UNITED STATES
SECURITIES AND EXCHANGE COMMISSION
Washington, D.C. 20549
FORM N-CSRS
CERTIFIED SHAREHOLDER REPORT OF REGISTERED
MANAGEMENT INVESTMENT COMPANIES
Investment Company Act file number: 811-09253
Wells Fargo Funds Trust
(Exact name of registrant as specified in charter)
| 525 Market St., San Francisco, CA | | 94105 |
| (Address of principal executive offices) | | (Zip code) |
C. David Messman
Wells Fargo Funds Management, LLC
525 Market St., San Francisco, CA 94105
(Name and address of agent for service)
Registrant’s telephone number, including area code: 800-643-9691
Date of fiscal year end: | | March 31, 2003 |
Date of reporting period: | | September 30, 2003 |
| ITEM 1. | | REPORT TO SHAREHOLDERS |
Wells Fargo Money Market Funds
Semi-Annual Report
Wells Fargo California Tax-Free Money Market Fund
Wells Fargo Government Money Market Fund
Wells Fargo Minnesota Money Market Fund
Wells Fargo Money Market Fund
Wells Fargo National Tax-Free Money Market Fund
Wells Fargo Treasury Plus Money Market Fund
Well Fargo 100% Treasury Money Market Fund
Class A, Class B
September 30, 2003
| | | WELLSFARGOMONEYMARKETFUNDS |
|
TABLEOFCONTENTS
NOT FDIC INSURED–NO BANK GUARANTEE–MAY LOSE VALUE
This page is intentionally left blank —
WELLSFARGOMONEYMARKETFUNDS | | SHAREHOLDERLETTER |
|
DEARVALUEDSHAREHOLDER,
We are pleased to provide you with this Wells Fargo Money Market Funds semi-annual report for the six-month period ending September 30, 2003. On the following pages, you will find the money market overview and facts and figures about each Fund’s portfolio.
OVERVIEW OF FINANCIAL MARKETS
Despite attempts by the federal government to boost the economy early in the year, the economy remained mired in weakness early in the reporting period. The Federal Reserve Board (the Fed) cut short-term interest rates from 1.25% to 1% in June, the lowest level in half a century. Still, unemployment continued to rise and a record fiscal year 2003 federal budget deficit loomed on the horizon, suggesting that tax revenues were not growing fast enough to cover government spending.
Market volatility that was caused by uncertainty over the possibility of war in Iraq was followed by uncertainty over the direction and magnitude of changes in Fed policy. Mortgage refinancing and consumer spending activity remained strong despite a back-up in intermediate-term interest rates. Economic growth began picking up steam during the summer, while corporate earnings exceeded expectations. Even employment data began showing improvement in September. Indeed, there were reasons to be optimistic about the U.S. economy as the end of 2003 approached.
WELLS FARGO MONEY MARKET FUNDS
The Fed’s decision to cut interest rates by just a quarter percentage point to 1% at its June 25, 2003 policy meeting brought interest rates down to levels not seen since the 1950s. Unfortunately, the rate cut did not meet investor expectations and interest rates were volatile through the end of the period in reaction to comments from the Fed and changing views on the outlook for economic growth. Despite a challenging environment for investors, the Wells Fargo Money Market Funds achieved their investment objectives of maintaining a stable net asset value.
It is important to remember that no one can accurately predict the future direction of short-term interest rates. We continue to maintain a more prudent investment strategy and do not pursue strategies that seek to boost yield at the expense of safety and liquidity. We believe that the pursuit of additional yield creates volatility that can potentially undermine Fund performance during uncertain markets.
INVESTMENT STRATEGIES IN CHALLENGING TIMES
Investors are counting on reasonably good earnings growth to propel stocks higher during the balance of 2003, overcoming potential hurdles to any future rally created by seemingly “rich” valuations and by upward pressure on interest rates. With pricing power still weak throughout much of the economy, most businesses will rely on further cost cutting to propel margins enough to sustain double-digit earnings growth. Meanwhile, bond investors may insulate portfolios from a potential rise in interest rates by gradually moving away from longer-term securities as well as by investing in high coupon bonds or mortgage-backed securities that hold up better in a rising interest rate environment. Regardless of what lies ahead, investors should continue to follow the fundamentals of investing—asset allocation and diversification—in an effort to achieve their long-term financial goals.
We would like to thank you for choosing Wells Fargo Funds. We appreciate your confidence in us during this uncertain time period. Through each market cycle, we are committed to helping you meet your financial needs. If you have any questions about your investment, please contact your investment professional or call us at 1-800-222-8222. You may also visit our Web site at www.wellsfargofunds.com.
Sincerely,

Karla M. Rabusch
President
Wells Fargo Funds
1
| WELLSFARGOMONEYMARKETFUNDS | | MONEYMARKETOVERVIEW |
|
MONEYMARKETOVERVIEW
This report covers the six-month period ended September 30, 2003.
This reporting period can be divided into two distinct segments. During the first three months of the period, interest rates moved lower as slow economic growth led many to believe that the Federal Reserve Board (the Fed) would continue its attempt to spur growth by aggressively lowering short-term interest rates. The second half of the period was characterized by rising interest rates, the result of the Fed’s interest rate cut in June not meeting investor expectations.
PRIME MONEY MARKET SECURITIES
For the first three months of the period, the yield curve flattened. Short-term money market investments (those maturing in less than three months) remained stable, while longer-term money market investments (those maturing in more than thirteen months) declined. By mid-June, the yield on one-year investments had declined 25 basis points to below 1%, while the Federal Funds rate remained near 1.25%. Despite warnings that their expectations were unrealistic, investors continued to expect a 50 basis point reduction in the Federal Funds rate in June. When the rate was lowered only 25 basis points, the market began to re-evaluate its outlook for continued regular rate cuts and the yields on longer-term money market investments began to move higher. By the end of the period, the one-year London Interbank Offered Rate (LIBOR) stood at 1.30% after peaking at 1.50% near the end of August.
The amount of commercial paper outstanding continued to decline during the period, as issuers took advantage of the record low bond yields to extend their debt. The amount of top rated commercial paper outstanding fell by more than 5% during the period, from $1.207 trillion to $1.144 trillion, reflecting a decrease of nearly 20% from the peak of $1.413 trillion in December 2000.
Credit quality also remained a concern during the reporting period. While the pace of downgrades slowed somewhat, accounting issues at some of the Government Sponsored Entities, and questions about corporate governance policies at the New York Stock Exchange, did not help to restore investor confidence in management policies, abilities, and integrity.
U.S. TREASURY SECURITIES
Although the Fed eventually did cut the Federal Funds rate by 25 basis points to 1.00%, Treasury bills had been pricing based on the assumption that there would be a 50 basis point cut. Even the one-year Treasury note traded below 0.90% in the days preceding the June rate cut. These low rates coincided with quarter-end demand pressures in June, causing the short-end of the Treasury market (less than three months) to remain overpriced for an unusually longer period of time than what typically follows a market disappointment. Eventually Treasury bill pricing became more reasonable, and the longer end of the market became relatively cheap. As budget deficit projections ballooned, expectations of a greater supply of Treasury bills and the general expectation of higher interest rates drove the price of Treasury bills into the mid 0.90’s to low 1.00’s.
Over this reporting period, the supply of Treasury bills greatly contracted: the issuance of Treasury bills for the first week of April stood at $72 billion, and declined to $44 billion by the end of the period. While the April issuance was largely due to seasonal factors, Treasury bill issuance did not meet expectations as the period progressed and Treasuries became more expensive. Evidence of this could be seen during September, when the U.S. Treasury Department had to issue cash management bills to cover a temporary cash shortfall early in the month. Continued issuance may point to the need for the Treasury to increase auction size in the coming months.
U.S. GOVERNMENT AGENCY SECURITIES
Spreads between U.S. Government agency offerings and money market securities continued to tighten during the period. Interest rates, concerns over the ability of government agencies to manage interest rate risk, losses in the Federal Home Loan Bank of New York’s bond portfolio, and an accounting scandal at the Federal Home Loan Mortgage Corporation (FHLMC) drove yields on U.S. Government agency securities higher on a relative basis. For a period in June, after the FHLMC accounting issues were made public, FHLMC discount notes traded more cheaply than A-1/P-1 bank commercial paper. Eighteen month floating rate paper from the Federal National Mortgage Association (FNMA) and FHLMC traded at similar discount margins to one-year asset-backed conduit program floaters. The number of callable issues continued to increase, but at a slower pace as rates declined in September. By the end of the period, changes in the regulation of FNMA and FHLMC seemed inevitable (although it may be a long and arduous process).
2
MONEYMARKETOVERVIEW | | WELLSFARGOMONEYMARKETFUNDS |
|
TAX-FREE SECURITIES
The number of new municipal issues continued to increase swiftly as issuers found that it was often cheaper to issue variable rate securities than use the swap market to hedge interest rate risk. As variable rates surged to 103% of the one-month LIBOR in mid-April, the vast supply of variable rate demand notes increased, making it somewhat easier to invest the seasonal July cash inflows.
Fixed rate municipal securities were volatile during the reporting period. One-year paper started the period at 1.10% and interest rates plummeted to 0.80% at the peak of note season in late June. California was on the verge of running out of cash, as legislative parties were at odds over approving a budget. Standard and Poor’s was one of the driving forces behind breaking the stalemate by downgrading the state from A to BBB in late July. The price of California Revenue Anticipation Warrants (RAWs) plummeted as their yields skyrocketed from 1.15% to 2.00%.
Texas issued record-breaking Tax and Revenue Anticipation Notes in late August, exceeding municipal demand and splitting the one-year sector into three markets – the general market, the California market, and the Texas market. The one-year municipal securities markets finally settled down in early September as rates hovered near 1.00% for general market paper, 1.10% for Texas paper, and 1.60% for California RAWs.
STRATEGIC OUTLOOK
While the overnight interest rate has been stable, longer money market rates have increased considerably since the mid-point of the reporting period. With the U.S. economy picking up steam and the U.S. dollar weakening overseas, we believe that interest rates may continue to move higher. That increase, when accompanied by outflows from institutional investors, could trigger a challenging period for all money market funds. However, we do not believe that aggressively positioning a money market fund to boost its yield at the risk of jeopardizing its net asset value (NAV) would be appropriate, and we will continue to position the portfolios and select their investments in an ongoing effort to maintain a stable $1.00 NAV.
The views expressed are as of September 30, 2003 and are those of the Funds’ manager. The views are subject to change at any time in response to changing circumstances in the market and are not intended to predict or guarantee the future performance of any individual security, market sector or the markets generally, or the Wells Fargo Money Market Funds.
3
WELLSFARGOMONEYMARKETFUNDS | | MONEYMARKETOVERVIEW |
|
PRIMARY INVESTMENTS*
Wells Fargo
Money Market
Fund Name | | U.S. Treasury Securities | | Repurchase Agreements | | U.S. Government Obligations | | Commercial Paper | | Certificates of Deposit/ Bankers Acceptances | | Time Deposits | | Floating/ Variable Rate Notes/Bonds | | Mortgage and Other Asset-
Backed Securities | | Corporate Notes/
Bonds | | Municipal Obligations |
| | | | | | | | | | |
100% Treasury | | X | | | | | | | | | | | | | | | | | | |
| | | | | | | | | | |
Treasury Plus | | X | | X | | | | | | | | | | | | | | | | |
| | | | | | | | | | |
Government | | X | | X | | X | | | | | | | | | | | | | | |
| | | | | | | | | | |
Money Market | | X | | X | | X | | X | | X | | X | | X | | X | | X | | |
| | | | | | | | | | |
National Tax-Free | | | | | | | | | | | | | | | | | | | | X |
| | | | | | | | | | |
Minnesota | | | | | | | | | | | | | | | | | | | | X |
| | | | | | | | | | |
California Tax-Free | | | | | | | | | | | | | | | | | | | | X |
* The chart highlights some of the primary investments that the Funds may make as part of their investment strategies. The chart does not identify all of the permitted investments for each Fund.
4
PERFORMANCEHIGHLIGHTS | | WELLSFARGOMONEYMARKETFUNDS |
|
WELLSFARGOCALIFORNIATAX-FREEMONEYMARKET
FUND —CLASSA
INVESTMENT OBJECTIVE
The Wells Fargo California Tax-Free Money Market Fund (the Fund) seeks a high level of income exempt from federal income tax and California individual income tax, while preserving capital and liquidity.
FUNDMANAGERS
Dave Sylvester
Julio Bonilla
INCEPTIONDATE
01/01/92
AVERAGE ANNUAL TOTAL RETURN1 (%) (AS OF SEPTEMBER 30, 2003)
| | | 6-Month* | | 1-Year | | 5-Year | | 10-Year |
| | | | |
Wells Fargo California Tax-Free Money Market Fund – Class A | | 0.19 | | 0.49 | | 1.81 | | 2.27 |
| | | | |
Benchmark | | | | | | | | |
| | | | |
iMoneyNet All State Specific California Money Fund Average2 | | 0.25 | | 0.63 | | 2.00 | | 2.67 |
| * Returns for periods of less than one year are not annualized. | | | | | | | | |
| FUND YIELD SUMMARY (AS OF SEPTEMBER 30, 2003) | |
|
| |
7-Day Current Yield | | 0.39% | |
| |
7-Day Compound Yield | | 0.39% | |
| |
30-Day Simple Yield | | 0.28% | |
| |
30-Day Compound Yield | | 0.28% | |
| FUND CHARACTERISTICS3 (AS OF SEPTEMBER 30, 2003) |
|
| |
Average Maturity | | 42 days |
| |
Number of Holdings | | 252 |
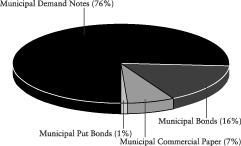
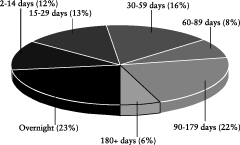
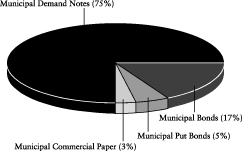
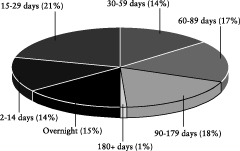
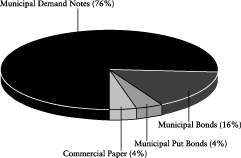
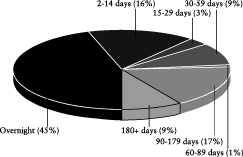
PORTFOLIO COMPOSITION3 (AS OF SEPTEMBER 30, 2003)
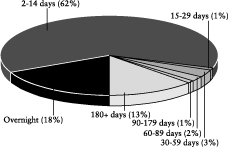
MATURITY DISTRIBUTION3 (AS OF SEPTEMBER 30, 2003)
The Fund is sold without a front-end sales charge or contingent deferred sales charge. Other fees and expenses apply to a continued investment in the Fund and are described in the Fund’s Statement of Additional Information. An investment in a Wells Fargo Money Market Fund is not insured or guaranteed by the Federal Deposit Insurance Corporation or any other government agency. Although the Wells Fargo Money Market Funds seek to preserve the value of your investment at $1.00 per share, it is possible to lose money by investing in money market funds.
1 Figures quoted represent past performance, which is no guarantee of future results. Investment returns will fluctuate. The Fund’s yield figures more closely reflect the current earnings of the Fund than the total return figures. The Fund’s Adviser has committed through July 31, 2004 to waive fees and/or reimburse expenses to the extent necessary to maintain a certain net operating expense ratio for the Fund. Actual reductions of operating expenses can increase total return to shareholders. Without these reductions, the Fund’s 7-day current yield would have been 0.20%.
Performance shown for the Class A shares of the Wells Fargo California Tax-Free Money Market Fund for periods prior to November 8, 1999, reflects performance of the Class A shares of the Stagecoach California Tax-Free Money Market Fund, its predecessor fund. Effective at the close of business November 5, 1999, the Stagecoach Funds were reorganized into the Wells Fargo Funds.
2 The iMoneyNet All State Specific California Money Fund Average is an average of California retail state tax-free and municipal money funds.
3 Portfolio holdings and characteristics are subject to change.
5
| WELLSFARGOMONEYMARKETFUNDS | | PERFORMANCEHIGHLIGHTS |
|
WELLSFARGOGOVERNMENTMONEYMARKETFUND — CLASSA
INVESTMENT OBJECTIVE
The Wells Fargo Government Money Market Fund (the Fund) seeks high current income, while preserving capital and liquidity.
FUNDMANAGERS
Dave Sylvester
Laurie White
INCEPTIONDATE
11/16/87
AVERAGE ANNUAL TOTAL RETURN1 (%) (AS OF SEPTEMBER 30, 2003)
| | | 6-Month* | | 1-Year | | 5-Year | | 10-Year |
| | | | |
Wells Fargo Government Money Market Fund – Class A | | 0.24 | | 0.65 | | 3.27 | | 3.92 |
| | | | |
Benchmark | | | | | | | | |
| | | | |
iMoneyNet First Tier Retail Money Fund Average2 | | 0.23 | | 0.62 | | 3.59 | | 4.90 |
| * | | Returns for periods of less than one year are not annualized. |
| FUND YIELD SUMMARY (AS OF SEPTEMBER 30, 2003) |
|
| |
7-Day Current Yield | | 0.45% |
| |
7-Day Compound Yield | | 0.45% |
| |
30-Day Simple Yield | | 0.44% |
| |
30-Day Compound Yield | | 0.44% |
| FUND CHARACTERISTICS3 (AS OF SEPTEMBER 30, 2003) |
|
| |
Weighted Average Maturity | | 58 days |
| |
Number of Holdings | | 108 |
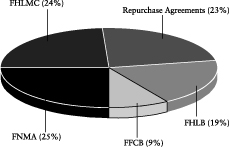
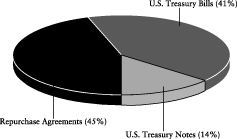
PORTFOLIO COMPOSITION3 (AS OF SEPTEMBER 30, 2003)
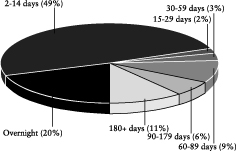
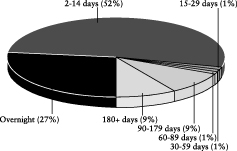
MATURITY DISTRIBUTION3 (AS OF SEPTEMBER 30, 2003)
The Fund is sold without a front-end sales charge or contingent deferred sales charge. Other fees and expenses apply to a continued investment in the Fund and are described in the Fund’s Statement of Additional Information. An investment in a Wells Fargo Money Market Fund is not insured or guaranteed by the Federal Deposit Insurance Corporation or any other government agency. Although the Wells Fargo Money Market Funds seek to preserve the value of your investment at $1.00 per share, it is possible to lose money by investing in money market funds.
1 Figures quoted represent past performance, which is no guarantee of future results. Investment returns will fluctuate. The Fund’s yield figures more closely reflect the current earnings of the Fund than the total return figures. The Fund’s Adviser has committed through July 31, 2004 to waive fees and/or reimburse expenses to the extent necessary to maintain a certain net operating expense ratio for the Fund. Actual reductions of operating expenses can increase total return to shareholders. Without these reductions, the Fund’s 7-day current yield would have been 0.45%.
Performance shown for the Class A shares of the Wells Fargo Government Money Market Fund for periods prior to November 8, 1999, reflects performance of the Service Class (formerly Single Class) shares, adjusted for expenses, of the Norwest Advantage U.S. Government Fund (the accounting survivor of a merger of the Norwest Advantage U.S. Government Fund and the Stagecoach Government Money Market Fund), its predecessor fund. Effective at the close of business November 5, 1999, the Stagecoach Funds and the Norwest Advantage Funds were reorganized into the Wells Fargo Funds.
2 The iMoneyNet First Tier Retail Money Fund Average is an average of non-governmental retail funds that do not hold any second tier securities. Portfolio holdings of first tier funds include U.S. Treasury securities, U.S. other securities, repos, time deposits, domestic bank obligations, foreign bank obligations, first tier commercial paper, floating rate notes, and asset-backed commercial paper.
3 Portfolio holdings and characteristics are subject to change.
6
| PERFORMANCEHIGHLIGHTS | | WELLSFARGOMONEYMARKETFUNDS |
|
WELLSFARGOMINNESOTAMONEYMARKETFUND —CLASSA
INVESTMENT OBJECTIVE
The Wells Fargo Minnesota Money Market Fund (the Fund) seeks to provide a high level of income exempt from federal income tax, but not the federal AMT, and Minnesota individual income tax, while preserving capital and liquidity.
FUNDMANAGERS
Dave Sylvester
Julio Bonilla
INCEPTIONDATE
8/14/00
AVERAGE ANNUAL TOTAL RETURN1 (%) (AS OF SEPTEMBER 30, 2003)
| | | 6-Month* | | 1-Year | | Life of Fund |
| | | |
Wells Fargo Minnesota Money Market Fund – Class A | | 0.16 | | 0.46 | | 1.51 |
| | | |
Benchmark | | | | | | |
| | | |
iMoneyNet All State Specific Minnesota Retail Money Fund Average2 | | 0.17 | | 0.46 | | 1.53 |
| * | | Returns for periods of less than one year are not annualized. |
| FUND YIELD SUMMARY (AS OF SEPTEMBER 30, 2003) |
|
| |
7-Day Current Yield | | 0.33% |
| |
7-Day Compound Yield | | 0.33% |
| |
30-Day Simple Yield | | 0.23% |
| |
30-Day Compound Yield | | 0.23% |
| FUND CHARACTERISTICS3 (AS OF SEPTEMBER 30, 2003) |
|
| |
Weighted Average Maturity | | 50 days |
| |
Number of Holdings | | 61 |
PORTFOLIO COMPOSITION3 (AS OF SEPTEMBER 30, 2003)
MATURITY DISTRIBUTION3 (AS OF SEPTEMBER 30, 2003)
The Fund is sold without a front-end sales charge or contingent deferred sales charge. Other fees and expenses apply to a continued investment in the Fund and are described in the Fund’s Statement of Additional Information. An investment in a Wells Fargo Money Market Fund is not insured or guaranteed by the Federal Deposit Insurance Corporation or any other government agency. Although the Wells Fargo Money Market Funds seek to preserve the value of your investment at $1.00 per share, it is possible to lose money by investing in money market funds.
1 Figures quoted represent past performance, which is no guarantee of future results. Investment returns will fluctuate. The Fund’s yield figures more closely reflect the current earnings of the Fund than the total return figures. The Fund’s Adviser has committed through July 31, 2004 to waive fees and/or reimburse expenses to the extent necessary to maintain a certain net operating expense ratio for the Fund. The Fund’s Adviser also has voluntarily waived fees and/or reimbursed expenses, which reduced operating expenses. Actual reductions of operating expenses increased total return to shareholders. Without these reductions, the Fund’s 7-day current yield would have been 0.24%.
2 The iMoneyNet All State Specific Minnesota Retail Money Fund Average consists of only Minnesota retail state tax-free and municipal money funds.
3 Portfolio holdings and characteristics are subject to change.
7
WELLSFARGOMONEYMARKETFUNDS | | PERFORMANCEHIGHLIGHTS |
|
WELLSFARGOMONEYMARKETFUND — CLASSAANDCLASSB
INVESTMENT OBJECTIVE
The Wells Fargo Money Market Fund (the Fund) seeks high current income, while preserving capital and liquidity.
FUNDMANAGERS
Dave Sylvester
Laurie White
INCEPTIONDATE
07/01/92
AVERAGE ANNUAL TOTAL RETURN1(%) (AS OF SEPTEMBER 30, 2003)
| | | 6-Month* | | 1-Year | | 5-Year | | 10-Year |
| | | | |
Wells Fargo Money Market Fund – Class A | | 0.23 | | 0.64 | | 3.31 | | 3.98 |
| | | | |
Wells Fargo Money Market Fund – Class B | | 0.07 | | 0.17 | | 2.62 | | 3.29 |
| | | | |
Benchmark | | | | | | | | |
| | | | |
iMoneyNet First Tier Retail Money Fund Average2 | | 0.23 | | 0.62 | | 3.59 | | 4.90 |
* Returns for periods of less than one year are not annualized.
| FUND YIELD SUMMARY CLASS A (AS OF SEPTEMBER 30, 2003) |
|
| |
7-Day Current Yield | | 0.36% |
| |
7-Day Compound Yield | | 0.36% |
| |
30-Day Simple Yield | | 0.35% |
| |
30-Day Compound Yield | | 0.35% |
| FUND YIELD SUMMARY CLASS B (AS OF SEPTEMBER 30, 2003) |
|
| |
7-Day Current Yield | | 0.10% |
| |
7-Day Compound Yield | | 0.10% |
| |
30-Day Simple Yield | | 0.10% |
| |
30-Day Compound Yield | | 0.10% |
| FUND CHARACTERISTICS3 (AS OF SEPTEMBER 30, 2003) |
|
| |
Average Maturity | | 50 days |
| |
Number of Holdings | | 116 |
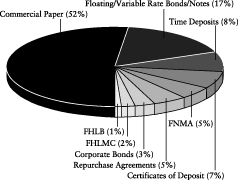
PORTFOLIO COMPOSITION3 (AS OF SEPTEMBER 30, 2003)
MATURITY DISTRIBUTION3 (AS OF SEPTEMBER 30, 2003)
The Fund is sold without a front-end sales charge, but the Fund’s Class B shares are subject to a contingent deferred sales charge. Other fees and expenses apply to a continued investment in the Fund and are described in the Fund’s Statement of Additional Information. An investment in a Wells Fargo Money Market Fund is not insured or guaranteed by the Federal Deposit Insurance Corporation or any other government agency. Although the Wells Fargo Money Market Funds seek to preserve the value of your investment at $1.00 per share, it is possible to lose money by investing in money market funds.
1 Figures quoted represent past performance, which is no guarantee of future results. Investment returns will fluctuate. The Fund’s yield figures more closely reflect the current earnings of the Fund than the total return figures. The Fund’s Adviser has committed through July 31, 2004 to waive fees and/or reimburse expenses to the extent necessary to maintain a certain net operating expense ratio for the Fund. The Fund’s Adviser also has voluntarily waived fees and/or reimbursed expenses, which reduced operating expenses. Actual reductions of operating expenses increased total return to shareholders. Without these reductions, the Fund’s 7-day current yield would have been 0.19% for the Class A shares and 0.00% for the Class B shares. Performance shown for the Class A shares of the Wells Fargo Money Market Fund for periods prior to November 8, 1999, reflects performance of the Class A shares of the Stagecoach Money Market Fund (the accounting survivor of a merger of the Norwest Advantage Ready Cash Investment Fund, Stagecoach Prime Money Market Fund and the Stagecoach Money Market), its predecessor fund. Performance shown for the Class B shares of the Wells Fargo Money Market Fund for periods prior to November 8, 1999, reflects performance of the Class S shares of the Stagecoach Money Market Fund (the accounting survivor of a merger of the Norwest Advantage Ready Cash Investment Fund, the Stagecoach Prime Money Market Fund and the Stagecoach Money Market Fund), its predecessor fund. Effective at the close of business November 5, 1999, the Stagecoach and Norwest Advantage Funds were reorganized into the Wells Fargo Funds.
2 The iMoneyNet First Tier Retail Money Fund Average is an average of non-government retail funds that do not hold any second tier securities. Portfolio holdings of first tier funds include U.S. Treasury securities, U.S. other securities, repos, time deposits, domestic bank obligations, foreign bank obligations, first tier commercial paper, floating rate notes and asset-backed commercial paper.
3 Portfolio holdings and characteristics are subject to change.
8
PERFORMANCEHIGHLIGHTS | | WELLSFARGOMONEYMARKETFUNDS |
|
WELLSFARGONATIONALTAX-FREEMONEYMARKETFUND —CLASSA
INVESTMENT OBJECTIVE
The Wells Fargo National Tax-Free Money Market Fund (the Fund) seeks high current income exempt from federal income taxes, while preserving capital and liquidity.
FUNDMANAGERS
Dave Sylvester
Julio Bonilla
INCEPTIONDATE
08/03/93
AVERAGE ANNUAL TOTAL RETURN1(%) (AS OF SEPTEMBER 30, 2003)
| | | 6-Month* | | 1-Year | | 5-Year | | 10-Year |
| | | | |
Wells Fargo National Tax-Free Money Market Fund – Class A | | 0.22 | | 0.58 | | 2.13 | | 2.58 |
| | | | |
Benchmark | | | | | | | | |
| | | | |
iMoneyNet All Tax-Free Money Fund Average2 | | 0.26 | | 0.64 | | 2.22 | | 2.83 |
| * Returns for periods of less than one year are not annualized. | | | | | | | | |
| FUND YIELD SUMMARY (AS OF SEPTEMBER 30, 2003) |
|
| |
7-Day Current Yield | | 0.47% |
| |
7-Day Compound Yield | | 0.48% |
| |
30-Day Simple Yield | | 0.36% |
| |
30-Day Compound Yield | | 0.36% |
| FUND CHARACTERISTICS3 (AS OF SEPTEMBER 30, 2003) |
|
| |
Weighted Average Maturity | | 37 days |
| |
Number of Holdings | | 316 |
PORTFOLIO COMPOSITION3 (AS OF SEPTEMBER 30, 2003)
MATURITY DISTRIBUTION3 (AS OF SEPTEMBER 30, 2003)
The Fund is sold without a front-end sales charge or contingent deferred sales charge. Other fees and expenses apply to a continued investment in the Fund and are described in the Fund’s Statement of Additional Information. An investment in a Wells Fargo Money Market Fund is not insured or guaranteed by the Federal Deposit Insurance Corporation or any other government agency. Although the Wells Fargo Money Market Funds seek to preserve the value of your investment at $1.00 per share, it is possible to lose money by investing in money market funds.
1 Figures quoted represent past performance, which is no guarantee of future results. Investment returns will fluctuate. The Fund’s yield figures more closely reflect the current earnings of the Fund than the total return figures. The Fund’s Adviser has committed through July 31, 2004 to waive fees and/or reimburse expenses to the extent necessary to maintain a certain net operating expense ratio for the Fund. Actual reductions of operating expenses can increase total return to shareholders. Without these reductions, the Fund’s 7-day current yield would have been 0.47%.
Performance shown for the Class A shares of the Wells Fargo National Tax-Free Money Market Fund for the period prior to July 28, 2003, reflects performance of the Service Class shares of the Wells Fargo National Tax-Free Money Market Fund, adjusted for Class A fees and expenses. Performance shown for periods prior to November 8, 1999, reflects performance of the Service Class (formerly Institutional Class) shares of the Norwest Advantage Municipal Money Market Fund (the accounting survivor of a merger of the Norwest Advantage Municipal Money Market Fund and the Stagecoach National Tax-Free Money Market Fund), its predecessor fund. Effective at the close of business November 5, 1999, the Stagecoach and Norwest Advantage Funds were reorganized into the Wells Fargo Funds.
2 The iMoneyNet All Tax-Free Money Fund Average includes tax-free and municipal retail and institutional money funds. It is made up of funds in the National Tax-Free Retail, National Tax-Free Institutional, State-Specific Retail and State-Specific Institutional categories.
3 Portfolio holdings and characteristics are subject to change.
9
WELLSFARGOMONEYMARKETFUNDS | | PERFORMANCEHIGHLIGHTS |
|
WELLSFARGOTREASURYPLUSMONEYMARKETFUND —CLASSA
INVESTMENT OBJECTIVE
The Wells Fargo Treasury Plus Money Market Fund (the Fund) seeks current income and stability of principal.
FUNDMANAGERS
Dave Sylvester
Laurie White
INCEPTIONDATE
10/01/85
AVERAGE ANNUAL TOTAL RETURN1 (%) (AS OF SEPTEMBER 30, 2003)
| | | 6-Month* | | 1-Year | | 5-Year | | 10-Year |
| | | | |
Wells Fargo Treasury Plus Money Market Fund – Class A | | 0.26 | | 0.68 | | 3.25 | | 3.95 |
| | | | |
Benchmark | | | | | | | | |
| | | | |
iMoneyNet Treasury & Repo Retail Money Fund Average2 | | 0.21 | | 0.56 | | 3.38 | | 4.65 |
* Returns for periods of less than one year are not annualized.
| FUND YIELD SUMMARY (AS OF SEPTEMBER 30, 2003) |
|
| |
7-Day Current Yield | | 0.39% |
| |
7-Day Compound Yield | | 0.39% |
| |
30-Day Simple Yield | | 0.38% |
| |
30-Day Compound Yield | | 0.39% |
| FUND CHARACTERISTICS3 (AS OF SEPTEMBER 30, 2003) |
|
| |
Weighted Average Maturity | | 51 days |
| |
Number of Holdings | | 32 |
PORTFOLIO COMPOSITION3 (AS OF SEPTEMBER 30, 2003)
MATURITY DISTRIBUTION3 (AS OF SEPTEMBER 30, 2003)
The Fund is sold without a front-end sales charge or contingent deferred sales charge. Other fees and expenses apply to a continued investment in the Fund and are described in the Fund’s Statement of Additional Information. An investment in a Wells Fargo Money Market Fund is not insured or guaranteed by the Federal Deposit Insurance Corporation or any other government agency. Although the Wells Fargo Money Market Funds seek to preserve the value of your investment at $1.00 per share, it is possible to lose money by investing in money market funds. The U.S. Treasury guarantee applies to the underlying securities and NOT to shares of the Fund.
1 Figures quoted represent past performance, which is no guarantee of future results. Investment returns will fluctuate. The Fund’s yield figures more closely reflect the current earnings of the Fund than the total return figures. The Fund’s Adviser has committed through July 31, 2004 to waive fees and/or reimburse expenses to the extent necessary to maintain a certain net operating expense ratio for the Fund. Actual reductions of operating expenses can increase total return to shareholders. Without these reductions, the Fund’s 7-day current yield would have been 0.39%.
Performance shown for the Class A shares of the Wells Fargo Treasury Plus Money Market Fund for the periods prior to July 28, 2003, reflects performance of the Service Class shares of the Wells Fargo Treasury Plus Money Market Fund, adjusted for Class A fees and expenses. Performance shown for periods prior to November 8, 1999, reflects performance of the Service Class shares of the Stagecoach Treasury Plus Money Market Fund (the accounting survivor of a merger between the Norwest Advantage Treasury Plus Fund and the Stagecoach Treasury Plus Money Market Fund), its predecessor fund. Effective at the close of business November 5, 1999, the Stagecoach and Norwest Advantage Funds were reorganized into the Wells Fargo Funds. Performance shown for the period prior to October 1, 1995, through September 6, 1996, reflects performance of the Pacific American U.S. Treasury Portfolio, the predecessor portfolio. In July 1995, the Pacific American U.S. Treasury Portfolio was renamed the Pacifica Treasury Money Market Fund. Performance shown for periods prior to October 1, 1995, reflects performance of the shares of the predecessor portfolio.
2 The iMoneyNet Treasury & Repo Retail Money Fund Average is an average of retail government funds holding U.S. Treasuries and repurchase agreements backed by the U.S. Treasury.
3 Portfolio holdings and characteristics are subject to change.
10
| PERFORMANCEHIGHLIGHTS | | WELLSFARGOMONEYMARKETFUNDS |
|
WELLSFARGO 100%TREASURYMONEYMARKETFUND —CLASSA
INVESTMENT OBJECTIVE
The Wells Fargo 100% Treasury Money Market Fund (the Fund) seeks stability of principal and current income that is exempt from most state and local individual income taxes.
FUNDMANAGERS
Dave Sylvester
Laurie White
INCEPTIONDATE
12/03/90
AVERAGE ANNUAL TOTAL RETURN1 (%) (AS OF SEPTEMBER 30, 2003)
| | | 6-Month* | | 1-Year | | 5-Year | | 10-Year |
| | | | |
Wells Fargo 100% Treasury Money Market Fund – Class A | | 0.21 | | 0.60 | | 3.10 | | 3.76 |
| | | | |
Benchmarks | | | | | | | | |
| | | | |
iMoneyNet Treasury Retail Money Fund Average2 | | 0.22 | | 0.63 | | 3.40 | | 4.64 |
| | | | |
91 Day U.S. Treasury Bill3 | | 0.84 | | 1.89 | | 4.54 | | 5.01 |
* Returns for periods of less than one year are not annualized.
| FUND YIELD SUMMARY (AS OF SEPTEMBER 30, 2003) | |
|
| |
7-Day Current Yield | | 0.31% | |
| |
7-Day Compound Yield | | 0.31% | |
| |
30-Day Simple Yield | | 0.32% | |
| |
30-Day Compound Yield | | 0.32% | |
| FUND CHARACTERISTICS4 (AS OF SEPTEMBER 30, 2003) |
|
| |
Average Maturity | | 53 days |
| |
Number of Holdings | | 31 |
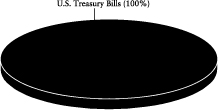
PORTFOLIO COMPOSITION4 (AS OF SEPTEMBER 30, 2003)
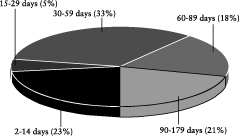
MATURITY DISTRIBUTION4 (AS OF SEPTEMBER 30, 2003)
The Fund is sold without a front-end sales charge or contingent deferred sales charge. Other fees and expenses apply to a continued investment in the Fund and are described in the Fund’s Statement of Additional Information. An investment in a Wells Fargo Money Market Fund is not insured or guaranteed by the Federal Deposit Insurance Corporation or any other government agency. Although the Wells Fargo Money Market Funds seek to preserve the value of your investment at $1.00 per share, it is possible to lose money by investing in money market funds.
1 Figures quoted represent past performance, which is no guarantee of future results. Investment returns will fluctuate. The Fund’s yield figures more closely reflect the current earnings of the Fund than the total return figures. The Fund’s Adviser has committed through July 31, 2004 to waive fees and/or reimburse expenses to the extent necessary to maintain a certain net operating expense ratio for the Fund. Actual reductions of operating expenses can increase total return to shareholders. Without these reductions, the Fund’s 7-day current yield would have been 0.08%.
Performance shown for the Class A shares of the Wells Fargo 100% Treasury Money Market Fund for periods prior to November 8, 1999 reflects performance of the Service Class (formerly Single Class) shares, adjusted for expenses, of the Norwest Advantage Treasury Fund, its predecessor fund. Effective at the close of business November 5, 1999, the Norwest Advantage Funds were reorganized into the Wells Fargo Funds.
2 The iMoneyNet Treasury Retail Money Fund Average includes only retail funds that hold 100% in U.S. Treasury securities.
3 Estimated monthly return (12th root of annualized discount rate) which is based on the discount rate quoted on the last business day of the month of 91 day U.S. Treasury Bills. These figures are calculated on a 365 day basis.
4 Portfolio holdings and characteristics are subject to change.
11
WELLSFARGOMONEYMARKETFUNDS | | PORTFOLIOOFINVESTMENTS — SEPTEMBER 30, 2003 (UNAUDITED) |
|
CALIFORNIATAX-FREEMONEYMARKETFUND
| Principal | | Security Name | | Interest Rate | | | Maturity Date | | Value |
|
| Municipal Securities – 99.85% |
|
| California – 93.77% |
| | | | |
| $ | 6,000,000 | | ABAG Finance Authority For Nonprofit Corporations California Housing Revenue Series A Societe Generale LOC§ | | 1.10 | % | | 07/01/2008 | | $ | 6,000,000 |
| | | | |
| | 9,865,000 | | ABAG Finance Authority For Nonprofit Corporations California MFHR Gaia Building Project Series A Collateralized By FNMA§ | | 1.05 | | | 09/15/2032 | | | 9,865,000 |
| | | | |
| | 1,150,000 | | Alameda County CA CTFS Participation Santa Rita Jail Project Lease Revenue Prerefunded 12/01/03 @ 102 MBIA Insured§ | | 5.70 | | | 12/01/2014 | | | 1,181,779 |
| | | | |
| | 5,500,000 | | Alvord CA University School District CTFS Participation Food Services Bridge Funding Program Lease Revenue FSA Insured§ | | 1.05 | | | 06/01/2037 | | | 5,500,000 |
| | | | |
| | 4,400,000 | | Anaheim CA CTFS Participation Lease Revenue AMBAC Insured§ | | 1.00 | | | 08/01/2019 | | | 4,400,000 |
| | | | |
| | 3,900,000 | | Anaheim CA Housing Authority MFHR Collateralized By FNMA§ | | 1.10 | | | 07/15/2020 | | | 3,900,000 |
| | | | |
| | 10,244,000 | | Anaheim CA Housing Authority MFHR Fountain Anaheim Hills Series A Collateralized By FNMA§ | | 1.15 | | | 02/15/2033 | | | 10,244,000 |
| | | | |
| | 4,345,000 | | Anaheim CA Housing Authority MFHR Monterrey Apartments Series B Collateralized By FNMA§ | | 1.10 | | | 05/15/2027 | | | 4,345,000 |
| | | | |
| | 6,300,000 | | Anaheim CA Housing Authority MFHR Sea Wind Apartments Project Series C Collateralized By FNMA§ | | 1.15 | | | 07/15/2033 | | | 6,300,000 |
| | | | |
| | 8,160,000 | | Anaheim CA Public Financing Authority Lease Revenue FSA Insured§ | | 1.13 | | | 09/01/2024 | | | 8,160,000 |
| | | | |
| | 37,000,000 | | Bay Area Toll Authority CA Toll Bridge Revenue San Francisco Bay Area Project Series A AMBAC Insured§ | | 1.00 | | | 04/01/2036 | | | 37,000,000 |
| | | | |
| | 4,300,000 | | Bay Area Toll Authority CA Toll Bridge Revenue San Francisco Bay Area Series B§ | | 1.00 | | | 04/01/2029 | | | 4,300,000 |
| | | | |
| | 700,000 | | Bay Area Toll Authority California Toll Bridge Revenue San Francisco Bay Area Project Series C AMBAC Insured§ | | 1.05 | | | 04/01/2037 | | | 700,000 |
| | | | |
| | 11,000,000 | | Buena Park CA MFHR Walden Glen Apartments Project Series A§ | | 1.15 | | | 02/15/2033 | | | 11,000,000 |
| | | | |
| | 13,000,000 | | California Cities Home Ownership Authority Housing Revenue Lease Purchase Program Project Series A Collateralized By FHLMC§ | | 1.10 | | | 09/01/2006 | | | 13,000,000 |
| | | | |
| | 3,000,000 | | California Communities Housing Finance Agency Lease Revenue Series A Collateralized By FHLMC§ | | 1.10 | | | 02/01/2007 | | | 3,000,000 |
| | | | |
| | 2,420,000 | | California Educational Facilities Authority Revenue CTFS Series 113 General Obligation of University§ | | 1.08 | | | 12/01/2027 | | | 2,420,000 |
| | | | |
| | 10,500,000 | | California Educational Facilities Authority Revenue Loyola Maramount University Series B MBIA Insured§ | | 1.10 | | | 10/01/2027 | | | 10,500,000 |
| | | | |
| | 8,290,000 | | California Educational Facilities Authority Revenue Santa Clara University Series B MBIA Insured§ | | 1.10 | | | 02/01/2032 | | | 8,290,000 |
| | | | |
| | 980,000 | | California HFA Revenue CTFS Series 150 MBIA Insured§ | | 1.13 | | | 02/01/2029 | | | 980,000 |
| | | | |
| | 75,000 | | California HFA Revenue CTFS Series 412 AMBAC Insured§ | | 1.13 | | | 08/01/2029 | | | 75,000 |
| | | | |
| | 3,400,000 | | California HFA Revenue Home Mortgage Series B§ | | 1.28 | | | 08/01/2033 | | | 3,400,000 |
| | | | |
| | 5,800,000 | | California HFA Revenue Home Mortgage Series M§ | | 1.20 | | | 08/01/2033 | | | 5,800,000 |
| | | | |
| | 4,415,000 | | California HFA Revenue Home Mortgage Series U§ | | 1.10 | | | 02/01/2017 | | | 4,415,000 |
| | | | |
| | 10,925,000 | | California HFA Revenue Home Mortgage Series U§ | | 1.14 | | | 02/01/2031 | | | 10,925,000 |
| | | | |
| | 31,960,000 | | California HFA Revenue Home Mortgages FSA Insured§ | | 1.14 | | | 02/01/2032 | | | 31,960,000 |
| | | | |
| | 6,800,000 | | California HFA Revenue Home Mortgages Series F FSA Insured§ | | 1.07 | | | 02/01/2034 | | | 6,800,000 |
| | | | |
| | 5,600,000 | | California HFA Revenue Home Mortgages Series M§ | | 1.20 | | | 02/01/2025 | | | 5,600,000 |
| | | | |
| | 1,470,000 | | California HFA Revenue MBIA Insured§ | | 1.15 | | | 08/01/2016 | | | 1,470,000 |
| | | | |
| | 9,100,000 | | California HFA Revenue MFHR Series D§ | | 1.23 | | | 02/01/2031 | | | 9,100,000 |
| | | | |
| | 2,050,000 | | California HFA Revenue Series 112-A§ | | 1.15 | | | 08/01/2026 | | | 2,050,000 |
| | | | |
| | 6,900,000 | | California HFA Revenue Series F§ | | 1.20 | | | 02/01/2033 | | | 6,900,000 |
| | | | |
| | 17,800,000 | | California HFFA Revenue Adventist Health Systems Series B KBC Bank NV LOC§ | | 1.20 | | | 09/01/2025 | | | 17,800,000 |
12
PORTFOLIOOFINVESTMENTS — SEPTEMBER 30, 2003 (UNAUDITED) | | WELLSFARGOMONEYMARKETFUNDS |
|
CALIFORNIATAX-FREEMONEYMARKETFUND
| Principal | | Security Name | | Interest Rate | | | Maturity Date | | Value |
|
| California (continued) |
| | | | |
| $ | 2,845,000 | | California HFFA Revenue CTFS Series 26 FSA Insured§ | | 1.08 | % | | 06/01/2022 | | $ | 2,845,000 |
| | | | |
| | 7,200,000 | | California HFFA Revenue Scripps Health Series A Bank One NA LOC§ | | 1.05 | | | 10/01/2023 | | | 7,200,000 |
| | | | |
| | 13,155,000 | | California HFFA Revenue Series A MBIA Insured§ | | 1.20 | | | 09/01/2028 | | | 13,155,000 |
| | | | |
| | 8,530,000 | | California HFFA Revenue Series B MBIA Insured§ | | 1.20 | | | 09/01/2028 | | | 8,530,000 |
| | | | |
| | 7,120,000 | | California HFFA Revenue Series C MBIA Insured§ | | 1.20 | | | 09/01/2015 | | | 7,120,000 |
| | | | |
| | 15,500,000 | | California Infrastructure & Economic Development Bank Revenue J Paul Getty Series D§ | | 1.00 | | | 04/01/2033 | | | 15,500,000 |
| | | | |
| | 18,000,000 | | California Infrastructure & Economic Development Bank Series 2002 | | 0.80 | | | 11/19/2003 | | | 18,000,000 |
| | | | |
| | 15,000,000 | | California Infrastructure & Economic Development Bank Series 2002 | | 0.80 | | | 12/09/2003 | | | 15,000,000 |
| | | | |
| | 76,000,000 | | California School Cash Reserve Program Authority Pool Series A | | 2.00 | | | 07/06/2004 | | | 76,632,672 |
| | | | |
| | 8,300,000 | | California State Department Water Reserve & Power Supply Revenue Series 764 FSA Insured§ | | 1.08 | | | 05/01/2012 | | | 8,300,000 |
| | | | |
| | 29,200,000 | | California State Department Water Reserve & Power Supply Revenue Series B-1 Bank of New York LOC§ | | 1.20 | | | 05/01/2022 | | | 29,200,000 |
| | | | |
| | 24,400,000 | | California State Department Water Reserve & Power Supply Revenue Series B-4 Bayerische Landesbank LOC§ | | 1.15 | | | 05/01/2022 | | | 24,400,000 |
| | | | |
| | 1,900,000 | | California State Department Water Reserve & Power Supply Revenue Series B-5 Bayerische Landesbank LOC§ | | 1.15 | | | 05/01/2022 | | | 1,900,000 |
| | | | |
| | 26,800,000 | | California State Department Water Reserve & Power Supply Revenue Series C-14 Westdeutsche Landesbank LOC§ | | 1.10 | | | 05/01/2022 | | | 26,800,000 |
| | | | |
| | 17,800,000 | | California State Department Water Reserve & Power Supply Revenue Series C-3 AMBAC Insured§ | | 1.05 | | | 05/01/2022 | | | 17,800,000 |
| | | | |
| | 9,000,000 | | California State Department Water Reserve Center Valley Project Revenue Putters Series 127 FGIC Insured§ | | 1.10 | | | 12/01/2022 | | | 9,000,000 |
| | | | |
| | 3,200,000 | | California State Economic Development Financing Authority Industrial Development Revenue Serra Microchassis Project US Bank NA LOC§ | | 1.20 | | | 08/01/2027 | | | 3,200,000 |
| | | | |
| | 2,005,000 | | California State Economic Development Financing Authority Industrial Development Revenue Serra Mission Project Series A US Bank NA LOC§ | | 1.20 | | | 08/01/2027 | | | 2,005,000 |
| | | | |
| | 4,995,000 | | California State Floater CTFS Series 471X MBIA Insured§ | | 1.13 | | | 09/01/2024 | | | 4,995,000 |
| | | | |
| | 9,000,000 | | California State Floats PA 315 FSA Insured§ | | 1.15 | | | 12/01/2003 | | | 9,000,000 |
| | | | |
| | 1,420,000 | | California State Floats PT 153A§ | | 1.15 | | | 12/01/2008 | | | 1,420,000 |
| | | | |
| | 11,500,000 | | California State Merlots-B 45 Wachovia Bank Insured§ | | 1.09 | | | 10/01/2029 | | | 11,500,000 |
| | | | |
| | 10,395,000 | | California State Public Works Board Lease Revenue CTFS Series 210 AMBAC Insured§ | | 1.08 | | | 01/01/2011 | | | 10,395,000 |
| | | | |
| | 19,570,000 | | California State Public Works Board Lease Revenue CTFS Series D AMBAC Insured§ | | 1.11 | | | 12/01/2019 | | | 19,570,000 |
| | | | |
| | 8,875,000 | | California State Public Works Board Lease Revenue Roc Series II-R-133 AMBAC Insured§ | | 1.11 | | | 12/01/2014 | | | 8,875,000 |
| | | | |
| | 4,205,000 | | California State Public Works Board Lease Revenue Roc Series II-R-160 AMBAC Insured§ | | 1.11 | | | 10/01/2012 | | | 4,205,000 |
| | | | |
| | 6,425,000 | | California State Putters Series 239Z AMBAC Insured§ | | 1.13 | | | 12/01/2032 | | | 6,425,000 |
| | | | |
| | 26,400,000 | | California State Series C-1 Bank of America NA LOC§ | | 1.10 | | | 05/01/2033 | | | 26,400,000 |
| | | | |
| | 20,800,000 | | California Statewide CDA Davis Retirement Care Project§ | | 1.20 | | | 11/15/2028 | | | 20,800,000 |
| | | | |
| | 6,400,000 | | California Statewide CDA MFHR Canyon Country Apartments Series M Collaterlized By FHLMC§ | | 1.15 | | | 12/01/2034 | | | 6,400,000 |
| | | | |
| | 6,750,000 | | California Statewide CDA MFHR Crocker Oaks Apartments Projectseries H Collateralized By FNMA§ | | 1.15 | | | 03/15/2034 | | | 6,750,000 |
| | | | |
| | 3,985,000 | | California Statewide CDA MFHR Granite Oaks Apartments Series R Collateralized By FNMA§ | | 1.15 | | | 10/15/2030 | | | 3,985,000 |
13
WELLSFARGOMONEYMARKETFUNDS | | PORTFOLIOOFINVESTMENTS — SEPTEMBER 30, 2003 (UNAUDITED) |
|
CALIFORNIATAX-FREEMONEYMARKETFUND
| Principal | | Security Name | | Interest Rate | | | Maturity Date | | Value |
| | | |
| California (continued) | | | | | | | | |
| | | | |
| $ | 2,160,000 | | California Statewide CDA MFHR Greenback Manorapartments Series A Collateralized By FHLB§ | | 1.10 | % | | 02/01/2028 | | $ | 2,160,000 |
| | | | |
| | 17,200,000 | | California Statewide CDA MFHR IAC Project Series W-1 Bank of America NA LOC§ | | 1.10 | | | 08/01/2034 | | | 17,200,000 |
| | | | |
| | 2,800,000 | | California Statewide CDA MFHR IAC Project Series W-2 Bank of America NA LOC§ | | 1.10 | | | 09/15/2029 | | | 2,800,000 |
| | | | |
| | 700,000 | | California Statewide CDA MFHR IAC Project Series W-3 Bank of America NA LOC§ | | 1.10 | | | 04/01/2025 | | | 700,000 |
| | | | |
| | 13,700,000 | | California Statewide CDA Revenue Childrens Hospital of Los Angeles Series Bambac Insured§ | | 1.00 | | | 08/15/2032 | | | 13,700,000 |
| | | | |
| | 9,180,000 | | California Statewide CDA Revenue CTFS Participation House Ear Institute
JP Morgan Chase & Company LOC§ | | 1.20 | | | 12/01/2018 | | | 9,180,000 |
| | | | |
| | 1,000,000 | | California Statewide CDA Revenue Fremont Rideout Health Group Series A AMBAC Insured§ | | 1.15 | | | 01/01/2031 | | | 1,000,000 |
| | | | |
| | 10,000,000 | | California Statewide CDA Revenue Series A AMBAC Insured§ | | 1.00 | | | 08/15/2032 | | | 10,000,000 |
| | | | |
| | 37,000,000 | | California Statewide CDA Revenue TRAN Series A-1 FSA Insured§ | | 2.00 | | | 06/30/2004 | | | 37,306,351 |
| | | | |
| | 11,090,000 | | California Statewide CDA Solid Waste Facilities Revenue Chevron USA Project Chevron Corporation LOC§ | | 1.18 | | | 12/15/2024 | | | 11,090,000 |
| | | | |
| | 16,420,000 | | Camarillo CA MFHR Hacienda de Camarillo Project Collateralized By FNMA§ | | 1.15 | | | 10/15/2026 | | | 16,420,000 |
| | | | |
| | 2,400,000 | | Camarillo CA MFHR Heritage Park Project Series A Collateralized By FNMA§ | | 1.10 | | | 07/15/2019 | | | 2,400,000 |
| | | | |
| | 5,000,000 | | Castaic Union School District California CTFS Participation School Facility Bridge Funding Program FSA Insured§ | | 1.05 | | | 09/01/2036 | | | 5,000,000 |
| | | | |
| | 5,100,000 | | Colton CA Redevelopment Agency CTFS Participation Las Palomas Association Project City National Bank LOC§ | | 1.05 | | | 11/01/2015 | | | 5,100,000 |
| | | | |
| | 5,985,000 | | Compton CA University School District Merlots Series B39 MBIA Insured§ | | 1.09 | | | 09/01/2027 | | | 5,985,000 |
| | | | |
| | 7,825,000 | | Contra Costa County CA Home Mortgage Revenue CTFS Series A§ | | 1.15 | | | 12/01/2010 | | | 7,825,000 |
| | | | |
| | 7,000,000 | | Contra Costa County CA MFHR Delta Square Apartments Project Series H Collateralized By FNMA§ | | 1.10 | | | 10/15/2029 | | | 7,000,000 |
| | | | |
| | 745,000 | | Contra Costa County CA MFHR El Cerrito Royale Project Series A Bank of America LOC§ | | 1.10 | | | 12/01/2017 | | | 745,000 |
| | | | |
| | 3,300,000 | | Contra Costa County CA MFHR Lafayette Town Center Apartments Series I Collateralized By FNMA§ | | 1.15 | | | 07/15/2032 | | | 3,300,000 |
| | | | |
| | 1,000,000 | | Contra Costa County CA MFHR Series B Collateralized By FNMA§ | | 1.10 | | | 11/15/2022 | | | 1,000,000 |
| | | | |
| | 32,000,000 | | Contra Costa County CA TRAN Series A | | 2.50 | | | 11/17/2003 | | | 32,043,332 |
| | | | |
| | 1,550,000 | | Covina CA Redevelopment Agency MFHR Shadowhills Apartments Series A Collateralized By FNMA§ | | 1.08 | | | 12/01/2015 | | | 1,550,000 |
| | | | |
| | 2,390,000 | | Eagle Tax-Exempt Trust CTF Series 950501 (California State) MBIA Insured§ | | 1.11 | | | 02/01/2006 | | | 2,390,000 |
| | | | |
| | 4,000,000 | | Eagle Tax-Exempt Trust CTF Series 970503 (California State Public Works Board Lease Revenue Series C) AMBAC Insured§ | | 1.11 | | | 09/01/2017 | | | 4,000,000 |
| | | | |
| | 4,400,000 | | Escondido CA Community Development Common CTFS Participation Bank of America NT & SA LOC§ | | 1.10 | | | 10/01/2016 | | | 4,400,000 |
| | | | |
| | 21,710,000 | | Fresno CA Union School District Anticipation Notes | | 1.10 | | | 02/19/2004 | | | 21,710,336 |
| | | | |
| | 6,865,000 | | Garden Grove CA Housing Authority MFHR Floats PT 1385 Collateralized By GNMA§ | | 1.15 | | | 03/23/2006 | | | 6,865,000 |
| | | | |
| | 2,725,000 | | Golden Gate Bridge Highway & Transportation District Morgan Guaranty Trust Company of New York LOC | | 0.85 | | | 10/08/2003 | | | 2,725,000 |
| | | | |
| | 4,000,000 | | Hayward CA MFHR Shorewood Series A FGIC Insured§ | | 1.05 | | | 08/01/2014 | | | 4,000,000 |
| | | | |
| | 3,700,000 | | Hayward CA MFHR Tennyson Gardens Apartments Project Series A US Bank NA LOC§ | | 1.20 | | | 08/01/2032 | | | 3,700,000 |
14
| PORTFOLIOOFINVESTMENTS — SEPTEMBER 30, 2003 (UNAUDITED) | | WELLSFARGOMONEYMARKETFUNDS |
|
CALIFORNIATAX-FREEMONEYMARKETFUND
| Principal | | Security Name | | Interest Rate | | | Maturity Date | | Value |
| | | |
| California (continued) | | | | | | | | |
| | | | |
| $ | 1,000,000 | | Hemet CA MFHR Sunwest Retirement Series A Collateralized By FHLMC§ | | 1.10 | % | | 01/01/2025 | | $ | 1,000,000 |
| | | | |
| | 1,760,000 | | Irvine CA Industrial Revenue Irvine East Investment Company Project Bank of America NA LOC§ | | 1.05 | | | 12/01/2005 | | | 1,760,000 |
| | | | |
| | 6,600,000 | | Irvine Ranch CA Water District CTFS Participation Capital Improvement Project Landesbank Baden LOC§ | | 1.15 | | | 08/01/2016 | | | 6,600,000 |
| | | | |
| | 2,000,000 | | Irvine Ranch CA Water District State Street B&T Company LOC§ | | 1.15 | | | 01/01/2021 | | | 2,000,000 |
| | | | |
| | 5,500,000 | | Lancaster CA Redevelopment Agency MFHR 20Th Street Apartments Project Series C Collateralized By FNMA§ | | 1.10 | | | 12/01/2026 | | | 5,500,000 |
| | | | |
| | 4,450,000 | | Livermore CA Redevelopment Agency MFHR Series 2002A Livermore Apartments Project Bank of America NA LOC§ | | 1.25 | | | 11/01/2040 | | | 4,450,000 |
| | | | |
| | 2,135,000 | | Long Beach CA Harbor Revenue Series 418 FGIC Insured§ | | 1.13 | | | 05/15/2020 | | | 2,135,000 |
| | | | |
| | 2,800,000 | | Long Beach CA Hbr Rev PA 651 FGIC Insured§ | | 1.15 | | | 05/15/2019 | | | 2,800,000 |
| | | | |
| | 7,140,000 | | Los Angeles CA Community Redevelopment Agency MFHR Series A Rowan Lofts Project FNMA Insured§ | | 1.15 | | | 12/01/2034 | | | 7,140,000 |
| | | | |
| | 12,000,000 | | Los Angeles CA Convention & Exhibition Center Authority Lease Revenue Series C1 AMBAC Insured§ | | 0.97 | | | 08/15/2021 | | | 12,000,000 |
| | | | |
| | 6,305,000 | | Los Angeles CA Convention & Exhibition Center Authority Lease Revenue Series D AMBAC Insured§ | | 0.97 | | | 08/15/2021 | | | 6,305,000 |
| | | | |
| | 12,000,000 | | Los Angeles CA Department of Airports Revenue Series C1 Los Angeles International Airport§ | | 1.05 | | | 05/15/2020 | | | 12,000,000 |
| | | | |
| | 6,795,000 | | Los Angeles CA Harbor Department Revenue Transportation Receipts Class F Series 7 MBIA Insured§ | | 1.11 | | | 11/01/2026 | | | 6,795,000 |
| | | | |
| | 7,300,000 | | Los Angeles CA MFHR Broadway Plaza Project Series L§ | | 1.10 | | | 12/01/2034 | | | 7,300,000 |
| | | | |
| | 2,500,000 | | Los Angeles CA MFHR Fountain Park Project Series P§ | | 1.05 | | | 04/15/2033 | | | 2,500,000 |
| | | | |
| | 3,700,000 | | Los Angeles CA MFHR LA Bera Apartment Project Series G Citibank NA LOC§ | | 1.05 | | | 12/01/2030 | | | 3,700,000 |
| | | | |
| | 100,000 | | Los Angeles CA MFHR Loans To Lenders Program Series A FHLB LOC§ | | 1.25 | | | 08/01/2026 | | | 100,000 |
| | | | |
| | 5,300,000 | | Los Angeles CA MFHR Masselin Manor Housing Project Bank of America Nt & SA LOC§ | | 1.10 | | | 07/01/2015 | | | 5,300,000 |
| | | | |
| | 9,000,000 | | Los Angeles CA Union School District COP Multiple Properties Project Series B§ | | 2.25 | | | 10/01/2003 | | | 9,000,000 |
| | | | |
| | 18,300,000 | | Los Angeles CA Union School District Merlots Series A22§ | | 1.09 | | | 07/01/2022 | | | 18,300,000 |
| | | | |
| | 5,000,000 | | Los Angeles CA Union School District Merlots Series B12§ | | 1.09 | | | 01/01/2027 | | | 5,000,000 |
| | | | |
| | 55,500,000 | | Los Angeles CA Union School District TRAN Series A | | 2.00 | | | 07/01/2004 | | | 55,944,576 |
| | | | |
| | 5,000,000 | | Los Angeles CA Wastewater System Sewer Revenue ROCS RR II R 4034§ | | 1.11 | | | 06/01/2022 | | | 5,000,000 |
| | | | |
| | 10,200,000 | | Los Angeles CA Wastewater System Sewer Revenue Series A FGIC Insured§ | | 1.25 | | | 12/01/2031 | | | 10,200,000 |
| | | | |
| | 8,600,000 | | Los Angeles CA Wastewater System Sewer Revenue Series B FGIC Insured§ | | 1.25 | | | 12/01/2031 | | | 8,600,000 |
| | | | |
| | 5,995,000 | | Los Angeles CA Water & Power Revenue Series 182 FSA Insured§ | | 1.10 | | | 07/01/2022 | | | 5,995,000 |
| | | | |
| | 10,595,000 | | Los Angeles CA Water & Power Revenue Series 184 FSA Insured§ | | 1.10 | | | 07/01/2022 | | | 10,595,000 |
| | | | |
| | 4,200,000 | | Los Angeles CA Water & Power Revenue Subseries A-2§ | | 1.05 | | | 07/01/2035 | | | 4,200,000 |
| | | | |
| | 16,700,000 | | Los Angeles CA Water & Power Revenue Subseries A-4§ | | 1.05 | | | 07/01/2035 | | | 16,700,000 |
| | | | |
| | 6,300,000 | | Los Angeles CA Water & Power Revenue Subseries A-6§ | | 1.05 | | | 07/01/2035 | | | 6,300,000 |
| | | | |
| | 20,000,000 | | Los Angeles CA Water & Power Revenue Subseries A-7§ | | 1.05 | | | 07/01/2035 | | | 20,000,000 |
| | | | |
| | 3,000,000 | | Los Angeles CA Water & Power Revenue Subseries B-1 Dexia Insured§ | | 1.05 | | | 07/01/2035 | | | 3,000,000 |
| | | | |
| | 20,900,000 | | Los Angeles CA Water & Power Revenue Subseries B-2§ | | 1.05 | | | 07/01/2034 | | | 20,900,000 |
| | | | |
| | 20,500,000 | | Los Angeles CA Water & Power Revenue Subseries B-3§ | | 1.18 | | | 07/01/2034 | | | 20,500,000 |
| | | | |
| | 1,450,000 | | Los Angeles CA Water & Power Revenue Subseries B-6§ | | 1.20 | | | 07/01/2034 | | | 1,450,000 |
| | | | |
| | 7,100,000 | | Los Angeles CA Water & Power Revenue Subseries B-7§ | | 1.05 | | | 07/01/2034 | | | 7,100,000 |
| | | | |
| | 13,600,000 | | Los Angeles CA Water & Power Revenue Subseries B-8 Bank of America NA LOC§ | | 1.05 | | | 07/01/2034 | | | 13,600,000 |
15
WELLSFARGOMONEYMARKETFUNDS | | PORTFOLIOOFINVESTMENTS — SEPTEMBER 30, 2003 (UNAUDITED) |
|
CALIFORNIATAX-FREEMONEYMARKETFUND
| Principal | | Security Name | | Interest Rate | | | Maturity Date | | Value |
| | | |
| California (continued) | | | | | | | | |
| | | | |
| $ | 18,670,000 | | Los Angeles County CA Metropolitan Transportation Authority Revenue FSA Insured§ | | 1.11 | % | | 07/01/2016 | | $ | 18,670,000 |
| | | | |
| | 20,200,000 | | Los Angeles County CA Metropolitan Transportation Authority Revenue FSA Insured§ | | 1.11 | | | 07/01/2021 | | | 20,200,000 |
| | | | |
| | 10,000,000 | | Los Angeles County CA Metropolitan Transportation Authority Revenue FSA Insured§ | | 1.11 | | | 07/01/2025 | | | 10,000,000 |
| | | | |
| | 3,000,000 | | Los Angeles County CA MFHR Authority Revenue P Float PT 639§ | | 1.22 | | | 10/01/2031 | | | 3,000,000 |
| | | | |
| | 5,850,000 | | Los Angeles County CA Pension Obligation Series B§ | | 1.01 | | | 06/30/2007 | | | 5,850,000 |
| | | | |
| | 1,305,000 | | Los Angeles County CA Pension Obligation Series C§ | | 1.00 | | | 06/30/2007 | | | 1,305,000 |
| | | | |
| | 5,000,000 | | Los Angeles County CA Sanitation District Revenue Series A | | 5.25 | | | 10/01/2019 | | | 5,100,000 |
| | | | |
| | 12,800,000 | | Los Angeles County CA Schools TRAN Series A | | 1.75 | | | 06/30/2004 | | | 12,878,504 |
| | | | |
| | 10,000,000 | | Los Angeles County CA Transportation Common Sales Revenue Series A FGIC Insured§ | | 1.00 | | | 07/01/2012 | | | 10,000,000 |
| | | | |
| | 9,055,000 | | Metropolitan Water District Southern CA Waterworks Revenue MBIA Insured§ | | 1.14 | | | 07/01/2030 | | | 9,055,000 |
| | | | |
| | 4,965,000 | | Metropolitan Water District Southern CA Waterworks Revenue Merlots A21§ | | 1.09 | | | 07/01/2021 | | | 4,965,000 |
| | | | |
| | 56,145,000 | | Metropolitan Water District Southern CA Waterworks Revenue Series A§ | | 1.03 | | | 07/01/2025 | | | 56,145,000 |
| | | | |
| | 3,400,000 | | Metropolitan Water District Southern CA Waterworks Revenue Series A AMBAC Insured§ | | 1.05 | | | 06/01/2023 | | | 3,400,000 |
| | | | |
| | 6,850,000 | | Metropolitan Water District Southern CA Waterworks Revenue Series B-3§ | | 1.15 | | | 07/01/2035 | | | 6,850,000 |
| | | | |
| | 11,100,000 | | Modesto CA Irrigation District Financing Authority Revenue Series SG66 MBIA Insured§ | | 1.14 | | | 10/01/2015 | | | 11,100,000 |
| | | | |
| | 6,500,000 | | Modesto CA MFHR Live Oak Apartments Project Collateralized By FNMA§ | | 1.10 | | | 09/15/2024 | | | 6,500,000 |
| | | | |
| | 5,620,000 | | Modesto CA PFA Lease Revenue Series 354 AMBAC Insured§ | | 1.08 | | | 09/01/2029 | | | 5,620,000 |
| | | | |
| | 31,900,000 | | Msr Public Power Agency CA Utility Tax Revenue San Juan Project Series F MBIA Insured§ | | 1.20 | | | 07/01/2022 | | | 31,900,000 |
| | | | |
| | 4,170,000 | | Msr Public Power Agency CA Utility Tax Revenue San Juan Project Series II R 134 MBIA Insured§ | | 1.11 | | | 07/01/2013 | | | 4,170,000 |
| | | | |
| | 2,400,000 | | Newport Beach CA Revenue Hoag Memorial Hospital Series A§ | | 1.23 | | | 10/01/2026 | | | 2,400,000 |
| | | | |
| | 19,700,000 | | Newport Beach CA Revenue Hoag Memorial Hospital Series B§ | | 1.23 | | | 10/01/2026 | | | 19,700,000 |
| | | | |
| | 10,500,000 | | Newport Beach CA Revenue Hoag Memorial Hospital Series C§ | | 1.23 | | | 10/01/2026 | | | 10,500,000 |
| | | | |
| | 2,965,000 | | Norwalk LA Mirada CA Union School District Series A§ | | 2.00 | | | 08/01/2004 | | | 2,993,907 |
| | | | |
| | 11,800,000 | | Orange County CA Apartment Development Revenue Bluffs Apartment Project Series C FHLMC LOC§ | | 1.10 | | | 12/01/2029 | | | 11,800,000 |
| | | | |
| | 4,000,000 | | Orange County CA Apartment Development Revenue Park Ridge Villas Project FNMA LOC§ | | 1.10 | | | 11/15/2028 | | | 4,000,000 |
| | | | |
| | 5,600,000 | | Orange County CA Apartment Development Revenue Seaside Meadows Partners Project Series 1984C FHLMC LOC§ | | 1.00 | | | 08/01/2008 | | | 5,600,000 |
| | | | |
| | 8,000,000 | | Orange County CA Apartment Development Revenue Series A FHLMC LOC§ | | 1.10 | | | 12/01/2006 | | | 8,000,000 |
| | | | |
| | 26,805,000 | | Orange County CA Apartment Development Revenue Series B Aliso Creek Project FHLMC LOC§ | | 1.05 | | | 11/01/2022 | | | 26,805,000 |
| | | | |
| | 7,449,000 | | Orange County CA Apartment Development Revenue Series D Harbor Pointe Project FHLMC LOC§ | | 1.10 | | | 12/01/2022 | | | 7,449,000 |
| | | | |
| | 9,098,000 | | Orange County CA Improvement Assessment District Number 88 Series 1 KBC Bank NV LOC§ | | 1.20 | | | 09/02/2018 | | | 9,098,000 |
| | | | |
| | 12,490,000 | | Orange County CA Sanitation Districts COP AMBAC Insured§ | | 1.05 | | | 08/01/2013 | | | 12,490,000 |
| | | | |
| | 1,375,000 | | Orange County CA Special Financing Authority Teeter Plan Revenue Series B AMBAC Insured§ | | 1.05 | | | 11/01/2014 | | | 1,375,000 |
16
| PORTFOLIOOFINVESTMENTS — SEPTEMBER 30, 2003 (UNAUDITED) | | WELLSFARGOMONEYMARKETFUNDS |
|
CALIFORNIATAX-FREEMONEYMARKETFUND
| Principal | | Security Name | | Interest Rate | | | Maturity Date | | Value |
|
| California (continued) |
| | | | |
| $ | 3,050,000 | | Orange County CA Special Financing Authority Teeter Plan Revenue Series D AMBAC Insured§ | | 1.05 | % | | 11/01/2014 | | $ | 3,050,000 |
| | | | |
| | 3,000,000 | | Orange County CA Special Financing Authority Teeter Plan Revenue Series E AMBAC Insured§ | | 1.05 | | | 11/01/2014 | | | 3,000,000 |
| | | | |
| | 5,000,000 | | Pacific CA HFA Lease Revenue Series A FHLMC Insured§ | | 1.10 | | | 02/01/2007 | | | 5,000,000 |
| | | | |
| | 720,000 | | Palo Alto CA USD Series II R 93§ | | 1.11 | | | 08/01/2016 | | | 720,000 |
| | | | |
| | 10,000,000 | | Port of Oakland CA | | 0.80 | | | 10/07/2003 | | | 10,000,000 |
| | | | |
| | 12,000,000 | | Port of Oakland CA Series D | | 0.80 | | | 10/08/2003 | | | 12,000,000 |
| | | | |
| | 6,000,000 | | Port of Oakland CA Series D | | 0.90 | | | 10/09/2003 | | | 6,000,000 |
| | | | |
| | 14,000,000 | | Port of Oakland CA Series D | | 0.80 | | | 10/14/2003 | | | 14,000,000 |
| | | | |
| | 11,400,000 | | Port of Oakland CA Series D | | 0.80 | | | 10/15/2003 | | | 11,400,000 |
| | | | |
| | 4,995,000 | | Port of Oakland CA Transportation Revenue FGIC Insured§ | | 1.15 | | | 05/01/2008 | | | 4,995,000 |
| | | | |
| | 7,285,000 | | Port of Oakland CA Transportation Revenue MBIA Insured§ | | 1.15 | | | 05/01/2010 | | | 7,285,000 |
| | | | |
| | 18,290,000 | | Port of Oakland CA Transportation Revenue Series 5 FGIC Insured§ | | 1.08 | | | 11/01/2012 | | | 18,290,000 |
| | | | |
| | 2,690,000 | | Rancho Mirage CA JT Powers Financing Authority Certificates of Participation EISenhower Medical Center Project§ | | 1.07 | | | 07/01/2022 | | | 2,690,000 |
| | | | |
| | 2,245,000 | | Riverside County CA Asset Lending Corporation Leasehold Revenue MBIA Insured§ | | 1.08 | | | 06/01/2016 | | | 2,245,000 |
| | | | |
| | 8,100,000 | | Riverside County CA Community Facilities District Series 88-4 KBC Bank LOC§ | | 1.10 | | | 09/01/2014 | | | 8,100,000 |
| | | | |
| | 5,000,000 | | Riverside County CA IDA Bank of America NA LOC§ | | 1.10 | | | 06/01/2026 | | | 5,000,000 |
| | | | |
| | 22,400,000 | | Riverside San Bernadino CA Housing & Finance Agency Lease Revenue Series A Societe Generale LOC§ | | 1.10 | | | 07/01/2006 | | | 22,400,000 |
| | | | |
| | 3,000,000 | | Roaring Fork Municipal Products Limited Liability Corporation Series 2000-12 Class A§ | | 1.24 | | | 03/01/2034 | | | 3,000,000 |
| | | | |
| | 7,000,000 | | Sacramento County CA HFA MFHR Arlington Creek Apartment Series 1 Collateralized By FNMA§ | | 1.15 | | | 05/15/2034 | | | 7,000,000 |
| | | | |
| | 6,300,000 | | Sacramento County CA HFA MFHR Hidden Oaks Apartments Project Series C Collateralized By FNMA§ | | 1.15 | | | 05/15/2029 | | | 6,300,000 |
| | | | |
| | 6,000,000 | | Sacramento County CA Housing Authority MFHR Normandy Park Apartments Series A§ | | 1.15 | | | 02/15/2033 | | | 6,000,000 |
| | | | |
| | 2,500,000 | | Sacramento County CA MFHR Series C Collateralized By FHLMC§ | | 1.05 | | | 04/15/2007 | | | 2,500,000 |
| | | | |
| | 5,200,000 | | Sacramento County CA MFHR Suncreek Apartments Project Series A§ | | 1.10 | | | 04/01/2026 | | | 5,200,000 |
| | | | |
| | 7,600,000 | | Sacramento County CA Sanitation District Financing Authority Revenue Subordinate Lien Sacramento Regulation C Credit Agricole Indosuez LOC§ | | 1.05 | | | 12/01/2030 | | | 7,600,000 |
| | | | |
| | 6,115,000 | | San Bernadino County CA MFHR Green Valley Apartments Project Series A Collateralized By FNMA§ | | 1.10 | | | 05/15/2029 | | | 6,115,000 |
| | | | |
| | 5,665,000 | | San Bernardino CA Community College District Series RR II R-3006 MBIA Insured§ | | 1.11 | | | 08/01/2023 | | | 5,665,000 |
| | | | |
| | 39,000,000 | | San Bernardino County CA TRAN | | 1.50 | | | 07/01/2004 | | | 39,202,625 |
| | | | |
| | 3,395,000 | | San Diego CA Area HFA Lease Revenue Series B Collateralized By FNMA§ | | 1.10 | | | 06/01/2006 | | | 3,395,000 |
| | | | |
| | 57,260,000 | | San Diego CA County & School District Revenue Anticipation Notes Series A | | 1.75 | | | 06/30/2004 | | | 57,619,750 |
| | | | |
| | 14,825,000 | | San Diego CA HFA MFHR Stratton Apartments Project Series A Collateralized By FNMA§ | | 1.15 | | | 01/15/2033 | | | 14,825,000 |
| | | | |
| | 16,830,000 | | San Diego CA MFHR Collateralized By FHLMC§ | | 1.13 | | | 09/01/2004 | | | 16,830,000 |
| | | | |
| | 32,595,000 | | San Diego CA MFHR Collateralized By FHLMC§ | | 1.13 | | | 03/01/2032 | | | 32,595,000 |
| | | | |
| | 10,200,000 | | San Diego CA MFHR Collateralized By FNMA§ | | 1.05 | | | 08/01/2014 | | | 10,200,000 |
| | | | |
| | 11,050,000 | | San Diego CA MFHR Paseo Series A§ | | 1.05 | | | 12/01/2022 | | | 11,050,000 |
| | | | |
| | 19,130,000 | | San Diego CA Public Facilities Financing Authority Sewer Revenue Series SG 130§ | | 1.11 | | | 05/15/2029 | | | 19,130,000 |
17
WELLSFARGOMONEYMARKETFUNDS | | PORTFOLIOOFINVESTMENTS — SEPTEMBER 30, 2003 (UNAUDITED) |
|
CALIFORNIATAX-FREEMONEYMARKETFUND
| Principal | | Security Name | | Interest Rate | | | Maturity Date | | Value |
|
| California (continued) |
| | | | |
| $ | 5,430,000 | | San Diego CA Public Facilities Financing Authority Water Revenue Class A§ | | 1.11 | % | | 08/01/2012 | | $ | 5,430,000 |
| | | | |
| | 6,621,000 | | San Diego CA Union School District Floaters Series 759 FSA Insured§ | | 1.08 | | | 07/01/2026 | | | 6,621,000 |
| | | | |
| | 5,826,000 | | San Diego CA Union School District Series 758§ | | 1.08 | | | 07/01/2027 | | | 5,826,000 |
| | | | |
| | 11,580,000 | | San Diego CA Union School District Series PA-804§ | | 1.11 | | | 07/01/2022 | | | 11,580,000 |
| | | | |
| | 4,975,000 | | San Francisco CA City & County CTFS Series C-6§ | | 1.10 | | | 06/15/2007 | | | 4,975,000 |
| | | | |
| | 15,800,000 | | San Francisco CA City & County Finance Corporation Lease Revenue Moscone Center Expansion Project Series 1 AMBAC Insured§ | | 1.03 | | | 04/01/2030 | | | 15,800,000 |
| | | | |
| | 10,700,000 | | San Francisco CA City & County Public Utilities Commission For Clean Water Merlots Series B20 MBIA Insured§ | | 1.09 | | | 10/01/2022 | | | 10,700,000 |
| | | | |
| | 1,500,000 | | San Jose CA MFHR Almaden Lake Village Apartments Project Series A Collateralized By FNMA§ | | 1.12 | | | 03/01/2032 | | | 1,500,000 |
| | | | |
| | 19,000,000 | | San Jose CA MFHR Evans Lane Apartments Project Series H Bank of America NA LOC§ | | 1.10 | | | 04/15/2036 | | | 19,000,000 |
| | | | |
| | 2,000,000 | | San Jose CA Redevelopment Agency Tax Allocation Putters Series 158Z Morgan Guaranty LOC§ | | 1.10 | | | 08/01/2014 | | | 2,000,000 |
| | | | |
| | 6,857,500 | | San Jose CA Union School District Santa Clara County Floaters Series 761 FSA Insured§ | | 1.08 | | | 08/01/2027 | | | 6,857,500 |
| | | | |
| | 8,690,000 | | San Jose-Santa Clara CA Water Financing Authority Sewer Revenue Floats SG 49§ | | 1.11 | | | 11/15/2020 | | | 8,690,000 |
| | | | |
| | 2,200,000 | | San Leandro CA MFHR Haas Avenue Apartments Series B Security Pacific National LOC§ | | 1.05 | | | 10/01/2007 | | | 2,200,000 |
| | | | |
| | 5,800,000 | | Santa Ana CA Health Facility Revenue Multi-Modal Town & Country Project BNP Paribas LOC§ | | 1.20 | | | 10/01/2020 | | | 5,800,000 |
| | | | |
| | 9,000,000 | | Santa Barbara County CA TRAN Series A | | 2.00 | | | 07/23/2004 | | | 9,086,649 |
| | | | |
| | 6,165,000 | | Santa Clara CA Electric Revenue Series A AMBAC Insured§ | | 1.05 | | | 07/01/2010 | | | 6,165,000 |
| | | | |
| | 2,395,000 | | Santa Clara CA Electric Revenue Series B AMBAC Insured§ | | 1.05 | | | 07/01/2010 | | | 2,395,000 |
| | | | |
| | 5,900,000 | | Santa Clara County CA MFHR Benton Park Center Apartments Project Series A Collateralized By FNMA§ | | 1.15 | | | 12/15/2025 | | | 5,900,000 |
| | | | |
| | 11,400,000 | | Santa Clara County CA MFHR Foxchase Apartments Project Series E FGIC Insured§ | | 1.05 | | | 11/01/2007 | | | 11,400,000 |
| | | | |
| | 6,150,000 | | Simi Valley CA MFHR Series A§ | | 1.10 | | | 07/01/2023 | | | 6,150,000 |
| | | | |
| | 24,000,000 | | Sonoma County CA TRAN | | 2.50 | | | 10/14/2003 | | | 24,008,072 |
| | | | |
| | 30,595,000 | | South Orange County CA PFA Special Tax Revenue Series 146§ | | 1.10 | | | 08/15/2015 | | | 30,595,000 |
| | | | |
| | 2,300,000 | | Southeast Resource Recovery Facilities Authority Lease Revenue Refunding Bonds Series B§ | | 1.04 | | | 12/01/2018 | | | 2,300,000 |
| | | | |
| | 1,300,000 | | Southern CA Public Power Authority Power Revenue Palo Verde Project Series C§ | | 1.00 | | | 07/01/2017 | | | 1,300,000 |
| | | | |
| | 13,400,000 | | Southern CA Public Power Authority Power Revenue Series A§ | | 1.05 | | | 07/01/2023 | | | 13,400,000 |
| | | | |
| | 7,620,000 | | Southern CA Public Power Authority Power Revenue Series B§ | | 1.00 | | | 07/01/2009 | | | 7,620,000 |
| | | | |
| | 7,400,000 | | Stanford University | | 0.90 | | | 02/06/2004 | | | 7,400,000 |
| | | | |
| | 2,000,000 | | Stockton CA Health Facilities Revenue Series A§ | | 1.15 | | | 12/01/2032 | | | 2,000,000 |
| | | | |
| | 5,000,000 | | Tahoe Forest CA Hospital District Revenue§ | | 1.15 | | | 07/01/2033 | | | 5,000,000 |
| | | | |
| | 3,100,000 | | Tulare CA Local Health Care District Health Facility Revenue§ | | 1.15 | | | 12/01/2032 | | | 3,100,000 |
| | | | |
| | 26,550,000 | | Turlock CA Irrigation District COP Capital Improvement Project Societe Generale LOC§ | | 1.20 | | | 01/01/2031 | | | 26,550,000 |
| | | | |
| | 3,000,000 | | University CA Education Facilities Revenue Series 480 MBIA Insured§ | | 1.13 | | | 09/01/2022 | | | 3,000,000 |
| | | | |
| | 7,000,000 | | University of California | | 0.80 | | | 10/06/2003 | | | 7,000,000 |
| | | | |
| | 10,000,000 | | University of California | | 0.85 | | | 10/10/2003 | | | 10,000,000 |
| | | | |
| | 7,500,000 | | University of California | | 0.85 | | | 10/16/2003 | | | 7,500,000 |
| | | | |
| | 15,000,000 | | University of California | | 0.90 | | | 10/20/2003 | | | 15,000,000 |
18
PORTFOLIOOFINVESTMENTS — SEPTEMBER 30, 2003 (UNAUDITED) | | WELLSFARGOMONEYMARKETFUNDS |
|
CALIFORNIATAX-FREEMONEYMARKETFUND
| Principal | | Security Name | | Interest Rate | | | Maturity Date | | Value |
|
| California (continued) |
| | | | |
| $ | 18,000,000 | | University of California | | 0.85 | % | | 11/18/2003 | | $ | 18,000,000 |
| | | | |
| | 15,000,000 | | University of California | | 0.85 | | | 12/08/2003 | | | 15,000,000 |
| | | | |
| | 3,700,000 | | Vacaville CA MFHR Quail Run Project Series A§ | | 1.05 | | | 07/15/2018 | | | 3,700,000 |
| | | | |
| | 4,800,000 | | Vallejo CA MFHR Hillside Terrace Apartments Series A Collaterized By FNMA§ | | 1.10 | | | 03/15/2027 | | | 4,800,000 |
| | | | |
| | | | | | | | | | | | 2,354,424,053 |
| | | | | | | | | | |
|
|
|
| Other – 4.43% |
| | | | |
| | 17,995,000 | | ABN AMRO Munitops CTFS Tr 1998-20 Munitops Certificates AMBAC Insured§ | | 1.13 | | | 07/05/2006 | | | 17,995,000 |
| | | | |
| | 13,176,000 | | ABN AMRO Munitops CTFS Tr 1998-25 Munitops Certificates FGIC Insured§ | | 1.13 | | | 07/05/2006 | | | 13,176,000 |
| | | | |
| | 17,000,000 | | ABN AMRO Munitops CTFS Tr 2000-5 Munitops Certificates FGIC Insured§^ | | 1.16 | | | 05/07/2008 | | | 17,000,000 |
| | | | |
| | 2,700,000 | | Municipal Securities Trust Series 2001 136 Class A§ | | 1.20 | | | 12/06/2018 | | | 2,700,000 |
| | | | |
| | 42,876,217 | | Newman Capital Trust Series 2000-1 Class A§ | | 1.19 | | | 04/01/2032 | | | 42,876,217 |
| | | | |
| | 17,500,000 | | Newman Capital Trust Series 2001-1 Class A§ | | 1.19 | | | 04/07/2031 | | | 17,500,000 |
| | | | |
| | | | | | | | | | | | 111,247,217 |
| | | | | | | | | | |
|
|
| | | |
| Puerto Rico – 1.65% | | | | | | | | |
| | | | |
| | 7,200,000 | | Eagle Tax-Exempt Trust CTF 20015101 Class A (Puerto Rico Commonwealth Infrastructure Financing Authority Series A)§ | | 1.11 | | | 10/01/2034 | | | 7,200,000 |
| | | | |
| | 10,000,000 | | Eagle Tax-Exempt Trust CTF 20025102 Class A (Puerto Rico Commonwealth Highway & Transportation Revenue Series D) FSA Insured§ | | 1.11 | | | 07/01/2027 | | | 10,000,000 |
| | | | |
| | 5,000,000 | | Puerto Rico Commonwealth Highway & Transportation Authority Revenue Series 2 MBIA Insured§ | | 1.11 | | | 07/01/2038 | | | 5,000,000 |
| | | | |
| | 4,995,000 | | Puerto Rico Commonwealth Infrastructure Financing Authority Series 86§ | | 1.08 | | | 07/01/2015 | | | 4,995,000 |
| | | | |
| | 5,360,000 | | Puerto Rico Commonwealth Municipal Finance Agency Series 645 FSA Insured§ | | 1.06 | | | 08/01/2015 | | | 5,360,000 |
| | | | |
| | 6,135,000 | | Puerto Rico Commonwealth Public Buildings Authority Revenue Series 416 FSA Insured§ | | 1.08 | | | 07/01/2021 | | | 6,135,000 |
| | | | |
| | 2,775,000 | | Puerto Rico Commonwealth Public Finance Corporation Series 522X MBIA Insured§ | | 1.08 | | | 08/01/2022 | | | 2,775,000 |
| | | | |
| | | | | | | | | | | | 41,465,000 |
| | | | | | | | | | |
|
|
| | |
Total Municipal Securities (Cost $2,507,136,270) | | | | | 2,507,136,270 |
| | | | | | | | | | |
|
|
| | | |
Total Investments In Securities
(Cost $2,507,136,270)* | | 99.85 | % | | | | $ | 2,507,136,270 |
| | | |
Other Assets And Liabilities, Net | | 0.15 | | | | | | 3,846,871 |
| | |
|
| | | |
|
|
| Total Net Assets | | 100.00 | % | | | | $ | 2,510,983,141 |
| | |
|
| | | |
|
|
| * | | Cost for federal income tax purposes is substantially the same as for financial reporting purposes. |
| ^ | | Securities that may be resold to “Qualified institutional buyers” under rule 144A or securities offered pursuant to section 4(2) of the Securities Act of 1933, as amended. These securities have been determined to be liquid by the Adviser based on procedures approved by the Board of Trustees. |
| § | | These variable rate securities are subject to a demand feature which reduces the remaining maturity. |
The accompanying notes are an integral part of these financial statements.
19
| WELLSFARGOMONEYMARKETFUNDS | | PORTFOLIOOFINVESTMENTS — SEPTEMBER 30, 2003 (UNAUDITED) |
|
GOVERNMENTMONEYMARKETFUND
| Principal | | Security Name | | Interest Rate | | | Maturity Date | | Value |
| | | |
| Discount Notes – Agency – 31.98% | | | | | | | | |
| | | |
| Federal Farm Credit Bank – 2.05% | | | | | | | | |
| | | | |
| $ | 2,530,000 | | FFCB | | 1.59 | %† | | 10/02/2003 | | $ | 2,529,888 |
| | | | |
| | 12,147,000 | | FFCB | | 1.14 | † | | 11/17/2003 | | | 12,128,921 |
| | | | |
| | 5,241,000 | | FFCB | | 1.13 | † | | 12/05/2003 | | | 5,230,307 |
| | | | |
| | 8,000,000 | | FFCB | | 1.22 | † | | 12/15/2003 | | | 7,979,667 |
| | | | |
| | 100,000,000 | | FFCB | | 1.02 | † | | 07/16/2004 | | | 100,000,000 |
| | | | |
| | | | | | | | | | | | 127,868,783 |
| | | | | | | | | | |
|
|
| | | |
| Federal Home Loan Bank – 6.73% | | | | | | | | |
| | | | |
| | 58,200,000 | | FHLB | | 1.05 | † | | 10/15/2003 | | | 58,176,235 |
| | | | |
| | 75,000,000 | | FHLB | | 1.03 | † | | 10/22/2003 | | | 74,955,156 |
| | | | |
| | 50,000,000 | | FHLB | | 1.04 | † | | 11/28/2003 | | | 49,916,222 |
| | | | |
| | 38,394,000 | | FHLB | | 1.03 | † | | 12/05/2003 | | | 38,322,945 |
| | | | |
| | 74,750,000 | | FHLB | | 1.03 | † | | 12/10/2003 | | | 74,600,292 |
| | | | |
| | 24,000,000 | | FHLB | | 1.09 | † | | 02/04/2004 | | | 23,908,440 |
| | | | |
| | 50,000,000 | | FHLB | | 1.08 | † | | 03/05/2004 | | | 49,766,000 |
| | | | |
| | 50,000,000 | | FHLB | | 1.08 | † | | 03/12/2004 | | | 49,756,632 |
| | | | |
| | | | | | | | | | | | 419,401,922 |
| | | | | | | | | | |
|
|
| | | |
| Federal Home Loan Mortgage Corporation – 17.85% | | | | | | | | |
| | | | |
| | 30,000,000 | | FHLMC | | 1.08 | † | | 10/07/2003 | | | 29,994,600 |
| | | | |
| | 15,000,000 | | FHLMC | | 1.15 | † | | 10/09/2003 | | | 14,996,167 |
| | | | |
| | 55,000,000 | | FHLMC | | 1.21 | † | | 10/27/2003 | | | 54,951,936 |
| | | | |
| | 25,000,000 | | FHLMC | | 1.49 | † | | 10/27/2003 | | | 24,973,097 |
| | | | |
| | 20,000,000 | | FHLMC | | 0.99 | † | | 11/06/2003 | | | 19,980,200 |
| | | | |
| | 20,000,000 | | FHLMC | | 0.99 | † | | 11/07/2003 | | | 19,979,650 |
| | | | |
| | 58,796,000 | | FHLMC | | 1.00 | † | | 11/07/2003 | | | 58,735,571 |
| | | | |
| | 50,089,000 | | FHLMC | | 1.13 | † | | 11/17/2003 | | | 50,015,105 |
| | | | |
| | 100,000,000 | | FHLMC | | 0.99 | † | | 11/28/2003 | | | 99,840,500 |
| | | | |
| | 64,572,000 | | FHLMC | | 0.97 | † | | 12/11/2003 | | | 64,448,470 |
| | | | |
| | 75,000,000 | | FHLMC | | 0.97 | † | | 12/16/2003 | | | 74,846,417 |
| | | | |
| | 50,000,000 | | FHLMC | | 1.07 | † | | 12/17/2003 | | | 49,885,569 |
| | | | |
| | 50,000,000 | | FHLMC | | 1.06 | † | | 12/24/2003 | | | 49,876,917 |
| | | | |
| | 36,000,000 | | FHLMC | | 1.06 | † | | 12/30/2003 | | | 35,905,050 |
| | | | |
| | 75,000,000 | | FHLMC | | 1.20 | † | | 01/09/2004 | | | 74,750,000 |
| | | | |
| | 70,000,000 | | FHLMC | | 1.05 | † | | 01/30/2004 | | | 69,752,958 |
| | | | |
| | 49,102,000 | | FHLMC | | 1.10 | † | | 02/02/2004 | | | 48,916,804 |
| | | | |
| | 50,000,000 | | FHLMC | | 1.11 | † | | 02/12/2004 | | | 49,793,417 |
| | | | |
| | 50,000,000 | | FHLMC | | 1.15 | † | | 02/17/2004 | | | 49,778,951 |
| | | | |
| | 28,658,000 | | FHLMC | | 1.24 | † | | 02/26/2004 | | | 28,511,908 |
| | | | |
| | 50,000,000 | | FHLMC | | 1.09 | † | | 03/03/2004 | | | 49,766,861 |
| | | | |
| | 65,000,000 | | FHLMC | | 1.10 | † | | 03/25/2004 | | | 64,650,444 |
| | | | |
| | 28,401,000 | | FHLMC | | 1.12 | † | | 04/14/2004 | | | 28,228,590 |
| | | | |
| | | | | | | | | | | | 1,112,579,182 |
| | | | | | | | | | |
|
|
20
PORTFOLIOOFINVESTMENTS — SEPTEMBER 30, 2003 (UNAUDITED) | | WELLSFARGOMONEYMARKETFUNDS |
|
GOVERNMENTMONEYMARKETFUND
| Principal | | Security Name | | Interest Rate | | | Maturity Date | | Value |
| | | |
| Federal National Mortgage Association – 5.35% | | | | | | | | |
| | | | |
| $ | 32,194,230 | | FNMA | | 0.97 | %† | | 10/01/2003 | | $ | 32,194,230 |
| | | | |
| | 49,917,000 | | FNMA | | 1.23 | † | | 10/17/2003 | | | 49,889,934 |
| | | | |
| | 20,000,000 | | FNMA | | 0.97 | † | | 10/29/2003 | | | 19,984,911 |
| | | | |
| | 50,000,000 | | FNMA | | 1.10 | † | | 12/01/2003 | | | 49,907,229 |
| | | | |
| | 30,000,000 | | FNMA | | 1.09 | † | | 01/02/2004 | | | 29,915,525 |
| | | | |
| | 9,000,000 | | FNMA | | 1.12 | † | | 01/02/2004 | | | 8,980,400 |
| | | | |
| | 8,427,800 | | FNMA | | 1.12 | † | | 01/02/2004 | | | 8,409,446 |
| | | | |
| | 10,076,000 | | FNMA | | 1.16 | † | | 01/02/2004 | | | 10,045,806 |
| | | | |
| | 50,000,000 | | FNMA | | 1.07 | † | | 01/21/2004 | | | 49,833,555 |
| | | | |
| | 50,000,000 | | FNMA | | 1.07 | † | | 01/28/2004 | | | 49,823,153 |
| | | | |
| | 25,000,000 | | FNMA | | 1.29 | † | | 04/02/2004 | | | 24,835,167 |
| | | | |
| | | | | | | | | | | | 333,819,356 |
| | | | | | | | | | |
|
|
| | |
Total Discount Notes – Agency (Cost $1,993,669,243) | | | | | 1,993,669,243 |
| | | | | | | | | | |
|
|
| | | |
| Fixed Rate Notes – Agency – 22.63% | | | | | | | | |
| | | |
| Federal Farm Credit Bank – 0.21% | | | | | | | | |
| | | | |
| | 12,990,000 | | FFCB | | 3.13 | | | 10/01/2003 | | | 12,990,000 |
| | | | | | | | | | |
|
|
| | | |
| Federal Home Loan Bank – 5.24% | | | | | | | | |
| | | | |
| | 1,750,000 | | FHLB | | 3.06 | | | 10/24/2003 | | | 1,751,656 |
| | | | |
| | 3,525,000 | | FHLB | | 2.50 | | | 11/14/2003 | | | 3,529,586 |
| | | | |
| | 14,925,000 | | FHLB | | 6.38 | | | 11/14/2003 | | | 15,014,941 |
| | | | |
| | 10,000,000 | | FHLB | | 2.73 | | | 11/28/2003 | | | 10,025,804 |
| | | | |
| | 11,300,000 | | FHLB | | 3.11 | | | 12/03/2003 | | | 11,337,843 |
| | | | |
| | 10,000,000 | | FHLB | | 0.97 | | | 12/12/2003 | | | 9,998,231 |
| | | | |
| | 5,850,000 | | FHLB | | 1.38 | | | 12/19/2003 | | | 5,851,311 |
| | | | |
| | 5,190,000 | | FHLB | | 5.38 | | | 01/05/2004 | | | 5,245,277 |
| | | | |
| | 5,000,000 | | FHLB | | 3.25 | | | 02/13/2004 | | | 5,035,432 |
| | | | |
| | 2,500,000 | | FHLB | | 3.75 | | | 02/13/2004 | | | 2,522,385 |
| | | | |
| | 24,935,000 | | FHLB | | 5.25 | | | 02/13/2004 | | | 25,310,441 |
| | | | |
| | 7,030,000 | | FHLB | | 1.13 | | | 04/07/2004 | | | 7,024,525 |
| | | | |
| | 28,150,000 | | FHLB | | 1.25 | | | 04/15/2004 | | | 28,154,891 |
| | | | |
| | 10,000,000 | | FHLB | | 3.75 | | | 04/15/2004 | | | 10,129,016 |
| | | | |
| | 23,175,000 | | FHLB | | 4.88 | | | 04/16/2004 | | | 23,628,399 |
| | | | |
| | 21,000,000 | | FHLB | | 3.38 | | | 05/14/2004 | | | 21,285,908 |
| | | | |
| | 38,330,000 | | FHLB | | 4.88 | | | 05/14/2004 | | | 39,212,215 |
| | | | |
| | 50,000,000 | | FHLB | | 3.38 | | | 06/15/2004 | | | 50,733,055 |
| | | | |
| | 50,000,000 | | FHLB | | 4.75 | | | 06/28/2004 | | | 51,320,006 |
| | | | |
| | | | | | | | | | | | 327,110,922 |
| | | | | | | | | | |
|
|
| | | |
| Federal Home Loan Mortgage Corporation – 6.61% | | | | | | | | |
| | | | |
| | 30,916,000 | | FHLMC | | 6.38 | | | 11/15/2003 | | | 31,104,798 |
| | | | |
| | 4,170,000 | | FHLMC | | 3.05 | | | 11/28/2003 | | | 4,181,160 |
| | | | |
| | 38,700,000 | | FHLMC | | 3.25 | | | 12/15/2003 | | | 38,875,275 |
| | | | |
| | 147,321,000 | | FHLMC | | 3.25 | | | 01/15/2004 | | | 148,232,208 |
| | | | |
| | 79,125,000 | | FHLMC | | 5.00 | | | 01/15/2004 | | | 80,007,339 |
21
WELLSFARGOMONEYMARKETFUNDS | | PORTFOLIOOFINVESTMENTS — SEPTEMBER 30, 2003 (UNAUDITED) |
|
GOVERNMENTMONEYMARKETFUND
| Principal | | Security Name | | Interest Rate | | | Maturity Date | | Value |
| | | |
| Federal Home Loan Mortgage Corporation (continued) | | | | | | | | |
| | | | |
| $ | 44,990,000 | | FHLMC | | 5.25 | % | | 02/15/2004 | | $ | 45,649,890 |
| | | | |
| | 62,995,000 | | FHLMC | | 3.75 | | | 04/15/2004 | | | 63,879,392 |
| | | | |
| | | | | | | | | | | | 411,930,062 |
| | | | | | | | | | |
|
|
| | | |
| Federal National Mortgage Association – 10.50% | | | | | | | | |
| | | | |
| | 4,925,000 | | FNMA | | 6.84 | | | 10/15/2003 | | | 4,935,590 |
| | | | |
| | 41,940,000 | | FNMA | | 1.01 | | | 11/03/2003 | | | 41,901,171 |
| | | | |
| | 45,695,000 | | FNMA | | 1.06 | | | 11/03/2003 | | | 45,650,600 |
| | | | |
| | 224,893,000 | | FNMA | | 4.75 | | | 11/14/2003 | | | 225,850,699 |
| | | | |
| | 50,000,000 | | FNMA | | 3.13 | | | 11/15/2003 | | | 50,111,153 |
| | | | |
| | 20,500,000 | | FNMA | | 1.28 | | | 01/02/2004 | | | 20,432,213 |
| | | | |
| | 26,000,000 | | FNMA | | 1.15 | | | 02/02/2004 | | | 25,897,011 |
| | | | |
| | 147,228,000 | | FNMA | | 5.13 | | | 02/13/2004 | | | 149,347,571 |
| | | | |
| | 40,183,000 | | FNMA | | 4.75 | | | 03/15/2004 | | | 40,851,921 |
| | | | |
| | 15,000,000 | | FNMA | | 5.91 | | | 03/19/2004 | | | 15,317,444 |
| | | | |
| | 33,975,000 | | FNMA | | 3.63 | | | 04/15/2004 | | | 34,435,781 |
| | | | |
| | | | | | | | | | | | 654,731,154 |
| | | | | | | | | | |
|
|
| | | |
| Tennessee Valley Authority – 0.07% | | | | | | | | |
| | | | |
| | 4,300,000 | | Tennessee Valley Authority | | 5.00 | | | 12/18/2003 | | | 4,331,670 |
| | | | | | | | | | |
|
|
| | |
Total Fixed Rate Notes – Agency (Cost $1,411,093,808) | | | | | 1,411,093,808 |
| | | | | | | | | | |
|
|
| | | |
| Floating Rate Notes – Agency – 23.23% | | | | | | | | |
| | | |
| Federal Farm Credit Bank – 6.41% | | | | | | | | |
| | | | |
| | 100,000,000 | | FFCB± | | 1.00 | | | 04/07/2004 | | | 99,976,268 |
| | | | |
| | 100,000,000 | | FFCB± | | 1.02 | | | 06/02/2004 | | | 99,996,629 |
| | | | |
| | 100,000,000 | | FFCB± | | 1.01 | | | 06/10/2004 | | | 99,986,150 |
| | | | |
| | 100,000,000 | | FFCB± | | 1.01 | | | 11/15/2004 | | | 99,977,455 |
| | | | |
| | | | | | | | | | | | 399,936,502 |
| | | | | | | | | | |
|
|
| | | |
| Federal Home Loan Bank – 6.74% | | | | | | | | |
| | | | |
| | 80,000,000 | | FHLB± | | 0.98 | | | 12/29/2003 | | | 79,990,684 |
| | | | |
| | 100,000,000 | | FHLB± | | 0.98 | | | 05/27/2004 | | | 99,973,698 |
| | | | |
| | 125,000,000 | | FHLB± | | 0.97 | | | 07/14/2004 | | | 124,980,308 |
| | | | |
| | 115,000,000 | | FHLB± | | 1.01 | | | 08/11/2004 | | | 114,978,999 |
| | | | |
| | | | | | | | | | | | 419,923,689 |
| | | | | | | | | | |
|
|
| | | |
| Federal National Mortgage Association – 10.08% | | | | | | | | |
| | | | |
| | 10,000,000 | | FNMA± | | 0.98 | | | 02/13/2004 | | | 9,998,875 |
| | | | |
| | 8,500,000 | | FNMA± | | 0.99 | | | 03/11/2004 | | | 8,498,987 |
| | | | |
| | 110,000,000 | | FNMA± | | 0.98 | | | 07/30/2004 | | | 109,977,089 |
| | | | |
| | 75,000,000 | | FNMA± | | 0.99 | | | 01/03/2005 | | | 74,976,321 |
| | | | |
| | 100,000,000 | | FNMA± | | 1.01 | | | 01/03/2005 | | | 99,968,411 |
| | | | |
| | 100,000,000 | | FNMA± | | 0.99 | | | 01/07/2005 | | | 99,949,529 |
| | | | |
| | 75,000,000 | | FNMA± | | 1.01 | | | 01/28/2005 | | | 74,970,040 |
22
PORTFOLIOOFINVESTMENTS — SEPTEMBER 30, 2003 (UNAUDITED) | | WELLSFARGOMONEYMARKETFUNDS |
|
GOVERNMENTMONEYMARKETFUND
| Principal | | Security Name | | Interest Rate | | | Maturity Date | | Value |
| | | |
| Federal National Mortgage Association (continued) | | | | | | | | |
| | | | |
| $ | 150,000,000 | | FNMA± | | 1.04 | % | | 01/28/2005 | | $ | 149,950,001 |
| | | | |
| | | | | | | | | | | | 628,289,253 |
| | | | | | | | | | |
|
|
| | |
Total Floating Rate Notes – Agency (Cost $1,448,149,444) | | | | | 1,448,149,444 |
| | | | | | | | | | |
|
|
| | | |
| Repurchase Agreements – 22.76% | | | | | | | | |
| | | | |
| | 500,000,000 | | Bear Stearns & Company Incorporated – 102% Collateralized by US Government Securities | | 1.13 | | | 10/01/2003 | | | 500,000,000 |
| | | | |
| | 125,000,000 | | Credit Suisse First Boston – 102% Collaterized by US Government Securities | | 1.08 | | | 10/01/2003 | | | 125,000,000 |
| | | | |
| | 500,000,000 | | Credit Suisse First Boston – 102% Collaterized by US Government Securities | | 1.13 | | | 10/01/2003 | | | 500,000,000 |
| | | | |
| | 22,000,000 | | Goldman Sachs Group Incorporated – 102% Collateralized by US Government Securities | | 1.12 | | | 10/01/2003 | | | 22,000,000 |
| | | | |
| | 21,596,000 | | Lehman Brothers Incorporated – 102% Collaterized by US Government Securities | | 1.10 | | | 10/01/2003 | | | 21,596,000 |
| | | | |
| | 250,000,000 | | UBS Warburg LLC – 102% Collaterized by US Government Securities | | 1.13 | | | 10/01/2003 | | | 250,000,000 |
| | |
Total Repurchase Agreements (Cost $1,418,596,000) | | | | | 1,418,596,000 |
| | | | | | | | | | |
|
|
| | | |
Total Investments In Securities
(Cost $6,271,508,495)* | | 100.60 | % | | | | $ | 6,271,508,495 | |
| | | |
Other Assets And Liabilities, Net | | (0.60 | ) | | | | | (37,121,602 | ) |
| | |
|
| | | |
|
|
|
| Total Net Assets | | 100.00 | % | | | | $ | 6,234,386,893 | |
| | |
|
| | | |
|
|
|
| * | | Cost for federal income tax purposes is substantially the same as for financial reporting purposes. |
| ± | | Variable Rate Securities. |
The accompanying notes are an integral part of these financial statements.
23
| WELLSFARGOMONEYMARKETFUNDS | | PORTFOLIOOFINVESTMENTS — SEPTEMBER 30, 2003 (UNAUDITED) |
|
MINNESOTAMONEYMARKETFUND
| Principal | | Security Name | | Interest Rate | | | Maturity Date | | Value |
| | | |
| Municipal Securities – 99.81% | | | | | | | | |
| | | |
| Minnesota – 99.67% | | | | | | | | |
| | | | |
| $ | 500,000 | | Arden Hills MN Housing & Healthcare Facilities Revenue Presbyterian Homes Series B US Bank NA LOC§ | | 1.25 | % | | 09/01/2029 | | $ | 500,000 |
| | | | |
| | 200,000 | | Brooklyn Center Minnesota Brookdale Corporation II Project Industrial Revenue Firstar Bank NA LOC§ | | 1.25 | | | 12/01/2014 | | | 200,000 |
| | | | |
| | 250,000 | | Burnsville MN MFHR Berkshire Project Series A Collateralized By FNMA§ | | 1.10 | | | 07/15/2030 | | | 250,000 |
| | | | |
| | 50,000 | | Dakota County MN Capital Improvement Series C | | 4.50 | | | 02/01/2004 | | | 50,545 |
| | | | |
| | 3,500,000 | | Dakota County MN CDA MFHR Regatta Commons Project Series A Lasalle Bank NA LOC§ | | 1.30 | | | 01/01/2038 | | | 3,500,000 |
| | | | |
| | 1,025,000 | | Dakota County MN Housing & Redevelopment Authority MFHR PT 484 Collateralized By FHLMC§ | | 1.14 | | | 12/01/2022 | | | 1,025,000 |
| | | | |
| | 630,000 | | Duluth MN Refinance & Improvement Series C FSA Insured | | 2.00 | | | 02/01/2004 | | | 631,774 |
| | | | |
| | 800,000 | | Eagan MN MFHR Floats PT 1221§ | | 1.14 | | | 12/01/2029 | | | 800,000 |
| | | | |
| | 1,750,000 | | Eagle Tax-Exempt Trust CTF 20012301 Class A§ | | 1.15 | | | 10/01/2019 | | | 1,750,000 |
| | | | |
| | 5,000,000 | | Edina MN Independent School District No 273 | | 1.25 | | | 09/10/2004 | | | 5,009,285 |
| | | | |
| | 3,400,000 | | Edina MN MFHR Edina Park Plaza Collateralized By FHLMC§ | | 1.05 | | | 12/01/2029 | | | 3,400,000 |
| | | | |
| | 1,900,000 | | Golden Valley MN Industrial Development Revenue Unicare Homes Project Bank of America NA LOC§ | | 1.16 | | | 09/01/2014 | | | 1,900,000 |
| | | | |
| | 2,600,000 | | Hennepin County MN Housing & Redevelopment Authority MFHR City Apartments At Loring Park Collateralized By FNMA§ | | 1.20 | | | 06/15/2034 | | | 2,600,000 |
| | | | |
| | 2,800,000 | | Hennepin County MN Housing & Redevelopment Authority MFHR Stone Arch Apartments Project Lasalle Bank NA LOC§ | | 1.15 | | | 04/15/2035 | | | 2,800,000 |
| | | | |
| | 1,020,000 | | Hutchinson MN Public Utility Revenue Series B MBIA Insured | | 2.00 | | | 12/01/2003 | | | 1,021,472 |
| | | | |
| | 1,365,000 | | Mankato MN Family YMCA Project Revenue§ | | 1.30 | | | 05/01/2006 | | | 1,365,000 |
| | | | |
| | 235,000 | | Mankato MN MFHR Highland Project US Bank Trust NA LOC§ | | 1.25 | | | 05/01/2027 | | | 235,000 |
| | | | |
| | 1,270,000 | | Maple Grove MN MFHR Basswood Trails Project§ | | 1.10 | | | 03/01/2029 | | | 1,270,000 |
| | | | |
| | 2,000,000 | | Metropolitan Council MN Minneapolis-St Paul Metro Area Waste Water Treatment
Series A | | 3.50 | | | 03/01/2004 | | | 2,021,243 |
| | | | |
| | 1,000,000 | | Metropolitan Council MN St Paul Metro Area Series A | | 4.50 | | | 12/01/2003 | | | 1,004,772 |
| | | | |
| | 2,900,000 | | Metropolitan Council MN St Paul Metro Area Water Revenue | | 5.00 | | | 12/01/2003 | | | 2,918,777 |
| | | | |
| | 2,000,000 | | Minneapolis MN GO Unlimited Notes | | 5.00 | | | 12/01/2003 | | | 2,012,975 |
| | | | |
| | 3,000,000 | | Minneapolis MN GO Unlimited Notes | | 5.00 | | | 12/01/2003 | | | 3,020,025 |
| | | | |
| | 4,415,000 | | Minneapolis MN Womans Club of Minneapolis Project Revenue§ | | 1.20 | | | 05/01/2023 | | | 4,415,000 |
| | | | |
| | 4,445,000 | | Minnesota Public Facilities Authority Water PCR Merlots 2003-B06§ | | 1.15 | | | 03/01/2021 | | | 4,445,000 |
| | | | |
| | 6,145,000 | | Minnesota Public Facilities Authority Water PCR Series A§ | | 1.13 | | | 03/01/2004 | | | 6,145,000 |
| | | | |
| | 620,000 | | Minnesota Public Facilities Authority Water PCR Series A | | 4.00 | | | 03/01/2004 | | | 627,446 |
| | | | |
| | 750,000 | | Minnesota Public Facilities Authority Water PCR Series A | | 5.00 | | | 03/01/2004 | | | 762,041 |
| | | | |
| | 210,000 | | Minnesota State GO Unlimited Notes§ | | 5.00 | | | 11/01/2003 | | | 210,588 |
| | | | |
| | 2,855,000 | | Minnesota State GO Unlimited Notes | | 5.50 | | | 06/01/2004 | | | 2,943,819 |
| | | | |
| | 975,000 | | Minnesota State GO Unlimited Notes Series II-R-96§ | | 1.15 | | | 08/01/2014 | | | 975,000 |
| | | | |
| | 5,900,000 | | Minnesota State HFA Residential Housing Finance Series H§ | | 1.00 | | | 07/01/2036 | | | 5,900,000 |
| | | | |
| | 50,000 | | Minnesota State Higher Education Facilities Authority Revenue Series 3W§ | | 6.38 | | | 03/01/2020 | | | 51,070 |
| | | | |
| | 310,000 | | Minnesota State Higher Education Facilities Authority Revenue St Thomas University Series 5L§ | | 1.07 | | | 04/01/2027 | | | 310,000 |
| | | | |
| | 2,300,000 | | New Brighton MN IDR Unicare Homes Incorporated Project Bank of America NA LOC§ | | 1.16 | | | 12/01/2014 | | | 2,300,000 |
| | | | |
| | 3,120,000 | | New Brighton MN MFHR Golden Pond Housing Project§ | | 1.15 | | | 07/15/2032 | | | 3,120,000 |
24
PORTFOLIOOFINVESTMENTS — SEPTEMBER 30, 2003 (UNAUDITED) | | WELLSFARGOMONEYMARKETFUNDS |
|
MINNESOTA MONEY MARKET FUND
| Principal | | Security Name | | Interest Rate | | | Maturity Date | | Value |
| | | |
| Minnesota (continued) | | | | | | | | |
| | | | |
| $ | 160,000 | | Plymouth MN IDA Revenue Turck Multipox Incorporated§ | | 1.12 | % | | 11/01/2006 | | $ | 160,000 |
| | | | |
| | 30,000 | | Ramsey County MN Capital Improvement Plan Series A | | 4.20 | | | 02/01/2004 | | | 30,297 |
| | | | |
| | 1,325,000 | | Ramsey County MN Capital Improvement Plan Series B | | 5.00 | | | 02/01/2004 | | | 1,342,847 |
| | | | |
| | 4,320,000 | | Robbinsdale MN IDA Unicare Homes Incorporated Project§ | | 1.16 | | | 10/01/2014 | | | 4,320,000 |
| | | | |
| | 3,000,000 | | Rochester MN Health Care Facilities Hospital Revenue | | 0.88 | | | 10/23/2003 | | | 3,000,000 |
| | | | |
| | 1,000,000 | | Rochester MN Healthcare Services | | 0.85 | | | 12/10/2003 | | | 1,000,000 |
| | | | |
| | 3,000,000 | | Rochester MN MFHR | | 0.85 | | | 11/06/2003 | | | 3,000,000 |
| | | | |
| | 3,025,000 | | Rochester MN MFHR§ | | 1.22 | | | 07/15/2031 | | | 3,025,000 |
| | | | |
| | 2,950,000 | | Roseville MN Private School Facilities Revenue Northwestern College Project§ | | 1.25 | | | 11/01/2022 | | | 2,950,000 |
| | | | |
| | 5,000,000 | | St Louis Park MN MFHR Newport ON Seven Apartments Project Collaterized By FNMA§ | | 1.15 | | | 09/15/2031 | | | 5,000,000 |
| | | | |
| | 590,000 | | St Paul MN Capital Improvements Street Improvements Series B | | 2.00 | | | 03/01/2004 | | | 592,204 |
| | | | |
| | 1,130,000 | | St Paul MN Housing & Redevelopment Authority District Cooling Revenue Series I§ | | 1.15 | | | 06/01/2015 | | | 1,130,000 |
| | | | |
| | 930,000 | | St Paul MN Housing & Redevelopment Authority District Cooling Revenue Series L Dexia Credit LOC§ | | 1.15 | | | 03/01/2018 | | | 930,000 |
| | | | |
| | 300,000 | | St Paul MN Housing & Redevelopment Authority District Heating Revenue Series A§ | | 1.05 | | | 12/01/2012 | | | 300,000 |
| | | | |
| | 4,725,000 | | St Paul MN Housing & Redevelopment Authority Revenue Minnesota Public Radio Project Allied Irish Bank PLC LOC§ | | 1.25 | | | 05/01/2022 | | | 4,725,000 |
| | | | |
| | 250,000 | | St Paul MN Port Authority District Cooling Revenue 2002 Series Q Dexia Credit Local de France LOC§ | | 1.05 | | | 03/01/2022 | | | 250,000 |
| | | | |
| | 3,325,000 | | St Paul MN Port Authority District Cooling Revenue Series M Dexia Bank LOC§ | | 1.25 | | | 03/01/2021 | | | 3,325,000 |
| | | | |
| | 915,000 | | St Paul MN Port Authority District Cooling Revenue Series O Dexia Credit Local de France LOC§ | | 1.25 | | | 03/01/2012 | | | 915,000 |
| | | | |
| | 4,795,000 | | St Paul MN Port Authority District Cooling Revenue Series R Dexia Credit Local de France LOC§ | | 1.30 | | | 03/01/2022 | | | 4,795,000 |
| | | | |
| | 100,000 | | St Paul MN Port Authority Tax Increment Revenue Westgate Office & Industrial Center Project US Bank Trust NA LOC§ | | 1.10 | | | 02/01/2015 | | | 100,000 |
| | | | |
| | 3,500,000 | | University of Minnesota Education Facilities Revenue Intermediate Term Financing Series A§ | | 1.12 | | | 01/01/2034 | | | 3,500,000 |
| | | | |
| | 5,400,000 | | University of Minnesota GO Revenue§ | | 1.15 | | | 07/01/2021 | | | 5,400,000 |
| | | | |
| | 1,555,000 | | Washington County MN Series A | | 4.00 | | | 02/01/2004 | | | 1,571,523 |
| | | | |
| | 270,000 | | Willmar MN Rice Memorial Hospital Project FSA Insured | | 3.00 | | | 02/01/2004 | | | 271,573 |
| | | | |
| | | | | | | | | | | | 123,124,276 |
| | | | | | | | | | |
|
|
| | | |
| Puerto Rico – 0.14% | | | | | | | | |
| | | | |
| | 165,000 | | Puerto Rico Commonwealth MBIA Insured | | 5.30 | | | 07/01/2004 | | | 170,154 |
| | | | | | | | | | |
|
|
| | |
Total Municipal Securities (Cost $123,294,430) | | | | | 123,294,430 |
| | | | | | | | | | |
|
|
| | | |
Total Investments In Securities
(Cost $123,294,430)* | | 99.81 | % | | | | $ | 123,294,430 |
| | | |
Other Assets And Liabilities, Net | | 0.19 | | | | | | 232,457 |
| | |
|
| | | |
|
|
| Total Net Assets | | 100.00 | % | | | | $ | 123,526,887 |
| | |
|
| | | |
|
|
| * | | Cost for federal income tax purposes is substantially the same as for financial reporting purposes. |
| § | | These variable rate securities are subject to a demand feature which reduces the remaining maturity. |
The accompanying notes are an integral part of these financial statements.
25
| WELLSFARGOMONEYMARKETFUNDS | | PORTFOLIOOFINVESTMENTS — SEPTEMBER 30, 2003 (UNAUDITED) |
|
MONEYMARKETFUND
| Principal | | Security Name | | Interest Rate | | | Maturity Date | | Value |
| | | |
| Certificates of Deposit – 8.06% | | | | | | | | |
| | | | |
| $ | 50,000,000 | | Abbey National Treasury Services plc | | 1.40 | % | | 03/02/2004 | | $ | 50,000,000 |
| | | | |
| | 80,000,000 | | Bank of Nova Scotia Portland | | 1.10 | | | 03/16/2004 | | | 80,000,000 |
| | | | |
| | 100,000,000 | | Barclays Bank plc | | 1.19 | | | 12/02/2003 | | | 99,985,379 |
| | | | |
| | 127,600,000 | | Credit Agricole Indosuez | | 1.03 | | | 10/03/2003 | | | 127,600,000 |
| | | | |
| | 97,000,000 | | Natexis Banque Populaires± | | 1.12 | | | 08/27/2004 | | | 97,001,731 |
| | | | |
| | 50,000,000 | | Svenska Handelsbanken | | 1.40 | | | 03/02/2004 | | | 50,000,000 |
| | | | |
| | 30,000,000 | | Unicredito Italiano SPA | | 1.04 | | | 10/17/2003 | | | 29,999,169 |
| | | | |
| | 100,000,000 | | Unicredito Italiano SPA | | 1.04 | | | 10/20/2003 | | | 100,000,000 |
| | | |
Total Certificates of Deposit (Cost $634,586,279) | | | | | | | | 634,586,279 |
| | | | | | | | | | |
|
|
| | | |
| Commercial Paper – 50.40% | | | | | | | | |
| | | | |
| | 70,000,000 | | Aegon Funding Corporation^ | | 1.07 | † | | 11/14/2003 | | | 69,908,883 |
| | | | |
| | 150,000,000 | | Amstel Funding Corporation^ | | 0.94 | † | | 12/29/2003 | | | 149,651,417 |
| | | | |
| | 85,000,000 | | Amstel Funding Corporation^ | | 1.14 | † | | 03/16/2004 | | | 84,550,492 |
| | | | |
| | 50,000,000 | | Banco Bilbao Vizcaya Argentaria Puerto Rico^ | | 1.06 | † | | 10/14/2003 | | | 49,980,861 |
| | | | |
| | 40,000,000 | | Banco Bilbao Vizcaya Argentaria Puerto Rico^ | | 1.10 | † | | 11/03/2003 | | | 39,959,667 |
| | | | |
| | 47,500,000 | | Banco Bilbao Vizcaya Argentaria Puerto Rico^ | | 1.09 | † | | 12/05/2003 | | | 47,406,517 |
| | | | |
| | 25,000,000 | | Banco Bilbao Vizcaya Argentaria Puerto Rico^ | | 1.10 | † | | 12/18/2003 | | | 24,940,687 |
| | | | |
| | 55,000,000 | | Banco Bilbao Vizcaya Argentaria Puerto Rico^ | | 1.10 | † | | 12/18/2003 | | | 54,868,917 |
| | | | |
| | 60,000,000 | | CAFCO LLC^ | | 1.07 | † | | 11/25/2003 | | | 59,901,917 |
| | | | |
| | 100,000,000 | | CAFCO LLC^ | | 1.07 | † | | 12/16/2003 | | | 99,774,111 |
| | | | |
| | 50,000,000 | | CDC Commericial Paper Corporation^ | | 1.15 | † | | 10/01/2003 | | | 50,000,000 |
| | | | |
| | 48,000,000 | | Charta LLC^ | | 1.07 | † | | 11/04/2003 | | | 47,951,493 |
| | | | |
| | 87,500,000 | | Citigroup Global | | 1.03 | † | | 10/01/2003 | | | 87,500,000 |
| | | | |
| | 50,000,000 | | Concord Minuteman Capital Company LLC^ | | 1.08 | † | | 11/18/2003 | | | 49,928,000 |
| | | | |
| | 90,000,000 | | Concord Minuteman Capital Company LLC^ | | 1.10 | † | | 11/18/2003 | | | 89,868,000 |
| | | | |
| | 75,000,000 | | Concord Minuteman Capital Company LLC^ | | 1.15 | † | | 02/06/2004 | | | 74,693,333 |
| | | | |
| | 100,000,000 | | CRC Funding LLC^ | | 1.07 | † | | 12/11/2003 | | | 99,788,972 |
| | | | |
| | 150,000,000 | | Credit Lyonnais—New York | | 1.26 | † | | 10/15/2003 | | | 149,926,500 |
| | | | |
| | 50,274,000 | | Crown Point Capital Company LLC^ | | 1.05 | † | | 10/15/2003 | | | 50,253,471 |
| | | | |
| | 102,682,000 | | Crown Point Capital Company LLC^ | | 1.08 | † | | 11/07/2003 | | | 102,568,023 |
| | | | |
| | 50,888,000 | | Crown Point Capital Company LLC^ | | 1.08 | † | | 01/21/2004 | | | 50,717,016 |
| | | | |
| | 90,000,000 | | Den Norske Bank ASA | | 1.10 | † | | 12/05/2003 | | | 89,822,062 |
| | | | |
| | 100,000,000 | | Eureka Securitization Incorporated^ | | 1.04 | † | | 10/22/2003 | | | 99,939,333 |
| | | | |
| | 52,000,000 | | Eureka Securitization Incorporated^ | | 1.08 | † | | 11/20/2003 | | | 51,922,000 |
| | | | |
| | 77,000,000 | | Governor & Company of The Bank of Ireland^ | | 1.21 | † | | 02/06/2004 | | | 76,668,729 |
| | | | |
| | 60,500,000 | | Grampian Funding LLC^ | | 1.07 | † | | 11/18/2003 | | | 60,413,687 |
| | | | |
| | 78,500,000 | | Grampian Funding LLC^ | | 1.07 | † | | 12/17/2003 | | | 78,320,344 |
| | | | |
| | 70,000,000 | | Grampian Funding LLC^ | | 1.11 | † | | 01/28/2004 | | | 69,743,158 |
| | | | |
| | 90,000,000 | | HBOs Treasury Services plc | | 1.04 | † | | 10/02/2003 | | | 89,997,413 |
| | | | |
| | 30,000,000 | | HBOs Treasury Services plc | | 1.03 | † | | 10/10/2003 | | | 29,992,275 |
| | | | |
| | 65,000,000 | | HBOs Treasury Services plc | | 1.07 | † | | 12/05/2003 | | | 64,874,424 |
| | | | |
| | 107,500,000 | | HSBC USA Incorporated | | 1.07 | † | | 10/15/2003 | | | 107,455,268 |
| | | | |
| | 62,500,000 | | Irish Life & Permanent plc^ | | 1.10 | † | | 12/10/2003 | | | 62,366,319 |
| | | | |
| | 75,000,000 | | Irish Life & Permanent plc^ | | 1.16 | † | | 02/09/2004 | | | 74,683,417 |
| | | | |
| | 97,500,000 | | KBC Financial Products International Limited^ | | 1.08 | † | | 11/12/2003 | | | 97,377,150 |
26
PORTFOLIOOFINVESTMENTS — SEPTEMBER 30, 2003 (UNAUDITED) | | WELLSFARGOMONEYMARKETFUNDS |
|
MONEYMARKETFUND
| Principal | | Security Name | | Interest Rate | | | Maturity Date | | Value |
| | | |
| Commercial Paper (continued) | | | | | | | | |
| | | | |
| $ | 79,701,000 | | Lexington Parker Capital Corporation^ | | 1.05 | %† | | 10/08/2003 | | $ | 79,684,728 |
| | | | |
| | 55,000,000 | | Lexington Parker Capital Corporation^ | | 1.13 | † | | 02/27/2004 | | | 54,742,768 |
| | | | |
| | 45,000,000 | | Lexington Parker Capital Corporation^ | | 1.14 | † | | 02/27/2004 | | | 44,787,675 |
| | | | |
| | 50,000,000 | | Lexington Parker Capital Corporation^ | | 1.16 | † | | 03/02/2004 | | | 49,753,500 |
| | | | |
| | 50,000,000 | | Moat Funding LLC^ | | 1.07 | † | | 12/09/2003 | | | 49,897,458 |
| | | | |
| | 58,000,000 | | National Bank of New Zealand International Limited^ | | 1.04 | † | | 10/02/2003 | | | 57,998,324 |
| | | | |
| | 25,000,000 | | National Bank of New Zealand International Limited^ | | 1.04 | † | | 10/07/2003 | | | 24,995,667 |
| | | | |
| | 62,500,000 | | National Bank of New Zealand International Limited^ | | 1.09 | † | | 12/15/2003 | | | 62,358,073 |
| | | | |
| | 73,000,000 | | National Bank of New Zealand International Limited^ | | 1.09 | † | | 12/17/2003 | | | 72,829,809 |
| | | | |
| | 33,000,000 | | Neptune Funding Corporation^ | | 1.25 | † | | 10/28/2003 | | | 32,969,063 |
| | | | |
| | 85,000,000 | | Neptune Funding Corporation^ | | 1.18 | † | | 02/03/2004 | | | 84,651,736 |
| | | | |
| | 75,000,000 | | Ness LLC^ | | 1.04 | † | | 10/22/2003 | | | 74,954,500 |
| | | | |
| | 49,431,000 | | Ness LLC^ | | 1.25 | † | | 10/27/2003 | | | 49,386,375 |
| | | | |
| | 60,000,000 | | Network Rail Commercial Paper Finance plc^ | | 1.03 | † | | 10/20/2003 | | | 59,967,383 |
| | | | |
| | 50,000,000 | | Network Rail Commercial Paper Finance plc^ | | 1.01 | † | | 12/18/2003 | | | 49,890,583 |
| | | | |
| | 120,000,000 | | Perry III Funding Corporation^ | | 1.00 | † | | 10/02/2003 | | | 119,996,667 |
| | | | |
| | 91,052,000 | | Perry III Funding Corporation^ | | 1.13 | † | | 03/03/2004 | | | 90,611,865 |
| | | | |
| | 53,866,000 | | Regency Markets Number 1 LLC^ | | 1.07 | † | | 10/20/2003 | | | 53,835,581 |
| | | | |
| | 91,476,000 | | Regency Markets Number 1 LLC^ | | 1.08 | † | | 12/08/2003 | | | 91,289,389 |
| | | | |
| | 100,000,000 | | Stadshypotek Delaware^ | | 1.07 | † | | 11/26/2003 | | | 99,833,556 |
| | | | |
| | 30,000,000 | | White Pine Finance LLC^ | | 1.25 | † | | 10/14/2003 | | | 29,986,458 |
| | | | |
| | 47,562,000 | | White Pine Finance LLC^ | | 1.05 | † | | 10/27/2003 | | | 47,525,932 |
| | | |
Total Commercial Paper (Cost $3,969,660,946) | | | | | | | | 3,969,660,946 |
| | | | | | | | | | |
|
|
| | | |
| Corporate Bonds – 1.27% | | | | | | | | |
| | | | |
| | 100,000,000 | | ING Security Life Institutional Funding±^ | | 1.14 | | | 10/08/2004 | | | 100,000,000 |
| | |
Total Corporate Bonds (Cost $100,000,000) | | | | | 100,000,000 |
| | | | | | | | | | |
|
|
| | | |
| Discount Notes – Agency – 5.38% | | | | | | | | |
| | | |
| Federal National Mortgage Association – 5.38% | | | | | | | | |
| | | | |
| | 125,000,000 | | FNMA | | 1.01 | † | | 10/15/2003 | | | 124,950,903 |
| | | | |
| | 150,000,000 | | FNMA | | 1.08 | † | | 12/31/2003 | | | 149,590,500 |
| | | | |
| | 50,000,000 | | FNMA | | 1.07 | † | | 01/28/2004 | | | 49,823,153 |
| | | | |
| | 100,000,000 | | FNMA | | 1.13 | † | | 02/04/2004 | | | 99,606,250 |
| | | | |
| | | | | | | | | | | | 423,970,806 |
| | | | | | | | | | |
|
|
| | |
Total Discount Notes – Agency (Cost $423,970,806) | | | | | 423,970,806 |
| | | | | | | | | | |
|
|
| | | |
| Fixed Rate Notes – Agency – 1.06% | | | | | | | | |
| | | |
| Federal Home Loan Bank – 0.55% | | | | | | | | |
| | | | |
| | 42,815,000 | | FHLB | | 3.38 | | | 05/14/2004 | | | 43,343,638 |
| | | | | | | | | | |
|
|
| | | |
| Federal Home Loan Mortgage Corporation – 0.51% | | | | | | | | |
| | | | |
| | 40,000,000 | | FHLMC | | 3.25 | | | 12/15/2003 | | | 40,173,659 |
| | | | | | | | | | |
|
|
| | | |
Total Fixed Rate Notes – Agency (Cost $83,517,297) | | | | | | | | 83,517,297 |
| | | | | | | | | | |
|
|
27
WELLSFARGOMONEYMARKETFUNDS | | PORTFOLIOOFINVESTMENTS — SEPTEMBER 30, 2003 (UNAUDITED) |
|
MONEYMARKETFUND
| Principal | | Security Name | | Interest Rate | | | Maturity Date | | Value |
| | | |
| Fixed Rate Notes – Corporate – 0.83% | | | | | | | | |
| | | | |
| $ | 25,000,000 | | Links Finance LLC | | 2.00 | % | | 10/10/2003 | | $ | 25,000,000 |
| | | | |
| | 40,000,000 | | McDonald’s Corporation^ | | 4.60 | | | 03/07/2004 | | | 40,558,094 |
| | | |
Total Fixed Rate Notes – Corporate (Cost $65,558,094) | | | | | | | | 65,558,094 |
| | | | | | | | | | |
|
|
| | | |
| Floating Rate Commercial Paper – 0.64% | | | | | | | | |
| | | | |
| | 25,000,000 | | Liquid Funding Limited± | | 1.12 | | | 03/05/2004 | | | 25,000,000 |
| | | | |
| | 25,000,000 | | Liquid Funding Limited± | | 1.11 | | | 03/26/2004 | | | 25,000,000 |
| | | |
Total Floating Rate Commercial Paper (Cost $50,000,000) | | | | | | | | 50,000,000 |
| | | | | | | | | | |
|
|
| | | |
| Floating Rate Funding Agreement – 0.64% | | | | | | | | |
| | | | |
| | 50,000,000 | | Bear Stearns Companies Incorporated± | | 1.11 | | | 04/05/2004 | | | 49,997,459 |
| | | |
Total Floating Rate Funding Agreement (Cost $49,997,459) | | | | | | | | 49,997,459 |
| | | | | | | | | | |
|
|
| | | |
| Floating Rate Note – Agency – 1.90% | | | | | | | | |
| | | |
| Federal Home Loan Mortgage Corporation – 1.90% | | | | | | | | |
| | | | |
| | 150,000,000 | | FHLMC± | | 1.04 | | | 02/04/2005 | | | 149,899,364 |
| | | |
Total Floating Rate Note – Agency (Cost $149,899,364) | | | | | | | | 149,899,364 |
| | | | | | | | | | |
|
|
| | | |
| Floating Rate Notes – Corporate – 15.36% | | | | | | | | |
| | | | |
| | 43,000,000 | | Abbey National Treasury Services plc± | | 1.12 | | | 06/10/2004 | | | 43,000,000 |
| | | | |
| | 47,500,000 | | Aegon NV± | | 1.12 | | | 07/15/2004 | | | 47,481,853 |
| | | | |
| | 40,000,000 | | American Express Centurion Bank± | | 1.12 | | | 12/23/2003 | | | 40,000,000 |
| | | | |
| | 25,000,000 | | American Express Centurion Bank± | | 1.09 | | | 05/24/2004 | | | 24,998,855 |
| | | | |
| | 50,000,000 | | Belford US Capital Company±^ | | 1.11 | | | 10/06/2003 | | | 49,999,858 |
| | | | |
| | 79,100,000 | | Belford US Capital Company±^ | | 1.13 | | | 11/26/2003 | | | 79,097,573 |
| | | | |
| | 50,000,000 | | Belford US Capital Company±^ | | 1.13 | | | 12/09/2003 | | | 50,000,000 |
| | | | |
| | 25,000,000 | | Belford US Capital Company±^ | | 1.13 | | | 12/10/2003 | | | 25,000,000 |
| | | | |
| | 30,000,000 | | Belford US Capital Company±^ | | 1.12 | | | 04/22/2004 | | | 30,000,000 |
| | | | |
| | 65,000,000 | | CC (USA) Incorporated±^ | | 1.07 | | | 06/28/2004 | | | 64,985,534 |
| | | | |
| | 75,000,000 | | Dorada Finance Incorporated±^ | | 1.08 | | | 03/17/2004 | | | 74,996,557 |
| | | | |
| | 95,000,000 | | Fortis Finance NV± | | 1.12 | | | 10/03/2003 | | | 95,000,196 |
| | | | |
| | 65,000,000 | | Household Finance Corporation± | | 1.63 | | | 05/28/2004 | | | 65,159,054 |
| | | | |
| | 80,000,000 | | John Hancock Global Funding II±^ | | 1.13 | | | 12/10/2003 | | | 79,998,564 |
| | | | |
| | 50,000,000 | | Liberty Lighthouse US Capital Company±^ | | 1.20 | | | 11/20/2003 | | | 50,005,213 |
| | | | |
| | 40,000,000 | | Liberty Lighthouse US Capital Company±^ | | 1.11 | | | 02/27/2004 | | | 39,998,469 |
| | | | |
| | 75,000,000 | | Liberty Lighthouse US Capital Company±^ | | 1.11 | | | 03/22/2004 | | | 75,000,000 |
| | | | |
| | 75,000,000 | | Liberty Lighthouse US Capital Company±^ | | 1.10 | | | 05/06/2004 | | | 75,000,000 |
| | | | |
| | 70,000,000 | | Nationwide Building Society±^ | | 1.08 | | | 07/23/2004 | | | 70,000,000 |
| | | | |
| | 100,000,000 | | Northern Rock plc±^ | | 1.14 | | | 11/19/2003 | | | 100,000,000 |
| | | | |
| | 30,000,000 | | Premium Asset Trust Series 2002-6±^ | | 1.32 | | | 06/01/2004 | | | 30,030,606 |
| | | |
Total Floating Rate Notes – Corporate (Cost $1,209,752,332) | | | | | | | | 1,209,752,332 |
| | | | | | | | | | |
|
|
| | | |
| Promissory Notes – 1.03% | | | | | | | | |
| | | | |
| | 35,000,000 | | Goldman Sachs Group Incorporated± | | 1.15 | | | 07/26/2004 | | | 35,000,000 |
| | | | |
| | 46,000,000 | | Goldman Sachs Group Incorporated± | | 1.19 | | | 07/26/2004 | | | 46,000,000 |
| | | |
Total Promissory Notes (Cost $81,000,000) | | | | | | | | 81,000,000 |
| | | | | | | | | | |
|
|
28
| PORTFOLIOOFINVESTMENTS — SEPTEMBER 30, 2003 (UNAUDITED) | | WELLSFARGOMONEYMARKETFUNDS |
|
MONEYMARKETFUND
| Principal | | Security Name | | Interest Rate | | | Maturity Date | | Value |
| | | |
| Repurchase Agreements – 5.38% | | | | | | | | |
| | | | |
| $ | 127,000,000 | | Bear Stearns & Company Incorporated—102% Collateralized by US Government Securities | | 1.13 | % | | 10/01/2003 | | $ | 127,000,000 |
| | | | |
| | 46,731,000 | | Credit Suisse First Boston – 102% Collaterized by US Government Securities | | 1.13 | | | 10/01/2003 | | | 46,731,000 |
| | | | |
| | 100,000,000 | | Goldman Sachs Group Incorporated – 102% Collaterized by US Government Securities | | 1.16 | | | 10/01/2003 | | | 100,000,000 |
| | | | |
| | 150,000,000 | | UBS Warburg LLC – 102% Collaterized by US Government Securities | | 1.13 | | | 10/01/2003 | | | 150,000,000 |
| | | |
Total Repurchase Agreements (Cost $423,731,000) | | | | | | | | 423,731,000 |
| | | | | | | | | | |
|
|
| | | |
| Time Deposits – 7.95% | | | | | | | | |
| | | | |
| | 100,000,000 | | Banque Nationale de Paris | | 1.16 | | | 10/01/2003 | | | 100,000,000 |
| | | | |
| | 60,000,000 | | Danske Bank | | 1.16 | | | 10/01/2003 | | | 60,000,000 |
| | | | |
| | 203,000,000 | | ING Bank Brussels | | 1.18 | | | 10/01/2003 | | | 203,000,000 |
| | | | |
| | 203,000,000 | | Rabobank Nederland Utrecht | | 1.16 | | | 10/01/2003 | | | 203,000,000 |
| | | | |
| | 60,000,000 | | Societe Generale | | 1.16 | | | 10/01/2003 | | | 60,000,000 |
| | | |
Total Time Deposits (Cost $626,000,000) | | | | | | | | 626,000,000 |
| | | | | | | | | | |
|
|
| | | |
| Variable Rate Demand Note – 0.01% | | | | | | | | |
| | | | |
| | 80,000 | | Kalamazoo Funding Company LLC§ | | 1.20 | | | 12/15/2026 | | | 80,000 |
| | | | |
| | 140,000 | | Kalamazoo Funding Company LLC§ | | 1.25 | | | 12/15/2026 | | | 140,000 |
| | | | |
| | 175,000 | | Kalamazoo Funding Company LLC§ | | 1.25 | | | 12/15/2026 | | | 175,000 |
| | | | |
| | 195,000 | | Kalamazoo Funding Company LLC§ | | 1.25 | | | 12/15/2026 | | | 195,000 |
| | | | |
| | 145,000 | | Kalamazoo Funding Company LLC§ | | 1.25 | | | 12/15/2026 | | | 145,000 |
| | | | |
| | 290,000 | | Kalamazoo Funding Company LLC§ | | 1.25 | | | 12/15/2026 | | | 290,000 |
| | | |
Total Variable Rate Demand Note (Cost $1,025,000) | | | | | | | | 1,025,000 |
| | | | | | | | | | |
|
|
| | | |
Total Investments In Securities
(Cost $7,868,698,577)* | | 99.91 | % | | | | $ | 7,868,698,577 |
| | | |
Other Assets And Liabilities, Net | | 0.09 | | | | | | 7,001,558 |
| | |
|
| | | |
|
|
| Total Net Assets | | 100.00 | % | | | | $ | 7,875,700,135 |
| | |
|
| | | |
|
|
| * | | Cost for federal income tax purposes is substantially the same as for financial reporting purposes. |
| ^ | | Securities that may be resold to “Qualified institutional buyers” under rule 144A or securities offered pursuant to section 4(2) of the Securities Act of 1933, as amended. These securities have been determined to be liquid by the Adviser based on procedures approved by the Board of Trustees. |
| § | | These variable rate securities are subject to a demand feature which reduces the remaining maturity. |
| ± | | Variable Rate Securties. |
The accompanying notes are an integral part of these financial statements.
29
WELLSFARGOMONEYMARKETFUNDS | | PORTFOLIOOFINVESTMENTS — SEPTEMBER 30, 2003 (UNAUDITED) |
|
NATIONALTAX-FREEMONEYMARKETFUND
| Principal | | Security Name | | Interest Rate | | | Maturity Date | | Value |
| | | |
| Municipal Securities – 99.81% | | | | | | | | |
| | | |
| Alabama – 0.51% | | | | | | | | |
| | | | |
| $ | 5,195,000 | | Alabama Water Pollution Control Authority Revenue Roc Series II-R-115 AMBAC Insured§ | | 1.15 | % | | 08/15/2010 | | $ | 5,195,000 |
| | | | |
| | 4,895,000 | | Montgomery AL BMC Special Care Facilities Authority Revenue Series 435§ | | 1.14 | | | 11/15/2029 | | | 4,895,000 |
| | | | |
| | | | | | | | | | | | 10,090,000 |
| | | | | | | | | | |
|
|
| | | |
| Alaska – 3.40% | | | | | | | | |
| | | | |
| | 1,500,000 | | Alaska IDA Revenue Providence Medical Office Building Associates Project KBC Bank NV LOC§ | | 0.95 | | | 06/01/2010 | | | 1,500,000 |
| | | | |
| | 7,495,000 | | Alaska State Housing Finance Corporation Floater PA 1057 Housing Revenue MBIA Insured§ | | 1.13 | | | 06/01/2026 | | | 7,495,000 |
| | | | |
| | 1,425,000 | | Alaska State Housing Finance Corporation Housing Revenue Series BB§ | | 1.23 | | | 06/01/2007 | | | 1,425,000 |
| | | | |
| | 55,300,000 | | Valdez AK Marine Terminal Revenue BP Pipelines Incorported Project Series B§ | | 1.20 | | | 07/01/2037 | | | 55,300,000 |
| | | | |
| | 2,000,000 | | Valdez AK Marine Terminal Revenue BP Pipelines Incorported Project Series A§ | | 1.20 | | | 06/01/2037 | | | 2,000,000 |
| | | | |
| | | | | | | | | | | | 67,720,000 |
| | | | | | | | | | |
|
|
| | | |
| Arizona – 1.82% | | | | | | | | |
| | | | |
| | 18,600,000 | | Arizona School District Tax Anticipation Notes Financing Program CTFS Participation | | 1.75 | | | 07/30/2004 | | | 18,714,518 |
| | | | |
| | 2,715,000 | | Maricopa County AZ IDA MFHR Refunding Las Gardenias Apartments Project Series A§ | | 1.13 | | | 04/15/2033 | | | 2,715,000 |
| | | | |
| | 2,300,000 | | Maricopa County AZ IDA MFHR Villas Solanas Apartments Project Series A Bank of Cherry Creek NA LOC§ | | 1.13 | | | 11/15/2032 | | | 2,300,000 |
| | | | |
| | 3,315,000 | | Maricopa County AZ IDA SFMR§ | | 1.18 | | | 09/01/2005 | | | 3,315,000 |
| | | | |
| | 5,615,000 | | Pima County AZ IDA Revenue Lease Purchase§ | | 1.20 | | | 06/01/2007 | | | 5,615,000 |
| | | | |
| | 2,000,000 | | Salt River Project AZ Agriculture Improvement & Power District Electric System Revenue Salt River Project Series A§ | | 5.00 | | | 01/01/2004 | | | 2,019,495 |
| | | | |
| | 1,515,000 | | Salt River Project AZ Agriculture Improvement & Power District Electric System Revenue Salt River Project Series B§ | | 6.50 | | | 01/01/2004 | | | 1,535,168 |
| | | | |
| | | | | | | | | | | | 36,214,181 |
| | | | | | | | | | |
|
|
| | | |
| Arkansas – 0.14% | | | | | | | | |
| | | | |
| | 2,845,000 | | Arkansas State Development Finance Authority SFMR Series II Collateralized By GNMA FNMA§ | | 1.20 | | | 07/01/2033 | | | 2,845,000 |
| | | | | | | | | | |
|
|
| | | |
| California – 2.10% | | | | | | | | |
| | | | |
| | 3,100,000 | | California HFA Revenue Home Mortgage Series J FSA Insured§ | | 1.14 | | | 02/01/2032 | | | 3,100,000 |
| | | | |
| | 1,200,000 | | California HFFA Revenue Series B MBIA Insured§ | | 1.20 | | | 09/01/2028 | | | 1,200,000 |
| | | | |
| | 4,000,000 | | California Higher Education Loan Authority Incorporated Student Loan Revenue Series A State Street B&T Company LOC§ | | 1.05 | | | 07/01/2005 | | | 4,000,000 |
| | | | |
| | 3,800,000 | | California State Department Water Reserve & Power Supply Revenue Series B-1 Bank of New York LOC§ | | 1.20 | | | 05/01/2022 | | | 3,800,000 |
| | | | |
| | 4,000,000 | | Las Virgenes CA Unified School District FSA Insured§ | | 0.88 | | | 07/01/2033 | | | 4,000,000 |
| | | | |
| | 4,900,000 | | Los Angeles CA Water & Power Revenue Subseries B-6§ | | 1.00 | | | 07/01/2034 | | | 4,900,000 |
| | | | |
| | 1,800,000 | | Metropolitan Water District Southern CA Waterworks Revenue Series B-3§ | | 1.15 | | | 07/01/2035 | | | 1,800,000 |
| | | | |
| | 19,000,000 | | San Bernardino County CA TRAN | | 1.50 | | | 07/01/2004 | | | 19,098,715 |
| | | | |
| | | | | | | | | | | | 41,898,715 |
| | | | | | | | | | |
|
|
30
PORTFOLIOOFINVESTMENTS — SEPTEMBER 30, 2003 (UNAUDITED) | | WELLSFARGOMONEYMARKETFUNDS |
|
NATIONALTAX-FREEMONEYMARKETFUND
| Principal | | Security Name | | Interest Rate | | | Maturity Date | | Value |
| | | |
| Colorado – 2.28% | | | | | | | | |
| | | | |
| $ | 3,800,000 | | Arapahoe County CO Capital Improvements & Transportation Funding Highway Revenue Tolls Series 437 Merrill Lynch Capital Services LOC§ | | 1.16 | % | | 08/31/2026 | | $ | 3,800,000 |
| | | | |
| | 2,000,000 | | Arvada County CO Water Enterprises Revenue FSA Insured§ | | 1.15 | | | 11/01/2020 | | | 2,000,000 |
| | | | |
| | 4,264,000 | | Boulder County CO MFHR Cloverbasin Village Apartments Project§ | | 1.80 | | | 12/25/2031 | | | 4,264,000 |
| | | | |
| | 2,015,000 | | Colorado Department of Transportation Revenue Putters Series 249Z AMBAC Insured§ | | 1.16 | | | 06/15/2014 | | | 2,015,000 |
| | | | |
| | 2,000,000 | | Colorado HFA AMT MFHR Project Class I Series B-3 Collateralized By FHLB§ | | 1.15 | | | 10/01/2035 | | | 2,000,000 |
| | | | |
| | 2,000,000 | | Denver CO Health & Hospital Authority Healthcare Revenue Series B Bank One Colorado NA LOC§ | | 1.25 | | | 12/01/2031 | | | 2,000,000 |
| | | | |
| | 18,000,000 | | Fitzsimons Redevelopment Authority Colorado Revenue University Physicians Incorporated Allied Irish Bank PLC LOC§ | | 1.15 | | | 01/01/2025 | | | 18,000,000 |
| | | | |
| | 11,300,000 | | Pitkin County CO Industrial Development Revenue Aspen Skiing Project Series A Bank One NA LOC§ | | 1.20 | | | 04/01/2016 | | | 11,300,000 |
| | | | |
| | | | | | | | | | | | 45,379,000 |
| | | | | | | | | | |
|
|
| | | |
| Dist Of Columbia – 0.21% | | | | | | | | |
| | | | |
| | 4,165,000 | | District of Columbia Floats PA 568 FSA Insured§ | | 1.14 | | | 06/01/2007 | | | 4,165,000 |
| | | | | | | | | | |
|
|
| | | |
| Florida – 1.98% | | | | | | | | |
| | | | |
| | 3,600,000 | | Alachua County FL Health Facilities Authority Oak Hammock University of Florida Project Series A§ | | 1.20 | | | 10/01/2032 | | | 3,600,000 |
| | | | |
| | 9,000,000 | | Eagle Tax-Exempt Trust CTF 20010906 Class A (Florida State Board of Education Lottery Revenue Series B) FGIC Insured§ | | 1.15 | | | 07/01/2019 | | | 9,000,000 |
| | | | |
| | 2,200,000 | | Escambia County FL HFA SFMR CTFS Series B§ | | 1.15 | | | 10/01/2033 | | | 2,200,000 |
| | | | |
| | 780,000 | | Escambia County FL Housing Finance Authority SFMR Floats PT 1228§ | | 1.18 | | | 10/01/2031 | | | 780,000 |
| | | | |
| | 2,000,000 | | Jacksonville FL Electric Authority Revenue Series D§ | | 5.38 | | | 10/01/2011 | | | 2,000,000 |
| | | | |
| | 9,300,000 | | Jacksonville FL Health Facilities Authority Hospital Revenue Charity OB Group Series C MBIA Insured§ | | 1.10 | | | 08/15/2019 | | | 9,300,000 |
| | | | |
| | 1,750,000 | | Orange County FL IDA Industrial Development Revenue Central Florida YMCA Project Series A Bank of America NA LOC§ | | 1.15 | | | 05/01/2027 | | | 1,750,000 |
| | | | |
| | 4,000,000 | | Orlando FL Utilities Commission Water and Electric Revenue Series B§ | | 5.25 | | | 10/01/2023 | | | 4,040,000 |
| | | | |
| | 1,190,000 | | Orlando FL Utilities Commission Water and Electric Revenue Sub-Series B§ | | 5.25 | | | 10/01/2006 | | | 1,220,631 |
| | | | |
| | 5,500,000 | | Palm Beach County FL Zoological Society Incorporated Project Northern Trust Company LOC§ | | 1.15 | | | 05/01/2031 | | | 5,500,000 |
| | | | |
| | | | | | | | | | | | 39,390,631 |
| | | | | | | | | | |
|
|
| | | |
| Georgia – 5.88% | | | | | | | | |
| | | | |
| | 1,500,000 | | Buford GA Housing Authority MFHR Series 1172§ | | 1.22 | | | 09/01/2025 | | | 1,500,000 |
| | | | |
| | 5,300,000 | | Clayton County GA Development Authority Industrial Development Revenue Blue Circle Aggregates Incorporated Danske Bank LOC§ | | 1.20 | | | 09/01/2009 | | | 5,300,000 |
| | | | |
| | 15,000,000 | | Cobb County GA Tax Anticipated Notes | | 1.50 | | | 12/31/2003 | | | 15,017,382 |
| | | | |
| | 4,270,000 | | Eagle Tax-Exempt Trust CTF 20001003 Class A (Atlanta GA Airport Revenue Series A) FGIC Insured§ | | 1.15 | | | 01/01/2030 | | | 4,270,000 |
| | | | |
| | 4,400,000 | | Gainesville & Hall County GA Development Authority Individual Exempt Facilities Revenue Spout Springs Water LLC Project Bank of America NA LOC§ | | 1.20 | | | 04/01/2027 | | | 4,400,000 |
| | | | |
| | 13,440,000 | | Georgia Local Government CTFS Participation Series K§ | | 1.18 | | | 06/01/2028 | | | 13,440,000 |
| | | | |
| | 23,400,000 | | Georgia Municipal Gas Authority Gas Revenue Gas Portfolio II Project C Wachovia Bank LOC§ | | 1.10 | | | 01/01/2008 | | | 23,400,000 |
31
| WELLSFARGOMONEYMARKETFUNDS | | PORTFOLIOOFINVESTMENTS — SEPTEMBER 30, 2003 (UNAUDITED) |
|
NATIONALTAX-FREEMONEYMARKETFUND
| Principal | | Security Name | | Interest Rate | | | Maturity Date | | Value |
| | | |
| Georgia (continued) | | | | | | | | |
| | | | |
| $ | 17,800,000 | | Gwinnett County GA Development Authority Revenue Civic & Cultural Center Project Landesbank Hessen LOC§ | | 1.05 | % | | 09/01/2031 | | $ | 17,800,000 |
| | | | |
| | 32,000,000 | | Gwinnett County GA School District Construction Sales Tax Notes | | 2.00 | | | 12/29/2003 | | | 32,069,608 |
| | | | |
| | | | | | | | | | | | 117,196,990 |
| | | | | | | | | | |
|
|
| | | |
| Hawaii – 0.85% | | | | | | | | |
| | | | |
| | 8,000,000 | | Eagle Tax-Exempt Trust CTF 20011101 Class A (Hawaii State Highway Revenue) FSA Insured§ | | 1.15 | | | 07/01/2019 | | | 8,000,000 |
| | | | |
| | 9,000,000 | | Honolulu HI City & County Tax Revenue Series C FGIC Insured§ | | 1.30 | | | 12/01/2008 | | | 9,000,000 |
| | | | |
| | | | | | | | | | | | 17,000,000 |
| | | | | | | | | | |
|
|
| | | |
| Idaho – 1.68% | | | | | | | | |
| | | | |
| | 3,000,000 | | Ada & Canyon Countys ID JT School District #2 Meridan SBG Insured | | 2.50 | | | 07/30/2004 | | | 3,039,482 |
| | | | |
| | 3,075,000 | | Idaho Housing & Financial Assistance Housing Revenue Balmoral Apartments II Development Project US Bank NA LOC§ | | 1.25 | | | 04/01/2033 | | | 3,075,000 |
| | | | |
| | 27,000,000 | | Idaho State Tax Anticipation Notes | | 2.00 | | | 06/30/2004 | | | 27,239,709 |
| | | | |
| | | | | | | | | | | | 33,354,191 |
| | | | | | | | | | |
|
|
| | | |
| Illinois – 10.91% | | | | | | | | |
| | | | |
| | 5,000,000 | | Chicago IL Board of Education CTFS Series A§ | | 1.18 | | | 06/01/2021 | | | 5,000,000 |
| | | | |
| | 6,050,000 | | Chicago IL Board of Education Roc Series II-R-139 AMBAC Insured§ | | 1.15 | | | 12/01/2022 | | | 6,050,000 |
| | | | |
| | 1,500,000 | | Chicago IL Economic Development Revenue Crane Carton Company Project Bankers Trust Company LOC§ | | 1.25 | | | 06/01/2012 | | | 1,500,000 |
| | | | |
| | 6,810,000 | | Chicago IL Midway Airport Revenue Series A MBIA Insured§ | | 6.25 | | | 01/01/2024 | | | 7,031,937 |
| | | | |
| | 5,465,000 | | Chicago IL Park District Roc Rr Series II-R-4018 AMBAC Insured§ | | 1.15 | | | 01/01/2024 | | | 5,465,000 |
| | | | |
| | 2,800,000 | | Chicago IL Public Building Commission Eagle 20030015 Class A FGIC Insured§ | | 1.15 | | | 12/01/2014 | | | 2,800,000 |
| | | | |
| | 5,700,000 | | Chicago IL Sales Tax Revenue Series SG 131 FGIC Insured§ | | 1.13 | | | 01/01/2027 | | | 5,700,000 |
| | | | |
| | 3,747,000 | | Cook County IL CTFS Series 458 FGIC Insured§ | | 1.14 | | | 11/15/2028 | | | 3,747,000 |
| | | | |
| | 4,000,000 | | Cook County IL High School District No 205 Thornton Township Series B FSA Insured§ | | 2.60 | | | 12/01/2003 | | | 4,008,267 |
| | | | |
| | 5,125,000 | | Eagle Tax-Exempt Trust CTF 20021301 Class A (Illinois State) FGIC Insured§ | | 1.15 | | | 02/01/2019 | | | 5,125,000 |
| | | | |
| | 18,025,000 | | Eagle Tax-Exempt Trust CTF 20021303 Class A (Cook County IL Series C) AMBAC Insured§ | | 1.15 | | | 11/15/2025 | | | 18,025,000 |
| | | | |
| | 4,000,000 | | Eagle Tax-Exempt Trust CTF 20021304 Class A (Illinois State) FGIC Insured§ | | 1.15 | | | 02/01/2027 | | | 4,000,000 |
| | | | |
| | 1,340,000 | | Elgin IL Industrial Development Revenue Gemini Mouldings Project Lasalle Bank NA LOC§ | | 1.18 | | | 12/01/2028 | | | 1,340,000 |
| | | | |
| | 200,000 | | Elmhurst IL Industrial Development Revenue John Sakash Company Incorporated Project Lasalle Bank NA LOC§ | | 1.18 | | | 02/01/2025 | | | 200,000 |
| | | | |
| | 5,145,000 | | Illinois Development Finance Authority Revenue Christian Heritage Academy US Bank NA LOC§ | | 1.25 | | | 12/01/2021 | | | 5,145,000 |
| | | | |
| | 200,000 | | Illinois Educational Facilities Authority Revenue Newberry Library Northern Trust Company LOC§ | | 1.10 | | | 03/01/2028 | | | 200,000 |
| | | | |
| | 4,800,000 | | Illinois Educational Facilities Authority Revenue St Xavier University Project
Series A Lasalle Bank NA LOC§ | | 1.13 | | | 10/01/2032 | | | 4,800,000 |
| | | | |
| | 14,600,000 | | Illinois Educuational Facilities Authority Revenue Cultural Pooled Financing American National B&T LOC§ | | 1.10 | | | 03/01/2028 | | | 14,600,000 |
| | | | |
| | 4,525,000 | | Illinois Health Facilities Authority Revenue Floater CTFS Series 166 AMBAC Insured§ | | 1.10 | | | 02/15/2024 | | | 4,525,000 |
| | | | |
| | 4,500,000 | | Illinois Health Facilities Authority Revenue Illinois Masonic Medical Center§ | | 5.50 | | | 10/01/2019 | | | 4,590,000 |
32
PORTFOLIOOFINVESTMENTS — SEPTEMBER 30, 2003 (UNAUDITED) | | WELLSFARGOMONEYMARKETFUNDS |
|
NATIONALTAX-FREEMONEYMARKETFUND
| Principal | | Security Name | | Interest Rate | | | Maturity Date | | Value |
| | | |
| Illinois (continued) | | | | | | | | |
| | | | |
| $ | 5,000,000 | | Illinois Health Facilities Authority Revenue Memorial Medical Center Series C Kredietbank NV LOC§ | | 1.10 | % | | 01/01/2016 | | $ | 5,000,000 |
| | | | |
| | 22,100,000 | | Illinois Health Facilities Authority Revenue Northwestern Memorial Hospital§ | | 1.20 | | | 08/15/2025 | | | 22,100,000 |
| | | | |
| | 7,500,000 | | Illinois Health Facilities Authority Revenue Northwestern Memorial Hospital
Series A Westdeutsche Landesbank LOC§ | | 1.22 | | | 08/15/2009 | | | 7,500,000 |
| | | | |
| | 13,600,000 | | Illinois Health Facilities Authority Revenue Northwestern Memorial Hospital
Series C Westdeutsche Landesbank LOC§ | | 1.20 | | | 08/15/2032 | | | 13,600,000 |
| | | | |
| | 3,600,000 | | Illinois Health Facilities Authority Revenue Revolving Fund Pooled Financing Bank One NA LOC§ | | 1.10 | | | 08/01/2015 | | | 3,600,000 |
| | | | |
| | 16,100,000 | | Illinois Health Facilities Authority Revenue Silver Cross Hospital & Medical Series A Fifth Third Bank LOC§ | | 1.14 | | | 08/15/2026 | | | 16,100,000 |
| | | | |
| | 7,500,000 | | Illinois Housing Development Authority MFHR Lakeshore Plaza Series A MBIA Insured§ | | 1.10 | | | 07/01/2027 | | | 7,500,000 |
| | | | |
| | 1,660,000 | | Illinois Industrial Development Finance Authority Revenue Recovery Income Project Bank of America NA LOC§ | | 1.18 | | | 06/01/2008 | | | 1,660,000 |
| | | | |
| | 7,530,000 | | Illinois State CTFS Series G§ | | 1.16 | | | 05/01/2015 | | | 7,530,000 |
| | | | |
| | 3,200,000 | | Illinois State Roc Series Ii-R-132 MBIA Insured§ | | 1.15 | | | 08/01/2010 | | | 3,200,000 |
| | | | |
| | 4,300,000 | | Illinois State Sales Tax Revenue Municipal Trust Receipts Series SG-9§ | | 1.13 | | | 06/15/2019 | | | 4,300,000 |
| | | | |
| | 6,800,000 | | Lombard IL IDA Revenue 2500 Higland Avenue Project Mid-America Federal Savings & Loan LOC§ | | 1.50 | | | 12/01/2006 | | | 6,800,000 |
| | | | |
| | 6,000,000 | | Orland Hills IL MFHR Series A Lasalle National Bank LOC§ | | 1.10 | | | 12/01/2004 | | | 6,000,000 |
| | | | |
| | 1,200,000 | | Schaumberg IL MFHR Windsong Apartments Project Lasalle National Bank LOC§ | | 1.12 | | | 02/01/2024 | | | 1,200,000 |
| | | | |
| | 3,250,000 | | Warren County IL Industrial Project Revenue Monmouth College Project Allied Irish Bank PLC LOC§ | | 1.10 | | | 12/01/2032 | | | 3,250,000 |
| | | | |
| | 4,000,000 | | Will County IL School District #122New Lenox GO Series II-R-114 FGIC Insured§ | | 1.15 | | | 11/01/2020 | | | 4,000,000 |
| | | | |
| | | | | | | | | | | | 217,192,204 |
| | | | | | | | | | |
|
|
| | | |
| Indiana – 3.56% | | | | | | | | |
| | | | |
| | 400,000 | | Indiana HFFA Revenue Capital Access Comerica Bank LOC§ | | 1.05 | | | 04/01/2013 | | | 400,000 |
| | | | |
| | 4,060,000 | | Indiana HFFA Revenue Fayette Memorial Hospital Association Series B Fifth Third Bank LOC§ | | 1.25 | | | 10/01/2022 | | | 4,060,000 |
| | | | |
| | 3,800,000 | | Indiana Secondary Market Educational Loans Incorporated Student Loan Revenue Series B AMBAC Insured§ | | 1.10 | | | 12/01/2013 | | | 3,800,000 |
| | | | |
| | 8,478,000 | | Indiana State Housing Finance Authority MFHR Pedcor Investments Series A Collateralized By FHLB§ | | 1.16 | | | 01/01/2029 | | | 8,478,000 |
| | | | |
| | 14,965,000 | | Indiana Transportation Finance Authority Toll Road Lease Revenue Roc
Series II-R-105 AMBAC Insured§ | | 1.15 | | | 07/01/2012 | | | 14,965,000 |
| | | | |
| | 1,750,000 | | Indianapolis IN Economic Development Revenue Jewish Federation Campus Fifth Third Bank LOC§ | | 1.05 | | | 04/01/2005 | | | 1,750,000 |
| | | | |
| | 2,000,000 | | Indianapolis IN Gas Utility Revenue Series A AMBAC Insured§ | | 5.88 | | | 06/01/2024 | | | 2,104,920 |
| | | | |
| | 8,700,000 | | Indianapolis IN MFHR Crossing Partners Project AIG Guaranty LOC§ | | 1.30 | | | 03/01/2031 | | | 8,700,000 |
| | | | |
| | 1,000,000 | | Ips School Building Corporation First Mortgage State Aid Withholding LOC§ | | 6.10 | | | 01/15/2020 | | | 1,061,018 |
| | | | |
| | 15,630,000 | | Richmond IN Hospital Authority Revenue Reid Hospital & Health Care Project§ | | 1.10 | | | 01/01/2012 | | | 15,630,000 |
| | | | |
| | 9,980,000 | | Whiting IN Environmental Facilities Revenue BP Products Project Series C§ | | 1.25 | | | 07/01/2034 | | | 9,980,000 |
| | | | |
| | | | | | | | | | | | 70,928,938 |
| | | | | | | | | | |
|
|
| | | |
| Iowa – 2.33% | | | | | | | | |
| | | | |
| | 3,225,000 | | Iowa Finance Authority Economic Development Revenue Lasalle Bank NA LOC§ | | 1.30 | | | 03/01/2016 | | | 3,225,000 |
33
| WELLSFARGOMONEYMARKETFUNDS | | PORTFOLIOOFINVESTMENTS — SEPTEMBER 30, 2003 (UNAUDITED) |
|
NATIONALTAX-FREEMONEYMARKETFUND
| Principal | | Security Name | | Interest Rate | | | Maturity Date | | Value |
| | | |
| Iowa (continued) | | | | | | | | |
| | | | |
| $ | 6,310,000 | | Iowa Finance Authority Health Care Facilities Revenue St Lukes Health Series A General Electric Capital Corporation LOC§ | | 1.10 | % | | 03/01/2018 | | $ | 6,310,000 |
| | | | |
| | 2,960,000 | | Iowa Finance Authority MFHR Cedarwood Hills Project Series A Collateralized By FHLMC§ | | 1.15 | | | 05/01/2031 | | | 2,960,000 |
| | | | |
| | 3,000,000 | | Iowa Finance Authority Private College Revenue Drake University Project Firstar Bank LOC§ | | 1.25 | | | 07/01/2011 | | | 3,000,000 |
| | | | |
| | 13,355,000 | | Iowa Finance Authority SFhr CTFS Series N§ | | 1.23 | | | 01/01/2008 | | | 13,355,000 |
| | | | |
| | 3,190,000 | | Iowa Higher Education Loan Authority Revenue Private College Facilities Grand View Project Firstar Bank NA LOC§ | | 1.25 | | | 10/01/2025 | | | 3,190,000 |
| | | | |
| | 14,300,000 | | Iowa State School Cash Anticipation Program Iowa School Corporations CTFS Series B FSA Insured | | 2.25 | | | 01/30/2004 | | | 14,354,903 |
| | | | |
| | | | | | | | | | | | 46,394,903 |
| | | | | | | | | | |
|
|
| | | |
| Kansas – 1.11% | | | | | | | | |
| | | | |
| | 2,600,000 | | Kansas State Development Finance Authority Health Facilities Revenue Stormont Vail Project Series M MBIA Insured§ | | 1.25 | | | 11/15/2023 | | | 2,600,000 |
| | | | |
| | 9,500,000 | | Kansas State Development Finance Authority MFHR Bluffs Olathe Apartments Project Series X§ | | 1.80 | | | 11/25/2031 | | | 9,500,000 |
| | | | |
| | 2,465,000 | | Lawrence KS GO Temporary Notes Property Tax Revenue Series II | | 2.25 | | | 10/01/2003 | | | 2,465,000 |
| | | | |
| | 5,035,000 | | Lenexa KS MFHR Series 1020§ | | 1.14 | | | 07/01/2004 | | | 5,035,000 |
| | | | |
| | 2,410,000 | | Sedgwick & Shawnee Countys KS SFMR Merrill Lynch Capital Services LOC§ | | 1.22 | | | 12/01/2013 | | | 2,410,000 |
| | | | |
| | | | | | | | | | | | 22,010,000 |
| | | | | | | | | | |
|
|
| | | |
| Kentucky – 0.11% | | | | | | | | |
| | | | |
| | 2,000,000 | | Louisville & Jefferson County KY Metropolitan Sewer District Sewer and Drain System Series A | | 9.00 | | | 05/15/2004 | | | 2,096,821 |
| | | | | | | | | | |
|
|
| | | |
| Lousiana – 2.15% | | | | | | | | |
| | | | |
| | 4,320,000 | | Jefferson Parish LA Home Mortgage Authority Floats PT 229 Collateralized By GNMA FNMA§ | | 1.18 | | | 06/01/2007 | | | 4,320,000 |
| | | | |
| | 5,620,000 | | Louisiana Public Facilities Authority Revenue Series II-R-192§ | | 1.15 | | | 05/15/2022 | | | 5,620,000 |
| | | | |
| | 3,785,000 | | Louisiana State GO State Territories Series II R 128 MBIA Insured§ | | 1.15 | | | 05/15/2013 | | | 3,785,000 |
| | | | |
| | 3,150,000 | | Louisiana State GO States Territories Series II R 111 MBIA Insured§ | | 1.15 | | | 05/15/2012 | | | 3,150,000 |
| | | | |
| | 2,715,000 | | Oskaloosa IA Private School Facility Revenue William Penn University Project US Bank NA LOC§ | | 1.25 | | | 07/01/2020 | | | 2,715,000 |
| | | | |
| | 7,700,000 | | Plaquemines LA Port Harbor & Terminal District Port Facilities Revenue International Marine Term Project Series B Kreditbank NV LOC§ | | 1.10 | | | 03/15/2006 | | | 7,700,000 |
| | | | |
| | 15,500,000 | | Plaquemines LA Port Harbor & Terminal District Port Facilities Revenue International Marine Terminal Project Series A Kredietbank NV LOC§ | | 1.10 | | | 03/15/2006 | | | 15,500,000 |
| | | | |
| | | | | | | | | | | | 42,790,000 |
| | | | | | | | | | |
|
|
| | | |
| Maine – 1.21% | | | | | | | | |
| | | | |
| | 1,000,000 | | Maine Municipal Revenue Series E§ | | 5.30 | | | 11/01/2013 | | | 1,030,362 |
| | | | |
| | 2,800,000 | | Maine Regional Industrial Waste System Waste Resources Recovery Revenue
Series R§ | | 1.22 | | | 07/01/2012 | | | 2,800,000 |
| | | | |
| | 20,100,000 | | Maine State Tax Anticipation Notes | | 1.75 | | | 06/30/2004 | | | 20,241,166 |
| | | | |
| | | | | | | | | | | | 24,071,528 |
| | | | | | | | | | |
|
|
34
PORTFOLIOOFINVESTMENTS — SEPTEMBER 30, 2003 (UNAUDITED) | | WELLSFARGOMONEYMARKETFUNDS |
|
NATIONALTAX-FREEMONEYMARKETFUND
| Principal | | Security Name | | Interest Rate | | | Maturity Date | | Value |
| | | |
| Maryland – 0.25% | | | | | | | | |
| | | | |
| $ | 4,995,000 | | Maryland State Community Development Administration Department Housing & Community Development§ | | 1.05 | % | | 07/01/2039 | | $ | 4,995,000 |
| | | | | | | | | | |
|
|
| | | |
| Massachusetts – 3.07% | | | | | | | | |
| | | | |
| | 3,270,000 | | Canton MA Housing Authority MFHR Canton Arboretum Apartments Collateralized By FNMA§ | | 1.05 | | | 09/15/2026 | | | 3,270,000 |
| | | | |
| | 35,440,000 | | Massachusetts Health & Education Facilities Authority | | 0.85 | | | 10/01/2003 | | | 35,440,000 |
| | | | |
| | 15,000,000 | | Massachusetts State Central Artery Series A§ | | 1.20 | | | 12/01/2030 | | | 15,000,000 |
| | | | |
| | 7,495,000 | | Massachusetts State GO FSA Insured§ | | 1.20 | | | 12/01/2014 | | | 7,495,000 |
| | | | |
| | | | | | | | | | | | 61,205,000 |
| | | | | | | | | | |
|
|
| | | |
| Michigan – 4.05% | | | | | | | | |
| | | | |
| | 7,200,000 | | Detroit MI City School District Eagle-20026014 Class A FGIC Insured§ | | 1.15 | | | 05/01/2032 | | | 7,200,000 |
| | | | |
| | 3,400,000 | | Detroit MI Sewer Disposal Revenue Series II-R-103 FGIC Insured§ | | 1.15 | | | 07/01/2026 | | | 3,400,000 |
| | | | |
| | 5,965,000 | | Detroit MI Sewer Disposal Revenue Series II-R-116 MBIA Insured§ | | 1.15 | | | 07/01/2017 | | | 5,965,000 |
| | | | |
| | 1,000,000 | | Farmington Hills MI Hospital Finance Authority Hospital Revenue Botsford General Hospital Series B MBIA Insured§ | | 1.25 | | | 02/15/2016 | | | 1,000,000 |
| | | | |
| | 9,285,000 | | Lakeview School District Calhoun MI GO School Building & Site Improvement Series B Landesbank Henssen-Thueringen LOC§ | | 1.05 | | | 05/01/2032 | | | 9,285,000 |
| | | | |
| | 4,500,000 | | Macomb County MI Hospital Finance Authority Revenue Mount Clemens General Hospital Series A-1 Comerica Bank LOC§ | | 1.20 | | | 10/01/2020 | | | 4,500,000 |
| | | | |
| | 1,700,000 | | Michigan State Grant Anticipation Notes Series B§ | | 1.07 | | | 09/15/2008 | | | 1,700,000 |
| | | | |
| | 2,100,000 | | Michigan State Higher Education Loan Revenue Series XII B AMBAC Insured§ | | 1.10 | | | 10/01/2013 | | | 2,100,000 |
| | | | |
| | 7,700,000 | | Michigan State Housing Development Authority Limited Obligation Revenue Nonprofit Housing Corporation VI§ | | 1.15 | | | 06/01/2025 | | | 7,700,000 |
| | | | |
| | 4,950,000 | | Michigan State Housing Development Authority MFHR Berrien Woods III Project Series A Lansing Bank§ | | 1.18 | | | 07/01/2032 | | | 4,950,000 |
| | | | |
| | 3,800,000 | | Michigan State Housing Development Authority Rental Housing Revenue Series A MBIA Insured§ | | 1.09 | | | 10/01/2037 | | | 3,800,000 |
| | | | |
| | 2,500,000 | | Michigan State Strategic Fund Limited Obligation Revenue Detroit Symphony Project Series B Michigan National Bank LOC§ | | 1.20 | | | 06/01/2031 | | | 2,500,000 |
| | | | |
| | 8,200,000 | | Michigan State Strategic Funding Limited Obligation Revenue Consumers Power Company Project Series A§ | | 1.20 | | | 06/15/2010 | | | 8,200,000 |
| | | | |
| | 18,300,000 | | St Joseph MI Hospital Finance Authority Hospital Revenue Lakeland Hospital At Niles Project FSA Insured§ | | 1.05 | | | 01/01/2032 | | | 18,300,000 |
| | | | |
| | | | | | | | | | | | 80,600,000 |
| | | | | | | | | | |
|
|
| | | |
| Minnesota – 4.61% | | | | | | | | |
| | | | |
| | 500,000 | | Arden Hills MN Housing & Healthcare Facilities Revenue Presbyterian Homes Series B US Bank NA LOC§ | | 1.25 | | | 09/01/2029 | | | 500,000 |
| | | | |
| | 3,320,000 | | Burnsville MN MFHR Berkshire Project Series A Collateralized By FNMA§ | | 1.10 | | | 07/15/2030 | | | 3,320,000 |
| | | | |
| | 3,000,000 | | Crystal MN MFHR Crystal Apartments Project Collateralized By FHLB§ | | 1.05 | | | 05/01/2027 | | | 3,000,000 |
| | | | |
| | 1,200,000 | | Dakota County MN CDA MFHR Regatta Commons Project Series A Lasalle Bank NA LOC§ | | 1.30 | | | 01/01/2038 | | | 1,200,000 |
| | | | |
| | 3,375,000 | | Dakota County MN Housing & Redevelopment Authority MFHR PT 484 Collateralized By FHLMC§ | | 1.14 | | | 12/01/2022 | | | 3,375,000 |
| | | | |
| | 2,900,000 | | Duluth MN Economic Development Authority Health Care Facilities Revenue Miller-Dwan Medical Center Project US Bank NA LOC§ | | 1.25 | | | 06/01/2019 | | | 2,900,000 |
| | | | |
| | 8,460,000 | | Eagan MN MFHR Floats PT 1221§ | | 1.14 | | | 12/01/2029 | | | 8,460,000 |
| | | | |
| | 1,550,000 | | Eagle Tax-Exempt Trust CTF 20012301 Class A§ | | 1.15 | | | 10/01/2019 | | | 1,550,000 |
35
| WELLSFARGOMONEYMARKETFUNDS | | PORTFOLIOOFINVESTMENTS — SEPTEMBER 30, 2003 (UNAUDITED) |
|
NATIONALTAX-FREEMONEYMARKETFUND
| Principal | | Security Name | | Interest Rate | | | Maturity Date | | Value |
| | | |
| Minnesota (continued) | | | | | | | | |
| | | | |
| $ | 7,880,000 | | Edina MN MFHR Edina Park Plaza Collateralized By FHLMC§ | | 1.05 | % | | 12/01/2029 | | $ | 7,880,000 |
| | | | |
| | 4,950,000 | | Mankato MN MFHR Highland Project US Bank Trust NA LOC§ | | 1.25 | | | 05/01/2027 | | | 4,950,000 |
| | | | |
| | 350,000 | | Maple Grove MN MFHR Basswood Trails Project§ | | 1.10 | | | 03/01/2029 | | | 350,000 |
| | | | |
| | 2,080,000 | | Minneapolis MN GO Unlimited Notes | | 5.00 | | | 12/01/2003 | | | 2,093,884 |
| | | | |
| | 1,000,000 | | Minnesota Public Facilities Authority Water PCR Series A§ | | 1.13 | | | 03/01/2004 | | | 1,000,000 |
| | | | |
| | 2,000,000 | | Minnesota Public Facilities Authority Water PCR Series A | | 4.00 | | | 03/01/2004 | | | 2,024,021 |
| | | | |
| | 2,125,000 | | Minnesota Rural Water Finance Authority Series B | | 2.38 | | | 12/15/2003 | | | 2,129,426 |
| | | | |
| | 2,725,000 | | Minnesota State GO Unlimited Notes Series II-R-96§ | | 1.15 | | | 08/01/2014 | | | 2,725,000 |
| | | | |
| | 1,020,000 | | Minnesota State Higher Education Facilities Authority Revenue St Thomas University Series 5L§ | | 1.07 | | | 04/01/2027 | | | 1,020,000 |
| | | | |
| | 2,865,000 | | Plymouth MN MFHR Lancaster Village Apartments Project Collateralized By FNMA§ | | 1.10 | | | 09/15/2031 | | | 2,865,000 |
| | | | |
| | 15,250,000 | | Rochester MN Health Care Facilities Hospital Revenue | | 0.88 | | | 10/23/2003 | | | 15,250,000 |
| | | | |
| | 4,000,000 | | Rochester MN Healthcare Services | | 0.85 | | | 12/10/2003 | | | 4,000,000 |
| | | | |
| | 650,000 | | Roseville MN Health Care Facilities Revenue Presbyterian Homes Care Project§ | | 1.25 | | | 10/01/2029 | | | 650,000 |
| | | | |
| | 1,000,000 | | Roseville MN Private School Facilities Revenue Northwestern College Project§ | | 1.25 | | | 11/01/2022 | | | 1,000,000 |
| | | | |
| | 2,375,000 | | St Paul MN Housing & Redevelopment Authority District Heating Revenue Series A§ | | 1.05 | | | 12/01/2012 | | | 2,375,000 |
| | | | |
| | 245,000 | | St Paul MN Housing & Redevelopment Authority Revenue Minnesota Public Radio Project Allied Irish Bank PLC LOC§ | | 1.25 | | | 05/01/2022 | | | 245,000 |
| | | | |
| | 1,500,000 | | St Paul MN Port Authority District Cooling Revenue 2002 Series Q Dexia Credit Local de France LOC§ | | 1.05 | | | 03/01/2022 | | | 1,500,000 |
| | | | |
| | 200,000 | | St Paul MN Port Authority District Cooling Revenue Series M Dexia Bank LOC§ | | 1.25 | | | 03/01/2021 | | | 200,000 |
| | | | |
| | 1,250,000 | | St Paul MN Port Authority District Cooling Revenue Series O Dexia Credit Local de France LOC§ | | 1.25 | | | 03/01/2012 | | | 1,250,000 |
| | | | |
| | 100,000 | | St Paul MN Port Authority District Cooling Revenue Series R Dexia Credit Local de France LOC§ | | 1.30 | | | 03/01/2022 | | | 100,000 |
| | | | |
| | 3,050,000 | | St Paul MN Port Authority Tax Increment Revenue Westgate Office & Industrial Center Project US Bank Trust NA LOC§ | | 1.10 | | | 02/01/2015 | | | 3,050,000 |
| | | | |
| | 8,990,000 | | University of Minnesota Education Facilities Revenue Intermediate Term Financing Series A§ | | 1.12 | | | 01/01/2034 | | | 8,990,000 |
| | | | |
| | 1,765,000 | | University of Minnesota GO Revenue§ | | 1.15 | | | 07/01/2021 | | | 1,765,000 |
| | | | |
| | | | | | | | | | | | 91,717,331 |
| | | | | | | | | | |
|
|
| | | |
| Mississippi – 1.22% | | | | | | | | |
| | | | |
| | 21,100,000 | | Jackson County MS Port Facility Revenue Chevron USA Incorporated Project§ | | 1.20 | | | 06/01/2023 | | | 21,100,000 |
| | | | |
| | 1,115,000 | | Mississippi Home Corporation SFMR Series 146 GNMA FNMA Insured§ | | 1.18 | | | 11/01/2029 | | | 1,115,000 |
| | | | |
| | 2,000,000 | | Mississippi Hospital Equipment & Facilities Authority Revenue North Mississippi Health Services Series 1§ | | 1.05 | | | 05/15/2030 | | | 2,000,000 |
| | | | |
| | | | | | | | | | | | 24,215,000 |
| | | | | | | | | | |
|
|
| | | |
| Missouri – 0.85% | | | | | | | | |
| | | | |
| | 145,000 | | Missouri Health and Education Facility Authority Education Facilities Revenue St Louis University Project Series A§ | | 1.25 | | | 10/01/2009 | | | 145,000 |
| | | | |
| | 10,900,000 | | Missouri Health and Education Facility Authority Education Facilities Revenue St Louis University Project Series B§ | | 1.25 | | | 10/01/2024 | | | 10,900,000 |
| | | | |
| | 3,800,000 | | Missouri Health and Education Facility Authority Revenue Christian Brothers College Series A§ | | 1.25 | | | 10/01/2032 | | | 3,800,000 |
36
PORTFOLIOOFINVESTMENTS — SEPTEMBER 30, 2003 (UNAUDITED) | | WELLSFARGOMONEYMARKETFUNDS |
|
NATIONALTAX-FREEMONEYMARKETFUND
| Principal | | Security Name | | Interest Rate | | | Maturity Date | | Value |
| | | |
| Missouri (continued) | | | | | | | | |
| | | | |
| $ | 2,100,000 | | Missouri Higher Education Loan Authority Student Loan Revenue Series A Bank of America§ | | 1.10 | % | | 12/01/2005 | | $ | 2,100,000 |
| | | | |
| | | | | | | | | | | | 16,945,000 |
| | | | | | | | | | |
|
|
| | | |
| Montana – 1.04% | | | | | | | | |
| | | | |
| | 5,000,000 | | Anaconda Deer Lodge County MT Environmental Facilities Revenue Variable Reference Arco Anaconda SMElter§ | | 1.25 | | | 10/01/2037 | | | 5,000,000 |
| | | | |
| | 5,475,000 | | Montana State Board of Investments Municipal Finance Construction Act-Intercap Program§ | | 1.35 | | | 03/01/2009 | | | 5,475,000 |
| | | | |
| | 4,750,000 | | Montana State Board of Investments Municipal Finance Construction-Intercap Program§ | | 1.35 | | | 03/01/2005 | | | 4,750,000 |
| | | | |
| | 5,515,000 | | Montana State Board of Investments Municipal Finance Construction-Intercap Program§ | | 1.35 | | | 03/01/2010 | | | 5,515,000 |
| | | | |
| | | | | | | | | | | | 20,740,000 |
| | | | | | | | | | |
|
|
| | | |
| Nebraska – 0.26% | | | | | | | | |
| | | | |
| | 5,200,000 | | Nebraska Educational Finance Authority Revenue Creighton University Project Allied Irish Bank PLC LOC§ | | 1.20 | | | 08/01/2031 | | | 5,200,000 |
| | | | | | | | | | |
|
|
| | | |
| Nevada – 0.45% | | | | | | | | |
| | | | |
| | 4,690,000 | | Clark County NV Roc Rr Series II-R-1035 MBIA Insured§ | | 1.15 | | | 06/01/2021 | | | 4,690,000 |
| | | | |
| | 4,200,000 | | Nevada Housing Division Multi Unit Housing Series A US Bank NA LOC§ | | 1.13 | | | 04/01/2035 | | | 4,200,000 |
| | | | |
| | | | | | | | | | | | 8,890,000 |
| | | | | | | | | | |
|
|
| | | |
| New Mexico – 0.38% | | | | | | | | |
| | | | |
| | 1,265,000 | | Albuquerque NM Industrial Development Revenue Karsten Company New Mexico Project Series A Bank One Arizona NA LOC§ | | 1.30 | | | 12/01/2017 | | | 1,265,000 |
| | | | |
| | 2,200,000 | | Bloomfield NM Healthcare Facilities Revenue Series A Lasalle National Bank NA LOC§ | | 1.30 | | | 11/15/2010 | | | 2,200,000 |
| | | | |
| | 2,460,000 | | Espanola NM Health Care Revenue Series A Lasalle National Bank NA LOC§ | | 1.30 | | | 11/15/2010 | | | 2,460,000 |
| | | | |
| | 1,685,000 | | Silver City NM Series A Lasalle National Bank NA LOC§ | | 1.30 | | | 11/15/2010 | | | 1,685,000 |
| | | | |
| | | | | | | | | | | | 7,610,000 |
| | | | | | | | | | |
|
|
| | | |
| New York – 0.61% | | | | | | | | |
| | | | |
| | 2,000,000 | | New York NY City Housing Development Corporation MFHR First Avenue Development Project Series A§ | | 1.05 | | | 10/15/2035 | | | 2,000,000 |
| | | | |
| | 1,500,000 | | New York State Dorm Authority Revenue State University Education Facilities Series C§ | | 5.30 | | | 05/15/2009 | | | 1,577,163 |
| | | | |
| | 8,500,000 | | New York State HFA Revenue Series A§ | | 1.10 | | | 05/01/2029 | | | 8,500,000 |
| | | | |
| | | | | | | | | | | | 12,077,163 |
| | | | | | | | | | |
|
|
| | | |
| North Carolina – 0.66% | | | | | | | | |
| | | | |
| | 13,170,000 | | University of North Carolina Hospital Chapel Hill Revenue Series B§ | | 1.22 | | | 02/15/2031 | | | 13,170,000 |
| | | | | | | | | | |
|
|
| | | |
| North Dakota – 0.97% | | | | | | | | |
| | | | |
| | 6,000,000 | | North Dakota Rural Water Financial Corporation | | 2.50 | | | 11/01/2003 | | | 6,004,518 |
| | | | |
| | 10,300,000 | | North Dakota State Housing Finance Agency Revenue Series B§ | | 1.10 | | | 01/01/2034 | | | 10,300,000 |
| | | | |
| | 2,950,000 | | Ward County ND Health Care Facilities Revenue Trinity Obligation Group Series A US Bank NA LOC§ | | 1.25 | | | 07/01/2029 | | | 2,950,000 |
| | | | |
| | | | | | | | | | | | 19,254,518 |
| | | | | | | | | | |
|
|
37
| WELLSFARGOMONEYMARKETFUNDS | | PORTFOLIOOFINVESTMENTS — SEPTEMBER 30, 2003 (UNAUDITED) |
|
NATIONALTAX-FREEMONEYMARKETFUND
| Principal | | Security Name | | Interest Rate | | | Maturity Date | | Value |
| | | |
| Ohio – 4.32% | | | | | | | | |
| | | | |
| $ | 5,000,000 | | Franklin County OH Hospital Revenue Series Ii-R-55 Salomon Smith Barnery LOC§ | | 1.15 | % | | 06/01/2017 | | $ | 5,000,000 |
| | | | |
| | 3,000,000 | | Grove City OH MFHR Regency Arms Apartments Project Collateralized By FNMA§ | | 1.15 | | | 06/15/2030 | | | 3,000,000 |
| | | | |
| | 19,500,000 | | Hamilton County OH Hospital Facilities Revenue Elizabeth Gamble Series B JP Morgan Chase & Company LOC§ | | 1.10 | | | 06/01/2027 | | | 19,500,000 |
| | | | |
| | 4,000,000 | | Ohio State Building Authority Adult Correctional Building Fund Series A MBIA Insured§ | | 5.75 | | | 10/01/2005 | | | 4,080,000 |
| | | | |
| | 6,295,000 | | Ohio State GO Series Rr Ii-R 206 FGIC Insured§ | | 1.15 | | | 03/15/2015 | | | 6,295,000 |
| | | | |
| | 2,520,000 | | Ohio State Higher Education Facilities Revenue Series A§ | | 1.10 | | | 09/01/2027 | | | 2,520,000 |
| | | | |
| | 500,000 | | Scioto County OH Hospital Revenue VHA Center Incorporated Series C AMBAC Insured§ | | 1.03 | | | 12/01/2025 | | | 500,000 |
| | | | |
| | 25,485,000 | | Sunamerica Trust Variable State�� | | 1.19 | | | 07/01/2041 | | | 25,485,000 |
| | | | |
| | 12,400,000 | | University of Toledo Ohio General Receipts Bonds§ | | 1.20 | | | 06/01/2032 | | | 12,400,000 |
| | | | |
| | 540,000 | | Warren County OH Health Care Facilities Revenue Otterbein Series A§ | | 1.14 | | | 07/01/2021 | | | 540,000 |
| | | | |
| | 2,810,000 | | Warren County OH Industrial Development Revenue Cincinnati Electricity Corporation Project Scotiabank LOC§ | | 1.10 | | | 09/01/2015 | | | 2,810,000 |
| | | | |
| | 3,845,000 | | Warren County OH Industrial Development Revenue Pac Manufacturing Project§ | | 1.30 | | | 12/01/2025 | | | 3,845,000 |
| | | | |
| | | | | | | | | | | | 85,975,000 |
| | | | | | | | | | |
|
|
| | | |
| Oklahoma – 1.10% | | | | | | | | |
| | | | |
| | 7,500,000 | | Muskogee OK Medical Center Authority Revenue Bank of America NA LOC§ | | 1.15 | | | 10/01/2032 | | | 7,500,000 |
| | | | |
| | 2,000,000 | | Oklahoma Development Finance Authority Health Care Revenue Continuing Care Community Project Series C KBC Bank NV LOC§ | | 1.25 | | | 02/01/2012 | | | 2,000,000 |
| | | | |
| | 4,820,000 | | Oklahoma State HFA Revenue Series 1327 Merrill Lynch Capital LOC§ | | 1.18 | | | 03/01/2009 | | | 4,820,000 |
| | | | |
| | 6,605,000 | | Oklahoma State IDA Tealridge Manor Corporation Project Bank of America NA LOC§ | | 1.15 | | | 11/01/2018 | | | 6,605,000 |
| | | | |
| | 1,055,000 | | Tulsa County OK HFA SFMR GNMA Mortgage Backed Securities Class A Series E§ | | 1.20 | | | 07/01/2032 | | | 1,055,000 |
| | | | |
| | | | | | | | | | | | 21,980,000 |
| | | | | | | | | | |
|
|
| | | |
| Oregon – 0.70% | | | | | | | | |
| | | | |
| | 1,655,000 | | Deschutes County OR Series A FSA Insured | | 5.00 | | | 06/15/2004 | | | 1,703,081 |
| | | | |
| | 3,000,000 | | Gilliam County OR Solid Waste Disposal Revenue Waste Management Incorporated Project JP Morgan Chase Bank LOC§ | | 1.15 | | | 07/01/2027 | | | 3,000,000 |
| | | | |
| | 4,300,000 | | Multnomah County OR Higher Education Revenue Concordia University Portland Project§ | | 1.25 | | | 12/01/2029 | | | 4,300,000 |
| | | | |
| | 4,995,000 | | Tri County Metro Transportation District OR Series 142§ | | 1.05 | | | 08/01/2019 | | | 4,995,000 |
| | | | |
| | | | | | | | | | | | 13,998,081 |
| | | | | | | | | | |
|
|
| | | |
| Other – 3.97% | | | | | | | | |
| | | | |
| | 5,787,003 | | ABN AMRO Leasetops CTFS Tr 2000-2 ABN AMRO Bank NV LOC§ | | 1.40 | | | 04/01/2005 | | | 5,787,003 |
| | | | |
| | 10,000,000 | | ABN AMRO Munitops CTFS Tr 1999-1 Munitops Certificates FGIC Insured§^ | | 1.18 | | | 12/06/2006 | | | 10,000,000 |
| | | | |
| | 15,420,000 | | ABN AMRO Munitops CTFS Tr 2001-23 MBIA Insured§ | | 1.18 | | | 12/01/2009 | | | 15,420,000 |
| | | | |
| | 11,286,080 | | MBIA Capital Corporation Global Funding MBIA Insured§ | | 1.23 | | | 01/14/2016 | | | 11,286,080 |
| | | | |
| | 8,160,000 | | Munimae Trust Collaterized By FHLMC§ | | 1.22 | | | 12/19/2005 | | | 8,160,000 |
| | | | |
| | 5,000,000 | | Newman Capital Trust Series 2001-2 Class A§ | | 1.24 | | | 04/11/2033 | | | 5,000,000 |
| | | | |
| | 5,027,835 | | Pitney Bowes Credit Corporation Leasetops Tr Revenue Series 2002-1§ | | 1.44 | | | 07/19/2006 | | | 5,027,835 |
38
PORTFOLIOOFINVESTMENTS — SEPTEMBER 30, 2003 (UNAUDITED) | | WELLSFARGOMONEYMARKETFUNDS |
|
NATIONALTAX-FREEMONEYMARKETFUND
| Principal | | Security Name | | Interest Rate | | | Maturity Date | | Value |
| | | |
| Other (continued) | | | | | | | | |
| | | | |
| $ | 6,640,000 | | Roaring Fork Municipal Products Limited Liability Corporation Series 2000-14 Class A§ | | 1.19 | % | | 06/01/2005 | | $ | 6,640,000 |
| | | | |
| | 2,153,805 | | Roaring Fork Municipal Products Limited Liability Corporation Series 2002-6 Class A§ | | 1.19 | | | 06/01/2034 | | | 2,153,805 |
| | | | |
| | 2,749,000 | | US Bancorp Project Funding Trust Series A§ | | 1.23 | | | 01/01/2010 | | | 2,749,000 |
| | | | |
| | 6,815,500 | | US Bancorp Project Funding Trust Series A§ | | 1.23 | | | 03/01/2010 | | | 6,815,500 |
| | | | |
| | | | | | | | | | | | 79,039,223 |
| | | | | | | | | | |
|
|
| | | |
| Pennsylvania – 0.79% | | | | | | | | |
| | | | |
| | 1,960,000 | | Hollidaysburg PA Area School District AMBAC Insured§ | | 6.50 | | | 06/01/2020 | | | 2,033,405 |
| | | | |
| | 9,500,000 | | Pennsylvania State Higher Education Assistance Agency Student Loan Revenue Series A AMBAC Insured§ | | 1.05 | | | 12/01/2025 | | | 9,500,000 |
| | | | |
| | 4,205,000 | | Pennsylvania State Turnpike Commission Oil Franchise Tax Revenue Series II R 1005§ | | 1.15 | | | 12/01/2015 | | | 4,205,000 |
| | | | |
| | | | | | | | | | | | 15,738,405 |
| | | | | | | | | | |
|
|
| | | |
| Rhode Island – 0.05% | | | | | | | | |
| | | | |
| | 1,000,000 | | Rhode Island Refunding Board Authority State Public Projects Revenue§ | | 1.13 | | | 08/01/2005 | | | 1,000,000 |
| | | | | | | | | | |
|
|
| | | |
| South Carolina – 3.08% | | | | | | | | |
| | | | |
| | 47,700,000 | | Charleston County SC School District Anticipated Notes | | 2.00 | | | 02/25/2004 | | | 47,870,867 |
| | | | |
| | 4,570,000 | | South Carolina Educational Facilities Authority For Private Nonprofit Insitiutions§ | | 1.15 | | | 02/01/2022 | | | 4,570,000 |
| | | | |
| | 3,265,000 | | South Carolina Housing Finance and Development Authority Mtg Revenue Series l§ | | 1.23 | | | 07/01/2028 | | | 3,265,000 |
| | | | |
| | 5,650,000 | | South Carolina State Public Service Authority Revenue§ | | 1.13 | | | 01/01/2023 | | | 5,650,000 |
| | | | |
| | | | | | | | | | | | 61,355,867 |
| | | | | | | | | | |
|
|
| | | |
| South Dakota – 0.75% | | | | | | | | |
| | | | |
| | 4,900,000 | | Lawrence County SD Solid Waste Disposal Revenue Homestake Mining Company Series A Chase Manhatten Bank LOC§ | | 1.25 | | | 07/01/2032 | | | 4,900,000 |
| | | | |
| | 10,100,000 | | South Dakota State Health & Educational Facilities Revenue Rapid City Regional Hospital§ | | 1.20 | | | 09/01/2027 | | | 10,100,000 |
| | | | |
| | | | | | | | | | | | 15,000,000 |
| | | | | | | | | | |
|
|
| | | |
| Tennessee – 2.95% | | | | | | | | |
| | | | |
| | 4,955,000 | | Chattanooga TN Roc Rr Series Ii-R-1026 MBIA Insured§ | | 1.15 | | | 10/01/2022 | | | 4,955,000 |
| | | | |
| | 4,700,000 | | Clarksville TN Public Building Authority Revenue Pooled Financing Tennessee Municipal Bond Funding Bank of America NA LOC§ | | 1.22 | | | 01/01/2033 | | | 4,700,000 |
| | | | |
| | 5,600,000 | | Jackson TN Energy Authority Wastewater System Revenue FSA Insured§ | | 1.10 | | | 12/01/2022 | | | 5,600,000 |
| | | | |
| | 4,000,000 | | Memphis TN Center City Revenue Finance Corporation MFHR Series 1220§ | | 1.14 | | | 11/01/2029 | | | 4,000,000 |
| | | | |
| | 28,360,000 | | Montgomery County TN Public Building Authority Pooled Financing Revenue Tennessee County Loan Pool§ | | 1.22 | | | 04/01/2032 | | | 28,360,000 |
| | | | |
| | 4,710,500 | | Portland TN Health & Education Facilities Board Hospital Revenue Series 322§ | | 1.23 | | | 11/15/2014 | | | 4,710,500 |
| | | | |
| | 4,610,000 | | Tennessee Housing Development Agency Series H§ | | 1.21 | | | 01/01/2021 | | | 4,610,000 |
| | | | |
| | 1,800,000 | | Volunteer State Student Funding Corporation Tennessee Student Loan Revenue Series A1 State Street Bank & Trust Company LOC§ | | 1.15 | | | 12/01/2023 | | | 1,800,000 |
| | | | |
| | | | | | | | | | | | 58,735,500 |
| | | | | | | | | | |
|
|
39
| WELLSFARGOMONEYMARKETFUNDS | | PORTFOLIOOFINVESTMENTS — SEPTEMBER 30, 2003 (UNAUDITED) |
|
NATIONALTAX-FREEMONEYMARKETFUND
| Principal | | Security Name | | Interest Rate | | | Maturity Date | | Value |
| | | |
| Texas – 9.18% | | | | | | | | |
| | | | |
| $ | 1,615,000 | | Austin TX Higher Education Authority University Revenue Concordia University At Austin Project Bank One Texas NA LOC§ | | 1.20 | % | | 04/01/2025 | | $ | 1,615,000 |
| | | | |
| | 7,000,000 | | Austin TX Utility Systems Revenue Roc Series Ii-R-159 FSA Insured§ | | 1.15 | | | 05/15/2014 | | | 7,000,000 |
| | | | |
| | 7,945,000 | | Austin TX Utility Systems Revenue Series A MBIA Insured§ | | 5.50 | | | 11/15/2003 | | | 7,987,297 |
| | | | |
| | 9,400,000 | | Austin TX Utility Systems Revenue Series G Receipts§ | | 1.13 | | | 11/15/2011 | | | 9,400,000 |
| | | | |
| | 7,145,000 | | Brownsville TX Utility Systems Revenue Series A MBIA Insured§ | | 1.05 | | | 09/01/2027 | | | 7,145,000 |
| | | | |
| | 8,000,000 | | Calhoun County TX Solid Waste Disposal Revenue Formosa Plastics Corporation Project Bank of America NA LOC§ | | 1.20 | | | 05/01/2025 | | | 8,000,000 |
| | | | |
| | 7,700,000 | | Cameron TX Ed Corporation Revenue Dallas Jewish Community Foundation Allied Irish Bank plc LOC§ | | 1.12 | | | 12/01/2030 | | | 7,700,000 |
| | | | |
| | 4,310,000 | | Eagle Tax-Exempt Trust CTF 20014302 Class A (Austin TX Electric Utility Systems Revenue) FSA Insured§ | | 1.15 | | | 11/15/2017 | | | 4,310,000 |
| | | | |
| | 6,000,000 | | Eagle Tax-Exempt Trust CTF 20014310 Class A (Dallas TX Area Rapid) AMBAC Insured§ | | 1.15 | | | 12/01/2026 | | | 6,000,000 |
| | | | |
| | 7,000,000 | | Harris County TX Health Care Facilities Development Corporation Revenue St Lukes Episcopal Hospital Series B§ | | 1.25 | | | 02/15/2031 | | | 7,000,000 |
| | | | |
| | 2,700,000 | | Harris County TX Health Facilities Development Corporation Special Facilities Revenue Texas Medical Center Project Series B FSA Insured§ | | 1.25 | | | 05/15/2029 | | | 2,700,000 |
| | | | |
| | 13,700,000 | | Houston TX Higher Education Finance Facilities Revenue Floater Receipts Series SG 139 Societe Generale LOC§ | | 1.13 | | | 11/15/2029 | | | 13,700,000 |
| | | | |
| | 5,470,000 | | Houston TX Water & Sewer Systems Revenue CTFS Series 495 FGIC Insured§ | | 1.14 | | | 12/01/2030 | | | 5,470,000 |
| | | | |
| | 3,770,000 | | Houston TX Water & Sewer Systems Revenue Municipal Trust Receipts Series SG 120§ | | 1.13 | | | 12/01/2023 | | | 3,770,000 |
| | | | |
| | 1,000,000 | | North Central TX Health Facilities Development Corporation Revenue Dallas Jewish Community Foundation Allied Irish Bank plc LOC§ | | 1.12 | | | 12/01/2030 | | | 1,000,000 |
| | | | |
| | 9,500,000 | | Pasadena TX Independent School District | | 2.25 | | | 02/15/2004 | | | 9,538,810 |
| | | | |
| | 2,425,000 | | Polly Ryon Hospital Authority TX Polly Ryon Memorial Hospital JP Morgan Chase & Company LLC§ | | 1.10 | | | 11/01/2026 | | | 2,425,000 |
| | | | |
| | 3,000,000 | | Splendora TX Higher Educational Facilities Corporate Revenue Project Fellowship Christian Project§ | | 1.15 | | | 01/01/2017 | | | 3,000,000 |
| | | | |
| | 7,900,000 | | Texas A & M University Notes Series 3 A2 | | 1.25 | | | 01/27/2004 | | | 7,907,048 |
| | | | |
| | 7,900,000 | | Texas A & M University Notes Series 3 A2 | | 1.25 | | | 01/29/2004 | | | 7,907,148 |
| | | | |
| | 1,000,000 | | Texas State Public Finance Authority Series B | | 6.00 | | | 10/01/2003 | | | 1,000,000 |
| | | | |
| | 36,000,000 | | Texas State TRAN | | 2.00 | | | 08/31/2004 | | | 36,276,982 |
| | | | |
| | 15,195,000 | | Travis County TX Health Facilities Development Corporation Health Revenue Series 4 AMBAC Insured§ | | 1.17 | | | 11/15/2024 | | | 15,195,000 |
| | | | |
| | 6,870,000 | | Travis County TX HFA SFMR Series 1287 Collateralized By GNMA§ | | 1.18 | | | 09/01/2018 | | | 6,870,000 |
| | | | |
| | | | | | | | | | | | 182,917,285 |
| | | | | | | | | | |
|
|
| | | |
| Utah – 2.86% | | | | | | | | |
| | | | |
| | 7,600,000 | | Salt Lake County UT Pollution Control Revenue Series B§ | | 1.22 | | | 08/01/2007 | | | 7,600,000 |
| | | | |
| | 19,800,000 | | Salt Lake County UT Pollution Control Revenue Service Station Holdings Project§ | | 1.20 | | | 02/01/2008 | | | 19,800,000 |
| | | | |
| | 2,000,000 | | Utah State Board of Regents Student Loan Revenue Series 1988C AMBAC Insured§ | | 1.05 | | | 11/01/2013 | | | 2,000,000 |
| | | | |
| | 14,800,000 | | Utah State Board of Regents Student Loan Revenue Series 1997R AMBAC Insured§ | | 1.10 | | | 11/01/2031 | | | 14,800,000 |
| | | | |
| | 12,700,000 | | Utah Transportation Authority Sales Tax Revenue Series B Bayerishe Landesbank LOC§ | | 1.05 | | | 09/01/2032 | | | 12,700,000 |
| | | | |
| | | | | | | | | | | | 56,900,000 |
| | | | | | | | | | |
|
|
40
PORTFOLIOOFINVESTMENTS — SEPTEMBER 30, 2003 (UNAUDITED) | | WELLSFARGOMONEYMARKETFUNDS |
|
NATIONALTAX-FREEMONEYMARKETFUND
| Principal | | Security Name | | Interest Rate | | | Maturity Date | | Value |
| | | |
| Virginia – 1.15% | | | | | | | | |
| | | | |
| $ | 16,490,000 | | Loudoun County VA IDA Howard Hughes Medical Project Series A | | 1.15 | % | | 02/15/2038 | | $ | 16,490,000 |
| | | | |
| | 2,335,000 | | Richmond VA ROC Series II-R-168 FGIC Insured§ | | 1.15 | | | 01/15/2016 | | | 2,335,000 |
| | | | |
| | 2,000,000 | | Virginia Beach VA GO | | 5.00 | | | 07/15/2004 | | | 2,065,245 |
| | | | |
| | 2,000,000 | | Virginia State Transportation Board Transportation Contract Revenue Northern Virginia Transportation District Project Series A§ | | 6.25 | | | 05/15/2017 | | | 2,090,765 |
| | | | |
| | | | | | | | | | | | 22,981,010 |
| | | | | | | | | | |
|
|
| | | |
| Washington – 4.24% | | | | | | | | |
| | | | |
| | 5,246,500 | | Energy Northwest Washington Electric Revenue CTFS Series C FSA Insured§ | | 1.21 | | | 01/01/2010 | | | 5,246,500 |
| | | | |
| | 4,200,000 | | Energy Northwest Washington Electric Revenue Floats PA 846 FSA Insured§ | | 1.14 | | | 01/01/2010 | | | 4,200,000 |
| | | | |
| | 17,350,000 | | Issaquah WA Community Properties Water Revenue Series A Bank of America NA LOC§ | | 1.10 | | | 02/15/2021 | | | 17,350,000 |
| | | | |
| | 2,000,000 | | King County WA School District No 411 Series A | | 5.85 | | | 12/01/2011 | | | 2,084,711 |
| | | | |
| | 1,255,000 | | King County WA Series A | | 5.00 | | | 01/01/2004 | | | 1,268,031 |
| | | | |
| | 5,320,000 | | Kitsap County WA School District No 400 North Kitsap Series II-R-1009 FSA Insured§ | | 1.15 | | | 12/01/2017 | | | 5,320,000 |
| | | | |
| | 1,900,000 | | Snohomish County WA Public Utility District Series A-1 FSA Insured§ | | 1.10 | | | 12/01/2019 | | | 1,900,000 |
| | | | |
| | 2,100,000 | | Washington State Economic Development Financing Authority Revenue Ace Tank Project US Bank NA LOC§ | | 1.20 | | | 11/01/2018 | | | 2,100,000 |
| | | | |
| | 5,500,000 | | Washington State Economic Development Financing Authority Revenue Industrial Development Canam Steel Project Series D§ | | 1.25 | | | 09/30/2030 | | | 5,500,000 |
| | | | |
| | 1,115,000 | | Washington State Economic Development Financing Authority Revenue Pioneer Human Services Project H§ | | 1.25 | | | 09/01/2018 | | | 1,115,000 |
| | | | |
| | 4,000,000 | | Washington State Economic Development Financing Authority Solid Waste Disposal Revenue Waste Management Incorporated Project Series D§ | | 1.15 | | | 07/01/2027 | | | 4,000,000 |
| | | | |
| | 6,645,000 | | Washington State HFA MFHR Canyon Lakes II Project Pacific Northwest Bank LOC§ | | 1.15 | | | 10/01/2019 | | | 6,645,000 |
| | | | |
| | 6,900,000 | | Washington State Housing Finance Community MFHR Country Club Apartments Series A US Bank NA LOC§ | | 1.30 | | | 08/01/2032 | | | 6,900,000 |
| | | | |
| | 3,140,000 | | Washington State Housing Finance Community MFHR Lakewood Meadows Apartments Project Series A Insured By FNMA§ | | 1.15 | | | 07/15/2033 | | | 3,140,000 |
| | | | |
| | 1,000,000 | | Washington State Housing Finance Community MFHR Mill Point Apartments Project Series A US Bank Trust NA LOC§ | | 1.30 | | | 01/01/2030 | | | 1,000,000 |
| | | | |
| | 2,000,000 | | Washington State Housing Finance Community Nonprofit Revenue Annie Wright School Bank of America NA LOC§ | | 1.15 | | | 12/01/2023 | | | 2,000,000 |
| | | | |
| | 1,700,000 | | Washington State Housing Finance Community Nonprofit Revenue Tacoma Art Museum Project Northern Trust Company LOC§ | | 1.25 | | | 06/01/2032 | | | 1,700,000 |
| | | | |
| | 1,700,000 | | Washington State Public Power Supply System Nuclear Project No 1 Revenue Municipal Securities Trust Receipts Series CMC2 Insured By AMBAC§ | | 1.12 | | | 01/01/2005 | | | 1,700,000 |
| | | | |
| | 300,000 | | Washington State Public Power Supply System Nuclear Project No 2 Revenue Municipal Securities Trust Receipts Series CMC3 Insured By AMBAC§ | | 1.12 | | | 07/01/2007 | | | 300,000 |
| | | | |
| | 7,000,000 | | Washington State Series SG-37§ | | 1.13 | | | 07/01/2017 | | | 7,000,000 |
| | | | |
| | 1,140,000 | | Yakima County WA Public Corporation Revenue Longview Fire Company Project Bank of America NT & SA LOC§ | | 1.25 | | | 01/01/2018 | | | 1,140,000 |
| | | | |
| | 2,900,000 | | Yakima County WA Public Corporation Revenue Valley Processing Project Bank of America NA LOC§ | | 1.20 | | | 02/01/2015 | | | 2,900,000 |
| | | | |
| | | | | | | | | | | | 84,509,242 |
| | | | | | | | | | |
|
|
41
| WELLSFARGOMONEYMARKETFUNDS | | PORTFOLIOOFINVESTMENTS — SEPTEMBER 30, 2003 (UNAUDITED) |
|
NATIONALTAX-FREEMONEYMARKETFUND
| Principal | | Security Name | | Interest Rate | | | Maturity Date | | Value |
| | | |
| Wisconsin – 3.41% | | | | | | | | |
| | | | |
| $ | 5,490,000 | | Chilton WI School District ROC RR Series II-R-1017 FGIC Insured§ | | 1.15 | % | | 04/01/2019 | | $ | 5,490,000 |
| | | | |
| | 5,000,000 | | Waukesha WI School District Tax & Revenue Anticipation Promissory Notes | | 1.50 | | | 08/23/2004 | | | 5,021,215 |
| | | | |
| | 26,500,000 | | Wisconsin Housing & Economic Development Authority Home Ownership Revenue Series I FSA Insured§ | | 1.10 | | | 09/01/2032 | | | 26,500,000 |
| | | | |
| | 8,565,000 | | Wisconsin Rural Water Construction Loan Program Community Revenue Anticipation Notes§ | | 2.50 | | | 11/01/2003 | | | 8,571,449 |
| | | | |
| | 21,000,000 | | Wisconsin State Health & Educational Facilities Authority Revenue Prohealth Incorporated Series B§ | | 1.20 | | | 08/15/2030 | | | 21,000,000 |
| | | | |
| | 365,000 | | Wisconsin State Health and Educational Facilities Authority Revenue Gundersen Lutheran Series A§ | | 1.20 | | | 12/01/2015 | | | 365,000 |
| | | | |
| | 1,000,000 | | Wisconsin State Transportation Revenue Series A§ | | 5.50 | | | 07/01/2009 | | | 1,044,668 |
| | | | |
| | | | | | | | | | | | 67,992,332 |
| | | | | | | | | | |
|
|
| | | |
| Wyoming – 0.61% | | | | | | | | |
| | | | |
| | 5,200,000 | | Lincoln County WY PCR Exxon Project Series 1985§ | | 1.15 | | | 08/01/2015 | | | 5,200,000 |
| | | | |
| | 3,000,000 | | Sweetwater County WY Environment Improvement Revenue Bonds§ | | 1.30 | | | 11/01/2025 | | | 3,000,000 |
| | | | |
| | 4,010,000 | | Wyoming Community Development Authority Revenue FGIC Insured§ | | 1.22 | | | 02/01/2004 | | | 4,010,000 |
| | | | |
| | | | | | | | | | | | 12,210,000 |
| | | | | | | | | | |
|
|
| | | |
Total Municipal Securities (Cost $1,987,689,059) | | | | | | | | 1,987,689,059 |
| | | | | | | | | | |
|
|
| | | |
Total Investments In Securities
(Cost $1,987,689,059)* | | 99.81 | % | | | | $ | 1,987,689,059 |
| | | |
Other Assets And Liabilities, Net | | 0.19 | | | | | | 3,882,773 |
| | |
|
| | | |
|
|
| Total Net Assets | | 100.00 | % | | | | $ | 1,991,571,832 |
| | |
|
| | | |
|
|
| * | | Cost for federal income tax purposes is substantially the same as for financial reporting purposes. |
| ^ | | Securities that may be resold to “Qualified institutional buyers” under rule 144A or securities offered pursuant to section 4(2) of the Securities Act of 1933, as amended. These securities have been determined to be liquid by Adviser based on procedures approved by the Board of Trustees. |
| § | | These variable rate securities are subject to a demand feature which reduces the remaining maturity. |
The accompanying notes are an integral part of these financial statements.
42
PORTFOLIOOFINVESTMENTS — SEPTEMBER 30, 2003 (UNAUDITED) | | WELLSFARGOMONEYMARKETFUNDS |
|
TREASURYPLUSMONEYMARKETFUND
| Principal | | Security Name | | Interest Rate | | | Maturity Date | | Value |
| | | |
| Repurchase Agreements – 44.57% | | | | | | | | |
| | | | |
| $ | 1,200,000,000 | | Bear Stearns & Company Incorporated—102% Collateralized by US Government Securities | | 0.97 | % | | 10/01/2003 | | $ | 1,200,000,000 |
| | | | |
| | 46,705,000 | | Deutsche Bank Alex Brown—102% Collateralized by US Government Securities | | 0.95 | | | 10/01/2003 | | | 46,705,000 |
| | | | |
| | 163,000,000 | | Goldman Sachs Group Incorporated—102% Collateralized by US Government Securities | | 0.95 | | | 10/01/2003 | | �� | 163,000,000 |
| | | | |
| | 1,050,000,000 | | Goldman Sachs Group Incorporated—102% Collateralized by US Government Securities | | 0.91 | | | 10/01/2003 | | | 1,050,000,000 |
| | |
Total Repurchase Agreements (Cost $2,459,705,000) | | | | | 2,459,705,000 |
| | | | | | | | | | |
|
|
| | | |
| US Treasury Securities – 55.31% | | | | | | | | |
| | | |
| US Treasury Bills – 41.17% | | | | | | | | |
| | | | |
| | 150,000,000 | | US Treasury Bills | | 0.92 | † | | 10/02/2003 | | | 149,996,187 |
| | | | |
| | 225,000,000 | | US Treasury Bills | | 0.93 | † | | 10/02/2003 | | | 224,994,219 |
| | | | |
| | 200,000,000 | | US Treasury Bills | | 0.96 | † | | 10/02/2003 | | | 199,994,667 |
| | | | |
| | 100,000,000 | | US Treasury Bills | | 1.09 | † | | 10/02/2003 | | | 99,996,972 |
| | | | |
| | 75,000,000 | | US Treasury Bills | | 0.60 | † | | 10/09/2003 | | | 74,990,000 |
| | | | |
| | 75,000,000 | | US Treasury Bills | | 1.07 | † | | 10/09/2003 | | | 74,982,167 |
| | | | |
| | 50,000,000 | | US Treasury Bills | | 1.12 | † | | 10/09/2003 | | | 49,987,556 |
| | | | |
| | 150,000,000 | | US Treasury Bills | | 1.18 | † | | 10/23/2003 | | | 149,891,833 |
| | | | |
| | 50,000,000 | | US Treasury Bills | | 0.91 | † | | 11/20/2003 | | | 49,936,458 |
| | | | |
| | 50,000,000 | | US Treasury Bills | | 0.92 | † | | 11/20/2003 | | | 49,936,458 |
| | | | |
| | 150,000,000 | | US Treasury Bills | | 0.98 | † | | 11/20/2003 | | | 149,795,833 |
| | | | |
| | 605,000 | | US Treasury Bills | | 0.99 | † | | 11/20/2003 | | | 604,172 |
| | | | |
| | 125,000,000 | | US Treasury Bills | | 1.09 | † | | 11/28/2003 | | | 124,780,486 |
| | | | |
| | 50,000,000 | | US Treasury Bills | | 0.93 | † | | 12/04/2003 | | | 49,917,778 |
| | | | |
| | 75,000,000 | | US Treasury Bills | | 0.94 | † | | 01/02/2004 | | | 74,817,875 |
| | | | |
| | 250,000,000 | | US Treasury Bills | | 0.95 | † | | 01/02/2004 | | | 249,389,687 |
| | | | |
| | 150,000,000 | | US Treasury Bills | | 0.95 | † | | 01/08/2004 | | | 149,610,188 |
| | | | |
| | 250,000,000 | | US Treasury Bills | | 1.03 | † | | 02/12/2004 | | | 249,041,528 |
| | | | |
| | 100,000,000 | | US Treasury Bills | | 1.00 | † | | 03/18/2004 | | | 99,530,556 |
| | | | |
| | | | | | | | | | | | 2,272,194,620 |
| | | | | | | | | | |
|
|
| | | |
| US Treasury Notes – 14.14% | | | | | | | | |
| | | | |
| | 50,000,000 | | US Treasury Notes | | 4.25 | | | 11/15/2003 | | | 50,149,243 |
| | | | |
| | 93,107,000 | | US Treasury Notes | | 11.88 | | | 11/15/2003 | | | 94,298,534 |
| | | | |
| | 100,000,000 | | US Treasury Notes | | 3.25 | | | 12/31/2003 | | | 100,520,288 |
| | | | |
| | 100,000,000 | | US Treasury Notes | | 3.63 | | | 03/31/2004 | | | 101,285,374 |
| | | | |
| | 125,000,000 | | US Treasury Notes | | 3.38 | | | 04/30/2004 | | | 126,570,423 |
| | | | |
| | 75,000,000 | | US Treasury Notes | | 7.25 | | | 05/15/2004 | | | 77,857,205 |
| | | | |
| | 75,000,000 | | US Treasury Notes | | 2.25 | | | 07/31/2004 | | | 75,721,090 |
| | | | |
| | 75,000,000 | | US Treasury Notes | | 6.00 | | | 08/15/2004 | | | 78,162,410 |
| | | | |
| | 75,000,000 | | US Treasury Notes | | 2.13 | | | 08/31/2004 | | | 75,541,121 |
| | | | |
| | | | | | | | | | | | 780,105,688 |
| | | | | | | | | | |
|
|
| | |
Total US Treasury Securities (Cost $3,052,300,308) | | | | | 3,052,300,308 |
| | | | | | | | | | |
|
|
43
| WELLSFARGOMONEYMARKETFUNDS | | PORTFOLIOOFINVESTMENTS — SEPTEMBER 30, 2003 (UNAUDITED) |
|
TREASURYPLUSMONEYMARKETFUND
| Principal | | Security Name | | Interest Rate | | Maturity Date | | Value |
| | | |
Total Investments In Securities (Cost $5,512,005,308)* | | 99.88 | % | | | | $ | 5,512,005,308 |
| | | |
Other Assets And Liabilities, Net | | 0.12 | | | | | | 6,440,286 |
| | |
|
| | | |
|
|
| Total Net Assets | | 100.00 | % | | | | $ | 5,518,445,594 |
| | |
|
| | | |
|
|
| * | | Cost for federal income tax purposes is substantially the same as for financial reporting purposes. |
The accompanying notes are an integral part of these financial statements.
44
PORTFOLIOOFINVESTMENTS — SEPTEMBER 30, 2003 (UNAUDITED) | | WELLSFARGOMONEYMARKETFUNDS |
|
100%TREASURYMONEYMARKETFUND
| Principal | | Security Name | | Interest Rate | | | Maturity Date | | Value |
| | | |
| US Treasury Securities – 100.09% | | | | | | | | |
| | | |
| US Treasury Bills – 100.09% | | | | | | | | |
| | | | |
| $ | 100,000,000 | | US Treasury Bills | | 0.95 | %† | | 10/02/2003 | | $ | 99,997,361 |
| | | | |
| | 250,000,000 | | US Treasury Bills | | 0.96 | † | | 10/02/2003 | | | 249,993,333 |
| | | | |
| | 124,226,000 | | US Treasury Bills | | 0.60 | † | | 10/09/2003 | | | 124,209,437 |
| | | | |
| | 26,160,000 | | US Treasury Bills | | 0.90 | † | | 10/09/2003 | | | 26,154,768 |
| | | | |
| | 100,000,000 | | US Treasury Bills | | 0.92 | † | | 10/09/2003 | | | 99,979,667 |
| | | | |
| | 50,000,000 | | US Treasury Bills | | 1.12 | † | | 10/09/2003 | | | 49,987,611 |
| | | | |
| | 75,000,000 | | US Treasury Bills | | 0.90 | † | | 10/23/2003 | | | 74,958,979 |
| | | | |
| | 75,000,000 | | US Treasury Bills | | 1.00 | † | | 10/23/2003 | | | 74,960,583 |
| | | | |
| | 150,000,000 | | US Treasury Bills | | 0.94 | † | | 10/30/2003 | | | 149,886,417 |
| | | | |
| | 75,000,000 | | US Treasury Bills | | 0.96 | † | | 10/30/2003 | | | 74,942,302 |
| | | | |
| | 185,655,000 | | US Treasury Bills | | 0.93 | † | | 11/13/2003 | | | 185,448,768 |
| | | | |
| | 15,415,000 | | US Treasury Bills | | 0.94 | † | | 11/13/2003 | | | 15,397,784 |
| | | | |
| | 75,000,000 | | US Treasury Bills | | 0.94 | † | | 11/13/2003 | | | 74,915,792 |
| | | | |
| | 152,615,000 | | US Treasury Bills | | 0.94 | † | | 11/20/2003 | | | 152,415,753 |
| | | | |
| | 9,220,000 | | US Treasury Bills | | 0.97 | † | | 11/20/2003 | | | 9,207,579 |
| | | | |
| | 3,395,000 | | US Treasury Bills | | 0.99 | † | | 11/20/2003 | | | 3,390,355 |
| | | | |
| | 27,645,000 | | US Treasury Bills | | 0.97 | † | | 11/28/2003 | | | 27,601,797 |
| | | | |
| | 150,000,000 | | US Treasury Bills | | 0.98 | † | | 11/28/2003 | | | 149,763,167 |
| | | | |
| | 75,000,000 | | US Treasury Bills | | 1.09 | † | | 11/28/2003 | | | 74,868,292 |
| | | | |
| | 67,500,000 | | US Treasury Bills | | 0.92 | † | | 12/04/2003 | | | 67,390,200 |
| | | | |
| | 200,000,000 | | US Treasury Bills | | 0.93 | † | | 12/04/2003 | | | 199,671,111 |
| | | | |
| | 100,000,000 | | US Treasury Bills | | 0.95 | † | | 12/04/2003 | | | 99,831,111 |
| | | | |
| | 50,000,000 | | US Treasury Bills | | 0.94 | † | | 12/11/2003 | | | 49,907,799 |
| | | | |
| | 100,000,000 | | US Treasury Bills | | 0.93 | † | | 12/18/2003 | | | 99,798,500 |
| | | | |
| | 100,000,000 | | US Treasury Bills | | 0.93 | † | | 01/02/2004 | | | 99,759,750 |
| | | | |
| | 100,000,000 | | US Treasury Bills | | 0.95 | † | | 01/02/2004 | | | 99,755,875 |
| | | | |
| | 75,000,000 | | US Treasury Bills | | 0.95 | † | | 01/08/2004 | | | 74,805,094 |
| | | | |
| | 100,000,000 | | US Treasury Bills | | 0.96 | † | | 01/22/2004 | | | 99,700,236 |
| | | | |
| | 26,725,000 | | US Treasury Bills | | 0.99 | † | | 01/22/2004 | | | 26,642,371 |
| | | | |
| | 84,505,000 | | US Treasury Bills | | 1.02 | † | | 02/05/2004 | | | 84,202,413 |
| | | | |
| | 100,000,000 | | US Treasury Bills | | 0.98 | † | | 02/12/2004 | | | 99,635,222 |
| | | | |
| | | | | | | | | | | | 2,819,179,427 |
| | | | | | | | | | |
|
|
| | |
Total US Treasury Securities (Cost $2,819,179,427) | | | | | 2,819,179,427 |
| | | | | | | | | | |
|
|
| | | |
Total Investments In Securities
(Cost $2,819,179,427)* | | 100.09 | % | | | | $ | 2,819,179,427 | |
| | | |
Other Assets And Liabilities, Net | | (0.09 | ) | | | | | (2,642,306 | ) |
| | |
|
| | | |
|
|
|
| Total Net Assets | | 100.00 | % | | | | $ | 2,816,537,121 | |
| | |
|
| | | |
|
|
|
| * | | Cost for federal income tax purposes is substantially the same as for financial reporting purposes. |
The accompanying notes are an integral part of these financial statements.
45
| WELLSFARGOMONEYMARKETFUNDS | | STATEMENTSOFASSETSANDLIABILITIES — SEPTEMBER 30, 2003 (UNAUDITED) |
|
| | | California Tax-Free
Money Market Fund | | | Government
Money Market Fund |
|
| | |
ASSETS | | | | | | | |
| | |
INVESTMENTS: | | | | | | | |
In securities, at amortized cost | | $ | 2,507,136,270 | | | $ | 4,852,912,495 |
Repurchase Agreements, at cost | | | 0 | | | | 1,418,596,000 |
| | |
|
|
| |
|
|
TOTALINSECURITIES,ATMARKETVALUE | | $ | 2,507,136,270 | | | $ | 6,271,508,495 |
| | |
|
|
| |
|
|
Cash | | | 84,295 | | | | 50,931 |
Receivable for dividends and interest and other receivables | | | 6,162,180 | | | | 16,641,031 |
Receivable for investments sold | | | 0 | | | | 0 |
Receivable for Fund shares issued | | | 0 | | | | 63 |
| | |
|
|
| |
|
|
TOTALASSETS | | | 2,513,382,745 | | | | 6,288,200,520 |
| | |
|
|
| |
|
|
| | |
LIABILITIES | | | | | | | |
Payable for investment purchased | | | 0 | | | | 47,305,371 |
Dividends Payable | | | 660,549 | | | | 3,262,290 |
Payable for investment adviser and affiliates (Note 3) | | | 857,401 | | | | 1,540,755 |
Payable to other related parties(1) | | | 466,118 | | | | 1,121,981 |
Accrued expenses and other liabilities | | | 415,536 | | | | 583,230 |
| | |
|
|
| |
|
|
TOTALLIABILITIES | | | 2,399,604 | | | | 53,813,627 |
| | |
|
|
| |
|
|
TOTALNETASSETS | | $ | 2,510,983,141 | | | $ | 6,234,386,893 |
| | |
|
|
| |
|
|
| | |
NETASSETSCONSISTOF: | | | | | | | |
|
Paid-in capital | | $ | 2,510,879,273 | | | $ | 6,234,347,826 |
Undistributed (overdistributed) net investment income | | | (985 | ) | | | 0 |
Undistributed net realized gain (loss) on investments | | | 104,853 | | | | 39,067 |
| | |
|
|
| |
|
|
TOTALNETASSETS | | $ | 2,510,983,141 | | | $ | 6,234,386,893 |
| | |
|
|
| |
|
|
|
COMPUTATIONOFNETASSETVALUEANDOFFERINGPRICEPERSHARE |
|
Net assets – Class A | | $ | 2,150,426,574 | | | $ | 273,483,973 |
Shares outstanding – Class A | | | 2,150,286,647 | | | | 273,482,477 |
Net asset value and offering price per share – Class A | | $ | 1.00 | | | $ | 1.00 |
Net Assets – Class B | | | N/A | | | | N/A |
Shares outstanding – Class B | | | N/A | | | | N/A |
Net asset value and offering price per share – Class B | | | N/A | | | | N/A |
Net Assets – Administrator Class | | | N/A | | | $ | 14,806,451 |
Shares outstanding – Administrator Class | | | N/A | | | | 14,806,453 |
Net asset value and offering price per share – Administrator Class | | | N/A | | | $ | 1.00 |
Net Assets – Institutional Class | | | N/A | | | $ | 968,869,582 |
Shares outstanding – Institutional Class | | | N/A | | | | 968,869,990 |
Net asset value and offering price per share – Institutional Class | | | N/A | | | $ | 1.00 |
Net Assets – Service Class | | $ | 360,556,567 | | | $ | 4,977,226,887 |
Shares outstanding – Service Class | | | 360,540,082 | | | | 4,977,206,287 |
Net asset value and offering price per share – Service Class | | $ | 1.00 | | | $ | 1.00 |
| | |
|
|
| |
|
|
| (1) | | Other related parties include the Funds’ trustees and distributor. |
The accompanying notes are an integral part of these financial statements.
46
STATEMENTSOFASSETSANDLIABILITIES — SEPTEMBER 30, 2003 (UNAUDITED) | | WELLSFARGOMONEYMARKETFUNDS |
|
Minnesota Money
Market Fund | | | Money Market Fund | | National Tax-Free
Money Market Fund | | | Treasury Plus
Money Market Fund | | | 100% Treasury
Money Market Fund |
|
| | | | |
| | | | | | | | | | | | | | | | | |
| | | | |
| | | | | | | | | | | | | | | | | |
| $ | 123,294,430 | | | $ | 7,444,967,577 | | $ | 1,987,689,059 | | | $ | 3,052,300,308 | | | $ | 2,819,179,427 |
| | 0 | | | | 423,731,000 | | | 0 | | | | 2,459,705,000 | | | | 0 |
|
|
| |
|
| |
|
|
| |
|
|
| |
|
|
| $ | 123,294,430 | | | $ | 7,868,698,577 | | $ | 1,987,689,059 | | | $ | 5,512,005,308 | | | $ | 2,819,179,427 |
|
|
| |
|
| |
|
|
| |
|
|
| |
|
|
| | 53,740 | | | | 50,734 | | | 108,429 | | | | 100,580 | | | | 50,425 |
| | 371,147 | | | | 6,379,539 | | | 5,815,611 | | | | 10,685,513 | | | | 0 |
| | 0 | | | | 10,000,000 | | | 0 | | | | 0 | | | | 0 |
| | 0 | | | | 31,334 | | | 0 | | | | 86,185 | | | | 350 |
|
|
| |
|
| |
|
|
| |
|
|
| |
|
|
| | 123,719,317 | | | | 7,885,160,184 | | | 1,993,613,099 | | | | 5,522,877,586 | | | | 2,819,230,202 |
|
|
| |
|
| |
|
|
| |
|
|
| |
|
|
| | | | |
| | | | | | | | | | | | | | | | | |
| | 0 | | | | 0 | | | 0 | | | | 0 | | | | 0 |
| | 24,061 | | | | 1,930,048 | | | 866,474 | | | | 2,306,957 | | | | 1,035,097 |
| | 51,580 | | | | 3,988,061 | | | 450,023 | | | | 1,247,009 | | | | 1,138,590 |
| | 27,987 | | | | 2,731,009 | | | 410,644 | | | | 730,147 | | | | 43,875 |
| | 88,802 | | | | 810,931 | | | 314,126 | | | | 147,879 | | | | 475,519 |
|
|
| |
|
| |
|
|
| |
|
|
| |
|
|
| | 192,430 | | | | 9,460,049 | | | 2,041,267 | | | | 4,431,992 | | | | 2,693,081 |
|
|
| |
|
| |
|
|
| |
|
|
| |
|
|
| $ | 123,526,887 | | | $ | 7,875,700,135 | | $ | 1,991,571,832 | | | $ | 5,518,445,594 | | | $ | 2,816,537,121 |
|
|
| |
|
| |
|
|
| |
|
|
| |
|
|
| | | | |
| | | | | | | | | | | | | | | | | |
|
| $ | 123,527,188 | | | $ | 7,875,697,126 | | $ | 1,991,585,299 | | | $ | 5,518,444,558 | | | $ | 2,816,449,796 |
| | 0 | | | | 0 | | | (6 | ) | | | (4,294 | ) | | | 40,624 |
| | (301 | ) | | | 3,009 | | | (13,461 | ) | | | 5,330 | | | | 46,701 |
|
|
| |
|
| |
|
|
| |
|
|
| |
|
|
| $ | 123,526,887 | | | $ | 7,875,700,135 | | $ | 1,991,571,832 | | | $ | 5,518,445,594 | | | $ | 2,816,537,121 |
|
|
| |
|
| |
|
|
| |
|
|
| |
|
|
| | | | |
| | | | | | | | | | | | | | | | | |
|
| $ | 123,526,887 | | | $ | 6,104,261,289 | | $ | 632,485,592 | | | $ | 2,323,852,961 | | | $ | 191,783,693 |
| | 123,526,961 | | | | 6,103,676,825 | | | 632,471,298 | | | | 2,323,899,039 | | | | 191,746,365 |
| $ | 1.00 | | | $ | 1.00 | | $ | 1.00 | | | $ | 1.00 | | | $ | 1.00 |
| | N/A | | | $ | 1,771,438,846 | | | N/A | | | | N/A | | | | N/A |
| | N/A | | | | 1,771,342,431 | | | N/A | | | | N/A | | | | N/A |
| | N/A | | | $ | 1.00 | | | N/A | | | | N/A | | | | N/A |
| | N/A | | | | N/A | | | N/A | | | | N/A | | | | N/A |
| | N/A | | | | N/A | | | N/A | | | | N/A | | | | N/A |
| | N/A | | | | N/A | | | N/A | | | | N/A | | | | N/A |
| | N/A | | | | N/A | | $ | 90,589,199 | | | $ | 1,879,358,151 | | | | N/A |
| | N/A | | | | N/A | | | 90,591,084 | | | | 1,879,526,164 | | | | N/A |
| | N/A | | | | N/A | | $ | 1.00 | | | $ | 1.00 | | | | N/A |
| | N/A | | | | N/A | | $ | 1,268,497,041 | | | $ | 1,315,234,482 | | | $ | 2,624,753,428 |
| | N/A | | | | N/A | | | 1,268,365,116 | | | | 1,315,235,617 | | | | 2,624,708,332 |
| | N/A | | | | N/A | | $ | 1.00 | | | $ | 1.00 | | | $ | 1.00 |
|
|
| |
|
| |
|
|
| |
|
|
| |
|
|
47
WELLSFARGOMONEYMARKETFUNDS | | STATEMENTSOFOPERATIONS — FORTHESIXMONTHSENDEDSEPTEMBER 30, 2003 (UNAUDITED) |
|
| | | California Tax-Free
Money Market Fund | | | Government
Money Market Fund | |
|
| | |
INVESTMENTINCOME | | | | | | | | |
Interest | | $ | 13,132,644 | | | $ | 35,017,807 | |
| | |
|
|
| |
|
|
|
TOTALINVESTMENTINCOME | | | 13,132,644 | | | | 35,017,807 | |
| | |
|
|
| |
|
|
|
| | |
NETEXPENSES | | | | | | | | |
Advisory fees | | | 3,845,501 | | | | 7,434,465 | |
Custody | | | 256,366 | | | | 589,997 | |
Shareholder servicing fees | | | 2,821,235 | | | | 2,636,615 | |
Portfolio accounting fees | | | 83,091 | | | | 65,175 | |
Administration fees | | | | | | | | |
Class A | | | 3,047,016 | | | | 357,649 | |
Class B | | | N/A | | | | N/A | |
Admininstrator Class | | | N/A | | | | 6,321 | |
Institutional Class | | | N/A | | | | 216,795 | |
Service Class | | | 260,597 | | | | 4,499,135 | |
Distribution fees | | | | | | | | |
Class B | | | N/A | | | | N/A | |
Legal and audit fees | | | 17,994 | | | | 17,994 | |
Registration fees | | | 48,604 | | | | 32,503 | |
Directors’ fees | | | 3,195 | | | | 3,195 | |
Shareholder reports | | | 46,320 | | | | 64,808 | |
Other | | | 25,697 | | | | 35,921 | |
| | |
|
|
| |
|
|
|
TOTALEXPENSES | | | 10,455,616 | | | | 15,960,573 | |
| | |
|
|
| |
|
|
|
| | |
LESS: | | | | | | | | |
Waived fees and reimbursed expenses | | | (2,408,278 | ) | | | (1,422,929 | ) |
Net expenses | | | 8,047,338 | | | | 14,537,644 | |
| | |
|
|
| |
|
|
|
NETINVESTMENTINCOME (LOSS) | | | 5,085,306 | | | | 20,480,163 | |
| | |
|
|
| |
|
|
|
Net Realized Gain (Loss) from Investments | | | 68,021 | | | | (1,245 | ) |
| | |
|
|
| |
|
|
|
NETINCREASE (DECREASE)INNETASSETSRESULTINGFROMOPERATIONS | | $ | 5,153,327 | | | $ | 20,478,918 | |
| | |
|
|
| |
|
|
|
The accompanying notes are an integral part of these financial statements.
48
STATEMENTSOFOPERATIONS — FORTHESIXMONTHSENDEDSEPTEMBER 30, 2003 (UNAUDITED) | | WELLSFARGOMONEYMARKETFUNDS |
|
Minnesota Money
Market Fund | | | Money Market Fund | | | National Tax-Free
Money Market Fund | | | Treasury Plus
Money Market Fund | | | 100% Treasury
Money Market Fund | |
|
| | | | |
| | | | | | | | | | | | | | | | | | | |
| $ | 756,218 | | | $ | 50,146,810 | | | $ | 9,173,219 | | | $ | 21,631,784 | | | $ | 15,543,433 | |
|
|
| |
|
|
| |
|
|
| |
|
|
| |
|
|
|
| | 756,218 | | | | 50,146,810 | | | | 9,173,219 | | | | 21,631,784 | | | | 15,543,433 | |
|
|
| |
|
|
| |
|
|
| |
|
|
| |
|
|
|
| | | | |
| | | | | | | | | | | | | | | | | | | |
| | 202,863 | | | | 16,476,868 | | | | 849,571 | | | | 1,933,895 | | | | 5,041,604 | |
| | 13,524 | | | | 823,843 | | | | 169,914 | | | | 386,780 | | | | 288,092 | |
| | 169,052 | | | | 10,298,042 | | | | 1,987,059 | | | | 2,689,309 | | | | 265,809 | |
| | 13,881 | | | | 244,822 | | | | 58,452 | | | | 120,259 | | | | 92,133 | |
| | | | | | | | | | | | | | | | | | | |
| | 182,579 | | | | 8,700,469 | | | | 323,165 | | | | 1,106,897 | | | | 287,101 | |
| | N/A | | | | 2,421,418 | | | | N/A | | | | N/A | | | | N/A | |
| | N/A | | | | N/A | | | | N/A | | | | N/A | | | | N/A | |
| | N/A | | | | N/A | | | | 71,135 | | | | 1,115,717 | | | | N/A | |
| | N/A | | | | N/A | | | | 1,147,757 | | | | 1,131,687 | | | | 2,268,002 | |
| | | | | | | | | | | | | | | | | | | |
| | N/A | | | | 6,726,340 | | | | N/A | | | | N/A | | | | N/A | |
| | 14,485 | | | | 20,500 | | | | 12,995 | | | | 17,493 | | | | 14,484 | |
| | 15,959 | | | | 36,480 | | | | 1,745 | | | | 24,809 | | | | 112,922 | |
| | 3,195 | | | | 3,195 | | | | 3,195 | | | | 3,195 | | | | 3,195 | |
| | 2,149 | | | | 42,491 | | | | 13,145 | | | | 36,567 | | | | 41,399 | |
| | 906 | | | | 147,970 | | | | 7,903 | | | | 10,937 | | | | 20,637 | |
|
|
| |
|
|
| |
|
|
| |
|
|
| |
|
|
|
| | 618,593 | | | | 45,942,438 | | | | 4,646,036 | | | | 8,577,545 | | | | 8,435,378 | |
|
|
| |
|
|
| |
|
|
| |
|
|
| |
|
|
|
| | | | |
| | | | | | | | | | | | | | | | | | | |
| | (76,519 | ) | | | (11,681,499 | ) | | | (687,701 | ) | | | (975,279 | ) | | | (1,414,293 | ) |
| | 542,074 | | | | 34,260,939 | | | | 3,958,335 | | | | 7,602,266 | | | | 7,021,085 | |
|
|
| |
|
|
| |
|
|
| |
|
|
| |
|
|
|
| | 214,144 | | | | 15,885,871 | | | | 5,214,884 | | | | 14,029,518 | | | | 8,522,348 | |
|
|
| |
|
|
| |
|
|
| |
|
|
| |
|
|
|
| | 2,718 | | | | 1,453 | | | | (23,078 | ) | | | 5,385 | | | | 46,733 | |
|
|
| |
|
|
| |
|
|
| |
|
|
| |
|
|
|
| $ | 216,862 | | | $ | 15,887,324 | | | $ | 5,191,806 | | | $ | 14,034,903 | | | $ | 8,569,081 | |
|
|
| |
|
|
| |
|
|
| |
|
|
| |
|
|
|
49
| WELLSFARGOMONEYMARKETFUNDS | | STATEMENTSOFCHANGESINNETASSETS |
|
| | | CALIFORNIA TAX-FREE
MONEY MARKET FUND
| |
| | | (Unaudited)
For the
Six Months Ended
September 30, 2003 | | | For the
Year Ended
March 31, 2003 | |
|
| | |
INCREASEINNETASSETS | | | | | | | | |
Beginning net assets | | $ | 2,662,105,499 | | | $ | 2,711,585,081 | |
| | |
OPERATIONS: | | | | | | | | |
Net investment income (loss) | | | 5,085,306 | | | | 19,492,554 | |
Net realized gain (loss) from investments | | | 68,021 | | | | 235,208 | |
| | |
|
|
| |
|
|
|
NETINCREASE (DECREASE)INNETASSETSRESULTINGFROMOPERATIONS | | | 5,153,327 | | | | 19,727,762 | |
| | |
|
|
| |
|
|
|
| | |
Distributions to shareholders: | | | | | | | | |
From net investment income | | | | | | | | |
Class A | | | (4,214,436 | ) | | | (16,873,030 | ) |
Class B | | | N/A | | | | N/A | |
Administrator Class | | | N/A | | | | N/A | |
Institutional Class | | | N/A | | | | N/A | |
Service Class | | | (870,870 | ) | | | (2,620,509 | ) |
From net realized gain on sales of investments | | | | | | | | |
Class A | | | 0 | | | | (115,803 | ) |
Class B | | | N/A | | | | N/A | |
Administrator Class | | | N/A | | | | N/A | |
Institutional Class | | | N/A | | | | N/A | |
Service Class | | | 0 | | | | (15,435 | ) |
Capital shares transactions: | | | | | | | | |
Proceeds from shares sold – Class A | | | 1,673,362,214 | | | | 2,886,230,813 | |
Reinvestment of dividends – Class A | | | 4,052,401 | | | | 14,022,246 | |
Cost of shares redeemed – Class A | | | (1,884,804,325 | ) | | | (2,991,380,111 | ) |
| | |
|
|
| |
|
|
|
| | |
NETINCREASE (DECREASE)INNETASSETSRESULTINGFROMCAPITAL
SHARETRANSACTIONS –CLASSA | | | (207,389,710 | ) | | | (91,127,052 | ) |
| | |
|
|
| |
|
|
|
Proceeds from shares sold – Class B | | | N/A | | | | N/A | |
Reinvestment of dividends – Class B | | | N/A | | | | N/A | |
Cost of shares redeemed – Class B | | | N/A | | | | N/A | |
| | |
|
|
| |
|
|
|
| | |
NETINCREASE (DECREASE)INNETASSETSRESULTINGFROMCAPITAL
SHARETRANSACTIONS –CLASSB | | | N/A | | | | N/A | |
| | |
|
|
| |
|
|
|
Proceeds from shares sold – Administrator Class | | | N/A | | | | N/A | |
Reinvestment of dividends – Administrator Class | | | N/A | | | | N/A | |
Cost of shares redeemed – Administrator Class | | | N/A | | | | N/A | |
| | |
|
|
| |
|
|
|
| | |
NETINCREASE (DECREASE)INNETASSETSRESULTINGFROMCAPITAL
SHARETRANSACTIONS –ADMINISTRATORCLASS | | | N/A | | | | N/A | |
| | |
|
|
| |
|
|
|
Proceeds from shares sold – Institutional Class | | | N/A | | | | N/A | |
Reinvestment of dividends – Institutional Class | | | N/A | | | | N/A | |
Cost of shares redeemed – Institutional Class | | | N/A | | | | N/A | |
| | |
|
|
| |
|
|
|
| | |
NETINCREASE (DECREASE)INNETASSETSRESULTINGFROMCAPITAL
SHARETRANSACTIONS –INSTITUTIONALCLASS | | | N/A | | | | N/A | |
| | |
|
|
| |
|
|
|
Proceeds from shares sold – Service Class | | | 379,355,098 | | | | 476,426,238 | |
Reinvestment of dividends – Service Class | | | 778,860 | | | | 2,314,388 | |
Cost of shares redeemed – Service Class | | | (323,934,627 | ) | | | (437,196,141 | ) |
| | |
|
|
| |
|
|
|
| | |
NETINCREASE (DECREASE)INNETASSETSRESULTINGFROMCAPITAL
SHARETRANSACTIONS –SERVICECLASS | | | 56,199,331 | | | | 41,544,485 | |
| | |
|
|
| |
|
|
|
NETINCREASE (DECREASE)INNETASSETS | | | (151,122,358 | ) | | | (49,479,582 | ) |
| | |
|
|
| |
|
|
|
| | |
NETASSETS: | | | | | | | | |
|
| | |
ENDINGNETASSETS | | $ | 2,510,983,141 | | | $ | 2,662,105,499 | |
| | |
Shares Issued and Redeemed: | | | | | | | | |
Shares sold – Class A | | | 1,673,362,214 | | | | 2,886,241,038 | |
Shares issued in reinvestment of dividends – Class A | | | 4,052,401 | | | | 14,022,246 | |
Shares redeemed – Class A | | | (1,884,804,325 | ) | | | (2,991,380,110 | ) |
| | |
|
|
| |
|
|
|
NETINCREASE (DECREASE)INSHARESOUTSTANDING –CLASSA | | | (207,389,710 | ) | | | (91,116,826 | ) |
| | |
|
|
| |
|
|
|
Shares sold – Class B | | | N/A | | | | N/A | |
Shares issued in reinvestment of dividends – Class B | | | N/A | | | | N/A | |
Shares redeemed – Class B | | | N/A | | | | N/A | |
| | |
|
|
| |
|
|
|
NETINCREASE (DECREASE)INSHARESOUTSTANDING –CLASSB | | | N/A | | | | N/A | |
| | |
|
|
| |
|
|
|
Shares sold – Administrator Class | | | N/A | | | | N/A | |
Shares issued in reinvestment of dividends – Administrator Class | | | N/A | | | | N/A | |
Shares redeemed – Administrator Class | | | N/A | | | | N/A | |
| | |
|
|
| |
|
|
|
NETINCREASE (DECREASE)INSHARESOUTSTANDING –ADMINISTRATORCLASS | | | N/A | | | | N/A | |
| | |
|
|
| |
|
|
|
Shares sold – Institutional Class | | | N/A | | | | N/A | |
Shares issued in reinvestment of dividends – Institutional Class | | | N/A | | | | N/A | |
Shares redeemed – Institutional Class | | | N/A | | | | N/A | |
| | |
|
|
| |
|
|
|
NETINCREASE (DECREASE)INSHARESOUTSTANDING –INSTITUTIONALCLASS | | | N/A | | | | N/A | |
| | |
|
|
| |
|
|
|
Shares sold – Service Class | | | 379,355,098 | | | | 476,426,622 | |
Shares issued in reinvestment of dividends – Service Class | | | 778,860 | | | | 2,314,388 | |
Shares redeemed – Service Class | | | (323,934,627 | ) | | | (437,196,140 | ) |
| | |
|
|
| |
|
|
|
NETINCREASE (DECREASE)INSHARESOUTSTANDING –SERVICECLASS | | | 56,199,331 | | | | 41,544,870 | |
| | |
|
|
| |
|
|
|
ENDINGBALANCEOFUNDISTRIBUTEDNETINVESTMENTINCOME | | $ | (985 | ) | | $ | (985 | ) |
| | |
|
|
| |
|
|
|
| (1) | | “Proceeds from shares sold” and “Shares sold” include amounts relating to Fund mergers. See Note 1. |
The accompanying notes are an integral part of these financial statements.
50
STATEMENTSOFCHANGESINNETASSETS | | WELLSFARGOMONEYMARKETFUNDS |
|
GOVERNMENT
MONEYMARKETFUND
| | | MINNESOTA
MONEYMARKETFUND
| | | MONEYMARKETFUND
| |
(Unaudited)
For the
Six Months Ended
September 30, 2003(1) | | | For the
Year Ended
March 31, 2003 | | | (Unaudited)
For the
Six Months Ended
September 30, 2003 | | | For the
Year Ended
March 31, 2003 | | | (Unaudited)
For the
Six Months Ended
September 30, 2003 | | | For the
Year Ended
March 31, 2003 | |
|
| | | | | |
| | | | | | | | | | | | | | | | | | | | | | | |
| $ | 5,083,245,155 | | | $ | 5,896,987,284 | | | $ | 127,192,911 | | | $ | 141,873,237 | | | $ | 8,610,935,861 | | | $ | 10,209,151,148 | |
| | | | | |
| | | | | | | | | | | | | | | | | | | | | | | |
| | 20,480,163 | | | | 65,028,284 | | | | 214,144 | | | | 939,230 | | | | 15,885,871 | | | | 80,414,762 | |
| | (1,245 | ) | | | 460,738 | | | | 2,718 | | | | 206 | | | | 1,453 | | | | 1,556 | |
|
|
| |
|
|
| |
|
|
| |
|
|
| |
|
|
| |
|
|
|
| | 20,478,918 | | | | 65,489,022 | | | | 216,862 | | | | 939,436 | | | | 15,887,324 | | | | 80,416,318 | |
|
|
| |
|
|
| |
|
|
| |
|
|
| |
|
|
| |
|
|
|
| | | | | |
| | | | | | | | | | | | | | | | | | | | | | | |
| | | | | | | | | | | | | | | | | | | | | | | |
| | (627,915 | ) | | | (1,837,311 | ) | | | (214,144 | ) | | | (939,230 | ) | | | (14,685,734 | ) | | | (73,505,975 | ) |
| | N/A | | | | N/A | | | | N/A | | | | N/A | | | | (1,200,137 | ) | | | (6,908,788 | ) |
| | (31,253 | ) | | | N/A | | | | N/A | | | | N/A | | | | N/A | | | | N/A | |
| | (1,486,785 | ) | | | N/A | | | | N/A | | | | N/A | | | | N/A | | | | N/A | |
| | (18,334,210 | ) | | | (63,195,521 | ) | | | N/A | | | | N/A | | | | N/A | | | | N/A | |
| | | | | | | | | | | | | | | | | | | | | | | |
| | 0 | | | | (19,974 | ) | | | 0 | | | | 0 | | | | 0 | | | | 0 | |
| | N/A | | | | N/A | | | | N/A | | | | N/A | | | | 0 | | | | 0 | |
| | 0 | | | | N/A | | | | N/A | | | | N/A | | | | N/A | | | | N/A | |
| | 0 | | | | N/A | | | | N/A | | | | N/A | | | | N/A | | | | N/A | |
| | 0 | | | | (493,768 | ) | | | N/A | | | | N/A | | | | N/A | | | | N/A | |
| | | | | | | | | | | | | | | | | | | | | | | |
| | 180,807,457 | | | | 353,982,022 | | | | 60,308,937 | | | | 163,182,673 | | | | 2,649,516,850 | | | | 5,522,392,625 | |
| | 620,318 | | | | 1,271,123 | | | | 234,581 | | | | 825,557 | | | | 15,658,854 | | | | 66,408,489 | |
| | (153,585,979 | ) | | | (254,182,834 | ) | | | (64,212,260 | ) | | | (178,688,762 | ) | | | (3,289,034,335 | ) | | | (6,696,549,549 | ) |
|
|
| |
|
|
| |
|
|
| |
|
|
| |
|
|
| |
|
|
|
| | | | | |
| | 27,841,796 | | | | 101,070,311 | | | | (3,668,742 | ) | | | (14,680,532 | ) | | | (623,858,631 | ) | | | (1,107,748,435 | ) |
|
|
| |
|
|
| |
|
|
| |
|
|
| |
|
|
| |
|
|
|
| | N/A | | | | N/A | | | | N/A | | | | N/A | | | | 1,178,262,626 | | | | 2,942,273,099 | |
| | N/A | | | | N/A | | | | N/A | | | | N/A | | | | 1,294,778 | | | | 6,654,965 | |
| | N/A | | | | N/A | | | | N/A | | | | N/A | | | | (1,290,935,952 | ) | | | (3,439,396,471 | ) |
|
|
| |
|
|
| |
|
|
| |
|
|
| |
|
|
| |
|
|
|
| | | | | |
| | N/A | | | | N/A | | | | N/A | | | | N/A | | | | (111,378,548 | ) | | | (490,468,407 | ) |
|
|
| |
|
|
| |
|
|
| |
|
|
| |
|
|
| |
|
|
|
| | 44,459,840 | | | | N/A | | | | N/A | | | | N/A | | | | N/A | | | | N/A | |
| | 18,126 | | | | N/A | | | | N/A | | | | N/A | | | | N/A | | | | N/A | |
| | (29,671,513 | ) | | | N/A | | | | N/A | | | | N/A | | | | N/A | | | | N/A | |
|
|
| |
|
|
| |
|
|
| |
|
|
| |
|
|
| |
|
|
|
| | | | | |
| | 14,806,453 | | | | N/A | | | | N/A | | | | N/A | | | | N/A | | | | N/A | |
|
|
| |
|
|
| |
|
|
| |
|
|
| |
|
|
| |
|
|
|
| | 2,576,516,399 | | | | N/A | | | | N/A | | | | N/A | | | | N/A | | | | N/A | |
| | 397,212 | | | | N/A | | | | N/A | | | | N/A | | | | N/A | | | | N/A | |
| | (1,608,043,580 | ) | | | N/A | | | | N/A | | | | N/A | | | | N/A | | | | N/A | |
|
|
| |
|
|
| |
|
|
| |
|
|
| |
|
|
| |
|
|
|
| | | | | |
| | 968,870,031 | | | | N/A | | | | N/A | | | | N/A | | | | N/A | | | | N/A | |
|
|
| |
|
|
| |
|
|
| |
|
|
| |
|
|
| |
|
|
|
| | 20,346,704,515 | | | | 33,705,518,589 | | | | N/A | | | | N/A | | | | N/A | | | | N/A | |
| | 3,805,339 | | | | 10,693,415 | | | | N/A | | | | N/A | | | | N/A | | | | N/A | |
| | (20,210,885,151 | ) | | | (34,630,966,892 | ) | | | N/A | | | | N/A | | | | N/A | | | | N/A | |
|
|
| |
|
|
| |
|
|
| |
|
|
| |
|
|
| |
|
|
|
| | | | | |
| | 139,624,703 | | | | (914,754,888 | ) | | | N/A | | | | N/A | | | | N/A | | | | N/A | |
|
|
| |
|
|
| |
|
|
| |
|
|
| |
|
|
| |
|
|
|
| | 1,151,141,738 | | | | (813,742,129 | ) | | | (3,666,024 | ) | | | (14,680,326 | ) | | | (735,235,726 | ) | | | (1,598,215,287 | ) |
|
|
| |
|
|
| |
|
|
| |
|
|
| |
|
|
| |
|
|
|
| | | | | |
| | | | | | | | | | | | | | | | | | | | | | | |
|
| | | | | |
| $ | 6,234,386,893 | | | $ | 5,083,245,155 | | | $ | 123,526,887 | | | $ | 127,192,911 | | | $ | 7,875,700,135 | | | $ | 8,610,935,861 | |
| | | | | |
| | | | | | | | | | | | | | | | | | | | | | | |
| | 180,807,457 | | | | 353,982,022 | | | | 60,308,937 | | | | 163,182,467 | | | | 2,649,516,850 | | | | 5,522,369,090 | |
| | 620,318 | | | | 1,271,123 | | | | 234,581 | | | | 825,557 | | | | 15,658,854 | | | | 66,408,488 | |
| | (153,585,979 | ) | | | (254,182,684 | ) | | | (64,212,260 | ) | | | (178,688,763 | ) | | | (3,289,034,335 | ) | | | (6,696,549,548 | ) |
|
|
| |
|
|
| |
|
|
| |
|
|
| |
|
|
| |
|
|
|
| | 27,841,796 | | | | 101,070,461 | | | | (3,668,742 | ) | | | (14,680,739 | ) | | | (623,858,631 | ) | | | (1,107,771,970 | ) |
|
|
| |
|
|
| |
|
|
| |
|
|
| |
|
|
| |
|
|
|
| | N/A | | | | N/A | | | | N/A | | | | N/A | | | | 1,178,262,625 | | | | 2,942,265,018 | |
| | N/A | | | | N/A | | | | N/A | | | | N/A | | | | 1,294,779 | | | | 6,654,965 | |
| | N/A | | | | N/A | | | | N/A | | | | N/A | | | | (1,290,935,952 | ) | | | (3,439,396,471 | ) |
|
|
| |
|
|
| |
|
|
| |
|
|
| |
|
|
| |
|
|
|
| | N/A | | | | N/A | | | | N/A | | | | N/A | | | | (111,378,548 | ) | | | (490,476,488 | ) |
|
|
| |
|
|
| |
|
|
| |
|
|
| |
|
|
| |
|
|
|
| | 44,459,840 | | | | N/A | | | | N/A | | | | N/A | | | | N/A | | | | N/A | |
| | 18,126 | | | | N/A | | | | N/A | | | | N/A | | | | N/A | | | | N/A | |
| | (29,671,513 | ) | | | N/A | | | | N/A | | | | N/A | | | | N/A | | | | N/A | |
|
|
| |
|
|
| |
|
|
| |
|
|
| |
|
|
| |
|
|
|
| | 14,806,453 | | | | N/A | | | | N/A | | | | N/A | | | | N/A | | | | N/A | |
|
|
| |
|
|
| |
|
|
| |
|
|
| |
|
|
| |
|
|
|
| | 2,576,516,358 | | | | N/A | | | | N/A | | | | N/A | | | | N/A | | | | N/A | |
| | 397,212 | | | | N/A | | | | N/A | | | | N/A | | | | N/A | | | | N/A | |
| | (1,608,043,580 | ) | | | N/A | | | | N/A | | | | N/A | | | | N/A | | | | N/A | |
|
|
| |
|
|
| |
|
|
| |
|
|
| |
|
|
| |
|
|
|
| | 968,869,990 | | | | N/A | | | | N/A | | | | N/A | | | | N/A | | | | N/A | |
|
|
| |
|
|
| |
|
|
| |
|
|
| |
|
|
| |
|
|
|
| | 20,346,649,202 | | | | 33,705,518,590 | | | | N/A | | | | N/A | | | | N/A | | | | N/A | |
| | 3,805,339 | | | | 10,693,415 | | | | N/A | | | | N/A | | | | N/A | | | | N/A | |
| | (20,210,885,151 | ) | | | (34,630,950,201 | ) | | | N/A | | | | N/A | | | | N/A | | | | N/A | |
|
|
| |
|
|
| |
|
|
| |
|
|
| |
|
|
| |
|
|
|
| | 139,569,390 | | | | (914,738,196 | ) | | | N/A | | | | N/A | | | | N/A | | | | N/A | |
|
|
| |
|
|
| |
|
|
| |
|
|
| |
|
|
| |
|
|
|
| $ | 0 | | | $ | 0 | | | $ | 0 | | | $ | 0 | | | $ | 0 | | | $ | (1 | ) |
|
|
| |
|
|
| |
|
|
| |
|
|
| |
|
|
| |
|
|
|
51
| WELLSFARGOMONEYMARKETFUNDS | | STATEMENTSOFCHANGESINNETASSETS |
|
| | | NATIONALTAX-FREE MONEYMARKETFUND
| |
| | | (Unaudited) For the Six Months Ended September 30, 2003(1) | | | For the Year Ended March 31, 2003 | |
|
| | |
INCREASEINNETASSETS | | | | | | | | |
Beginning net assets | | $ | 1,528,551,557 | | | $ | 1,572,155,033 | |
| | |
OPERATIONS: | | | | | | | | |
Net investment income (loss) | | | 5,214,884 | | | | 16,648,886 | |
Net realized gain (loss) from investments | | | (23,078 | ) | | | 68,020 | |
| | |
|
|
| |
|
|
|
NETINCREASE (DECREASE)INNETASSETSRESULTINGFROMOPERATIONS | | | 5,191,806 | | | | 16,716,906 | |
| | |
|
|
| |
|
|
|
| | |
Distributions to shareholders: | | | | | | | | |
From net investment income | | | | | | | | |
Class A | | | (387,197 | ) | | | N/A | |
Class B | | | N/A | | | | N/A | |
Administrator Class | | | N/A | | | | N/A | |
Institutional Class. | | | (465,324 | ) | | | (1,353,229 | ) |
Service Class | | | (4,362,363 | ) | | | (15,295,663 | ) |
From net realized gain on sales of investments | | | | | | | | |
Class A | | | 0 | | | | N/A | |
Class B | | | N/A | | | | N/A | |
Administrator Class | | | N/A | | | | N/A | |
Institutional Class. | | | 0 | | | | (2,183 | ) |
Service Class | | | 0 | | | | (21,865 | ) |
| | |
Capital shares transactions: | | | | | | | | |
Proceeds from shares sold – Class A | | | 879,954,067 | | | | N/A | |
Reinvestment of dividends – Class A | | | 326,972 | | | | N/A | |
Cost of shares redeemed – Class A | | | (247,789,870 | ) | | | N/A | |
| | |
|
|
| |
|
|
|
| | |
NETINCREASE (DECREASE)INNETASSETSRESULTINGFROMCAPITALSHARETRANSACTIONS –CLASSA | | | 632,491,169 | | | | N/A | |
| | |
|
|
| |
|
|
|
Proceeds from shares sold – Class B | | | N/A | | | | N/A | |
Reinvestment of dividends – Class B | | | N/A | | | | N/A | |
Cost of shares redeemed – Class B | | | N/A | | | | N/A | |
| | |
|
|
| |
|
|
|
| | |
NETINCREASE (DECREASE)INNETASSETSRESULTINGFROMCAPITALSHARETRANSACTIONS –CLASSB | | | N/A | | | | N/A | |
| | |
|
|
| |
|
|
|
Proceeds from shares sold – Administrator Class | | | N/A | | | | N/A | |
Reinvestment of dividends – Administrator Class | | | N/A | | | | N/A | |
Cost of shares redeemed – Administrator Class | | | N/A | | | | N/A | |
| | |
|
|
| |
|
|
|
| | |
NETINCREASE (DECREASE)INNETASSETSRESULTINGFROMCAPITALSHARETRANSACTIONS –ADMINISTRATORCLASS | | | N/A | | | | N/A | |
| | |
|
|
| |
|
|
|
Proceeds from shares sold – Institutional Class | | | 238,644,013 | | | | 767,491,304 | |
Reinvestment of dividends – Institutional Class | | | 194,187 | | | | 264,655 | |
Cost of shares redeemed – Institutional Class | | | (275,216,470 | ) | | | (778,969,274 | ) |
| | |
|
|
| |
|
|
|
| | |
NETINCREASE (DECREASE)INNETASSETSRESULTINGFROMCAPITALSHARETRANSACTIONS –INSTITUTIONALCLASS | | | (36,378,270 | ) | | | (11,213,315 | ) |
| | |
|
|
| |
|
|
|
Proceeds from shares sold – Service Class | | | 1,019,453,611 | | | | 2,254,523,688 | |
Reinvestment of dividends – Service Class | | | 1,548,107 | | | | 4,476,160 | |
Cost of shares redeemed – Service Class | | | (1,154,071,264 | ) | | | (2,291,433,975 | ) |
| | |
|
|
| |
|
|
|
| | |
NETINCREASE (DECREASE)INNETASSETSRESULTINGFROMCAPITALSHARETRANSACTIONS –SERVICECLASS | | | (133,069,546 | ) | | | (32,434,127 | ) |
| | |
|
|
| |
|
|
|
NETINCREASE (DECREASE)INNETASSETS | | | 463,020,275 | | | | (43,603,476 | ) |
| | |
|
|
| |
|
|
|
| | |
NETASSETS: | | | | | | | | |
|
| | |
ENDINGNETASSETS | | $ | 1,991,571,832 | | | $ | 1,528,551,557 | |
| | |
Shares Issued and Redeemed: | | | | | | | | |
Shares sold – Class A | | | 879,934,196 | | | | N/A | |
Shares issued in reinvestment of dividends – Class A | | | 326,972 | | | | N/A | |
Shares redeemed – Class A | | | (247,789,870 | ) | | | N/A | |
| | |
|
|
| |
|
|
|
NETINCREASE (DECREASE)INSHARESOUTSTANDING –CLASSA | | | 632,471,298 | | | | N/A | |
| | |
|
|
| |
|
|
|
Shares sold – Class B | | | N/A | | | | N/A | |
Shares issued in reinvestment of dividends – Class B | | | N/A | | | | N/A | |
Shares redeemed – Class B | | | N/A | | | | N/A | |
| | |
|
|
| |
|
|
|
NETINCREASE (DECREASE)INSHARESOUTSTANDING –CLASSB | | | N/A | | | | N/A | |
| | |
|
|
| |
|
|
|
Shares sold – Administrator Class | | | N/A | | | | N/A | |
Shares issued in reinvestment of dividends – Administrator Class | | | N/A | | | | N/A | |
Shares redeemed – Administrator Class | | | N/A | | | | N/A | |
| | |
|
|
| |
|
|
|
NETINCREASE (DECREASE)INSHARESOUTSTANDING –ADMINISTRATORCLASS | | | N/A | | | | N/A | |
| | |
|
|
| |
|
|
|
Shares sold – Institutional Class | | | 238,644,013 | | | | 767,490,685 | |
Shares issued in reinvestment of dividends – Institutional Class | | | 194,187 | | | | 264,655 | |
Shares redeemed – Institutional Class | | | (275,216,470 | ) | | | (778,969,273 | ) |
| | |
|
|
| |
|
|
|
NETINCREASE (DECREASE)INSHARESOUTSTANDING –INSTITUTIONALCLASS | | | (36,378,270 | ) | | | (11,213,933 | ) |
| | |
|
|
| |
|
|
|
Shares sold – Service Class | | | 1,019,453,610 | | | | 2,254,515,379 | |
Shares issued in reinvestment of dividends – Service Class | | | 1,548,107 | | | | 4,476,160 | |
Shares redeemed – Service Class | | | (1,154,071,264 | ) | | | (2,291,433,975 | ) |
| | |
|
|
| |
|
|
|
NETINCREASE (DECREASE)INSHARESOUTSTANDING –SERVICECLASS | | | (133,069,547 | ) | | | (32,442,436 | ) |
| | |
|
|
| |
|
|
|
ENDINGBALANCEOFUNDISTRIBUTEDNETINVESTMENTINCOME | | $ | (6 | ) | | $ | (6 | ) |
| | |
|
|
| |
|
|
|
| (1) | | “Proceeds from shares sold” and “Shares sold” include amounts relating to Fund mergers. See Note 1. |
The accompanying notes are an integral part of these financial statements.
52
STATEMENTSOFCHANGESINNETASSETS | | WELLSFARGOMONEYMARKETFUNDS |
|
TREASURYPLUS MONEYMARKETFUND
| | | 100%TREASURY MONEYMARKETFUND
| |
| (Unaudited) | | | | | | (Unaudited) | | | | |
For the Six Months Ended September 30, 2003(1) | | | For the Year Ended March 31, 2003 | | | For the Six Months Ended September 30, 2003 | | | For the Year Ended March 31, 2003 | |
|
| | | |
| | | | | | | | | | | | | | | |
| $ | 2,773,473,140 | | | $ | 2,063,967,798 | | | $ | 2,934,927,382 | | | $ | 2,663,835,087 | |
| | | |
| | | | | | | | | | | | | | | |
| | 14,029,518 | | | | 29,681,374 | | | | 8,522,348 | | | | 31,326,676 | |
| | 5,385 | | | | 11,432 | | | | 46,733 | | | | 109,493 | |
|
|
| |
|
|
| |
|
|
| |
|
|
|
| | 14,034,903 | | | | 29,692,806 | | | | 8,569,081 | | | | 31,436,169 | |
|
|
| |
|
|
| |
|
|
| |
|
|
|
| | | |
| | | | | | | | | | | | | | | |
| | | | | | | | | | | | | | | |
| | (1,615,024 | ) | | | N/A | | | | (454,040 | ) | | | (1,614,815 | ) |
| | N/A | | | | N/A | | | | N/A | | | | N/A | |
| | N/A | | | | N/A | | | | N/A | | | | N/A | |
| | (7,974,558 | ) | | | (16,390,043 | ) | | | N/A | | | | N/A | |
| | (4,439,936 | ) | | | (13,291,330 | ) | | | (8,068,308 | ) | | | (30,020,000 | ) |
| | | | | | | | | | | | | | | |
| | 0 | | | | N/A | | | | 0 | | | | (3,104 | ) |
| | N/A | | | | N/A | | | | N/A | | | | N/A | |
| | N/A | | | | N/A | | | | N/A | | | | N/A | |
| | 0 | | | | (46,882 | ) | | | N/A | | | | N/A | |
| | 0 | | | | (38,008 | ) | | | 0 | | | | (50,042 | ) |
| | | |
| | | | | | | | | | | | | | | |
| | 3,976,187,061 | | | | N/A | | | | 255,912,755 | | | | 409,695,186 | |
| | 403,454 | | | | N/A | | | | 488,980 | | | | 1,510,309 | |
| | (1,652,737,555 | ) | | | N/A | | | | (273,906,261 | ) | | | (363,853,473 | ) |
|
|
| |
|
|
| |
|
|
| |
|
|
|
| | | |
| | 2,323,852,960 | | | | N/A | | | | (17,504,526 | ) | | | 47,352,022 | |
|
|
| |
|
|
| |
|
|
| |
|
|
|
| | N/A | | | | N/A | | | | N/A | | | | N/A | |
| | N/A | | | | N/A | | | | N/A | | | | N/A | |
| | N/A | | | | N/A | | | | N/A | | | | N/A | |
|
|
| |
|
|
| |
|
|
| |
|
|
|
| | | |
| | N/A | | | | N/A | | | | N/A | | | | N/A | |
|
|
| |
|
|
| |
|
|
| |
|
|
|
| | N/A | | | | N/A | | | | N/A | | | | N/A | |
| | N/A | | | | N/A | | | | N/A | | | | N/A | |
| | N/A | | | | N/A | | | | N/A | | | | N/A | |
|
|
| |
|
|
| |
|
|
| |
|
|
|
| | | |
| N/A | | | | N/A | | | | N/A | | | | N/A | |
|
|
| |
|
|
| |
|
|
| |
|
|
|
| | 34,811,584,390 | | | | 113,558,849,495 | | | | N/A | | | | N/A | |
| | 1,045,828 | | | | 2,509,244 | | | | N/A | | | | N/A | |
| | (34,499,139,159 | ) | | | (112,901,219,091 | ) | | | N/A | | | | N/A | |
|
|
| |
|
|
| |
|
|
| |
|
|
|
| | | |
| | 313,491,059 | | | | 660,139,648 | | | | N/A | | | | N/A | |
|
|
| |
|
|
| |
|
|
| |
|
|
|
| | 7,096,880,635 | | | | 10,808,760,558 | | | | 8,080,684,352 | | | | 15,915,545,320 | |
| | 1,044,301 | | | | 2,257,836 | | | | 1,742,247 | | | | 6,217,119 | |
| | (6,990,301,886 | ) | | | (10,761,579,243 | ) | | | (8,183,359,067 | ) | | | (15,697,770,374 | ) |
|
|
| |
|
|
| |
|
|
| |
|
|
|
| | | |
| | 107,623,050 | | | | 49,439,151 | | | | (100,932,468 | ) | | | 223,992,065 | |
|
|
| |
|
|
| |
|
|
| |
|
|
|
| | 2,744,972,454 | | | | 709,505,342 | | | | (118,390,261 | ) | | | 271,092,295 | |
|
|
| |
|
|
| |
|
|
| |
|
|
|
| | | |
| | | | | | | | | | | | | | | |
|
| | | |
| $ | 5,518,445,594 | | | $ | 2,773,473,140 | | | $ | 2,816,537,121 | | | $ | 2,934,927,382 | |
| | | |
| | | | | | | | | | | | | | | |
| | 3,976,233,141 | | | | N/A | | | | 255,912,755 | | | | 409,695,186 | |
| | 403,454 | | | | N/A | | | | 488,980 | | | | 1,510,309 | |
| | (1,652,737,555 | ) | | | N/A | | | | (273,906,261 | ) | | | (363,852,531 | ) |
|
|
| |
|
|
| |
|
|
| |
|
|
|
| | 2,323,899,040 | | | | N/A | | | | (17,504,526 | ) | | | 47,352,964 | |
|
|
| |
|
|
| |
|
|
| |
|
|
|
| | N/A | | | | N/A | | | | N/A | | | | N/A | |
| | N/A | | | | N/A | | | | N/A | | | | N/A | |
| | N/A | | | | N/A | | | | N/A | | | | N/A | |
|
|
| |
|
|
| |
|
|
| |
|
|
|
| | N/A | | | | N/A | | | | N/A | | | | N/A | |
|
|
| |
|
|
| |
|
|
| |
|
|
|
| | N/A | | | | N/A | | | | N/A | | | | N/A | |
| | N/A | | | | N/A | | | | N/A | | | | N/A | |
| | N/A | | | | N/A | | | | N/A | | | | N/A | |
|
|
| |
|
|
| |
|
|
| |
|
|
|
| | N/A | | | | N/A | | | | N/A | | | | N/A | |
|
|
| |
|
|
| |
|
|
| |
|
|
|
| | 34,811,584,390 | | | | 113,558,849,494 | | | | N/A | | | | N/A | |
| | 1,045,828 | | | | 2,509,243 | | | | N/A | | | | N/A | |
| | (34,499,139,159 | ) | | | (112,901,208,629 | ) | | | N/A | | | | N/A | |
|
|
| |
|
|
| |
|
|
| |
|
|
|
| | 313,491,059 | | | | 660,150,108 | | | | N/A | | | | N/A | |
|
|
| |
|
|
| |
|
|
| |
|
|
|
| | 7,096,880,635 | | | | 10,808,760,561 | | | | 8,080,684,352 | | | | 15,915,545,320 | |
| | 1,044,301 | | | | 2,257,835 | | | | 1,742,247 | | | | 6,217,119 | |
| | (6,990,301,886 | ) | | | (10,761,560,441 | ) | | | (8,183,359,067 | ) | | | (15,697,765,127 | ) |
|
|
| |
|
|
| |
|
|
| |
|
|
|
| | 107,623,050 | | | | 49,457,955 | | | | (100,932,468 | ) | | | 223,997,312 | |
|
|
| |
|
|
| |
|
|
| |
|
|
|
| $ | (4,294 | ) | | $ | (4,294 | ) | | $ | 40,624 | | | $ | 40,624 | |
|
|
| |
|
|
| |
|
|
| |
|
|
|
53
| WELLSFARGOMONEYMARKETFUNDS | | FINANCIALHIGHLIGHTS |
|
| | | Beginning
Net Asset
Value Per
Share | | Net
Investment
Income | | Net Realized
and
Unrealized
Gain (Loss) on
Investments | | | Dividends
From Net
Investment
Income | |
|
| | | | |
CALIFORNIATAX-FREEMONEYMARKETFUND | | | | | | | | | | | |
| | | | |
CLASSA | | | | | | | | | | | |
April 1, 2003 to September 30, 2003 (Unaudited) | | $ | 1.00 | | 0.00 | | 0.00 | | | 0.00 | |
April 1, 2002 to March 31, 2003 | | $ | 1.00 | | 0.01 | | 0.00 | | | (0.01 | ) |
April 1, 2001 to March 31, 2002 | | $ | 1.00 | | 0.02 | | 0.00 | | | (0.02 | ) |
April 1, 2000 to March 31, 2001 | | $ | 1.00 | | 0.03 | | 0.00 | | | (0.03 | ) |
April 1, 1999 to March 31, 2000 | | $ | 1.00 | | 0.02 | | 0.00 | | | (0.02 | ) |
April 1, 1998 to March 31, 1999 | | $ | 1.00 | | 0.02 | | 0.00 | | | (0.02 | ) |
| | | | |
GOVERNMENTMONEYMARKETFUND | | | | | | | | | | | |
|
| | | | |
CLASSA | | | | | | | | | | | |
April 1, 2003 to September 30, 2003 (Unaudited) | | $ | 1.00 | | 0.00 | | 0.00 | | | 0.00 | |
April 1, 2002 to March 31, 2003 | | $ | 1.00 | | 0.01 | | 0.00 | | | (0.01 | ) |
April 1, 2001 to March 31, 2002 | | $ | 1.00 | | 0.03 | | 0.00 | | | (0.03 | ) |
April 1, 2000 to March 31, 2001 | | $ | 1.00 | | 0.06 | | 0.00 | | | (0.06 | ) |
November 8, 1999(3) to March 31, 2000 | | $ | 1.00 | | 0.02 | | 0.00 | | | (0.02 | ) |
| | | | |
MINNESOTAMONEYMARKETFUND | | | | | | | | | | | |
|
| | | | |
CLASSA | | | | | | | | | | | |
April 1, 2003 to September 30, 2003 (Unaudited) | | $ | 1.00 | | 0.00 | | 0.00 | | | (0.00 | ) |
April 1, 2002 to March 31, 2003 | | $ | 1.00 | | 0.01 | | 0.00 | | | (0.01 | ) |
April 1, 2001 to March 31, 2002 | | $ | 1.00 | | 0.02 | | 0.00 | | | (0.02 | ) |
August 14, 2000(3) to March 31, 2001 | | $ | 1.00 | | 0.02 | | 0.00 | | | (0.02 | ) |
| | | | |
MONEYMARKETFUND | | | | | | | | | | | |
|
| | | | |
CLASSA | | | | | | | | | | | |
April 1, 2003 to September 30, 2003 (Unaudited) | | $ | 1.00 | | 0.00 | | (0.00 | ) | | (0.00 | ) |
April 1, 2002 to March 31, 2003 | | $ | 1.00 | | 0.01 | | (0.00 | ) | | (0.01 | ) |
April 1, 2001 to March 31, 2002 | | $ | 1.00 | | 0.03 | | 0.00 | | | (0.03 | ) |
April 1, 2000 to March 31, 2001 | | $ | 1.00 | | 0.06 | | 0.00 | | | (0.06 | ) |
April 1, 1999 to March 31, 2000 | | $ | 1.00 | | 0.05 | | 0.00 | | | (0.05 | ) |
April 1, 1998 to March 31, 1999 | | $ | 1.00 | | 0.05 | | 0.00 | | | (0.05 | ) |
| | | | |
CLASSB | | | | | | | | | | | |
April 1, 2003 to September 30, 2003 (Unaudited) | | $ | 1.00 | | 0.00 | | 0.00 | | | (0.00 | ) |
April 1, 2002 to March 31, 2003 | | $ | 1.00 | | 0.00 | | 0.00 | | | (0.00 | ) |
April 1, 2001 to March 31, 2002 | | $ | 1.00 | | 0.02 | | 0.00 | | | (0.02 | ) |
April 1, 2000 to March 31, 2001 | | $ | 1.00 | | 0.05 | | 0.00 | | | (0.05 | ) |
April 1, 1999 to March 31, 2000(4) | | $ | 1.00 | | 0.04 | | 0.00 | | | (0.04 | ) |
April 1, 1998 to March 31, 1999 | | $ | 1.00 | | 0.04 | | 0.00 | | | (0.04 | ) |
| | | | |
NATIONALTAX-FREEMONEYMARKETFUND | | | | | | | | | | | |
|
| | | | |
CLASSA | | | | | | | | | | | |
July 28, 2003(3) to September 30, 2003 (Unaudited) | | $ | 1.00 | | 0.00 | | (0.00 | ) | | (0.00 | ) |
| | | | |
TREASURYPLUSMONEYMARKETFUND | | | | | | | | | | | |
|
| | | | |
CLASSA | | | | | | | | | | | |
July 28, 2003(3) to September 30, 2003 (Unaudited) | | $ | 1.00 | | 0.00 | | 0.00 | | | (0.00 | ) |
| | | | |
100%TREASURYMONEYMARKETFUND | | | | | | | | | | | |
|
| | | | |
CLASSA | | | | | | | | | | | |
April 1, 2003 to September 30, 2003 (Unaudited) | | $ | 1.00 | | 0.00 | | (0.00 | ) | | (0.00 | ) |
April 1, 2002 to March 31, 2003 | | $ | 1.00 | | 0.01 | | 0.00 | | | (0.01 | ) |
April 1, 2001 to March 31, 2002 | | $ | 1.00 | | 0.02 | | 0.00 | | | (0.02 | ) |
April 1, 2000 to March 31, 2001 | | $ | 1.00 | | 0.05 | | 0.00 | | | (0.05 | ) |
November 8, 1999(3) to March 31, 2000 | | $ | 1.00 | | 0.02 | | 0.00 | | | (0.02 | ) |
The accompanying notes are an integral part of these financial statements.
54
FINANCIALHIGHLIGHTS | | WELLSFARGOMONEYMARKETFUNDS |
|
| | | | |
Distributions
From Net
Realized
Gains | | | Ending
Net Asset
Value Per
Share | | Ratio to Average Net Assets (Annualized)(1)
| | Total
Return(2) | | Net Assets at
End of Period
(000’s
omitted) |
| | | Net Investment
Income | | Net
Expenses | | Gross
Expenses | | |
|
| | | | | | |
| | | | | | | | | | | | | | | | |
| | | | | | |
| | | | | | | | | | | | | | | | |
| 0.00 | | | $ | 1.00 | | 0.37% | | 0.65% | | 0.86% | | 0.19% | | $ | 2,150,427 |
| (0.00 | ) | | $ | 1.00 | | 0.72% | | 0.65% | | 0.77% | | 0.73% | | $ | 2,357,684 |
| 0.00 | | | $ | 1.00 | | 1.52% | | 0.65% | | 0.77% | | 1.54% | | $ | 2,448,719 |
| 0.00 | | | $ | 1.00 | | 2.93% | | 0.65% | | 0.77% | | 2.99% | | $ | 2,528,345 |
| 0.00 | | | $ | 1.00 | | 2.48% | | 0.65% | | 0.96% | | 2.51% | | $ | 2,464,890 |
| 0.00 | | | $ | 1.00 | | 2.46% | | 0.65% | | 1.03% | | 2.49% | | $ | 2,246,123 |
| | | | | | |
| | | | | | | | | | | | | | | | |
|
| | | | | | |
| | | | | | | | | | | | | | | | |
| 0.00 | | | $ | 1.00 | | 0.47% | | 0.71% | | 0.80% | | 0.24% | | $ | 273,484 |
| (0.00 | ) | | $ | 1.00 | | 0.97% | | 0.75% | | 0.81% | | 1.02% | | $ | 245,642 |
| 0.00 | | | $ | 1.00 | | 2.33% | | 0.75% | | 1.00% | | 2.60% | | $ | 144,577 |
| 0.00 | | | $ | 1.00 | | 5.69% | | 0.75% | | 0.81% | | 5.70% | | $ | 72,460 |
| 0.00 | | | $ | 1.00 | | 4.99% | | 0.75% | | 0.81% | | 1.99% | | $ | 58,960 |
| | | | | | |
| | | | | | | | | | | | | | | | |
|
| | | | | | |
| | | | | | | | | | | | | | | | |
| 0.00 | | | $ | 1.00 | | 0.32% | | 0.80% | | 0.91% | | 0.16% | | $ | 123,527 |
| 0.00 | | | $ | 1.00 | | 0.72% | | 0.80% | | 0.83% | | 0.73% | | $ | 127,193 |
| 0.00 | | | $ | 1.00 | | 1.65% | | 0.80% | | 0.83% | | 1.75% | | $ | 141,873 |
| 0.00 | | | $ | 1.00 | | 2.03% | | 0.51% | | 0.56% | | 2.07% | | $ | 113,871 |
| | | | | | |
| | | | | | | | | | | | | | | | |
|
| | | | | | |
| | | | | | | | | | | | | | | | |
| 0.00 | | | $ | 1.00 | | 0.45% | | 0.76% | | 0.95% | | 0.23% | | $ | 6,104,261 |
| 0.00 | | | $ | 1.00 | | 1.01% | | 0.76% | | 0.97% | | 1.01% | | $ | 6,728,119 |
| 0.00 | | | $ | 1.00 | | 2.58% | | 0.76% | | 0.97% | | 2.54% | | $ | 7,835,864 |
| 0.00 | | | $ | 1.00 | | 5.60% | | 0.76% | | 0.95% | | 5.77% | | $ | 14,406,458 |
| 0.00 | | | $ | 1.00 | | 4.78% | | 0.75% | | 1.01% | | 4.84% | | $ | 13,441,754 |
| 0.00 | | | $ | 1.00 | | 4.67% | | 0.75% | | 0.93% | | 4.79% | | $ | 9,137,812 |
| | | | | | |
| | | | | | | | | | | | | | | | |
| 0.00 | | | $ | 1.00 | | 0.13% | | 1.08% | | 1.70% | | 0.07% | | $ | 1,771,439 |
| 0.00 | | | $ | 1.00 | | 0.32% | | 1.46% | | 1.61% | | 0.31% | | $ | 1,882,817 |
| 0.00 | | | $ | 1.00 | | 1.76% | | 1.51% | | 1.60% | | 1.78% | | $ | 2,373,287 |
| 0.00 | | | $ | 1.00 | | 4.86% | | 1.51% | | 1.69% | | 4.99% | | $ | 2,493,119 |
| 0.00 | | | $ | 1.00 | | 4.06% | | 1.46% | | 1.65% | | 4.10% | | $ | 1,736,843 |
| 0.00 | | | $ | 1.00 | | 4.01% | | 1.42% | | 1.62% | | 4.10% | | $ | 1,158,589 |
| | | | | | |
| | | | | | | | | | | | | | | | |
|
| | | | | | |
| | | | | | | | | | | | | | | | |
| 0.00 | | | $ | 1.00 | | 0.32% | | 0.65% | | 0.65% | | 0.06% | | $ | 632,486 |
| | | | | | |
| | | | | | | | | | | | | | | | |
|
| | | | | | |
| | | | | | | | | | | | | | | | |
| 0.00 | | | $ | 1.00 | | 0.39% | | 0.65% | | 0.65% | | 0.07% | | $ | 2,323,853 |
| | | | | | |
| | | | | | | | | | | | | | | | |
|
| | | | | | |
| | | | | | | | | | | | | | | | |
| 0.00 | | | $ | 1.00 | | 0.43% | | 0.65% | | 0.91% | | 0.21% | | $ | 191,784 |
| 0.00 | | | $ | 1.00 | | 0.94% | | 0.65% | | 0.81% | | 0.96% | | $ | 209,285 |
| 0.00 | | | $ | 1.00 | | 2.33% | | 0.65% | | 0.79% | | 2.48% | | $ | 161,947 |
| 0.00 | | | $ | 1.00 | | 5.28% | | 0.65% | | 0.74% | | 5.39% | | $ | 98,260 |
| 0.00 | | | $ | 1.00 | | 4.89% | | 0.65% | | 0.82% | | 1.89% | | $ | 2,047 |
55
| WELLSFARGOMONEYMARKETFUNDS | | NOTESTOFINANCIALHIGHLIGHTS |
|
NOTESTOFINANCIALHIGHLIGHTS
| |
| (1) | | During each period, various fees and expenses were waived and reimbursed as indicated. The ratio of Gross Expenses to Average Net Assets reflects the expense ratio in the absence of any waivers and reimbursements (Note 8). |
| |
| (2) | | Total return calculations would have been lower had certain expenses not been waived or reimbursed during the periods shown. Returns for periods less than one year are not annualized. |
| |
| (3) | | Commencement of operations. |
| |
| (4) | | This class of shares was redesignated from Class S to Class B on November 8, 1999. |
The accompanying notes are an integral part of these financial statements.
56
NOTESTOFINANCIALSTATEMENTS (UNAUDITED) | | WELLSFARGOMONEYMARKETFUNDS |
|
1. ORGANIZATION
Wells Fargo Funds Trust (the “Trust”) is registered under the Investment Company Act of 1940, as amended (the “1940 Act”), as an open-end series management investment company. The Trust commenced operations on November 8, 1999, and is currently comprised of 68 separate series. These financial statements present the California Tax-Free Money Market, Government Money Market, Minnesota Money Market, Money Market, National Tax-Free Money Market (formerly named the National Tax-Free Institutional Money Market Fund), 100% Treasury Money Market, and Treasury Plus Money Market (formerly named the Treasury Plus Institutional Money Market Fund) Funds (each, a “Fund”, collectively, the “Funds”), each with the exception of the California Tax-Free Money Market Fund and Minnesota Money Market Fund, a diversified series of the Trust. The California Tax-Free Money Market Fund and Minnesota Money Market Fund are non-diversified series of the Trust.
Effective at the close of business on June 6, 2003, the Wells Fargo Government Money Market Fund acquired all of the net assets of the Montgomery Government Money Market Fund. The Montgomery Government Money Market Fund exchanged its 180,530,053 R Class shares (valued at $180,585,365) for 180,530,053 Service Class shares of the Wells Fargo Government Money Market Fund.
Effective at the close of business on July 25, 2003, the Government Money Market Fund acquired all of the net assets of the Government Institutional Money Market Fund. The Government Institutional Money Market Fund exchanged its 1,081,553,886 Institutional Class shares (valued at $1,081,553,928) for 1,081,553,886 Institutional Class shares of the Government Money Market Fund.
Effective at the close of business on July 25, 2003, the National Tax-Free Money Market Fund (formerly named the National Tax-Free Institutional Money Market Fund) (the “Acquiring Fund”) acquired all of the net assets of the National Tax-Free Money Market Fund (the “Target Fund”). The Target Fund exchanged its 667,850,273 Class A shares (valued at $667,870,144) for 667,850,273 Class A shares of the Acquiring Fund.
Effective at the close of business on July 25, 2003, the Treasury Plus Money Market Fund (formerly named the Treasury Plus Institutional Money Market Fund) (the “Acquiring Fund”) acquired all of the net assets of the Treasury Plus Money Market Fund (the “Target Fund”). The Target Fund exchanged its 2,352,982,205 Class A shares (valued at $2,352,936,127) for 2,352,982,205 Class A shares of the Acquiring Fund.
The separate classes of shares offered by each Fund differ principally in the applicable sales charges (if any) and distribution, shareholder servicing and administration fees. Shareholders of each class bear certain expenses that pertain to that particular class. All shareholders bear the common expenses of a Fund and earn income from the portfolio, pro rata based on the average daily net assets of each class, without distinction between share classes. Dividends are determined separately for each class based on income and expenses allocable to each class. Realized gains and losses are allocated to each class pro rata based on the net assets of each class on the date realized. No class has preferential dividend rights. Differences in per share dividend rates generally result from the relative weightings of pro rata income and realized gain allocations and from differences in separate class expenses, including distribution, shareholder servicing and administration fees.
2. SIGNIFICANT ACCOUNTING POLICIES
The following significant accounting policies which are consistently followed by the Trust in the preparation of its financial statements are in conformity with accounting principles generally accepted in the United States of America (“GAAP”) for investment companies.
The preparation of financial statements in conformity with GAAP requires management to make estimates and assumptions that affect the reported amounts of assets and liabilities, disclosure of contingent assets and liabilities at the date of the financial statements and the reported amounts of revenues and expenses during the reporting period. Actual results could differ from those estimates.
SECURITYVALUATION
The Funds invest only in securities with remaining maturities not exceeding 397 days (13 months). Certain floating- and variable-rate instruments in the portfolios may have maturities in excess of 397 days, but carry a demand feature that permits the holder to tender the instruments back to the issuer at par value prior to maturity.
The Funds use the amortized cost method to value their portfolio securities. The amortized cost method involves valuing a security at its cost, plus accretion of discount or minus amortization of premium over the period until maturity, which approximates market value. The Funds seek to maintain a constant net asset value of $1.00 per share, although there is no assurance that they will be able to do so.
57
| WELLSFARGOMONEYMARKETFUNDS | | NOTESTOFINANCIALSTATEMENTS (UNAUDITED) |
|
SECURITIESTRANSACTIONSANDINCOMERECOGNITION
Securities transactions are recorded on a trade date basis. Realized gains or losses are reported on the basis of identified cost of securities delivered. Interest income is accrued daily and bond discounts are accreted and premiums are amortized.
REPURCHASEAGREEMENTS
The Government Money Market Fund, Money Market Fund and the Treasury Plus Money Market Fund may invest in repurchase agreements and may participate in pooled repurchase agreement transactions with other funds advised by Wells Fargo Funds Management, LLC. The repurchase agreements must be fully collateralized based on values that are marked to market daily. The collateral may be held by an agent bank under a tri-party agreement. It is the Funds’ custodian’s responsibility to value collateral daily and to take action to obtain additional collateral as necessary to maintain market value equal to or greater than the resale price. The repurchase agreements held by the Funds are collateralized by instruments such as U.S. Treasury, federal agency, or high-grade corporate obligations. There could be potential loss to a Fund in the event that such Fund is delayed or prevented from exercising its rights to dispose of the collateral, including the risk of a possible decline in the value of the underlying obligations during the period in which a Fund seeks to assert its rights.
DISTRIBUTIONSTOSHAREHOLDERS
Net investment income is declared daily and distributed to shareholders monthly. Distributions to shareholders from net realized capital gains are declared and distributed at least annually.
Distributions are based on amounts calculated in accordance with the applicable federal income tax regulations, which may differ from GAAP. The timing and character of distributions made during the period from net investment income or net realized gains may also differ from their ultimate characterization for federal income tax purposes. To the extent that these differences are permanent in nature, such amounts are reclassified within the capital accounts based on their federal tax-basis treatment; temporary differences do not require reclassifications.
FEDERALINCOMETAXES
Each Fund is treated as a separate entity for federal income tax purposes. It is the policy of each fund of the Trust to continue to qualify as a regulated investment company by complying with the provisions applicable to regulated investment companies, as defined under subchapter M of the Internal Revenue Code (the “Code”), and to make distributions of substantially all of its investment company taxable income and any net realized capital gains (after reduction for capital loss carryforwards) sufficient to relieve it from all, or substantially all, federal income taxes. Accordingly, no provision for federal income taxes was required at September 30, 2003.
The following Fund had an estimated net capital loss carryforward, which is available to offset future net realized capital gains:
| Fund | | Year Expires | | Capital Loss Carryforwards |
Minnesota Money Market Fund | | 2010 | | $ | 3,019 |
The Treasury Plus Money Market Fund has a current post-October deferred loss of $898. This loss will be recognized for tax purposes on the first day of the following tax year.
3. ADVISORY FEES
The Trust has entered into an advisory contract on behalf of the Funds with Wells Fargo Funds Management, LLC (“Funds Management”). Pursuant to the advisory contract, Funds Management has agreed to provide the following Funds with daily portfolio management for which Funds Management is entitled to be paid a monthly advisory fee at the following annual rates:
| Fund | | % of Average Daily Net Assets |
California Tax-Free Money Market Fund | | 0.30 |
Government Money Market Fund | | 0.10 |
Minnesota Money Market Fund | | 0.30 |
Money Market Fund | | 0.40 |
National Tax-Free Money Market Fund | | 0.10 |
100% Treasury Money Market Fund | | 0.35 |
Treasury Plus Money Market Fund | | 0.10 |
58
NOTESTOFINANCIALSTATEMENTS (UNAUDITED) | | WELLSFARGOMONEYMARKETFUNDS |
|
The Funds’ adviser is responsible for implementing the investment policies and guidelines for the Funds, and for supervising the sub-adviser who is responsible for the day-to-day portfolio management of the Funds.
Wells Capital Management Incorporated (“Wells Capital Management”), an affiliate of Funds Management, acts as investment sub-adviser to the Funds. Wells Capital Management is entitled to receive from Funds Management, as compensation for its sub-advisory services to the Funds, a monthly fee at the annual rate of 0.05% of each Fund’s average daily net assets up to $1 billion and 0.04% of each Fund’s average daily net assets in excess of $1 billion.
4. DISTRIBUTION FEES
The Trust has adopted a Distribution Plan (the “Plan”) for Class B shares of the Money Market Fund pursuant to Rule 12b-1 under the 1940 Act. Distribution fees are charged to the Money Market Fund’s Class B shares and paid to Stephens Inc. (“Stephens”) at a rate of 0.75% of average daily net assets. There are no distribution fees for Class A, Administrator Class, Institutional Class or Service Class shares of the Funds. The distribution fees paid on behalf of the Money Market Fund for the six months ended September 30, 2003 were $6,726,340.
5. ADMINISTRATION FEES AND TRANSFER AGENT FEES
Through February 28, 2003, the Trust had entered into an Administration Agreement with Funds Management on behalf of the Funds. Under the Administration Agreement, Funds Management acted as administrator to the Funds and was entitled to receive, on a monthly basis, fees at the annual rate of 0.15% of each Fund’s average daily net assets.
The Trust had also entered into an agreement with Boston Financial Data Services, Inc. (“BFDS”) as the transfer agent for the Trust. Under the agreement, BFDS was entitled to receive from the Funds a per-account fee plus transaction fees, certain out-of-pocket costs and a complex based fee.
Effective March 1, 2003, the Trust has entered into a new Administration Agreement with Funds Management on behalf of the Funds. Under this Agreement, for providing administrative services, which now includes paying the Funds’ fees and expenses for services provided by the Funds’ transfer agent and various sub-transfer agents and omnibus account servicers and record-keepers out of the fees it receives as administrator, Funds Management is entitled to receive an annual fee of 0.27% of the average daily net assets of a Fund’s Class A and Class B shares, 0.17% of the average daily net assets of a Fund’s Service Class shares, 0.15% of the average daily net assets of a Fund’s Administrator Class shares and 0.13% of the average daily net assets of a Fund’s Institutional Class shares.
6. SHAREHOLDER SERVICING FEES
The Trust has entered into contracts on behalf of the Funds with numerous shareholder servicing agents, whereby the Funds are charged for these services 0.25% of the average daily net assets of each Fund for Class A, Class B and Service Class shares, and 0.10% of the average daily Net assets of each Fund for Administrator Class shares. No fee is charged for Institutional Class shares.
The shareholder servicing fees paid on behalf of the Funds for the six months ended September 30, 2003 were as follows:
| Fund | | Class A | | Class B | | Administrator Class | | Service
Class |
California Tax-Free Money Market Fund | | $ | 2,821,235 | | | N/A | | | N/A | | $ | 0 |
Government Money Market Fund | | | 331,177 | | | N/A | | $ | 4,215 | | | 2,301,223 |
Minnesota Money Market Fund | | | 169,052 | | | N/A | | | N/A | | | N/A |
Money Market Fund | | | 8,055,929 | | $ | 2,242,113 | | | N/A | | | N/A |
National Tax-Free Money Market Fund | | | 299,214 | | | N/A | | | N/A | | | 1,687,845 |
100% Treasury Money Market Fund | | | 265,809 | | | N/A | | | N/A | | | 0 |
Treasury Plus Money Market Fund | | | 1,024,870 | | | N/A | | | N/A | | | 1,664,439 |
7. OTHER FEES AND TRANSACTIONS WITH AFFILIATES
Effective the first quarter of 2003, PFPC, Inc. (“PFPC”) serves as fund accountant for the Funds. For its services as fund accountant, PFPC is entitled to receive an annual asset based fund complex fee, an annual fee of $20,000 from each Fund and is entitled to be reimbursed for all out-of-pocket expenses reasonably incurred in providing these services. Prior to PFPC, Forum Accounting Services, LLC served as fund
59
| WELLSFARGOMONEYMARKETFUNDS | | NOTESTOFINANCIALSTATEMENTS (UNAUDITED) |
|
accountant for all of the Funds and was entitled to receive a fixed monthly per fund fee, a basis point fee of 0.0025% of the average daily net assets of the Fund, and was reimbursed for all out-of-pocket expenses reasonably incurred in providing these services.
In addition, the Trust has entered into a contract on behalf of each Fund with Wells Fargo Bank Minnesota, N.A. (“Wells Fargo Bank, MN”), whereby Wells Fargo Bank, MN is responsible for providing custody services for the Funds. Pursuant to the contracts, Wells Fargo Bank, MN is entitled to receive certain transaction charges plus a monthly fee for custody services at the annual rate of 0.02% of the average daily net assets of each Fund.
8. WAIVED FEES AND REIMBURSED EXPENSES
All amounts shown as waived fees or reimbursed expenses on the Statements of Operations, for the six months ended September 30, 2003, were waived by Funds Management first from advisory fees, and then any remaining amount consecutively from administration, custody and shareholder servicing fees collected.
60
| BOARDOFTRUSTEES | | WELLSFARGOMONEYMARKETFUNDS |
|
BOARDOFTRUSTEES
The following table provides basic information about the Board of Trustees (“Trustees”) of the Trust and supplements, and should be read in conjunction with, the Prospectus and the Statement of Additional Information* of each Fund. Each of the Trustees listed below acts in identical capacities for each of the 92 funds comprising the Trust, Wells Fargo Variable Trust and Wells Fargo Master Trust (collectively the “Fund Complex”). All of the non-interested Trustees are also members of the Audit and Nominating Committees of each Trust in the Fund Complex. The address of each Trustee and Officer is 525 Market Street, 20th Floor, San Francisco, CA 94105. Each Trustee and Officer serves an indefinite term, however, each Trustee serves such term until reaching the mandatory retirement age established by the Trustees.
INTERESTEDTRUSTEES**
| Name and Age | | Position held and
length of service*** | | Principal occupations during
past five years | | Other Directorships |
Robert C. Brown
72 | | Trustee since 1992 | | Retired. Director, Federal Farm Credit Banks Funding Corporation and Farm Credit System Financial Assistance Corporation until February 1999. | | None |
|
J. Tucker Morse
59 | | Trustee since 1987 | | Private Investor/Real Estate Developer; Chairman of White Point Capital, LLC. | | None |
|
| |
| NON-INTERESTEDTRUSTEES | | |
| Name and Age | | Position held and length of service*** | | Principal occupations during
past five years | | Other Directorships |
Thomas S. Goho
61 | | Trustee since 1987 | | Wake Forest University, Calloway School of Business and Accountancy, Benson-Pruitt Professorship since 1999, Associate Professor of Finance 1994-1999. | | None |
|
Peter G. Gordon
61 | | Trustee since 1998 (Lead Trustee since 2001) | | Chairman, CEO, and Co-Founder of Crystal Geyser Water Company and President of Crystal Geyser Roxane Water Company. | | None |
|
Richard M. Leach
70 | | Trustee since 1987 | | Retired. Prior thereto, President of Richard M. Leach Associates (a financial consulting firm). | | None |
|
Timothy J. Penny
51 | | Trustee since 1996 | | Senior Counselor to the public relations firm of Himle-Horner and Senior Fellow at the Humphrey Institute, Minneapolis, Minnesota (a public policy organization). | | None |
|
Donald C. Willeke
63 | | Trustee since 1996 | | Principal in the law firm of Willeke & Daniels. | | None |
|
61
| WELLSFARGOMONEYMARKETFUNDS | | BOARDOFTRUSTEES |
|
OFFICERS
| Name and Age | | Position held and
length of service | | Principal occupations during
past five years | | Other Directorships |
Karla M. Rabusch
44 | | President, since 2003 | | Executive Vice President of Wells Fargo Bank, N.A. President of Wells Fargo Funds Management, LLC. Senior Vice President and Chief Administrative Officer of Wells Fargo Funds Management, LLC from March 2001 to March 2003. Vice President of Wells Fargo Bank, N.A. from December 1997 to May 2000. | | None |
|
Stacie D. DeAngelo
34 | | Treasurer, since 2003 | | Vice President of Wells Fargo Bank, N.A. Vice President of Operations for Wells Fargo Funds Management, LLC. Prior thereto, Operations Manager at Scudder Weisel Capital, LLC (2000 to 2001), Director of Shareholder Services at BISYS Fund Services (1999 to 2000) and Assistant Vice President of Operations with Nicholas-Applegate Capital Management (1993 to 1999). | | None |
|
C. David Messman
43 | | Secretary, since 2000 | | Vice President and Counsel of Wells Fargo Bank, N.A. since January 1996. Vice President and Secretary of Wells Fargo Funds Management, LLC since March 2001. | | None |
|
| * | | The Statement of Additional Information includes additional information about the Funds’ Trustees and is available, without charge, upon request, by calling 1-800-222-8222. |
| ** | | Currently, two of the seven Trustees are considered “interested persons” of the Trusts as defined in the Investment Company Act of 1940. One of the interested Trustees, Robert C. Brown, owns securities of Wells Fargo & Company, and one of the interested Trustees, J. Tucker Morse, is affiliated with a government securities dealer that is registered under the Securities Exchange Act of 1934, which is not itself affiliated with Wells Fargo Funds Management, LLC. |
| *** | | Length of service dates reflects a Trustee’s commencement of service with the Trust’s predecessor entities. |
62
LISTOFABBREVIATIONS | | WELLSFARGOMONEYMARKETFUNDS |
|
The following is a list of common abbreviations for terms and entities which may have appeared in this report.
| |
ABAG | | — Association of Bay Area Governments |
| |
ADR | | — American Depository Receipts |
| |
AMBAC | | — American Municipal Bond Assurance Corporation |
| |
AMT | | — Alternative Minimum Tax |
| |
ARM | | — Adjustable Rate Mortgages |
| |
BART | | — Bay Area Rapid Transit |
| |
CDA | | — Community Development Authority |
| |
CDSC | | — Contingent Deferred Sales Charge |
| |
CGIC | | — Capital Guaranty Insurance Company |
| |
CGY | | — Capital Guaranty Corporation |
| |
CMT | | — Constant Maturity Treasury |
| |
COFI | | — Cost of Funds Index |
| |
Connie Lee | | — Connie Lee Insurance Company |
| |
COP | | — Certificate of Participation |
| |
CP | | — Commercial Paper |
| |
CTF | | — Common Trust Fund |
| |
DW&P | | — Department of Water & Power |
| |
DWR | | — Department of Water Resources |
| |
EDFA | | — Education Finance Authority |
| |
FGIC | | — Financial Guaranty Insurance Corporation |
| |
FHA | | — Federal Housing Authority |
| |
FHLB | | — Federal Home Loan Bank |
| |
FHLMC | | — Federal Home Loan Mortgage Corporation |
| |
FNMA | | — Federal National Mortgage Association |
| |
FRN | | — Floating Rate Notes |
| |
FSA | | — Financial Security Assurance, Inc |
| |
GNMA | | — Government National Mortgage Association |
| |
GO | | — General Obligation |
| |
HFA | | — Housing Finance Authority |
| |
HFFA | | — Health Facilities Financing Authority |
| |
IDA | | — Industrial Development Authority |
| |
LIBOR | | — London Interbank Offered Rate |
| |
LLC | | — Limited Liability Corporation |
| |
LOC | | — Letter of Credit |
| |
LP | | — Limited Partnership |
| |
MBIA | | — Municipal Bond Insurance Association |
| |
MFHR | | — Multi-Family Housing Revenue |
| |
MUD | | — Municipal Utility District |
| |
MTN | | — Medium Term Note |
| |
PCFA | | — Pollution Control Finance Authority |
| |
PCR | | — Pollution Control Revenue |
| |
PFA | | — Public Finance Authority |
| |
PLC | | — Private Placement |
| |
PSFG | | — Public School Fund Guaranty |
| |
RAW | | — Revenue Anticipation Warrants |
| |
RDA | | — Redevelopment Authority |
| |
RDFA | | — Redevelopment Finance Authority |
| |
R&D | | — Research & Development |
| |
SFMR | | — Single Family Mortgage Revenue |
| |
STEERS | | — Structured Enhanced Return Trust |
| |
TBA | | — To Be Announced |
| |
TRAN | | — Tax Revenue Anticipation Notes |
| |
USD | | — Unified School District |
| |
V/R | | — Variable Rate |
| |
WEBS | | — World Equity Benchmark Shares |
63
More information about Wells Fargo Funds® is available free upon request. To obtain literature, please write or call: Wells Fargo Funds PO Box 8266 Boston, MA 02266-8266 Wells Fargo Funds Investor Services: 1-800-222-8222 or visit our Web site at www.wellsfargofunds.com | | This report and the financial statements contained herein are submitted for the general information of the shareholders of the Wells Fargo Funds. If this report is used for promotional purposes, distribution of the report must be accompanied or preceded by a current prospectus. For a prospectus containing more complete information, including charges and expenses, call 1-800-222-8222. Read the prospectus carefully before you invest or send money. Wells Fargo Funds Management, LLC, a wholly-owned subsidiary of Wells Fargo & Company, provides investment advisory and administrative services for the Wells Fargo Funds. Other affiliates of Wells Fargo & Company provide sub-advisory and other services for the Funds. The Funds are distributed by Stephens Inc., Member NYSE/SIPC. Wells Fargo & Company and its affiliates are not affiliated with Stephens Inc. |
| NOT FDIC INSURED - NO BANK GUARANTEE - MAY LOSE VALUE | | SAR 004 (11/03) |
WELLS FARGO
FUNDS
Wells Fargo Money Market Funds
Semi-Annual Report
Wells Fargo California Tax-Free Money Market Fund
Wells Fargo Cash Investment Money Market Fund
Wells Fargo Government Money Market Fund
Wells Fargo National Tax-Free Money Market Fund
Wells Fargo Prime Investment Money Market Fund
Wells Fargo Treasury Plus Money Market Fund
Wells Fargo 100% Treasury Money Market Fund
Administrator, Institutional and Service Classes
September 30, 2003
| | | WELLSFARGOMONEYMARKETFUNDS |
|
TABLEOFCONTENTS
NOT FDIC INSURED–NO BANK GUARANTEE–MAY LOSE VALUE
This page is intentionally left blank —
SHAREHOLDERLETTER | | WELLSFARGOMONEYMARKETFUNDS |
|
DEARVALUEDSHAREHOLDER,
We are pleased to provide you with this Wells Fargo Money Market Funds semi-annual report for the six-month period ending September 30, 2003. On the following pages, you will find the money market overview and facts and figures about each Fund’s portfolio.
OVERVIEW OF FINANCIAL MARKETS
Despite attempts by the federal government to boost the economy early in the year, the economy remained mired in weakness early in the reporting period. The Federal Reserve Board (the Fed) cut short-term interest rates from 1.25% to 1% in June, the lowest level in half a century. Still, unemployment continued to rise and a record fiscal year 2003 federal budget deficit loomed on the horizon, suggesting that tax revenues were not growing fast enough to cover government spending.
Market volatility that was caused by uncertainty over the possibility of war in Iraq was followed by uncertainty over the direction and magnitude of changes in Fed policy. Mortgage refinancing and consumer spending activity remained strong despite a back-up in intermediate-term interest rates. Economic growth began picking up steam during the summer, while corporate earnings exceeded expectations. Even employment data began showing improvement in September. Indeed, there were reasons to be optimistic about the U.S. economy as the end of 2003 approached.
WELLS FARGO MONEY MARKET FUNDS
The Fed’s decision to cut interest rates by just a quarter percentage point to 1% at its June 25, 2003 policy meeting brought interest rates down to levels not seen since the 1950s. Unfortunately, the rate cut did not meet investor expectations and interest rates were volatile through the end of the period in reaction to comments from the Fed and changing views on the outlook for economic growth. Despite a challenging environment for investors, the Wells Fargo Money Market Funds achieved their investment objectives of maintaining a stable net asset value.
It is important to remember that no one can accurately predict the future direction of short-term interest rates. We continue to maintain a more prudent investment strategy and do not pursue strategies that seek to boost yield at the expense of safety and liquidity. We believe that the pursuit of additional yield creates volatility that can potentially undermine Fund performance during uncertain markets.
INVESTMENT STRATEGIES IN CHALLENGING TIMES
Investors are counting on reasonably good earnings growth to propel stocks higher during the balance of 2003, overcoming potential hurdles to any future rally created by seemingly “rich” valuations and by upward pressure on interest rates. With pricing power still weak throughout much of the economy, most businesses will rely on further cost cutting to propel margins enough to sustain double-digit earnings growth. Meanwhile, bond investors may insulate portfolios from a potential rise in interest rates by gradually moving away from longer-term securities as well as by investing in high coupon bonds or mortgage-backed securities that hold up better in a rising interest rate environment. Regardless of what lies ahead, investors should continue to follow the fundamentals of investing — asset allocation and diversification — in an effort to achieve their long-term financial goals.
We would like to thank you for choosing Wells Fargo Funds. We appreciate your confidence in us during this uncertain time period. Through each market cycle, we are committed to helping you meet your financial needs. If you have any questions about your investment, please contact your investment professional or call us at 1-800-222-8222. You may also visit our Web site at www.wellsfargofunds.com.
Sincerely,

Karla M. Rabusch
President
Wells Fargo Funds
1
| WELLSFARGOMONEYMARKETFUNDS | | MONEYMARKETOVERVIEW |
|
MONEYMARKETOVERVIEW
This report covers the six-month period ended September 30, 2003.
This reporting period can be divided into two distinct segments. During the first three months of the period, interest rates moved lower as slow economic growth led many to believe that the Federal Reserve Board (the Fed) would continue its attempt to spur growth by aggressively lowering short-term interest rates. The second half of the period was characterized by rising interest rates, the result of the Fed’s interest rate cut in June not meeting investor expectations.
PRIME MONEY MARKET SECURITIES
For the first three months of the period, the yield curve flattened. Short-term money market investments (those maturing in less than three months) remained stable, while longer-term money market investments (those maturing in more than thirteen months) declined. By mid-June, the yield on one-year investments had declined 25 basis points to below 1%, while the Federal Funds rate remained near 1.25%. Despite warnings that their expectations were unrealistic, investors continued to expect a 50 basis point reduction in the Federal Funds rate in June. When the rate was lowered only 25 basis points, the market began to re-evaluate its outlook for continued regular rate cuts and the yields on longer-term money market investments began to move higher. By the end of the period, the one-year London Interbank Offered Rate (LIBOR) stood at 1.30% after peaking at 1.50% near the end of August.
The amount of commercial paper outstanding continued to decline during the period, as issuers took advantage of the record low bond yields to extend their debt. The amount of top rated commercial paper outstanding fell by more than 5% during the period, from $1.207 trillion to $1.144 trillion, reflecting a decrease of nearly 20% from the peak of $1.413 trillion in December 2000.
Credit quality also remained a concern during the reporting period. While the pace of downgrades slowed somewhat, accounting issues at some of the Government Sponsored Entities, and questions about corporate governance policies at the New York Stock Exchange, did not help to restore investor confidence in management policies, abilities, and integrity.
U.S. TREASURY SECURITIES
Although the Fed eventually did cut the Federal Funds rate by 25 basis points to 1.00%, Treasury bills had been pricing based on the assumption that there would be a 50 basis point cut. Even the one-year Treasury note traded below 0.90% in the days preceding the June rate cut. These low rates coincided with quarter-end demand pressures in June, causing the short-end of the Treasury market (less than three months) to remain overpriced for an unusually longer period of time than what typically follows a market disappointment. Eventually Treasury bill pricing became more reasonable, and the longer end of the market became relatively cheap. As budget deficit projections ballooned, expectations of a greater supply of Treasury bills and the general expectation of higher interest rates drove the price of Treasury bills into the mid 0.90’s to low 1.00’s.
Over this reporting period, the supply of Treasury bills greatly contracted: the issuance of Treasury bills for the first week of April stood at $72 billion, and declined to $44 billion by the end of the period. While the April issuance was largely due to seasonal factors, Treasury bill issuance did not meet expectations as the period progressed and Treasuries became more expensive. Evidence of this could be seen during September, when the U.S. Treasury Department had to issue cash management bills to cover a temporary cash shortfall early in the month. Continued issuance may point to the need for the Treasury to increase auction size in the coming months.
U.S. GOVERNMENT AGENCY SECURITIES
Spreads between U.S. Government agency offerings and money market securities continued to tighten during the period. Interest rates, concerns over the ability of government agencies to manage interest rate risk, losses in the Federal Home Loan Bank of New York’s bond portfolio, and an accounting scandal at the Federal Home Loan Mortgage Corporation (FHLMC) drove yields on U.S. Government agency securities higher on a relative basis. For a period in June, after the FHLMC accounting issues were made public, FHLMC discount notes traded more cheaply than A-1/P-1 bank commercial paper. Eighteen month floating rate paper from the Federal National Mortgage Association (FNMA) and FHLMC traded at similar discount margins to one-year asset-backed conduit program floaters. The number of callable issues continued to increase, but at a slower pace as rates declined in September. By the end of the period, changes in the regulation of FNMA and FHLMC seemed inevitable (although it may be a long and arduous process).
2
MONEYMARKETOVERVIEW | | WELLSFARGOMONEYMARKETFUNDS |
|
TAX-FREE SECURITIES
The number of new municipal issues continued to increase swiftly as issuers found that it was often cheaper to issue variable rate securities than use the swap market to hedge interest rate risk. As variable rates surged to 103% of the one-month LIBOR in mid-April, the vast supply of variable rate demand notes increased, making it somewhat easier to invest the seasonal July cash inflows.
Fixed rate municipal securities were volatile during the reporting period. One-year paper started the period at 1.10% and interest rates plummeted to 0.80% at the peak of note season in late June. California was on the verge of running out of cash, as legislative parties were at odds over approving a budget. Standard and Poor’s was one of the driving forces behind breaking the stalemate by downgrading the state from A to BBB in late July. The price of California Revenue Anticipation Warrants (RAWs) plummeted as their yields skyrocketed from 1.15% to 2.00%.
Texas issued record-breaking Tax and Revenue Anticipation Notes in late August, exceeding municipal demand and splitting the one-year sector into three markets – the general market, the California market, and the Texas market. The one-year municipal securities markets finally settled down in early September as rates hovered near 1.00% for general market paper, 1.10% for Texas paper, and 1.60% for California RAWs.
STRATEGIC OUTLOOK
While the overnight interest rate has been stable, longer money market rates have increased considerably since the mid-point of the reporting period. With the U.S. economy picking up steam and the U.S. dollar weakening overseas, we believe that interest rates may continue to move higher. That increase, when accompanied by outflows from institutional investors, could trigger a challenging period for all money market funds. However, we do not believe that aggressively positioning a money market fund to boost its yield at the risk of jeopardizing its net asset value (NAV) would be appropriate, and we will continue to position the portfolios and select their investments in an ongoing effort to maintain a stable $1.00 NAV.
The views expressed are as of September 30, 2003 and are those of the Funds’ manager. The views are subject to change at any time in response to changing circumstances in the market and are not intended to predict or guarantee the future performance of any individual security, market sector or the markets generally, or the Wells Fargo Money Market Funds.
3
WELLSFARGOMONEYMARKETFUNDS | | MONEYMARKETOVERVIEW |
|
PRIMARY INVESTMENTS*
Wells Fargo
Money Market
Fund Name | | U.S.
Treasury
Securities | | Repurchase
Agreements | | U.S.
Government
Obligations | | Commercial
Paper | | Certificates
of Deposit/
Bankers
Acceptances | | Time
Deposits | | Floating/
Variable Rate
Notes/Bonds | | Mortgage-
and Other
Asset-
Backed
Securities | | Corporate
Notes/
Bonds | | Municipal
Obligations |
| | | | | | | | | | |
100% Treasury | | X | | | | | | | | | | | | | | | | | | |
| | | | | | | | | | |
Treasury Plus | | X | | X | | | | | | | | | | | | | | | | |
| | | | | | | | | | |
Government | | X | | X | | X | | | | | | | | | | | | | | |
| | | | | | | | | | |
Prime Investment | | X | | X | | X | | X | | X | | X | | X | | X | | X | | |
| | | | | | | | | | |
Cash Investment | | X | | X | | X | | X | | X | | X | | X | | X | | X | | |
| | | | | | | | | | |
National Tax-Free | | | | | | | | | | | | | | | | | | | | X |
| | | | | | | | | | |
California Tax-Free | | | | | | | | | | | | | | | | | | | | X |
* The chart highlights some of the primary investments that the Funds may make as part of their investment strategies. The chart does not identify all of the permitted investments for each Fund.
4
| PERFORMANCEHIGHLIGHTS | | WELLSFARGOMONEYMARKETFUNDS |
|
WELLSFARGOCALIFORNIATAX-FREEMONEYMARKETFUND —SERVICE CLASS
INVESTMENT OBJECTIVE
The Wells Fargo California Tax-Free Money Market Fund (the Fund) seeks a high level of income exempt from federal income tax and California individual income tax, while preserving capital and liquidity.
FUNDMANAGERS
Dave Sylvester
Julio Bonilla
INCEPTIONDATE
01/01/92
AVERAGE ANNUAL TOTAL RETURN1 (%) (AS OF SEPTEMBER 30, 2003)
| | | 6-Month* | | 1-Year | | 5-Year | | 10-Year |
| | | | |
Wells Fargo California Tax-Free Money Market Fund – Service Class | | 0.29 | | 0.69 | | 1.97 | | 2.35 |
| | | | |
Benchmark | | | | | | | | |
| | | | |
iMoneyNet California State Specific Institutional Money Fund Average2 | | 0.31 | | 0.75 | | 2.22 | | 2.87 |
| * | | Returns for periods of less than one year are not annualized. |
| FUND YIELD SUMMARY (AS OF SEPTEMBER 30, 2003) |
|
| |
7-Day Current Yield | | 0.59% |
| |
7-Day Compound Yield | | 0.59% |
| |
30-Day Simple Yield | | 0.48% |
| |
30-Day Compound Yield | | 0.48% |
| FUND CHARACTERISTICS3 (AS OF SEPTEMBER 30, 2003) |
|
| |
Weighted Average Maturity | | 42 days |
| |
Number of Holdings | | 252 |
PORTFOLIO COMPOSITION3 (AS OF SEPTEMBER 30, 2003)
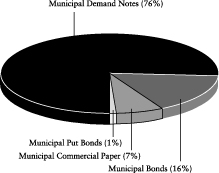
MATURITY DISTRIBUTION3 (AS OF SEPTEMBER 30, 2003)
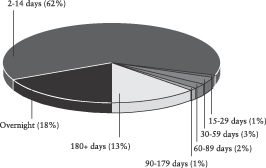
The Fund is sold without a front-end sales charge or contingent deferred sales charge. Other fees and expenses apply to a continued investment in the Fund and are described in the Fund’s Statement of Additional Information. An investment in a Wells Fargo Money Market Fund is not insured or guaranteed by the Federal Deposit Insurance Corporation or any other government agency. Although the Wells Fargo Money Market Funds seek to preserve the value of your investment at $1.00 per share, it is possible to lose money by investing in money market funds.
1 Figures quoted represent past performance, which is no guarantee of future results. Investment returns will fluctuate. The Fund’s yield figures more closely reflect the current earnings of the Fund than the total return figures. The Fund’s Adviser has committed through July 31, 2004 to waive fees and/or reimburse expenses to the extent necessary to maintain a certain net operating expense ratio for the Fund. Actual reductions of operating expenses can increase total return to shareholders. Without these reductions, the Fund’s 7-day current yield would have been 0.55%. Performance shown for the Service Class shares of the Wells Fargo California Tax-Free Money Market Fund for periods prior to November 8, 1999, reflects performance of the Class A shares of the Stagecoach California Tax-Free Money Market Fund, its predecessor fund. Effective at the close of business November 5, 1999, the Stagecoach Funds were reorganized into the Wells Fargo Funds.
2 The iMoneyNet California State Specific Institutional Money Fund Average is an average of California institutional state tax-free and municipal money funds.
3 Portfolio holdings and characteristics are subject to change.
5
WELLSFARGOMONEYMARKETFUNDS | | PERFORMANCEHIGHLIGHTS |
|
WELLSFARGOCASHINVESTMENTMONEYMARKETFUND —ADMINISTRATOR,INSTITUTIONALANDSERVICECLASSES
INVESTMENT OBJECTIVE
The Wells Fargo Cash Investment Money Market Fund (the Fund) seeks high current income, preservation of capital and liquidity.
FUNDMANAGERS
Dave Sylvester
Laurie White
INCEPTIONDATE
10/14/87
AVERAGE ANNUAL TOTAL RETURN1 (%) (AS OF SEPTEMBER 30, 2003)
| | | 6-Month* | | 1-Year | | 5-Year | | 10-Year |
| | | | |
Wells Fargo Cash Investment Money Market Fund – Administrator Class | | 0.40 | | 0.96 | | 3.69 | | 4.34 |
| | | | |
Wells Fargo Cash Investment Money Market Fund – Institutional Class | | 0.50 | | 1.18 | | 3.87 | | 4.43 |
| | | | |
Wells Fargo Cash Investment Money Market Fund – Service Class | | 0.37 | | 0.93 | | 3.68 | | 4.34 |
| | | | |
Benchmark | | | | | | | | |
| | | | |
iMoneyNet First Tier Institutional Money Fund Average2 | | 0.41 | | 0.99 | | 4.02 | | 5.41 |
| * | | Returns for periods of less than one year are not annualized. |
| FUND YIELD SUMMARY (AS OF SEPTEMBER 30, 2003) |
|
| | | Administrator | | Institutional | | Service |
| | | |
7-Day Current Yield | | 0.79% | | 0.94% | | 0.64% |
| | | |
7-Day Compound Yield | | 0.79% | | 0.94% | | 0.64% |
| | | |
30-Day Simple Yield | | 0.77% | | 0.92% | | 0.62% |
| | | |
30-Day Compound Yield | | 0.78% | | 0.93% | | 0.63% |
| FUND CHARACTERISTICS3 (AS OF SEPTEMBER 30, 2003) |
|
| |
Weighted Average Maturity | | 49 days |
| |
Number of Holdings | | 144 |
PORTFOLIO COMPOSITION3 (AS OF SEPTEMBER 30, 2003)
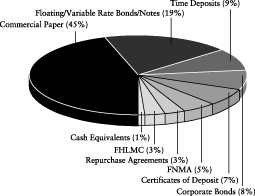
MATURITY DISTRIBUTION3 (AS OF SEPTEMBER 30, 2003)
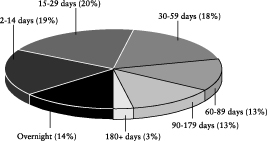
The Fund is sold without a front-end sales charge or contingent deferred sales charge. Other fees and expenses apply to a continued investment in the Fund and are described in the Fund’s Statement of Additional Information. An investment in a Wells Fargo Money Market Fund is not insured or guaranteed by the Federal Deposit Insurance Corporation or any other government agency. Although the Wells Fargo Money Market Funds seek to preserve the value of your investment at $1.00 per share, it is possible to lose money by investing in money market funds.
1 Figures quoted represent past performance, which is no guarantee of future results. Investment returns will fluctuate. The Fund’s yield figures more closely reflect the current earnings of the Fund than the total return figures. The Fund’s Adviser has committed through July 31, 2004 to waive fees and/or reimburse expenses to the extent necessary to maintain a certain net operating expense ratio for the Fund. Actual reductions of operating expenses can increase total return to shareholders. Without these reductions, the Fund’s 7-day current yield would have been 0.77% for the Administrator Class shares, 0.88% for the Institutional Class shares and 0.59% for the Service Class shares.
Performance shown for the Administrator Class shares of the Wells Fargo Cash Investment Money Market Fund for the period prior to July 31, 2003, reflects performance of the Fund’s Service Class shares, and includes fees and expenses that are not applicable to the Administrator Class shares. The Service Class shares annual returns are substantially similar to what the Administrator Class shares would be because the shares are invested in the same portfolio of securities and the annual returns differ only to the extent that the Classes do not have the same fees and expenses. Performance shown for the Institutional and Service Class shares of the Wells Fargo Cash Investment Money Market Fund for the periods prior to November 8, 1999, reflects performance of the Service Class (formerly Single Class) shares of the Norwest Advantage Cash Investment Fund (the accounting survivor of a merger of the Norwest Advantage Cash Investment Fund and the Stagecoach Prime Money Market Fund at the close of business on November 5, 1999), its predecessor fund. Effective at the close of business November 5, 1999, the Stagecoach and Norwest Advantage Funds were reorganized into the Wells Fargo Funds.
2 The iMoneyNet First Tier Institutional Money Fund Average is an average of non-governmental institutional funds that do not hold any second tier securities. Portfolio holdings of first tier funds include U.S. Treasury securities, U.S. other securities, repos, time deposits, domestic bank obligations, foreign bank obligations, first tier commercial paper, floating rate notes and asset-backed commercial paper.
3 Portfolio holdings and characteristics are subject to change.
6
| PERFORMANCEHIGHLIGHTS | | WELLSFARGOMONEYMARKETFUNDS |
|
WELLSFARGOGOVERNMENTMONEYMARKETFUND —ADMINISTRATOR,INSTITUTIONALANDSERVICECLASSES
INVESTMENT OBJECTIVE
The Wells Fargo Government Money Market Fund (the Fund) seeks high current income, while preserving capital and liquidity.
FUNDMANAGERS
Dave Sylvester
Laurie White
INCEPTIONDATE
11/16/87
AVERAGE ANNUAL TOTAL RETURN1 (%) (AS OF SEPTEMBER 30, 2003)
| | | 6-Month* | | 1-Year | | 5-Year | | 10-Year |
| | | | |
Wells Fargo Government Money Market Fund – Administrator Class | | 0.37 | | 0.91 | | 3.53 | | 4.18 |
| | | | |
Wells Fargo Government Money Market Fund – Institutional Class | | 0.40 | | 0.93 | | 3.54 | | 4.18 |
| | | | |
Wells Fargo Government Money Market Fund – Service Class | | 0.35 | | 0.88 | | 3.53 | | 4.18 |
| | | | |
Benchmark | | | | | | | | |
| | | | |
iMoneyNet Government Institutional Money Fund Average2 | | 0.36 | | 0.88 | | 3.79 | | 5.17 |
| * | | Returns for periods of less than one year are not annualized. |
| FUND YIELD SUMMARY (AS OF SEPTEMBER 30, 2003) | | |
|
| | | Administrator
Class | | Institutional
Class | | Service
Class |
| | | |
7-Day Current Yield | | 0.74% | | 0.89% | | 0.59% |
| | | |
7-Day Compound Yield | | 0.75% | | 0.90% | | 0.60% |
| | | |
30-Day Simple Yield | | 0.73% | | 0.88% | | 0.58% |
| | | |
30-Day Compound Yield | | 0.74% | | 0.89% | | 0.58% |
| FUND CHARACTERISTICS3 (AS OF SEPTEMBER 30, 2003) |
|
| |
Weighted Average Maturity | | 58 days |
| |
Number of Holdings | | 108 |
PORTFOLIO COMPOSITION3 (AS OF SEPTEMBER 30, 2003)
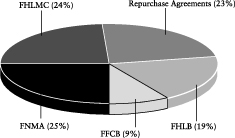
MATURITY DISTRIBUTION3 (AS OF SEPTEMBER 30, 2003)
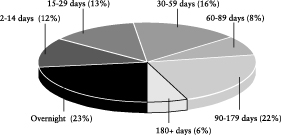
The Fund is sold without a front-end sales charge or contingent deferred sales charge. Other fees and expenses apply to a continued investment in the Fund and are described in the Fund’s Statement of Additional Information. An investment in a Wells Fargo Money Market Fund is not insured or guaranteed by the Federal Deposit Insurance Corporation or any other government agency. Although the Wells Fargo Money Market Funds seek to preserve the value of your investment at $1.00 per share, it is possible to lose money by investing in money market funds.
1 Figures quoted represent past performance, which is no guarantee of future results. Investment returns will fluctuate. The Fund’s yield figures more closely reflect the current earnings of the Fund than the total return figures. The Fund’s Adviser has committed through July 31, 2004 to waive fees and/or reimburse expenses to the extent necessary to maintain a certain net operating expense ratio for the Fund. Actual reductions of operating expenses can increase total return to shareholders. Without these reductions, the Fund’s 7-day current yield would have been 0.72% for the Administrator Class shares, 0.84% for the Institutional Class shares and 0.55% for the Service Class shares.
Performance shown for the Administrator Class shares of the Wells Fargo Government Money Market Fund for the period prior to July 31, 2003, reflects performance of the Fund’s Service Class shares, and includes fees and expenses that are not applicable to the Administrator Class shares. Performance shown for the Institutional Class shares of the Wells Fargo Government Money Market Fund for the period prior to July 28, 2003, reflects performance of the Fund’s Service Class shares, and includes fees and expenses that are not applicable to the Institutional Class shares. The Service Class shares annual returns are substantially similar to what the Administrator and Institutional Class shares would be because the shares are invested in the same portfolio of securities and the annual returns differ only to the extent that the Classes do not have the same fees and expenses. Performance shown for the Service Class shares of the Wells Fargo Government Money Market Fund for periods prior to November 8, 1999, reflects performance of the Service Class (formerly Single Class) shares, adjusted for expenses, of the Norwest Advantage U.S. Government Fund (the accounting survivor of a merger of the Norwest Advantage U.S. Government Fund and the Stagecoach Government Money Market), its predecessor fund. Effective at the close of business November 5, 1999, the Stagecoach Funds and the Norwest Advantage Funds were reorganized into the Wells Fargo Funds.
2 The iMoneyNet Government Institutional Money Fund Average is an average of governmental institutional funds.
3 Portfolio holdings and characteristics are subject to change.
7
WELLSFARGOMONEYMARKETFUNDS | | PERFORMANCEHIGHLIGHTS |
|
WELLSFARGONATIONALTAX-FREEMONEYMARKETFUND —INSTITUTIONALANDSERVICECLASSES
INVESTMENT OBJECTIVE
The Wells Fargo National Tax-Free Money Market Fund (the Fund) seeks to provide high current income exempt from federal income taxes, while preserving capital and liquidity.
FUNDMANAGERS
Dave Sylvester
Julio Bonilla
INCEPTIONDATE
01/07/88
AVERAGE ANNUAL TOTAL RETURN1 (%) (AS OF SEPTEMBER 30, 2003)
| | | 6-Month* | | | 1-Year | | | 5-Year | | | 10-Year | |
| | | | |
Wells Fargo National Tax-Free Money Market Fund – Institutional Class | | 0.43 | | | 0.96 | | | 2.46 | | | 2.84 | |
| | | | |
Wells Fargo National Tax-Free Money Market Fund – Service Class | | 0.32 | | | 0.78 | | | 2.33 | | | 2.78 | |
| | | | |
Benchmark | | | | | | | | | | | | |
| | | | |
iMoneyNet Tax-Free Institutional Money Fund Average2 | | 0.33 | % | | 0.79 | % | | 2.43 | % | | 3.09 | % |
| * | | Returns for periods of less than one year are not annualized. |
| FUND YIELD SUMMARY (AS OF SEPTEMBER 30, 2003) |
|
| | | Institutional | | Service |
| | |
7-Day Current Yield | | 0.92% | | 0.67% |
| | |
7-Day Compound Yield | | 0.92% | | 0.67% |
| | |
30-Day Simple Yield | | 0.80% | | 0.55% |
| | |
30-Day Compound Yield | | 0.81% | | 0.56% |
| FUND CHARACTERISTICS3 (AS OF SEPTEMBER 30, 2003) |
|
| |
Weighted Average Maturity | | 37 days |
| |
Number of Holdings | | 316 |
PORTFOLIO COMPOSITION3 (AS OF SEPTEMBER 30, 2003)
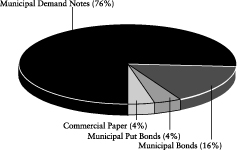
MATURITY DISTRIBUTION3 (AS OF SEPTEMBER 30, 2003)
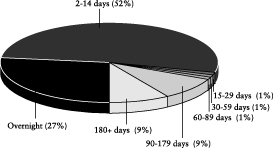
The Fund is sold without a front-end sales charge or contingent deferred sales charge. Other fees and expenses apply to a continued investment in the Fund and are described in the Fund’s Statement of Additional Information. An investment in a Wells Fargo Money Market Fund is not insured or guaranteed by the Federal Deposit Insurance Corporation or any other government agency. Although the Wells Fargo Money Market Funds seek to preserve the value of your investment at $1.00 per share, it is possible to lose money by investing in money market funds.
1 Figures quoted represent past performance, which is no guarantee of future results. Investment returns will fluctuate. The Fund’s yield figures more closely reflect the current earnings of the Fund than the total return figures. The Fund’s Adviser has committed through July 31, 2004 to waive fees and/or reimburse expenses to the extent necessary to maintain a certain net operating expense ratio for the Fund. Actual reductions of operating expenses can increase total return to shareholders. Without these reductions, the Fund’s 7-day current yield would have been 0.86% for the Institutional Class shares and 0.57% for the Service Class shares.
Performance shown for the Institutional and Service Class shares of the Wells Fargo National Tax-Free Money Market Fund for the periods prior to November 8, 1999, reflects performance of the Service Class (formerly Institutional Class) shares of the Norwest Advantage Municipal Money Market Fund (the accounting survivor of a merger of the Norwest Municipal Money Market Fund and the Stagecoach National Tax-Free Money Market Fund), its predecessor fund. Effective at the close of business November 5, 1999, the Stagecoach and Norwest Advantage Funds were reorganized into the Wells Fargo Funds.
2 The iMoneyNet Tax-Free Institutional Money Fund Average is an average of national and state tax-free and institutional municipal money funds. Portfolio holdings of tax-free funds include rated and unrated demand notes, rated and unrated general market notes, commercial paper, put bonds under six months, put bonds over six months, AMT paper and other tax-free holdings. It is made up of funds in the National Tax-Free Institutional and State Specific Institutional categories.
3 Portfolio holdings and characteristics are subject to change.
8
| PERFORMANCEHIGHLIGHTS | | WELLSFARGOMONEYMARKETFUNDS |
|
WELLSFARGOPRIMEINVESTMENTMONEYMARKETFUND —INSTITUTIONALANDSERVICECLASSES
INVESTMENT OBJECTIVE
The Wells Fargo Prime Investment Money Market Fund (the Fund) seeks high current income consistent with the preservation of capital and liquidity.
FUNDMANAGERS
Dave Sylvester
Laurie White
INCEPTIONDATE
09/02/98
AVERAGE ANNUAL TOTAL RETURN1 (%) (AS OF SEPTEMBER 30, 2003)
| | | 6-Month* | | 1-Year | | 5-Year | | Life of Fund |
| | | | |
Wells Fargo Prime Investment Money Market Fund – Institutional Class | | 0.38 | | 0.86 | | 3.55 | | 3.58 |
| | | | |
Wells Fargo Prime Investment Money Market Fund – Service Class | | 0.32 | | 0.80 | | 3.54 | | 3.57 |
| | | | |
Benchmark | | | | | | | | |
| | | | |
iMoneyNet First Tier Institutional Money Fund Average2 | | 0.41 | | 0.99 | | 4.02 | | 4.06 |
| * | | Returns for periods of less than one year are not annualized. |
| FUND YIELD SUMMARY (AS OF SEPTEMBER 30, 2003) |
|
| | | Institutional
Class | | Service
Class |
| | |
7-Day Current Yield | | 0.90% | | 0.57% |
| | |
7-Day Compound Yield | | 0.90% | | 0.57% |
| | |
30-Day Simple Yield | | 0.87% | | 0.54% |
| | |
30-Day Compound Yield | | 0.87% | | 0.54% |
| FUND CHARACTERISTICS3 (AS OF SEPTEMBER 30, 2003) |
|
| |
Weighted Average Maturity | | 46 days |
| |
Number of Holdings | | 46 |
PORTFOLIO COMPOSITION3 (AS OF SEPTEMBER 30, 2003)
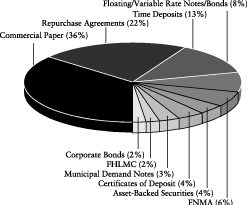
MATURITY DISTRIBUTION3 (AS OF SEPTEMBER 30, 2003)
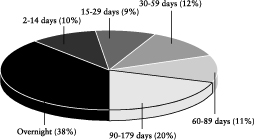
The Fund is sold without a front-end sales charge or contingent deferred sales charge. Other fees and expenses apply to a continued investment in the Fund and are described in the Fund’s Statement of Additional Information. An investment in a Wells Fargo Money Market Fund is not insured or guaranteed by the Federal Deposit Insurance Corporation or any other government agency. Although the Wells Fargo Money Market Funds seek to preserve the value of your investment at $1.00 per share, it is possible to lose money by investing in money market funds.
1 Figures quoted represent past performance, which is no guarantee of future results. Investment returns will fluctuate. The Fund’s yield figures more closely reflect the current earnings of the Fund than the total return figures. The Fund’s Adviser has committed through July 31, 2004 to waive fees and/or reimburse expenses to the extent necessary to maintain a certain net operating expense ratio for the Fund. Actual reductions of operating expenses can increase total return to shareholders. Without these reductions, the Fund’s 7-day current yield would have been 0.86% for the Institutional Class shares and 0.57% for the Service Class shares.
Performance shown for the Institutional Class shares of the Wells Fargo Prime Investment Money Market Fund for periods prior to July 28, 2003 reflects performance of the Fund’s Service Class shares, and includes fees and expenses that are not applicable to the Institutional Class shares. The Service Class shares annual returns are substantially similar to what the Institutional Class shares would be because the shares are invested in the same portfolio of securities and the annual returns differ only to the extent that the Classes do not have the same fees and expenses. Performance shown for the Service Class shares of the Wells Fargo Prime Investment Money Market Fund for periods prior to November 8, 1999, reflects performance of the Service (formerly Public Entities) shares of the Norwest Advantage Ready Cash Investment Fund, its predecessor fund. Effective at the close of business November 5, 1999, the Norwest Advantage Funds were reorganized into the Wells Fargo Funds.
2 The iMoneyNet First Tier Institutional Money Fund Average is an average of non-governmental institutional funds that do not hold any second tier securities. Portfolio holdings of first tier funds include U.S. Treasury securities, U.S. other securities, repos, time deposits, domestic bank obligations, foreign bank obligations, first tier commercial paper, floating rate notes and asset-backed commercial paper.
3 Portfolio holdings and characteristics are subject to change.
9
WELLSFARGOMONEYMARKETFUNDS | | PERFORMANCEHIGHLIGHTS |
|
WELLSFARGOTREASURYPLUSMONEYMARKETFUND —INSTITUTIONALANDSERVICECLASSES
INVESTMENT OBJECTIVE
The Wells Fargo Treasury Plus Money Market Fund (the Fund) seeks current income and stability of principal.
FUNDMANAGERS
Dave Sylvester
Laurie White
INCEPTIONDATE
10/01/85
AVERAGE ANNUAL TOTAL RETURN1 (%) (AS OF SEPTEMBER 30, 2003)
| | | 6-Month* | | 1-Year | | 5-Year | | 10-Year |
| | | | |
Wells Fargo Treasury Plus Money Market Fund—Institutional Class | | 0.47 | | 1.09 | | 3.63 | | 4.28 |
| | | | |
Wells Fargo Treasury Plus Money Market Fund—Service Class | | 0.33 | | 0.83 | | 3.40 | | 4.11 |
| | | | |
Benchmark | | | | | | | | |
| | | | |
iMoneyNet Treasury & Repo Institutional Money Fund Average2 | | 0.34 | | 0.84 | | 3.70 | | 5.07 |
| | | | |
91 Day U.S. Treasury Bill3 | | 0.84 | | 1.89 | | 4.54 | | 5.01 |
| * | | Returns for periods of less than one year are not annualized. |
| FUND YIELD SUMMARY (AS OF SEPTEMBER 30, 2003) |
|
| | | Institutional
Class | | Service
Class |
| | |
7-Day Current Yield | | 0.84% | | 0.54% |
| | |
7-Day Compound Yield | | 0.84% | | 0.54% |
| | |
30-Day Simple Yield | | 0.83% | | 0.53% |
| | |
30-Day Compound Yield | | 0.84% | | 0.53% |
| FUND CHARACTERISTICS4 (AS OF SEPTEMBER 30, 2003) |
|
| |
Average Maturity | | 51 days |
| |
Number of Holdings | | 32 |
PORTFOLIO COMPOSITION4 (AS OF SEPTEMBER 30, 2003)
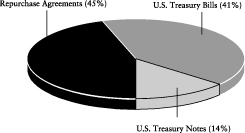
MATURITY DISTRIBUTION4 (AS OF SEPTEMBER 30, 2003)
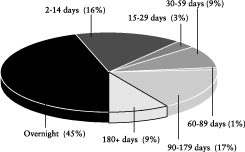
The Fund is sold without a front-end sales charge or contingent deferred sales charge. Other fees and expenses apply to a continued investment in the Fund and are described in the Fund’s Statement of Additional Information. An investment in a Wells Fargo Money Market Fund is not insured or guaranteed by the Federal Deposit Insurance Corporation or any other government agency. Although the Wells Fargo Money Market Funds seek to preserve the value of your investment at $1.00 per share, it is possible to lose money by investing in money market funds. The U.S. Treasury guarantee applies to the underlying securities and NOT to shares of the Fund.
1 Figures quoted represent past performance, which is no guarantee of future results. Investment returns will fluctuate. The Fund’s yield figures more closely reflect the current earnings of the Fund than the total return figures. The Fund’s Adviser has committed through July 31, 2004 to waive fees and/or reimburse expenses to the extent necessary to maintain a certain net operating expense ratio for the Fund. Actual reductions of operating expenses can increase total return to shareholders. Without these reductions, the Fund’s 7-day current yield would have been 0.78% for the Institutional Class shares and 0.49% for the Service Class shares.
Performance shown for the Institutional and Service Class shares of the Wells Fargo Treasury Plus Money Market Fund for the periods prior to November 8, 1999, reflects performance of the Institutional and Service Class shares, respectively, of the Stagecoach Treasury Plus Money Market Fund (the accounting survivor of a merger between the Norwest Advantage Treasury Plus Fund and the Stagecoach Treasury Plus Money Market Fund), its predecessor Fund. Effective at the close of business November 5, 1999, the Stagecoach and Norwest Advantage Funds were reorganized into the Wells Fargo Funds.
Performance shown for the periods between September 6, 1996 and October 1, 1995, reflects performance of the Pacific American U.S. Treasury Portfolio, the predecessor portfolio. In July 1995, the Pacific American U.S. Treasury Portfolio was renamed the Pacifica Treasury Money Market Fund. For the periods prior to October 1, 1995, the performance shown reflects the performance of the shares of the predecessor portfolio.
2 The iMoneyNet Treasury & Repo Institutional Money Fund Average is an average of institutional government funds that hold U.S. Treasury securities and repurchase agreements backed by the U.S. Treasury.
3 Estimated monthly return (12th root of annualized discount rate) which is based on the discount rate quoted on the last business day of the month of 91 day U.S. Treasury Bills. These figures are calculated on a 365 day basis.
4 Portfolio holdings and characteristics are subject to change.
10
| PERFORMANCEHIGHLIGHTS | | WELLSFARGOMONEYMARKETFUNDS |
|
WELLSFARGO 100%TREASURYMONEYMARKETFUND —SERVICE CLASS
INVESTMENT OBJECTIVE
The Wells Fargo 100% Treasury Money Market Fund (the Fund) seeks stability of principal and current income that is exempt from most state and local individual income taxes.
FUNDMANAGERS
Dave Sylvester
Laurie White
INCEPTIONDATE
12/03/90
AVERAGE ANNUAL TOTAL RETURN1 (%) (AS OF SEPTEMBER 30, 2003)
| | | 6-Month* | | 1-Year | | 5-Year | | 10-Year |
| | | | |
Wells Fargo 100% Treasury Money Market Fund – Service Class | | 0.30 | | 0.79 | | 3.29 | | 3.95 |
| | | | |
Benchmarks | | | | | | | | |
| | | | |
iMoneyNet Treasury Institutional Money Fund Average2 | | 0.34 | | 0.85 | | 3.64 | | 5.00 |
| | | | |
91 Day U.S. Treasury Bill3 | | 0.84 | | 1.89 | | 4.54 | | 5.01 |
| * | | Returns for periods of less than one year are not annualized. |
| FUND YIELD SUMMARY | | |
|
| |
7-Day Current Yield | | 0.46% |
| |
7-Day Compound Yield | | 0.47% |
| |
30-Day Simple Yield | | 0.47% |
| |
30-Day Compound Yield | | 0.47% |
| FUND CHARACTERISTICS4 (AS OF SEPTEMBER 30, 2003) |
|
| |
Weighted Average Maturity | | 53 days |
| |
Number of Holdings | | 31 |
PORTFOLIO COMPOSITION4 (AS OF SEPTEMBER 30, 2003)
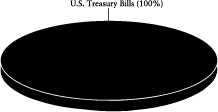
MATURITY DISTRIBUTION4 (AS OF SEPTEMBER 30, 2003)
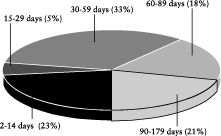
The Fund is sold without a front-end sales charge or contingent deferred sales charge. Other fees and expenses apply to a continued investment in the Fund and are described in the Fund’s Statement of Additional Information. An investment in a Wells Fargo Money Market Fund is not insured or guaranteed by the Federal Deposit Insurance Corporation or any other government agency. Although the Wells Fargo Money Market Funds seek to preserve the value of your investment at $1.00 per share, it is possible to lose money by investing in money market funds.
1 Figures quoted represent past performance, which is no guarantee of future results. Investment returns will fluctuate. The Fund’s yield figures more closely reflect the current earnings of the Fund than the total return figures. The Fund’s Adviser has committed through July 31, 2004 to waive fees and/or reimburse expenses to the extent necessary to maintain a certain net operating expense ratio for the Fund. Actual reductions of operating expenses can increase total return to shareholders. Without these reductions, the Fund’s 7-day current yield would have been 0.43%.
Performance shown for the Service Class of the Wells Fargo 100% Treasury Money Market Fund for periods prior to November 8, 1999, reflects performance of the Service Class (formerly Single Class) shares, adjusted for expenses, of the Norwest Advantage Treasury Fund, its predecessor fund. Effective at the close of business November 5, 1999, the Norwest Advantage Funds were reorganized into the Wells Fargo Funds.
2 The iMoneyNet Treasury Institutional Money Fund Average includes only institutional funds that hold 100% in U.S. Treasury securities.
3 Estimated monthly return (12th root of annualized discount rate) which is based on the discount rate quoted on the last business day of the month of 91 day U.S. Treasury Bills. These figures are calculated on a 365 day basis.
4 Portfolio holdings and characteristics are subject to change.
11
| WELLSFARGOMONEYMARKETFUNDS | | PORTFOLIOOFINVESTMENTS — SEPTEMBER 30, 2003 (UNAUDITED) |
|
CALIFORNIATAX-FREEMONEYMARKETFUND
| Principal | | Security Name | | Interest Rate | | | Maturity Date | | Value |
| | | |
| Municipal Securities – 99.85% | | | | | | | | |
| | | |
| California – 93.77% | | | | | | | | |
| | | | |
| $ | 6,000,000 | | ABAG Finance Authority For Nonprofit Corporations California Housing Revenue Series A Societe Generale LOC§ | | 1.10 | % | | 07/01/2008 | | $ | 6,000,000 |
| | | | |
| | 9,865,000 | | ABAG Finance Authority For Nonprofit Corporations California MFHR Gaia Building Project Series A Collateralized By FNMA§ | | 1.05 | | | 09/15/2032 | | | 9,865,000 |
| | | | |
| | 1,150,000 | | Alameda County CA CTFS Participation Santa Rita Jail Project Lease Revenue Prerefunded 12/01/03 @ 102 MBIA Insured§ | | 5.70 | | | 12/01/2014 | | | 1,181,779 |
| | | | |
| | 5,500,000 | | Alvord CA University School District CTFS Participation Food Services Bridge Funding Program Lease Revenue FSA Insured§ | | 1.05 | | | 06/01/2037 | | | 5,500,000 |
| | | | |
| | 4,400,000 | | Anaheim CA CTFS Participation Lease Revenue AMBAC Insured§ | | 1.00 | | | 08/01/2019 | | | 4,400,000 |
| | | | |
| | 3,900,000 | | Anaheim CA Housing Authority MFHR Collateralized By FNMA§ | | 1.10 | | | 07/15/2020 | | | 3,900,000 |
| | | | |
| | 10,244,000 | | Anaheim CA Housing Authority MFHR Fountain Anaheim Hills Series A Collateralized By FNMA§ | | 1.15 | | | 02/15/2033 | | | 10,244,000 |
| | | | |
| | 4,345,000 | | Anaheim CA Housing Authority MFHR Monterrey Apartments Series B Collateralized By FNMA§ | | 1.10 | | | 05/15/2027 | | | 4,345,000 |
| | | | |
| | 6,300,000 | | Anaheim CA Housing Authority MFHR Sea Wind Apartments Project Series C Collateralized By FNMA§ | | 1.15 | | | 07/15/2033 | | | 6,300,000 |
| | | | |
| | 8,160,000 | | Anaheim CA Public Financing Authority Lease Revenue FSA Insured§ | | 1.13 | | | 09/01/2024 | | | 8,160,000 |
| | | | |
| | 37,000,000 | | Bay Area Toll Authority CA Toll Bridge Revenue San Francisco Bay Area Project Series A AMBAC Insured§ | | 1.00 | | | 04/01/2036 | | | 37,000,000 |
| | | | |
| | 4,300,000 | | Bay Area Toll Authority CA Toll Bridge Revenue San Francisco Bay Area Series B§ | | 1.00 | | | 04/01/2029 | | | 4,300,000 |
| | | | |
| | 700,000 | | Bay Area Toll Authority California Toll Bridge Revenue San Francisco Bay Area Project Series C AMBAC Insured§ | | 1.05 | | | 04/01/2037 | | | 700,000 |
| | | | |
| | 11,000,000 | | Buena Park CA MFHR Walden Glen Apartments Project Series A§ | | 1.15 | | | 02/15/2033 | | | 11,000,000 |
| | | | |
| | 13,000,000 | | California Cities Home Ownership Authority Housing Revenue Lease Purchase Program Project Series A Collateralized By FHLMC§ | | 1.10 | | | 09/01/2006 | | | 13,000,000 |
| | | | |
| | 3,000,000 | | California Communities Housing Finance Agency Lease Revenue Series A Collateralized By FHLMC§ | | 1.10 | | | 02/01/2007 | | | 3,000,000 |
| | | | |
| | 2,420,000 | | California Educational Facilities Authority Revenue CTFS Series 113 General Obligation of University§ | | 1.08 | | | 12/01/2027 | | | 2,420,000 |
| | | | |
| | 10,500,000 | | California Educational Facilities Authority Revenue Loyola Maramount University Series B MBIA Insured§ | | 1.10 | | | 10/01/2027 | | | 10,500,000 |
| | | | |
| | 8,290,000 | | California Educational Facilities Authority Revenue Santa Clara University Series B MBIA Insured§ | | 1.10 | | | 02/01/2032 | | | 8,290,000 |
| | | | |
| | 980,000 | | California HFA Revenue CTFS Series 150 MBIA Insured§ | | 1.13 | | | 02/01/2029 | | | 980,000 |
| | | | |
| | 75,000 | | California HFA Revenue CTFS Series 412 AMBAC Insured§ | | 1.13 | | | 08/01/2029 | | | 75,000 |
| | | | |
| | 3,400,000 | | California HFA Revenue Home Mortgage Series B§ | | 1.28 | | | 08/01/2033 | | | 3,400,000 |
| | | | |
| | 5,800,000 | | California HFA Revenue Home Mortgage Series M§ | | 1.20 | | | 08/01/2033 | | | 5,800,000 |
| | | | |
| | 4,415,000 | | California HFA Revenue Home Mortgage Series U§ | | 1.10 | | | 02/01/2017 | | | 4,415,000 |
| | | | |
| | 10,925,000 | | California HFA Revenue Home Mortgage Series U§ | | 1.14 | | | 02/01/2031 | | | 10,925,000 |
| | | | |
| | 31,960,000 | | California HFA Revenue Home Mortgages FSA Insured§ | | 1.14 | | | 02/01/2032 | | | 31,960,000 |
| | | | |
| | 6,800,000 | | California HFA Revenue Home Mortgages Series F FSA Insured§ | | 1.07 | | | 02/01/2034 | | | 6,800,000 |
| | | | |
| | 5,600,000 | | California HFA Revenue Home Mortgages Series M§ | | 1.20 | | | 02/01/2025 | | | 5,600,000 |
| | | | |
| | 1,470,000 | | California HFA Revenue MBIA Insured§ | | 1.15 | | | 08/01/2016 | | | 1,470,000 |
| | | | |
| | 9,100,000 | | California HFA Revenue MFHR Series D§ | | 1.23 | | | 02/01/2031 | | | 9,100,000 |
| | | | |
| | 2,050,000 | | California HFA Revenue Series 112-A§ | | 1.15 | | | 08/01/2026 | | | 2,050,000 |
| | | | |
| | 6,900,000 | | California HFA Revenue Series F§ | | 1.20 | | | 02/01/2033 | | | 6,900,000 |
| | | | |
| | 17,800,000 | | California HFFA Revenue Adventist Health Systems Series B KBC Bank NV LOC§ | | 1.20 | | | 09/01/2025 | | | 17,800,000 |
12
| PORTFOLIOOFINVESTMENTS — SEPTEMBER 30, 2003 (UNAUDITED) | | WELLSFARGOMONEYMARKETFUNDS |
|
CALIFORNIATAX-FREEMONEYMARKETFUND
| Principal | | Security Name | | Interest Rate | | | Maturity Date | | Value |
| | | |
| California (continued) | | | | | | | | |
| | | | |
| $ | 2,845,000 | | California HFFA Revenue CTFS Series 26 FSA Insured§ | | 1.08 | % | | 06/01/2022 | | $ | 2,845,000 |
| | | | |
| | 7,200,000 | | California HFFA Revenue Scripps Health Series A Bank One NA LOC§ | | 1.05 | | | 10/01/2023 | | | 7,200,000 |
| | | | |
| | 13,155,000 | | California HFFA Revenue Series A MBIA Insured§ | | 1.20 | | | 09/01/2028 | | | 13,155,000 |
| | | | |
| | 8,530,000 | | California HFFA Revenue Series B MBIA Insured§ | | 1.20 | | | 09/01/2028 | | | 8,530,000 |
| | | | |
| | 7,120,000 | | California HFFA Revenue Series C MBIA Insured§ | | 1.20 | | | 09/01/2015 | | | 7,120,000 |
| | | | |
| | 15,500,000 | | California Infrastructure & Economic Development Bank Revenue J Paul Getty Series D§ | | 1.00 | | | 04/01/2033 | | | 15,500,000 |
| | | | |
| | 18,000,000 | | California Infrastructure & Economic Development Bank Series 2002 | | 0.80 | | | 11/19/2003 | | | 18,000,000 |
| | | | |
| | 15,000,000 | | California Infrastructure & Economic Development Bank Series 2002 | | 0.80 | | | 12/09/2003 | | | 15,000,000 |
| | | | |
| | 76,000,000 | | California School Cash Reserve Program Authority Pool Series A | | 2.00 | | | 07/06/2004 | | | 76,632,672 |
| | | | |
| | 8,300,000 | | California State Department Water Reserve & Power Supply Revenue Series 764 FSA Insured§ | | 1.08 | | | 05/01/2012 | | | 8,300,000 |
| | | | |
| | 29,200,000 | | California State Department Water Reserve & Power Supply Revenue Series B-1 Bank of New York LOC§ | | 1.20 | | | 05/01/2022 | | | 29,200,000 |
| | | | |
| | 24,400,000 | | California State Department Water Reserve & Power Supply Revenue Series B-4 Bayerische Landesbank LOC§ | | 1.15 | | | 05/01/2022 | | | 24,400,000 |
| | | | |
| | 1,900,000 | | California State Department Water Reserve & Power Supply Revenue Series B-5 Bayerische Landesbank LOC§ | | 1.15 | | | 05/01/2022 | | | 1,900,000 |
| | | | |
| | 26,800,000 | | California State Department Water Reserve & Power Supply Revenue Series C-14 Westdeutsche Landesbank LOC§ | | 1.10 | | | 05/01/2022 | | | 26,800,000 |
| | | | |
| | 17,800,000 | | California State Department Water Reserve & Power Supply Revenue Series C-3 AMBAC Insured§ | | 1.05 | | | 05/01/2022 | | | 17,800,000 |
| | | | |
| | 9,000,000 | | California State Department Water Reserve Center Valley Project Revenue Putters Series 127 FGIC Insured§ | | 1.10 | | | 12/01/2022 | | | 9,000,000 |
| | | | |
| | 3,200,000 | | California State Economic Development Financing Authority Industrial Development Revenue Serra Microchassis Project US Bank NA LOC§ | | 1.20 | | | 08/01/2027 | | | 3,200,000 |
| | | | |
| | 2,005,000 | | California State Economic Development Financing Authority Industrial Development Revenue Serra Mission Project Series A US Bank NA LOC§ | | 1.20 | | | 08/01/2027 | | | 2,005,000 |
| | | | |
| | 4,995,000 | | California State Floater CTFS Series 471X MBIA Insured§ | | 1.13 | | | 09/01/2024 | | | 4,995,000 |
| | | | |
| | 9,000,000 | | California State Floats PA 315 FSA Insured§ | | 1.15 | | | 12/01/2003 | | | 9,000,000 |
| | | | |
| | 1,420,000 | | California State Floats PT 153A§ | | 1.15 | | | 12/01/2008 | | | 1,420,000 |
| | | | |
| | 11,500,000 | | California State Merlots-B 45 Wachovia Bank Insured§ | | 1.09 | | | 10/01/2029 | | | 11,500,000 |
| | | | |
| | 10,395,000 | | California State Public Works Board Lease Revenue CTFS Series 210 AMBAC Insured§ | | 1.08 | | | 01/01/2011 | | | 10,395,000 |
| | | | |
| | 19,570,000 | | California State Public Works Board Lease Revenue CTFS Series D AMBAC Insured§ | | 1.11 | | | 12/01/2019 | | | 19,570,000 |
| | | | |
| | 8,875,000 | | California State Public Works Board Lease Revenue Roc Series II-R-133 AMBAC Insured§ | | 1.11 | | | 12/01/2014 | | | 8,875,000 |
| | | | |
| | 4,205,000 | | California State Public Works Board Lease Revenue Roc Series II-R-160 AMBAC Insured§ | | 1.11 | | | 10/01/2012 | | | 4,205,000 |
| | | | |
| | 6,425,000 | | California State Putters Series 239Z AMBAC Insured§ | | 1.13 | | | 12/01/2032 | | | 6,425,000 |
| | | | |
| | 26,400,000 | | California State Series C-1 Bank of America NA LOC§ | | 1.10 | | | 05/01/2033 | | | 26,400,000 |
| | | | |
| | 20,800,000 | | California Statewide CDA Davis Retirement Care Project§ | | 1.20 | | | 11/15/2028 | | | 20,800,000 |
| | | | |
| | 6,400,000 | | California Statewide CDA MFHR Canyon Country Apartments Series M Collaterlized By FHLMC§ | | 1.15 | | | 12/01/2034 | | | 6,400,000 |
| | | | |
| | 6,750,000 | | California Statewide CDA MFHR Crocker Oaks Apartments Projectseries H Collateralized By FNMA§ | | 1.15 | | | 03/15/2034 | | | 6,750,000 |
13
| WELLSFARGOMONEYMARKETFUNDS | | PORTFOLIOOFINVESTMENTS — SEPTEMBER 30, 2003 (UNAUDITED) |
|
CALIFORNIATAX-FREEMONEYMARKETFUND
| Principal | | Security Name | | Interest Rate | | | Maturity Date | | Value |
| | | |
| California (continued) | | | | | | | | |
| | | | |
| $ | 3,985,000 | | California Statewide CDA MFHR Granite Oaks Apartments Series R Collateralized By FNMA§ | | 1.15 | % | | 10/15/2030 | | $ | 3,985,000 |
| | | | |
| | 2,160,000 | | California Statewide CDA MFHR Greenback Manorapartments Series A Collateralized By FHLB§ | | 1.10 | | | 02/01/2028 | | | 2,160,000 |
| | | | |
| | 17,200,000 | | California Statewide CDA MFHR IAC Project Series W-1 Bank of America
NA LOC§ | | 1.10 | | | 08/01/2034 | | | 17,200,000 |
| | | | |
| | 2,800,000 | | California Statewide CDA MFHR IAC Project Series W-2 Bank of America
NA LOC§ | | 1.10 | | | 09/15/2029 | | | 2,800,000 |
| | | | |
| | 700,000 | | California Statewide CDA MFHR IAC Project Series W-3 Bank of America
NA LOC§ | | 1.10 | | | 04/01/2025 | | | 700,000 |
| | | | |
| | 13,700,000 | | California Statewide CDA Revenue Childrens Hospital of Los Angeles Series Bambac Insured§ | | 1.00 | | | 08/15/2032 | | | 13,700,000 |
| | | | |
| | 9,180,000 | | California Statewide CDA Revenue CTFS Participation House Ear Institute JP Morgan Chase & Company LOC§ | | 1.20 | | | 12/01/2018 | | | 9,180,000 |
| | | | |
| | 1,000,000 | | California Statewide CDA Revenue Fremont Rideout Health Group Series A AMBAC Insured§ | | 1.15 | | | 01/01/2031 | | | 1,000,000 |
| | | | |
| | 10,000,000 | | California Statewide CDA Revenue Series A AMBAC Insured§ | | 1.00 | | | 08/15/2032 | | | 10,000,000 |
| | | | |
| | 37,000,000 | | California Statewide CDA Revenue TRAN Series A-1 FSA Insured§ | | 2.00 | | | 06/30/2004 | | | 37,306,351 |
| | | | |
| | 11,090,000 | | California Statewide CDA Solid Waste Facilities Revenue Chevron USA Project Chevron Corporation LOC§ | | 1.18 | | | 12/15/2024 | | | 11,090,000 |
| | | | |
| | 16,420,000 | | Camarillo CA MFHR Hacienda de Camarillo Project Collateralized By FNMA§ | | 1.15 | | | 10/15/2026 | | | 16,420,000 |
| | | | |
| | 2,400,000 | | Camarillo CA MFHR Heritage Park Project Series A Collateralized By FNMA§ | | 1.10 | | | 07/15/2019 | | | 2,400,000 |
| | | | |
| | 5,000,000 | | Castaic Union School District California CTFS Participation School Facility Bridge Funding Program FSA Insured§ | | 1.05 | | | 09/01/2036 | | | 5,000,000 |
| | | | |
| | 5,100,000 | | Colton CA Redevelopment Agency CTFS Participation Las Palomas Association Project City National Bank LOC§ | | 1.05 | | | 11/01/2015 | | | 5,100,000 |
| | | | |
| | 5,985,000 | | Compton CA University School District Merlots Series B39 MBIA Insured§ | | 1.09 | | | 09/01/2027 | | | 5,985,000 |
| | | | |
| | 7,825,000 | | Contra Costa County CA Home Mortgage Revenue CTFS Series A§ | | 1.15 | | | 12/01/2010 | | | 7,825,000 |
| | | | |
| | 7,000,000 | | Contra Costa County CA MFHR Delta Square Apartments Project Series H Collateralized By FNMA§ | | 1.10 | | | 10/15/2029 | | | 7,000,000 |
| | | | |
| | 745,000 | | Contra Costa County CA MFHR El Cerrito Royale Project Series A Bank of America LOC§ | | 1.10 | | | 12/01/2017 | | | 745,000 |
| | | | |
| | 3,300,000 | | Contra Costa County CA MFHR Lafayette Town Center Apartments Series I Collateralized By FNMA§ | | 1.15 | | | 07/15/2032 | | | 3,300,000 |
| | | | |
| | 1,000,000 | | Contra Costa County CA MFHR Series B Collateralized By FNMA§ | | 1.10 | | | 11/15/2022 | | | 1,000,000 |
| | | | |
| | 32,000,000 | | Contra Costa County CA TRAN Series A | | 2.50 | | | 11/17/2003 | | | 32,043,332 |
| | | | |
| | 1,550,000 | | Covina CA Redevelopment Agency MFHR Shadowhills Apartments Series A Collateralized By FNMA§ | | 1.08 | | | 12/01/2015 | | | 1,550,000 |
| | | | |
| | 2,390,000 | | Eagle Tax-Exempt Trust CTF Series 950501 (California State) MBIA Insured§ | | 1.11 | | | 02/01/2006 | | | 2,390,000 |
| | | | |
| | 4,000,000 | | Eagle Tax-Exempt Trust CTF Series 970503 (California State Public Works Board Lease Revenue Series C) AMBAC Insured§ | | 1.11 | | | 09/01/2017 | | | 4,000,000 |
| | | | |
| | 4,400,000 | | Escondido CA Community Development Common CTFS Participation Bank of America NT & SA LOC§ | | 1.10 | | | 10/01/2016 | | | 4,400,000 |
| | | | |
| | 21,710,000 | | Fresno CA Union School District Anticipation Notes | | 1.10 | | | 02/19/2004 | | | 21,710,336 |
| | | | |
| | 6,865,000 | | Garden Grove CA Housing Authority MFHR Floats PT 1385 Collateralized By GNMA§ | | 1.15 | | | 03/23/2006 | | | 6,865,000 |
| | | | |
| | 2,725,000 | | Golden Gate Bridge Highway & Transportation District Morgan Guaranty Trust Company of New York LOC | | 0.85 | | | 10/08/2003 | | | 2,725,000 |
| | | | |
| | 4,000,000 | | Hayward CA MFHR Shorewood Series A FGIC Insured§ | | 1.05 | | | 08/01/2014 | | | 4,000,000 |
14
| PORTFOLIOOFINVESTMENTS — SEPTEMBER 30, 2003 (UNAUDITED) | | WELLSFARGOMONEYMARKETFUNDS |
|
CALIFORNIATAX-FREEMONEYMARKETFUND
| Principal | | Security Name | | Interest Rate | | | Maturity Date | | Value |
| | | |
| California (continued) | | | | | | | | |
| | | | |
| $ | 3,700,000 | | Hayward CA MFHR Tennyson Gardens Apartments Project Series A US Bank
NA LOC§ | | 1.20 | % | | 08/01/2032 | | $ | 3,700,000 |
| | | | |
| | 1,000,000 | | Hemet CA MFHR Sunwest Retirement Series A Collateralized By FHLMC§ | | 1.10 | | | 01/01/2025 | | | 1,000,000 |
| | | | |
| | 1,760,000 | | Irvine CA Industrial Revenue Irvine East Investment Company Project Bank of America NA LOC§ | | 1.05 | | | 12/01/2005 | | | 1,760,000 |
| | | | |
| | 6,600,000 | | Irvine Ranch CA Water District CTFS Participation Capital Improvement Project Landesbank Baden LOC§ | | 1.15 | | | 08/01/2016 | | | 6,600,000 |
| | | | |
| | 2,000,000 | | Irvine Ranch CA Water District State Street B&T Company LOC§ | | 1.15 | | | 01/01/2021 | | | 2,000,000 |
| | | | |
| | 5,500,000 | | Lancaster CA Redevelopment Agency MFHR 20Th Street Apartments Project Series C Collateralized By FNMA§ | | 1.10 | | | 12/01/2026 | | | 5,500,000 |
| | | | |
| | 4,450,000 | | Livermore CA Redevelopment Agency MFHR Series 2002A Livermore Apartments Project Bank of America NA LOC§ | | 1.25 | | | 11/01/2040 | | | 4,450,000 |
| | | | |
| | 2,135,000 | | Long Beach CA Harbor Revenue Series 418 FGIC Insured§ | | 1.13 | | | 05/15/2020 | | | 2,135,000 |
| | | | |
| | 2,800,000 | | Long Beach CA Hbr Rev PA 651 FGIC Insured§ | | 1.15 | | | 05/15/2019 | | | 2,800,000 |
| | | | |
| | 7,140,000 | | Los Angeles CA Community Redevelopment Agency MFHR Series A Rowan Lofts Project FNMA Insured§ | | 1.15 | | | 12/01/2034 | | | 7,140,000 |
| | | | |
| | 12,000,000 | | Los Angeles CA Convention & Exhibition Center Authority Lease Revenue Series C1 AMBAC Insured§ | | 0.97 | | | 08/15/2021 | | | 12,000,000 |
| | | | |
| | 6,305,000 | | Los Angeles CA Convention & Exhibition Center Authority Lease Revenue Series D AMBAC Insured§ | | 0.97 | | | 08/15/2021 | | | 6,305,000 |
| | | | |
| | 12,000,000 | | Los Angeles CA Department of Airports Revenue Series C1 Los Angeles International Airport§ | | 1.05 | | | 05/15/2020 | | | 12,000,000 |
| | | | |
| | 6,795,000 | | Los Angeles CA Harbor Department Revenue Transportation Receipts Class F Series 7 MBIA Insured§ | | 1.11 | | | 11/01/2026 | | | 6,795,000 |
| | | | |
| | 7,300,000 | | Los Angeles CA MFHR Broadway Plaza Project Series L§ | | 1.10 | | | 12/01/2034 | | | 7,300,000 |
| | | | |
| | 2,500,000 | | Los Angeles CA MFHR Fountain Park Project Series P§ | | 1.05 | | | 04/15/2033 | | | 2,500,000 |
| | | | |
| | 3,700,000 | | Los Angeles CA MFHR LA Bera Apartment Project Series G Citibank NA LOC§ | | 1.05 | | | 12/01/2030 | | | 3,700,000 |
| | | | |
| | 100,000 | | Los Angeles CA MFHR Loans To Lenders Program Series A FHLB LOC§ | | 1.25 | | | 08/01/2026 | | | 100,000 |
| | | | |
| | 5,300,000 | | Los Angeles CA MFHR Masselin Manor Housing Project Bank of America Nt &
SA LOC§ | | 1.10 | | | 07/01/2015 | | | 5,300,000 |
| | | | |
| | 9,000,000 | | Los Angeles CA Union School District COP Multiple Properties Project Series B§ | | 2.25 | | | 10/01/2003 | | | 9,000,000 |
| | | | |
| | 18,300,000 | | Los Angeles CA Union School District Merlots Series A22§ | | 1.09 | | | 07/01/2022 | | | 18,300,000 |
| | | | |
| | 5,000,000 | | Los Angeles CA Union School District Merlots Series B12§ | | 1.09 | | | 01/01/2027 | | | 5,000,000 |
| | | | |
| | 55,500,000 | | Los Angeles CA Union School District TRAN Series A | | 2.00 | | | 07/01/2004 | | | 55,944,576 |
| | | | |
| | 5,000,000 | | Los Angeles CA Wastewater System Sewer Revenue ROCS RR II R 4034§ | | 1.11 | | | 06/01/2022 | | | 5,000,000 |
| | | | |
| | 10,200,000 | | Los Angeles CA Wastewater System Sewer Revenue Series A FGIC Insured§ | | 1.25 | | | 12/01/2031 | | | 10,200,000 |
| | | | |
| | 8,600,000 | | Los Angeles CA Wastewater System Sewer Revenue Series B FGIC Insured§ | | 1.25 | | | 12/01/2031 | | | 8,600,000 |
| | | | |
| | 5,995,000 | | Los Angeles CA Water & Power Revenue Series 182 FSA Insured§ | | 1.10 | | | 07/01/2022 | | | 5,995,000 |
| | | | |
| | 10,595,000 | | Los Angeles CA Water & Power Revenue Series 184 FSA Insured§ | | 1.10 | | | 07/01/2022 | | | 10,595,000 |
| | | | |
| | 4,200,000 | | Los Angeles CA Water & Power Revenue Subseries A-2§ | | 1.05 | | | 07/01/2035 | | | 4,200,000 |
| | | | |
| | 16,700,000 | | Los Angeles CA Water & Power Revenue Subseries A-4§ | | 1.05 | | | 07/01/2035 | | | 16,700,000 |
| | | | |
| | 6,300,000 | | Los Angeles CA Water & Power Revenue Subseries A-6§ | | 1.05 | | | 07/01/2035 | | | 6,300,000 |
| | | | |
| | 20,000,000 | | Los Angeles CA Water & Power Revenue Subseries A-7§ | | 1.05 | | | 07/01/2035 | | | 20,000,000 |
| | | | |
| | 3,000,000 | | Los Angeles CA Water & Power Revenue Subseries B-1 Dexia Insured§ | | 1.05 | | | 07/01/2035 | | | 3,000,000 |
| | | | |
| | 20,900,000 | | Los Angeles CA Water & Power Revenue Subseries B-2§ | | 1.05 | | | 07/01/2034 | | | 20,900,000 |
| | | | |
| | 20,500,000 | | Los Angeles CA Water & Power Revenue Subseries B-3§ | | 1.18 | | | 07/01/2034 | | | 20,500,000 |
| | | | |
| | 1,450,000 | | Los Angeles CA Water & Power Revenue Subseries B-6§ | | 1.20 | | | 07/01/2034 | | | 1,450,000 |
15
| WELLSFARGOMONEYMARKETFUNDS | | PORTFOLIOOFINVESTMENTS — SEPTEMBER 30, 2003 (UNAUDITED) |
|
CALIFORNIATAX-FREEMONEYMARKETFUND
| Principal | | Security Name | | Interest Rate | | | Maturity Date | | Value |
| | | |
| California (continued) | | | | | | | | |
| | | | |
| $ | 7,100,000 | | Los Angeles CA Water & Power Revenue Subseries B-7§ | | 1.05 | % | | 07/01/2034 | | $ | 7,100,000 |
| | | | |
| | 13,600,000 | | Los Angeles CA Water & Power Revenue Subseries B-8 Bank of America NA LOC§ | | 1.05 | | | 07/01/2034 | | | 13,600,000 |
| | | | |
| | 18,670,000 | | Los Angeles County CA Metropolitan Transportation Authority Revenue FSA Insured§ | | 1.11 | | | 07/01/2016 | | | 18,670,000 |
| | | | |
| | 20,200,000 | | Los Angeles County CA Metropolitan Transportation Authority Revenue FSA Insured§ | | 1.11 | | | 07/01/2021 | | | 20,200,000 |
| | | | |
| | 10,000,000 | | Los Angeles County CA Metropolitan Transportation Authority Revenue FSA Insured§ | | 1.11 | | | 07/01/2025 | | | 10,000,000 |
| | | | |
| | 3,000,000 | | Los Angeles County CA MFHR Authority Revenue P Float PT 639§ | | 1.22 | | | 10/01/2031 | | | 3,000,000 |
| | | | |
| | 5,850,000 | | Los Angeles County CA Pension Obligation Series B§ | | 1.01 | | | 06/30/2007 | | | 5,850,000 |
| | | | |
| | 1,305,000 | | Los Angeles County CA Pension Obligation Series C§ | | 1.00 | | | 06/30/2007 | | | 1,305,000 |
| | | | |
| | 5,000,000 | | Los Angeles County CA Sanitation District Revenue Series A | | 5.25 | | | 10/01/2019 | | | 5,100,000 |
| | | | |
| | 12,800,000 | | Los Angeles County CA Schools TRAN Series A | | 1.75 | | | 06/30/2004 | | | 12,878,504 |
| | | | |
| | 10,000,000 | | Los Angeles County CA Transportation Common Sales Revenue Series A FGIC Insured§ | | 1.00 | | | 07/01/2012 | | | 10,000,000 |
| | | | |
| | 9,055,000 | | Metropolitan Water District Southern CA Waterworks Revenue MBIA Insured§ | | 1.14 | | | 07/01/2030 | | | 9,055,000 |
| | | | |
| | 4,965,000 | | Metropolitan Water District Southern CA Waterworks Revenue Merlots A21§ | | 1.09 | | | 07/01/2021 | | | 4,965,000 |
| | | | |
| | 56,145,000 | | Metropolitan Water District Southern CA Waterworks Revenue Series A§ | | 1.03 | | | 07/01/2025 | | | 56,145,000 |
| | | | |
| | 3,400,000 | | Metropolitan Water District Southern CA Waterworks Revenue Series A AMBAC Insured§ | | 1.05 | | | 06/01/2023 | | | 3,400,000 |
| | | | |
| | 6,850,000 | | Metropolitan Water District Southern CA Waterworks Revenue Series B-3§ | | 1.15 | | | 07/01/2035 | | | 6,850,000 |
| | | | |
| | 11,100,000 | | Modesto CA Irrigation District Financing Authority Revenue Series SG66 MBIA Insured§ | | 1.14 | | | 10/01/2015 | | | 11,100,000 |
| | | | |
| | 6,500,000 | | Modesto CA MFHR Live Oak Apartments Project Collateralized By FNMA§ | | 1.10 | | | 09/15/2024 | | | 6,500,000 |
| | | | |
| | 5,620,000 | | Modesto CA PFA Lease Revenue Series 354 AMBAC Insured§ | | 1.08 | | | 09/01/2029 | | | 5,620,000 |
| | | | |
| | 31,900,000 | | Msr Public Power Agency CA Utility Tax Revenue San Juan Project Series F MBIA Insured§ | | 1.20 | | | 07/01/2022 | | | 31,900,000 |
| | | | |
| | 4,170,000 | | Msr Public Power Agency CA Utility Tax Revenue San Juan Project Series II R 134 MBIA Insured§ | | 1.11 | | | 07/01/2013 | | | 4,170,000 |
| | | | |
| | 2,400,000 | | Newport Beach CA Revenue Hoag Memorial Hospital Series A§ | | 1.23 | | | 10/01/2026 | | | 2,400,000 |
| | | | |
| | 19,700,000 | | Newport Beach CA Revenue Hoag Memorial Hospital Series B§ | | 1.23 | | | 10/01/2026 | | | 19,700,000 |
| | | | |
| | 10,500,000 | | Newport Beach CA Revenue Hoag Memorial Hospital Series C§ | | 1.23 | | | 10/01/2026 | | | 10,500,000 |
| | | | |
| | 2,965,000 | | Norwalk LA Mirada CA Union School District Series A§ | | 2.00 | | | 08/01/2004 | | | 2,993,907 |
| | | | |
| | 11,800,000 | | Orange County CA Apartment Development Revenue Bluffs Apartment Project Series C FHLMC LOC§ | | 1.10 | | | 12/01/2029 | | | 11,800,000 |
| | | | |
| | 4,000,000 | | Orange County CA Apartment Development Revenue Park Ridge Villas Project FNMA LOC§ | | 1.10 | | | 11/15/2028 | | | 4,000,000 |
| | | | |
| | 5,600,000 | | Orange County CA Apartment Development Revenue Seaside Meadows Partners Project Series 1984C FHLMC LOC§ | | 1.00 | | | 08/01/2008 | | | 5,600,000 |
| | | | |
| | 8,000,000 | | Orange County CA Apartment Development Revenue Series A FHLMC LOC§ | | 1.10 | | | 12/01/2006 | | | 8,000,000 |
| | | | |
| | 26,805,000 | | Orange County CA Apartment Development Revenue Series B Aliso Creek Project FHLMC LOC§ | | 1.05 | | | 11/01/2022 | | | 26,805,000 |
| | | | |
| | 7,449,000 | | Orange County CA Apartment Development Revenue Series D Harbor Pointe Project FHLMC LOC§ | | 1.10 | | | 12/01/2022 | | | 7,449,000 |
| | | | |
| | 9,098,000 | | Orange County CA Improvement Assessment District Number 88 Series 1 KBC Bank NV LOC§ | | 1.20 | | | 09/02/2018 | | | 9,098,000 |
| | | | |
| | 12,490,000 | | Orange County CA Sanitation Districts COP AMBAC Insured§ | | 1.05 | | | 08/01/2013 | | | 12,490,000 |
16
| PORTFOLIOOFINVESTMENTS — SEPTEMBER 30, 2003 (UNAUDITED) | | WELLSFARGOMONEYMARKETFUNDS |
|
CALIFORNIATAX-FREEMONEYMARKETFUND
| Principal | | Security Name | | Interest Rate | | | Maturity Date | | Value |
| | | |
| California (continued) | | | | | | | | |
| | | | |
| $ | 1,375,000 | | Orange County CA Special Financing Authority Teeter Plan Revenue Series B AMBAC Insured§ | | 1.05 | % | | 11/01/2014 | | $ | 1,375,000 |
| | | | |
| | 3,050,000 | | Orange County CA Special Financing Authority Teeter Plan Revenue Series D AMBAC Insured§ | | 1.05 | | | 11/01/2014 | | | 3,050,000 |
| | | | |
| | 3,000,000 | | Orange County CA Special Financing Authority Teeter Plan Revenue Series E AMBAC Insured§ | | 1.05 | | | 11/01/2014 | | | 3,000,000 |
| | | | |
| | 5,000,000 | | Pacific CA HFA Lease Revenue Series A FHLMC Insured§ | | 1.10 | | | 02/01/2007 | | | 5,000,000 |
| | | | |
| | 720,000 | | Palo Alto CA USD Series II R 93§ | | 1.11 | | | 08/01/2016 | | | 720,000 |
| | | | |
| | 10,000,000 | | Port of Oakland CA | | 0.80 | | | 10/07/2003 | | | 10,000,000 |
| | | | |
| | 12,000,000 | | Port of Oakland CA Series D | | 0.80 | | | 10/08/2003 | | | 12,000,000 |
| | | | |
| | 6,000,000 | | Port of Oakland CA Series D | | 0.90 | | | 10/09/2003 | | | 6,000,000 |
| | | | |
| | 14,000,000 | | Port of Oakland CA Series D | | 0.80 | | | 10/14/2003 | | | 14,000,000 |
| | | | |
| | 11,400,000 | | Port of Oakland CA Series D | | 0.80 | | | 10/15/2003 | | | 11,400,000 |
| | | | |
| | 4,995,000 | | Port of Oakland CA Transportation Revenue FGIC Insured§ | | 1.15 | | | 05/01/2008 | | | 4,995,000 |
| | | | |
| | 7,285,000 | | Port of Oakland CA Transportation Revenue MBIA Insured§ | | 1.15 | | | 05/01/2010 | | | 7,285,000 |
| | | | |
| | 18,290,000 | | Port of Oakland CA Transportation Revenue Series 5 FGIC Insured§ | | 1.08 | | | 11/01/2012 | | | 18,290,000 |
| | | | |
| | 2,690,000 | | Rancho Mirage CA JT Powers Financing Authority Certificates of Participation EISenhower Medical Center Project§ | | 1.07 | | | 07/01/2022 | | | 2,690,000 |
| | | | |
| | 2,245,000 | | Riverside County CA Asset Lending Corporation Leasehold Revenue MBIA Insured§ | | 1.08 | | | 06/01/2016 | | | 2,245,000 |
| | | | |
| | 8,100,000 | | Riverside County CA Community Facilities District Series 88-4 KBC Bank LOC§ | | 1.10 | | | 09/01/2014 | | | 8,100,000 |
| | | | |
| | 5,000,000 | | Riverside County CA IDA Bank of America NA LOC§ | | 1.10 | | | 06/01/2026 | | | 5,000,000 |
| | | | |
| | 22,400,000 | | Riverside San Bernadino CA Housing & Finance Agency Lease Revenue Series A Societe Generale LOC§ | | 1.10 | | | 07/01/2006 | | | 22,400,000 |
| | | | |
| | 3,000,000 | | Roaring Fork Municipal Products Limited Liability Corporation Series 2000-12 Class A§ | | 1.24 | | | 03/01/2034 | | | 3,000,000 |
| | | | |
| | 7,000,000 | | Sacramento County CA HFA MFHR Arlington Creek Apartment Series 1 Collateralized By FNMA§ | | 1.15 | | | 05/15/2034 | | | 7,000,000 |
| | | | |
| | 6,300,000 | | Sacramento County CA HFA MFHR Hidden Oaks Apartments Project Series C Collateralized By FNMA§ | | 1.15 | | | 05/15/2029 | | | 6,300,000 |
| | | | |
| | 6,000,000 | | Sacramento County CA Housing Authority MFHR Normandy Park Apartments Series A§ | | 1.15 | | | 02/15/2033 | | | 6,000,000 |
| | | | |
| | 2,500,000 | | Sacramento County CA MFHR Series C Collateralized By FHLMC§ | | 1.05 | | | 04/15/2007 | | | 2,500,000 |
| | | | |
| | 5,200,000 | | Sacramento County CA MFHR Suncreek Apartments Project Series A§ | | 1.10 | | | 04/01/2026 | | | 5,200,000 |
| | | | |
| | 7,600,000 | | Sacramento County CA Sanitation District Financing Authority Revenue Subordinate Lien Sacramento Regulation C Credit Agricole Indosuez LOC§ | | 1.05 | | | 12/01/2030 | | | 7,600,000 |
| | | | |
| | 6,115,000 | | San Bernadino County CA MFHR Green Valley Apartments Project Series A Collateralized By FNMA§ | | 1.10 | | | 05/15/2029 | | | 6,115,000 |
| | | | |
| | 5,665,000 | | San Bernardino CA Community College District Series RR II R-3006 MBIA Insured§ | | 1.11 | | | 08/01/2023 | | | 5,665,000 |
| | | | |
| | 39,000,000 | | San Bernardino County CA TRAN | | 1.50 | | | 07/01/2004 | | | 39,202,625 |
| | | | |
| | 3,395,000 | | San Diego CA Area HFA Lease Revenue Series B Collateralized By FNMA§ | | 1.10 | | | 06/01/2006 | | | 3,395,000 |
| | | | |
| | 57,260,000 | | San Diego CA County & School District Revenue Anticipation Notes Series A | | 1.75 | | | 06/30/2004 | | | 57,619,750 |
| | | | |
| | 14,825,000 | | San Diego CA HFA MFHR Stratton Apartments Project Series A Collateralized By FNMA§ | | 1.15 | | | 01/15/2033 | | | 14,825,000 |
| | | | |
| | 16,830,000 | | San Diego CA MFHR Collateralized By FHLMC§ | | 1.13 | | | 09/01/2004 | | | 16,830,000 |
| | | | |
| | 32,595,000 | | San Diego CA MFHR Collateralized By FHLMC§ | | 1.13 | | | 03/01/2032 | | | 32,595,000 |
| | | | |
| | 10,200,000 | | San Diego CA MFHR Collateralized By FNMA§ | | 1.05 | | | 08/01/2014 | | | 10,200,000 |
17
| WELLSFARGOMONEYMARKETFUNDS | | PORTFOLIOOFINVESTMENTS — SEPTEMBER 30, 2003 (UNAUDITED) |
|
CALIFORNIATAX-FREEMONEYMARKETFUND
| Principal | | Security Name | | Interest Rate | | | Maturity Date | | Value |
| | | |
| California (continued) | | | | | | | | |
| | | | |
| $ | 11,050,000 | | San Diego CA MFHR Paseo Series A§ | | 1.05 | % | | 12/01/2022 | | $ | 11,050,000 |
| | | | |
| | 19,130,000 | | San Diego CA Public Facilities Financing Authority Sewer Revenue Series SG 130§ | | 1.11 | | | 05/15/2029 | | | 19,130,000 |
| | | | |
| | 5,430,000 | | San Diego CA Public Facilities Financing Authority Water Revenue Class A§ | | 1.11 | | | 08/01/2012 | | | 5,430,000 |
| | | | |
| | 6,621,000 | | San Diego CA Union School District Floaters Series 759 FSA Insured§ | | 1.08 | | | 07/01/2026 | | | 6,621,000 |
| | | | |
| | 5,826,000 | | San Diego CA Union School District Series 758§ | | 1.08 | | | 07/01/2027 | | | 5,826,000 |
| | | | |
| | 11,580,000 | | San Diego CA Union School District Series PA-804§ | | 1.11 | | | 07/01/2022 | | | 11,580,000 |
| | | | |
| | 4,975,000 | | San Francisco CA City & County CTFS Series C-6§ | | 1.10 | | | 06/15/2007 | | | 4,975,000 |
| | | | |
| | 15,800,000 | | San Francisco CA City & County Finance Corporation Lease Revenue Moscone Center Expansion Project Series 1 AMBAC Insured§ | | 1.03 | | | 04/01/2030 | | | 15,800,000 |
| | | | |
| | 10,700,000 | | San Francisco CA City & County Public Utilities Commission For Clean Water Merlots Series B20 MBIA Insured§ | | 1.09 | | | 10/01/2022 | | | 10,700,000 |
| | | | |
| | 1,500,000 | | San Jose CA MFHR Almaden Lake Village Apartments Project Series A Collateralized By FNMA§ | | 1.12 | | | 03/01/2032 | | | 1,500,000 |
| | | | |
| | 19,000,000 | | San Jose CA MFHR Evans Lane Apartments Project Series H Bank of America
NA LOC§ | | 1.10 | | | 04/15/2036 | | | 19,000,000 |
| | | | |
| | 2,000,000 | | San Jose CA Redevelopment Agency Tax Allocation Putters Series 158Z Morgan Guaranty LOC§ | | 1.10 | | | 08/01/2014 | | | 2,000,000 |
| | | | |
| | 6,857,500 | | San Jose CA Union School District Santa Clara County Floaters Series 761 FSA Insured§ | | 1.08 | | | 08/01/2027 | | | 6,857,500 |
| | | | |
| | 8,690,000 | | San Jose-Santa Clara CA Water Financing Authority Sewer Revenue Floats SG 49§ | | 1.11 | | | 11/15/2020 | | | 8,690,000 |
| | | | |
| | 2,200,000 | | San Leandro CA MFHR Haas Avenue Apartments Series B Security Pacific
National LOC§ | | 1.05 | | | 10/01/2007 | | | 2,200,000 |
| | | | |
| | 5,800,000 | | Santa Ana CA Health Facility Revenue Multi-Modal Town & Country Project BNP Paribas LOC§ | | 1.20 | | | 10/01/2020 | | | 5,800,000 |
| | | | |
| | 9,000,000 | | Santa Barbara County CA TRAN Series A | | 2.00 | | | 07/23/2004 | | | 9,086,649 |
| | | | |
| | 6,165,000 | | Santa Clara CA Electric Revenue Series A AMBAC Insured§ | | 1.05 | | | 07/01/2010 | | | 6,165,000 |
| | | | |
| | 2,395,000 | | Santa Clara CA Electric Revenue Series B AMBAC Insured§ | | 1.05 | | | 07/01/2010 | | | 2,395,000 |
| | | | |
| | 5,900,000 | | Santa Clara County CA MFHR Benton Park Center Apartments Project Series A Collateralized By FNMA§ | | 1.15 | | | 12/15/2025 | | | 5,900,000 |
| | | | |
| | 11,400,000 | | Santa Clara County CA MFHR Foxchase Apartments Project Series E FGIC Insured§ | | 1.05 | | | 11/01/2007 | | | 11,400,000 |
| | | | |
| | 6,150,000 | | Simi Valley CA MFHR Series A§ | | 1.10 | | | 07/01/2023 | | | 6,150,000 |
| | | | |
| | 24,000,000 | | Sonoma County CA TRAN | | 2.50 | | | 10/14/2003 | | | 24,008,072 |
| | | | |
| | 30,595,000 | | South Orange County CA PFA Special Tax Revenue Series 146§ | | 1.10 | | | 08/15/2015 | | | 30,595,000 |
| | | | |
| | 2,300,000 | | Southeast Resource Recovery Facilities Authority Lease Revenue Refunding Bonds Series B§ | | 1.04 | | | 12/01/2018 | | | 2,300,000 |
| | | | |
| | 1,300,000 | | Southern CA Public Power Authority Power Revenue Palo Verde Project Series C§ | | 1.00 | | | 07/01/2017 | | | 1,300,000 |
| | | | |
| | 13,400,000 | | Southern CA Public Power Authority Power Revenue Series A§ | | 1.05 | | | 07/01/2023 | | | 13,400,000 |
| | | | |
| | 7,620,000 | | Southern CA Public Power Authority Power Revenue Series B§ | | 1.00 | | | 07/01/2009 | | | 7,620,000 |
| | | | |
| | 7,400,000 | | Stanford University | | 0.90 | | | 02/06/2004 | | | 7,400,000 |
| | | | |
| | 2,000,000 | | Stockton CA Health Facilities Revenue Series A§ | | 1.15 | | | 12/01/2032 | | | 2,000,000 |
| | | | |
| | 5,000,000 | | Tahoe Forest CA Hospital District Revenue§ | | 1.15 | | | 07/01/2033 | | | 5,000,000 |
| | | | |
| | 3,100,000 | | Tulare CA Local Health Care District Health Facility Revenue§ | | 1.15 | | | 12/01/2032 | | | 3,100,000 |
| | | | |
| | 26,550,000 | | Turlock CA Irrigation District COP Capital Improvement Project Societe Generale LOC§ | | 1.20 | | | 01/01/2031 | | | 26,550,000 |
| | | | |
| | 3,000,000 | | University CA Education Facilities Revenue Series 480 MBIA Insured§ | | 1.13 | | | 09/01/2022 | | | 3,000,000 |
| | | | |
| | 7,000,000 | | University of California | | 0.80 | | | 10/06/2003 | | | 7,000,000 |
| | | | |
| | 10,000,000 | | University of California | | 0.85 | | | 10/10/2003 | | | 10,000,000 |
18
| PORTFOLIOOFINVESTMENTS — SEPTEMBER 30, 2003 (UNAUDITED) | | WELLSFARGOMONEYMARKETFUNDS |
|
CALIFORNIATAX-FREEMONEYMARKETFUND
| Principal | | Security Name | | Interest Rate | | | Maturity Date | | Value |
| | | |
| California (continued) | | | | | | | | |
| | | | |
| $ | 7,500,000 | | University of California | | 0.85 | % | | 10/16/2003 | | $ | 7,500,000 |
| | | | |
| | 15,000,000 | | University of California | | 0.90 | | | 10/20/2003 | | | 15,000,000 |
| | | | |
| | 18,000,000 | | University of California | | 0.85 | | | 11/18/2003 | | | 18,000,000 |
| | | | |
| | 15,000,000 | | University of California | | 0.85 | | | 12/08/2003 | | | 15,000,000 |
| | | | |
| | 3,700,000 | | Vacaville CA MFHR Quail Run Project Series A§ | | 1.05 | | | 07/15/2018 | | | 3,700,000 |
| | | | |
| | 4,800,000 | | Vallejo CA MFHR Hillside Terrace Apartments Series A Collaterized By FNMA§ | | 1.10 | | | 03/15/2027 | | | 4,800,000 |
| | | | |
| | | | | | | | | | | | 2,354,424,053 |
| | | | | | | | | | |
|
|
| | | |
| Other – 4.43% | | | | | | | | |
| | | | |
| | 17,995,000 | | ABN AMRO Munitops CTFS Tr 1998-20 Munitops Certificates AMBAC Insured§ | | 1.13 | | | 07/05/2006 | | | 17,995,000 |
| | | | |
| | 13,176,000 | | ABN AMRO Munitops CTFS Tr 1998-25 Munitops Certificates FGIC Insured§ | | 1.13 | | | 07/05/2006 | | | 13,176,000 |
| | | | |
| | 17,000,000 | | ABN AMRO Munitops CTFS Tr 2000-5 Munitops Certificates FGIC Insured§ª | | 1.16 | | | 05/07/2008 | | | 17,000,000 |
| | | | |
| | 2,700,000 | | Municipal Securities Trust Series 2001 136 Class A§ | | 1.20 | | | 12/06/2018 | | | 2,700,000 |
| | | | |
| | 42,876,217 | | Newman Capital Trust Series 2000-1 Class A§ | | 1.19 | | | 04/01/2032 | | | 42,876,217 |
| | | | |
| | 17,500,000 | | Newman Capital Trust Series 2001-1 Class A§ | | 1.19 | | | 04/07/2031 | | | 17,500,000 |
| | | | |
| | | | | | | | | | | | 111,247,217 |
| | | | | | | | | | |
|
|
| | | |
| Puerto Rico – 1.65% | | | | | | | | |
| | | | |
| | 7,200,000 | | Eagle Tax-Exempt Trust CTF 20015101 Class A (Puerto Rico Commonwealth Infrastructure Financing Authority Series A)§ | | 1.11 | | | 10/01/2034 | | | 7,200,000 |
| | | | |
| | 10,000,000 | | Eagle Tax-Exempt Trust CTF 20025102 Class A (Puerto Rico Commonwealth Highway & Transportation Revenue Series D) FSA Insured§ | | 1.11 | | | 07/01/2027 | | | 10,000,000 |
| | | | |
| | 5,000,000 | | Puerto Rico Commonwealth Highway & Transportation Authority Revenue Series 2 MBIA Insured§ | | 1.11 | | | 07/01/2038 | | | 5,000,000 |
| | | | |
| | 4,995,000 | | Puerto Rico Commonwealth Infrastructure Financing Authority Series 86§ | | 1.08 | | | 07/01/2015 | | | 4,995,000 |
| | | | |
| | 5,360,000 | | Puerto Rico Commonwealth Municipal Finance Agency Series 645 FSA Insured§ | | 1.06 | | | 08/01/2015 | | | 5,360,000 |
| | | | |
| | 6,135,000 | | Puerto Rico Commonwealth Public Buildings Authority Revenue Series 416 FSA Insured§ | | 1.08 | | | 07/01/2021 | | | 6,135,000 |
| | | | |
| | 2,775,000 | | Puerto Rico Commonwealth Public Finance Corporation Series 522X MBIA Insured§ | | 1.08 | | | 08/01/2022 | | | 2,775,000 |
| | | | |
| | | | | | | | | | | | 41,465,000 |
| | | | | | | | | | |
|
|
| | |
Total Municipal Securities (Cost $2,507,136,270) | | | | | 2,507,136,270 |
| | | | | | | | | | |
|
|
| | | |
Total Investments In Securities
(Cost $2,507,136,270)* | | 99.85 | % | | | | $ | 2,507,136,270 |
| | | |
Other Assets And Liabilities, Net | | 0.15 | | | | | | 3,846,871 |
| | |
|
| | | |
|
|
| Total Net Assets | | 100.00 | % | | | | $ | 2,510,983,141 |
| | |
|
| | | |
|
|
| * | | Cost for federal income tax purposes is substantially the same as for financial reporting purposes. |
| ª | | Securities that may be resold to “Qualified institutional buyers” under rule 144A or securities offered pursuant to section 4(2) of the Securities Act of 1933, as amended. These securities have been determined to be liquid by the Adviser based on procedures approved by the Board of Trustees. |
| § | | These variable rate securities are subject to a demand feature which reduces the remaining maturity. |
The accompanying notes are an integral part of these financial statements.
19
| WELLSFARGOMONEYMARKETFUNDS | | PORTFOLIOOFINVESTMENTS — SEPTEMBER 30, 2003 (UNAUDITED) |
|
CASHINVESTMENTMONEYMARKETFUND
| Principal | | Security Name | | Interest Rate | | | Maturity Date | | Value |
| | | |
| Certificates of Deposit – 7.16% | | | | | | | | |
| | | | |
| $ | 100,000,000 | | Abbey National Treasury Services plc | | 1.40 | % | | 03/02/2004 | | $ | 100,000,000 |
| | | | |
| | 100,000,000 | | Bank of Nova Scotia Portland | | 1.09 | | | 03/23/2004 | | | 100,000,000 |
| | | | |
| | 250,000,000 | | Credit Agricole Indosuez New York | | 1.06 | | | 12/19/2003 | | | 250,000,000 |
| | | | |
| | 150,000,000 | | Natexis Banque Populaires | | 1.07 | | | 11/03/2003 | | | 150,000,000 |
| | | | |
| | 100,000,000 | | Svenska Handelsbanken | | 1.40 | | | 03/02/2004 | | | 100,000,000 |
| | | | |
| | 193,000,000 | | Unicredito Italiano SPA | | 1.04 | | | 10/20/2003 | | | 193,000,000 |
| | | | |
| | 150,000,000 | | World Savings Bank Fsb | | 1.01 | | | 10/17/2003 | | | 149,998,671 |
| | | |
Total Certificates of Deposit (Cost $1,042,998,671) | | | | | | | | 1,042,998,671 |
| | | | | | | | | | |
|
|
| | | |
| Commercial Paper – 43.18% | | | | | | | | |
| | | | |
| | 100,000,000 | | Aegon Funding Corporationª | | 1.07 | † | | 11/03/2003 | | | 99,901,917 |
| | | | |
| | 50,000,000 | | Aegon Funding Corporationª | | 1.07 | † | | 11/06/2003 | | | 49,946,500 |
| | | | |
| | 75,000,000 | | Aegon Funding Corporationª | | 1.07 | † | | 11/07/2003 | | | 74,917,521 |
| | | | |
| | 140,000,000 | | Amstel Funding Corporationª | | 0.94 | † | | 12/29/2003 | | | 139,674,656 |
| | | | |
| | 99,201,000 | | Amstel Funding Corporationª | | 1.12 | † | | 03/17/2004 | | | 98,682,509 |
| | | | |
| | 140,000,000 | | Amstel Funding Corporationª | | 1.12 | † | | 03/25/2004 | | | 139,233,422 |
| | | | |
| | 200,000,000 | | Atlantis One Funding Corporationª | | 1.06 | † | | 01/28/2004 | | | 199,299,222 |
| | | | |
| | 150,000,000 | | Atlantis One Funding Corporationª | | 1.12 | † | | 03/17/2004 | | | 149,216,000 |
| | | | |
| | 60,000,000 | | Banco Bilbao Vizcaya Argentaria Puerto Ricoª | | 1.25 | † | | 10/01/2003 | | | 60,000,000 |
| | | | |
| | 150,000,000 | | Blue Spice LLCª | | 1.07 | † | | 10/17/2003 | | | 149,928,667 |
| | | | |
| | 100,000,000 | | Blue Spice LLCª | | 1.10 | † | | 12/08/2003 | | | 99,792,222 |
| | | | |
| | 55,000,000 | | CC (USA) Incorporatedª | | 1.11 | † | | 11/20/2003 | | | 54,915,208 |
| | | | |
| | 124,000,000 | | CDC Commercial Paper Corporationª | | 1.15 | † | | 10/01/2003 | | | 124,000,000 |
| | | | |
| | 125,000,000 | | Charta LLCª | | 1.07 | † | | 11/18/2003 | | | 124,821,667 |
| | | | |
| | 53,578,000 | | Concord Minuteman Capital Company LLCª | | 1.10 | † | | 10/10/2003 | | | 53,563,266 |
| | | | |
| | 75,000,000 | | Concord Minuteman Capital Company LLCª | | 1.10 | † | | 11/18/2003 | | | 74,890,000 |
| | | | |
| | 75,000,000 | | Concord Minuteman Capital Company LLCª | | 1.15 | † | | 02/06/2004 | | | 74,693,333 |
| | | | |
| | 100,000,000 | | CRC Funding LLCª | | 1.08 | † | | 11/24/2003 | | | 99,838,000 |
| | | | |
| | 260,000,000 | | Credit Agricole Indosuez | | 1.02 | † | | 10/07/2003 | | | 259,955,800 |
| | | | |
| | 100,000,000 | | Credit Lyonnais – New York | | 1.26 | † | | 10/15/2003 | | | 99,951,000 |
| | | | |
| | 77,214,000 | | Crown Point Capital Company LLCª | | 1.04 | † | | 10/14/2003 | | | 77,185,002 |
| | | | |
| | 100,000,000 | | Crown Point Capital Company LLCª | | 1.08 | † | | 01/21/2004 | | | 99,664,000 |
| | | | |
| | 73,500,000 | | Dorada Finance Incorporatedª | | 1.05 | † | | 10/28/2003 | | | 73,442,119 |
| | | | |
| | 142,500,000 | | Grampian Funding LLCª | | 1.00 | † | | 10/01/2003 | | | 142,500,000 |
| | | | |
| | 43,720,000 | | Grampian Funding LLCª | | 1.00 | † | | 10/15/2003 | | | 43,702,998 |
| | | | |
| | 100,000,000 | | Grampian Funding LLCª | | 1.08 | † | | 11/18/2003 | | | 99,856,000 |
| | | | |
| | 100,000,000 | | Greyhawk Funding LLCª | | 1.03 | † | | 10/08/2003 | | | 99,979,972 |
| | | | |
| | 100,000,000 | | HBOs Treasury Services plc | | 1.06 | † | | 10/09/2003 | | | 99,976,444 |
| | | | |
| | 50,430,000 | | Holdenby Capital Company LLCª | | 1.06 | † | | 10/10/2003 | | | 50,416,636 |
| | | | |
| | 103,869,000 | | Holdenby Capital Company LLCª | | 1.09 | † | | 12/10/2003 | | | 103,648,855 |
| | | | |
| | 50,000,000 | | Irish Life & Permanent plcª | | 1.10 | † | | 12/09/2003 | | | 49,894,583 |
| | | | |
| | 100,000,000 | | KBC Financial Products International Limitedª | | 1.08 | † | | 11/12/2003 | | | 99,874,000 |
| | | | |
| | 30,000,000 | | Liquid Funding Limitedª | | 1.06 | † | | 10/14/2003 | | | 29,988,517 |
| | | | |
| | 40,000,000 | | Mont Blanc Capital Corporationª | | 1.06 | † | | 10/20/2003 | | | 39,977,622 |
| | | | |
| | 114,782,000 | | Natexis Banque Populaires | | 1.05 | † | | 10/07/2003 | | | 114,761,913 |
| | | | |
| | 70,800,000 | | National Bank of New Zealand International Limitedª | | 1.08 | † | | 10/06/2003 | | | 70,789,380 |
20
| PORTFOLIOOFINVESTMENTS — SEPTEMBER 30, 2003 (UNAUDITED) | | WELLSFARGOMONEYMARKETFUNDS |
|
CASHINVESTMENTMONEYMARKETFUND
| Principal | | Security Name | | Interest Rate | | | Maturity Date | | Value |
| | | |
| Commercial Paper (continued) | | | | | | | | |
| | | | |
| $ | 50,000,000 | | National Bank of New Zealand International Limitedª | | 1.04 | %† | | 10/14/2003 | | $ | 49,981,222 |
| | | | |
| | 50,000,000 | | National Bank of New Zealand International Limitedª | | 1.04 | † | | 10/30/2003 | | | 49,958,111 |
| | | | |
| | 100,000,000 | | National Bank of New Zealand International Limitedª | | 1.08 | † | | 11/03/2003 | | | 99,901,000 |
| | | | |
| | 20,000,000 | | National Bank of New Zealand International Limitedª | | 1.08 | † | | 11/12/2003 | | | 19,974,800 |
| | | | |
| | 150,000,000 | | National Bank of New Zealand International Limitedª | | 1.11 | † | | 12/22/2003 | | | 149,622,458 |
| | | | |
| | 100,000,000 | | Neptune Funding Corporationª | | 1.06 | † | | 10/02/2003 | | | 99,997,056 |
| | | | |
| | 70,523,000 | | Neptune Funding Corporationª | | 1.11 | † | | 10/23/2003 | | | 70,475,162 |
| | | | |
| | 118,358,000 | | Neptune Funding Corporationª | | 1.10 | † | | 11/19/2003 | | | 118,180,792 |
| | | | |
| | 140,000,000 | | Network Rail Commercial Paper Finance plcª | | 1.03 | † | | 10/20/2003 | | | 139,923,894 |
| | | | |
| | 120,000,000 | | Network Rail Commercial Paper Finance plcª | | 1.01 | † | | 12/18/2003 | | | 119,737,400 |
| | | | |
| | 35,655,000 | | Perry Funding Corporationª | | 1.12 | † | | 11/17/2003 | | | 35,602,864 |
| | | | |
| | 85,000,000 | | Perry Global Funding Limitedª | | 1.05 | † | | 10/08/2003 | | | 84,982,646 |
| | | | |
| | 66,142,000 | | Perry Global Funding Limitedª | | 1.05 | † | | 10/16/2003 | | | 66,113,063 |
| | | | |
| | 96,724,000 | | Perry Global Funding Limitedª | | 1.08 | † | | 11/13/2003 | | | 96,599,226 |
| | | | |
| | 100,000,000 | | Province of Quebec | | 1.25 | † | | 10/16/2003 | | | 99,947,917 |
| | | | |
| | 150,000,000 | | Prudential plcª | | 1.20 | † | | 10/20/2003 | | | 149,905,000 |
| | | | |
| | 53,866,000 | | Regency Markets Number 1 LLCª | | 1.07 | † | | 10/20/2003 | | | 53,835,581 |
| | | | |
| | 205,000,000 | | Regency Markets Number 1 LLCª | | 1.10 | † | | 11/20/2003 | | | 204,686,806 |
| | | | |
| | 93,476,000 | | Regency Markets Number 1 LLCª | | 1.09 | † | | 12/08/2003 | | | 93,283,543 |
| | | | |
| | 100,000,000 | | Stadshypotek Delawareª | | 1.07 | † | | 11/26/2003 | | | 99,833,556 |
| | | | |
| | 200,000,000 | | Swedbank | | 1.03 | † | | 10/02/2003 | | | 199,994,278 |
| | | | |
| | 175,266,000 | | Ticonderoga Funding LLCª | | 1.08 | † | | 10/27/2003 | | | 175,129,925 |
| | | | |
| | 220,000,000 | | Tulip Funding Corporationª | | 1.08 | † | | 11/28/2003 | | | 219,617,200 |
| | | | |
| | 100,000,000 | | Tulip Funding Corporationª | | 1.09 | † | | 12/01/2003 | | | 99,815,306 |
| | | | |
| | 96,488,000 | | White Pine Finance LLCª | | 1.04 | † | | 11/17/2003 | | | 96,356,991 |
| | | | |
| | 75,000,000 | | Yorktown Capital LLCª | | 1.08 | † | | 10/06/2003 | | | 74,988,750 |
| | | |
Total Commercial Paper (Cost $6,291,323,498) | | | | | | | | 6,291,323,498 |
| | | | | | | | | | |
|
|
| | | |
| Corporate Bonds – 3.56% | | | | | | | | |
| | | | |
| | 25,000,000 | | Grand Metro Investment Corporation†† | | 1.58 | | | 01/06/2004 | | | 24,893,013 |
| | | | |
| | 300,000,000 | | ING Security Life Institutional Funding±ª | | 1.14 | | | 10/08/2004 | | | 300,000,000 |
| | | | |
| | 33,100,000 | | Republic of Italy | | 5.00 | | | 11/20/2003 | | | 33,232,459 |
| | | | |
| | 160,000,000 | | Restructured Asset Securities Enhanced Returns Series 2002-7-MM±ª | | 1.32 | | | 10/25/2004 | | | 160,000,000 |
| | | |
Total Corporate Bonds (Cost $518,125,472) | | | | | | | | 518,125,472 |
| | | | | | | | | | |
|
|
| | | |
| Discount Notes – Agency – 3.36% | | | | | | | | |
| | | |
| Federal Home Loan Mortgage Corporation – 0.57% | | | | | | | | |
| | | | |
| | 82,648,000 | | FHLMC | | 1.06 | † | | 12/31/2003 | | | 82,427,594 |
| | | | |
| | | | | | | | | | | | 82,427,594 |
| | | | | | | | | | |
|
|
| | | |
| Federal National Mortgage Association – 2.79% | | | | | | | | |
| | | | |
| | 100,000,000 | | FNMA | | 1.01 | † | | 10/15/2003 | | | 99,960,722 |
| | | | |
| | 100,000,000 | | FNMA | | 1.07 | † | | 11/19/2003 | | | 99,854,361 |
| | | | |
| | 207,500,000 | | FNMA | | 1.08 | † | | 12/31/2003 | | | 206,933,525 |
| | | | |
| | | | | | | | | | | | 406,748,608 |
| | | | | | | | | | |
|
|
| | | |
Total Discount Notes – Agency (Cost $489,176,202) | | | | | | | | 489,176,202 |
| | | | | | | | | | |
|
|
21
| WELLSFARGOMONEYMARKETFUNDS | | PORTFOLIOOFINVESTMENTS — SEPTEMBER 30, 2003 (UNAUDITED) |
|
CASHINVESTMENTMONEYMARKETFUND
| Principal | | Security Name | | Interest Rate | | | Maturity Date | | Value |
| | | |
| Fixed Rate Funding Agreement – 1.37% | | | | | | | | |
| | | | |
| $ | 200,000,000 | | Security Life of Denver | | 1.21 | % | | 12/26/2003 | | $ | 200,000,000 |
| | | |
Total Fixed Rate Funding Agreement (Cost $200,000,000) | | | | | | | | 200,000,000 |
| | | | | | | | | | |
|
|
| | | |
| Fixed Rate Notes – Agency – 2.57% | | | | | | | | |
| | | |
| Federal Home Loan Mortgage Corporation – 0.69% | | | | | | | | |
| | | | |
| | 97,457,000 | | FHLMC | | 4.50 | | | 08/15/2004 | | | 100,311,231 |
| | | | |
| | | | | | | | | | | | 100,311,231 |
| | | | | | | | | | |
|
|
| | | |
| Federal National Mortgage Association – 1.88% | | | | | | | | |
| | | | |
| | 130,000,000 | | FNMA | | 1.14 | | | 01/09/2004 | | | 129,588,334 |
| | | | |
| | 40,000,000 | | FNMA | | 5.13 | | | 02/13/2004 | | | 40,541,361 |
| | | | |
| | 100,000,000 | | FNMA | | 6.50 | | | 08/15/2004 | | | 104,604,233 |
| | | | |
| | | | | | | | | | | | 274,733,928 |
| | | | | | | | | | |
|
|
| | | |
Total Fixed Rate Notes – Agency (Cost $375,045,159) | | | | | | | | 375,045,159 |
| | | | | | | | | | |
|
|
| | | |
| Fixed Rate Notes – Corporate – 4.15% | | | | | | | | |
| | | | |
| | 17,970,000 | | Bear Stearns Companies Incorporated | | 6.63 | | | 01/15/2004 | | | 18,222,194 |
| | | | |
| | 10,000,000 | | Bear Stearns Companies Incorporated | | 6.15 | | | 03/02/2004 | | | 10,193,513 |
| | | | |
| | 85,000,000 | | General Electric Capital Corporation | | 7.25 | | | 05/03/2004 | | | 87,981,399 |
| | | | |
| | 88,500,000 | | K2 (USA) LLC | | 1.76 | | | 10/17/2003 | | | 88,500,000 |
| | | | |
| | 110,000,000 | | Liberty Lighthouse US Capital Companyª | | 1.40 | | | 08/16/2004 | | | 109,995,204 |
| | | | |
| | 53,000,000 | | Links Finance LLC | | 2.00 | | | 10/10/2003 | | | 53,000,000 |
| | | | |
| | 125,000,000 | | M&I Marshall & Ilsley Bank | | 5.26 | | | 12/15/2016 | | | 125,895,684 |
| | | | |
| | 110,000,000 | | McDonald’s Corporationª | | 4.60 | | | 03/07/2004 | | | 111,534,759 |
| | | |
Total Fixed Rate Notes – Corporate (Cost $605,322,753) | | | | | | | | 605,322,753 |
| | | | | | | | | | |
|
|
| | | |
| Floating Rate Commercial Paper – 2.25% | | | | | | | | |
| | | | |
| | 30,000,000 | | Concord Minutemen Capital Company LLC± | | 1.15 | | | 10/04/2004 | | | 30,000,000 |
| | | | |
| | 75,000,000 | | Concord Minutemen Capital Company LLC± | | 1.15 | | | 10/14/2004 | | | 75,000,000 |
| | | | |
| | 48,000,000 | | Concord Minutemen Capital Company LLC± | | 1.15 | | | 10/20/2004 | | | 48,000,000 |
| | | | |
| | 75,000,000 | | Liquid Funding Limited± | | 1.14 | | | 01/08/2004 | | | 75,000,000 |
| | | | |
| | 50,000,000 | | Liquid Funding Limited± | | 1.11 | | | 03/26/2004 | | | 50,000,000 |
| | | | |
| | 50,000,000 | | Liquid Funding Limited± | | 1.11 | | | 06/14/2004 | | | 50,000,000 |
| | | |
Total Floating Rate Commercial Paper (Cost $328,000,000) | | | | | | | | 328,000,000 |
| | | | | | | | | | |
|
|
| | | |
| Floating Rate Funding Agreements – 3.88% | | | | | | | | |
| | | | |
| | 165,000,000 | | Bear Stearns Companies Incorporated± | | 1.11 | | | 04/05/2004 | | | 164,991,616 |
| | | | |
| | 50,000,000 | | General Electric Capital Assurance Company± | | 1.12 | | | 07/01/2004 | | | 50,000,000 |
| | | | |
| | 50,000,000 | | General Electric Capital Assurance Company± | | 1.18 | | | 07/01/2004 | | | 50,000,000 |
| | | | |
| | 100,000,000 | | General Electric Life & Annuity Assurance Company± | | 1.19 | | | 11/07/2003 | | | 100,000,000 |
| | | | |
| | 100,000,000 | | General Electric Life & Annuity Assurance Company± | | 1.17 | | | 12/26/2003 | | | 100,000,000 |
| | | | |
| | 100,000,000 | | Western & Southern Life Insurance Company± | | 1.12 | | | 10/01/2003 | | | 100,000,000 |
| | | |
Total Floating Rate Funding Agreements (Cost $564,991,616) | | | | | | | | 564,991,616 |
| | | | | | | | | | |
|
|
22
| PORTFOLIOOFINVESTMENTS — SEPTEMBER 30, 2003 (UNAUDITED) | | WELLSFARGOMONEYMARKETFUNDS |
|
CASHINVESTMENTMONEYMARKETFUND
| Principal | | Security Name | | Interest Rate | | | Maturity Date | | Value |
| | | |
| Floating Rate Note – Agency – 1.37% | | | | | | | | |
| | | |
| Federal Home Loan Mortgage Corporation – 1.37% | | | | | | | | |
| | | | |
| $ | 200,000,000 | | FHLMC± | | 1.04 | % | | 02/04/2005 | | $ | 199,865,818 |
| | | |
Total Floating Rate Note – Agency (Cost $199,865,818) | | | | | | | | 199,865,818 |
| | | | | | | | | | |
|
|
| | | |
| Floating Rate Notes – Corporate – 13.76% | | | | | | | | |
| | | | |
| | 85,000,000 | | American Express Centurion Bank± | | 1.12 | | | 12/23/2003 | | | 85,000,000 |
| | | | |
| | 90,000,000 | | Associates Corporation of North America± | | 1.24 | | | 06/25/2004 | | | 90,000,000 |
| | | | |
| | 75,000,000 | | Bank of Ireland± | | 1.17 | | | 04/19/2004 | | | 75,018,744 |
| | | | |
| | 59,000,000 | | Belford US Capital Company±ª | | 1.12 | | | 03/08/2004 | | | 59,000,000 |
| | | | |
| | 50,000,000 | | Belford US Capital Company±ª | | 1.12 | | | 04/15/2004 | | | 50,000,000 |
| | | | |
| | 75,000,000 | | Belford US Capital Company±ª | | 1.11 | | | 05/17/2004 | | | 75,000,000 |
| | | | |
| | 125,000,000 | | Commonwealth Bank of Australia± | | 1.11 | | | 10/30/2003 | | | 125,006,997 |
| | | | |
| | 150,000,000 | | Dorada Finance Incorporated±ª | | 1.08 | | | 03/17/2004 | | | 149,993,115 |
| | | | |
| | 130,000,000 | | General Electric Capital Corporation± | | 1.24 | | | 05/10/2004 | | | 130,110,329 |
| | | | |
| | 31,500,000 | | Household Finance Corporation± | | 2.39 | | | 03/11/2004 | | | 31,687,308 |
| | | | |
| | 56,000,000 | | Lehman Brothers Holdings Incorporated± | | 1.51 | | | 07/06/2004 | | | 56,176,129 |
| | | | |
| | 75,000,000 | | Liberty Lighthouse US Capital Company±ª | | 1.11 | | | 03/12/2004 | | | 75,000,000 |
| | | | |
| | 115,000,000 | | Liberty Lighthouse US Capital Company±ª | | 1.11 | | | 04/19/2004 | | | 115,000,000 |
| | | | |
| | 48,000,000 | | Liberty Lighthouse US Capital Company±ª | | 1.10 | | | 07/19/2004 | | | 47,996,181 |
| | | | |
| | 100,000,000 | | Nationwide Building Society±ª | | 1.08 | | | 07/23/2004 | | | 100,000,000 |
| | | | |
| | 90,000,000 | | Northern Rock plc±ª | | 1.14 | | | 01/16/2004 | | | 90,000,000 |
| | | | |
| | 130,000,000 | | Premium Asset Trust Series 2003-1±ª | | 1.22 | | | 02/27/2004 | | | 130,000,000 |
| | | | |
| | 75,000,000 | | Sheffield Receivables Corporation± | | 1.08 | | | 01/20/2004 | | | 75,000,000 |
| | | | |
| | 100,000,000 | | Spintab (Swedmortgage) AB± | | 1.11 | | | 10/30/2003 | | | 100,002,433 |
| | | | |
| | 50,000,000 | | Spintab (Swedmortgage) AB± | | 1.14 | | | 11/28/2003 | | | 50,002,196 |
| | | | |
| | 85,000,000 | | Strategic Money Market Trust Series 2002-M±ª | | 1.17 | | | 12/15/2003 | | | 85,000,000 |
| | | | |
| | 150,000,000 | | Strategic Money Market Trust Series 2003-H±ª | | 1.14 | | | 09/23/2004 | | | 150,000,000 |
| | | | |
| | 60,000,000 | | White Pine Finance LLC±ª | | 1.08 | | | 06/15/2004 | | | 59,990,678 |
| | | |
Total Floating Rate Notes – Corporate (Cost $2,004,984,110) | | | | | | | | 2,004,984,110 |
| | | | | | | | | | |
|
|
| | | |
| Promissory Notes – 1.04% | | | | | | | | |
| | | | |
| | 65,500,000 | | Goldman Sachs Group Incorporated± | | 1.15 | | | 07/26/2004 | | | 65,500,000 |
| | | | |
| | 86,500,000 | | Goldman Sachs Group Incorporated± | | 1.19 | | | 07/26/2004 | | | 86,500,000 |
| | | |
Total Promissory Notes (Cost $152,000,000) | | | | | | | | 152,000,000 |
| | | | | | | | | | |
|
|
| | | |
| Repurchase Agreements – 3.27% | | | | | | | | |
| | | | |
| | 100,000,000 | | Bear Stearns & Company Incorporated – 102% Collateralized by US Government Securities | | 1.13 | | | 10/01/2003 | | | 100,000,000 |
| | | | |
| | 50,000,000 | | Bear Stearns & Company Incorporated – 102% Collateralized by US Government Securities | | 1.17 | | | 10/01/2003 | | | 50,000,000 |
| | | | |
| | 38,000,000 | | Goldman Sachs Group Incorporated – 102% Collateralized by US Government Securities | | 1.12 | | | 10/01/2003 | | | 38,000,000 |
| | | | |
| | 244,000,000 | | Goldman Sachs Group Incorporated – 102% Collaterized by US Government Securities | | 1.16 | | | 10/01/2003 | | | 244,000,000 |
| | | | |
| | 43,862,000 | | Lehman Brothers Incorporated – 102% Collaterized by US Government Securities | | 1.10 | | | 10/01/2003 | | | 43,862,000 |
| | | |
Total Repurchase Agreements (Cost $475,862,000) | | | | | | | | 475,862,000 |
| | | | | | | | | | |
|
|
23
| WELLSFARGOMONEYMARKETFUNDS | | PORTFOLIOOFINVESTMENTS — SEPTEMBER 30, 2003 (UNAUDITED) |
|
CASHINVESTMENTMONEYMARKETFUND
| Principal | | Security Name | | Interest Rate | | | Maturity Date | | Value |
| | | |
| Time Deposits – 8.82% | | | | | | | | |
| | | | |
| $ | 175,000,000 | | Banque Nationale de Paris | | 1.16 | % | | 10/01/2003 | | $ | 175,000,000 |
| | | | |
| | 105,000,000 | | Danske Bank | | 1.16 | | | 10/01/2003 | | | 105,000,000 |
| | | | |
| | 450,000,000 | | ING Bank Brussels | | 1.18 | | | 10/01/2003 | | | 450,000,000 |
| | | | |
| | 450,000,000 | | Rabobank Nederland Utrecht | | 1.16 | | | 10/01/2003 | | | 450,000,000 |
| | | | |
| | 105,000,000 | | Societe Generale | | 1.16 | | | 10/01/2003 | | | 105,000,000 |
| | | |
Total Time Deposits (Cost $1,285,000,000) | | | | | | | | 1,285,000,000 |
| | | | | | | | | | |
|
|
| | | |
| Variable Rate Demand Note – 0.05% | | | | | | | | |
| | | | |
| | 640,000 | | Kalamazoo Funding Company LLC§ | | 1.20 | | | 12/15/2026 | | | 640,000 |
| | | | |
| | 1,120,000 | | Kalamazoo Funding Company LLC§ | | 1.25 | | | 12/15/2026 | | | 1,120,000 |
| | | | |
| | 705,000 | | Kalamazoo Funding Company LLC§ | | 1.25 | | | 12/15/2026 | | | 705,000 |
| | | | |
| | 1,260,000 | | Kalamazoo Funding Company LLC§ | | 1.25 | | | 12/15/2026 | | | 1,260,000 |
| | | | |
| | 1,400,000 | | Kalamazoo Funding Company LLC§ | | 1.25 | | | 12/15/2026 | | | 1,400,000 |
| | | | |
| | 545,000 | | Kalamazoo Funding Company LLC§ | | 1.25 | | | 12/15/2026 | | | 545,000 |
| | | | |
| | 1,665,000 | | Kalamazoo Funding Company LLC§ | | 1.25 | | | 12/15/2026 | | | 1,665,000 |
| | | |
Total Variable Rate Demand Note (Cost $7,335,000) | | | | | | | | 7,335,000 |
| | | | | | | | | | |
|
|
| | | |
Total Investments In Securities
(Cost $14,540,030,299)* | | 99.79 | % | | | | $ | 14,540,030,299 |
| | | |
Other Assets And Liabilities, Net | | 0.21 | | | | | | 30,389,660 |
| | |
|
| | | |
|
|
| Total Net Assets | | 100.00 | % | | | | $ | 14,570,419,959 |
| | |
|
| | | |
|
|
| * | | Cost for federal income tax purposes is substantially the same as for financial reporting purposes. |
| ª | | Securities that may be resold to “Qualified institutional buyers” under rule 144A or securities offered pursuant to section 4(2) of the Securities Act of 1933, as amended. These securities have been determined to be liquid by the Adviser based on procedures approved by the Board of Trustees. |
| § | | These variable rate securities are subject to a demand feature which reduces the remaining maturity. |
| ± | | Variable Rate Securities. |
| †† | | Zero Coupon Bond. Interest rate presented is Yield to Maturity. |
The accompanying notes are an integral part of these financial statements.
24
| PORTFOLIOOFINVESTMENTS — SEPTEMBER 30, 2003 (UNAUDITED) | | WELLSFARGOMONEYMARKETFUNDS |
|
GOVERNMENTMONEYMARKETFUND
| Principal | | Security Name | | Interest Rate | | | Maturity Date | | Value |
| | | | |
| | | | | | | | | | | | |
| | | |
| Discount Notes – Agency – 31.98% | | | | | | | | |
| | | |
| Federal Farm Credit Bank – 2.05% | | | | | | | | |
| | | | |
| $ | 2,530,000 | | FFCB | | 1.59 | %† | | 10/02/2003 | | $ | 2,529,888 |
| | | | |
| | 12,147,000 | | FFCB | | 1.14 | † | | 11/17/2003 | | | 12,128,921 |
| | | | |
| | 5,241,000 | | FFCB | | 1.13 | † | | 12/05/2003 | | | 5,230,307 |
| | | | |
| | 8,000,000 | | FFCB | | 1.22 | † | | 12/15/2003 | | | 7,979,667 |
| | | | |
| | 100,000,000 | | FFCB | | 1.02 | † | | 07/16/2004 | | | 100,000,000 |
| | | | |
| | | | | | | | | | | | 127,868,783 |
| | | | | | | | | | |
|
|
| | | |
| Federal Home Loan Bank – 6.73% | | | | | | | | |
| | | | |
| | 58,200,000 | | FHLB | | 1.05 | † | | 10/15/2003 | | | 58,176,235 |
| | | | |
| | 75,000,000 | | FHLB | | 1.03 | † | | 10/22/2003 | | | 74,955,156 |
| | | | |
| | 50,000,000 | | FHLB | | 1.04 | † | | 11/28/2003 | | | 49,916,222 |
| | | | |
| | 38,394,000 | | FHLB | | 1.03 | † | | 12/05/2003 | | | 38,322,945 |
| | | | |
| | 74,750,000 | | FHLB | | 1.03 | † | | 12/10/2003 | | | 74,600,292 |
| | | | |
| | 24,000,000 | | FHLB | | 1.09 | † | | 02/04/2004 | | | 23,908,440 |
| | | | |
| | 50,000,000 | | FHLB | | 1.08 | † | | 03/05/2004 | | | 49,766,000 |
| | | | |
| | 50,000,000 | | FHLB | | 1.08 | † | | 03/12/2004 | | | 49,756,632 |
| | | | |
| | | | | | | | | | | | 419,401,922 |
| | | | | | | | | | |
|
|
| | | |
| Federal Home Loan Mortgage Corporation – 17.85% | | | | | | | | |
| | | | |
| | 30,000,000 | | FHLMC | | 1.08 | † | | 10/07/2003 | | | 29,994,600 |
| | | | |
| | 15,000,000 | | FHLMC | | 1.15 | † | | 10/09/2003 | | | 14,996,167 |
| | | | |
| | 55,000,000 | | FHLMC | | 1.21 | † | | 10/27/2003 | | | 54,951,936 |
| | | | |
| | 25,000,000 | | FHLMC | | 1.49 | † | | 10/27/2003 | | | 24,973,097 |
| | | | |
| | 20,000,000 | | FHLMC | | 0.99 | † | | 11/06/2003 | | | 19,980,200 |
| | | | |
| | 20,000,000 | | FHLMC | | 0.99 | † | | 11/07/2003 | | | 19,979,650 |
| | | | |
| | 58,796,000 | | FHLMC | | 1.00 | † | | 11/07/2003 | | | 58,735,571 |
| | | | |
| | 50,089,000 | | FHLMC | | 1.13 | † | | 11/17/2003 | | | 50,015,105 |
| | | | |
| | 100,000,000 | | FHLMC | | 0.99 | † | | 11/28/2003 | | | 99,840,500 |
| | | | |
| | 64,572,000 | | FHLMC | | 0.97 | † | | 12/11/2003 | | | 64,448,470 |
| | | | |
| | 75,000,000 | | FHLMC | | 0.97 | † | | 12/16/2003 | | | 74,846,417 |
| | | | |
| | 50,000,000 | | FHLMC | | 1.07 | † | | 12/17/2003 | | | 49,885,569 |
| | | | |
| | 50,000,000 | | FHLMC | | 1.06 | † | | 12/24/2003 | | | 49,876,917 |
| | | | |
| | 36,000,000 | | FHLMC | | 1.06 | † | | 12/30/2003 | | | 35,905,050 |
| | | | |
| | 75,000,000 | | FHLMC | | 1.20 | † | | 01/09/2004 | | | 74,750,000 |
| | | | |
| | 70,000,000 | | FHLMC | | 1.05 | † | | 01/30/2004 | | | 69,752,958 |
| | | | |
| | 49,102,000 | | FHLMC | | 1.10 | † | | 02/02/2004 | | | 48,916,804 |
| | | | |
| | 50,000,000 | | FHLMC | | 1.11 | † | | 02/12/2004 | | | 49,793,417 |
| | | | |
| | 50,000,000 | | FHLMC | | 1.15 | † | | 02/17/2004 | | | 49,778,951 |
| | | | |
| | 28,658,000 | | FHLMC | | 1.24 | † | | 02/26/2004 | | | 28,511,908 |
| | | | |
| | 50,000,000 | | FHLMC | | 1.09 | † | | 03/03/2004 | | | 49,766,861 |
| | | | |
| | 65,000,000 | | FHLMC | | 1.10 | † | | 03/25/2004 | | | 64,650,444 |
| | | | |
| | 28,401,000 | | FHLMC | | 1.12 | † | | 04/14/2004 | | | 28,228,590 |
| | | |
| | | | | | | | | 1,112,579,182 |
| | | | | | | | | | |
|
|
25
| WELLSFARGOMONEYMARKETFUNDS | | PORTFOLIOOFINVESTMENTS — SEPTEMBER 30, 2003 (UNAUDITED) |
|
GOVERNMENTMONEYMARKETFUND
| Principal | | Security Name | | Interest Rate | | | Maturity Date | | Value |
| | | | |
| | | | | | | | | | | | |
| | | |
| Federal National Mortgage Association – 5.35% | | | | | | | | |
| | | | |
| $ | 32,194,230 | | FNMA | | 0.97 | %† | | 10/01/2003 | | $ | 32,194,230 |
| | | | |
| | 49,917,000 | | FNMA | | 1.23 | † | | 10/17/2003 | | | 49,889,934 |
| | | | |
| | 20,000,000 | | FNMA | | 0.97 | † | | 10/29/2003 | | | 19,984,911 |
| | | | |
| | 50,000,000 | | FNMA | | 1.10 | † | | 12/01/2003 | | | 49,907,229 |
| | | | |
| | 30,000,000 | | FNMA | | 1.09 | † | | 01/02/2004 | | | 29,915,525 |
| | | | |
| | 9,000,000 | | FNMA | | 1.12 | † | | 01/02/2004 | | | 8,980,400 |
| | | | |
| | 8,427,800 | | FNMA | | 1.12 | † | | 01/02/2004 | | | 8,409,446 |
| | | | |
| | 10,076,000 | | FNMA | | 1.16 | † | | 01/02/2004 | | | 10,045,806 |
| | | | |
| | 50,000,000 | | FNMA | | 1.07 | † | | 01/21/2004 | | | 49,833,555 |
| | | | |
| | 50,000,000 | | FNMA | | 1.07 | † | | 01/28/2004 | | | 49,823,153 |
| | | | |
| | 25,000,000 | | FNMA | | 1.29 | † | | 04/02/2004 | | | 24,835,167 |
| | | | |
| | | | | | | | | | | | 333,819,356 |
| | | | | | | | | | |
|
|
| | | |
Total Discount Notes – Agency (Cost $1,993,669,243) | | | | | | | | 1,993,669,243 |
| | | | | | | | | | |
|
|
| | | |
| Fixed Rate Notes – Agency – 22.63% | | | | | | | | |
| | | |
| Federal Farm Credit Bank – 0.21% | | | | | | | | |
| | | | |
| | 12,990,000 | | FFCB | | 3.13 | | | 10/01/2003 | | | 12,990,000 |
| | | | | | | | | | |
|
|
| | | |
| Federal Home Loan Bank – 5.24% | | | | | | | | |
| | | | |
| | 1,750,000 | | FHLB | | 3.06 | | | 10/24/2003 | | | 1,751,656 |
| | | | |
| | 3,525,000 | | FHLB | | 2.50 | | | 11/14/2003 | | | 3,529,586 |
| | | | |
| | 14,925,000 | | FHLB | | 6.38 | | | 11/14/2003 | | | 15,014,941 |
| | | | |
| | 10,000,000 | | FHLB | | 2.73 | | | 11/28/2003 | | | 10,025,804 |
| | | | |
| | 11,300,000 | | FHLB | | 3.11 | | | 12/03/2003 | | | 11,337,843 |
| | | | |
| | 10,000,000 | | FHLB | | 0.97 | | | 12/12/2003 | | | 9,998,231 |
| | | | |
| | 5,850,000 | | FHLB | | 1.38 | | | 12/19/2003 | | | 5,851,311 |
| | | | |
| | 5,190,000 | | FHLB | | 5.38 | | | 01/05/2004 | | | 5,245,277 |
| | | | |
| | 5,000,000 | | FHLB | | 3.25 | | | 02/13/2004 | | | 5,035,432 |
| | | | |
| | 2,500,000 | | FHLB | | 3.75 | | | 02/13/2004 | | | 2,522,385 |
| | | | |
| | 24,935,000 | | FHLB | | 5.25 | | | 02/13/2004 | | | 25,310,441 |
| | | | |
| | 7,030,000 | | FHLB | | 1.13 | | | 04/07/2004 | | | 7,024,525 |
| | | | |
| | 28,150,000 | | FHLB | | 1.25 | | | 04/15/2004 | | | 28,154,891 |
| | | | |
| | 10,000,000 | | FHLB | | 3.75 | | | 04/15/2004 | | | 10,129,016 |
| | | | |
| | 23,175,000 | | FHLB | | 4.88 | | | 04/16/2004 | | | 23,628,399 |
| | | | |
| | 21,000,000 | | FHLB | | 3.38 | | | 05/14/2004 | | | 21,285,908 |
| | | | |
| | 38,330,000 | | FHLB | | 4.88 | | | 05/14/2004 | | | 39,212,215 |
| | | | |
| | 50,000,000 | | FHLB | | 3.38 | | | 06/15/2004 | | | 50,733,055 |
| | | | |
| | 50,000,000 | | FHLB | | 4.75 | | | 06/28/2004 | | | 51,320,006 |
| | | | |
| | | | | | | | | | | | 327,110,922 |
| | | | | | | | | | |
|
|
| | | |
| Federal Home Loan Mortgage Corporation – 6.61% | | | | | | | | |
| | | | |
| | 30,916,000 | | FHLMC | | 6.38 | | | 11/15/2003 | | | 31,104,798 |
| | | | |
| | 4,170,000 | | FHLMC | | 3.05 | | | 11/28/2003 | | | 4,181,160 |
| | | | |
| | 38,700,000 | | FHLMC | | 3.25 | | | 12/15/2003 | | | 38,875,275 |
| | | | |
| | 147,321,000 | | FHLMC | | 3.25 | | | 01/15/2004 | | | 148,232,208 |
26
| PORTFOLIOOFINVESTMENTS — SEPTEMBER 30, 2003 (UNAUDITED) | | WELLSFARGOMONEYMARKETFUNDS |
|
GOVERNMENTMONEYMARKETFUND
| Principal | | Security Name | | Interest Rate | | | Maturity Date | | Value |
| | | | |
| | | | | | | | | | | | |
| | | |
| Federal Home Loan Mortgage Corporation (continued) | | | | | | | | |
| | | | |
| $ | 79,125,000 | | FHLMC | | 5.00 | % | | 01/15/2004 | | $ | 80,007,339 |
| | | | |
| | 44,990,000 | | FHLMC | | 5.25 | | | 02/15/2004 | | | 45,649,890 |
| | | | |
| | 62,995,000 | | FHLMC | | 3.75 | | | 04/15/2004 | | | 63,879,392 |
| | | | |
| | | | | | | | | | | | 411,930,062 |
| | | | | | | | | | |
|
|
| | | |
| Federal National Mortgage Association – 10.50% | | | | | | | | |
| | | | |
| | 4,925,000 | | FNMA | | 6.84 | | | 10/15/2003 | | | 4,935,590 |
| | | | |
| | 41,940,000 | | FNMA | | 1.01 | | | 11/03/2003 | | | 41,901,171 |
| | | | |
| | 45,695,000 | | FNMA | | 1.06 | | | 11/03/2003 | | | 45,650,600 |
| | | | |
| | 224,893,000 | | FNMA | | 4.75 | | | 11/14/2003 | | | 225,850,699 |
| | | | |
| | 50,000,000 | | FNMA | | 3.13 | | | 11/15/2003 | | | 50,111,153 |
| | | | |
| | 20,500,000 | | FNMA | | 1.28 | | | 01/02/2004 | | | 20,432,213 |
| | | | |
| | 26,000,000 | | FNMA | | 1.15 | | | 02/02/2004 | | | 25,897,011 |
| | | | |
| | 147,228,000 | | FNMA | | 5.13 | | | 02/13/2004 | | | 149,347,571 |
| | | | |
| | 40,183,000 | | FNMA | | 4.75 | | | 03/15/2004 | | | 40,851,921 |
| | | | |
| | 15,000,000 | | FNMA | | 5.91 | | | 03/19/2004 | | | 15,317,444 |
| | | | |
| | 33,975,000 | | FNMA | | 3.63 | | | 04/15/2004 | | | 34,435,781 |
| | | | |
| | | | | | | | | | | | 654,731,154 |
| | | | | | | | | | |
|
|
| | | |
| Tennessee Valley Authority – 0.07% | | | | | | | | |
| | | | |
| | 4,300,000 | | Tennessee Valley Authority | | 5.00 | | | 12/18/2003 | | | 4,331,670 |
| | | | | | | | | | |
|
|
| | | |
Total Fixed Rate Notes – Agency (Cost $1,411,093,808) | | | | | | | | 1,411,093,808 |
| | | | | | | | | | |
|
|
| | | |
| Floating Rate Notes – Agency – 23.23% | | | | | | | | |
| | | |
| Federal Farm Credit Bank – 6.41% | | | | | | | | |
| | | | |
| | 100,000,000 | | FFCB± | | 1.00 | | | 04/07/2004 | | | 99,976,268 |
| | | | |
| | 100,000,000 | | FFCB± | | 1.02 | | | 06/02/2004 | | | 99,996,629 |
| | | | |
| | 100,000,000 | | FFCB± | | 1.01 | | | 06/10/2004 | | | 99,986,150 |
| | | | |
| | 100,000,000 | | FFCB± | | 1.01 | | | 11/15/2004 | | | 99,977,455 |
| | | | |
| | | | | | | | | | | | 399,936,502 |
| | | | | | | | | | |
|
|
| | | |
| Federal Home Loan Bank – 6.74% | | | | | | | | |
| | | | |
| | 80,000,000 | | FHLB± | | 0.98 | | | 12/29/2003 | | | 79,990,684 |
| | | | |
| | 100,000,000 | | FHLB± | | 0.98 | | | 05/27/2004 | | | 99,973,698 |
| | | | |
| | 125,000,000 | | FHLB± | | 0.97 | | | 07/14/2004 | | | 124,980,308 |
| | | | |
| | 115,000,000 | | FHLB± | | 1.01 | | | 08/11/2004 | | | 114,978,999 |
| | | | |
| | | | | | | | | | | | 419,923,689 |
| | | | | | | | | | |
|
|
| | | |
| Federal National Mortgage Association – 10.08% | | | | | | | | |
| | | | |
| | 10,000,000 | | FNMA± | | 0.98 | | | 02/13/2004 | | | 9,998,875 |
| | | | |
| | 8,500,000 | | FNMA± | | 0.99 | | | 03/11/2004 | | | 8,498,987 |
| | | | |
| | 110,000,000 | | FNMA± | | 0.98 | | | 07/30/2004 | | | 109,977,089 |
| | | | |
| | 75,000,000 | | FNMA± | | 0.99 | | | 01/03/2005 | | | 74,976,321 |
| | | | |
| | 100,000,000 | | FNMA± | | 1.01 | | | 01/03/2005 | | | 99,968,411 |
| | | | |
| | 100,000,000 | | FNMA± | | 0.99 | | | 01/07/2005 | | | 99,949,529 |
27
| WELLSFARGOMONEYMARKETFUNDS | | PORTFOLIOOFINVESTMENTS — SEPTEMBER 30, 2003 (UNAUDITED) |
|
GOVERNMENTMONEYMARKETFUND
| Principal | | Security Name | | Interest Rate | | | Maturity Date | | Value |
| | | | |
| | | | | | | | | | | | |
| | | |
| Federal National Mortgage Association (continued) | | | | | | | | |
| | | | |
| $ | 75,000,000 | | FNMA± | | 1.01 | % | | 01/28/2005 | | $ | 74,970,040 |
| | | | |
| | 150,000,000 | | FNMA± | | 1.04 | | | 01/28/2005 | | | 149,950,001 |
| | | | |
| | | | | | | | | | | | 628,289,253 |
| | | | | | | | | | |
|
|
| | |
Total Floating Rate Notes – Agency (Cost $1,448,149,444) | | | | | 1,448,149,444 |
| | | | | | | | | | |
|
|
| | | |
| Repurchase Agreements – 22.76% | | | | | | | | |
| | | | |
| | 500,000,000 | | Bear Stearns & Company Incorporated – 102% Collateralized by US Government Securities | | 1.13 | | | 10/01/2003 | | | 500,000,000 |
| | | | |
| | 125,000,000 | | Credit Suisse First Boston – 102% Collaterized by US Government Securities | | 1.08 | | | 10/01/2003 | | | 125,000,000 |
| | | | |
| | 500,000,000 | | Credit Suisse First Boston – 102% Collaterized by US Government Securities | | 1.13 | | | 10/01/2003 | | | 500,000,000 |
| | | | |
| | 22,000,000 | | Goldman Sachs Group Incorporated – 102% Collateralized by US Government Securities | | 1.12 | | | 10/01/2003 | | | 22,000,000 |
| | | | |
| | 21,596,000 | | Lehman Brothers Incorporated – 102% Collaterized by US Government Securities | | 1.10 | | | 10/01/2003 | | | 21,596,000 |
| | | | |
| | 250,000,000 | | UBS Warburg LLC – 102% Collaterized by US Government Securities | | 1.13 | | | 10/01/2003 | | | 250,000,000 |
| | | |
Total Repurchase Agreements (Cost $1,418,596,000) | | | | | | | | 1,418,596,000 |
| | | | | | | | | | |
|
|
| | | |
Total Investments In Securities
(Cost $6,271,508,495)* | | 100.60 | % | | | | $ | 6,271,508,495 | |
| | | |
Other Assets And Liabilities, Net | | (0.60 | ) | | | | | (37,121,602 | ) |
| | |
|
| | | |
|
|
|
| Total Net Assets | | 100.00 | % | | | | $ | 6,234,386,893 | |
| | |
|
| | | |
|
|
|
| * | | Cost for federal income tax purposes is substantially the same as for financial reporting purposes. |
| ± | | Variable Rate Securties. |
The accompanying notes are an integral part of these financial statements.
28
| PORTFOLIOOFINVESTMENTS — SEPTEMBER 30, 2003 (UNAUDITED) | | WELLSFARGOMONEYMARKETFUNDS |
|
NATIONALTAX-FREEMONEYMARKETFUND
| Principal | | Security Name | | Interest Rate | | | Maturity Date | | Value |
| | | | |
| | | | | | | | | | | | |
| | | |
| Municipal Securities – 99.81% | | | | | | | | |
| | | |
| Alabama – 0.51% | | | | | | | | |
| | | | |
| $ | 5,195,000 | | Alabama Water Pollution Control Authority Revenue Roc Series II-R-115
AMBAC Insured§ | | 1.15 | % | | 08/15/2010 | | $ | 5,195,000 |
| | | | |
| | 4,895,000 | | Montgomery AL BMC Special Care Facilities Authority Revenue Series 435§ | | 1.14 | | | 11/15/2029 | | | 4,895,000 |
| | | | |
| | | | | | | | | | | | 10,090,000 |
| | | | | | | | | | |
|
|
| | | |
| Alaska – 3.40% | | | | | | | | |
| | | | |
| | 1,500,000 | | Alaska IDA Revenue Providence Medical Office Building Associates Project
KBC Bank NV LOC§ | | 0.95 | | | 06/01/2010 | | | 1,500,000 |
| | | | |
| | 7,495,000 | | Alaska State Housing Finance Corporation Floater PA 1057 Housing Revenue MBIA Insured§ | | 1.13 | | | 06/01/2026 | | | 7,495,000 |
| | | | |
| | 1,425,000 | | Alaska State Housing Finance Corporation Housing Revenue Series BB§ | | 1.23 | | | 06/01/2007 | | | 1,425,000 |
| | | | |
| | 55,300,000 | | Valdez AK Marine Terminal Revenue BP Pipelines Incorporated Project Series B§ | | 1.20 | | | 07/01/2037 | | | 55,300,000 |
| | | | |
| | 2,000,000 | | Valdez AK Marine Terminal Revenue BP Pipelines Incorporated Project Series A§ | | 1.20 | | | 06/01/2037 | | | 2,000,000 |
| | | | |
| | | | | | | | | | | | 67,720,000 |
| | | | | | | | | | |
|
|
| | | |
| Arizona – 1.82% | | | | | | | | |
| | | | |
| | 18,600,000 | | Arizona School District Tax Anticipation Notes Financing Program CTFS Participation | | 1.75 | | | 07/30/2004 | | | 18,714,518 |
| | | | |
| | 2,715,000 | | Maricopa County AZ IDA MFHR Refunding Las Gardenias Apartments Project Series A§ | | 1.13 | | | 04/15/2033 | | | 2,715,000 |
| | | | |
| | 2,300,000 | | Maricopa County AZ IDA MFHR Villas Solanas Apartments Project Series A Bank of Cherry Creek NA LOC§ | | 1.13 | | | 11/15/2032 | | | 2,300,000 |
| | | | |
| | 3,315,000 | | Maricopa County AZ IDA SFMR§ | | 1.18 | | | 09/01/2005 | | | 3,315,000 |
| | | | |
| | 5,615,000 | | Pima County AZ IDA Revenue Lease Purchase§ | | 1.20 | | | 06/01/2007 | | | 5,615,000 |
| | | | |
| | 2,000,000 | | Salt River Project AZ Agriculture Improvement & Power District Electric System Revenue Salt River Project Series A§ | | 5.00 | | | 01/01/2004 | | | 2,019,495 |
| | | | |
| | 1,515,000 | | Salt River Project AZ Agriculture Improvement & Power District Electric System Revenue Salt River Project Series B§ | | 6.50 | | | 01/01/2004 | | | 1,535,168 |
| | | | |
| | | | | | | | | | | | 36,214,181 |
| | | | | | | | | | |
|
|
| | | |
| Arkansas – 0.14% | | | | | | | | |
| | | | |
| | 2,845,000 | | Arkansas State Development Finance Authority SFMR Series II
Collateralized By GNMA FNMA§ | | 1.20 | | | 07/01/2033 | | | 2,845,000 |
| | | | | | | | | | |
|
|
| | | |
| California – 2.10% | | | | | | | | |
| | | | |
| | 3,100,000 | | California HFA Revenue Home Mortgage Series J FSA Insured§ | | 1.14 | | | 02/01/2032 | | | 3,100,000 |
| | | | |
| | 1,200,000 | | California HFFA Revenue Series B MBIA Insured§ | | 1.20 | | | 09/01/2028 | | | 1,200,000 |
| | | | |
| | 4,000,000 | | California Higher Education Loan Authority Incorporated Student Loan Revenue Series A State Street B&T Company LOC§ | | 1.05 | | | 07/01/2005 | | | 4,000,000 |
| | | | |
| | 3,800,000 | | California State Department Water Reserve & Power Supply Revenue Series B-1 Bank of New York LOC§ | | 1.20 | | | 05/01/2022 | | | 3,800,000 |
| | | | |
| | 4,000,000 | | Las Virgenes CA Unified School District FSA Insured§ | | 0.88 | | | 07/01/2033 | | | 4,000,000 |
| | | | |
| | 4,900,000 | | Los Angeles CA Water & Power Revenue Subseries B-6§ | | 1.00 | | | 07/01/2034 | | | 4,900,000 |
| | | | |
| | 1,800,000 | | Metropolitan Water District Southern CA Waterworks Revenue Series B-3§ | | 1.15 | | | 07/01/2035 | | | 1,800,000 |
| | | | |
| | 19,000,000 | | San Bernardino County CA TRAN | | 1.50 | | | 07/01/2004 | | | 19,098,715 |
| | | | |
| | | | | | | | | | | | 41,898,715 |
| | | | | | | | | | |
|
|
29
| WELLSFARGOMONEYMARKETFUNDS | | PORTFOLIOOFINVESTMENTS — SEPTEMBER 30, 2003 (UNAUDITED) |
|
NATIONALTAX-FREEMONEYMARKETFUND
| Principal | | Security Name | | Interest Rate | | | Maturity Date | | Value |
| | | | |
| | | | | | | | | | | | |
| | | |
| Colorado – 2.28% | | | | | | | | |
| | | | |
| $ | 3,800,000 | | Arapahoe County CO Capital Improvements & Transportation Funding Highway Revenue Tolls Series 437 Merrill Lynch Capital Services LOC§ | | 1.16 | % | | 08/31/2026 | | $ | 3,800,000 |
| | | | |
| | 2,000,000 | | Arvada County CO Water Enterprises Revenue FSA Insured§ | | 1.15 | | | 11/01/2020 | | | 2,000,000 |
| | | | |
| | 4,264,000 | | Boulder County CO MFHR Cloverbasin Village Apartments Project§ | | 1.80 | | | 12/25/2031 | | | 4,264,000 |
| | | | |
| | 2,015,000 | | Colorado Department of Transportation Revenue Putters Series 249Z AMBAC Insured§ | | 1.16 | | | 06/15/2014 | | | 2,015,000 |
| | | | |
| | 2,000,000 | | Colorado HFA AMT MFHR Project Class I Series B-3 Collateralized By FHLB§ | | 1.15 | | | 10/01/2035 | | | 2,000,000 |
| | | | |
| | 2,000,000 | | Denver CO Health & Hospital Authority Healthcare Revenue Series B Bank One Colorado NA LOC§ | | 1.25 | | | 12/01/2031 | | | 2,000,000 |
| | | | |
| | 18,000,000 | | Fitzsimons Redevelopment Authority Colorado Revenue University Physicians Incorporated Allied Irish Bank PLC LOC§ | | 1.15 | | | 01/01/2025 | | | 18,000,000 |
| | | | |
| | 11,300,000 | | Pitkin County CO Industrial Development Revenue Aspen Skiing Project Series A Bank One NA LOC§ | | 1.20 | | | 04/01/2016 | | | 11,300,000 |
| | | | |
| | | | | | | | | | | | 45,379,000 |
| | | | | | | | | | |
|
|
| | | |
| Dist Of Columbia – 0.21% | | | | | | | | |
| | | | |
| | 4,165,000 | | District of Columbia Floats PA 568 FSA Insured§ | | 1.14 | | | 06/01/2007 | | | 4,165,000 |
| | | | | | | | | | |
|
|
| | | |
| Florida – 1.98% | | | | | | | | |
| | | | |
| | 3,600,000 | | Alachua County FL Health Facilities Authority Oak Hammock University of Florida Project Series A§ | | 1.20 | | | 10/01/2032 | | | 3,600,000 |
| | | | |
| | 9,000,000 | | Eagle Tax-Exempt Trust CTF 20010906 Class A (Florida State Board of Education Lottery Revenue Series B) FGIC Insured§ | | 1.15 | | | 07/01/2019 | | | 9,000,000 |
| | | | |
| | 2,200,000 | | Escambia County FL HFA SFMR CTFS Series B§ | | 1.15 | | | 10/01/2033 | | | 2,200,000 |
| | | | |
| | 780,000 | | Escambia County FL Housing Finance Authority SFMR Floats PT 1228§ | | 1.18 | | | 10/01/2031 | | | 780,000 |
| | | | |
| | 2,000,000 | | Jacksonville FL Electric Authority Revenue Series D§ | | 5.38 | | | 10/01/2011 | | | 2,000,000 |
| | | | |
| | 9,300,000 | | Jacksonville FL Health Facilities Authority Hospital Revenue Charity OB Group Series C MBIA Insured§ | | 1.10 | | | 08/15/2019 | | | 9,300,000 |
| | | | |
| | 1,750,000 | | Orange County FL IDA Industrial Development Revenue Central Florida YMCA Project Series A Bank of America NA LOC§ | | 1.15 | | | 05/01/2027 | | | 1,750,000 |
| | | | |
| | 4,000,000 | | Orlando FL Utilities Commission Water and Electric Revenue Series B§ | | 5.25 | | | 10/01/2023 | | | 4,040,000 |
| | | | |
| | 1,190,000 | | Orlando FL Utilities Commission Water and Electric Revenue Sub-Series B§ | | 5.25 | | | 10/01/2006 | | | 1,220,631 |
| | | | |
| | 5,500,000 | | Palm Beach County FL Zoological Society Incorporated Project Northern Trust Company LOC§ | | 1.15 | | | 05/01/2031 | | | 5,500,000 |
| | | | |
| | | | | | | | | | | | 39,390,631 |
| | | | | | | | | | |
|
|
| | | |
| Georgia – 5.88% | | | | | | | | |
| | | | |
| | 1,500,000 | | Buford GA Housing Authority MFHR Series 1172§ | | 1.22 | | | 09/01/2025 | | | 1,500,000 |
| | | | |
| | 5,300,000 | | Clayton County GA Development Authority Industrial Development Revenue Blue Circle Aggregates Incorporated Danske Bank LOC§ | | 1.20 | | | 09/01/2009 | | | 5,300,000 |
| | | | |
| | 15,000,000 | | Cobb County GA Tax Anticipated Notes | | 1.50 | | | 12/31/2003 | | | 15,017,382 |
| | | | |
| | 4,270,000 | | Eagle Tax-Exempt Trust CTF 20001003 Class A (Atlanta GA Airport Revenue Series A) FGIC Insured§ | | 1.15 | | | 01/01/2030 | | | 4,270,000 |
| | | | |
| | 4,400,000 | | Gainesville & Hall County GA Development Authority Individual Exempt Facilities Revenue Spout Springs Water LLC Project Bank of America NA LOC§ | | 1.20 | | | 04/01/2027 | | | 4,400,000 |
| | | | |
| | 13,440,000 | | Georgia Local Government CTFS Participation Series K§ | | 1.18 | | | 06/01/2028 | | | 13,440,000 |
| | | | |
| | 23,400,000 | | Georgia Municipal Gas Authority Gas Revenue Gas Portfolio II Project C Wachovia Bank LOC§ | | 1.10 | | | 01/01/2008 | | | 23,400,000 |
30
| PORTFOLIOOFINVESTMENTS — SEPTEMBER 30, 2003 (UNAUDITED) | | WELLSFARGOMONEYMARKETFUNDS |
|
NATIONALTAX-FREEMONEYMARKETFUND
| Principal | | Security Name | | Interest Rate | | | Maturity Date | | Value |
| | | | |
| | | | | | | | | | | | |
| | | |
| Georgia (continued) | | | | | | | | |
| | | | |
| $ | 17,800,000 | | Gwinnett County GA Development Authority Revenue Civic & Cultural Center Project Landesbank Hessen LOC§ | | 1.05 | % | | 09/01/2031 | | $ | 17,800,000 |
| | | | |
| | 32,000,000 | | Gwinnett County GA School District Construction Sales Tax Notes | | 2.00 | | | 12/29/2003 | | | 32,069,608 |
| | | | |
| | | | | | | | | | | | 117,196,990 |
| | | | | | | | | | |
|
|
| | | |
| Hawaii – 0.85% | | | | | | | | |
| | | | |
| | 8,000,000 | | Eagle Tax-Exempt Trust CTF 20011101 Class A (Hawaii State Highway Revenue) FSA Insured§ | | 1.15 | | | 07/01/2019 | | | 8,000,000 |
| | | | |
| | 9,000,000 | | Honolulu HI City & County Tax Revenue Series C FGIC Insured§ | | 1.30 | | | 12/01/2008 | | | 9,000,000 |
| | | | |
| | | | | | | | | | | | 17,000,000 |
| | | | | | | | | | |
|
|
| | | |
| Idaho – 1.68% | | | | | | | | |
| | | | |
| | 3,000,000 | | Ada & Canyon Countys ID JT School District #2 Meridan SBG Insured | | 2.50 | | | 07/30/2004 | | | 3,039,482 |
| | | | |
| | 3,075,000 | | Idaho Housing & Financial Assistance Housing Revenue Balmoral Apartments II Development Project US Bank NA LOC§ | | 1.25 | | | 04/01/2033 | | | 3,075,000 |
| | | | |
| | 27,000,000 | | Idaho State Tax Anticipation Notes | | 2.00 | | | 06/30/2004 | | | 27,239,709 |
| | | | |
| | | | | | | | | | | | 33,354,191 |
| | | | | | | | | | |
|
|
| | | |
| Illinois – 10.91% | | | | | | | | |
| | | | |
| | 5,000,000 | | Chicago IL Board of Education CTFS Series A§ | | 1.18 | | | 06/01/2021 | | | 5,000,000 |
| | | | |
| | 6,050,000 | | Chicago IL Board of Education Roc Series II-R-139 AMBAC Insured§ | | 1.15 | | | 12/01/2022 | | | 6,050,000 |
| | | | |
| | 1,500,000 | | Chicago IL Economic Development Revenue Crane Carton Company Project Bankers Trust Company LOC§ | | 1.25 | | | 06/01/2012 | | | 1,500,000 |
| | | | |
| | 6,810,000 | | Chicago IL Midway Airport Revenue Series A MBIA Insured§ | | 6.25 | | | 01/01/2024 | | | 7,031,937 |
| | | | |
| | 5,465,000 | | Chicago IL Park District Roc Rr Series II-R-4018 AMBAC Insured§ | | 1.15 | | | 01/01/2024 | | | 5,465,000 |
| | | | |
| | 2,800,000 | | Chicago IL Public Building Commission Eagle 20030015 Class A FGIC Insured§ | | 1.15 | | | 12/01/2014 | | | 2,800,000 |
| | | | |
| | 5,700,000 | | Chicago IL Sales Tax Revenue Series SG 131 FGIC Insured§ | | 1.13 | | | 01/01/2027 | | | 5,700,000 |
| | | | |
| | 3,747,000 | | Cook County IL CTFS Series 458 FGIC Insured§ | | 1.14 | | | 11/15/2028 | | | 3,747,000 |
| | | | |
| | 4,000,000 | | Cook County IL High School District No 205 Thornton Township Series B FSA Insured§ | | 2.60 | | | 12/01/2003 | | | 4,008,267 |
| | | | |
| | 5,125,000 | | Eagle Tax-Exempt Trust CTF 20021301 Class A (Illinois State) FGIC Insured§ | | 1.15 | | | 02/01/2019 | | | 5,125,000 |
| | | | |
| | 18,025,000 | | Eagle Tax-Exempt Trust CTF 20021303 Class A (Cook County IL Series C) AMBAC Insured§ | | 1.15 | | | 11/15/2025 | | | 18,025,000 |
| | | | |
| | 4,000,000 | | Eagle Tax-Exempt Trust CTF 20021304 Class A (Illinois State) FGIC Insured§ | | 1.15 | | | 02/01/2027 | | | 4,000,000 |
| | | | |
| | 1,340,000 | | Elgin IL Industrial Development Revenue Gemini Mouldings Project Lasalle Bank NA LOC§ | | 1.18 | | | 12/01/2028 | | | 1,340,000 |
| | | | |
| | 200,000 | | Elmhurst IL Industrial Development Revenue John Sakash Company Incorporated Project Lasalle Bank NA LOC§ | | 1.18 | | | 02/01/2025 | | | 200,000 |
| | | | |
| | 5,145,000 | | Illinois Development Finance Authority Revenue Christian Heritage Academy US Bank NA LOC§ | | 1.25 | | | 12/01/2021 | | | 5,145,000 |
| | | | |
| | 200,000 | | Illinois Educational Facilities Authority Revenue Newberry Library Northern Trust Company LOC§ | | 1.10 | | | 03/01/2028 | | | 200,000 |
| | | | |
| | 4,800,000 | | Illinois Educational Facilities Authority Revenue St Xavier University Project Series A Lasalle Bank NA LOC§ | | 1.13 | | | 10/01/2032 | | | 4,800,000 |
| | | | |
| | 14,600,000 | | Illinois Educuational Facilities Authority Revenue Cultural Pooled Financing American National B&T LOC§ | | 1.10 | | | 03/01/2028 | | | 14,600,000 |
| | | | |
| | 4,525,000 | | Illinois Health Facilities Authority Revenue Floater CTFS Series 166 AMBAC Insured§ | | 1.10 | | | 02/15/2024 | | | 4,525,000 |
31
| WELLSFARGOMONEYMARKETFUNDS | | PORTFOLIOOFINVESTMENTS — SEPTEMBER 30, 2003 (UNAUDITED) |
|
NATIONALTAX-FREEMONEYMARKETFUND
| Principal | | Security Name | | Interest Rate | | | Maturity Date | | Value |
| | | | |
| | | | | | | | | | | | |
| | | |
| Illinois (continued) | | | | | | | | |
| | | | |
| $ | 4,500,000 | | Illinois Health Facilities Authority Revenue Illinois Masonic Medical Center§ | | 5.50 | % | | 10/01/2019 | | $ | 4,590,000 |
| | | | |
| | 5,000,000 | | Illinois Health Facilities Authority Revenue Memorial Medical Center Series C Kredietbank NV LOC§ | | 1.10 | | | 01/01/2016 | | | 5,000,000 |
| | | | |
| | 22,100,000 | | Illinois Health Facilities Authority Revenue Northwestern Memorial Hospital§ | | 1.20 | | | 08/15/2025 | | | 22,100,000 |
| | | | |
| | 7,500,000 | | Illinois Health Facilities Authority Revenue Northwestern Memorial Hospital Series A Westdeutsche Landesbank LOC§ | | 1.22 | | | 08/15/2009 | | | 7,500,000 |
| | | | |
| | 13,600,000 | | Illinois Health Facilities Authority Revenue Northwestern Memorial Hospital Series C Westdeutsche Landesbank LOC§ | | 1.20 | | | 08/15/2032 | | | 13,600,000 |
| | | | |
| | 3,600,000 | | Illinois Health Facilities Authority Revenue Revolving Fund Pooled Financing Bank One NA LOC§ | | 1.10 | | | 08/01/2015 | | | 3,600,000 |
| | | | |
| | 16,100,000 | | Illinois Health Facilities Authority Revenue Silver Cross Hospital & Medical Series A Fifth Third Bank LOC§ | | 1.14 | | | 08/15/2026 | | | 16,100,000 |
| | | | |
| | 7,500,000 | | Illinois Housing Development Authority MFHR Lakeshore Plaza Series A
MBIA Insured§ | | 1.10 | | | 07/01/2027 | | | 7,500,000 |
| | | | |
| | 1,660,000 | | Illinois Industrial Development Finance Authority Revenue Recovery Income Project Bank of America NA LOC§ | | 1.18 | | | 06/01/2008 | | | 1,660,000 |
| | | | |
| | 7,530,000 | | Illinois State CTFS Series G§ | | 1.16 | | | 05/01/2015 | | | 7,530,000 |
| | | | |
| | 3,200,000 | | Illinois State Roc Series Ii-R-132 MBIA Insured§ | | 1.15 | | | 08/01/2010 | | | 3,200,000 |
| | | | |
| | 4,300,000 | | Illinois State Sales Tax Revenue Municipal Trust Receipts Series SG-9§ | | 1.13 | | | 06/15/2019 | | | 4,300,000 |
| | | | |
| | 6,800,000 | | Lombard IL IDA Revenue 2500 Higland Avenue Project Mid-America Federal Savings & Loan LOC§ | | 1.50 | | | 12/01/2006 | | | 6,800,000 |
| | | | |
| | 6,000,000 | | Orland Hills IL MFHR Series A Lasalle National Bank LOC§ | | 1.10 | | | 12/01/2004 | | | 6,000,000 |
| | | | |
| | 1,200,000 | | Schaumberg IL MFHR Windsong Apartments Project Lasalle National Bank LOC§ | | 1.12 | | | 02/01/2024 | | | 1,200,000 |
| | | | |
| | 3,250,000 | | Warren County IL Industrial Project Revenue Monmouth College Project Allied Irish Bank PLC LOC§ | | 1.10 | | | 12/01/2032 | | | 3,250,000 |
| | | | |
| | 4,000,000 | | Will County IL School District #122 New Lenox GO Series II-R-114 FGIC Insured§ | | 1.15 | | | 11/01/2020 | | | 4,000,000 |
| | | | |
| | | | | | | | | | | | 217,192,204 |
| | | | | | | | | | |
|
|
| | | |
| Indiana – 3.56% | | | | | | | | |
| | | | |
| | 400,000 | | Indiana HFFA Revenue Capital Access Comerica Bank LOC§ | | 1.05 | | | 04/01/2013 | | | 400,000 |
| | | | |
| | 4,060,000 | | Indiana HFFA Revenue Fayette Memorial Hospital Association Series B
Fifth Third Bank LOC§ | | 1.25 | | | 10/01/2022 | | | 4,060,000 |
| | | | |
| | 3,800,000 | | Indiana Secondary Market Educational Loans Incorporated Student Loan Revenue Series B AMBAC Insured§ | | 1.10 | | | 12/01/2013 | | | 3,800,000 |
| | | | |
| | 8,478,000 | | Indiana State Housing Finance Authority MFHR Pedcor Investments Series A Collateralized By FHLB§ | | 1.16 | | | 01/01/2029 | | | 8,478,000 |
| | | | |
| | 14,965,000 | | Indiana Transportation Finance Authority Toll Road Lease Revenue Roc
Series II-R-105 AMBAC Insured§ | | 1.15 | | | 07/01/2012 | | | 14,965,000 |
| | | | |
| | 1,750,000 | | Indianapolis IN Economic Development Revenue Jewish Federation Campus
Fifth Third Bank LOC§ | | 1.05 | | | 04/01/2005 | | | 1,750,000 |
| | | | |
| | 2,000,000 | | Indianapolis IN Gas Utility Revenue Series A AMBAC Insured§ | | 5.88 | | | 06/01/2024 | | | 2,104,920 |
| | | | |
| | 8,700,000 | | Indianapolis IN MFHR Crossing Partners Project AIG Guaranty LOC§ | | 1.30 | | | 03/01/2031 | | | 8,700,000 |
| | | | |
| | 1,000,000 | | Ips School Building Corporation First Mortgage State Aid Withholding LOC§ | | 6.10 | | | 01/15/2020 | | | 1,061,018 |
| | | | |
| | 15,630,000 | | Richmond IN Hospital Authority Revenue Reid Hospital & Health Care Project§ | | 1.10 | | | 01/01/2012 | | | 15,630,000 |
| | | | |
| | 9,980,000 | | Whiting IN Environmental Facilities Revenue BP Products Project Series C§ | | 1.25 | | | 07/01/2034 | | | 9,980,000 |
| | | | |
| | | | | | | | | | | | 70,928,938 |
| | | | | | | | | | |
|
|
32
| PORTFOLIOOFINVESTMENTS — SEPTEMBER 30, 2003 (UNAUDITED) | | WELLSFARGOMONEYMARKETFUNDS |
|
NATIONALTAX-FREEMONEYMARKETFUND
| Principal | | Security Name | | Interest Rate | | | Maturity Date | | Value |
| | | | |
| | | | | | | | | | | | |
| | | |
| Iowa – 2.33% | | | | | | | | |
| | | | |
| $ | 3,225,000 | | Iowa Finance Authority Economic Development Revenue Lasalle Bank NA LOC§ | | 1.30 | % | | 03/01/2016 | | $ | 3,225,000 |
| | | | |
| | 6,310,000 | | Iowa Finance Authority Health Care Facilities Revenue St Lukes Health Series A General Electric Capital Corporation LOC§ | | 1.10 | | | 03/01/2018 | | | 6,310,000 |
| | | | |
| | 2,960,000 | | Iowa Finance Authority MFHR Cedarwood Hills Project Series A
Collateralized By FHLMC§ | | 1.15 | | | 05/01/2031 | | | 2,960,000 |
| | | | |
| | 3,000,000 | | Iowa Finance Authority Private College Revenue Drake University Project Firstar Bank LOC§ | | 1.25 | | | 07/01/2011 | | | 3,000,000 |
| | | | |
| | 13,355,000 | | Iowa Finance Authority SFhr CTFS Series N§ | | 1.23 | | | 01/01/2008 | | | 13,355,000 |
| | | | |
| | 3,190,000 | | Iowa Higher Education Loan Authority Revenue Private College Facilities Grand View Project Firstar Bank NA LOC§ | | 1.25 | | | 10/01/2025 | | | 3,190,000 |
| | | | |
| | 14,300,000 | | Iowa State School Cash Anticipation Program Iowa School Corporations CTFS Series B FSA Insured | | 2.25 | | | 01/30/2004 | | | 14,354,903 |
| | | | |
| | | | | | | | | | | | 46,394,903 |
| | | | | | | | | | |
|
|
| | | |
| Kansas – 1.11% | | | | | | | | |
| | | | |
| | 2,600,000 | | Kansas State Development Finance Authority Health Facilities Revenue Stormont Vail Project Series M MBIA Insured§ | | 1.25 | | | 11/15/2023 | | | 2,600,000 |
| | | | |
| | 9,500,000 | | Kansas State Development Finance Authority MFHR Bluffs Olathe Apartments Project Series X§ | | 1.80 | | | 11/25/2031 | | | 9,500,000 |
| | | | |
| | 2,465,000 | | Lawrence KS GO Temporary Notes Property Tax Revenue Series II | | 2.25 | | | 10/01/2003 | | | 2,465,000 |
| | | | |
| | 5,035,000 | | Lenexa KS MFHR Series 1020§ | | 1.14 | | | 07/01/2004 | | | 5,035,000 |
| | | | |
| | 2,410,000 | | Sedgwick & Shawnee Countys KS SFMR Merrill Lynch Capital Services LOC§ | | 1.22 | | | 12/01/2013 | | | 2,410,000 |
| | | | |
| | | | | | | | | | | | 22,010,000 |
| | | | | | | | | | |
|
|
| | | |
| Kentucky – 0.11% | | | | | | | | |
| | | | |
| | 2,000,000 | | Louisville & Jefferson County KY Metropolitan Sewer District Sewer and Drain System Series A | | 9.00 | | | 05/15/2004 | | | 2,096,821 |
| | | | | | | | | | |
|
|
| | | |
| Lousiana – 2.15% | | | | | | | | |
| | | | |
| | 4,320,000 | | Jefferson Parish LA Home Mortgage Authority Floats PT 229
Collateralized By GNMA FNMA§ | | 1.18 | | | 06/01/2007 | | | 4,320,000 |
| | | | |
| | 5,620,000 | | Louisiana Public Facilities Authority Revenue Series II-R-192§ | | 1.15 | | | 05/15/2022 | | | 5,620,000 |
| | | | |
| | 3,785,000 | | Louisiana State GO State Territories Series II R 128 MBIA Insured§ | | 1.15 | | | 05/15/2013 | | | 3,785,000 |
| | | | |
| | 3,150,000 | | Louisiana State GO States Territories Series II R 111 MBIA Insured§ | | 1.15 | | | 05/15/2012 | | | 3,150,000 |
| | | | |
| | 2,715,000 | | Oskaloosa IA Private School Facility Revenue William Penn University Project
US Bank NA LOC§ | | 1.25 | | | 07/01/2020 | | | 2,715,000 |
| | | | |
| | 7,700,000 | | Plaquemines LA Port Harbor & Terminal District Port Facilities Revenue International Marine Term Project Series B Kreditbank NV LOC§ | | 1.10 | | | 03/15/2006 | | | 7,700,000 |
| | | | |
| | 15,500,000 | | Plaquemines LA Port Harbor & Terminal District Port Facilities Revenue International Marine Terminal Project Series A Kredietbank NV LOC§ | | 1.10 | | | 03/15/2006 | | | 15,500,000 |
| | | | |
| | | | | | | | | | | | 42,790,000 |
| | | | | | | | | | |
|
|
| | | |
| Maine – 1.21% | | | | | | | | |
| | | | |
| | 1,000,000 | | Maine Municipal Revenue Series E§ | | 5.30 | | | 11/01/2013 | | | 1,030,362 |
| | | | |
| | 2,800,000 | | Maine Regional Industrial Waste System Waste Resources Recovery Revenue Series R§ | | 1.22 | | | 07/01/2012 | | | 2,800,000 |
| | | | |
| | 20,100,000 | | Maine State Tax Anticipation Notes | | 1.75 | | | 06/30/2004 | | | 20,241,166 |
| | | | |
| | | | | | | | | | | | 24,071,528 |
| | | | | | | | | | |
|
|
33
| WELLSFARGOMONEYMARKETFUNDS | | PORTFOLIOOFINVESTMENTS — SEPTEMBER 30, 2003 (UNAUDITED) |
|
NATIONALTAX-FREEMONEYMARKETFUND
| Principal | | Security Name | | Interest Rate | | | Maturity Date | | Value |
| | | | |
| | | | | | | | | | | | |
| | | |
| Maryland – 0.25% | | | | | | | | |
| | | | |
| $ | 4,995,000 | | Maryland State Community Development Administration Department Housing & Community Development§ | | 1.05 | % | | 07/01/2039 | | $ | 4,995,000 |
| | | | | | | | | | |
|
|
| | | |
| Massachusetts – 3.07% | | | | | | | | |
| | | | |
| | 3,270,000 | | Canton MA Housing Authority MFHR Canton Arboretum Apartments Collateralized By FNMA§ | | 1.05 | | | 09/15/2026 | | | 3,270,000 |
| | | | |
| | 35,440,000 | | Massachusetts Health & Education Facilities Authority | | 0.85 | | | 10/01/2003 | | | 35,440,000 |
| | | | |
| | 15,000,000 | | Massachusetts State Central Artery Series A§ | | 1.20 | | | 12/01/2030 | | | 15,000,000 |
| | | | |
| | 7,495,000 | | Massachusetts State GO FSA Insured§ | | 1.20 | | | 12/01/2014 | | | 7,495,000 |
| | | | |
| | | | | | | | | | | | 61,205,000 |
| | | | | | | | | | |
|
|
| | | |
| Michigan – 4.05% | | | | | | | | |
| | | | |
| | 7,200,000 | | Detroit MI City School District Eagle-20026014 Class A FGIC Insured§ | | 1.15 | | | 05/01/2032 | | | 7,200,000 |
| | | | |
| | 3,400,000 | | Detroit MI Sewer Disposal Revenue Series II-R-103 FGIC Insured§ | | 1.15 | | | 07/01/2026 | | | 3,400,000 |
| | | | |
| | 5,965,000 | | Detroit MI Sewer Disposal Revenue Series II-R-116 MBIA Insured§ | | 1.15 | | | 07/01/2017 | | | 5,965,000 |
| | | | |
| | 1,000,000 | | Farmington Hills MI Hospital Finance Authority Hospital Revenue Botsford General Hospital Series B MBIA Insured§ | | 1.25 | | | 02/15/2016 | | | 1,000,000 |
| | | | |
| | 9,285,000 | | Lakeview School District Calhoun MI GO School Building & Site Improvement Series B Landesbank Henssen-Thueringen LOC§ | | 1.05 | | | 05/01/2032 | | | 9,285,000 |
| | | | |
| | 4,500,000 | | Macomb County MI Hospital Finance Authority Revenue Mount Clemens General Hospital Series A-1 Comerica Bank LOC§ | | 1.20 | | | 10/01/2020 | | | 4,500,000 |
| | | | |
| | 1,700,000 | | Michigan State Grant Anticipation Notes Series B§ | | 1.07 | | | 09/15/2008 | | | 1,700,000 |
| | | | |
| | 2,100,000 | | Michigan State Higher Education Loan Revenue Series XII B AMBAC Insured§ | | 1.10 | | | 10/01/2013 | | | 2,100,000 |
| | | | |
| | 7,700,000 | | Michigan State Housing Development Authority Limited Obligation Revenue Nonprofit Housing Corporation VI§ | | 1.15 | | | 06/01/2025 | | | 7,700,000 |
| | | | |
| | 4,950,000 | | Michigan State Housing Development Authority MFHR Berrien Woods III Project Series A Lansing Bank§ | | 1.18 | | | 07/01/2032 | | | 4,950,000 |
| | | | |
| | 3,800,000 | | Michigan State Housing Development Authority Rental Housing Revenue Series A MBIA Insured§ | | 1.09 | | | 10/01/2037 | | | 3,800,000 |
| | | | |
| | 2,500,000 | | Michigan State Strategic Fund Limited Obligation Revenue Detroit Symphony Project Series B Michigan National Bank LOC§ | | 1.20 | | | 06/01/2031 | | | 2,500,000 |
| | | | |
| | 8,200,000 | | Michigan State Strategic Funding Limited Obligation Revenue Consumers Power Company Project Series A§ | | 1.20 | | | 06/15/2010 | | | 8,200,000 |
| | | | |
| | 18,300,000 | | St Joseph MI Hospital Finance Authority Hospital Revenue Lakeland Hospital At Niles Project FSA Insured§ | | 1.05 | | | 01/01/2032 | | | 18,300,000 |
| | | | |
| | | | | | | | | | | | 80,600,000 |
| | | | | | | | | | |
|
|
| | | |
| Minnesota – 4.61% | | | | | | | | |
| | | | |
| | 500,000 | | Arden Hills MN Housing & Healthcare Facilities Revenue Presbyterian Homes Series B US Bank NA LOC§ | | 1.25 | | | 09/01/2029 | | | 500,000 |
| | | | |
| | 3,320,000 | | Burnsville MN MFHR Berkshire Project Series A Collateralized By FNMA§ | | 1.10 | | | 07/15/2030 | | | 3,320,000 |
| | | | |
| | 3,000,000 | | Crystal MN MFHR Crystal Apartments Project Collateralized By FHLB§ | | 1.05 | | | 05/01/2027 | | | 3,000,000 |
| | | | |
| | 1,200,000 | | Dakota County MN CDA MFHR Regatta Commons Project Series A Lasalle Bank NA LOC§ | | 1.30 | | | 01/01/2038 | | | 1,200,000 |
| | | | |
| | 3,375,000 | | Dakota County MN Housing & Redevelopment Authority MFHR PT 484 Collateralized By FHLMC§ | | 1.14 | | | 12/01/2022 | | | 3,375,000 |
| | | | |
| | 2,900,000 | | Duluth MN Economic Development Authority Health Care Facilities Revenue Miller-Dwan Medical Center Project US Bank NA LOC§ | | 1.25 | | | 06/01/2019 | | | 2,900,000 |
| | | | |
| | 8,460,000 | | Eagan MN MFHR Floats PT 1221§ | | 1.14 | | | 12/01/2029 | | | 8,460,000 |
34
| PORTFOLIOOFINVESTMENTS — SEPTEMBER 30, 2003 (UNAUDITED) | | WELLSFARGOMONEYMARKETFUNDS |
|
NATIONALTAX-FREEMONEYMARKETFUND
| Principal | | Security Name | | Interest Rate | | | Maturity Date | | Value |
| | | | |
| | | | | | | | | | | | |
| | | |
| Minnesota (continued) | | | | | | | | |
| | | | |
| $ | 1,550,000 | | Eagle Tax-Exempt Trust CTF 20012301 Class A§ | | 1.15 | % | | 10/01/2019 | | $ | 1,550,000 |
| | | | |
| | 7,880,000 | | Edina MN MFHR Edina Park Plaza Collateralized By FHLMC§ | | 1.05 | | | 12/01/2029 | | | 7,880,000 |
| | | | |
| | 4,950,000 | | Mankato MN MFHR Highland Project US Bank Trust NA LOC§ | | 1.25 | | | 05/01/2027 | | | 4,950,000 |
| | | | |
| | 350,000 | | Maple Grove MN MFHR Basswood Trails Project§ | | 1.10 | | | 03/01/2029 | | | 350,000 |
| | | | |
| | 2,080,000 | | Minneapolis MN GO Unlimited Notes | | 5.00 | | | 12/01/2003 | | | 2,093,884 |
| | | | |
| | 1,000,000 | | Minnesota Public Facilities Authority Water PCR Series A§ | | 1.13 | | | 03/01/2004 | | | 1,000,000 |
| | | | |
| | 2,000,000 | | Minnesota Public Facilities Authority Water PCR Series A | | 4.00 | | | 03/01/2004 | | | 2,024,021 |
| | | | |
| | 2,125,000 | | Minnesota Rural Water Finance Authority Series B | | 2.38 | | | 12/15/2003 | | | 2,129,426 |
| | | | |
| | 2,725,000 | | Minnesota State GO Unlimited Notes Series II-R-96§ | | 1.15 | | | 08/01/2014 | | | 2,725,000 |
| | | | |
| | 1,020,000 | | Minnesota State Higher Education Facilities Authority Revenue St Thomas University Series 5L§ | | 1.07 | | | 04/01/2027 | | | 1,020,000 |
| | | | |
| | 2,865,000 | | Plymouth MN MFHR Lancaster Village Apartments Project
Collateralized By FNMA§ | | 1.10 | | | 09/15/2031 | | | 2,865,000 |
| | | | |
| | 15,250,000 | | Rochester MN Health Care Facilities Hospital Revenue | | 0.88 | | | 10/23/2003 | | | 15,250,000 |
| | | | |
| | 4,000,000 | | Rochester MN Healthcare Services | | 0.85 | | | 12/10/2003 | | | 4,000,000 |
| | | | |
| | 650,000 | | Roseville MN Health Care Facilities Revenue Presbyterian Homes Care Project§ | | 1.25 | | | 10/01/2029 | | | 650,000 |
| | | | |
| | 1,000,000 | | Roseville MN Private School Facilities Revenue Northwestern College Project§ | | 1.25 | | | 11/01/2022 | | | 1,000,000 |
| | | | |
| | 2,375,000 | | St Paul MN Housing & Redevelopment Authority District Heating Revenue Series A§ | | 1.05 | | | 12/01/2012 | | | 2,375,000 |
| | | | |
| | 245,000 | | St Paul MN Housing & Redevelopment Authority Revenue Minnesota Public Radio Project Allied Irish Bank PLC LOC§ | | 1.25 | | | 05/01/2022 | | | 245,000 |
| | | | |
| | 1,500,000 | | St Paul MN Port Authority District Cooling Revenue 2002 Series Q Dexia Credit Local de France LOC§ | | 1.05 | | | 03/01/2022 | | | 1,500,000 |
| | | | |
| | 200,000 | | St Paul MN Port Authority District Cooling Revenue Series M Dexia Bank LOC§ | | 1.25 | | | 03/01/2021 | | | 200,000 |
| | | | |
| | 1,250,000 | | St Paul MN Port Authority District Cooling Revenue Series O Dexia Credit Local de France LOC§ | | 1.25 | | | 03/01/2012 | | | 1,250,000 |
| | | | |
| | 100,000 | | St Paul MN Port Authority District Cooling Revenue Series R Dexia Credit Local de France LOC§ | | 1.30 | | | 03/01/2022 | | | 100,000 |
| | | | |
| | 3,050,000 | | St Paul MN Port Authority Tax Increment Revenue Westgate Office & Industrial Center Project US Bank Trust NA LOC§ | | 1.10 | | | 02/01/2015 | | | 3,050,000 |
| | | | |
| | 8,990,000 | | University of Minnesota Education Facilities Revenue Intermediate Term Financing Series A§ | | 1.12 | | | 01/01/2034 | | | 8,990,000 |
| | | | |
| | 1,765,000 | | University of Minnesota GO Revenue§ | | 1.15 | | | 07/01/2021 | | | 1,765,000 |
| | | | |
| | | | | | | | | | | | 91,717,331 |
| | | | | | | | | | |
|
|
| | | |
| Mississippi – 1.22% | | | | | | | | |
| | | | |
| | 21,100,000 | | Jackson County MS Port Facility Revenue Chevron USA Incorporated Project§ | | 1.20 | | | 06/01/2023 | | | 21,100,000 |
| | | | |
| | 1,115,000 | | Mississippi Home Corporation SFMR Series 146 GNMA FNMA Insured§ | | 1.18 | | | 11/01/2029 | | | 1,115,000 |
| | | | |
| | 2,000,000 | | Mississippi Hospital Equipment & Facilities Authority Revenue North Mississippi Health Services Series 1§ | | 1.05 | | | 05/15/2030 | | | 2,000,000 |
| | | | |
| | | | | | | | | | | | 24,215,000 |
| | | | | | | | | | |
|
|
| | | |
| Missouri – 0.85% | | | | | | | | |
| | | | |
| | 145,000 | | Missouri Health and Education Facility Authority Education Facilities Revenue
St Louis University Project Series A§ | | 1.25 | | | 10/01/2009 | | | 145,000 |
| | | | |
| | 10,900,000 | | Missouri Health and Education Facility Authority Education Facilities Revenue
St Louis University Project Series B§ | | 1.25 | | | 10/01/2024 | | | 10,900,000 |
| | | | |
| | 3,800,000 | | Missouri Health and Education Facility Authority Revenue Christian Brothers College Series A§ | | 1.25 | | | 10/01/2032 | | | 3,800,000 |
35
| WELLSFARGOMONEYMARKETFUNDS | | PORTFOLIOOFINVESTMENTS — SEPTEMBER 30, 2003 (UNAUDITED) |
|
NATIONALTAX-FREEMONEYMARKETFUND
| Principal | | Security Name | | Interest Rate | | | Maturity Date | | Value |
| | | | |
| | | | | | | | | | | | |
| | | |
| Missouri (continued) | | | | | | | | |
| | | | |
| $ | 2,100,000 | | Missouri Higher Education Loan Authority Student Loan Revenue Series A Bank of America§ | | 1.10 | % | | 12/01/2005 | | $ | 2,100,000 |
| | | | |
| | | | | | | | | | | | 16,945,000 |
| | | | | | | | | | |
|
|
| | | |
| Montana – 1.04% | | | | | | | | |
| | | | |
| | 5,000,000 | | Anaconda Deer Lodge County MT Environmental Facilities Revenue Variable Reference Arco Anaconda SMElter§ | | 1.25 | | | 10/01/2037 | | | 5,000,000 |
| | | | |
| | 5,475,000 | | Montana State Board of Investments Municipal Finance Construction Act – Intercap Program§ | | 1.35 | | | 03/01/2009 | | | 5,475,000 |
| | | | |
| | 4,750,000 | | Montana State Board of Investments Municipal Finance Construction – Intercap Program§ | | 1.35 | | | 03/01/2005 | | | 4,750,000 |
| | | | |
| | 5,515,000 | | Montana State Board of Investments Municipal Finance Construction – Intercap Program§ | | 1.35 | | | 03/01/2010 | | | 5,515,000 |
| | | | |
| | | | | | | | | | | | 20,740,000 |
| | | | | | | | | | |
|
|
| | | |
| Nebraska – 0.26% | | | | | | | | |
| | | | |
| | 5,200,000 | | Nebraska Educational Finance Authority Revenue Creighton University Project Allied Irish Bank PLC LOC§ | | 1.20 | | | 08/01/2031 | | | 5,200,000 |
| | | | | | | | | | |
|
|
| | | |
| Nevada – 0.45% | | | | | | | | |
| | | | |
| | 4,690,000 | | Clark County NV Roc Rr Series II-R-1035 MBIA Insured§ | | 1.15 | | | 06/01/2021 | | | 4,690,000 |
| | | | |
| | 4,200,000 | | Nevada Housing Division Multi Unit Housing Series A US Bank NA LOC§ | | 1.13 | | | 04/01/2035 | | | 4,200,000 |
| | | | |
| | | | | | | | | | | | 8,890,000 |
| | | | | | | | | | |
|
|
| | | |
| New Mexico – 0.38% | | | | | | | | |
| | | | |
| | 1,265,000 | | Albuquerque NM Industrial Development Revenue Karsten Company New Mexico Project Series A Bank One Arizona NA LOC§ | | 1.30 | | | 12/01/2017 | | | 1,265,000 |
| | | | |
| | 2,200,000 | | Bloomfield NM Healthcare Facilities Revenue Series A Lasalle National Bank NA LOC§ | | 1.30 | | | 11/15/2010 | | | 2,200,000 |
| | | | |
| | 2,460,000 | | Espanola NM Health Care Revenue Series A Lasalle National Bank NA LOC§ | | 1.30 | | | 11/15/2010 | | | 2,460,000 |
| | | | |
| | 1,685,000 | | Silver City NM Series A Lasalle National Bank NA LOC§ | | 1.30 | | | 11/15/2010 | | | 1,685,000 |
| | | | |
| | | | | | | | | | | | 7,610,000 |
| | | | | | | | | | |
|
|
| | | |
| New York – 0.61% | | | | | | | | |
| | | | |
| | 2,000,000 | | New York NY City Housing Development Corporation MFHR First Avenue Development Project Series A§ | | 1.05 | | | 10/15/2035 | | | 2,000,000 |
| | | | |
| | 1,500,000 | | New York State Dorm Authority Revenue State University Education Facilities Series C§ | | 5.30 | | | 05/15/2009 | | | 1,577,163 |
| | | | |
| | 8,500,000 | | New York State HFA Revenue Series A§ | | 1.10 | | | 05/01/2029 | | | 8,500,000 |
| | | | |
| | | | | | | | | | | | 12,077,163 |
| | | | | | | | | | |
|
|
| | | |
| North Carolina – 0.66% | | | | | | | | |
| | | | |
| | 13,170,000 | | University of North Carolina Hospital Chapel Hill Revenue Series B§ | | 1.22 | | | 02/15/2031 | | | 13,170,000 |
| | | | | | | | | | |
|
|
| | | |
| North Dakota – 0.97% | | | | | | | | |
| | | | |
| | 6,000,000 | | North Dakota Rural Water Financial Corporation | | 2.50 | | | 11/01/2003 | | | 6,004,518 |
| | | | |
| | 10,300,000 | | North Dakota State Housing Finance Agency Revenue Series B§ | | 1.10 | | | 01/01/2034 | | | 10,300,000 |
| | | | |
| | 2,950,000 | | Ward County ND Health Care Facilities Revenue Trinity Obligation Group Series A US Bank NA LOC§ | | 1.25 | | | 07/01/2029 | | | 2,950,000 |
| | | | |
| | | | | | | | | | | | 19,254,518 |
| | | | | | | | | | |
|
|
36
| PORTFOLIOOFINVESTMENTS — SEPTEMBER 30, 2003 (UNAUDITED) | | WELLSFARGOMONEYMARKETFUNDS |
|
NATIONALTAX-FREEMONEYMARKETFUND
| Principal | | Security Name | | Interest Rate | | | Maturity Date | | Value |
| | | | |
| | | | | | | | | | | | |
| | | |
| Ohio – 4.32% | | | | | | | | |
| | | | |
| $ | 5,000,000 | | Franklin County OH Hospital Revenue Series Ii-R-55 Salomon Smith Barney LOC§ | | 1.15 | % | | 06/01/2017 | | $ | 5,000,000 |
| | | | |
| | 3,000,000 | | Grove City OH MFHR Regency Arms Apartments Project
Collateralized By FNMA§ | | 1.15 | | | 06/15/2030 | | | 3,000,000 |
| | | | |
| | 19,500,000 | | Hamilton County OH Hospital Facilities Revenue Elizabeth Gamble Series B
JP Morgan Chase & Company LOC§ | | 1.10 | | | 06/01/2027 | | | 19,500,000 |
| | | | |
| | 4,000,000 | | Ohio State Building Authority Adult Correctional Building Fund Series A
MBIA Insured§ | | 5.75 | | | 10/01/2005 | | | 4,080,000 |
| | | | |
| | 6,295,000 | | Ohio State GO Series Rr Ii-R 206 FGIC Insured§ | | 1.15 | | | 03/15/2015 | | | 6,295,000 |
| | | | |
| | 2,520,000 | | Ohio State Higher Education Facilities Revenue Series A§ | | 1.10 | | | 09/01/2027 | | | 2,520,000 |
| | | | |
| | 500,000 | | Scioto County OH Hospital Revenue VHA Center Incorporated Series C
AMBAC Insured§ | | 1.03 | | | 12/01/2025 | | | 500,000 |
| | | | |
| | 25,485,000 | | Sunamerica Trust Variable State§ | | 1.19 | | | 07/01/2041 | | | 25,485,000 |
| | | | |
| | 12,400,000 | | University of Toledo Ohio General Receipts Bonds§ | | 1.20 | | | 06/01/2032 | | | 12,400,000 |
| | | | |
| | 540,000 | | Warren County OH Health Care Facilities Revenue Otterbein Series A§ | | 1.14 | | | 07/01/2021 | | | 540,000 |
| | | | |
| | 2,810,000 | | Warren County OH Industrial Development Revenue Cincinnati Electricity Corporation Project Scotiabank LOC§ | | 1.10 | | | 09/01/2015 | | | 2,810,000 |
| | | | |
| | 3,845,000 | | Warren County OH Industrial Development Revenue Pac Manufacturing Project§ | | 1.30 | | | 12/01/2025 | | | 3,845,000 |
| | | | |
| | | | | | | | | | | | 85,975,000 |
| | | | | | | | | | |
|
|
| | | |
| Oklahoma – 1.10% | | | | | | | | |
| | | | |
| | 7,500,000 | | Muskogee OK Medical Center Authority Revenue Bank of America NA LOC§ | | 1.15 | | | 10/01/2032 | | | 7,500,000 |
| | | | |
| | 2,000,000 | | Oklahoma Development Finance Authority Health Care Revenue Continuing Care Community Project Series C KBC Bank NV LOC§ | | 1.25 | | | 02/01/2012 | | | 2,000,000 |
| | | | |
| | 4,820,000 | | Oklahoma State HFA Revenue Series 1327 Merrill Lynch Capital LOC§ | | 1.18 | | | 03/01/2009 | | | 4,820,000 |
| | | | |
| | 6,605,000 | | Oklahoma State IDA Tealridge Manor Corporation Project Bank of America NA LOC§ | | 1.15 | | | 11/01/2018 | | | 6,605,000 |
| | | | |
| | 1,055,000 | | Tulsa County OK HFA SFMR GNMA Mortgage Backed Securities Class A Series E§ | | 1.20 | | | 07/01/2032 | | | 1,055,000 |
| | | | |
| | | | | | | | | | | | 21,980,000 |
| | | | | | | | | | |
|
|
| | | |
| Oregon – 0.70% | | | | | | | | |
| | | | |
| | 1,655,000 | | Deschutes County OR Series A FSA Insured | | 5.00 | | | 06/15/2004 | | | 1,703,081 |
| | | | |
| | 3,000,000 | | Gilliam County OR Solid Waste Disposal Revenue Waste Management Incorporated Project JP Morgan Chase Bank LOC§ | | 1.15 | | | 07/01/2027 | | | 3,000,000 |
| | | | |
| | 4,300,000 | | Multnomah County OR Higher Education Revenue Concordia University Portland Project§ | | 1.25 | | | 12/01/2029 | | | 4,300,000 |
| | | | |
| | 4,995,000 | | Tri County Metro Transportation District OR Series 142§ | | 1.05 | | | 08/01/2019 | | | 4,995,000 |
| | | | |
| | | | | | | | | | | | 13,998,081 |
| | | | | | | | | | |
|
|
| | | |
| Other – 3.97% | | | | | | | | |
| | | | |
| | 5,787,003 | | ABN AMRO Leasetops CTFS Tr 2000-2 ABN AMRO Bank NV LOC§ | | 1.40 | | | 04/01/2005 | | | 5,787,003 |
| | | | |
| | 10,000,000 | | ABN AMRO Munitops CTFS Tr 1999-1 Munitops Certificates FGIC Insured§ª | | 1.18 | | | 12/06/2006 | | | 10,000,000 |
| | | | |
| | 15,420,000 | | ABN AMRO Munitops CTFS Tr 2001-23 MBIA Insured§ | | 1.18 | | | 12/01/2009 | | | 15,420,000 |
| | | | |
| | 11,286,080 | | MBIA Capital Corporation Global Funding MBIA Insured§ | | 1.23 | | | 01/14/2016 | | | 11,286,080 |
| | | | |
| | 8,160,000 | | Munimae Trust Collaterized By FHLMC§ | | 1.22 | | | 12/19/2005 | | | 8,160,000 |
| | | | |
| | 5,000,000 | | Newman Capital Trust Series 2001-2 Class A§ | | 1.24 | | | 04/11/2033 | | | 5,000,000 |
| | | | |
| | 5,027,835 | | Pitney Bowes Credit Corporation Leasetops Tr Revenue Series 2002-1§ | | 1.44 | | | 07/19/2006 | | | 5,027,835 |
| | | | |
| | 6,640,000 | | Roaring Fork Municipal Products Limited Liability Corporation Series 2000-14 Class A§ | | 1.19 | | | 06/01/2005 | | | 6,640,000 |
37
| WELLSFARGOMONEYMARKETFUNDS | | PORTFOLIOOFINVESTMENTS — SEPTEMBER 30, 2003 (UNAUDITED) |
|
NATIONALTAX-FREEMONEYMARKETFUND
| Principal | | Security Name | | Interest Rate | | | Maturity Date | | Value |
| | | | |
| | | | | | | | | | | | |
| | | |
| Other (continued) | | | | | | | | |
| | | | |
| $ | 2,153,805 | | Roaring Fork Municipal Products Limited Liability Corporation Series 2002-6 Class A§ | | 1.19 | % | | 06/01/2034 | | $ | 2,153,805 |
| | | | |
| | 2,749,000 | | US Bancorp Project Funding Trust Series A§ | | 1.23 | | | 01/01/2010 | | | 2,749,000 |
| | | | |
| | 6,815,500 | | US Bancorp Project Funding Trust Series A§ | | 1.23 | | | 03/01/2010 | | | 6,815,500 |
| | | | |
| | | | | | | | | | | | 79,039,223 |
| | | | | | | | | | |
|
|
| | | |
| Pennsylvania – 0.79% | | | | | | | | |
| | | | |
| | 1,960,000 | | Hollidaysburg PA Area School District AMBAC Insured§ | | 6.50 | | | 06/01/2020 | | | 2,033,405 |
| | | | |
| | 9,500,000 | | Pennsylvania State Higher Education Assistance Agency Student Loan Revenue Series A AMBAC Insured§ | | 1.05 | | | 12/01/2025 | | | 9,500,000 |
| | | | |
| | 4,205,000 | | Pennsylvania State Turnpike Commission Oil Franchise Tax Revenue
Series II R 1005§ | | 1.15 | | | 12/01/2015 | | | 4,205,000 |
| | | | |
| | | | | | | | | | | | 15,738,405 |
| | | | | | | | | | |
|
|
| | | |
| Rhode Island – 0.05% | | | | | | | | |
| | | | |
| | 1,000,000 | | Rhode Island Refunding Board Authority State Public Projects Revenue§ | | 1.13 | | | 08/01/2005 | | | 1,000,000 |
| | | | | | | | | | |
|
|
| | | |
| South Carolina – 3.08% | | | | | | | | |
| | | | |
| | 47,700,000 | | Charleston County SC School District Anticipated Notes | | 2.00 | | | 02/25/2004 | | | 47,870,867 |
| | | | |
| | 4,570,000 | | South Carolina Educational Facilities Authority For Private Nonprofit Institutions§ | | 1.15 | | | 02/01/2022 | | | 4,570,000 |
| | | | |
| | 3,265,000 | | South Carolina Housing Finance and Development Authority Mtg Revenue Seriesl§ | | 1.23 | | | 07/01/2028 | | | 3,265,000 |
| | | | |
| | 5,650,000 | | South Carolina State Public Service Authority Revenue§ | | 1.13 | | | 01/01/2023 | | | 5,650,000 |
| | | | |
| | | | | | | | | | | | 61,355,867 |
| | | | | | | | | | |
|
|
| | | |
| South Dakota – 0.75% | | | | | | | | |
| | | | |
| | 4,900,000 | | Lawrence County SD Solid Waste Disposal Revenue Homestake Mining Company Series A Chase Manhatten Bank LOC§ | | 1.25 | | | 07/01/2032 | | | 4,900,000 |
| | | | |
| | 10,100,000 | | South Dakota State Health & Educational Facilities Revenue Rapid City Regional Hospital§ | | 1.20 | | | 09/01/2027 | | | 10,100,000 |
| | | | |
| | | | | | | | | | | | 15,000,000 |
| | | | | | | | | | |
|
|
| | | |
| Tennessee – 2.95% | | | | | | | | |
| | | | |
| | 4,955,000 | | Chattanooga TN Roc Rr Series Ii-R-1026 MBIA Insured§ | | 1.15 | | | 10/01/2022 | | | 4,955,000 |
| | | | |
| | 4,700,000 | | Clarksville TN Public Building Authority Revenue Pooled Financing Tennessee Municipal Bond Funding Bank of America NA LOC§ | | 1.22 | | | 01/01/2033 | | | 4,700,000 |
| | | | |
| | 5,600,000 | | Jackson TN Energy Authority Wastewater System Revenue FSA Insured§ | | 1.10 | | | 12/01/2022 | | | 5,600,000 |
| | | | |
| | 4,000,000 | | Memphis TN Center City Revenue Finance Corporation MFHR Series 1220§ | | 1.14 | | | 11/01/2029 | | | 4,000,000 |
| | | | |
| | 28,360,000 | | Montgomery County TN Public Building Authority Pooled Financing Revenue Tennessee County Loan Pool§ | | 1.22 | | | 04/01/2032 | | | 28,360,000 |
| | | | |
| | 4,710,500 | | Portland TN Health & Education Facilities Board Hospital Revenue Series 322§ | | 1.23 | | | 11/15/2014 | | | 4,710,500 |
| | | | |
| | 4,610,000 | | Tennessee Housing Development Agency Series H§ | | 1.21 | | | 01/01/2021 | | | 4,610,000 |
| | | | |
| | 1,800,000 | | Volunteer State Student Funding Corporation Tennessee Student Loan Revenue Series A1 State Street Bank & Trust Company LOC§ | | 1.15 | | | 12/01/2023 | | | 1,800,000 |
| | | | |
| | | | | | | | | | | | 58,735,500 |
| | | | | | | | | | |
|
|
| | | |
| Texas – 9.18% | | | | | | | | |
| | | | |
| | 1,615,000 | | Austin TX Higher Education Authority University Revenue Concordia University At Austin Project Bank One Texas NA LOC§ | | 1.20 | | | 04/01/2025 | | | 1,615,000 |
| | | | |
| | 7,000,000 | | Austin TX Utility Systems Revenue Roc Series Ii-R-159 FSA Insured§ | | 1.15 | | | 05/15/2014 | | | 7,000,000 |
38
| PORTFOLIOOFINVESTMENTS — SEPTEMBER 30, 2003 (UNAUDITED) | | WELLSFARGOMONEYMARKETFUNDS |
|
NATIONALTAX-FREEMONEYMARKETFUND
| Principal | | Security Name | | Interest Rate | | | Maturity Date | | Value |
| | | | |
| | | | | | | | | | | | |
| | | |
| Texas (continued) | | | | | | | | |
| | | | |
| $ | 7,945,000 | | Austin TX Utility Systems Revenue Series A MBIA Insured§ | | 5.50 | % | | 11/15/2003 | | $ | 7,987,297 |
| | | | |
| | 9,400,000 | | Austin TX Utility Systems Revenue Series G Receipts§ | | 1.13 | | | 11/15/2011 | | | 9,400,000 |
| | | | |
| | 7,145,000 | | Brownsville TX Utility Systems Revenue Series A MBIA Insured§ | | 1.05 | | | 09/01/2027 | | | 7,145,000 |
| | | | |
| | 8,000,000 | | Calhoun County TX Solid Waste Disposal Revenue Formosa Plastics Corporation Project Bank of America NA LOC§ | | 1.20 | | | 05/01/2025 | | | 8,000,000 |
| | | | |
| | 7,700,000 | | Cameron TX Ed Corporation Revenue Dallas Jewish Community Foundation Allied Irish Bank plc LOC§ | | 1.12 | | | 12/01/2030 | | | 7,700,000 |
| | | | |
| | 4,310,000 | | Eagle Tax-Exempt Trust CTF 20014302 Class A (Austin TX Electric Utility Systems Revenue) FSA Insured§ | | 1.15 | | | 11/15/2017 | | | 4,310,000 |
| | | | |
| | 6,000,000 | | Eagle Tax-Exempt Trust CTF 20014310 Class A (Dallas TX Area Rapid)
AMBAC Insured§ | | 1.15 | | | 12/01/2026 | | | 6,000,000 |
| | | | |
| | 7,000,000 | | Harris County TX Health Care Facilities Development Corporation Revenue
St Lukes Episcopal Hospital Series B§ | | 1.25 | | | 02/15/2031 | | | 7,000,000 |
| | | | |
| | 2,700,000 | | Harris County TX Health Facilities Development Corporation Special Facilities Revenue Texas Medical Center Project Series B FSA Insured§ | | 1.25 | | | 05/15/2029 | | | 2,700,000 |
| | | | |
| | 13,700,000 | | Houston TX Higher Education Finance Facilities Revenue Floater Receipts
Series SG 139 Societe Generale LOC§ | | 1.13 | | | 11/15/2029 | | | 13,700,000 |
| | | | |
| | 5,470,000 | | Houston TX Water & Sewer Systems Revenue CTFS Series 495 FGIC Insured§ | | 1.14 | | | 12/01/2030 | | | 5,470,000 |
| | | | |
| | 3,770,000 | | Houston TX Water & Sewer Systems Revenue Municipal Trust Receipts
Series SG 120§ | | 1.13 | | | 12/01/2023 | | | 3,770,000 |
| | | | |
| | 1,000,000 | | North Central TX Health Facilities Development Corporation Revenue Dallas Jewish Community Foundation Allied Irish Bank plc LOC§ | | 1.12 | | | 12/01/2030 | | | 1,000,000 |
| | | | |
| | 9,500,000 | | Pasadena TX Independent School District | | 2.25 | | | 02/15/2004 | | | 9,538,810 |
| | | | |
| | 2,425,000 | | Polly Ryon Hospital Authority TX Polly Ryon Memorial Hospital JP Morgan Chase & Company LLC§ | | 1.10 | | | 11/01/2026 | | | 2,425,000 |
| | | | |
| | 3,000,000 | | Splendora TX Higher Educational Facilities Corporate Revenue Project Fellowship Christian Project§ | | 1.15 | | | 01/01/2017 | | | 3,000,000 |
| | | | |
| | 7,900,000 | | Texas A & M University Notes Series 3 A2 | | 1.25 | | | 01/27/2004 | | | 7,907,048 |
| | | | |
| | 7,900,000 | | Texas A & M University Notes Series 3 A2 | | 1.25 | | | 01/29/2004 | | | 7,907,148 |
| | | | |
| | 1,000,000 | | Texas State Public Finance Authority Series B | | 6.00 | | | 10/01/2003 | | | 1,000,000 |
| | | | |
| | 36,000,000 | | Texas State TRAN | | 2.00 | | | 08/31/2004 | | | 36,276,982 |
| | | | |
| | 15,195,000 | | Travis County TX Health Facilities Development Corporation Health Revenue Series 4 AMBAC Insured§ | | 1.17 | | | 11/15/2024 | | | 15,195,000 |
| | | | |
| | 6,870,000 | | Travis County TX HFA SFMR Series 1287 Collateralized By GNMA§ | | 1.18 | | | 09/01/2018 | | | 6,870,000 |
| | | | |
| | | | | | | | | | | | 182,917,285 |
| | | | | | | | | | |
|
|
| | | |
| Utah – 2.86% | | | | | | | | |
| | | | |
| | 7,600,000 | | Salt Lake County UT Pollution Control Revenue Series B§ | | 1.22 | | | 08/01/2007 | | | 7,600,000 |
| | | | |
| | 19,800,000 | | Salt Lake County UT Pollution Control Revenue Service Station Holdings Project§ | | 1.20 | | | 02/01/2008 | | | 19,800,000 |
| | | | |
| | 2,000,000 | | Utah State Board of Regents Student Loan Revenue Series 1988C AMBAC Insured§ | | 1.05 | | | 11/01/2013 | | | 2,000,000 |
| | | | |
| | 14,800,000 | | Utah State Board of Regents Student Loan Revenue Series 1997R AMBAC Insured§ | | 1.10 | | | 11/01/2031 | | | 14,800,000 |
| | | | |
| | 12,700,000 | | Utah Transportation Authority Sales Tax Revenue Series B Bayerishe Landesbank LOC§ | | 1.05 | | | 09/01/2032 | | | 12,700,000 |
| | | | |
| | | | | | | | | | | | 56,900,000 |
| | | | | | | | | | |
|
|
| | | |
| Virginia – 1.15% | | | | | | | | |
| | | | |
| | 16,490,000 | | Loudoun County VA IDA Howard Hughes Medical Project Series A | | 1.15 | | | 02/15/2038 | | | 16,490,000 |
| | | | |
| | 2,335,000 | | Richmond VA ROC Series II-R-168 FGIC Insured§ | | 1.15 | | | 01/15/2016 | | | 2,335,000 |
39
| WELLSFARGOMONEYMARKETFUNDS | | PORTFOLIOOFINVESTMENTS — SEPTEMBER 30, 2003 (UNAUDITED) |
|
NATIONALTAX-FREEMONEYMARKETFUND
| Principal | | Security Name | | Interest Rate | | | Maturity Date | | Value |
| | | | |
| | | | | | | | | | | | |
| | | |
| Virginia (continued) | | | | | | | | |
| | | | |
| $ | 2,000,000 | | Virginia Beach VA GO | | 5.00 | % | | 07/15/2004 | | $ | 2,065,245 |
| | | | |
| | 2,000,000 | | Virginia State Transporation Board Transportation Contract Revenue Northern Virginia Transportation District Project Series A§ | | 6.25 | | | 05/15/2017 | | | 2,090,765 |
| | | | |
| | | | | | | | | | | | 22,981,010 |
| | | | | | | | | | |
|
|
| | | |
| Washington – 4.24% | | | | | | | | |
| | | | |
| | 5,246,500 | | Energy Northwest Washington Electric Revenue CTFS Series C FSA Insured§ | | 1.21 | | | 01/01/2010 | | | 5,246,500 |
| | | | |
| | 4,200,000 | | Energy Northwest Washington Electric Revenue Floats PA 846 FSA Insured§ | | 1.14 | | | 01/01/2010 | | | 4,200,000 |
| | | | |
| | 17,350,000 | | Issaquah WA Community Properties Water Revenue Series A Bank of America NA LOC§ | | 1.10 | | | 02/15/2021 | | | 17,350,000 |
| | | | |
| | 2,000,000 | | King County WA School District No 411 Series A | | 5.85 | | | 12/01/2011 | | | 2,084,711 |
| | | | |
| | 1,255,000 | | King County WA Series A | | 5.00 | | | 01/01/2004 | | | 1,268,031 |
| | | | |
| | 5,320,000 | | Kitsap County WA School District No 400 North Kitsap Series II-R-1009
FSA Insured§ | | 1.15 | | | 12/01/2017 | | | 5,320,000 |
| | | | |
| | 1,900,000 | | Snohomish County WA Public Utility District Series A-1 FSA Insured§ | | 1.10 | | | 12/01/2019 | | | 1,900,000 |
| | | | |
| | 2,100,000 | | Washington State Economic Development Financing Authority Revenue Ace Tank Project US Bank NA LOC§ | | 1.20 | | | 11/01/2018 | | | 2,100,000 |
| | | | |
| | 5,500,000 | | Washington State Economic Development Financing Authority Revenue Industrial Development Canam Steel Project Series D§ | | 1.25 | | | 09/30/2030 | | | 5,500,000 |
| | | | |
| | 1,115,000 | | Washington State Economic Development Financing Authority Revenue Pioneer Human Services Project H§ | | 1.25 | | | 09/01/2018 | | | 1,115,000 |
| | | | |
| | 4,000,000 | | Washington State Economic Development Financing Authority Solid Waste Disposal Revenue Waste Managment Incorporated Project Series D§ | | 1.15 | | | 07/01/2027 | | | 4,000,000 |
| | | | |
| | 6,645,000 | | Washington State HFA MFHR Canyon Lakes II Project Pacific Northwest Bank LOC§ | | 1.15 | | | 10/01/2019 | | | 6,645,000 |
| | | | |
| | 6,900,000 | | Washington State Housing Finance Community MFHR Country Club Apartments Series A US Bank NA LOC§ | | 1.30 | | | 08/01/2032 | | | 6,900,000 |
| | | | |
| | 3,140,000 | | Washington State Housing Finance Community MFHR Lakewood Meadows Apartments Project Series A Insured By FNMA§ | | 1.15 | | | 07/15/2033 | | | 3,140,000 |
| | | | |
| | 1,000,000 | | Washington State Housing Finance Community MFHR Mill Point Apartments Project Series A US Bank Trust NA LOC§ | | 1.30 | | | 01/01/2030 | | | 1,000,000 |
| | | | |
| | 2,000,000 | | Washington State Housing Finance Community Nonprofit Revenue Annie Wright School Bank of America NA LOC§ | | 1.15 | | | 12/01/2023 | | | 2,000,000 |
| | | | |
| | 1,700,000 | | Washington State Housing Finance Community Nonprofit Revenue Tacoma Art Museum Project Northern Trust Company LOC§ | | 1.25 | | | 06/01/2032 | | | 1,700,000 |
| | | | |
| | 1,700,000 | | Washington State Public Power Supply System Nuclear Project No 1 Revenue Municipal Securities Trust Receipts Series CMC2 Insured By AMBAC§ | | 1.12 | | | 01/01/2005 | | | 1,700,000 |
| | | | |
| | 300,000 | | Washington State Public Power Supply System Nuclear Project No 2 Revenue Municipal Securities Trust Receipts Series CMC3 Insured By AMBAC§ | | 1.12 | | | 07/01/2007 | | | 300,000 |
| | | | |
| | 7,000,000 | | Washington State Series SG-37§ | | 1.13 | | | 07/01/2017 | | | 7,000,000 |
| | | | |
| | 1,140,000 | | Yakima County WA Public Corporation Revenue Longview Fire Company Project Bank of America NT & SA LOC§ | | 1.25 | | | 01/01/2018 | | | 1,140,000 |
| | | | |
| | 2,900,000 | | Yakima County WA Public Corporation Revenue Valley Processing Project Bank of America NA LOC§ | | 1.20 | | | 02/01/2015 | | | 2,900,000 |
| | | | |
| | | | | | | | | | | | 84,509,242 |
| | | | | | | | | | |
|
|
| | | |
| Wisconsin – 3.41% | | | | | | | | |
| | | | |
| | 5,490,000 | | Chilton WI School District ROC RR Series II-R-1017 FGIC Insured§ | | 1.15 | | | 04/01/2019 | | | 5,490,000 |
| | | | |
| | 5,000,000 | | Waukesha WI School District Tax & Revenue Anticipation Promissory Notes | | 1.50 | | | 08/23/2004 | | | 5,021,215 |
40
| PORTFOLIOOFINVESTMENTS — SEPTEMBER 30, 2003 (UNAUDITED) | | WELLSFARGOMONEYMARKETFUNDS |
|
NATIONALTAX-FREEMONEYMARKETFUND
| Principal | | Security Name | | Interest Rate | | | Maturity Date | | Value |
| | | | |
| | | | | | | | | | | | |
| | | |
| Wisconsin (continued) | | | | | | | | |
| | | | |
| $ | 26,500,000 | | Wisconsin Housing & Economic Development Authority Home Ownership Revenue Series I FSA Insured§ | | 1.10 | % | | 09/01/2032 | | $ | 26,500,000 |
| | | | |
| | 8,565,000 | | Wisconsin Rural Water Construction Loan Program Community Revenue Anticipation Notes§ | | 2.50 | | | 11/01/2003 | | | 8,571,449 |
| | | | |
| | 21,000,000 | | Wisconsin State Health & Educational Facilities Authority Revenue Prohealth Incorporated Series B§ | | 1.20 | | | 08/15/2030 | | | 21,000,000 |
| | | | |
| | 365,000 | | Wisconsin State Health and Educational Facilities Authority Revenue Gundersen Lutheran Series A§ | | 1.20 | | | 12/01/2015 | | | 365,000 |
| | | | |
| | 1,000,000 | | Wisconsin State Transportation Revenue Series A§ | | 5.50 | | | 07/01/2009 | | | 1,044,668 |
| | | | |
| | | | | | | | | | | | 67,992,332 |
| | | | | | | | | | |
|
|
| | | |
| Wyoming – 0.61% | | | | | | | | |
| | | | |
| | 5,200,000 | | Lincoln County WY PCR Exxon Project Series 1985§ | | 1.15 | | | 08/01/2015 | | | 5,200,000 |
| | | | |
| | 3,000,000 | | Sweetwater County WY Environment Improvement Revenue Bonds§ | | 1.30 | | | 11/01/2025 | | | 3,000,000 |
| | | | |
| | 4,010,000 | | Wyoming Community Development Authority Revenue FGIC Insured§ | | 1.22 | | | 02/01/2004 | | | 4,010,000 |
| | | | |
| | | | | | | | | | | | 12,210,000 |
| | | | | | | | | | |
|
|
| | |
Total Municipal Securities (Cost $1,987,689,059) | | | | | 1,987,689,059 |
| | | | | | | | | | |
|
|
| | | |
Total Investments In Securities
(Cost $1,987,689,059)* | | 99.81 | % | | | | $ | 1,987,689,059 |
| | | |
Other Assets And Liabilities, Net | | 0.19 | | | | | | 3,882,773 |
| | |
|
| | | |
|
|
| Total Net Assets | | 100.00 | % | | | | $ | 1,991,571,832 |
| | |
|
| | | |
|
|
| * | | Cost for federal income tax purposes is substantially the same as for financial reporting purposes. |
| ª | | Securities that may be resold to “Qualified institutional buyers” under rule 144A or securities offered pursuant to section 4(2) of the Securities Act of 1933, as amended. These securities have been determined to be liquid by the Adviser based on procedures approved by the Board of Trustees. |
| § | | These variable rate securities are subject to a demand feature which reduces the remaining maturity. |
The accompanying notes are an integral part of these financial statements.
41
| WELLSFARGOMONEYMARKETFUNDS | | PORTFOLIOOFINVESTMENTS — SEPTEMBER 30, 2003 (UNAUDITED) |
|
PRIMEINVESTMENTMONEYMARKETFUND
| Principal | | Security Name | | Interest Rate | | | Maturity Date | | Value |
| | | | |
| | | | | | | | | | | | |
| | | |
| Asset Backed Securities – 3.91% | | | | | | | | |
| | | | |
| $ | 50,000,000 | | WFS Financial Owner Trust Series 2003-3 Class A1 | | 1.13 | % | | 08/20/2004 | | $ | 50,000,000 |
| | | | |
| | 25,000,000 | | Whole Auto Loan Trust Series 2003-1 Class A1 | | 1.10 | | | 09/15/2004 | | | 25,000,000 |
| | | |
Total Asset Backed Securities (Cost $75,000,000) | | | | | | | | 75,000,000 |
| | | | | | | | | | |
|
|
| | | |
| Certificates of Deposit – 4.43% | | | | | | | | |
| | | | |
| | 15,000,000 | | Abbey National Treasury Services plc | | 1.40 | | | 03/02/2004 | | | 15,000,000 |
| | | | |
| | 15,000,000 | | Svenska Handelsbanken | | 1.40 | | | 03/02/2004 | | | 15,000,000 |
| | | | |
| | 55,000,000 | | Unicredito Italiano SPA | | 1.04 | | | 10/20/2003 | | | 55,000,000 |
| | | |
Total Certificates of Deposit (Cost $85,000,000) | | | | | | | | 85,000,000 |
| | | | | | | | | | |
|
|
| | | |
| Commercial Paper – 36.43% | | | | | | | | |
| | | | |
| | 60,000,000 | | Amstel Funding Corporationª | | 0.94 | † | | 12/29/2003 | | | 59,860,567 |
| | | | |
| | 50,000,000 | | Aspen Funding Corporationª | | 1.07 | † | | 10/10/2003 | | | 49,986,625 |
| | | | |
| | 50,000,000 | | Atlantis One Funding Corporationª | | 1.08 | † | | 01/28/2004 | | | 49,821,500 |
| | | | |
| | 20,000,000 | | Banco Bilbao Vizcaya Argentaria Puerto Ricoª | | 1.25 | † | | 10/01/2003 | | | 20,000,000 |
| | | | |
| | 35,000,000 | | CDC Commericial Paper Corporationª | | 1.15 | † | | 10/01/2003 | | | 35,000,000 |
| | | | |
| | 30,000,000 | | Credit Agricole Indosuez | | 1.02 | † | | 10/07/2003 | | | 29,994,900 |
| | | | |
| | 50,099,000 | | Gemini Securitization Incorporatedª | | 1.07 | † | | 10/14/2003 | | | 50,079,642 |
| | | | |
| | 50,000,000 | | Grampian Funding LLCª | | 1.08 | † | | 11/18/2003 | | | 49,928,000 |
| | | | |
| | 36,000,000 | | HBOs Treasury Services plc | | 1.06 | † | | 10/09/2003 | | | 35,991,520 |
| | | | |
| | 27,800,000 | | National Bank of New Zealand International Limitedª | | 1.09 | † | | 12/09/2003 | | | 27,741,921 |
| | | | |
| | 50,000,000 | | National Bank of New Zealand International Limitedª | | 1.09 | † | | 12/11/2003 | | | 49,892,514 |
| | | | |
| | 40,000,000 | | Network Rail Commercial Paper Finance plcª | | 1.03 | † | | 10/20/2003 | | | 39,978,256 |
| | | | |
| | 20,000,000 | | Network Rail Commercial Paper Finance plcª | | 1.01 | † | | 12/18/2003 | | | 19,956,233 |
| | | | |
| | 5,000,000 | | Province of Quebec | | 1.25 | † | | 10/09/2003 | | | 4,998,611 |
| | | | |
| | 100,000,000 | | Regency Markets Number 1 LLCª | | 1.09 | † | | 11/20/2003 | | | 99,848,611 |
| | | | |
| | 50,000,000 | | Republic of Italy | | 1.02 | † | | 12/30/2003 | | | 49,872,500 |
| | | | |
| | 26,752,000 | | Tulip Funding Corporationª | | 1.09 | † | | 12/01/2003 | | | 26,702,591 |
| | | |
Total Commercial Paper (Cost $699,653,991) | | | | | | | | 699,653,991 |
| | | | | | | | | | |
|
|
| | | |
| Discount Note – Agency – 5.19% | | | | | | | | |
| | | |
| Federal National Mortgage Association – 5.19% | | | | | | | | |
| | | | |
| | 100,000,000 | | FNMA | | 1.08 | † | | 12/31/2003 | | | 99,727,000 |
| | | |
Total Discount Note – Agency (Cost $99,727,000) | | | | | | | | 99,727,000 |
| | | | | | | | | | |
|
|
| | | |
| Fixed Rate Note – Agency – 0.38% | | | | | | | | |
| | | |
| Federal National Mortgage Association – 0.38% | | | | | | | | |
| | | | |
| | 7,371,000 | | FNMA | | 1.14 | | | 01/19/2004 | | | 7,346,210 |
| | | |
Total Fixed Rate Note – Agency (Cost $7,346,210) | | | | | | | | 7,346,210 |
| | | | | | | | | | |
|
|
| | | |
| Fixed Rate Note – Corporate – 1.09% | | | | | | | | |
| | | | |
| | 21,000,000 | | Links Finance LLC | | 2.00 | | | 10/10/2003 | | | 21,000,000 |
| | | |
Total Fixed Rate Note – Corporate (Cost $21,000,000) | | | | | | | | 21,000,000 |
| | | | | | | | | | |
|
|
42
| PORTFOLIOOFINVESTMENTS — SEPTEMBER 30, 2003 (UNAUDITED) | | WELLSFARGOMONEYMARKETFUNDS |
|
PRIMEINVESTMENTMONEYMARKETFUND
| Principal | | Security Name | | Interest Rate | | | Maturity Date | | Value |
| | | |
| Floating Rate Note – Agency – 2.08% | | | | | | | | |
| | | |
| Federal Home Loan Mortgage Corporation – 2.08% | | | | | | | | |
| | | | |
| $ | 40,000,000 | | FHLMC± | | 1.04 | % | | 02/04/2005 | | $ | 39,973,163 |
| | | |
Total Floating Rate Note – Agency (Cost $39,973,163) | | | | | | | | 39,973,163 |
| | | | | | | | | | |
|
|
| | | |
| Floating Rate Notes – Corporate – 12.06% | | | | | | | | |
| | | | |
| | 50,000,000 | | Aegon NV± | | 1.19 | | | 03/30/2004 | | | 50,014,923 |
| | | | |
| | 12,000,000 | | American Express Centurion Bank± | | 1.12 | | | 12/23/2003 | | | 12,000,000 |
| | | | |
| | 7,500,000 | | Associates Corporation of North America± | | 1.24 | | | 06/25/2004 | | | 7,500,000 |
| | | | |
| | 25,000,000 | | Commonwealth Bank of Australia± | | 1.11 | | | 10/30/2003 | | | 25,001,399 |
| | | | |
| | 37,500,000 | | First USA Bank± | | 1.29 | | | 07/21/2004 | | | 37,561,540 |
| | | | |
| | 26,000,000 | | John Hancock Global Funding II±ª | | 1.13 | | | 12/10/2003 | | | 25,999,533 |
| | | | |
| | 5,000,000 | | Merrill Lynch & Company Incorporated± | | 1.26 | | | 10/01/2003 | | | 5,000,000 |
| | | | |
| | 23,500,000 | | Northern Rock plc±ª | | 1.14 | | | 01/16/2004 | | | 23,500,000 |
| | | | |
| | 20,000,000 | | Premium Asset Trust Series 2001-10±ª | | 1.31 | | | 11/14/2003 | | | 20,004,925 |
| | | | |
| | 25,000,000 | | Premium Asset Trust Series 2002-6±ª | | 1.32 | | | 06/01/2004 | | | 25,027,947 |
| | | |
Total Floating Rate Notes – Corporate (Cost $231,610,267) | | | | | | | | 231,610,267 |
| | | | | | | | | | |
|
|
| | | |
| Repurchase Agreements – 22.27% | | | | | | | | |
| | | | |
| | 75,826,000 | | Bear Stearns & Company Incorporated – 102% Collateralized by US Government Securities | | 1.13 | | | 10/01/2003 | | | 75,826,000 |
| | | | |
| | 247,085,000 | | Credit Suisse First Boston – 102% Collaterized by US Government Securities | | 1.13 | | | 10/01/2003 | | | 247,085,000 |
| | | | |
| | 25,000,000 | | Goldman Sachs Group Incorporated – 102% Collaterized by US Government Securities | | 1.16 | | | 10/01/2003 | | | 25,000,000 |
| | | | |
| | 4,810,000 | | Lehman Brothers Incorporated – 102% Collaterized by US Government Securities | | 1.10 | | | 10/01/2003 | | | 4,810,000 |
| | | | |
| | 75,000,000 | | UBS Warburg LLC – 102% Collaterized by US Government Securities | | 1.13 | | | 10/01/2003 | | | 75,000,000 |
| | | |
Total Repurchase Agreements (Cost $427,721,000) | | | | | | | | 427,721,000 |
| | | | | | | | | | |
|
|
| | | |
| Time Deposits – 13.02% | | | | | | | | |
| | | | |
| | 50,000,000 | | Banque Nationale de Paris | | 1.16 | | | 10/01/2003 | | | 50,000,000 |
| | | | |
| | 50,000,000 | | Danske Bank | | 1.16 | | | 10/01/2003 | | | 50,000,000 |
| | | | |
| | 50,000,000 | | ING Bank Brussels | | 1.18 | | | 10/01/2003 | | | 50,000,000 |
| | | | |
| | 50,000,000 | | Rabobank Nederland Utrecht | | 1.16 | | | 10/01/2003 | | | 50,000,000 |
| | | | |
| | 50,000,000 | | Societe Generale | | 1.16 | | | 10/01/2003 | | | 50,000,000 |
| | | |
Total Time Deposits (Cost $250,000,000) | | | | | | | | 250,000,000 |
| | | | | | | | | | |
|
|
| | | |
Total Investments In Securities
(Cost $1,937,031,631)* | | 100.86 | % | | | | $ | 1,937,031,631 | |
| | | |
Other Assets And Liabilities, Net | | (0.86 | ) | | | | | (16,566,969 | ) |
| | |
|
| | | |
|
|
|
| Total Net Assets | | 100.00 | % | | | | $ | 1,920,464,662 | |
| | |
|
| | | |
|
|
|
| * | | Cost for federal income tax purposes is substantially the same as for financial reporting purposes. |
| ª | | Securities that may be resold to “Qualified institutional buyers” under rule 144A or securities offered pursuant to section 4(2) of the Securities Act of 1933, as amended. These securities have been determined to be liquid by the Adviser based on procedures approved by the Board of Trustees. |
| ± | | Variable Rate Securties. |
The accompanying notes are an integral part of these financial statements.
43
| WELLSFARGOMONEYMARKETFUNDS | | PORTFOLIOOFINVESTMENTS — SEPTEMBER 30, 2003 (UNAUDITED) |
|
TREASURYPLUSMONEYMARKETFUND
| Principal | | Security Name | | Interest Rate | | | Maturity Date | | Value |
| | | |
| Repurchase Agreements – 44.57% | | | | | | | | |
| | | | |
| $ | 1,200,000,000 | | Bear Stearns & Company Incorporated – 102% Collateralized by
US Government Securities | | 0.97 | % | | 10/01/2003 | | $ | 1,200,000,000 |
| | | | |
| | 46,705,000 | | Deutsche Bank Alex Brown – 102% Collateralized by US Government Securities | | 0.95 | | | 10/01/2003 | | | 46,705,000 |
| | | | |
| | 163,000,000 | | Goldman Sachs Group Incorporated – 102% Collateralized by US Government Securities | | 0.95 | | | 10/01/2003 | | | 163,000,000 |
| | | | |
| | 1,050,000,000 | | Goldman Sachs Group Incorporated – 102% Collateralized by US Government Securities | | 0.91 | | | 10/01/2003 | | | 1,050,000,000 |
| | | |
Total Repurchase Agreements (Cost $2,459,705,000) | | | | | | | | 2,459,705,000 |
| | | | | | | | | | |
|
|
| | | |
| US Treasury Securities – 55.31% | | | | | | | | |
| | | |
| US Treasury Bills – 41.17% | | | | | | | | |
| | | | |
| | 150,000,000 | | US Treasury Bills | | 0.92 | † | | 10/02/2003 | | | 149,996,187 |
| | | | |
| | 225,000,000 | | US Treasury Bills | | 0.93 | † | | 10/02/2003 | | | 224,994,219 |
| | | | |
| | 200,000,000 | | US Treasury Bills | | 0.96 | † | | 10/02/2003 | | | 199,994,667 |
| | | | |
| | 100,000,000 | | US Treasury Bills | | 1.09 | † | | 10/02/2003 | | | 99,996,972 |
| | | | |
| | 75,000,000 | | US Treasury Bills | | 0.60 | † | | 10/09/2003 | | | 74,990,000 |
| | | | |
| | 75,000,000 | | US Treasury Bills | | 1.07 | † | | 10/09/2003 | | | 74,982,167 |
| | | | |
| | 50,000,000 | | US Treasury Bills | | 1.12 | † | | 10/09/2003 | | | 49,987,556 |
| | | | |
| | 150,000,000 | | US Treasury Bills | | 1.18 | † | | 10/23/2003 | | | 149,891,833 |
| | | | |
| | 50,000,000 | | US Treasury Bills | | 0.91 | † | | 11/20/2003 | | | 49,936,458 |
| | | | |
| | 50,000,000 | | US Treasury Bills | | 0.92 | † | | 11/20/2003 | | | 49,936,458 |
| | | | |
| | 150,000,000 | | US Treasury Bills | | 0.98 | † | | 11/20/2003 | | | 149,795,833 |
| | | | |
| | 605,000 | | US Treasury Bills | | 0.99 | † | | 11/20/2003 | | | 604,172 |
| | | | |
| | 125,000,000 | | US Treasury Bills | | 1.09 | † | | 11/28/2003 | | | 124,780,486 |
| | | | |
| | 50,000,000 | | US Treasury Bills | | 0.93 | † | | 12/04/2003 | | | 49,917,778 |
| | | | |
| | 75,000,000 | | US Treasury Bills | | 0.94 | † | | 01/02/2004 | | | 74,817,875 |
| | | | |
| | 250,000,000 | | US Treasury Bills | | 0.95 | † | | 01/02/2004 | | | 249,389,687 |
| | | | |
| | 150,000,000 | | US Treasury Bills | | 0.95 | † | | 01/08/2004 | | | 149,610,188 |
| | | | |
| | 250,000,000 | | US Treasury Bills | | 1.03 | † | | 02/12/2004 | | | 249,041,528 |
| | | | |
| | 100,000,000 | | US Treasury Bills | | 1.00 | † | | 03/18/2004 | | | 99,530,556 |
| | | |
| | | | | | | | | 2,272,194,620 |
| | | | | | | | | | |
|
|
| | | |
| US Treasury Notes – 14.14% | | | | | | | | |
| | | | |
| | 50,000,000 | | US Treasury Notes | | 4.25 | | | 11/15/2003 | | | 50,149,243 |
| | | | |
| | 93,107,000 | | US Treasury Notes | | 11.88 | | | 11/15/2003 | | | 94,298,534 |
| | | | |
| | 100,000,000 | | US Treasury Notes | | 3.25 | | | 12/31/2003 | | | 100,520,288 |
| | | | |
| | 100,000,000 | | US Treasury Notes | | 3.63 | | | 03/31/2004 | | | 101,285,374 |
| | | | |
| | 125,000,000 | | US Treasury Notes | | 3.38 | | | 04/30/2004 | | | 126,570,423 |
| | | | |
| | 75,000,000 | | US Treasury Notes | | 7.25 | | | 05/15/2004 | | | 77,857,205 |
| | | | |
| | 75,000,000 | | US Treasury Notes | | 2.25 | | | 07/31/2004 | | | 75,721,090 |
| | | | |
| | 75,000,000 | | US Treasury Notes | | 6.00 | | | 08/15/2004 | | | 78,162,410 |
| | | | |
| | 75,000,000 | | US Treasury Notes | | 2.13 | | | 08/31/2004 | | | 75,541,121 |
| | | |
| | | | | | | | | 780,105,688 |
| | | | | | | | | | |
|
|
| | | |
Total US Treasury Securities (Cost $3,052,300,308) | | | | | | | | 3,052,300,308 |
| | | | | | | | | | |
|
|
| | | |
Total Investments In Securities
(Cost $5,512,005,308)* | | 99.88 | % | | | | $ | 5,512,005,308 |
| | | |
Other Assets And Liabilities, Net | | 0.12 | | | | | | 6,440,286 |
| | |
|
| | | |
|
|
| Total Net Assets | | 100.00 | % | | | | $ | 5,518,445,594 |
| | |
|
| | | |
|
|
| * | | Cost for federal income tax purposes is substantially the same as for financial reporting purposes. |
The accompanying notes are an integral part of these financial statements.
44
| PORTFOLIOOFINVESTMENTS — SEPTEMBER 30, 2003 (UNAUDITED) | | WELLSFARGOMONEYMARKETFUNDS |
|
100%TREASURYMONEYMARKETFUND
| Principal | | Security Name | | Interest Rate | | | Maturity Date | | Value |
| | | |
| US Treasury Securities – 100.09% | | | | | | | | |
| | | |
| US Treasury Bills – 100.09% | | | | | | | | |
| | | | |
| $ | 100,000,000 | | US Treasury Bills | | 0.95 | %† | | 10/02/2003 | | $ | 99,997,361 |
| | | | |
| | 250,000,000 | | US Treasury Bills | | 0.96 | † | | 10/02/2003 | | | 249,993,333 |
| | | | |
| | 124,226,000 | | US Treasury Bills | | 0.60 | † | | 10/09/2003 | | | 124,209,437 |
| | | | |
| | 26,160,000 | | US Treasury Bills | | 0.90 | † | | 10/09/2003 | | | 26,154,768 |
| | | | |
| | 100,000,000 | | US Treasury Bills | | 0.92 | † | | 10/09/2003 | | | 99,979,667 |
| | | | |
| | 50,000,000 | | US Treasury Bills | | 1.12 | † | | 10/09/2003 | | | 49,987,611 |
| | | | |
| | 75,000,000 | | US Treasury Bills | | 0.90 | † | | 10/23/2003 | | | 74,958,979 |
| | | | |
| | 75,000,000 | | US Treasury Bills | | 1.00 | † | | 10/23/2003 | | | 74,960,583 |
| | | | |
| | 150,000,000 | | US Treasury Bills | | 0.94 | † | | 10/30/2003 | | | 149,886,417 |
| | | | |
| | 75,000,000 | | US Treasury Bills | | 0.96 | † | | 10/30/2003 | | | 74,942,302 |
| | | | |
| | 185,655,000 | | US Treasury Bills | | 0.93 | † | | 11/13/2003 | | | 185,448,768 |
| | | | |
| | 15,415,000 | | US Treasury Bills | | 0.94 | † | | 11/13/2003 | | | 15,397,784 |
| | | | |
| | 75,000,000 | | US Treasury Bills | | 0.94 | † | | 11/13/2003 | | | 74,915,792 |
| | | | |
| | 152,615,000 | | US Treasury Bills | | 0.94 | † | | 11/20/2003 | | | 152,415,753 |
| | | | |
| | 9,220,000 | | US Treasury Bills | | 0.97 | † | | 11/20/2003 | | | 9,207,579 |
| | | | |
| | 3,395,000 | | US Treasury Bills | | 0.99 | † | | 11/20/2003 | | | 3,390,355 |
| | | | |
| | 27,645,000 | | US Treasury Bills | | 0.97 | † | | 11/28/2003 | | | 27,601,797 |
| | | | |
| | 150,000,000 | | US Treasury Bills | | 0.98 | † | | 11/28/2003 | | | 149,763,167 |
| | | | |
| | 75,000,000 | | US Treasury Bills | | 1.09 | † | | 11/28/2003 | | | 74,868,292 |
| | | | |
| | 67,500,000 | | US Treasury Bills | | 0.92 | † | | 12/04/2003 | | | 67,390,200 |
| | | | |
| | 200,000,000 | | US Treasury Bills | | 0.93 | † | | 12/04/2003 | | | 199,671,111 |
| | | | |
| | 100,000,000 | | US Treasury Bills | | 0.95 | † | | 12/04/2003 | | | 99,831,111 |
| | | | |
| | 50,000,000 | | US Treasury Bills | | 0.94 | † | | 12/11/2003 | | | 49,907,799 |
| | | | |
| | 100,000,000 | | US Treasury Bills | | 0.93 | † | | 12/18/2003 | | | 99,798,500 |
| | | | |
| | 100,000,000 | | US Treasury Bills | | 0.93 | † | | 01/02/2004 | | | 99,759,750 |
| | | | |
| | 100,000,000 | | US Treasury Bills | | 0.95 | † | | 01/02/2004 | | | 99,755,875 |
| | | | |
| | 75,000,000 | | US Treasury Bills | | 0.95 | † | | 01/08/2004 | | | 74,805,094 |
| | | | |
| | 100,000,000 | | US Treasury Bills | | 0.96 | † | | 01/22/2004 | | | 99,700,236 |
| | | | |
| | 26,725,000 | | US Treasury Bills | | 0.99 | † | | 01/22/2004 | | | 26,642,371 |
| | | | |
| | 84,505,000 | | US Treasury Bills | | 1.02 | † | | 02/05/2004 | | | 84,202,413 |
| | | | |
| | 100,000,000 | | US Treasury Bills | | 0.98 | † | | 02/12/2004 | | | 99,635,222 |
| | | | |
| | | | | | | | | | | | 2,819,179,427 |
| | | | | | | | | | |
|
|
| | | |
Total US Treasury Securities (Cost $2,819,179,427) | | | | | | | | 2,819,179,427 |
| | | | | | | | | | |
|
|
| | | |
Total Investments In Securities
(Cost $2,819,179,427)* | | 100.09 | % | | | | $ | 2,819,179,427 | |
| | | |
Other Assets And Liabilities, Net | | (0.09 | ) | | | | | (2,642,306 | ) |
| | |
|
| | | |
|
|
|
| Total Net Assets | | 100.00 | % | | | | $ | 2,816,537,121 | |
| | |
|
| | | |
|
|
|
| * | | Cost for federal income tax purposes is substantially the same as for financial reporting purposes. |
The accompanying notes are an integral part of these financial statements.
45
| WELLSFARGOMONEYMARKETFUNDS | | STATEMENTSOFASSETSANDLIABILITIES — SEPTEMBER 30, 2003 (UNAUDITED) |
|
| | | California Tax-free
Money Market Fund | | | Cash Investment
Money Market Fund | |
|
| | |
ASSETS | | | | | | | | |
| | |
INVESTMENTS: | | | | | | | | |
In securities, at amortized cost | | $ | 2,507,136,270 | | | $ | 14,064,168,299 | |
Repurchase Agreements, at cost | | | 0 | | | | 475,862,000 | |
| | |
|
|
| |
|
|
|
TOTALINVESTMENTS,ATMARKETVALUE | | $ | 2,507,136,270 | | | $ | 14,540,030,299 | |
| | |
|
|
| |
|
|
|
Cash | | | 84,295 | | | | 50,111 | |
Receivable for dividends and interest and other receivables | | | 6,162,180 | | | | 23,240,787 | |
Receivable for investments sold | | | 0 | | | | 20,000,000 | |
Receivable for Fund shares issued | | | 0 | | | | 656,706 | |
| | |
|
|
| |
|
|
|
TOTALASSETS | | | 2,513,382,745 | | | | 14,583,977,903 | |
| | |
|
|
| |
|
|
|
| | |
LIABILITIES | | | | | | | | |
Payable for investment purchased | | | 0 | | | | 0 | |
Dividends Payable | | | 660,549 | | | | 8,152,368 | |
Payable for investment adviser and affiliates (Note 3) | | | 857,401 | | | | 3,024,382 | |
Payable to other related parties(1) | | | 466,118 | | | | 1,959,352 | |
Accrued expenses and other liabilities | | | 415,536 | | | | 421,842 | |
| | |
|
|
| |
|
|
|
TOTALLIABILITIES | | | 2,399,604 | | | | 13,557,944 | |
| | |
|
|
| |
|
|
|
TOTALNETASSETS | | $ | 2,510,983,141 | | | $ | 14,570,419,959 | |
| | |
|
|
| |
|
|
|
| | |
NETASSETSCONSISTOF: | | | | | | | | |
|
Paid-in capital | | $ | 2,510,879,273 | | | $ | 14,569,764,436 | |
Undistributed (overdistributed) net investment income (loss) | | | (985 | ) | | | (7,752 | ) |
Undistributed net realized gain (loss) on investments | | | 104,853 | | | | 663,275 | |
| | |
|
|
| |
|
|
|
TOTALNETASSETS | | $ | 2,510,983,141 | | | $ | 14,570,419,959 | |
| | |
|
|
| |
|
|
|
| | |
COMPUTATIONOFNETASSETVALUEANDOFFERINGPRICEPERSHARE | | | | | | | | |
|
Net assets – Class A | | $ | 2,150,426,574 | | | | N/A | |
Shares outstanding – Class A | | | 2,150,286,647 | | | | N/A | |
Net asset value and offering price per share – Class A | | $ | 1.00 | | | | N/A | |
Net assets – Administrator Class | | | N/A | | | $ | 39,098,216 | |
Shares outstanding – Administrator Class | | | N/A | | | | 39,098,219 | |
Net asset value and offering price per share – Administrator Class | | | N/A | | | $ | 1.00 | |
Net Assets – Institutional Class | | | N/A | | | $ | 5,254,543,853 | |
Shares outstanding – Institutional Class | | | N/A | | | | 5,254,299,488 | |
Net asset value and offering price per share – Institutional Class | | | N/A | | | $ | 1.00 | |
Net Assets – Service Class | | $ | 360,556,567 | | | $ | 9,276,777,890 | |
Shares outstanding – Service Class | | | 360,540,082 | | | | 9,276,855,998 | |
Net asset value and offering price per share – Service Class | | $ | 1.00 | | | $ | 1.00 | |
| | |
|
|
| |
|
|
|
| (1) | | Other related parties include the Funds’ trustees and distributor. |
The accompanying notes are an integral part of these financial statements.
46
STATEMENTSOFASSETSANDLIABILITIES — SEPTEMBER 30, 2003 (UNAUDITED) | | WELLSFARGOMONEYMARKETFUNDS |
|
Government
Money Market Fund | | National Tax-Free
Money Market Fund | | | Prime Investment
Money Market Fund | | Treasury Plus
Money Market Fund | | | 100% Treasury
Money Market Fund |
|
| | | | |
| | | | | | | | | | | | | | | | |
| | | | |
| | | | | | | | | | | | | | | | |
| $ | 4,852,912,495 | | $ | 1,987,689,059 | | | $ | 1,509,310,631 | | $ | 3,052,300,308 | | | $ | 2,819,179,427 |
| | 1,418,596,000 | | | 0 | | | | 427,721,000 | | | 2,459,705,000 | | | | 0 |
|
| |
|
|
| |
|
| |
|
|
| |
|
|
| $ | 6,271,508,495 | | $ | 1,987,689,059 | | | $ | 1,937,031,631 | | $ | 5,512,005,308 | | | $ | 2,819,179,427 |
|
| |
|
|
| |
|
| |
|
|
| |
|
|
| | 50,931 | | | 108,429 | | | | 50,566 | | | 100,580 | | | | 50,425 |
| | 16,641,031 | | | 5,815,611 | | | | 1,246,024 | | | 10,685,513 | | | | 0 |
| | 0 | | | 0 | | | | 10,000,000 | | | 0 | | | | 0 |
| | 63 | | | 0 | | | | 10,000 | | | 86,185 | | | | 350 |
|
| |
|
|
| |
|
| |
|
|
| |
|
|
| | 6,288,200,520 | | | 1,993,613,099 | | | | 1,948,338,221 | | | 5,522,877,586 | | | | 2,819,230,202 |
|
| |
|
|
| |
|
| |
|
|
| |
|
|
| | | | |
| | | | | | | | | | | | | | | | |
| | 47,305,371 | | | 0 | | | | 25,000,000 | | | 0 | | | | 0 |
| | 3,262,290 | | | 866,474 | | | | 1,159,861 | | | 2,306,957 | | | | 1,035,097 |
| | 1,540,755 | | | 450,023 | | | | 549,154 | | | 1,247,009 | | | | 1,138,590 |
| | 1,121,981 | | | 410,644 | | | | 398,733 | | | 730,147 | | | | 43,875 |
| | 583,230 | | | 314,126 | | | | 765,811 | | | 147,879 | | | | 475,519 |
|
| |
|
|
| |
|
| |
|
|
| |
|
|
| | 53,813,627 | | | 2,041,267 | | | | 27,873,559 | | | 4,431,992 | | | | 2,693,081 |
|
| |
|
|
| |
|
| |
|
|
| |
|
|
| $ | 6,234,386,893 | | $ | 1,991,571,832 | | | $ | 1,920,464,662 | | $ | 5,518,445,594 | | | $ | 2,816,537,121 |
|
| |
|
|
| |
|
| |
|
|
| |
|
|
| | | | |
| | | | | | | | | | | | | | | | |
|
| $ | 6,234,347,826 | | $ | 1,991,585,299 | | | $ | 1,920,384,655 | | $ | 5,518,444,558 | | | $ | 2,816,449,796 |
| | 0 | | | (6 | ) | | | 4 | | | (4,294 | ) | | | 40,624 |
| | 39,067 | | | (13,461 | ) | | | 80,003 | | | 5,330 | | | | 46,701 |
|
| |
|
|
| |
|
| |
|
|
| |
|
|
| $ | 6,234,386,893 | | $ | 1,991,571,832 | | | $ | 1,920,464,662 | | $ | 5,518,445,594 | | | $ | 2,816,537,121 |
|
| |
|
|
| |
|
| |
|
|
| |
|
|
| | | | |
| | | | | | | | | | | | | | | | |
|
| $ | 273,483,973 | | $ | 632,485,592 | | | | N/A | | $ | 2,323,852,961 | | | $ | 191,783,693 |
| | 273,482,477 | | | 632,471,298 | | | | N/A | | | 2,323,899,039 | | | | 191,746,365 |
| $ | 1.00 | | $ | 1.00 | | | | N/A | | $ | 1.00 | | | $ | 1.00 |
| $ | 14,806,451 | | | N/A | | | | N/A | | | N/A | | | | N/A |
| | 14,806,453 | | | N/A | | | | N/A | | | N/A | | | | N/A |
| $ | 1.00 | | | N/A | | | | N/A | | | N/A | | | | N/A |
| $ | 968,869,582 | | $ | 90,589,199 | | | $ | 462,207,799 | | $ | 1,879,358,151 | | | | N/A |
| | 968,869,990 | | | 90,591,084 | | | | 462,207,659 | | | 1,879,526,164 | | | | N/A |
| $ | 1.00 | | $ | 1.00 | | | $ | 1.00 | | $ | 1.00 | | | | N/A |
| $ | 4,977,226,887 | | $ | 1,268,497,041 | | | $ | 1,458,256,863 | | $ | 1,315,234,482 | | | $ | 2,624,753,428 |
| | 4,977,206,287 | | | 1,268,365,116 | | | | 1,458,184,461 | | | 1,315,235,617 | | | | 2,624,708,332 |
| $ | 1.00 | | $ | 1.00 | | | $ | 1.00 | | $ | 1.00 | | | $ | 1.00 |
|
| |
|
|
| |
|
| |
|
|
| |
|
|
47
WELLSFARGOMONEYMARKETFUNDS | | STATEMENTS OF OPERATIONS — FOR THE SIX MONTHS ENDED SEPTEMBER 30, 2003 (UNAUDITED) |
|
| | | California Tax-free Money Market Fund | | | Cash Investment Money Market Fund | |
|
| | |
INVESTMENTINCOME | | | | | | | | |
Interest | | $ | 13,132,644 | | | $ | 91,772,049 | |
| | |
|
|
| |
|
|
|
TOTALINVESTMENTINCOME | | | 13,132,644 | | | | 91,772,049 | |
| | |
|
|
| |
|
|
|
| | |
NETEXPENSES | | | | | | | | |
Advisory fees | | | 3,845,501 | | | | 7,444,916 | |
Custody | | | 256,366 | | | | 1,488,982 | |
Shareholder servicing fees | | | 2,821,235 | | | | 12,342,739 | |
Portfolio accounting fees | | | 83,091 | | | | 156,386 | |
Administration fees | | | | | | | | |
Class A | | | 3,047,016 | | | | N/A | |
Administrator Class | | | N/A | | | | 3,777 | |
Institutional Class | | | N/A | | | | 3,258,441 | |
Service Class | | | 260,597 | | | | 8,391,110 | |
Legal and Audit fees | | | 17,994 | | | | 21,502 | |
Registration fees | | | 48,604 | | | | 94,986 | |
Directors’ fees | | | 3,195 | | | | 3,196 | |
Shareholder reports | | | 46,320 | | | | 39,000 | |
Other | | | 25,697 | | | | 128,232 | |
| | |
|
|
| |
|
|
|
TOTALEXPENSES | | | 10,455,616 | | | | 33,373,267 | |
| | |
|
|
| |
|
|
|
| | |
LESS: | | | | | | | | |
Waived fees and reimbursed expenses | | | (2,408,278 | ) | | | (3,440,207 | ) |
Net expenses | | | 8,047,338 | | | | 29,933,060 | |
| | |
|
|
| |
|
|
|
NETINVESTMENTINCOME (LOSS) | | | 5,085,306 | | | | 61,838,989 | |
| | |
|
|
| |
|
|
|
NETREALIZEDGAIN (LOSS)FROMINVESTMENTS | | | 68,021 | | | | 13,248 | |
| | |
|
|
| |
|
|
|
NETINCREASE (DECREASE)INNETASSETSRESULTINGFROMOPERATIONS | | $ | 5,153,327 | | | $ | 61,852,237 | |
| | |
|
|
| |
|
|
|
The accompanying notes are an integral part of these financial statements.
48
STATEMENTS OF OPERATIONS — FOR THE SIX MONTHS ENDED SEPTEMBER 30, 2003 (UNAUDITED) | | WELLSFARGOMONEYMARKETFUNDS |
|
Government
Money Market Fund | | | National Tax-free
Money Market Fund | | | Prime Investment
Money Market Fund | | | Treasury Plus
Money Market Fund | | | 100% Treasury
Money Market Fund | |
|
| | | | |
| | | | | | | | | | | | | | | | | | | |
| $ | 35,017,807 | | | $ | 9,173,219 | | | $ | 12,894,133 | | | $ | 21,631,784 | | | $ | 15,543,433 | |
|
|
| |
|
|
| |
|
|
| |
|
|
| |
|
|
|
| | 35,017,807 | | | | 9,173,219 | | | | 12,894,133 | | | | 21,631,784 | | | | 15,543,433 | |
|
|
| |
|
|
| |
|
|
| |
|
|
| |
|
|
|
| | | | |
| | | | | | | | | | | | | | | | | | | |
| | 7,434,465 | | | | 849,571 | | | | 1,099,300 | | | | 1,933,895 | | | | 5,041,604 | |
| | 589,997 | | | | 169,914 | | | | 219,860 | | | | 386,780 | | | | 288,092 | |
| | 2,636,615 | | | | 1,987,059 | | | | 2,547,194 | | | | 2,689,309 | | | | 265,809 | |
| | 65,175 | | | | 58,452 | | | | 72,687 | | | | 120,259 | | | | 92,133 | |
| | | | | | | | | | | | | | | | | | | |
| | 357,649 | | | | 323,165 | | | | N/A | | | | 1,106,897 | | | | 287,101 | |
| | 6,321 | | | | N/A | | | | N/A | | | | N/A | | | | N/A | |
| | 216,795 | | | | 71,135 | | | | 104,550 | | | | 1,115,717 | | | | N/A | |
| | 4,499,135 | | | | 1,147,757 | | | | 1,732,091 | | | | 1,131,687 | | | | 2,268,002 | |
| | 17,994 | | | | 12,995 | | | | 17,995 | | | | 17,493 | | | | 14,484 | |
| | 32,503 | | | | 1,745 | | | | 122,988 | | | | 24,809 | | | | 112,922 | |
| | 3,195 | | | | 3,195 | | | | 3,195 | | | | 3,195 | | | | 3,195 | |
| | 64,808 | | | | 13,145 | | | | 27,189 | | | | 36,567 | | | | 41,399 | |
| | 35,921 | | | | 7,903 | | | | 19,184 | | | | 10,937 | | | | 20,637 | |
|
|
| |
|
|
| |
|
|
| |
|
|
| |
|
|
|
| | 15,960,573 | | | | 4,646,036 | | | | 5,966,233 | | | | 8,577,545 | | | | 8,435,378 | |
|
|
| |
|
|
| |
|
|
| |
|
|
| |
|
|
|
| | | | |
| | | | | | | | | | | | | | | | | | | |
| | (1,422,929 | ) | | | (687,701 | ) | | | (203,850 | ) | | | (975,279 | ) | | | (1,414,293 | ) |
| | 14,537,644 | | | | 3,958,335 | | | | 5,762,383 | | | | 7,602,266 | | | | 7,021,085 | |
|
|
| |
|
|
| |
|
|
| |
|
|
| |
|
|
|
| | 20,480,163 | | | | 5,214,884 | | | | 7,131,750 | | | | 14,029,518 | | | | 8,522,348 | |
|
|
| |
|
|
| |
|
|
| |
|
|
| |
|
|
|
| | (1,245 | ) | | | (23,078 | ) | | | 200 | | | | 5,385 | | | | 46,733 | |
|
|
| |
|
|
| |
|
|
| |
|
|
| |
|
|
|
| $ | 20,478,918 | | | $ | 5,191,806 | | | $ | 7,131,950 | | | $ | 14,034,903 | | | $ | 8,569,081 | |
|
|
| |
|
|
| |
|
|
| |
|
|
| |
|
|
|
49
| WELLSFARGOMONEYMARKETFUNDS | | STATEMENTSOFCHANGESINNETASSETS |
|
| | | CALIFORNIATAX-FREE
MONEYMARKETFUND
| |
| | | (Unaudited) | | | | |
| | | For the Six Months Ended
September 30, 2003 | | | For the Year Ended
March 31, 2003 | |
|
| | |
INCREASEINNETASSETS | | | | | | | | |
Beginning net assets | | $ | 2,662,105,499 | | | $ | 2,711,585,081 | |
| | |
OPERATIONS: | | | | | | | | |
Net investment income (loss) | | | 5,085,306 | | | | 19,492,554 | |
Net realized gain (loss) from investments | | | 68,021 | | | | 235,208 | |
| | |
|
|
| |
|
|
|
NETINCREASE (DECREASE)INNETASSETSRESULTINGFROMOPERATIONS | | | 5,153,327 | | | | 19,727,762 | |
| | |
|
|
| |
|
|
|
Distributions to shareholders: | | | | | | | | |
From net investment income | | | | | | | | |
Class A | | | (4,214,436 | ) | | | (16,873,030 | ) |
Administrator Class | | | N/A | | | | N/A | |
Instititutional Class | | | N/A | | | | N/A | |
Service Class | | | (870,870 | ) | | | (2,620,509 | ) |
From net realized gain on sales of investments | | | | | | | | |
Class A | | | 0 | | | | (115,803 | ) |
Administrator Class | | | N/A | | | | N/A | |
Instititutional Class | | | N/A | | | | N/A | |
Service Class | | | 0 | | | | (15,435 | ) |
| | |
Capital shares transactions: | | | | | | | | |
Proceeds from shares sold – Class A | | | 1,673,362,214 | | | | 2,886,230,813 | |
Reinvestment of dividends – Class A | | | 4,052,401 | | | | 14,022,246 | |
Cost of shares redeemed – Class A | | | (1,884,804,325 | ) | | | (2,991,380,111 | ) |
| | |
|
|
| |
|
|
|
| | |
NETINCREASE (DECREASE)INNETASSETSRESULTINGFROMCAPITAL
SHARETRANSACTIONS –CLASSA | | | (207,389,710 | ) | | | (91,127,052 | ) |
| | |
|
|
| |
|
|
|
Proceeds from shares sold – Administrator Class | | | N/A | | | | N/A | |
Reinvestment of dividends – Administrator Class | | | N/A | | | | N/A | |
Cost of shares redeemed – Administrator Class | | | N/A | | | | N/A | |
| | |
|
|
| |
|
|
|
| | |
NETINCREASE (DECREASE)INNETASSETSRESULTINGFROMCAPITAL
SHARETRANSACTIONS –ADMINISTRATORCLASS | | | N/A | | | | N/A | |
| | |
|
|
| |
|
|
|
Proceeds from shares sold – Institutional Class | | | N/A | | | | N/A | |
Reinvestment of dividends – Institutional Class | | | N/A | | | | N/A | |
Cost of shares redeemed – Institutional Class | | | N/A | | | | N/A | |
| | |
|
|
| |
|
|
|
| | |
NETINCREASE (DECREASE)INNETASSETSRESULTINGFROMCAPITAL
SHARETRANSACTIONS –INSTITUTIONALCLASS | | | N/A | | | | N/A | |
| | |
|
|
| |
|
|
|
Proceeds from shares sold – Service Class | | | 379,355,098 | | | | 476,426,238 | |
Reinvestment of dividends – Service Class | | | 778,860 | | | | 2,314,388 | |
Cost of shares redeemed – Service Class | | | (323,934,627 | ) | | | (437,196,141 | ) |
| | |
|
|
| |
|
|
|
| | |
NETINCREASE (DECREASE)INNETASSETSRESULTINGFROMCAPITAL
SHARETRANSACTIONS –SERVICECLASS | | | 56,199,331 | | | | 41,544,485 | |
| | |
|
|
| |
|
|
|
NETINCREASE (DECREASE)INNETASSETS | | | (151,122,358 | ) | | | (49,479,582 | ) |
| | |
|
|
| |
|
|
|
| | | | | | | | | |
|
NETASSETS: | | | | | | | | |
| | |
ENDINGNETASSETS | | $ | 2,510,983,141 | | | $ | 2,662,105,499 | |
| | |
Shares Issued and Redeemed: | | | | | | | | |
Shares sold – Class A | | | 1,673,362,214 | | | | 2,886,241,038 | |
Shares issued in reinvestment of dividends – Class A | | | 4,052,401 | | | | 14,022,246 | |
Shares redeemed – Class A | | | (1,884,804,325 | ) | | | (2,991,380,110 | ) |
| | |
|
|
| |
|
|
|
NETINCREASE (DECREASE)INSHARESOUTSTANDING –CLASSA | | | (207,389,710 | ) | | | (91,116,826 | ) |
| | |
|
|
| |
|
|
|
Shares sold – Administrator Class | | | N/A | | | | N/A | |
Shares issued in reinvestment of dividends – Administrator Class | | | N/A | | | | N/A | |
Shares redeemed – Administrator Class | | | N/A | | | | N/A | |
| | |
|
|
| |
|
|
|
NETINCREASE (DECREASE)INSHARESOUTSTANDING – ADMINISTRATORCLASS | | | N/A | | | | N/A | |
| | |
|
|
| |
|
|
|
Shares sold – Institutional Class | | | N/A | | | | N/A | |
Shares issued in reinvestment of dividends – Institutional Class | | | N/A | | | | N/A | |
Shares redeemed – Institutional Class | | | N/A | | | | N/A | |
| | |
|
|
| |
|
|
|
NETINCREASE (DECREASE)INSHARESOUTSTANDING – INSTITUTIONALCLASS | | | N/A | | | | N/A | |
| | |
|
|
| |
|
|
|
Shares sold – Service Class | | | 379,355,098 | | | | 476,426,622 | |
Shares issued in reinvestment of dividends – Service Class | | | 778,860 | | | | 2,314,388 | |
Shares redeemed – Service Class | | | (323,934,627 | ) | | | (437,196,140 | ) |
| | |
|
|
| |
|
|
|
NETINCREASE (DECREASE)INSHARESOUTSTANDING –SERVICECLASS | | | 56,199,331 | | | | 41,544,870 | |
| | |
|
|
| |
|
|
|
ENDINGBALANCEOFUNDISTRIBUTEDNETINVESTMENTINCOME | | $ | (985 | ) | | $ | (985 | ) |
| | |
|
|
| |
|
|
|
| (1) | | “Proceeds from shares sold” and “Shares sold” include amounts relating to Fund mergers. See Note 1. |
The accompanying notes are an integral part of these financial statements.
50
STATEMENTSOFCHANGESINNETASSETS | | WELLSFARGOMONEYMARKETFUNDS |
|
CASHINVESTMENT
MONEYMARKETFUND
| | | GOVERNMENT
MONEYMARKETFUND
| | | NATIONALTAX-FREE
MONEYMARKETFUND
| |
| (Unaudited) | | | | | | (Unaudited) | | | | | | (Unaudited) | | | | |
For the Six Months Ended
September 30, 2003 | | | For the Year Ended March 31, 2003 | | | For the Six Months Ended
September 30, 2003(1) | | | For the Year Ended March 31, 2003 | | | For the Six Months Ended
September 30, 2003(1) | | | For the Year Ended March 31, 2003 | |
|
| | | | | |
| $ | 15,765,893,029 | | | $ | 18,823,956,591 | | | $ | 5,083,245,155 | | | $ | 5,896,987,284 | | | $ | 1,528,551,557 | | | $ | 1,572,155,033 | |
| | | | | | | | | | | | | | | | | | | | | | | |
| | | | | |
| | 61,838,989 | | | | 232,012,539 | | | | 20,480,163 | | | | 65,028,284 | | | | 5,214,884 | | | | 16,648,886 | |
| | 13,248 | | | | 1,076,740 | | | | (1,245 | ) | | | 460,738 | | | | (23,078 | ) | | | 68,020 | |
|
|
| |
|
|
| |
|
|
| |
|
|
| |
|
|
| |
|
|
|
| | 61,852,237 | | | | 233,089,279 | | �� | | 20,478,918 | | | | 65,489,022 | | | | 5,191,806 | | | | 16,716,906 | |
|
|
| |
|
|
| |
|
|
| |
|
|
| |
|
|
| |
|
|
|
| | | | | | | | | | | | | | | | | | | | | | | |
| | | | | | | | | | | | | | | | | | | | | | | |
| | N/A | | | | N/A | | | | (627,915 | ) | | | (1,837,311 | ) | | | (387,197 | ) | | | N/A | |
| | (19,490 | ) | | | N/A | | | | (31,253 | ) | | | N/A | | | | N/A | | | | N/A | |
| | (24,969,632 | ) | | | (85,639,688 | ) | | | (1,486,785 | ) | | | N/A | | | | (465,324 | ) | | | (1,353,229 | ) |
| | (36,849,867 | ) | | | (146,372,851 | ) | | | (18,334,210 | ) | | | (63,195,521 | ) | | | (4,362,363 | ) | | | (15,295,663 | ) |
| | | | | |
| | N/A | | | | N/A | | | | 0 | | | | (19,974 | ) | | | N/A | | | | N/A | |
| | 0 | | | | 0 | | | | 0 | | | | N/A | | | | N/A | | | | N/A | |
| | 0 | | | | (152,420 | ) | | | N/A | | | | N/A | | | | 0 | | | | (2,183 | ) |
| | 0 | | | | (282,560 | ) | | | 0 | | | | (493,768 | ) | | | 0 | | | | (21,865 | ) |
| | | | | |
| | N/A | | | | N/A | | | | 180,807,457 | | | | 353,982,022 | | | | 879,954,067 | | | | N/A | |
| | N/A | | | | N/A | | | | 620,318 | | | | 1,271,123 | | | | 326,972 | | | | N/A | |
| | N/A | | | | N/A | | | | (153,585,979 | ) | | | (254,182,834 | ) | | | (247,789,870 | ) | | | N/A | |
|
|
| |
|
|
| |
|
|
| |
|
|
| |
|
|
| |
|
|
|
| | | | | |
| | N/A | | | | N/A | | | | 27,841,796 | | | | 101,070,311 | | | | 632,491,169 | | | | N/A | |
|
|
| |
|
|
| |
|
|
| |
|
|
| |
|
|
| |
|
|
|
| | 58,086,652 | | | | N/A | | | | 44,459,840 | | | | N/A | | | | N/A | | | | N/A | |
| | 3,902 | | | | N/A | | | | 18,126 | | | | N/A | | | | N/A | | | | N/A | |
| | (18,992,335 | ) | | | N/A | | | | (29,671,513 | ) | | | N/A | | | | N/A | | | | N/A | |
|
|
| |
|
|
| |
|
|
| |
|
|
| |
|
|
| |
|
|
|
| | | | | |
| | 39,098,219 | | | | N/A | | | | 14,806,453 | | | | N/A | | | | N/A | | | | N/A | |
|
|
| |
|
|
| |
|
|
| |
|
|
| |
|
|
| |
|
|
|
| | 136,827,353,281 | | | | 287,346,947,223 | | | | 2,576,516,399 | | | | N/A | | | | 238,644,013 | | | | 767,491,304 | |
| | 5,340,422 | | | | 19,325,692 | | | | 397,212 | | | | N/A | | | | 194,187 | | | | 264,655 | |
| | (136,753,481,892 | ) | | | (287,669,168,584 | ) | | | (1,608,043,580 | ) | | | N/A | | | | (275,216,470 | ) | | | (778,969,274 | ) |
|
|
| |
|
|
| |
|
|
| |
|
|
| |
|
|
| |
|
|
|
| | | | | |
| | 79,211,811 | | | | (302,895,669 | ) | | | 968,870,031 | | | | N/A | | | | (36,378,270 | ) | | | (11,213,315 | ) |
|
|
| |
|
|
| |
|
|
| |
|
|
| |
|
|
| |
|
|
|
| | 19,423,130,200 | | | | 34,274,299,406 | | | | 20,346,704,515 | | | | 33,705,518,589 | | | | 1,019,453,611 | | | | 2,254,523,688 | |
| | 24,707,015 | | | | 87,283,110 | | | | 3,805,339 | | | | 10,693,415 | | | | 1,548,107 | | | | 4,476,160 | |
| | (20,761,633,563 | ) | | | (37,117,392,169 | ) | | | (20,210,885,151 | ) | | | (34,630,966,892 | ) | | | (1,154,071,264 | ) | | | (2,291,433,975 | ) |
|
|
| |
|
|
| |
|
|
| |
|
|
| |
|
|
| |
|
|
|
| | | | | |
| | (1,313,796,348 | ) | | | (2,755,809,653 | ) | | | 139,624,703 | | | | (914,754,888 | ) | | | (133,069,546 | ) | | | (32,434,127 | ) |
|
|
| |
|
|
| |
|
|
| |
|
|
| |
|
|
| |
|
|
|
| | (1,195,473,070 | ) | | | (3,058,063,562 | ) | | | 1,151,141,738 | | | | (813,742,129 | ) | | | 463,020,275 | | | | (43,603,476 | ) |
|
|
| |
|
|
| |
|
|
| |
|
|
| |
|
|
| |
|
|
|
| | | | | | | | | | | | | | | | | | | | | | | |
|
| | | | | |
| | | | | | | | | | | | | | | | | | | | | | | |
| | | | | |
| $ | 14,570,419,959 | | | $ | 15,765,893,029 | | | $ | 6,234,386,893 | | | $ | 5,083,245,155 | | | $ | 1,991,571,832 | | | $ | 1,528,551,557 | |
| | | | | |
| | N/A | | | | N/A | | | | 180,807,457 | | | | 353,982,022 | | | | 879,934,196 | | | | N/A | |
| | N/A | | | | N/A | | | | 620,318 | | | | 1,271,123 | | | | 326,972 | | | | N/A | |
| | N/A | | | | N/A | | | | (153,585,979 | ) | | | (254,182,684 | ) | | | (247,789,870 | ) | | | N/A | |
|
|
| |
|
|
| |
|
|
| |
|
|
| |
|
|
| |
|
|
|
| | N/A | | | | N/A | | | | 27,841,796 | | | | 101,070,461 | | | | 632,471,298 | | | | N/A | |
|
|
| |
|
|
| |
|
|
| |
|
|
| |
|
|
| |
|
|
|
| | 58,086,652 | �� | | | N/A | | | | 44,459,840 | | | | N/A | | | | N/A | | | | N/A | |
| | 3,902 | | | | N/A | | | | 18,126 | | | | N/A | | | | N/A | | | | N/A | |
| | (18,992,335 | ) | | | N/A | | | | (29,671,513 | ) | | | N/A | | | | N/A | | | | N/A | |
|
|
| |
|
|
| |
|
|
| |
|
|
| |
|
|
| |
|
|
|
| | 39,098,219 | | | | N/A | | | | 14,806,453 | | | | N/A | | | | N/A | | | | N/A | |
|
|
| |
|
|
| |
|
|
| |
|
|
| |
|
|
| |
|
|
|
| | 136,827,353,281 | | | | 287,346,947,224 | | | | 2,576,516,358 | | | | N/A | | | | 238,644,013 | | | | 767,490,685 | |
| | 5,340,422 | | | | 19,325,692 | | | | 397,212 | | | | N/A | | | | 194,187 | | | | 264,655 | |
| | (136,753,481,893 | ) | | | (287,668,882,040 | ) | | | (1,608,043,580 | ) | | | N/A | | | | (275,216,470 | ) | | | (778,969,273 | ) |
|
|
| |
|
|
| |
|
|
| |
|
|
| |
|
|
| |
|
|
|
| | 79,211,811 | | | | (302,609,124 | ) | | | 968,869,990 | | | | N/A | | | | (36,378,270 | ) | | | (11,213,933 | ) |
|
|
| |
|
|
| |
|
|
| |
|
|
| |
|
|
| |
|
|
|
| | 19,423,130,200 | | | | 34,274,299,406 | | | | 20,346,649,202 | | | | 33,705,518,590 | | | | 1,019,453,610 | | | | 2,254,515,379 | |
| | 24,707,015 | | | | 87,283,110 | | | | 3,805,339 | | | | 10,693,415 | | | | 1,548,107 | | | | 4,476,160 | |
| | (20,761,633,563 | ) | | | (37,117,399,088 | ) | | | (20,210,885,151 | ) | | | (34,630,950,201 | ) | | | (1,154,071,264 | ) | | | (2,291,433,975 | ) |
|
|
| |
|
|
| |
|
|
| |
|
|
| |
|
|
| |
|
|
|
| | (1,313,796,348 | ) | | | (2,755,816,572 | ) | | | 139,569,390 | | | | (914,738,196 | ) | | | (133,069,547 | ) | | | (32,442,436 | ) |
|
|
| |
|
|
| |
|
|
| |
|
|
| |
|
|
| |
|
|
|
| $ | (7,752 | ) | | $ | (7,752 | ) | | $ | 0 | | | $ | 0 | | | $ | (6 | ) | | $ | (6 | ) |
|
|
| |
|
|
| |
|
|
| |
|
|
| |
|
|
| |
|
|
|
51
| WELLSFARGOMONEYMARKETFUNDS | | STATEMENTSOFCHANGESINNETASSETS |
|
| | | PRIMEINVESTMENT
MONEYMARKETFUND
| |
| | | (Unaudited)
For the
Six Months Ended
September 30, 2003(1) | | | For the
Year Ended
March 31, 2003 | |
|
| | |
INCREASEINNETASSETS | | | | | | | | |
Beginning net assets | | $ | 1,818,363,896 | | | $ | 2,006,493,390 | |
| | |
OPERATIONS: | | | | | | | | |
Net investment income (loss) | | | 7,131,750 | | | | 28,143,468 | |
Net realized gain (loss) from investments | | | 200 | | | | 108,812 | |
| | |
|
|
| |
|
|
|
NETINCREASE (DECREASE)INNETASSETSRESULTINGFROMOPERATIONS | | | 7,131,950 | | | | 28,252,280 | |
| | |
|
|
| |
|
|
|
| | |
Distributions to shareholders: | | | | | | | | |
From net investment income | | | | | | | | |
Class A | | | N/A | | | | N/A | |
Administrator Class | | | N/A | | | | N/A | |
Institutional Class | | | (708,618 | ) | | | N/A | |
Service Class | | | (6,423,132 | ) | | | (28,143,468 | ) |
From net realized gain on sales of investments | | | | | | | | |
Class A | | | N/A | | | | N/A | |
Administrator Class | | | N/A | | | | N/A | |
Institutional Class | | | 0 | | | | N/A | |
Service Class | | | 0 | | | | (86,851 | ) |
| | |
Capital shares transactions: | | | | | | | | |
Proceeds from shares sold – Class A | | | N/A | | �� | | N/A | |
Reinvestment of dividends – Class A | | | N/A | | | | N/A | |
Cost of shares redeemed – Class A | | | N/A | | | | N/A | |
| | |
|
|
| |
|
|
|
| | |
NETINCREASE (DECREASE)INNETASSETSRESULTINGFROMCAPITAL
SHARETRANSACTIONS – CLASSA | | | N/A | | | | N/A | |
| | |
|
|
| |
|
|
|
Proceeds from shares sold – Administrator Class | | | N/A | | | | N/A | |
Reinvestment of dividends – Administrator Class | | | N/A | | | | N/A | |
Cost of shares redeemed – Administrator Class | | | N/A | | | | N/A | |
| | |
|
|
| |
|
|
|
| | |
NETINCREASE (DECREASE)INNETASSETSRESULTINGFROMCAPITAL
SHARETRANSACTIONS –ADMINISTRATORCLASS | | | N/A | | | | N/A | |
| | |
|
|
| |
|
|
|
Proceeds from shares sold – Institutional Class | | | 1,373,573,338 | | | | N/A | |
Reinvestment of dividends – Institutional Class | | | 169,073 | | | | N/A | |
Cost of shares redeemed – Institutional Class | | | (911,534,660 | ) | | | N/A | |
| | |
|
|
| |
|
|
|
| | |
NETINCREASE (DECREASE)INNETASSETSRESULTINGFROMCAPITAL
SHARETRANSACTIONS – INSTITUTIONALCLASS | | | 462,207,751 | | | | N/A | |
| | |
|
|
| |
|
|
|
Proceeds from shares sold – Service Class | | | 30,028,436,155 | | | | 55,176,100,867 | |
Reinvestment of dividends – Service Class | | | 772,541 | | | | 2,080,586 | |
Cost of shares redeemed – Service Class | | | (30,389,315,881 | ) | | | (55,366,332,911 | ) |
| | |
|
|
| |
|
|
|
| | |
NETINCREASE (DECREASE)INNETASSETSRESULTINGFROMCAPITAL
SHARETRANSACTIONS –SERVICECLASS | | | (360,107,185 | ) | | | (188,151,455 | ) |
| | |
|
|
| |
|
|
|
NETINCREASE (DECREASE)INNETASSETS | | | 102,100,766 | | | | (188,129,494 | ) |
| | |
|
|
| |
|
|
|
|
NETASSETS: | | | | | | | | |
| | |
ENDINGNETASSETS | | $ | 1,920,464,662 | | | $ | 1,818,363,896 | |
| | |
Shares Issued and Redeemed: | | | | | | | | |
Shares sold – Class A | | | N/A | | | | N/A | |
Shares issued in reinvestment of dividends – Class A | | | N/A | | | | N/A | |
Shares redeemed – Class A | | | N/A | | | | N/A | |
| | |
|
|
| |
|
|
|
| | |
NETINCREASE (DECREASE)INSHARESOUTSTANDING –CLASSA | | | N/A | | | | N/A | |
| | |
|
|
| |
|
|
|
Shares sold – Administrator Class | | | N/A | | | | N/A | |
Shares issued in reinvestment of dividends – Administrator Class | | | N/A | | | | N/A | |
Shares redeemed – Administrator Class | | | N/A | | | | N/A | |
| | |
|
|
| |
|
|
|
| | |
NETINCREASE (DECREASE)INSHARESOUTSTANDING –ADMINISTRATORCLASS | | | N/A | | | | N/A | |
| | |
|
|
| |
|
|
|
Shares sold – Institutional Class | | | 1,373,573,246 | | | | N/A | |
Shares issued in reinvestment of dividends – Institutional Class | | | 169,073 | | | | N/A | |
Shares redeemed – Institutional Class | | | (911,534,660 | ) | | | N/A | |
| | |
|
|
| |
|
|
|
| | |
NETINCREASE (DECREASE)INSHARESOUTSTANDING –INSTITUTIONALCLASS | | | 462,207,659 | | | | N/A | |
| | |
|
|
| |
|
|
|
Shares sold – Service Class | | | 30,028,436,155 | | | | 55,176,107,563 | |
Shares issued in reinvestment of dividends – Service Class | | | 772,541 | | | | 2,080,589 | |
Shares redeemed – Service Class | | | (30,389,315,881 | ) | | | (55,366,332,911 | ) |
| | |
NETINCREASE (DECREASE)INSHARESOUTSTANDING –SERVICECLASS | | | (360,107,185 | ) | | | (188,144,759 | ) |
| | |
|
|
| |
|
|
|
ENDINGBALANCEOFUNDISTRIBUTEDNETINVESTMENTINCOME | | $ | 4 | | | $ | 4 | |
| | |
|
|
| |
|
|
|
| (1) | | “Proceeds from shares sold” and “Shares sold” include amounts relating to Fund mergers. See Note 1. |
The accompanying notes are an integral part of these financial statements.
52
STATEMENTSOFCHANGESINNETASSETS | | WELLSFARGOMONEYMARKETFUNDS |
|
TREASURYPLUS
MONEYMARKETFUND
| | | 100%TREASURY
MONEYMARKETFUND
| |
(Unaudited)
For the
Six Months Ended
September 30, 2003(1) | | | For the
Year Ended
March 31, 2003 | | | (Unaudited)
For the
Six Months Ended
September 30, 2003 | | | For the
Year Ended
March 31, 2003 | |
|
| | | |
| | | | | | | | | | | | | | | |
| $ | 2,773,473,140 | | | $ | 2,063,967,798 | | | $ | 2,934,927,382 | | | $ | 2,663,835,087 | |
| | | |
| | | | | | | | | | | | | | | |
| | 14,029,518 | | | | 29,681,374 | | | | 8,522,348 | | | | 31,326,676 | |
| | 5,385 | | | | 11,432 | | | | 46,733 | | | | 109,493 | |
|
|
| |
|
|
| |
|
|
| |
|
|
|
| | 14,034,903 | | | | 29,692,806 | | | | 8,569,081 | | | | 31,436,169 | |
|
|
| |
|
|
| |
|
|
| |
|
|
|
| | | |
| | | | | | | | | | | | | | | |
| | | | | | | | | | | | | | | |
| | (1,615,024 | ) | | | N/A | | | | (454,040 | ) | | | (1,614,815 | ) |
| | N/A | | | | N/A | | | | N/A | | | | N/A | |
| | (7,974,558 | ) | | | (16,390,043 | ) | | | N/A | | | | N/A | |
| | (4,439,936 | ) | | | (13,291,330 | ) | | | (8,068,308 | ) | | | (30,020,000 | ) |
| | | | | | | | | | | | | | | |
| | 0 | | | | N/A | | | | 0 | | | | (3,104 | ) |
| | N/A | | | | N/A | | | | N/A | | | | N/A | |
| | 0 | | | | (46,882 | ) | | | N/A | | | | N/A | |
| | 0 | | | | (38,008 | ) | | | 0 | | | | (50,042 | ) |
| | | |
| | | | | | | | | | | | | | | |
| | 3,976,187,061 | | | | N/A | | | | 255,912,755 | | | | 409,695,186 | |
| | 403,454 | | | | N/A | | | | 488,980 | | | | 1,510,309 | |
| | (1,652,737,555 | ) | | | N/A | | | | (273,906,261 | ) | | | (363,853,473 | ) |
|
|
| |
|
|
| |
|
|
| |
|
|
|
| | | |
| | 2,323,852,960 | | | | N/A | | | | (17,504,526 | ) | | | 47,352,022 | |
|
|
| |
|
|
| |
|
|
| |
|
|
|
| | N/A | | | | N/A | | | | N/A | | | | N/A | |
| | N/A | | | | N/A | | | | N/A | | | | N/A | |
| | N/A | | | | N/A | | | | N/A | | | | N/A | |
|
|
| |
|
|
| |
|
|
| |
|
|
|
| | | |
| | N/A | | | | N/A | | | | N/A | | | | N/A | |
|
|
| |
|
|
| |
|
|
| |
|
|
|
| | 34,811,584,390 | | | | 113,558,849,495 | | | | N/A | | | | N/A | |
| | 1,045,828 | | | | 2,509,244 | | | | N/A | | | | N/A | |
| | (34,499,139,159 | ) | | | (112,901,219,091 | ) | | | N/A | | | | N/A | |
|
|
| |
|
|
| |
|
|
| |
|
|
|
| | | |
| | 313,491,059 | | | | 660,139,648 | | | | N/A | | | | N/A | |
|
|
| |
|
|
| |
|
|
| |
|
|
|
| | 7,096,880,635 | | | | 10,808,760,558 | | | | 8,080,684,352 | | | | 15,915,545,320 | |
| | 1,044,301 | | | | 2,257,836 | | | | 1,742,247 | | | | 6,217,119 | |
| | (6,990,301,886 | ) | | | (10,761,579,243 | ) | | | (8,183,359,067 | ) | | | (15,697,770,374 | ) |
|
|
| |
|
|
| |
|
|
| |
|
|
|
| | | |
| | 107,623,050 | | | | 49,439,151 | | | | (100,932,468 | ) | | | 223,992,065 | |
|
|
| |
|
|
| |
|
|
| |
|
|
|
| | 2,744,972,454 | | | | 709,505,342 | | | | (118,390,261 | ) | | | 271,092,295 | |
|
|
| |
|
|
| |
|
|
| |
|
|
|
| | | | | | | | | | | | | | | |
|
| | | | | | | | | | | | | | | |
| | | |
| $ | 5,518,445,594 | | | $ | 2,773,473,140 | | | $ | 2,816,537,121 | | | $ | 2,934,927,382 | |
| | | | | | | | | | | | | | | |
| | | |
| | 3,976,233,141 | | | | N/A | | | | 255,912,755 | | | | 409,695,186 | |
| | 403,454 | | | | N/A | | | | 488,980 | | | | 1,510,309 | |
| | (1,652,737,555 | ) | | | N/A | | | | (273,906,261 | ) | | | (363,852,531 | ) |
|
|
| |
|
|
| |
|
|
| |
|
|
|
| | | |
| | 2,323,899,040 | | | | N/A | | | | (17,504,526 | ) | | | 47,352,964 | |
|
|
| |
|
|
| |
|
|
| |
|
|
|
| | N/A | | | | N/A | | | | N/A | | | | N/A | |
| | N/A | | | | N/A | | | | N/A | | | | N/A | |
| | N/A | | | | N/A | | | | N/A | | | | N/A | |
|
|
| |
|
|
| |
|
|
| |
|
|
|
| | | |
| | N/A | | | | N/A | | | | N/A | | | | N/A | |
|
|
| |
|
|
| |
|
|
| |
|
|
|
| | 34,811,584,390 | | | | 113,558,849,494 | | | | N/A | | | | N/A | |
| | 1,045,828 | | | | 2,509,243 | | | | N/A | | | | N/A | |
| | (34,499,139,159 | ) | | | (112,901,208,629 | ) | | | N/A | | | | N/A | |
|
|
| |
|
|
| |
|
|
| |
|
|
|
| | | |
| | 313,491,059 | | | | 660,150,108 | | | | N/A | | | | N/A | |
|
|
| |
|
|
| |
|
|
| |
|
|
|
| | 7,096,880,635 | | | | 10,808,760,561 | | | | 8,080,684,352 | | | | 15,915,545,320 | |
| | 1,044,301 | | | | 2,257,835 | | | | 1,742,247 | | | | 6,217,119 | |
| | (6,990,301,886 | ) | | | (10,761,560,441 | ) | | | (8,183,359,067 | ) | | | (15,697,765,127 | ) |
| | | |
| | 107,623,050 | | | | 49,457,955 | | | | (100,932,468 | ) | | | 223,997,312 | |
|
|
| |
|
|
| |
|
|
| |
|
|
|
| $ | (4,294 | ) | | $ | (4,294 | ) | | $ | 40,624 | | | $ | 40,624 | |
|
|
| |
|
|
| |
|
|
| |
|
|
|
53
| WELLSFARGOMONEYMARKETFUNDS | | FINANCIALHIGHLIGHTS |
|
| | | Beginning
Net Asset
Value Per
Share | | Net
Investment
Income | | Net Realized
and Unrealized
Gain (Loss) on
Investments | | Dividends
From Net
Investment
Income | |
|
| | | | |
CALIFORNIATAX-FREEMONEYMARKETFUND | | | | | | | | | | |
| | | | |
SERVICECLASS | | | | | | | | | | |
April 1, 2003 to September 30, 2003 (Unaudited) | | $ | 1.00 | | 0.00 | | 0.00 | | 0.00 | |
April 1, 2002 to March 31, 2003 | | $ | 1.00 | | 0.01 | | 0.00 | | (0.01 | ) |
April 1, 2001 to March 31, 2002 | | $ | 1.00 | | 0.02 | | 0.00 | | (0.02 | ) |
April 1, 2000 to March 31, 2001 | | $ | 1.00 | | 0.03 | | 0.00 | | (0.03 | ) |
November 8, 1999(2) to March 31, 2000 | | $ | 1.00 | | 0.01 | | 0.00 | | (0.01 | ) |
| | | | |
CASHINVESTMENTMONEYMARKETFUND | | | | | | | | | | |
|
| | | | |
ADMINISTRATORCLASS | | | | | | | | | | |
July 31, 2003(2) to September 30, 2003 (Unaudited) | | $ | 1.00 | | 0.00 | | 0.00 | | (0.00 | ) |
| | | | |
INSTITUTIONALCLASS | | | | | | | | | | |
April 1, 2003 to September 30, 2003 (Unaudited) | | $ | 1.00 | | 0.00 | | 0.00 | | (0.00 | ) |
April 1, 2002 to March 31, 2003 | | $ | 1.00 | | 0.02 | | 0.00 | | (0.02 | ) |
April 1, 2001 to March 31, 2002 | | $ | 1.00 | | 0.03 | | 0.00 | | (0.03 | ) |
April 1, 2000 to March 31, 2001 | | $ | 1.00 | | 0.06 | | 0.00 | | (0.06 | ) |
November 8, 1999(2) to March 31, 2000 | | $ | 1.00 | | 0.02 | | 0.00 | | (0.02 | ) |
| | | | |
SERVICECLASS | | | | | | | | | | |
April 1, 2003 to September 30, 2003 (Unaudited) | | $ | 1.00 | | 0.00 | | 0.00 | | (0.00 | ) |
April 1, 2002 to March 31, 2003 | | $ | 1.00 | | 0.01 | | 0.00 | | (0.01 | ) |
April 1, 2001 to March 31, 2002 | | $ | 1.00 | | 0.03 | | 0.00 | | (0.03 | ) |
April 1, 2000 to March 31, 2001 | | $ | 1.00 | | 0.06 | | 0.00 | | (0.06 | ) |
June 1, 1999 to March 31, 2000(4) | | $ | 1.00 | | 0.04 | | 0.00 | | (0.04 | ) |
June 1, 1998 to May 31, 1999 | | $ | 1.00 | | 0.05 | | 0.00 | | (0.05 | ) |
June 1, 1997 to May 31, 1998 | | $ | 1.00 | | 0.05 | | 0.00 | | (0.05 | ) |
| | | | |
GOVERNMENTMONEYMARKETFUND | | | | | | | | | | |
|
| | | | |
ADMINISTRATORCLASS | | | | | | | | | | |
July 31, 2003(2) to September 30, 2003 (Unaudited) | | $ | 1.00 | | 0.00 | | 0.00 | | 0.00 | |
| | | | |
INSTITUTIONALCLASS | | | | | | | | | | |
July 28, 2003(2) to September 30, 2003 (Unaudited) | | $ | 1.00 | | 0.00 | | 0.00 | | 0.00 | |
| | | | |
SERVICECLASS | | | | | | | | | | |
April 1, 2003 to September 30, 2003 (Unaudited) | | $ | 1.00 | | 0.00 | | 0.00 | | (0.00 | ) |
April 1, 2002 to March 31, 2003 | | $ | 1.00 | | 0.01 | | 0.00 | | (0.01 | ) |
April 1, 2001 to March 31, 2002 | | $ | 1.00 | | 0.03 | | 0.00 | | (0.03 | ) |
April 1, 2000 to March 31, 2001 | | $ | 1.00 | | 0.05 | | 0.00 | | (0.05 | ) |
June 1, 1999 to March 31, 2000(4) | | $ | 1.00 | | 0.04 | | 0.00 | | (0.04 | ) |
June 1, 1998 to May 31, 1999 | | $ | 1.00 | | 0.05 | | 0.00 | | (0.05 | ) |
June 1, 1997 to May 31, 1998 | | $ | 1.00 | | 0.05 | | 0.00 | | (0.05 | ) |
| | | | |
NATIONALTAX-FREEMONEYMARKETFUND | | | | | | | | | | |
|
| | | | |
INSTITUTIONALCLASS | | | | | | | | | | |
April 1, 2003 to September 30, 2003 (Unaudited) | | $ | 1.00 | | 0.00 | | 0.00 | | (0.00 | ) |
April 1, 2002 to March 31, 2003 | | $ | 1.00 | | 0.01 | | 0.00 | | (0.01 | ) |
April 1, 2001 to March 31, 2002 | | $ | 1.00 | | 0.02 | | 0.00 | | (0.02 | ) |
April 1, 2000 to March 31, 2001 | | $ | 1.00 | | 0.04 | | 0.00 | | (0.04 | ) |
November 8, 1999(2) to March 31, 2000 | | $ | 1.00 | | 0.01 | | 0.00 | | (0.01 | ) |
| | | | |
SERVICECLASS | | | | | | | | | | |
April 1, 2003 to September 30, 2003 (Unaudited) | | $ | 1.00 | | 0.00 | | 0.00 | | (0.00 | ) |
April 1, 2002 to March 31, 2003 | | $ | 1.00 | | 0.01 | | 0.00 | | (0.01 | ) |
April 1, 2001 to March 31, 2002 | | $ | 1.00 | | 0.02 | | 0.00 | | (0.02 | ) |
April 1, 2000 to March 31, 2001 | | $ | 1.00 | | 0.04 | | 0.00 | | (0.04 | ) |
June 1, 1999 to March 31, 2000(4) | | $ | 1.00 | | 0.03 | | 0.00 | | (0.03 | ) |
June 1, 1998 to May 31, 1999 | | $ | 1.00 | | 0.03 | | 0.00 | | (0.03 | ) |
June 1, 1997 to May 31, 1998 | | $ | 1.00 | | 0.03 | | 0.00 | | (0.03 | ) |
The accompanying notes are an integral part of these financial statements.
54
FINANCIALHIGHLIGHTS | | WELLSFARGOMONEYMARKETFUNDS |
|
| | | | |
Distributions
From Net
Realized
Gains | | Ending
Net Asset
Value Per
Share | | Ratio to Average Net Assets (Annualized)(1)
| | Total
Return(3) | | Net Assets at
End of Period
(000’s omitted) |
| | | Net
Investment
Income | | Net
Expenses | | Gross
Expenses | | |
|
| | | | | | |
| | | | | | | | | | | | | | | |
| | | | | | |
| | | | | | | | | | | | | | | |
| 0.00 | | $ | 1.00 | | 0.57% | | 0.45% | | 0.51% | | 0.29% | | $ | 360,557 |
| 0.00 | | $ | 1.00 | | 0.90% | | 0.45% | | 0.50% | | 0.93% | | $ | 304,422 |
| 0.00 | | $ | 1.00 | | 1.62% | | 0.45% | | 0.49% | | 1.75% | | $ | 262,866 |
| 0.00 | | $ | 1.00 | | 3.10% | | 0.45% | | 0.57% | | 3.20% | | $ | 150,149 |
| 0.00 | | $ | 1.00 | | 2.69% | | 0.45% | | 0.51% | | 1.10% | | $ | 75,697 |
| | | | | | |
| | | | | | | | | | | | | | | |
|
| | | | | | |
| | | | | | | | | | | | | | | |
| 0.00 | | $ | 1.00 | | 0.77% | | 0.35% | | 0.35% | | 0.13% | | $ | 39,098 |
| | | | | | |
| | | | | | | | | | | | | | | |
| 0.00 | | $ | 1.00 | | 0.99% | | 0.23% | | 0.25% | | 0.50% | | $ | 5,254,544 |
| 0.00 | | $ | 1.00 | | 1.52% | | 0.25% | | 0.28% | | 1.54% | | $ | 5,175,328 |
| 0.00 | | $ | 1.00 | | 3.14% | | 0.25% | | 0.28% | | 3.28% | | $ | 5,478,005 |
| 0.00 | | $ | 1.00 | | 6.16% | | 0.25% | | 0.31% | | 6.38% | | $ | 3,332,149 |
| 0.00 | | $ | 1.00 | | 5.77% | | 0.25% | | 0.30% | | 2.29% | | $ | 2,116,276 |
| | | | | | |
| | | | | | | | | | | | | | | |
| 0.00 | | $ | 1.00 | | 0.74% | | 0.49% | | 0.54% | | 0.37% | | $ | 9,276,778 |
| 0.00 | | $ | 1.00 | | 1.31% | | 0.48% | | 0.54% | | 1.31% | | $ | 10,590,565 |
| 0.00 | | $ | 1.00 | | 2.91% | | 0.48% | | 0.54% | | 3.05% | | $ | 13,345,951 |
| 0.00 | | $ | 1.00 | | 5.94% | | 0.48% | | 0.54% | | 6.14% | | $ | 12,307,775 |
| 0.00 | | $ | 1.00 | | 5.23% | | 0.48% | | 0.54% | | 4.37% | | $ | 9,082,788 |
| 0.00 | | $ | 1.00 | | 4.91% | | 0.48% | | 0.57% | | 5.04% | | $ | 5,481,802 |
| 0.00 | | $ | 1.00 | | 5.29% | | 0.48% | | 0.57% | | 5.42% | | $ | 4,685,818 |
| | | | | | |
| | | | | | | | | | | | | | | |
|
| | | | | | |
| | | | | | | | | | | | | | | |
| 0.00 | | $ | 1.00 | | 0.74% | | 0.35% | | 0.37% | | 0.13% | | $ | 14,806 |
| | | | | | |
| | | | | | | | | | | | | | | |
| 0.00 | | $ | 1.00 | | 0.89% | | 0.20% | | 0.25% | | 0.16% | | $ | 968,870 |
| | | | | | |
| | | | | | | | | | | | | | | |
| 0.00 | | $ | 1.00 | | 0.69% | | 0.50% | | 0.55% | | 0.35% | | $ | 4,977,227 |
| 0.00 | | $ | 1.00 | | 1.24% | | 0.50% | | 0.54% | | 1.27% | | $ | 4,837,603 |
| 0.00 | | $ | 1.00 | | 2.67% | | 0.50% | | 0.52% | | 2.86% | | $ | 5,752,411 |
| 0.00 | | $ | 1.00 | | 5.79% | | 0.50% | | 0.56% | | 5.97% | | $ | 3,181,143 |
| 0.00 | | $ | 1.00 | | 4.94% | | 0.50% | | 0.54% | | 4.18% | | $ | 3,433,956 |
| 0.00 | | $ | 1.00 | | 4.69% | | 0.50% | | 0.52% | | 4.81% | | $ | 3,368,534 |
| 0.00 | | $ | 1.00 | | 5.08% | | 0.50% | | 0.51% | | 5.20% | | $ | 2,260,208 |
| | | | | | |
| | | | | | | | | | | | | | | |
|
| | | | | | |
| | | | | | | | | | | | | | | |
| 0.00 | | $ | 1.00 | | 0.85% | | 0.25% | | 0.26% | | 0.43% | | $ | 90,589 |
| 0.00 | | $ | 1.00 | | 1.23% | | 0.29% | | 0.29% | | 1.23% | | $ | 126,969 |
| 0.00 | | $ | 1.00 | | 2.05% | | 0.30% | | 0.38% | | 2.20% | | $ | 138,179 |
| 0.00 | | $ | 1.00 | | 3.86% | | 0.30% | | 0.37% | | 3.93% | | $ | 65,265 |
| 0.00 | | $ | 1.00 | | 3.43% | | 0.30% | | 0.31% | | 1.36% | | $ | 23,134 |
| | | | | | |
| | | | | | | | | | | | | | | |
| 0.00 | | $ | 1.00 | | 0.64% | | 0.45% | | 0.55% | | 0.32% | | $ | 1,268,497 |
| 0.00 | | $ | 1.00 | | 1.06% | | 0.45% | | 0.55% | | 1.07% | | $ | 1,401,583 |
| 0.00 | | $ | 1.00 | | 1.96% | | 0.45% | | 0.54% | | 2.05% | | $ | 1,433,976 |
| 0.00 | | $ | 1.00 | | 3.68% | | 0.45% | | 0.56% | | 3.78% | | $ | 1,183,279 |
| 0.00 | | $ | 1.00 | | 3.05% | | 0.45% | | 0.57% | | 2.58% | | $ | 1,124,073 |
| 0.00 | | $ | 1.00 | | 2.91% | | 0.45% | | 0.57% | | 2.97% | | $ | 1,019,589 |
| 0.00 | | $ | 1.00 | | 3.32% | | 0.45% | | 0.59% | | 3.39% | | $ | 977,693 |
55
| WELLSFARGOMONEYMARKETFUNDS | | FINANCIALHIGHLIGHTS |
|
| | | Beginning
Net Asset
Value Per
Share | | Net
Investment
Income | | Net Realized
and
Unrealized
Gain (Loss) on
Investments | | Dividends
From Net
Investment
Income | |
|
| | | | |
PRIMEINVESTMENTMONEYMARKETFUND | | | | | | | | | | |
| | | | |
INSTITUTIONALCLASS | | | | | | | | | | |
July 28, 2003(2) to September 30, 2003 (Unaudited) | | $ | 1.00 | | 0.00 | | 0.00 | | 0.00 | |
| | | | |
SERVICECLASS | | | | | | | | | | |
April 1, 2003 to September 30, 2003 (Unaudited) | | $ | 1.00 | | 0.00 | | 0.00 | | 0.00 | |
April 1, 2002 to March 31, 2003 | | $ | 1.00 | | 0.01 | | 0.00 | | (0.01 | ) |
April 1, 2001 to March 31, 2002 | | $ | 1.00 | | 0.03 | | 0.00 | | (0.03 | ) |
April 1, 2000 to March 31, 2001 | | $ | 1.00 | | 0.06 | | 0.00 | | (0.06 | ) |
June 1, 1999 to March 31, 2000(4) | | $ | 1.00 | | 0.04 | | 0.00 | | (0.04 | ) |
September 2, 1998(2) to May 31, 1999 | | $ | 1.00 | | 0.04 | | 0.00 | | (0.04 | ) |
| | | | |
TREASURYPLUSMONEYMARKETFUND | | | | | | | | | | |
|
| | | | |
INSTITUTIONALCLASS | | | | | | | | | | |
April 1, 2003 to September 30, 2003 (Unaudited) | | $ | 1.00 | | 0.00 | | 0.00 | | (0.00 | ) |
April 1, 2002 to March 31, 2003 | | $ | 1.00 | | 0.01 | | 0.00 | | (0.01 | ) |
April 1, 2001 to March 31, 2002 | | $ | 1.00 | | 0.03 | | 0.00 | | (0.03 | ) |
April 1, 2000 to March 31, 2001 | | $ | 1.00 | | 0.06 | | 0.00 | | (0.06 | ) |
April 1, 1999 to March 31, 2000 | | $ | 1.00 | | 0.05 | | 0.00 | | (0.05 | ) |
April 1, 1998 to March 31, 1999 | | $ | 1.00 | | 0.05 | | 0.00 | | (0.05 | ) |
| | | | |
SERVICECLASS | | | | | | | | | | |
April 1, 2003 to September 30, 2003 (Unaudited) | | $ | 1.00 | | 0.00 | | 0.00 | | (0.00 | ) |
April 1, 2002 to March 31, 2003 | | $ | 1.00 | | 0.01 | | 0.00 | | (0.01 | ) |
April 1, 2001 to March 31, 2002 | | $ | 1.00 | | 0.03 | | 0.00 | | (0.03 | ) |
April 1, 2000 to March 31, 2001 | | $ | 1.00 | | 0.06 | | 0.00 | | (0.06 | ) |
April 1, 1999 to March 31, 2000 | | $ | 1.00 | | 0.05 | | 0.00 | | (0.05 | ) |
April 1, 1998 to March 31, 1999 | | $ | 1.00 | | 0.05 | | 0.00 | | (0.05 | ) |
| | | | |
100%TREASURYMONEYMARKETFUND | | | | | | | | | | |
|
| | | | |
SERVICECLASS | | | | | | | | | | |
April 1, 2003 to September 30, 2003 (Unaudited) | | $ | 1.00 | | 0.00 | | 0.00 | | (0.00 | ) |
April 1, 2002 to March 31, 2003 | | $ | 1.00 | | 0.01 | | 0.00 | | (0.01 | ) |
April 1, 2001 to March 31, 2002 | | $ | 1.00 | | 0.03 | | 0.00 | | (0.03 | ) |
April 1, 2000 March 31, 2001 | | $ | 1.00 | | 0.05 | | 0.00 | | (0.05 | ) |
June 1, 1999 to March 31, 2000(4) | | $ | 1.00 | | 0.04 | | 0.00 | | (0.04 | ) |
June 1, 1998 to May 31, 1999 | | $ | 1.00 | | 0.04 | | 0.00 | | (0.04 | ) |
June 1, 1997 to May 31, 1998 | | $ | 1.00 | | 0.05 | | 0.00 | | (0.05 | ) |
The accompanying notes are an integral part of these financial statements.
56
FINANCIALHIGHLIGHTS | | WELLSFARGOMONEYMARKETFUNDS |
|
| | | | |
Distributions
From Net
Realized
Gains | | Ending
Net Asset
Value Per
Share | | Ratio to Average Net Assets (Annualized)(1)
| | | Total
Return(3) | | | Net Assets at
End of Period
(000’s Omitted) |
| | | Net Investment
Income | | | Net
Expenses | | | Gross
Expenses | | | |
| | | | | | | | | | | | | | | | | | | |
|
| | | | | | |
| | | | | | | | | | | | | | | | | | | |
| | | | | | |
| | | | | | | | | | | | | | | | | | | |
| 0.00 | | $ | 1.00 | | 0.88 | % | | 0.20 | % | | 0.26 | % | | 0.16 | % | | $ | 462,208 |
| | | | | | |
| | | | | | | | | | | | | | | | | | | |
| 0.00 | | $ | 1.00 | | 0.63 | % | | 0.55 | % | | 0.57 | % | | 0.32 | % | | $ | 1,458,257 |
| 0.00 | | $ | 1.00 | | 1.14 | % | | 0.55 | % | | 0.55 | % | | 1.14 | % | | $ | 1,818,364 |
| 0.00 | | $ | 1.00 | | 2.64 | % | | 0.55 | % | | 0.55 | % | | 2.80 | % | | $ | 2,006,493 |
| 0.00 | | $ | 1.00 | | 5.72 | % | | 0.55 | % | | 0.63 | % | | 6.02 | % | | $ | 1,678,432 |
| 0.00 | | $ | 1.00 | | 5.15 | % | | 0.55 | % | | 0.93 | % | | 4.30 | % | | $ | 222,523 |
| 0.00 | | $ | 1.00 | | 4.69 | % | | 0.54 | % | | 0.74 | % | | 3.59 | % | | $ | 68,771 |
| | | | | | |
| | | | | | | | | | | | | | | | | | | |
|
| | | | | | |
| | | | | | | | | | | | | | | | | | | |
| 0.00 | | $ | 1.00 | | 0.93 | % | | 0.21 | % | | 0.26 | % | | 0.47 | % | | $ | 1,879,358 |
| 0.00 | | $ | 1.00 | | 1.38 | % | | 0.21 | % | | 0.29 | % | | 1.45 | % | | $ | 1,565,864 |
| 0.00 | | $ | 1.00 | | 2.78 | % | | 0.21 | % | | 0.29 | % | | 2.97 | % | | $ | 905,766 |
| 0.00 | | $ | 1.00 | | 5.88 | % | | 0.25 | % | | 0.30 | % | | 6.05 | % | | $ | 415,965 |
| 0.00 | | $ | 1.00 | | 4.81 | % | | 0.25 | % | | 0.40 | % | | 4.98 | % | | $ | 390,592 |
| 0.00 | | $ | 1.00 | | 4.92 | % | | 0.25 | % | | 0.41 | % | | 5.04 | % | | $ | 493,987 |
| | | | | | |
| | | | | | | | | | | | | | | | | | | |
| 0.00 | | $ | 1.00 | | 0.66 | % | | 0.47 | % | | 0.55 | % | | 0.33 | % | | $ | 1,315,234 |
| 0.00 | | $ | 1.00 | | 1.18 | % | | 0.46 | % | | 0.55 | % | | 1.20 | % | | $ | 1,207,609 |
| 0.00 | | $ | 1.00 | | 2.54 | % | | 0.46 | % | | 0.53 | % | | 2.73 | % | | $ | 1,158,202 |
| 0.00 | | $ | 1.00 | | 5.64 | % | | 0.46 | % | | 0.55 | % | | 5.83 | % | | $ | 1,050,508 |
| 0.00 | | $ | 1.00 | | 5.04 | % | | 0.45 | % | | 0.63 | % | | 4.76 | % | | $ | 468,150 |
| 0.00 | | $ | 1.00 | | 4.70 | % | | 0.45 | % | | 0.70 | % | | 4.83 | % | | $ | 447,886 |
| | | | | | |
| | | | | | | | | | | | | | | | | | | |
|
| | | | | | |
| | | | | | | | | | | | | | | | | | | |
| 0.00 | | $ | 1.00 | | 0.60 | % | | 0.47 | % | | 0.56 | % | | 0.30 | % | | $ | 2,624,753 |
| 0.00 | | $ | 1.00 | | 1.12 | % | | 0.46 | % | | 0.55 | % | | 1.15 | % | | $ | 2,725,643 |
| 0.00 | | $ | 1.00 | | 2.53 | % | | 0.46 | % | | 0.55 | % | | 2.68 | % | | $ | 2,501,888 |
| 0.00 | | $ | 1.00 | | 5.41 | % | | 0.46 | % | | 0.55 | % | | 5.59 | % | | $ | 2,254,618 |
| 0.00 | | $ | 1.00 | | 4.67 | % | | 0.46 | % | | 0.54 | % | | 3.94 | % | | $ | 1,702,250 |
| 0.00 | | $ | 1.00 | | 4.34 | % | | 0.46 | % | | 0.53 | % | | 4.49 | % | | $ | 1,548,549 |
| 0.00 | | $ | 1.00 | | 4.89 | % | | 0.46 | % | | 0.54 | % | | 5.00 | % | | $ | 1,440,515 |
57
| WELLSFARGOMONEYMARKETFUNDS | | NOTESTOFINANCIALHIGHLIGHTS |
|
NOTESTOFINANCIALHIGHLIGHTS
| |
| (1) | | During each period, various fees and expenses were waived and reimbursed as indicated. The ratio of Gross Expenses to Average Net Assets reflects the expense ratio in the absence of any waivers and reimbursements (Note 7). |
| |
| (2) | | Commencement of operations. |
| |
| (3) | | Total return calculations would have been lower had certain expenses not been waived or reimbursed during the periods shown. Returns for periods less than one year are not annualized. |
| |
| (4) | | The Fund changed its fiscal year-end from May 31 to March 31. |
The accompanying notes are an integral part of these financial statements.
58
NOTESTOFINANCIALSTATEMENTS (UNAUDITED) | | WELLSFARGOMONEYMARKETFUNDS |
|
1. ORGANIZATION
Wells Fargo Funds Trust (the “Trust”) is registered under the Investment Company Act of 1940, as amended (the “1940 Act”), as an open-end series management investment company. The Trust commenced operations on November 8, 1999, and is currently comprised of 68 separate series. These financial statements present the California Tax-Free Money Market, Cash Investment Money Market, Government Money Market, National Tax-Free Money Market (formerly named National Tax-Free Institutional Money Market Fund), 100% Treasury Money Market, Prime Investment Money Market and Treasury Plus Money Market (formerly named the Treasury Plus Institutional Money Market Fund) Funds (each, a “Fund”, collectively, the “Funds”), each with the exception of the California Tax-Free Money Market Fund, a diversified series of the Trust. The California Tax-Free Money Market Fund is a non-diversified series of the Trust.
Effective at the close of business on June 6, 2003, the Wells Fargo Government Money Market Fund acquired all of the net assets of the Montgomery Government Money Market Fund. The Montgomery Government Money Market Fund exchanged its 180,530,053 R Class shares (valued at $180,585,365) for 180,530,053 Service Class shares of the Wells Fargo Government Money Market Fund.
Effective at the close of business on July 25, 2003, the Government Money Market Fund acquired all of the net assets of the Government Institutional Money Market Fund. The Government Institutional Money Market Fund exchanged its 1,081,553,886 Institutional Class shares (valued at $1,081,553,928) for 1,081,553,886 Institutional Class shares of the Government Money Market Fund.
Effective at the close of business on July 25, 2003, the National Tax-Free Money Market Fund (formerly named the National Tax-Free Institutional Money Market Fund) (the “Acquiring Fund”) acquired all of the net assets of the National Tax-Free Money Market Fund (the “Target Fund”). The Target Fund exchanged its 667,850,273 Class A shares (valued at $667,870,144) for 667,850,273 Class A shares of the Acquiring Fund.
Effective as of the close of business on July 25, 2003, the Prime Investment Money Market Fund acquired all of the net assets of the Prime Investment Institutional Money Market Fund. The Prime Investment Institutional Money Market Fund exchanged its 455,533,672 Institutional Class shares (valued at $455,533,763) for 455,533,672 Institutional Class shares of the Prime Investment Money Market Fund.
Effective at the close of business on July 25, 2003, the Treasury Plus Money Market Fund (formerly named the Treasury Plus Institutional Money Market Fund) (the “Acquiring Fund”) acquired all of the net assets of the Treasury Plus Money Market Fund (the “Target Fund”). The Target Fund exchanged its 2,352,982,205 Class A shares (valued at $2,352,936,127) for 2,352,982,205 Class A shares of the Acquiring Fund.
The separate classes of shares offered by each Fund differ principally in the applicable sales charges (if any) and distribution, shareholder servicing and administration fees. Shareholders of each class bear certain expenses that pertain to that particular class. All shareholders bear the common expenses of a Fund and earn income from the portfolio, pro rata based on the average daily net assets of each class, without distinction between share classes. Dividends are determined separately for each class based on income and expenses allocable to each class. Realized gains and losses are allocated to each class pro rata based on the net assets of each class on the date realized. No class has preferential dividend rights. Differences in per share dividend rates generally result from the relative weightings of pro rata income and realized gain allocations and from differences in separate class expenses, including distribution, shareholder servicing and administration fees.
2. SIGNIFICANT ACCOUNTING POLICIES
The following significant accounting policies which are consistently followed by the Trust in the preparation of its financial statements are in conformity with accounting principles generally accepted in the United States of America (“GAAP”) for investment companies.
The preparation of financial statements in conformity with GAAP requires management to make estimates and assumptions that affect the reported amounts of assets and liabilities, disclosure of contingent assets and liabilities at the date of the financial statements and the reported amounts of revenues and expenses during the reporting period. Actual results could differ from those estimates.
SECURITYVALUATION
The Funds invest only in securities with remaining maturities not exceeding 397 days (13 months). Certain floating- and variable-rate instruments in the portfolios may have maturities in excess of 397 days, but carry a demand feature that permits the holder to tender the instruments back to the issuer at par value prior to maturity.
59
| WELLSFARGOMONEYMARKETFUNDS | | NOTESTOFINANCIALSTATEMENTS (UNAUDITED) |
|
The Funds use the amortized cost method to value their portfolio securities. The amortized cost method involves valuing a security at its cost, plus accretion of discount or minus amortization of premium over the period until maturity, which approximates market value. The Funds seek to maintain a constant net asset value of $1.00 per share, although there is no assurance that they will be able to do so.
SECURITIESTRANSACTIONSANDINCOMERECOGNITION
Securities transactions are recorded on a trade date basis. Realized gains or losses are reported on the basis of identified cost of securities delivered. Interest income is accrued daily and bond discounts are accreted and premiums are amortized.
REPURCHASEAGREEMENTS
Each Fund, with the exception of the 100% Treasury Money Market, California Tax-Free Money Market, and National Tax-Free Money Market Funds, may invest in repurchase agreements and may participate in pooled repurchase agreement transactions with other funds advised by Wells Fargo Funds Management, LLC. The repurchase agreements must be fully collateralized based on values that are marked to market daily. The collateral may be held by an agent bank under a tri-party agreement. It is the Funds’ custodian’s responsibility to value collateral daily and to take action to obtain additional collateral as necessary to maintain market value equal to or greater than the resale price. The repurchase agreements held by the Funds are collateralized by instruments such as U.S. Treasury, federal agency, or high-grade corporate obligations. There could be potential loss to a Fund in the event that such Fund is delayed or prevented from exercising its rights to dispose of the collateral, including the risk of a possible decline in the value of the underlying obligations during the period in which a Fund seeks to assert its rights.
DISTRIBUTIONSTOSHAREHOLDERS
Net investment income is declared daily and distributed to shareholders monthly. Distributions to shareholders from net realized capital gains, if any, are declared and distributed at least annually.
Distributions are based on amounts calculated in accordance with the applicable federal income tax regulations, which may differ from GAAP. The timing and character of distributions made during the period from net investment income or net realized gains may also differ from their ultimate characterization for federal income tax purposes. To the extent that these differences are permanent in nature, such amounts are reclassified within the capital accounts based on their federal tax-basis treatment; temporary differences do not require reclassifications.
FEDERALINCOMETAXES
Each Fund is treated as a separate entity for federal income tax purposes. It is the policy of each Fund to continue to qualify as a regulated investment company by complying with the provisions applicable to regulated investment companies, as defined under subchapter M of the Internal Revenue Code (“Code”), and to make distributions of substantially all of its investment company taxable income and any net realized capital gains (after reduction for capital loss carryforwards) sufficient to relieve it from all, or substantially all, federal income taxes. Accordingly, no provision for federal income taxes was required at September 30, 2003.
The Treasury Plus Money Market Fund has a current post-October deferred loss of $898. This loss will be recognized for tax purposes on the first day of the following tax year.
3. ADVISORY FEES
The Trust has entered into an advisory contract on behalf of the Funds with Wells Fargo Funds Management (“Funds Management”). Pursuant to the advisory contract, Funds Management has agreed to provide the following Funds with daily portfolio management, for which Funds Management is entitled to be paid a monthly advisory fee at the following annual rates:
| Fund | | % of Average Daily Net Assets |
California Tax-Free Money Market Fund | | 0.30 |
Cash Investment Money Market Fund | | 0.10 |
Government Money Market Fund | | 0.10 |
National Tax-Free Money Market Fund | | 0.10 |
Prime Investment Money Market Fund | | 0.10 |
Treasury Plus Money Market Fund | | 0.10 |
100% Treasury Money Market Fund | | 0.35 |
60
NOTESTOFINANCIALSTATEMENTS (UNAUDITED) | | WELLSFARGOMONEYMARKETFUNDS |
|
The Funds’ adviser is responsible for implementing the investment policies and guidelines for the Funds, and for supervising the sub-adviser who is responsible for the day-to-day portfolio management of the Funds.
Wells Capital Management Incorporated (“Wells Capital Management”), an affiliate of Funds Management, acts as investment sub-adviser to the Funds. Wells Capital Management is entitled to receive from Funds Management, as compensation for its sub-advisory services to the Funds, a monthly fee at the annual rate of 0.05% of each Fund’s average daily net assets up to $1 billion and 0.04% of each Fund’s average daily net assets in excess of $1 billion.
4. ADMINISTRATION FEES AND TRANSFER AGENT FEES
Through February 28, 2003, the Trust had entered into an Administration Agreement with Funds Management on behalf of the Funds. Under the Administration Agreement, Funds Management acted as administrator to the Funds and was entitled to receive, on a monthly basis, fees at the annual rate of 0.15% of each Fund’s average daily net assets.
The Trust had also entered into an agreement with Boston Financial Data Services, Inc. (“BFDS”) as the transfer agent for the Trust. Under the agreement, BFDS was entitled to receive from the Funds a per-account fee plus transaction fees, certain out-of-pocket costs and a complex based fee.
Effective March 1, 2003, the Trust has entered into a new Administration Agreement with Funds Management on behalf of the Funds. Under this Agreement, for providing administrative services, which now includes paying the Funds’ fees and expenses for services provided by the Funds’ transfer agent and various sub-transfer agents and omnibus account servicers and record-keepers out of the fees it receives as administrator, Funds Management is entitled to receive an annual fee of 0.27% of the average daily net assets of a Fund’s Class A and Class B shares, 0.17% of the average daily net assets of a Fund’s Service Class shares, 0.15% of the average daily net assets of a Fund’s Administrator Class shares and 0.13% of the average daily net assets of a Fund’s Institutional Class shares.
5. SHAREHOLDER SERVICING FEES
The Trust has entered into contracts on behalf of the Funds with numerous shareholder servicing agents. The Government Money Market and Cash Investment Money Market Funds are charged 0.10% of the average daily net assets of each Fund for Administrator Class shares for these services. The California Tax-Free, Government Money Market, National Tax-Free Money Market, Treasury Plus Money Market and 100% Treasury Money Market Funds are charged 0.25% of the average daily net assets of each Fund for Class A shares for these services. The Cash Investment Money Market, Government Money Market, National Tax-Free Money Market, Prime Investment Money Market and Treasury Plus Money Market Funds are charged 0.25% of the average daily net assets of each Fund for Service Class shares for these services. No fee is charged for Service Class shares of the California Tax-Free Money Market and 100% Treasury Money Market Funds, and Institutional Class shares of the Cash Investment Money Market, Government Money Market, National Tax-Free Money Market, Prime Investment Money Market and Treasury Plus Money Market Funds.
The shareholder servicing fees paid on behalf of the Funds for the period ended September 30, 2003 were as follows:
| Fund | | Class A | | Administrator
Class | | Service Class |
California Tax-Free Money Market Fund | | $ | 2,821,235 | | | N/A | | $ | 0 |
Cash Investment Money Market Fund | | | N/A | | $ | 2,525 | | | 12,340,214 |
Government Money Market Fund | | | 331,177 | | | 4,215 | | | 2,301,223 |
National Tax-Free Money Market Fund | | | 299,214 | | | N/A | | | 1,687,845 |
Prime Investment Money Market Fund | | | N/A | | | N/A | | | 2,547,194 |
Treasury Plus Money Market Fund | | | 1,024,870 | | | N/A | | | 1,664,439 |
100% Treasury Money Market Fund | | | 265,809 | | | N/A | | | 0 |
6. OTHER FEES AND TRANSACTIONS WITH AFFILIATES
Effective the first quarter of 2003, PFPC, Inc. (“PFPC”) serves as fund accountant for the Funds. For its services as fund accountant, PFPC is entitled to receive an annual asset based fund complex fee, an annual fee of $20,000 from each Fund and is entitled to be reimbursed for all out-of-pocket expenses reasonably incurred in providing these services. Prior to PFPC, Forum Accounting Services, LLC (“Forum”) served as
61
| WELLSFARGOMONEYMARKETFUNDS | | NOTESTOFINANCIALSTATEMENTS (UNAUDITED) |
|
fund accountant and was entitled to receive a fixed monthly per fund fee, a basis point fee of 0.0025% of the average daily net assets of each Fund, and was reimbursed for all out-of-pocket expenses reasonably incurred in providing these services.
In addition, the Trust has entered into a contract on behalf of each Fund with Wells Fargo Bank Minnesota, N.A. (“Wells Fargo Bank, MN”), whereby Wells Fargo Bank, MN is responsible for providing custody services for the Funds. Pursuant to the contracts, Wells Fargo Bank, MN is entitled to receive certain transaction charges plus a monthly fee for custody services at the annual rate of 0.02% of the average daily net assets of each Fund.
7. WAIVED FEES AND REIMBURSED EXPENSES
All amounts shown as waived fees or reimbursed expenses on the Statements of Operations, for the six months ended September 30, 2003, were waived by Funds Management first from advisory fees, and then any remaining amount consecutively from administration, custody and shareholder servicing fees collected.
62
BOARDOFTRUSTEES | | WELLSFARGOMONEYMARKETFUNDS |
|
BOARDOFTRUSTEES
The following table provides basic information about the Board of Trustees (“Trustees”) of the Trust and supplements, and should be read in conjunction with, the Prospectus and the Statement of Additional Information* of each Fund. Each of the Trustees listed below acts in identical capacities for each of the 92 funds comprising the Trust, Wells Fargo Variable Trust and Wells Fargo Master Trust (collectively the “Fund Complex”). All of the non-interested Trustees are also members of the Audit and Nominating Committees of each Trust in the Fund Complex. The address of each Trustee and Officer is 525 Market Street, 20th Floor, San Francisco, CA 94105. Each Trustee and Officer serves an indefinite term, however, each Trustee serves such term until reaching the mandatory retirement age established by the Trustees.
INTERESTEDTRUSTEES **
| Name and Age | | Position held and
length of service *** | | Principal occupations during
past five years | | Other Directorships |
Robert C. Brown
72 | | Trustee since 1992 | | Retired. Director, Federal Farm Credit Banks Funding Corporation and Farm Credit System Financial Assistance Corporation until
February 1999. | | None |
|
J. Tucker Morse
59 | | Trustee since 1987 | | Private Investor/Real Estate Developer; Chairman of White Point Capital, LLC. | | None |
|
| | |
| NON-INTERESTEDTRUSTEES | | | | |
| Name and Age | | Position held and length of service *** | | Principal occupations during
past five years | | Other Directorships |
Thomas S. Goho
61 | | Trustee since 1987 | | Wake Forest University, Calloway School of Business and Accountancy, Benson-Pruitt Professorship since 1999, Associate Professor of Finance 1994–1999. | | None |
|
Peter G. Gordon
61 | | Trustee since 1998 (Lead Trustee since 2001) | | Chairman, CEO, and Co-Founder of Crystal Geyser Water Company and President of Crystal Geyser Roxane Water Company. | | None |
|
Richard M. Leach
70 | | Trustee since 1987 | | Retired. Prior thereto, President of Richard M. Leach Associates (a financial consulting firm). | | None |
|
Timothy J. Penny
51 | | Trustee since 1996 | | Senior Counselor to the public relations firm of Himle-Horner and Senior Fellow at the Humphrey Institute, Minneapolis, Minnesota (a public policy organization). | | None |
|
Donald C. Willeke
63 | | Trustee since 1996 | | Principal in the law firm of Willeke & Daniels. | | None |
|
63
| WELLSFARGOMONEYMARKETFUNDS | | BOARDOFTRUSTEES |
|
OFFICERS
| Name and Age | | Position held and
length of service | | Principal occupations during
past five years | | Other Directorships |
Karla M. Rabusch 44 | | President, since 2003 | | Executive Vice President of Wells Fargo Bank, N.A. President of Wells Fargo Funds Management, LLC. Senior Vice President and Chief Administrative Officer of Wells Fargo Funds Management, LLC from March 2001 to March 2003. Vice President of Wells Fargo Bank, N.A. from December 1997 to May 2000. | | None |
|
Stacie D. DeAngelo 34 | | Treasurer, since 2003 | | Vice President of Wells Fargo Bank, N.A. Vice President of Operations for Wells Fargo Funds Management, LLC. Prior thereto, Operations Manager at Scudder Weisel Capital, LLC (2000 to 2001), Director of Shareholder Services at BISYS Fund Services (1999 to 2000) and Assistant Vice President of Operations with Nicholas-Applegate Capital Management (1993 to 1999). | | None |
|
C. David Messman 43 | | Secretary, since 2000 | | Vice President and Counsel of Wells Fargo Bank, N.A. since January 1996. Vice President and Secretary of Wells Fargo Funds Management, LLC since March 2001. | | None |
|
| * | | The Statement of Additional Information includes additional information about the Funds’ Trustees and is available, without charge, upon request, by calling 1-800-222-8222. |
| ** | | Currently, two of the seven Trustees are considered “interested persons” of the Trusts as defined in the Investment Company Act of 1940. One of the interested Trustees, Robert C. Brown, owns securities of Wells Fargo & Company, and one of the interested Trustees, J. Tucker Morse, is affiliated with a government securities dealer that is registered under the Securities Exchange Act of 1934, which is not itself affiliated with Wells Fargo Funds Management, LLC. |
| *** | | Length of service dates reflects a Trustee’s commencement of service with the Trust’s predecessor entities. |
64
LISTOFABBREVIATIONS | | WELLSFARGOMONEYMARKETFUNDS |
|
The following is a list of common abbreviations for terms and entities which may have appeared in this report.
| |
ABAG | | — Association of Bay Area Governments |
| |
ADR | | — American Depository Receipts |
| |
AMBAC | | — American Municipal Bond Assurance Corporation |
| |
AMT | | — Alternative Minimum Tax |
| |
ARM | | — Adjustable Rate Mortgages |
| |
BART | | — Bay Area Rapid Transit |
| |
CDA | | — Community Development Authority |
| |
CDSC | | — Contingent Deferred Sales Charge |
| |
CGIC | | — Capital Guaranty Insurance Company |
| |
CGY | | — Capital Guaranty Corporation |
| |
CMT | | — Constant Maturity Treasury |
| |
COFI | | — Cost of Funds Index |
| |
Connie Lee | | — Connie Lee Insurance Company |
| |
COP | | — Certificate of Participation |
| |
CP | | — Commercial Paper |
| |
CTF | | — Common Trust Fund |
| |
DW&P | | — Department of Water & Power |
| |
DWR | | — Department of Water Resources |
| |
EDFA | | — Education Finance Authority |
| |
FGIC | | — Financial Guaranty Insurance Corporation |
| |
FHA | | — Federal Housing Authority |
| |
FHLB | | — Federal Home Loan Bank |
| |
FHLMC | | — Federal Home Loan Mortgage Corporation |
| |
FNMA | | — Federal National Mortgage Association |
| |
FRN | | — Floating Rate Notes |
| |
FSA | | — Financial Security Assurance, Inc |
| |
GNMA | | — Government National Mortgage Association |
| |
GO | | — General Obligation |
| |
HFA | | — Housing Finance Authority |
| |
HFFA | | — Health Facilities Financing Authority |
| |
IDA | | — Industrial Development Authority |
| |
LIBOR | | — London Interbank Offered Rate |
| |
LLC | | — Limited Liability Corporation |
| |
LOC | | — Letter of Credit |
| |
LP | | — Limited Partnership |
| |
MBIA | | — Municipal Bond Insurance Association |
| |
MFHR | | — Multi-Family Housing Revenue |
| |
MUD | | — Municipal Utility District |
| |
MTN | | — Medium Term Note |
| |
PCFA | | — Pollution Control Finance Authority |
| |
PCR | | — Pollution Control Revenue |
| |
PFA | | — Public Finance Authority |
| |
PLC | | — Private Placement |
| |
PSFG | | — Public School Fund Guaranty |
| |
RAW | | — Revenue Anticipation Warrants |
| |
RDA | | — Redevelopment Authority |
| |
RDFA | | — Redevelopment Finance Authority |
| |
R&D | | — Research & Development |
| |
SFMR | | — Single Family Mortgage Revenue |
| |
STEERS | | — Structured Enhanced Return Trust |
| |
TBA | | — To Be Announced |
| |
TRAN | | — Tax Revenue Anticipation Notes |
| |
USD | | — Unified School District |
| |
V/R | | — Variable Rate |
| |
WEBS | | — World Equity Benchmark Shares |
65

More information about Wells Fargo Funds® is available free upon request. To obtain literature, please write or call: Wells Fargo Funds PO Box 8266 Boston, MA 02266-8266 Wells Fargo Funds Investor Services: 1-800-222-8222 or visit our Web site at www.wellsfargofunds.com. | | This report and the financial statements contained herein are submitted for the general information of the shareholders of the Wells Fargo Funds. If this report is used for promotional purposes, distribution of the report must be accompanied or preceded by a current prospectus. For a prospectus containing more complete information, including charges and expenses, call 1-800-222-8222. Read the prospectus carefully before you invest or send money. Wells Fargo Funds Management, LLC, a wholly-owned subsidiary of Wells Fargo & Company, provides investment advisory and administrative services for the Wells Fargo Funds. Other affiliates of Wells Fargo & Company provide sub-advisory and other services for the Funds. The Funds are distributed by Stephens Inc., Member NYSE/SIPC. Wells Fargo & Company and its affiliates are not affiliated with Stephens Inc. |
| | | NOT FDIC INSURED - NO BANK GUARANTEE - MAY LOSE VALUE | | SAR 006 (11/03) |
WELLS FARGO
FUNDS
Wells Fargo Money Market Funds
Semi-Annual Report
Wells Fargo California Tax-Free Money Market Trust
Wells Fargo Money Market Trust
Wells Fargo National Tax-Free Money Market Trust
September 30, 2003
| | | WELLSFARGOMONEYMARKETTRUSTS |
|
TABLEOFCONTENTS
NOT FDIC INSURED–NO BANK GUARANTEE–MAY LOSE VALUE
This page is intentionally left blank —
WELLSFARGOMONEYMARKETTRUSTS | | SHAREHOLDERLETTER |
|
DEARVALUEDSHAREHOLDER,
We are pleased to provide you with this Wells Fargo Money Market Trusts semi-annual report for the six-month period ending September 30, 2003. On the following pages, you will find the money market overview and facts and figures about each Trust’s portfolio.
OVERVIEW OF FINANCIAL MARKETS
Despite attempts by the federal government to boost the economy early in the year, the economy remained mired in weakness early in the reporting period. The Federal Reserve Board (the Fed) cut short-term interest rates from 1.25% to 1% in June, the lowest level in half a century. Still, unemployment continued to rise and a record fiscal year 2003 federal budget deficit loomed on the horizon, suggesting that tax revenues were not growing fast enough to cover government spending.
Market volatility that was caused by uncertainty over the possibility of war in Iraq was followed by uncertainty over the direction and magnitude of changes in Fed policy. Mortgage refinancing and consumer spending activity remained strong despite a back-up in intermediate-term interest rates. Economic growth began picking up steam during the summer, while corporate earnings exceeded expectations. Even employment data began showing improvement in September. Indeed, there were reasons to be optimistic about the U.S. economy as the end of 2003 approached.
WELLS FARGO MONEY MARKET TRUSTS
The Fed’s decision to cut interest rates by just a quarter percentage point to 1% at its June 25, 2003 policy meeting brought interest rates down to levels not seen since the 1950s. Unfortunately, the rate cut did not meet investor expectations and interest rates were volatile through the end of the period in reaction to comments from the Fed and changing views on the outlook for economic growth. Despite a challenging environment for investors, the Wells Fargo Money Market Trusts achieved their investment objectives of maintaining a stable net asset value.
It is important to remember that no one can accurately predict the future direction of short-term interest rates. We continue to maintain a more prudent investment strategy and do not pursue strategies that seek to boost yield at the expense of safety and liquidity. We believe that the pursuit of additional yield creates volatility that can potentially undermine Trust performance during uncertain markets.
INVESTMENT STRATEGIES IN CHALLENGING TIMES
Investors are counting on reasonably good earnings growth to propel stocks higher during the balance of 2003, overcoming potential hurdles to any future rally created by seemingly “rich” valuations and by upward pressure on interest rates. With pricing power still weak throughout much of the economy, most businesses will rely on further cost cutting to propel margins enough to sustain double-digit earnings growth. Meanwhile, bond investors may insulate portfolios from a potential rise in interest rates by gradually moving away from longer-term securities as well as by investing in high coupon bonds or mortgage-backed securities that hold up better in a rising interest rate environment. Regardless of what lies ahead, investors should continue to follow the fundamentals of investing — asset allocation and diversification — in an effort to achieve their long-term financial goals.
We would like to thank you for choosing Wells Fargo Funds. We appreciate your confidence in us during this uncertain time period. Through each market cycle, we are committed to helping you meet your financial needs. If you have any questions about your investment, please contact your investment professional or call us at 1-800-222-8222. You may also visit our Web site at www.wellsfargofunds.com.
Sincerely,

Karla M. Rabusch
President
Wells Fargo Funds
1
| WELLSFARGOMONEYMARKETTRUSTS | | MONEYMARKETOVERVIEW |
|
MONEYMARKETOVERVIEW
This report covers the six-month period ended September 30, 2003.
This reporting period can be divided into two distinct segments. During the first three months of the period, interest rates moved lower as slow economic growth led many to believe that the Federal Reserve Board (the Fed) would continue its attempt to spur growth by aggressively lowering short-term interest rates. The second half of the period was characterized by rising interest rates, the result of the Fed’s interest rate cut in June not meeting investor expectations.
PRIME MONEY MARKET SECURITIES
For the first three months of the period, the yield curve flattened. Short-term money market investments (those maturing in less than three months) remained stable, while longer-term money market investments (those maturing in more than thirteen months) declined. By mid-June, the yield on one-year investments had declined 25 basis points to below 1%, while the Federal Funds rate remained near 1.25%. Despite warnings that their expectations were unrealistic, investors continued to expect a 50 basis point reduction in the Federal Funds rate in June. When the rate was lowered only 25 basis points, the market began to re-evaluate its outlook for continued regular rate cuts and the yields on longer-term money market investments began to move higher. By the end of the period, the one-year London Interbank Offered Rate (LIBOR) stood at 1.30% after peaking at 1.50% near the end of August.
The amount of commercial paper outstanding continued to decline during the period, as issuers took advantage of the record low bond yields to extend their debt. The amount of top rated commercial paper outstanding fell by more than 5% during the period, from $1.207 trillion to $1.144 trillion, reflecting a decrease of nearly 20% from the peak of $1.413 trillion in December 2000.
Credit quality also remained a concern during the reporting period. While the pace of downgrades slowed somewhat, accounting issues at some of the Government Sponsored Entities, and questions about corporate governance policies at the New York Stock Exchange, did not help to restore investor confidence in management policies, abilities, and integrity.
U.S. TREASURY SECURITIES
Although the Fed eventually did cut the Federal Funds rate by 25 basis points to 1.00%, Treasury bills had been pricing based on the assumption that there would be a 50 basis point cut. Even the one-year Treasury note traded below 0.90% in the days preceding the June rate cut. These low rates coincided with quarter-end demand pressures in June, causing the short-end of the Treasury market (less than three months) to remain overpriced for an unusually longer period of time than what typically follows a market disappointment. Eventually Treasury bill pricing became more reasonable, and the longer end of the market became relatively cheap. As budget deficit projections ballooned, expectations of a greater supply of Treasury bills and the general expectation of higher interest rates drove the price of Treasury bills into the mid 0.90’s to low 1.00’s.
Over this reporting period, the supply of Treasury bills greatly contracted: the issuance of Treasury bills for the first week of April stood at $72 billion, and declined to $44 billion by the end of the period. While the April issuance was largely due to seasonal factors, Treasury bill issuance did not meet expectations as the period progressed and Treasuries became more expensive. Evidence of this could be seen during September, when the U.S. Treasury Department had to issue cash management bills to cover a temporary cash shortfall early in the month. Continued issuance may point to the need for the Treasury to increase auction size in the coming months.
U.S. GOVERNMENT AGENCY SECURITIES
Spreads between U.S. Government agency offerings and money market securities continued to tighten during the period. Interest rates, concerns over the ability of government agencies to manage interest rate risk, losses in the Federal Home Loan Bank of New York’s bond portfolio, and an accounting scandal at the Federal Home Loan Mortgage Corporation (FHLMC) drove yields on U.S. Government agency securities higher on a relative basis. For a period in June, after the FHLMC accounting issues were made public, FHLMC discount notes traded more cheaply than A-1/P-1 bank commercial paper. Eighteen month floating rate paper from the Federal National Mortgage Association (FNMA) and FHLMC traded at similar discount margins to one-year asset-backed conduit program floaters. The number of callable issues continued to increase, but at a slower pace as rates declined in September. By the end of the period, changes in the regulation of FNMA and FHLMC seemed inevitable (although it may be a long and arduous process).
2
MONEYMARKETOVERVIEW | | WELLSFARGOMONEYMARKETTRUSTS |
|
TAX-FREE SECURITIES
The number of new municipal issues continued to increase swiftly as issuers found that it was often cheaper to issue variable rate securities than use the swap market to hedge interest rate risk. As variable rates surged to 103% of the one-month LIBOR in mid-April, the vast supply of variable rate demand notes increased, making it somewhat easier to invest the seasonal July cash inflows.
Fixed rate municipal securities were volatile during the reporting period. One-year paper started the period at 1.10% and interest rates plummeted to 0.80% at the peak of note season in late June. California was on the verge of running out of cash, as legislative parties were at odds over approving a budget. Standard and Poor’s was one of the driving forces behind breaking the stalemate by downgrading the state from A to BBB in late July. The price of California Revenue Anticipation Warrants (RAWs) plummeted as their yields skyrocketed from 1.15% to 2.00%.
Texas issued record-breaking Tax and Revenue Anticipation Notes in late August, exceeding municipal demand and splitting the one-year sector into three markets – the general market, the California market, and the Texas market. The one-year municipal securities markets finally settled down in early September as rates hovered near 1.00% for general market paper, 1.10% for Texas paper, and 1.60% for California RAWs.
STRATEGIC OUTLOOK
While the overnight interest rate has been stable, longer money market rates have increased considerably since the mid-point of the reporting period. With the U.S. economy picking up steam and the U.S. dollar weakening overseas, we believe that interest rates may continue to move higher. That increase, when accompanied by outflows from institutional investors, could trigger a challenging period for all money market funds. However, we do not believe that aggressively positioning a money market fund to boost its yield at the risk of jeopardizing its net asset value (NAV) would be appropriate, and we will continue to position the portfolios and select their investments in an ongoing effort to maintain a stable $1.00 NAV.
The views expressed are as of September 30, 2003 and are those of the Funds’ manager. The views are subject to change at any time in response to changing circumstances in the market and are not intended to predict or guarantee the future performance of any individual security, market sector or the markets generally, or the Wells Fargo Money Market Funds.
3
| WELLSFARGOMONEYMARKETTRUSTS | | MONEYMARKETOVERVIEW |
|
PRIMARY INVESTMENTS*
| | | U.S. Treasury Securities | | Repurchase Agreements | | U.S. Government Obligations | | Commercial Paper | | Certificates of Deposit/ Bankers Acceptances | | Time Deposits | | Floating/ Variable Rate Notes/Bonds | | Mortgage and Other Asset-
Backed Securities | | Corporate Notes/
Bonds | | Municipal Obligations |
| | | | | | | | | | |
Money Market | | X | | X | | X | | X | | X | | X | | X | | X | | X | | |
| | | | | | | | | | |
National Tax-Free | | | | | | | | | | | | | | | | | | | | X |
| | | | | | | | | | |
California Tax-Free | | | | | | | | | | | | | | | | | | | | X |
* The chart highlights some of the primary investments that the Trusts may make as part of their investment strategies. The chart does not identify all of the permitted investments for each Trust.
4
PERFORMANCEHIGHLIGHTS | | WELLSFARGOMONEYMARKETTRUSTS |
|
WELLSFARGOCALIFORNIATAX-FREEMONEYMARKETTRUST
INVESTMENT OBJECTIVE
The Wells Fargo California Tax-Free Money Market Trust (the Trust) seeks high current income exempt from federal income tax and California individual income tax, while preserving capital and liquidity.
TRUSTMANAGERS
Dave Sylvester
Julio Bonilla
INCEPTIONDATE
05/05/97
AVERAGE ANNUAL TOTAL RETURN1 (%) (AS OF SEPTEMBER 30, 2003)
| | | 6-Month* | | 1-Year | | 5-Year | | Life of Fund |
| | | | |
Wells Fargo California Tax-Free Money Market Trust | | 0.41 | | 0.93 | | 2.25 | | 2.47 |
| | | | |
Benchmark | | | | | | | | |
| | | | |
iMoneyNet California State Specific Institutional Money Fund Average2 | | 0.31 | | 0.75 | | 2.22 | | 2.49 |
* Returns for periods of less than one year are not annualized.
| YIELD SUMMARY (AS OF SEPTEMBER 30, 2003) | | |
|
| |
7-Day Current Yield | | 0.85% |
| |
7-Day Compound Yield | | 0.85% |
| |
30-Day Simple Yield | | 0.74% |
| |
30-Day Compound Yield | | 0.74% |
| CHARACTERISTICS3 (AS OF SEPTEMBER 30, 2003) | | |
|
| |
Average Maturity | | 50 days |
| |
Number of Holdings | | 111 |
PORTFOLIO COMPOSITION3 (AS OF SEPTEMBER 30, 2003)
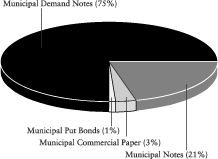
MATURITY DISTRIBUTION3 (AS OF SEPTEMBER 30, 2003)
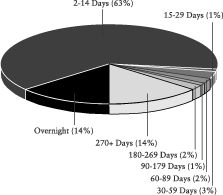
The Trust is sold without a front-end sales charge or contingent deferred sales charge. Other fees and expenses apply to a continued investment in the Trust and are described in the Trust’s Statement of Additional Information. An investment in a Wells Fargo Money Market Trust is not insured or guaranteed by the Federal Deposit Insurance Corporation or any other government agency. Although the Wells Fargo Money Market Trusts seek to preserve the value of your investment at $1.00 per share, it is possible to lose money by investing in money market funds.
1 Figures quoted represent past performance, which is no guarantee of future results. Investment returns will fluctuate. The Trust’s yield figures more closely reflect the current earnings of the Trust than the total return figures. The Trust’s Adviser has committed through July 31, 2004, to waive fees and/or reimburse expenses to the extent necessary to maintain a certain net operating expense ratio for the Trust. Actual reductions of operating expenses can increase total return to shareholders. Without these reductions, the Trust’s 7-day current yield would have been 0.84%. Performance shown for the Wells Fargo California Tax-Free Money Market Trust for periods prior to November 8, 1999, reflects performance of the Stagecoach California Tax-Free Money Market Trust, its predecessor fund. Effective at the close of business November 5, 1999, the Stagecoach Funds were reorganized into the Wells Fargo Funds.
2 The iMoneyNet California State Specific Institutional Money Fund Average is an average of California institutional state tax-free and municipal money funds.
3 Portfolio holdings and characteristics are subject to change.
5
WELLSFARGOMONEYMARKETTRUSTS | | PERFORMANCEHIGHLIGHTS |
|
WELLSFARGOMONEYMARKETTRUST
INVESTMENT OBJECTIVE
The Wells Fargo Money Market Trust (the Trust) seeks current income and stability of principal.
TRUSTMANAGERS
Dave Sylvester
Laurie White
INCEPTIONDATE
9/17/90
AVERAGE ANNUAL TOTAL RETURN1 (%) (AS OF SEPTEMBER 30, 2003)
| | | 6-Month* | | 1-Year | | 5-Year | | 10-Year |
| | | | |
Wells Fargo Money Market Trust | | 0.52 | | 1.21 | | 3.94 | | 4.56 |
| | | | |
Benchmark | | | | | | | | |
| | | | |
iMoneyNet First Tier Institutional Money Fund Average2 | | 0.41 | | 0.99 | | 4.02 | | 5.41 |
* Returns for periods of less than one year are not annualized.
| YIELD SUMMARY (AS OF SEPTEMBER 30, 2003) | | |
|
| |
7-Day Current Yield | | 0.93% |
| |
7-Day Compound Yield | | 0.94% |
| |
30-Day Simple Yield | | 0.93% |
| |
30-Day Compound Yield | | 0.93% |
| CHARACTERISTICS3 (AS OF SEPTEMBER 30, 2003) | | |
|
| |
Average Maturity | | 44 days |
| |
Number of Holdings | | 60 |
PORTFOLIO COMPOSITION3 (AS OF SEPTEMBER 30, 2003)
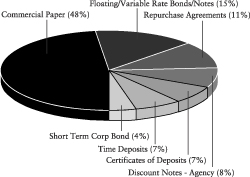
MATURITY DISTRIBUTION3 (AS OF SEPTEMBER 30, 2003)
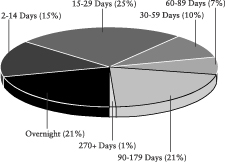
The Trust is sold without a front-end sales charge or contingent deferred sales charge. Other fees and expenses apply to a continued investment in the Trust and are described in the Trust’s Statement of Additional Information. An investment in a Wells Fargo Money Market Trust is not insured or guaranteed by the Federal Deposit Insurance Corporation or any other government agency. Although the Wells Fargo Money Market Trusts seek to preserve the value of your investment at $1.00 per share, it is possible to lose money by investing in money market funds.
1 Figures quoted represent past performance, which is no guarantee of future results. Investment returns will fluctuate. The Trust’s yield figures more closely reflect the current earnings of the Trust than the total return figures. The Trust’s Adviser has committed through July 31, 2004 to waive fees and/or reimburse expenses to the extent necessary to maintain a certain net operating expense ratio for the Trust. Actual reductions of operating expenses can increase total return to shareholders. Without these reductions, the Trust’s 7-day current yield would have been 0.93%.
Performance shown for the Wells Fargo Money Market Trust for periods prior to November 8, 1999, reflects performance of the Stagecoach Money Market Trust, its predecessor fund. Effective at the close of business November 5, 1999, the Stagecoach Funds and the Norwest Advantage Funds were reorganized into the Wells Fargo Funds.
2 The iMoneyNet First Tier Institutional Money Fund Average is an average of non-governmental institutional funds that do not hold any second tier securities. Portfolio holdings of first tier funds include U.S. Treasury securities, U.S. other securities, repos, time deposits, domestic bank obligations, foreign bank obligations, first tier commercial paper, floating rate notes and asset-backed commercial paper.
3 Portfolio holdings and characteristics are subject to change.
6
| PERFORMANCEHIGHLIGHTS | | WELLSFARGOMONEYMARKETTRUSTS |
|
WELLSFARGONATIONALTAX-FREEMONEYMARKETTRUST
INVESTMENT OBJECTIVE
The Wells Fargo National Tax-Free Money Market Trust (the Trust) seeks a high level of income exempt from federal income taxes, while preserving capital and liquidity.
TRUSTMANAGERS
Dave Sylvester
Julio Bonilla
INCEPTIONDATE
11/10/97
AVERAGE ANNUAL TOTAL RETURN1 (%) (AS OF SEPTEMBER 30, 2003)
| | | 6-Month* | | 1-Year | | 5-years | | Life of Fund |
| | | | |
Wells Fargo National Tax-Free Money Market Trust | | 0.45 | | 1.03 | | 2.55 | | 2.68 |
| | | | |
Benchmark | | | | | | | | |
| | | | |
iMoneyNet Tax-Free Institutional Money Fund Average2 | | 0.33 | | 0.79 | | 2.43 | | 2.61 |
* Returns for periods of less than one year are not annualized.
| YIELD SUMMARY (AS OF SEPTEMBER 30, 2003) | | | |
|
| |
7-Day Current Yield | | 0.95 | % |
| |
7-Day Compound Yield | | 0.96 | % |
| |
30-Day Simple Yield | | 0.81 | % |
| |
30-Day Compound Yield | | 0.82 | % |
CHARACTERISTICS3 (AS OF SEPTEMBER 30, 2003)
| |
Weighted Average Maturity | | 42 days |
| |
Number of Holdings | | 148 |
PORTFOLIO COMPOSITION3 (AS OF SEPTEMBER 30, 2003)

MATURITY DISTRIBUTION3 (AS OF SEPTEMBER 30, 2003)
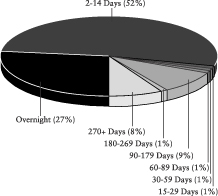
The Trust is sold without a front-end sales charge or contingent deferred sales charge. Other fees and expenses apply to a continued investment in the Trust and are described in the Trust’s Statement of Additional Information. An investment in a Wells Fargo Money Market Trust is not insured or guaranteed by the Federal Deposit Insurance Corporation or any other government agency. Although the Wells Fargo Money Market Trusts seek to preserve the value of your investment at $1.00 per share, it is possible to lose money by investing in money market funds.
1 Figures quoted represent past performance, which is no guarantee of future results. Investment returns will fluctuate. The Trust’s yield figures more closely reflect the current earnings of the Trust than the total return figures. The Trust’s Adviser has committed through July 31, 2004 to waive fees and/or reimburse expenses to the extent necessary to maintain a certain net operating expense ratio for the Trust. Actual reductions of operating expenses can increase total return to shareholders. Without these reductions, the Fund’s 7-day current yield would have been 0.95%.
Performance shown for the Wells Fargo National Tax-Free Money Market Trust for the periods prior to November 8, 1999, reflects performance of the Stagecoach National Tax-Free Money Market Trust, its predecessor fund. Effective at the close of business November 5, 1999, the Stagecoach Funds were reorganized into the Wells Fargo Funds.
2 The iMoneyNet Tax-Free Institutional Money Fund Average is an average of all national and state tax-free and institutional municipal money funds. Portfolio holdings of tax-free funds include rated and unrated demand notes, rated and unrated general market notes, commercial paper, put bonds under six months, put bonds over six months, AMT paper and other tax-free holdings. It is made up of funds in the National Tax-Free Institutional and State Specific Institutional categories.
3 Portfolio holdings and characteristics are subject to change.
7
| WELLSFARGOMONEYMARKETTRUSTS | | PORTFOLIOOFINVESTMENTS — SEPTEMBER 30, 2003 (UNAUDITED) |
|
CALIFORNIATAX-FREEMONEYMARKETTRUST
| Principal | | Security Name | | Interest Rate | | | Maturity Date | | Value |
|
| Municipal Securities – 99.81% |
| | | |
| California – 95.29% | | | | | | | | |
| | | | |
| $ | 2,400,000 | | ABAG Finance Authority For Nonprofit Corporation California Jewish Community Center Project Allied Irish Bank LOC§ | | 1.22 | % | | 11/15/2031 | | $ | 2,400,000 |
| | | | |
| | 2,000,000 | | ABAG Finance Authority For Nonprofit Corporations California Housing Revenue Series A Societe Generale LOC§ | | 1.10 | | | 07/01/2008 | | | 2,000,000 |
| | | | |
| | 2,240,000 | | Alameda-Contra Costa CA Schools Financing Authority CTFS Participation Capital Improvements Financing Projects Lease Revenue Series G AMBAC Insured§ | | 1.03 | | | 08/01/2024 | | | 2,240,000 |
| | | | |
| | 1,500,000 | | Alvord CA University School District CTFS Participation Food Services Bridge Funding Program Lease Revenue FSA Insured± | | 1.05 | | | 06/01/2037 | | | 1,500,000 |
| | | | |
| | 2,300,000 | | Alvord CA University School District Financing Corp CTFS Participation Refinancing Project Lease Revenue KBC Bank NV LOC§ | | 1.10 | | | 09/01/2019 | | | 2,300,000 |
| | | | |
| | 4,500,000 | | Bay Area Toll Authority CA Toll Bridge Revenue San Francisco Bay Area Series B§ | | 1.00 | | | 04/01/2029 | | | 4,500,000 |
| | | | |
| | 3,288,000 | | Buena Park CA MFHR Walden Glen Apartments Project Series A§ | | 1.15 | | | 02/15/2033 | | | 3,288,000 |
| | | | |
| | 3,300,000 | | California Cities Home Ownership Authority Housing Revenue Lease Purchase Program Project Series A Collateralized By FHLMC§ | | 1.10 | | | 09/01/2006 | | | 3,300,000 |
| | | | |
| | 2,000,000 | | California Communities Housing Finance Agency Lease Revenue Series A Collateralized By FHLMC§ | | 1.10 | | | 02/01/2007 | | | 2,000,000 |
| | | | |
| | 3,840,000 | | California Educational Facilities Authority Revenue Art Center Design College
Series A Allied Irish Bank PLC LOC§ | | 1.15 | | | 12/01/2032 | | | 3,840,000 |
| | | | |
| | 9,500,000 | | California Educational Facilities Authority Revenue Loyola Maramount University Series B MBIA Insured§ | | 1.10 | | | 10/01/2027 | | | 9,500,000 |
| | | | |
| | 3,100,000 | | California HFA Revenue Home Mortgage Series M§ | | 1.20 | | | 08/01/2033 | | | 3,100,000 |
| | | | |
| | 4,210,000 | | California HFA Revenue Home Mortgage Series R§ | | 1.20 | | | 08/01/2032 | | | 4,210,000 |
| | | | |
| | 985,000 | | California HFA Revenue Home Mortgage Series U§ | | 1.10 | | | 02/01/2017 | | | 985,000 |
| | | | |
| | 1,800,000 | | California HFA Revenue MFHR Series D§ | | 1.23 | | | 02/01/2031 | | | 1,800,000 |
| | | | |
| | 1,375,000 | | California HFA Revenue Series 539R FHA Insured§ | | 1.11 | | | 02/01/2005 | | | 1,375,000 |
| | | | |
| | 5,900,000 | | California HFFA Revenue Adventist Health Systems Series B KBC Bank NV LOC§ | | 1.20 | | | 09/01/2025 | | | 5,900,000 |
| | | | |
| | 2,500,000 | | California HFFA Revenue CTFS Series 26 FSA Insured§ | | 1.08 | | | 06/01/2022 | | | 2,500,000 |
| | | | |
| | 4,500,000 | | California Infrastructure & Economic Development Bank Revenue J Paul Getty Series D§ | | 1.00 | | | 04/01/2033 | | | 4,500,000 |
| | | | |
| | 2,000,000 | | California Infrastructure & Economic Development Bank Series 2002 | | 0.80 | | | 11/19/2003 | | | 2,000,000 |
| | | | |
| | 2,575,000 | | California Infrastructure & Economic Development Bank Series 2002 | | 0.80 | | | 12/09/2003 | | | 2,575,000 |
| | | | |
| | 24,000,000 | | California School Cash Reserve Program Authority Pool Series A | | 2.00 | | | 07/06/2004 | | | 24,199,791 |
| | | | |
| | 6,200,000 | | California State Department Water Reserve & Power Supply Revenue Series B-4 Bayerische Landesbank LOC§ | | 1.15 | | | 05/01/2022 | | | 6,200,000 |
| | | | |
| | 3,400,000 | | California State Department Water Reserve & Power Supply Revenue Series C-3 AMBAC Insured§ | | 1.05 | | | 05/01/2022 | | | 3,400,000 |
| | | | |
| | 3,000,000 | | California State Department Water Reserve Center Valley Project Revenue Putters Series 127 FGIC Insured§ | | 1.10 | | | 12/01/2022 | | | 3,000,000 |
| | | | |
| | 1,500,000 | | California State Economic Development Financing Authority Industrial Development Revenue Serra Microchassis Project US Bank NA LOC§ | | 1.20 | | | 08/01/2027 | | | 1,500,000 |
| | | | |
| | 3,500,000 | | California State Merlots-B 45 Wachovia Bank Insured§ | | 1.09 | | | 10/01/2029 | | | 3,500,000 |
| | | | |
| | 1,400,000 | | California State Public Works Board Lease Revenue CTFS Series D AMBAC Insured§ | | 1.11 | | | 12/01/2019 | | | 1,400,000 |
| | | | |
| | 4,700,000 | | California State Putters Series 142 FGIC Insured§ | | 1.10 | | | 12/01/2029 | | | 4,700,000 |
| | | | |
| | 8,415,000 | | California State Series C-1 Bank of America NA LOC§ | | 1.10 | | | 05/01/2033 | | | 8,415,000 |
| | | | |
| | 4,500,000 | | California Statewide CDA MFHR Canyon Country Apartments Series M Collaterlized By FHLMC§ | | 1.15 | | | 12/01/2034 | | | 4,500,000 |
| | | | |
| | 8,700,000 | | California Statewide CDA MFHR Concord Green Apartments Series S Collateralized By FHLB§ | | 1.10 | | | 06/01/2028 | | | 8,700,000 |
8
| PORTFOLIOOFINVESTMENTS — SEPTEMBER 30, 2003 (UNAUDITED) | | WELLSFARGOMONEYMARKETTRUSTS |
|
CALIFORNIATAX-FREEMONEYMARKETTRUST
| Principal | | Security Name | | Interest Rate | | | Maturity Date | | Value |
| | | |
| California (continued) | | | | | | | | |
| | | | |
| $ | 5,300,000 | | California Statewide CDA MFHR IAC Project Series W-3 Bank of America NA LOC§ | | 1.10 | % | | 04/01/2025 | | $ | 5,300,000 |
| | | | |
| | 3,500,000 | | California Statewide CDA Revenue CTFS Participation House Ear Institute
JP Morgan Chase & Company LOC§ | | 1.20 | | | 12/01/2018 | | | 3,500,000 |
| | | | |
| | 640,000 | | California Statewide CDA Revenue Fremont Rideout Health Group Series A AMBAC Insured§ | | 1.15 | | | 01/01/2031 | | | 640,000 |
| | | | |
| | 12,000,000 | | California Statewide CDA Revenue TRAN Series A-1 FSA Insured | | 2.00 | | | 06/30/2004 | | | 12,099,357 |
| | | | |
| | 200,000 | | Concord CA MFHR Bel Air Apartments Project Series A Bank of America LOC§ | | 1.10 | | | 12/01/2016 | | | 200,000 |
| | | | |
| | 8,500,000 | | Contra Cost County CA MFHR Park Regency Series A State Street B&T Company LOC§ | | 1.04 | | | 08/01/2032 | | | 8,500,000 |
| | | | |
| | 12,095,000 | | Contra Costa County CA Home Mortgage Revenue CTFS Series A§ | | 1.15 | | | 12/01/2010 | | | 12,095,000 |
| | | | |
| | 7,100,000 | | Contra Costa County CA MFHR Lafayette Town Center Apartments Series I Collateralized By FNMA§ | | 1.15 | | | 07/15/2032 | | | 7,100,000 |
| | | | |
| | 11,000,000 | | Contra Costa County CA TRAN Series A | | 2.50 | | | 11/17/2003 | | | 11,015,367 |
| | | | |
| | 6,000,000 | | Fresno CA Union School District Anticipation Notes | | 1.10 | | | 02/19/2004 | | | 6,000,093 |
| | | | |
| | 1,100,000 | | Irvine Ranch CA Water District CTFS Participation Capital Improvement Project Landesbank Baden LOC§ | | 1.15 | | | 08/01/2016 | | | 1,100,000 |
| | | | |
| | 2,700,000 | | Irvine Ranch CA Water District State Street B&T Company LOC§ | | 1.15 | | | 01/01/2021 | | | 2,700,000 |
| | | | |
| | 5,705,000 | | Kern CA High School District CTFS Series 14 MBIA Insured§ | | 1.08 | | | 02/01/2013 | | | 5,705,000 |
| | | | |
| | 2,000,000 | | Lancaster CA Redevelopment Agency MFHR 20Th Street Apartments Project Series C Collateralized By FNMA§ | | 1.10 | | | 12/01/2026 | | | 2,000,000 |
| | | | |
| | 5,400,000 | | Livermore CA MFHR Series 1989A Mortgage Remarketed Portola Meadows Project FHLMC Insured§ | | 1.10 | | | 05/01/2019 | | | 5,400,000 |
| | | | |
| | 1,580,000 | | Long Beach CA Harbor Revenue Series 418 FGIC Insured§ | | 1.13 | | | 05/15/2020 | | | 1,580,000 |
| | | | |
| | 4,000,000 | | Los Angeles CA Convention & Exhibition Center Authority Lease Revenue Series C1 AMBAC Insured§ | | 0.97 | | | 08/15/2021 | | | 4,000,000 |
| | | | |
| | 2,000,000 | | Los Angeles CA Convention & Exhibition Center Authority Lease Revenue Series D AMBAC Insured§ | | 0.97 | | | 08/15/2021 | | | 2,000,000 |
| | | | |
| | 9,200,000 | | Los Angeles CA Department of Airports Revenue Series C1 Los Angeles International Airport§ | | 1.05 | | | 05/15/2020 | | | 9,200,000 |
| | | | |
| | 5,500,000 | | Los Angeles CA GO Series A Merrill Lynch Capital Services LOC§ | | 1.11 | | | 03/01/2012 | | | 5,500,000 |
| | | | |
| | 2,700,000 | | Los Angeles CA MFHR Broadway Plaza Project Series L§ | | 1.10 | | | 12/01/2034 | | | 2,700,000 |
| | | | |
| | 2,200,000 | | Los Angeles CA MFHR Loans To Lenders Project Series B FHLB LOC§ | | 1.25 | | | 12/01/2026 | | | 2,200,000 |
| | | | |
| | 3,005,000 | | Los Angeles CA Union School District COP Multiple Properties Project Series B | | 2.25 | | | 10/01/2003 | | | 3,005,000 |
| | | | |
| | 1,700,000 | | Los Angeles CA Union School District Merlots Series A22§ | | 1.09 | | | 07/01/2022 | | | 1,700,000 |
| | | | |
| | 14,500,000 | | Los Angeles CA Union School District TRAN Series A | | 2.00 | | | 07/01/2004 | | | 14,616,151 |
| | | | |
| | 3,800,000 | | Los Angeles CA Wastewater System Sewer Revenue Series A FGIC Insured± | | 1.25 | | | 12/01/2031 | | | 3,800,000 |
| | | | |
| | 2,400,000 | | Los Angeles CA Wastewater System Sewer Revenue Series B FGIC Insured± | | 1.25 | | | 12/01/2031 | | | 2,400,000 |
| | | | |
| | 4,400,000 | | Los Angeles CA Water & Power Revenue Series 184 FSA Insured§ | | 1.10 | | | 07/01/2022 | | | 4,400,000 |
| | | | |
| | 300,000 | | Los Angeles CA Water & Power Revenue Subseries A-4§ | | 1.05 | | | 07/01/2035 | | | 300,000 |
| | | | |
| | 7,500,000 | | Los Angeles CA Water & Power Revenue Subseries B-3§ | | 1.18 | | | 07/01/2034 | | | 7,500,000 |
| | | | |
| | 7,400,000 | | Los Angeles CA Water & Power Revenue Subseries B-6§ | | 1.20 | | | 07/01/2034 | | | 7,400,000 |
| | | | |
| | 3,000,000 | | Los Angeles County CA Metropolitan Transportation Authority Revenue FSA Insured§ | | 1.11 | | | 07/01/2016 | | | 3,000,000 |
| | | | |
| | 10,000,000 | | Los Angeles County CA Metropolitan Transportation Authority Revenue FSA Insured§ | | 1.11 | | | 07/01/2025 | | | 10,000,000 |
| | | | |
| | 2,000,000 | | Los Angeles County CA MFHR Authority Revenue P Float PT 639§ | | 1.22 | | | 10/01/2031 | | | 2,000,000 |
| | | | |
| | 8,230,000 | | Los Angeles County CA Pension Obligation Series A§ | | 1.00 | | | 06/30/2007 | | | 8,230,000 |
| | | | |
| | 5,000 | | Los Angeles County CA Pension Obligation Series B§ | | 1.01 | | | 06/30/2007 | | | 5,000 |
| | | | |
| | 4,200,000 | | Los Angeles County CA Schools TRAN Series A | | 1.75 | | | 06/30/2004 | | | 4,225,759 |
9
WELLSFARGOMONEYMARKETTRUST | | PORTFOLIOOFINVESTMENTS — SEPTEMBER 30, 2003 (UNAUDITED) |
|
CALIFORNIATAX-FREEMONEYMARKETTRUST
| Principal | | Security Name | | Interest Rate | | | Maturity Date | | Value |
| | | |
| California (continued) | | | | | | | | |
| | | | |
| $ | 1,000,000 | | Metropolitan Water District Southern CA Waterworks Revenue Merlots A21§ | | 1.09 | % | | 07/01/2021 | | $ | 1,000,000 |
| | | | |
| | 2,900,000 | | Metropolitan Water District Southern CA Waterworks Revenue Series B-3§ | | 1.15 | | | 07/01/2035 | | | 2,900,000 |
| | | | |
| | 4,400,000 | | Modesto CA Irrigation District Financing Authority Revenue Series SG66 MBIA Insured§ | | 1.14 | | | 10/01/2015 | | | 4,400,000 |
| | | | |
| | 6,250,000 | | Msr Public Power Agency CA Utility Tax Revenue San Juan Project Series F MBIA Insured§ | | 1.20 | | | 07/01/2022 | | | 6,250,000 |
| | | | |
| | 2,000,000 | | Msr Public Power Agency CA Utility Tax Revenue San Juan Project Series II R 134 MBIA Insured§ | | 1.11 | | | 07/01/2013 | | | 2,000,000 |
| | | | |
| | 2,500,000 | | Newport Beach CA Revenue Hoag Memorial Hospital Series C§ | | 1.23 | | | 10/01/2026 | | | 2,500,000 |
| | | | |
| | 1,000,000 | | Orange County CA Apartment Development Revenue Hidden Hills Project Series C§ | | 1.10 | | | 11/01/2009 | | | 1,000,000 |
| | | | |
| | 5,800,000 | | Orange County CA Apartment Development Revenue Issue G Series 2 FNMA LOC§ | | 1.10 | | | 11/15/2028 | | | 5,800,000 |
| | | | |
| | 4,600,000 | | Orange County CA Apartment Development Revenue Series B Aliso Creek Project FHLMC LOC§ | | 1.05 | | | 11/01/2022 | | | 4,600,000 |
| | | | |
| | 2,495,000 | | Orange County CA Recovery COF Series 128 MBIA Insured§ | | 1.08 | | | 07/01/2019 | | | 2,495,000 |
| | | | |
| | 8,230,000 | | Orange County CA Sanitation Districts COP AMBAC Insured§ | | 1.05 | | | 08/01/2013 | | | 8,230,000 |
| | | | |
| | 14,000,000 | | Palo Alto CA USD Series II R 93§ | | 1.11 | | | 08/01/2016 | | | 14,000,000 |
| | | | |
| | 3,900,000 | | Port of Oakland CA Series D | | 0.80 | | | 10/08/2003 | | | 3,900,000 |
| | | | |
| | 4,500,000 | | Port of Oakland CA Series D | | 0.80 | | | 10/14/2003 | | | 4,500,000 |
| | | | |
| | 3,600,000 | | Port of Oakland CA Series D | | 0.80 | | | 10/15/2003 | | | 3,600,000 |
| | | | |
| | 1,600,000 | | Riverside San Bernadino CA Housing & Finance Agency Lease Revenue Series A Societe Generale LOC§ | | 1.10 | | | 07/01/2006 | | | 1,600,000 |
| | | | |
| | 3,000,000 | | Sacramento County CA HFA MFHR Arlington Creek Apartment Series 1 Collateralized By FNMA§ | | 1.15 | | | 05/15/2034 | | | 3,000,000 |
| | | | |
| | 400,000 | | Sacramento County CA MFHR Suncreek Apartments Project Series A§ | | 1.10 | | | 04/01/2026 | | | 400,000 |
| | | | |
| | 3,200,000 | | Sacramento County CA Sanitation District Financing Authority Revenue Subordinate Lien Sacramento Regulation C Credit Agricole Indosuez LOC§ | | 1.05 | | | 12/01/2030 | | | 3,200,000 |
| | | | |
| | 5,870,000 | | San Mateo County CA TRAN District Sales Tax Revenue Floater PT 1914 FSA Insured§ | | 1.11 | | | 12/01/2007 | | | 5,870,000 |
| | | | |
| | 15,000,000 | | San Diego CA County & School District Revenue Anticipation Notes Series A | | 1.75 | | | 06/30/2004 | | | 15,094,241 |
| | | | |
| | 10,400,000 | | San Diego CA MFHR Collateralized By FHLMC§ | | 1.13 | | | 09/01/2004 | | | 10,400,000 |
| | | | |
| | 1,275,000 | | San Diego CA Union School District Series PA-804§ | | 1.11 | | | 07/01/2022 | | | 1,275,000 |
| | | | |
| | 3,500,000 | | San Francisco CA City & County Redevelopment Agency MFHR Namiki Apartments Project Series C Citibank NA LOC§ | | 1.10 | | | 11/01/2036 | | | 3,500,000 |
| | | | |
| | 6,000,000 | | San Jose CA MFHR Evans Lane Apartments Project Series H Bank of America NA LOC§ | | 1.10 | | | 04/15/2036 | | | 6,000,000 |
| | | | |
| | 2,000,000 | | San Jose CA MFHR Series A FNMA Insured§ | | 1.12 | | | 03/01/2032 | | | 2,000,000 |
| | | | |
| | 7,800,000 | | San Jose CA Mortgage Revenue Somerset Park Project Collateralized By FHLMC§ | | 1.10 | | | 11/01/2017 | | | 7,800,000 |
| | | | |
| | 1,000,000 | | San Jose CA Redevelopment Agency Tax Allocation CTFS Series 149 MBIA Insured§ | | 1.13 | | | 08/01/2027 | | | 1,000,000 |
| | | | |
| | 7,520,000 | | San Jose CA Redevelopment Agency Tax Allocation ROC RR II-R-201 MBIA Insured§ | | 1.11 | | | 08/01/2032 | | | 7,520,000 |
| | | | |
| | 2,000,000 | | Santa Barbara County CA TRAN Series A | | 2.00 | | | 07/23/2004 | | | 2,019,255 |
| | | | |
| | 8,505,000 | | Sonoma County CA TRAN | | 2.50 | | | 10/14/2003 | | | 8,507,878 |
| | | | |
| | 9,000,000 | | South Orange County CA PFA Special Tax Revenue Series 146§ | | 1.10 | | | 08/15/2015 | | | 9,000,000 |
| | | | |
| | 9,350,000 | | Southeast Resource Recovery Facilities Authority Lease Revenue Refunding Bonds Series B§ | | 1.04 | | | 12/01/2018 | | | 9,350,000 |
| | | | |
| | 1,105,000 | | Turlock CA Irrigation District COP Capital Improvement Project Societe Generale LOC§ | | 1.20 | | | 01/01/2031 | | | 1,105,000 |
| | | | |
| | 3,200,000 | | Union City CA MFHR Housing Mission Sierra Series A§ | | 1.10 | | | 07/15/2029 | | | 3,200,000 |
| | | | |
| | 1,695,000 | | University CA Education Facilities Revenue Series 479 MBIA Insured§ | | 1.13 | | | 09/01/2022 | | | 1,695,000 |
10
| PORTFOLIOOFINVESTMENTS — SEPTEMBER 30, 2003 (UNAUDITED) | | WELLSFARGOMONEYMARKETTRUSTS |
|
CALIFORNIATAX-FREEMONEYMARKETTRUST
| Principal | | Security Name | | Interest Rate | | | Maturity Date | | Value |
| | | |
| California (continued) | | | | | | | | |
| | | | |
| $ | 3,100,000 | | University CA Education Facilities Revenue Series 480 MBIA Insured§ | | 1.13 | % | | 09/01/2022 | | $ | 3,100,000 |
| | | | |
| | 2,900,000 | | Vacaville CA MFHR Quail Run Project Series A§ | | 1.05 | | | 07/15/2018 | | | 2,900,000 |
| | | | |
| | | | | | | | | | | | 495,155,892 |
| | | | | | | | | | |
|
|
| | | |
| Other – 3.16% | | | | | | | | |
| | | | |
| | 5,000,000 | | ABN AMRO Munitops CTFS Tr 1998-20 Munitops Certificates AMBAC Insured§ | | 1.13 | | | 07/05/2006 | | | 5,000,000 |
| | | | |
| | 2,680,000 | | ABN AMRO Munitops CTFS Tr 2000-5 Munitops Certificates FGIC Insured§ª | | 1.16 | | | 05/07/2008 | | | 2,680,000 |
| | | | |
| | 8,743,853 | | Newman Capital Trust Series 2000-1 Class A§ | | 1.19 | | | 04/01/2032 | | | 8,743,853 |
| | | | |
| | | | | | | | | | | | 16,423,853 |
| | | | | | | | | | |
|
|
| | | |
| Puerto Rico – 1.36% | | | | | | | | |
| | | | |
| | 2,500,000 | | Eagle Tax-Exempt Trust CTF 20015101 Class A (Puerto Rico Commonwealth Infrastructure Financing Authority Series A)§ | | 1.11 | | | 10/01/2034 | | | 2,500,000 |
| | | | |
| | 4,575,000 | | Eagle Tax-Exempt Trust CTF 20025102 Class A (Puerto Rico Commonwealth Highway & Transportation Revenue Series D) FSA Insured§ | | 1.11 | | | 07/01/2027 | | | 4,575,000 |
| | | | |
| | | | | | | | | | | | 7,075,000 |
| | | | | | | | | | |
|
|
| | | |
Total Municipal Securities (Cost $518,654,745) | | | | | | | | 518,654,745 |
| | | | | | | | | | |
|
|
| | | |
Total Investments In Securities
(Cost $518,654,745)* | | 99.81 | % | | | | $ | 518,654,745 |
| | | |
Other Assets And Liabilities, Net | | 0.19 | | | | | | 972,577 |
| | |
|
| | | |
|
|
| Total Net Assets | | 100.00 | % | | | | $ | 519,627,322 |
| | |
|
| | | |
|
|
| * | | Cost for federal income tax purposes is substantially the same as for financial reporting purposes. |
| ª | | Securities that may be resold to “Qualified institutional buyers” under rule 144A or securities offered pursuant to section 4(2) of the Securities Act of 1933, as amended. These securities have been determined to be liquid by the Adviser based on procedures approved by the Board of Trustees. |
| § | | These variable rate securities are subject to a demand feature which reduces the remaining maturity. |
| ± | | Variable Rate Securities. |
The accompanying notes are an integral part of these financial statements.
11
WELLSFARGOMONEYMARKETTRUSTS | | PORTFOLIOOFINVESTMENTS — SEPTEMBER 30, 2003 (UNAUDITED) |
|
MONEYMARKETTRUST
| Principal | | Security Name | | Interest Rate | | | Maturity Date | | Value |
| | | |
| Certificates of Deposit – 7.16% | | | | | | | | |
| | | | |
| $ | 10,000,000 | | Abbey National Treasury Services plc | | 1.40 | % | | 03/02/2004 | | $ | 10,000,000 |
| | | | |
| | 30,000,000 | | Credit Agricole Indosuez | | 1.03 | | | 10/03/2003 | | | 30,000,000 |
| | | | |
| | 30,000,000 | | Svenska Handelsbanken | | 1.18 | | | 12/03/2003 | | | 29,995,025 |
| | | | |
| | 10,000,000 | | Svenska Handelsbanken | | 1.40 | | | 03/02/2004 | | | 10,000,000 |
| | | | |
| | 15,000,000 | | Unicredito Italiano SPA | | 1.04 | | | 10/17/2003 | | | 14,999,584 |
| | | | |
| | 25,000,000 | | Unicredito Italiano SPA | | 1.04 | | | 10/20/2003 | | | 25,000,000 |
| | | |
Total Certificates Of Deposit (Cost $119,994,609) | | | | | | | | 119,994,609 |
| | | | | | | | | | |
|
|
| | | |
| Commercial Paper – 46.58% | | | | | | | | |
| | | | |
| | 35,000,000 | | Allied Irish Banks North America Incorporated | | 1.04 | † | | 12/15/2003 | | | 34,924,167 |
| | | | |
| | 30,000,000 | | Amstel Funding Corporationª | | 0.94 | † | | 12/29/2003 | | | 29,930,283 |
| | | | |
| | 35,445,000 | | Atlantis One Funding Corporationª | | 1.26 | † | | 10/16/2003 | | | 35,426,391 |
| | | | |
| | 20,000,000 | | Atlantis One Funding Corporationª | | 1.06 | † | | 01/27/2004 | | | 19,930,511 |
| | | | |
| | 20,000,000 | | Banco Bilbao Vizcaya Argentaria Puerto Ricoª | | 1.25 | † | | 10/01/2003 | | | 20,000,000 |
| | | | |
| | 25,000,000 | | Beta Finance Incorporatedª | | 1.11 | † | | 03/15/2004 | | | 24,872,042 |
| | | | |
| | 25,000,000 | | CC (USA) Incorporatedª | | 1.05 | † | | 10/27/2003 | | | 24,981,042 |
| | | | |
| | 20,000,000 | | CDC Commercial Paper Corporationª | | 1.15 | † | | 10/01/2003 | | | 20,000,000 |
| | | | |
| | 27,000,000 | | Concord Minuteman Capital Company LLCª | | 1.28 | † | | 10/08/2003 | | | 26,993,280 |
| | | | |
| | 20,000,000 | | Concord Minuteman Capital Company LLCª | | 1.10 | † | | 11/18/2003 | | | 19,970,667 |
| | | | |
| | 25,000,000 | | Crown Point Capital Company LLCª | | 1.09 | † | | 11/18/2003 | | | 24,963,667 |
| | | | |
| | 20,000,000 | | Crown Point Capital Company LLCª | | 1.12 | † | | 01/16/2004 | | | 19,933,422 |
| | | | |
| | 25,000,000 | | Govco Incorporatedª | | 1.07 | † | | 10/03/2003 | | | 24,998,514 |
| | | | |
| | 13,000,000 | | Governor & Company of The Bank of Irelandª | | 1.21 | † | | 02/06/2004 | | | 12,944,071 |
| | | | |
| | 50,000,000 | | HBOs Treasury Services plc | | 1.04 | † | | 10/02/2003 | | | 49,998,562 |
| | | | |
| | 30,000,000 | | Holdenby Capital Company LLCª | | 1.07 | † | | 10/23/2003 | | | 29,980,383 |
| | | | |
| | 17,327,000 | | Holdenby Capital Company LLCª | | 1.10 | † | | 10/29/2003 | | | 17,312,176 |
| | | | |
| | 25,000,000 | | Irish Life & Permanent plcª | | 1.16 | † | | 02/09/2004 | | | 24,894,472 |
| | | | |
| | 30,000,000 | | KBC Financial Products International Limitedª | | 1.08 | † | | 11/12/2003 | | | 29,962,200 |
| | | | |
| | 45,000,000 | | Lexington Parker Capital Corporationª | | 1.13 | † | | 02/27/2004 | | | 44,789,538 |
| | | | |
| | 15,000,000 | | Liquid Funding Limitedª | | 1.04 | † | | 10/21/2003 | | | 14,991,333 |
| | | | |
| | 35,000,000 | | Liquid Funding Limitedª | | 1.08 | † | | 10/27/2003 | | | 34,972,700 |
| | | | |
| | 50,000,000 | | National Bank of New Zealand International Limitedª | | 1.04 | † | | 10/07/2003 | | | 49,991,333 |
| | | | |
| | 45,000,000 | | Nordea North America Incorporated | | 1.08 | † | | 12/29/2003 | | | 44,879,850 |
| | | | |
| | 23,476,000 | | Perry Global Funding Limitedª | | 1.07 | † | | 11/06/2003 | | | 23,450,881 |
| | | | |
| | 38,632,000 | | Regency Markets Number 1 LLCª | | 1.10 | † | | 10/24/2003 | | | 38,604,850 |
| | | | |
| | 9,709,000 | | Transamerica Asset Funding Corporationª | | 1.08 | † | | 10/21/2003 | | | 9,703,175 |
| | | | |
| | 27,500,000 | | White Pine Finance LLCª | | 1.05 | † | | 11/10/2003 | | | 27,467,917 |
| | | |
Total Commercial Paper (Cost $780,867,427) | | | | | | | | 780,867,427 |
| | | | | | | | | | |
|
|
| | | |
| Corporate Bonds – 5.97% | | | | | | | | |
| | | | |
| | 50,000,000 | | ING Security Life Institutional Funding±ª | | 1.14 | | | 10/08/2004 | | | 50,000,000 |
| | | | |
| | 50,000,000 | | Restructured Asset Securities Enhanced Returns Series 2002-7-MM±ª | | 1.32 | | | 10/25/2004 | | | 50,000,000 |
| | | |
Total Corporate Bonds (Cost $100,000,000) | | | | | | | | 100,000,000 |
| | | | | | | | | | |
|
|
12
| PORTFOLIOOFINVESTMENTS — SEPTEMBER 30, 2003 (UNAUDITED) | | WELLSFARGOMONEYMARKETTRUSTS |
|
MONEYMARKETTRUST
| Principal | | Security Name | | Interest Rate | | | Maturity Date | | Value |
| | | |
| Discount Notes – Agency – 5.69% | | | | | | | | |
| | | |
| Federal Home Loan Bank – 0.81% | | | | | | | | |
| | | | |
| $ | 13,600,000 | | FHLB | | 1.25 | %† | | 11/03/2003 | | $ | 13,584,417 |
| | | | | | | | | | |
|
|
| | | |
| Federal National Mortgage Association – 4.88% | | | | | | | | |
| | | | |
| | 32,112,160 | | FNMA | | 1.11 | † | | 01/02/2004 | | | 32,020,078 |
| | | | |
| | 50,000,000 | | FNMA | | 1.07 | † | | 01/21/2004 | | | 49,833,556 |
| | | | |
| | | | | | | | | | | | 81,853,634 |
| | | | | | | | | | |
|
|
| | | |
Total Discount Notes – Agency (Cost $95,438,051) | | | | | | | | 95,438,051 |
| | | | | | | | | | |
|
|
| | | |
| Fixed Rate Notes – Corporate – 1.49% | | | | | | | | |
| | | | |
| | 15,000,000 | | Liberty Lighthouse US Capital Companyª | | 1.40 | | | 08/16/2004 | | | 14,999,346 |
| | | | |
| | 10,000,000 | | Links Finance LLC | | 2.00 | | | 10/10/2003 | | | 10,000,000 |
| |
Total Fixed Rate Notes – Corporate (Cost $24,999,346) | | | 24,999,346 |
| | | | | | | | | | |
|
|
| | | |
| Floating Rate Funding Agreement – 1.19% | | | | | | | | |
| | | | |
| | 20,000,000 | | Bear Stearns Companies Incorporated± | | 1.11 | | | 04/05/2004 | | | 19,998,984 |
| | | |
Total Floating Rate Funding Agreement (Cost $19,998,984) | | | | | | | | 19,998,984 |
| | | | | | | | | | |
|
|
| | | |
| Floating Rate Not – Agency – 2.09% | | | | | | | | |
| | | |
| Federal Home Loan Mortgage Corporation – 2.09% | | | | | | | | |
| | | | |
| | 35,000,000 | | FHLMC± | | 1.04 | | | 02/04/2005 | | | 34,976,518 |
| | | |
Total Floating Rate Note – Agency (Cost $34,976,518) | | | | | | | | 34,976,518 |
| | | | | | | | | | |
|
|
| | | |
| Floating Rate Notes – Corporate – 11.68% | | | | | | | | |
| | | | |
| | 10,000,000 | | American Express Centurion Bank± | | 1.12 | | | 12/23/2003 | | | 10,000,000 |
| | | | |
| | 25,000,000 | | Dorada Finance Incorporated±ª | | 1.08 | | | 03/17/2004 | | | 24,998,852 |
| | | | |
| | 16,000,000 | | John Hancock Global Funding II±ª | | 1.13 | | | 12/10/2003 | | | 15,999,718 |
| | | | |
| | 35,000,000 | | Liberty Lighthouse US Capital Company±ª | | 1.10 | | | 07/19/2004 | | | 34,997,215 |
| | | | |
| | 25,000,000 | | Northern Rock plc±ª | | 1.14 | | | 01/16/2004 | | | 25,000,000 |
| | | | |
| | 30,000,000 | | Northern Rock plc±ª | | 1.13 | | | 02/11/2004 | | | 29,874,758 |
| | | | |
| | 20,000,000 | | Premium Asset Trust Series 2003-1±ª | | 1.19 | | | 02/28/2004 | | | 20,000,000 |
| | | | |
| | 15,000,000 | | Strategic Money Market Trust Series 2002-M±ª | | 1.17 | | | 12/15/2003 | | | 15,000,000 |
| | | | |
| | 20,000,000 | | Tango Finance Corporation±ª | | 1.12 | | | 12/15/2003 | | | 20,000,000 |
| | | |
Total Floating Rate Notes – Corporate (Cost $195,870,543) | | | | | | | | 195,870,543 |
| | | | | | | | | | |
|
|
| | | |
| Promissory Notes – 1.01% | | | | | | | | |
| | | | |
| | 7,000,000 | | Goldman Sachs Group Incorporated± | | 1.15 | | | 07/26/2004 | | | 7,000,000 |
| | | | |
| | 10,000,000 | | Goldman Sachs Group Incorporated± | | 1.19 | | | 07/26/2004 | | | 10,000,000 |
| | | |
Total Promissory Notes (Cost $17,000,000) | | | | | | | | 17,000,000 |
| | | | | | | | | | |
|
|
| | | |
| Repurchase Agreements – 11.35% | | | | | | | | |
| | | | |
| | 70,000,000 | | Bear Stearns & Company Incorporated – 102% Collateralized by US Government Securities | | 1.13 | | | 10/01/2003 | | | 70,000,000 |
| | | | |
| | 85,193,000 | | Credit Suisse First Boston – 102% Collaterized by US Government Securities | | 1.13 | | | 10/01/2003 | | | 85,193,000 |
| | | | |
| | 35,000,000 | | Goldman Sachs Group Incorporated – 102% Collaterized by US Government Securities | | 1.16 | | | 10/01/2003 | | | 35,000,000 |
| | | |
Total Repurchase Agreements (Cost $190,193,000) | | | | | | | | 190,193,000 |
| | | | | | | | | | |
|
|
13
WELLSFARGOMONEYMARKETTRUSTS | | PORTFOLIOOFINVESTMENTS — SEPTEMBER 30, 2003 (UNAUDITED) |
|
MONEYMARKETTRUST
| Principal | | Security Name | | Interest Rate | | | Maturity Date | | Value |
| | | |
| Time Deposits – 7.46% | | | | | | | | |
| | | | |
| $ | 25,000,000 | | Banque Nationale de Paris | | 1.16 | % | | 10/01/2003 | | $ | 25,000,000 |
| | | | |
| | 50,000,000 | | ING Bank Brussels | | 1.18 | | | 10/01/2003 | | | 50,000,000 |
| | | | |
| | 50,000,000 | | Rabobank Nederland Utrecht | | 1.16 | | | 10/01/2003 | | | 50,000,000 |
| | | |
Total Time Deposits (Cost $125,000,000) | | | | | | | | 125,000,000 |
| | | | | | | | | | |
|
|
| | | |
Total Investments In Securities
(Cost $1,704,338,478)* | | 101.67 | % | | | | $ | 1,704,338,478 | |
| | | |
Other Assets And Liabilities, Net | | (1.67 | ) | | | | | (27,965,986 | ) |
| | |
|
| | | |
|
|
|
| Total Net Assets | | 100.00 | % | | | | $ | 1,676,372,492 | |
| | |
|
| | | |
|
|
|
| * | | Cost for federal income tax purposes is substantially the same as for financial reporting purposes. |
| ± | | Variable Rate Securities. |
| ª | | Securities that may be resold to “Qualified institutional buyers” under rule 144A or securities offered pursuant to section 4(2) of the Securities Act of 1933, as amended. These securities have been determined to be liquid by the Adviser based on procedures approved by the Board of Trustees. |
The accompanying notes are an integral part of these financial statements.
14
| PORTFOLIOOFINVESTMENTS — SEPTEMBER 30, 2003 (UNAUDITED) | | WELLSFARGOMONEYMARKETTRUSTS |
|
NATIONALTAX-FREEMONEYMARKETTRUST
| Principal | | Security Name | | Interest Rate | | | Maturity Date | | Value |
| | | |
| Municipal Securities – 99.78% | | | | | | | | |
| | | |
| Alabama – 0.30% | | | | | | | | |
| | | | |
| $ | 1,250,000 | | Scottsboro AL Water Sewer & Gas Revenue AMBAC Insured§ | | 6.50 | % | | 12/01/2014 | | $ | 1,338,761 |
| | | | | | | | | | |
|
|
| | | |
| Alaska – 2.48% | | | | | | | | |
| | | | |
| | 935,000 | | Alaska IDA Revenue Providence Medical Office Building Associates Project KBC Bank NV LOC§ | | 0.95 | | | 06/01/2010 | | | 935,000 |
| | | | |
| | 10,000,000 | | Valdez AK Marine Terminal Revenue BP Pipelines Incorporated Project Series B§ | | 1.20 | | | 07/01/2037 | | | 10,000,000 |
| | | | |
| | | | | | | | | | | | 10,935,000 |
| | | | | | | | | | |
|
|
| | | |
| Arizona – 1.52% | | | | | | | | |
| | | | |
| | 4,000,000 | | Arizona School District Tax Anticipation Notes Financing Program CTFS Participation | | 1.75 | | | 07/30/2004 | | | 4,024,627 |
| | | | |
| | 465,000 | | Maricopa County AZ IDA SFMR§ | | 1.18 | | | 09/01/2005 | | | 465,000 |
| | | | |
| | 2,200,000 | | Salt River Project AZ Agriculture Improvement & Power District Electric System Revenue Salt River Project Series A | | 5.00 | | | 01/01/2004 | | | 2,221,445 |
| | | | |
| | | | | | | | | | | | 6,711,072 |
| | | | | | | | | | |
|
|
| | | |
| California – 3.54% | | | | | | | | |
| | | | |
| | 1,000,000 | | California Higher Education Loan Authority Incorporated Student Loan Revenue Series A State Street B&T Company LOC | | 1.05 | | | 07/01/2005 | | | 1,000,000 |
| | | | |
| | 500,000 | | Metropolitan Water District Southern CA Waterworks Revenue Series B-3§ | | 0.80 | | | 07/01/2035 | | | 500,000 |
| | | | |
| | 11,000,000 | | San Bernardino County CA TRAN | | 1.50 | | | 07/01/2004 | | | 11,057,151 |
| | | | |
| | 2,550,000 | | Southeast Resource Recovery Facilities Authority Lease Revenue Refunding Bonds Series B§ | | 1.04 | | | 12/01/2018 | | | 2,550,000 |
| | | | |
| | 500,000 | | Vacaville CA MFHR Quail Run Project Series A§ | | 1.05 | | | 07/15/2018 | | | 500,000 |
| | | | |
| | | | | | | | | | | | 15,607,151 |
| | | | | | | | | | |
|
|
| | | |
| Colorado – 1.43% | | | | | | | | |
| | | | |
| | 2,000,000 | | Arvada County CO Water Enterprises Revenue FSA Insured§ | | 1.15 | | | 11/01/2020 | | | 2,000,000 |
| | | | |
| | 4,300,000 | | Boulder County CO MFHR Cloverbasin Village Apartments Project§ | | 1.80 | | | 12/25/2031 | | | 4,300,000 |
| | | | |
| | | | | | | | | | | | 6,300,000 |
| | | | | | | | | | |
|
|
| | | |
| Florida – 2.95% | | | | | | | | |
| | | | |
| | 6,200,000 | | Alachua County FL Health Facilities Authority Oak Hammock University of Florida Project Series A§ | | 1.20 | | | 10/01/2032 | | | 6,200,000 |
| | | | |
| | 525,000 | | Escambia County FL HFA SFMR CTFS Series B§ | | 1.15 | | | 10/01/2009 | | | 525,000 |
| | | | |
| | 2,300,000 | | Escambia County FL HFA SFMR CTFS Series C§ | | 1.20 | | | 10/01/2032 | | | 2,300,000 |
| | | | |
| | 2,950,000 | | Orange County FL IDA Industrial Development Revenue Central Florida YMCA Project Series A Bank of America NA LOC§ | | 1.15 | | | 05/01/2027 | | | 2,950,000 |
| | | | |
| | 1,000,000 | | Orlando FL Utilities Commission Water and Electric Revenue Series B | | 5.25 | | | 10/01/2023 | | | 1,010,000 |
| | | | |
| | | | | | | | | | | | 12,985,000 |
| | | | | | | | | | |
|
|
| | | |
| Georgia – 7.56% | | | | | | | | |
| | | | |
| | 3,000,000 | | Cobb County GA Tax Anticipated Notes | | 1.50 | | | 12/31/2003 | | | 3,003,476 |
| | | | |
| | 4,600,000 | | Georgia Local Government CTFS Participation Series K§ | | 1.18 | | | 06/01/2028 | | | 4,600,000 |
| | | | |
| | 12,100,000 | | Georgia Municipal Gas Authority Gas Revenue Gas Portfolio II Project C Wachovia Bank LOC§ | | 1.10 | | | 01/01/2008 | | | 12,100,000 |
| | | | |
| | 5,600,000 | | Gwinnett County GA Development Authority Revenue Civic & Cultural Center Project Landesbank Hessen LOC§ | | 1.05 | | | 09/01/2031 | | | 5,600,000 |
15
WELLSFARGOMONEYMARKETTRUSTS | | PORTFOLIOOFINVESTMENTS — SEPTEMBER 30, 2003 (UNAUDITED) |
|
NATIONALTAX-FREEMONEYMARKETTRUST
| Principal | | Security Name | | Interest Rate | | | Maturity Date | | Value |
| | | |
| Georgia (continued) | | | | | | | | |
| | | | |
| $ | 8,000,000 | | Gwinnett County GA School District Construction Sales Tax Notes | | 2.00 | % | | 12/29/2003 | | $ | 8,017,768 |
| | | | |
| | | | | | | | | | | | 33,321,244 |
| | | | | | | | | | |
|
|
| | | |
| Hawaii – 1.04% | | | | | | | | |
| | | | |
| | 1,800,000 | | Honolulu HI City & County Tax Revenue Series B FGIC Insured | | 6.13 | | | 06/01/2004 | | | 1,907,014 |
| | | | |
| | 2,700,000 | | Honolulu HI City & County Tax Revenue Series C FGIC Insured§ | | 1.30 | | | 12/05/2008 | | | 2,700,000 |
| | | | |
| | | | | | | | | | | | 4,607,014 |
| | | | | | | | | | |
|
|
| | | |
| Idaho – 2.26% | | | | | | | | |
| | | | |
| | 1,900,000 | | Idaho Housing & Financial Assistance Housing Revenue Balmoral Apartments II Development Project US Bank NA LOC§ | | 1.25 | | | 04/01/2033 | | | 1,900,000 |
| | | | |
| | 8,000,000 | | Idaho State Tax Anticipation Notes | | 2.00 | | | 06/30/2004 | | | 8,071,025 |
| | | | |
| | | | | | | | | | | | 9,971,025 |
| | | | | | | | | | |
|
|
| | | |
| Illinois – 11.27% | | | | | | | | |
| | | | |
| | 2,300,000 | | Chicago IL Sales Tax Revenue Series SG 131 FGIC Insured§ | | 1.13 | | | 01/01/2027 | | | 2,300,000 |
| | | | |
| | 3,000,000 | | Chicago IL SFMR Floats PT 290 Collateralized By GNMA FNMA FHLMC§ | | 1.18 | | | 09/01/2010 | | | 3,000,000 |
| | | | |
| | 1,300,000 | | Chicago IL Skyway Toll Bridge Revenue§ | | 6.75 | | | 01/01/2017 | | | 1,343,825 |
| | | | |
| | 1,000,000 | | Cook County IL High School District No 205 Thornton Township Series B FSA Insured | | 2.60 | | | 12/01/2003 | | | 1,002,067 |
| | | | |
| | 1,000,000 | | Eagle Tax-Exempt Trust CTF 20021304 Class A (Illinois State) FGIC Insured§ | | 1.15 | | | 02/01/2027 | | | 1,000,000 |
| | | | |
| | 5,500,000 | | Eagle Tax-Exempt Trust CTF 20021306 Class A (Chicago IL Park District Series D) FGIC Insured§ | | 1.15 | | | 01/01/2029 | | | 5,500,000 |
| | | | |
| | 1,700,000 | | Elgin IL Industrial Development Revenue Gemini Mouldings Project Lasalle Bank NA LOC§ | | 1.18 | | | 12/01/2028 | | | 1,700,000 |
| | | | |
| | 2,720,000 | | Elgin IL Industrial Development Revenue Nelson Graphic Incorporated Project Lasalle Bank NA LOC§ | | 1.18 | | | 05/01/2020 | | | 2,720,000 |
| | | | |
| | 1,900,000 | | Elmhurst IL Industrial Development Revenue John Sakash Company Incorporated Project Lasalle Bank NA LOC§ | | 1.18 | | | 02/01/2025 | | | 1,900,000 |
| | | | |
| | 849,000 | | Illinois Development Finance Authority Revenue Uhlich Childrens Home Project American National B&T LOC§ | | 1.10 | | | 06/01/2015 | | | 849,000 |
| | | | |
| | 2,800,000 | | Illinois Educational Facilities Authority Revenue Newberry Library Northern Trust Company LOC§ | | 1.10 | | | 03/01/2028 | | | 2,800,000 |
| | | | |
| | 200,000 | | Illinois Educational Facilities Authority Revenue St Xavier University Project Series A Lasalle Bank NA LOC§ | | 1.13 | | | 10/01/2032 | | | 200,000 |
| | | | |
| | 1,000,000 | | Illinois Health Facilities Authority Revenue Illinois Masonic Medical Center§ | | 5.50 | | | 10/01/2019 | | | 1,020,000 |
| | | | |
| | 400,000 | | Illinois Health Facilities Authority Revenue Memorial Medical Center Series C Kredietbank NV LOC§ | | 1.10 | | | 01/01/2016 | | | 400,000 |
| | | | |
| | 12,300,000 | | Illinois Health Facilities Authority Revenue Northwestern Memorial Hospital§ | | 1.20 | | | 08/15/2025 | | | 12,300,000 |
| | | | |
| | 2,400,000 | | Illinois Health Facilities Authority Revenue Northwestern Memorial Hospital Series B Westdeutsche Landesbank LOC§ | | 1.20 | | | 08/15/2009 | | | 2,400,000 |
| | | | |
| | 2,500,000 | | Illinois Health Facilities Authority Revenue Northwestern Memorial Hospital Series C Westdeutsche Landesbank LOC§ | | 1.20 | | | 08/15/2032 | | | 2,500,000 |
| | | | |
| | 3,000,000 | | Illinois Health Facilities Authority Revenue Silver Cross Hospital & Medical Series A Fifth Third Bank LOC§ | | 1.14 | | | 08/15/2026 | | | 3,000,000 |
| | | | |
| | 1,300,000 | | Illinois State CTFS Series G§ | | 1.16 | | | 05/01/2015 | | | 1,300,000 |
| | | | |
| | 200,000 | | Illinois State Sales Tax Revenue Municipal Trust Receipts Series SG-9§ | | 1.13 | | | 06/15/2019 | | | 200,000 |
| | | | |
| | 2,235,000 | | Will County IL School District #122New Lenox GO Series II-R-114 FGIC Insured§ | | 1.15 | | | 11/01/2020 | | | 2,235,000 |
| | | | |
| | | | | | | | | | | | 49,669,892 |
| | | | | | | | | | |
|
|
16
| PORTFOLIOOFINVESTMENTS — SEPTEMBER 30, 2003 (UNAUDITED) | | WELLSFARGOMONEYMARKETTRUSTS |
|
NATIONALTAX-FREEMONEYMARKETTRUST
| Principal | | Security Name | | Interest Rate | | | Maturity Date | | Value |
| | | |
| Indiana – 6.05% | | | | | | | | |
| | | | |
| $ | 1,245,000 | | Indiana HFFA Revenue Fayette Memorial Hospital Association Series A US Bank NA LOC§ | | 1.25 | % | | 10/01/2032 | | $ | 1,245,000 |
| | | | |
| | 5,000,000 | | Indiana Hospital Equipment Financing Authority Revenue Series A MBIA Insured§ | | 1.05 | | | 12/01/2015 | | | 5,000,000 |
| | | | |
| | 1,000,000 | | Indiana Secondary Market Educational Loans Incorporated Student Loan Revenue Series B AMBAC Insured§ | | 1.10 | | | 12/01/2013 | | | 1,000,000 |
| | | | |
| | 1,800,000 | | Indiana State Educational Facilities Authority Revenue St Mary Project Bank One Indiana NA LOC§ | | 1.15 | | | 02/15/2026 | | | 1,800,000 |
| | | | |
| | 10,000,000 | | Indiana State Office Building Commission Facilities Revenue Merlots Series B17 MBIA Insured§ | | 1.15 | | | 07/01/2023 | | | 10,000,000 |
| | | | |
| | 4,500,000 | | Indiana Transportation Finance Authority Toll Road Lease Revenue Roc Series II-R-105 AMBAC Insured§ | | 1.15 | | | 07/01/2012 | | | 4,500,000 |
| | | | |
| | 3,100,000 | | Whiting IN Environmental Facilities Revenue BP Products Project Series C§ | | 1.25 | | | 07/01/2034 | | | 3,100,000 |
| | | | |
| | | | | | | | | | | | 26,645,000 |
| | | | | | | | | | |
|
|
| | | |
| Iowa – 0.46% | | | | | | | | |
| | | | |
| | 2,000,000 | | Iowa State School Cash Anticipation Program Iowa School Corporations CTFS Series B FSA Insured | | 2.25 | | | 01/30/2004 | | | 2,007,683 |
| | | | | | | | | | |
|
|
| | | |
| Kentucky – 0.30% | | | | | | | | |
| | | | |
| | 1,265,000 | | Louisville & Jefferson County KY Metropolitan Sewer District Sewer and Drain System Series A | | 9.00 | | | 05/15/2004 | | | 1,326,240 |
| | | | | | | | | | |
|
|
| | | |
| Louisiana – 3.41% | | | | | | | | |
| | | | |
| | 1,225,000 | | Jefferson Parish LA Home Mortgage Authority Floats PT 229 Collateralized By GNMA FNMA§ | | 1.18 | | | 06/01/2007 | | | 1,225,000 |
| | | | |
| | 2,300,000 | | Plaquemines LA Port Harbor & Terminal District Port Facilities Revenue International Marine Term Project Series B Kreditbank NV LOC§ | | 1.10 | | | 03/15/2006 | | | 2,300,000 |
| | | | |
| | 4,500,000 | | Plaquemines LA Port Harbor & Terminal District Port Facilities Revenue International Marine Terminal Project Series A Kredietbank NV LOC§ | | 1.10 | | | 03/15/2006 | | | 4,500,000 |
| | | | |
| | 7,000,000 | | Plaquemines Parish LA Environmental Revenue BP Exploration & Oil Inc Project§ | | 1.25 | | | 10/01/2024 | | | 7,000,000 |
| | | | |
| | | | | | | | | | | | 15,025,000 |
| | | | | | | | | | |
|
|
| | | |
| Maine – 1.12% | | | | | | | | |
| | | | |
| | 4,900,000 | | Maine State Tax Anticipation Notes | | 1.75 | | | 06/30/2004 | | | 4,934,414 |
| | | | | | | | | | |
|
|
| | | |
| Massachusetts – 0.35% | | | | | | | | |
| | | | |
| | 1,525,000 | | Massachusetts State Central Artery Series A§ | | 1.20 | | | 12/01/2030 | | | 1,525,000 |
| | | | | | | | | | |
|
|
| | | |
| Michigan – 3.71% | | | | | | | | |
| | | | |
| | 2,265,000 | | Detroit MI Sewer Disposal Revenue Merlots Series B41 FSA Insured§ | | 0.85 | | | 07/01/2026 | | | 2,265,000 |
| | | | |
| | 3,095,000 | | Detroit MI Sewer Disposal Revenue Series II-R-103 FGIC Insured§ | | 1.15 | | | 07/01/2026 | | | 3,095,000 |
| | | | |
| | 2,540,000 | | Lake Orion MI Community School District GO Series 11-R-27 AMBAC Insured§ | | 1.15 | | | 05/01/2012 | | | 2,540,000 |
| | | | |
| | 2,195,000 | | Michigan Higher Education Student Loan Authority Revenue Putters Series 238§ | | 1.17 | | | 06/01/2019 | | | 2,195,000 |
| | | | |
| | 3,950,000 | | Michigan State Strategic Fund Limited Obligation Revenue Detroit Symphony Project Series B Michigan National Bank LOC§ | | 1.20 | | | 06/01/2031 | | | 3,950,000 |
| | | | |
| | 2,300,000 | | Michigan State Strategic Funding Limited Obligation Revenue Consumers Power Company Project Series A§ | | 1.20 | | | 06/15/2010 | | | 2,300,000 |
| | | | |
| | | | | | | | | | | | 16,345,000 |
| | | | | | | | | | |
|
|
| | | |
| Minnesota – 4.57% | | | | | | | | |
| | | | |
| | 745,000 | | Arden Hills MN Housing & Healthcare Facilities Revenue Presbyterian Homes Series B US Bank NA LOC§ | | 1.25 | | | 09/01/2029 | | | 745,000 |
17
WELLSFARGOMONEYMARKETTRUSTS | | PORTFOLIOOFINVESTMENTS — SEPTEMBER 30, 2003 (UNAUDITED) |
|
NATIONALTAX-FREEMONEYMARKETTRUST
| Principal | | Security Name | | Interest Rate | | | Maturity Date | | Value |
| | | |
| Minnesota (continued) | | | | | | | | |
| | | | |
| $ | 25,000 | | Burnsville MN MFHR Berkshire Project Series A Collateralized By FNMA§ | | 1.10 | % | | 07/15/2030 | | $ | 25,000 |
| | | | |
| | 250,000 | | Crystal MN MFHR Crystal Apartments Project Collateralized By FHLB§ | | 1.05 | | | 05/01/2027 | | | 250,000 |
| | | | |
| | 600,000 | | Dakota County MN Housing & Redevelopment Authority MFHR PT 484 Collateralized By FHLMC§ | | 1.14 | | | 12/01/2022 | | | 600,000 |
| | | | |
| | 660,000 | | Duluth MN Economic Development Authority Health Care Facilities Revenue Miller-Dwan Medical Center Project US Bank NA LOC§ | | 1.25 | | | 06/01/2019 | | | 660,000 |
| | | | |
| | 1,800,000 | | Edina MN MFHR Edina Park Plaza Collateralized By FHLMC§ | | 1.05 | | | 12/01/2029 | | | 1,800,000 |
| | | | |
| | 550,000 | | Minnesota Public Facilities Authority Water PCR Merlots 2003-B06§ | | 1.15 | | | 03/01/2021 | | | 550,000 |
| | | | |
| | 1,000,000 | | Minnesota Rural Water Finance Authority Series B | | 2.38 | | | 12/15/2003 | | | 1,002,083 |
| | | | |
| | 6,805,000 | | Minnesota State Higher Education Facilities Authority Revenue St Thomas University Series 5L§ | | 1.07 | | | 04/01/2027 | | | 6,805,000 |
| | | | |
| | 1,140,000 | | Rochester MN MFHR§ | | 1.22 | | | 07/15/2031 | | | 1,140,000 |
| | | | |
| | 500,000 | | St Paul MN Housing & Redevelopment Authority District Heating Revenue Series A§ | | 1.05 | | | 12/01/2012 | | | 500,000 |
| | | | |
| | 1,385,000 | | St Paul MN Housing & Redevelopment Authority Revenue Minnesota Public Radio Project Allied Irish Bank PLC LOC§ | | 1.25 | | | 05/01/2022 | | | 1,385,000 |
| | | | |
| | 475,000 | | St Paul MN Port Authority District Cooling Revenue Series M Dexia Bank LOC§ | | 1.25 | | | 03/01/2021 | | | 475,000 |
| | | | |
| | 200,000 | | St Paul MN Port Authority District Cooling Revenue Series R Dexia Credit Local de France LOC§ | | 1.30 | | | 03/01/2022 | | | 200,000 |
| | | | |
| | 4,010,000 | | St Paul MN Port Authority Tax Increment Revenue Westgate Office & Industrial Center Project US Bank Trust NA LOC§ | | 1.10 | | | 02/01/2015 | | | 4,010,000 |
| | | | |
| | | | | | | | | | | | 20,147,083 |
| | | | | | | | | | |
|
|
| | | |
| Mississippi – 1.64% | | | | | | | | |
| | | | |
| | 5,200,000 | | Jackson County MS Port Facility Revenue Chevron USA Incorporated Project§ | | 1.20 | | | 06/01/2023 | | | 5,200,000 |
| | | | |
| | 340,000 | | Mississippi Home Corporation SFMR Series 146 GNMA FNMA Insured§ | | 1.18 | | | 11/01/2029 | | | 340,000 |
| | | | |
| | 1,700,000 | | Mississippi Hospital Equipment & Facilities Authority Revenue North Misssssippi Health Services Series 1§ | | 1.05 | | | 05/15/2030 | | | 1,700,000 |
| | | | |
| | | | | | | | | | | | 7,240,000 |
| | | | | | | | | | |
|
|
| | | |
| Montana – 0.98% | | | | | | | | |
| | | | |
| | 1,500,000 | | Montana State Board of Investments Municipal Finance Construction Act-Intercap Program§ | | 1.35 | | | 03/01/2009 | | | 1,500,000 |
| | | | |
| | 1,325,000 | | Montana State Board of Investments Municipal Finance Construction-Intercap Program§ | | 1.35 | | | 03/01/2005 | | | 1,325,000 |
| | | | |
| | 1,500,000 | | Montana State Board of Investments Municipal Finance Construction-Intercap Program§ | | 1.35 | | | 03/01/2010 | | | 1,500,000 |
| | | | |
| | | | | | | | | | | | 4,325,000 |
| | | | | | | | | | |
|
|
| | | |
| Nebraska – 0.57% | | | | | | | | |
| | | | |
| | 2,500,000 | | Nebraska Educational Finance Authority Revenue Creighton University Project§ | | 1.20 | | | 03/01/2033 | | | 2,500,000 |
| | | | | | | | | | |
|
|
| | | |
| Nevada – 0.29% | | | | | | | | |
| | | | |
| | 1,300,000 | | Clark County NV Roc Rr Series II-R-1035 MBIA Insured§ | | 1.15 | | | 06/01/2021 | | | 1,300,000 |
| | | | | | | | | | |
|
|
| | | |
| North Carolina – 0.94% | | | | | | | | |
| | | | |
| | 4,130,000 | | University of North Carolina Hospital Chapel Hill Revenue Series B§ | | 1.22 | | | 02/15/2031 | | | 4,130,000 |
| | | | | | | | | | |
|
|
| | | |
| North Dakota – 1.14% | | | | | | | | |
| | | | |
| | 5,000,000 | | North Dakota Rural Water Financial Corporation | | 2.50 | | | 11/01/2003 | | | 5,003,765 |
| | | | | | | | | | |
|
|
18
| PORTFOLIOOFINVESTMENTS — SEPTEMBER 30, 2003 (UNAUDITED) | | WELLSFARGOMONEYMARKETTRUSTS |
|
NATIONALTAX-FREEMONEYMARKETTRUST
| Principal | | Security Name | | Interest Rate | | | Maturity Date | | Value |
| | | |
| Ohio – 2.16% | | | | | | | | |
| | | | |
| $ | 2,000,000 | | Hamilton County OH Hospital Facilities Revenue Elizabeth Gamble Series B JP Morgan Chase & Company LOC§ | | 1.10 | % | | 06/01/2027 | | $ | 2,000,000 |
| | | | |
| | 1,000,000 | | Ohio State Building Authority Adult Correctional Building Fund Series A MBIA Insured§ | | 5.75 | | | 10/01/2005 | | | 1,020,000 |
| | | | |
| | 6,495,000 | | Sunamerica Trust Variable State§ | | 1.19 | | | 07/01/2041 | | | 6,495,000 |
| | | | |
| | | | | | | | | | | | 9,515,000 |
| | | | | | | | | | |
|
|
| | | |
| Oregon – 0.62% | | | | | | | | |
| | | | |
| | 500,000 | | Deschutes County OR Series A FSA Insured | | 5.00 | | | 06/15/2004 | | | 514,526 |
| | | | |
| | 1,250,000 | | Gilliam County OR Solid Waste Disposal Revenue Waste Management Incorporated Project JP Morgan Chase Bank LOC§ | | 1.15 | | | 07/01/2027 | | | 1,250,000 |
| | | | |
| | 949,500 | | Portland TN Health & Education Facilities Board Hospital Revenue Series 322§ | | 1.23 | | | 11/15/2014 | | | 949,500 |
| | | | |
| | | | | | | | | | | | 2,714,026 |
| | | | | | | | | | |
|
|
| | | |
| Other – 3.40% | | | | | | | | |
| | | | |
| | 3,733,920 | | MBIA Capital Corporation Global Funding MBIA Insured§ | | 1.23 | | | 01/14/2016 | | | 3,733,920 |
| | | | |
| | 2,000,000 | | Munimae Trust Collaterized By FHLMC§ | | 1.22 | | | 12/19/2005 | | | 2,000,000 |
| | | | |
| | 1,000,000 | | Newman Capital Trust Series 2001-2 Class A§ | | 1.24 | | | 04/11/2033 | | | 1,000,000 |
| | | | |
| | 718,258 | | Pitney Bowes Credit Corporation Leasetops Tr Revenue Series 2002-1 | | 1.44 | | | 07/19/2006 | | | 718,258 |
| | | | |
| | 1,550,000 | | Roaring Fork Municipal Products Limited Liability Corporation Series 2000-14
Class A§ | | 1.19 | | | 06/01/2005 | | | 1,550,000 |
| | | | |
| | 5,490,000 | | Roaring Fork Municipal Products Limited Liability Corporation Series 2002-5
Class A§ | | 1.19 | | | 11/01/2034 | | | 5,490,000 |
| | | | |
| | 506,195 | | Roaring Fork Municipal Products Limited Liability Corporation Series 2002-6
Class A§ | | 1.19 | | | 06/01/2034 | | | 506,195 |
| | | | |
| | | | | | | | | | | | 14,998,373 |
| | | | | | | | | | |
|
|
| | | |
| Pennsylvania – 2.18% | | | | | | | | |
| | | | |
| | 9,600,000 | | Pennsylvania State Higher Education Assistance Agency Student Loan Revenue
Series A AMBAC Insured§ | | 1.05 | | | 12/01/2025 | | | 9,600,000 |
| | | | | | | | | | |
|
|
| | | |
| Rhode Island – 0.91% | | | | | | | | |
| | | | |
| | 3,995,000 | | Rhode Island Refunding Board Authority State Public Projects Revenue§ | | 1.13 | | | 08/01/2005 | | | 3,995,000 |
| | | | | | | | | | |
|
|
| | | |
| South Carolina – 2.91% | | | | | | | | |
| | | | |
| | 11,300,000 | | Charleston County SC School District Anticipated Notes | | 2.00 | | | 02/25/2004 | | | 11,340,478 |
| | | | |
| | 1,465,000 | | Eagle Tax-Exempt Trust CTF 20004001 Class A (South Carolina State Public Service Authority Revenue Series A) MBIA Insured§ | | 1.15 | | | 01/01/2022 | | | 1,465,000 |
| | | | |
| | | | | | | | | | | | 12,805,478 |
| | | | | | | | | | |
|
|
| | | |
| Tennessee – 4.81% | | | | | | | | |
| | | | |
| | 1,925,000 | | Clarksville TN Public Building Authority Revenue Pooled Financing Tennessee Municipal Bond Funding Bank of America NA LOC§ | | 1.22 | | | 07/01/2031 | | | 1,925,000 |
| | | | |
| | 5,900,000 | | Clarksville TN Public Building Authority Revenue Pooled Financing Tennessee Municipal Bond Funding Bank of America NA LOC§ | | 1.22 | | | 01/01/2033 | | | 5,900,000 |
| | | | |
| | 2,000,000 | | Eagle Tax-Exempt Trust CTF 20004202 Class A (Chattanooga TN Industrial Development Board Lease Rent Revenue) AMBAC Insured§ | | 1.15 | | | 10/01/2027 | | | 2,000,000 |
| | | | |
| | 7,400,000 | | Jackson TN Energy Authority Wastewater System Revenue FSA Insured§ | | 1.10 | | | 12/01/2022 | | | 7,400,000 |
| | | | |
| | 3,200,000 | | Montgomery County TN Public Building Authority Pooled Financing Revenue Tennessee County Loan Pool§ | | 1.22 | | | 04/01/2032 | | | 3,200,000 |
19
WELLSFARGOMONEYMARKETTRUSTS | | PORTFOLIOOFINVESTMENTS — SEPTEMBER 30, 2003 (UNAUDITED) |
|
NATIONALTAX-FREEMONEYMARKETTRUST
| Principal | | Security Name | | Interest Rate | | | Maturity Date | | Value |
| | | |
| Tennessee (continued) | | | | | | | | |
| | | | |
| $ | 780,000 | | Tennessee Housing Development Agency Series H§ | | 1.21 | % | | 01/01/2021 | | $ | 780,000 |
| | | | |
| | | | | | | | | | | | 21,205,000 |
| | | | | | | | | | |
|
|
| | | |
| Texas – 8.95% | | | | | | | | |
| | | | |
| | 1,800,000 | | Austin TX Utility Systems Revenue Series A MBIA Insured | | 5.50 | | | 11/15/2003 | | | 1,809,583 |
| | | | |
| | 970,000 | | Brownsville TX Utility Systems Revenue Series A MBIA Insured§ | | 1.05 | | | 09/01/2027 | | | 970,000 |
| | | | |
| | 4,100,000 | | Eagle Tax-Exempt Trust CTF 20024301 Class A (Ector County TX Independent School District) PSFG Insured§ | | 1.15 | | | 08/15/2021 | | | 4,100,000 |
| | | | |
| | 9,232,500 | | Harris County TX Health Facilities Development Corporation Revenue Floater CTFS Series 357 MBIA Insured§ | | 1.14 | | | 07/01/2029 | | | 9,232,500 |
| | | | |
| | 2,770,000 | | Harris County TX Houston Sports Authority Special Revenue Jr Lien Rodeo Series C MBIA Insured§ | | 1.10 | | | 11/15/2030 | | | 2,770,000 |
| | | | |
| | 4,245,000 | | Houston TX Independent School District CTFS Series 462 PSFG Insured§ | | 1.14 | | | 02/15/2026 | | | 4,245,000 |
| | | | |
| | 1,000,000 | | North Central TX Health Facilities Development Corporation Revenue Dallas Jewish Community Foundation Allied Irish Bank plc LOC§ | | 1.12 | | | 12/01/2030 | | | 1,000,000 |
| | | | |
| | 3,495,000 | | North Texas Highway Authority Dallas North Highway System Revenue§ | | 1.15 | | | 01/01/2016 | | | 3,495,000 |
| | | | |
| | 2,500,000 | | Pasadena TX Independent School District | | 2.25 | | | 02/15/2004 | | | 2,510,227 |
| | | | |
| | 1,060,000 | | Polly Ryon Hospital Authority TX Polly Ryon Memorial Hospital JP Morgan Chase & Company LLC§ | | 1.10 | | | 11/01/2026 | | | 1,060,000 |
| | | | |
| | 2,100,000 | | Texas A & M University Notes Series 3 A2 | | 1.25 | | | 01/27/2004 | | | 2,101,873 |
| | | | |
| | 2,100,000 | | Texas A & M University Notes Series 3 A2 | | 1.25 | | | 01/29/2004 | | | 2,101,900 |
| | | | |
| | 4,000,000 | | Texas State TRAN | | 2.00 | | | 08/31/2004 | | | 4,030,776 |
| | | | |
| | | | | | | | | | | | 39,426,859 |
| | | | | | | | | | |
|
|
| | | |
| Utah – 2.81% | | | | | | | | |
| | | | |
| | 10,200,000 | | Utah State Board of Regents Student Loan Revenue Series 1997R AMBAC Insured§ | | 1.10 | | | 11/01/2031 | | | 10,200,000 |
| | | | |
| | 2,200,000 | | Utah Transportation Authority Sales Tax Revenue Series B Bayerishe Landesbank LOC§ | | 1.05 | | | 09/01/2032 | | | 2,200,000 |
| | | | |
| | | | | | | | | | | | 12,400,000 |
| | | | | | | | | | |
|
|
| | | |
| Virginia – 1.65% | | | | | | | | |
| | | | |
| | 5,200,000 | | Loudoun County VA IDA Howard Hughes Medical Project Series A§ | | 0.80 | | | 02/15/2038 | | | 5,200,000 |
| | | | |
| | 1,000,000 | | Virginia Beach VA GO | | 5.00 | | | 07/15/2004 | | | 1,032,623 |
| | | | |
| | 1,000,000 | | Virginia State Transportation Board Transportation Contract Revenue Northern Virginia Transportation District Project Series A§ | | 6.25 | | | 05/15/2017 | | | 1,057,151 |
| | | | |
| | | | | | | | | | | | 7,289,774 |
| | | | | | | | | | |
|
|
| | | |
| Washington – 4.81% | | | | | | | | |
| | | | |
| | 4,640,000 | | Energy Northwest Washington Electric Revenue Floats PA 846 FSA Insured§ | | 1.14 | | | 01/01/2010 | | | 4,640,000 |
| | | | |
| | 2,600,000 | | Everett WA Bank of America NA LOC§ | | 1.15 | | | 12/01/2021 | | | 2,600,000 |
| | | | |
| | 1,075,000 | | Snohomish County WA School District School Board Guaranty LOC | | 5.25 | | | 12/01/2003 | | | 1,082,484 |
| | | | |
| | 4,920,000 | | Washington State Economic Development Financing Authority Revenue Pioneer Human Services Project H§ | | 1.25 | | | 09/01/2018 | | | 4,920,000 |
| | | | |
| | 1,600,000 | | Washington State Housing Finance Community MFHR Country Club Apartments Series A US Bank NA LOC§ | | 1.30 | | | 08/01/2032 | | | 1,600,000 |
| | | | |
| | 3,550,000 | | Washington State Housing Finance Community MFHR Summer Ridge Apartments Project Series A US Bank NA LOC§ | | 1.30 | | | 12/01/2029 | | | 3,550,000 |
| | | | |
| | 1,800,000 | | Washington State Housing Finance Community Nonprofit Revenue Tacoma Art Museum Project Northern Trust Company LOC§ | | 1.25 | | | 06/01/2032 | | | 1,800,000 |
20
| PORTFOLIOOFINVESTMENTS — SEPTEMBER 30, 2003 (UNAUDITED) | | WELLSFARGOMONEYMARKETTRUSTS |
|
NATIONALTAX-FREEMONEYMARKETTRUST
| Principal | | Security Name | | Interest Rate | | | Maturity Date | | Value |
| | | | |
| $ | 1,000,000 | | Yakima County WA Public Corporation Revenue Valley Processing Project Bank of America NA LOC§ | | 1.20 | % | | 02/01/2015 | | $ | 1,000,000 |
| | | | |
| | | | | | | | | | | | 21,192,484 |
| | | | | | | | | | |
|
|
| | | |
| Wisconsin – 4.69% | | | | | | | | |
| | | | |
| | 6,500,000 | | Wisconsin Housing & Economic Development Authority Home Ownership Revenue Series I FSA Insured§ | | 1.10 | | | 09/01/2032 | | | 6,500,000 |
| | | | |
| | 4,965,000 | | Wisconsin Housing & Economic Development Authority Housing Revenue Series F§ | | 1.14 | | | 11/01/2033 | | | 4,965,000 |
| | | | |
| | 2,400,000 | | Wisconsin State Health & Educational Facilities Authority Revenue Alverno College Project§ | | 1.25 | | | 11/01/2017 | | | 2,400,000 |
| | | | |
| | 2,100,000 | | Wisconsin State Health & Educational Facilities Authority Revenue Gundersen Lutheran Series B§ | | 1.20 | | | 12/01/2029 | | | 2,100,000 |
| | | | |
| | 4,700,000 | | Wisconsin State Health & Educational Facilities Authority Revenue Prohealth Incorporated Series B§ | | 1.20 | | | 08/15/2030 | | | 4,700,000 |
| | | | |
| | | | | | | | | | | | 20,665,000 |
| | | | | | | | | | |
|
|
| | |
Total Municipal Securities (Cost $439,707,338) | | | | | 439,707,338 |
| | | | | | | | | | |
|
|
| | | |
Total Investments In Securities
(Cost $439,707,338)* | | 99.78 | % | | | | $ | 439,707,338 |
| | | |
Other Assets and Liabilities, Net | | 0.22 | | | | | | 980,450 |
| | |
|
| | | |
|
|
| Total Net Assets | | 100.00 | % | | | | $ | 440,687,788 |
| | |
|
| | | |
|
|
| * | | Cost for federal income tax purposes is substantially the same as for financial reporting purposes. |
| § | | These variable rate securities are subject to a demand feature which reduces the remaining maturity. |
The accompanying notes are an integral part of these financial statements.
21
WELLSFARGOMONEYMARKETTRUSTS | | STATEMENTSOFASSETSANDLIABILITIES — SEPTEMBER 30, 2003 (UNAUDITED) |
|
| | | California Tax-Free
Money Market Trust | | Money Market Trust | | National Tax-Free
Money Market Trust | |
|
| | | |
ASSETS | | | | | | | | | | |
| | | |
INVESTMENTS: | | | | | | | | | | |
In securities, at amortized cost | | $ | 518,654,745 | | $ | 1,514,145,478 | | $ | 439,707,338 | |
Repurchase Agreements, at cost | | | 0 | | | 190,193,000 | | | 0 | |
| | |
|
| |
|
| |
|
|
|
TOTALINSECURITIES,ATMARKETVALUE | | $ | 518,654,745 | | $ | 1,704,338,478 | | $ | 439,707,338 | |
| | |
|
| |
|
| |
|
|
|
Cash | | | 127,922 | | | 50,159 | | | 78,437 | |
Receivable for dividends and interest and other receivables | | | 1,484,823 | | | 997,982 | | | 1,395,424 | |
Receivable for investments sold | | | 0 | | | 4,900,000 | | | 0 | |
| | |
|
| |
|
| |
|
|
|
TOTALASSETS | | | 520,267,490 | | | 1,710,286,619 | | | 441,181,199 | |
| | |
|
| |
|
| |
|
|
|
| | | |
LIABILITIES | | | | | | | | | | |
Payable for investment purchased | | | 0 | | | 32,020,078 | | | 0 | |
Dividends Payable | | | 383,949 | | | 1,246,302 | | | 325,582 | |
Payable for investment adviser and affiliates (Note 3) | | | 93,079 | | | 270,207 | | | 69,404 | |
Payable to other related parties (1) | | | 1,741 | | | 2,557 | | | 1,619 | |
Accrued expenses and other liabilities | | | 161,399 | | | 374,983 | | | 96,806 | |
| | |
|
| |
|
| |
|
|
|
TOTALLIABILITIES | | | 640,168 | | | 33,914,127 | | | 493,411 | |
| | |
|
| |
|
| |
|
|
|
TOTALNETASSETS | | $ | 519,627,322 | | $ | 1,676,372,492 | | $ | 440,687,788 | |
| | |
|
| |
|
| |
|
|
|
| | | |
NETASSETSCONSISTOF: | | | | | | | | | | |
|
Paid-in capital | | $ | 519,609,102 | | $ | 1,676,237,164 | | $ | 440,690,961 | |
Undistributed (overdistributed) net investment income | | | 0 | | | 0 | | | 182 | |
Undistributed net realized gain (loss) on investments | | | 18,220 | | | 135,328 | | | (3,355 | ) |
| | |
|
| |
|
| |
|
|
|
TOTALNETASSETS | | $ | 519,627,322 | | $ | 1,676,372,492 | | $ | 440,687,788 | |
| | |
|
| |
|
| |
|
|
|
|
COMPUTATIONOFNETASSETVALUEANDOFFERINGPRICEPERSHARE |
|
Net assets | | $ | 519,627,322 | | $ | 1,676,372,492 | | $ | 440,687,788 | |
Shares outstanding | | | 519,596,430 | | | 1,676,315,484 | | | 440,684,400 | |
Net asset value and offering price per share | | $ | 1.00 | | $ | 1.00 | | $ | 1.00 | |
| | |
|
| |
|
| |
|
|
|
| (1) | | Other related parties include the Funds’ trustees and distributor. |
| The | | accompanying notes are an integral part of these financial statements. |
22
| STATEMENTS OF OPERATIONS — FOR THE SIX MONTHS ENDED SEPTEMBER 30, 2003 (UNAUDITED) | | WELLSFARGOMONEYMARKETTRUSTS |
|
| | | California Tax-Free
Money Market Trust | | | Money Market Trust | | | National Tax-Free
Money Market Trust | |
|
| | | |
INVESTMENTINCOME | | | | | | | | | | | | |
Interest | | $ | 3,837,351 | | | $ | 10,594,990 | | | $ | 3,098,432 | |
| | |
|
|
| |
|
|
| |
|
|
|
TOTALINVESTMENTINCOME | | | 3,837,351 | | | | 10,594,990 | | | | 3,098,432 | |
| | |
|
|
| |
|
|
| |
|
|
|
| | | |
NETEXPENSES | | | | | | | | | | | | |
Administration fees | | | 636,567 | | | | 1,465,651 | | | | 476,259 | |
Custody | | | 74,890 | | | | 172,430 | | | | 56,030 | |
Portfolio accounting fees | | | 31,370 | | | | 59,169 | | | | 25,995 | |
Legal and audit fees | | | 16,992 | | | | 17,493 | | | | 16,992 | |
Registration fees | | | 12,302 | | | | 60,855 | | | | 21,423 | |
Directors’ fees | | | 3,195 | | | | 3,195 | | | | 3,195 | |
Shareholder reports | | | 13,639 | | | | 26,953 | | | | 7,332 | |
Other | | | 6,974 | | | | 11,171 | | | | 4,274 | |
| | |
|
|
| |
|
|
| |
|
|
|
TOTALEXPENSES | | | 795,929 | | | | 1,816,917 | | | | 611,500 | |
| | |
|
|
| |
|
|
| |
|
|
|
| | | |
LESS: | | | | | | | | | | | | |
Waived fees and reimbursed expenses (Note 3) | | | (43,038 | ) | | | (93,256 | ) | | | (48,076 | ) |
Net expenses | | | 752,891 | | | | 1,723,661 | | | | 563,424 | |
| | |
|
|
| |
|
|
| |
|
|
|
NETINVESTMENTINCOME | | | 3,084,460 | | | | 8,871,329 | | | | 2,535,008 | |
| | |
|
|
| |
|
|
| |
|
|
|
Net Realized Gain (Loss) from Investments | | | (6,008 | ) | | | (2,491 | ) | | | (15,465 | ) |
| | |
|
|
| |
|
|
| |
|
|
|
NETINCREASE (DECREASE)INNETASSETSRESULTINGFROMOPERATIONS | | $ | 3,078,452 | | | $ | 8,868,838 | | | $ | 2,519,543 | |
| | |
|
|
| |
|
|
| |
|
|
|
The accompanying notes are an integral part of these financial statements.
23
| WELLSFARGOMONEYMARKETTRUSTS | | STATEMENTSOFCHANGESINNETASSETS |
|
| | | CALIFORNIATAX-FREE
MONEYMARKETTRUST
| |
| | | (Unaudited)
For the
Six Months Ended
September 30, 2003 | | | For the
Year Ended
March 31, 2003 | |
|
| | |
INCREASEINNETASSETS | | | | | | | | |
Beginning net assets | | $ | 830,713,076 | | | $ | 852,775,197 | |
| | |
OPERATIONS: | | | | | | | | |
Net investment income | | | 3,084,460 | | | | 9,805,790 | |
Net realized gain (loss) on sale of investments | | | (6,008 | ) | | | 55,520 | |
| | |
|
|
| |
|
|
|
NETINCREASE (DECREASE)INNETASSETSRESULTINGFROMOPERATIONS | | | 3,078,452 | | | | 9,861,310 | |
| | |
|
|
| |
|
|
|
| | |
Distributions to shareholders: | | | | | | | | |
From net investment income | | | (3,084,460 | ) | | | (9,805,790 | ) |
From net realized gain on sales of investments | | | 0 | | | | (10,633 | ) |
| | |
Capital shares transactions: | | | | | | | | |
Proceeds from shares sold | | | 932,994,088 | | | | 2,130,059,731 | |
Reinvestment of dividends | | | 87,080 | | | | 277,634 | |
Cost of shares redeemed | | | (1,244,160,914 | ) | | | (2,152,444,373 | ) |
| | |
|
|
| |
|
|
|
| | |
NETINCREASE (DECREASE)INNETASSETSRESULTINGFROMCAPITALSHARETRANSACTIONS | | | (311,079,746 | ) | | | (22,107,008 | ) |
| | |
|
|
| |
|
|
|
NETINCREASE (DECREASE)INNETASSETS | | | (311,085,754 | ) | | | (22,062,121 | ) |
| | |
|
|
| |
|
|
|
| | |
NETASSETS: | | | | | | | | |
|
| | |
ENDINGNETASSETS | | $ | 519,627,322 | | | $ | 830,713,076 | |
| | |
Shares Issued and Redeemed: | | | | | | | | |
Shares sold | | | 932,994,089 | | | | 2,130,059,223 | |
Shares issued in reinvestment of dividends | | | 87,080 | | | | 277,634 | |
Shares redeemed | | | (1,244,160,915 | ) | | | (2,152,444,373 | ) |
| | |
|
|
| |
|
|
|
NETINCREASE (DECREASE)INSHARESOUTSTANDING | | | (311,079,746 | ) | | | (22,107,516 | ) |
| | |
|
|
| |
|
|
|
ENDINGBALANCEOFUNDISTRIBUTEDNETINVESTMENTINCOME | | $ | 0 | | | $ | 0 | |
| | |
|
|
| |
|
|
|
The accompanying notes are an integral part of these financial statements.
24
STATEMENTSOFCHANGESINNETASSETS | | WELLSFARGOMONEYMARKETTRUSTS |
|
MONEYMARKETTRUST
| | | NATIONALTAX-FREE
MONEYMARKETTRUST
| |
(Unaudited)
For the
Six Months Ended
September 30, 2003 | | | For the
Year Ended
March 31, 2003 | | | (Unaudited)
For the
Six Months Ended
September 30, 2003 | | | For the
Year Ended
March 31, 2003 | |
|
| | | |
| | | | | | | | | | | | | | | |
| $ | 1,823,970,186 | | | $ | 1,776,434,967 | | | $ | 507,048,487 | | | $ | 627,773,130 | |
| | | |
| | | | | | | | | | | | | | | |
| | 8,871,329 | | | | 31,522,703 | | | | 2,535,008 | | | | 6,969,507 | |
| | (2,491 | ) | | | 137,819 | | | | (15,465 | ) | | | 22,859 | |
|
|
| |
|
|
| |
|
|
| |
|
|
|
| | 8,868,838 | | | | 31,660,522 | | | | 2,519,543 | | | | 6,992,366 | |
|
|
| |
|
|
| |
|
|
| |
|
|
|
| | | |
| | | | | | | | | | | | | | | |
| | (8,871,333 | ) | | | (31,522,700 | ) | | | (2,535,008 | ) | | | (6,969,510 | ) |
| | 0 | | | | 0 | | | | 0 | | | | (6,237 | ) |
| | | |
| | | | | | | | | | | | | | | |
| | 9,467,813,746 | | | | 6,903,556,870 | | | | 1,306,947,794 | | | | 2,324,454,720 | |
| | 26 | | | | 34 | | | | 21,408 | | | | 48,612 | |
| | (9,615,408,971 | ) | | | (6,856,159,507 | ) | | | (1,373,314,436 | ) | | | (2,445,244,594 | ) |
|
|
| |
|
|
| |
|
|
| |
|
|
|
| | | |
| | (147,595,199 | ) | | | 47,397,397 | | | | (66,345,234 | ) | | | (120,741,262 | ) |
|
|
| |
|
|
| |
|
|
| |
|
|
|
| | (147,597,694 | ) | | | 47,535,219 | | | | (66,360,699 | ) | | | (120,724,643 | ) |
|
|
| |
|
|
| |
|
|
| |
|
|
|
| | | |
| | | | | | | | | | | | | | | |
|
| | | |
| $ | 1,676,372,492 | | | $ | 1,823,970,186 | | | $ | 440,687,788 | | | $ | 507,048,487 | |
| | | |
| | | | | | | | | | | | | | | |
| | 9,467,813,742 | | | | 6,903,558,473 | | | | 1,306,947,794 | | | | 2,324,455,859 | |
| | 26 | | | | 34 | | | | 21,408 | | | | 48,612 | |
| | (9,615,408,971 | ) | | | (6,856,159,506 | ) | | | (1,373,314,437 | ) | | | (2,445,244,594 | ) |
|
|
| |
|
|
| |
|
|
| |
|
|
|
| | (147,595,203 | ) | | | 47,399,001 | | | | (66,345,235 | ) | | | (120,740,123 | ) |
|
|
| |
|
|
| |
|
|
| |
|
|
|
| $ | 0 | | | $ | 4 | | | $ | 182 | | | $ | 182 | |
|
|
| |
|
|
| |
|
|
| |
|
|
|
25
| WELLSFARGOMONEYMARKETTRUSTS | | FINANCIALHIGHLIGHTS |
|
| | | Beginning
Net Asset
Value
Per
Share | | Net
Investment
Income | | Dividends
From Net
Investment
Income | | | Ending
Net Asset
Value Per
Share |
|
| | | | |
CALIFORNIATAX-FREEMONEYMARKETTRUST | | | | | | | | | | | |
April 1, 2003 to September 30, 2003 (Unaudited) | | $ | 1.00 | | 0.00 | | 0.00 | | | $ | 1.00 |
April 1, 2002 to March 31, 2003 | | $ | 1.00 | | 0.01 | | (0.01 | ) | | $ | 1.00 |
April 1, 2001 to March 31, 2002 | | $ | 1.00 | | 0.02 | | (0.02 | ) | | $ | 1.00 |
April 1, 2000 to March 31, 2001 | | $ | 1.00 | | 0.03 | | (0.03 | ) | | $ | 1.00 |
April 1, 1999 to March 31, 2000 | | $ | 1.00 | | 0.03 | | (0.03 | ) | | $ | 1.00 |
April 1, 1998 to March 31, 1999 | | $ | 1.00 | | 0.03 | | (0.03 | ) | | $ | 1.00 |
| | | | |
MONEYMARKETTRUST | | | | | | | | | | | |
|
April 1, 2003 to September 30, 2003 (Unaudited) | | $ | 1.00 | | 0.01 | | (0.01 | ) | | $ | 1.00 |
April 1, 2002 to March 31, 2003 | | $ | 1.00 | | 0.02 | | (0.02 | ) | | $ | 1.00 |
April 1, 2001 to March 31, 2002 | | $ | 1.00 | | 0.03 | | (0.03 | ) | | $ | 1.00 |
April 1, 2000 to March 31, 2001 | | $ | 1.00 | | 0.06 | | (0.06 | ) | | $ | 1.00 |
April 1, 1999 to March 31, 2000 | | $ | 1.00 | | 0.05 | | (0.05 | ) | | $ | 1.00 |
April 1, 1998 to March 31, 1999 | | $ | 1.00 | | 0.05 | | (0.05 | ) | | $ | 1.00 |
| | | | |
NATIONALTAX-FREEMONEYMARKETTRUST | | | | | | | | | | | |
|
April 1, 2003 to September 30, 2003 (Unaudited) | | $ | 1.00 | | 0.00 | | 0.00 | | | $ | 1.00 |
April 1, 2002 to March 31, 2003 | | $ | 1.00 | | 0.01 | | (0.01 | ) | | $ | 1.00 |
April 1, 2001 to March 31, 2002 | | $ | 1.00 | | 0.02 | | (0.02 | ) | | $ | 1.00 |
April 1, 2000 to March 31, 2001 | | $ | 1.00 | | 0.04 | | (0.04 | ) | | $ | 1.00 |
April 1, 1999 to March 31, 2000 | | $ | 1.00 | | 0.03 | | (0.03 | ) | | $ | 1.00 |
April 1, 1998 to March 31, 1999 | | $ | 1.00 | | 0.03 | | (0.03 | ) | | $ | 1.00 |
| |
| (1) | | During each period, various fees and expenses were waived and reimbursed as indicated. The ratio of Gross Expenses to Average Net Assets reflects the expense ratio in the absence of any waivers and reimbursements (Note 3). |
| |
| (2) | | Total return calculations for less than one year are not annualized and would have been lower had certain expenses not been waived or reimbursed during the periods shown. |
The accompanying notes are an integral part of these financial statements.
26
FINANCIALHIGHLIGHTS | | WELLSFARGOMONEYMARKETTRUSTS |
|
| | |
Ratio to Average Net Assets (Annualized)(1)
| | | Total
Return(2) | | | Net Assets at
End of Period
(000’s omitted) |
Net Investment
Income | | | Net
Expenses | | | Gross
Expenses | | | |
| | | | | | | | | | | | | | |
|
| | | | |
| | | | | | | | | | | | | | |
| 0.82 | % | | 0.20 | % | | 0.21 | % | | 0.41 | % | | $ | 519,627 |
| 1.16 | % | | 0.20 | % | | 0.24 | % | | 1.18 | % | | $ | 830,713 |
| 1.92 | % | | 0.20 | % | | 0.25 | % | | 2.01 | % | | $ | 852,775 |
| 3.33 | % | | 0.20 | % | | 0.23 | % | | 3.41 | % | | $ | 590,286 |
| 2.89 | % | | 0.20 | % | | 0.67 | % | | 2.93 | % | | $ | 540,704 |
| 2.91 | % | | 0.20 | % | | 0.91 | % | | 2.93 | % | | $ | 549,289 |
| | | | |
| | | | | | | | | | | | | | |
|
| 1.03 | % | | 0.20 | % | | 0.21 | % | | 0.52 | % | | $ | 1,676,372 |
| 1.56 | % | | 0.20 | % | | 0.23 | % | | 1.58 | % | | $ | 1,823,970 |
| 3.02 | % | | 0.20 | % | | 0.22 | % | | 3.27 | % | | $ | 1,776,435 |
| 6.20 | % | | 0.20 | % | | 0.22 | % | | 6.44 | % | | $ | 1,161,092 |
| 5.35 | % | | 0.20 | % | | 0.48 | % | | 5.43 | % | | $ | 713,278 |
| 5.20 | % | | 0.20 | % | | 0.61 | % | | 5.35 | % | | $ | 471,923 |
| | | | |
| | | | | | | | | | | | | | |
|
| 0.90 | % | | 0.20 | % | | 0.22 | % | | 0.45 | % | | $ | 440,688 |
| 1.28 | % | | 0.20 | % | | 0.22 | % | | 1.30 | % | | $ | 507,048 |
| 2.08 | % | | 0.20 | % | | 0.24 | % | | 2.25 | % | | $ | 627,773 |
| 3.89 | % | | 0.20 | % | | 0.25 | % | | 4.01 | % | | $ | 339,791 |
| 3.27 | % | | 0.20 | % | | 0.52 | % | | 3.30 | % | | $ | 269,943 |
| 3.09 | % | | 0.20 | % | | 0.68 | % | | 3.16 | % | | $ | 233,546 |
27
WELLSFARGOMONEYMARKETTRUSTS | | NOTESTOFINANCIALSTATEMENTS (UNAUDITED) |
|
1. ORGANIZATION
Wells Fargo Funds Trust (the “Trust”) is registered under the Investment Company Act of 1940, as amended (the “1940 Act”), as an open-end series management investment company. The Trust commenced operations on November 8, 1999, and is currently comprised of 68 separate series. These financial statements present the Money Market Trust and National Tax-Free Money Market Trust, diversified series of the Trust, and the California Tax-Free Money Market Trust, a non-diversified series of the Trust (each, a “Fund”, collectively, the “Funds”).
2. SIGNIFICANT ACCOUNTING POLICIES
The following significant accounting policies, which are consistently followed by the Trust in the preparation of its financial statements, are in conformity with accounting principles generally accepted in the United States of America (“GAAP”) for investment companies.
The preparation of financial statements in conformity with GAAP requires management to make estimates and assumptions that affect the reported amounts of assets and liabilities, disclosure of contingent assets and liabilities at the date of the financial statements and the reported amounts of revenues and expenses during the reporting period. Actual results could differ from those estimates.
SECURITYVALUATION
The Funds invest only in securities with remaining maturities not exceeding 397 days (13 months). Certain floating- and variable-rate instruments in the portfolios may have maturities in excess of 397 days, but carry a demand feature that permits the holder to tender the instruments back to the issuer at par value prior to maturity.
The Funds use the amortized cost method to value their portfolio securities. The amortized cost method involves valuing a security at its cost, plus accretion of discount or minus amortization of premium over the period until maturity, which approximates market value. The Funds seek to maintain a constant net asset value of $1.00 per share, although there is no assurance that they will be able to do so.
SECURITIESTRANSACTIONSANDINCOMERECOGNITION
Securities transactions are recorded on a trade date basis. Realized gains or losses are reported on the basis of identified cost of securities delivered. Interest income is accrued daily and bond discounts are accreted and premiums are amortized.
REPURCHASEAGREEMENTS
The Money Market Trust may invest in repurchase agreements and may participate in pooled repurchase agreement transactions with other funds advised by Wells Fargo Funds Management, LLC. The repurchase agreements must be fully collateralized based on values that are marked to market daily. The collateral may be held by an agent bank under a tri-party agreement. It is the Fund’s custodian’s responsibility to value collateral daily and to take action to obtain additional collateral as necessary to maintain market value equal to or greater than the resale price. The repurchase agreements held by the Fund are collateralized by instruments such as U.S. Treasury, federal agency, or high-grade corporate obligations. There could be potential loss to a Fund in the event that such Fund is delayed or prevented from exercising its rights to dispose of the collateral, including the risk of a possible decline in the value of the underlying obligations during the period in which a Fund seeks to assert its rights.
DISTRIBUTIONSTOSHAREHOLDERS
Net investment income is declared daily and distributed to shareholders monthly. Distributions to shareholders from net realized capital gains, if any, are declared and distributed at least annually.
Distributions are based on amounts calculated in accordance with the applicable federal income tax regulations, which may differ from GAAP. The timing and character of distributions made during the period from net investment income or net realized gains may also differ from their ultimate characterization for federal income tax purposes. To the extent that these differences are permanent in nature, such amounts are reclassified within the capital accounts based on their federal tax-basis treatment; temporary differences do not require reclassifications.
FEDERALINCOMETAXES
Each Fund is treated as a separate entity for federal income tax purposes. It is the policy of each fund of the Trust to continue to qualify as a regulated investment company by complying with the provisions applicable to regulated investment companies, as defined in the Internal Revenue Code (the “Code”), and to make distributions of substantially all of its investment company taxable income and any net realized capital gains (after reduction for capital loss carryforwards) sufficient to relieve it from all, or substantially
28
| NOTESTOFINANCIALSTATEMENTS (UNAUDITED) | | WELLSFARGOMONEYMARKETTRUSTS |
|
all, federal income taxes. Accordingly, no provision for federal income taxes was required at September 30, 2003.
3. AGREEMENTS AND OTHER TRANSACTIONS WITH AFFILIATES
Wells Fargo Funds Management, LLC (“Funds Management”), an indirect and wholly-owned subsidiary of Wells Fargo & Company serves as adviser to the Funds and is responsible for implementing the investment policies and guidelines for the Funds, and for supervising the sub-adviser. Pursuant to the advisory contract, Funds Management has agreed to provide the Funds with daily portfolio management. Funds Management does not receive a fee for providing those services.
Wells Capital Management Incorporated (“Wells Capital Management”), an affiliate of Funds Management, acts as investment sub-adviser to the Funds and is responsible for the day-to-day portfolio management of the Funds. Wells Capital Management does not receive a fee for the services it provides as sub-adviser.
Through February 28, 2003, the Trust had entered into an Administration Agreement with Funds Management on behalf of the Funds. Under the Administration Agreement, Funds Management acted as administrator to the Funds and was entitled to receive, on a monthly basis, fees at the annual rate of 0.15% of each Fund’s average daily net assets.
The Trust had also entered into an agreement with Boston Financial Data Services, Inc. (“BFDS”) as the transfer agent for the Trust. Under the agreement, BFDS was entitled to receive from the Funds a per-account fee plus transaction fees, certain out-of-pocket costs and a complex based fee.
Effective March 1, 2003, the Trust has entered into a new Administration Agreement with Funds Management on behalf of the Funds. Under this Agreement, for providing administrative services, which now includes paying the Funds’ fees and expenses for services provided by the Funds’ transfer agent and various sub-transfer agents and omnibus account servicers and record-keepers out of the fees it receives as administrator, Funds Management is entitled to receive an annual fee of 0.17% of the average daily net assets of a Fund.
Funds Management has committed to reimburse each Fund for some of its operating expenses or to waive a portion of the fees payable to it in order to maintain a certain operating expense ratio. Funds Management has committed through July 31, 2004 to maintain the current net operating expense ratio for each Fund. Actual reimbursements and waivers can have a positive effect on performance information. For the six months ended September 30, 2003, Funds Management waived a portion of each Fund’s expenses as follows: first from advisory fees, and then any remaining amounts consecutively from administration, custody and shareholder servicing fees collected. Expense waiver information is included in the Funds’ Statement of Operations.
Effective the first quarter of 2003, PFPC Inc. (“PFPC”) serves as fund accountant for the Funds. For these services, PFPC is entitled to receive an annual asset based fund complex fee, an annual fee of $20,000 from each Fund and is entitled to be reimbursed for all out-of-pocket expenses reasonably incurred in providing these services. Prior to PFPC, Forum Accounting Services, LLC served as fund accountant and was entitled to receive a fixed monthly fee, a basis point fee of 0.0025% of the average daily net assets of each Fund, plus out-of-pocket expenses.
In addition, the Trust has entered into a contract on behalf of the Funds with Wells Fargo Bank Minnesota, N.A. (“Wells Fargo Bank, MN”), whereby Wells Fargo Bank, MN is responsible for providing custody services for the Funds. Pursuant to the contract, Wells Fargo Bank, MN is entitled to certain transaction charges plus a monthly fee for custody services at the annual rate of 0.02% of the average daily net assets of each Fund.
29
WELLSFARGOMONEYMARKETTRUSTS | | BOARDOFTRUSTEES |
|
BOARDOFTRUSTEES
The following table provides basic information about the Board of Trustees (“Trustees”) of the Trust and supplements, and should be read in conjunction with, the Prospectus and the Statement of Additional Information* of each Fund. Each of the Trustees listed below acts in identical capacities for each of the 92 funds comprising the Trust, Wells Fargo Variable Trust and Wells Fargo Master Trust (collectively the “Fund Complex”). All of the non-interested Trustees are also members of the Audit and Nominating Committees of each Trust in the Fund Complex. The address of each Trustee and Officer is 525 Market Street, 20th Floor, San Francisco, CA 94105. Each Trustee and Officer serves an indefinite term, however, each Trustee serves such term until reaching the mandatory retirement age established by the Trustees.
INTERESTEDTRUSTEES**
| Name and Age | | Position held and
length of service*** | | Principal occupations during
past five years | | Other Directorships |
Robert C. Brown
72 | | Trustee since 1992 | | Retired. Director, Federal Farm Credit Banks Funding Corporation and Farm Credit System Financial Assistance Corporation until February 1999. | | None |
|
J. Tucker Morse
59 | | Trustee since 1987 | | Private Investor/Real Estate Developer; Chairman of White Point Capital, LLC. | | None |
|
| | |
| NON-INTERESTEDTRUSTEES | | | | |
| Name and Age | | Position held and
length of service*** | | Principal occupations during
past five years | | Other Directorships |
Thomas S. Goho
61 | | Trustee since 1987 | | Wake Forest University, Calloway School of Business and Accountancy, Benson-Pruitt Professorship since 1999, Associate Professor of Finance 1994-1999. | | None |
|
Peter G. Gordon
61 | | Trustee since 1998 (Lead Trustee since 2001) | | Chairman, CEO, and Co-Founder of Crystal Geyser Water Company and President of Crystal Geyser Roxane Water Company. | | None |
|
Richard M. Leach
70 | | Trustee since 1987 | | Retired. Prior thereto, President of Richard M. Leach Associates (a financial consulting firm). | | None |
|
Timothy J. Penny
51 | | Trustee since 1996 | | Senior Counselor to the public relations firm of Himle-Horner and Senior Fellow at the Humphrey Institute, Minneapolis, Minnesota (a public policy organization). | | None |
|
Donald C. Willeke
63 | | Trustee since 1996 | | Principal in the law firm of Willeke & Daniels. | | None |
|
30
| BOARDOFTRUSTEES | | WELLSFARGOMONEYMARKETTRUSTS |
|
OFFICERS
| Name and Age | | Position held and
length of service | | Principal occupations during
past five years | | Other Directorships |
Karla M. Rabusch 44 | | President, since 2003 | | Executive Vice President of Wells Fargo Bank, N.A. President of Wells Fargo Funds Management, LLC. Senior Vice President and Chief Administrative Officer of Wells Fargo Funds Management, LLC from March 2001 to March 2003. Vice President of Wells Fargo Bank, N.A. from December 1997 to May 2000. | | None |
|
Stacie D. DeAngelo 34 | | Treasurer, since 2003 | | Vice President of Wells Fargo Bank, N.A. Vice President of Operations for Wells Fargo Funds Management, LLC. Prior thereto, Operations Manager at Scudder Weisel Capital, LLC (2000 to 2001), Director of Shareholder Services at BISYS Fund Services (1999 to 2000) and Assistant Vice President of Operations with Nicholas-Applegate Capital Management (1993 to 1999). | | None |
|
C. David Messman 43 | | Secretary, since 2000 | | Vice President and Counsel of Wells Fargo Bank, N.A. since January 1996. Vice President and Secretary of Wells Fargo Funds Management, LLC since March 2001. | | None |
|
| * | | The Statement of Additional Information includes additional information about the Funds’ Trustees and is available, without charge, upon request, by calling 1-800-222-8222. |
| ** | | Currently, two of the seven Trustees are considered “interested persons” of the Trusts as defined in the Investment Company Act of 1940. One of the interested Trustees, Robert C. Brown, owns securities of Wells Fargo & Company, and one of the interested Trustees, J. Tucker Morse, is affiliated with a government securities dealer that is registered under the Securities Exchange Act of 1934, which is not itself affiliated with Wells Fargo Funds Management, LLC. |
| *** | | Length of service dates reflects a Trustee’s commencement of service with the Trust’s predecessor entities. |
31
MONEYMARKETFUNDS | | LISTOFABBREVIATIONS |
|
The following is a list of common abbreviations for terms and entities which may have appeared in this report.
| |
ABAG | | — Association of Bay Area Governments |
| |
ADR | | — American Depository Receipts |
| |
AMBAC | | — American Municipal Bond Assurance Corporation |
| |
AMT | | — Alternative Minimum Tax |
| |
ARM | | — Adjustable Rate Mortgages |
| |
BART | | — Bay Area Rapid Transit |
| |
CDA | | — Community Development Authority |
| |
CDSC | | — Contingent Deferred Sales Charge |
| |
CGIC | | — Capital Guaranty Insurance Company |
| |
CGY | | — Capital Guaranty Corporation |
| |
CMT | | — Constant Maturity Treasury |
| |
COFI | | — Cost of Funds Index |
| |
Connie Lee | | — Connie Lee Insurance Company |
| |
COP | | — Certificate of Participation |
| |
CP | | — Commercial Paper |
| |
CTF | | — Common Trust Fund |
| |
DW&P | | — Department of Water & Power |
| |
DWR | | — Department of Water Resources |
| |
EDFA | | — Education Finance Authority |
| |
FGIC | | — Financial Guaranty Insurance Corporation |
| |
FHA | | — Federal Housing Authority |
| |
FHLB | | — Federal Home Loan Bank |
| |
FHLMC | | — Federal Home Loan Mortgage Corporation |
| |
FNMA | | — Federal National Mortgage Association |
| |
FRN | | — Floating Rate Notes |
| |
FSA | | — Financial Security Assurance, Inc |
| |
GNMA | | — Government National Mortgage Association |
| |
GO | | — General Obligation |
| |
HFA | | — Housing Finance Authority |
| |
HFFA | | — Health Facilities Financing Authority |
| |
IDA | | — Industrial Development Authority |
| |
LIBOR | | — London Interbank Offered Rate |
| |
LLC | | — Limited Liability Corporation |
| |
LOC | | — Letter of Credit |
| |
LP | | — Limited Partnership |
| |
MBIA | | — Municipal Bond Insurance Association |
| |
MFHR | | — Multi-Family Housing Revenue |
| |
MUD | | — Municipal Utility District |
| |
MTN | | — Medium Term Note |
| |
PCFA | | — Pollution Control Finance Authority |
| |
PCR | | — Pollution Control Revenue |
| |
PFA | | — Public Finance Authority |
| |
PLC | | — Private Placement |
| |
PSFG | | — Public School Fund Guaranty |
| |
RAW | | — Revenue Anticipation Warrants |
| |
RDA | | — Redevelopment Authority |
| |
RDFA | | — Redevelopment Finance Authority |
| |
R&D | | — Research & Development |
| |
SFMR | | — Single Family Mortgage Revenue |
| |
STEERS | | — Structured Enhanced Return Trust |
| |
TBA | | — To Be Announced |
| |
TRAN | | — Tax Revenue Anticipation Notes |
| |
USD | | — Unified School District |
| |
V/R | | — Variable Rate |
| |
WEBS | | — World Equity Benchmark Shares |
32

More information about Wells Fargo Funds® is available free upon request. To obtain literature, please write or call: Wells Fargo Funds PO Box 8266 Boston, MA 02266-8266 Wells Fargo Funds Investor Services: 1-800-222-8222 or visit our Web site at www.wellsfargofunds.com. | | This report and the financial statements contained herein are submitted for the general information of the shareholders of the Wells Fargo Funds. If this report is used for promotional purposes, distribution of the report must be accompanied or preceded by a current prospectus. For a prospectus containing more complete information, including charges and expenses, call 1-800-222-8222. Read the prospectus carefully before you invest or send money. Wells Fargo Funds Management, LLC, a wholly-owned subsidiary of Wells Fargo & Company, provides investment advisory and administrative services for the Wells Fargo Funds. Other affiliates of Wells Fargo & Company provide sub-advisory and other services for the Funds. The Funds are distributed by Stephens Inc., Member NYSE/SIPC. Wells Fargo & Company and its affiliates are not affiliated with Stephens Inc. |
| | | NOT FDIC INSURED - NO BANK GUARANTEE - MAY LOSE VALUE | | SAR 010 (11/03) |
WELLS FARGO
FUNDS
Wells Fargo Overland Express Sweep Fund
Semi-Annual Report
Wells Fargo Overland Express Sweep Fund
September 30, 2003
| | | WELLSFARGOOVERLANDEXPRESSSWEEPFUND |
|
TABLEOFCONTENTS
NOT FDIC INSURED–NO BANK GUARANTEE–MAY LOSE VALUE
This page is intentionally left blank —
SHAREHOLDERLETTER | | WELLSFARGOOVERLANDEXPRESSSWEEPFUND |
|
DEARVALUEDSHAREHOLDER,
We are pleased to provide you with this Wells Fargo Overland Express Sweep Fund semi-annual report for the six-month period ending September 30, 2003. On the following pages, you will find the money market overview and facts and figures about the Fund’s portfolio.
OVERVIEW OF FINANCIAL MARKETS
Despite attempts by the federal government to boost the economy early in the year, the economy remained mired in weakness early in the reporting period. The Federal Reserve Board (the Fed) cut short-term interest rates from 1.25% to 1% in June, the lowest level in half a century. Still, unemployment continued to rise and a record fiscal year 2003 federal budget deficit loomed on the horizon, suggesting that tax revenues were not growing fast enough to cover government spending.
Market volatility that was caused by uncertainty over the possibility of war in Iraq was followed by uncertainty over the direction and magnitude of changes in Fed policy. Mortgage refinancing and consumer spending activity remained strong despite a back-up in intermediate-term interest rates. Economic growth began picking up steam during the summer, while corporate earnings exceeded expectations. Even employment data began showing improvement in September. Indeed, there were reasons to be optimistic about the U.S. economy as the end of 2003 approached.
WELLS FARGO OVERLAND EXPRESS SWEEP FUND
The Fed’s decision to cut interest rates by just a quarter percentage point to 1% at its June 25, 2003 policy meeting brought interest rates down to levels not seen since the 1950s. Unfortunately, the rate cut did not meet investor expectations and interest rates were volatile through the end of the period in reaction to comments from the Fed and changing views on the outlook for economic growth. Despite a challenging environment for investors, the Wells Fargo Overland Express Sweep Fund achieved its investment objectives of maintaining a stable net asset value.
It is important to remember that no one can accurately predict the future direction of short-term interest rates. We continue to maintain a more prudent investment strategy and do not pursue strategies that seek to boost yield at the expense of safety and liquidity. We believe that the pursuit of additional yield creates volatility that can potentially undermine Fund performance during uncertain markets.
INVESTMENT STRATEGIES IN CHALLENGING TIMES
Investors are counting on reasonably good earnings growth to propel stocks higher during the balance of 2003, overcoming potential hurdles to any future rally created by seemingly “rich” valuations and by upward pressure on interest rates. With pricing power still weak throughout much of the economy, most businesses will rely on further cost cutting to propel margins enough to sustain double-digit earnings growth. Meanwhile, bond investors may insulate portfolios from a potential rise in interest rates by gradually moving away from longer-term securities as well as by investing in high coupon bonds or mortgage-backed securities that hold up better in a rising interest rate environment. Regardless of what lies ahead, investors should continue to follow the fundamentals of investing — asset allocation and diversification — in an effort to achieve their long-term financial goals.
We would like to thank you for choosing Wells Fargo Funds. We appreciate your confidence in us during this uncertain time period. Through each market cycle, we are committed to helping you meet your financial needs. If you have any questions about your investment, please contact your investment professional or call us at 1-800-222-8222. You may also visit our Web site at www.wellsfargofunds.com.
Sincerely,

Karla M. Rabusch
President
Wells Fargo Funds
1
WELLSFARGOOVERLANDEXPRESSSWEEPFUND | | MONEYMARKETOVERVIEW |
|
MONEYMARKETOVERVIEW
This report covers the six-month period ended September 30, 2003.
This reporting period can be divided into two distinct segments. During the first three months of the period, interest rates moved lower as slow economic growth led many to believe that the Federal Reserve Board (the Fed) would continue its attempt to spur growth by aggressively lowering short-term interest rates. The second half of the period was characterized by rising interest rates, the result of the Fed’s interest rate cut in June not meeting investor expectations.
PRIME MONEY MARKET SECURITIES
For the first three months of the period, the yield curve flattened. Short-term money market investments (those maturing in less than three months) remained stable, while longer-term money market investments (those maturing in more than thirteen months) declined. By mid-June, the yield on one-year investments had declined 25 basis points to below 1%, while the Federal Funds rate remained near 1.25%. Despite warnings that their expectations were unrealistic, investors continued to expect a 50 basis point reduction in the Federal Funds rate in June. When the rate was lowered only 25 basis points, the market began to re-evaluate its outlook for continued regular rate cuts and the yields on longer-term money market investments began to move higher. By the end of the period, the one-year London Interbank Offered Rate (LIBOR) stood at 1.30% after peaking at 1.50% near the end of August.
The amount of commercial paper outstanding continued to decline during the period, as issuers took advantage of the record low bond yields to extend their debt. The amount of top rated commercial paper outstanding fell by more than 5% during the period, from $1.207 trillion to $1.144 trillion, reflecting a decrease of nearly 20% from the peak of $1.413 trillion in December 2000.
Credit quality also remained a concern during the reporting period. While the pace of downgrades slowed somewhat, accounting issues at some of the Government Sponsored Entities, and questions about corporate governance policies at the New York Stock Exchange, did not help to restore investor confidence in management policies, abilities, and integrity.
U.S. TREASURY SECURITIES
Although the Fed eventually did cut the Federal Funds rate by 25 basis points to 1.00%, Treasury bills had been pricing based on the assumption that there would be a 50 basis point cut. Even the one-year Treasury note traded below 0.90% in the days preceding the June rate cut. These low rates coincided with quarter-end demand pressures in June, causing the short-end of the Treasury market (less than three months) to remain overpriced for an unusually longer period of time than what typically follows a market disappointment. Eventually Treasury bill pricing became more reasonable, and the longer end of the market became relatively cheap. As budget deficit projections ballooned, expectations of a greater supply of Treasury bills and the general expectation of higher interest rates drove the price of Treasury bills into the mid 0.90’s to low 1.00’s.
Over this reporting period, the supply of Treasury bills greatly contracted: the issuance of Treasury bills for the first week of April stood at $72 billion, and declined to $44 billion by the end of the period. While the April issuance was largely due to seasonal factors, Treasury bill issuance did not meet expectations as the period progressed and Treasuries became more expensive. Evidence of this could be seen during September, when the U.S. Treasury Department had to issue cash management bills to cover a temporary cash shortfall early in the month. Continued issuance may point to the need for the Treasury to increase auction size in the coming months.
U.S. GOVERNMENT AGENCY SECURITIES
Spreads between U.S. Government agency offerings and money market securities continued to tighten during the period. Interest rates, concerns over the ability of government agencies to manage interest rate risk, losses in the Federal Home Loan Bank of New York’s bond portfolio, and an accounting scandal at the Federal Home Loan Mortgage Corporation (FHLMC) drove yields on U.S. Government agency securities higher on a relative basis. For a period in June, after the FHLMC accounting issues were made public, FHLMC discount notes traded more cheaply than A-1/P-1 bank commercial paper. Eighteen month floating rate paper from the Federal National Mortgage Association (FNMA) and FHLMC traded at similar discount margins to one-year asset-backed conduit program floaters. The number of callable issues continued to increase, but at a slower pace as rates declined in September. By the end of the period, changes in the regulation of FNMA and FHLMC seemed inevitable (although it may be a long and arduous process).
2
MONEYMARKETOVERVIEW | | WELLSFARGOOVERLANDEXPRESSSWEEPFUND |
|
TAX-FREE SECURITIES
The number of new municipal issues continued to increase swiftly as issuers found that it was often cheaper to issue variable rate securities than use the swap market to hedge interest rate risk. As variable rates surged to 103% of the one-month LIBOR in mid-April, the vast supply of variable rate demand notes increased, making it somewhat easier to invest the seasonal July cash inflows.
Fixed rate municipal securities were volatile during the reporting period. One-year paper started the period at 1.10% and interest rates plummeted to 0.80% at the peak of note season in late June. California was on the verge of running out of cash, as legislative parties were at odds over approving a budget. Standard and Poor’s was one of the driving forces behind breaking the stalemate by downgrading the state from A to BBB in late July. The price of California Revenue Anticipation Warrants (RAWs) plummeted as their yields skyrocketed from 1.15% to 2.00%.
Texas issued record-breaking Tax and Revenue Anticipation Notes in late August, exceeding municipal demand and splitting the one-year sector into three markets – the general market, the California market, and the Texas market. The one-year municipal securities markets finally settled down in early September as rates hovered near 1.00% for general market paper, 1.10% for Texas paper, and 1.60% for California RAWs.
STRATEGIC OUTLOOK
While the overnight interest rate has been stable, longer money market rates have increased considerably since the mid-point of the reporting period. With the U.S. economy picking up steam and the U.S. dollar weakening overseas, we believe that interest rates may continue to move higher. That increase, when accompanied by outflows from institutional investors, could trigger a challenging period for all money market funds. However, we do not believe that aggressively positioning a money market fund to boost its yield at the risk of jeopardizing its net asset value (NAV) would be appropriate, and we will continue to position the portfolios and select their investments in an ongoing effort to maintain a stable $1.00 NAV.
The views expressed are as of September 30, 2003 and are those of the Funds’ manager. The views are subject to change at any time in response to changing circumstances in the market and are not intended to predict or guarantee the future performance of any individual security, market sector or the markets generally, or the Wells Fargo Money Market Funds.
3
| WELLSFARGOOVERLANDEXPRESSSWEEPFUND | | PERFORMANCEHIGHLIGHTS |
|
WELLSFARGOOVERLANDEXPRESSSWEEPFUND
INVESTMENT OBJECTIVE
The Wells Fargo Overland Express Sweep Fund (the Fund) seeks a high level of current income, while preserving capital and liquidity.
FUNDMANAGERS
Dave Sylvester
Laurie White
INCEPTIONDATE
10/01/91
AVERAGE ANNUAL TOTAL RETURN1 (%) (AS OF SEPTEMBER 30, 2003)
| | | 6-Month* | | | 1-Year | | | 5-Year | | | 10-Year | |
| | | | |
Wells Fargo Overland Express Sweep Fund | | 0.05 | % | | 0.22 | % | | 2.88 | % | | 3.50 | % |
| | | | |
Benchmark | | | | | | | | | | | | |
| | | | |
iMoneyNet First Tier Retail Money Fund Average2 | | 0.23 | % | | 0.62 | % | | 3.59 | % | | 4.90 | % |
| * | | Returns for periods of less than one year are not annualized. |
| FUND YIELD SUMMARY (AS OF SEPTEMBER 30, 2003) | |
|
| |
7-Day Current Yield | | 0.10 | % |
| |
7-Day Compound Yield | | 0.10 | % |
| |
30-Day Simple Yield | | 0.10 | % |
| |
30-Day Compound Yield | | 0.10 | % |
| FUND CHARACTERISTICS3 (AS OF SEPTEMBER 30, 2003) |
|
| |
Weighted Average Maturity | | 51 days |
| |
Number of Holdings | | 99 |
PORTFOLIO COMPOSITION3 (AS OF SEPTEMBER 30, 2003)
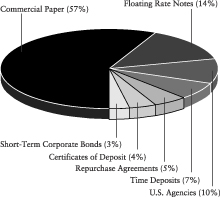
MATURITY DISTRIBUTION3 (AS OF SEPTEMBER 30, 2003)
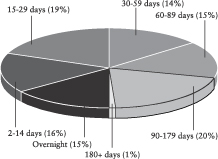
The Fund is sold without a front-end sales charge or contingent deferred sales charge. Other fees and expenses apply to a continued investment in the Fund and are described in the Fund’s Statement of Additional Information. An investment in a Wells Fargo Money Market Fund is not insured or guaranteed by the Federal Deposit Insurance Corporation or any other government agency. Although the Wells Fargo Money Market Funds seek to preserve the value of your investment at $1.00 per share, it is possible to lose money by investing in money market funds.
1 Figures quoted represent past performance, which is no guarantee of future results. Investment returns will fluctuate. The Fund’s yield figures more closely reflect the current earnings of the Fund than the total return figures. The Fund’s Adviser has committed through July 31, 2004 to waive fees and/or reimburse expenses to the extent necessary to maintain a certain net operating expense ratio for the Fund. The Fund’s Adviser also has voluntarily waived fees and/or reimbursed expenses, which reduced operating expenses. Actual reductions of operating expenses increased total return to shareholders. Without these reductions, the Fund’s 7-day current yield would have been 0.00%.
Performance shown for the Wells Fargo Overland Express Sweep Fund for periods prior to November 8, 1999, reflects performance of the Stagecoach Overland Express Fund, its predecessor fund. Effective at the close of business November 5, 1999, the Stagecoach Funds were reorganized into the Wells Fargo Funds. Performance shown for periods prior to December 15, 1997, reflects performance of the predecessor Overland Express Funds, Inc. portfolio.
2The iMoneyNet First Tier Retail Money Fund Average is an average of non-government retail funds that do not hold any second tier securities. Portfolio holdings of first tier funds include U.S. Treasury securities, U.S. other securities, repos, time deposits, domestic bank obligations, foreign bank obligations, first tier commercial paper, floating rate notes and asset-backed commercial paper.
3Portfolio holdings and characteristics are subject to change.
4
PORTFOLIOOFINVESTMENTS — SEPTEMBER 30, 2003 (UNAUDITED) | | WELLSFARGOOVERLANDEXPRESSSWEEPFUND |
|
OVERLANDEXPRESSSWEEPFUND
| Principal | | Security Name | | Interest Rate | | | Maturity Date | | Value |
|
| Certificates of Deposit – 4.36% |
| | | | |
| $ | 75,000,000 | | Credit Agricole Indosuez | | 1.03 | % | | 10/03/2003 | | $ | 75,000,000 |
| | | | |
| | 50,000,000 | | Lloyds TSB Bank | | 1.18 | | | 12/03/2003 | | | 49,992,142 |
| | | | |
| | 35,000,000 | | Svenska Handelsbanken | | 1.18 | | | 12/03/2003 | | | 34,994,195 |
| | | | |
| | 50,000,000 | | Unicredito Italiano SPA | | 1.04 | | | 10/20/2003 | | | 50,000,000 |
| |
Total Certificates of Deposit (Cost $209,986,337) | | | 209,986,337 |
| | | | | | | | | | |
|
|
|
| Commercial Paper – 56.65% |
| | | | |
| | 70,000,000 | | Amstel Funding Corporationª | | 0.94 | † | | 12/29/2003 | | | 69,837,328 |
| | | | |
| | 70,000,000 | | Amstel Funding Corporationª | | 1.14 | † | | 03/16/2004 | | | 69,629,817 |
| | | | |
| | 40,000,000 | | Atlantis One Funding Corporationª | | 1.26 | † | | 10/16/2003 | | | 39,979,000 |
| | | | |
| | 45,000,000 | | Banco Bilbao Vizcaya Argentaria Puerto Ricoª | | 1.09 | † | | 12/10/2003 | | | 44,904,625 |
| | | | |
| | 50,000,000 | | Banco Bilbao Vizcaya Argentaria Puerto Ricoª | | 1.10 | † | | 12/15/2003 | | | 49,885,937 |
| | | | |
| | 87,000,000 | | Beta Finance Incorporatedª | | 1.11 | † | | 03/15/2004 | | | 86,554,705 |
| | | | |
| | 40,000,000 | | CAFCO LLCª | | 1.07 | † | | 11/25/2003 | | | 39,934,611 |
| | | | |
| | 47,500,000 | | CC (USA) Incorporatedª | | 1.05 | † | | 10/27/2003 | | | 47,463,979 |
| | | | |
| | 35,000,000 | | CDC Commercial Paper Corporationª | | 1.15 | † | | 10/01/2003 | | | 35,000,000 |
| | | | |
| | 46,500,000 | | Charta LLCª | | 1.07 | † | | 10/02/2003 | | | 46,498,618 |
| | | | |
| | 35,000,000 | | Charta LLCª | | 1.04 | † | | 10/23/2003 | | | 34,977,755 |
| | | | |
| | 50,000,000 | | Citigroup Global | | 1.03 | † | | 10/01/2003 | | | 50,000,000 |
| | | | |
| | 70,000,000 | | Concord Minutemen Capital Company LLCª | | 1.12 | † | | 10/06/2003 | | | 69,989,111 |
| | | | |
| | 50,000,000 | | Crown Point Capital Company LLCª | | 1.05 | † | | 10/15/2003 | | | 49,979,583 |
| | | | |
| | 50,000,000 | | Crown Point Capital Company LLCª | | 1.12 | † | | 01/16/2004 | | | 49,833,556 |
| | | | |
| | 40,000,000 | | Eureka Securitization Incorporatedª | | 1.04 | † | | 10/22/2003 | | | 39,975,733 |
| | | | |
| | 33,750,000 | | Galaxy Funding Incorporatedª | | 1.09 | † | | 11/05/2003 | | | 33,714,234 |
| | | | |
| | 23,927,000 | | Galaxy Funding Incorporatedª | | 1.07 | † | | 12/10/2003 | | | 23,877,219 |
| | | | |
| | 102,500,000 | | Gemini Securitization Incorporatedª | | 1.07 | † | | 11/13/2003 | | | 102,368,999 |
| | | | |
| | 73,000,000 | | Govco Incorporatedª | | 1.08 | † | | 11/19/2003 | | | 72,892,690 |
| | | | |
| | 105,000,000 | | Grampian Funding LLCª | | 1.11 | † | | 01/28/2004 | | | 104,614,737 |
| | | | |
| | 60,000,000 | | HBOs Treasury Services plc | | 1.04 | † | | 10/02/2003 | | | 59,998,275 |
| | | | |
| | 70,000,000 | | HBOs Treasury Services plc | | 1.03 | † | | 10/10/2003 | | | 69,981,975 |
| | | | |
| | 36,525,000 | | Holdenby Capital Company LLCª | | 1.20 | † | | 02/18/2004 | | | 36,354,550 |
| | | | |
| | 50,000,000 | | HSBC Bank Canadaª | | 1.22 | † | | 02/04/2004 | | | 49,786,500 |
| | | | |
| | 25,000,000 | | Ivory Funding Corporationª | | 1.25 | † | | 10/01/2003 | | | 25,000,000 |
| | | | |
| | 141,700,000 | | K2 (USA) LLCª | | 1.10 | † | | 12/01/2003 | | | 141,435,887 |
| | | | |
| | 50,000,000 | | Lexington Parker Capital Corporationª | | 1.13 | † | | 02/27/2004 | | | 49,766,153 |
| | | | |
| | 35,000,000 | | Lexington Parker Capital Corporationª | | 1.16 | † | | 03/02/2004 | | | 34,827,450 |
| | | | |
| | 42,627,000 | | Liberty Street Funding Corporationª | | 1.05 | † | | 10/28/2003 | | | 42,593,431 |
| | | | |
| | 20,000,000 | | Liberty Street Funding Corporationª | | 1.07 | † | | 12/23/2003 | | | 19,950,661 |
| | | | |
| | 35,000,000 | | Liquid Funding Limitedª | | 1.04 | † | | 10/21/2003 | | | 34,979,778 |
| | | | |
| | 40,000,000 | | Liquid Funding Limitedª | | 1.08 | † | | 10/27/2003 | | | 39,968,800 |
| | | | |
| | 50,000,000 | | Moat Funding LLCª | | 1.10 | † | | 01/15/2004 | | | 49,838,056 |
| | | | |
| | 100,000,000 | | Natexis Banque Populaires | | 1.04 | † | | 10/07/2003 | | | 99,982,667 |
| | | | |
| | 75,000,000 | | National Bank of New Zealand International Limitedª | | 1.09 | † | | 12/17/2003 | | | 74,825,146 |
| | | | |
| | 40,000,000 | | Nationwide Building Society | | 1.08 | † | | 12/02/2003 | | | 39,925,600 |
| | | | |
| | 16,000,000 | | Neptune Funding Corporationª | | 1.25 | † | | 10/28/2003 | | | 15,985,000 |
5
| WELLSFARGOOVERLANDEXPRESSSWEEPFUND | | PORTFOLIOOFINVESTMENTS — SEPTEMBER 30, 2003 (UNAUDITED) |
|
OVERLANDEXPRESSSWEEPFUND
| Principal | | Security Name | | Interest Rate | | | Maturity Date | | Value |
|
| Commercial Paper (continued) |
| | | | |
| $ | 25,000,000 | | Neptune Funding Corporationª | | 0.97 | %† | | 12/18/2003 | | $ | 24,947,458 |
| | | | |
| | 26,232,000 | | Ness LLCª | | 1.04 | † | | 10/22/2003 | | | 26,216,086 |
| | | | |
| | 20,112,000 | | Ness LLCª | | 1.05 | † | | 10/24/2003 | | | 20,098,508 |
| | | | |
| | 65,000,000 | | Network Rail Commercial Paper Finance plcª | | 1.03 | † | | 11/10/2003 | | | 64,925,611 |
| | | | |
| | 50,000,000 | | Nordea North America Incorporated | | 1.08 | † | | 12/29/2003 | | | 49,866,500 |
| | | | |
| | 60,000,000 | | Perry Global Funding Limitedª | | 1.07 | † | | 11/06/2003 | | | 59,935,800 |
| | | | |
| | 30,000,000 | | Regency Markets Number 1 LLCª | | 1.10 | † | | 11/20/2003 | | | 29,954,167 |
| | | | |
| | 70,000,000 | | Spintab (Swedmortgage) AB | | 1.07 | † | | 11/07/2003 | | | 69,923,019 |
| | | | |
| | 71,937,000 | | Swedbank | | 1.08 | † | | 10/08/2003 | | | 71,921,893 |
| | | | |
| | 55,196,000 | | Ticonderoga Funding LLCª | | 1.07 | † | | 12/15/2003 | | | 55,072,959 |
| | | | |
| | 36,298,000 | | White Pine Finance LLCª | | 1.05 | † | | 10/10/2003 | | | 36,288,472 |
| | | | |
| | 49,277,000 | | White Pine Finance LLCª | | 1.19 | † | | 11/10/2003 | | | 49,211,845 |
| | | | |
| | 125,000,000 | | Yorktown Capital LLCª | | 1.07 | † | | 10/24/2003 | | | 124,914,549 |
| |
Total Commercial Paper (Cost $2,730,389,033) | | | 2,730,389,033 |
| | | | | | | | | | |
|
|
|
| Discount Notes – Agency – 6.70% |
|
| Federal Home Loan Bank – 0.52% |
| | | | |
| | 25,000,000 | | FHLB | | 1.25 | † | | 11/03/2003 | | | 24,971,354 |
| | | | | | | | | | |
|
|
|
| Federal Home Loan Mortgage Corporation – 1.90% |
| | | | |
| | 92,200,000 | | FHLMC | | 1.14 | † | | 02/26/2004 | | | 91,767,889 |
| | | | | | | | | | |
|
|
|
| Federal National Mortgage Association – 4.28% |
| | | | |
| | 70,100,000 | | FNMA | | 1.01 | † | | 10/15/2003 | | | 70,072,467 |
| | | | |
| | 6,200,000 | | FNMA | | 1.11 | † | | 01/02/2004 | | | 6,182,222 |
| | | | |
| | 80,180,200 | | FNMA | | 1.11 | † | | 01/02/2004 | | | 79,950,283 |
| | | | |
| | 50,000,000 | | FNMA | | 1.07 | † | | 01/28/2004 | | | 49,823,153 |
| | | | |
| | | | | | | | | | | | 206,028,125 |
| | | | | | | | | | |
|
|
| |
Total Discount Notes – Agency (Cost $322,767,368) | | | 322,767,368 |
| | | | | | | | | | |
|
|
|
| Fixed Rate Notes – Agency – 1.13% |
|
| Federal Home Loan Bank – 0.21% |
| | | | |
| | 10,000,000 | | FHLB | | 3.38 | | | 05/14/2004 | | | 10,124,092 |
| | | | | | | | | | |
|
|
|
| Federal National Mortgage Association – 0.92% |
| | | | |
| | 43,700,000 | | FNMA | | 5.13 | | | 02/13/2004 | | | 44,325,905 |
| | | | | | | | | | |
|
|
| |
Total Fixed Rate Notes – Agency (Cost $54,449,997) | | | 54,449,997 |
| | | | | | | | | | |
|
|
|
| Fixed Rate Notes – Corporate – 1.14% |
| | | | |
| | 35,000,000 | | Liberty Lighthouse US Capital Companyª | | 1.40 | | | 08/16/2004 | | | 34,998,474 |
| | | | |
| | 20,000,000 | | Links Finance LLC | | 2.00 | | | 10/10/2003 | | | 20,000,000 |
| |
Total Fixed Rate Notes – Corporate (Cost $54,998,474) | | | 54,998,474 |
| | | | | | | | | | |
|
|
|
| Floating Rate Commercial Paper – 0.52% |
| | | | |
| | 25,000,000 | | Liquid Funding Limited± | | 1.12 | | | 03/05/2004 | | | 25,000,000 |
| |
Total Floating Rate Commercial Paper (Cost $25,000,000) | | | 25,000,000 |
| | | | | | | | | | |
|
|
6
PORTFOLIOOFINVESTMENTS — SEPTEMBER 30, 2003 (UNAUDITED) | | WELLSFARGOOVERLANDEXPRESSSWEEPFUND |
|
OVERLANDEXPRESSSWEEPFUND
| Principal | | Security Name | | Interest Rate | | | Maturity Date | | Value |
|
| Floating Rate Funding Agreement – 0.62% |
| | | | |
| $ | 30,000,000 | | Bear Stearns Companies Incorporated± | | 1.11 | % | | 04/05/2004 | | $ | 29,998,476 |
| |
Total Floating Rate Funding Agreement (Cost $29,998,476) | | | 29,998,476 |
| | | | | | | | | | |
|
|
|
| Floating Rate Note – Agency – 1.87% |
|
| Federal Home Loan Mortgage Corporation – 1.87% |
| | | | |
| | 90,000,000 | | FHLMC± | | 1.04 | | | 02/04/2005 | | | 89,939,618 |
| |
Total Floating Rate Note – Agency (Cost $89,939,618) | | | 89,939,618 |
| | | | | | | | | | |
|
|
|
| Floating Rate Notes – Corporate – 15.92% |
| | | | |
| | 47,500,000 | | Aegon NV± | | 1.15 | | | 06/03/2004 | | | 47,471,416 |
| | | | |
| | 50,000,000 | | Allstate Financial Global Funding LLC±ª | | 1.22 | | | 12/16/2003 | | | 50,010,074 |
| | | | |
| | 29,000,000 | | American Express Centurion Bank± | | 1.12 | | | 12/23/2003 | | | 29,000,000 |
| | | | |
| | 45,000,000 | | Associates Corporation of North America± | | 1.24 | | | 06/25/2004 | | | 45,000,000 |
| | | | |
| | 23,200,000 | | Bear Stearns Companies Incorporated± | | 1.37 | | | 12/12/2003 | | | 23,206,428 |
| | | | |
| | 48,500,000 | | Bear Stearns Companies Incorporated± | | 1.56 | | | 10/22/2004 | | | 48,742,141 |
| | | | |
| | 50,000,000 | | Belford US Capital Company±ª | | 1.11 | | | 01/14/2004 | | | 50,000,000 |
| | | | |
| | 25,000,000 | | Belford US Capital Company±ª | | 1.12 | | | 03/08/2004 | | | 25,000,000 |
| | | | |
| | 20,000,000 | | Belford US Capital Company±ª | | 1.12 | | | 04/22/2004 | | | 20,000,000 |
| | | | |
| | 32,500,000 | | CC (USA) Incorporated±ª | | 1.07 | | | 07/01/2004 | | | 32,492,701 |
| | | | |
| | 50,000,000 | | CC (USA) Incorporated±ª | | 1.12 | | | 07/15/2004 | | | 50,007,916 |
| | | | |
| | 55,000,000 | | Fortis Finance NV± | | 1.12 | | | 10/03/2003 | | | 55,000,114 |
| | | | |
| | 50,000,000 | | Household Finance Corporation± | | 1.49 | | | 05/28/2004 | | | 50,122,349 |
| | | | |
| | 46,000,000 | | John Hancock Global Funding II±ª | | 1.13 | | | 12/10/2003 | | | 45,999,174 |
| | | | |
| | 15,000,000 | | John Hancock Global Funding II±ª | | 1.24 | | | 08/30/2004 | | | 15,016,700 |
| | | | |
| | 25,000,000 | | Liberty Lighthouse US Capital Company±ª | | 1.11 | | | 05/06/2004 | | | 25,000,000 |
| | | | |
| | 25,000,000 | | Northern Rock plc±ª | | 1.14 | | | 11/19/2003 | | | 25,000,000 |
| | | | |
| | 50,000,000 | | Northern Rock plc±ª | | 1.14 | | | 01/16/2004 | | | 50,000,000 |
| | | | |
| | 57,500,000 | | Northern Rock plc±ª | | 1.13 | | | 02/11/2004 | | | 57,259,954 |
| | | | |
| | 23,000,000 | | White Pine Finance LLC±ª | | 1.08 | | | 09/13/2004 | | | 22,992,263 |
| | |
Total Floating Rate Notes – Corporate (Cost $767,321,230) | | | | | 767,321,230 |
| | | | | | | | | | |
|
|
|
| Promissory Notes – 0.98% |
| | | | |
| | 20,000,000 | | Goldman Sachs Group Incorporated± | | 1.15 | | | 07/26/2004 | | | 20,000,000 |
| | | | |
| | 27,000,000 | | Goldman Sachs Group Incorporated± | | 1.19 | | | 07/26/2004 | | | 27,000,000 |
| | |
Total Promissory Notes (Cost $47,000,000) | | | | | 47,000,000 |
| | | | | | | | | | |
|
|
|
| Repurchase Agreements – 4.91% |
| | | | |
| | 50,000,000 | | Bear Stearns & Company Incorporated – 102% Collateralized by US Government Securities | | 1.13 | | | 10/01/2003 | | | 50,000,000 |
| | | | |
| | 31,614,000 | | Credit Suisse First Boston – 102% Collateralized by US Government Securities | | 1.13 | | | 10/01/2003 | | | 31,614,000 |
| | | | |
| | 55,000,000 | | Goldman Sachs Group Incorporated – 102% Collateralized by US Government Securities | | 1.16 | | | 10/01/2003 | | | 55,000,000 |
| | | | |
| | 100,000,000 | | UBS Warburg LLC – 102% Collateralized by US Government Securities | | 1.13 | | | 10/01/2003 | | | 100,000,000 |
| | |
Total Repurchase Agreements (Cost $236,614,000) | | | | | 236,614,000 |
| | | | | | | | | | |
|
|
7
| WELLSFARGOOVERLANDEXPRESSSWEEPFUND | | PORTFOLIOOFINVESTMENTS — SEPTEMBER 30, 2003 (UNAUDITED) |
|
OVERLANDEXPRESSSWEEPFUND
| Principal | | Security Name | | Interest Rate | | | Maturity Date | | Value |
|
| Time Deposits – 7.05% |
| | | | |
| $ | 50,000,000 | | Banque Nationale de Paris | | 1.16 | % | | 10/01/2003 | | $ | 50,000,000 |
| | | | |
| | 35,000,000 | | Dankske Bank A/S | | 1.16 | | | 10/01/2003 | | | 35,000,000 |
| | | | |
| | 110,000,000 | | ING Bank Brussels | | 1.18 | | | 10/01/2003 | | | 110,000,000 |
| | | | |
| | 110,000,000 | | Rabobank Nederland Utrecht | | 1.16 | | | 10/01/2003 | | | 110,000,000 |
| | | | |
| | 35,000,000 | | Societe Generale | | 1.16 | | | 10/01/2003 | | | 35,000,000 |
| |
Total Time Deposits (Cost $340,000,000) | | | 340,000,000 |
| | | | | | | | | | |
|
|
| | | |
Total Investments In Securities
(Cost $4,908,464,533)* | | 101.85 | % | | | | $ | 4,908,464,533 | |
| | | |
Other Assets and Liabilities, Net | | (1.85 | ) | | | | | (89,042,049 | ) |
| | |
|
| | | |
|
|
|
| Total Net Assets | | 100.00 | % | | | | $ | 4,819,422,484 | |
| | |
|
| | | |
|
|
|
| * | | Cost for federal income tax purposes is substantially the same as for financial reporting purposes. |
| ª | | Securities that may be resold to “Qualified institutional buyers” under rule 144A or securities offered pursuant to section 4(2) of the Securities Act of 1933, as amended. These securities have been determined to be liquid by the Adviser based on procedures approved by the Board of Trustees. |
| ± | | Variable Rate Securities. |
The accompanying notes are an integral part of these financial statements.
8
STATEMENTOFASSETSANDLIABILITIES — SEPTEMBER 30, 2003 (UNAUDITED) | | WELLSFARGOOVERLANDEXPRESSSWEEPFUND |
|
| | | Overland
Express Sweep | |
|
| |
ASSETS | | | | |
| |
INVESTMENTS: | | | | |
In securities, at amortized cost | | $ | 4,671,850,533 | |
Repurchase Agreements, at cost | | | 236,614,000 | |
| | |
|
|
|
TOTALINSECURITIES,ATMARKETVALUE | | $ | 4,908,464,533 | |
| | |
|
|
|
Cash | | | 50,062 | |
Receivable for dividends and interest and other receivables | | | 2,630,447 | |
| | |
|
|
|
TOTALASSETS | | | 4,911,145,042 | |
| | |
|
|
|
| |
LIABILITIES | | | | |
Payable for investment purchased | | | 86,132,505 | |
Dividends Payable | | | 404,813 | |
Payable for investment adviser and affiliates (Notes 3 and 7) | | | 1,833,849 | |
Payable to other related parties (1) | | | 2,428,089 | |
Accrued expenses and other liabilities | | | 923,302 | |
| | |
|
|
|
TOTALLIABILITIES | | | 91,722,558 | |
| | |
|
|
|
TOTALNETASSETS | | $ | 4,819,422,484 | |
| | |
|
|
|
| |
NETASSETSCONSISTOF: | | | | |
|
Paid-in capital | | $ | 4,819,399,306 | |
Undistributed (overdistributed) net investment income (loss) | | | (172 | ) |
Undistributed net realized gain (loss) on investments | | | 23,350 | |
| | |
|
|
|
TOTALNETASSETS | | $ | 4,819,422,484 | |
| | |
|
|
|
| |
COMPUTATIONOFNETASSETVALUEANDOFFERINGPRICEPERSHARE | | | | |
|
Net assets | | $ | 4,819,422,484 | |
Shares outstanding | | | 4,819,424,220 | |
Net asset value and offering price per share | | $ | 1.00 | |
| | |
|
|
|
| (1) | | Other related parties include the Fund’s trustees and distributor. |
9
The accompanying notes are an integral part of these financial statements.
WELLSFARGOOVERLANDEXPRESSSWEEPFUND | | STATEMENT OF OPERATIONS — FOR THE SIX MONTHS ENDED SEPTEMBER 30, 2003 (UNAUDITED) |
|
| Overland Express Sweep | |
|
| |
INVESTMENTINCOME | | | | |
Interest | | $ | 29,304,637 | |
| | |
|
|
|
TOTALINVESTMENTINCOME | | | 29,304,637 | |
| | |
|
|
|
| |
EXPENSES | | | | |
Advisory fees | | | 10,951,746 | |
Administration fees (Note 5) | | | 6,571,047 | |
Custody | | | 486,744 | |
Shareholder servicing fees | | | 7,301,164 | |
Portfolio accounting fees | | | 148,749 | |
Distribution fees | | | 7,301,164 | |
Legal and audit fees | | | 18,995 | |
Registration fees | | | 21,341 | |
Trustees’ fees | | | 3,195 | |
Shareholder reports | | | 2,792 | |
Other | | | 42,018 | |
| | |
|
|
|
TOTALEXPENSES | | | 32,848,955 | |
| | |
|
|
|
| |
LESS: | | | | |
Waived fees and reimbursed expenses (Note 5) | | | (5,987,938 | ) |
Net expenses | | | 26,861,017 | |
| | |
|
|
|
NETINVESTMENTINCOME (LOSS) | | | 2,443,620 | |
| | |
|
|
|
Net realized gain (loss) from investments | | | 20,404 | |
| | |
|
|
|
NETINCREASE (DECREASE)INNETASSETSRESULTINGFROMOPERATIONS | | $ | 2,464,024 | |
| | |
|
|
|
The accompanying notes are an integral part of these financial statements.
10
STATEMENTSOFCHANGESINNETASSETS | | WELLSFARGOOVERLANDEXPRESSSWEEPFUND |
|
| | | OVERLANDEXPRESSSWEEP
| |
| | | (Unaudited)
For the
Six Months Ended
September 30, 2003 | | | For the
Year Ended
March 31, 2003 | |
|
| | |
INCREASE (DECREASE)INNETASSETS | | | | | | | | |
Beginning net assets | | $ | 5,084,537,775 | | | $ | 6,107,674,502 | |
| | |
OPERATIONS: | | | | | | | | |
Net investment income (loss) | | | 2,443,620 | | | | 28,740,468 | |
Net realized gain (loss) from investments | | | 20,404 | | | | 3,145 | |
| | |
|
|
| |
|
|
|
NETINCREASE (DECREASE)INNETASSETSRESULTINGFROMOPERATIONS | | | 2,464,024 | | | | 28,743,613 | |
| | |
|
|
| |
|
|
|
| | |
Distributions to shareholders: | | | | | | | | |
From net investment income | | | (2,443,620 | ) | | | (28,740,468 | ) |
| | |
Capital shares transactions: | | | | | | | | |
Proceeds from shares sold | | | 6,689,441,244 | | | | 12,454,028,246 | |
Reinvestment of dividends | | | 901,245 | | | | 10,644,149 | |
Cost of shares redeemed | | | (6,955,478,184 | ) | | | (13,487,812,267 | ) |
| | |
|
|
| |
|
|
|
| | |
NETINCREASE (DECREASE)INNETASSETSRESULTINGFROMCAPITALSHARETRANSACTIONS | | | (265,135,695 | ) | | | (1,023,139,872 | ) |
| | |
|
|
| |
|
|
|
INCREASE (DECREASE)INNETASSETS | | | (265,115,291 | ) | | | (1,023,136,727 | ) |
| | |
|
|
| |
|
|
|
| | |
NETASSETS: | | | | | | | | |
|
| | |
ENDINGNETASSETS | | $ | 4,819,422,484 | | | $ | 5,084,537,775 | |
| | |
|
|
| |
|
|
|
| | |
Shares issued and redeemed: | | | | | | | | |
Shares sold | | | 6,689,441,244 | | | | 12,454,042,526 | |
Shares issued in reinvestment of dividends | | | 901,245 | | | | 10,644,149 | |
Shares redeemed | | | (6,955,478,184 | ) | | | (13,487,812,267 | ) |
| | |
|
|
| |
|
|
|
NETINCREASE (DECREASE)INSHARESOUTSTANDING | | | (265,135,695 | ) | | | (1,023,125,592 | ) |
| | |
|
|
| |
|
|
|
ENDINGBALANCEOFUNDISTRIBUTEDNETINVESTMENTINCOME (LOSS) | | $ | (172 | ) | | $ | (172 | ) |
| | |
|
|
| |
|
|
|
The accompanying notes are an integral part of these financial statements.
11
| WELLSFARGOOVERLANDEXPRESSSWEEPFUND | | FINANCIALHIGHLIGHTS |
|
| | | | |
| | | Beginning
Net Asset
Value Per
Share | | Net
Investment
Income | | Dividends
From Net
Investment
Income | | | Ending
Net Asset
Value
Per Share |
|
| | | | |
OVERLANDEXPRESSSWEEPFUND | | | | | | | | | | | |
April 1, 2003 to September 30, 2003 (Unaudited) | | $ | 1.00 | | 0.00 | | 0.00 | | | $ | 1.00 |
April 1, 2002 to March 31, 2003 | | $ | 1.00 | | 0.01 | | (0.01 | ) | | $ | 1.00 |
April 1, 2001 to March 31, 2002 | | $ | 1.00 | | 0.02 | | (0.02 | ) | | $ | 1.00 |
April 1, 2000 to March 31, 2001 | | $ | 1.00 | | 0.05 | | (0.05 | ) | | $ | 1.00 |
April 1, 1999 to March 31, 2000 | | $ | 1.00 | | 0.04 | | (0.04 | ) | | $ | 1.00 |
April 1, 1998 to March 31, 1999 | | $ | 1.00 | | 0.04 | | (0.04 | ) | | $ | 1.00 |
The accompanying notes are an integral part of these financial statements.
12
FINANCIALHIGHLIGHTS | | WELLSFARGOOVERLANDEXPRESSSWEEPFUND |
|
Ratio to Average Net Assets (Annualized)(1)
| | Total
Return(2) | | Net Assets at
End of Period
(000’s Omitted) |
Net
Investment
Income | | Net
Expenses | | Gross
Expenses | | |
|
| | | | |
| | | | | | | | | | |
| 0.10% | | 1.10% | | 1.35% | | 0.05% | | $ | 4,819,422 |
| 0.52% | | 1.25% | | 1.25% | | 0.52% | | $ | 5,084,538 |
| 2.13% | | 1.25% | | 1.25% | | 2.26% | | $ | 6,107,675 |
| 5.21% | | 1.25% | | 1.25% | | 5.35% | | $ | 4,924,869 |
| 4.29% | | 1.25% | | 1.29% | | 4.32% | | $ | 3,863,612 |
| 4.16% | | 1.25% | | 1.28% | | 4.26% | | $ | 3,097,219 |
13
| WELLSFARGOOVERLANDEXPRESSSWEEPFUND | | NOTESTOFINANCIALHIGHLIGHTS |
|
NOTESTOFINANCIALHIGHLIGHTS
| |
| (1) | | During each period, various fees and expenses were waived and reimbursed as indicated. The ratio of Gross Expenses to Average Net Assets reflects the expense ratio in the absence of any waivers and reimbursements (Note 5). |
| |
| (2) | | Total return calculations would have been lower had certain expenses not been waived or reimbursed during the periods shown. Returns for periods less than one year are not annualized. |
The accompanying notes are an integral part of these financial statements.
14
NOTESTOFINANCIALSTATEMENTS (UNAUDITED) | | WELLSFARGOOVERLANDEXPRESSSWEEPFUND |
|
1. ORGANIZATION
Wells Fargo Funds Trust (the “Trust”) is registered under the Investment Company Act of 1940, as amended (the “1940 Act”), as an open-end series management investment company. The Trust commenced operations on November 8, 1999, and is currently comprised of 68 separate series. These financial statements present the Overland Express Sweep Fund (the “Fund”), a diversified series of the Trust.
2. SIGNIFICANT ACCOUNTING POLICIES
The following significant accounting policies which are consistently followed by the Trust in the preparation of its financial statements are in conformity with accounting principles generally accepted in the United States of America (“GAAP”) for investment companies.
The preparation of financial statements in conformity with GAAP requires management to make estimates and assumptions that affect the reported amounts of assets and liabilities, disclosure of contingent assets and liabilities at the date of the financial statements and the reported amounts of revenues and expenses during the reporting period. Actual results could differ from those estimates.
SECURITYVALUATION
The Fund invests only in securities with remaining maturities not exceeding 397 days (13 months). Certain floating- and variable-rate instruments in the portfolio may have maturities in excess of 397 days, but carry a demand feature that permits the holder to tender the instruments back to the issuer at par value prior to maturity.
The Fund uses the amortized cost method to value its portfolio securities. The amortized cost method involves valuing a security at its cost, plus accretion of discount or minus amortization of premium over the period until maturity, which approximates market value. The Fund seeks to maintain a constant net asset value of $1.00 per share, although there is no assurance that it will be able to do so.
SECURITIESTRANSACTIONSANDINCOMERECOGNITION
Securities transactions are recorded on a trade date basis. Realized gains or losses are reported on the basis of identified cost of securities delivered. Interest income is accrued daily and bond discounts are accreted and premiums are amortized.
REPURCHASEAGREEMENTS
The Fund may enter into repurchase agreements and may participate in pooled repurchase agreement transactions with other funds advised by Wells Fargo Funds Management, LLC. The repurchase agreements must be fully collateralized based on values that are marked to market daily. The collateral may be held by an agent bank under a tri-party agreement. It is the Fund’s custodian’s responsibility to value collateral daily and to take action to obtain additional collateral as necessary to maintain market value equal to or greater than the resale price. The repurchase agreements held by the Fund are collateralized by instruments such as U.S. Treasury, federal agency, or high-grade corporate obligations. There could be potential loss to a Fund in the event that such Fund is delayed or prevented from exercising its rights to dispose of the collateral, including the risk of a possible decline in the value of the underlying obligations during the period in which a Fund seeks to assert its rights.
DISTRIBUTIONSTOSHAREHOLDERS
Net investment income is declared daily and distributed to shareholders monthly. Distributions to shareholders from net realized capital gains, if any, are declared and distributed at least annually.
Distributions are based on amounts calculated in accordance with the applicable federal income tax regulations, which may differ from GAAP. The timing and character of distributions made during the period from net investment income or net realized gains may also differ from their ultimate characterization for federal income tax purposes. To the extent that these differences are permanent in nature, such amounts are reclassified within the capital accounts based on their federal tax-basis treatment; temporary differences do not require reclassifications.
FEDERALINCOMETAXES
The Fund is treated as a separate entity for federal income tax purposes. It is the policy of each fund of the Trust to continue to qualify as a regulated investment company by complying with the provisions applicable to regulated investment companies, as defined under subchapter M of the Internal Revenue Code, and to make distributions of substantially all of its investment company taxable income and any net realized capital gains (after reduction for capital loss carryforwards) sufficient to relieve it from all, or substantially all, federal income taxes. Accordingly, no provision for federal income taxes was required at September 30, 2003.
15
| WELLSFARGOOVERLANDEXPRESSSWEEPFUND | | NOTESTOFINANCIALSTATEMENTS (UNAUDITED) |
|
3. ADVISORY FEES
The Trust has entered into an advisory contract on behalf of the Fund with Wells Fargo Funds Management, LLC (“Funds Management”). Pursuant to the advisory contract, Funds Management has agreed to provide the Fund with daily portfolio management for which Funds Management is entitled to be paid a monthly advisory fee at the annual rate of 0.45% of the Fund’s average daily net assets.
The Fund’s adviser is responsible for implementing the investment policies and guidelines for the Fund, and for supervising the sub-adviser who is responsible for the day-to-day portfolio management of the Fund.
Wells Capital Management Incorporated (“Wells Capital Management”), an affiliate of Funds Management, acts as investment sub-adviser to the Fund. Wells Capital Management is entitled to receive from Funds Management, as compensation for its sub-advisory services to the Fund, a monthly fee at the annual rate of 0.05% of the Fund’s average daily net assets up to $1 billion and 0.04% of the Fund’s average daily net assets in excess of $1 billion.
4. DISTRIBUTION FEES
The Trust has adopted a Distribution Plan (the “Plan”) on behalf of the Fund pursuant to Rule 12b-1 under the 1940 Act. The Plan provides that the Fund may pay to Stephens Inc. (“Stephens”), as compensation for distribution-related services or as reimbursement for distribution-related expenses, a monthly fee at an annual rate of 0.30% of the Fund’s average daily net assets. The distribution fees paid on behalf of the Fund for the six months ended September 30, 2003 are disclosed on the Statement of Operations.
5. ADMINISTRATION AND TRANSFER AGENT FEES
Through February 28, 2003, the Trust had entered into an Administration Agreement with Funds Management on behalf of the Funds. Under the Administration Agreement, Funds Management acted as administrator to the Funds and was entitled to receive, on a monthly basis, fees at the annual rate of 0.15% of each Fund’s average daily net assets.
The Trust had also entered into an agreement with Boston Financial Data Services, Inc. (“BFDS”) as the transfer agent for the Trust. Under the agreement, BFDS was entitled to receive from the Funds a per-account fee plus transaction fees, certain out-of-pocket costs and a complex based fee.
Effective March 1, 2003, the Trust has entered into a new Administration Agreement with Funds Management. Under this Agreement, for providing administrative services, which now includes paying the Funds’ fees and expenses for services provided by the Funds’ transfer agent and various sub-transfer agents and omnibus account servicers and record-keepers out of the fees it receives as administrator, Funds Management is entitled to receive an annual fee of 0.27% of the average daily net assets of the Fund.
Funds Management has committed to reimburse the Fund for some of its operating expenses or to waive a portion of the fees payable to it in order to maintain a certain operating expense ratio. Funds Management has committed through July 31, 2004 to maintain the current net operating expense ratio for the Fund. Actual reimbursements and waivers can have a positive effect on performance information. For the six months ended September 30, 2003, Funds Management waived a portion of the Fund’s expenses, first from advisory fees, and then any remaining amount consecutively from administration, custody and shareholder servicing fees collected. Expense waiver information is included in the Fund’s Statement of Operations.
6. SHAREHOLDER SERVICING FEES
The Trust has entered into a contract on behalf of the Fund with numerous shareholder servicing agents, whereby the Fund is charged an annual fee of 0.30% of the average daily net assets of the Fund for these services. The shareholder servicing fees paid on behalf of the Fund for the six months ended September 30, 2003 are disclosed on the Statement of Operations.
7. OTHER FEES AND TRANSACTIONS WITH AFFILIATES
Effective the first quarter of 2003, PFPC, Inc. (“PFPC”) serves as fund accountant for the Fund. For these services, PFPC is entitled to receive an annual asset based fund fee, an annual fixed fee of $20,000 from the Fund and is entitled to be reimbursed for all out-of-pocket expenses reasonably incurred in providing these services. Prior to PFPC, Forum Accounting Services, LLC served as fund accountant and was entitled to receive a fixed monthly per fund fee, a basis point fee of 0.0025% of the average daily net assets of the Fund, and was reimbursed for all out-of-pocket expenses reasonably incurred in providing these services.
The Trust has entered into a contract on behalf of the Fund with Wells Fargo Bank Minnesota, N.A. (“Wells Fargo Bank, MN”), whereby Wells Fargo Bank, MN is responsible for providing custody services for the Fund. Pursuant to the contract, Wells Fargo Bank, MN is entitled to certain transaction charges plus a monthly fee for custody services at the annual rate of 0.02% of the average daily net assets of the Fund.
16
BOARDOFTRUSTEES | | WELLSFARGOOVERLANDEXPRESSSWEEPFUND |
|
BOARDOFTRUSTEES
The following table provides basic information about the Board of Trustees (“Trustees”) of the Trust and supplements, and should be read in conjunction with, the Prospectus and the Statement of Additional Information* of the Fund. Each of the Trustees and Officers listed below acts in identical capacities for each of the 92 funds comprising the Trust, Wells Fargo Variable Trust and Wells Fargo Master Trust (collectively the “Fund Complex”). All of the non-interested Trustees are also members of the Audit and Nominating Committees of each Trust in the Fund Complex. The address of each Trustee and Officer is 525 Market Street, 20th Floor, San Francisco, CA 94105. Each Trustee and Officer serves an indefinite term, however, each Trustee serves such term until reaching the mandatory retirement age established by the Trustees.
INTERESTEDTRUSTEES**
| Name and Age | | Position held and
length of service*** | | Principal occupations during
past five years | | Other Directorships |
Robert C. Brown
72 | | Trustee since 1992 | | Retired. Director, Federal Farm Credit Banks Funding Corporation and Farm Credit System Financial Assistance Corporation until February 1999. | | None |
|
J. Tucker Morse
59 | | Trustee since 1987 | | Private Investor/Real Estate Developer; Chairman of White Point Capital, LLC. | | None |
|
|
| NON-INTERESTEDTRUSTEES |
| Name and Age | | Position held and length of service*** | | Principal occupations during
past five years | | Other Directorships |
Thomas S. Goho
61 | | Trustee since 1987 | | Wake Forest University, Calloway School of Business and Accountancy, Benson-Pruitt Professorship since 1999, Associate Professor of Finance 1994—1999. | | None |
|
Peter G. Gordon
61 | | Trustee since 1998 (Lead Trustee since 2001) | | Chairman, CEO, and Co-Founder of Crystal Geyser Water Company and President of Crystal Geyser Roxane Water Company. | | None |
|
Richard M. Leach
70 | | Trustee since 1987 | | Retired. Prior thereto, President of Richard M. Leach Associates (a financial consulting firm). | | None |
|
Timothy J. Penny
51 | | Trustee since 1996 | | Senior Counselor to the public relations firm of Himle-Horner and Senior Fellow at the Humphrey Institute, Minneapolis, Minnesota (a public policy organization). | | None |
|
Donald C. Willeke
63 | | Trustee since 1996 | | Principal in the law firm of Willeke & Daniels. | | None |
|
17
| WELLSFARGOOVERLANDEXPRESSSWEEPFUND | | BOARDOFTRUSTEES |
|
OFFICERS
| Name and Age | | Position held and
length of service | | Principal occupations during
past five years | | Other Directorships |
Karla M. Rabusch 44 | | President, since 2003 | | Executive Vice President of Wells Fargo Bank, N.A. President of Wells Fargo Funds Management, LLC. Senior Vice President and Chief Administrative Officer of Wells Fargo Funds Management, LLC from March 2001 to March 2003. Vice President of Wells Fargo Bank, N.A. from December 1997 to May 2000. | | None |
|
Stacie D. DeAngelo 34 | | Treasurer, since 2003 | | Vice President of Wells Fargo Bank, N.A. Vice President of Operations for Wells Fargo Funds Management, LLC. Prior thereto, Operations Manager at Scudder Weisel Capital, LLC (2000 to 2001), Director of Shareholder Services at BISYS Fund Services (1999 to 2000) and Assistant Vice President of Operations with Nicholas-Applegate Capital Management (1993 to 1999). | | None |
|
C. David Messman 43 | | Secretary, since 2000 | | Vice President and Counsel of Wells Fargo Bank, N.A. since January 1996. Vice President and Secretary of Wells Fargo Funds Management, LLC since March 2001. | | None |
|
| * | | The Statement of Additional Information includes additional information about the Fund’s Trustees and is available, without charge, upon request, by calling 1-800-222-8222. |
| ** | | Currently, two of the seven Trustees are considered “interested persons” of the Trusts as defined in the Investment Company Act of 1940. One of the interested Trustees, Robert C. Brown, owns securities of Wells Fargo & Company, and one of the interested Trustees, J. Tucker Morse, is affiliated with a government securities dealer that is registered under the Securities Exchange Act of 1934, which is not itself affiliated with Wells Fargo Funds Management, LLC. |
| *** | | Length of service dates reflects a Trustee’s commencement of service with the Trust’s predecessor entities. |
18
LISTOFABBREVIATIONS | | WELLS FARGO OVERLAND EXPRESS SWEEP FUND |
|
The following is a list of common abbreviations for terms and entities which may have appeared in this report.
| |
ABAG | | — Association of Bay Area Governments |
| |
ADR | | — American Depository Receipts |
| |
AMBAC | | — American Municipal Bond Assurance Corporation |
| |
AMT | | — Alternative Minimum Tax |
| |
ARM | | — Adjustable Rate Mortgages |
| |
BART | | — Bay Area Rapid Transit |
| |
CDA | | — Community Development Authority |
| |
CDSC | | — Contingent Deferred Sales Charge |
| |
CGIC | | — Capital Guaranty Insurance Company |
| |
CGY | | — Capital Guaranty Corporation |
| |
CMT | | — Constant Maturity Treasury |
| |
COFI | | — Cost of Funds Index |
| |
Connie Lee | | — Connie Lee Insurance Company |
| |
COP | | — Certificate of Participation |
| |
CP | | — Commercial Paper |
| |
CTF | | — Common Trust Fund |
| |
DW&P | | — Department of Water & Power |
| |
DWR | | — Department of Water Resources |
| |
EDFA | | — Education Finance Authority |
| |
FGIC | | — Financial Guaranty Insurance Corporation |
| |
FHA | | — Federal Housing Authority |
| |
FHLB | | — Federal Home Loan Bank |
| |
FHLMC | | — Federal Home Loan Mortgage Corporation |
| |
FNMA | | — Federal National Mortgage Association |
| |
FRN | | — Floating Rate Notes |
| |
FSA | | — Financial Security Assurance, Inc |
| |
GNMA | | — Government National Mortgage Association |
| |
GO | | — General Obligation |
| |
HFA | | — Housing Finance Authority |
| |
HFFA | | — Health Facilities Financing Authority |
| |
IDA | | — Industrial Development Authority |
| |
LIBOR | | — London Interbank Offered Rate |
| |
LLC | | — Limited Liability Corporation |
| |
LOC | | — Letter of Credit |
| |
LP | | — Limited Partnership |
| |
MBIA | | — Municipal Bond Insurance Association |
| |
MFHR | | — Multi-Family Housing Revenue |
| |
MUD | | — Municipal Utility District |
| |
MTN | | — Medium Term Note |
| |
PCFA | | — Pollution Control Finance Authority |
| |
PCR | | — Pollution Control Revenue |
| |
PFA | | — Public Finance Authority |
| |
PLC | | — Private Placement |
| |
PSFG | | — Public School Fund Guaranty |
| |
RAW | | — Revenue Anticipation Warrants |
| |
RDA | | — Redevelopment Authority |
| |
RDFA | | — Redevelopment Finance Authority |
| |
R&D | | — Research & Development |
| |
SFMR | | — Single Family Mortgage Revenue |
| |
STEERS | | — Structured Enhanced Return Trust |
| |
TBA | | — To Be Announced |
| |
TRAN | | — Tax Revenue Anticipation Notes |
| |
USD | | — Unified School District |
| |
V/R | | — Variable Rate |
| |
WEBS | | — World Equity Benchmark Shares |
19

More information about Wells Fargo Funds® is available free upon request. To obtain literature, please write or call: Wells Fargo Funds PO Box 8266 Boston, MA 02266-8266 Wells Fargo Funds Investor Services: 1-800-222-8222 or visit our Web site at www.wellsfargofunds.com. | | This report and the financial statements contained herein are submitted for the general information of the shareholders of the Wells Fargo Funds. If this report is used for promotional purposes, distribution of the report must be accompanied or preceded by a current prospectus. For a prospectus containing more complete information, including charges and expenses, call 1-800-222-8222. Read the prospectus carefully before you invest or send money. Wells Fargo Funds Management, LLC, a wholly-owned subsidiary of Wells Fargo & Company, provides investment advisory and administrative services for the Wells Fargo Funds. Other affiliates of Wells Fargo & Company provide sub-advisory and other services for the Funds. The Funds are distributed by Stephens Inc., Member NYSE/SIPC. Wells Fargo & Company and its affiliates are not affiliated with Stephens Inc. |
| | | NOT FDIC INSURED - NO BANK GUARANTEE - MAY LOSE VALUE | | SAR 011 (11/03) |

WELLS FARGO
FUNDS
Wells Fargo Money Market Funds
Semi-Annual Report
Wells Fargo Liquidity Reserve Money Market Fund
Investor Class
September 30, 2003
| | | WELLSFARGOMONEYMARKETFUNDS |
|
TABLEOFCONTENTS
NOT FDIC INSURED–NO BANK GUARANTEE–MAY LOSE VALUE
This page is intentionally left blank —
SHAREHOLDERLETTER | | WELLSFARGOMONEYMARKETFUNDS |
|
DEARVALUEDSHAREHOLDER,
We are pleased to provide you with this Wells Fargo Liquidity Reserve Money Market Fund semi-annual report for the six-month period ending September 30, 2003. On the following pages, you will find the money market overview and facts and figures about the Fund’s portfolio.
OVERVIEW OF FINANCIAL MARKETS
Despite attempts by the federal government to boost the economy early in the year, the economy remained mired in weakness early in the reporting period. The Federal Reserve Board (the Fed) cut short-term interest rates from 1.25% to 1% in June, the lowest level in half a century. Still, unemployment continued to rise and a record fiscal year 2003 federal budget deficit loomed on the horizon, suggesting that tax revenues were not growing fast enough to cover government spending.
Market volatility that was caused by uncertainty over the possibility of war in Iraq was followed by uncertainty over the direction and magnitude of changes in Fed policy. Mortgage refinancing and consumer spending activity remained strong despite a back-up in intermediate-term interest rates. Economic growth began picking up steam during the summer, while corporate earnings exceeded expectations. Even employment data began showing improvement in September. Indeed, there were reasons to be optimistic about the U.S. economy as the end of 2003 approached.
WELLS FARGO LIQUIDITY RESERVE MONEY MARKET FUND
The Fed’s decision to cut interest rates by just a quarter percentage point to 1% at its June 25, 2003 policy meeting brought interest rates down to levels not seen since the 1950s. Unfortunately, the rate cut did not meet investor expectations and interest rates were volatile through the end of the period in reaction to comments from the Fed and changing views on the outlook for economic growth. Despite a challenging environment for investors, the Wells Fargo Liquidity Reserve Money Market Fund achieved its investment objectives of maintaining a stable net asset value.
It is important to remember that no one can accurately predict the future direction of short-term interest rates. We continue to maintain a more prudent investment strategy and do not pursue strategies that seek to boost yield at the expense of safety and liquidity. We believe that the pursuit of additional yield creates volatility that can potentially undermine Fund performance during uncertain markets.
INVESTMENT STRATEGIES IN CHALLENGING TIMES
Investors are counting on reasonably good earnings growth to propel stocks higher during the balance of 2003, overcoming potential hurdles to any future rally created by seemingly “rich” valuations and by upward pressure on interest rates. With pricing power still weak throughout much of the economy, most businesses will rely on further cost cutting to propel margins enough to sustain double-digit earnings growth. Meanwhile, bond investors may insulate portfolios from a potential rise in interest rates by gradually moving away from longer-term securities as well as by investing in high coupon bonds or mortgage-backed securities that hold up better in a rising interest rate environment. Regardless of what lies ahead, investors should continue to follow the fundamentals of investing — asset allocation and diversification — in an effort to achieve their long-term financial goals.
We would like to thank you for choosing Wells Fargo Funds. We appreciate your confidence in us during this uncertain time period. Through each market cycle, we are committed to helping you meet your financial needs. If you have any questions about your investment, please contact your investment professional or call us at 1-800-222-8222. You may also visit our Web site at www.wellsfargofunds.com.
Sincerely,

Karla M. Rabusch
President
Wells Fargo Funds
1
This page is intentionally left blank —
MONEYMARKETOVERVIEW | | WELLSFARGOMONEYMARKETFUNDS |
|
MONEYMARKETOVERVIEW
This report covers the six-month period ended September 30, 2003.
This reporting period can be divided into two distinct segments. During the first three months of the period, interest rates moved lower as slow economic growth led many to believe that the Federal Reserve Board (the Fed) would continue its attempt to spur growth by aggressively lowering short-term interest rates. The second half of the period was characterized by rising interest rates, the result of the Fed’s interest rate cut in June not meeting investor expectations.
PRIME MONEY MARKET SECURITIES
For the first three months of the period, the yield curve flattened. Short-term money market investments (those maturing in less than three months) remained stable, while longer-term money market investments (those maturing in more than thirteen months) declined. By mid-June, the yield on one-year investments had declined 25 basis points to below 1%, while the Federal Funds rate remained near 1.25%. Despite warnings that their expectations were unrealistic, investors continued to expect a 50 basis point reduction in the Federal Funds rate in June. When the rate was lowered only 25 basis points, the market began to re-evaluate its outlook for continued regular rate cuts and the yields on longer-term money market investments began to move higher. By the end of the period, the one-year London Interbank Offered Rate (LIBOR) stood at 1.30% after peaking at 1.50% near the end of August.
The amount of commercial paper outstanding continued to decline during the period, as issuers took advantage of the record low bond yields to extend their debt. The amount of top rated commercial paper outstanding fell by more than 5% during the period, from $1.207 trillion to $1.144 trillion, reflecting a decrease of nearly 20% from the peak of $1.413 trillion in December 2000.
Credit quality also remained a concern during the reporting period. While the pace of downgrades slowed somewhat, accounting issues at some of the Government Sponsored Entities, and questions about corporate governance policies at the New York Stock Exchange, did not help to restore investor confidence in management policies, abilities, and integrity.
U.S. TREASURY SECURITIES
Although the Fed eventually did cut the Federal Funds rate by 25 basis points to 1.00%, Treasury bills had been pricing based on the assumption that there would be a 50 basis point cut. Even the one-year Treasury note traded below 0.90% in the days preceding the June rate cut. These low rates coincided with quarter-end demand pressures in June, causing the short-end of the Treasury market (less than three months) to remain overpriced for an unusually longer period of time than what typically follows a market disappointment. Eventually Treasury bill pricing became more reasonable, and the longer end of the market became relatively cheap. As budget deficit projections ballooned, expectations of a greater supply of Treasury bills and the general expectation of higher interest rates drove the price of Treasury bills into the mid 0.90’s to low 1.00’s.
Over this reporting period, the supply of Treasury bills greatly contracted: the issuance of Treasury bills for the first week of April stood at $72 billion, and declined to $44 billion by the end of the period. While the April issuance was largely due to seasonal factors, Treasury bill issuance did not meet expectations as the period progressed and Treasuries became more expensive. Evidence of this could be seen during September, when the U.S. Treasury Department had to issue cash management bills to cover a temporary cash shortfall early in the month. Continued issuance may point to the need for the Treasury to increase auction size in the coming months.
U.S. GOVERNMENT AGENCY SECURITIES
Spreads between U.S. Government agency offerings and money market securities continued to tighten during the period. Interest rates, concerns over the ability of government agencies to manage interest rate risk, losses in the Federal Home Loan Bank of New York’s bond portfolio, and an accounting scandal at the Federal Home Loan Mortgage Corporation (FHLMC) drove yields on U.S. Government agency securities higher on a relative basis. For a period in June, after the FHLMC accounting issues were made public, FHLMC discount notes traded more cheaply than A-1/P-1 bank commercial paper. Eighteen month floating rate paper from the Federal National Mortgage Association (FNMA) and FHLMC traded at similar discount margins to one-year asset-backed conduit program floaters. The number of callable issues continued to increase, but at a slower pace as rates declined in September. By the end of the period, changes in the regulation of FNMA and FHLMC seemed inevitable (although it may be a long and arduous process).
3
| WELLSFARGOMONEYMARKETFUNDS | | MONEYMARKETOVERVIEW |
|
TAX-FREE SECURITIES
The number of new municipal issues continued to increase swiftly as issuers found that it was often cheaper to issue variable rate securities than use the swap market to hedge interest rate risk. As variable rates surged to 103% of the one-month LIBOR in mid-April, the vast supply of variable rate demand notes increased, making it somewhat easier to invest the seasonal July cash inflows.
Fixed rate municipal securities were volatile during the reporting period. One-year paper started the period at 1.10% and interest rates plummeted to 0.80% at the peak of note season in late June. California was on the verge of running out of cash, as legislative parties were at odds over approving a budget. Standard and Poor’s was one of the driving forces behind breaking the stalemate by downgrading the state from A to BBB in late July. The price of California Revenue Anticipation Warrants (RAWs) plummeted as their yields skyrocketed from 1.15% to 2.00%.
Texas issued record-breaking Tax and Revenue Anticipation Notes in late August, exceeding municipal demand and splitting the one-year sector into three markets — the general market, the California market, and the Texas market. The one-year municipal securities markets finally settled down in early September as rates hovered near 1.00% for general market paper, 1.10% for Texas paper, and 1.60% for California RAWs.
STRATEGIC OUTLOOK
While the overnight interest rate has been stable, longer money market rates have increased considerably since the mid-point of the reporting period. With the U.S. economy picking up steam and the U.S. dollar weakening overseas, we believe that interest rates may continue to move higher. That increase, when accompanied by outflows from institutional investors, could trigger a challenging period for all money market funds. However, we do not believe that aggressively positioning a money market fund to boost its yield at the risk of jeopardizing its net asset value (NAV) would be appropriate, and we will continue to position the portfolios and select their investments in an ongoing effort to maintain a stable $1.00 NAV.
The views expressed are as of September 30, 2003 and are those of the Funds’ manager. The views are subject to change at any time in response to changing circumstances in the market and are not intended to predict or guarantee the future performance of any individual security, market sector or the markets generally, or the Wells Fargo Money Market Funds.
4
| PERFORMANCEHIGHLIGHTS | | WELLSFARGOMONEYMARKETFUNDS |
|
WELLSFARGOLIQUIDITYRESERVEMONEYMARKETFUND —INVESTOR CLASS
INVESTMENT OBJECTIVE
The Wells Fargo Liquidity Reserve Money Market Fund (the Fund) seeks current income, while preserving capital and liquidity.
FUNDMANAGERS
Dave Sylvester
Laurie White
INCEPTIONDATE
07/31/02
AVERAGE ANNUAL TOTAL RETURN1(%) (AS OF SEPTEMBER 30, 2003)
| | | 6 Month* | | | 1-Year | | | Life of Fund | |
| | | |
Wells Fargo Liquidity Reserve Money Market Fund – Investor Class | | 0.10 | % | | 0.40 | % | | 0.48 | % |
| | | |
Benchmark | | | | | | | | | |
| | | |
iMoneyNet First Tier Retail Money Fund Average2 | | 0.23 | % | | 0.62 | % | | 0.73 | % |
* Returns for periods of less than one year are not annualized.
| FUND YIELD SUMMARY (AS OF SEPTEMBER 30, 2003) |
|
| |
7-Day Current Yield | | 0.12% |
| |
7-Day Compound Yield | | 0.12% |
| |
30-Day Simple Yield | | 0.11% |
| |
30-Day Compound Yield | | 0.11% |
| FUND CHARACTERISTICS3 (AS OF SEPTEMBER 30, 2003) |
|
| |
Average Maturity | | 50 days |
| |
Number of Holdings | | 76 |
PORTFOLIO COMPOSITION3 (AS OF SEPTEMBER 30, 2003)
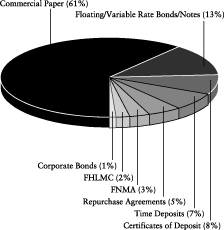
MATURITY DISTRIBUTION3 (AS OF SEPTEMBER 30, 2003)
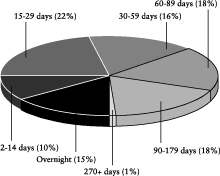
The Fund is sold without a front-end sales charge or contingent deferred sales charge. Other fees and expenses apply to a continued investment in the Fund and are described in the Fund’s Statement of Additional Information. An investment in a Wells Fargo Money Market Fund is not insured or guaranteed by the Federal Deposit Insurance Corporation or any other government agency. Although the Wells Fargo Money Market Funds seek to preserve the value of your investment at $1.00 per share, it is possible to lose money by investing in money market funds.
1 Figures quoted represent past performance, which is no guarantee of future results. Investment returns will fluctuate. The Fund’s yield figures more closely reflect the current earnings of the Fund than the total return figures. The Fund’s Adviser has committed through July 31, 2004 to waive fees and/or reimburse expenses to the extent necessary to maintain a certain net operating expense ratio for the Fund. The Fund’s Adviser also has voluntarily waived fees and/or reimbursed expenses, which reduced operating expenses. Actual reductions of operating expenses increased total return to shareholders. Without these reductions, the Fund’s 7-day current yield would have been 0.00%.
2 The iMoneyNet First Tier Retail Money Fund Average is an average of non-government retail funds that do not hold any second tier securities. Portfolio holdings of first tier funds include U.S. Treasury securities, U.S. other securities, repos, time deposits, domestic bank obligations, foreign bank obligations, first tier commercial paper, floating rate notes and asset-backed commercial paper.
3 Portfolio holdings and characteristics are subject to change.
5
| WELLSFARGOMONEYMARKETFUNDS | | PORTFOLIOOFINVESTMENTS — SEPTEMBER 30, 2003 (UNAUDITED) |
|
LIQUIDITYRESERVEMONEYMARKETFUND
| Principal | | Security Name | | Interest Rate | | | Maturity Date | | Value |
| | | |
| Certificates of Deposit – 7.52% | | | | | | | | |
| | | | |
| $ | 20,000,000 | | Bank of Nova Scotia Portland | | 1.10 | % | | 03/16/2004 | | $ | 20,000,000 |
| | | | |
| | 20,000,000 | | Credit Agricole Indosuez | | 1.03 | | | 10/03/2003 | | | 20,000,000 |
| | | | |
| | 17,500,000 | | Royal Bank of Canada New York± | | 1.04 | | | 09/03/2004 | | | 17,493,705 |
| | | | |
| | 30,000,000 | | Svenska Handelsbanken | | 1.18 | | | 12/03/2003 | | | 29,995,025 |
| | | | |
| | 10,000,000 | | Unicredito Italiano SPA | | 1.04 | | | 10/20/2003 | | | 10,000,000 |
| | | |
Total Certificates of Deposit (Cost $97,488,730) | | | | | | | | 97,488,730 |
| | | | | | | | | | |
|
|
| | | |
| Commercial Paper – 58.80% | | | | | | | | |
| | | | |
| | 30,000,000 | | Aegon Funding Corporation^ | | 1.07 | † | | 11/14/2003 | | | 29,960,950 |
| | | | |
| | 12,500,000 | | Allied Irish Banks North America Incorporated | | 1.04 | † | | 12/15/2003 | | | 12,472,917 |
| | | | |
| | 25,000,000 | | Amstel Funding Corporation^ | | 0.94 | † | | 12/29/2003 | | | 24,941,903 |
| | | | |
| | 10,000,000 | | Amstel Funding Corporation^ | | 1.14 | † | | 03/16/2004 | | | 9,947,117 |
| | | | |
| | 25,000,000 | | Banco Bilbao Vizcaya Argentaria Puerto Rico^ | | 1.10 | † | | 12/18/2003 | | | 24,940,417 |
| | | | |
| | 5,000,000 | | CC (USA) Incorporated^ | | 1.11 | † | | 11/10/2003 | | | 4,993,833 |
| | | | |
| | 15,000,000 | | CDC Commercial Paper Corporation^ | | 1.15 | † | | 10/01/2003 | | | 15,000,000 |
| | | | |
| | 15,000,000 | | Charta LLC^ | | 1.04 | † | | 10/23/2003 | | | 14,990,467 |
| | | | |
| | 10,000,000 | | Citigroup Global | | 1.03 | † | | 10/01/2003 | | | 10,000,000 |
| | | | |
| | 18,469,000 | | Concord Minuteman Capital Company LLC^ | | 1.28 | † | | 10/08/2003 | | | 18,464,403 |
| | | | |
| | 15,000,000 | | Concord Minuteman Capital Company LLC^ | | 1.10 | † | | 11/18/2003 | | | 14,978,000 |
| | | | |
| | 15,000,000 | | Crown Point Capital Company LLC^ | | 1.12 | † | | 10/06/2003 | | | 14,997,667 |
| | | | |
| | 10,000,000 | | Crown Point Capital Company LLC^ | | 1.08 | † | | 11/07/2003 | | | 9,988,900 |
| | | | |
| | 10,000,000 | | Eureka Securitization Incorporated^ | | 1.04 | † | | 10/22/2003 | | | 9,993,933 |
| | | | |
| | 20,000,000 | | Eureka Securitization Incorporated^ | | 1.08 | † | | 11/20/2003 | | | 19,970,000 |
| | | | |
| | 10,000,000 | | Galaxy Funding Incorporated^ | | 1.09 | † | | 11/05/2003 | | | 9,989,403 |
| | | | |
| | 35,000,000 | | Gemini Securitization Incorporated^ | | 1.07 | † | | 11/13/2003 | | | 34,955,268 |
| | | | |
| | 25,000,000 | | Govco Incorporated^ | | 1.07 | † | | 10/03/2003 | | | 24,998,514 |
| | | | |
| | 10,000,000 | | Governor & Company of The Bank of Ireland^ | | 1.21 | † | | 02/06/2004 | | | 9,956,978 |
| | | | |
| | 15,000,000 | | Grampian Funding LLC^ | | 1.07 | † | | 11/18/2003 | | | 14,978,600 |
| | | | |
| | 20,000,000 | | Grampian Funding LLC^ | | 1.07 | † | | 12/17/2003 | | | 19,954,228 |
| | | | |
| | 10,000,000 | | Holdenby Capital Company LLC^ | | 1.07 | † | | 10/23/2003 | | | 9,993,461 |
| | | | |
| | 10,000,000 | | HSBC Bank Canada^ | | 1.22 | † | | 02/04/2004 | | | 9,957,300 |
| | | | |
| | 30,000,000 | | HSBC USA Incorporated | | 1.07 | † | | 10/15/2003 | | | 29,987,517 |
| | | | |
| | 35,000,000 | | Irish Life & Permanent plc^ | | 1.10 | † | | 12/10/2003 | | | 34,925,139 |
| | | | |
| | 10,000,000 | | KBC Financial Products International Limited^ | | 1.06 | † | | 11/05/2003 | | | 9,989,694 |
| | | | |
| | 20,000,000 | | KBC Financial Products International Limited^ | | 1.08 | † | | 11/12/2003 | | | 19,974,800 |
| | | | |
| | 20,000,000 | | Lexington Parker Capital Corporation^ | | 1.14 | † | | 02/27/2004 | | | 19,905,633 |
| | | | |
| | 15,000,000 | | Lexington Parker Capital Corporation^ | | 1.16 | † | | 03/02/2004 | | | 14,926,050 |
| | | | |
| | 25,000,000 | | Natexis Banque Populaires | | 1.04 | † | | 10/07/2003 | | | 24,995,667 |
| | | | |
| | 35,000,000 | | National Bank of New Zealand International Limited^ | | 1.09 | † | | 12/15/2003 | | | 34,920,521 |
| | | | |
| | 25,000,000 | | Neptune Funding Corporation^ | | 1.18 | † | | 02/03/2004 | | | 24,897,569 |
| | | | |
| | 15,000,000 | | Ness LLC^ | | 1.04 | † | | 10/22/2003 | | | 14,990,900 |
| | | | |
| | 20,000,000 | | Ness LLC^ | | 1.05 | † | | 10/24/2003 | | | 19,986,583 |
| | | | |
| | 8,000,000 | | Network Rail Commercial Paper Finance plc^ | | 1.03 | † | | 10/20/2003 | | | 7,995,651 |
| | | | |
| | 10,000,000 | | Network Rail Commercial Paper Finance plc^ | | 1.01 | † | | 12/18/2003 | | | 9,978,117 |
| | | | |
| | 10,000,000 | | Perry III Funding Corporation^ | | 1.00 | † | | 10/02/2003 | | | 9,999,722 |
| | | | |
| | 25,000,000 | | Perry III Funding Corporation^ | | 1.13 | † | | 03/03/2004 | | | 24,879,153 |
6
PORTFOLIOOFINVESTMENTS — SEPTEMBER 30, 2003 (UNAUDITED) | | WELLSFARGOMONEYMARKETFUNDS |
|
LIQUIDITYRESERVEMONEYMARKETFUND
| Principal | | Security Name | | Interest Rate | | | Maturity Date | | Value |
| | | |
| Commercial Paper (continued) | | | | | | | | |
| | | | |
| $ | 35,000,000 | | Regency Markets Number 1 LLC^ | | 1.08 | %† | | 12/19/2003 | | $ | 34,917,050 |
| | | | |
| | 35,000,000 | | Transamerica Asset Funding Corporation^ | | 1.08 | † | | 10/21/2003 | | | 34,979,000 |
| | | | |
| | 9,900,000 | | White Pine Finance LLC^ | | 1.25 | † | | 10/14/2003 | | | 9,895,531 |
| | | | |
| | 10,149,000 | | White Pine Finance LLC^ | | 1.05 | † | | 11/10/2003 | | | 10,137,159 |
| | | |
Total Commercial Paper (Cost $762,705,715) | | | | | | | | 762,705,715 |
| | | | | | | | | | |
|
|
| | | |
| Discount Notes – Agency – 5.00% | | | | | | | | |
| | | |
| Federal National Mortgage Association – 5.00% | | | | | | | | |
| | | | |
| | 40,000,000 | | FNMA | | 1.08 | † | | 12/31/2003 | | | 39,890,800 |
| | | | |
| | 25,000,000 | | FNMA | | 1.11 | † | | 01/02/2004 | | | 24,928,313 |
| | | |
Total Discount Notes – Agency (Cost $64,819,113) | | | | | | | | 64,819,113 |
| | | | | | | | | | |
|
|
| | | |
| Fixed Rate Note – Agency – 0.31% | | | | | | | | |
| | | |
| Federal Home Loan Bank – 0.31% | | | | | | | | |
| | | | |
| | 4,000,000 | | FHLB | | 3.38 | | | 05/14/2004 | | | 4,049,388 |
| |
Total Fixed Rate Note – Agency (Cost $4,049,388) | | | 4,049,388 |
| | | | | | | | | | |
|
|
|
| Fixed Rate Notes – Corporate – 1.16% |
| | | | |
| | 10,000,000 | | Liberty Lighthouse US Capital Company^ | | 1.40 | | | 08/16/2004 | | | 9,999,564 |
| | | | |
| | 5,000,000 | | Links Finance LLC | | 2.00 | | | 10/10/2003 | | | 5,000,000 |
| | | |
Total Fixed Rate Notes – Corporate (Cost $14,999,564) | | | | | | | | 14,999,564 |
| | | | | | | | | | |
|
|
|
| Floating Rate Commercial Paper – 1.93% |
| | | | |
| | 25,000,000 | | Liquid Funding Limited± | | 1.11 | | | 03/26/2004 | | | 25,000,000 |
| | | |
Total Floating Rate Commercial Paper (Cost $25,000,000) | | | | | | | | 25,000,000 |
| | | | | | | | | | |
|
|
|
| Floating Rate Funding Agreement – 0.77% |
| | | | |
| | 10,000,000 | | Bear Stearns Companies Incorporated± | | 1.11 | | | 04/05/2004 | | | 9,999,492 |
| | | |
Total Floating Rate Funding Agreement (Cost $9,999,492) | | | | | | | | 9,999,492 |
| | | | | | | | | | |
|
|
| | | |
| Floating Rate Note – Agency – 1.93% | | | | | | | | |
| | | |
| Federal Home Loan Mortgage Corporation – 1.93% | | | | | | | | |
| | | | |
| | 25,000,000 | | FHLMC± | | 1.04 | | | 02/04/2005 | | | 24,983,227 |
| |
Total Floating Rate Note – Agency (Cost $24,983,227) | | | 24,983,227 |
| | | | | | | | | | |
|
|
|
| Floating Rate Notes – Corporate – 12.11% |
| | | | |
| | 6,000,000 | | Abbey National Treasury Services plc± | | 1.12 | | | 06/10/2004 | | | 6,000,000 |
| | | | |
| | 4,000,000 | | American Express Centurion Bank± | | 1.12 | | | 12/23/2003 | | | 4,000,000 |
| | | | |
| | 15,000,000 | | Bear Stearns Companies Incorporated± | | 1.56 | | | 10/22/2004 | | | 15,074,889 |
| | | | |
| | 20,000,000 | | Belford US Capital Company±^ | | 1.13 | | | 11/26/2003 | | | 19,999,387 |
| | | | |
| | 10,000,000 | | CC (USA) Incorporated±^ | | 1.07 | | | 07/01/2004 | | | 9,997,754 |
| | | | |
| | 6,000,000 | | John Hancock Global Funding II±^ | | 1.13 | | | 12/10/2003 | | | 5,999,892 |
| | | | |
| | 10,000,000 | | John Hancock Global Funding II±^ | | 1.24 | | | 08/30/2004 | | | 10,011,133 |
| | | | |
| | 10,000,000 | | Liberty Lighthouse US Capital Company±^ | | 1.11 | | | 02/27/2004 | | | 9,999,591 |
| | | | |
| | 15,000,000 | | Liberty Lighthouse US Capital Company±^ | | 1.09 | | | 07/19/2004 | | | 14,998,807 |
| | | | |
| | 16,000,000 | | Merrill Lynch & Company Incorporated± | | 1.26 | | | 10/01/2003 | | | 16,000,000 |
| | | | |
| | 10,000,000 | | Northern Rock plc±^ | | 1.14 | | | 01/16/2004 | | | 10,000,000 |
7
| WELLSFARGOMONEYMARKETFUNDS | | PORTFOLIOOFINVESTMENTS — SEPTEMBER 30, 2003 (UNAUDITED) |
|
LIQUIDITYRESERVEMONEYMARKETFUND
| Principal | | Security Name | | Interest Rate | | | Maturity Date | | Value |
| | | |
| Floating Rate Notes – Corporate – (continued) | | | | | | | | |
| | | | |
| $ | 10,000,000 | | Northern Rock plc±^ | | 1.13 | % | | 02/11/2004 | | $ | 9,958,253 |
| | | | |
| | 10,000,000 | | Tango Finance Corporation±^ | | 1.12 | | | 12/15/2003 | | | 10,000,000 |
| | | | |
| | 15,000,000 | | White Pine Finance LLC±^ | | 1.08 | | | 06/15/2004 | | | 14,997,669 |
| | | |
Total Floating Rate Notes – Corporate (Cost $157,037,375) | | | | | | | | 157,037,375 |
| | | | | | | | | | |
|
|
|
| Promissory Notes – 0.92% |
| | | | |
| | 5,000,000 | | Goldman Sachs Group Incorporated± | | 1.15 | | | 07/26/2004 | | | 5,000,000 |
| | | | |
| | 7,000,000 | | Goldman Sachs Group Incorporated± | | 1.19 | | | 07/26/2004 | | | 7,000,000 |
| | | |
Total Promissory Notes (Cost $12,000,000) | | | | | | | | 12,000,000 |
| | | | | | | | | | |
|
|
| | | |
| Repurchase Agreements – 4.56% | | | | | | | | |
| | | | |
| | 39,174,000 | | Bear Stearns & Company Incorporated – 102% Collateralized by US Government Securities | | 1.13 | | | 10/01/2003 | | | 39,174,000 |
| | | | |
| | 20,000,000 | | Goldman Sachs Group Incorporated – 102% Collaterized by US Government Securities | | 1.16 | | | 10/01/2003 | | | 20,000,000 |
| | | |
Total Repurchase Agreements (Cost $59,174,000) | | | | | | | | 59,174,000 |
| | | | | | | | | | |
|
|
| | | |
| Time Deposits – 6.94% | | | | | | | | |
| | | | |
| | 20,000,000 | | Banque Nationale de Paris | | 1.16 | | | 10/01/2003 | | | 20,000,000 |
| | | | |
| | 35,000,000 | | ING Bank Brussels | | 1.18 | | | 10/01/2003 | | | 35,000,000 |
| | | | |
| | 35,000,000 | | Rabobank Nederland Utrecht | | 1.16 | | | 10/01/2003 | | | 35,000,000 |
| | | |
Total Time Deposits (Cost $90,000,000) | | | | | | | | 90,000,000 |
| | | | | | | | | | |
|
|
| | | |
Total Investments In Securities
(Cost $1,322,256,604)* | | 101.95 | % | | | | $ | 1,322,256,604 | |
| | | |
Other Assets and Liabilities, Net | | (1.95 | ) | | | | | (25,227,916 | ) |
| | |
|
| | | |
|
|
|
| Total Net Assets | | 100.00 | % | | | | $ | 1,297,028,688 | |
| | |
|
| | | |
|
|
|
| * | | Cost for federal income tax purposes is substantially the same as for financial reporting purposes. |
| ^ | | Securities that may be resold to “Qualified institutional buyers” under rule 144A or securities offered pursuant to section 4(2) of the Securities Act of 1933, as amended. These securities have been determined to be liquid by the Adviser based on procedures approved by the Board of Trustees. |
| ± | | Variable Rate Securities. |
The accompanying notes are an integral part of these financial statements.
8
STATEMENTOFASSETSANDLIABILITIES — SEPTEMBER 30, 2003 (UNAUDITED) | | WELLSFARGOMONEYMARKETFUNDS |
|
| | | Liquidity Reserve
Money Market |
|
| |
ASSETS | | | |
| |
INVESTMENTS: | | | |
In securities, at amortized cost | | $ | 1,263,082,604 |
Repurchase Agreements, at cost | | | 59,174,000 |
Cash | | | 311 |
Receivable for dividends and interest and other receivables | | | 667,512 |
Prepaid expenses and other assets | | | 212,878 |
| | |
|
|
TOTALASSETS | | | 1,323,137,305 |
| | |
|
|
| |
LIABILITIES | | | |
Payable for investments purchased | | | 24,928,313 |
Dividends Payable | | | 113,425 |
Payable for investment adviser and affiliates (Note 3) | | | 514,279 |
Payable to other related parties(1) | | | 533,726 |
Accrued expenses and other liabilities | | | 18,874 |
| | |
|
|
TOTALLIABILITIES | | | 26,108,617 |
| | |
|
|
TOTALNETASSETS | | $ | 1,297,028,688 |
| | |
|
|
| |
NETASSETSCONSISTOF: | | | |
|
Paid-in capital | | $ | 1,297,005,643 |
Undistributed (overdistributed) net investment income | | | 0 |
Undistributed net realized gain (loss) on investments | | | 23,045 |
| | |
|
|
TOTALNETASSETS | | $ | 1,297,028,688 |
| | |
|
|
| |
COMPUTATIONOFNETASSETVALUEANDOFFERINGPRICEPERSHARE | | | |
|
Net Assets | | $ | 1,297,028,688 |
Shares outstanding | | | 1,297,005,643 |
Net asset value and offering price per share | | $ | 1.00 |
| | |
|
|
| (1) | | Other related parties include the Fund’s trustees and distributor. |
The accompanying notes are an integral part of these financial statements.
9
WELLSFARGOMONEYMARKETFUNDS | | STATEMENTOFOPERATIONS — FORTHESIXMONTHSENDEDSEPTEMBER 30, 2003 (UNAUDITED) |
|
| | | Liquidity Reserve
Money Market | |
|
| |
INVESTMENTINCOME | | | | |
Interest | | $ | 7,166,686 | |
| | |
|
|
|
TOTALINVESTMENTINCOME | | | 7,166,686 | |
| | |
|
|
|
| |
EXPENSES | | | | |
Advisory fees | | | 2,088,500 | |
Administration fees (Note 3) | | | 1,611,128 | |
Custody | | | 119,343 | |
Shareholder servicing fees | | | 1,491,786 | |
Portfolio accounting fees | | | 44,039 | |
Distribution fees | | | 1,491,786 | |
Legal and audit fees | | | 14,040 | |
Registration fees | | | 7,659 | |
Trustees’ fees | | | 3,195 | |
Shareholder reports | | | 501 | |
Other | | | 1,654 | |
| | |
|
|
|
TOTALEXPENSES | | | 6,873,631 | |
| | |
|
|
|
| |
LESS: | | | | |
Waived fees and reimbursed expenses (Note 3) | | | (894,929 | ) |
| | |
|
|
|
Net Expenses | | | 5,978,702 | |
| | |
|
|
|
NETINVESTMENTINCOME (LOSS) | | | 1,187,984 | |
| | |
|
|
|
NETINCREASE (DECREASE)INNETASSETSRESULTINGFROMOPERATIONS | | $ | 1,187,984 | |
| | |
|
|
|
The accompanying notes are an integral part of these financial statements.
10
STATEMENTSOFCHANGESINNETASSETS (UNAUDITED) | | WELLSFARGOMONEYMARKETFUNDS |
|
| | | LIQUIDITYRESERVEMONEYMARKET
| |
| | | (Unaudited)
For the Six Months Ended
September 30, 2003 | | | For the Period
from July 31, 2002
to March 31, 2003(1) | |
|
| | |
INCREASE (DECREASE)INNETASSETS | | | | | | | | |
Beginning net assets | | $ | 1,054,549,239 | | | $ | 0 | |
| | |
OPERATIONS: | | | | | | | | |
Net investment income (loss) | | | 1,187,984 | | | | 3,521,099 | |
Net realized gain (loss) on sale of investments | | | 0 | | | | 23,045 | |
| | |
|
|
| |
|
|
|
NETINCREASE (DECREASE)INNETASSETSRESULTINGFROMOPERATIONS | | | 1,187,984 | | | | 3,544,144 | |
| | |
|
|
| |
|
|
|
| | |
Distributions to shareholders: | | | | | | | | |
From net investment income | | | (1,187,984 | ) | | | (3,521,099 | ) |
| | |
Capital shares transactions: | | | | | | | | |
Proceeds from shares sold – Investor Class | | | 535,789,475 | | | | 1,376,644,127 | |
Reinvestment of dividends – Investor Class | | | 1,381,093 | | | | 3,214,473 | |
Cost of shares redeemed – Investor Class | | | (294,691,119 | ) | | | (325,332,406 | ) |
| | |
|
|
| |
|
|
|
| | |
NETINCREASE (DECREASE)INNETASSETSRESULTINGFROMCAPITAL
SHARETRANSACTIONS –INVESTORCLASS | | | 242,479,449 | | | | 1,054,526,194 | |
| | |
|
|
| |
|
|
|
INCREASE (DECREASE)INNETASSETS | | | 242,479,449 | | | | 1,054,549,239 | |
| | |
|
|
| |
|
|
|
| | |
NETASSETS: | | | | | | | | |
|
| | |
ENDINGNETASSETS | | $ | 1,297,028,688 | | | $ | 1,054,549,239 | |
| | |
Shares Issued and Redeemed: | | | | | | | | |
Shares sold – Investor Class | | | 535,789,475 | | | | 1,376,644,127 | |
Shares issued in reinvestment of dividends – Investor Class | | | 1,381,093 | | | | 3,214,473 | |
Shares redeemed – Investor Class | | | (294,691,119 | ) | | | (325,332,406 | ) |
| | |
|
|
| |
|
|
|
NETINCREASE (DECREASE)INSHARESOUTSTANDING –INVESTORCLASS | | | 242,479,449 | | | | 1,054,526,194 | |
| | |
|
|
| |
|
|
|
ENDINGBALANCEOFUNDISTRIBUTEDNETINVESTMENTINCOME (LOSS) | | $ | 0 | | | $ | 0 | |
| | |
|
|
| |
|
|
|
| (1) | | Fund commenced operations on July 31, 2002. |
The accompanying notes are an integral part of these financial statements.
11
| WELLSFARGOMONEYMARKETFUNDS | | FINANCIALHIGHLIGHTS |
|
| | | Beginning
Net Asset
Value Per
Share | | Net
Investment
Income | | Net Realized
and
Unrealized
Gain on
Investments | | Dividends
From Net
Investment
Income |
|
| | | | |
LIQUIDITYRESERVEMONEYMARKETFUND | | | | | | | | | |
| | | | |
INVESTORCLASS | | | | | | | | | |
April 1, 2003 to September 30, 2003 (Unaudited) | | $ | 1.00 | | 0.00 | | 0.00 | | 0.00 |
July 31, 2002(2) to March 31, 2003 | | $ | 1.00 | | 0.00 | | 0.00 | | 0.00 |
The accompanying notes are an integral part of these financial statements.
12
FINANCIALHIGHLIGHTS | | WELLSFARGOMONEYMARKETFUNDS |
|
Distributions
From Net
Realized
Gains | | Ending
Net Asset
Value Per
Share | | Ratio To Average Net Assets (Annualized)(1)
| | | Total
Return(3) | | | Net Assets at
End of Period
(000’s Omitted) |
| | | Net Investment
Income | | | Net
Expenses | | Gross
Expenses | | | |
| | | | | | | | | | | | | | | | | | |
|
| | | | | | |
| | | | | | | | | | | | | | | | | | |
| | | | | | |
| | | | | | | | | | | | | | | | | | |
| 0.00 | | $ | 1.00 | | 0.20 | % | | 1.00% | | 1.15 | % | | 0.10 | % | | $ | 1,297,029 |
| 0.00 | | $ | 1.00 | | 0.64 | % | | 0.92% | | 1.07 | % | | 0.46 | % | | $ | 1,054,549 |
13
| WELLSFARGOMONEYMARKETFUNDS | | NOTESTOFINANCIALHIGHLIGHTS |
|
NOTESTOFINANCIALHIGHLIGHTS
| |
| (1) | | During each period, various fees and expenses were waived and reimbursed as indicated. The ratio of Gross Expenses to Average Net Assets reflects the expense ratio in the absence of any waivers and reimbursements (Note 3). |
| |
| (2) | | Commencement of operations. |
| |
| (3) | | Total return calculations would have been lower had certain expenses not been waived or reimbursed during the periods shown. Returns for periods less than one year are not annualized. |
The accompanying notes are an integral part of these financial statements.
14
NOTESTOFINANCIALSTATEMENTS (UNAUDITED) | | WELLSFARGOMONEYMARKETFUNDS |
|
1. ORGANIZATION
Wells Fargo Funds Trust (the “Trust”) is registered under the Investment Company Act of 1940, as amended (the “1940 Act”), as an open-end management investment company. The Trust commenced operations on November 8, 1999, and is currently comprised of 68 separate series. These financial statements present the Liquidity Reserve Money Market Fund (the “Fund”), a diversified series of the Trust.
2. SIGNIFICANT ACCOUNTING POLICIES
The following significant accounting policies which are consistently followed by the Trust in the preparation of its financial statements are in conformity with accounting principles generally accepted in the United States of America (“GAAP”) for investment companies.
The preparation of financial statements in conformity with GAAP requires management to make estimates and assumptions that affect the reported amounts of assets and liabilities, disclosure of contingent assets and liabilities at the date of the financial statements and the reported amounts of revenues and expenses during the reporting period. Actual results could differ from those estimates.
SECURITYVALUATION
The Fund invests only in securities with remaining maturities not exceeding 397 days (13 months). Certain floating- and variable-rate instruments in the portfolio may have maturities in excess of 397 days, but carry a demand feature that permits the holder to tender the instruments back to the issuer at par value prior to maturity.
The Fund uses the amortized cost method to value its portfolio securities. The amortized cost method involves valuing a security at its cost, plus accretion of discount or minus amortization of premium over the period until maturity, which approximates market value. The Fund seeks to maintain a constant net asset value of $1.00 per share, although there is no assurance that it will be able to do so.
SECURITIESTRANSACTIONSANDINCOMERECOGNITION
Securities transactions are recorded on a trade date basis. Realized gains or losses are reported on the basis of identified cost of securities delivered. Interest income is accrued daily and bond discounts are accreted and premiums are amortized.
REPURCHASEAGREEMENTS
The Fund may enter into repurchase agreements and may participate in pooled repurchase agreement transactions with other funds advised by Wells Fargo Funds Management, LLC. The repurchase agreements must be fully collateralized based on values that are marked to market daily. The collateral may be held by an agent bank under a tri-party agreement. It is the Fund’s custodian’s responsibility to value collateral daily and to take action to obtain additional collateral as necessary to maintain market value equal to or greater than the resale price. The repurchase agreements held by the Fund are collateralized by instruments such as U.S. Treasury, federal agency, or high-grade corporate obligations. There could be potential loss to a Fund in the event that such Fund is delayed or prevented from exercising its rights to dispose of the collateral, including the risk of a possible decline in the value of the underlying obligations during the period in which a Fund seeks to assert its rights.
DISTRIBUTIONSTOSHAREHOLDERS
Net investment income is declared daily and distributed to shareholders monthly. Distributions to shareholders from net realized capital gains, if any, are declared and distributed at least annually.
Distributions are based on amounts calculated in accordance with the applicable federal income tax regulations, which may differ from GAAP. The timing and character of distributions made during the period from net investment income or net realized gains may also differ from their ultimate characterization for federal income tax purposes. To the extent that these differences are permanent in nature, such amounts are reclassified within the capital accounts based on their federal tax-basis treatment; temporary differences do not require reclassifications.
FEDERALINCOMETAXES
The Fund is treated as a separate entity for federal income tax purposes. It is the policy of each fund of the Trust to continue to qualify as a regulated investment company by complying with the provisions applicable to regulated investment companies, as defined under subchapter M of the Internal Revenue Code, and to make distributions of substantially all of its investment company taxable income and any net realized capital gains (after reduction for capital loss carryforwards) sufficient to relieve it from all, or substantially all, federal income taxes. Accordingly, no provision for federal income taxes was required at September 30, 2003.
15
| WELLSFARGOMONEYMARKETFUNDS | | NOTESTOFINANCIALSTATEMENTS (UNAUDITED) |
|
3. AGREEMENTS AND OTHER TRANSACTIONS WITH AFFILIATES
Wells Fargo Funds Management, LLC (“Funds Management”), an indirect and wholly-owned subsidiary of Wells Fargo & Company serves as adviser to the Fund and is responsible for implementing the investment policies and guidelines for the Fund, and for supervising the sub-adviser who is responsible for the day-to-day portfolio management of the Fund. Pursuant to the advisory contract, Funds Management has agreed to provide the Fund with daily portfolio management for which it is entitled to be paid a monthly advisory fee at the annual rate of 0.35% of the Fund’s average daily net assets.
Wells Capital Management Incorporated (“Wells Capital Management”), an affiliate of Funds Management, acts as investment sub-adviser to the Fund and is responsible for the day-to-day portfolio management of the Fund. Wells Capital Management is entitled to receive from Funds Management, as compensation for its sub-advisory services to the Fund, a monthly fee at the annual rate of 0.05% of the Fund’s average daily net assets up to $1 billion and 0.04% of the Fund’s average daily net assets in excess of $1 billion.
Through February 28, 2003, the Trust had entered into an Administration Agreement with Funds Management on behalf of the Fund. Under the Administration Agreement, Funds Management acted as administrator to the Fund and was entitled to receive, on a monthly basis, fees at the annual rate of 0.15% of the Fund’s average daily net assets.
The Trust had also entered into an agreement with Boston Financial Data Services, Inc. (“BFDS”) as the transfer agent for the Trust. Under the agreement, BFDS was entitled to receive from the Fund a per-account fee plus transaction fees, certain out-of-pocket costs and a complex based fee.
Effective March 1, 2003, the Trust has entered into a new Administration Agreement with Funds Management on behalf of the Fund. Under this Agreement, for providing administrative services, which now includes paying the Fund’s fees and expenses for services provided by the Fund’s transfer agent and various sub-transfer agents and omnibus account servicers and record-keepers out of the fees it receives as administrator, Funds Management is entitled to receive an annual fee of 0.27% of the average daily net assets of the Fund.
Funds Management has committed to reimburse the Fund for some of its operating expenses or to waive a portion of the fees payable to it in order to maintain a certain operating expense ratio. Funds Management has committed through July 31, 2004 to maintain the current net operating expense ratio for the Fund. Actual reimbursements and waivers can have a positive effect on performance information. For the six months ended September 30, 2003, Funds Management waived a portion of the Fund’s expenses, first from advisory fees, and then any remaining amount consecutively from administration, custody and shareholder servicing fees collected. Expense waiver information is included in the Fund’s Statement of Operations.
Effective the first quarter of 2003, PFPC, Inc. (“PFPC”) serves as fund accountant for the Fund. For these services, PFPC is entitled to receive an annual asset based fund fee, an annual fixed fee of $20,000 from the Fund and is entitled to be reimbursed for all out-of-pocket expenses reasonably incurred in providing these services. Prior to PFPC, Forum Accounting Services, LLC served as fund accountant and was entitled to receive a fixed monthly per fund fee, a basis point fee of 0.0025% of the average daily net assets of the Fund, and was reimbursed for all out-of-pocket expenses reasonably incurred in providing these services.
The Trust has entered into a contract on behalf of the Fund with Wells Fargo Bank Minnesota, N.A. (“Wells Fargo Bank, MN”), whereby Wells Fargo Bank, MN is responsible for providing custody services for the Fund. Pursuant to the contract, Wells Fargo Bank, MN is entitled to certain transaction charges plus a monthly fee for custody services at the annual rate of 0.02% of the average daily net assets of the Fund.
On behalf of the Fund, the Trust may enter into servicing agreements with certain financial institutions, securities dealers, and other industry professionals (collectively, “Shareholder Servicing Agents”) for the provision of certain services to Fund shareholders. For the services provided pursuant to a Shareholder Servicing Agreement, the Fund may pay each Shareholder Servicing Agent an annual fee of up to 0.25% of the average daily net asset value of the Fund’s shares beneficially owned by customers of the Shareholder Servicing Agent.
The Trust has adopted a Distribution Plan (the “Plan”) on behalf of the Fund pursuant to Rule 12b-1 under the 1940 Act for the Investor Class shares of the Fund. The Plan provides that the Fund may pay to Stephens Inc. (“Stephens”), as compensation for distribution-related services or as reimbursement for distribution-related expenses, an annual fee of up to 0.25% of the Fund’s average daily net assets attributable to the Investor Class. The annual fee is paid monthly based on the average daily net assets attributable to the Class. The distribution fees paid on behalf of the Fund for the six months ended September 30, 2003 are disclosed on the Statement of Operations.
16
BOARDOFTRUSTEES | | WELLSFARGOMONEYMARKETFUNDS |
|
BOARDOFTRUSTEES
The following table provides basic information about the Board of Trustees (“Trustees”) of the Trust and supplements, and should be read in conjunction with, the Prospectus and the Statement of Additional Information* of the Fund. Each of the Trustees listed below acts in identical capacities for each of the 92 funds comprising the Trust, Wells Fargo Variable Trust and Wells Fargo Master Trust (collectively the “Fund Complex”). All of the non-interested Trustees are also members of the Audit and Nominating Committees of each Trust in the Fund Complex. The address of each Trustee and Officer is 525 Market Street, 20th Floor, San Francisco, CA 94105. Each Trustee and Officer serves an indefinite term, however, each Trustee serves such term until reaching the mandatory retirement age established by the Trustees.
INTERESTEDTRUSTEES **
| Name and Age | | Position held and
length of service *** | | Principal occupations during
past five years | | Other Directorships |
Robert C. Brown
72 | | Trustee since 1992 | | Retired. Director, Federal Farm Credit Banks Funding Corporation and Farm Credit System Financial Assistance Corporation until February 1999. | | None |
|
J. Tucker Morse
59 | | Trustee since 1987 | | Private Investor/Real Estate Developer; Chairman of White Point Capital, LLC. | | None |
|
|
| NON-INTERESTEDTRUSTEES |
| Name and Age | | Position held and length of service *** | | Principal occupations during
past five years | | Other Directorships |
Thomas S. Goho
61 | | Trustee since 1987 | | Wake Forest University, Calloway School of Business and Accountancy, Benson-Pruitt Professorship since 1999, Associate Professor of Finance 1994 – 1999. | | None |
|
Peter G. Gordon
61 | | Trustee since 1998 (Lead Trustee since 2001) | | Chairman, CEO, and Co-Founder of Crystal Geyser Water Company and President of Crystal Geyser Roxane Water Company. | | None |
|
Richard M. Leach 70 | | Trustee since 1987 | | Retired. Prior thereto, President of Richard M. Leach Associates (a financial consulting firm). | | None |
|
Timothy J. Penny
51 | | Trustee since 1996 | | Senior Counselor to the public relations firm of Himle-Horner and Senior Fellow at the Humphrey Institute, Minneapolis, Minnesota (a public policy organization). | | None |
|
Donald C. Willeke
63 | | Trustee since 1996 | | Principal in the law firm of Willeke & Daniels. | | None |
|
17
| WELLSFARGOMONEYMARKETFUNDS | | BOARDOFTRUSTEES |
|
OFFICERS
| Name and Age | | Position held and
length of service | | Principal occupations during
past five years | | Other Directorships |
Karla M. Rabusch 44 | | President, since 2003 | | Executive Vice President of Wells Fargo Bank, N.A. President of Wells Fargo Funds Management, LLC. Senior Vice President and Chief Administrative Officer of Wells Fargo Funds Management, LLC from March 2001 to March 2003. Vice President of Wells Fargo Bank, N.A. from December 1997 to May 2000. | | None |
|
Stacie D. DeAngelo 34 | | Treasurer, since 2003 | | Vice President of Wells Fargo Bank, N.A. Vice President of Operations for Wells Fargo Funds Management, LLC. Prior thereto, Operations Manager at Scudder Weisel Capital, LLC (2000 to 2001), Director of Shareholder Services at BISYS Fund Services (1999 to 2000) and Assistant Vice President of Operations with Nicholas-Applegate Capital Management (1993 to 1999). | | None |
|
C. David Messman 43 | | Secretary, since 2000 | | Vice President and Counsel of Wells Fargo Bank, N.A. since January 1996. Vice President and Secretary of Wells Fargo Funds Management, LLC since March 2001. | | None |
|
| * | | The Statement of Additional Information includes additional information about the Funds’ Trustees and is available, without charge, upon request, by calling 1-800-222-8222. |
| ** | | Currently, two of the seven Trustees are considered “interested persons” of the Trusts as defined in the Investment Company Act of 1940. One of the interested Trustees, Robert C. Brown, owns securities of Wells Fargo & Company, and one of the interested Trustees, J. Tucker Morse, is affiliated with a government securities dealer that is registered under the Securities Exchange Act of 1934, which is not itself affiliated with Wells Fargo Funds Management, LLC. |
| *** | | Length of service dates reflects a Trustee’s commencement of service with the Trust’s predecessor entities. |
18
LISTOFABBREVIATIONS | | WELLSFARGOMONEYMARKETFUNDS |
|
The following is a list of common abbreviations for terms and entities which may have appeared in this report.
| |
ABAG | | — Association of Bay Area Governments |
| |
ADR | | — American Depository Receipts |
| |
AMBAC | | — American Municipal Bond Assurance Corporation |
| |
AMT | | — Alternative Minimum Tax |
| |
ARM | | — Adjustable Rate Mortgages |
| |
BART | | — Bay Area Rapid Transit |
| |
CDA | | — Community Development Authority |
| |
CDSC | | — Contingent Deferred Sales Charge |
| |
CGIC | | — Capital Guaranty Insurance Company |
| |
CGY | | — Capital Guaranty Corporation |
| |
CMT | | — Constant Maturity Treasury |
| |
COFI | | — Cost of Funds Index |
| |
Connie Lee | | — Connie Lee Insurance Company |
| |
COP | | — Certificate of Participation |
| |
CP | | — Commercial Paper |
| |
CTF | | — Common Trust Fund |
| |
DW&P | | — Department of Water & Power |
| |
DWR | | — Department of Water Resources |
| |
EDFA | | — Education Finance Authority |
| |
FGIC | | — Financial Guaranty Insurance Corporation |
| |
FHA | | — Federal Housing Authority |
| |
FHLB | | — Federal Home Loan Bank |
| |
FHLMC | | — Federal Home Loan Mortgage Corporation |
| |
FNMA | | — Federal National Mortgage Association |
| |
FRN | | — Floating Rate Notes |
| |
FSA | | — Financial Security Assurance, Inc |
| |
GNMA | | — Government National Mortgage Association |
| |
GO | | — General Obligation |
| |
HFA | | — Housing Finance Authority |
| |
HFFA | | — Health Facilities Financing Authority |
| |
IDA | | — Industrial Development Authority |
| |
LIBOR | | — London Interbank Offered Rate |
| |
LLC | | — Limited Liability Corporation |
| |
LOC | | — Letter of Credit |
| |
LP | | — Limited Partnership |
| |
MBIA | | — Municipal Bond Insurance Association |
| |
MFHR | | — Multi-Family Housing Revenue |
| |
MUD | | — Municipal Utility District |
| |
MTN | | — Medium Term Note |
| |
PCFA | | — Pollution Control Finance Authority |
| |
PCR | | — Pollution Control Revenue |
| |
PFA | | — Public Finance Authority |
| |
PLC | | — Private Placement |
| |
PSFG | | — Public School Fund Guaranty |
| |
RAW | | — Revenue Anticipation Warrants |
| |
RDA | | — Redevelopment Authority |
| |
RDFA | | — Redevelopment Finance Authority |
| |
R&D | | — Research & Development |
| |
SFMR | | — Single Family Mortgage Revenue |
| |
STEERS | | — Structured Enhanced Return Trust |
| |
TBA | | — To Be Announced |
| |
TRAN | | — Tax Revenue Anticipation Notes |
| |
USD | | — Unified School District |
| |
V/R | | — Variable Rate |
| |
WEBS | | — World Equity Benchmark Shares |
19

More information about Wells Fargo Funds® is available free upon request. To obtain literature, please write or call: Wells Fargo Funds PO Box 8266 Boston, MA 02266-8266 Wells Fargo Funds Investor Services: 1-800-222-8222 or visit our Web site at www.wellsfargofunds.com. | | This report and the financial statements contained herein are submitted for the general information of the shareholders of the Wells Fargo Funds. If this report is used for promotional purposes, distribution of the report must be accompanied or preceded by a current prospectus. For a prospectus containing more complete information, including charges and expenses, call 1-800-222-8222. Read the prospectus carefully before you invest or send money. Wells Fargo Funds Management, LLC, a wholly-owned subsidiary of Wells Fargo & Company, provides investment advisory and administrative services for the Wells Fargo Funds. Other affiliates of Wells Fargo & Company provide sub-advisory and other services for the Funds. The Funds are distributed by Stephens Inc., Member NYSE/SIPC. Wells Fargo & Company and its affiliates are not affiliated with Stephens Inc. |
| | | NOT FDIC INSURED - NO BANK GUARANTEE - MAY LOSE VALUE | | SAR 027 (11/03) |
Not applicable.
| ITEM 3. | | AUDIT COMMITTEE FINANCIAL EXPERT |
Not applicable.
| ITEM 4. | | PRINCIPAL ACCOUNTANT FEES AND SERVICES |
Not applicable.
| ITEM 7. | | DISCLOSURE OF PROXY VOTING POLICIES AND PROCEDURES FOR CLOSED-END MANAGEMENT INVESTMENT COMPANIES |
Not applicable.
| ITEM 9. | | CONTROLS AND PROCEDURES |
(a)(i) The President and Treasurer have concluded that the Wells Fargo Funds Trust (the “Trust”) disclosure controls and procedures (as defined in Rule 30a-3(c) under the Investment Company Act of 1940) provide reasonable assurances that material information relating to the Trust is made known to them by the appropriate persons based on their evaluation of these controls and procedures as of a date within 90 days of the filing of this report.
(a)(ii) There were no significant changes in the Trust’s internal controls or in other factors that could significantly affect these controls subsequent to the date of the evaluation referenced in (a)(i) above.
(a)(1) Not applicable.
(a)(2) Certification pursuant to Rule 30a-2(a) under the Investment Company Act of 1940 (17 CFR 270.30a-2(a)) attached hereto as Exhibit 99.CERT.
(b) Certification pursuant to Rule 30a-2(b) under the Investment Company Act of 1940 (17 CFR 270.30a-2(b)) attached hereto as Exhibit 99.906CERT.
SIGNATURES
Pursuant to the requirements of the Securities Exchange Act of 1934 and the Investment Company Act of 1940, the registrant has duly caused this report to be signed on its behalf by the undersigned, thereunto duly authorized.
Wells Fargo Funds Trust |
| |
| By: | | /s/ Karla M. Rabusch |
| |
|
| | | Karla M. Rabusch President |
Date: November 24, 2003
SIGNATURES
Pursuant to the requirements of the Securities Exchange Act of 1934 and the Investment Company Act of 1940, the registrant has duly caused this report to be signed on its behalf by the undersigned, thereunto duly authorized.
| Wells Fargo Funds Trust |
| |
| By: | | /s/ Stacie D. DeAngelo |
| |
|
| | | Stacie D. DeAngelo Treasurer |
Date: November 24, 2003