
UNITED STATES
SECURITIES AND EXCHANGE COMMISSION
Washington, D.C. 20549
FORM N-CSRS
CERTIFIED SHAREHOLDER REPORT OF REGISTERED
MANAGEMENT INVESTMENT COMPANIES
Investment Company Act file number: 811-09253
Wells Fargo Funds Trust
(Exact name of registrant as specified in charter)
525 Market St., San Francisco, CA 94105
(Address of principal executive offices) (Zip code)
C. David Messman
Wells Fargo Funds Management, LLC
525 Market St., San Francisco, CA 94105
(Name and address of agent for service)
Registrant’s telephone number, including area code: 800-222-8222
Date of fiscal year end: October 31
Date of reporting period: Registrant is making a filing for 16 of its series, Wells Fargo Advantage Emerging Markets Local Bond Fund, Wells Fargo Advantage International Bond Fund, Wells Fargo Advantage Strategic Income Fund, Wells Fargo Advantage Asia Pacific Fund, Wells Fargo Advantage Diversified International Fund, Wells Fargo Advantage Emerging Markets Equity Fund, Wells Fargo Advantage Emerging Markets Equity Income Fund, Wells Fargo Advantage Global Opportunities Fund, Wells Fargo Advantage International Equity Fund, Wells Fargo Advantage Intrinsic World Equity Fund, Wells Fargo Advantage Intrinsic Small Cap Value Fund, Wells Fargo Advantage Small Cap Opportunities Fund, Wells Fargo Advantage Small Cap Value Fund, Wells Fargo Advantage Small/Mid Cap Value Fund, Wells Fargo Advantage Special Small Cap Value Fund, and Wells Fargo Advantage Traditional Small Cap Growth Fund. Each series has an April 30, 2013 fiscal year end.
| ITEM 1. | REPORT TO STOCKHOLDERS |

Wells Fargo Advantage
Emerging Markets Local Bond Fund

Semi-Annual Report
April 30, 2013

Reduce clutter. Save trees.
Sign up for electronic delivery of prospectuses and shareholder reports at wellsfargo.com/advantagedelivery
Contents
The views expressed and any forward-looking statements are as of April 30, 2013, unless otherwise noted, and are those of the Fund managers and/or Wells Fargo Funds Management, LLC. Discussions of individual securities, or the markets generally, or any Wells Fargo Advantage Fund are not intended as individual recommendations. Future events or results may vary significantly from those expressed in any forward-looking statements; the views expressed are subject to change at any time in response to changing circumstances in the market. Wells Fargo Funds Management, LLC, disclaims any obligation to publicly update or revise any views expressed or forward-looking statements.
NOT FDIC INSURED ¡ NO BANK GUARANTEE ¡ MAY LOSE VALUE

Wells Fargo investment history
| | |
| 1932 | | Keystone creates one of the first mutual fund families. |
| 1971 | | Wells Fargo & Company introduces one of the first institutional index funds. |
| 1978 | | Wells Fargo applies Markowitz and Sharpe’s research on Modern Portfolio Theory to introduce one of the industry’s first tactical asset allocation models in institutional separately managed accounts. |
| 1984 | | Wells Fargo Stagecoach Funds launches its first asset allocation fund. |
| 1989 | | The Tactical Asset Allocation (TAA) Model is first applied to Wells Fargo’s asset allocation mutual funds. |
| 1994 | | Wells Fargo introduces the LifePath Funds, one of the first suites of target date funds (now the Wells Fargo Advantage Dow Jones Target Date FundsSM). |
| 1996 | | Evergreen Investments and Keystone Funds merge. |
| 1997 | | Wells Fargo launches the Wells Fargo Advantage WealthBuilder PortfoliosSM, a fund-of-funds suite of products that includes the use of quantitative models to shift assets among investment styles. |
| 1999 | | Norwest Advantage Funds and Stagecoach Funds are reorganized into Wells Fargo Funds after the merger of Norwest and Wells Fargo. |
| 2002 | | Evergreen Retail and Evergreen Institutional companies form the umbrella asset management company, Evergreen Investments. |
| 2005 | | The integration of Strong Funds with Wells Fargo Funds creates Wells Fargo Advantage Funds, resulting in one of the top 20 mutual fund companies in the United States. |
| 2006 | | Wells Fargo Advantage Funds relaunches the target date product line as Wells Fargo Advantage Dow Jones Target Date Funds. |
| 2010 | | The mergers and reorganizations of Evergreen and Wells Fargo Advantage mutual funds are completed, unifying the families under the brand of Wells Fargo Advantage Funds. |
Wells Fargo Advantage Funds®
Wells Fargo Advantage Funds skillfully guides institutions, financial advisors, and individuals through the investment terrain to help them reach their financial objectives. Everything we do on behalf of investors is backed by our unique combination of qualifications.
Strength
Our organization is built on the standards of integrity and service established by our parent company—Wells Fargo & Company—more than 150 years ago. And, because we’re part of a highly diversified financial enterprise, we offer the depth of resources to help investors succeed.
Expertise
Our multi-boutique model offers investors access to the independent thinking of premier investment managers that have been chosen for their time-tested strategies. While each team specializes in a specific investment strategy, collectively they provide investors a wide choice of distinct investment styles. Our dedication to investment excellence doesn’t end with our expertise in manager selection—risk management, analysis, and rigorous ongoing review seek to ensure each manager’s investment process remains consistent.
Partnership
Our collaborative approach is built around understanding the needs and goals of our clients. By adhering to core principles of sound judgment and steady guidance, we support you through every stage of the investment decision process.
Carefully consider the investment objectives, risks, charges, and expenses before investing. For a current prospectus and, if available, a summary prospectus, for Wells Fargo Advantage Funds, containing this and other information, visit wellsfargoadvantagefunds.com. Read it carefully before investing.
Wells Fargo Funds Management, LLC, a wholly owned subsidiary of Wells Fargo & Company, provides investment advisory and administrative services for Wells Fargo Advantage Funds. Other affiliates of Wells Fargo & Company provide subadvisory and other services for the Funds. The Funds are distributed by Wells Fargo Funds Distributor, LLC, Member FINRA/SIPC, an affiliate of Wells Fargo & Company.
“Dow Jones®” and “Dow Jones Target Date IndexesSM” are service marks of Dow Jones Trademark Holdings LLC (“Dow Jones”); have been licensed to CME Group Index Services LLC (“CME Indexes”); and have been sublicensed for use for certain purposes by Global Index Advisors, Inc., and Wells Fargo Funds Management, LLC. The Wells Fargo Advantage Dow Jones Target Date FundsSM, based on the Dow Jones Target Date Indexes, are not sponsored, endorsed, sold, or promoted by Dow Jones, CME Indexes, or their respective affiliates, and none of them makes any representation regarding the advisability of investing in such product(s).
NOT FDIC INSURED ¡ NO BANK GUARANTEE ¡ MAY LOSE VALUE
Not part of the semi-annual report.
Wells Fargo Advantage Funds offers more than 100 mutual funds across a wide range of asset classes, representing over $228 billion in assets under management, as of April 30, 2013.
| | | | |
| Equity funds | | | | |
Asia Pacific Fund | | Enterprise Fund† | | Opportunity Fund† |
C&B Large Cap Value Fund | | Global Opportunities Fund | | Precious Metals Fund |
C&B Mid Cap Value Fund | | Growth Fund | | Premier Large Company Growth Fund |
Capital Growth Fund | | Index Fund | | Small Cap Opportunities Fund |
Common Stock Fund | | International Equity Fund | | Small Cap Value Fund |
Disciplined U.S. Core Fund | | International Value Fund | | Small Company Growth Fund |
Discovery Fund† | | Intrinsic Small Cap Value Fund | | Small Company Value Fund |
Diversified Equity Fund | | Intrinsic Value Fund | | Small/Mid Cap Value Fund |
Diversified International Fund | | Intrinsic World Equity Fund | | Special Mid Cap Value Fund |
Emerging Growth Fund | | Large Cap Core Fund | | Special Small Cap Value Fund |
Emerging Markets Equity Fund | | Large Cap Growth Fund | | Specialized Technology Fund |
Emerging Markets Equity Income Fund | | Large Company Value Fund | | Traditional Small Cap Growth Fund |
Endeavor Select Fund† | | Omega Growth Fund | | Utility and Telecommunications Fund |
| Bond funds | | | | |
Adjustable Rate Government Fund | | High Yield Municipal Bond Fund | | Short-Term Bond Fund |
California Limited-Term Tax-Free Fund | | Income Plus Fund | | Short-Term High Yield Bond Fund |
California Tax-Free Fund | | Inflation-Protected Bond Fund | | Short-Term Municipal Bond Fund |
Colorado Tax-Free Fund | | Intermediate Tax/AMT-Free Fund | | Strategic Income Fund |
Conservative Income Fund | | International Bond Fund | | Strategic Municipal Bond Fund |
Core Bond Fund | | Minnesota Tax-Free Fund | | Ultra Short-Term Income Fund |
Emerging Markets Local Bond Fund | | Municipal Bond Fund | | Ultra Short-Term Municipal Income Fund |
Government Securities Fund | | North Carolina Tax-Free Fund | | Wisconsin Tax-Free Fund |
High Income Fund | | Pennsylvania Tax-Free Fund | | |
High Yield Bond Fund | | Short Duration Government Bond Fund | | |
| Asset allocation funds | | | | |
Absolute Return Fund | | WealthBuilder Equity Portfolio† | | Target 2020 Fund† |
Asset Allocation Fund | | WealthBuilder Growth Allocation Portfolio† | | Target 2025 Fund† |
Diversified Capital Builder Fund | | WealthBuilder Growth Balanced Portfolio† | | Target 2030 Fund† |
Diversified Income Builder Fund | | WealthBuilder Moderate Balanced Portfolio† | | Target 2035 Fund† |
Growth Balanced Fund | | WealthBuilder Tactical Equity Portfolio† | | Target 2040 Fund† |
Index Asset Allocation Fund | | Target Today Fund† | | Target 2045 Fund† |
Moderate Balanced Fund | | Target 2010 Fund† | | Target 2050 Fund† |
WealthBuilder Conservative Allocation Portfolio† | | Target 2015 Fund† | | Target 2055 Fund† |
| Money market funds | | | | |
100% Treasury Money Market Fund | | Heritage Money Market Fund† | | National Tax-Free Money Market Fund |
California Municipal Money Market Fund | | Money Market Fund | | Treasury Plus Money Market Fund |
Cash Investment Money Market Fund | | Municipal Cash Management Money Market Fund | | |
Government Money Market Fund | | Municipal Money Market Fund | | |
| Variable trust funds1 | | | | |
VT Discovery Fund† | | VT Intrinsic Value Fund | | VT Small Cap Growth Fund |
VT Index Asset Allocation Fund | | VT Omega Growth Fund | | VT Small Cap Value Fund |
VT International Equity Fund | | VT Opportunity Fund† | | VT Total Return Bond Fund |
An investment in a money market fund is not insured or guaranteed by the Federal Deposit Insurance Corporation or any other government agency. Although the Wells Fargo Advantage Money Market Funds seek to preserve the value of your investment at $1.00 per share, it is possible to lose money by investing in a money market fund.
| 1. | The variable trust funds are generally available only through insurance company variable contracts. |
| † | In this report, the Wells Fargo Advantage Discovery FundSM, Wells Fargo Advantage Endeavor Select FundSM, Wells Fargo Advantage Enterprise FundSM, Wells Fargo Advantage Opportunity FundSM, Wells Fargo Advantage WealthBuilder Conservative Allocation PortfolioSM, Wells Fargo Advantage WealthBuilder Equity PortfolioSM, Wells Fargo Advantage WealthBuilder Growth Allocation PortfolioSM, Wells Fargo Advantage WealthBuilder Growth Balanced PortfolioSM, Wells Fargo Advantage WealthBuilder Moderate Balanced PortfolioSM, Wells Fargo Advantage WealthBuilder Tactical Equity PortfolioSM, Wells Fargo Advantage Dow Jones Target Today FundSM, Wells Fargo Advantage Dow Jones Target 2010 FundSM, Wells Fargo Advantage Dow Jones Target 2015 FundSM, Wells Fargo Advantage Dow Jones Target 2020 FundSM, Wells Fargo Advantage Dow Jones Target 2025 FundSM, Wells Fargo Advantage Dow Jones Target 2030 FundSM, Wells Fargo Advantage Dow Jones Target 2035 FundSM, Wells Fargo Advantage Dow Jones Target 2040 FundSM, Wells Fargo Advantage Dow Jones Target 2045 FundSM, Wells Fargo Advantage Dow Jones Target 2050 FundSM, Wells Fargo Advantage Dow Jones Target 2055 FundSM, Wells Fargo Advantage Heritage Money Market FundSM, Wells Fargo Advantage VT Discovery FundSM, and Wells Fargo Advantage VT Opportunity FundSM are referred to as the Discovery Fund, Endeavor Select Fund, Enterprise Fund, Opportunity Fund, WealthBuilder Conservative Allocation Portfolio, WealthBuilder Equity Portfolio, WealthBuilder Growth Allocation Portfolio, WealthBuilder Growth Balanced Portfolio, WealthBuilder Moderate Balanced Portfolio, WealthBuilder Tactical Equity Portfolio, Target Today Fund, Target 2010 Fund, Target 2015 Fund, Target 2020 Fund, Target 2025 Fund, Target 2030 Fund, Target 2035 Fund, Target 2040 Fund, Target 2045 Fund, Target 2050 Fund, Target 2055 Fund, Heritage Money Market Fund, VT Discovery Fund, and VT Opportunity Fund, respectively. |
Not part of the semi-annual report.
| | | | |
| 2 | | Wells Fargo Advantage Emerging Markets Local Bond Fund | | Letter to shareholders (unaudited) |

Karla M. Rabusch
President
Wells Fargo Advantage Funds
During the period, global fixed-income markets trended toward higher bond prices and lower yields but fluctuated between periods of risk aversion and corresponding recoveries in investor confidence.
Dear Valued Shareholder:
We are pleased to offer you this semi-annual report for the Wells Fargo Advantage Emerging Markets Local Bond Fund for the six-month period ended April 30, 2013. During the period, global fixed-income markets trended toward higher bond prices and lower yields but fluctuated between periods of risk aversion and corresponding recoveries in investor confidence. On the whole, global bond markets generated positive returns during the period, benefiting from deepening rallies in the corporate bond and securitized sectors and most notably in high yield and emerging markets debt. The lower-rated credit tiers and longest-maturity segments of the fixed-income markets outperformed the higher-quality and shorter-maturity segments during the period, overcoming spates of risk aversion that flared up intermittently.
Global credit markets rallied after European Central Bank (ECB) actions.
The six-month period started after the watershed announcements of the ECB in late summer 2012, which largely declared that the euro would be preserved and that every measure would be taken to fortify the European credit markets. These actions bolstered the global credit markets and inspired an ongoing rally in high-yield corporate debt and emerging markets debt over the final two months of 2012 and into 2013. Global bond markets had been enthralled by central bank policies in Europe—decisive policymaking would bolster markets, while reescalating crises in Greece and Spain would undercut confidence and damage security pricing. But the ECB’s actions proved effective—despite continued economic woes across Europe, the announced central bank policies revitalized global credit markets. While no measure could serve as a panacea, coordinated policymaking certainly offered much-needed tonic to Europe and provided a foundation of confidence for the riskier areas of the global credit markets to rally.
Improving economic trends strengthened in the U.S. while Europe’s recession persisted.
Despite problems in Europe during the period—this time in the form of Italian politics and a bank debt crisis in Cyprus—higher-yielding global debt securities continued to perform well. Investors continued to shun most higher-quality sovereign markets in preference for higher-yielding corporate debt. In November and December 2012, high yield and emerging markets debt outperformed higher-rated sovereign debt. These trends largely carried over in the first four months of 2013, as investors rallied to the higher-yielding, lower-rated areas of the global bond markets on increasing confidence in the intentions of the ECB to support credit and a distaste for low yields from the higher-rated sovereign debt sectors.
Despite global credit markets performing well, economic conditions across the globe continued to be mixed and, at times, volatile. In the U.S., growth remained relatively healthy compared with developed Europe and Japan, but employment levels remained disappointing. U.S. Treasury yields remained near historic lows, with negative real yields—not a good outlook for the U.S. dollar or long-term investment in U.S. Treasuries. But more problematic was the eurozone, which remained firmly in recession. Fortunately, there appeared to be the political will to do whatever is necessary to preserve the single euro currency. The pain suffered in the periphery regions outside of core Europe during the period led to cheaper labor costs and lower Social Security and welfare costs. This internal devaluation within the European monetary union marketplace allowed the periphery markets to better compete in the European Union, which strengthened economic optimism during the period. It appeared to many investors that growth in the periphery may well hit bottom in 2013 and start to pick up from what is admittedly a low base, thus providing an investing foundation that strengthened security valuations during the period.
Japan’s newly elected government took little time to deploy a new political mandate, announcing significant quantitative easing policies to deliberately
| | | | | | |
| Letter to shareholders (unaudited) | | Wells Fargo Advantage Emerging Markets Local Bond Fund | | | 3 | |
weaken the currency. The Bank of Japan’s new mandate to target 2% inflation and to intervene in foreign exchange markets while buying foreign bonds may have the political weight to deal with Japan’s problems once and for all. Although this policy direction may help finally break the vicious cycle that is the Japanese economy, the circumstances indicated an unattractive market for bond investments and further currency depreciation to come. Consequently, the Japanese yen deteriorated precipitously throughout the period.
China also had new leaders in place, and investors looked for signs that political stability may resume with the new cabinet entering. Optimism that a shift from an export-led economy to a consumer-led economy appeared to develop in the early months of 2013. With the continued expansion of the offshore Renminbi-based markets, bond yields of 3.5%, and a firming currency, China increasingly appeared to demonstrate signs of being a high-quality candidate for investment, thus generally improving security valuations during the period.
Nonetheless, the longer-term picture around the globe remained largely consistent throughout the period—smaller, more dynamic economies with trade surpluses, healthier growth, and higher interest rates appeared to demonstrate the best characteristics for investment, particularly Asian and South American economies, while the largest economies with languid growth and high deficits underperformed. Optimism across the global markets continued to produce rallies in lower-rated securities while also pricing in some caution for intermittent periods of volatility that may persist in 2013, as markets attempt to balance uncertain growth prospects with deficit control and credit-risk contagion. Despite ongoing concerns across Europe, the six-month period largely produced positive performance across the global fixed-income markets, with strong returns most notably in high-yield corporate bonds and emerging markets debt.
Don’t let short-term uncertainty derail long-term investment goals.
Periods of uncertainty can present challenges, but experience has taught us that maintaining a long-term investment strategy based on individual goals and risk tolerance can be an effective way to plan for the future. To help you create a sound strategy based on your personal goals and risk tolerance, Wells Fargo
Advantage Funds offers more than 100 mutual funds and other investments spanning a wide range of asset classes and investment styles. Although diversification1 cannot guarantee an investment profit or prevent losses, we believe it can be an effective way to manage investment risk and potentially smooth out overall portfolio performance.
Thank you for choosing to invest with Wells Fargo Advantage Funds. We appreciate your confidence in us and remain committed to helping you meet your financial needs. For current information about your fund investments, contact your investment professional, visit our website at wellsfargoadvantagefunds.com, or call us directly at 1-800-222-8222. We are available 24 hours a day, 7 days a week.
Sincerely,

Karla M. Rabusch
President
Wells Fargo Advantage Funds
Despite ongoing concerns across Europe, the six-month period largely produced positive performance across the global fixed-income markets, with strong returns most notably in high-yield corporate bonds and emerging markets debt.
| 1. | Diversification does not assure or guarantee better performance and cannot eliminate the risk of investment losses. |
| | | | |
| 4 | | Wells Fargo Advantage Emerging Markets Local Bond Fund | | Performance highlights (unaudited) |
Investment objective
The Fund seeks total return, consisting of income and capital appreciation.
Adviser
Wells Fargo Funds Management, LLC
Subadviser
First International Advisors, LLC
Portfolio managers
Michael Lee
Tony Norris
Alex Perrin
Christopher Wightman
Peter Wilson
Average annual total returns (%) as of April 30, 2013
| | | | | | | | | | | | | | | | | | |
| | | | | Including sales charge | | | Excluding sales charge | | | Expense ratios1 (%) | |
| | | Inception date | | Since inception | | | Since inception | | | Gross | | | Net2 | |
| Class A (WLBAX) | | 5-31-2012 | | | 10.35 | | | | 15.54 | | | | 2.27 | | | | 1.23 | |
| Class C (WLBEX) | | 5-31-2012 | | | 13.77 | | | | 14.77 | | | | 3.02 | | | | 1.98 | |
| Administrator Class (WLBDX) | | 5-31-2012 | | | – | | | | 15.61 | | | | 2.21 | | | | 1.10 | |
| Institutional Class (WLBIX) | | 5-31-2012 | | | – | | | | 15.86 | | | | 1.94 | | | | 0.90 | |
JPMorgan GBI-EM Global Diversified
Composite Index3 | | – | | | – | | | | 19.03 | | | | – | | | | – | |
Figures quoted represent past performance, which is no guarantee of future results and do not reflect the deduction of taxes that a shareholder may pay on fund distributions or the redemption of fund shares. Investment return and principal value of an investment will fluctuate so that an investor’s shares, when redeemed, may be worth more or less than their original cost. Performance shown without sales charges would be lower if sales charges were reflected. Current performance may be lower or higher than the performance data quoted, which assumes the reinvestment of dividends and capital gains. Current month-end performance is available on the Fund’s website, wellsfargoadvantagefunds.com.
Index returns do not include transaction costs associated with buying and selling securities, any mutual fund fees or expenses, or any taxes. It is not possible to invest directly in an index.
For Class A shares, the maximum front-end sales charge is 4.50%. For Class C shares, the maximum contingent deferred sales charge is 1.00%. Performance including sales charge assumes the sales charge for the corresponding time period. Administrator Class and Institutional Class shares are sold without a front-end sales charge or contingent deferred sales charge.
Bond values fluctuate in response to the financial condition of individual issuers, general market and economic conditions, and changes in interest rates. In general, when interest rates rise, bond values fall and investors may lose principal value. Foreign investments are especially volatile and can rise or fall dramatically due to differences in the political and economic conditions of the host country. These risks are generally intensified in emerging markets. The use of derivatives may reduce returns and/or increase volatility. Certain investment strategies tend to increase the total risk of an investment (relative to the broader market). The Fund is exposed to high-yield securities risk and regional risk. Consult the Fund’s prospectus for additional information on these and other risks.
Please see footnotes on page 5.
| | | | | | |
| Performance highlights (unaudited) | | Wells Fargo Advantage Emerging Markets Local Bond Fund | | | 5 | |
| | | | |
| Ten largest long-term holdings4 (%) as of April 30, 2013 | |
Russia, 7.00%, 1-25-2013 | | | 9.32 | |
Brazil, 10.00%, 1-1-2017 | | | 8.64 | |
Indonesia, 7.38%, 9-15-2016 | | | 4.76 | |
Hungary, 6.75%, 11-24-2017 | | | 4.68 | |
Republic of South Africa, 2.60%, 3-31-2028 | | | 4.53 | |
Brazil, 8.50%, 1-5-2024 | | | 4.52 | |
Turkey, 9.00%, 3-8-2017 | | | 4.47 | |
Inter-American Development Bank, 8.00%, 1-26-2016 | | | 3.93 | |
Poland, 4.00%, 10-25-2023 | | | 3.92 | |
Thailand, 3.25%, 6-16-2017 | | | 3.77 | |
|
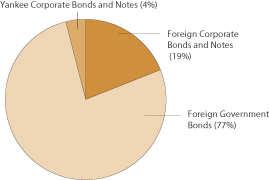
| Portfolio allocation5 as of April 30, 2013 |
|
|
| 1. | Reflects the expense ratios as stated in the most recent prospectuses. |
| 2. | The Adviser has committed through February 28, 2014, to waive fees and/or reimburse expenses to the extent necessary to cap the Fund’s Total Annual Fund Operating Expenses After Fee Waiver, excluding certain expenses, at the amounts shown. Brokerage commissions, stamp duty fees, interest, taxes, acquired fund fees and expenses, and extraordinary expenses are excluded from the cap. Without this cap, the Fund’s returns would have been lower. |
| 3. | The JPMorgan GBI-EM Global Diversified Composite Index is an unmanaged index of debt instruments of 31 emerging countries. You cannot invest directly in an index. |
| 4. | The ten largest long-term holdings are calculated based on the value of the securities divided by total net assets of the Fund. Holdings are subject to change and may have changed since the date specified. |
| 5. | Portfolio allocation is subject to change and is calculated based on the total long-term investments of the Fund. |
| | | | |
| 6 | | Wells Fargo Advantage Emerging Markets Local Bond Fund | | Fund expenses (unaudited) |
As a shareholder of the Fund, you incur two types of costs: (1) transaction costs, including sales charges (loads) on purchase payments and contingent deferred sales charges (if any) on redemptions and (2) ongoing costs, including management fees, distribution (12b-1) and/or shareholder service fees, and other Fund expenses. This example is intended to help you understand your ongoing costs (in dollars) of investing in the Fund and to compare these costs with the ongoing costs of investing in other mutual funds.
The example is based on an investment of $1,000 invested at the beginning of the six-month period and held for the entire period from November 1, 2012 to April 30, 2013.
Actual expenses
The “Actual” line of the table below provides information about actual account values and actual expenses. You may use the information in this line, together with the amount you invested, to estimate the expenses that you paid over the period. Simply divide your account value by $1,000 (for example, an $8,600 account value divided by $1,000 = 8.6), then multiply the result by the number in the “Actual” line under the heading entitled “Expenses paid during period” for your applicable class of shares to estimate the expenses you paid on your account during this period.
Hypothetical example for comparison purposes
The “Hypothetical” line of the table below provides information about hypothetical account values and hypothetical expenses based on the Fund’s actual expense ratio and an assumed rate of return of 5% per year before expenses, which is not the Fund’s actual return. The hypothetical account values and expenses may not be used to estimate the actual ending account balance or expenses you paid for the period. You may use this information to compare the ongoing costs of investing in the Fund and other funds. To do so, compare this 5% hypothetical example with the 5% hypothetical examples that appear in the shareholder reports of the other funds.
Please note that the expenses shown in the table are meant to highlight your ongoing costs only and do not reflect any transactional costs, such as sales charges (loads) and contingent deferred sales charges. Therefore, the “Hypothetical” line of the table is useful in comparing ongoing costs only and will not help you determine the relative total costs of owning different funds. In addition, if these transactional costs were included, your costs would have been higher.
| | | | | | | | | | | | | | | | |
| | | Beginning
account value
11-1-2012 | | | Ending
account value
4-30-2013 | | | Expenses
paid during
the period1 | | | Net annual
expense ratio | |
Class A | | | | | | | | | | | | | | | | |
Actual | | $ | 1,000.00 | | | $ | 1,053.44 | | | $ | 6.26 | | | | 1.23 | % |
Hypothetical (5% return before expenses) | | $ | 1,000.00 | | | $ | 1,018.70 | | | $ | 6.16 | | | | 1.23 | % |
Class C | | | | | | | | | | | | | | | | |
Actual | | $ | 1,000.00 | | | $ | 1,049.58 | | | $ | 10.06 | | | | 1.98 | % |
Hypothetical (5% return before expenses) | | $ | 1,000.00 | | | $ | 1,014.98 | | | $ | 9.89 | | | | 1.98 | % |
Administrator Class | | | | | | | | | | | | | | | | |
Actual | | $ | 1,000.00 | | | $ | 1,053.67 | | | $ | 5.60 | | | | 1.10 | % |
Hypothetical (5% return before expenses) | | $ | 1,000.00 | | | $ | 1,019.34 | | | $ | 5.51 | | | | 1.10 | % |
Institutional Class | | | | | | | | | | | | | | | | |
Actual | | $ | 1,000.00 | | | $ | 1,055.08 | | | $ | 4.59 | | | | 0.90 | % |
Hypothetical (5% return before expenses) | | $ | 1,000.00 | | | $ | 1,020.33 | | | $ | 4.51 | | | | 0.90 | % |
| 1. | Expenses paid is equal to the annualized expense ratio of each class multiplied by the average account value over the period, multiplied by the number of days in the most recent fiscal half-year divided by the number of days in the fiscal year (to reflect the one-half-year period). |
| | | | | | |
| Portfolio of investments—April 30, 2013 (unaudited) | | Wells Fargo Advantage Emerging Markets Local Bond Fund | | | 7 | |
| | | | | | | | | | | | | | | | |
| Security name | | Interest rate | | | Maturity date | | | Principal | | | Value | |
| | | | | | | | | | | | | | | | |
| | | | |
Foreign Corporate Bonds and Notes @: 18.92% | | | | | | | | | | | | | | | | |
| | | | |
| Germany: 3.19% | | | | | | | | | | | | | | | | |
KFW (Financials, Commercial Banks, TRY) | | | 7.50 | % | | | 8-2-2013 | | | | 600,000 | | | $ | 337,058 | |
KFW (Financials, Commercial Banks, TRY) | | | 8.50 | | | | 4-15-2015 | | | | 1,000,000 | | | | 595,621 | |
| | | | |
| | | | | | | | | | | | | | | 932,679 | |
| | | | | | | | | | | | | | | | |
| | | | |
| Ireland: 0.75% | | | | | | | | | | | | | | | | |
RZD Capital Limited (Industrials, Road & Rail, RUB) | | | 8.30 | | | | 4-2-2019 | | | | 6,500,000 | | | | 218,951 | |
| | | | | | | | | | | | | | | | |
| | | | |
| Luxembourg: 3.66% | | | | | | | | | | | | | | | | |
European Investment Bank (Financials, Commercial Banks, ZAR) | | | 6.00 | | | | 10-21-2019 | | | | 7,300,000 | | | | 818,351 | |
European Investment Bank (Financials, Commercial Banks, HUF) | | | 6.50 | | | | 1-5-2015 | | | | 54,000,000 | | | | 251,184 | |
| | | | |
| | | | | | | | | | | | | | | 1,069,535 | |
| | | | | | | | | | | | | | | | |
| | | | |
| Mexico: 1.66% | | | | | | | | | | | | | | | | |
America Movil Sab De CV (Telecommunication Services, Wireless Telecommunication Services, MXN) | | | 6.45 | | | | 12-5-2022 | | | | 3,000,000 | | | | 268,588 | |
Petroleos Mexicanos Company (Energy, Oil, Gas & Consumable Fuels, MXN) | | | 7.65 | | | | 11-24-2021 | | | | 2,300,000 | | | | 218,004 | |
| | | | |
| | | | | | | | | | | | | | | 486,592 | |
| | | | | | | | | | | | | | | | |
| | | | |
| Netherlands: 0.88% | | | | | | | | | | | | | | | | |
Rabobank Nederland (Financials, Commercial Banks, TRY) | | | 9.50 | | | | 1-22-2014 | | | | 450,000 | | | | 258,792 | |
| | | | | | | | | | | | | | | | |
| | | | |
| Russia: 0.72% | | | | | | | | | | | | | | | | |
Sberbank Rossii (Financials, Commercial Banks, RUB) | | | 7.00 | | | | 1-31-2016 | | | | 6,500,000 | | | | 209,295 | |
| | | | | | | | | | | | | | | | |
| | | | |
| South Africa: 0.97% | | | | | | | | | | | | | | | | |
Foodcorp Limited (Consumer Staples, Food & Staples Retailing, EUR) | | | 8.75 | | | | 3-1-2018 | | | | 100,000 | | | | 144,535 | |
Transnet Limited (Industrials, Road & Rail, ZAR) | | | 10.80 | | | | 11-6-2023 | | | | 1,000,000 | | | | 140,049 | |
| | | | |
| | | | | | | | | | | | | | | 284,584 | |
| | | | | | | | | | | | | | | | |
| | | | |
| United States: 7.09% | | | | | | | | | | | | | | | | |
Inter-American Development Bank (Financials, Commercial Banks, MXN) | | | 8.00 | | | | 1-26-2016 | | | | 12,500,000 | | | | 1,148,979 | |
International Bank for Reconstruction & Development (Financials, Diversified Financial Services, MXN) | | | 6.50 | | | | 9-11-2013 | | | | 6,900,000 | | | | 573,603 | |
International Bank for Reconstruction & Development (Financials, Diversified Financial Services, MXN) | | | 7.50 | | | | 3-5-2020 | | | | 3,600,000 | | | | 351,512 | |
| | | | |
| | | | | | | | | | | | | | | 2,074,094 | |
| | | | | | | | | | | | | | | | |
| | | | |
Total Foreign Corporate Bonds and Notes (Cost $5,414,367) | | | | | | | | | | | | | | | 5,534,522 | |
| | | | | | | | | | | | | | | | |
| | | | |
Foreign Government Bonds @: 75.72% | | | | | | | | | | | | | | | | |
Brazil (BRL) | | | 8.50 | | | | 1-5-2024 | | | | 2,375,000 | | | | 1,321,192 | |
Brazil (BRL) | | | 10.00 | | | | 1-1-2017 | | | | 4,750,000 | | | | 2,527,769 | |
Chile (CLP) | | | 5.50 | | | | 8-5-2020 | | | | 238,000,000 | | | | 534,824 | |
Colombia (COP) | | | 7.75 | | | | 4-14-2021 | | | | 975,000,000 | | | | 668,204 | |
Hungary (HUF) | | | 6.75 | | | | 11-24-2017 | | | | 290,000,000 | | | | 1,369,993 | |
Indonesia (IDR) | | | 7.38 | | | | 9-15-2016 | | | | 12,500,000,000 | | | | 1,393,794 | |
Malaysia (MYR) | | | 3.26 | | | | 3-1-2018 | | | | 2,350,000 | | | | 776,188 | |
Malaysia (MYR) | | | 4.26 | | | | 9-15-2016 | | | | 3,125,000 | | | | 1,068,187 | |
Mexico (MXN) | | | 6.50 | | | | 6-9-2022 | | | | 8,500,000 | | | | 804,699 | |
Mexico (MXN) | | | 7.75 | | | | 11-13-2042 | | | | 5,300,000 | | | | 592,727 | |
The accompanying notes are an integral part of these financial statements.
| | | | |
| 8 | | Wells Fargo Advantage Emerging Markets Local Bond Fund | | Portfolio of investments—April 30, 2013 (unaudited) |
| | | | | | | | | | | | | | | | |
| Security name | | Interest rate | | | Maturity date | | | Principal | | | Value | |
| | | | | | | | | | | | | | | | |
| | | | |
Foreign Government Bonds @ (continued) | | | | | | | | | | | | | | | | |
Nigeria (NGN) | | | 15.10 | % | | | 4-27-2017 | | | | 80,000,000 | | | $ | 556,962 | |
Poland (PLN) ¤ | | | 0.00 | | | | 7-25-2013 | | | | 1,880,000 | | | | 591,455 | |
Poland (PLN) | | | 4.00 | | | | 10-25-2023 | | | | 3,400,000 | | | | 1,146,801 | |
Republic of South Africa (ZAR) | | | 2.60 | | | | 3-31-2028 | | | | 9,963,282 | | | | 1,324,045 | |
Romania (RON) | | | 6.00 | | | | 4-30-2016 | | | | 1,800,000 | | | | 563,652 | |
Russia (RUB) | | | 7.00 | | | | 1-25-2023 | | | | 81,500,000 | | | | 2,727,639 | |
Russia (RUB) | | | 7.50 | | | | 3-15-2018 | | | | 25,400,000 | | | | 868,850 | |
Thailand (THB) | | | 3.25 | | | | 6-16-2017 | | | | 32,000,000 | | | | 1,102,325 | |
Turkey (TRY) | | | 6.30 | | | | 2-14-2018 | | | | 1,590,000 | | | | 903,757 | |
Turkey (TRY) | | | 9.00 | | | | 3-8-2017 | | | | 2,100,000 | | | | 1,307,265 | |
| | | | |
Total Foreign Government Bonds (Cost $21,386,327) | | | | | | | | | | | | | | | 22,150,328 | |
| | | | | | | | | | | | | | | | |
| | | | |
Yankee Corporate Bonds and Notes: 3.35% | | | | | | | | | | | | | | | | |
| | | | |
| Brazil: 1.70% | | | | | | | | | | | | | | | | |
BFF International Limited Company (Consumer Staples, Food Products) | | | 7.25 | | | | 1-28-2020 | | | $ | 100,000 | | | | 120,377 | |
ITAU Unibanco Holdings SA (Financials, Commercial Banks) 144A | | | 5.13 | | | | 5-13-2023 | | | | 200,000 | | | | 207,750 | |
Petroplus Finance Limited (Energy, Oil, Gas & Consumable Fuels) | | | 5.75 | | | | 1-20-2020 | | | | 150,000 | | | | 169,331 | |
| | | | |
| | | | | | | | | | | | | | | 497,458 | |
| | | | | | | | | | | | | | | | |
| | | | |
| Luxembourg: 0.58% | | | | | | | | | | | | | | | | |
TNK BP Finance SA (Energy, Oil, Gas & Consumable Fuels) | | | 6.63 | | | | 3-20-2017 | | | | 150,000 | | | | 171,000 | |
| | | | | | | | | | | | | | | | |
| | | | |
| United Kingdom: 0.41% | | | | | | | | | | | | | | | | |
Sable International Finance Limited (Telecommunication Services, Diversified Telecommunication Services) | | | 7.75 | | | | 2-15-2017 | | | | 110,000 | | | | 118,800 | |
| | | | | | | | | | | | | | | | |
| | | | |
| Virgin Islands (British): 0.66% | | | | | | | | | | | | | | | | |
Gold Fields Orogen Holdings (Materials, Metals & Mining) | | | 4.88 | | | | 10-7-2020 | | | | 200,000 | | | | 192,384 | |
| | | | | | | | | | | | | | | | |
| | | | |
Total Yankee Corporate Bonds and Notes (Cost $943,937) | | | | | | | | | | | | | | | 979,642 | |
| | | | | | | | | | | | | | | | |
| | | | |
| | | Yield | | | | | | Shares | | | | |
| | | | |
Short-Term Investments: 0.22% | | | | | | | | | | | | | | | | |
| | | | |
| Investment Companies: 0.22% | | | | | | | | | | | | | | | | |
Wells Fargo Advantage Cash Investment Money Market Fund, Select Class (l)(u) | | | 0.13 | | | | | | | | 64,734 | | | | 64,734 | |
| | | | | | | | | | | | | | | | |
| | | | |
Total Short-Term Investments (Cost $64,734) | | | | | | | | | | | | | | | 64,734 | |
| | | | | | | | | | | | | | | | |
| | | | | | | | |
| Total investments in securities | | | | | | | | |
| (Cost $27,809,365) * | | | 98.21 | % | | | 28,729,226 | |
Other assets and liabilities, net | | | 1.79 | | | | 523,110 | |
| | | | | | | | |
| Total net assets | | | 100.00 | % | | $ | 29,252,336 | |
| | | | | | | | |
The accompanying notes are an integral part of these financial statements.
| | | | | | |
| Portfolio of investments—April 30, 2013 (unaudited) | | Wells Fargo Advantage Emerging Markets Local Bond Fund | | | 9 | |
| @ | Foreign bond principal is denominated in local currency. |
| ¤ | Security issued in zero coupon form with no periodic interest payments. |
| 144A | Security that may be resold to “qualified institutional buyers” under Rule 144A or security offered pursuant to Section 4(2) of the Securities Act of 1933, as amended. |
| (l) | Investment in an affiliate |
| (u) | Rate shown is the 7-day annualized yield at period end. |
| * | Cost for federal income tax purposes is $27,859,083 and unrealized appreciation (depreciation) consists of: |
| | | | |
Gross unrealized appreciation | | $ | 1,053,488 | |
Gross unrealized depreciation | | | (183,345 | ) |
| | | | |
Net unrealized appreciation | | $ | 870,143 | |
The accompanying notes are an integral part of these financial statements.
| | | | |
| 10 | | Wells Fargo Advantage Emerging Markets Local Bond Fund | | Statement of assets and liabilities—April 30, 2013 (unaudited) |
| | | | |
| | | | |
| |
Assets | | | | |
Investments | | | | |
In unaffiliated securities, at value (see cost below) | | $ | 28,664,492 | |
In affiliated securities, at value (see cost below) | | | 64,734 | |
| | | | |
Total investments, at value (see cost below) | | | 28,729,226 | |
Foreign currency, at value (see cost below) | | | 48,326 | |
Receivable for interest | | | 473,570 | |
Unrealized gains on forward foreign currency contracts | | | 67,654 | |
Prepaid expenses and other assets | | | 17,232 | |
| | | | |
Total assets | | | 29,336,008 | |
| | | | |
| |
Liabilities | | | | |
Unrealized losses on forward foreign currency contracts | | | 32,187 | |
Advisory fee payable | | | 815 | |
Distribution fees payable | | | 367 | |
Due to other related parties | | | 3,400 | |
Shareholder report expenses payable | | | 11,160 | |
Custodian and accounting fees payable | | | 13,767 | |
Professional fees payable | | | 19,524 | |
Accrued expenses and other liabilities | | | 2,452 | |
| | | | |
Total liabilities | | | 83,672 | |
| | | | |
Total net assets | | $ | 29,252,336 | |
| | | | |
| |
NET ASSETS CONSIST OF | | | | |
Paid-in capital | | $ | 27,260,348 | |
Overdistributed net investment income | | | (15,123 | ) |
Accumulated net realized gains on investments | | | 1,048,424 | |
Net unrealized gains on investments | | | 958,687 | |
| | | | |
Total net assets | | $ | 29,252,336 | |
| | | | |
| |
COMPUTATION OF NET ASSET VALUE AND OFFERING PRICE PER SHARE1 | | | | |
Net assets – Class A | | $ | 868,385 | |
Shares outstanding – Class A | | | 80,485 | |
Net asset value per share – Class A | | | $10.79 | |
Maximum offering price per share – Class A2 | | | $11.30 | |
Net assets – Class C | | $ | 602,066 | |
Shares outstanding – Class C | | | 55,821 | |
Net asset value per share – Class C | | | $10.79 | |
Net assets – Administrator Class | | $ | 13,878,340 | |
Shares outstanding – Administrator Class | | | 1,285,731 | |
Net asset value per share – Administrator Class | | | $10.79 | |
Net assets – Institutional Class | | $ | 13,903,545 | |
Shares outstanding – Institutional Class | | | 1,288,579 | |
Net asset value per share – Institutional Class | | | $10.79 | |
| |
Investments in unaffiliated securities, at cost | | $ | 27,744,631 | |
| | | | |
Investments in affiliated securities, at cost | | $ | 64,734 | |
| | | | |
Total investments, at cost | | $ | 27,809,365 | |
| | | | |
Foreign currency, at cost | | $ | 48,616 | |
| | | | |
| 1. | The Fund has an unlimited number of authorized shares. |
| 2. | Maximum offering price is computed as 100/95.50 of net asset value. On investments of $50,000 or more, the offering price is reduced. |
The accompanying notes are an integral part of these financial statements.
| | | | | | |
| Statement of operations—six months ended April 30, 2013 (unaudited) | | Wells Fargo Advantage Emerging Markets Local Bond Fund | | | 11 | |
| | | | |
| | | | |
| |
Investment income | | | | |
Interest* | | $ | 705,616 | |
Income from affiliated securities | | | 279 | |
| | | | |
Total investment income | | | 705,895 | |
| | | | |
| |
Expenses | | | | |
Advisory fee | | | 91,421 | |
Administration fees | | | | |
Fund level | | | 7,032 | |
Class A | | | 564 | |
Class C | | | 467 | |
Administrator Class | | | 6,706 | |
Institutional Class | | | 5,372 | |
Shareholder servicing fees | | | | |
Class A | | | 881 | |
Class C | | | 729 | |
Administrator Class | | | 16,765 | |
Distribution fees | | | | |
Class C | | | 2,187 | |
Custody and accounting fees | | | 17,879 | |
Professional fees | | | 19,862 | |
Registration fees | | | 54,364 | |
Shareholder report expenses | | | 12,380 | |
Trustees’ fees and expenses | | | 7,018 | |
Other fees and expenses | | | 3,192 | |
| | | | |
Total expenses | | | 246,819 | |
Less: Fee waivers and/or expense reimbursements | | | (102,512 | ) |
| | | | |
Net expenses | | | 144,307 | |
| | | | |
Net investment income | | | 561,588 | |
| | | | |
| |
REALIZED AND UNREALIZED GAINS (LOSSES) ON INVESTMENTS | | | | |
| |
Net realized gains (losses) on: | | | | |
Unaffiliated securities | | | 1,048,847 | |
Forward foreign currency contract transactions | | | (226 | ) |
| | | | |
Net realized gains on investments | | | 1,048,621 | |
| | | | |
| |
Net change in unrealized gains (losses) on: | | | | |
Unaffiliated securities | | | (87,210 | ) |
Forward foreign currency contract transactions | | | (20,231 | ) |
| | | | |
Net change in unrealized gains (losses) on investments | | | (107,441 | ) |
| | | | |
Net realized and unrealized gains (losses) on investments | | | 941,180 | |
| | | | |
Net increase in net assets resulting from operations | | $ | 1,502,768 | |
| | | | |
| |
* Net of foreign interest withholding taxes in the amount of | | | $4,536 | |
The accompanying notes are an integral part of these financial statements.
| | | | |
| 12 | | Wells Fargo Advantage Emerging Markets Local Bond Fund | | Statement of changes in net assets |
| | | | | | | | | | | | | | | | |
| | | Six months ended April 30, 2013 (unaudited) | | | Year ended October 31, 20121 | |
| | | | |
Operations | | | | | | | | | | | | | | | | |
Net investment income | | | | | | $ | 561,588 | | | | | | | $ | 315,569 | |
Net realized gains on investments | | | | | | | 1,048,621 | | | | | | | | 1,056,816 | |
Net change in unrealized gains (losses) on investments | | | | | | | (107,441 | ) | | | | | | | 1,066,128 | |
| | | | | | | | | | | | | | | | |
Net increase in net assets resulting from operations | | | | | | | 1,502,768 | | | | | | | | 2,438,513 | |
| | | | | | | | | | | | | | | | |
| | | | |
Distributions to shareholders from | | | | | | | | | | | | | | | | |
Net investment income | | | | | | | | | | | | | | | | |
Class A | | | | | | | (26,441 | ) | | | | | | | (5,880 | ) |
Class C | | | | | | | (21,162 | ) | | | | | | | (4,142 | ) |
Administrator Class | | | | | | | (539,432 | ) | | | | | | | (143,107 | ) |
Institutional Class | | | | | | | (558,184 | ) | | | | | | | (154,350 | ) |
Net realized gains | | | | | | | | | | | | | | | | |
Class A | | | | | | | (10,611 | ) | | | | | | | 0 | |
Class C | | | | | | | (10,327 | ) | | | | | | | 0 | |
Administrator Class | | | | | | | (237,700 | ) | | | | | | | 0 | |
Institutional Class | | | | | | | (237,957 | ) | | | | | | | 0 | |
| | | | | | | | | | | | | | | | |
Total distributions to shareholders | | | | | | | (1,641,814 | ) | | | | | | | (307,479 | ) |
| | | | | | | | | | | | | | | | |
| | | | |
| | | Shares | | | | | | | | Shares | | | | | |
Capital share transactions | | | | | | | | | | | | | | | | |
Proceeds from shares sold | | | | | | | | | | | | | | | | |
Class A | | | 24,641 | | | | 263,754 | | | | 53,037 | | | | 532,766 | |
Class C | | | 4,298 | | | | 46,499 | | | | 50,000 | | | | 500,000 | |
Administrator Class | | | 0 | | | | 0 | | | | 1,200,000 | | | | 12,000,000 | |
Institutional Class | | | 0 | | | | 0 | | | | 1,200,000 | | | | 12,000,000 | |
| | | | | | | | | | | | | | | | |
| | | | | | | 310,253 | | | | | | | | 25,032,766 | |
| | | | | | | | | | | | | | | | |
Reinvestment of distributions | | | | | | | | | | | | | | | | |
Class A | | | 3,447 | | | | 37,052 | | | | 554 | | | | 5,880 | |
Class C | | | 2,926 | | | | 31,489 | | | | 391 | | | | 4,142 | |
Administrator Class | | | 72,235 | | | | 777,132 | | | | 13,496 | | | | 143,107 | |
Institutional Class | | | 74,020 | | | | 796,141 | | | | 14,559 | | | | 154,350 | |
| | | | | | | | | | | | | | | | |
| | | | | | | 1,641,814 | | | | | | | | 307,479 | |
| | | | | | | | | | | | | | | | |
Payment for shares redeemed | | | | | | | | | | | | | | | | |
Class A | | | (1,194 | ) | | | (12,952 | ) | | | 0 | | | | 0 | |
Class C | | | (1,794 | ) | | | (19,012 | ) | | | 0 | | | | 0 | |
| | | | | | | | | | | | | | | | |
| | | | | | | (31,964 | ) | | | | | | | 0 | |
| | | | | | | | | | | | | | | | |
Net increase in net assets resulting from capital share transactions | | | | | | | 1,920,103 | | | | | | | | 25,340,245 | |
| | | | | | | | | | | | | | | | |
Total increase in net assets | | | | | | | 1,781,057 | | | | | | | | 27,471,279 | |
| | | | | | | | | | | | | | | | |
| | | | |
Net assets | | | | | | | | | | | | | | | | |
Beginning of period | | | | | | | 27,471,279 | | | | | | | | 0 | |
| | | | | | | | | | | | | | | | |
End of period | | | | | | $ | 29,252,336 | | | | | | | $ | 27,471,279 | |
| | | | | | | | | | | | | | | | |
Undistributed (overdistributed) net investment income | | | | | | $ | (15,123 | ) | | | | | | $ | 568,508 | |
| | | | | | | | | | | | | | | | |
| 1. | For the period from May 31, 2012 (commencement of operations) to October 31, 2012 |
The accompanying notes are an integral part of these financial statements.
| | | | | | |
| Financial highlights | | Wells Fargo Advantage Emerging Markets Local Bond Fund | | | 13 | |
(For a share outstanding throughout each period)
| | | | | | | | |
| CLASS A | | Six months ended
April 30, 2013
(unaudited) | | | Year ended
October 31, 20121 | |
Net asset value, beginning of period | | $ | 10.85 | | | $ | 10.00 | |
Net investment income | | | 0.20 | 2 | | | 0.11 | |
Net realized and unrealized gains (losses) on investments | | | 0.37 | | | | 0.85 | |
| | | | | | | | |
Total from investment operations | | | 0.57 | | | | 0.96 | |
Distributions to shareholders from | | | | | | | | |
Net investment income | | | (0.43 | ) | | | (0.11 | ) |
Net realized gains | | | (0.20 | ) | | | 0.00 | |
| | | | | | | | |
Total distributions to shareholders | | | (0.63 | ) | | | (0.11 | ) |
Net asset value, end of period | | $ | 10.79 | | | $ | 10.85 | |
Total return3 | | | 5.34 | % | | | 9.67 | % |
Ratios to average net assets (annualized) | | | | | | | | |
Gross expenses | | | 1.92 | % | | | 2.20 | % |
Net expenses | | | 1.23 | % | | | 1.23 | % |
Net investment income | | | 3.83 | % | | | 2.62 | % |
Supplemental data | | | | | | | | |
Portfolio turnover rate | | | 62 | % | | | 120 | % |
Net assets, end of period (000s omitted) | | | $868 | | | | $581 | |
| 1. | For the period from May 31, 2012 (commencement of class operations) to October 31, 2012 |
| 2. | Calculated based upon average shares outstanding |
| 3. | Total return calculations do not include any sales charges. Returns for periods of less than one year are not annualized. |
The accompanying notes are an integral part of these financial statements.
| | | | |
| 14 | | Wells Fargo Advantage Emerging Markets Local Bond Fund | | Financial highlights |
(For a share outstanding throughout each period)
| | | | | | | | |
| CLASS C | | Six months ended
April 30, 2013
(unaudited) | | | Year ended
October 31, 20121 | |
Net asset value, beginning of period | | $ | 10.85 | | | $ | 10.00 | |
Net investment income | | | 0.16 | 2 | | | 0.08 | |
Net realized and unrealized gains (losses) on investments | | | 0.37 | | | | 0.85 | |
| | | | | | | | |
Total from investment operations | | | 0.53 | | | | 0.93 | |
Distributions to shareholders from | | | | | | | | |
Net investment income | | | (0.39 | ) | | | (0.08 | ) |
Net realized gains | | | (0.20 | ) | | | 0.00 | |
| | | | | | | | |
Total distributions to shareholders | | | (0.59 | ) | | | (0.08 | ) |
Net asset value, end of period | | $ | 10.79 | | | $ | 10.85 | |
Total return3 | | | 4.96 | % | | | 9.35 | % |
Ratios to average net assets (annualized) | | | | | | | | |
Gross expenses | | | 2.67 | % | | | 2.95 | % |
Net expenses | | | 1.98 | % | | | 1.98 | % |
Net investment income | | | 3.03 | % | | | 1.89 | % |
Supplemental data | | | | | | | | |
Portfolio turnover rate | | | 62 | % | | | 120 | % |
Net assets, end of period (000s omitted) | | | $602 | | | | $547 | |
| 1. | For the period from May 31, 2012 (commencement of class operations) to October 31, 2012 |
| 2. | Calculating based upon average shares outstanding |
| 3. | Total return calculations do not include any sales charges. Returns for periods of less than one year are not annualized. |
The accompanying notes are an integral part of these financial statements.
| | | | | | |
| Financial highlights | | Wells Fargo Advantage Emerging Markets Local Bond Fund | | | 15 | |
(For a share outstanding throughout each period)
| | | | | | | | |
| ADMINISTRATOR CLASS | | Six months ended
April 30, 2013
(unaudited) | | | Year ended
October 31, 20121 | |
Net asset value, beginning of period | | $ | 10.85 | | | $ | 10.00 | |
Net investment income | | | 0.21 | 2 | | | 0.12 | |
Net realized and unrealized gains (losses) on investments | | | 0.36 | | | | 0.85 | |
| | | | | | | | |
Total from investment operations | | | 0.57 | | | | 0.97 | |
Distributions to shareholders from | | | | | | | | |
Net investment income | | | (0.43 | ) | | | (0.12 | ) |
Net realized gains | | | (0.20 | ) | | | 0.00 | |
| | | | | | | | |
Total distributions to shareholders | | | (0.63 | ) | | | (0.12 | ) |
Net asset value, end of period | | $ | 10.79 | | | $ | 10.85 | |
Total return3 | | | 5.37 | % | | | 9.72 | % |
Ratios to average net assets (annualized) | | | | | | | | |
Gross expenses | | | 1.87 | % | | | 2.16 | % |
Net expenses | | | 1.10 | % | | | 1.10 | % |
Net investment income | | | 3.92 | % | | | 2.77 | % |
Supplemental data | | | | | | | | |
Portfolio turnover rate | | | 62 | % | | | 120 | % |
Net assets, end of period (000s omitted) | | | $13,878 | | | | $13,166 | |
| 1. | For the period from May 31, 2012 (commencement of class operations) to October 31, 2012 |
| 2. | Calculated based upon average shares outstanding |
| 3. | Returns for periods of less than one year are not annualized. |
The accompanying notes are an integral part of these financial statements.
| | | | |
| 16 | | Wells Fargo Advantage Emerging Markets Local Bond Fund | | Financial highlights |
(For a share outstanding throughout each period)
| | | | | | | | |
| INSTITUTIONAL CLASS | | Six months ended
April 30, 2013
(unaudited) | | | Year ended
October 31, 20121 | |
Net asset value, beginning of period | | $ | 10.85 | | | $ | 10.00 | |
Net investment income | | | 0.22 | 2 | | | 0.13 | |
Net realized and unrealized gains (losses) on investments | | | 0.37 | | | | 0.85 | |
| | | | | | | | |
Total from investment operations | | | 0.59 | | | | 0.98 | |
Distributions to shareholders from | | | | | | | | |
Net investment income | | | (0.45 | ) | | | (0.13 | ) |
Net realized gains | | | (0.20 | ) | | | 0.00 | |
| | | | | | | | |
Total distributions to shareholders | | | (0.65 | ) | | | (0.13 | ) |
Net asset value, end of period | | $ | 10.79 | | | $ | 10.85 | |
Total return3 | | | 5.51 | % | | | 9.82 | % |
Ratios to average net assets (annualized) | | | | | | | | |
Gross expenses | | | 1.60 | % | | | 1.94 | % |
Net expenses | | | 0.90 | % | | | 0.90 | % |
Net investment income | | | 4.12 | % | | | 2.97 | % |
Supplemental data | | | | | | | | |
Portfolio turnover rate | | | 62 | % | | | 120 | % |
Net assets, end of period (000s omitted) | | | $13,904 | | | | $13,177 | |
| 1. | For the period from May 31, 2012 (commencement of class operations) to October 31, 2012 |
| 2. | Calculated based upon average shares outstanding |
| 3. | Returns for periods of less than one year are not annualized. |
The accompanying notes are an integral part of these financial statements.
| | | | | | |
| Notes to financial statements (unaudited) | | Wells Fargo Advantage Emerging Markets Local Bond Fund | | | 17 | |
1. ORGANIZATION
Wells Fargo Funds Trust (the “Trust”), a Delaware statutory trust organized on March 10, 1999, is an open-end management investment company registered under the Investment Company Act of 1940, as amended (the “1940 Act”). These financial statements report on Wells Fargo Advantage Emerging Markets Local Bond Fund (the “Fund”) which is a diversified series of the Trust.
2. SIGNIFICANT ACCOUNTING POLICIES
The following significant accounting policies, which are consistently followed in the preparation of the financial statements of the Fund, are in conformity with U.S. generally accepted accounting principles which require management to make estimates and assumptions that affect the reported amounts of assets and liabilities, disclosure of contingent assets and liabilities at the date of the financial statements, and the reported amounts of revenues and expenses during the reporting period. Actual results could differ from those estimates.
Securities valuation
All investments are valued each business day as of the close of regular trading on the New York Stock Exchange (normally 4 p.m. Eastern Time).
Securities denominated in foreign currencies are translated into U.S. dollars using the rates of exchange in effect on the day of valuation at a time specified by the Management Valuation Team of Wells Fargo Funds Management, LLC (“Funds Management”).
Fixed income securities acquired with maturities exceeding 60 days are valued based on evaluated bid prices received from an independent pricing service which may utilize both transaction data and market information such as yield, prices of securities of comparable quality, coupon rate, maturity, type of issue, trading characteristics and other market data. If valuations are not available from the independent pricing service or values received are deemed not representative of market value, values will be obtained from a broker-dealer or otherwise determined based on the Fund’s Valuation Procedures.
Short-term securities with maturities of 60 days or less generally are valued at amortized cost which approximates fair value. The amortized cost method involves valuing a security at its cost, plus accretion of discount or minus amortization of premium over the period until maturity.
Investments in registered open-end investment companies are valued at net asset value.
Investments which are not valued using any of the methods discussed above are valued at their fair value, as determined by procedures established in good faith and approved by the Board of Trustees. The Board of Trustees has established a Valuation Committee comprised of the Trustees and has delegated to it the authority to take any actions regarding the valuation of portfolio securities that the Valuation Committee deems necessary or appropriate, including determining the fair value of portfolio securities, unless the determination has been delegated to the Management Valuation Team. The Board of Trustees retains the authority to make or ratify any valuation decisions or approve any changes to the Valuation Procedures as it deems appropriate. On a quarterly basis, the Board of Trustees receives reports on any valuation actions taken by the Valuation Committee or the Management Valuation Team which may include items for ratification.
Valuations of fair valued securities are compared to the next actual sales price when available, or other appropriate market information to assess the continued appropriateness of the fair valuation methodology used. These securities are fair valued on a day-to-day basis, taking into consideration changes to appropriate market information and any significant changes to the input factors considered in the valuation process until there is a readily available price provided on the exchange or by an independent pricing service. Valuations received from an independent pricing service or broker quotes are periodically validated by comparisons to most recent trades and valuations provided by other independent pricing services in addition to the review of prices by the adviser and/or subadviser. Unobservable inputs used in determining fair valuations are identified based on the type of security, taking into consideration factors utilized by market participants in valuing the investment, knowledge about the issuer and the current market environment.
Foreign currency translation
The accounting records of the Fund are maintained in U.S. dollars. Assets, including investment securities, and liabilities denominated in foreign currency are translated into U.S. dollars at the rates of exchange at a time specified by the Management Valuation Team on the date of valuation. Purchases and sales of securities, and income and expenses are translated at the rate of exchange on the respective dates of such transactions. Reported net realized foreign exchange gains or losses arise from sales of foreign currencies, currency gains or losses realized between the trade and settlement dates on securities transactions, and the difference between the amounts of dividends, interest and foreign withholding
| | | | |
| 18 | | Wells Fargo Advantage Emerging Markets Local Bond Fund | | Notes to financial statements (unaudited) |
taxes recorded and the U.S. dollar equivalent of the amounts actually paid or received. Net unrealized foreign exchange gains and losses arise from changes in the fair value of assets and liabilities other than investments in securities resulting in changes in exchange rates.
The changes in net assets arising from changes in exchange rates and the changes in net assets resulting from changes in market prices of securities are not separately presented. Such changes are recorded with net realized and unrealized gains or losses from investments. Gains and losses from certain foreign currency transactions are treated as ordinary income for U.S. federal income tax purposes.
Forward foreign currency contracts
The Fund may be subject to foreign currency exchange rate risk in the normal course of pursuing its investment objectives. A forward foreign currency contract is an agreement between two parties to purchase or sell a specific currency for an agreed-upon price at a future date. The Fund enters into forward foreign currency contracts to facilitate transactions in foreign-denominated securities and to attempt to minimize the risk to the Fund from adverse changes in the relationship between currencies. Forward foreign currency contracts are recorded at the forward rate and marked-to-market daily. When the contracts are closed, realized gains and losses arising from such transactions are recorded as realized gains or losses on forward foreign currency contract transactions. The Fund could be exposed to risks if the counterparties to the contracts are unable to meet the terms of their contracts or if the value of the foreign currency changes unfavorably. The Fund’s maximum risk of loss from counterparty credit risk is the unrealized gains or losses on the contracts. This risk is mitigated by having a master netting arrangement between the Fund and the counterparty.
Security transactions and income recognition
Securities transactions are recorded on a trade date basis. Realized gains or losses are recorded on the basis of identified cost.
Interest income is accrued daily and bond discounts are accreted and premiums are amortized daily based on the effective interest method. To the extent debt obligations are placed on non-accrual status, any related interest income may be reduced by writing off interest receivables when the collection of all or a portion of interest has become doubtful based on consistently applied procedures. If the issuer subsequently resumes interest payments or when the collectability of interest is reasonably assured, the debt obligation is removed from non-accrual status.
Income from foreign securities is recorded net of foreign taxes withheld where recovery of such taxes is not assured.
Distributions to shareholders
Distributions to shareholders from net investment income and net realized gains, if any, are recorded on the ex-dividend date. Such distributions are determined in conformity with federal income tax regulations, which may differ in amount or character from net investment income and realized gains recognized for purposes of U.S. generally accepted accounting principles.
Federal and other taxes
The Fund intends to continue to qualify as a regulated investment company by distributing substantially all of its investment company taxable income and any net realized capital gains (after reduction for capital loss carryforwards) sufficient to relieve it from all, or substantially all, federal income taxes. Accordingly, no provision for federal income taxes was required.
The Fund’s income and federal excise tax returns and all financial records supporting those returns since commencement of operations are subject to examination by the federal and Delaware revenue authorities. Management has analyzed the Fund’s tax positions taken on federal, state, and foreign tax returns for all open tax years and does not believe that there are any uncertain tax positions that require recognition of a tax liability.
Class allocations
The separate classes of shares offered by the Fund differ principally in applicable sales charges, distribution, shareholder servicing, and administration fees. Shareholders of each class bear certain expenses that pertain to that particular class. All shareholders bear the common expenses of the Fund, earn income from the portfolio, and are allocated any unrealized gains and losses pro rata based on the average daily net assets of each class, without distinction between share classes. Dividends are determined separately for each class based on income and expenses allocable to each class. Realized gains and losses are allocated to each class pro rata based upon the net assets of each class on the date realized. Differences in per share dividend rates generally result from the relative weightings of pro rata income and realized gain allocations and from differences in separate class expenses, including distribution, shareholder servicing, and administration fees.
| | | | | | |
| Notes to financial statements (unaudited) | | Wells Fargo Advantage Emerging Markets Local Bond Fund | | | 19 | |
3. FAIR VALUATION MEASUREMENTS
Fair value measurements of investments are determined within a framework that has established a fair value hierarchy based upon the various data inputs utilized in determining the value of the Fund’s investments. The three-level hierarchy gives the highest priority to unadjusted quoted prices in active markets for identical assets or liabilities (Level 1) and the lowest priority to significant unobservable inputs (Level 3). The Fund’s investments are classified within the fair value hierarchy based on the lowest level of input that is significant to the fair value measurement. The inputs are summarized into three broad levels as follows:
| n | | Level 1 – quoted prices in active markets for identical securities |
| n | | Level 2 – other significant observable inputs (including quoted prices for similar securities, interest rates, prepayment speeds, credit risk, use of amortized cost, etc.) |
| n | | Level 3 – significant unobservable inputs (including the Fund’s own assumptions in determining the fair value of investments) |
The inputs or methodologies used for valuing investments in securities are not necessarily an indication of the risk associated with investing in those securities.
As of April 30, 2013, the inputs used in valuing investments in securities were as follows:
| | | | | | | | | | | | | | | | |
| Investments in securities | | Quoted prices (Level 1) | | | Significant other
observable inputs (Level 2) | | | Significant unobservable inputs (Level 3) | | | Total | |
Foreign corporate bonds and notes | | $ | 0 | | | $ | 5,534,522 | | | $ | 0 | | | $ | 5,534,522 | |
Foreign government bonds | | | 0 | | | | 22,150,328 | | | | 0 | | | | 22,150,328 | |
Yankee corporate bonds and notes | | | 0 | | | | 979,642 | | | | 0 | | | | 979,642 | |
Short-term investments | | | | | | | | | | | | | | | | |
Investment companies | | | 64,734 | | | | 0 | | | | 0 | | | | 64,734 | |
| | | $ | 64,734 | | | $ | 28,664,492 | | | $ | 0 | | | $ | 28,729,226 | |
As of April 30, 2013, the inputs used in valuing the Fund’s other financial instruments were as follows:
| | | | | | | | | | | | | | | | |
| Other financial instruments | | Quoted prices (Level 1) | | | Significant other
observable inputs (Level 2) | | | Significant unobservable inputs (Level 3) | | | Total | |
Forward foreign currency contracts+ | | $ | 0 | | | $ | 35,467 | | | $ | 0 | | | $ | 35,467 | |
| + | Forward foreign currency contracts are presented at the unrealized gains or losses on the instrument. |
Transfers in and transfers out are recognized at the end of the reporting period. For the six months ended April 30, 2013, the Fund did not have any transfers into/out of Level 1 or Level 2.
4. TRANSACTIONS WITH AFFILIATES AND OTHER EXPENSES
Advisory fee
The Trust has entered into an advisory contract with Funds Management, an indirect wholly owned subsidiary of Wells Fargo & Company (“Wells Fargo”). The adviser is responsible for implementing investment policies and guidelines and for supervising the subadviser, who is responsible for day-to-day portfolio management of the Fund.
Pursuant to the contract, Funds Management is entitled to receive an annual advisory fee starting at 0.65% and declining to 0.55% as the average daily net assets of the Fund increase. For the six months ended April 30, 2013, the advisory fee was equivalent to an annual rate of 0.65% of the Fund’s average daily net assets.
Funds Management has retained the services of a subadviser to provide daily portfolio management to the Fund. The fee for subadvisory services is borne by Funds Management. First International Advisors, LLC, an affiliate of Funds Management, is the subadviser to the Fund and is entitled to receive a fee from Funds Management at an annual rate starting at 0.45% and declining to 0.30% as the average daily net assets of the Fund increase.
Administration and transfer agent fees
The Trust has entered into an administration agreement with Funds Management. Under this agreement, for providing administrative services, which includes paying fees and expenses for services provided by the transfer agent, sub-transfer
| | | | |
| 20 | | Wells Fargo Advantage Emerging Markets Local Bond Fund | | Notes to financial statements (unaudited) |
agents, omnibus account servicers and record-keepers, Funds Management is entitled to receive from the Fund an annual fund level administration fee starting at 0.05% and declining to 0.03% as the average daily net assets of the Fund increase and a class level administration fee which is calculated based on the average daily net assets of each class as follows:
| | | | |
| | | Class level administration fee | |
Class A, Class C | | | 0.16 | % |
Administrator Class | | | 0.10 | |
Institutional Class | | | 0.08 | |
Funds Management has contractually waived and/or reimbursed advisory and administration fees to the extent necessary to maintain certain net operating expense ratios for the Fund. Waiver of fees and/or reimbursement of expenses by Funds Management were made first from fund level expenses on a proportionate basis and then from class specific expenses. Funds Management has committed through February 28, 2014 to waive fees and/or reimburse expenses to the extent necessary to cap the Fund’s expenses at 1.23% for Class A shares, 1.98% for Class C shares, 1.10% for Administration Class shares, and 0.90% for Institutional Class shares.
Distribution fees
The Trust has adopted a Distribution Plan for Class C shares of the Fund pursuant to Rule 12b-1 under the 1940 Act. Distribution fees are charged to Class C shares and paid to Wells Fargo Funds Distributor, LLC, the principal underwriter, at an annual rate of 0.75% of the average daily net assets of Class C shares.
For the six months ended April 30, 2013, Wells Fargo Funds Distributor, LLC received $210 from the sale of Class A shares.
Shareholder servicing fees
The Trust has entered into contracts with one or more shareholder servicing agents, whereby Class A, Class C and Administrator Class of the Fund is charged a fee at an annual rate of 0.25% of the average daily net assets of each respective class.
A portion of these total shareholder servicing fees were paid to affiliates of Wells Fargo.
5. INVESTMENT PORTFOLIO TRANSACTIONS
Purchases and sales of investments, excluding U.S. government obligations (if any) and short-term securities, for the six months ended April 30, 2013 were $18,353,815 and $16,968,999, respectively.
6. DERIVATIVE TRANSACTIONS
During the six months ended April 30, 2013, the Fund entered into forward foreign currency exchange contracts for economic hedging purposes.
At April 30, 2013, the Fund had forward foreign currency contracts outstanding as follows:
Forward foreign currency contracts to buy:
| | | | | | | | | | | | | | | | | | |
| Exchange date | | Counterparty | | Contracts to
receive | | | U.S. value at
April 30, 2013 | | | In exchange
for U.S. $ | | | Unrealized
gains
(losses) | |
| 5-7-2013 | | State Street Bank | | | 35,000,000 | THB | | $ | 1,192,227 | | | $ | 1,173,315 | | | $ | 18,912 | |
| 5-7-2013 | | State Street Bank | | | 10,000,000,000 | IDR | | | 1,027,922 | | | | 1,029,156 | | | | (1,234 | ) |
| 5-28-2013 | | State Street Bank | | | 7,100,000 | MYR | | | 2,329,285 | | | | 2,280,758 | | | | 48,527 | |
Forward foreign currency contracts to sell:
| | | | | | | | | | | | | | | | | | |
| Exchange date | | Counterparty | | Contracts to
deliver | | | U.S. value at
April 30, 2013 | | | In exchange
for U.S. $ | | | Unrealized
gains
(losses) | |
| 5-7-2013 | | State Street Bank | | | 10,000,000,000 | IDR | | $ | 1,027,923 | | | $ | 1,027,538 | | | $ | (385 | ) |
| 5-28-2013 | | State Street Bank | | | 3,100,000 | MYR | | | 1,017,012 | | | | 1,017,227 | | | | 215 | |
| 7-29-2013 | | State Street Bank | | | 2,000,000 | TRY | | | 1,105,756 | | | | 1,098,874 | | | | (6,882 | ) |
| 7-31-2013 | | State Street Bank | | | 10,000,000 | ZAR | | | 1,101,238 | | | | 1,077,552 | | | | (23,686 | ) |
| | | | | | |
| Notes to financial statements (unaudited) | | Wells Fargo Advantage Emerging Markets Local Bond Fund | | | 21 | |
The Fund had average contract amounts of $4,630,022 and $4,435,183 in forward foreign currency contracts to buy and forward foreign currency contracts to sell, respectively, during the six months ended April 30, 2013.
The fair value, realized gains or losses and change in unrealized gains or losses, if any, on derivative instruments are reflected in the appropriate financial statements.
7. BANK BORROWINGS
The Trust (excluding the money market funds and certain other funds in the Trust) and Wells Fargo Variable Trust are parties to a $150,000,000 revolving credit agreement with State Street Bank and Trust Company, whereby the Fund is permitted to use bank borrowings for temporary or emergency purposes, such as to fund shareholder redemption requests. Interest under the credit agreement is charged to the Fund based on a borrowing rate equal to the higher of the Federal Funds rate in effect on that day plus 1.25% or the overnight LIBOR rate in effect on that day plus 1.25%. In addition, an annual commitment fee equal to 0.10% of the unused balance is allocated to each participating fund. For the six months ended April 30, 2013, the Fund paid $30 in commitment fees.
For the six months ended April 30, 2013, there were no borrowings by the Fund under the agreement.
8. INDEMNIFICATION
Under the Trust’s organizational documents, the officers and directors are indemnified against certain liabilities that may arise out of performance of their duties to the Trust. Additionally, in the normal course of business, the Trust may enter into contracts with service providers that contain a variety of indemnification clauses. The Trust’s maximum exposure under these arrangements is dependent on future claims that may be made against the Fund and, therefore, cannot be estimated.
9. NEW ACCOUNTING PRONOUNCEMENT
In December 2011, the Financial Accounting Standards Board (“FASB”) issued Accounting Standard Update (“ASU”) No. 2011-11, Disclosures about Offsetting Assets and Liabilities. ASU 2011-11, which amends FASB ASC Topic 210, Balance Sheet, creates new disclosure requirements which require entities to disclose both gross and net information for derivatives and other financial instruments that are either offset in the Statement of Assets and Liabilities or subject to an enforceable master netting arrangement or similar agreement. The disclosure requirements are effective for interim and annual reporting periods beginning on or after January 1, 2013. Management is currently assessing the potential impact, in addition to expanded financial statement disclosure, that may result from adopting this ASU.
10. SUBSEQUENT DISTRIBUTIONS
On May 24, 2013, the Fund declared distributions from net investment income to shareholders of record on May 23, 2013. The per share amounts payable on May 28, 2013 were as follows:
| | | | |
| | | Net investment income | |
Class A | | $ | 0.03726 | |
Class C | | | 0.03060 | |
Administration Class | | | 0.03779 | |
Institutional Class | | | 0.04018 | |
On June 24, 2013, the Fund declared distributions from net investment income to shareholders of record on June 21, 2013. The per share amounts payable on June 25, 2013 were as follows:
| | | | |
| | | Net investment income | |
Class A | | $ | 0.03399 | |
Class C | | | 0.02803 | |
Administration Class | | | 0.03446 | |
Institutional Class | | | 0.03660 | |
These distributions are not reflected in the accompanying financial statements.
| | | | |
| 22 | | Wells Fargo Advantage Emerging Markets Local Bond Fund | | Other information (unaudited) |
PROXY VOTING INFORMATION
A description of the policies and procedures that the Fund uses to determine how to vote proxies relating to portfolio securities is available without charge, upon request, by calling 1-800-222-8222, visiting our website at wellsfargoadvantagefunds.com, or visiting the SEC website at sec.gov. Information regarding how the Fund voted proxies relating to portfolio securities during the most recent 12-month period ended June 30 is available without charge on the Fund’s website at wellsfargoadvantagefunds.com or by visiting the SEC website at sec.gov.
PORTFOLIO HOLDINGS INFORMATION
The complete portfolio holdings for the Fund are publicly available on the Fund’s website (wellsfargoadvantagefunds.com) on a monthly, 30-day or more delayed basis. In addition, top ten holdings information for the Fund is publicly available on the Fund’s website on a monthly, seven-day or more delayed basis. The Fund files its complete schedule of portfolio holdings with the SEC for the first and third quarters of each fiscal year on Form N-Q, which is available without charge by visiting the SEC website at sec.gov. In addition, the Fund’s Form N-Q may be reviewed and copied at the SEC’s Public Reference Room in Washington, DC, and at regional offices in New York City, at 233 Broadway, and in Chicago, at 175 West Jackson Boulevard, Suite 900. Information about the Public Reference Room may be obtained by calling 1-800-SEC-0330.
| | | | | | |
| Other information (unaudited) | | Wells Fargo Advantage Emerging Markets Local Bond Fund | | | 23 | |
BOARD OF TRUSTEES AND OFFICERS
Each of the Trustees and Officers listed in the table below acts in identical capacities for the Wells Fargo Advantage family of funds, which consists of 131 funds1 comprising the Wells Fargo Funds Trust, Wells Fargo Variable Trust, Wells Fargo Master Trust and four closed-end funds (collectively the “Fund Complex”). This table should be read in conjunction with the Prospectus and the Statement of Additional Information2. All of the Trustees are also Members of the Audit and Governance Committees of each Trust in the Fund Complex. The mailing address of each Trustee and Officer is 525 Market Street, 12th Floor, San Francisco, CA 94105. Each Trustee and Officer serves an indefinite term, however, each Trustee serves such term until reaching the mandatory retirement age established by the Trustees.
Independent Trustees
| | | | | | |
Name and year of birth | | Position held and length of service* | | Principal occupations during past five years | | Other directorships during
past five years |
Peter G. Gordon (Born 1942) | | Trustee, since 1998; Chairman, since 2005 | | Co-Founder, Retired Chairman, President and CEO of Crystal Geyser Water Company. Trustee Emeritus, Colby College. | | Asset Allocation Trust |
Isaiah Harris, Jr. (Born 1952) | | Trustee, since 2009 | | Retired. Prior thereto, President and CEO of BellSouth Advertising and Publishing Corp. from 2005 to 2007, President and CEO of BellSouth Enterprises from 2004 to 2005 and President of BellSouth Consumer Services from 2000 to 2003. Emeritus member of the Iowa State University Foundation Board of Governors. Emeritus Member of the Advisory Board of Iowa State University School of Business. Advisory Board Member, Palm Coast Academy (charter school). Mr. Harris is a certified public accountant. | | CIGNA Corporation; Deluxe Corporation; Asset Allocation Trust |
Judith M. Johnson (Born 1949) | | Trustee, since 2008; Audit Committee Chairman, since 2008 | | Retired. Prior thereto, Chief Executive Officer and Chief Investment Officer of Minneapolis Employees Retirement Fund from 1996 to 2008. Ms. Johnson is an attorney, certified public accountant and a certified managerial accountant. | | Asset Allocation Trust |
Leroy Keith, Jr. (Born 1939) | | Trustee, since 2010 | | Chairman, Bloc Global Services (development and construction). Trustee of the Evergreen Funds from 1983 to 2010. Former Managing Director, Almanac Capital Management (commodities firm), former Partner, Stonington Partners, Inc. (private equity fund), former Director, Obagi Medical Products Co. and former Director, Lincoln Educational Services. | | Trustee, Virtus Fund Complex (consisting of 48 portfolios as of 1/31/2013); Asset Allocation Trust |
David F. Larcker (Born 1950) | | Trustee, since 2009 | | James Irvin Miller Professor of Accounting at the Graduate School of Business, Stanford University, Morgan Stanley Director of the Center for Leadership Development and Research and Senior Faculty of The Rock Center for Corporate Governance since 2006. From 2005 to 2008, Professor of Accounting at the Graduate School of Business, Stanford University. Prior thereto, Ernst & Young Professor of Accounting at The Wharton School, University of Pennsylvania from 1985 to 2005. | | Asset Allocation Trust |
Olivia S. Mitchell (Born 1953) | | Trustee, since 2006 | | International Foundation of Employee Benefit Plans Professor, Wharton School of the University of Pennsylvania since 1993. Director of Wharton’s Pension Research Council and Boettner Center on Pensions & Retirement Research, and Research Associate at the National Bureau of Economic Research. Previously, Cornell University Professor from 1978 to 1993. | | Asset Allocation Trust |
Timothy J. Penny (Born 1951) | | Trustee, since 1996 | | President and CEO of Southern Minnesota Initiative Foundation, a non-profit organization, since 2007 and Senior Fellow at the Humphrey Institute Policy Forum at the University of Minnesota since 1995. Member of the Board of Trustees of NorthStar Education Finance, Inc., a non-profit organization, since 2007. | | Asset Allocation Trust |
| | | | |
| 24 | | Wells Fargo Advantage Emerging Markets Local Bond Fund | | Other information (unaudited) |
| | | | | | |
Name and year of birth | | Position held and length of service* | | Principal occupations during past five years | | Other directorships during past five years |
Michael S. Scofield (Born 1943) | | Trustee, since 2010 | | Served on the Investment Company Institute’s Board of Governors and Executive Committee from 2008-2011 as well the Governing Council of the Independent Directors Council from 2006-2011 and the Independent Directors Council Executive Committee from 2008-2011. Chairman of the IDC from 2008-2010. Institutional Investor (Fund Directions) Trustee of Year in 2007. Trustee of the Evergreen Funds (and its predecessors) from 1984 to 2010. Chairman of the Evergreen Funds from 2000-2010. Former Trustee of the Mentor Funds. Retired Attorney, Law Offices of Michael S. Scofield. | | Asset Allocation Trust |
Donald C. Willeke (Born 1940) | | Trustee, since 1996 | | Principal of the law firm of Willeke & Daniels. General Counsel of the Minneapolis Employees Retirement Fund from 1984 until its consolidation into the Minnesota Public Employees Retirement Association on June 30, 2010. Director and Vice Chair of The Tree Trust (non-profit corporation). Director of the American Chestnut Foundation (non-profit corporation). | | Asset Allocation Trust |
| * | Length of service dates reflect the Trustee’s commencement of service with the Trust’s predecessor entities, where applicable. |
Officers
| | | | | | |
Name and year of birth | | Position held and length of service | | Principal occupations during past five years | | |
Karla M. Rabusch (Born 1959) | | President, since 2003 | | Executive Vice President of Wells Fargo Bank, N.A. and President of Wells Fargo Funds Management, LLC since 2003. | | |
Nancy Wiser1 (Born 1967) | | Treasurer, since 2012 | | Executive Vice President of Wells Fargo Funds Management, LLC since 2011. Chief Operating Officer and Chief Compliance Officer at LightBox Capital Management LLC, from 2008 to 2011. Owned and operated a consulting business providing services to various hedge funds including acting as Chief Operating Officer and Chief Compliance Officer for a hedge fund from 2007 to 2008. Chief Operating Officer and Chief Compliance Officer of GMN Capital LLC from 2006 to 2007. | | |
C. David Messman (Born 1960) | | Secretary, since 2000; Chief Legal Officer, since 2003 | | Senior Vice President and Secretary of Wells Fargo Funds Management, LLC since 2001. Vice President and Managing Counsel of Wells Fargo Bank, N.A. since 1996. | | |
Debra Ann Early (Born 1964) | | Chief Compliance Officer, since 2007 | | Chief Compliance Officer of Wells Fargo Funds Management, LLC since 2007. Chief Compliance Officer of Parnassus Investments from 2005 to 2007. Chief Financial Officer of Parnassus Investments from 2004 to 2007. | | |
David Berardi (Born 1975) | | Assistant Treasurer, since 2009 | | Vice President of Wells Fargo Funds Management, LLC since 2009. Vice President of Evergreen Investment Management Company, LLC from 2008 to 2010. Assistant Vice President of Evergreen Investment Services, Inc. from 2004 to 2008. Manager of Fund Reporting and Control for Evergreen Investment Management Company, LLC from 2004 to 2010. | | |
Jeremy DePalma1 (Born 1974) | | Assistant Treasurer, since 2009 | | Senior Vice President of Wells Fargo Funds Management, LLC since 2009. Senior Vice President of Evergreen Investment Management Company, LLC from 2008 to 2010. Vice President, Evergreen Investment Services, Inc. from 2004 to 2007. Head of the Fund Reporting and Control Team within Fund Administration from 2005 to 2010. | | |
| 1. | Nancy Wiser acts as Treasurer of 73 funds in the Fund Complex. Jeremy DePalma acts as Treasurer of 58 funds and Assistant Treasurer of 73 funds in the Fund Complex. |
| 2. | The Statement of Additional Information includes additional information about the Trustees and is available, without charge, upon request, by calling 1-800-222-8222 or by visiting the website at wellsfargoadvantagefunds.com. |
| | | | | | |
| Other information (unaudited) | | Wells Fargo Advantage Emerging Markets Local Bond Fund | | | 25 | |
BOARD CONSIDERATION OF INVESTMENT ADVISORY AND SUBADVISORY AGREEMENTS:
Under Section 15 of the Investment Company Act of 1940 (the “1940 Act”), the Board of Trustees (the “Board”) of Wells Fargo Funds Trust (the “Trust”), all the members of which have no direct or indirect interest in the investment advisory and sub-advisory agreements and are not “interested persons” of the Trust, as defined in the 1940 Act (the “Independent Trustees”), must determine whether to approve the continuation of the Trust’s investment advisory and sub-advisory agreements. In this regard, at an in-person meeting held on March 28-29, 2013 (the “Meeting”), the Board reviewed: (i) an investment advisory agreement with Wells Fargo Funds Management, LLC (“Funds Management”) for Wells Fargo Advantage Emerging Markets Local Bond Fund (the “Fund”) and (ii) an investment sub-advisory agreement with First International Advisors, LLC (the “Sub-Adviser”), an affiliate of Funds Management, for the Fund. The investment advisory agreement with Funds Management and the investment sub-advisory agreement with the Sub-Adviser are collectively referred to as the “Advisory Agreements.”
At the Meeting, the Board considered the factors and reached the conclusions described below relating to the selection of Funds Management and the Sub-Adviser and the continuation of the Advisory Agreements. Prior to the Meeting, the Trustees conferred extensively among themselves and with representatives of Funds Management about these matters. The Board has adopted a team-based approach, with each team consisting of a sub-set of Trustees, to assist the Board in the discharge of its duties in reviewing performance and other matters throughout the year. The Independent Trustees were assisted in their evaluation of the Advisory Agreements by independent legal counsel, from whom they received separate legal advice and with whom they met separately.
In providing information to the Board, Funds Management and the Sub-Adviser were guided by a detailed set of requests for information submitted to them by independent legal counsel on behalf of the Independent Trustees at the start of the Board’s annual contract renewal process earlier in 2013. In considering and approving the Advisory Agreements, the Trustees considered the information they believed relevant, including but not limited to the information discussed below. The Board considered not only the specific information presented in connection with the Meeting, but also the knowledge gained over time through interaction with Funds Management and the Sub-Adviser about various topics. In this regard, the Board reviewed reports of Funds Management at each of its quarterly meetings, which included, among other things, portfolio reviews and performance reports. In addition, the Board and the teams mentioned above confer with portfolio managers at various times throughout the year. The Board did not identify any particular information or consideration that was all-important or controlling, and each individual Trustee may have attributed different weights to various factors.
After its deliberations, the Board unanimously determined that the continuation of the Advisory Agreements is in the best interests of the Fund and its shareholders, and that the compensation payable to Funds Management and the Sub-Adviser is reasonable. The Board considered the continuation of the Advisory Agreements for the Fund as part of its consideration of the continuation of advisory agreements for funds across the complex, but each decision was made on a fund-by-fund basis. The following summarizes a number of important, but not necessarily all, factors considered by the Board in reaching its determination.
Nature, extent and quality of services
The Board received and considered various information regarding the nature, extent and quality of services provided to the Fund by Funds Management and the Sub-Adviser under the Advisory Agreements. This information included, among other things, a summary of the background and experience of senior management of Funds Management, and the qualifications, background, tenure and responsibilities of each of the portfolio managers primarily responsible for the day-to-day portfolio management of the Fund.
The Board evaluated the ability of Funds Management and the Sub-Adviser, based on attributes such as their financial condition, resources and reputation, to attract and retain qualified investment professionals, including research, advisory and supervisory personnel. The Board further considered the compliance programs and compliance records of Funds Management and the Sub-Adviser. In addition, the Board took into account the administrative and other services provided to the Fund by Funds Management and its affiliates and Funds Management’s oversight of the Fund’s various service providers.
Fund performance and expenses
The Board considered the performance results for the Fund over various time periods ended December 31, 2012. The Board also considered these results in comparison to the performance of funds in a universe that was determined by Lipper Inc. (“Lipper”) to be similar to the Fund (the “Universe”), and in comparison to the Fund’s benchmark index and to other comparative data. Lipper is an independent provider of investment company data. The Board received a
| | | | |
| 26 | | Wells Fargo Advantage Emerging Markets Local Bond Fund | | Other information (unaudited) |
description of the methodology used by Lipper to select the mutual funds in the performance Universe. The Board noted that the performance of the Fund (Administrator Class) was in range of the median performance of the Universe for the period since the Fund’s inception. The Board also noted that the performance of the Fund was in range of its benchmark, the JPMorgan Government Bond Index - Emerging Markets Global Diversified Composite Index, for the period since its inception.
The Board received and considered information regarding the Fund’s net operating expense ratios and their various components, including actual management fees (which reflect fee waivers, if any, and include advisory, administration and transfer agent fees), custodian and other non-management fees, Rule 12b-1 and non-Rule 12b-1 service fees and fee waiver and expense reimbursement arrangements. The Board also considered these ratios in comparison to the median ratios of funds in class-specific expense groups that were determined by Lipper to be similar to the Fund (the “Groups”). The Board received a description of the methodology used by Lipper to select the mutual funds in the expense Groups. Based on the Lipper reports, the Board noted that the net operating expense ratios of the Fund were lower than or in range of the median net operating expense ratios of the expense Groups.
Based on its consideration of the factors and information it deemed relevant, including those described here, the Board concluded that the overall performance and expense structure of the Fund supported the re-approval of the Advisory Agreements.
Investment advisory and sub-advisory fee rates
The Board reviewed and considered the contractual investment advisory fee rates that are payable by the Fund to Funds Management for investment advisory services (the “Advisory Agreement Rates”), both on a stand-alone basis and on a combined basis with the Fund’s fund-level and class-level contractual administration fee rates (the “Management Rates”). The Board noted that the administration fees include transfer agency costs. The Board also reviewed and considered the contractual investment sub-advisory fee rates that are payable by Funds Management to the Sub-Adviser for investment sub-advisory services (the “Sub-Advisory Agreement Rates”).
Among other information reviewed by the Board was a comparison of the Management Rates of the Fund with those of other funds in the expense Groups at a common asset level. The Board noted that the Management Rates of the Fund were in range or equal to the median rates for the Fund’s expense Groups for all classes.
The Board also received and considered information about the portion of the total advisory fee that was retained by Funds Management after payment of the fee to the Sub-Adviser for sub-advisory services. In assessing the reasonableness of this amount, the Board received and evaluated information concerning the nature and extent of responsibilities retained and risks assumed by Funds Management and not delegated to or assumed by the Sub-Adviser, and about Funds Management’s on-going oversight services. In recognition of the fact that the Wells Fargo enterprise provides a suite of combined advisory and sub-advisory services to the Fund through affiliated entities, the Board ascribed limited relevance to the allocation of the total advisory fee between Funds Management and the Sub-Adviser.
The Board also received and considered information about the nature and extent of services offered and fee rates charged by Funds Management and the Sub-Adviser to other types of clients. In this regard, the Board received information about the significantly greater scope of services, and compliance, reporting and other legal burdens and risks of managing mutual funds compared with those associated with managing assets of non-mutual fund clients such as collective funds or institutional separate accounts.
Based on its consideration of the factors and information it deemed relevant, including those described here, the Board determined that the Advisory Agreement Rates and the Sub-Advisory Agreement Rates were reasonable in light of the services covered by the Advisory Agreements.
Profitability
The Board received and considered information concerning the profitability of Funds Management, as well as the profitability of Wells Fargo as a whole, from providing services to the Fund. The Board did not receive or consider to be necessary separate profitability information with respect to the Sub-Adviser, because, as an affiliate of Funds Management, its profitability information was subsumed in the collective Wells Fargo profitability analysis provided by Funds Management.
Funds Management explained the methodologies and estimates that it used in calculating the profitability from the Fund and the fund family as a whole. Among other things, the Board noted that the levels of profitability reported on a fund-by-fund basis varied widely, depending on factors such as the size and type of fund. Based on its review, the Board did not deem the profits reported by Funds Management to be at a level that would prevent it from approving the continuation of the Advisory Agreements.
| | | | | | |
| Other information (unaudited) | | Wells Fargo Advantage Emerging Markets Local Bond Fund | | | 27 | |
Economies of scale
With respect to possible economies of scale, the Board reviewed the breakpoints in the Fund’s advisory fee and administration fee structure, which operate generally to reduce the Fund’s expense ratios as the Fund grows in size. It considered that, for a small fund or a fund that shrinks in size, breakpoints conversely can result in higher fee levels. The Board also considered fee waiver and expense reimbursement arrangements as a means of sharing potential economies of scale with the Fund. The Board acknowledged the inherent limitations of any analysis of potential economies of scale and of any attempt to correlate breakpoints with such economies. Nonetheless, the Board concluded that the breakpoints and net operating expense ratio caps appeared to be a reasonable approach to sharing potential economies of scale with the Fund.
Other benefits to Funds Management and the Sub-Adviser
The Board received and considered information regarding potential “fall-out” or ancillary benefits received by Funds Management and its affiliates, including the Sub-Adviser, as a result of their relationship with the Fund. Ancillary benefits could include, among others, benefits directly attributable to other relationships with the Fund and benefits potentially derived from an increase in Funds Management’s and the Sub-Adviser’s business as a result of their relationship with the Fund (such as the ability to market to shareholders other financial products and services offered by Funds Management and its affiliates, including the Sub-Adviser, or to operate other products and services that follow investment strategies similar to those of the Fund).
The Board considered that Wells Fargo Funds Distributor, LLC, an affiliate of Funds Management, serves as distributor to the Fund and receives certain compensation for those services. The Board noted that various financial institutions, including affiliates of Funds Management, may receive distribution-related fees, shareholder servicing payments (including amounts derived from payments under Rule 12b-1 plans) and sub-transfer agency fees in respect of shares sold or held through them and services provided.
The Board also reviewed information about whether and to what extent soft dollar credits are sought and how any such credits are utilized, and any benefits that might be realized by an affiliated broker that handles portfolio transactions for the Fund.
Based on its consideration of the factors and information it deemed relevant, including those described here, the Board did not find that any ancillary benefits received by Funds Management and its affiliates, including the Sub-Adviser, were unreasonable.
Conclusion
After considering the above-described factors and based on its deliberations and its evaluation of the information described above, the Board unanimously approved the continuation of the Advisory Agreements for an additional one-year period.
| | | | |
| 28 | | Wells Fargo Advantage Emerging Markets Local Bond Fund | | List of abbreviations |
The following is a list of common abbreviations for terms and entities that may have appeared in this report.
| ACA | — ACA Financial Guaranty Corporation |
| ADR | — American depositary receipt |
| ADS | — American depositary shares |
| AGC | — Assured Guaranty Corporation |
| AGM | — Assured Guaranty Municipal |
| Ambac | — Ambac Financial Group Incorporated |
| AMT | — Alternative minimum tax |
| BAN | — Bond anticipation notes |
| BHAC | — Berkshire Hathaway Assurance Corporation |
| CAB | — Capital appreciation bond |
| CCAB | — Convertible capital appreciation bond |
| CDA | — Community Development Authority |
| CDO | — Collateralized debt obligation |
| COP | — Certificate of participation |
| DRIVER | — Derivative inverse tax-exempt receipts |
| DW&P | — Department of Water & Power |
| DWR | — Department of Water Resources |
| ECFA | — Educational & Cultural Facilities Authority |
| EDA | — Economic Development Authority |
| EDFA | — Economic Development Finance Authority |
| ETF | — Exchange-traded fund |
| FDIC | — Federal Deposit Insurance Corporation |
| FFCB | — Federal Farm Credit Banks |
| FGIC | — Financial Guaranty Insurance Corporation |
| FHA | — Federal Housing Administration |
| FHLB | — Federal Home Loan Bank |
| FHLMC | — Federal Home Loan Mortgage Corporation |
| FICO | — The Financing Corporation |
| FNMA | — Federal National Mortgage Association |
| GDR | — Global depositary receipt |
| GNMA | — Government National Mortgage Association |
| HCFR | — Healthcare facilities revenue |
| HEFA | — Health & Educational Facilities Authority |
| HEFAR | — Higher education facilities authority revenue |
| HFA | — Housing Finance Authority |
| HFFA | — Health Facilities Financing Authority |
| HUD | — Department of Housing and Urban Development |
| IDA | — Industrial Development Authority |
| IDAG | — Industrial Development Agency |
| IDR | — Industrial development revenue |
| KRW | — Republic of Korea won |
| LIBOR | — London Interbank Offered Rate |
| LLC | — Limited liability company |
| LLP | — Limited liability partnership |
| MBIA | — Municipal Bond Insurance Association |
| MFHR | — Multifamily housing revenue |
| MSTR | — Municipal securities trust receipts |
| MUD | — Municipal Utility District |
| National | — National Public Finance Guarantee Corporation |
| PCFA | — Pollution Control Financing Authority |
| PCL | — Public Company Limited |
| PCR | — Pollution control revenue |
| PFA | — Public Finance Authority |
| PFFA | — Public Facilities Financing Authority |
| PFOTER | — Puttable floating option tax-exempt receipts |
| plc | — Public limited company |
| PUTTER | — Puttable tax-exempt receipts |
| R&D | — Research & development |
| Radian | — Radian Asset Assurance |
| RAN | — Revenue anticipation notes |
| RDA | — Redevelopment Authority |
| RDFA | — Redevelopment Finance Authority |
| REIT | — Real estate investment trust |
| ROC | — Reset option certificates |
| SAVRS | — Select auction variable rate securities |
| SBA | — Small Business Authority |
| SFHR | — Single-family housing revenue |
| SFMR | — Single-family mortgage revenue |
| SPA | — Standby purchase agreement |
| SPDR | — Standard & Poor’s Depositary Receipts |
| STRIPS | — Separate trading of registered interest and principal securities |
| TAN | — Tax anticipation notes |
| TIPS | — Treasury inflation-protected securities |
| TRAN | — Tax revenue anticipation notes |
| TTFA | — Transportation Trust Fund Authority |
| TVA | — Tennessee Valley Authority |
This page is intentionally left blank.
This page is intentionally left blank.


For more information
More information about Wells Fargo Advantage Funds is available free upon request. To obtain literature, please write, email, visit the Fund’s website, or call:
Wells Fargo Advantage Funds
P.O. Box 8266
Boston, MA 02266-8266
Email: wfaf@wellsfargo.com
Website: wellsfargoadvantagefunds.com
Individual investors: 1-800-222-8222
Retail investment professionals: 1-888-877-9275
Institutional investment professionals: 1-866-765-0778
This report and the financial statements contained herein are submitted for the general information of the shareholders of Wells Fargo Advantage Funds. If this report is used for promotional purposes, distribution of the report must be accompanied or preceded by a current prospectus. For a current prospectus and, if available, a summary prospectus containing more complete information, including charges and expenses, call 1-800-222-8222 or visit the Fund’s website at wellsfargoadvantagefunds.com. Please consider the investment objectives, risks, charges, and expenses of the investment carefully before investing. This and other information about Wells Fargo Advantage Funds can be found in the current prospectus. Read the prospectus carefully before you invest or send money.
Wells Fargo Funds Management, LLC, a wholly owned subsidiary of Wells Fargo & Company, provides investment advisory and administrative services for Wells Fargo Advantage Funds. Other affiliates of Wells Fargo & Company provide subadvisory and other services for the Funds. The Funds are distributed by Wells Fargo Funds Distributor, LLC, Member FINRA/SIPC, an affiliate of Wells Fargo & Company.
NOT FDIC INSURED ¡ NO BANK GUARANTEE ¡ MAY LOSE VALUE
© 2013 Wells Fargo Funds Management, LLC. All rights reserved.
| | |
 | | 216827 06-13 SA261/SAR261 4-13 |

Wells Fargo Advantage International Bond Fund

Semi-Annual Report
April 30, 2013

Reduce clutter. Save trees.
Sign up for electronic delivery of prospectuses and shareholder reports at wellsfargo.com/advantagedelivery
Contents
The views expressed and any forward-looking statements are as of April 30, 2013, unless otherwise noted, and are those of the Fund managers and/or Wells Fargo Funds Management, LLC. Discussions of individual securities, or the markets generally, or any Wells Fargo Advantage Fund are not intended as individual recommendations. Future events or results may vary significantly from those expressed in any forward-looking statements; the views expressed are subject to change at any time in response to changing circumstances in the market. Wells Fargo Funds Management, LLC, disclaims any obligation to publicly update or revise any views expressed or forward-looking statements.
NOT FDIC INSURED ¡ NO BANK GUARANTEE ¡ MAY LOSE VALUE

Wells Fargo investment history
| | |
| 1932 | | Keystone creates one of the first mutual fund families. |
| 1971 | | Wells Fargo & Company introduces one of the first institutional index funds. |
| 1978 | | Wells Fargo applies Markowitz and Sharpe’s research on Modern Portfolio Theory to introduce one of the industry’s first tactical asset allocation models in institutional separately managed accounts. |
| 1984 | | Wells Fargo Stagecoach Funds launches its first asset allocation fund. |
| 1989 | | The Tactical Asset Allocation (TAA) Model is first applied to Wells Fargo’s asset allocation mutual funds. |
| 1994 | | Wells Fargo introduces the LifePath Funds, one of the first suites of target date funds (now the Wells Fargo Advantage Dow Jones Target Date FundsSM). |
| 1996 | | Evergreen Investments and Keystone Funds merge. |
| 1997 | | Wells Fargo launches the Wells Fargo Advantage WealthBuilder PortfoliosSM, a fund-of-funds suite of products that includes the use of quantitative models to shift assets among investment styles. |
| 1999 | | Norwest Advantage Funds and Stagecoach Funds are reorganized into Wells Fargo Funds after the merger of Norwest and Wells Fargo. |
| 2002 | | Evergreen Retail and Evergreen Institutional companies form the umbrella asset management company, Evergreen Investments. |
| 2005 | | The integration of Strong Funds with Wells Fargo Funds creates Wells Fargo Advantage Funds, resulting in one of the top 20 mutual fund companies in the United States. |
| 2006 | | Wells Fargo Advantage Funds relaunches the target date product line as Wells Fargo Advantage Dow Jones Target Date Funds. |
| 2010 | | The mergers and reorganizations of Evergreen and Wells Fargo Advantage mutual funds are completed, unifying the families under the brand of Wells Fargo Advantage Funds. |
Wells Fargo Advantage Funds®
Wells Fargo Advantage Funds skillfully guides institutions, financial advisors, and individuals through the investment terrain to help them reach their financial objectives. Everything we do on behalf of investors is backed by our unique combination of qualifications.
Strength
Our organization is built on the standards of integrity and service established by our parent company—Wells Fargo & Company—more than 150 years ago. And, because we’re part of a highly diversified financial enterprise, we offer the depth of resources to help investors succeed.
Expertise
Our multi-boutique model offers investors access to the independent thinking of premier investment managers that have been chosen for their time-tested strategies. While each team specializes in a specific investment strategy, collectively they provide investors a wide choice of distinct investment styles. Our dedication to investment excellence doesn’t end with our expertise in manager selection—risk management, analysis, and rigorous ongoing review seek to ensure each manager’s investment process remains consistent.
Partnership
Our collaborative approach is built around understanding the needs and goals of our clients. By adhering to core principles of sound judgment and steady guidance, we support you through every stage of the investment decision process.
Carefully consider the investment objectives, risks, charges, and expenses before investing. For a current prospectus and, if available, a summary prospectus, for Wells Fargo Advantage Funds, containing this and other information, visit wellsfargoadvantagefunds.com. Read it carefully before investing.
Wells Fargo Funds Management, LLC, a wholly owned subsidiary of Wells Fargo & Company, provides investment advisory and administrative services for Wells Fargo Advantage Funds. Other affiliates of Wells Fargo & Company provide subadvisory and other services for the Funds. The Funds are distributed by Wells Fargo Funds Distributor, LLC, Member FINRA/SIPC, an affiliate of Wells Fargo & Company.
“Dow Jones®” and “Dow Jones Target Date IndexesSM” are service marks of Dow Jones Trademark Holdings LLC (“Dow Jones”); have been licensed to CME Group Index Services LLC (“CME Indexes”); and have been sublicensed for use for certain purposes by Global Index Advisors, Inc., and Wells Fargo Funds Management, LLC. The Wells Fargo Advantage Dow Jones Target Date FundsSM, based on the Dow Jones Target Date Indexes, are not sponsored, endorsed, sold, or promoted by Dow Jones, CME Indexes, or their respective affiliates, and none of them makes any representation regarding the advisability of investing in such product(s).
NOT FDIC INSURED ¡ NO BANK GUARANTEE ¡ MAY LOSE VALUE
Not part of the semi-annual report.
Wells Fargo Advantage Funds offers more than 100 mutual funds across a wide range of asset classes, representing over $228 billion in assets under management, as of April 30, 2013.
| | | | |
| Equity funds | | | | |
Asia Pacific Fund | | Enterprise Fund† | | Opportunity Fund† |
C&B Large Cap Value Fund | | Global Opportunities Fund | | Precious Metals Fund |
C&B Mid Cap Value Fund | | Growth Fund | | Premier Large Company Growth Fund |
Capital Growth Fund | | Index Fund | | Small Cap Opportunities Fund |
Common Stock Fund | | International Equity Fund | | Small Cap Value Fund |
Disciplined U.S. Core Fund | | International Value Fund | | Small Company Growth Fund |
Discovery Fund† | | Intrinsic Small Cap Value Fund | | Small Company Value Fund |
Diversified Equity Fund | | Intrinsic Value Fund | | Small/Mid Cap Value Fund |
Diversified International Fund | | Intrinsic World Equity Fund | | Special Mid Cap Value Fund |
Emerging Growth Fund | | Large Cap Core Fund | | Special Small Cap Value Fund |
Emerging Markets Equity Fund | | Large Cap Growth Fund | | Specialized Technology Fund |
Emerging Markets Equity Income Fund | | Large Company Value Fund | | Traditional Small Cap Growth Fund |
Endeavor Select Fund† | | Omega Growth Fund | | Utility and Telecommunications Fund |
| Bond funds | | | | |
Adjustable Rate Government Fund | | High Yield Municipal Bond Fund | | Short-Term Bond Fund |
California Limited-Term Tax-Free Fund | | Income Plus Fund | | Short-Term High Yield Bond Fund |
California Tax-Free Fund | | Inflation-Protected Bond Fund | | Short-Term Municipal Bond Fund |
Colorado Tax-Free Fund | | Intermediate Tax/AMT-Free Fund | | Strategic Income Fund |
Conservative Income Fund | | International Bond Fund | | Strategic Municipal Bond Fund |
Core Bond Fund | | Minnesota Tax-Free Fund | | Ultra Short-Term Income Fund |
Emerging Markets Local Bond Fund | | Municipal Bond Fund | | Ultra Short-Term Municipal Income Fund |
Government Securities Fund | | North Carolina Tax-Free Fund | | Wisconsin Tax-Free Fund |
High Income Fund | | Pennsylvania Tax-Free Fund | | |
High Yield Bond Fund | | Short Duration Government Bond Fund | | |
| Asset allocation funds | | | | |
Absolute Return Fund | | WealthBuilder Equity Portfolio† | | Target 2020 Fund† |
Asset Allocation Fund | | WealthBuilder Growth Allocation Portfolio† | | Target 2025 Fund† |
Diversified Capital Builder Fund | | WealthBuilder Growth Balanced Portfolio† | | Target 2030 Fund† |
Diversified Income Builder Fund | | WealthBuilder Moderate Balanced Portfolio† | | Target 2035 Fund† |
Growth Balanced Fund | | WealthBuilder Tactical Equity Portfolio† | | Target 2040 Fund† |
Index Asset Allocation Fund | | Target Today Fund† | | Target 2045 Fund† |
Moderate Balanced Fund | | Target 2010 Fund† | | Target 2050 Fund† |
WealthBuilder Conservative Allocation Portfolio† | | Target 2015 Fund† | | Target 2055 Fund† |
| Money market funds | | | | |
100% Treasury Money Market Fund | | Heritage Money Market Fund† | | National Tax-Free Money Market Fund |
California Municipal Money Market Fund | | Money Market Fund | | Treasury Plus Money Market Fund |
Cash Investment Money Market Fund | | Municipal Cash Management Money Market Fund | | |
Government Money Market Fund | | Municipal Money Market Fund | | |
| Variable trust funds1 | | | | |
VT Discovery Fund† | | VT Intrinsic Value Fund | | VT Small Cap Growth Fund |
VT Index Asset Allocation Fund | | VT Omega Growth Fund | | VT Small Cap Value Fund |
VT International Equity Fund | | VT Opportunity Fund† | | VT Total Return Bond Fund |
An investment in a money market fund is not insured or guaranteed by the Federal Deposit Insurance Corporation or any other government agency. Although the Wells Fargo Advantage Money Market Funds seek to preserve the value of your investment at $1.00 per share, it is possible to lose money by investing in a money market fund.
| 1. | The variable trust funds are generally available only through insurance company variable contracts. |
| † | In this report, the Wells Fargo Advantage Discovery FundSM, Wells Fargo Advantage Endeavor Select FundSM, Wells Fargo Advantage Enterprise FundSM, Wells Fargo Advantage Opportunity FundSM, Wells Fargo Advantage WealthBuilder Conservative Allocation PortfolioSM, Wells Fargo Advantage WealthBuilder Equity PortfolioSM, Wells Fargo Advantage WealthBuilder Growth Allocation PortfolioSM, Wells Fargo Advantage WealthBuilder Growth Balanced PortfolioSM, Wells Fargo Advantage WealthBuilder Moderate Balanced PortfolioSM, Wells Fargo Advantage WealthBuilder Tactical Equity PortfolioSM, Wells Fargo Advantage Dow Jones Target Today FundSM, Wells Fargo Advantage Dow Jones Target 2010 FundSM, Wells Fargo Advantage Dow Jones Target 2015 FundSM, Wells Fargo Advantage Dow Jones Target 2020 FundSM, Wells Fargo Advantage Dow Jones Target 2025 FundSM, Wells Fargo Advantage Dow Jones Target 2030 FundSM, Wells Fargo Advantage Dow Jones Target 2035 FundSM, Wells Fargo Advantage Dow Jones Target 2040 FundSM, Wells Fargo Advantage Dow Jones Target 2045 FundSM, Wells Fargo Advantage Dow Jones Target 2050 FundSM, Wells Fargo Advantage Dow Jones Target 2055 FundSM, Wells Fargo Advantage Heritage Money Market FundSM, Wells Fargo Advantage VT Discovery FundSM, and Wells Fargo Advantage VT Opportunity FundSM are referred to as the Discovery Fund, Endeavor Select Fund, Enterprise Fund, Opportunity Fund, WealthBuilder Conservative Allocation Portfolio, WealthBuilder Equity Portfolio, WealthBuilder Growth Allocation Portfolio, WealthBuilder Growth Balanced Portfolio, WealthBuilder Moderate Balanced Portfolio, WealthBuilder Tactical Equity Portfolio, Target Today Fund, Target 2010 Fund, Target 2015 Fund, Target 2020 Fund, Target 2025 Fund, Target 2030 Fund, Target 2035 Fund, Target 2040 Fund, Target 2045 Fund, Target 2050 Fund, Target 2055 Fund, Heritage Money Market Fund, VT Discovery Fund, and VT Opportunity Fund, respectively. |
Not part of the semi-annual report.
| | | | |
| 2 | | Wells Fargo Advantage International Bond Fund | | Letter to shareholders (unaudited) |

Karla M. Rabusch
President
Wells Fargo Advantage Funds
During the period, global fixed-income markets trended toward higher bond prices and lower yields but fluctuated between periods of risk aversion and corresponding recoveries in investor confidence.
Dear Valued Shareholder:
We are pleased to offer you this semi-annual report for the Wells Fargo Advantage International Bond Fund for the six-month period that ended April 30, 2013. During the period, global fixed-income markets trended toward higher bond prices and lower yields but fluctuated between periods of risk aversion and corresponding recoveries in investor confidence. On the whole, global bond markets generated positive returns during the period, benefiting from deepening rallies in the corporate bond and securitized sectors and most notably in high yield and emerging markets debt. The lower-rated credit tiers and longest-maturity segments of the fixed-income markets outperformed the higher-quality and shorter-maturity segments during the period, overcoming spates of risk aversion that flared up intermittently.
Global credit markets rallied after European Central Bank (ECB) actions.
The six-month period started after the watershed announcements of the ECB in late summer 2012, which largely declared that the euro would be preserved and that every measure would be taken to fortify the European credit markets. These actions bolstered the global credit markets and inspired an ongoing rally in high-yield corporate debt and emerging markets debt over the final two months of 2012 and into 2013. Global bond markets had been enthralled by central bank policies in Europe—decisive policymaking would bolster markets, while reescalating crises in Greece and Spain would undercut confidence and damage security pricing. But the ECB’s actions proved effective—despite continued economic woes across Europe, the announced central bank policies revitalized global credit markets. While no measure could serve as a panacea, coordinated policymaking certainly offered much-needed tonic to Europe and provided a foundation of confidence for the riskier areas of the global credit markets to rally.
Improving economic trends strengthened in the U.S. while Europe’s recession persisted.
Despite problems in Europe during the period—this time in the form of Italian politics and a bank debt crisis in Cyprus—higher-yielding global debt securities continued to perform well. Investors continued to shun most higher-quality sovereign markets in preference for higher-yielding corporate debt. In November and December 2012, high yield and emerging markets debt outperformed higher-rated sovereign debt. These trends largely carried over in the first four months of 2013, as investors rallied to the higher-yielding, lower-rated areas of the global bond markets on increasing confidence in the intentions of the ECB to support credit and a distaste for low yields from the higher-rated sovereign debt sectors.
Despite global credit markets performing well, economic conditions across the globe continued to be mixed and, at times, volatile. In the U.S., growth remained relatively healthy compared with developed Europe and Japan, but employment levels remained disappointing. U.S. Treasury yields remained near historic lows, with negative real yields—not a good outlook for the U.S. dollar or long-term investment in U.S. Treasuries. But more problematic was the eurozone, which remained firmly in recession. Fortunately, there appeared to be the political will to do whatever is necessary to preserve the single euro currency. The pain suffered in the periphery regions outside of core Europe during the period led to cheaper labor costs and lower Social Security and welfare costs. This internal devaluation within the European monetary union marketplace allowed the periphery markets to better compete in the European Union, which strengthened economic optimism during the period. It appeared to many investors that growth in the
| | | | | | |
| Letter to shareholders (unaudited) | | Wells Fargo Advantage International Bond Fund | | | 3 | |
periphery may well hit bottom in 2013 and start to pick up from what is admittedly a low base, thus providing an investing foundation that strengthened security valuations during the period.
Japan’s newly elected government took little time to deploy a new political mandate, announcing significant quantitative easing policies to deliberately weaken the currency. The Bank of Japan’s new mandate to target 2% inflation and to intervene in foreign exchange markets while buying foreign bonds may have the political weight to deal with Japan’s problems once and for all. Although this policy direction may help finally break the vicious cycle that is the Japanese economy, the circumstances indicated an unattractive market for bond investments and further currency depreciation to come. Consequently, the Japanese yen deteriorated precipitously throughout the period.
China also had new leaders in place, and investors looked for signs that political stability may resume with the new cabinet entering. Optimism that a shift from an export-led economy to a consumer-led economy appeared to develop in the early months of 2013. With the continued expansion of the offshore Renminbi-based markets, bond yields of 3.5%, and a firming currency, China increasingly appeared to demonstrate signs of being a high-quality candidate for investment, thus generally improving security valuations during the period.
Nonetheless, the longer-term picture around the globe remained largely consistent throughout the period—smaller, more dynamic economies with trade surpluses, healthier growth, and higher interest rates appeared to demonstrate the best characteristics for investment, particularly Asian and South American economies, while the largest economies with languid growth and high deficits underperformed. Optimism across the global markets continued to produce rallies in lower-rated securities while also pricing in some caution for intermittent periods of volatility that may persist in 2013, as markets attempt to balance uncertain growth prospects with deficit control and credit-risk contagion. Despite ongoing concerns across Europe, the six-month period largely produced positive performance across the global fixed-income markets, with strong returns most notably in high-yield corporate bonds and emerging markets debt.
Don’t let short-term uncertainty derail long-term investment goals.
Periods of uncertainty can present challenges, but experience has taught us that maintaining a long-term investment strategy based on individual goals and risk tolerance can be an effective way to plan for the future. To help you create a sound strategy based on your personal goals and risk tolerance, Wells Fargo
Advantage Funds offers more than 100 mutual funds and other investments spanning a wide range of asset classes and investment styles. Although diversification1 cannot guarantee an investment profit or prevent losses, we believe it can be an effective way to manage investment risk and potentially smooth out overall portfolio performance.
Despite ongoing concerns across Europe, the six-month period largely produced positive performance across the global fixed-income markets, with strong returns most notably in high-yield corporate bonds and emerging markets debt.
| 1. | Diversification does not assure or guarantee better performance and cannot eliminate the risk of investment losses. |
| | | | |
| 4 | | Wells Fargo Advantage International Bond Fund | | Letter to shareholders (unaudited) |
Thank you for choosing to invest with Wells Fargo Advantage Funds. We appreciate your confidence in us and remain committed to helping you meet your financial needs. For current information about your fund investments, contact your investment professional, visit our website at wellsfargoadvantagefunds.com, or call us directly at 1-800-222-8222. We are available 24 hours a day, 7 days a week.
Sincerely,

Karla M. Rabusch
President
Wells Fargo Advantage Funds
This page is intentionally left blank.
| | | | |
| 6 | | Wells Fargo Advantage International Bond Fund | | Performance highlights (unaudited) |
Investment objective
The Fund seeks total return, consisting of income and capital appreciation.
Adviser
Wells Fargo Funds Management, LLC
Subadviser
First International Advisors, LLC
Portfolio managers
Michael Lee
Tony Norris
Alex Perrin
Christopher Wightman
Peter Wilson
Average annual total returns1 (%) as of April 30, 2013
| | | | | | | | | | | | | | | | | | | | | | | | | | | | | | | | | | |
| | | | | Including sales charge | | | Excluding sales charge | | | Expense ratios2 (%) | |
| | | Inception date | | 1 year | | | 5 year | | | 10 year | | | 1 year | | | 5 year | | | 10 year | | | Gross | | | Net3 | |
| Class A (ESIYX) | | 9-30-2003 | | | (0.67 | ) | | | 4.43 | | | | 5.92 | | | | 3.99 | | | | 5.40 | | | | 6.41 | | | | 1.04 | | | | 1.03 | |
| Class B (ESIUX)* | | 9-30-2003 | | | (1.85 | ) | | | 4.30 | | | | 5.89 | | | | 3.15 | | | | 4.63 | | | | 5.89 | | | | 1.79 | | | | 1.78 | |
| Class C (ESIVX) | | 9-30-2003 | | | 2.11 | | | | 4.62 | | | | 5.63 | | | | 3.11 | | | | 4.62 | | | | 5.63 | | | | 1.79 | | | | 1.78 | |
| Class R6 (ESIRX) | | 11-30-2012 | | | – | | | | – | | | | – | | | | 4.29 | | | | 5.74 | | | | 6.70 | | | | 0.66 | | | | 0.65 | |
| Administrator Class (ESIDX) | | 7-30-2010 | | | – | | | | – | | | | – | | | | 4.10 | | | | 5.58 | | | | 6.56 | | | | 0.98 | | | | 0.85 | |
| Institutional Class (ESICX) | | 12-15-1993 | | | – | | | | – | | | | – | | | | 4.19 | | | | 5.72 | | | | 6.69 | | | | 0.71 | | | | 0.70 | |
| BofA Merrill Lynch Global Broad Market Ex. U.S. Index4 | | – | | | – | | | | – | | | | – | | | | (0.43 | ) | | | 3.46 | | | | 5.88 | | | | – | | | | – | |
| * | | Class B shares are closed to investment, except in connection with the reinvestment of any distributions and permitted exchanges. |
Figures quoted represent past performance, which is no guarantee of future results and do not reflect the deduction of taxes that a shareholder may pay on fund distributions or the redemption of fund shares. Investment return and principal value of an investment will fluctuate so that an investor’s shares, when redeemed, may be worth more or less than their original cost. Performance shown without sales charges would be lower if sales charges were reflected. Current performance may be lower or higher than the performance data quoted, which assumes the reinvestment of dividends and capital gains. Current month-end performance is available on the Fund’s website, wellsfargoadvantagefunds.com.
Index returns do not include transaction costs associated with buying and selling securities, any mutual fund fees or expenses, or any taxes. It is not possible to invest directly in an index.
For Class A shares, the maximum front-end sales charge is 4.50%. For Class B shares, the maximum contingent deferred sales charge is 5.00%. For Class C shares, the maximum contingent deferred sales charge is 1.00%. Performance including sales charge assumes the sales charge for the corresponding time period. Class R6, Administrator Class, and Institutional Class shares are sold without a front-end sales charge or contingent deferred sales charge.
Bond values fluctuate in response to the financial condition of individual issuers, general market and economic conditions, and changes in interest rates. In general, when interest rates rise, bond values fall and investors may lose principal value. Foreign investments are especially volatile and can rise or fall dramatically due to differences in the political and economic conditions of the host country. These risks are generally intensified in emerging markets. The use of derivatives may reduce returns and/or increase volatility. Certain investment strategies tend to increase the total risk of an investment (relative to the broader market). The Fund is exposed to high-yield securities risk, mortgage- and asset backed securities risk, and regional risk. Consult the Fund’s prospectus for additional information on these and other risks.
Please see footnotes on page 7.
| | | | | | |
| Performance highlights (unaudited) | | Wells Fargo Advantage International Bond Fund | | | 7 | |
| | | | |
| Ten largest long-term holdings5 (%) as of April 30, 2013 | |
Australian Government Bond Series 133, 5.50%, 4-21-2023 | | | 5.14 | |
Sweden, 3.75%, 8-12-2017 | | | 4.79 | |
Canada, 2.50%, 9-1-2013 | | | 3.87 | |
Italy Buoni Poliennali del Tesoro, 4.00%, 2-1-2017 | | | 3.69 | |
Italy Buoni Poliennali del Tesoro, 5.50%, 11-1-2022 | | | 3.64 | |
Bonos y Obligaciones del Estado, 4.10%, 7-30-2018 | | | 3.54 | |
Mexico, 8.50%, 11-18-2038 | | | 3.44 | |
Bonos y Obligaciones del Estado, 5.40%, 1-31-2023 | | | 3.32 | |
Poland, 5.25%, 10-25-2020 | | | 3.18 | |
Malaysia, 4.26%, 9-15-2016 | | | 3.14 | |
| | |
| Portfolio allocation6 as of April 30, 2013 |
|
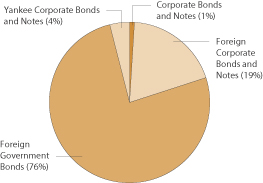
|
| 1. | Historical performance shown for Class A, Class B, Class C and Administrator Class shares prior to their inception reflects the performance of the Institutional Class shares, adjusted to reflect the higher expenses applicable to Class A, Class B, Class C, and Administrator Class shares. Historical performance shown for Class R6 shares prior to their inception reflects the performance of the Institutional Class shares and includes the higher expenses applicable to the Institutional Class shares. If these expenses had not been included, returns would be higher. Historical performance shown for all classes of the Fund prior to July 12, 2010, is based on the performance of the Fund’s predecessor, Evergreen International Bond Fund. |
| 2. | Reflects the expense ratios as stated in the most recent prospectuses. |
| 3. | The Adviser has committed through February 28, 2015, to waive fees and/or reimburse expenses to the extent necessary to cap the Fund’s Total Annual Fund Operating Expenses After Fee Waiver, excluding certain expenses, at the amounts shown. Brokerage commissions, stamp duty fees, interest, taxes, acquired fund fees and expenses, and extraordinary expenses are excluded from the cap. Without this cap, the Fund’s returns would have been lower. |
| 4. | The BofA Merrill Lynch Global Broad Market Ex. U.S. Index tracks the performance of investment grade debt publicly issued in the major domestic and euro bond markets, including sovereign, quasi-government, corporate, securitized and collateralized securities and excludes all securities denominated in U.S. dollars. You cannot invest directly in an index. |
| 5. | The ten largest long-term holdings are calculated based on the value of the securities divided by total net assets of the Fund. Holdings are subject to change and may have changed since the date specified. |
| 6. | Portfolio allocation is subject to change and is calculated based on the total long-term investments of the Fund. |
| | | | |
| 8 | | Wells Fargo Advantage International Bond Fund | | Fund expenses (unaudited) |
As a shareholder of the Fund, you incur two types of costs: (1) transaction costs, including sales charges (loads) on purchase payments and contingent deferred sales charges (if any) on redemptions and (2) ongoing costs, including
management fees, distribution (12b-1) and/or shareholder service fees, and other Fund expenses. This example is
intended to help you understand your ongoing costs (in dollars) of investing in the Fund and to compare these costs with
the ongoing costs of investing in other mutual funds.
The example is based on an investment of $1,000 invested at the beginning of the six-month period and held for the
entire period from November 1, 2012 to April 30, 2013.
Actual expenses
The “Actual” line of the table below provides information about actual account values and actual expenses. You may use
the information in this line, together with the amount you invested, to estimate the expenses that you paid over the
period. Simply divide your account value by $1,000 (for example, an $8,600 account value divided by $1,000 = 8.6), then
multiply the result by the number in the “Actual” line under the heading entitled “Expenses paid during period” for your
applicable class of shares to estimate the expenses you paid on your account during this period.
Hypothetical example for comparison purposes
The “Hypothetical” line of the table below provides information about hypothetical account values and hypothetical
expenses based on the Fund’s actual expense ratio and an assumed rate of return of 5% per year before expenses, which
is not the Fund’s actual return. The hypothetical account values and expenses may not be used to estimate the actual
ending account balance or expenses you paid for the period. You may use this information to compare the ongoing costs
of investing in the Fund and other funds. To do so, compare this 5% hypothetical example with the 5% hypothetical
examples that appear in the shareholder reports of the other funds.
Please note that the expenses shown in the table are meant to highlight your ongoing costs only and do not reflect any
transactional costs, such as sales charges (loads) and contingent deferred sales charges. Therefore, the “Hypothetical” line
of the table is useful in comparing ongoing costs only and will not help you determine the relative total costs of owning
different funds. In addition, if these transactional costs were included, your costs would have been higher.
| | | | | | | | | | | | | | | | |
| | | Beginning
account value
11-1-2012 | | | Ending
account value
4-30-2013 | | | Expenses
paid during
the period1 | | | Net annual
expense ratio | |
Class A | | | | | | | | | | | | | | | | |
Actual | | $ | 1,000.00 | | | $ | 999.03 | | | $ | 5.11 | | | | 1.03 | % |
Hypothetical (5% return before expenses) | | $ | 1,000.00 | | | $ | 1,019.69 | | | $ | 5.16 | | | | 1.03 | % |
Class B | | | | | | | | | | | | | | | | |
Actual | | $ | 1,000.00 | | | $ | 995.11 | | | $ | 8.81 | | | | 1.78 | % |
Hypothetical (5% return before expenses) | | $ | 1,000.00 | | | $ | 1,015.97 | | | $ | 8.90 | | | | 1.78 | % |
Class C | | | | | | | | | | | | | | | | |
Actual | | $ | 1,000.00 | | | $ | 995.13 | | | $ | 8.81 | | | | 1.78 | % |
Hypothetical (5% return before expenses) | | $ | 1,000.00 | | | $ | 1,015.97 | | | $ | 8.90 | | | | 1.78 | % |
Class R6 | | | | | | | | | | | | | | | | |
Actual | | $ | 1,000.00 | | | $ | 1,001.40 | | | $ | 3.23 | | | | 0.65 | % |
Hypothetical (5% return before expenses) | | $ | 1,000.00 | | | $ | 1,021.57 | | | $ | 3.26 | | | | 0.65 | % |
Administrator Class | | | | | | | | | | | | | | | | |
Actual | | $ | 1,000.00 | | | $ | 999.34 | | | $ | 4.21 | | | | 0.85 | % |
Hypothetical (5% return before expenses) | | $ | 1,000.00 | | | $ | 1,020.58 | | | $ | 4.26 | | | | 0.85 | % |
Institutional Class | | | | | | | | | | | | | | | | |
Actual | | $ | 1,000.00 | | | $ | 1,000.44 | | | $ | 3.47 | | | | 0.70 | % |
Hypothetical (5% return before expenses) | | $ | 1,000.00 | | | $ | 1,021.32 | | | $ | 3.51 | | | | 0.70 | % |
| 1. | Expenses paid is equal to the annualized expense ratio of each class multiplied by the average account value over the period, multiplied by the number of days in the most recent fiscal half-year divided by the number of days in the fiscal year (to reflect the one-half-year period). |
| | | | | | |
| Portfolio of investments—April 30, 2013 (unaudited) | | Wells Fargo Advantage International Bond Fund | | | 9 | |
| | | | | | | | | | | | | | | | |
| Security name | | Interest rate | | | Maturity date | | | Principal | | | Value | |
| | | | | | | | | | | | | | | | |
| | | |
Corporate Bonds and Notes: 0.62% | | | | | | | | | | | | | |
| | | |
| United States: 0.62% | | | | | | | | | | | | | |
JPMorgan Chase & Company (Financials, Diversified Financial Services) | | | 3.25 | % | | | 9-23-2022 | | | $ | 7,500,000 | | | $ | 7,681,335 | |
NBCUniversal Media LLC (Consumer Discretionary, Media) | | | 2.88 | | | | 1-15-2023 | | | | 2,600,000 | | | | 2,673,733 | |
| | | | |
Total Corporate Bonds and Notes (Cost $10,267,972) | | | | | | | | | | | | | | | 10,355,068 | |
| | | | | | | | | | | | | | | | |
| | | |
Foreign Corporate Bonds and Notes @: 19.69% | | | | | | | | | | | | | |
| | | |
| Australia: 0.97% | | | | | | | | | | | | | |
General Electric Capital Corporation (Financials, Diversified Financial Services, AUD) | | | 6.00 | | | | 3-15-2019 | | | | 1,405,000 | | | | 1,566,145 | |
Telstra Corporation Limited (Telecommunication Services, Diversified Telecommunication Services, EUR) | | | 3.75 | | | | 5-16-2022 | | | | 2,500,000 | | | | 3,763,351 | |
Telstra Corporation Limited (Telecommunication Services, Diversified Telecommunication Services, EUR) | | | 4.25 | | | | 3-23-2020 | | | | 7,000,000 | | | | 10,832,010 | |
| | | | |
| | | | | | | | | | | | | | | 16,161,506 | |
| | | | | | | | | | | | | | | | |
| | | |
| Finland: 0.04% | | | | | | | | | | | | | |
Nokia Siemens Networks (Telecommunication Services, Diversified Telecommunication Services, EUR) 144A | | | 6.75 | | | | 4-15-2018 | | | | 500,000 | | | | 694,697 | |
| | | | | | | | | | | | | | | | |
| | | |
| France: 2.09% | | | | | | | | | | | | | |
Casino Guichard Perrachon SA (Consumer Discretionary, Hotels, Restaurants & Leisure, EUR) | | | 4.38 | | | | 2-8-2017 | | | | 4,150,000 | | | | 6,065,396 | |
Casino Guichard Perrachon SA (Consumer Discretionary, Hotels, Restaurants & Leisure, EUR) | | | 4.73 | | | | 5-26-2021 | | | | 3,500,000 | | | | 5,380,292 | |
Pernod Ricard SA (Consumer Staples, Beverages, EUR) | | | 4.88 | | | | 3-18-2016 | | | | 3,750,000 | | | | 5,447,483 | |
Pernod Ricard SA (Consumer Staples, Beverages, EUR) | | | 5.00 | | | | 3-15-2017 | | | | 1,900,000 | | | | 2,837,511 | |
Pernod Ricard SA (Consumer Staples, Beverages, EUR) | | | 7.00 | | | | 1-15-2015 | | | | 2,450,000 | | | | 3,558,629 | |
Veolia Environnement (Utilities, Multi-Utilities, EUR) | | | 6.75 | | | | 4-24-2019 | | | | 6,910,000 | | | | 11,634,058 | |
| | | | |
| | | | | | | | | | | | | | | 34,923,369 | |
| | | | | | | | | | | | | | | | |
| | | |
| Germany: 1.38% | | | | | | | | | | | | | |
KfW (Financials, Commercial Banks, AUD) | | | 6.25 | | | | 5-19-2021 | | | | 11,700,000 | | | | 13,843,021 | |
KfW (Financials, Commercial Banks, NOK) | | | 3.75 | | | | 9-25-2015 | | | | 35,500,000 | | | | 6,441,355 | |
Unitymedia Hessen GmbH & Company (Consumer Discretionary, Media, EUR) 144A | | | 5.13 | | | | 1-21-2023 | | | | 1,700,000 | | | | 2,227,622 | |
Unitymedia Hessen GmbH & Company (Consumer Discretionary, Media, EUR) 144A | | | 5.75 | | | | 1-15-2023 | | | | 500,000 | | | | 676,583 | |
| | | | |
| | | | | | | | | | | | | | | 23,188,581 | |
| | | | | | | | | | | | | | | | |
| | | |
| Ireland: 0.24% | | | | | | | | | | | | | |
Rottapharm Limited (Health Care, Pharmaceuticals, EUR) 144A | | | 6.13 | | | | 11-15-2019 | | | | 3,000,000 | | | | 4,061,475 | |
| | | | | | | | | | | | | | | | |
| | | |
| Italy: 0.26% | | | | | | | | | | | | | |
Luxottica Group SpA (Consumer Discretionary, Textiles, Apparel & Luxury Goods, EUR) | | | 3.63 | | | | 3-19-2019 | | | | 3,000,000 | | | | 4,397,471 | |
| | | | | | | | | | | | | | | | |
| | | |
| Luxembourg: 2.80% | | | | | | | | | | | | | |
European Investment Bank (Financials, Commercial Banks, NZD) | | | 6.50 | | | | 9-10-2014 | | | | 11,189,000 | | | | 10,029,970 | |
European Investment Bank (Financials, Commercial Banks, AUD) | | | 6.50 | | | | 8-7-2019 | | | | 16,400,000 | | | | 19,192,406 | |
Fiat Industrial SpA (Financials, Consumer Finance, EUR) | | | 6.25 | | | | 3-9-2018 | | | | 3,000,000 | | | | 4,503,971 | |
The accompanying notes are an integral part of these financial statements.
| | | | |
| 10 | | Wells Fargo Advantage International Bond Fund | | Portfolio of investments—April 30, 2013 (unaudited) |
| | | | | | | | | | | | | | | | |
| Security name | | Interest rate | | | Maturity date | | | Principal | | | Value | |
| | | | | | | | | | | | | | | | |
| | | | |
| Luxembourg (continued) | | | | | | | | | | | | | | | | |
Heidelbergcement AG (Industrials, Building Products, EUR) | | | 8.50 | % | | | 10-31-2019 | | | | 1,730,000 | | | $ | 2,904,864 | |
Sunrise Communications (Telecommunication Services, Diversified Telecommunication Services, EUR) | | | 7.00 | | | | 12-31-2017 | | | | 200,000 | | | | 283,144 | |
Telenet Finance V Luxemburg SCA (Consumer Discretionary, Media, EUR) | | | 6.25 | | | | 8-15-2022 | | | | 3,000,000 | | | | 4,108,885 | |
Zinc Capital SA (Financials, Diversified Financial Services, EUR) | | | 8.88 | | | | 5-15-2018 | | | | 4,025,000 | | | | 5,844,050 | |
| | | | |
| | | | | | | | | | | | | | | 46,867,290 | |
| | | | | | | | | | | | | | | | |
| | | | |
| Mexico: 0.42% | | | | | | | | | | | | | | | | |
America Movil SAB de CV (Telecommunication Services, Wireless Telecommunication Services, EUR) | | | 3.00 | | | | 7-12-2021 | | | | 5,100,000 | | | | 7,108,621 | |
| | | | | | | | | | | | | | | | |
| | | | |
| Netherlands: 3.49% | | | | | | | | | | | | | | | | |
Bank Nederlandse Gemeenten (Financials, Commercial Banks, EUR) | | | 2.63 | | | | 9-1-2020 | | | | 9,250,000 | | | | 13,295,208 | |
BMW Finance NV (Financials, Consumer Finance, EUR) | | | 3.63 | | | | 1-29-2018 | | | | 3,500,000 | | | | 5,133,296 | |
British-American Tobacco Holdings BV (Consumer Staples, Tobacco, EUR) | | | 4.00 | | | | 7-7-2020 | | | | 4,370,000 | | | | 6,655,570 | |
Deutsche Telekom International Finance BV (Telecommunication Services, Diversified Telecommunication Services, EUR) | | | 6.00 | | | | 1-20-2017 | | | | 7,000,000 | | | | 10,883,358 | |
Heineken NV (Consumer Staples, Beverages, EUR) | | | 2.13 | | | | 8-4-2020 | | | | 6,000,000 | | | | 8,103,117 | |
Rabobank Nederland (Financials, Commercial Banks, EUR) | | | 4.25 | | | | 1-16-2017 | | | | 5,541,000 | | | | 8,140,854 | |
Rabobank Nederland (Financials, Commercial Banks, NZD) | | | 6.25 | | | | 7-10-2014 | | | | 4,361,000 | | | | 3,868,257 | |
UPC Holdings BV (Consumer Discretionary, Media, EUR) | | | 8.38 | | | | 8-15-2020 | | | | 1,635,000 | | | | 2,400,403 | |
| | | | |
| | | | | | | | | | | | | | | 58,480,063 | |
| | | | | | | | | | | | | | | | |
| | | | |
| Russia: 0.03% | | | | | | | | | | | | | | | | |
Sberbank Rossii (Financials, Commercial Banks, RUB) | | | 7.00 | | | | 1-31-2016 | | | | 14,200,000 | | | | 457,230 | |
| | | | | | | | | | | | | | | | |
| | | | |
| South Africa: 0.24% | | | | | | | | | | | | | | | | |
Foodcorp Limited (Consumer Staples, Food & Staples Retailing, EUR) | | | 8.75 | | | | 3-1-2018 | | | | 2,730,000 | | | | 3,945,814 | |
| | | | | | | | | | | | | | | | |
| | | | |
| Spain: 0.24% | | | | | | | | | | | | | | | | |
Telefonica Emisiones S.A.U. (Telecommunication Services, Diversified Telecommunication Services, EUR) | | | 3.99 | | | | 1-23-2023 | | | | 3,000,000 | | | | 4,077,279 | |
| | | | | | | | | | | | | | | | |
| | | | |
| Switzerland: 0.87% | | | | | | | | | | | | | | | | |
Eurofima (Financials, Commercial Banks, AUD) | | | 6.25 | | | | 12-28-2018 | | | | 12,750,000 | | | | 14,596,465 | |
| | | | | | | | | | | | | | | | |
| | | | |
| United Kingdom: 4.89% | | | | | | | | | | | | | | | | |
Anglian Water Osprey Financing plc (Utilities, Water & Sewer Revenue, GBP) | | | 7.00 | | | | 1-31-2018 | | | | 4,000,000 | | | | 6,788,139 | |
Arqiva Broadcast Finance plc (Consumer Discretionary, Media, GBP) 144A | | | 9.50 | | | | 3-31-2020 | | | | 800,000 | | | | 1,317,241 | |
Aston Martin Capital Limited (Finance, Consumer Finance, GBP) | | | 9.25 | | | | 7-15-2018 | | | | 900,000 | | | | 1,453,935 | |
B.A.T. International Finance plc (Financials, Diversified Financial Services, EUR) | | | 3.63 | | | | 11-9-2021 | | | | 4,000,000 | | | | 5,973,266 | |
GlaxoSmithKline plc (Health Care, Pharmaceuticals, EUR) | | | 5.63 | | | | 12-13-2017 | | | | 6,500,000 | | | | 10,365,331 | |
Heathrow Funding Limited (Industrials, Transportation Infrastructure, EUR) | | | 4.60 | | | | 2-15-2020 | | | | 9,450,000 | | | | 14,127,820 | |
Imperial Tobacco Finance Company (Consumer Staples, Tobacco, EUR) | | | 4.50 | | | | 7-5-2018 | | | | 5,000,000 | | | | 7,521,565 | |
Imperial Tobacco Finance Company (Consumer Staples, Tobacco, EUR) | | | 5.00 | | | | 12-2-2019 | | | | 4,100,000 | | | | 6,439,505 | |
Jaguar Land Rover plc (Consumer Discretionary, Automobiles, GBP) | | | 8.25 | | | | 3-15-2020 | | | | 3,355,000 | | | | 5,911,131 | |
National Grid plc (Utilities, Multi-Utilities, EUR) | | | 4.38 | | | | 3-10-2020 | | | | 6,511,000 | | | | 10,016,426 | |
Nationwide Building Society (Financials, Diversified Financial Services, EUR) | | | 3.13 | | | | 4-3-2017 | | | | 4,000,000 | | | | 5,655,512 | |
Phones4u Finance plc (Telecommunication Services, Diversified Telecommunication Services, GBP) | | | 9.50 | | | | 4-1-2018 | | | | 2,410,000 | | | | 3,912,034 | |
The accompanying notes are an integral part of these financial statements.
| | | | | | |
| Portfolio of investments—April 30, 2013 (unaudited) | | Wells Fargo Advantage International Bond Fund | | | 11 | |
| | | | | | | | | | | | | | | | |
| Security name | | Interest rate | | | Maturity date | | | Principal | | | Value | |
| | | | | | | | | | | | | | | | |
| | | | |
| United Kingdom (continued) | | | | | | | | | | | | | | | | |
Virgin Media Finance plc (Telecommunication Services, Diversified Telecommunication Services, GBP) | | | 8.88 | % | | | 10-15-2019 | | | | 1,431,000 | | | $ | 2,471,802 | |
| | | | |
| | | | | | | | | | | | | | | 81,953,707 | |
| | | | | | | | | | | | | | | | |
| | | | |
| United States: 1.73% | | | | | | | | | | | | | | | | |
Anheuser-Busch InBev NV (Consumer Staples, Beverages, EUR) | | | 2.88 | | | | 9-25-2024 | | | | 5,000,000 | | | | 6,929,583 | |
EP Energy (Energy, Oil, Gas & Consumable Fuels, EUR) | | | 5.88 | | | | 11-1-2019 | | | | 3,500,000 | | | | 5,058,736 | |
General Electric Capital Corporation (Financials, Diversified Financial Services, NZD) | | | 7.63 | | | | 12-10-2014 | | | | 10,200,000 | | | | 9,284,755 | |
IBM Corporation (Information Technology, Computers & Peripherals, EUR) | | | 1.38 | | | | 11-19-2019 | | | | 1,800,000 | | | | 2,371,578 | |
Iron Mountain Incorporated (Industrials, Commercial Services & Supplies, EUR) | | | 6.75 | | | | 10-15-2018 | | | | 1,920,000 | | | | 2,585,437 | |
National Grid USA (Utilities, Electric Utilities, EUR) | | | 3.25 | | | | 6-3-2015 | | | | 2,065,000 | | | | 2,855,293 | |
| | | | |
| | | | | | | | | | | | | | | 29,085,382 | |
| | | | | | | | | | | | | | | | |
| | | | |
Total Foreign Corporate Bonds and Notes (Cost $300,684,441) | | | | | | | | | | | | | | | 329,998,950 | |
| | | | | | | | | | | | | | | | |
| | | | |
Foreign Government Bonds @: 76.03% | | | | | | | | | | | | | | | | |
Australian Government Bond Series 133 (AUD) | | | 5.50 | | | | 4-21-2023 | | | | 69,000,000 | | | | 86,165,681 | |
Bonos y Obligaciones del Estado (EUR) | | | 4.10 | | | | 7-30-2018 | | | | 42,700,000 | | | | 59,231,046 | |
Bonos y Obligaciones del Estado (EUR) 144A« | | | 5.40 | | | | 1-31-2023 | | | | 38,430,000 | | | | 55,593,001 | |
Brazil (BRL) | | | 8.50 | | | | 1-5-2024 | | | | 61,035,000 | | | | 33,953,245 | |
Brazil (BRL) | | | 6.00 | | | | 1-1-2017 | | | | 89,550,000 | | | | 47,655,102 | |
Canada (CAD) | | | 2.50 | | | | 9-1-2013 | | | | 65,000,000 | | | | 64,830,959 | |
Canada (CAD) 144A | | | 3.35 | | | | 12-15-2020 | | | | 5,500,000 | | | | 6,027,862 | |
Canada (NZD) | | | 6.25 | | | | 6-16-2015 | | | | 13,150,000 | | | | 11,962,184 | |
Chile (CLP) | | | 5.50 | | | | 8-5-2020 | | | | 531,500,000 | | | | 1,194,366 | |
Colombia (COP) | | | 7.75 | | | | 4-14-2021 | | | | 1,675,000,000 | | | | 1,147,941 | |
Germany (NOK) | | | 4.00 | | | | 3-4-2016 | | | | 40,000,000 | | | | 7,352,453 | |
Hungary (HUF) | | | 6.75 | | | | 11-24-2017 | | | | 760,000,000 | | | | 3,590,327 | |
Hungary (HUF) | | | 7.00 | | | | 6-24-2022 | | | | 8,243,000,000 | | | | 40,460,979 | |
Hungary (HUF) | | | 7.50 | | | | 11-12-2020 | | | | 1,500,000,000 | | | | 7,518,951 | |
Indonesia (IDR) | | | 7.38 | | | | 9-15-2016 | | | | 25,630,000,000 | | | | 2,857,835 | |
Italy Buoni Poliennali del Tesoro (EUR) | | | 4.00 | | | | 2-1-2017 | | | | 44,300,000 | | | | 61,805,772 | |
Italy Buoni Poliennali del Tesoro (EUR) | | | 5.50 | | | | 11-1-2022 | | | | 41,000,000 | | | | 61,063,289 | |
Korea (KRW) | | | 2.75 | | | | 9-10-2017 | | | | 33,300,000,000 | | | | 30,474,474 | |
Korea (KRW) | | | 5.25 | | | | 9-10-2015 | | | | 11,400,000,000 | | | | 10,993,045 | |
Korea (KRW) | | | 5.25 | | | | 3-10-2027 | | | | 33,590,000,000 | | | | 38,695,174 | |
Malaysia (MYR) | | | 3.26 | | | | 3-1-2018 | | | | 5,250,000 | | | | 1,734,037 | |
Malaysia (MYR) | | | 3.31 | | | | 10-31-2017 | | | | 78,000,000 | | | | 25,768,483 | |
Malaysia (MYR) | | | 4.26 | | | | 9-15-2016 | | | | 153,725,000 | | | | 52,546,262 | |
Mexico (MXN) | | | 6.50 | | | | 6-9-2022 | | | | 163,000,000 | | | | 15,431,283 | |
Mexico (MXN) | | | 7.25 | | | | 12-15-2016 | | | | 52,500,000 | | | | 4,784,278 | |
Mexico (MXN) | | | 7.75 | | | | 11-13-2042 | | | | 11,500,000 | | | | 1,286,106 | |
Mexico (MXN) | | | 8.50 | | | | 11-18-2038 | | | | 484,100,000 | | | | 57,610,304 | |
New Zealand (NZD) | | | 5.50 | | | | 4-15-2023 | | | | 49,925,000 | | | | 51,169,983 | |
Nigeria (NGN) | | | 15.10 | | | | 4-27-2017 | | | | 170,000,000 | | | | 1,183,544 | |
Norway (NOK) | | | 3.75 | | | | 5-25-2021 | | | | 167,000,000 | | | | 33,118,505 | |
Poland (PLN) ¤ | | | 0.00 | | | | 7-25-2013 | | | | 4,000,000 | | | | 1,258,414 | |
Poland (PLN) | | | 4.00 | | | | 10-25-2023 | | | | 80,100,000 | | | | 27,017,289 | |
Poland (PLN) | | | 5.25 | | | | 10-25-2020 | | | | 146,300,000 | | | | 53,202,946 | |
The accompanying notes are an integral part of these financial statements.
| | | | |
| 12 | | Wells Fargo Advantage International Bond Fund | | Portfolio of investments—April 30, 2013 (unaudited) |
| | | | | | | | | | | | | | | | |
| Security name | | Interest rate | | | Maturity date | | | Principal | | | Value | |
| | | | | | | | | | | | | | | | |
| | | | |
Foreign Government Bonds @ (continued) | | | | | | | | | | | | | | | | |
Province of Alberta (CAD) | | | 2.55 | % | | | 12-15-2022 | | | | 11,750,000 | | | $ | 11,784,290 | |
Province of Ontario (AUD) | | | 6.25 | | | | 9-29-2020 | | | | 13,600,000 | | | | 15,839,801 | |
Queensland Treasury (AUD) | | | 5.75 | | | | 7-22-2024 | | | | 11,000,000 | | | | 12,796,266 | |
Republic of South Africa (ZAR) | | | 2.00 | | | | 1-31-2025 | | | | 234,603,853 | | | | 29,824,637 | |
Republic of South Africa (ZAR) | | | 2.60 | | | | 3-31-2028 | | | | 21,349,890 | | | | 2,837,238 | |
Republic of South Africa (ZAR) | | | 3.45 | | | | 12-7-2033 | | | | 16,535,429 | | | | 2,477,460 | |
Republic of South Africa (ZAR) | | | 6.50 | | | | 2-28-2041 | | | | 22,300,000 | | | | 2,161,016 | |
Republic of South Africa (ZAR) | | | 7.75 | | | | 2-28-2023 | | | | 125,000,000 | | | | 15,428,317 | |
Romania (RON) | | | 6.00 | | | | 4-30-2016 | | | | 3,850,000 | | | | 1,205,590 | |
Russia (RUB) | | | 7.00 | | | | 1-25-2023 | | | | 189,500,000 | | | | 6,342,179 | |
Russia (RUB) | | | 7.50 | | | | 3-15-2018 | | | | 1,203,800,000 | | | | 41,178,027 | |
Sweden (SEK) | | | 1.50 | | | | 11-13-2023 | | | | 216,400,000 | | | | 33,066,106 | |
Sweden (SEK) | | | 3.75 | | | | 8-12-2017 | | | | 467,300,000 | | | | 80,278,939 | |
Thailand (THB) | | | 3.25 | | | | 6-16-2017 | | | | 1,523,000,000 | | | | 52,463,795 | |
Turkey (TRY) | | | 6.30 | | | | 2-14-2018 | | | | 6,655,000 | | | | 3,782,705 | |
Turkey (TRY) | | | 9.00 | | | | 3-8-2017 | | | | 5,900,000 | | | | 3,672,793 | |
| | | | |
Total Foreign Government Bonds (Cost $1,215,909,136) | | | | | | | | | | | | | | | 1,273,824,279 | |
| | | | | | | | | | | | | | | | |
| | | | |
Yankee Corporate Bonds and Notes: 3.76% | | | | | | | | | | | | | | | | |
| | | | |
| Bermuda: 0.37% | | | | | | | | | | | | | | | | |
Qtel International Finance Limited (Telecommunication Services, Diversified Telecommunication Services) | | | 4.75 | | | | 2-16-2021 | | | $ | 5,550,000 | | | | 6,243,750 | |
| | | | | | | | | | | | | | | | |
| | | | |
| Brazil: 0.89% | | | | | | | | | | | | | | | | |
BRF SA (Consumer Staples, Food Products) | | | 5.88 | | | | 6-6-2022 | | | | 300,000 | | | | 341,400 | |
ITAU Unibanco Holdings SA (Financials, Commercial Banks) 144A | | | 5.13 | | | | 5-13-2023 | | | | 7,350,000 | | | | 7,634,813 | |
Petroplus Finance Limited (Energy, Oil, Gas & Consumable Fuels) | | | 5.75 | | | | 1-20-2020 | | | | 6,185,000 | | | | 6,982,080 | |
| | | | |
| | | | | | | | | | | | | | | 14,958,293 | |
| | | | | | | | | | | | | | | | |
| | | | |
| Cayman Islands: 0.45% | | | | | | | | | | | | | | | | |
International Petroleum Investment Company Limited (Energy, Oil, Gas & Consumable Fuels) | | | 5.00 | | | | 11-15-2020 | | | | 5,700,000 | | | | 6,512,250 | |
Petrobras International Finance Company (Energy, Oil, Gas & Consumable Fuels) | | | 5.38 | | | | 1-27-2021 | | | | 860,000 | | | | 949,791 | |
| | | | |
| | | | | | | | | | | | | | | 7,462,041 | |
| | | | | | | | | | | | | | | | |
| | | | |
| Luxembourg: 0.12% | | | | | | | | | | | | | | | | |
Aguila 3 SA (Industrials, Airlines) | | | 7.88 | | | | 1-31-2018 | | | | 1,500,000 | | | | 1,616,250 | |
TNK BP Finance SA (Financials, Commercial Banks) | | | 6.63 | | | | 3-20-2017 | | | | 400,000 | | | | 456,000 | |
| | | | |
| | | | | | | | | | | | | | | 2,072,250 | |
| | | | | | | | | | | | | | | | |
| | | | |
| Mexico: 0.12% | | | | | | | | | | | | | | | | |
America Movil SAB de CV (Telecommunication Services, Wireless Telecommunication Services) | | | 3.13 | | | | 7-16-2022 | | | | 2,000,000 | | | | 2,035,578 | |
| | | | | | | | | | | | | | | | |
| | | | |
| Netherlands: 0.23% | | | | | | | | | | | | | | | | |
Mubadala Development Company (Energy, Oil, Gas & Consumable Fuels) | | | 5.50 | | | | 4-20-2021 | | | | 3,200,000 | | | | 3,780,000 | |
| | | | | | | | | | | | | | | | |
The accompanying notes are an integral part of these financial statements.
| | | | | | |
| Portfolio of investments—April 30, 2013 (unaudited) | | Wells Fargo Advantage International Bond Fund | | | 13 | |
| | | | | | | | | | | | | | | | |
| Security name | | Interest rate | | | Maturity date | | | Principal | | | Value | |
| | | | | | | | | | | | | | | | |
| | | | |
| Peru: 0.43% | | | | | | | | | | | | | | | | |
Banco De Credito Del Peru (Financials, Commercial Banks) 144A(i) | | | 4.25 | % | | | 4-1-2023 | | | $ | 7,235,000 | | | $ | 7,260,323 | |
| | | | | | | | | | | | | | | | |
| | | | |
| South Africa: 0.17% | | | | | | | | | | | | | | | | |
Eskom Holdings Limited (Utilities, Electric Utilities) | | | 5.75 | | | | 1-26-2021 | | | | 225,000 | | | | 251,438 | |
Transnet SOC Limited (Industrials, Transportation Infrastructure) | | | 4.50 | | | | 2-10-2016 | | | | 2,500,000 | | | | 2,649,578 | |
| | | | |
| | | | | | | | | | | | | | | 2,901,016 | |
| | | | | | | | | | | | | | | | |
| | | | |
| United Kingdom: 0.89% | | | | | | | | | | | | | | | | |
British Sky Broadcasting Group plc (Consumer Discretionary, Media) 144A | | | 3.13 | | | | 11-26-2022 | | | | 2,900,000 | | | | 2,936,424 | |
HSBC Holdings plc (Financials, Commercial Banks) | | | 4.00 | | | | 3-30-2022 | | | | 8,000,000 | | | | 8,863,208 | |
Sable International Finance Limited (Telecommunication Services, Diversified Telecommunication Services) | | | 7.75 | | | | 2-15-2017 | | | | 2,795,000 | | | | 3,018,600 | |
| | | | |
| | | | | | | | | | | | | | | 14,818,232 | |
| | | | | | | | | | | | | | | | |
| | | | |
| Virgin Islands (British): 0.09% | | | | | | | | | | | | | | | | |
Gold Fields Orogen Holdings (Materials, Metals & Mining) | | | 4.88 | | | | 10-7-2020 | | | | 1,500,000 | | | | 1,442,882 | |
| | | | | | | | | | | | | | | | |
| | | | |
Total Yankee Corporate Bonds and Notes (Cost $58,599,232) | | | | | | | | | | | | | | | 62,974,365 | |
| | | | | | | | | | | | | | | | |
| | | | |
| | | Yield | | | | | | Shares | | | | |
| Short-Term Investments: 0.14% | | | | | | | | | | | | | | | | |
| | | | |
| Investment Companies: 0.14% | | | | | | | | | | | | | | | | |
Wells Fargo Securities Lending Cash Investments, LLC (l)(u)(r)(v) | | | 0.18 | % | | | | | | | 2,293,500 | | | | 2,293,500 | |
| | | | | | | | | | | | | | | | |
| | | | |
Total Short-Term Investments (Cost $2,293,500) | | | | | | | | | | | | | | | 2,293,500 | |
| | | | | | | | | | | | | | | | |
| | | | | | | | |
Total investments in securities (Cost $1,587,754,281) * | | | 100.24 | % | | | 1,679,446,162 | |
Other assets and liabilities, net | | | (0.24 | ) | | | (4,066,961 | ) |
| | | | | | | | |
| Total net assets | | | 100.00 | % | | $ | 1,675,379,201 | |
| | | | | | | | |
| @ | Foreign bond principal is denominated in local currency. |
| 144A | Security that may be resold to “qualified institutional buyers” under Rule 144A or security offered pursuant to Section 4(2) of the Securities Act of 1933, as amended. |
| « | All or a portion of this security is on loan. |
| ¤ | Security issued in zero coupon form with no periodic interest payments. |
| (l) | Investment in an affiliate |
| (u) | Rate shown is the 7-day annualized yield at period end. |
| (r) | The investment company is exempt from registration under Section 3(c)(7) of the Investment Company Act of 1940, as amended. |
| (v) | Security represents investment of cash collateral received from securities on loan. |
| * | Cost for federal income tax purposes is $1,587,873,741 and unrealized appreciation (depreciation) consists of: |
| | | | |
Gross unrealized appreciation | | $ | 118,863,024 | |
Gross unrealized depreciation | | | (27,290,603 | ) |
| | | | |
Net unrealized appreciation | | $ | 91,572,421 | |
The accompanying notes are an integral part of these financial statements.
| | | | |
| 14 | | Wells Fargo Advantage International Bond Fund | | Statement of assets and liabilities—April 30, 2013 (unaudited) |
| | | | |
| | | | |
| |
Assets | | | | |
Investments | | | | |
In unaffiliated securities (including securities on loan), at value (see cost below) | | $ | 1,677,152,662 | |
In affiliated securities, at value (see cost below) | | | 2,293,500 | |
| | | | |
Total investments, at value (see cost below) | | | 1,679,446,162 | |
Foreign currency, at value (see cost below) | | | 2,175,232 | |
Receivable for investments sold | | | 64,887,645 | |
Receivable for Fund shares sold | | | 3,879,617 | |
Receivable for interest | | | 23,191,938 | |
Receivable for securities lending income | | | 4,043 | |
Unrealized gains on forward foreign currency contracts | | | 6,991,832 | |
Prepaid expenses and other assets | | | 71,741 | |
| | | | |
Total assets | | | 1,780,648,210 | |
| | | | |
| |
Liabilities | | | | |
Payable for investments purchased | | | 75,329,515 | |
Payable for Fund shares redeemed | | | 1,600,991 | |
Unrealized losses on forward foreign currency contracts | | | 18,088,796 | |
Payable upon receipt of securities loaned | | | 2,293,500 | |
Advisory fee payable | | | 672,867 | |
Distribution fees payable | | | 13,950 | |
Due to other related parties | | | 196,552 | |
Bank borrowing payable | | | 6,820,336 | |
Accrued expenses and other liabilities | | | 252,502 | |
| | | | |
Total liabilities | | | 105,269,009 | |
| | | | |
Total net assets | | $ | 1,675,379,201 | |
| | | | |
| |
NET ASSETS CONSIST OF | | | | |
Paid-in capital | | $ | 1,593,961,188 | |
Undistributed net investment income | | | 26,920,410 | |
Accumulated net realized losses on investments | | | (26,247,832 | ) |
Net unrealized gains on investments | | | 80,745,435 | |
| | | | |
Total net assets | | $ | 1,675,379,201 | |
| | | | |
| |
COMPUTATION OF NET ASSET VALUE AND OFFERING PRICE PER SHARE1 | | | | |
Net assets – Class A | | $ | 132,598,796 | |
Shares outstanding – Class A | | | 11,354,691 | |
Net asset value per share – Class A | | | $11.68 | |
Maximum offering price per share – Class A2 | | | $12.23 | |
Net assets – Class B | | $ | 2,834,457 | |
Shares outstanding – Class B | | | 242,955 | |
Net asset value per share – Class B | | | $11.67 | |
Net assets – Class C | | $ | 19,940,450 | |
Shares outstanding – Class C | | | 1,721,340 | |
Net asset value per share – Class C | | | $11.58 | |
Net assets – Class R6 | | $ | 50,140 | |
Share outstanding – Class R6 | | | 4,290 | |
Net asset value per share – Class R6 | | | $11.69 | |
Net assets – Administrator Class | | $ | 319,623,059 | |
Shares outstanding – Administrator Class | | | 27,408,246 | |
Net asset value per share – Administrator Class | | | $11.66 | |
Net assets – Institutional Class | | $ | 1,200,332,299 | |
Shares outstanding – Institutional Class | | | 102,752,786 | |
Net asset value per share – Institutional Class | | | $11.68 | |
Investments in unaffiliated securities (including securities on loan), at cost | | $ | 1,585,460,781 | |
| | | | |
Investments in affiliated securities, at cost | | $ | 2,293,500 | |
| | | | |
Total investments, at cost | | $ | 1,587,754,281 | |
| | | | |
Securities on loan, at value | | $ | 2,184,061 | |
| | | | |
Foreign currency, at cost | | $ | 2,158,611 | |
| | | | |
| 1. | The Fund has an unlimited number of authorized shares. |
| 2. | Maximum offering price is computed as 100/95.50 of net asset value. On investments of $50,000 or more, the offering price is reduced. |
The accompanying notes are an integral part of these financial statements.
| | | | | | |
| Statement of operations—six months ended April 30, 2013 (unaudited) | | Wells Fargo Advantage International Bond Fund | | | 15 | |
| | | | |
| | | | |
| |
Investment income | | | | |
Interest** | | $ | 29,208,738 | |
Securities lending income, net | | | 4,991 | |
| | | | |
Total investment income | | | 29,213,729 | |
| | | | |
| |
Expenses | | | | |
Advisory fee | | | 4,394,985 | |
Administration fees | | | | |
Fund level | | | 420,903 | |
Class A | | | 107,486 | |
Class B | | | 2,604 | |
Class C | | | 17,108 | |
Class R6 | | | 6 | 1 |
Administrator Class | | | 149,115 | |
Institutional Class | | | 490,537 | |
Shareholder servicing fees | | | | |
Class A | | | 167,947 | |
Class B | | | 4,068 | |
Class C | | | 26,731 | |
Administrator Class | | | 367,322 | |
Distribution fees | | | | |
Class B | | | 12,205 | |
Class C | | | 80,193 | |
Custody and accounting fees | | | 250,838 | |
Professional fees | | | 24,290 | |
Registration fees | | | 55,364 | |
Shareholder report expenses | | | 122,563 | |
Trustees’ fees and expenses | | | 6,783 | |
Other fees and expenses | | | 9,338 | |
| | | | |
Total expenses | | | 6,710,386 | |
Less: Fee waivers and/or expense reimbursements | | | (232,449 | ) |
| | | | |
Net expenses | | | 6,477,937 | |
| | | | |
Net investment income | | | 22,735,792 | |
| | | | |
| |
REALIZED AND UNREALIZED GAINS (LOSSES) ON INVESTMENTS | | | | |
| |
Net realized losses on: | | | | |
Unaffiliated securities | | | (25,914,980 | ) |
Forward foreign currency contract transactions | | | (212,450 | ) |
| | | | |
Net realized losses on investments | | | (26,127,430 | ) |
| | | | |
| |
Net change in unrealized gains (losses) on: | | | | |
Unaffiliated securities | | | 1,394,474 | |
Forward foreign currency contract transactions | | | 1,976,311 | |
| | | | |
Net change in unrealized gains (losses) on investments | | | 3,370,785 | |
| | | | |
Net realized and unrealized gains (losses) on investments | | | (22,756,645 | ) |
| | | | |
Net decrease in net assets resulting from operations | | $ | (20,853 | ) |
| | | | |
| |
**Net of foreign interest withholding taxes in the amount of | | | $(87,392) | |
| 1. | For the period from November 30, 2012 (commencement of class operations) to April 30, 2013 |
The accompanying notes are an integral part of these financial statements.
| | | | |
| 16 | | Wells Fargo Advantage International Bond Fund | | Statement of changes in net assets |
| | | | | | | | | | | | | | | | |
| | | Six months ended April 30, 2013 (unaudited) | | | Year ended October 31, 2012 | |
| | | | |
Operations | | | | | | | | | | | | | | | | |
Net investment income | | | | | | $ | 22,735,792 | | | | | | | $ | 53,041,856 | |
Net realized losses on investments | | | | | | | (26,127,430 | ) | | | | | | | (10,520,120 | ) |
Net change in unrealized gains (losses) on investments | | | | | | | 3,370,785 | | | | | | | | 20,933,219 | |
| | | | |
Net increase (decrease) in net assets resulting from operations | | | | | | | (20,853 | ) | | | | | | | 63,454,955 | |
| | | | |
| | | | |
Distributions to shareholders from | | | | | | | | | | | | | | | | |
Net investment income | | | | | | | | | | | | | | | | |
Class A | | | | | | | (650,142 | ) | | | | | | | (6,256,979 | ) |
Class B | | | | | | | (11,718 | ) | | | | | | | (109,655 | ) |
Class C | | | | | | | (78,483 | ) | | | | | | | (530,654 | ) |
Class R6 | | | | | | | (272 | )1 | | | | | | | N/A | |
Administrator Class | | | | | | | (1,509,662 | ) | | | | | | | (4,974,946 | ) |
Institutional Class | | | | | | | (6,633,090 | ) | | | | | | | (34,342,328 | ) |
Net realized gains | | | | | | | | | | | | | | | | |
Class A | | | | | | | (966,464 | ) | | | | | | | (3,215,523 | ) |
Class B | | | | | | | (24,581 | ) | | | | | | | (70,558 | ) |
Class C | | | | | | | (162,683 | ) | | | | | | | (322,808 | ) |
Class R6 | | | | | | | (351 | )1 | | | | | | | N/A | |
Administrator Class | | | | | | | (2,075,049 | ) | | | | | | | (2,279,562 | ) |
Institutional Class | | | | | | | (8,812,709 | ) | | | | | | | (14,779,473 | ) |
| | | | |
Total distributions to shareholders | | | | | | | (20,925,204 | ) | | | | | | | (66,882,486 | ) |
| | | | |
| | | | |
| | | Shares | | | | | | | | Shares | | | | | |
Capital share transactions | | | | | | | | | | | | | | | | |
Proceeds from shares sold | | | | | | | | | | | | | | | | |
Class A | | | 1,813,124 | | | | 20,983,306 | | | | 9,615,714 | | | | 110,217,364 | |
Class B | | | 2,136 | | | | 24,742 | | | | 17,622 | | | | 202,581 | |
Class C | | | 96,600 | | | | 1,111,882 | | | | 283,966 | | | | 3,261,039 | |
Class R6 | | | 4,237 | 1 | | | 50,000 | 1 | | | N/A | | | | N/A | |
Administrator Class | | | 5,045,495 | | | | 58,305,384 | | | | 14,661,358 | | | | 170,087,803 | |
Institutional Class | | | 17,452,292 | | | | 201,390,244 | | | | 31,062,934 | | | | 356,684,003 | |
| | | | |
| | | | | | | 281,865,558 | | | | | | | | 640,452,790 | |
| | | | |
Reinvestment of distributions | | | | | | | | | | | | | | | | |
Class A | | | 129,784 | | | | 1,524,180 | | | | 749,068 | | | | 8,478,238 | |
Class B | | | 2,686 | | | | 31,562 | | | | 11,594 | | | | 131,849 | |
Class C | | | 15,788 | | | | 184,194 | | | | 52,700 | | | | 594,881 | |
Class R6 | | | 53 | 1 | | | 623 | 1 | | | N/A | | | | N/A | |
Administrator Class | | | 214,185 | | | | 2,510,250 | | | | 213,513 | | | | 2,403,750 | |
Institutional Class | | | 760,210 | | | | 8,920,248 | | | | 2,231,590 | | | | 25,169,566 | |
| | | | |
| | | | | | | 13,171,057 | | | | | | | | 36,778,284 | |
| | | | |
Payment for shares redeemed | | | | | | | | | | | | | | | | |
Class A | | | (2,388,726 | ) | | | (27,615,739 | ) | | | (22,745,556 | ) | | | (261,828,611 | ) |
Class B | | | (100,226 | ) | | | (1,167,422 | ) | | | (273,761 | ) | | | (3,134,428 | ) |
Class C | | | (384,215 | ) | | | (4,419,041 | ) | | | (701,806 | ) | | | (8,025,216 | ) |
Administrator Class | | | (2,780,163 | ) | | | (32,164,807 | ) | | | (4,381,700 | ) | | | (50,282,229 | ) |
Institutional Class | | | (22,905,126 | ) | | | (264,894,975 | ) | | | (29,596,015 | ) | | | (339,974,777 | ) |
| | | | |
| | | | | | | (330,261,984 | ) | | | | | | | (663,245,261 | ) |
| | | | |
Net increase (decrease) in net assets resulting from capital share transactions | | | | | | | (35,225,369 | ) | | | | | | | 13,985,813 | |
| | | | |
Total increase (decrease) in net assets | | | | | | | (56,171,426 | ) | | | | | | | 10,558,282 | |
| | | | |
| | | | |
Net assets | | | | | | | | | | | | | | | | |
Beginning of period | | | | | | | 1,731,550,627 | | | | | | | | 1,720,992,345 | |
| | | | |
End of period | | | | | | $ | 1,675,379,201 | | | | | | | $ | 1,731,550,627 | |
| | | | |
Undistributed net investment income | | | | | | $ | 26,920,410 | | | | | | | $ | 13,067,985 | |
| | | | |
| 1. | For the period from November 30, 2012 (commencement of class operations) to April 30, 2013 |
The accompanying notes are an integral part of these financial statements.
| | | | | | |
| Financial highlights | | Wells Fargo Advantage International Bond Fund | | | 17 | |
(For a share outstanding throughout each period)
| | | | | | | | | | | | | | | | | | | | | | | | |
| | | Six months ended
April 30, 2013
(unaudited) | | | Year ended October 31 | |
| CLASS A | | | 2012 | | | 2011 | | | 20101 | | | 20091 | | | 20081 | |
Net asset value, beginning of period | | $ | 11.83 | | | $ | 11.85 | | | $ | 12.23 | | | $ | 11.59 | | | $ | 10.36 | | | $ | 11.57 | |
Net investment income | | | 0.13 | 2 | | | 0.33 | 2 | | | 0.39 | 2 | | | 0.40 | | | | 0.39 | 2 | | | 0.47 | 2 |
Net realized and unrealized gains (losses) on investments | | | (0.14 | ) | | | 0.08 | | | | (0.18 | ) | | | 0.65 | | | | 2.20 | | | | (0.92 | ) |
| | | | | | | | | | | | | | | | | | | | | | | | |
Total from investment operations | | | (0.01 | ) | | | 0.41 | | | | 0.21 | | | | 1.05 | | | | 2.59 | | | | (0.45 | ) |
Distributions to shareholders from | | | | | | | | | | | | | | | | | | | | | | | | |
Net investment income | | | (0.06 | ) | | | (0.29 | ) | | | (0.51 | ) | | | (0.41 | ) | | | (1.36 | ) | | | (0.76 | ) |
Net realized gains | | | (0.08 | ) | | | (0.14 | ) | | | (0.08 | ) | | | 0.00 | | | | 0.00 | | | | 0.00 | |
| | | | | | | | | | | | | | | | | | | | | | | | |
Total distributions to shareholders | | | (0.14 | ) | | | (0.43 | ) | | | (0.59 | ) | | | (0.41 | ) | | | (1.36 | ) | | | (0.76 | ) |
Net asset value, end of period | | $ | 11.68 | | | $ | 11.83 | | | $ | 11.85 | | | $ | 12.23 | | | $ | 11.59 | | | $ | 10.36 | |
Total return3 | | | (0.10 | )% | | | 3.66 | % | | | 1.93 | % | | | 9.35 | % | | | 26.34 | % | | | (4.07 | )% |
Ratios to average net assets (annualized) | | | | | | | | | | | | | | | | | | | | | | | | |
Gross expenses | | | 1.04 | % | | | 1.04 | % | | | 1.02 | % | | | 1.10 | % | | | 1.05 | % | | | 1.01 | % |
Net expenses | | | 1.03 | % | | | 1.03 | % | | | 1.02 | % | | | 1.08 | % | | | 1.05 | % | | | 0.99 | % |
Net investment income | | | 2.24 | % | | | 2.88 | % | | | 3.26 | % | | | 3.53 | % | | | 3.65 | % | | | 4.05 | % |
Supplemental data | | | | | | | | | | | | | | | | | | | | | | | | |
Portfolio turnover rate | | | 52 | % | | | 79 | % | | | 88 | % | | | 89 | % | | | 118 | % | | | 87 | % |
Net assets, end of period (000s omitted) | | | $132,599 | | | | $139,600 | | | | $286,577 | | | | $255,134 | | | | $246,719 | | | | $66,649 | |
| 1. | After the close of business on July 9, 2010, the Fund acquired the net assets of Evergreen International Bond Fund which became the accounting and performance survivor in this transaction. The information for the periods prior to July 12, 2010 is that of Class A of Evergreen International Bond Fund. |
| 2. | Calculated based upon average shares outstanding |
| 3. | Total return calculations do not include any sales charges. Returns for periods of less than one year are not annualized. |
The accompanying notes are an integral part of these financial statements.
| | | | |
| 18 | | Wells Fargo Advantage International Bond Fund | | Financial highlights |
(For a share outstanding throughout each period)
| | | | | | | | | | | | | | | | | | | | | | | | |
| | | Six months ended
April 30, 2013
(unaudited) | | | Year ended October 31 | |
| CLASS B | | | 2012 | | | 2011 | | | 20101 | | | 20091 | | | 20081 | |
Net asset value, beginning of period | | $ | 11.85 | | | $ | 11.88 | | | $ | 12.25 | | | $ | 11.54 | | | $ | 10.37 | | | $ | 11.58 | |
Net investment income | | | 0.08 | 2 | | | 0.24 | 2 | | | 0.31 | | | | 0.29 | | | | 0.30 | 2 | | | 0.38 | 2 |
Net realized and unrealized gains (losses) on investments | | | (0.14 | ) | | | 0.09 | | | | (0.19 | ) | | | 0.67 | | | | 2.21 | | | | (0.91 | ) |
| | | | | | | | | | | | | | | | | | | | | | | | |
Total from investment operations | | | (0.06 | ) | | | 0.33 | | | | 0.12 | | | | 0.96 | | | | 2.51 | | | | (0.53 | ) |
Distributions to shareholders from | | | | | | | | | | | | | | | | | | | | | | | | |
Net investment income | | | (0.04 | ) | | | (0.22 | ) | | | (0.41 | ) | | | (0.25 | ) | | | (1.34 | ) | | | (0.68 | ) |
Net realized gains | | | (0.08 | ) | | | (0.14 | ) | | | (0.08 | ) | | | 0.00 | | | | 0.00 | | | | 0.00 | |
| | | | | | | | | | | | | | | | | | | | | | | | |
Total distributions to shareholders | | | (0.12 | ) | | | (0.36 | ) | | | (0.49 | ) | | | (0.25 | ) | | | (1.34 | ) | | | (0.68 | ) |
Net asset value, end of period | | $ | 11.67 | | | $ | 11.85 | | | $ | 11.88 | | | $ | 12.25 | | | $ | 11.54 | | | $ | 10.37 | |
Total return3 | | | (0.49 | )% | | | 2.90 | % | | | 1.15 | % | | | 8.55 | % | | | 25.44 | % | | | (4.74 | )% |
Ratios to average net assets (annualized) | | | | | | | | | | | | | | | | | | | | | | | | |
Gross expenses | | | 1.79 | % | | | 1.79 | % | | | 1.77 | % | | | 1.85 | % | | | 1.79 | % | | | 1.74 | % |
Net expenses | | | 1.78 | % | | | 1.78 | % | | | 1.77 | % | | | 1.82 | % | | | 1.79 | % | | | 1.74 | % |
Net investment income | | | 1.47 | % | | | 2.12 | % | | | 2.53 | % | | | 2.77 | % | | | 2.86 | % | | | 3.30 | % |
Supplemental data | | | | | | | | | | | | | | | | | | | | | | | | |
Portfolio turnover rate | | | 52 | % | | | 79 | % | | | 88 | % | | | 89 | % | | | 118 | % | | | 87 | % |
Net assets, end of period (000s omitted) | | | $2,834 | | | | $4,008 | | | | $6,925 | | | | $10,060 | | | | $11,615 | | | | $10,345 | |
| 1. | After the close of business on July 9, 2010, the Fund acquired the net assets of Evergreen International Bond Fund which became the accounting and performance survivor in this transaction. The information for the periods prior to July 12, 2010 is that of Class B of Evergreen International Bond Fund. |
| 2. | Calculated based upon average shares outstanding |
| 3. | Total return calculations do not include any sales charges. Returns for periods of less than one year are not annualized. |
The accompanying notes are an integral part of these financial statements.
| | | | | | |
| Financial highlights | | Wells Fargo Advantage International Bond Fund | | | 19 | |
(For a share outstanding throughout each period)
| | | | | | | | | | | | | | | | | | | | | | | | |
| | | Six months ended
April 30, 2013
(unaudited) | | | Year ended October 31 | |
| CLASS C | | | 2012 | | | 2011 | | | 20101 | | | 20091 | | | 20081 | |
Net asset value, beginning of period | | $ | 11.76 | | | $ | 11.81 | | | $ | 12.20 | | | $ | 11.51 | | | $ | 10.35 | | | $ | 11.56 | |
Net investment income | | | 0.09 | 2 | | | 0.24 | 2 | | | 0.31 | | | | 0.33 | | | | 0.30 | 2 | | | 0.38 | 2 |
Net realized and unrealized gains (losses) on investments | | | (0.15 | ) | | | 0.08 | | | | (0.19 | ) | | | 0.64 | | | | 2.20 | | | | (0.91 | ) |
| | | | | | | | | | | | | | | | | | | | | | | | |
Total from investment operations | | | (0.06 | ) | | | 0.32 | | | | 0.12 | | | | 0.97 | | | | 2.50 | | | | (0.53 | ) |
Distributions to shareholders from | | | | | | | | | | | | | | | | | | | | | | | | |
Net investment income | | | (0.04 | ) | | | (0.23 | ) | | | (0.43 | ) | | | (0.28 | ) | | | (1.34 | ) | | | (0.68 | ) |
Net realized gains | | | (0.08 | ) | | | (0.14 | ) | | | (0.08 | ) | | | 0.00 | | | | 0.00 | | | | 0.00 | |
| | | | | | | | | | | | | | | | | | | | | | | | |
Total distributions to shareholders | | | (0.12 | ) | | | (0.37 | ) | | | (0.51 | ) | | | (0.28 | ) | | | (1.34 | ) | | | (0.68 | ) |
Net asset value, end of period | | $ | 11.58 | | | $ | 11.76 | | | $ | 11.81 | | | $ | 12.20 | | | $ | 11.51 | | | $ | 10.35 | |
Total return3 | | | (0.49 | )% | | | 2.86 | % | | | 1.11 | % | | | 8.61 | % | | | 25.47 | % | | | (4.85 | )% |
Ratios to average net assets (annualized) | | | | | | | | | | | | | | | | | | | | | | | | |
Gross expenses | | | 1.79 | % | | | 1.79 | % | | | 1.77 | % | | | 1.85 | % | | | 1.79 | % | | | 1.74 | % |
Net expenses | | | 1.78 | % | | | 1.78 | % | | | 1.77 | % | | | 1.82 | % | | | 1.79 | % | | | 1.74 | % |
Net investment income | | | 1.62 | % | | | 2.12 | % | | | 2.50 | % | | | 2.77 | % | | | 2.87 | % | | | 3.31 | % |
Supplemental data | | | | | | | | | | | | | | | | | | | | | | | | |
Portfolio turnover rate | | | 52 | % | | | 79 | % | | | 88 | % | | | 89 | % | | | 118 | % | | | 87 | % |
Net assets, end of period (000s omitted) | | | $19,940 | | | | $23,448 | | | | $27,861 | | | | $30,974 | | | | $33,330 | | | | $18,044 | |
| 1. | After the close of business on July 9, 2010, the Fund acquired the net assets of Evergreen International Bond Fund which became the accounting and performance survivor in this transaction. The information for the periods prior to July 12, 2010 is that of Class C of Evergreen International Bond Fund. |
| 2. | Calculated based upon average shares outstanding |
| 3. | Total return calculations do not include any sales charges. Returns for periods of less than one year are not annualized. |
The accompanying notes are an integral part of these financial statements.
| | | | |
| 20 | | Wells Fargo Advantage International Bond Fund | | Financial highlights |
(For a share outstanding throughout each period)
| | | | |
| CLASS R6 | | Period ended
April 30, 2013
(unaudited)1 | |
Net asset value, beginning of period | | $ | 11.80 | |
Net investment loss | | | (0.01 | )2 |
Net realized and unrealized gains (losses) on investments | | | 0.04 | |
| | | | |
Total from investment operations | | | 0.03 | |
Distributions to shareholders from | | | | |
Net investment income | | | (0.06 | ) |
Net realized gains | | | (0.08 | ) |
| | | | |
Total distributions to shareholders | | | (0.14 | ) |
Net asset value, end of period | | $ | 11.69 | |
Total return3 | | | 0.31 | % |
Ratios to average net assets (annualized) | | | | |
Gross expenses | | | 0.66 | % |
Net expenses | | | 0.65 | % |
Net investment loss | | | (0.18 | )% |
Supplemental data | | | | |
Portfolio turnover rate | | | 52 | % |
Net assets, end of period (000s omitted) | | | $50 | |
| 1. | For the period from November 30, 2012 (commencement of class operations) to April 30, 2013 |
| 2. | Calculated based upon average shares outstanding |
| 3. | Returns for periods of less than one year are not annualized. |
The accompanying notes are an integral part of these financial statements.
| | | | | | |
| Financial highlights | | Wells Fargo Advantage International Bond Fund | | | 21 | |
(For a share outstanding throughout each period)
| | | | | | | | | | | | | | | | |
| | | Six months ended
April 30, 2013
(unaudited) | | | Year ended October 31 | |
| ADMINISTRATOR CLASS | | | 2012 | | | 2011 | | | 20101 | |
Net asset value, beginning of period | | $ | 11.81 | | | $ | 11.83 | | | $ | 12.23 | | | $ | 11.39 | |
Net investment income | | | 0.15 | 2 | | | 0.35 | 2 | | | 0.38 | 2 | | | 0.11 | 2 |
Net realized and unrealized gains (losses) on investments | | | (0.16 | ) | | | 0.08 | | | | (0.16 | ) | | | 0.82 | |
| | | | | | | | | | | | | | | | |
Total from investment operations | | | (0.01 | ) | | | 0.43 | | | | 0.22 | | | | 0.93 | |
Distributions to shareholders from | | | | | | | | | | | | | | | | |
Net investment income | | | (0.06 | ) | | | (0.31 | ) | | | (0.54 | ) | | | (0.09 | ) |
Net realized gains | | | (0.08 | ) | | | (0.14 | ) | | | (0.08 | ) | | | 0.00 | |
| | | | | | | | | | | | | | | | |
Total distributions to shareholders | | | (0.14 | ) | | | (0.45 | ) | | | (0.62 | ) | | | (0.09 | ) |
Net asset value, end of period | | $ | 11.66 | | | $ | 11.81 | | | $ | 11.83 | | | $ | 12.23 | |
Total return3 | | | (0.07 | )% | | | 3.89 | % | | | 2.03 | % | | | 8.21 | % |
Ratios to average net assets (annualized) | | | | | | | | | | | | | | | | |
Gross expenses | | | 0.97 | % | | | 0.97 | % | | | 0.95 | % | | | 1.05 | % |
Net expenses | | | 0.85 | % | | | 0.85 | % | | | 0.85 | % | | | 0.85 | % |
Net investment income | | | 2.71 | % | | | 3.04 | % | | | 3.21 | % | | | 3.63 | % |
Supplemental data | | | | | | | | | | | | | | | | |
Portfolio turnover rate | | | 52 | % | | | 79 | % | | | 88 | % | | | 89 | % |
Net assets, end of period (000s omitted) | | | $319,623 | | | | $294,330 | | | | $170,836 | | | | $4,866 | |
| 1. | For the period from July 30, 2010 (commencement of class operations) to October 31, 2010 |
| 2. | Calculated based upon average shares outstanding |
| 3. | Returns for periods of less than one year are not annualized. |
The accompanying notes are an integral part of these financial statements.
| | | | |
| 22 | | Wells Fargo Advantage International Bond Fund | | Financial highlights |
(For a share outstanding throughout each period)
| | | | | | | | | | | | | | | | | | | | | | | | |
| | | Six months ended
April 30, 2013
(unaudited) | | | Year ended October 31 | |
| INSTITUTIONAL CLASS | | | 2012 | | | 2011 | | | 20101 | | | 20091 | | | 20081 | |
Net asset value, beginning of period | | $ | 11.82 | | | $ | 11.84 | | | $ | 12.23 | | | $ | 11.59 | | | $ | 10.35 | | | $ | 11.56 | |
Net investment income | | | 0.16 | 2 | | | 0.36 | | | | 0.44 | | | | 0.44 | | | | 0.43 | | | | 0.50 | |
Net realized and unrealized gains (losses) on investments | | | (0.16 | ) | | | 0.09 | | | | (0.20 | ) | | | 0.65 | | | | 2.18 | | | | (0.92 | ) |
| | | | | | | | | | | | | | | | | | | | | | | | |
Total from investment operations | | | (0.00 | ) | | | 0.45 | | | | 0.24 | | | | 1.09 | | | | 2.61 | | | | (0.42 | ) |
Distributions to shareholders from | | | | | | | | | | | | | | | | | | | | | | | | |
Net investment income | | | (0.06 | ) | | | (0.33 | ) | | | (0.55 | ) | | | (0.45 | ) | | | (1.37 | ) | | | (0.79 | ) |
Net realized gains | | | (0.08 | ) | | | (0.14 | ) | | | (0.08 | ) | | | 0.00 | | | | 0.00 | | | | 0.00 | |
| | | | | | | | | | | | | | | | | | | | | | | | |
Total distributions to shareholders | | | (0.14 | ) | | | (0.47 | ) | | | (0.63 | ) | | | (0.45 | ) | | | (1.37 | ) | | | (0.79 | ) |
Net asset value, end of period | | $ | 11.68 | | | $ | 11.82 | | | $ | 11.84 | | | $ | 12.23 | | | $ | 11.59 | | | $ | 10.35 | |
Total return3 | | | 0.04 | % | | | 3.99 | % | | | 2.19 | % | | | 9.73 | % | | | 26.71 | % | | | (3.88 | )% |
Ratios to average net assets (annualized) | | | | | | | | | | | | | | | | | | | | | | | | |
Gross expenses | | | 0.71 | % | | | 0.71 | % | | | 0.69 | % | | | 0.82 | % | | | 0.79 | % | | | 0.73 | % |
Net expenses | | | 0.70 | % | | | 0.71 | % | | | 0.69 | % | | | 0.80 | % | | | 0.79 | % | | | 0.73 | % |
Net investment income | | | 2.77 | % | | | 3.19 | % | | | 3.60 | % | | | 3.79 | % | | | 3.86 | % | | | 4.31 | % |
Supplemental data | | | | | | | | | | | | | | | | | | | | | | | | |
Portfolio turnover rate | | | 52 | % | | | 79 | % | | | 88 | % | | | 89 | % | | | 118 | % | | | 87 | % |
Net assets, end of period (000s omitted) | | | $1,200,332 | | | | $1,270,164 | | | | $1,228,793 | | | | $1,276,184 | | | | $997,308 | | | | $902,304 | |
| 1. | After the close of business on July 9, 2010, the Fund acquired the net assets of Evergreen International Bond Fund which became the accounting and performance survivor in this transaction. The information for the periods prior to July 12, 2010 is that of Class I of Evergreen International Bond Fund. |
| 2. | Calculated based upon average shares outstanding |
| 3. | Returns for periods of less than one year are not annualized. |
The accompanying notes are an integral part of these financial statements.
| | | | | | |
| Notes to financial statements (unaudited) | | Wells Fargo Advantage International Bond Fund | | | 23 | |
1. ORGANIZATION
Wells Fargo Funds Trust (the “Trust”), a Delaware statutory trust organized on March 10, 1999, is an open-end management investment company registered under the Investment Company Act of 1940, as amended (the “1940 Act”). These financial statements report on Wells Fargo Advantage International Bond Fund (the “Fund”) which is a diversified series of the Trust.
2. SIGNIFICANT ACCOUNTING POLICIES
The following significant accounting policies, which are consistently followed in the preparation of the financial statements of the Fund, are in conformity with U.S. generally accepted accounting principles which require management to make estimates and assumptions that affect the reported amounts of assets and liabilities, disclosure of contingent assets and liabilities at the date of the financial statements, and the reported amounts of revenues and expenses during the reporting period. Actual results could differ from those estimates.
Securities valuation
All investments are valued each business day as of the close of regular trading on the New York Stock Exchange (normally 4 p.m. Eastern Time).
Securities denominated in foreign currencies are translated into U.S. dollars using the rates of exchange in effect on the day of valuation at a time specified by the Management Valuation Team of Wells Fargo Funds Management, LLC (“Funds Management”).
Fixed income securities acquired with maturities exceeding 60 days are valued based on evaluated bid prices received from an independent pricing service which may utilize both transaction data and market information such as yield, prices of securities of comparable quality, coupon rate, maturity, type of issue, trading characteristics and other market data. If valuations are not available from the independent pricing service or values received are deemed not representative of market value, values will be obtained from a broker-dealer or otherwise determined based on the Fund’s Valuation Procedures.
Short-term securities with maturities of 60 days or less generally are valued at amortized cost which approximates fair value. The amortized cost method involves valuing a security at its cost, plus accretion of discount or minus amortization of premium over the period until maturity.
Investments in registered open-end investment companies are valued at net asset value. Non-registered investment companies are fair valued at net asset value.
Investments which are not valued using any of the methods discussed above are valued at their fair value, as determined by procedures established in good faith and approved by the Board of Trustees. The Board of Trustees has established a Valuation Committee comprised of the Trustees and has delegated to it the authority to take any actions regarding the valuation of portfolio securities that the Valuation Committee deems necessary or appropriate, including determining the fair value of portfolio securities, unless the determination has been delegated to the Management Valuation Team. The Board of Trustees retains the authority to make or ratify any valuation decisions or approve any changes to the Valuation Procedures as it deems appropriate. On a quarterly basis, the Board of Trustees receives reports on any valuation actions taken by the Valuation Committee or the Management Valuation Team which may include items for ratification.
Valuations of fair valued securities are compared to the next actual sales price when available, or other appropriate market information to assess the continued appropriateness of the fair valuation methodology used. These securities are fair valued on a day-to-day basis, taking into consideration changes to appropriate market information and any significant changes to the input factors considered in the valuation process until there is a readily available price provided on the exchange or by an independent pricing service. Valuations received from an independent pricing service or broker quotes are periodically validated by comparisons to most recent trades and valuations provided by other independent pricing services in addition to the review of prices by the adviser and/or subadviser. Unobservable inputs used in determining fair valuations are identified based on the type of security, taking into consideration factors utilized by market participants in valuing the investment, knowledge about the issuer and the current market environment.
Foreign currency translation
The accounting records of the Fund are maintained in U.S. dollars. Assets, including investment securities, and liabilities denominated in foreign currency are translated into U.S. dollars at the rates of exchange at a time specified by the Management Valuation Team on the date of valuation. Purchases and sales of securities, and income and expenses are converted at the rate of exchange on the respective dates of such transactions. Reported net realized foreign exchange gains or losses arise from sales of foreign currencies, currency gains or losses realized between the trade and settlement dates on securities transactions, and the difference between the amounts of dividends, interest and foreign withholding
| | | | |
| 24 | | Wells Fargo Advantage International Bond Fund | | Notes to financial statements (unaudited) |
taxes recorded and the U.S. dollar equivalent of the amounts actually paid or received. Net unrealized foreign exchange gains and losses arise from changes in the fair value of assets and liabilities other than investments in securities resulting in changes in exchange rates.
The changes in net assets arising from changes in exchange rates and the changes in net assets resulting from changes in market prices of securities are not separately presented. Such changes are recorded with net realized and unrealized gains or losses from investments. Gains and losses from certain foreign currency transactions are treated as ordinary income for U.S. federal income tax purposes.
Forward foreign currency contracts
The Fund may be subject to foreign currency exchange rate risk in the normal course of pursuing its investment objectives. A forward foreign currency contract is an agreement between two parties to purchase or sell a specific currency for an agreed-upon price at a future date. The Fund enters into forward foreign currency contracts to facilitate transactions in foreign-denominated securities and to attempt to minimize the risk to the Fund from adverse changes in the relationship between currencies. Forward foreign currency contracts are recorded at the forward rate and marked-to-market daily. When the contracts are closed, realized gains and losses arising from such transactions are recorded as realized gains or losses on forward foreign currency contract transactions. The Fund could be exposed to risks if the counterparties to the contracts are unable to meet the terms of their contracts or if the value of the foreign currency changes unfavorably. The Fund’s maximum risk of loss from counterparty credit risk is the unrealized gains or losses on the contracts. This risk is mitigated by having a master netting arrangement between the Fund and the counterparty.
Security loans
The Fund may lend its securities from time to time in order to earn additional income in the form of fees or interest on securities received as collateral or the investment of any cash received as collateral. The Fund continues to receive interest or dividends on the securities loaned. The Fund receives collateral in the form of cash or securities with a value at least equal to the value of the securities on loan. The value of the loaned securities is determined at the close of each business day and any additional required collateral is delivered to the Fund on the next business day. In a securities lending transaction, the net asset value of the Fund will be affected by an increase or decrease in the value of the securities loaned and by an increase or decrease in the value of the instrument in which collateral is invested. The amount of securities lending activity undertaken by the Fund fluctuates from time to time. In the event of default or bankruptcy by the borrower, the Fund may be prevented from recovering the loaned securities or gaining access to the collateral or may experience delays or costs in doing so. In addition, the investment of any cash collateral received may lose all or part of its value. The Fund has the right under the lending agreement to recover the securities from the borrower on demand.
The Fund lends its securities through an unaffiliated securities lending agent. Cash collateral received in connection with its securities lending transactions is invested in Wells Fargo Securities Lending Cash Investments, LLC (the “Cash Collateral Fund”). The Cash Collateral Fund is exempt from registration under Section 3(c)(7) of the 1940 Act and is managed by Funds Management and is subadvised by Wells Capital Management Incorporated (“WellsCap”). Funds Management receives an advisory fee starting at 0.05% and declining to 0.01% as the average daily net assets of the Cash Collateral Fund increase. All of the fees received by Funds Management are paid to WellsCap for its services as subadviser. The Cash Collateral Fund seeks to provide a positive return compared to the daily Fed Funds Open rate by investing in high-quality, U.S. dollar-denominated short-term money market instruments. Cash Collateral Fund investments are fair valued based upon the amortized cost valuation technique. Income earned from investment in the Cash Collateral Fund is included in securities lending income on the Statement of Operations.
Security transactions and income recognition
Securities transactions are recorded on a trade date basis. Realized gains or losses are recorded on the basis of identified cost.
Interest income is accrued daily and bond discounts are accreted and premiums are amortized daily based on the effective interest method. To the extent debt obligations are placed on non-accrual status, any related interest income may be reduced by writing off interest receivables when the collection of all or a portion of interest has become doubtful based on consistently applied procedures. If the issuer subsequently resumes interest payments or when the collectability of interest is reasonably assured, the debt obligation is removed from non-accrual status.
Income from foreign securities is recorded net of foreign taxes withheld where recovery of such taxes is not assured.
Distributions to shareholders
Distributions to shareholders from net investment income and net realized gains, if any, are recorded on the ex-dividend date. Such distributions are determined in conformity with federal income tax regulations, which may differ in amount or character from net investment income and realized gains recognized for purposes of U.S. generally accepted accounting principles.
| | | | | | |
| Notes to financial statements (unaudited) | | Wells Fargo Advantage International Bond Fund | | | 25 | |
Federal and other taxes
The Fund intends to continue to qualify as a regulated investment company by distributing substantially all of its investment company taxable income and any net realized capital gains (after reduction for capital loss carryforwards) sufficient to relieve it from all, or substantially all, federal income taxes. Accordingly, no provision for federal income taxes was required.
The Fund’s income and federal excise tax returns and all financial records supporting those returns for the prior three fiscal years are subject to examination by the federal and Delaware revenue authorities. Management has analyzed the Fund’s tax positions taken on federal, state, and foreign tax returns for all open tax years and does not believe that there are any uncertain tax positions that require recognition of a tax liability.
Class allocations
The separate classes of shares offered by the Fund differ principally in applicable sales charges, distribution, shareholder servicing, and administration fees. Shareholders of each class bear certain expenses that pertain to that particular class. All shareholders bear the common expenses of the Fund, earn income from the portfolio, and are allocated any unrealized gains and losses pro rata based on the average daily net assets of each class, without distinction between share classes. Dividends are determined separately for each class based on income and expenses allocable to each class. Realized gains and losses are allocated to each class pro rata based upon the net assets of each class on the date realized. Differences in per share dividend rates generally result from the relative weightings of pro rata income and realized gain allocations and from differences in separate class expenses, including distribution, shareholder servicing, and administration fees.
3. FAIR VALUATION MEASUREMENTS
Fair value measurements of investments are determined within a framework that has established a fair value hierarchy based upon the various data inputs utilized in determining the value of the Fund’s investments. The three-level hierarchy gives the highest priority to unadjusted quoted prices in active markets for identical assets or liabilities (Level 1) and the lowest priority to significant unobservable inputs (Level 3). The Fund’s investments are classified within the fair value hierarchy based on the lowest level of input that is significant to the fair value measurement. The inputs are summarized into three broad levels as follows:
| n | | Level 1 – quoted prices in active markets for identical securities |
| n | | Level 2 – other significant observable inputs (including quoted prices for similar securities, interest rates, prepayment speeds, credit risk, use of amortized cost, etc.) |
| n | | Level 3 – significant unobservable inputs (including the Fund’s own assumptions in determining the fair value of investments) |
The inputs or methodologies used for valuing investments in securities are not necessarily an indication of the risk associated with investing in those securities.
As of April 30, 2013, the inputs used in valuing investments in securities were as follows:
| | | | | | | | | | | | | | | | |
| Investments in securities | | Quoted prices (Level 1) | | | Significant other
observable inputs (Level 2) | | | Significant unobservable inputs (Level 3) | | | Total | |
Corporate bonds and notes | | $ | 0 | | | $ | 10,355,068 | | | $ | 0 | | | $ | 10,355,068 | |
Foreign corporate bonds and notes | | | 0 | | | | 329,998,950 | | | | 0 | | | | 329,998,950 | |
Foreign government bonds | | | 0 | | | | 1,273,824,279 | | | | 0 | | | | 1,273,824,279 | |
Yankee corporate bonds and notes | | | 0 | | | | 62,974,365 | | | | 0 | | | | 62,974,365 | |
Short-term investments | | | | | | | | | | | | | | | | |
Investment companies | | | 0 | | | | 2,293,500 | | | | 0 | | | | 2,293,500 | |
| | | $ | 0 | | | $ | 1,679,446,162 | | | $ | 0 | | | $ | 1,679,446,162 | |
| | | | |
| 26 | | Wells Fargo Advantage International Bond Fund | | Notes to financial statements (unaudited) |
As of April 30, 2013, the inputs used in valuing the Fund’s other financial instruments were as follows:
| | | | | | | | | | | | | | | | |
| Other financial instruments | | Quoted prices (Level 1) | | | Significant other
observable inputs (Level 2) | | | Significant unobservable inputs (Level 3) | | | Total | |
Forward foreign currency contracts+ | | $ | 0 | | | $ | (11,096,964 | ) | | $ | 0 | | | $ | (11,096,964 | ) |
| + | Forward foreign currency contracts are presented at the unrealized gains or losses on the instrument. |
Transfers in and transfers out are recognized at the end of the reporting period. For the six months ended April 30, 2013, the Fund did not have any transfers into/out of Level 1 or Level 2.
4. TRANSACTIONS WITH AFFILIATES AND OTHER EXPENSES
Advisory fee
The Trust has entered into an advisory contract with Funds Management, an indirect wholly owned subsidiary of Wells Fargo & Company (“Wells Fargo”). The adviser is responsible for implementing investment policies and guidelines and for supervising the subadviser, who is responsible for day-to-day portfolio management of the Fund.
Pursuant to the contract, Funds Management is entitled to receive an annual advisory fee starting at 0.55% and declining to 0.45% as the average daily net assets of the Fund increase. For the six months ended April 30, 2013, the advisory fee was equivalent to an annual rate of 0.52% of the Fund’s average daily net assets.
Funds Management has retained the services of a subadviser to provide daily portfolio management to the Fund. The fee for subadvisory services is borne by Funds Management. First International Advisors, LLC, an affiliate of Funds Management, is the subadviser to the Fund and is entitled to receive a fee from Funds Management at an annual rate starting at 0.35% and declining to 0.20% as the average daily net assets of the Fund increase.
Administration and transfer agent fees
The Trust has entered into an administration agreement with Funds Management. Under this agreement, for providing administrative services, which includes paying fees and expenses for services provided by the transfer agent, sub-transfer agents, omnibus account servicers and record-keepers, Funds Management is entitled to receive from the Fund an annual fund level administration fee starting at 0.05% and declining to 0.03% as the average daily net assets of the Fund increase and a class level administration fee which is calculated based on the average daily net assets of each class as follows:
| | | | |
| | | Class level
administration fee | |
Class A, Class B, Class C | | | 0.16 | % |
Class R6 | | | 0.03 | |
Administrator Class | | | 0.10 | |
Institutional Class | | | 0.08 | |
Funds Management has contractually waived and/or reimbursed advisory and administration fees to the extent necessary to maintain certain net operating expense ratios for the Fund. Waiver of fees and/or reimbursement of expenses by Funds Management were made first from fund level expenses on a proportionate basis and then from class specific expenses. Funds Management has committed through February 28, 2015 to waive fees and/or reimburse expenses to the extent necessary to cap the Fund’s expenses at 1.03% for Class A shares, 1.78% for Class B shares, 1.78% for Class C shares, 0.65% for Class R6 shares, 0.85% for Administrator Class shares and 0.70% for Institutional Class shares.
Distribution fees
The Trust has adopted a Distribution Plan for Class B and Class C shares of the Fund pursuant to Rule 12b-1 under the 1940 Act. Distribution fees are charged to Class B and Class C shares and paid to Wells Fargo Funds Distributor, LLC, the principal underwriter, at an annual rate of 0.75% of the average daily net assets of Class B and Class C shares.
For the six months ended April 30, 2013, Wells Fargo Funds Distributor, LLC received $3,739 from the sale of Class A shares and $1,922 and $62 in contingent deferred sales charges from redemptions of Class B and Class C shares, respectively.
| | | | | | |
| Notes to financial statements (unaudited) | | Wells Fargo Advantage International Bond Fund | | | 27 | |
Shareholder servicing fees
The Trust has entered into contracts with one or more shareholder servicing agents, whereby Class A, Class B, Class C and Administrator Class of the Fund is charged a fee at an annual rate of 0.25% of the average daily net assets of each respective class.
A portion of these total shareholder servicing fees were paid to affiliates of Wells Fargo.
5. INVESTMENT PORTFOLIO TRANSACTIONS
Purchases and sales of investments, excluding U.S. government obligations (if any) and short-term securities, for the six months ended April 30, 2013 were $873,605,583 and $949,944,430 respectively.
6. DERIVATIVE TRANSACTIONS
During the six months ended April 30, 2013, the Fund entered into forward foreign currency exchange contracts for economic hedging purposes.
At April 30, 2013, the Fund had forward foreign currency contracts outstanding as follows:
Forward foreign currency contracts to buy:
| | | | | | | | | | | | | | | | | | |
| Exchange date | | Counterparty | | Contracts to
receive | | | U.S. value at
April 30, 2013 | | | In exchange
for U.S. $ | | | Unrealized
gains
(losses) | |
| 5-7-2013 | | State Street Bank | | | 21,600,000,000 | IDR | | $ | 2,220,312 | | | $ | 2,222,977 | | | $ | (2,665 | ) |
| 5-7-2013 | | State Street Bank | | | 75,000,000 | THB | | | 2,554,771 | | | | 2,514,247 | | | | 40,524 | |
| 5-7-2013 | | State Street Bank | | | 17,725,000,000 | JPY | | | 181,827,085 | | | | 190,854,079 | | | | (9,026,994 | ) |
| 5-28-2013 | | State Street Bank | | | 15,400,000 | MYR | | | 5,052,253 | | | | 4,946,996 | | | | 105,257 | |
| 7-31-2013 | | State Street Bank | | | 9,050,000,000 | JPY | | | 92,881,524 | | | | 91,322,358 | | | | 1,559,166 | |
| | | | | | | | | | | | | | | | | | | | | | |
| Exchange date | | Counterparty | | Contracts to
receive | | | U.S. value at
April 30, 2013 | | | In exchange for | | | U.S. value at
April 30, 2013 | | | Unrealized
gains
(losses) | |
| 5-7-2013 | | State Street Bank | | | 54,176,688 | EUR | | $ | 71,349,832 | | | | 6,555,000,000 JPY | | | $ | 67,242,682 | | | $ | 4,107,150 | |
| 5-13-2013 | | State Street Bank | | | 35,772,621 | EUR | | | 47,113,770 | | | | 10,600,000,000 HUF | | | | 46,589,600 | | | | 524,170 | |
| 6-13-2013 | | State Street Bank | | | 7,836,600,000 | JPY | | | 80,404,388 | | | | 100,000,000 NZD | | | | 85,470,535 | | | | (5,066,147 | ) |
| 6-18-2013 | | State Street Bank | | | 10,414,494,920 | JPY | | | 106,856,959 | | | | 105,200,000 AUD | | | | 108,679,121 | | | | (1,822,162 | ) |
| 6-18-2013 | | State Street Bank | | | 554,411,000 | JPY | | | 5,688,483 | | | | 5,500,000 AUD | | | | 5,681,893 | | | | 6,590 | |
Forward foreign currency contracts to sell:
| | | | | | | | | | | | | | | | | | |
| Exchange date | | Counterparty | | Contracts to
deliver | | | U.S. value at
April 30, 2013 | | | In exchange
for U.S. $ | | | Unrealized
gains
(losses) | |
| 5-7-2013 | | State Street Bank | | | 750,000,000 | JPY | | $ | 7,693,671 | | | $ | 7,780,809 | | | $ | 87,138 | |
| 5-7-2013 | | State Street Bank | | | 280,000,000 | JPY | | | 2,872,304 | | | | 2,915,847 | | | | 43,543 | |
| 5-7-2013 | | State Street Bank | | | 21,600,000,000 | IDR | | | 2,220,313 | | | | 2,219,482 | | | | (831 | ) |
| 5-21-2013 | | State Street Bank | | | 235,500,000 | PLN | | | 74,446,090 | | | | 74,688,047 | | | | 241,957 | |
| 5-28-2013 | | State Street Bank | | | 14,150,000 | GBP | | | 21,976,106 | | | | 21,473,616 | | | | (502,490 | ) |
| 5-28-2013 | | State Street Bank | | | 6,650,000 | MYR | | | 2,181,655 | | | | 2,182,116 | | | | 461 | |
| 6-5-2013 | | State Street Bank | | | 270,275,000 | NOK | | | 46,810,933 | | | | 46,734,507 | | | | (76,426 | ) |
| 7-18-2013 | | State Street Bank | | | 7,650,000 | EUR | | | 10,079,803 | | | | 10,041,696 | | | | (38,107 | ) |
| 7-29-2013 | | State Street Bank | | | 4,575,000 | TRY | | | 2,529,418 | | | | 2,513,674 | | | | (15,744 | ) |
| 7-29-2013 | | State Street Bank | | | 1,430,000,000 | THB | | | 48,488,809 | | | | 48,764,685 | | | | 275,876 | |
| 7-30-2013 | | State Street Bank | | | 216,800,000 | SEK | | | 33,387,280 | | | | 32,915,813 | | | | (471,467 | ) |
| 7-31-2013 | | State Street Bank | | | 428,000,000 | ZAR | | | 47,132,970 | | | | 46,119,199 | | | | (1,013,771 | ) |
| 7-31-2013 | | State Street Bank | | | 21,950,000 | ZAR | | | 2,417,217 | | | | 2,365,225 | | | | (51,992 | ) |
| | | | |
| 28 | | Wells Fargo Advantage International Bond Fund | | Notes to financial statements (unaudited) |
The Fund had average contract amounts of $664,646,418 and $279,195,313 in forward foreign currency contracts to buy and forward foreign currency contracts to sell, respectively, during the six months ended April 30, 2013.
The fair value, realized gains or losses and change in unrealized gains or losses, if any, on derivative instruments are reflected in the appropriate financial statements.
7. BANK BORROWINGS
The Trust (excluding the money market funds and certain other funds in the Trust) and Wells Fargo Variable Trust are parties to a $150,000,000 revolving credit agreement with State Street Bank and Trust Company, whereby the Fund is permitted to use bank borrowings for temporary or emergency purposes, such as to fund shareholder redemption requests. Interest under the credit agreement is charged to the Fund based on a borrowing rate equal to the higher of the Federal Funds rate in effect on that day plus 1.25% or the overnight LIBOR rate in effect on that day plus 1.25%. In addition, an annual commitment fee equal to 0.10% of the unused balance is allocated to each participating fund. For the six months ended April 30, 2013, the Fund paid $1,818 in commitment fees.
During the six months ended April 30, 2013, the Fund had average borrowings outstanding of $102,569 (on an annualized basis) at a an average rate of 1.44% and paid interest in the amount of $1,477.
8. INDEMNIFICATION
Under the Trust’s organizational documents, the officers and directors are indemnified against certain liabilities that may arise out of performance of their duties to the Trust. Additionally, in the normal course of business, the Trust may enter into contracts with service providers that contain a variety of indemnification clauses. The Trust’s maximum exposure under these arrangements is dependent on future claims that may be made against the Fund and, therefore, cannot be estimated.
9. NEW ACCOUNTING PRONOUNCEMENT
In December 2011, the Financial Accounting Standards Board (“FASB”) issued Accounting Standard Update (“ASU”) No. 2011-11, Disclosures about Offsetting Assets and Liabilities. ASU 2011-11, which amends FASB ASC Topic 210, Balance Sheet, creates new disclosure requirements which require entities to disclose both gross and net information for derivatives and other financial instruments that are either offset in the Statement of Assets and Liabilities or subject to an enforceable master netting arrangement or similar agreement. The disclosure requirements are effective for interim and annual reporting periods beginning on or after January 1, 2013. Management is currently assessing the potential impact, in addition to expanded financial statement disclosure, that may result from adopting this ASU.
| | | | | | |
| Other information (unaudited) | | Wells Fargo Advantage International Bond Fund | | | 29 | |
PROXY VOTING INFORMATION
A description of the policies and procedures that the Fund uses to determine how to vote proxies relating to portfolio securities is available without charge, upon request, by calling 1-800-222-8222, visiting our website at wellsfargoadvantagefunds.com, or visiting the SEC website at sec.gov. Information regarding how the Fund voted proxies relating to portfolio securities during the most recent 12-month period ended June 30 is available without charge on the Fund’s website at wellsfargoadvantagefunds.com or by visiting the SEC website at sec.gov.
PORTFOLIO HOLDINGS INFORMATION
The complete portfolio holdings for the Fund are publicly available on the Fund’s website (wellsfargoadvantagefunds.com) on a monthly, 30-day or more delayed basis. In addition, top ten holdings information for the Fund is publicly available on the Fund’s website on a monthly, seven-day or more delayed basis. The Fund files its complete schedule of portfolio holdings with the SEC for the first and third quarters of each fiscal year on Form N-Q, which is available without charge by visiting the SEC website at sec.gov. In addition, the Fund’s Form N-Q may be reviewed and copied at the SEC’s Public Reference Room in Washington, DC, and at regional offices in New York City, at 233 Broadway, and in Chicago, at 175 West Jackson Boulevard, Suite 900. Information about the Public Reference Room may be obtained by calling 1-800-SEC-0330.
| | | | |
| 30 | | Wells Fargo Advantage International Bond Fund | | Other information (unaudited) |
BOARD OF TRUSTEES AND OFFICERS
Each of the Trustees and Officers listed in the table below acts in identical capacities for the Wells Fargo Advantage family of funds, which consists of 131 funds1 comprising the Wells Fargo Funds Trust, Wells Fargo Variable Trust, Wells Fargo Master Trust and four closed-end funds (collectively the “Fund Complex”). This table should be read in conjunction with the Prospectus and the Statement of Additional Information2. All of the Trustees are also Members of the Audit and Governance Committees of each Trust in the Fund Complex. The mailing address of each Trustee and Officer is 525 Market Street, 12th Floor, San Francisco, CA 94105. Each Trustee and Officer serves an indefinite term, however, each Trustee serves such term until reaching the mandatory retirement age established by the Trustees.
Independent Trustees
| | | | | | |
Name and year of birth | | Position held and length of service* | | Principal occupations during past five years | | Other directorships during
past five years |
| Peter G. Gordon (Born 1942) | | Trustee, since 1998; Chairman, since 2005 | | Co-Founder, Retired Chairman, President and CEO of Crystal Geyser Water Company. Trustee Emeritus, Colby College. | | Asset Allocation Trust |
| Isaiah Harris, Jr. (Born 1952) | | Trustee, since 2009 | | Retired. Prior thereto, President and CEO of BellSouth Advertising and Publishing Corp. from 2005 to 2007, President and CEO of BellSouth Enterprises from 2004 to 2005 and President of BellSouth Consumer Services from 2000 to 2003. Emeritus member of the Iowa State University Foundation Board of Governors. Emeritus Member of the Advisory Board of Iowa State University School of Business. Advisory Board Member, Palm Coast Academy (charter school). Mr. Harris is a certified public accountant. | | CIGNA Corporation; Deluxe Corporation; Asset Allocation Trust |
| Judith M. Johnson (Born 1949) | | Trustee, since 2008; Audit Committee Chairman, since 2008 | | Retired. Prior thereto, Chief Executive Officer and Chief Investment Officer of Minneapolis Employees Retirement Fund from 1996 to 2008. Ms. Johnson is an attorney, certified public accountant and a certified managerial accountant. | | Asset Allocation Trust |
| Leroy Keith, Jr. (Born 1939) | | Trustee, since 2010 | | Chairman, Bloc Global Services (development and construction). Trustee of the Evergreen Funds from 1983 to 2010. Former Managing Director, Almanac Capital Management (commodities firm), former Partner, Stonington Partners, Inc. (private equity fund), former Director, Obagi Medical Products Co. and former Director, Lincoln Educational Services. | | Trustee, Virtus Fund Complex (consisting of 48 portfolios as of 1/31/2013); Asset Allocation Trust |
| David F. Larcker (Born 1950) | | Trustee, since 2009 | | James Irvin Miller Professor of Accounting at the Graduate School of Business, Stanford University, Morgan Stanley Director of the Center for Leadership Development and Research and Senior Faculty of The Rock Center for Corporate Governance since 2006. From 2005 to 2008, Professor of Accounting at the Graduate School of Business, Stanford University. Prior thereto, Ernst & Young Professor of Accounting at The Wharton School, University of Pennsylvania from 1985 to 2005. | | Asset Allocation Trust |
| Olivia S. Mitchell (Born 1953) | | Trustee, since 2006 | | International Foundation of Employee Benefit Plans Professor, Wharton School of the University of Pennsylvania since 1993. Director of Wharton’s Pension Research Council and Boettner Center on Pensions & Retirement Research, and Research Associate at the National Bureau of Economic Research. Previously, Cornell University Professor from 1978 to 1993. | | Asset Allocation Trust |
| Timothy J. Penny (Born 1951) | | Trustee, since 1996 | | President and CEO of Southern Minnesota Initiative Foundation, a non-profit organization, since 2007 and Senior Fellow at the Humphrey Institute Policy Forum at the University of Minnesota since 1995. Member of the Board of Trustees of NorthStar Education Finance, Inc., a non-profit organization, since 2007. | | Asset Allocation Trust |
| | | | | | |
| Other information (unaudited) | | Wells Fargo Advantage International Bond Fund | | | 31 | |
| | | | | | |
Name and year of birth | | Position held and length of service* | | Principal occupations during past five years | | Other directorships during
past five years |
| Michael S. Scofield (Born 1943) | | Trustee, since 2010 | | Served on the Investment Company Institute’s Board of Governors and Executive Committee from 2008-2011 as well the Governing Council of the Independent Directors Council from 2006-2011 and the Independent Directors Council Executive Committee from 2008-2011. Chairman of the IDC from 2008-2010. Institutional Investor (Fund Directions) Trustee of Year in 2007. Trustee of the Evergreen Funds (and its predecessors) from 1984 to 2010. Chairman of the Evergreen Funds from 2000-2010. Former Trustee of the Mentor Funds. Retired Attorney, Law Offices of Michael S. Scofield. | | Asset Allocation Trust |
| Donald C. Willeke (Born 1940) | | Trustee, since 1996 | | Principal of the law firm of Willeke & Daniels. General Counsel of the Minneapolis Employees Retirement Fund from 1984 until its consolidation into the Minnesota Public Employees Retirement Association on June 30, 2010. Director and Vice Chair of The Tree Trust (non-profit corporation). Director of the American Chestnut Foundation (non-profit corporation). | | Asset Allocation Trust |
| * | Length of service dates reflect the Trustee’s commencement of service with the Trust’s predecessor entities, where applicable. |
Officers
| | | | | | |
Name and year of birth | | Position held and
length of service | | Principal occupations during past five years | | |
| Karla M. Rabusch (Born 1959) | | President, since 2003 | | Executive Vice President of Wells Fargo Bank, N.A. and President of Wells Fargo Funds Management, LLC since 2003. | | |
Nancy Wiser1 (Born 1967) | | Treasurer, since 2012 | | Executive Vice President of Wells Fargo Funds Management, LLC since 2011. Chief Operating Officer and Chief Compliance Officer at LightBox Capital Management LLC, from 2008 to 2011. Owned and operated a consulting business providing services to various hedge funds including acting as Chief Operating Officer and Chief Compliance Officer for a hedge fund from 2007 to 2008. Chief Operating Officer and Chief Compliance Officer of GMN Capital LLC from 2006 to 2007. | | |
| C. David Messman (Born 1960) | | Secretary, since 2000; Chief Legal Officer, since 2003 | | Senior Vice President and Secretary of Wells Fargo Funds Management, LLC since 2001. Vice President and Managing Counsel of Wells Fargo Bank, N.A. since 1996. | | |
Debra Ann Early (Born 1964) | | Chief Compliance Officer, since 2007 | | Chief Compliance Officer of Wells Fargo Funds Management, LLC since 2007. Chief Compliance Officer of Parnassus Investments from 2005 to 2007. Chief Financial Officer of Parnassus Investments from 2004 to 2007. | | |
David Berardi (Born 1975) | | Assistant Treasurer, since 2009 | | Vice President of Wells Fargo Funds Management, LLC since 2009. Vice President of Evergreen Investment Management Company, LLC from 2008 to 2010. Assistant Vice President of Evergreen Investment Services, Inc. from 2004 to 2008. Manager of Fund Reporting and Control for Evergreen Investment Management Company, LLC from 2004 to 2010. | | |
| Jeremy DePalma1 (Born 1974) | | Assistant Treasurer, since 2009 | | Senior Vice President of Wells Fargo Funds Management, LLC since 2009. Senior Vice President of Evergreen Investment Management Company, LLC from 2008 to 2010. Vice President, Evergreen Investment Services, Inc. from 2004 to 2007. Head of the Fund Reporting and Control Team within Fund Administration from 2005 to 2010. | | |
| 1. | Nancy Wiser acts as Treasurer of 73 funds in the Fund Complex. Jeremy DePalma acts as Treasurer of 58 funds and Assistant Treasurer of 73 funds in the Fund Complex. |
| 2. | The Statement of Additional Information includes additional information about the Trustees and is available, without charge, upon request, by calling 1-800-222-8222 or by visiting the website at wellsfargoadvantagefunds.com. |
| | | | |
| 32 | | Wells Fargo Advantage International Bond Fund | | Other information (unaudited) |
BOARD CONSIDERATION OF INVESTMENT ADVISORY AND SUBADVISORY AGREEMENTS:
Under Section 15 of the Investment Company Act of 1940 (the “1940 Act”), the Board of Trustees (the “Board”) of Wells Fargo Funds Trust (the “Trust”), all the members of which have no direct or indirect interest in the investment advisory and sub-advisory agreements and are not “interested persons” of the Trust, as defined in the 1940 Act (the “Independent Trustees”), must determine whether to approve the continuation of the Trust’s investment advisory and sub-advisory agreements. In this regard, at an in-person meeting held on March 28-29, 2013 (the “Meeting”), the Board reviewed: (i) an investment advisory agreement with Wells Fargo Funds Management, LLC (“Funds Management”) for Wells Fargo Advantage International Bond Fund (the “Fund”) and (ii) an investment sub-advisory agreement with First International Advisors, LLC (the “Sub-Adviser”), an affiliate of Funds Management, for the Fund. The investment advisory agreement with Funds Management and the investment sub-advisory agreement with the Sub-Adviser are collectively referred to as the “Advisory Agreements.”
At the Meeting, the Board considered the factors and reached the conclusions described below relating to the selection of Funds Management and the Sub-Adviser and the continuation of the Advisory Agreements. Prior to the Meeting, the Trustees conferred extensively among themselves and with representatives of Funds Management about these matters. The Board has adopted a team-based approach, with each team consisting of a sub-set of Trustees, to assist the Board in the discharge of its duties in reviewing performance and other matters throughout the year. The Independent Trustees were assisted in their evaluation of the Advisory Agreements by independent legal counsel, from whom they received separate legal advice and with whom they met separately.
In providing information to the Board, Funds Management and the Sub-Adviser were guided by a detailed set of requests for information submitted to them by independent legal counsel on behalf of the Independent Trustees at the start of the Board’s annual contract renewal process earlier in 2013. In considering and approving the Advisory Agreements, the Trustees considered the information they believed relevant, including but not limited to the information discussed below. The Board considered not only the specific information presented in connection with the Meeting, but also the knowledge gained over time through interaction with Funds Management and the Sub-Adviser about various topics. In this regard, the Board reviewed reports of Funds Management at each of its quarterly meetings, which included, among other things, portfolio reviews and performance reports. In addition, the Board and the teams mentioned above confer with portfolio managers at various times throughout the year. The Board did not identify any particular information or consideration that was all-important or controlling, and each individual Trustee may have attributed different weights to various factors.
After its deliberations, the Board unanimously determined that the continuation of the Advisory Agreements is in the best interests of the Fund and its shareholders, and that the compensation payable to Funds Management and the Sub-Adviser is reasonable. The Board considered the continuation of the Advisory Agreements for the Fund as part of its consideration of the continuation of advisory agreements for funds across the complex, but each decision was made on a fund-by-fund basis. The following summarizes a number of important, but not necessarily all, factors considered by the Board in reaching its determination.
Nature, extent and quality of services
The Board received and considered various information regarding the nature, extent and quality of services provided to the Fund by Funds Management and the Sub-Adviser under the Advisory Agreements. This information included, among other things, a summary of the background and experience of senior management of Funds Management, and the qualifications, background, tenure and responsibilities of each of the portfolio managers primarily responsible for the day-to-day portfolio management of the Fund.
The Board evaluated the ability of Funds Management and the Sub-Adviser, based on attributes such as their financial condition, resources and reputation, to attract and retain qualified investment professionals, including research, advisory and supervisory personnel. The Board further considered the compliance programs and compliance records of Funds Management and the Sub-Adviser. In addition, the Board took into account the administrative and other services provided to the Fund by Funds Management and its affiliates and Funds Management’s oversight of the Fund’s various service providers.
Fund performance and expenses
The Board considered the performance results for the Fund over various time periods ended December 31, 2012. The Board also considered these results in comparison to the performance of funds in a universe that was determined by Lipper Inc. (“Lipper”) to be similar to the Fund (the “Universe”), and in comparison to the Fund’s benchmark index and to other comparative data. Lipper is an independent provider of investment company data. The Board received a
| | | | | | |
| Other information (unaudited) | | Wells Fargo Advantage International Bond Fund | | | 33 | |
description of the methodology used by Lipper to select the mutual funds in the performance Universe. The Board noted that the performance of the Fund (Class A) was higher than or in range of the median performance of the Universe for all periods under review except for the one-year period. The Board also noted that the performance of the Fund was higher than its benchmark, the Bank of America Merrill Lynch Global Broad Market Ex. U.S. Index, for all periods under review.
The Board received information concerning, and discussed factors contributing to, the underperformance of the Fund relative to the Universe for the one-year period under review. Funds Management advised the Board about the market conditions and investment decisions that it believed contributed to the underperformance during that period. The Board noted the positive performance of the Fund for all other periods under review and was satisfied with the explanation it received.
The Board received and considered information regarding the Fund’s net operating expense ratios and their various components, including actual management fees (which reflect fee waivers, if any, and include advisory, administration and transfer agent fees), custodian and other non-management fees, Rule 12b-1 and non-Rule 12b-1 service fees and fee waiver and expense reimbursement arrangements. The Board also considered these ratios in comparison to the median ratios of funds in class-specific expense groups that were determined by Lipper to be similar to the Fund (the “Groups”). The Board received a description of the methodology used by Lipper to select the mutual funds in the expense Groups. Based on the Lipper reports, the Board noted that the net operating expense ratios of the Fund were lower than or in range of the median net operating expense ratios of the expense Groups.
Based on its consideration of the factors and information it deemed relevant, including those described here, the Board concluded that the overall performance and expense structure of the Fund supported the re-approval of the Advisory Agreements.
Investment advisory and sub-advisory fee rates
The Board reviewed and considered the contractual investment advisory fee rates that are payable by the Fund to Funds Management for investment advisory services (the “Advisory Agreement Rates”), both on a stand-alone basis and on a combined basis with the Fund’s fund-level and class-level contractual administration fee rates (the “Management Rates”). The Board noted that the administration fees include transfer agency costs. The Board also reviewed and considered the contractual investment sub-advisory fee rates that are payable by Funds Management to the Sub-Adviser for investment sub-advisory services (the “Sub-Advisory Agreement Rates”).
Among other information reviewed by the Board was a comparison of the Management Rates of the Fund with those of other funds in the expense Groups at a common asset level. The Board noted that the Management Rates of the Fund were in range of the median rates for the Fund’s expense Groups for all classes except for Class A. The Board viewed favorably the fact that the net operating expense ratios of the Fund were lower than or in range of the median net operating expense ratios of the expense Groups for all classes, including Class A.
The Board also received and considered information about the portion of the total advisory fee that was retained by Funds Management after payment of the fee to the Sub-Adviser for sub-advisory services. In assessing the reasonableness of this amount, the Board received and evaluated information concerning the nature and extent of responsibilities retained and risks assumed by Funds Management and not delegated to or assumed by the Sub-Adviser, and about Funds Management’s on-going oversight services. In recognition of the fact that the Wells Fargo enterprise provides a suite of combined advisory and sub-advisory services to the Fund through affiliated entities, the Board ascribed limited relevance to the allocation of the total advisory fee between Funds Management and the Sub-Adviser.
The Board also received and considered information about the nature and extent of services offered and fee rates charged by Funds Management and the Sub-Adviser to other types of clients. In this regard, the Board received information about the significantly greater scope of services, and compliance, reporting and other legal burdens and risks of managing mutual funds compared with those associated with managing assets of non-mutual fund clients such as collective funds or institutional separate accounts.
Based on its consideration of the factors and information it deemed relevant, including those described here, the Board determined that the Advisory Agreement Rates and the Sub-Advisory Agreement Rates were reasonable in light of the services covered by the Advisory Agreements.
Profitability
The Board received and considered information concerning the profitability of Funds Management, as well as the profitability of Wells Fargo as a whole, from providing services to the Fund. The Board did not receive or consider to be necessary separate profitability information with respect to the Sub-Adviser, because, as an affiliate of Funds Management, its profitability information was subsumed in the collective Wells Fargo profitability analysis provided by Funds Management.
| | | | |
| 34 | | Wells Fargo Advantage International Bond Fund | | Other information (unaudited) |
Funds Management explained the methodologies and estimates that it used in calculating the profitability from the Fund and the fund family as a whole. Among other things, the Board noted that the levels of profitability reported on a fund-by-fund basis varied widely, depending on factors such as the size and type of fund. Based on its review, the Board did not deem the profits reported by Funds Management to be at a level that would prevent it from approving the continuation of the Advisory Agreements.
Economies of scale
With respect to possible economies of scale, the Board reviewed the breakpoints in the Fund’s advisory fee and administration fee structure, which operate generally to reduce the Fund’s expense ratios as the Fund grows in size. It considered that, for a small fund or a fund that shrinks in size, breakpoints conversely can result in higher fee levels. The Board also considered fee waiver and expense reimbursement arrangements as a means of sharing potential economies of scale with the Fund. The Board acknowledged the inherent limitations of any analysis of potential economies of scale and of any attempt to correlate breakpoints with such economies. Nonetheless, the Board concluded that the breakpoints and net operating expense ratio caps appeared to be a reasonable approach to sharing potential economies of scale with the Fund.
Other benefits to Funds Management and the Sub-Adviser
The Board received and considered information regarding potential “fall-out” or ancillary benefits received by Funds Management and its affiliates, including the Sub-Adviser, as a result of their relationship with the Fund. Ancillary benefits could include, among others, benefits directly attributable to other relationships with the Fund and benefits potentially derived from an increase in Funds Management’s and the Sub-Adviser’s business as a result of their relationship with the Fund (such as the ability to market to shareholders other financial products and services offered by Funds Management and its affiliates, including the Sub-Adviser, or to operate other products and services that follow investment strategies similar to those of the Fund).
The Board considered that Wells Fargo Funds Distributor, LLC, an affiliate of Funds Management, serves as distributor to the Fund and receives certain compensation for those services. The Board noted that various financial institutions, including affiliates of Funds Management, may receive distribution-related fees, shareholder servicing payments (including amounts derived from payments under Rule 12b-1 plans) and sub-transfer agency fees in respect of shares sold or held through them and services provided.
The Board also reviewed information about whether and to what extent soft dollar credits are sought and how any such credits are utilized, and any benefits that might be realized by an affiliated broker that handles portfolio transactions for the Fund.
Based on its consideration of the factors and information it deemed relevant, including those described here, the Board did not find that any ancillary benefits received by Funds Management and its affiliates, including the Sub-Adviser, were unreasonable.
Conclusion
After considering the above-described factors and based on its deliberations and its evaluation of the information described above, the Board unanimously approved the continuation of the Advisory Agreements for an additional one-year period.
| | | | | | |
| List of abbreviations | | Wells Fargo Advantage International Bond Fund | | | 35 | |
The following is a list of common abbreviations for terms and entities that may have appeared in this report.
| ACA | — ACA Financial Guaranty Corporation |
| ADR | — American depositary receipt |
| ADS | — American depositary shares |
| AGC | — Assured Guaranty Corporation |
| AGM | — Assured Guaranty Municipal |
| Ambac | — Ambac Financial Group Incorporated |
| AMT | — Alternative minimum tax |
| BAN | — Bond anticipation notes |
| BHAC | — Berkshire Hathaway Assurance Corporation |
| CAB | — Capital appreciation bond |
| CCAB | — Convertible capital appreciation bond |
| CDA | — Community Development Authority |
| CDO | — Collateralized debt obligation |
| COP | — Certificate of participation |
| DRIVER | — Derivative inverse tax-exempt receipts |
| DW&P | — Department of Water & Power |
| DWR | — Department of Water Resources |
| ECFA | — Educational & Cultural Facilities Authority |
| EDA | — Economic Development Authority |
| EDFA | — Economic Development Finance Authority |
| ETF | — Exchange-traded fund |
| FDIC | — Federal Deposit Insurance Corporation |
| FFCB | — Federal Farm Credit Banks |
| FGIC | — Financial Guaranty Insurance Corporation |
| FHA | — Federal Housing Administration |
| FHLB | — Federal Home Loan Bank |
| FHLMC | — Federal Home Loan Mortgage Corporation |
| FICO | — The Financing Corporation |
| FNMA | — Federal National Mortgage Association |
| GDR | — Global depositary receipt |
| GNMA | — Government National Mortgage Association |
| HCFR | — Healthcare facilities revenue |
| HEFA | — Health & Educational Facilities Authority |
| HEFAR | — Higher education facilities authority revenue |
| HFA | — Housing Finance Authority |
| HFFA | — Health Facilities Financing Authority |
| HUD | — Department of Housing and Urban Development |
| IDA | — Industrial Development Authority |
| IDAG | — Industrial Development Agency |
| IDR | — Industrial development revenue |
| KRW | — Republic of Korea won |
| LIBOR | — London Interbank Offered Rate |
| LLC | — Limited liability company |
| LLP | — Limited liability partnership |
| MBIA | — Municipal Bond Insurance Association |
| MFHR | — Multifamily housing revenue |
| MSTR | — Municipal securities trust receipts |
| MUD | — Municipal Utility District |
| National | — National Public Finance Guarantee Corporation |
| PCFA | — Pollution Control Financing Authority |
| PCL | — Public Company Limited |
| PCR | — Pollution control revenue |
| PFA | — Public Finance Authority |
| PFFA | — Public Facilities Financing Authority |
| PFOTER | — Puttable floating option tax-exempt receipts |
| plc | — Public limited company |
| PUTTER | — Puttable tax-exempt receipts |
| R&D | — Research & development |
| Radian | — Radian Asset Assurance |
| RAN | — Revenue anticipation notes |
| RDA | — Redevelopment Authority |
| RDFA | — Redevelopment Finance Authority |
| REIT | — Real estate investment trust |
| ROC | — Reset option certificates |
| SAVRS | — Select auction variable rate securities |
| SBA | — Small Business Authority |
| SFHR | — Single-family housing revenue |
| SFMR | — Single-family mortgage revenue |
| SPA | — Standby purchase agreement |
| SPDR | — Standard & Poor’s Depositary Receipts |
| STRIPS | — Separate trading of registered interest and principal securities |
| TAN | — Tax anticipation notes |
| TIPS | — Treasury inflation-protected securities |
| TRAN | — Tax revenue anticipation notes |
| TTFA | — Transportation Trust Fund Authority |
| TVA | — Tennessee Valley Authority |
This page is intentionally left blank.
This page is intentionally left blank.
This page is intentionally left blank.


For more information
More information about Wells Fargo Advantage Funds is available free upon request. To obtain literature, please write, email, visit the Fund’s website, or call:
Wells Fargo Advantage Funds
P.O. Box 8266
Boston, MA 02266-8266
Email: wfaf@wellsfargo.com
Website: wellsfargoadvantagefunds.com
Individual investors: 1-800-222-8222
Retail investment professionals: 1-888-877-9275
Institutional investment professionals: 1-866-765-0778
This report and the financial statements contained herein are submitted for the general information of the shareholders of Wells Fargo Advantage Funds. If this report is used for promotional purposes, distribution of the report must be accompanied or preceded by a current prospectus. For a current prospectus and, if available, a summary prospectus containing more complete information, including charges and expenses, call 1-800-222-8222 or visit the Fund’s website at wellsfargoadvantagefunds.com. Please consider the investment objectives, risks, charges, and expenses of the investment carefully before investing. This and other information about Wells Fargo Advantage Funds can be found in the current prospectus. Read the prospectus carefully before you invest or send money.
Wells Fargo Funds Management, LLC, a wholly owned subsidiary of Wells Fargo & Company, provides investment advisory and administrative services for Wells Fargo Advantage Funds. Other affiliates of Wells Fargo & Company provide subadvisory and other services for the Funds. The Funds are distributed by Wells Fargo Funds Distributor, LLC, Member FINRA/SIPC, an affiliate of Wells Fargo & Company.
NOT FDIC INSURED ¡ NO BANK GUARANTEE ¡ MAY LOSE VALUE
© 2013 Wells Fargo Funds Management, LLC. All rights reserved.
| | |
 | | 216828 06-13 SA235/SAR235 4-13 |

Wells Fargo Advantage Strategic Income Fund

Semi-Annual Report
April 30, 2013

Reduce clutter. Save trees.
Sign up for electronic delivery of prospectuses and shareholder reports at wellsfargo.com/advantagedelivery
Contents
The views expressed and any forward-looking statements are as of April 30, 2013, unless otherwise noted, and are those of the Fund managers and/or Wells Fargo Funds Management, LLC. Discussions of individual securities, or the markets generally, or any Wells Fargo Advantage Fund are not intended as individual recommendations. Future events or results may vary significantly from those expressed in any forward-looking statements; the views expressed are subject to change at any time in response to changing circumstances in the market. Wells Fargo Funds Management, LLC, disclaims any obligation to publicly update or revise any views expressed or forward-looking statements.
NOT FDIC INSURED ¡ NO BANK GUARANTEE ¡ MAY LOSE VALUE

Wells Fargo investment history
| | |
| 1932 | | Keystone creates one of the first mutual fund families. |
| 1971 | | Wells Fargo & Company introduces one of the first institutional index funds. |
| 1978 | | Wells Fargo applies Markowitz and Sharpe’s research on Modern Portfolio Theory to introduce one of the industry’s first tactical asset allocation models in institutional separately managed accounts. |
| 1984 | | Wells Fargo Stagecoach Funds launches its first asset allocation fund. |
| 1989 | | The Tactical Asset Allocation (TAA) Model is first applied to Wells Fargo’s asset allocation mutual funds. |
| 1994 | | Wells Fargo introduces the LifePath Funds, one of the first suites of target date funds (now the Wells Fargo Advantage Dow Jones Target Date FundsSM). |
| 1996 | | Evergreen Investments and Keystone Funds merge. |
| 1997 | | Wells Fargo launches the Wells Fargo Advantage WealthBuilder PortfoliosSM, a fund-of-funds suite of products that includes the use of quantitative models to shift assets among investment styles. |
| 1999 | | Norwest Advantage Funds and Stagecoach Funds are reorganized into Wells Fargo Funds after the merger of Norwest and Wells Fargo. |
| 2002 | | Evergreen Retail and Evergreen Institutional companies form the umbrella asset management company, Evergreen Investments. |
| 2005 | | The integration of Strong Funds with Wells Fargo Funds creates Wells Fargo Advantage Funds, resulting in one of the top 20 mutual fund companies in the United States. |
| 2006 | | Wells Fargo Advantage Funds relaunches the target date product line as Wells Fargo Advantage Dow Jones Target Date Funds. |
| 2010 | | The mergers and reorganizations of Evergreen and Wells Fargo Advantage mutual funds are completed, unifying the families under the brand of Wells Fargo Advantage Funds. |
Wells Fargo Advantage Funds®
Wells Fargo Advantage Funds skillfully guides institutions, financial advisors, and individuals through the investment terrain to help them reach their financial objectives. Everything we do on behalf of investors is backed by our unique combination of qualifications.
Strength
Our organization is built on the standards of integrity and service established by our parent company—Wells Fargo & Company—more than 150 years ago. And, because we’re part of a highly diversified financial enterprise, we offer the depth of resources to help investors succeed.
Expertise
Our multi-boutique model offers investors access to the independent thinking of premier investment managers that have been chosen for their time-tested strategies. While each team specializes in a specific investment strategy, collectively they provide investors a wide choice of distinct investment styles. Our dedication to investment excellence doesn’t end with our expertise in manager selection—risk management, analysis, and rigorous ongoing review seek to ensure each manager’s investment process remains consistent.
Partnership
Our collaborative approach is built around understanding the needs and goals of our clients. By adhering to core principles of sound judgment and steady guidance, we support you through every stage of the investment decision process.
Carefully consider the investment objectives, risks, charges, and expenses before investing. For a current prospectus and, if available, a summary prospectus, for Wells Fargo Advantage Funds, containing this and other information, visit wellsfargoadvantagefunds.com. Read it carefully before investing.
Wells Fargo Funds Management, LLC, a wholly owned subsidiary of Wells Fargo & Company, provides investment advisory and administrative services for Wells Fargo Advantage Funds. Other affiliates of Wells Fargo & Company provide subadvisory and other services for the Funds. The Funds are distributed by Wells Fargo Funds Distributor, LLC, Member FINRA/SIPC, an affiliate of Wells Fargo & Company.
“Dow Jones®” and “Dow Jones Target Date IndexesSM” are service marks of Dow Jones Trademark Holdings LLC (“Dow Jones”); have been licensed to CME Group Index Services LLC (“CME Indexes”); and have been sublicensed for use for certain purposes by Global Index Advisors, Inc., and Wells Fargo Funds Management, LLC. The Wells Fargo Advantage Dow Jones Target Date FundsSM, based on the Dow Jones Target Date Indexes, are not sponsored, endorsed, sold, or promoted by Dow Jones, CME Indexes, or their respective affiliates, and none of them makes any representation regarding the advisability of investing in such product(s).
NOT FDIC INSURED ¡ NO BANK GUARANTEE ¡ MAY LOSE VALUE
Not part of the semi-annual report.
Wells Fargo Advantage Funds offers more than 100 mutual funds across a wide range of asset classes, representing over $228 billion in assets under management, as of April 30, 2013.
| | | | |
| Equity funds | | | | |
Asia Pacific Fund | | Enterprise Fund† | | Opportunity Fund† |
C&B Large Cap Value Fund | | Global Opportunities Fund | | Precious Metals Fund |
C&B Mid Cap Value Fund | | Growth Fund | | Premier Large Company Growth Fund |
Capital Growth Fund | | Index Fund | | Small Cap Opportunities Fund |
Common Stock Fund | | International Equity Fund | | Small Cap Value Fund |
Disciplined U.S. Core Fund | | International Value Fund | | Small Company Growth Fund |
Discovery Fund† | | Intrinsic Small Cap Value Fund | | Small Company Value Fund |
Diversified Equity Fund | | Intrinsic Value Fund | | Small/Mid Cap Value Fund |
Diversified International Fund | | Intrinsic World Equity Fund | | Special Mid Cap Value Fund |
Emerging Growth Fund | | Large Cap Core Fund | | Special Small Cap Value Fund |
Emerging Markets Equity Fund | | Large Cap Growth Fund | | Specialized Technology Fund |
Emerging Markets Equity Income Fund | | Large Company Value Fund | | Traditional Small Cap Growth Fund |
Endeavor Select Fund† | | Omega Growth Fund | | Utility and Telecommunications Fund |
| Bond funds | | | | |
Adjustable Rate Government Fund | | High Yield Municipal Bond Fund | | Short-Term Bond Fund |
California Limited-Term Tax-Free Fund | | Income Plus Fund | | Short-Term High Yield Bond Fund |
California Tax-Free Fund | | Inflation-Protected Bond Fund | | Short-Term Municipal Bond Fund |
Colorado Tax-Free Fund | | Intermediate Tax/AMT-Free Fund | | Strategic Income Fund |
Conservative Income Fund | | International Bond Fund | | Strategic Municipal Bond Fund |
Core Bond Fund | | Minnesota Tax-Free Fund | | Ultra Short-Term Income Fund |
Emerging Markets Local Bond Fund | | Municipal Bond Fund | | Ultra Short-Term Municipal Income Fund |
Government Securities Fund | | North Carolina Tax-Free Fund | | Wisconsin Tax-Free Fund |
High Income Fund | | Pennsylvania Tax-Free Fund | | |
High Yield Bond Fund | | Short Duration Government Bond Fund | | |
| Asset allocation funds | | | | |
Absolute Return Fund | | WealthBuilder Equity Portfolio† | | Target 2020 Fund† |
Asset Allocation Fund | | WealthBuilder Growth Allocation Portfolio† | | Target 2025 Fund† |
Diversified Capital Builder Fund | | WealthBuilder Growth Balanced Portfolio† | | Target 2030 Fund† |
Diversified Income Builder Fund | | WealthBuilder Moderate Balanced Portfolio† | | Target 2035 Fund† |
Growth Balanced Fund | | WealthBuilder Tactical Equity Portfolio† | | Target 2040 Fund† |
Index Asset Allocation Fund | | Target Today Fund† | | Target 2045 Fund† |
Moderate Balanced Fund | | Target 2010 Fund† | | Target 2050 Fund† |
WealthBuilder Conservative Allocation Portfolio† | | Target 2015 Fund† | | Target 2055 Fund† |
| Money market funds | | | | |
100% Treasury Money Market Fund | | Heritage Money Market Fund† | | National Tax-Free Money Market Fund |
California Municipal Money Market Fund | | Money Market Fund | | Treasury Plus Money Market Fund |
Cash Investment Money Market Fund | | Municipal Cash Management Money Market Fund | | |
Government Money Market Fund | | Municipal Money Market Fund | | |
| Variable trust funds1 | | | | |
VT Discovery Fund† | | VT Intrinsic Value Fund | | VT Small Cap Growth Fund |
VT Index Asset Allocation Fund | | VT Omega Growth Fund | | VT Small Cap Value Fund |
VT International Equity Fund | | VT Opportunity Fund† | | VT Total Return Bond Fund |
An investment in a money market fund is not insured or guaranteed by the Federal Deposit Insurance Corporation or any other government agency. Although the Wells Fargo Advantage Money Market Funds seek to preserve the value of your investment at $1.00 per share, it is possible to lose money by investing in a money market fund.
| 1. | The variable trust funds are generally available only through insurance company variable contracts. |
| † | In this report, the Wells Fargo Advantage Discovery FundSM, Wells Fargo Advantage Endeavor Select FundSM, Wells Fargo Advantage Enterprise FundSM, Wells Fargo Advantage Opportunity FundSM, Wells Fargo Advantage WealthBuilder Conservative Allocation PortfolioSM, Wells Fargo Advantage WealthBuilder Equity PortfolioSM, Wells Fargo Advantage WealthBuilder Growth Allocation PortfolioSM, Wells Fargo Advantage WealthBuilder Growth Balanced PortfolioSM, Wells Fargo Advantage WealthBuilder Moderate Balanced PortfolioSM, Wells Fargo Advantage WealthBuilder Tactical Equity PortfolioSM, Wells Fargo Advantage Dow Jones Target Today FundSM, Wells Fargo Advantage Dow Jones Target 2010 FundSM, Wells Fargo Advantage Dow Jones Target 2015 FundSM, Wells Fargo Advantage Dow Jones Target 2020 FundSM, Wells Fargo Advantage Dow Jones Target 2025 FundSM, Wells Fargo Advantage Dow Jones Target 2030 FundSM, Wells Fargo Advantage Dow Jones Target 2035 FundSM, Wells Fargo Advantage Dow Jones Target 2040 FundSM, Wells Fargo Advantage Dow Jones Target 2045 FundSM, Wells Fargo Advantage Dow Jones Target 2050 FundSM, Wells Fargo Advantage Dow Jones Target 2055 FundSM, Wells Fargo Advantage Heritage Money Market FundSM, Wells Fargo Advantage VT Discovery FundSM, and Wells Fargo Advantage VT Opportunity FundSM are referred to as the Discovery Fund, Endeavor Select Fund, Enterprise Fund, Opportunity Fund, WealthBuilder Conservative Allocation Portfolio, WealthBuilder Equity Portfolio, WealthBuilder Growth Allocation Portfolio, WealthBuilder Growth Balanced Portfolio, WealthBuilder Moderate Balanced Portfolio, WealthBuilder Tactical Equity Portfolio, Target Today Fund, Target 2010 Fund, Target 2015 Fund, Target 2020 Fund, Target 2025 Fund, Target 2030 Fund, Target 2035 Fund, Target 2040 Fund, Target 2045 Fund, Target 2050 Fund, Target 2055 Fund, Heritage Money Market Fund, VT Discovery Fund, and VT Opportunity Fund, respectively. |
Not part of the semi-annual report.
| | | | |
| 2 | | Wells Fargo Advantage Strategic Income Fund | | Letter to shareholders (unaudited) |

Karla M. Rabusch
President
Wells Fargo Advantage Funds
High-yield fixed-income performance was best among the lowest-rated securities, as continued monetary accommodation from the U.S. Federal Reserve (Fed) strengthened the demand for securities with higher yields.
High-yield fixed-income markets continued to outperform the investment-grade segments of the fixed-income markets, as each lower-rated credit tier outperformed each respectively higher credit tier.
Dear Valued Shareholder:
We are pleased to offer you the first shareholder report for the Wells Fargo Advantage Strategic Income Fund since commencement of operations on January 31, 2013 through April 30, 2013. During the period, high-yield fixed-income performance was best among the lowest-rated securities, as continued monetary accommodation from the U.S. Federal Reserve (Fed) strengthened the demand for securities with higher yields. The longer-maturity segments of the fixed-income markets outperformed the shorter-maturity segments, benefiting from higher yields and increasing prices.
U.S. high yield continued to outperform, while U.S. Treasury yields declined.
Before the period began, growing confidence in the U.S. economy and improving stability in the European credit markets drove longer-maturity U.S. Treasury yields significantly higher in December 2012 and January 2013. However, those trends steadily reversed during the three-month period, as U.S. Treasury yields continuously declined over February, March, and April 2013. The yield on the 10-year U.S. Treasury note began the period at 1.98% and finished at 1.68%. U.S. high-yield securities continued to perform well throughout the period, benefiting from both the declining yields and the corresponding price increases across the fixed-income markets, as well as higher spread compensation across the high-yield credit tiers.
Over the months of February, March, and April 2013, high-yield fixed-income markets continued to outperform the investment-grade segments of the fixed-income markets, as each lower-rated credit tier outperformed each respectively higher credit tier. Spreads across the high-yield credit spectrum continued to grind tighter, particularly in the CCC-rated credit tier. The CCC-rated subsector of the Barclays U.S. Corporate High Yield Index1 returned 4.81% during the period and saw spreads decline from 727 basis points (bps; 100 bps equals 1.00%) at the start of the period to 637 bps at the finish. Credit risks generally continued to be better rewarded than interest-rate risks during the period, meaning that higher-yield compensation from lower-rated securities generally performed better than higher-yield compensation from longer-maturity securities.
Don’t let short-term uncertainty derail long-term investment goals.
Periods of uncertainty can present challenges, but experience has taught us that maintaining a long-term investment strategy based on individual goals and risk tolerance can be an effective way to plan for the future. To help you create a sound strategy based on your personal goals and risk tolerance, Wells Fargo Advantage Funds offers more than 100 mutual funds and other investments spanning a wide range of asset classes and investment styles. Although diversification2 cannot guarantee an investment profit or prevent losses, we believe it can be an effective way to manage investment risk and potentially smooth out overall portfolio performance.
Thank you for choosing to invest with Wells Fargo Advantage Funds. We appreciate your confidence in us and remain committed to helping you meet your financial needs. For current information about your fund investments, contact your investment professional, visit our website at wellsfargoadvantagefunds.com, or call us directly at 1-800-222-8222. We are available 24 hours a day, 7 days a week.
| 1. | The Barclays U.S. Corporate High Yield Index is an unmanaged, U.S. dollar-denominated, nonconvertible, non-investment-grade debt index. The Index consists of domestic and corporate bonds rated Ba and below with a minimum outstanding amount of $150 million. You cannot invest directly in an index. |
| 2. | Diversification does not assure or guarantee better performance and cannot eliminate the risk of investment losses. |
| | | | | | |
| Letter to shareholders (unaudited) | | Wells Fargo Advantage Strategic Income Fund | | | 3 | |
Sincerely,

Karla M. Rabusch
President
Wells Fargo Advantage Funds
| | | | |
| 4 | | Wells Fargo Advantage Strategic Income Fund | | Performance highlights (unaudited) |
Investment objective
The Fund seeks total return, consisting of a high level of current income and capital appreciation.
Adviser
Wells Fargo Funds Management, LLC
Subadvisers
First International Advisors, LLC
Wells Capital Management Incorporated
Portfolio managers
Michael Bray, CFA
David Germany, Ph.D
Niklas Nordenfelt, CFA
Anthony Norris
Margaret D. Patel
Thomas M. Price, CFA
Scott M. Smith, CFA
Average annual total returns (%) as of April 30, 2013
| | | | | | | | | | | | | | | | | | |
| | | | | Including sales charge | | | Excluding sales charge | | | Expense ratios1 (%) | |
| | | Inception date | | Since inception | | | Since inception | | | Gross | | | Net2 | |
| Class A (WSIAX) | | 1-31-2013 | | | (3.57 | ) | | | 0.96 | | | | 1.11 | | | | 0.90 | |
| Class C (WSICX) | | 1-31-2013 | | | (0.19 | ) | | | 0.81 | | | | 1.86 | | | | 1.65 | |
| Administrator Class (WSIDX) | | 1-31-2013 | | | – | | | | 0.97 | | | | 1.05 | | | | 0.75 | |
| Institutional Class (WSINX) | | 1-31-2013 | | | – | | | | 1.03 | | | | 0.78 | | | | 0.60 | |
| Barclays U.S. Universal Bond Index3 | | – | | | – | | | | 1.70 | | | | – | | | | – | |
Figures quoted represent past performance, which is no guarantee of future results and do not reflect the deduction of taxes that a shareholder may pay on fund distributions or the redemption of fund shares. Investment return and principal value of an investment will fluctuate so that an investor’s shares, when redeemed, may be worth more or less than their original cost. Performance shown without sales charges would be lower if sales charges were reflected. Current performance may be lower or higher than the performance data quoted, which assumes the reinvestment of dividends and capital gains. Current month-end performance is available on the Fund’s website, wellsfargoadvantagefunds.com.
Index returns do not include transaction costs associated with buying and selling securities, any mutual fund fees or expenses, or any taxes. It is not possible to invest directly in an index.
For Class A shares, the maximum front-end sales charge is 4.50%. For Class C shares, the maximum contingent deferred sales charge is 1.00%. Performance including sales charge assumes the sales charge for the corresponding time period. Administrator Class and Institutional Class shares are sold without a front-end sales charge or contingent deferred sales charge.
Bond values fluctuate in response to the financial condition of individual issuers, general market and economic conditions, and changes in interest rates. In general, when interest rates rise, bond values fall and investors may lose principal value. High-yield securities have a greater risk of default and tend to be more volatile than higher-rated debt securities. Loans are subject to risks similar to those associated with other below-investment-grade bond investments, such as credit risk (for example, risk of issuer default), below-investment-grade bond risk (for example, risk of greater volatility in value), and risk that the loan may become illiquid or difficult to price. Foreign investments are especially volatile and can rise or fall dramatically due to differences in the political and economic conditions of the host country. These risks are generally intensified in emerging markets. The use of derivatives may reduce returns and/or increase volatility. Certain investment strategies tend to increase the total risk of an investment (relative to the broader market). The Fund is exposed to mortgage- and asset-backed securities risk, and regional risk. Consult the Fund’s prospectus for additional information on these and other risks.
Please see footnotes on page 5.
| | | | | | |
| Performance highlights (unaudited) | | Wells Fargo Advantage Strategic Income Fund | | | 5 | |
| | | | |
| Ten largest long-term holdings4 (%) as of April 30, 2013 | |
Russia, 6.20%, 1-31-2018 | | | 3.96 | |
Poland, 4.00%, 10-25-2023 | | | 2.47 | |
Republic of South Africa, 7.75%, 2-28-2023 | | | 2.44 | |
Brazil, 10.00%, 1-1-2017 | | | 1.84 | |
Brazil, 8.50%, 1-5-2024 | | | 1.76 | |
Turkey, 9.00%, 3-8-2017 | | | 1.66 | |
Mexico, 8.50%, 11-18-2038 | | | 1.65 | |
Mexico, 7.25%, 12-15-2016 | | | 1.30 | |
Malaysia, 4.26%, 9-15-2016 | | | 1.22 | |
Texas Competitive Electric Holidngs LLC, 3.50%,
10-10-2014 | | | 1.19 | |
| | |
| Portfolio allocation5 as of April 30, 2013 |
|
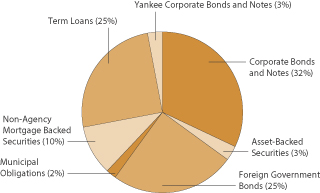
|
| 1. | Reflects the expense ratios as stated in the most recent prospectuses. |
| 2. | The Adviser has committed through February 28, 2014, to waive fees and/or reimburse expenses to the extent necessary to cap the Fund’s Total Annual Fund Operating Expenses After Fee Waiver, excluding certain expenses, at the amounts shown. Brokerage commissions, stamp duty fees, interest, taxes, acquired fund fees and expenses, and extraordinary expenses are excluded from the cap. Without this cap, the Fund’s returns would have been lower. |
| 3. | The Barclays U.S. Universal Bond Index is an unmanaged market value-weighted performance benchmark for the U.S. dollar-denominated bond market, which includes investment-grade, high yield, and emerging market debt securities with maturities of one year or more. You cannot invest directly in an index. |
| 4. | The ten largest long-term holdings are calculated based on the value of the securities divided by total net assets of the Fund. Holdings are subject to change and may have changed since the date specified. |
| 5. | Portfolio allocation is subject to change and is calculated based on the total long-term investments of the Fund. |
| | | | |
| 6 | | Wells Fargo Advantage Strategic Income Fund | | Fund expenses (unaudited) |
As a shareholder of the Fund, you incur two types of costs: (1) transaction costs, including sales charges (loads) on purchase payments and contingent deferred sales charges (if any) on redemptions and (2) ongoing costs, including management fees, distribution (12b-1) and/or shareholder service fees, and other Fund expenses. This example is intended to help you understand your ongoing costs (in dollars) of investing in the Fund and to compare these costs with the ongoing costs of investing in other mutual funds.
The example is based on an investment of $1,000 invested at the beginning of the six-month period and held for the entire period from November 1, 2012 to April 30, 2013.
Actual expenses
The “Actual” line of the table below provides information about actual account values and actual expenses. You may use the information in this line, together with the amount you invested, to estimate the expenses that you paid over the period. Simply divide your account value by $1,000 (for example, an $8,600 account value divided by $1,000 = 8.6), then multiply the result by the number in the “Actual” line under the heading entitled “Expenses paid during period” for your applicable class of shares to estimate the expenses you paid on your account during this period.
Hypothetical example for comparison purposes
The “Hypothetical” line of the table below provides information about hypothetical account values and hypothetical expenses based on the Fund’s actual expense ratio and an assumed rate of return of 5% per year before expenses, which is not the Fund’s actual return. The hypothetical account values and expenses may not be used to estimate the actual ending account balance or expenses you paid for the period. You may use this information to compare the ongoing costs of investing in the Fund and other funds. To do so, compare this 5% hypothetical example with the 5% hypothetical examples that appear in the shareholder reports of the other funds.
Please note that the expenses shown in the table are meant to highlight your ongoing costs only and do not reflect any transactional costs, such as sales charges (loads) and contingent deferred sales charges. Therefore, the “Hypothetical” line of the table is useful in comparing ongoing costs only and will not help you determine the relative total costs of owning different funds. In addition, if these transactional costs were included, your costs would have been higher.
| | | | | | | | | | | | | | | | |
| | | Beginning account value 11-1-2012 | | | Ending account value 4-30-2013 | | | Expenses paid during the period1 | | | Net annual expense ratio | |
Class A | | | | | | | | | | | | | | | | |
Actual | | $ | 1,000.00 | | | $ | 1,009.59 | | | $ | 4.48 | | | | 0.90 | % |
Hypothetical (5% return before expenses) | | $ | 1,000.00 | | | $ | 1,020.33 | | | $ | 4.51 | | | | 0.90 | % |
Class C | | | | | | | | | | | | | | | | |
Actual | | $ | 1,000.00 | | | $ | 1,008.06 | | | $ | 8.22 | | | | 1.65 | % |
Hypothetical (5% return before expenses) | | $ | 1,000.00 | | | $ | 1,016.61 | | | $ | 8.25 | | | | 1.65 | % |
Administrator Class | | | | | | | | | | | | | | | | |
Actual | | $ | 1,000.00 | | | $ | 1,009.71 | | | $ | 3.74 | | | | 0.75 | % |
Hypothetical (5% return before expenses) | | $ | 1,000.00 | | | $ | 1,021.08 | | | $ | 3.76 | | | | 0.75 | % |
Institutional Class | | | | | | | | | | | | | | | | |
Actual | | $ | 1,000.00 | | | $ | 1,010.27 | | | $ | 2.99 | | | | 0.60 | % |
Hypothetical (5% return before expenses) | | $ | 1,000.00 | | | $ | 1,021.82 | | | $ | 3.01 | | | | 0.60 | % |
| 1. | Expenses paid is equal to the annualized expense ratio of each class multiplied by the average account value over the period, multiplied by the number of days in the most recent fiscal half-year divided by the number of days in the fiscal year (to reflect the one-half-year period). |
| | | | | | |
| Portfolio of investments—April 30, 2013 (unaudited) | | Wells Fargo Advantage Strategic Income Fund | | | 7 | |
| | | | | | | | | | | | | | | | |
| Security name | | Interest rate | | | Maturity date | | | Principal | | | Value | |
| | | | | | | | | | | | | | | | |
| | | | |
Asset-Backed Securities: 2.97% | | | | | | | | | | | | | | | | |
AmeriCredit Automobile Receivables Trust Series 2012-4 Class E 144A | | | 3.82 | % | | | 2-10-2020 | | | $ | 250,000 | | | $ | 260,449 | |
CAL Funding II Limited Series 2012-1A Class A 144A | | | 3.47 | | | | 10-25-2027 | | | | 237,500 | | | | 243,187 | |
Santander Drive Auto Receivables Trust Series 2012-5 Class D | | | 3.30 | | | | 9-17-2018 | | | | 95,000 | | | | 98,517 | |
TAL Advantage LLC Series 2013-1A Class A 144A | | | 2.83 | | | | 2-22-2038 | | | | 147,500 | | | | 147,997 | |
| | | | |
Total Asset-Backed Securities (Cost $753,278) | | | | | | | | | | | | | | | 750,150 | |
| | | | | | | | | | | | | | | | |
| | | | |
Corporate Bonds and Notes: 30.62% | | | | | | | | | | | | | | | | |
| | | | |
Consumer Discretionary: 9.08% | | | | | | | | | | | | | | | | |
| | | | |
| Automobiles: 1.05% | | | | | | | | | | | | | | | | |
Ford Motor Company | | | 7.45 | | | | 7-16-2031 | | | | 200,000 | | | | 266,351 | |
| | | | | | | | | | | | | | | | |
| | | | |
| Diversified Consumer Services: 0.73% | | | | | | | | | | | | | | | | |
Service Corporation International | | | 8.00 | | | | 11-15-2021 | | | | 150,000 | | | | 183,750 | |
| | | | | | | | | | | | | | | | |
| | | | |
| Hotels, Restaurants & Leisure: 2.51% | | | | | | | | | | | | | | | | |
CityCenter Holdings LLC ¥ | | | 10.75 | | | | 1-15-2017 | | | | 250,000 | | | | 276,563 | |
Darden Restaurants Incorporated | | | 3.35 | | | | 11-1-2022 | | | | 200,000 | | | | 194,079 | |
NAI Entertainment Holdings LLC 144A | | | 8.25 | | | | 12-15-2017 | | | | 150,000 | | | | 162,750 | |
| | | | |
| | | | | | | | | | | | | | | 633,392 | |
| | | | | | | | | | | | | | | | |
| | | | |
| Household Durables: 1.03% | | | | | | | | | | | | | | | | |
Mohawk Industries Incorporated | | | 3.85 | | | | 2-1-2023 | | | | 250,000 | | | | 261,065 | |
| | | | | | | | | | | | | | | | |
| | | | |
| Internet & Catalog Retail: 0.78% | | | | | | | | | | | | | | | | |
Expedia Incorporated | | | 5.95 | | | | 8-15-2020 | | | | 175,000 | | | | 196,095 | |
| | | | | | | | | | | | | | | | |
| | | | |
| Media: 2.98% | | | | | | | | | | | | | | | | |
Cinemark USA Incorporated 144A | | | 5.13 | | | | 12-15-2022 | | | | 200,000 | | | | 207,000 | |
DIRECTV Holdings LLC | | | 3.80 | | | | 3-15-2022 | | | | 200,000 | | | | 210,094 | |
DISH DBS Corporation | | | 6.75 | | | | 6-1-2021 | | | | 150,000 | | | | 162,000 | |
Lamar Media Corporation | | | 5.88 | | | | 2-1-2022 | | | | 150,000 | | | | 164,063 | |
Lynx I Corporation 144A | | | 5.38 | | | | 4-15-2021 | | | | 5,000 | | | | 5,338 | |
Lynx II Corporation 144A | | | 6.38 | | | | 4-15-2023 | | | | 5,000 | | | | 5,413 | |
| | | | |
| | | | | | | | | | | | | | | 753,908 | |
| | | | | | | | | | | | | | | | |
| | | | |
Consumer Staples: 2.68% | | | | | | | | | | | | | | | | |
| | | | |
| Beverages: 0.80% | | | | | | | | | | | | | | | | |
Constellation Brands Incorporated | | | 7.25 | | | | 9-1-2016 | | | | 175,000 | | | | 201,250 | |
| | | | | | | | | | | | | | | | |
| | | | |
| Food Products: 1.12% | | | | | | | | | | | | | | | | |
Dean Foods Company | | | 7.00 | | | | 6-1-2016 | | | | 250,000 | | | | 283,750 | |
| | | | | | | | | | | | | | | | |
| | | | |
| Tobacco: 0.76% | | | | | | | | | | | | | | | | |
Lorillard Tobacco Company | | | 8.13 | | | | 6-23-2019 | | | | 150,000 | | | | 192,064 | |
| | | | | | | | | | | | | | | | |
| | | | |
Energy: 4.72% | | | | | | | | | | | | | | | | |
| | | | |
| Energy Equipment & Services: 1.64% | | | | | | | | | | | | | | | | |
NGPL PipeCo LLC 144A | | | 7.77 | | | | 12-15-2037 | | | | 250,000 | | | | 250,625 | |
PHI Incorporated | | | 8.63 | | | | 10-15-2018 | | | | 150,000 | | | | 164,063 | |
| | | | |
| | | | | | | | | | | | | | | 414,688 | |
| | | | | | | | | | | | | | | | |
The accompanying notes are an integral part of these financial statements.
| | | | |
| 8 | | Wells Fargo Advantage Strategic Income Fund | | Portfolio of investments—April 30, 2013 (unaudited) |
| | | | | | | | | | | | | | | | |
| Security name | | Interest rate | | | Maturity date | | | Principal | | | Value | |
| | | | | | | | | | | | | | | | |
| | | | |
| Oil, Gas & Consumable Fuels: 3.08% | | | | | | | | | | | | | | | | |
Denbury Resources Incorporated | | | 6.38 | % | | | 8-15-2021 | | | $ | 150,000 | | | $ | 167,250 | |
Energy Transfer Partners LP | | | 5.20 | | | | 2-1-2022 | | | | 125,000 | | | | 142,935 | |
Sabine Pass LNG LP 144A | | | 5.63 | | | | 2-1-2021 | | | | 25,000 | | | | 25,875 | |
Sabine Pass LNG LP 144A | | | 5.63 | | | | 4-15-2023 | | | | 10,000 | | | | 10,275 | |
Sabine Pass LNG LP 144A | | | 6.50 | | | | 11-1-2020 | | | | 250,000 | | | | 268,125 | |
Suburban Propane Partners LP | | | 7.38 | | | | 3-15-2020 | | | | 150,000 | �� | | | 163,125 | |
| | | | |
| | | | | | | | | | | | | | | 777,585 | |
| | | | | | | | | | | | | | | | |
| | | | |
Financials: 3.67% | | | | | | | | | | | | | | | | |
| | | | |
| Capital Markets: 0.80% | | | | | | | | | | | | | | | | |
Lazard Group LLC | | | 6.85 | | | | 6-15-2017 | | | | 175,000 | | | | 201,297 | |
| | | | | | | | | | | | | | | | |
| | | | |
| Consumer Finance: 0.60% | | | | | | | | | | | | | | | | |
HSBC Finance Corporation | | | 6.68 | | | | 1-15-2021 | | | | 125,000 | | | | 151,276 | |
| | | | | | | | | | | | | | | | |
| | | | |
| Diversified Financial Services: 1.03% | | | | | | | | | | | | | | | | |
General Electric Capital Corporation | | | 5.30 | | | | 2-11-2021 | | | | 225,000 | | | | 261,424 | |
| | | | | | | | | | | | | | | | |
| | | | |
| Insurance: 0.44% | | | | | | | | | | | | | | | | |
Prudential Financial Incorporated ± | | | 5.20 | | | | 3-15-2044 | | | | 110,000 | | | | 111,925 | |
| | | | | | | | | | | | | | | | |
| | | | |
| REITs: 0.80% | | | | | | | | | | | | | | | | |
American Tower Corporation | | | 3.50 | | | | 1-31-2023 | | | | 200,000 | | | | 202,083 | |
| | | | | | | | | | | | | | | | |
| | | | |
Health Care: 1.94% | | | | | | | | | | | | | | | | |
| | | | |
| Health Care Providers & Services: 1.94% | | | | | | | | | | | | | | | | |
Coventry Health Care Incorporated | | | 5.45 | | | | 6-15-2021 | | | | 225,000 | | | | 268,141 | |
Health Management Associates Incorporated | | | 6.13 | | | | 4-15-2016 | | | | 200,000 | | | | 220,500 | |
| | | | |
| | | | | | | | | | | | | | | 488,641 | |
| | | | | | | | | | | | | | | | |
| | | | |
Industrials: 1.48% | | | | | | | | | | | | | | | | |
| | | | |
| Air Freight & Logistics: 0.65% | | | | | | | | | | | | | | | | |
Bristow Group Incorporated | | | 6.25 | | | | 10-15-2022 | | | | 150,000 | | | | 163,500 | |
| | | | | | | | | | | | | | | | |
| | | | |
| Transportation Infrastructure: 0.83% | | | | | | | | | | | | | | | | |
Penske Truck Leasing 144A | | | 4.25 | | | | 1-17-2023 | | | | 200,000 | | | | 211,014 | |
| | | | | | | | | | | | | | | | |
| | | | |
Information Technology: 1.87% | | | | | | | | | | | | | | | | |
| | | | |
| Computers & Peripherals: 1.00% | | | | | | | | | | | | | | | | |
NCR Corporation 144A | | | 5.00 | | | | 7-15-2022 | | | | 250,000 | | | | 253,125 | |
| | | | | | | | | | | | | | | | |
| | | | |
| Internet Software & Services: 0.06% | | | | | | | | | | | | | | | | |
Verisign Incorporated 144A | | | 4.63 | | | | 5-1-2023 | | | | 15,000 | | | | 15,375 | |
| | | | | | | | | | | | | | | | |
| | | | |
| IT Services: 0.81% | | | | | | | | | | | | | | | | |
First Data Corporation | | | 11.25 | | | | 3-31-2016 | | | | 200,000 | | | | 203,500 | |
| | | | | | | | | | | | | | | | |
The accompanying notes are an integral part of these financial statements.
| | | | | | |
| Portfolio of investments—April 30, 2013 (unaudited) | | Wells Fargo Advantage Strategic Income Fund | | | 9 | |
| | | | | | | | | | | | | | | | |
| Security name | | Interest rate | | | Maturity date | | | Principal | | | Value | |
| | | | | | | | | | | | | | | | |
| | | | |
Telecommunication Services: 4.75% | | | | | | | | | | | | | | | | |
| | | | |
| Diversified Telecommunication Services: 1.63% | | | | | | | | | | | | | | | | |
Cincinnati Bell Incorporated | | | 8.25 | % | | | 10-15-2017 | | | $ | 250,000 | | | $ | 267,500 | |
GCI Incorporated | | | 6.75 | | | | 6-1-2021 | | | | 150,000 | | | | 143,250 | |
| | | | |
| | | | | | | | | | | | | | | 410,750 | |
| | | | | | | | | | | | | | | | |
| | | | |
| Wireless Telecommunication Services: 3.12% | | | | | | | | | | | | | | | | |
MetroPCS Wireless Incorporated | | | 6.63 | | | | 11-15-2020 | | | | 150,000 | | | | 162,375 | |
Motorola Solutions Incorporated | | | 3.75 | | | | 5-15-2022 | | | | 200,000 | | | | 208,202 | |
Sprint Capital Corporation | | | 6.88 | | | | 11-15-2028 | | | | 250,000 | | | | 255,625 | |
TW Telecommunications Holdings Incorporated | | | 5.38 | | | | 10-1-2022 | | | | 155,000 | | | | 162,363 | |
| | | | |
| | | | | | | | | | | | | | | 788,565 | |
| | | | | | | | | | | | | | | | |
| | | | |
Utilities: 0.43% | | | | | | | | | | | | | | | | |
| | | | |
| Independent Power Producers & Energy Traders: 0.43% | | | | | | | | | | | | | | | | |
NSG Holdings LLC 144A(i) | | | 7.75 | | | | 12-15-2025 | | | | 100,000 | | | | 107,500 | |
| | | | | | | | | | | | | | | | |
| | | | |
Total Corporate Bonds and Notes (Cost $7,642,264) | | | | | | | | | | | | | | | 7,733,873 | |
| | | | | | | | | | | | | | | | |
| | | | |
Foreign Government Bonds@: 24.27% | | | | | | | | | | | | | | | | |
Brazil (BRL) | | | 8.50 | | | | 1-5-2024 | | | | 800,000 | | | | 445,033 | |
Brazil (BRL) | | | 10.00 | | | | 1-1-2017 | | | | 875,000 | | | | 465,642 | |
Hungary (HUF) | | | 6.75 | | | | 8-22-2014 | | | | 62,500,000 | | | | 283,652 | |
Hungary (HUF) | | | 6.75 | | | | 11-24-2017 | | | | 63,000,000 | | | | 297,619 | |
Indonesia (IDR) | | | 5.25 | | | | 5-15-2018 | | | | 2,850,000,000 | | | | 297,549 | |
Indonesia (IDR) | | | 8.25 | | | | 6-15-2032 | | | | 1,475,000,000 | | | | 181,921 | |
Malaysia (MYR) | | | 3.26 | | | | 3-1-2018 | | | | 350,000 | | | | 115,603 | |
Malaysia (MYR) | | | 4.26 | | | | 9-15-2016 | | | | 900,000 | | | | 307,638 | |
Mexico (MXN) | | | 7.25 | | | | 12-15-2016 | | | | 3,600,000 | | | | 328,065 | |
Mexico (MXN) | | | 8.50 | | | | 11-18-2038 | | | | 3,500,000 | | | | 416,517 | |
Poland (PLN) | | | 4.00 | | | | 10-25-2023 | | | | 1,850,000 | | | | 623,995 | |
Republic of South Africa (ZAR) | | | 7.75 | | | | 2-28-2023 | | | | 5,000,000 | | | | 617,133 | |
Romania (RON) | | | 6.00 | | | | 4-30-2016 | | | | 400,000 | | | | 125,256 | |
Russia (RUB) | | | 6.20 | | | | 1-31-2018 | | | | 30,850,000 | | | | 1,000,772 | |
Turkey (TRY) | | | 6.30 | | | | 2-14-2018 | | | | 360,000 | | | | 204,624 | |
Turkey (TRY) | | | 9.00 | | | | 3-8-2017 | | | | 675,000 | | | | 420,192 | |
| | | | |
Total Foreign Government Bonds (Cost $6,079,484) | | | | | | | | | | | | | | | 6,131,211 | |
| | | | | | | | | | | | | | | | |
| | | | |
Municipal Obligations: 1.54% | | | | | | | | | | | | | | | | |
| | | | |
| Idaho: 0.52% | | | | | | | | | | | | | | | | |
Idaho Housing & Finance Association Legacy Public Charter School (Miscellaneous Revenue) | | | 7.00 | | | | 5-1-2017 | | | | 130,000 | | | | 130,897 | |
| | | | | | | | | | | | | | | | |
| | | | |
| Texas: 1.02% | | | | | | | | | | | | | | | | |
North Texas Tollway Authority (Transportation Revenue) | | | 8.91 | | | | 2-1-2030 | | | | 210,000 | | | | 258,164 | |
| | | | | | | | | | | | | | | | |
| | | | |
Total Municipal Obligations (Cost $379,524) | | | | | | | | | | | | | | | 389,061 | |
| | | | | | | | | | | | | | | | |
The accompanying notes are an integral part of these financial statements.
| | | | |
| 10 | | Wells Fargo Advantage Strategic Income Fund | | Portfolio of investments—April 30, 2013 (unaudited) |
| | | | | | | | | | | | | | | | |
| Security name | | Interest rate | | | Maturity date | | | Principal | | | Value | |
| | | | | | | | | | | | | | | | |
| | | | |
Non-Agency Mortgage Backed Securities: 9.96% | | | | | | | | | | | | | | | | |
Americold LLC Trust Series 2010-ARTA Class B 144A | | | 6.03 | % | | | 1-14-2029 | | | $ | 200,000 | | | $ | 241,441 | |
BB-UBS Trust Series 2012-TFT Class C 144A± | | | 3.58 | | | | 6-5-2030 | | | | 150,000 | | | | 152,039 | |
Commercial Mortgage Trust Series 2011-THL Class B 144A | | | 4.55 | | | | 6-9-2028 | | | | 160,000 | | | | 164,475 | |
Commercial Mortgage Trust Series 2012-LC4 Class B ± | | | 4.93 | | | | 12-10-2044 | | | | 175,000 | | | | 201,183 | |
FREMF Mortgage Trust Series 2011-K15 Class B 144A± | | | 4.93 | | | | 8-25-2044 | | | | 250,000 | | | | 281,245 | |
FREMF Mortgage Trust Series 2011-K703 Class B 144A± | | | 4.89 | | | | 7-25-2044 | | | | 250,000 | | | | 280,427 | |
FREMF Mortgage Trust Series 2013-K502 Class B 144A± | | | 2.84 | | | | 3-25-2045 | | | | 250,000 | | | | 256,375 | |
GS Mortgage Securities Trust Series 2012 Class B 144A | | | 3.41 | | | | 12-10-2030 | | | | 250,000 | | | | 253,813 | |
JPMorgan Chase Commercial Mortgage Securities Trust Series 2011-C5 Class B 144A± | | | 5.49 | | | | 8-15-2046 | | | | 250,000 | | | | 293,286 | |
Morgan Stanley Capital I Series 2007-HQ11 Class AM ± | | | 5.48 | | | | 2-12-2044 | | | | 25,000 | | | | 28,646 | |
Morgan Stanley Trust Series 2012-C5 Class B ± | | | 4.44 | | | | 8-15-2045 | | | | 250,000 | | | | 279,575 | |
Morgan Stanley Trust Series 2013-C7 Class C ± | | | 4.33 | | | | 2-15-2046 | | | | 80,000 | | | | 84,445 | |
| | | | |
Total Non-Agency Mortgage Backed Securities (Cost $2,487,630) | | | | | | | | | | | | | | | 2,516,950 | |
| | | | | | | | | | | | | | | | |
| | | | |
Term Loans: 24.14% | | | | | | | | | | | | | | | | |
Albertson’s LLC | | | 5.75 | | | | 3-21-2016 | | | | 30,000 | | | | 30,321 | |
Allison Transmission Incorporated | | | 3.21 | | | | 8-7-2017 | | | | 149,625 | | | | 151,121 | |
AMC Entertainment Incorporated < | | | 0.00 | | | | 4-30-2020 | | | | 10,000 | | | | 10,065 | |
Applied Systems Incorporated < | | | 0.00 | | | | 6-8-2017 | | | | 10,000 | | | | 10,066 | |
Arris Group Incorporation | | | 3.50 | | | | 2-7-2020 | | | | 55,000 | | | | 55,035 | |
Bausch & Lomb Incorporated < | | | 0.00 | | | | 12-25-2016 | | | | 25,000 | | | | 25,177 | |
Capital Automotive LP | | | 4.25 | | | | 3-27-2019 | | | | 134,839 | | | | 135,821 | |
CBAC Borrower LLC < | | | 0.00 | | | | 4-24-2020 | | | | 10,000 | | | | 9,950 | |
CDW LLC < | | | 0.00 | | | | 4-29-2020 | | | | 60,000 | | | | 60,113 | |
Centaur LLC | | | 5.25 | | | | 2-20-2019 | | | | 60,000 | | | | 60,900 | |
Charter Communications < | | | 0.00 | | | | 1-19-2021 | | | | 25,000 | | | | 24,969 | |
Community Health Systems Incorporated | | | 3.79 | | | | 1-25-2017 | | | | 150,000 | | | | 151,370 | |
Cricket Communications Incorporated | | | 4.75 | | | | 10-10-2019 | | | | 249,375 | | | | 250,622 | |
Cricket Communications Incorporated | | | 4.75 | | | | 2-21-2020 | | | | 10,000 | | | | 10,041 | |
Crown Castle International Corporation | | | 3.25 | | | | 1-31-2019 | | | | 249,369 | | | | 250,531 | |
CSC Holdings Incorporated | | | 2.70 | | | | 4-15-2020 | | | | 130,000 | | | | 129,631 | |
DineEquity Incorporated | | | 3.75 | | | | 10-19-2017 | | | | 249,364 | | | | 252,833 | |
Dole Food Company Incorporated < | | | 0.00 | | | | 4-1-2020 | | | | 10,000 | | | | 10,063 | |
Dunkin’ Brands Incorporated | | | 3.75 | | | | 2-11-2020 | | | | 249,324 | | | | 251,705 | |
Federal-Mogul Corporation | | | 2.14 | | | | 12-27-2014 | | | | 165,105 | | | | 156,410 | |
Federal-Mogul Corporation | | | 2.14 | | | | 12-27-2015 | | | | 84,237 | | | | 79,801 | |
Focus Brands Incorporated < | | | 0.00 | | | | 2-21-2018 | | | | 30,000 | | | | 30,188 | |
HCA Incorporated < | | | 0.00 | | | | 5-1-2018 | | | | 100,000 | | | | 100,181 | |
Hubbard Radio LLC | | | 4.50 | | | | 4-29-2017 | | | | 25,000 | | | | 25,406 | |
Intelsat Jackson Holdings Limited | | | 4.25 | | | | 4-2-2018 | | | | 249,373 | | | | 252,491 | |
KAR Auction Services Incorporated | | | 3.75 | | | | 5-19-2017 | | | | 243,809 | | | | 247,030 | |
Level 3 Financing Incorporated | | | 5.25 | | | | 8-1-2019 | | | | 250,000 | | | | 253,250 | |
MetroPCS Wireless Incorporated | | | 4.88 | | | | 3-17-2018 | | | | 199,491 | | | | 199,533 | |
MGM Resorts International | | | 4.25 | | | | 12-20-2019 | | | | 249,375 | | | | 252,856 | |
MTL Publishing LLC | | | 4.25 | | | | 6-29-2018 | | | | 65,000 | | | | 65,785 | |
Multiplan Incorporated | | | 4.00 | | | | 8-26-2017 | | | | 38,621 | | | | 38,999 | |
National Cinemedia LLC < | | | 0.00 | | | | 11-20-2019 | | | | 45,000 | | | | 45,000 | |
Nielsen Finance LLC | | | 2.95 | | | | 5-2-2016 | | | | 249,375 | | | | 252,492 | |
NRG Energy Incorporated B | | | 3.25 | | | | 7-2-2018 | | | | 249,365 | | | | 252,223 | |
The accompanying notes are an integral part of these financial statements.
| | | | | | |
| Portfolio of investments—April 30, 2013 (unaudited) | | Wells Fargo Advantage Strategic Income Fund | | | 11 | |
| | | | | | | | | | | | | | | | |
| Security name | | Interest rate | | | Maturity date | | | Principal | | | Value | |
| | | | | | | | | | | | | | | | |
| | | | |
Term Loans (continued) | | | | | | | | | | | | | | | | |
Nusil Technology LLC | | | 5.00 | % | | | 4-7-2017 | | | $ | 4,986 | | | $ | 5,013 | |
Pep Boys-Manny, Moe & Jack | | | 5.00 | | | | 10-11-2018 | | | | 199,500 | | | | 202,233 | |
Philadelphia Energy Solutions LLC < | | | 0.00 | | | | 3-19-2018 | | | | 25,000 | | | | 25,438 | |
Regal Cinemas Corporation < | | | 0.00 | | | | 8-23-2017 | | | | 250,000 | | | | 251,458 | |
Riverbed Technology Incorporation | | | 4.00 | | | | 12-18-2019 | | | | 182,603 | | | | 185,799 | |
SBA Senior Finance II LLC | | | 3.75 | | | | 9-20-2019 | | | | 54,986 | | | | 55,278 | |
SRAM LLC First Lien < | | | 0.00 | | | | 6-7-2018 | | | | 10,000 | | | | 10,063 | |
Starwood Property Trust Incorporated | | | 3.50 | | | | 2-11-2020 | | | | 25,000 | | | | 25,063 | |
Sungard Data Systems Incorporated | | | 4.50 | | | | 1-31-2020 | | | | 149,625 | | | | 151,403 | |
Supervalu Incorporated | | | 6.25 | | | | 3-21-2019 | | | | 25,000 | | | | 25,372 | |
Syniverse Holdings Incorporated | | | 1.00 | | | | 4-23-2019 | | | | 250,000 | | | | 250,783 | |
Tallgrass Energy Partners LP | | | 5.71 | | | | 11-13-2018 | | | | 199,500 | | | | 200,747 | |
Texas Competitive Electric Holdings LLC | | | 3.73 | | | | 10-10-2014 | | | | 400,000 | | | | 300,332 | |
The Geo Group Incorporated < | | | 0.00 | | | | 3-31-2020 | | | | 25,000 | | | | 25,115 | |
United Surgical Partners International Incorporated < | | | 0.00 | | | | 4-3-2019 | | | | 10,000 | | | | 9,950 | |
Valeant Pharmaceuticals International Incorporated Series C < | | | 0.00 | | | | 12-11-2019 | | | | 200,000 | | | | 202,200 | |
Vertafore Incorporated | | | 4.25 | | | | 10-2-2019 | | | | 15,000 | | | | 15,131 | |
Washington Multifamily Laundry Systems LLC | | | 5.25 | | | | 2-21-2019 | | | | 25,000 | | | | 25,250 | |
| | | | |
Total Term Loans (Cost $6,102,165) | | | | | | | | | | | | | | | 6,098,607 | |
| | | | | | | | | | | | | | | | |
| | | | |
Yankee Corporate Bonds and Notes: 3.31% | | | | | | | | | | | | | | | | |
| | | | |
Consumer Discretionary: 0.81% | | | | | | | | | | | | | | | | |
| | | | |
| Media: 0.81% | | | | | | | | | | | | | | | | |
WPP Finance 2010 Company | | | 3.63 | | | | 9-7-2022 | | | | 200,000 | | | | 203,843 | |
| | | | | | | | | | | | | | | | |
| | | | |
Financials: 0.64% | | | | | | | | | | | | | | | | |
| | | | |
| Commercial Banks: 0.64% | | | | | | | | | | | | | | | | |
Banco de Brasil 144A | | | 5.88 | | | | 1-26-2022 | | | | 150,000 | | | | 163,125 | |
| | | | | | | | | | | | | | | | |
| | | | |
Industrials: 1.54% | | | | | | | | | | | | | | | | |
| | | | |
| Building Products: 1.03% | | | | | | | | | | | | | | | | |
ArcelorMittal | | | 4.25 | | | | 8-5-2015 | | | | 250,000 | | | | 261,205 | |
| | | | | | | | | | | | | | | | |
| | | | |
| Construction & Engineering: 0.51% | | | | | | | | | | | | | | | | |
Odebrecht Finance Limited 144A | | | 4.38 | | | | 4-25-2025 | | | | 130,000 | | | | 128,700 | |
| | | | | | | | | | | | | | | | |
| | | | |
Telecommunication Services: 0.32% | | | | | | | | | | | | | | | | |
| | | | |
| Diversified Telecommunication Services: 0.32% | | | | | | | | | | | | | | | | |
Intelsat Bermuda Limited | | | 11.25 | | | | 2-4-2017 | | | | 75,000 | | | | 79,875 | |
| | | | | | | | | | | | | | | | |
| | | | |
Total Yankee Corporate Bonds and Notes (Cost $828,234) | | | | | | | | | | | | | | | 836,748 | |
| | | | | | | | | | | | | | | | |
| | | | |
| | | Yield | | | | | | Shares | | | | |
| | | | |
Short-Term Investments: 5.97% | | | | | | | | | | | | | | | | |
| | | | |
| Investment Companies: 5.75% | | | | | | | | | | | | | | | | |
Wells Fargo Advantage Cash Investment Money Market Fund, Select Class (l)(u)## | | | 0.13 | | | | | | | | 1,451,582 | | | | 1,451,582 | |
| | | | | | | | | | | | | | | | |
The accompanying notes are an integral part of these financial statements.
| | | | |
| 12 | | Wells Fargo Advantage Strategic Income Fund | | Portfolio of investments—April 30, 2013 (unaudited) |
| | | | | | | | | | | | | | | | |
| Security name | | Yield | | | Maturity date | | | Principal | | | Value | |
| | | | | | | | | | | | | | | | |
| | | | |
| U.S. Treasury Securities: 0.22% | | | | | | | | | | | | | | | | |
U.S. Treasury Bill #(z) | | | 0.02 | % | | | 6-20-2013 | | | $ | 50,000 | | | $ | 49,998 | |
U.S. Treasury Bill #(z) | | | 0.02 | | | | 6-20-2013 | | | | 5,000 | | | | 5,000 | |
| | | | |
| | | | | | | | | | | | | | | 54,998 | |
| | | | | | | | | | | | | | | | |
| | | | |
Total Short-Term Investments (Cost $1,506,578) | | | | | | | | | | | | | | | 1,506,580 | |
| | | | | | | | | | | | | | | | |
| | | | | | | | |
| | |
Total investments in securities (Cost $25,779,157) * | | | 102.78 | % | | | 25,963,180 | |
Other assets and liabilities, net | | | (2.78 | ) | | | (703,348 | ) |
| | | | | | | | |
| Total net assets | | | 100.00 | % | | $ | 25,259,832 | |
| | | | | | | | |
| 144A | Security that may be resold to “qualified institutional buyers” under Rule 144A or security offered pursuant to Section 4(2) of the Securities Act of 1933, as amended. |
| ¥ | A payment-in-kind (PIK) security is a security in which the issuer may make interest or dividend payments in cash or additional securities. These additional securities generally have the same terms as the original holdings. |
| ± | Variable rate investment. The rate shown is the rate in effect at period end. |
| @ | Foreign bond principal is denominated in local currency. |
| < | All or a portion of the position represents an unfunded loan commitment. |
| (l) | Investment in an affiliate |
| (u) | Rate shown is the 7-day annualized yield at period end. |
| # | All or a portion of this security is segregated as collateral for investments in derivative instruments. |
| ## | All or a portion of this security has been segregated for unfunded loans. |
| (z) | Zero coupon security. Rate represents yield to maturity at time of purchase. |
| * | Cost for federal income tax purposes is $25,779,766 and unrealized appreciation (depreciation) consists of: |
| | | | |
Gross unrealized appreciation | | $ | 309,201 | |
Gross unrealized depreciation | | | (125,787 | ) |
| | | | |
Net unrealized appreciation | | $ | 183,414 | |
| | | | | | |
| Statement of assets and liabilities—April 30, 2013 (unaudited) | | Wells Fargo Advantage Strategic Income Fund | | | 13 | |
| | | | |
| | | | |
| |
Assets | | | | |
Investments | | | | |
In unaffiliated securities, at value (see cost below) | | $ | 24,511,598 | |
In affiliated securities, at value (see cost below) | | | 1,451,582 | |
| | | | |
Total investments, at value (see cost below) | | | 25,963,180 | |
Foreign currency, at value (see cost below) | | | 28,892 | |
Receivable for investments sold | | | 22,825 | |
Receivable for interest | | | 270,615 | |
Receivable for daily variation margin on open futures contracts | | | 4,266 | |
Unrealized gains on forward foreign currency contracts | | | 27,736 | |
Receivable from adviser | | | 4,581 | |
Prepaid expenses and other assets | | | 58,549 | |
| | | | |
Total assets | | | 26,380,644 | |
| | | | |
| |
Liabilities | | | | |
Payable for investments purchased | | | 1,100,781 | |
Unrealized losses on forward foreign currency contracts | | | 15,142 | |
Distribution fees payable | | | 314 | |
Due to other related parties | | | 2,753 | |
Accrued expenses and other liabilities | | | 1,822 | |
| | | | |
Total liabilities | | | 1,120,812 | |
| | | | |
Total net assets | | $ | 25,259,832 | |
| | | | |
| |
NET ASSETS CONSIST OF | | | | |
Paid-in capital | | $ | 25,155,941 | |
Undistributed net investment income | | | 41,001 | |
Accumulated net realized losses on investments | | | (34,395 | ) |
Net unrealized gains on investments | | | 97,285 | |
| | | | |
Total net assets | | $ | 25,259,832 | |
| | | | |
| |
COMPUTATION OF NET ASSET VALUE AND OFFERING PRICE PER SHARE1 | | | | |
Net assets – Class A | | $ | 506,818 | |
Shares outstanding – Class A | | | 50,480 | |
Net asset value per share – Class A | | | $10.04 | |
Maximum offering price per share – Class A2 | | | $10.51 | |
Net assets – Class C | | $ | 503,852 | |
Shares outstanding – Class C | | | 50,202 | |
Net asset value per share – Class C | | | $10.04 | |
Net assets – Administrator Class | | $ | 504,970 | |
Shares outstanding – Administrator Class | | | 50,285 | |
Net asset value per share – Administrator Class | | | $10.04 | |
Net assets – Institutional Class | | $ | 23,744,192 | |
Shares outstanding – Institutional Class | | | 2,364,676 | |
Net asset value per share – Institutional Class | | | $10.04 | |
| |
Investments in unaffiliated securities, at cost | | $ | 24,327,575 | |
| | | | |
Investments in affiliated securities, at cost | | $ | 1,451,582 | |
| | | | |
Total investments, at cost | | $ | 25,779,157 | |
| | | | |
Foreign currency, at cost | | $ | 28,777 | |
| | | | |
| 1. | The Fund has an unlimited number of authorized shares. |
| 2. | Maximum offering price is computed as 100/95.50 of net asset value. On investments of $50,000 or more, the offering price is reduced. |
The accompanying notes are an integral part of these financial statements.
| | | | |
| 14 | | Wells Fargo Advantage Strategic Income Fund | | Statement of operations—period ended April 30, 20131 (unaudited) |
| | | | |
| | | | |
| |
Investment income | | | | |
Interest* | | $ | 231,870 | |
Income from affiliated securities | | | 1,695 | |
| | | | |
Total investment income | | | 233,565 | |
| | | | |
| |
Expenses | | | | |
Advisory fee | | | 29,021 | |
Administration fees | | | | |
Fund level | | | 3,055 | |
Class A | | | 195 | |
Class C | | | 196 | |
Administrator Class | | | 121 | |
Institutional Class | | | 4,596 | |
Shareholder servicing fees | | | | |
Class A | | | 305 | |
Class C | | | 306 | |
Administrator Class | | | 304 | |
Distribution fees | | | | |
Class C | | | 921 | |
Custody and accounting fees | | | 3,163 | |
Professional fees | | | 14,589 | |
Registration fees | | | 14,066 | |
Shareholder report expenses | | | 5,762 | |
Trustees’ fees and expenses | | | 2,934 | |
Other fees and expenses | | | 1,581 | |
| | | | |
Total expenses | | | 81,115 | |
Less: Fee waivers and/or expense reimbursements | | | (42,620 | ) |
| | | | |
Net expenses | | | 38,495 | |
| | | | |
Net investment income | | | 195,070 | |
| | | | |
| |
REALIZED AND UNREALIZED GAINS (LOSSES) ON INVESTMENTS | | | | |
| |
Net realized losses on: | | | | |
Unaffiliated securities | | | (6,371 | ) |
Futures transactions | | | (28,024 | ) |
| | | | |
Net realized losses on investments | | | (34,395 | ) |
| | | | |
| |
Net change in unrealized gains (losses) on: | | | | |
Unaffiliated securities | | | 183,460 | |
Futures transactions | | | (98,769 | ) |
Forward foreign currency contract transactions | | | 12,594 | |
| | | | |
Net change in unrealized gains (losses) on investments | | | 97,285 | |
| | | | |
Net realized and unrealized gains (losses) on investments | | | 62,890 | |
| | | | |
Net increase in net assets resulting from operations | | $ | 257,960 | |
| | | | |
| |
* Net of foreign interest withholding taxes in the amount of | | | $2,371 | |
| 1. | For the period from January 31, 2013 (commencement of operations) to April 30, 2013 |
The accompanying notes are an integral part of these financial statements.
| | | | | | |
| Statement of changes in net assets—period ended April 30, 20131 (unaudited) | | Wells Fargo Advantage Strategic Income Fund | | | 15 | |
| | | | | | | | |
| | | | |
| | |
Operations | | | | | | | | |
Net investment income | | | | | | $ | 195,070 | |
Net realized losses on investments | | | | | | | (34,395 | ) |
Net change in unrealized gains (losses) on investments | | | | | | | 97,285 | |
| | | | | | | | |
Net increase in net assets resulting from operations | | | | | | | 257,960 | |
| | | | | | | | |
| | |
Distributions to shareholders from | | | | | | | | |
Net investment income | | | | | | | | |
Class A | | | | | | | (2,789 | ) |
Class C | | | | | | | (2,033 | ) |
Administrator Class | | | | | | | (2,839 | ) |
Institutional Class | | | | | | | (146,408 | ) |
| | | | | | | | |
Total distributions to shareholders | | | | | | | (154,069 | ) |
| | | | | | | | |
| | |
| | | Shares | | | | | |
Capital share transactions | | | | | | | | |
Proceeds from shares sold | | | | | | | | |
Class A | | | 50,201 | | | | 502,000 | |
Class C | | | 51,574 | | | | 515,645 | |
Administrator Class | | | 50,000 | | | | 500,000 | |
Institutional Class | | | 2,350,000 | | | | 23,500,000 | |
| | | | | | | | |
| | | | | | | 25,017,645 | |
| | | | | | | | |
Reinvestment of distributions | | | | | | | | |
Class A | | | 279 | | | | 2,789 | |
Class C | | | 204 | | | | 2,033 | |
Administrator Class | | | 285 | | | | 2,839 | |
Institutional Class | | | 14,676 | | | | 146,408 | |
| | | | | | | | |
| | | | | | | 154,069 | |
| | | | | | | | |
Payment for shares redeemed | | | | | | | | |
Class C | | | (1,576 | ) | | | (15,773 | ) |
| | | | | | | | |
Net increase in net assets resulting from capital share transactions | | | | | | | 25,155,941 | |
| | | | | | | | |
Total increase in net assets | | | | | | | 25,259,832 | |
| | | | | | | | |
| | |
Net assets | | | | | | | | |
Beginning of period | | | | | | | 0 | |
| | | | | | | | |
End of period | | | | | | $ | 25,259,832 | |
| | | | | | | | |
Undistributed net investment income | | | | | | $ | 41,001 | |
| | | | | | | | |
| 1. | For the period from January 31, 2013 (commencement of operations) to April 30, 2013 |
The accompanying notes are an integral part of these financial statements.
| | | | |
| 16 | | Wells Fargo Advantage Strategic Income Fund | | Financial highlights |
(For a share outstanding throughout the period)
| | | | |
| CLASS A | | Period ended April 30, 20131
(unaudited) | |
Net asset value, beginning of period | | $ | 10.00 | |
Net investment income | | | 0.07 | |
Net realized and unrealized gains (losses) on investments | | | 0.03 | |
| | | | |
Total from investment operations | | | 0.10 | |
Distributions to shareholders from | | | | |
Net investment income | | | (0.06 | ) |
Net asset value, end of period | | $ | 10.04 | |
Total return2 | | | 0.96 | % |
Ratios to average net assets (annualized) | | | | |
Gross expenses | | | 1.62 | % |
Net expenses | | | 0.90 | % |
Net investment income | | | 2.93 | % |
Supplemental data | | | | |
Portfolio turnover rate | | | 11 | % |
Net assets, end of period (000s omitted) | | | $507 | |
| 1. | For the period from January 31, 2013 (commencement of class operations) to April 30, 2013 |
| 2. | Total return calculations do not include any sales charges. Returns for periods of less than one year are not annualized. |
The accompanying notes are an integral part of these financial statements.
| | | | | | |
| Financial highlights | | Wells Fargo Advantage Strategic Income Fund | | | 17 | |
(For a share outstanding throughout the period)
| | | | |
| CLASS C | | Period ended
April 30, 20131
(unaudited) | |
Net asset value, beginning of period | | $ | 10.00 | |
Net investment income | | | 0.05 | |
Net realized and unrealized gains (losses) on investments | | | 0.03 | |
| | | | |
Total from investment operations | | | 0.08 | |
Distributions to shareholders from | | | | |
Net investment income | | | (0.04 | ) |
Net asset value, end of period | | $ | 10.04 | |
Total return2 | | | 0.81 | % |
Ratios to average net assets (annualized) | | | | |
Gross expenses | | | 2.37 | % |
Net expenses | | | 1.65 | % |
Net investment income | | | 2.18 | % |
Supplemental data | | | | |
Portfolio turnover rate | | | 11 | % |
Net assets, end of period (000s omitted) | | | $504 | |
| 1. | For the period from January 31, 2013 (commencement of class operations) to April 30, 2013 |
| 2. | Total return calculations do not include any sales charges. Returns for periods of less than one year are not annualized. |
The accompanying notes are an integral part of these financial statements.
| | | | |
| 18 | | Wells Fargo Advantage Strategic Income Fund | | Financial highlights |
(For a share outstanding throughout the period)
| | | | |
| ADMINISTRATOR CLASS | | Period ended
April 30, 20131
(unaudited) | |
Net asset value, beginning of period | | $ | 10.00 | |
Net investment income | | | 0.07 | |
Net realized and unrealized gains (losses) on investments | | | 0.03 | |
| | | | |
Total from investment operations | | | 0.10 | |
Distributions to shareholders from | | | | |
Net investment income | | | (0.06 | ) |
Net asset value, end of period | | $ | 10.04 | |
Total return2 | | | 0.97 | % |
Ratios to average net assets (annualized) | | | | |
Gross expenses | | | 1.56 | % |
Net expenses | | | 0.75 | % |
Net investment income | | | 3.08 | % |
Supplemental data | | | | |
Portfolio turnover rate | | | 11 | % |
Net assets, end of period (000s omitted) | | | $505 | |
| 1. | For the period from January 31, 2013 (commencement of class operations) to April 30, 2013 |
| 2. | Returns for periods of less than one year are not annualized. |
The accompanying notes are an integral part of these financial statements.
| | | | | | |
| Financial highlights | | Wells Fargo Advantage Strategic Income Fund | | | 19 | |
(For a share outstanding throughout the period)
| | | | |
| INSTITUTIONAL CLASS | | Period ended
April 30, 20131
(unaudited) | |
Net asset value, beginning of period | | $ | 10.00 | |
Net investment income | | | 0.08 | |
Net realized and unrealized gains (losses) on investments | | | 0.02 | |
| | | | |
Total from investment operations | | | 0.10 | |
Distributions to shareholders from | | | | |
Net investment income | | | (0.06 | ) |
Net asset value, end of period | | $ | 10.04 | |
Total return2 | | | 1.03 | % |
Ratios to average net assets (annualized) | | | | |
Gross expenses | | | 1.29 | % |
Net expenses | | | 0.60 | % |
Net investment income | | | 3.23 | % |
Supplemental data | | | | |
Portfolio turnover rate | | | 11 | % |
Net assets, end of period (000s omitted) | | | $23,744 | |
| 1. | For the period from January 31, 2013 (commencement of class operations) to April 30, 2013 |
| 2. | Returns for periods of less than one year are not annualized. |
The accompanying notes are an integral part of these financial statements.
| | | | |
| 20 | | Wells Fargo Advantage Strategic Income Fund | | Notes to financial statements (unaudited) |
1. ORGANIZATION
Wells Fargo Funds Trust (the “Trust”), a Delaware statutory trust organized on March 10, 1999, is an open-end management investment company registered under the Investment Company Act of 1940, as amended (the “1940 Act”). These financial statements report on Wells Fargo Advantage Strategic Income Fund (the “Fund”) which is a diversified series of the Trust.
2. SIGNIFICANT ACCOUNTING POLICIES
The following significant accounting policies, which are consistently followed in the preparation of the financial statements of the Fund, are in conformity with U.S. generally accepted accounting principles which require management to make estimates and assumptions that affect the reported amounts of assets and liabilities, disclosure of contingent assets and liabilities at the date of the financial statements, and the reported amounts of revenues and expenses during the reporting period. Actual results could differ from those estimates.
Securities valuation
All investments are valued each business day as of the close of regular trading on the New York Stock Exchange (normally 4 p.m. Eastern Time).
Fixed income securities acquired with maturities exceeding 60 days are valued based on evaluated bid prices received from an independent pricing service which may utilize both transaction data and market information such as yield, prices of securities of comparable quality, coupon rate, maturity, type of issue, trading characteristics and other market data. If valuations are not available from the independent pricing service or values received are deemed not representative of market value, values will be obtained from a broker-dealer or otherwise determined based on the Fund’s Valuation Procedures.
Short-term securities with maturities of 60 days or less generally are valued at amortized cost which approximates fair value. The amortized cost method involves valuing a security at its cost, plus accretion of discount or minus amortization of premium over the period until maturity.
Investments in registered open-end investment companies are valued at net asset value.
Investments which are not valued using any of the methods discussed above are valued at their fair value, as determined by procedures established in good faith and approved by the Board of Trustees. The Board of Trustees has established a Valuation Committee comprised of the Trustees and has delegated to it the authority to take any actions regarding the valuation of portfolio securities that the Valuation Committee deems necessary or appropriate, including determining the fair value of portfolio securities, unless the determination has been delegated to the Management Valuation Team of Wells Fargo Funds Management, LLC (“Funds Management”). The Board of Trustees retains the authority to make or ratify any valuation decisions or approve any changes to the Valuation Procedures as it deems appropriate. On a quarterly basis, the Board of Trustees receives reports on any valuation actions taken by the Valuation Committee or the Management Valuation Team which may include items for ratification.
Valuations of fair valued securities are compared to the next actual sales price when available, or other appropriate market information to assess the continued appropriateness of the fair valuation methodology used. These securities are fair valued on a day-to-day basis, taking into consideration changes to appropriate market information and any significant changes to the input factors considered in the valuation process until there is a readily available price provided on the exchange or by an independent pricing service. Valuations received from an independent pricing service or broker quotes are periodically validated by comparisons to most recent trades and valuations provided by other independent pricing services in addition to the review of prices by the adviser and/or subadviser. Unobservable inputs used in determining fair valuations are identified based on the type of security, taking into consideration factors utilized by market participants in valuing the investment, knowledge about the issuer and the current market environment.
Foreign currency translation
The accounting records of the Fund are maintained in U.S. dollars. Assets, including investment securities, and liabilities denominated in foreign currency are translated into U.S. dollars at the rates of exchange at a time specified by the Management Valuation Team on the date of valuation. Purchases and sales of securities, and income and expenses are converted at the rate of exchange on the respective dates of such transactions. Reported net realized foreign exchange gains or losses arise from sales of foreign currencies, currency gains or losses realized between the trade and settlement dates on securities transactions, and the difference between the amounts of dividends, interest and foreign withholding taxes recorded and the U.S. dollar equivalent of the amounts actually paid or received. Net unrealized foreign exchange gains and losses arise from changes in the fair value of assets and liabilities other than investments in securities resulting in changes in exchange rates.
| | | | | | |
| Notes to financial statements (unaudited) | | Wells Fargo Advantage Strategic Income Fund | | | 21 | |
The changes in net assets arising from changes in exchange rates and the changes in net assets resulting from changes in market prices of securities are not separately presented. Such changes are recorded with net realized and unrealized gains or losses from investments. Gains and losses from certain foreign currency transactions are treated as ordinary income for U.S. federal income tax purposes.
Forward foreign currency contracts
The Fund may be subject to foreign currency exchange rate risk in the normal course of pursuing its investment objectives. A forward foreign currency contract is an agreement between two parties to purchase or sell a specific currency for an agreed-upon price at a future date. The Fund enters into forward foreign currency contracts to facilitate transactions in foreign-denominated securities and to attempt to minimize the risk to the Fund from adverse changes in the relationship between currencies. Forward foreign currency contracts are recorded at the forward rate and marked-to-market daily. When the contracts are closed, realized gains and losses arising from such transactions are recorded as realized gains or losses on forward foreign currency contract transactions. The Fund could be exposed to risks if the counterparties to the contracts are unable to meet the terms of their contracts or if the value of the foreign currency changes unfavorably. The Fund’s maximum risk of loss from counterparty credit risk is the unrealized gains or losses on the contracts. This risk may be mitigated if there is a master netting arrangement between the Fund and the counterparty.
Term loans
The Fund may invest in term loans. The Fund begins earning interest when the loans are funded. The loans pay interest at rates which are periodically reset by reference to a base lending rate plus a spread. The Fund assumes the credit risk of the borrower and there could be potential loss to the Fund in the event of default by the borrower.
Futures contracts
The Fund may be subject to interest rate risk in the normal course of pursuing its investment objectives. The Fund may buy and sell futures contracts in order to gain exposure to, or protect against, changes in security values and interest rates. The primary risks associated with the use of futures contracts are the imperfect correlation between changes in market values of securities held by the Fund and the prices of futures contracts, and the possibility of an illiquid market.
Futures contracts are valued based upon their quoted daily settlement prices when available. The aggregate principal amounts of the contracts are not recorded in the financial statements. Fluctuations in the value of the contracts are recorded in the Statement of Assets and Liabilities as an asset or liability and in the Statement of Operations as unrealized gains or losses until the contracts are closed, at which point they are recorded as net realized gains or losses on futures contracts. With futures contracts, there is minimal counterparty risk to the Fund since futures are exchange traded and the exchange’s clearinghouse, as counterparty to all exchange traded futures, guarantees the futures against default.
Security transactions and income recognition
Securities transactions are recorded on a trade date basis. Realized gains or losses are recorded on the basis of identified cost.
Interest income is accrued daily and bond discounts are accreted and premiums are amortized daily based on the effective interest method. To the extent debt obligations are placed on non-accrual status, any related interest income may be reduced by writing off interest receivables when the collection of all or a portion of interest has become doubtful based on consistently applied procedures. If the issuer subsequently resumes interest payments or when the collectability of interest is reasonably assured, the debt obligation is removed from non-accrual status.
Income from foreign securities is recorded net of foreign taxes withheld where recovery of such taxes is not assured.
Distributions to shareholders
Distributions to shareholders from net investment income and net realized gains, if any, are recorded on the ex-dividend date. Such distributions are determined in conformity with federal income tax regulations, which may differ in amount or character from net investment income and realized gains recognized for purposes of U.S. generally accepted accounting principles.
Federal and other taxes
The Fund intends to qualify as a regulated investment company by distributing substantially all of its investment company taxable income and any net realized capital gains (after reduction for capital loss carryforwards) sufficient to relieve it from all, or substantially all, federal income taxes. Accordingly, no provision for federal income taxes will be required.
The Fund’s income and federal excise tax returns and all financial records supporting those returns since commencement of operations will be subject to examination by the federal and Delaware revenue authorities.
| | | | |
| 22 | | Wells Fargo Advantage Strategic Income Fund | | Notes to financial statements (unaudited) |
Class allocations
The separate classes of shares offered by the Fund differ principally in applicable sales charges, distribution, shareholder servicing, and administration fees. Shareholders of each class bear certain expenses that pertain to that particular class. All shareholders bear the common expenses of the Fund, earn income from the portfolio, and are allocated any unrealized gains and losses pro rata based on the average daily net assets of each class, without distinction between share classes. Dividends are determined separately for each class based on income and expenses allocable to each class. Realized gains and losses are allocated to each class pro rata based upon the net assets of each class on the date realized. Differences in per share dividend rates generally result from the relative weightings of pro rata income and realized gain allocations and from differences in separate class expenses, including distribution, shareholder servicing, and administration fees.
3. FAIR VALUATION MEASUREMENTS
Fair value measurements of investments are determined within a framework that has established a fair value hierarchy based upon the various data inputs utilized in determining the value of the Fund’s investments. The three-level hierarchy gives the highest priority to unadjusted quoted prices in active markets for identical assets or liabilities (Level 1) and the lowest priority to significant unobservable inputs (Level 3). The Fund’s investments are classified within the fair value hierarchy based on the lowest level of input that is significant to the fair value measurement. The inputs are summarized into three broad levels as follows:
| n | | Level 1 – quoted prices in active markets for identical securities |
| n | | Level 2 – other significant observable inputs (including quoted prices for similar securities, interest rates, prepayment speeds, credit risk, use of amortized cost, etc.) |
| n | | Level 3 – significant unobservable inputs (including the Fund’s own assumptions in determining the fair value of investments) |
The inputs or methodologies used for valuing investments in securities are not necessarily an indication of the risk associated with investing in those securities.
As of April 30, 2013, the inputs used in valuing investments in securities were as follows:
| | | | | | | | | | | | | | | | |
| Investments in securities | | Quoted prices (Level 1) | | | Significant other
observable inputs (Level 2) | | | Significant unobservable inputs (Level 3) | | | Total | |
Asset-backed securities | | $ | 0 | | | $ | 750,150 | | | $ | 0 | | | $ | 750,150 | |
Corporate bonds and notes | | | 0 | | | | 7,733,873 | | | | 0 | | | | 7,733,873 | |
Foreign government bonds | | | 0 | | | | 6,131,211 | | | | 0 | | | | 6,131,211 | |
Municipal obligations | | | 0 | | | | 389,061 | | | | 0 | | | | 389,061 | |
Non-agency mortgage backed securities | | | 0 | | | | 2,516,950 | | | | 0 | | | | 2,516,950 | |
Term loans | | | 0 | | | | 5,775,204 | | | | 323,403 | | | | 6,098,607 | |
Yankee corporate bonds and notes | | | 0 | | | | 836,748 | | | | 0 | | | | 836,748 | |
Short-term investments | | | | | | | | | | | | | | | | |
Investment companies | | | 1,451,582 | | | | 0 | | | | 0 | | | | 1,451,582 | |
U.S. Treasury securities | | | 54,998 | | | | 0 | | | | 0 | | | | 54,998 | |
| | | $ | 1,506,580 | | | $ | 24,133,197 | | | $ | 323,403 | | | $ | 25,963,180 | |
As of April 30, 2013, the inputs used in valuing the Fund’s other financial instruments were as follows:
| | | | | | | | | | | | | | | | |
| Other financial instruments | | Quoted prices (Level 1) | | | Significant other
observable inputs (Level 2) | | | Significant unobservable inputs (Level 3) | | | Total | |
Futures contracts+ | | $ | 0 | | | $ | (98,769 | ) | | $ | 0 | | | $ | (98,769 | ) |
Forward foreign currency contracts+ | | | 0 | | | | 12,594 | | | | 0 | | | | 12,594 | |
| + | Futures contracts and forward foreign currency contracts are presented at the unrealized gains or losses on the instrument. |
| | | | | | |
| Notes to financial statements (unaudited) | | Wells Fargo Advantage Strategic Income Fund | | | 23 | |
Transfers in and transfers out are recognized at the end of the reporting period. For the period ended April 30, 2013 the Fund did not have any transfers into/out of Level 1 or Level 2.
The following is a reconciliation of assets in which significant unobservable inputs (Level 3) were used in determining fair value:
| | | | |
| | | Term
loans | |
Balance as of January 31, 2013 | | $ | 0 | |
Accrued discounts | | | (128 | ) |
Realized losses | | | (11 | ) |
Change in unrealized losses | | | (34 | ) |
Purchases | | | 324,076 | |
Sales | | | (500 | ) |
Transfers into Level 3 | | | 0 | |
Transfers out of Level 3 | | | 0 | |
Balance as of April 30, 2013 | | $ | 323,403 | |
Change in unrealized gains (losses) relating to securities still held at April 30, 2013 | | $ | (34 | ) |
The investment types categorized above were valued using indicative broker quotes and are therefore considered Level 3 inputs. Quantitative unobservable inputs used by the brokers are often proprietary and not provided to the Fund and therefore the disclosure that would address these inputs is not included above.
4. TRANSACTIONS WITH AFFILIATES AND OTHER EXPENSES
Advisory Fee
The Trust has entered into an advisory contract with Funds Management, an indirect wholly owned subsidiary of Wells Fargo & Company (“Wells Fargo”). The adviser is responsible for implementing investment policies and guidelines and for supervising the subadvisers, who are responsible for day-to-day portfolio management of the Fund.
Pursuant to the contract, Funds Management is entitled to receive an annual advisory fee starting at 0.475% and declining to 0.375% as the average daily net assets of the Fund increase. For the period from January 31, 2013 to April 30, 2013, the advisory fee was equivalent to an annual rate of 0.475% of the Fund’s average daily net assets.
Funds Management has retained the services of certain subadvisers to provide daily portfolio management to the Fund. The fee for subadvisory services is borne by Funds Management. Wells Capital Management Incorporated, an affiliate of Funds Management, is a subadviser to the Fund and is entitled to receive a fee from Funds Management at an annual rate starting at 0.30% and declining to 0.15% as the average daily net assets of the Fund increase. First International Advisors, LLC, an affiliate of Funds Management, is also a subadviser to the Fund and is entitled to receive a fee from Funds Management at an annual rate starting at 0.35% and declining to 0.20% as the average daily net assets of the subadvisers’ portion of the Fund increase.
Administration and transfer agent fees
The Trust has entered into an administration agreement with Funds Management. Under this agreement, for providing administrative services, which includes paying fees and expenses for services provided by the transfer agent, sub-transfer agents, omnibus account servicers and record-keepers, Funds Management is entitled to receive from the Fund an annual fund level administration fee starting at 0.05% and declining to 0.03% as the average daily net assets of the Fund increase and a class level administration fee which is calculated based on the average daily net assets of each class as follows:
| | | | |
| | | Class level
administration fee | |
Class A, Class C | | | 0.16 | % |
Administrator Class | | | 0.10 | |
Institutional Class | | | 0.08 | |
Funds Management has contractually waived and/or reimbursed advisory and administration fees to the extent necessary to maintain certain net operating expense ratios for the Fund. Waiver of fees and/or reimbursement of expenses by Funds Management were made first from fund level expenses on a proportionate basis and then from class specific expenses. Funds Management has committed through February 28, 2014, to waive fees and/or reimburse expenses to the extent necessary to cap the Fund’s expenses at 0.90% for Class A shares, 1.65% for Class C shares, 0.75% for Administrator Class shares, and 0.60% for Institutional Class shares.
| | | | |
| 24 | | Wells Fargo Advantage Strategic Income Fund | | Notes to financial statements (unaudited) |
Distribution fees
The Trust has adopted a Distribution Plan for Class C shares of the Fund pursuant to Rule 12b-1 under the 1940 Act. Distribution fees are charged to Class C shares and paid to Wells Fargo Funds Distributor, LLC, the principal underwriter, at an annual rate of 0.75% of the average daily net assets of Class C shares.
Shareholder servicing fees
The Trust has entered into contracts with one or more shareholder servicing agents, whereby Class A, Class C, and Administrator Class of the Fund is charged a fee at an annual rate of 0.25% of the average daily net assets of each respective class.
A portion of these total shareholder servicing fees were paid to affiliates of Wells Fargo.
4. INVESTMENT PORTFOLIO TRANSACTIONS
Purchases and sales of investments, excluding U.S. government obligations (if any) and short-term securities, for the period from January 31, 2013 to April 30, 2013 were $27,344,633 and $2,334,408, respectively.
As of April 30, 2013, the Fund had unfunded term loan commitments of $850,781.
5. DERIVATIVE TRANSACTIONS
During the period from January 31, 2013 to April 30, 2013, the Fund entered into futures contracts to manage duration exposure.
At April 30, 2013, the Fund had short futures contracts outstanding as follows:
| | | | | | | | | | | | |
| Expiration date | | Contracts | | Type | | Contract Value at April 30, 2013 | | | Unrealized
losses | |
6-19-2013 | | 45 Short | | 10-Year U.S. Treasury Notes (CBT) | | $ | 6,001,172 | | | $ | (98,008 | ) |
6-28-2013 | | 6 Short | | 5-Year U.S. Treasury Notes (CBT) | | | 747,844 | | | | (761 | ) |
The Fund had an average notional amount of $4,327,435 in futures contracts during the period from January 31, 2013 to April 30, 2013.
During the period from January 31, 2013 to April 30, 2013, the Fund entered into forward foreign currency exchange contracts for economic hedging purposes.
At April 30, 2013, the Fund had forward foreign currency contracts outstanding as follows:
Forward foreign currency contracts to sell:
| | | | | | | | | | | | | | | | | | |
| Exchange date | | Counterparty | | Contracts
to deliver | | | U.S. value at April, 30, 2013 | | | In exchange for U.S. $ | | | Unrealized
gains
(losses) | |
| 5-6-2013 | | State Street Bank | | | 5,475,000 | ZAR | | $ | 609,882 | | | $ | 604,188 | | | $ | (5,694 | ) |
| 5-6-2013 | | State Street Bank | | | 132,200,000 | HUF | | | 581,507 | | | | 609,243 | | | | 27,736 | |
| 5-28-2013 | | State Street Bank | | | 28,000 | TRY | | | 15,576 | | | | 15,487 | | | | (89 | ) |
| 5-28-2013 | | State Street Bank | | | 1,100,000 | TRY | | | 611,924 | | | | 602,565 | | | | (9,359 | ) |
The Fund had average contract amounts of $1,609,123 in forward foreign currency contracts to sell during the period from January 31, 2013 to April 30, 2013.
| | | | | | |
| Notes to financial statements (unaudited) | | Wells Fargo Advantage Strategic Income Fund | | | 25 | |
A summary of derivative instruments by primary risk exposure is outlined in the following tables.
The fair value of derivative instruments as of April 30, 2013 was as follows for the Fund:
| | | | | | | | | | | | |
| | | Asset derivatives | | | Liability derivatives | |
| | | Balance sheet location | | Fair value | | | Balance sheet location | | Fair
value | |
Interest rate contracts | | Net assets – Net unrealized gains on investments | | $ | 0 | * | | Net assets – Net unrealized gains on investments | | $ | 98,769 | * |
Forward foreign currency contracts | | Unrealized gains on forward foreign currency contracts, Net assets – Net unrealized gains on investments | | | 27,736 | | | Unrealized losses on forward foreign currency contracts, Net assets – Net unrealized gains on investments | | | 15,142 | |
| | | | | | | | | | | | |
| | | | $ | 27,736 | | | | | $ | 113,911 | |
| | | | | | | | | | | | |
| * | Amount represents cumulative unrealized gains (losses) on futures contracts. Only the variation margin as of April 30, 2013 is reported separately on the Statement of Assets and Liabilities. |
The effect of derivative instruments on the Statement of Operations for the period ended April 30, 2013 was as follows for the Fund:
| | | | | | | | |
| | | Amount of realized gains (losses) on derivatives | |
| | | Futures | | | Forward
currency
contracts | |
Interest rate contracts | | $ | (28,024 | ) | | $ | 0 | |
| | | | | | | | |
| | | Change in unrealized gains (losses) on derivatives | |
| | | Futures | | | Forward
currency
contracts | |
Interest rate contracts | | $ | (98,769 | ) | | $ | 0 | |
Forward foreign currency contracts | | | 0 | | | | 12,594 | |
For certain types of derivative transactions, the Fund has entered into International Swaps and Derivatives Association, Inc. master agreements (“ISDA Master Agreements”) with approved counterparties. The ISDA Master Agreements may have requirements to deliver/deposit securities or cash to/with an exchange or broker-dealer as collateral and allows the Fund to offset with each counterparty certain derivative financial instrument’s assets and/or liabilities with collateral held or pledged. Collateral requirements differ by type of derivative. Collateral or margin requirements are set by the broker or exchange clearing house for exchange traded derivatives while collateral terms are contract specific for over-the-counter traded. Cash collateral that has been pledged to cover obligations of the Fund under derivative contracts, if any, will be reported separately in the Statement of Assets and Liabilities. Securities pledged as collateral, if any, for the same purpose are noted in the Portfolio of Investments. With respect to balance sheet offsetting, absent an event of default by the counterparty or a termination of the agreement, the reported amounts of financial assets and financial liabilities in the Statement of Assets and Liabilities are not offset across transactions between the Fund and the applicable counterparty.
As of April 30, 2013, the Fund has transactions subject to an enforceable master netting agreements. A reconciliation of the gross amounts on the Statement of Assets and Liabilities to the net amounts by derivative type, including any collateral exposure, is as follows:
| | | | | | | | | | | | |
| Description | | Gross amounts of assets in the Statement of Assets
and Liabilities | | | Collateral
received | | | Net amount (not less than $0) | |
Futures contracts | | $ | 98,769 | * | | $ | 54,998 | | | $ | 43,771 | |
| * | Amount represents cumulative unrealized gains (losses) on futures contracts. Only the variation margin as of April 30, 2013 is reported separately on the Statement of Assets and Liabilities. |
| | | | |
| 26 | | Wells Fargo Advantage Strategic Income Fund | | Notes to financial statements (unaudited) |
6. BANK BORROWINGS
The Trust (excluding the money market funds and certain other funds in the Trust) and Wells Fargo Variable Trust are parties to a $150,000,000 revolving credit agreement with State Street Bank and Trust Company, whereby the Fund is permitted to use bank borrowings for temporary or emergency purposes, such as to fund shareholder redemption requests. Interest under the credit agreement is charged to the Fund based on a borrowing rate equal to the higher of the Federal Funds rate in effect on that day plus 1.25% or the overnight LIBOR rate in effect on that day plus 1.25%. In addition, an annual commitment fee equal to 0.10% of the unused balance is allocated to each participating fund. For the period from January 31, 2013 to April 30, 2013, the Fund paid $13 in commitment fees.
For the period from January 31, 2013 to April 30, 2013, there were no borrowings by the Fund under the agreement.
7. INDEMNIFICATION
Under the Trust’s organizational documents, the officers and directors are indemnified against certain liabilities that may arise out of performance of their duties to the Trust. Additionally, in the normal course of business, the Trust may enter into contracts with service providers that contain a variety of indemnification clauses. The Trust’s maximum exposure under these arrangements is dependent on future claims that may be made against the Fund and, therefore, cannot be estimated.
8. SUBSEQUENT DISTRIBUTIONS
On May 24, 2013, the Fund declared distributions from net investment income to shareholders of record on May 23, 2013. The per share amounts payable on May 28, 2013 were as follows:
| | | | |
| | | Net investment income | |
Class A | | | $0.03296 | |
Class C | | | 0.02677 | |
Administrator Class | | | 0.03345 | |
Institutional Class | | | 0.03568 | |
On June 24, 2013, the Fund declared distributions from net investment income to shareholders of record on June 21, 2013. The per share amounts payable on June 25, 2013, were as follows:
| | | | |
| | | Net investment income | |
Class A | | | $0.03173 | |
Class C | | | 0.02600 | |
Administrator Class | | | 0.03215 | |
Institutional Class | | | 0.03420 | |
These distributions are not reflected in the accompanying financial statements.
| | | | | | |
| Other information (unaudited) | | Wells Fargo Advantage Strategic Income Fund | | | 27 | |
PROXY VOTING INFORMATION
A description of the policies and procedures that the Fund uses to determine how to vote proxies relating to portfolio securities is available without charge, upon request, by calling 1-800-222-8222, visiting our website at wellsfargoadvantagefunds.com, or visiting the SEC website at sec.gov. Information regarding how the Fund voted proxies relating to portfolio securities during the most recent 12-month period ended June 30 is available without charge on the Fund’s website at wellsfargoadvantagefunds.com or by visiting the SEC website at sec.gov.
PORTFOLIO HOLDINGS INFORMATION
The complete portfolio holdings for the Fund are publicly available on the Fund’s website (wellsfargoadvantagefunds.com) on a monthly, 30-day or more delayed basis. In addition, top ten holdings information for the Fund is publicly available on the Fund’s website on a monthly, seven-day or more delayed basis. The Fund files its complete schedule of portfolio holdings with the SEC for the first and third quarters of each fiscal year on Form N-Q, which is available without charge by visiting the SEC website at sec.gov. In addition, the Fund’s Form N-Q may be reviewed and copied at the SEC’s Public Reference Room in Washington, DC, and at regional offices in New York City, at 233 Broadway, and in Chicago, at 175 West Jackson Boulevard, Suite 900. Information about the Public Reference Room may be obtained by calling 1-800-SEC-0330.
| | | | |
| 28 | | Wells Fargo Advantage Strategic Income Fund | | Other information (unaudited) |
BOARD OF TRUSTEES AND OFFICERS
Each of the Trustees and Officers listed in the table below acts in identical capacities for the Wells Fargo Advantage family of funds, which consists of 131 funds1 comprising the Wells Fargo Funds Trust, Wells Fargo Variable Trust, Wells Fargo Master Trust and four closed-end funds (collectively the “Fund Complex”). This table should be read in conjunction with the Prospectus and the Statement of Additional Information2. All of the Trustees are also Members of the Audit and Governance Committees of each Trust in the Fund Complex. The mailing address of each Trustee and Officer is 525 Market Street, 12th Floor, San Francisco, CA 94105. Each Trustee and Officer serves an indefinite term, however, each Trustee serves such term until reaching the mandatory retirement age established by the Trustees.
Independent Trustees
| | | | | | |
Name and year of birth | | Position held and length of service* | | Principal occupations during past five years | | Other directorships during
past five years |
Peter G. Gordon
(Born 1942) | | Trustee, since 1998; Chairman, since 2005 | | Co-Founder, Retired Chairman, President and CEO of Crystal Geyser Water Company. Trustee Emeritus, Colby College. | | Asset Allocation Trust |
Isaiah Harris, Jr.
(Born 1952) | | Trustee, since 2009 | | Retired. Prior thereto, President and CEO of BellSouth Advertising and Publishing Corp. from 2005 to 2007, President and CEO of BellSouth Enterprises from 2004 to 2005 and President of BellSouth Consumer Services from 2000 to 2003. Emeritus member of the Iowa State University Foundation Board of Governors. Emeritus Member of the Advisory Board of Iowa State University School of Business. Advisory Board Member, Palm Coast Academy (charter school). Mr. Harris is a certified public accountant. | | CIGNA Corporation; Deluxe Corporation; Asset Allocation Trust |
Judith M. Johnson
(Born 1949) | | Trustee, since 2008; Audit Committee Chairman, since 2008 | | Retired. Prior thereto, Chief Executive Officer and Chief Investment Officer of Minneapolis Employees Retirement Fund from 1996 to 2008. Ms. Johnson is an attorney, certified public accountant and a certified managerial accountant. | | Asset Allocation Trust |
Leroy Keith, Jr.
(Born 1939) | | Trustee, since 2010 | | Chairman, Bloc Global Services (development and construction). Trustee of the Evergreen Funds from 1983 to 2010. Former Managing Director, Almanac Capital Management (commodities firm), former Partner, Stonington Partners, Inc. (private equity fund), former Director, Obagi Medical Products Co. and former Director, Lincoln Educational Services. | | Trustee, Virtus Fund Complex (consisting of 48 portfolios as of 1/31/2013); Asset Allocation Trust |
David F. Larcker
(Born 1950) | | Trustee, since 2009 | | James Irvin Miller Professor of Accounting at the Graduate School of Business, Stanford University, Morgan Stanley Director of the Center for Leadership Development and Research and Senior Faculty of The Rock Center for Corporate Governance since 2006. From 2005 to 2008, Professor of Accounting at the Graduate School of Business, Stanford University. Prior thereto, Ernst & Young Professor of Accounting at The Wharton School, University of Pennsylvania from 1985 to 2005. | | Asset Allocation Trust |
Olivia S. Mitchell
(Born 1953) | | Trustee, since 2006 | | International Foundation of Employee Benefit Plans Professor, Wharton School of the University of Pennsylvania since 1993. Director of Wharton’s Pension Research Council and Boettner Center on Pensions & Retirement Research, and Research Associate at the National Bureau of Economic Research. Previously, Cornell University Professor from 1978 to 1993. | | Asset Allocation Trust |
Timothy J. Penny
(Born 1951) | | Trustee, since 1996 | | President and CEO of Southern Minnesota Initiative Foundation, a non-profit organization, since 2007 and Senior Fellow at the Humphrey Institute Policy Forum at the University of Minnesota since 1995. Member of the Board of Trustees of NorthStar Education Finance, Inc., a non-profit organization, since 2007. | | Asset Allocation Trust |
| | | | | | |
| Other information (unaudited) | | Wells Fargo Advantage Strategic Income Fund | | | 29 | |
| | | | | | |
Name and year of birth | | Position held and length of service* | | Principal occupations during past five years | | Other directorships during
past five years |
Michael S. Scofield
(Born 1943) | | Trustee, since 2010 | | Served on the Investment Company Institute’s Board of Governors and Executive Committee from 2008-2011 as well the Governing Council of the Independent Directors Council from 2006-2011 and the Independent Directors Council Executive Committee from 2008-2011. Chairman of the IDC from 2008-2010. Institutional Investor (Fund Directions) Trustee of Year in 2007. Trustee of the Evergreen Funds (and its predecessors) from 1984 to 2010. Chairman of the Evergreen Funds from 2000-2010. Former Trustee of the Mentor Funds. Retired Attorney, Law Offices of Michael S. Scofield. | | Asset Allocation Trust |
Donald C. Willeke
(Born 1940) | | Trustee, since 1996 | | Principal of the law firm of Willeke & Daniels. General Counsel of the Minneapolis Employees Retirement Fund from 1984 until its consolidation into the Minnesota Public Employees Retirement Association on June 30, 2010. Director and Vice Chair of The Tree Trust (non-profit corporation). Director of the American Chestnut Foundation (non-profit corporation). | | Asset Allocation Trust |
| * | Length of service dates reflect the Trustee’s commencement of service with the Trust’s predecessor entities, where applicable. |
Officers
| | | | | | |
Name and year of birth | | Position held and
length of service | | Principal occupations during past five years | | |
Karla M. Rabusch
(Born 1959) | | President, since 2003 | | Executive Vice President of Wells Fargo Bank, N.A. and President of Wells Fargo Funds Management, LLC since 2003. | | |
Nancy Wiser1
(Born 1967) | | Treasurer, since 2012 | | Executive Vice President of Wells Fargo Funds Management, LLC since 2011. Chief Operating Officer and Chief Compliance Officer at LightBox Capital Management LLC, from 2008 to 2011. Owned and operated a consulting business providing services to various hedge funds including acting as Chief Operating Officer and Chief Compliance Officer for a hedge fund from 2007 to 2008. Chief Operating Officer and Chief Compliance Officer of GMN Capital LLC from 2006 to 2007. | | |
C. David Messman
(Born 1960) | | Secretary, since 2000; Chief Legal Officer, since 2003 | | Senior Vice President and Secretary of Wells Fargo Funds Management, LLC since 2001. Vice President and Managing Counsel of Wells Fargo Bank, N.A. since 1996. | | |
Debra Ann Early (Born 1964) | | Chief Compliance Officer, since 2007 | | Chief Compliance Officer of Wells Fargo Funds Management, LLC since 2007. Chief Compliance Officer of Parnassus Investments from 2005 to 2007. Chief Financial Officer of Parnassus Investments from 2004 to 2007. | | |
David Berardi
(Born 1975) | | Assistant Treasurer, since 2009 | | Vice President of Wells Fargo Funds Management, LLC since 2009. Vice President of Evergreen Investment Management Company, LLC from 2008 to 2010. Assistant Vice President of Evergreen Investment Services, Inc. from 2004 to 2008. Manager of Fund Reporting and Control for Evergreen Investment Management Company, LLC from 2004 to 2010. | | |
Jeremy DePalma1
(Born 1974) | | Assistant Treasurer, since 2009 | | Senior Vice President of Wells Fargo Funds Management, LLC since 2009. Senior Vice President of Evergreen Investment Management Company, LLC from 2008 to 2010. Vice President, Evergreen Investment Services, Inc. from 2004 to 2007. Head of the Fund Reporting and Control Team within Fund Administration from 2005 to 2010. | | |
| 1. | Nancy Wiser acts as Treasurer of 73 funds in the Fund Complex. Jeremy DePalma acts as Treasurer of 58 funds and Assistant Treasurer of 73 funds in the Fund Complex. |
| 2. | The Statement of Additional Information includes additional information about the Trustees and is available,without charge, upon request, by calling 1-800-222-8222 or by visiting the website at wellsfargoadvantagefunds.com. |
| | | | |
| 30 | | Wells Fargo Advantage Strategic Income Fund | | Other information (unaudited) |
BOARD CONSIDERATION OF INVESTMENT ADVISORY AND SUBADVISORY AGREEMENTS:
Under Section 15 of the Investment Company Act of 1940 (the “1940 Act”), the Board of Trustees (the “Board”) of Wells Fargo Funds Trust (the “Trust”), all the members of which have no direct or indirect interest in the investment advisory and sub-advisory agreements and are not “interested persons” of the Trust, as defined in the 1940 Act (the “Independent Trustees”), must determine whether to approve the continuation of the Trust’s investment advisory and sub-advisory agreements. In this regard, at an in-person meeting held on March 28-29, 2013 (the “Meeting”), the Board reviewed: (i) an investment advisory agreement with Wells Fargo Funds Management, LLC (“Funds Management”) for Wells Fargo Advantage Strategic Income Fund (the “Fund”), (ii) an investment sub-advisory agreement with Wells Capital Management Incorporated (“WellsCap”), an affiliate of Funds Management, for the Fund, and (iii) an investment sub-advisory agreement with First International Advisors, LLC (“First International”), an affiliate of Funds Management, for the Fund. The investment advisory agreement with Funds Management and the investment sub-advisory agreements with WellsCap and First International (the “Sub-Advisers”) are collectively referred to as the “Advisory Agreements.”
At the Meeting, the Board considered the factors and reached the conclusions described below relating to the selection of Funds Management and the Sub-Advisers and the continuation of the Advisory Agreements. Prior to the Meeting, the Trustees conferred extensively among themselves and with representatives of Funds Management about these matters. The Board has adopted a team-based approach, with each team consisting of a sub-set of Trustees, to assist the Board in the discharge of its duties in reviewing performance and other matters throughout the year. The Independent Trustees were assisted in their evaluation of the Advisory Agreements by independent legal counsel, from whom they received separate legal advice and with whom they met separately.
In providing information to the Board, Funds Management and the Sub-Advisers were guided by a detailed set of requests for information submitted to them by independent legal counsel on behalf of the Independent Trustees at the start of the Board’s annual contract renewal process earlier in 2013. In considering and approving the Advisory Agreements, the Trustees considered the information they believed relevant, including but not limited to the information discussed below. The Board considered not only the specific information presented in connection with the Meeting, but also the knowledge gained over time through interaction with Funds Management and the Sub-Advisers about various topics. In addition, the Board and the teams mentioned above confer with portfolio managers at various times throughout the year. The Board did not identify any particular information or consideration that was all-important or controlling, and each individual Trustee may have attributed different weights to various factors.
After its deliberations, the Board unanimously determined that the continuation of the Advisory Agreements is in the best interests of the Fund and its shareholders, and that the compensation payable to Funds Management and the Sub-Advisers is reasonable. The Board considered the continuation of the Advisory Agreements for the Fund as part of its consideration of the continuation of advisory agreements for funds across the complex, but each decision was made on a fund-by-fund basis. The following summarizes a number of important, but not necessarily all, factors considered by the Board in reaching its determination.
Nature, extent and quality of services
The Board received and considered various information regarding the nature, extent and quality of services provided to the Fund by Funds Management and the Sub-Advisers under the Advisory Agreements. This information included, among other things, a summary of the background and experience of senior management of Funds Management, and the qualifications, background, tenure and responsibilities of each of the portfolio managers primarily responsible for the day-to-day portfolio management of the Fund.
The Board evaluated the ability of Funds Management and the Sub-Advisers, based on attributes such as their financial condition, resources and reputation, to attract and retain qualified investment professionals, including research, advisory and supervisory personnel. The Board further considered the compliance programs and compliance records of Funds Management and the Sub-Advisers. In addition, the Board took into account the administrative and other services provided to the Fund by Funds Management and its affiliates and Funds Management’s oversight of the Fund’s various service providers.
Fund performance and expenses
The Board acknowledged that the Fund is newly formed and has no performance record. The Board noted that it considered the performance of other accounts managed by WellsCap utilizing an investment style and strategy similar to that of the Fund when the Board initially approved the Advisory Agreements for the Fund at an in-person meeting of the Board held on November 6-7, 2012, including how such accounts performed in relation to the Fund’s benchmark index. The Board noted that it would have the opportunity to review performance information relating to the Fund on an on-going basis and in connection with future annual reviews of advisory agreements.
| | | | | | |
| Other information (unaudited) | | Wells Fargo Advantage Strategic Income Fund | | | 31 | |
The Board received and considered information regarding the Fund’s net operating expense ratios and their various components, including actual management fees (which reflect fee waivers, if any, and include advisory, administration and transfer agent fees), custodian and other non-management fees, Rule 12b-1 and non-Rule 12b-1 service fees and fee waiver and expense reimbursement arrangements. The Board also considered these ratios in comparison to the median ratios of funds in class-specific expense groups that were determined by Lipper to be similar to the Fund (the “Groups”). The Board received a description of the methodology used by Lipper to select the mutual funds in the expense Groups. Based on the Lipper reports, the Board noted that the net operating expense ratios of the Fund were lower than the median net operating expense ratios of the expense Groups.
Based on its consideration of the factors and information it deemed relevant, including those described here, the Board concluded that the expense structure of the Fund supported the re-approval of the Advisory Agreements.
Investment advisory and sub-advisory fee rates
The Board reviewed and considered the contractual investment advisory fee rates that are payable by the Fund to Funds Management for investment advisory services (the “Advisory Agreement Rates”), both on a stand-alone basis and on a combined basis with the Fund’s fund-level and class-level contractual administration fee rates (the “Management Rates”). The Board noted that the administration fees include transfer agency costs. The Board also reviewed and considered the contractual investment sub-advisory fee rates that are payable by Funds Management to each of the Sub-Advisers for investment sub-advisory services (the “Sub-Advisory Agreement Rates”).
Among other information reviewed by the Board was a comparison of the Management Rates of the Fund with those of other funds in the expense Groups at a common asset level. The Board noted that the Management Rates of the Fund were equal to or in range of the median rates for the Fund’s expense Groups.
The Board also received and considered information about the portion of the total advisory fee that was retained by Funds Management after payment of the fee to each of the Sub-Advisers for sub-advisory services. In assessing the reasonableness of this amount, the Board received and evaluated information concerning the nature and extent of responsibilities retained and risks assumed by Funds Management and not delegated to or assumed by the Sub-Advisers, and about Funds Management’s on-going oversight services. In recognition of the fact that the Wells Fargo enterprise provides a suite of combined advisory and sub-advisory services to the Fund through affiliated entities, the Board ascribed limited relevance to the allocation of the total advisory fee between Funds Management and the Sub-Advisers.
The Board also received and considered information about the nature and extent of services offered and fee rates charged by Funds Management and the Sub-Advisers to other types of clients. In this regard, the Board received information about the significantly greater scope of services, and compliance, reporting and other legal burdens and risks of managing mutual funds compared with those associated with managing assets of non-mutual fund clients such as collective funds or institutional separate accounts.
Based on its consideration of the factors and information it deemed relevant, including those described here, the Board determined that the Advisory Agreement Rates and the Sub-Advisory Agreement Rates were reasonable in light of the services covered by the Advisory Agreements.
Profitability
The Board received and considered information concerning the profitability of Funds Management, as well as the profitability of Wells Fargo as a whole, from providing services to the Fund. The Board did not receive or consider to be necessary separate profitability information with respect to the Sub-Advisers, because, as affiliates of Funds Management, their profitability information was subsumed in the collective Wells Fargo profitability analysis provided by Funds Management.
Funds Management explained the methodologies and estimates that it used in calculating the profitability from the Fund and the fund family as a whole. Among other things, the Board noted that the levels of profitability reported on a fund-by-fund basis varied widely, depending on factors such as the size and type of fund. Based on its review, the Board did not deem the profits reported by Funds Management to be at a level that would prevent it from approving the continuation of the Advisory Agreements.
Economies of scale
With respect to possible economies of scale, the Board reviewed the breakpoints in the Fund’s advisory fee and administration fee structure, which operate generally to reduce the Fund’s expense ratios as the Fund grows in size. It considered that, for a small fund or a fund that shrinks in size, breakpoints conversely can result in higher fee levels. The Board also considered fee waiver and expense reimbursement arrangements as a means of sharing potential economies of scale with the Fund. The Board acknowledged the inherent limitations of any analysis of potential economies of scale
| | | | |
| 32 | | Wells Fargo Advantage Strategic Income Fund | | Other information (unaudited) |
and of any attempt to correlate breakpoints with such economies. Nonetheless, the Board concluded that the breakpoints and net operating expense ratio caps appeared to be a reasonable approach to sharing potential economies of scale with the Fund.
Other benefits to Funds Management and the Sub-Advisers
The Board received and considered information regarding potential “fall-out” or ancillary benefits received by Funds Management and its affiliates, including the Sub-Advisers, as a result of their relationship with the Fund. Ancillary benefits could include, among others, benefits directly attributable to other relationships with the Fund and benefits potentially derived from an increase in Funds Management’s and the Sub-Advisers’ business as a result of their relationship with the Fund (such as the ability to market to shareholders other financial products and services offered by Funds Management and its affiliates, including the Sub-Advisers, or to operate other products and services that follow investment strategies similar to those of the Fund).
The Board considered that Wells Fargo Funds Distributor, LLC, an affiliate of Funds Management, serves as distributor to the Fund and receives certain compensation for those services. The Board noted that various financial institutions, including affiliates of Funds Management, may receive distribution-related fees, shareholder servicing payments (including amounts derived from payments under Rule 12b-1 plans) and sub-transfer agency fees in respect of shares sold or held through them and services provided.
The Board also reviewed information about whether and to what extent soft dollar credits are sought and how any such credits are utilized, and any benefits that might be realized by an affiliated broker that handles portfolio transactions for the Fund.
Based on its consideration of the factors and information it deemed relevant, including those described here, the Board did not find that any ancillary benefits received by Funds Management and its affiliates, including the Sub-Advisers, were unreasonable.
Conclusion
After considering the above-described factors and based on its deliberations and its evaluation of the information described above, the Board unanimously approved the continuation of the Advisory Agreements for an additional one-year period.
| | | | | | |
| List of abbreviations | | Wells Fargo Advantage Strategic Income Fund | | | 33 | |
The following is a list of common abbreviations for terms and entities that may have appeared in this report.
| ACA | — ACA Financial Guaranty Corporation |
| ADR | — American depositary receipt |
| ADS | — American depositary shares |
| AGC | — Assured Guaranty Corporation |
| AGM | — Assured Guaranty Municipal |
| Ambac | — Ambac Financial Group Incorporated |
| AMT | — Alternative minimum tax |
| BAN | — Bond anticipation notes |
| BHAC | — Berkshire Hathaway Assurance Corporation |
| CAB | — Capital appreciation bond |
| CCAB | — Convertible capital appreciation bond |
| CDA | — Community Development Authority |
| CDO | — Collateralized debt obligation |
| COP | — Certificate of participation |
| DRIVER | — Derivative inverse tax-exempt receipts |
| DW&P | — Department of Water & Power |
| DWR | — Department of Water Resources |
| ECFA | — Educational & Cultural Facilities Authority |
| EDA | — Economic Development Authority |
| EDFA | — Economic Development Finance Authority |
| ETF | — Exchange-traded fund |
| FDIC | — Federal Deposit Insurance Corporation |
| FFCB | — Federal Farm Credit Banks |
| FGIC | — Financial Guaranty Insurance Corporation |
| FHA | — Federal Housing Administration |
| FHLB | — Federal Home Loan Bank |
| FHLMC | — Federal Home Loan Mortgage Corporation |
| FICO | — The Financing Corporation |
| FNMA | — Federal National Mortgage Association |
| GDR | — Global depositary receipt |
| GNMA | — Government National Mortgage Association |
| HCFR | — Healthcare facilities revenue |
| HEFA | — Health & Educational Facilities Authority |
| HEFAR | — Higher education facilities authority revenue |
| HFA | — Housing Finance Authority |
| HFFA | — Health Facilities Financing Authority |
| HUD | — Department of Housing and Urban Development |
| IDA | — Industrial Development Authority |
| IDAG | — Industrial Development Agency |
| IDR | — Industrial development revenue |
| KRW | — Republic of Korea won |
| LIBOR | — London Interbank Offered Rate |
| LLC | — Limited liability company |
| LLP | — Limited liability partnership |
| MBIA | — Municipal Bond Insurance Association |
| MFHR | — Multifamily housing revenue |
| MSTR | — Municipal securities trust receipts |
| MUD | — Municipal Utility District |
| National | — National Public Finance Guarantee Corporation |
| PCFA | — Pollution Control Financing Authority |
| PCL | — Public Company Limited |
| PCR | — Pollution control revenue |
| PFA | — Public Finance Authority |
| PFFA | — Public Facilities Financing Authority |
| PFOTER | — Puttable floating option tax-exempt receipts |
| plc | — Public limited company |
| PUTTER | — Puttable tax-exempt receipts |
| R&D | — Research & development |
| Radian | — Radian Asset Assurance |
| RAN | — Revenue anticipation notes |
| RDA | — Redevelopment Authority |
| RDFA | — Redevelopment Finance Authority |
| REIT | — Real estate investment trust |
| ROC | — Reset option certificates |
| SAVRS | — Select auction variable rate securities |
| SBA | — Small Business Authority |
| SFHR | — Single-family housing revenue |
| SFMR | — Single-family mortgage revenue |
| SPA | — Standby purchase agreement |
| SPDR | — Standard & Poor’s Depositary Receipts |
| STRIPS | — Separate trading of registered interest and principal securities |
| TAN | — Tax anticipation notes |
| TIPS | — Treasury inflation-protected securities |
| TRAN | — Tax revenue anticipation notes |
| TTFA | — Transportation Trust Fund Authority |
| TVA | — Tennessee Valley Authority |
This page is intentionally left blank.


For more information
More information about Wells Fargo Advantage Funds is available free upon request. To obtain literature, please write, email, visit the Fund’s website, or call:
Wells Fargo Advantage Funds
P.O. Box 8266
Boston, MA 02266-8266
Email: wfaf@wellsfargo.com
Website: wellsfargoadvantagefunds.com
Individual investors: 1-800-222-8222
Retail investment professionals: 1-888-877-9275
Institutional investment professionals: 1-866-765-0778
This report and the financial statements contained herein are submitted for the general information of the shareholders of Wells Fargo Advantage Funds. If this report is used for promotional purposes, distribution of the report must be accompanied or preceded by a current prospectus. For a current prospectus and, if available, a summary prospectus containing more complete information, including charges and expenses, call 1-800-222-8222 or visit the Fund’s website at wellsfargoadvantagefunds.com. Please consider the investment objectives, risks, charges, and expenses of the investment carefully before investing. This and other information about Wells Fargo Advantage Funds can be found in the current prospectus. Read the prospectus carefully before you invest or send money.
Wells Fargo Funds Management, LLC, a wholly owned subsidiary of Wells Fargo & Company, provides investment advisory and administrative services for Wells Fargo Advantage Funds. Other affiliates of Wells Fargo & Company provide subadvisory and other services for the Funds. The Funds are distributed by Wells Fargo Funds Distributor, LLC, Member FINRA/SIPC, an affiliate of Wells Fargo & Company.
NOT FDIC INSURED ¡ NO BANK GUARANTEE ¡ MAY LOSE VALUE
© 2013 Wells Fargo Funds Management, LLC. All rights reserved.
| | |
 | | 216829 06-13 SA263/SAR263 4-13 |

Wells Fargo Advantage Asia Pacific Fund

Semi-Annual Report
April 30, 2013

Reduce clutter. Save trees.
Sign up for electronic delivery of prospectuses and shareholder reports at wellsfargo.com/advantagedelivery
Contents
The views expressed and any forward-looking statements are as of April 30, 2013, unless otherwise noted, and are those of the Fund managers and/or Wells Fargo Funds Management, LLC. Discussions of individual securities, or the markets generally, or any Wells Fargo Advantage Fund are not intended as individual recommendations. Future events or results may vary significantly from those expressed in any forward-looking statements; the views expressed are subject to change at any time in response to changing circumstances in the market. Wells Fargo Funds Management, LLC, disclaims any obligation to publicly update or revise any views expressed or forward-looking statements.
NOT FDIC INSURED ¡ NO BANK GUARANTEE ¡ MAY LOSE VALUE

Wells Fargo investment history
| | |
| 1932 | | Keystone creates one of the first mutual fund families. |
| 1971 | | Wells Fargo & Company introduces one of the first institutional index funds. |
| 1978 | | Wells Fargo applies Markowitz and Sharpe’s research on Modern Portfolio Theory to introduce one of the industry’s first tactical asset allocation models in institutional separately managed accounts. |
| 1984 | | Wells Fargo Stagecoach Funds launches its first asset allocation fund. |
| 1989 | | The Tactical Asset Allocation (TAA) Model is first applied to Wells Fargo’s asset allocation mutual funds. |
| 1994 | | Wells Fargo introduces the LifePath Funds, one of the first suites of target date funds (now the Wells Fargo Advantage Dow Jones Target Date FundsSM). |
| 1996 | | Evergreen Investments and Keystone Funds merge. |
| 1997 | | Wells Fargo launches the Wells Fargo Advantage WealthBuilder PortfoliosSM, a fund-of-funds suite of products that includes the use of quantitative models to shift assets among investment styles. |
| 1999 | | Norwest Advantage Funds and Stagecoach Funds are reorganized into Wells Fargo Funds after the merger of Norwest and Wells Fargo. |
| 2002 | | Evergreen Retail and Evergreen Institutional companies form the umbrella asset management company, Evergreen Investments. |
| 2005 | | The integration of Strong Funds with Wells Fargo Funds creates Wells Fargo Advantage Funds, resulting in one of the top 20 mutual fund companies in the United States. |
| 2006 | | Wells Fargo Advantage Funds relaunches the target date product line as Wells Fargo Advantage Dow Jones Target Date Funds. |
| 2010 | | The mergers and reorganizations of Evergreen and Wells Fargo Advantage mutual funds are completed, unifying the families under the brand of Wells Fargo Advantage Funds. |
Wells Fargo Advantage Funds®
Wells Fargo Advantage Funds skillfully guides institutions, financial advisors, and individuals through the investment terrain to help them reach their financial objectives. Everything we do on behalf of investors is backed by our unique combination of qualifications.
Strength
Our organization is built on the standards of integrity and service established by our parent company—Wells Fargo & Company—more than 150 years ago. And, because we’re part of a highly diversified financial enterprise, we offer the depth of resources to help investors succeed.
Expertise
Our multi-boutique model offers investors access to the independent thinking of premier investment managers that have been chosen for their time-tested strategies. While each team specializes in a specific investment strategy, collectively they provide investors a wide choice of distinct investment styles. Our dedication to investment excellence doesn’t end with our expertise in manager selection—risk management, analysis, and rigorous ongoing review seek to ensure each manager’s investment process remains consistent.
Partnership
Our collaborative approach is built around understanding the needs and goals of our clients. By adhering to core principles of sound judgment and steady guidance, we support you through every stage of the investment decision process.
Carefully consider the investment objectives, risks, charges, and expenses before investing. For a current prospectus and, if available, a summary prospectus, for Wells Fargo Advantage Funds, containing this and other information, visit wellsfargoadvantagefunds.com. Read it carefully before investing.
Wells Fargo Funds Management, LLC, a wholly owned subsidiary of Wells Fargo & Company, provides investment advisory and administrative services for Wells Fargo Advantage Funds. Other affiliates of Wells Fargo & Company provide subadvisory and other services for the Funds. The Funds are distributed by Wells Fargo Funds Distributor, LLC, Member FINRA/SIPC, an affiliate of Wells Fargo & Company.
“Dow Jones®” and “Dow Jones Target Date IndexesSM” are service marks of Dow Jones Trademark Holdings LLC (“Dow Jones”); have been licensed to CME Group Index Services LLC (“CME Indexes”); and have been sublicensed for use for certain purposes by Global Index Advisors, Inc., and Wells Fargo Funds Management, LLC. The Wells Fargo Advantage Dow Jones Target Date FundsSM, based on the Dow Jones Target Date Indexes, are not sponsored, endorsed, sold, or promoted by Dow Jones, CME Indexes, or their respective affiliates, and none of them makes any representation regarding the advisability of investing in such product(s).
NOT FDIC INSURED ¡ NO BANK GUARANTEE ¡ MAY LOSE VALUE
Not part of the semi-annual report.
Wells Fargo Advantage Funds offers more than 100 mutual funds across a wide range of asset classes, representing over $228 billion in assets under management, as of April 30, 2013.
| | | | |
| Equity funds | | | | |
Asia Pacific Fund | | Enterprise Fund† | | Opportunity Fund† |
C&B Large Cap Value Fund | | Global Opportunities Fund | | Precious Metals Fund |
C&B Mid Cap Value Fund | | Growth Fund | | Premier Large Company Growth Fund |
Capital Growth Fund | | Index Fund | | Small Cap Opportunities Fund |
Common Stock Fund | | International Equity Fund | | Small Cap Value Fund |
Disciplined U.S. Core Fund | | International Value Fund | | Small Company Growth Fund |
Discovery Fund† | | Intrinsic Small Cap Value Fund | | Small Company Value Fund |
Diversified Equity Fund | | Intrinsic Value Fund | | Small/Mid Cap Value Fund |
Diversified International Fund | | Intrinsic World Equity Fund | | Special Mid Cap Value Fund |
Emerging Growth Fund | | Large Cap Core Fund | | Special Small Cap Value Fund |
Emerging Markets Equity Fund | | Large Cap Growth Fund | | Specialized Technology Fund |
Emerging Markets Equity Income Fund | | Large Company Value Fund | | Traditional Small Cap Growth Fund |
Endeavor Select Fund† | | Omega Growth Fund | | Utility and Telecommunications Fund |
| Bond funds | | | | |
Adjustable Rate Government Fund | | High Yield Municipal Bond Fund | | Short Duration Government Bond Fund |
California Limited-Term Tax-Free Fund | | Income Plus Fund | | Short-Term Bond Fund |
California Tax-Free Fund | | Inflation-Protected Bond Fund | | Short-Term High Yield Bond Fund |
Colorado Tax-Free Fund | | Intermediate Tax/AMT-Free Fund | | Short-Term Municipal Bond Fund |
Conservative Income Fund | | International Bond Fund | | Strategic Income Fund |
Core Bond Fund | | Minnesota Tax-Free Fund | | Strategic Municipal Bond Fund |
Emerging Markets Local Bond Fund | | Municipal Bond Fund | | Ultra Short-Term Income Fund |
Government Securities Fund | | North Carolina Tax-Free Fund | | Ultra Short-Term Municipal Income Fund |
High Income Fund | | Pennsylvania Tax-Free Fund | | Wisconsin Tax-Free Fund |
High Yield Bond Fund | | | | |
| Asset allocation funds | | | | |
Absolute Return Fund | | WealthBuilder Equity Portfolio† | | Target 2020 Fund† |
Asset Allocation Fund | | WealthBuilder Growth Allocation Portfolio† | | Target 2025 Fund† |
Diversified Capital Builder Fund | | WealthBuilder Growth Balanced Portfolio† | | Target 2030 Fund† |
Diversified Income Builder Fund | | WealthBuilder Moderate Balanced Portfolio† | | Target 2035 Fund† |
Growth Balanced Fund | | WealthBuilder Tactical Equity Portfolio† | | Target 2040 Fund† |
Index Asset Allocation Fund | | Target Today Fund† | | Target 2045 Fund† |
Moderate Balanced Fund | | Target 2010 Fund† | | Target 2050 Fund† |
WealthBuilder Conservative Allocation Portfolio† | | Target 2015 Fund† | | Target 2055 Fund† |
| Money market funds | | | | |
100% Treasury Money Market Fund | | Heritage Money Market Fund† | | National Tax-Free Money Market Fund |
California Municipal Money Market Fund | | Money Market Fund | | Treasury Plus Money Market Fund |
Cash Investment Money Market Fund | | Municipal Cash Management Money Market Fund | | |
Government Money Market Fund | | Municipal Money Market Fund | | |
| Variable trust funds1 | | | | |
VT Discovery Fund† | | VT Intrinsic Value Fund | | VT Small Cap Growth Fund |
VT Index Asset Allocation Fund | | VT Omega Growth Fund | | VT Small Cap Value Fund |
VT International Equity Fund | | VT Opportunity Fund† | | VT Total Return Bond Fund |
An investment in a money market fund is not insured or guaranteed by the Federal Deposit Insurance Corporation or any other government agency. Although the Wells Fargo Advantage Money Market Funds seek to preserve the value of your investment at $1.00 per share, it is possible to lose money by investing in a money market fund.
| 1. | The variable trust funds are generally available only through insurance company variable contracts. |
| † | In this report, the Wells Fargo Advantage Discovery FundSM, Wells Fargo Advantage Endeavor Select FundSM, Wells Fargo Advantage Enterprise FundSM, Wells Fargo Advantage Opportunity FundSM, Wells Fargo Advantage WealthBuilder Conservative Allocation PortfolioSM, Wells Fargo Advantage WealthBuilder Equity PortfolioSM, Wells Fargo Advantage WealthBuilder Growth Allocation PortfolioSM, Wells Fargo Advantage WealthBuilder Growth Balanced PortfolioSM, Wells Fargo Advantage WealthBuilder Moderate Balanced PortfolioSM, Wells Fargo Advantage WealthBuilder Tactical Equity PortfolioSM, Wells Fargo Advantage Dow Jones Target Today FundSM, Wells Fargo Advantage Dow Jones Target 2010 FundSM, Wells Fargo Advantage Dow Jones Target 2015 FundSM, Wells Fargo Advantage Dow Jones Target 2020 FundSM, Wells Fargo Advantage Dow Jones Target 2025 FundSM, Wells Fargo Advantage Dow Jones Target 2030 FundSM, Wells Fargo Advantage Dow Jones Target 2035 FundSM, Wells Fargo Advantage Dow Jones Target 2040 FundSM, Wells Fargo Advantage Dow Jones Target 2045 FundSM, Wells Fargo Advantage Dow Jones Target 2050 FundSM, Wells Fargo Advantage Dow Jones Target 2055 FundSM, Wells Fargo Advantage Heritage Money Market FundSM, Wells Fargo Advantage VT Discovery FundSM, and Wells Fargo Advantage VT Opportunity FundSM are referred to as the Discovery Fund, Endeavor Select Fund, Enterprise Fund, Opportunity Fund, WealthBuilder Conservative Allocation Portfolio, WealthBuilder Equity Portfolio, WealthBuilder Growth Allocation Portfolio, WealthBuilder Growth Balanced Portfolio, WealthBuilder Moderate Balanced Portfolio, WealthBuilder Tactical Equity Portfolio, Target Today Fund, Target 2010 Fund, Target 2015 Fund, Target 2020 Fund, Target 2025 Fund, Target 2030 Fund, Target 2035 Fund, Target 2040 Fund, Target 2045 Fund, Target 2050 Fund, Target 2055 Fund, Heritage Money Market Fund, VT Discovery Fund, and VT Opportunity Fund, respectively. |
Not part of the semi-annual report.
| | | | |
| 2 | | Wells Fargo Advantage Asia Pacific Fund | | Letter to shareholders (unaudited) |

Karla M. Rabusch
President
Wells Fargo Advantage Funds
In Asia, both Japan and Singapore posted double-digit returns, with Japan’s market boosted by the reelection of Prime Minister Shinzo Abe.
Within emerging markets, smaller markets, such as the Philippines and Thailand, strongly outperformed the larger markets, such as China, India, and South Korea.
Dear Valued Shareholder:
We are pleased to offer you this semi-annual report for the Wells Fargo Advantage Asia Pacific Fund for the six-month period that ended April 30, 2013. Much of the period was marked by the aftereffects of the two largest economies within the region, China and Japan, changing their leadership. Continued monetary easing by global central banks helped support rallies in developed stock markets, including Japan, but major emerging markets, such as China, lagged.
Developed markets posted double-digit returns, but major emerging markets underperformed.
Global developed equity markets demonstrated continued strength throughout the reporting period despite a budget fight and sequestration cuts in the U.S. and Europe’s seemingly never-ending debt crisis, with Cyprus becoming the newest addition to a list of countries mired in debt. In Europe, investors were heartened by the resilient performance of the German economy and by the fact that the United Kingdom managed to avoid another recession. Relatively positive economic data from the U.S. also aided sentiment for Western developed stock markets.
In Asia, both Japan and Singapore posted double-digit returns, with Japan’s market boosted by the reelection of Prime Minister Shinzo Abe. Under Prime Minister Abe’s direction, the Bank of Japan (BoJ) adopted a formal annual inflation target of 2% and committed to buy bonds in unlimited quantities until it reached that target. The BoJ’s policy shift toward inflation targeting caused the yen to fall in response. The weaker yen aided Japanese stocks, especially in companies that stood to benefit from a weaker currency (such as exporters) or from rising inflation (such as real estate investment trusts). The MSCI Japan Index (Net)1 gained 30.89% for the six-month reporting period, one of the more substantial gains among major markets.
During the reporting period, China experienced a once-in-a-generation change in its political leadership, a change that was expected to be far more evolutionary than revolutionary and did not have a significant effect on the country’s stock market. Within emerging markets, smaller markets, such as the Philippines and Thailand, strongly outperformed the larger markets, such as China, India, and South Korea. The smaller markets are benefiting from high growth rates without some of the imbalances—such as an overreliance on real estate—that are affecting the larger emerging markets.
Central banks continued to provide stimulus.
The U.S. Federal Reserve Board (Fed) and the European Central Bank (ECB) continued to inject liquidity into the banks and the market through various quantitative easing policies. Because of the connections among global markets, this liquidity helped support stock markets in Asia as well. Throughout the reporting period, the Federal Open Market Committee (FOMC) kept its key interest rates effectively at zero in order to support the economy and the financial system. After its September 2012 meeting, the FOMC announced its intention to keep interest rates low until at least mid-2015 and to make open-ended purchases of $40 billion per month in mortgage-backed securities to support the housing market.
After cutting its key rate to 0.75% in July 2012, the ECB announced in September 2012 that it would purchase an unlimited amount of one- to three-year sovereign debt from countries that had formally applied for a bailout. In May 2013, after the
| | | | | | |
| Letter to shareholders (unaudited) | | Wells Fargo Advantage Asia Pacific Fund | | | 3 | |
end of the reporting period, the ECB cut its key rate to a historic low of 0.50%. The ECB’s aggressive actions helped ease investor worries about a eurozone sovereign debt default.
The BoJ took center stage toward the end of the reporting period, in mid-March 2013, after the BoJ’s governor resigned to allow Prime Minister Abe to appoint a new governor who supported using aggressive monetary policies to attack Japan’s persistent deflation.
The debt crisis in the eurozone returned to center stage but with less impact than before.
In previous reporting periods, worries about sovereign debt default in Europe had affected both developed and emerging markets around the globe, in part because of fears that such a default would lead to another global financial crisis. Although ongoing weakness in the Greek economy made it difficult for the country to meet previously agreed upon austerity targets, as central banks continued to provide liquidity, investor worries about the effect of a European sovereign debt default on the global economy began to ease. When the tiny eurozone nation of Cyprus was forced to implement capital controls and impose losses on uninsured bank depositors in March 2013, global stock markets remained resilient despite short-term volatility.
We employ a diverse array of investment strategies, even as many variables are at work in the market.
The full effect of the European credit crisis remains unknown. Elevated unemployment in the U.S. and Southern Europe continues to pressure consumers and businesses alike. As a whole, Wells Fargo Advantage Funds represents investments across a range of asset classes and investment styles, giving you an opportunity to create a diversified investment portfolio. While diversification2 may not prevent losses in a downturn, we believe it helps manage risk.
Thank you for choosing to invest with Wells Fargo Advantage Funds. We appreciate your confidence in us and remain committed to helping you meet your financial needs. For current information about your fund investments, contact your investment professional, visit our website at wellsfargoadvantagefunds.com, or call us directly at 1-800-222-8222. We are available 24 hours a day, 7 days a week.
Sincerely,

Karla M. Rabusch
President
Wells Fargo Advantage Funds
| 1. | The MSCI Japan Index is a free-float adjusted market capitalization weighted index that is designed to track the equity market performance of Japanese securities listed on Tokyo Stock Exchange, Osaka Stock Exchange, JASDAQ and Nagoya Stock Exchange. You cannot invest directly in an index. Source: MSCI. MSCI makes no express or implied warranties or representations and shall have no liability whatsoever with respect to any MSCI data contained herein. The MSCI data may not be further redistributed or used as a basis for other indexes or any securities or financial products. This report is not approved, reviewed, or produced by MSCI. |
| 2. | Diversification does not assure or guarantee better perfomance and cannot eliminate the risk of investment losses. |
| | | | |
| 4 | | Wells Fargo Advantage Asia Pacific Fund | | Performance highlights (unaudited) |
Investment objective
The Fund seeks long-term capital appreciation.
Adviser
Wells Fargo Funds Management, LLC
Subadvisers
Wells Capital Management Incorporated
Wells Capital Management Singapore
Portfolio managers
Anthony L.T. Cragg
Alison Shimada
Average annual total returns1 (%) as of April 30, 2013
| | | | | | | | | | | | | | | | | | | | | | | | | | | | | | | | | | |
| | | | | Including sales charge | | | Excluding sales charge | | | Expense ratios2 (%) | |
| | | Inception date | | 1 year | | | 5 year | | | 10 year | | | 1 year | | | 5 year | | | 10 year | | | Gross | | | Net3 | |
| Class A (WFAAX) | | 7-31-2007 | | | 13.56 | | | | (1.04 | ) | | | 13.42 | | | | 20.44 | | | | 0.14 | | | | 14.08 | | | | 1.74 | | | | 1.62 | |
| Class C (WFCAX) | | 7-31-2007 | | | 18.62 | | | | (0.61 | ) | | | 13.27 | | | | 19.62 | | | | (0.61 | ) | | | 13.27 | | | | 2.49 | | | | 2.37 | |
| Administrator Class (WFADX) | | 7-30-2010 | | | – | | | | – | | | | – | | | | 20.80 | | | | 0.26 | | | | 14.15 | | | | 1.58 | | | | 1.42 | |
| Institutional Class (WFPIX) | | 7-30-2010 | | | – | | | | – | | | | – | | | | 20.95 | | | | 0.33 | | | | 14.19 | | | | 1.31 | | | | 1.27 | |
| Investor Class (SASPX) | | 12-31-1993 | | | – | | | | – | | | | – | | | | 20.46 | | | | 0.08 | | | | 14.03 | | | | 1.80 | | | | 1.67 | |
MSCI All Country Asia Pacific
Index (Net)4 | | – | | | – | | | | – | | | | – | | | | 16.45 | | | | 1.40 | | | | 11.39 | | | | – | | | | – | |
Figures quoted represent past performance, which is no guarantee of future results and do not reflect the deduction of taxes that a shareholder may pay on fund distributions or the redemption of fund shares. Investment return and principal value of an investment will fluctuate so that an investor’s shares, when redeemed, may be worth more or less than their original cost. Performance shown without sales charges would be lower if sales charges were reflected. Current performance may be lower or higher than the performance data quoted, which assumes the reinvestment of dividends and capital gains. Current month-end performance is available on the Fund’s website, wellsfargoadvantagefunds.com.
Index returns do not include transaction costs associated with buying and selling securities, any mutual fund fees or expenses, or any taxes. It is not possible to invest directly in an index.
For Class A shares, the maximum front-end sales charge is 5.75%. For Class C shares, the maximum contingent deferred sales charge is 1.00%. Performance including sales charge assumes the sales charge for the corresponding time period. Administrator Class, Institutional Class, and Investor Class shares are sold without a front-end sales charge or contingent deferred sales charge.
Stock values fluctuate in response to the activities of individual companies and general market and economic conditions. Foreign investments are especially volatile and can rise or fall dramatically due to differences in the political and economic conditions of the host country. These risks are generally intensified in emerging markets. The use of derivatives may reduce returns and/or increase volatility. Certain investment strategies tend to increase the total risk of an investment (relative to the broader market). The Fund is exposed to regional risk, and smaller-company securities risk. Consult the Fund’s prospectus for additional information on these and other risks.
Please see footnotes on page 5.
| | | | | | |
| Performance highlights (unaudited) | | Wells Fargo Advantage Asia Pacific Fund | | | 5 | |
|
| Sector distribution5 as of April 30, 2013 |
|
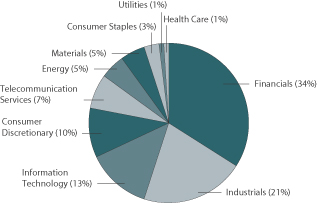
|
| | | | |
| Ten largest equity holdings6 (%) as of April 30, 2013 | |
Samsung Electronics Company Limited | | | 2.96 | |
Mitsui Fudosan Company Limited | | | 2.92 | |
Mizuho Financial Group Incorporated | | | 2.71 | |
ORIX Corporation | | | 2.49 | |
Hitachi Limited | | | 2.35 | |
Taiwan Semiconductor Manufacturing Company Limited | | | 2.26 | |
Sumitomo Mitsui Financial Group Incorporated | | | 2.21 | |
China Construction Bank | | | 2.01 | |
Mitsubishi Heavy Industries Limited | | | 1.95 | |
Industrial & Commercial Bank of China Limited Class H | | | 1.94 | |
| 1. | Historical performance shown for Class A shares prior to their inception reflects the performance of the Investor Class shares, and includes the higher expenses applicable to the Investor Class shares. If these expenses had not been included, returns would be higher. Historical performance shown for Class C shares prior to their inception reflects the performance of the Investor Class shares, adjusted to reflect the higher expenses applicable to Class C shares. Historical performance shown for the Administrator and Institutional Class shares prior to their inception reflects the performance of the Class A shares, and includes the higher expenses applicable to the Class A shares. If these expenses had not been included, returns would be higher. |
| 2. | Reflects the expense ratios as stated in the most recent prospectuses. |
| 3. | The Adviser has committed through February 28, 2014, to waive fees and/or reimburse expenses to the extent necessary to cap the Fund’s Total Annual Fund Operating Expenses After Fee Waiver, excluding certain expenses, at 1.60% for Class A, 2.35% for Class C, 1.40% for Administrator Class, 1.25% for Institutional Class, and 1.65% for Investor Class. Brokerage commissions, stamp duty fees, interest, taxes, acquired fund fees and expenses, and extraordinary expenses are excluded from the cap. Without this cap, the Fund’s returns would have been lower. |
| 4. | The Morgan Stanley Capital International (MSCI) All Country Asia Pacific Index (Net) is a total return, capitalization-weighted index that measures the performance of stock markets in 15 pacific region countries, including Australia, China, Hong Kong, India, Indonesia, Japan, Korea, Malaysia, New Zealand, Pakistan, Philippines, Singapore, Sri Lanka, Taiwan, and Thailand. You cannot invest directly in an index. Source: MSCI. MSCI makes no express or implied warranties or representations and shall have no liability whatsoever with respect to any MSCI data contained herein. The MSCI data may not be further redistributed or used as a basis for other indexes or any securities or financial products. This report is not approved, reviewed, or produced by MSCI. |
| 5. | Sector distribution is subject to change and is calculated based on the total long-term investments of the Fund. |
| 6. | The ten largest equity holdings are calculated based on the value of the securities divided by total net assets of the Fund. Holdings are subject to change and may have changed since the date specified. Top holdings typically include the underlying ordinary shares combined with any depositary receipts. |
| | | | |
| 6 | | Wells Fargo Advantage Asia Pacific Fund | | Fund expenses (unaudited) |
As a shareholder of the Fund, you incur two types of costs: (1) transaction costs, including sales charges (loads) on purchase payments and contingent deferred sales charges (if any) on redemptions and (2) ongoing costs, including management fees, distribution (12b-1) and/or shareholder service fees, and other Fund expenses. This example is intended to help you understand your ongoing costs (in dollars) of investing in the Fund and to compare these costs with the ongoing costs of investing in other mutual funds.
The example is based on an investment of $1,000 invested at the beginning of the six-month period and held for the entire period from November 1, 2012 to April 30, 2013.
Actual expenses
The “Actual” line of the table below provides information about actual account values and actual expenses. You may use the information in this line, together with the amount you invested, to estimate the expenses that you paid over the period. Simply divide your account value by $1,000 (for example, an $8,600 account value divided by $1,000 = 8.6), then multiply the result by the number in the “Actual” line under the heading entitled “Expenses paid during period” for your applicable class of shares to estimate the expenses you paid on your account during this period.
Hypothetical example for comparison purposes
The “Hypothetical” line of the table below provides information about hypothetical account values and hypothetical expenses based on the Fund’s actual expense ratio and an assumed rate of return of 5% per year before expenses, which is not the Fund’s actual return. The hypothetical account values and expenses may not be used to estimate the actual ending account balance or expenses you paid for the period. You may use this information to compare the ongoing costs of investing in the Fund and other funds. To do so, compare this 5% hypothetical example with the 5% hypothetical examples that appear in the shareholder reports of the other funds.
Please note that the expenses shown in the table are meant to highlight your ongoing costs only and do not reflect any transactional costs, such as sales charges (loads) and contingent deferred sales charges. Therefore, the “Hypothetical” line of the table is useful in comparing ongoing costs only and will not help you determine the relative total costs of owning different funds. In addition, if these transactional costs were included, your costs would have been higher.
| | | | | | | | | | | | | | | | |
| | | Beginning
account value
11-1-2012 | | | Ending
account value
4-30-2013 | | | Expenses
paid during
the period¹ | | | Net annual
expense ratio | |
Class A | | | | | | | | | | | | | | | | |
Actual | | $ | 1,000.00 | | | $ | 1,191.35 | | | $ | 8.69 | | | | 1.60 | % |
Hypothetical (5% return before expenses) | | $ | 1,000.00 | | | $ | 1,016.86 | | | $ | 8.00 | | | | 1.60 | % |
Class C | | | | | | | | | | | | | | | | |
Actual | | $ | 1,000.00 | | | $ | 1,187.58 | | | $ | 12.75 | | | | 2.35 | % |
Hypothetical (5% return before expenses) | | $ | 1,000.00 | | | $ | 1,013.14 | | | $ | 11.73 | | | | 2.35 | % |
Administrator Class | | | | | | | | | | | | | | | | |
Actual | | $ | 1,000.00 | | | $ | 1,193.59 | | | $ | 7.61 | | | | 1.40 | % |
Hypothetical (5% return before expenses) | | $ | 1,000.00 | | | $ | 1,017.85 | | | $ | 7.00 | | | | 1.40 | % |
Institutional Class | | | | | | | | | | | | | | | | |
Actual | | $ | 1,000.00 | | | $ | 1,193.90 | | | $ | 6.80 | | | | 1.25 | % |
Hypothetical (5% return before expenses) | | $ | 1,000.00 | | | $ | 1,018.60 | | | $ | 6.26 | | | | 1.25 | % |
Investor Class | | | | | | | | | | | | | | | | |
Actual | | $ | 1,000.00 | | | $ | 1,191.44 | | | $ | 8.97 | | | | 1.65 | % |
Hypothetical (5% return before expenses) | | $ | 1,000.00 | | | $ | 1,016.61 | | | $ | 8.25 | | | | 1.65 | % |
| 1. | Expenses paid is equal to the annualized expense ratio of each class multiplied by the average account value over the period, multiplied by the number of days in the most recent fiscal half-year divided by the number of days in the fiscal year (to reflect the one-half-year period). |
| | | | | | |
| Portfolio of investments—April 30, 2013 (unaudited) | | Wells Fargo Advantage Asia Pacific Fund | | | 7 | |
| | | | | | | | | | | | |
| Security name | | | | | | Shares | | | Value | |
| | | | | | | | | | | | |
| | | |
Common Stocks: 95.11% | | | | | | | | | | |
| | | |
| Australia: 4.54% | | | | | | | | | | |
Amcor Limited (Materials, Containers & Packaging) | | | | | | | 114,372 | | | $ | 1,172,652 | |
AMP Limited (Financials, Insurance) | | | | | | | 260,957 | | | | 1,460,885 | |
BHP Billiton Limited (Materials, Metals & Mining) | | | | | | | 30,000 | | | | 1,017,003 | |
National Australia Bank Limited (Financials, Commercial Banks) | | | | | | | 31,400 | | | | 1,106,781 | |
Sonic Healthcare Limited (Health Care, Health Care Providers & Services) | | | | | | | 74,400 | | | | 1,022,750 | |
Sydney Airport Holdings Llimited (Industrials, Transportation Infrastructure) | | | | | | | 558,900 | | | | 2,004,765 | |
Treasury Wine Estates Limited (Consumer Staples, Beverages) | | | | | | | 240,700 | | | | 1,457,277 | |
| | | | |
| | | | | | | | | | | 9,242,113 | |
| | | | | | | | | | | | |
| | | |
| China: 9.03% | | | | | | | | | | |
China Construction Bank (Financials, Commercial Banks) | | | | | | | 4,896,000 | | | | 4,100,952 | |
Cosco Pacific Limited (Industrials, Transportation Infrastructure) | | | | | | | 1,322,000 | | | | 1,751,275 | |
Country Garden Holdings Company Limited (Financials, Real Estate Management & Development) | | | | | | | 1,530,000 | | | | 867,509 | |
Industrial & Commercial Bank of China Limited Class H (Financials, Commercial Banks) | | | | | | | 5,618,000 | | | | 3,952,795 | |
Jiangsu Express Company Limited (Industrials, Transportation Infrastructure) | | | | | | | 1,406,000 | | | | 1,540,048 | |
PetroChina Company Limited (Energy, Oil, Gas & Consumable Fuels) | | | | | | | 1,126,000 | | | | 1,432,140 | |
Shanghai Electric Group Company Limited (Industrials, Electrical Equipment) | | | | | | | 5,162,000 | | | | 1,809,326 | |
Shenzhen Expressway Company Limited (Industrials, Transportation Infrastructure) | | | | | | | 2,676,000 | | | | 1,100,035 | |
Zhaojin Mining Industry Company Limited (Materials, Metals & Mining) | | | | | | | 812,500 | | | | 902,528 | |
Zhejiang Expressway Company Limited (Industrials, Transportation Infrastructure) | | | | | | | 1,172,000 | | | | 921,271 | |
| | | | |
| | | | | | | | | | | 18,377,879 | |
| | | | | | | | | | | | |
| | | |
| Hong Kong: 5.13% | | | | | | | | | | |
Bosideng International Holdings Limited (Consumer Discretionary, Textiles, Apparel & Luxury Goods) | | | | | | | 3,108,000 | | | | 817,036 | |
CNOOC Limited (Energy, Oil, Gas & Consumable Fuels) | | | | | | | 675,000 | | | | 1,259,512 | |
First Pacific Company Limited (Financials, Diversified Financial Services) | | | | | | | 2,388,000 | | | | 3,304,977 | |
L’Occitane International SA (Consumer Discretionary, Personal Products) | | | | | | | 527,000 | | | | 1,527,999 | |
SmarTone Telecommunications Holding Limited (Telecommunication Services, Wireless
Telecommunication Services) | | | | | | | 523,500 | | | | 932,298 | |
Termbray Petro-King Oilfield Services Limited (Energy, Energy Equipment & Services) † | | | | | | | 1,796,000 | | | | 1,110,906 | |
Tianneng Power International Limited (Consumer Discretionary, Auto Components) | | | | | | | 1,558,000 | | | | 985,777 | |
Youyuan International Holdings Limited (Materials, Paper & Forest Products) | | | | | | | 1,845,000 | | | | 511,169 | |
| | | | |
| | | | | | | | | | | 10,449,674 | |
| | | | | | | | | | | | |
| | | |
| India: 5.20% | | | | | | | | | | |
Bharti Airtel Limited (Telecommunication Services, Wireless Telecommunication Services) | | | | | | | 198,300 | | | | 1,173,237 | |
Bharti Infratel Limited (Industrials, Construction & Engineering) † | | | | | | | 320,588 | | | | 1,058,015 | |
Cairn India Limited (Energy, Oil, Gas & Consumable Fuels) | | | | | | | 183,800 | | | | 1,064,419 | |
Coal India Limited (Energy, Oil, Gas & Consumable Fuels) | | | | | | | 252,900 | | | | 1,498,388 | |
Cox & Kings Limited (Consumer Discretionary, Hotels, Restaurants & Leisure) | | | | | | | 207,900 | | | | 497,995 | |
Emami Limited (Consumer Staples, Personal Products) | | | | | | | 52,300 | | | | 625,591 | |
ICICI Bank Limited (Financials, Commercial Banks) | | | | | | | 50,000 | | | | 1,079,954 | |
Indusind Bank Limited (Financials, Commercial Banks) | | | | | | | 121,000 | | | | 1,050,538 | |
Maruti Suzuki India Limited (Consumer Discretionary, Automobiles) | | | | | | | 53,449 | | | | 1,656,398 | |
State Bank of India Limited (Financials, Commercial Banks) | | | | | | | 21,100 | | | | 886,807 | |
| | | | |
| | | | | | | | | | | 10,591,342 | |
| | | | | | | | | | | | |
The accompanying notes are an integral part of these financial statements.
| | | | |
| 8 | | Wells Fargo Advantage Asia Pacific Fund | | Portfolio of investments—April 30, 2013 (unaudited) |
| | | | | | | | | | | | |
| Security name | | | | | | Shares | | | Value | |
| | | | | | | | | | | | |
| | | |
| Indonesia: 3.93% | | | | | | | | | | |
PT Bank Rakyat Indonesia Tbk (Financials, Commercial Banks) | | | | | | | 1,063,000 | | | $ | 1,027,740 | |
PT Garuda Indonesia Persero Tbk (Industrials, Airlines) † | | | | | | | 22,216,000 | | | | 1,439,556 | |
PT Gudang Garam Tbk (Consumer Staples, Tobacco) | | | | | | | 298,500 | | | | 1,516,678 | |
PT Indomobil Sukses Internasional Tbk (Consumer Discretionary, Specialty Retail) | | | | | | | 1,765,000 | | | | 962,150 | |
PT Lippo Karawaci Terbuka Tbk (Financials, Real Estate Management & Development) | | | | | | | 7,206,000 | | | | 1,000,576 | |
PT Matahari Department Store Tbk (Consumer Discretionary, Multiline Retail) † | | | | | | | 348,200 | | | | 433,347 | |
PT Telekomunikasi Indonesia Tbk (Telecommunication Services, Diversified Telecommunication Services) | | | | | | | 1,343,000 | | | | 1,616,158 | |
| | | | |
| | | | | | | | | | | 7,996,205 | |
| | | | | | | | | | | | |
| | | |
| Japan: 35.47% | | | | | | | | | | |
Canon Incorporated (Information Technology, Office Electronics) | | | | | | | 70,000 | | | | 2,509,617 | |
Dynam Japan Holdings Corporation Limited (Consumer Discretionary, Hotels, Restaurants & Leisure) | | | | | | | 551,600 | | | | 945,379 | |
Fuji Heavy Industries Limited (Consumer Discretionary, Automobiles) | | | | | | | 116,000 | | | | 2,189,465 | |
GLP J-REIT (Financials, REITs) | | | | | | | 2,750 | | | | 2,832,231 | |
Hitachi Limited (Information Technology, Electronic Equipment, Instruments & Components) | | | | | | | 749,000 | | | | 4,778,971 | |
Honda Motor Company Limited (Consumer Discretionary, Automobiles) | | | | | | | 50,800 | | | | 2,019,285 | |
Industrial & Infrastructure Fund Investment Corporation (Financials, REITs) | | | | | | | 95 | | | | 1,008,617 | |
Japan Airlines Company Limited (Industrials, Airlines) | | | | | | | 32,200 | | | | 1,631,718 | |
Japan Retail Fund Investment Corporation (Financials, REITs) | | | | | | | 460 | | | | 1,090,014 | |
JFE Holdings Incorporated (Materials, Metals & Mining) | | | | | | | 124,100 | | | | 2,683,518 | |
Makita Corporation (Industrials, Machinery) | | | | | | | 59,400 | | | | 3,613,294 | |
Marubeni Corporation (Industrials, Trading Companies & Distributors) | | | | | | | 201,000 | | | | 1,437,113 | |
Mitsubishi Corporation (Industrials, Trading Companies & Distributors) | | | | | | | 95,500 | | | | 1,712,407 | |
Mitsubishi Electric Corporation (Industrials, Electrical Equipment) | | | | | | | 337,000 | | | | 3,208,042 | |
Mitsubishi Heavy Industries Limited (Industrials, Machinery) | | | | | | | 576,000 | | | | 3,964,671 | |
Mitsui Fudosan Company Limited (Financials, Real Estate Management & Development) | | | | | | | 175,000 | | | | 5,941,940 | |
Mizuho Financial Group Incorporated (Financials, Commercial Banks) | | | | | | | 2,499,000 | | | | 5,511,463 | |
Modec Incorporated (Energy, Energy Equipment & Services) | | | | | | | 106,000 | | | | 3,043,484 | |
Nippon Telegraph & Telephone Corporation (Telecommunication Services,
Diversified Telecommunication Services) | | | | | | | 56,100 | | | | 2,776,658 | |
Nissan Motor Company Limited (Consumer Discretionary, Automobiles) | | | | | | | 314,600 | | | | 3,278,798 | |
ORIX Corporation (Financials, Consumer Finance) | | | | | | | 329,700 | | | | 5,059,560 | |
Osaka Securities Exchange Company (Financials, Diversified Financial Services) | | | | | | | 14,200 | | | | 1,742,135 | |
Sumitomo Mitsui Financial Group Incorporated (Financials, Commercial Banks) | | | | | | | 95,200 | | | | 4,497,061 | |
Sumitomo Mitsui Trust Holdings Incorporated (Financials, Commercial Banks) | | | | | | | 486,000 | | | | 2,437,852 | |
THK Company Limited (Industrials, Machinery) | | | | | | | 109,600 | | | | 2,301,392 | |
| | | | |
| | | | | | | | | | | 72,214,685 | |
| | | | | | | | | | | | |
| | | |
| Malaysia: 3.55% | | | | | | | | | | |
Asiatic Development Bhd (Consumer Staples, Food Products) | | | | | | | 351,000 | | | | 987,530 | |
Berjaya Sports Toto Bhd (Consumer Discretionary, Hotels, Restaurants & Leisure) | | | | | | | 743,600 | | | | 1,026,498 | |
Eastern & Oriental Bhd (Financials, Real Estate Management & Development) | | | | | | | 2,668,300 | | | | 1,447,065 | |
SP Setia Bhd (Financials, Real Estate Management & Development) | | | | | | | 1,664,600 | | | | 1,876,607 | |
Tan Chong Motor Holdings Bhd (Consumer Discretionary, Automobiles) | | | | | | | 257,000 | | | | 458,672 | |
UEM Land Holdings Bhd (Financials, Real Estate Management & Development) † | | | | | | | 1,730,500 | | | | 1,427,627 | |
| | | | |
| | | | | | | | | | | 7,223,999 | |
| | | | | | | | | | | | |
| | | |
| New Zealand: 2.01% | | | | | | | | | | |
Auckland International Airport Limited (Industrials, Transportation Infrastructure) | | | | | | | 551,000 | | | | 1,464,098 | |
Sky City Entertainment Group Limited (Consumer Discretionary, Hotels, Restaurants & Leisure) | | | | | | | 275,200 | | | | 1,052,059 | |
The accompanying notes are an integral part of these financial statements.
| | | | | | |
| Portfolio of investments—April 30, 2013 (unaudited) | | Wells Fargo Advantage Asia Pacific Fund | | | 9 | |
| | | | | | | | | | | | |
| Security name | | | | | | Shares | | | Value | |
| | | | | | | | | | | | |
| | | |
| New Zealand (continued) | | | | | | | | | | |
Telecom Corporation of New Zealand Limited (Telecommunication Services,
Diversified Telecommunication Services)« | | | | | | | 708,100 | | | $ | 1,581,099 | |
| | | | |
| | | | | | | | | | | 4,097,256 | |
| | | | | | | | | | | | |
| | | |
| Philippines: 3.52% | | | | | | | | | | |
D&L Industries Incorporated (Materials, Chemicals) † | | | | | | | 8,299,000 | | | | 1,530,355 | |
GT Capital Holdings Incorporated (Financials, Diversified Financial Services) | | | | | | | 77,300 | | | | 1,485,527 | |
LT Group Incorporated (Consumer Staples, Beverages) † | | | | | | | 563,000 | | | | 332,383 | |
Philippine Long Distance Telephone Company (Telecommunication Services, Wireless Telecommunication Services) | | | | | | | 27,345 | | | | 2,023,636 | |
Semirara Mining Corporation (Energy, Oil, Gas & Consumable Fuels) | | | | | | | 245,800 | | | | 1,791,545 | |
| | | | |
| | | | | | | | | | | 7,163,446 | |
| | | | | | | | | | | | |
| | | | |
| Singapore: 8.13% | | | | | | | | | | | | |
AIMS AMP Capital Industrial REIT( Financials, REITs) | | | | | | | 200,000 | | | | 295,527 | |
CapitaLand Limited (Financials, Real Estate Management & Development) | | | | | | | 318,000 | | | | 965,592 | |
CSE Global Limited (Information Technology, IT Services) | | | | | | | 1,498,000 | | | | 1,027,693 | |
CWT Limited (Industrials, Air Freight & Logistics) | | | | | | | 600,000 | | | | 825,688 | |
Dyna-Mac Holdings Limited (Industrials, Construction & Engineering) | | | | | | | 2,305,000 | | | | 823,415 | |
Global Logistic Properties Limited (Financials, Real Estate Management & Development) | | | | | | | 876,000 | | | | 1,962,946 | |
Hutchison Port Holdings Trust (Industrials, Transportation Infrastructure) | | | | | | | 2,483,000 | | | | 2,060,890 | |
Keppel Corporation Limited (Industrials, Industrial Conglomerates) | | | | | | | 107,000 | | | | 930,397 | |
Keppel REIT (Financials, REITs) | | | | | | | 21,400 | | | | 26,235 | |
Religare Health Trust (Financials, REITs) † | | | | | | | 2,003,000 | | | | 1,544,897 | |
SIA Engineering Company (Industrials, Transportation Infrastructure) | | | | | | | 382,000 | | | | 1,569,311 | |
Singapore Airport Terminal Services Limited (Industrials, Transportation Infrastructure) | | | | | | | 407,000 | | | | 1,040,878 | |
STX OSV Holdings Limited (Industrials, Machinery) | | | | | | | 3,038,000 | | | | 2,540,505 | |
Venture Corporation Limited (Information Technology, Electronic Equipment,
Instruments & Components) | | | | | | | 140,000 | | | | 945,685 | |
| | | | |
| | | | | | | | | | | 16,559,659 | |
| | | | | | | | | | | | |
| | | | |
| South Korea: 5.69% | | | | | | | | | | | | |
Kangwon Land Incorporated (Consumer Discretionary, Hotels, Restaurants & Leisure) | | | | | | | 36,000 | | | | 1,029,174 | |
Korea Electric Power Corporation (Utilities, Electric Utilities) † | | | | | | | 48,600 | | | | 1,396,704 | |
KT Corporation (Telecommunication Services, Diversified Telecommunication Services) | | | | | | | 31,000 | | | | 1,027,666 | |
Samsung Electronics Company Limited (Information Technology, Semiconductors & Semiconductor Equipment) | | | | | | | 4,360 | | | | 6,017,616 | |
SK Telecom Company Limited (Telecommunication Services, Wireless Telecommunication Services) | | | | | | | 12,000 | | | | 2,108,417 | |
| | | | |
| | | | | | | | | | | 11,579,577 | |
| | | | | | | | | | | | |
| | | | |
| Taiwan: 4.95% | | | | | | | | | | | | |
ASUSTeK Computer Incorporated (Information Technology, Computers & Peripherals) | | | | | | | 97,000 | | | | 1,129,015 | |
Chroma ATE Incorporated (Information Technology, Electronic Equipment, Instruments & Components) | | | | | | | 309,000 | | | | 662,771 | |
Cleanaway Company Limited (Industrials, Commercial Services & Supplies) | | | | | | | 204,000 | | | | 1,658,986 | |
Taiwan Semiconductor Manufacturing Company Limited (Information Technology,
Semiconductors & Semiconductor Equipment) | | | | | | | 1,241,000 | | | | 4,604,551 | |
United Microelectronics Corporation ADR (Information Technology, Semiconductors & Semiconductor Equipment)« | | | | | | | 1,064,400 | | | | 2,011,716 | |
| | | | |
| | | | | | | | | | | 10,067,039 | |
| | | | | | | | | | | | |
The accompanying notes are an integral part of these financial statements.
| | | | |
| 10 | | Wells Fargo Advantage Asia Pacific Fund | | Portfolio of investments—April 30, 2013 (unaudited) |
| | | | | | | | | | | | | | | | |
| Security name | | | | | | | | Shares | | | Value | |
| | | | | | | | | | | | | | | | |
| | | | |
| Thailand: 3.20% | | | | | | | | | | | | | | | | |
Major Cineplex Group PCL (Consumer Discretionary, Media) | | | | | | | | | | | 2,334,400 | | | $ | 1,765,713 | |
Malee Sampran PCL (Consumer Staples, Food Products) | | | | | | | | | | | 225,300 | | | | 529,666 | |
PTT Global Chemical PCL (Materials, Chemicals) | | | | | | | | | | | 823,100 | | | | 2,047,233 | |
Shin Corporation PCL (Information Technology, Communications Equipment) | | | | | | | | | | | 560,000 | | | | 1,645,656 | |
Shin Corporation PCL ADR Non-Voting (Information Technology, Communications Equipment) | | | | | | | | | | | 180,000 | | | | 528,961 | |
| | | | |
| | | | | | | | | | | | | | | 6,517,229 | |
| | | | | | | | | | | | | | | | |
| | | | |
| United Kingdom: 0.76% | | | | | | | | | | | | | | | | |
HSBC Holdings plc (Financials, Commercial Banks) | | | | | | | | | | | 141,200 | | | | 1,537,522 | |
| | | | | | | | | | | | | | | | |
| | | | |
Total Common Stocks (Cost $167,701,292) | | | | | | | | | | | | | | | 193,617,625 | |
| | | | | | | | | | | | | | | | |
| | | | |
| | | | | | Expiration date | | | | | | | |
| | | | |
Warrants: 2.64% | | | | | | | | | | | | | | | | |
| | | | |
| United Kingdom: 2.64% | | | | | | | | | | | | | | | | |
HSBC Bank plc (Financials, Commercial Banks) † | | | | | | | 2-19-2019 | | | | 180,000 | | | | 435,037 | |
HSBC Bank plc (Financials, Commercial Banks) † | | | | | | | 6-8-2020 | | | | 702,500 | | | | 1,460,835 | |
HSBC Bank plc (Financials, Commercial Banks) † | | | | | | | 6-11-2020 | | | | 134,344 | | | | 600,789 | |
HSBC Bank plc (Financials, Commercial Banks) † | | | | | | | 8-20-2020 | | | | 693,500 | | | | 1,420,746 | |
HSBC Bank plc (Financials, Commercial Banks) † | | | | | | | 2-20-2023 | | | | 749,900 | | | | 1,469,391 | |
| | | | |
Total Warrants (Cost $5,551,532) | | | | | | | | | | | | | | | 5,386,798 | |
| | | | | | | | | | | | | | | | |
| | | | |
| | | Yield | | | | | | | | | | |
| Short-Term Investments: 3.36% | | | | | | | | | | | | | | | | |
| | | | |
| Investment Companies: 3.36% | | | | | | | | | | | | | | | | |
Wells Fargo Advantage Cash Investment Money Market Fund, Select Class (l)(u) | | | 0.13 | % | | | | | | | 4,596,355 | | | | 4,596,355 | |
Wells Fargo Securities Lending Cash Investments, LLC (l)(r)(u)(v) | | | 0.18 | | | | | | | | 2,239,437 | | | | 2,239,437 | |
| | | | |
Total Short-Term Investments (Cost $6,835,792) | | | | | | | | | | | | | | | 6,835,792 | |
| | | | | | | | | | | | | | | | |
| | | | | | | | |
Total investments in securities
(Cost $180,088,616) * | | | 101.11 | % | | | 205,840,215 | |
Other assets and liabilities, net | | | (1.11 | ) | | | (2,265,964 | ) |
| | | | | | | | |
| Total net assets | | | 100.00 | % | | $ | 203,574,251 | |
| | | | | | | | |
| † | Non-income-earning security |
| « | All or a portion of this security is on loan. |
| (l) | Investment in an affiliate |
| (u) | Rate shown is the 7-day annualized yield at period end. |
| (r) | The investment company is exempt from registration under Section 3(c)(7) of the Investment Company Act of 1940, as amended. |
| (v) | Security represents investment of cash collateral received from securities on loan. |
| * | Cost for federal income tax purposes is $184,082,444 and unrealized appreciation (depreciation) consists of: |
| | | | |
Gross unrealized appreciation | | $ | 29,687,932 | |
Gross unrealized depreciation | | | (7,930,161 | ) |
| | | | |
Net unrealized appreciation | | $ | 21,757,771 | |
The accompanying notes are an integral part of these financial statements.
| | | | | | |
| Statement of assets and liabilities—April 30, 2013 (unaudited) | | Wells Fargo Advantage Asia Pacific Fund | | | 11 | |
| | | | |
| | | | |
| |
Assets | | | | |
Investments | | | | |
In unaffiliated securities (including securities on loan), at value (see cost below) | | $ | 199,004,423 | |
In affiliated securities, at value (see cost below) | | | 6,835,792 | |
| | | | |
Total investments, at value (see cost below) | | | 205,840,215 | |
Foreign currency, at value (see cost below) | | | 1,601,682 | |
Receivable for investments sold | | | 2,369,456 | |
Receivable for Fund shares sold | | | 147,763 | |
Receivable for dividends | | | 778,577 | |
Receivable for securities lending income | | | 1,015 | |
Prepaid expenses and other assets | | | 36,018 | |
| | | | |
Total assets | | | 210,774,726 | |
| | | | |
| |
Liabilities | | | | |
Payable for investments purchased | | | 3,619,749 | |
Payable for Fund shares redeemed | | | 1,066,324 | |
Payable upon receipt of securities loaned | | | 2,239,437 | |
Advisory fee payable | | | 130,854 | |
Distribution fees payable | | | 1,259 | |
Due to other related parties | | | 57,549 | |
Accrued expenses and other liabilities | | | 85,303 | |
| | | | |
Total liabilities | | | 7,200,475 | |
| | | | |
Total net assets | | $ | 203,574,251 | |
| | | | |
| |
NET ASSETS CONSIST OF | | | | |
Paid-in capital | | $ | 314,234,675 | |
Overdistributed net investment income | | | (3,195,093 | ) |
Accumulated net realized losses on investments | | | (133,211,671 | ) |
Net unrealized gains on investments | | | 25,746,340 | |
| | | | |
Total net assets | | $ | 203,574,251 | |
| | | | |
| |
COMPUTATION OF NET ASSET VALUE AND OFFERING PRICE PER SHARE1 | | | | |
Net assets – Class A | | $ | 7,082,555 | |
Shares outstanding – Class A | | | 604,733 | |
Net asset value per share – Class A | | | $11.71 | |
Maximum offering price per share – Class A2 | | | $12.42 | |
Net assets – Class C | | $ | 2,083,524 | |
Shares outstanding – Class C | | | 186,257 | |
Net asset value per share – Class C | | | $11.19 | |
Net assets – Administrator Class | | $ | 14,823,223 | |
Shares outstanding – Administrator Class | | | 1,287,144 | |
Net asset value per share – Administrator Class | | | $11.52 | |
Net assets – Institutional Class | | $ | 39,827 | |
Shares outstanding – Institutional Class | | | 3,458 | |
Net asset value per share – Institutional Class | | | $11.52 | |
Net assets – Investor Class | | $ | 179,545,122 | |
Shares outstanding – Investor Class | | | 15,559,431 | |
Net asset value per share – Investor Class | | | $11.54 | |
| |
Investments in unaffiliated securities (including securities on loan), at cost | | $ | 173,252,824 | |
| | | | |
Investments in affiliated securities, at cost | | $ | 6,835,792 | |
| | | | |
Total investments, at cost | | $ | 180,088,616 | |
| | | | |
Securities on loan, at value | | $ | 2,076,660 | |
| | | | |
Foreign currency, at cost | | $ | 1,590,622 | |
| | | | |
| 1. | The Fund has an unlimited number of authorized shares. |
| 2. | Maximum offering price is computed as 100/94.25 of net asset value. On investments of $50,000 or more, the offering price is reduced. |
The accompanying notes are an integral part of these financial statements.
| | | | |
| 12 | | Wells Fargo Advantage Asia Pacific Fund | | Statement of operations—six months ended April 30, 2013 (unaudited) |
| | | | |
| | | | |
| |
Investment income | | | | |
Dividends * | | $ | 1,818,238 | |
Securities lending income, net | | | 40,375 | |
Income from affiliated securities | | | 3,443 | |
Interest | | | 35 | |
| | | | |
Total investment income | | | 1,862,091 | |
| | | | |
| |
Expenses | | | | |
Advisory fee | | | 992,241 | |
Administration fees | | | | |
Fund level | | | 47,364 | |
Class A | | | 9,096 | |
Class C | | | 2,415 | |
Administrator Class | | | 6,826 | |
Institutional Class | | | 7 | |
Investor Class | | | 267,093 | |
Shareholder servicing fees | | | | |
Class A | | | 8,746 | |
Class C | | | 2,322 | |
Administrator Class | | | 15,495 | |
Investor Class | | | 205,774 | |
Distribution fees | | | | |
Class C | | | 6,966 | |
Custody and accounting fees | | | 80,650 | |
Professional fees | | | 20,848 | |
Registration fees | | | 35,738 | |
Shareholder report expenses | | | 43,629 | |
Trustees’ fees and expenses | | | 6,311 | |
Other fees and expenses | | | 14,214 | |
| | | | |
Total expenses | | | 1,765,735 | |
Less: Fee waivers and/or expense reimbursements | | | (215,076 | ) |
| | | | |
Net expenses | | | 1,550,659 | |
| | | | |
Net investment income | | | 311,432 | |
| | | | |
| |
REALIZED AND UNREALIZED GAINS (LOSSES) ON INVESTMENTS | | | | |
Net realized gains on investments | | | 17,489,949 | |
Net change in unrealized gains (losses) on investments | | | 15,622,690 | |
| | | | |
Net realized and unrealized gains (losses) on investments | | | 33,112,639 | |
| | | | |
Net increase in net assets resulting from operations | | $ | 33,424,071 | |
| | | | |
| |
* Net of foreign dividend withholding taxes in the amount of | | | $165,919 | |
The accompanying notes are an integral part of these financial statements.
| | | | | | |
| Statement of changes in net assets | | Wells Fargo Advantage Asia Pacific Fund | | | 13 | |
| | | | | | | | | | | | | | | | |
| | | Six months ended April 30, 2013 (unaudited) | | | Year ended October 31, 2012 | |
| | | | |
Operations | | | | | | | | | | | | | | | | |
Net investment income | | | | | | $ | 311,432 | | | | | | | $ | 2,670,805 | |
Net realized gains (losses) on investments | | | | | | | 17,489,949 | | | | | | | | (9,105,718 | ) |
Net change in unrealized gains (losses) on investments | | | | | | | 15,622,690 | | | | | | | | 21,109,646 | |
| | | | | | | | | | | | | | | | |
Net increase in net assets resulting from operations | | | | | | | 33,424,071 | | | | | | | | 14,674,733 | |
| | | | | | | | | | | | | | | | |
| | | | |
Distributions to shareholders from | | | | | | | | | | | | | | | | |
Net investment income | | | | | | | | | | | | | | | | |
Class A | | | | | | | (242,199 | ) | | | | | | | 0 | |
Class C | | | | | | | (55,133 | ) | | | | | | | (4,466 | ) |
Administrator Class | | | | | | | (517,420 | ) | | | | | | | (180,458 | ) |
Institutional Class | | | | | | | (488 | ) | | | | | | | (165 | ) |
Investor Class | | | | | | | (5,920,195 | ) | | | | | | | (1,715,646 | ) |
| | | | | | | | | | | | | | | | |
Total distributions to shareholders | | | | | | | (6,735,435 | ) | | | | | | | (1,900,735 | ) |
| | | | | | | | | | | | | | | | |
| | | Shares | | | | | | Shares | | | | |
Capital share transactions | | | | | | | | | | | | | | | | |
Proceeds from shares sold | | | | | | | | | | | | | | | | |
Class A | | | 290,030 | | | | 3,098,543 | | | | 283,043 | | | | 2,752,406 | |
Class C | | | 30,068 | | | | 312,756 | | | | 72,771 | | | | 668,114 | |
Administrator Class | | | 230,855 | | | | 2,442,458 | | | | 462,654 | | | | 4,454,889 | |
Institutional Class | | | 2,249 | | | | 24,952 | | | | 376 | | | | 3,321 | |
Investor Class | | | 2,401,977 | | | | 25,547,596 | | | | 1,721,079 | | | | 16,356,712 | |
| | | | | | | | | | | | | | | | |
| | | | | | | 31,426,305 | | | | | | | | 24,235,442 | |
| | | | | | | | | | | | | | | | |
Reinvestment of distributions | | | | | | | | | | | | | | | | |
Class A | | | 19,589 | | | | 201,959 | | | | 0 | | | | 0 | |
Class C | | | 3,990 | | | | 39,420 | | | | 467 | | | | 3,886 | |
Administrator Class | | | 46,860 | | | | 474,690 | | | | 19,583 | | | | 166,851 | |
Institutional Class | | | 48 | | | | 488 | | | | 19 | | | | 165 | |
Investor Class | | | 551,264 | | | | 5,600,848 | | | | 181,106 | | | | 1,546,646 | |
| | | | | | | | | | | | | | | | |
| | | | | | | 6,317,405 | | | | | | | | 1,717,548 | |
| | | | | | | | | | | | | | | | |
Payment for shares redeemed | | | | | | | | | | | | | | | | |
Class A | | | (264,101 | ) | | | (2,907,183 | ) | | | (3,056,737 | ) | | | (27,310,428 | ) |
Class C | | | (19,678 | ) | | | (206,823 | ) | | | (43,135 | ) | | | (400,836 | ) |
Administrator Class | | | (270,863 | ) | | | (2,867,798 | ) | | | (705,282 | ) | | | (6,676,833 | ) |
Institutional Class | | | 0 | | | | 0 | | | | (375 | ) | | | (3,637 | ) |
Investor Class | | | (2,814,233 | ) | | | (30,118,322 | ) | | | (4,783,428 | ) | | | (45,231,217 | ) |
| | | | | | | | | | | | | | | | |
| | | | | | | (36,100,126 | ) | | | | | | | (79,622,951 | ) |
| | | | | | | | | | | | | | | | |
Net increase (decrease) in net assets resulting from capital share transactions | | | | | | | 1,643,584 | | | | | | | | (53,669,961 | ) |
| | | | | | | | | | | | | | | | |
Total increase (decrease) in net assets | | | | | | | 28,332,220 | | | | | | | | (40,895,963 | ) |
| | | | | | | | | | | | | | | | |
| | | | |
Net assets | | | | | | | | | | | | | | | | |
Beginning of period | | | | | | | 175,242,031 | | | | | | | | 216,137,994 | |
| | | | | | | | | | | | | | | | |
End of period | | | | | | $ | 203,574,251 | | | | | | | $ | 175,242,031 | |
| | | | | | | | | | | | | | | | |
Undistributed (overdistributed) net investment income | | | | | | $ | (3,195,093 | ) | | | | | | $ | 3,228,910 | |
| | | | | | | | | | | | | | | | |
The accompanying notes are an integral part of these financial statements.
| | | | |
| 14 | | Wells Fargo Advantage Asia Pacific Fund | | Financial highlights |
(For a share outstanding throughout each period)
| | | | | | | | | | | | | | | | | | | | | | | | | | | | |
| | | Six months ended
April 30, 2013 (unaudited) | | | Year ended October 31 | | | Year ended September 30 | |
| CLASS A | | | 2012 | | | 2011 | | | 20101 | | | 2010 | | | 2009 | | | 2008 | |
Net asset value, beginning of period | | $ | 10.19 | | | $ | 9.30 | | | $ | 10.15 | | | $ | 9.77 | | | $ | 8.82 | | | $ | 8.14 | | | $ | 15.83 | |
Net investment income (loss) | | | 0.02 | 2 | | | 0.10 | 2 | | | 0.08 | 2 | | | (0.01 | )2 | | | 0.04 | 2 | | | 0.11 | 2 | | | 0.09 | 2 |
Net realized and unrealized gains (losses)
on investments | | | 1.88 | | | | 0.79 | | | | (0.89 | ) | | | 0.39 | | | | 1.05 | | | | 0.59 | | | | (5.20 | ) |
| | | | | | | | | | | | | | | | | | | | | | | | | | | | |
Total from investment operations | | | 1.90 | | | | 0.89 | | | | (0.81 | ) | | | 0.38 | | | | 1.09 | | | | 0.70 | | | | (5.11 | ) |
Distributions to shareholders from | | | | | | | | | | | | | | | | | | | | | | | | | | | | |
Net investment income | | | (0.38 | ) | | | 0.00 | | | | (0.04 | ) | | | 0.00 | | | | (0.14 | ) | | | (0.02 | ) | | | 0.00 | |
Net realized gains | | | 0.00 | | | | 0.00 | | | | 0.00 | | | | 0.00 | | | | 0.00 | | | | 0.00 | | | | (2.58 | ) |
| | | | | | | | | | | | | | | | | | | | | | | | | | | | |
Total distributions to shareholders | | | (0.38 | ) | | | 0.00 | | | | (0.04 | ) | | | 0.00 | | | | (0.14 | ) | | | (0.02 | ) | | | (2.58 | ) |
Net asset value, end of period | | $ | 11.71 | | | $ | 10.19 | | | $ | 9.30 | | | $ | 10.15 | | | $ | 9.77 | | | $ | 8.82 | | | $ | 8.14 | |
Total return3 | | | 19.14 | % | | | 9.57 | % | | | (7.97 | )% | | | 3.89 | % | | | 12.58 | % | | | 8.64 | % | | | (38.53 | )% |
Ratios to average net assets (annualized) | | | | | | | | | | | | | | | | | | | | | | | | | | | | |
Gross expenses | | | 1.82 | % | | | 1.86 | % | | | 1.73 | % | | | 1.90 | % | | | 1.90 | % | | | 2.03 | % | | | 1.99 | % |
Net expenses | | | 1.60 | % | | | 1.60 | % | | | 1.60 | % | | | 1.60 | % | | | 1.59 | % | | | 1.60 | % | | | 1.60 | % |
Net investment income (loss) | | | 0.39 | % | | | 1.04 | % | | | 0.83 | % | | | (0.91 | )% | | | 0.49 | % | | | 1.56 | % | | | 0.77 | % |
Supplemental data | | | | | | | | | | | | | | | | | | | | | | | | | | | | |
Portfolio turnover rate | | | 96 | % | | | 163 | % | | | 196 | % | | | 11 | % | | | 137 | % | | | 185 | % | | | 187 | % |
Net assets, end of period (000s omitted) | | | $7,083 | | | | $5,699 | | | | $31,000 | | | | $63,741 | | | | $62,700 | | | | $85,156 | | | | $43,946 | |
| 1. | For the one month ended October 31, 2010. The Fund changed its fiscal year end from September 30 to October 31, effective October 31, 2010. |
| 2. | Calculated based upon average shares outstanding |
| 3. | Total return calculations do not include any sales charges. Returns for periods of less than one year are not annualized. |
The accompanying notes are an integral part of these financial statements.
| | | | | | |
| Financial highlights | | Wells Fargo Advantage Asia Pacific Fund | | | 15 | |
(For a share outstanding throughout each period)
| | | | | | | | | | | | | | | | | | | | | | | | | | | | |
| | | Six months ended
April 30, 2013 (unaudited) | | | Year ended October 31 | | | Year ended September 30 | |
| CLASS C | | | 2012 | | | 2011 | | | 20101 | | | 2010 | | | 2009 | | | 2008 | |
Net asset value, beginning of period | | $ | 9.73 | | | $ | 8.98 | | | $ | 9.96 | | | $ | 9.59 | | | $ | 8.67 | | | $ | 8.05 | | | $ | 15.81 | |
Net investment income (loss) | | | (0.02 | )2 | | | 0.09 | 2 | | | 0.01 | | | | (0.01 | )2 | | | (0.01 | )2 | | | 0.05 | 2 | | | 0.04 | 2 |
Net realized and unrealized gains (losses) on investments | | | 1.80 | | | | 0.69 | | | | (0.86 | ) | | | 0.38 | | | | 1.03 | | | | 0.57 | | | | (5.22 | ) |
| | | | | | | | | | | | | | | | | | | | | | | | | | | | |
Total from investment operations | | | 1.78 | | | | 0.78 | | | | (0.85 | ) | | | 0.37 | | | | 1.02 | | | | 0.62 | | | | 5.18 | |
Distributions to shareholders from | | | | | | | | | | | | | | | | | | | | | | | | | | | | |
Net investment income | | | (0.32 | ) | | | (0.03 | ) | | | (0.13 | ) | | | 0.00 | | | | (0.10 | ) | | | 0.00 | | | | 0.00 | |
Net realized gains | | | 0.00 | | | | 0.00 | | | | 0.00 | | | | 0.00 | | | | 0.00 | | | | 0.00 | | | | (2.58 | ) |
| | | | | | | | | | | | | | | | | | | | | | | | | | | | |
Total distributions to shareholders | | | (0.32 | ) | | | (0.03 | ) | | | (0.13 | ) | | | 0.00 | | | | (0.10 | ) | | | 0.00 | | | | (2.58 | ) |
Net asset value, end of period | | $ | 11.19 | | | $ | 9.73 | | | $ | 8.98 | | | $ | 9.96 | | | $ | 9.59 | | | $ | 8.67 | | | $ | 8.05 | |
Total return3 | | | 18.76 | % | | | 8.78 | % | | | (8.67 | )% | | | 3.86 | % | | | 11.84 | % | | | 7.70 | % | | | (39.10 | )% |
Ratios to average net assets (annualized) | | | | | | | | | | | | | | | | | | | | | | | | | | | | |
Gross expenses | | | 2.57 | % | | | 2.62 | % | | | 2.48 | % | | | 2.65 | % | | | 2.65 | % | | | 2.79 | % | | | 2.71 | % |
Net expenses | | | 2.35 | % | | | 2.35 | % | | | 2.35 | % | | | 2.35 | % | | | 2.34 | % | | | 2.35 | % | | | 2.35 | % |
Net investment income (loss) | | | (0.36 | )% | | | 0.92 | % | | | 0.18 | % | | | (1.66 | )% | | | (0.13 | )% | | | 0.73 | % | | | 0.36 | % |
Supplemental data | | | | | | | | | | | | | | | | | | | | | | | | | | | | |
Portfolio turnover rate | | | 96 | % | | | 163 | % | | | 196 | % | | | 11 | % | | | 137 | % | | | 185 | % | | | 187 | % |
Net assets, end of period (000s omitted) | | $ | 2,084 | | | $ | 1,673 | | | $ | 1,274 | | | $ | 1,507 | | | $ | 1,450 | | | $ | 1,112 | | | $ | 939 | |
| 1. | For the one month ended October 31, 2010. The Fund changed its fiscal year end from September 30 to October 31, effective October 31, 2010. |
| 2. | Calculated based upon average shares outstanding |
| 3. | Total return calculations do not include any sales charges. Returns for periods of less than one year are not annualized. |
The accompanying notes are an integral part of these financial statements.
| | | | |
| 16 | | Wells Fargo Advantage Asia Pacific Fund | | Financial highlights |
(For a share outstanding throughout each period)
| | | | | | | | | | | | | | | | | | | | |
| | | Six months ended
April 30, 2013 (unaudited) | | | Year ended October 31 | | | Year ended September 30
20102 | |
| ADMINISTRATOR CLASS | | | 2012 | | | 2011 | | | 20101 | | |
Net asset value, beginning of period | | $ | 10.04 | | | $ | 9.29 | | | $ | 10.15 | | | $ | 9.77 | | | $ | 8.84 | |
Net investment income (loss) | | | 0.03 | | | | 0.17 | | | | 0.12 | 3 | | | (0.00 | )3,4 | | | 0.03 | 3 |
Net realized and unrealized gains (losses) on investments | | | 1.86 | | | | 0.71 | | | | (0.89 | ) | | | 0.38 | | | | 0.90 | |
| | | | | | | | | | | | | | | | | | | | |
Total from investment operations | | | 1.89 | | | | 0.88 | | | | (0.77 | ) | | | 0.38 | | | | 0.93 | |
Distributions to shareholders from | | | | | | | | | | | | | | | | | | | | |
Net investment income | | | (0.41 | ) | | | (0.13 | ) | | | (0.09 | ) | | | 0.00 | | | | 0.00 | |
Net asset value, end of period | | $ | 11.52 | | | $ | 10.04 | | | $ | 9.29 | | | $ | 10.15 | | | $ | 9.77 | |
Total return5 | | | 19.36 | % | | | 9.66 | % | | | (7.68 | )% | | | 3.89 | % | | | 10.52 | % |
Ratios to average net assets (annualized) | | | | | | | | | | | | | | | | | | | | |
Gross expenses | | | 1.64 | % | | | 1.67 | % | | | 1.52 | % | | | 1.74 | % | | | 1.80 | % |
Net expenses | | | 1.40 | % | | | 1.40 | % | | | 1.39 | % | | | 1.40 | % | | | 1.40 | % |
Net investment income (loss) | | | 0.56 | % | | | 1.74 | % | | | 1.14 | % | | | (0.70 | )% | | | 1.98 | % |
Supplemental data | | | | | | | | | | | | | | | | | | | | |
Portfolio turnover rate | | | 96 | % | | | 163 | % | | | 196 | % | | | 11 | % | | | 137 | % |
Net assets, end of period (000s omitted) | | | $14,823 | | | | $12,860 | | | | $13,959 | | | | $11 | | | | $11 | |
| 1. | For the one month ended October 31, 2010. The Fund changed its fiscal year end from September 30 to October 31, effective October 31, 2010. |
| 2. | For the period from July 30, 2010 (commencement of class operations) to September 30, 2010 |
| 3. | Calculated based upon average shares outstanding |
| 4. | Amount is less than $0.005. |
| 5. | Returns for periods of less than one year are not annualized. |
The accompanying notes are an integral part of these financial statements.
| | | | | | |
| Financial highlights | | Wells Fargo Advantage Asia Pacific Fund | | | 17 | |
(For a share outstanding throughout each period)
| | | | | | | | | | | | | | | | | | | | |
| | | Six months ended
April 30, 2013 (unaudited) | | | Year ended October 31 | | | Year ended
September 30 | |
| INSTITUTIONAL CLASS | | | 2012 | | | 2011 | | | 20101 | | | 20102 | |
Net asset value, beginning of period | | $ | 10.05 | | | $ | 9.30 | | | $ | 10.15 | | | $ | 9.77 | | | $ | 8.84 | |
Net Investment income (loss) | | | 0.05 | 3 | | | 0.18 | | | | 0.13 | | | | (0.01 | )3 | | | 0.03 | 3 |
Net realized and unrealized gains (losses) on investments | | | 1.84 | | | | 0.71 | | | | (0.89 | ) | | | 0.39 | | | | 0.90 | |
| | | | | | | | | | | | | | | | | | | | |
Total from investment operations | | | 1.89 | | | | 0.89 | | | | (0.76 | ) | | | 0.38 | | | | 0.93 | |
Distributions to shareholders from | | | | | | | | | | | | | | | | | | | | |
Net investment income | | | (0.42 | ) | | | (0.14 | ) | | | (0.09 | ) | | | 0.00 | | | | 0.00 | |
Net asset value, end of period | | $ | 11.52 | | | $ | 10.05 | | | $ | 9.30 | | | $ | 10.15 | | | $ | 9.77 | |
Total return4 | | | 19.39 | % | | | 9.90 | % | | | (7.55 | )% | | | 3.89 | % | | | 10.52 | % |
Ratios to average net assets (annualized) | | | | | | | | | | | | | | | | | | | | |
Gross expenses | | | 1.36 | % | | | 1.42 | % | | | 1.29 | % | | | 1.47 | % | | | 1.47 | % |
Net expenses | | | 1.25 | % | | | 1.25 | % | | | 1.24 | % | | | 1.25 | % | | | 1.25 | % |
Net investment income (loss) | | | 1.03 | % | | | 1.86 | % | | | 1.30 | % | | | (0.57 | )% | | | 2.11 | % |
Supplemental data | | | | | | | | | | | | | | | | | | | | |
Portfolio turnover rate | | | 96 | % | | | 163 | % | | | 196 | % | | | 11 | % | | | 137 | % |
Net assets, end of period (000s omitted) | | | $40 | | | | $12 | | | | $11 | | | | $11 | | | | $11 | |
| 1. | For the one month ended October 31, 2010. The Fund changed its fiscal year end from September 30 to October 31, effective October 31, 2010. |
| 2. | For the period from July 30, 2010 (commencement of class operations) to September 30, 2010 |
| 3. | Calculated based upon average shares outstanding |
| 4. | Returns for periods of less than one year are not annualized. |
The accompanying notes are an integral part of these financial statements.
| | | | |
| 18 | | Wells Fargo Advantage Asia Pacific Fund | | Financial highlights |
(For a share outstanding throughout each period)
| | | | | | | | | | | | | | | | | | | | | | | | | | | | |
| | | Six months ended
April 30, 2013 (unaudited) | | | Year ended October 31 | | | Year ended September 30 | |
| INVESTOR CLASS | | | 2012 | | | 2011 | | | 20101 | | | 2010 | | | 2009 | | | 2008 | |
Net asset value, beginning of period | | $ | 10.05 | | | $ | 9.28 | | | $ | 10.14 | | | $ | 9.76 | | | $ | 8.81 | | | $ | 8.12 | | | $ | 15.82 | |
Net investment income (loss) | | | 0.02 | | | | 0.15 | | | | 0.08 | 2 | | | (0.01 | )2 | | | 0.04 | 2 | | | 0.09 | 2 | | | 0.06 | 2 |
Net realized and unrealized gains (losses) on investments | | | 1.85 | | | | 0.72 | | | | (0.88 | ) | | | 0.39 | | | | 1.05 | | | | 0.60 | | | | (5.18 | ) |
| | | | | | | | | | | | | | | | | | | | | | | | | | | | |
Total from investment operations | | | 1.87 | | | | 0.87 | | | | (0.80 | ) | | | 0.38 | | | | 1.09 | | | | 0.69 | | | | (5.12 | ) |
Distributions to shareholders from | | | | | | | | | | | | | | | | | | | | | | | | | | | | |
Net investment income | | | (0.38 | ) | | | (0.10 | ) | | | (0.06 | ) | | | 0.00 | | | | (0.14 | ) | | | (0.00 | )3 | | | 0.00 | |
Net realized gains | | | 0.00 | | | | 0.00 | | | | 0.00 | | | | 0.00 | | | | 0.00 | | | | 0.00 | | | | (2.58 | ) |
| | | | | | | | | | | | | | | | | | | | | | | | | | | | |
Total distributions to shareholders | | | (0.38 | ) | | | (0.10 | ) | | | (0.06 | ) | | | 0.00 | | | | (0.14 | ) | | | (0.00 | )3 | | | (2.58 | ) |
Net asset value, end of period | | | $11.54 | | | | $10.05 | | | | $9.28 | | | | $10.14 | | | | $9.76 | | | | $8.81 | | | | $8.12 | |
Total return4 | | | 19.14 | % | | | 9.51 | % | | | (7.97 | )% | | | 3.89 | % | | | 12.51 | % | | | 8.53 | % | | | (38.63 | )% |
Ratios to average net assets (annualized) | | | | | | | | | | | | | | | | | | | | | | | | | | | | |
Gross expenses | | | 1.88 | % | | | 1.94 | % | | | 1.80 | % | | | 1.97 | % | | | 1.99 | % | | | 2.14 | % | | | 2.01 | % |
Net expenses | | | 1.65 | % | | | 1.65 | % | | | 1.65 | % | | | 1.65 | % | | | 1.64 | % | | | 1.65 | % | | | 1.65 | % |
Net investment income (loss) | | | 0.32 | % | | | 1.47 | % | | | 0.82 | % | | | (0.96 | )% | | | 0.41 | % | | | 1.36 | % | | | 0.52 | % |
Supplemental data | | | | | | | | | | | | | | | | | | | | | | | | | | | | |
Portfolio turnover rate | | | 96 | % | | | 163 | % | | | 196 | % | | | 11 | % | | | 137 | % | | | 185 | % | | | 187 | % |
Net assets, end of period (000s omitted) | | | $179,545 | | | | $154,999 | | | | $169,895 | | | | $252,214 | | | | $241,892 | | | | $278,741 | | | | $326,929 | |
| 1. | For the one month ended October 31, 2010. The Fund changed its fiscal year end from September 30 to October 31, effective October 31, 2010. |
| 2. | Calculated based upon average shares outstanding |
| 3. | Amount is less than $0.005. |
| 4. | Returns for periods of less than one year are not annualized. |
The accompanying notes are an integral part of these financial statements.
| | | | | | |
| Notes to financial statements (unaudited) | | Wells Fargo Advantage Asia Pacific Fund | | | 19 | |
1. ORGANIZATION
Wells Fargo Funds Trust (the “Trust”), a Delaware statutory trust organized on March 10, 1999, is an open-end management investment company registered under the Investment Company Act of 1940, as amended (the “1940 Act”). These financial statements report on Wells Fargo Advantage Asia Pacific Fund (the “Fund”) which is a diversified series of the Trust.
2. SIGNIFICANT ACCOUNTING POLICIES
The following significant accounting policies, which are consistently followed in the preparation of the financial statements of the Fund, are in conformity with U.S. generally accepted accounting principles which require management to make estimates and assumptions that affect the reported amounts of assets and liabilities, disclosure of contingent assets and liabilities at the date of the financial statements, and the reported amounts of revenues and expenses during the reporting period. Actual results could differ from those estimates.
Securities valuation
All investments are valued each business day as of the close of regular trading on the New York Stock Exchange (normally 4 p.m. Eastern Time).
Equity securities that are listed on a foreign or domestic exchange, except for The Nasdaq Stock Market, Inc. (“Nasdaq”), are valued at the official closing price or, if none, the last sales price. Securities listed on Nasdaq are valued at the Nasdaq Official Closing Price (“NOCP”). If no NOCP is available, securities are valued at the last sales price. If no sales price is shown on the Nasdaq, the bid price will be used. If no sale occurs on the primary exchange or market for the security that day or if no sale occurs and no bid price is shown on Nasdaq, the prior day’s price will be deemed “stale” and fair values will be determined in accordance with the Fund’s Valuation Procedures.
Securities denominated in foreign currencies are translated into U.S. dollars using the rates of exchange in effect on the day of valuation at a time specified by the Management Valuation Team of Wells Fargo Funds Management, LLC (“Funds Management”).
Many securities markets and exchanges outside the U.S. close prior to the close of the New York Stock Exchange and therefore may not fully reflect trading or events that occur after the close of the principal exchange in which the foreign securities are traded, but before the close of the New York Stock Exchange. If such trading or events are expected to materially affect the value of such securities, then fair value pricing procedures approved by the Board of Trustees are applied. These procedures take into account multiple factors including movements in U.S. securities markets after foreign exchanges close. Foreign securities that are fair valued under these procedures are categorized as Level 2 and the application of these procedures may result in transfers between Level 1 and Level 2. Depending on market activity, such fair valuations may be frequent. Such fair value pricing may result in NAVs that are higher or lower than NAVs based on the last reported sales price or latest quoted bid price. On April 30, 2013, fair value pricing was not used in pricing foreign securities.
Investments in registered open-end investment companies are valued at net asset value. Non-registered investment companies are fair valued at net asset value.
Investments which are not valued using any of the methods discussed above are valued at their fair value, as determined by procedures established in good faith and approved by the Board of Trustees. The Board of Trustees has established a Valuation Committee comprised of the Trustees and has delegated to it the authority to take any actions regarding the valuation of portfolio securities that the Valuation Committee deems necessary or appropriate, including determining the fair value of portfolio securities, unless the determination has been delegated to the Management Valuation Team. The Board of Trustees retains the authority to make or ratify any valuation decisions or approve any changes to the Valuation Procedures as it deems appropriate. On a quarterly basis, the Board of Trustees receives reports on any valuation actions taken by the Valuation Committee or the Management Valuation Team which may include items for ratification.
Valuations of fair valued securities are compared to the next actual sales price when available, or other appropriate market information to assess the continued appropriateness of the fair valuation methodology used. These securities are fair valued on a day-to-day basis, taking into consideration changes to appropriate market information and any significant changes to the input factors considered in the valuation process until there is a readily available price provided on the exchange or by an independent pricing service. Valuations received from an independent pricing service or broker quotes are periodically validated by comparisons to most recent trades and valuations provided by other independent pricing services in addition to the review of prices by the adviser and/or subadviser. Unobservable inputs used in determining fair valuations are identified based on the type of security, taking into consideration factors utilized by market participants in valuing the investment, knowledge about the issuer and the current market environment.
| | | | |
| 20 | | Wells Fargo Advantage Asia Pacific Fund | | Notes to financial statements (unaudited) |
Foreign currency translation
The accounting records of the Fund are maintained in U.S. dollars. Assets, including investment securities, and liabilities denominated in foreign currency are translated into U.S. dollars at the rates of exchange at a time specified by the Management Valuation Team on the date of valuation. Purchases and sales of securities, and income and expenses are converted at the rate of exchange on the respective dates of such transactions. Reported net realized foreign exchange gains or losses arise from sales of foreign currencies, currency gains or losses realized between the trade and settlement dates on securities transactions, and the difference between the amounts of dividends, interest and foreign withholding taxes recorded and the U.S. dollar equivalent of the amounts actually paid or received. Net unrealized foreign exchange gains and losses arise from changes in the fair value of assets and liabilities other than investments in securities resulting in changes in exchange rates.
The changes in net assets arising from changes in exchange rates and the changes in net assets resulting from changes in market prices of securities are not separately presented. Such changes are recorded with net realized and unrealized gains or losses from investments. Gains and losses from certain foreign currency transactions are treated as ordinary income for U.S. federal income tax purposes.
Security loans
The Fund may lend its securities from time to time in order to earn additional income in the form of fees or interest on securities received as collateral or the investment of any cash received as collateral. The Fund continues to receive interest or dividends on the securities loaned. The Fund receives collateral in the form of cash or securities with a value at least equal to the value of the securities on loan. The value of the loaned securities is determined at the close of each business day and any additional required collateral is delivered to the Fund on the next business day. In a securities lending transaction, the net asset value of the Fund will be affected by an increase or decrease in the value of the securities loaned and by an increase or decrease in the value of the instrument in which collateral is invested. The amount of securities lending activity undertaken by the Fund fluctuates from time to time. In the event of default or bankruptcy by the borrower, the Fund may be prevented from recovering the loaned securities or gaining access to the collateral or may experience delays or costs in doing so. In addition, the investment of any cash collateral received may lose all or part of its value. The Fund has the right under the lending agreement to recover the securities from the borrower on demand.
The Fund lends its securities through an unaffiliated securities lending agent. Cash collateral received in connection with its securities lending transactions is invested in Wells Fargo Securities Lending Cash Investments, LLC (the “Cash Collateral Fund”). The Cash Collateral Fund is exempt from registration under Section 3(c)(7) of the 1940 Act and is managed by Funds Management and is subadvised by Wells Capital Management Incorporated (“WellsCap”). Funds Management receives an advisory fee starting at 0.05% and declining to 0.01% as the average daily net assets of the Cash Collateral Fund increase. All of the fees received by Funds Management are paid to WellsCap for its services as subadviser. The Cash Collateral Fund seeks to provide a positive return compared to the daily Fed Funds Open rate by investing in high-quality, U.S. dollar-denominated short-term money market instruments. Cash Collateral Fund investments are fair valued based upon the amortized cost valuation technique. Income earned from investment in the Cash Collateral Fund is included in securities lending income on the Statement of Operations.
Security transactions and income recognition
Securities transactions are recorded on a trade date basis. Realized gains or losses are recorded on the basis of identified cost.
Dividend income is recognized on the ex-dividend date, except for certain dividends from foreign securities, which are recorded as soon as the Fund is informed of the ex-dividend date. Dividend income from foreign securities is recorded net of foreign taxes withheld where recovery of such taxes is not assured.
Distributions to shareholders
Distributions to shareholders from net investment income and net realized gains, if any, are recorded on the ex-dividend date. Such distributions are determined in conformity with federal income tax regulations, which may differ in amount or character from net investment income and realized gains recognized for purposes of U.S. generally accepted accounting principles.
Federal and other taxes
The Fund intends to continue to qualify as a regulated investment company by distributing substantially all of its investment company taxable income and any net realized capital gains (after reduction for capital loss carryforwards) sufficient to relieve it from all, or substantially all, federal income taxes. Accordingly, no provision for federal income taxes was required.
The Fund’s income and federal excise tax returns and all financial records supporting those returns for the prior three fiscal years are subject to examination by the federal and Delaware revenue authorities. Management has analyzed the Fund’s tax positions taken on federal, state, and foreign tax returns for all open tax years and does not believe that there are any uncertain tax positions that require recognition of a tax liability.
| | | | | | |
| Notes to financial statements (unaudited) | | Wells Fargo Advantage Asia Pacific Fund | | | 21 | |
At October 31, 2012, capital loss carryforwards, which were available to offset future net realized capital gains, was as follows:
| | | | | | |
| Pre-enactment capital loss expiration* | | Post-enactment capital losses** |
| 2016 | | 2017 | | Short-term | | Long-term |
| $59,224,431 | | $80,817,204 | | $4,095,236 | | $5,239,473 |
| * | Losses incurred in taxable years beginning before December 22, 2010. |
| ** | Losses incurred in taxable years which began after December 22, 2010 are carried forward for an unlimited period. |
Class allocations
The separate classes of shares offered by the Fund differ principally in applicable sales charges, distribution, shareholder servicing, and administration fees. Shareholders of each class bear certain expenses that pertain to that particular class. All shareholders bear the common expenses of the Fund, earn income from the portfolio, and are allocated any unrealized gains and losses pro rata based on the average daily net assets of each class, without distinction between share classes. Dividends are determined separately for each class based on income and expenses allocable to each class. Realized gains and losses are allocated to each class pro rata based upon the net assets of each class on the date realized. Differences in per share dividend rates generally result from the relative weightings of pro rata income and realized gain allocations and from differences in separate class expenses, including distribution, shareholder servicing, and administration fees.
3. FAIR VALUATION MEASUREMENTS
Fair value measurements of investments are determined within a framework that has established a fair value hierarchy based upon the various data inputs utilized in determining the value of the Fund’s investments. The three-level hierarchy gives the highest priority to unadjusted quoted prices in active markets for identical assets or liabilities (Level 1) and the lowest priority to significant unobservable inputs (Level 3). The Fund’s investments are classified within the fair value hierarchy based on the lowest level of input that is significant to the fair value measurement. The inputs are summarized into three broad levels as follows:
| n | | Level 1 – quoted prices in active markets for identical securities |
| n | | Level 2 – other significant observable inputs (including quoted prices for similar securities, interest rates, prepayment speeds, credit risk, use of amortized cost, etc.) |
| n | | Level 3 – significant unobservable inputs (including the Fund’s own assumptions in determining the fair value of investments) |
The inputs or methodologies used for valuing investments in securities are not necessarily an indication of the risk associated with investing in those securities.
As of April 30, 2013, the inputs used in valuing investments in securities were as follows:
| | | | | | | | | | | | | | | | |
| Investments in securities | | Quoted prices (Level 1) | | | Significant other
observable Inputs (Level 2) | | | Significant unobservable inputs (Level 3) | | | Total | |
| | | | |
Equity securities | | | | | | | | | | | | | | | | |
Common stocks | | $ | 191,570,392 | | | $ | 2,047,233 | | | $ | 0 | | | | $193,617,625 | |
Warrants | | | 0 | | | | 5,386,798 | | | | 0 | | | | 5,386,798 | |
| | | | |
Short-term investments | | | | | | | | | | | | | | | | |
Investment companies | | | 4,596,355 | | | | 2,239,437 | | | | 0 | | | | 6,835,792 | |
| | | $ | 196,166,747 | | | $ | 9,673,468 | | | $ | 0 | | | $ | 205,840,215 | |
Transfers in and transfers out are recognized at the end of the reporting period. For the six months ended April 30, 2013, the Fund did not have any transfers into/out of Level 1 or Level 2.
4. TRANSACTIONS WITH AFFILIATES AND OTHER EXPENSES
Advisory fee
The Trust has entered into an advisory contract with Funds Management, an indirect wholly owned subsidiary of Wells Fargo & Company (“Wells Fargo”). The adviser is responsible for implementing investment policies and guidelines and for supervising the subadvisers, who are responsible for day-to-day portfolio management of the Fund.
| | | | |
| 22 | | Wells Fargo Advantage Asia Pacific Fund | | Notes to financial statements (unaudited) |
Pursuant to the contract, Funds Management is entitled to receive an annual advisory fee starting at 0.95% and declining to 0.80% as the average daily net assets of the Fund increase. Prior to March 1, 2013, the annual advisory fee started at 1.10% and declined to 0.95% as the average daily net assets of the Fund increased. For the six months ended April 30, 2013, the advisory fee was equivalent to an annual rate of 1.05% of the Fund’s average daily net assets.
Funds Management has retained the services of certain subadvisers to provide daily portfolio management to the Fund. The fee for subadvisory services is borne by Funds Management. WellsCap, an affiliate of Funds Management, is a subadviser to the Fund and is entitled to receive a fee from Funds Management at an annual rate starting at 0.65% and declining to 0.45% as the average daily net assets of the Fund increase. Wells Capital Management Singapore, a separately identifiable department of Wells Fargo Bank, N.A., is also a subadviser to the Fund. Out of its fees, WellsCap pays Wells Capital Management Singapore a fee for its services as subadviser at an annual rate starting at 0.25% and declining to 0.15% as the average daily net assets of the Fund increase.
Administration and transfer agent fees
The Trust has entered into an administration agreement with Funds Management. Under this agreement, for providing administrative services, which includes paying fees and expenses for services provided by the transfer agent, sub-transfer agents, omnibus account servicers and record-keepers, Funds Management is entitled to receive from the Fund an annual fund level administration fee starting at 0.05% and declining to 0.03% as the average daily net assets of the Fund increase and a class level administration fee which is calculated based on the average daily net assets of each class as follows:
| | | | |
| | | Class level
administration fee | |
Class A, Class C | | | 0.26 | % |
Administrator Class | | | 0.10 | |
Institutional Class | | | 0.08 | |
Investor Class | | | 0.32 | |
Funds Management has contractually waived and/or reimbursed advisory and administration fees to the extent necessary to maintain certain net operating expense ratios for the Fund. Waiver of fees and/or reimbursement of expenses by Funds Management were made first from fund level expenses on a proportionate basis and then from class specific expenses. Funds Management has committed through February 28, 2014 to waive fees and/or reimburse expenses to the extent necessary to cap the Fund’s expenses at 1.60% for Class A shares, 2.35% for Class C shares, 1.40% for Administrator Class shares, 1.25% for Institutional Class shares, and 1.65% for Investor Class shares.
Distribution fees
The Trust has adopted a Distribution Plan for Class C shares of the Fund pursuant to Rule 12b-1 under the 1940 Act. Distribution fees are charged to Class C shares and paid to Wells Fargo Funds Distributor, LLC, the principal underwriter, at an annual rate of 0.75% of the average daily net assets of Class C shares.
For the six months ended April 30, 2013, Wells Fargo Funds Distributor, LLC received $3,398 from the sale of Class A shares and $80 in contingent deferred sales charges from redemptions of Class C shares.
Shareholder servicing fees
The Trust has entered into contracts with one or more shareholder servicing agents, whereby Class A, Class C, Administrator Class, and Investor Class of the Fund is charged a fee at an annual rate of 0.25% of the average daily net assets of each respective class.
A portion of these total shareholder servicing fees were paid to affiliates of Wells Fargo.
5. INVESTMENT PORTFOLIO TRANSACTIONS
Purchases and sales of investments, excluding U.S. government obligations (if any) and short-term securities, for the six months ended April 30, 2013 were $177,489,840 and $180,795,624, respectively.
6. BANK BORROWINGS
The Trust (excluding the money market funds and certain other funds in the Trust) and Wells Fargo Variable Trust are parties to a $150,000,000 revolving credit agreement with State Street Bank and Trust Company, whereby the Fund is permitted to use bank borrowings for temporary or emergency purposes, such as to fund shareholder redemption
| | | | | | |
| Notes to financial statements (unaudited) | | Wells Fargo Advantage Asia Pacific Fund | | | 23 | |
requests. Interest under the credit agreement is charged to the Fund based on a borrowing rate equal to the higher of the Federal Funds rate in effect on that day plus 1.25% or the overnight LIBOR rate in effect on that day plus 1.25%. In addition, an annual commitment fee equal to 0.10% of the unused balance is allocated to each participating fund. For the six months ended April 30, 2013, the Fund paid $198 in commitment fees.
For the six months ended April 30, 2013, there were no borrowings by the Fund under the agreement.
7. INDEMNIFICATION
Under the Trust’s organizational documents, the officers and directors are indemnified against certain liabilities that may arise out of performance of their duties to the Trust. Additionally, in the normal course of business, the Trust may enter into contracts with service providers that contain a variety of indemnification clauses. The Trust’s maximum exposure under these arrangements is dependent on future claims that may be made against the Fund and, therefore, cannot be estimated.
8. NEW ACCOUNTING PRONOUNCEMENT
In December 2011, the Financial Accounting Standards Board (“FASB”) issued Accounting Standard Update (“ASU”) No. 2011-11, Disclosures about Offsetting Assets and Liabilities. ASU 2011-11, which amends FASB ASC Topic 210, Balance Sheet, creates new disclosure requirements which require entities to disclose both gross and net information for derivatives and other financial instruments that are either offset in the Statement of Assets and Liabilities or subject to an enforceable master netting arrangement or similar agreement. The disclosure requirements are effective for interim and annual reporting periods beginning on or after January 1, 2013. Management is currently assessing the potential impact, in addition to expanded financial statement disclosure, that may result from adopting this ASU.
| | | | |
| 24 | | Wells Fargo Advantage Asia Pacific Fund | | Other information (unaudited) |
TAX INFORMATION
Pursuant to Section 853 of the Internal Revenue Code, the following amounts were designated as foreign taxes paid for the fiscal year ended October 31, 2012. These amounts may be less than the actual foreign taxes paid for financial statement purposes. Foreign taxes paid or withheld should be included in taxable income with an offsetting deduction from gross income or as a credit for taxes paid to foreign governments. None of the income was derived from ineligible foreign sources as defined under Section 901(j) of the Internal Revenue Code.
| | | | |
Creditable foreign taxes paid | | Per share amount on October 31, 2012 | | Foreign income as % of ordinary income distributions |
| $270,484 | | $0.02 | | 57.22% |
PROXY VOTING INFORMATION
A description of the policies and procedures that the Fund uses to determine how to vote proxies relating to portfolio securities is available without charge, upon request, by calling 1-800-222-8222, visiting our website at wellsfargoadvantagefunds.com, or visiting the SEC website at sec.gov. Information regarding how the Fund voted proxies relating to portfolio securities during the most recent 12-month period ended June 30 is available without charge on the Fund’s website at wellsfargoadvantagefunds.com or by visiting the SEC website at sec.gov.
PORTFOLIO HOLDINGS INFORMATION
The complete portfolio holdings for the Fund are publicly available on the Fund’s website (wellsfargoadvantagefunds.com) on a monthly, 30-day or more delayed basis. In addition, top ten holdings information for the Fund is publicly available on the Fund’s website on a monthly, seven-day or more delayed basis. The Fund files its complete schedule of portfolio holdings with the SEC for the first and third quarters of each fiscal year on Form N-Q, which is available without charge by visiting the SEC website at sec.gov. In addition, the Fund’s Form N-Q may be reviewed and copied at the SEC’s Public Reference Room in Washington, DC, and at regional offices in New York City, at 233 Broadway, and in Chicago, at 175 West Jackson Boulevard, Suite 900. Information about the Public Reference Room may be obtained by calling 1-800-SEC-0330.
| | | | | | |
| Other information (unaudited) | | Wells Fargo Advantage Asia Pacific Fund | | | 25 | |
BOARD OF TRUSTEES AND OFFICERS
Each of the Trustees and Officers listed in the table below acts in identical capacities for the Wells Fargo Advantage family of funds, which consists of 131 funds1 comprising the Wells Fargo Funds Trust, Wells Fargo Variable Trust, Wells Fargo Master Trust and four closed-end funds (collectively the “Fund Complex”). This table should be read in conjunction with the Prospectus and the Statement of Additional Information2. All of the Trustees are also Members of the Audit and Governance Committees of each Trust in the Fund Complex. The mailing address of each Trustee and Officer is 525 Market Street, 12th Floor, San Francisco, CA 94105. Each Trustee and Officer serves an indefinite term, however, each Trustee serves such term until reaching the mandatory retirement age established by the Trustees.
Independent Trustees
| | | | | | |
Name and year of birth | | Position held and length of service* | | Principal occupations during past five years | | Other directorships during
past five years |
| Peter G. Gordon (Born 1942) | | Trustee, since 1998; Chairman, since 2005 | | Co-Founder, Retired Chairman, President and CEO of Crystal Geyser Water Company. Trustee Emeritus, Colby College. | | Asset Allocation Trust |
| Isaiah Harris, Jr. (Born 1952) | | Trustee, since 2009 | | Retired. Prior thereto, President and CEO of BellSouth Advertising and Publishing Corp. from 2005 to 2007, President and CEO of BellSouth Enterprises from 2004 to 2005 and President of BellSouth Consumer Services from 2000 to 2003. Emeritus member of the Iowa State University Foundation Board of Governors. Emeritus Member of the Advisory Board of Iowa State University School of Business. Advisory Board Member, Palm Coast Academy (charter school). Mr. Harris is a certified public accountant. | | CIGNA Corporation; Deluxe Corporation; Asset Allocation Trust |
| Judith M. Johnson (Born 1949) | | Trustee, since 2008; Audit Committee Chairman, since 2008 | | Retired. Prior thereto, Chief Executive Officer and Chief Investment Officer of Minneapolis Employees Retirement Fund from 1996 to 2008. Ms. Johnson is an attorney, certified public accountant and a certified managerial accountant. | | Asset Allocation Trust |
| Leroy Keith, Jr. (Born 1939) | | Trustee, since 2010 | | Chairman, Bloc Global Services (development and construction). Trustee of the Evergreen Funds from 1983 to 2010. Former Managing Director, Almanac Capital Management (commodities firm), former Partner, Stonington Partners, Inc. (private equity fund), former Director, Obagi Medical Products Co. and former Director, Lincoln Educational Services. | | Trustee, Virtus Fund Complex (consisting of 48 portfolios as of 1/31/2013); Asset Allocation Trust |
| David F. Larcker (Born 1950) | | Trustee, since 2009 | | James Irvin Miller Professor of Accounting at the Graduate School of Business, Stanford University, Morgan Stanley Director of the Center for Leadership Development and Research and Senior Faculty of The Rock Center for Corporate Governance since 2006. From 2005 to 2008, Professor of Accounting at the Graduate School of Business, Stanford University. Prior thereto, Ernst & Young Professor of Accounting at The Wharton School, University of Pennsylvania from 1985 to 2005. | | Asset Allocation Trust |
| Olivia S. Mitchell (Born 1953) | | Trustee, since 2006 | | International Foundation of Employee Benefit Plans Professor, Wharton School of the University of Pennsylvania since 1993. Director of Wharton’s Pension Research Council and Boettner Center on Pensions & Retirement Research, and Research Associate at the National Bureau of Economic Research. Previously, Cornell University Professor from 1978 to 1993. | | Asset Allocation Trust |
| Timothy J. Penny (Born 1951) | | Trustee, since 1996 | | President and CEO of Southern Minnesota Initiative Foundation, a non-profit organization, since 2007 and Senior Fellow at the Humphrey Institute Policy Forum at the University of Minnesota since 1995. Member of the Board of Trustees of NorthStar Education Finance, Inc., a non-profit organization, since 2007. | | Asset Allocation Trust |
| | | | |
| 26 | | Wells Fargo Advantage Asia Pacific Fund | | Other information (unaudited) |
| | | | | | |
Name and year of birth | | Position held and length of service* | | Principal occupations during past five years | | Other directorships during
past five years |
| Michael S. Scofield (Born 1943) | | Trustee, since 2010 | | Served on the Investment Company Institute’s Board of Governors and Executive Committee from 2008-2011 as well the Governing Council of the Independent Directors Council from 2006-2011 and the Independent Directors Council Executive Committee from 2008-2011. Chairman of the IDC from 2008-2010. Institutional Investor (Fund Directions) Trustee of Year in 2007. Trustee of the Evergreen Funds (and its predecessors) from 1984 to 2010. Chairman of the Evergreen Funds from 2000-2010. Former Trustee of the Mentor Funds. Retired Attorney, Law Offices of Michael S. Scofield. | | Asset Allocation Trust |
| Donald C. Willeke (Born 1940) | | Trustee, since 1996 | | Principal of the law firm of Willeke & Daniels. General Counsel of the Minneapolis Employees Retirement Fund from 1984 until its consolidation into the Minnesota Public Employees Retirement Association on June 30, 2010. Director and Vice Chair of The Tree Trust (non-profit corporation). Director of the American Chestnut Foundation (non-profit corporation). | | Asset Allocation Trust |
| * | Length of service dates reflect the Trustee’s commencement of service with the Trust’s predecessor entities, where applicable. |
Officers
| | | | | | |
Name and year of birth | | Position held and length of service | | Principal occupations during past five years | | |
| Karla M. Rabusch (Born 1959) | | President, since 2003 | | Executive Vice President of Wells Fargo Bank, N.A. and President of Wells Fargo Funds Management, LLC since 2003. | | |
| Jeremy DePalma1 (Born 1974) | | Treasurer, since 2012 | | Senior Vice President of Wells Fargo Funds Management, LLC since 2009. Senior Vice President of Evergreen Investment Management Company, LLC from 2008 to 2010. Vice President, Evergreen Investment Services, Inc. from 2004 to 2007. Head of the Fund Reporting and Control Team within Fund Administration from 2005 to 2010. | | |
C. David Messman (Born 1960) | | Secretary, since 2000; Chief Legal Officer, since 2003 | | Senior Vice President and Secretary of Wells Fargo Funds Management, LLC since 2001. Vice President and Managing Counsel of Wells Fargo Bank, N.A. since 1996. | | |
Debra Ann Early (Born 1964) | | Chief Compliance Officer, since 2007 | | Chief Compliance Officer of Wells Fargo Funds Management, LLC since 2007. Chief Compliance Officer of Parnassus Investments from 2005 to 2007. Chief Financial Officer of Parnassus Investments from 2004 to 2007. | | |
David Berardi (Born 1975) | | Assistant Treasurer, since 2009 | | Vice President of Wells Fargo Funds Management, LLC since 2009. Vice President of Evergreen Investment Management Company, LLC from 2008 to 2010. Assistant Vice President of Evergreen Investment Services, Inc. from 2004 to 2008. Manager of Fund Reporting and Control for Evergreen Investment Management Company, LLC from 2004 to 2010. | | |
| 1. | Jeremy DePalma acts as Treasurer of 58 funds and Assistant Treasurer of 73 funds in the Fund Complex. |
| 2. | The Statement of Additional Information includes additional information about the Trustees and is available, without charge, upon request, by calling 1-800-222-8222 or by visiting the website at wellsfargoadvantagefunds.com. |
| | | | | | |
| Other information (unaudited) | | Wells Fargo Advantage Asia Pacific Fund | | | 27 | |
BOARD CONSIDERATION OF INVESTMENT ADVISORY AND SUBADVISORY AGREEMENTS:
Under Section 15 of the Investment Company Act of 1940 (the “1940 Act”), the Board of Trustees (the “Board”) of Wells Fargo Funds Trust (the “Trust”), all the members of which have no direct or indirect interest in the investment advisory and sub-advisory agreements and are not “interested persons” of the Trust, as defined in the 1940 Act (the “Independent Trustees”), must determine whether to approve the continuation of the Trust’s investment advisory and sub-advisory agreements. In this regard, at an in-person meeting held on March 28-29, 2013 (the “Meeting”), the Board reviewed: (i) an investment advisory agreement with Wells Fargo Funds Management, LLC (“Funds Management”) for Wells Fargo Advantage Asia Pacific Fund (the “Fund”), (ii) an investment sub-advisory agreement with Wells Capital Management Incorporated (“WellsCap”), an affiliate of Funds Management, for the Fund and (iii) an investment sub-advisory agreement with Wells Capital Management Singapore (“WellsCap Singapore”), an affiliate of Funds Management, for the Fund. The investment advisory agreement with Funds Management and the investment sub-advisory agreements with WellsCap and WellsCap Singapore (the “Sub-Advisers”) are collectively referred to as the “Advisory Agreements.”
At the Meeting, the Board considered the factors and reached the conclusions described below relating to the selection of Funds Management and the Sub-Advisers and the continuation of the Advisory Agreements. Prior to the Meeting, the Trustees conferred extensively among themselves and with representatives of Funds Management about these matters. The Board has adopted a team-based approach, with each team consisting of a sub-set of Trustees, to assist the Board in the discharge of its duties in reviewing performance and other matters throughout the year. The Independent Trustees were assisted in their evaluation of the Advisory Agreements by independent legal counsel, from whom they received separate legal advice and with whom they met separately.
In providing information to the Board, Funds Management and the Sub-Advisers were guided by a detailed set of requests for information submitted to them by independent legal counsel on behalf of the Independent Trustees at the start of the Board’s annual contract renewal process earlier in 2013. In considering and approving the Advisory Agreements, the Trustees considered the information they believed relevant, including but not limited to the information discussed below. The Board considered not only the specific information presented in connection with the Meeting, but also the knowledge gained over time through interaction with Funds Management and the Sub-Advisers about various topics. In this regard, the Board reviewed reports of Funds Management at each of its quarterly meetings, which included, among other things, portfolio reviews and performance reports. In addition, the Board and the teams mentioned above confer with portfolio managers at various times throughout the year. The Board did not identify any particular information or consideration that was all-important or controlling, and each individual Trustee may have attributed different weights to various factors.
After its deliberations, the Board unanimously determined that the continuation of the Advisory Agreements is in the best interests of the Fund and its shareholders, and that the compensation payable to Funds Management and the Sub-Advisers is reasonable. The Board considered the continuation of the Advisory Agreements for the Fund as part of its consideration of the continuation of advisory agreements for funds across the complex, but each decision was made on a fund-by-fund basis. The following summarizes a number of important, but not necessarily all, factors considered by the Board in reaching its determination.
Nature, extent and quality of services
The Board received and considered various information regarding the nature, extent and quality of services provided to the Fund by Funds Management and the Sub-Advisers under the Advisory Agreements. This information included, among other things, a summary of the background and experience of senior management of Funds Management, and the qualifications, background, tenure and responsibilities of each of the portfolio managers primarily responsible for the day-to-day portfolio management of the Fund.
The Board evaluated the ability of Funds Management and the Sub-Advisers, based on attributes such as their financial condition, resources and reputation, to attract and retain qualified investment professionals, including research, advisory and supervisory personnel. The Board further considered the compliance programs and compliance records of Funds Management and the Sub-Advisers. In addition, the Board took into account the administrative and other services provided to the Fund by Funds Management and its affiliates and Funds Management’s oversight of the Fund’s various service providers.
Fund performance and expenses
The Board considered the performance results for the Fund over various time periods ended December 31, 2012. The Board also considered these results in comparison to the performance of funds in a universe that was determined by Lipper Inc. (“Lipper”) to be similar to the Fund (the “Universe”), and in comparison to the Fund’s benchmark index and to
| | | | |
| 28 | | Wells Fargo Advantage Asia Pacific Fund | | Other information (unaudited) |
other comparative data. Lipper is an independent provider of investment company data. The Board received a description of the methodology used by Lipper to select the mutual funds in the performance Universe. The Board noted that the performance of the Fund (Class A) was higher than the median performance of the Universe for the one-, three- and ten-year periods under review and lower than the median performance of the Universe for the five-year period. The Board also noted that the performance of the Fund was higher than its benchmark, the Morgan Stanley Composite Index All Country Asia Pacific Index (Net), for the one-, three- and ten-year periods under review and lower than the benchmark for the five-year period.
The Board received information concerning, and discussed factors contributing to, the underperformance of the Fund relative to the Universe and the benchmark for the five-year period under review. Funds Management advised the Board about the market conditions and investment decisions that it believed contributed to the underperformance during that period. Funds Management advised the Board that the underperformance during that period was due to sector allocations in 2008 and the Board noted the recent positive performance of the Fund relative to the Universe and the benchmark during the one- and three-year periods under review. The Board was satisfied with the explanation of the underperformance.
The Board received and considered information regarding the Fund’s net operating expense ratios and their various components, including actual management fees (which reflect fee waivers, if any, and include advisory, administration and transfer agent fees), custodian and other non-management fees, Rule 12b-1 and non-Rule 12b-1 service fees and fee waiver and expense reimbursement arrangements. The Board also considered these ratios in comparison to the median ratios of funds in class-specific expense groups that were determined by Lipper to be similar to the Fund (the “Groups”). The Board received a description of the methodology used by Lipper to select the mutual funds in the expense Groups. Based on the Lipper reports, the Board noted that the net operating expense ratios of the Fund were equal to, in range of or lower than the median net operating expense ratios of the expense Groups. The Board and Funds Management agreed to continue the current contractual net expense ratio caps for the Fund.
Based on its consideration of the factors and information it deemed relevant, including those described here, the Board concluded that the overall performance and expense structure of the Fund supported the re-approval of the Advisory Agreements.
Investment advisory and sub-advisory fee rates
The Board reviewed and considered the contractual investment advisory fee rates that are payable by the Fund to Funds Management for investment advisory services (the “Advisory Agreement Rates”), both on a stand-alone basis and on a combined basis with the Fund’s fund-level and class-level contractual administration fee rates (the “Management Rates”). The Board noted that the administration fees include transfer agency costs. The Board also reviewed and considered the contractual investment sub-advisory fee rates that are payable by Funds Management to WellsCap and by WellsCap to WellsCap Singapore for investment sub-advisory services (the “Sub-Advisory Agreement Rates”).
Among other information reviewed by the Board was a comparison of the Management Rates of the Fund with those of other funds in the expense Groups at a common asset level. The Board noted that the Management Rates of the Fund were higher than the median rates for the Fund’s expense Groups for all classes. The Board and Funds Management agreed to continue the current contractual net expense ratio caps for the Fund.
The Board also received and considered information about the portion of the total advisory fee that was retained by Funds Management after payment of the fee to the Sub-Advisers for sub-advisory services. In assessing the reasonableness of this amount, the Board received and evaluated information concerning the nature and extent of responsibilities retained and risks assumed by Funds Management and not delegated to or assumed by the Sub-Advisers, and about Funds Management’s on-going oversight services. In recognition of the fact that the Wells Fargo enterprise provides a suite of combined advisory and sub-advisory services to the Fund through affiliated entities, the Board ascribed limited relevance to the allocation of the total advisory fee between Funds Management and the Sub-Advisers.
The Board also received and considered information about the nature and extent of services offered and fee rates charged by Funds Management and the Sub-Advisers to other types of clients. In this regard, the Board received information about the significantly greater scope of services, and compliance, reporting and other legal burdens and risks of managing mutual funds compared with those associated with managing assets of non-mutual fund clients such as collective funds or institutional separate accounts.
Based on its consideration of the factors and information it deemed relevant, including those described here, the Board determined that the Advisory Agreement Rates and the Sub-Advisory Agreement Rates were reasonable in light of the services covered by the Advisory Agreements.
| | | | | | |
| Other information (unaudited) | | Wells Fargo Advantage Asia Pacific Fund | | | 29 | |
Profitability
The Board received and considered information concerning the profitability of Funds Management, as well as the profitability of Wells Fargo as a whole, from providing services to the Fund. The Board did not receive or consider to be necessary separate profitability information with respect to the Sub-Advisers, because, as affiliates of Funds Management, their profitability information was subsumed in the collective Wells Fargo profitability analysis provided by Funds Management.
Funds Management explained the methodologies and estimates that it used in calculating the profitability from the Fund and the fund family as a whole. Among other things, the Board noted that the levels of profitability reported on a fund-by-fund basis varied widely, depending on factors such as the size and type of fund. Based on its review, the Board did not deem the profits reported by Funds Management to be at a level that would prevent it from approving the continuation of the Advisory Agreements.
Economies of scale
With respect to possible economies of scale, the Board reviewed the breakpoints in the Fund’s advisory fee and administration fee structure, which operate generally to reduce the Fund’s expense ratios as the Fund grows in size. It considered that, for a small fund or a fund that shrinks in size, breakpoints conversely can result in higher fee levels. The Board also considered fee waiver and expense reimbursement arrangements as a means of sharing potential economies of scale with the Fund. The Board acknowledged the inherent limitations of any analysis of potential economies of scale and of any attempt to correlate breakpoints with such economies. Nonetheless, the Board concluded that the breakpoints and net operating expense ratio caps appeared to be a reasonable approach to sharing potential economies of scale with the Fund.
Other benefits to funds management and the sub-advisers
The Board received and considered information regarding potential “fall-out” or ancillary benefits received by Funds Management and its affiliates, including the Sub-Advisers, as a result of their relationship with the Fund. Ancillary benefits could include, among others, benefits directly attributable to other relationships with the Fund and benefits potentially derived from an increase in Funds Management’s and the Sub-Advisers’ business as a result of their relationship with the Fund (such as the ability to market to shareholders other financial products and services offered by Funds Management and its affiliates, including the Sub-Advisers, or to operate other products and services that follow investment strategies similar to those of the Fund).
The Board considered that Wells Fargo Funds Distributor, LLC, an affiliate of Funds Management, serves as distributor to the Fund and receives certain compensation for those services. The Board noted that various financial institutions, including affiliates of Funds Management, may receive distribution-related fees, shareholder servicing payments (including amounts derived from payments under Rule 12b-1 plans) and sub-transfer agency fees in respect of shares sold or held through them and services provided.
The Board also reviewed information about whether and to what extent soft dollar credits are sought and how any such credits are utilized, and any benefits that might be realized by an affiliated broker that handles portfolio transactions for the Fund.
Based on its consideration of the factors and information it deemed relevant, including those described here, the Board did not find that any ancillary benefits received by Funds Management and its affiliates, including the Sub-Advisers, were unreasonable.
Conclusion
After considering the above-described factors and based on its deliberations and its evaluation of the information described above, the Board unanimously approved the continuation of the Advisory Agreements for an additional one-year period.
| | | | |
| 30 | | Wells Fargo Advantage Asia Pacific Fund | | List of abbreviations |
The following is a list of common abbreviations for terms and entities that may have appeared in this report.
| ACA | — ACA Financial Guaranty Corporation |
| ADR | — American depositary receipt |
| ADS | — American depositary shares |
| AGC | — Assured Guaranty Corporation |
| AGM | — Assured Guaranty Municipal |
| Ambac | — Ambac Financial Group Incorporated |
| AMT | — Alternative minimum tax |
| BAN | — Bond anticipation notes |
| BHAC | — Berkshire Hathaway Assurance Corporation |
| CAB | — Capital appreciation bond |
| CCAB | — Convertible capital appreciation bond |
| CDA | — Community Development Authority |
| CDO | — Collateralized debt obligation |
| COP | — Certificate of participation |
| DRIVER | — Derivative inverse tax-exempt receipts |
| DW&P | — Department of Water & Power |
| DWR | — Department of Water Resources |
| ECFA | — Educational & Cultural Facilities Authority |
| EDA | — Economic Development Authority |
| EDFA | — Economic Development Finance Authority |
| ETF | — Exchange-traded fund |
| FDIC | — Federal Deposit Insurance Corporation |
| FFCB | — Federal Farm Credit Banks |
| FGIC | — Financial Guaranty Insurance Corporation |
| FHA | — Federal Housing Administration |
| FHLB | — Federal Home Loan Bank |
| FHLMC | — Federal Home Loan Mortgage Corporation |
| FICO | — The Financing Corporation |
| FNMA | — Federal National Mortgage Association |
| GDR | — Global depositary receipt |
| GNMA | — Government National Mortgage Association |
| HCFR | — Healthcare facilities revenue |
| HEFA | — Health & Educational Facilities Authority |
| HEFAR | — Higher education facilities authority revenue |
| HFA | — Housing Finance Authority |
| HFFA | — Health Facilities Financing Authority |
| HUD | — Department of Housing and Urban Development |
| IDA | — Industrial Development Authority |
| IDAG | — Industrial Development Agency |
| IDR | — Industrial development revenue |
| KRW | — Republic of Korea won |
| LIBOR | — London Interbank Offered Rate |
| LLC | — Limited liability company |
| LLP | — Limited liability partnership |
| MBIA | — Municipal Bond Insurance Association |
| MFHR | — Multifamily housing revenue |
| MSTR | — Municipal securities trust receipts |
| MUD | — Municipal Utility District |
| National | — National Public Finance Guarantee Corporation |
| PCFA | — Pollution Control Financing Authority |
| PCL | — Public Company Limited |
| PCR | — Pollution control revenue |
| PFA | — Public Finance Authority |
| PFFA | — Public Facilities Financing Authority |
| PFOTER | — Puttable floating option tax-exempt receipts |
| plc | — Public limited company |
| PUTTER | — Puttable tax-exempt receipts |
| R&D | — Research & development |
| Radian | — Radian Asset Assurance |
| RAN | — Revenue anticipation notes |
| RDA | — Redevelopment Authority |
| RDFA | — Redevelopment Finance Authority |
| REIT | — Real estate investment trust |
| ROC | — Reset option certificates |
| SAVRS | — Select auction variable rate securities |
| SBA | — Small Business Authority |
| SFHR | — Single-family housing revenue |
| SFMR | — Single-family mortgage revenue |
| SPA | — Standby purchase agreement |
| SPDR | — Standard & Poor’s Depositary Receipts |
| STRIPS | — Separate trading of registered interest and principal securities |
| TAN | — Tax anticipation notes |
| TIPS | — Treasury inflation-protected securities |
| TRAN | — Tax revenue anticipation notes |
| TTFA | — Transportation Trust Fund Authority |
| TVA | — Tennessee Valley Authority |


For more information
More information about Wells Fargo Advantage Funds is available free upon request. To obtain literature, please write, email, visit the Fund’s website, or call:
Wells Fargo Advantage Funds
P.O. Box 8266
Boston, MA 02266-8266
Email: wfaf@wellsfargo.com
Website: wellsfargoadvantagefunds.com
Individual investors: 1-800-222-8222
Retail investment professionals: 1-888-877-9275
Institutional investment professionals: 1-866-765-0778
This report and the financial statements contained herein are submitted for the general information of the shareholders of Wells Fargo Advantage Funds. If this report is used for promotional purposes, distribution of the report must be accompanied or preceded by a current prospectus. For a current prospectus and, if available, a summary prospectus containing more complete information, including charges and expenses, call 1-800-222-8222 or visit the Fund’s website at wellsfargoadvantagefunds.com. Please consider the investment objectives, risks, charges, and expenses of the investment carefully before investing. This and other information about Wells Fargo Advantage Funds can be found in the current prospectus. Read the prospectus carefully before you invest or send money.
Wells Fargo Funds Management, LLC, a wholly owned subsidiary of Wells Fargo & Company, provides investment advisory and administrative services for Wells Fargo Advantage Funds. Other affiliates of Wells Fargo & Company provide subadvisory and other services for the Funds. The Funds are distributed by Wells Fargo Funds Distributor, LLC, Member FINRA/SIPC, an affiliate of Wells Fargo & Company.
NOT FDIC INSURED ¡ NO BANK GUARANTEE ¡ MAY LOSE VALUE
© 2013 Wells Fargo Funds Management, LLC. All rights reserved.
| | |
 | | 216830 06-13 SA236/SAR236 4-13 |

Wells Fargo Advantage
Diversified International Fund

Semi-Annual Report
April 30, 2013

Reduce clutter. Save trees.
Sign up for electronic delivery of prospectuses and shareholder reports at wellsfargo.com/advantagedelivery
Contents
The views expressed and any forward-looking statements are as of April 30, 2013, unless otherwise noted, and are those of the Fund managers and/or Wells Fargo Funds Management, LLC. Discussions of individual securities, or the markets generally, or any Wells Fargo Advantage Fund are not intended as individual recommendations. Future events or results may vary significantly from those expressed in any forward-looking statements; the views expressed are subject to change at any time in response to changing circumstances in the market. Wells Fargo Funds Management, LLC, disclaims any obligation to publicly update or revise any views expressed or forward-looking statements.
NOT FDIC INSURED ¡ NO BANK GUARANTEE ¡ MAY LOSE VALUE

Wells Fargo investment history
| | |
| 1932 | | Keystone creates one of the first mutual fund families. |
| 1971 | | Wells Fargo & Company introduces one of the first institutional index funds. |
| 1978 | | Wells Fargo applies Markowitz and Sharpe’s research on Modern Portfolio Theory to introduce one of the industry’s first tactical asset allocation models in institutional separately managed accounts. |
| 1984 | | Wells Fargo Stagecoach Funds launches its first asset allocation fund. |
| 1989 | | The Tactical Asset Allocation (TAA) Model is first applied to Wells Fargo’s asset allocation mutual funds. |
| 1994 | | Wells Fargo introduces the LifePath Funds, one of the first suites of target date funds (now the Wells Fargo Advantage Dow Jones Target Date FundsSM). |
| 1996 | | Evergreen Investments and Keystone Funds merge. |
| 1997 | | Wells Fargo launches the Wells Fargo Advantage WealthBuilder PortfoliosSM, a fund-of-funds suite of products that includes the use of quantitative models to shift assets among investment styles. |
| 1999 | | Norwest Advantage Funds and Stagecoach Funds are reorganized into Wells Fargo Funds after the merger of Norwest and Wells Fargo. |
| 2002 | | Evergreen Retail and Evergreen Institutional companies form the umbrella asset management company, Evergreen Investments. |
| 2005 | | The integration of Strong Funds with Wells Fargo Funds creates Wells Fargo Advantage Funds, resulting in one of the top 20 mutual fund companies in the United States. |
| 2006 | | Wells Fargo Advantage Funds relaunches the target date product line as Wells Fargo Advantage Dow Jones Target Date Funds. |
| 2010 | | The mergers and reorganizations of Evergreen and Wells Fargo Advantage mutual funds are completed, unifying the families under the brand of Wells Fargo Advantage Funds. |
Wells Fargo Advantage Funds®
Wells Fargo Advantage Funds skillfully guides institutions, financial advisors, and individuals through the investment terrain to help them reach their financial objectives. Everything we do on behalf of investors is backed by our unique combination of qualifications.
Strength
Our organization is built on the standards of integrity and service established by our parent company—Wells Fargo & Company—more than 150 years ago. And, because we’re part of a highly diversified financial enterprise, we offer the depth of resources to help investors succeed.
Expertise
Our multi-boutique model offers investors access to the independent thinking of premier investment managers that have been chosen for their time-tested strategies. While each team specializes in a specific investment strategy, collectively they provide investors a wide choice of distinct investment styles. Our dedication to investment excellence doesn’t end with our expertise in manager selection—risk management, analysis, and rigorous ongoing review seek to ensure each manager’s investment process remains consistent.
Partnership
Our collaborative approach is built around understanding the needs and goals of our clients. By adhering to core principles of sound judgment and steady guidance, we support you through every stage of the investment decision process.
Carefully consider the investment objectives, risks, charges, and expenses before investing. For a current prospectus and, if available, a summary prospectus, for Wells Fargo Advantage Funds, containing this and other information, visit wellsfargoadvantagefunds.com. Read it carefully before investing.
Wells Fargo Funds Management, LLC, a wholly owned subsidiary of Wells Fargo & Company, provides investment advisory and administrative services for Wells Fargo Advantage Funds. Other affiliates of Wells Fargo & Company provide subadvisory and other services for the Funds. The Funds are distributed by Wells Fargo Funds Distributor, LLC, Member FINRA/SIPC, an affiliate of Wells Fargo & Company.
“Dow Jones®” and “Dow Jones Target Date IndexesSM” are service marks of Dow Jones Trademark Holdings LLC (“Dow Jones”); have been licensed to CME Group Index Services LLC (“CME Indexes”); and have been sublicensed for use for certain purposes by Global Index Advisors, Inc., and Wells Fargo Funds Management, LLC. The Wells Fargo Advantage Dow Jones Target Date FundsSM, based on the Dow Jones Target Date Indexes, are not sponsored, endorsed, sold, or promoted by Dow Jones, CME Indexes, or their respective affiliates, and none of them makes any representation regarding the advisability of investing in such product(s).
NOT FDIC INSURED ¡ NO BANK GUARANTEE ¡ MAY LOSE VALUE
Not part of the semi-annual report.
Wells Fargo Advantage Funds offers more than 100 mutual funds across a wide range of asset classes, representing over $228 billion in assets under management, as of April 30, 2013.
| | | | |
| Equity funds | | | | |
Asia Pacific Fund | | Enterprise Fund† | | Opportunity Fund† |
C&B Large Cap Value Fund | | Global Opportunities Fund | | Precious Metals Fund |
C&B Mid Cap Value Fund | | Growth Fund | | Premier Large Company Growth Fund |
Capital Growth Fund | | Index Fund | | Small Cap Opportunities Fund |
Common Stock Fund | | International Equity Fund | | Small Cap Value Fund |
Disciplined U.S. Core Fund | | International Value Fund | | Small Company Growth Fund |
Discovery Fund† | | Intrinsic Small Cap Value Fund | | Small Company Value Fund |
Diversified Equity Fund | | Intrinsic Value Fund | | Small/Mid Cap Value Fund |
Diversified International Fund | | Intrinsic World Equity Fund | | Special Mid Cap Value Fund |
Emerging Growth Fund | | Large Cap Core Fund | | Special Small Cap Value Fund |
Emerging Markets Equity Fund | | Large Cap Growth Fund | | Specialized Technology Fund |
Emerging Markets Equity Income Fund | | Large Company Value Fund | | Traditional Small Cap Growth Fund |
Endeavor Select Fund† | | Omega Growth Fund | | Utility and Telecommunications Fund |
| Bond funds | | | | |
Adjustable Rate Government Fund | | High Yield Municipal Bond Fund | | Short-Term Bond Fund |
California Limited-Term Tax-Free Fund | | Income Plus Fund | | Short-Term High Yield Bond Fund |
California Tax-Free Fund | | Inflation-Protected Bond Fund | | Short-Term Municipal Bond Fund |
Colorado Tax-Free Fund | | Intermediate Tax/AMT-Free Fund | | Strategic Income Fund |
Conservative Income Fund | | International Bond Fund | | Strategic Municipal Bond Fund |
Core Bond Fund | | Minnesota Tax-Free Fund | | Ultra Short-Term Income Fund |
Emerging Markets Local Bond Fund | | Municipal Bond Fund | | Ultra Short-Term Municipal Income Fund |
Government Securities Fund | | North Carolina Tax-Free Fund | | Wisconsin Tax-Free Fund |
High Income Fund | | Pennsylvania Tax-Free Fund | | |
High Yield Bond Fund | | Short Duration Government Bond Fund | | |
| Asset allocation funds | | | | |
Absolute Return Fund | | WealthBuilder Equity Portfolio† | | Target 2020 Fund† |
Asset Allocation Fund | | WealthBuilder Growth Allocation Portfolio† | | Target 2025 Fund† |
Diversified Capital Builder Fund | | WealthBuilder Growth Balanced Portfolio† | | Target 2030 Fund† |
Diversified Income Builder Fund | | WealthBuilder Moderate Balanced Portfolio† | | Target 2035 Fund† |
Growth Balanced Fund | | WealthBuilder Tactical Equity Portfolio† | | Target 2040 Fund† |
Index Asset Allocation Fund | | Target Today Fund† | | Target 2045 Fund† |
Moderate Balanced Fund | | Target 2010 Fund† | | Target 2050 Fund† |
WealthBuilder Conservative Allocation Portfolio† | | Target 2015 Fund† | | Target 2055 Fund† |
| Money market funds | | | | |
100% Treasury Money Market Fund | | Heritage Money Market Fund† | | National Tax-Free Money Market Fund |
California Municipal Money Market Fund | | Money Market Fund | | Treasury Plus Money Market Fund |
Cash Investment Money Market Fund | | Municipal Cash Management Money Market Fund | | |
Government Money Market Fund | | Municipal Money Market Fund | | |
| Variable trust funds1 | | | | |
VT Discovery Fund† | | VT Intrinsic Value Fund | | VT Small Cap Growth Fund |
VT Index Asset Allocation Fund | | VT Omega Growth Fund | | VT Small Cap Value Fund |
VT International Equity Fund | | VT Opportunity Fund† | | VT Total Return Bond Fund |
An investment in a money market fund is not insured or guaranteed by the Federal Deposit Insurance Corporation or any other government agency. Although the Wells Fargo Advantage Money Market Funds seek to preserve the value of your investment at $1.00 per share, it is possible to lose money by investing in a money market fund.
| 1. | The variable trust funds are generally available only through insurance company variable contracts. |
| † | In this report, the Wells Fargo Advantage Discovery FundSM, Wells Fargo Advantage Endeavor Select FundSM, Wells Fargo Advantage Enterprise FundSM, Wells Fargo Advantage Opportunity FundSM, Wells Fargo Advantage WealthBuilder Conservative Allocation PortfolioSM, Wells Fargo Advantage WealthBuilder Equity PortfolioSM, Wells Fargo Advantage WealthBuilder Growth Allocation PortfolioSM, Wells Fargo Advantage WealthBuilder Growth Balanced PortfolioSM, Wells Fargo Advantage WealthBuilder Moderate Balanced PortfolioSM, Wells Fargo Advantage WealthBuilder Tactical Equity PortfolioSM, Wells Fargo Advantage Dow Jones Target Today FundSM, Wells Fargo Advantage Dow Jones Target 2010 FundSM, Wells Fargo Advantage Dow Jones Target 2015 FundSM, Wells Fargo Advantage Dow Jones Target 2020 FundSM, Wells Fargo Advantage Dow Jones Target 2025 FundSM, Wells Fargo Advantage Dow Jones Target 2030 FundSM, Wells Fargo Advantage Dow Jones Target 2035 FundSM, Wells Fargo Advantage Dow Jones Target 2040 FundSM, Wells Fargo Advantage Dow Jones Target 2045 FundSM, Wells Fargo Advantage Dow Jones Target 2050 FundSM, Wells Fargo Advantage Dow Jones Target 2055 FundSM, Wells Fargo Advantage Heritage Money Market FundSM, Wells Fargo Advantage VT Discovery FundSM, and Wells Fargo Advantage VT Opportunity FundSM are referred to as the Discovery Fund, Endeavor Select Fund, Enterprise Fund, Opportunity Fund, WealthBuilder Conservative Allocation Portfolio, WealthBuilder Equity Portfolio, WealthBuilder Growth Allocation Portfolio, WealthBuilder Growth Balanced Portfolio, WealthBuilder Moderate Balanced Portfolio, WealthBuilder Tactical Equity Portfolio, Target Today Fund, Target 2010 Fund, Target 2015 Fund, Target 2020 Fund, Target 2025 Fund, Target 2030 Fund, Target 2035 Fund, Target 2040 Fund, Target 2045 Fund, Target 2050 Fund, Target 2055 Fund, Heritage Money Market Fund, VT Discovery Fund, and VT Opportunity Fund, respectively. |
Not part of the semi-annual report.
| | | | |
| 2 | | Wells Fargo Advantage Diversified International Fund | | Letter to shareholders (unaudited) |

Karla M. Rabusch
President
Wells Fargo Advantage Funds
Investors were heartened by the resilient performance of the German economy and by the fact that the United Kingdom managed to avoid another recession.
Dear Valued Shareholder:
We are pleased to offer you this semi-annual report for the Wells Fargo Advantage Diversified International Fund for the six-month period that ended April 30, 2013. Much of the period was marked by diminished worries of a sovereign debt default in Europe, partially offset by concerns about slowing economic growth in China. Continued monetary easing by global central banks helped support rallies in developed stock markets, but major emerging markets lagged.
Developed markets posted double-digit returns, but major emerging markets lagged.
Global developed equity markets demonstrated continued strength throughout the reporting period despite a budget fight and sequestration cuts in the U.S. and Europe’s seemingly never-ending debt crisis, with Cyprus becoming the newest addition to a list of countries mired in debt. Investors were heartened by the resilient performance of the German economy and by the fact that the United Kingdom managed to avoid another recession. Relatively positive economic data from the U.S. also aided sentiment for developed-market stocks. Although reported U.S. gross domestic product (GDP) growth came in at a moderate 0.4% annualized rate in the fourth quarter of 2012—in part, due to the temporary aftereffects from Hurricane Sandy, which devastated the Eastern Seaboard in October 2012—GDP growth improved to a 2.4% annualized rate for the first quarter of 2013. Monetary easing by major central banks also supported equity markets.
As judged by various MSCI indexes, major emerging markets generally underperformed. Despite China’s smooth transition to a new generation of political leadership, the country’s decelerating growth rate caused its stock market to lag not only developed markets but also the main MSCI Emerging Markets Index (Net)1. Given China’s importance as a buyer of raw commodities from countries such as Brazil, as well as its key role in Asia’s manufacturing chain, fears of a recession in China led to single-digit returns for other emerging markets.
Central banks continued to provide stimulus.
Major central banks, including the U.S. Federal Reserve Board (Fed) and the European Central Bank (ECB), continued to inject liquidity into the banks and the market through various quantitative easing policies. Throughout the reporting period, the Federal Open Market Committee (FOMC) kept its key interest rates effectively at zero in order to support the economy and the financial system. After its September 2012 meeting, the FOMC announced its intention to keep interest rates low until at least mid-2015 and to make open-ended purchases of $40 billion per month in mortgage-backed securities to support the housing market.
After cutting its key rate to 0.75% in July 2012, the ECB announced in September 2012 that it would purchase an unlimited amount of one- to three-year sovereign debt from countries that had formally applied for a bailout. In May 2013, after the end of the reporting period, the ECB cut its key rate to a historic low of 0.50%. The ECB’s aggressive actions helped ease investor worries about a eurozone sovereign debt default. Moreover, in mid-March 2013, the governor of the Bank of Japan resigned to allow Shinzo Abe, the recently reelected prime minister, to appoint a new bank governor who supported using aggressive monetary policies to attack Japan’s persistent deflation.
| | | | | | |
| Letter to shareholders (unaudited) | | Wells Fargo Advantage Diversified International Fund | | | 3 | |
The debt crisis in the eurozone returned to center stage but with less impact than before.
Ongoing weakness in the Greek economy made it difficult for the country to meet previously agreed upon austerity targets. Because many eurozone banks owned Greek debt and many U.S. banks had financial ties to eurozone banks, investors initially worried that a Greek default would result in another global financial crisis. However, as central banks continued to provide liquidity, investor worries about the effect of a European sovereign debt default on the global economy began to ease. When the tiny eurozone nation of Cyprus was forced to implement capital controls and impose losses on uninsured bank depositors in March 2013, global stock markets remained resilient despite short-term volatility.
Global monetary easing helped push the MSCI EAFE Index (Net)2, an index of developed stock markets, to a 16.90% return for the six-month period. By comparison, the S&P 500 Index3, a barometer of large-cap U.S. stocks, posted a 14.42% return for the reporting period. Within emerging markets, smaller markets, such as the Philippines and Thailand, strongly outperformed the larger markets, such as China, India, and Brazil. The smaller markets are benefiting from high growth rates without some of the imbalances—such as an overreliance on real estate—that are affecting the larger emerging markets.
We employ a diverse array of investment strategies, even as many variables are at work in the market.
The full effect of the European credit crisis remains unknown. Elevated unemployment in the U.S. and Southern Europe continues to pressure consumers and businesses alike. As a whole, Wells Fargo Advantage Funds represents investments across a range of asset classes and investment styles, giving you an opportunity to create a diversified investment portfolio. While diversification4 may not prevent losses in a downturn, we believe it helps manage risk.
Thank you for choosing to invest with Wells Fargo Advantage Funds. We appreciate your confidence in us and remain committed to helping you meet your financial needs. For current information about your fund investments, contact your investment professional, visit our website at wellsfargoadvantagefunds.com, or call us directly at 1-800-222-8222. We are available 24 hours a day, 7 days a week.
Sincerely,

Karla M. Rabusch
President
Wells Fargo Advantage Funds
Within emerging markets, smaller markets, such as the Philippines and Thailand, strongly outperformed the larger markets, such as China, India, and Brazil.
| 1. | The Morgan Stanley Capital International Emerging Markets (MSCI Emerging Markets) Index (Net) is a free float-adjusted market capitalization index designed to measure the equity market performance in the global emerging markets. The index is currently composed of 21 emerging markets country indexes. You cannot invest directly in an index. Source: MSCI. MSCI makes no express or implied warranties or representations and shall have no liability whatsoever with respect to any MSCI data contained herein. The MSCI data may not be further redistributed or used as a basis for other indexes or any securities or financial products. This report is not approved, reviewed, or produced by MSCI. |
| 2. | The Morgan Stanley Capital International Europe, Australasia, and Far East (MSCI EAFE) Index (Net) is an unmanaged group of securities widely regarded by investors to be representations of the stock markets of Europe, Australasia, and the Far East. You cannot invest directly in an index. |
| 3. | The S&P 500 Index consists of 500 stocks chosen for market size, liquidity, and industry group representation. It is a market-value-weighted index with each stock’s weight in the index proportionate to its market value. You cannot invest directly in an index. |
| 4. | Diversification does not assure or guarantee better performance and cannot eliminate the risk of investment losses. |
| | | | |
| 4 | | Wells Fargo Advantage Diversified International Fund | | Performance highlights (unaudited) |
Investment objective
The Fund seeks long-term capital appreciation.
Adviser
Wells Fargo Funds Management, LLC
Subadvisers
Artisan Partners Limited Partnership
LSV Asset Management
Wells Capital Management Incorporated
Portfolio managers
Jeffrey Everett, CFA
Josef Lakonishok
Puneet Mansharamani, CFA
Menno Vermeulen, CFA
Dale Winner, CFA
Mark L. Yockey, CFA
Average annual total returns1 (%) as of April 30, 2013
| | | | | | | | | | | | | | | | | | | | | | | | | | | | | | | | | | |
| | | | | Including sales charge | | | Excluding sales charge | | | Expense ratios2 (%) | |
| | | Inception date | | 1 year | | | 5 year | | | 10 year | | | 1 year | | | 5 year | | | 10 year | | | Gross | | | Net3 | |
| Class A (SILAX) | | 9-24-1997 | | | 10.46 | | | | (2.52 | ) | | | 6.49 | | | | 17.24 | | | | (1.35 | ) | | | 7.12 | | | | 1.66 | | | | 1.42 | |
| Class B (SILBX)* | | 9-24-1997 | | | 11.35 | | | | (2.49 | ) | | | 6.55 | | | | 16.35 | | | | (2.05 | ) | | | 6.55 | | | | 2.41 | | | | 2.17 | |
| Class C (WFECX) | | 4-1-1998 | | | 15.36 | | | | (2.04 | ) | | | 6.32 | | | | 16.36 | | | | (2.04 | ) | | | 6.32 | | | | 2.41 | | | | 2.17 | |
| Administrator Class (WFIEX) | | 11-8-1999 | | | – | | | | – | | | | – | | | | 17.34 | | | | (1.16 | ) | | | 7.33 | | | | 1.50 | | | | 1.26 | |
| Institutional Class (WFISX) | | 8-31-2006 | | | – | | | | – | | | | – | | | | 17.21 | | | | (1.00 | ) | | | 7.45 | | | | 1.23 | | | | 1.00 | |
| Investor Class (WIEVX) | | 7-18-2008 | | | – | | | | – | | | | – | | | | 17.14 | | | | (1.37 | ) | | | 7.04 | | | | 1.72 | | | | 1.47 | |
| MSCI EAFE® Index (Net)4 | | – | | | – | | | | – | | | | – | | | | 19.39 | | | | (0.93 | ) | | | 9.23 | | | | – | | | | – | |
| * | | Class B shares are closed to investment, except in connection with the reinvestment of any distributions and permitted exchanges. |
Figures quoted represent past performance, which is no guarantee of future results and do not reflect the deduction of taxes that a shareholder may pay on fund distributions or the redemption of fund shares. Investment return and principal value of an investment will fluctuate so that an investor’s shares, when redeemed, may be worth more or less than their original cost. Performance shown without sales charges would be lower if sales charges were reflected. Current performance may be lower or higher than the performance data quoted, which assumes the reinvestment of dividends and capital gains. Current month-end performance is available on the Fund’s website, wellsfargoadvantagefunds.com.
Index returns do not include transaction costs associated with buying and selling securities, any mutual fund fees or expenses, or any taxes. It is not possible to invest directly in an index.
For Class A shares, the maximum front-end sales charge is 5.75%. For Class B shares, the maximum contingent deferred sales charge is 5.00%. For Class C shares, the maximum contingent deferred sales charge is 1.00%. Performance including sales charge assumes the sales charge for the corresponding time period. Administrator Class, Institutional Class, and Investor Class shares are sold without a front-end sales charge or contingent deferred sales charge.
Stock values fluctuate in response to the activities of individual companies and general market and economic conditions. Foreign investments are especially volatile and can rise or fall dramatically due to differences in the political and economic conditions of the host country. These risks are generally intensified in emerging markets. The use of derivatives may reduce returns and/or increase volatility. Certain investment strategies tend to increase the total risk of an investment (relative to the broader market). The Fund is exposed to smaller-company securities risk. Consult the Fund’s prospectus for additional information on these and other risks.
Please see footnotes on page 5.
| | | | | | |
| Performance highlights (unaudited) | | Wells Fargo Advantage Diversified International Fund | | | 5 | |
| | | | |
| Ten largest equity holdings5 (%) as of April 30, 2013 | |
Toyota Motor Corporation | | | 1.59 | |
Zurich Financial Services AG | | | 1.45 | |
Muenchener Rueckversicherungs-Gesellschaft AG | | | 1.39 | |
Honda Motor Company Limited | | | 1.38 | |
Linde AG | | | 1.37 | |
Allianz AG | | | 1.31 | |
BP plc | | | 1.26 | |
Japan Tobacco Incorporated | | | 1.26 | |
Bayer AG | | | 1.19 | |
Anheuser-Busch InBev NV | | | 1.15 | |
|
| Sector distribution6 as of April 30, 2013 |
|
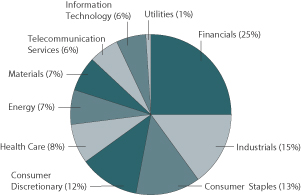
|
| 1. | Historical performance shown for the Investor Class shares prior to their inception reflects the performance of Class A shares, adjusted to reflect the higher expenses applicable to the Investor Class shares. Historical performance shown for the Institutional Class shares prior to their inception reflects the performance of the Administrator Class shares, and includes the higher expenses applicable to the Administrator Class shares. If these expenses had not been included, returns would be higher. |
| 2. | Reflects the expense ratios as stated in the most recent prospectuses. |
| 3. | The Adviser has committed through February 28, 2014, to waive fees and/or reimburse expenses to the extent necessary to cap the Fund’s Total Annual Fund Operating Expenses After Fee Waiver, excluding certain expenses, at 1.41% for Class A, 2.16% for Class B, 2.16% for Class C, 1.25% for Administrator Class, 0.99% for Institutional Class, and 1.46% for Investor Class. Brokerage commissions, stamp duty fees, interest, taxes, acquired fund fees and expenses, and extraordinary expenses are excluded from the cap. Without this cap, the Fund’s returns would have been lower. |
| 4. | The Morgan Stanley Capital International Europe, Australasia, and Far East (MSCI EAFE) Index (Net) is an unmanaged group of securities widely regarded by investors to be representations of the stock markets of Europe, Australasia, and the Far East. You cannot invest directly in an index. Source: MSCI. MSCI makes no express or implied warranties or representations and shall have no liability whatsoever with respect to any MSCI data contained herein. The MSCI data may not be further redistributed or used as a basis for other indexes or any securities or financial products. This report is not approved, reviewed, or produced by MSCI. |
| 5. | The ten largest equity holdings are calculated based on the value of the securities divided by total net assets of the Fund. Holdings are subject to change and may have changed since the date specified. Top holdings typically include the underlying ordinary shares combined with any depositary receipts. |
| 6. | Sector distribution is subject to change and is calculated based on the total long-term investments of the Fund. |
| | | | |
| 6 | | Wells Fargo Advantage Diversified International Fund | | Fund expenses (unaudited) |
As a shareholder of the Fund, you incur two types of costs: (1) transaction costs, including sales charges (loads) on purchase payments and contingent deferred sales charges (if any) on redemptions and (2) ongoing costs, including management fees, distribution (12b-1) and/or shareholder service fees, and other Fund expenses. This example is intended to help you understand your ongoing costs (in dollars) of investing in the Fund and to compare these costs with the ongoing costs of investing in other mutual funds.
The example is based on an investment of $1,000 invested at the beginning of the six-month period and held for the entire period from November 1, 2012 to April 30, 2013.
Actual Expenses
The “Actual” line of the table below provides information about actual account values and actual expenses. You may use the information in this line, together with the amount you invested, to estimate the expenses that you paid over the period. Simply divide your account value by $1,000 (for example, an $8,600 account value divided by $1,000 = 8.6), then multiply the result by the number in the “Actual” line under the heading entitled “Expenses paid during period” for your applicable class of shares to estimate the expenses you paid on your account during this period.
Hypothetical Example for Comparison Purposes
The “Hypothetical” line of the table below provides information about hypothetical account values and hypothetical expenses based on the Fund’s actual expense ratio and an assumed rate of return of 5% per year before expenses, which is not the Fund’s actual return. The hypothetical account values and expenses may not be used to estimate the actual ending account balance or expenses you paid for the period. You may use this information to compare the ongoing costs of investing in the Fund and other funds. To do so, compare this 5% hypothetical example with the 5% hypothetical examples that appear in the shareholder reports of the other funds.
Please note that the expenses shown in the table are meant to highlight your ongoing costs only and do not reflect any transactional costs, such as sales charges (loads) and contingent deferred sales charges. Therefore, the “Hypothetical” line of the table is useful in comparing ongoing costs only and will not help you determine the relative total costs of owning different funds. In addition, if these transactional costs were included, your costs would have been higher.
| | | | | | | | | | | | | | | | |
| | | Beginning
account value
11-1-2012 | | | Ending
account value
4-30-2013 | | | Expenses
paid during
the period¹ | | | Net annual
expense ratio | |
Class A | | | | | | | | | | | | | | | | |
Actual | | $ | 1,000.00 | | | $ | 1,156.34 | | | $ | 7.54 | | | | 1.41 | % |
Hypothetical (5% return before expenses) | | $ | 1,000.00 | | | $ | 1,017.80 | | | $ | 7.05 | | | | 1.41 | % |
Class B | | | | | | | | | | | | | | | | |
Actual | | $ | 1,000.00 | | | $ | 1,152.84 | | | $ | 11.53 | | | | 2.16 | % |
Hypothetical (5% return before expenses) | | $ | 1,000.00 | | | $ | 1,014.08 | | | $ | 10.79 | | | | 2.16 | % |
Class C | | | | | | | | | | | | | | | | |
Actual | | $ | 1,000.00 | | | $ | 1,152.61 | | | $ | 11.53 | | | | 2.16 | % |
Hypothetical (5% return before expenses) | | $ | 1,000.00 | | | $ | 1,014.08 | | | $ | 10.79 | | | | 2.16 | % |
Administrator Class | | | | | | | | | | | | | | | | |
Actual | | $ | 1,000.00 | | | $ | 1,157.66 | | | $ | 6.69 | | | | 1.25 | % |
Hypothetical (5% return before expenses) | | $ | 1,000.00 | | | $ | 1,018.60 | | | $ | 6.26 | | | | 1.25 | % |
Institutional Class | | | | | | | | | | | | | | | | |
Actual | | $ | 1,000.00 | | | $ | 1,159.44 | | | $ | 5.30 | | | | 0.99 | % |
Hypothetical (5% return before expenses) | | $ | 1,000.00 | | | $ | 1,019.89 | | | $ | 4.96 | �� | | | 0.99 | % |
Investor Class | | | | | | | | | | | | | | | | |
Actual | | $ | 1,000.00 | | | $ | 1,156.49 | | | $ | 7.81 | | | | 1.46 | % |
Hypothetical (5% return before expenses) | | $ | 1,000.00 | | | $ | 1,017.55 | | | $ | 7.30 | | | | 1.46 | % |
| 1. | Expenses paid is equal to the annualized expense ratio of each class multiplied by the average account value over the period, multiplied by the number of days in the most recent fiscal half-year divided by the number of days in the fiscal year (to reflect the one-half-year period). |
| | | | | | |
| Portfolio of investments—April 30, 2013 (unaudited) | | Wells Fargo Advantage Diversified International Fund | | | 7 | |
| | | | | | | | | | | | |
| Security name | | | | | | Shares | | | Value | |
| | | | | | | | | | | | |
| | | | |
Common Stocks: 95.93% | | | | | | | | | | | | |
| | | | |
| Australia: 2.11% | | | | | | | | | | | | |
Arrium Limited (Materials, Metals & Mining) | | | | | | | 198,700 | | | $ | 175,093 | |
Bendigo Bank Limited (Financials, Commercial Banks) | | | | | | | 26,100 | | | | 299,260 | |
Challenger Financial Services Group Limited (Financials, Diversified Financial Services) | | | | | | | 46,700 | | | | 203,338 | |
Downer EDI Limited (Industrials, Commercial Services & Supplies) | | | | | | | 42,300 | | | | 215,315 | |
Goodman Fielder Limited (Consumer Staples, Food Products) † | | | | | | | 134,500 | | | | 108,063 | |
Lend Lease Corporation Limited (Financials, Real Estate Management & Development) | | | | | | | 20,800 | | | | 232,453 | |
Metcash Limited (Consumer Staples, Food & Staples Retailing) | | | | | | | 28,500 | | | | 120,843 | |
Perilya Limited (Industrials, Professional Services) † | | | | | | | 289,100 | | | | 44,957 | |
Westfield Group (Financials, REITs) | | | | | | | 5,840 | | | | 70,533 | |
Westpac Banking Corporation (Financials, Commercial Banks) | | | | | | | 6,300 | | | | 220,755 | |
| | | | |
| | | | | | | | | | | 1,690,610 | |
| | | | | | | | | | | | |
| | | | |
| Austria: 0.44% | | | | | | | | | | | | |
OMV AG (Energy, Oil, Gas & Consumable Fuels) | | | | | | | 5,300 | | | | 249,006 | |
Voestalpine AG (Materials, Metals & Mining) | | | | | | | 3,400 | | | | 106,142 | |
| | | | |
| | | | | | | | | | | 355,148 | |
| | | | | | | | | | | | |
| | | | |
| Belgium: 2.12% | | | | | | | | | | | | |
Anheuser-Busch InBev NV (Consumer Staples, Beverages) « | | | | | | | 9,698 | | | | 922,762 | |
Delhaize Group SA (Consumer Staples, Food & Staples Retailing) | | | | | | | 3,600 | | | | 225,720 | |
KBC Groep NV (Financials, Commercial Banks) | | | | | | | 3,700 | | | | 145,207 | |
Telenet Group Holding NV (Telecommunication Services, Diversified Telecommunication Services) | | | | | | | 2,545 | | | | 137,400 | |
Tessenderlo Chemie NV (Materials, Chemicals) | | | | | | | 3,600 | | | | 101,790 | |
UCB SA (Health Care, Pharmaceuticals) « | | | | | | | 2,796 | | | | 165,257 | |
| | | | |
| | | | | | | | | | | 1,698,136 | |
| | | | | | | | | | | | |
| | | | |
| Brazil: 0.92% | | | | | | | | | | | | |
Banco do Brasil SA (Financials, Commercial Banks) | | | | | | | 12,100 | | | | 151,980 | |
BM&FBOVESPA SA (Financials, Diversified Financial Services) | | | | | | | 9,400 | | | | 65,259 | |
Companhia de Saneamento Basico do Estado de Sao Paulo (Utilities, Water Utilities) | | | | | | | 17,700 | | | | 249,034 | |
Companhia de Saneamento de Minas Gerais SA (Utilities, Water Utilities) | | | | | | | 5,300 | | | | 123,179 | |
Cosan Limited Class A (Energy, Oil, Gas & Consumable Fuels) | | | | | | | 7,000 | | | | 145,250 | |
| | | | |
| | | | | | | | | | | 734,702 | |
| | | | | | | | | | | | |
| | | | |
| Canada: 3.49% | | | | | | | | | | | | |
Barrick Gold Corporation (Materials, Metals & Mining) | | | | | | | 15,266 | | | | 300,941 | |
Canadian Pacific Railway Limited (Industrials, Road & Rail) | | | | | | | 6,046 | | | | 753,453 | |
Cenovus Energy Incorporated (Energy, Oil, Gas & Consumable Fuels) | | | | | | | 11,290 | | | | 338,023 | |
Magna International Incorporated Class A (Consumer Discretionary, Auto Components) « | | | | | | | 4,500 | | | | 270,683 | |
Metro Incorporated (Consumer Staples, Food & Staples Retailing) | | | | | | | 3,400 | | | | 230,570 | |
Suncor Energy Incorporated (Energy, Oil, Gas & Consumable Fuels) | | | | | | | 4,293 | | | | 133,846 | |
Valeant Pharmaceuticals International Incorporated (Health Care, Pharmaceuticals) † | | | | | | | 6,539 | | | | 497,487 | |
WestJet Airlines Limited (Industrials, Airlines) | | | | | | | 11,100 | | | | 272,583 | |
| | | | |
| | | | | | | | | | | 2,797,586 | |
| | | | | | | | | | | | |
| | | | |
| China: 3.87% | | | | | | | | | | | | |
AutoNavi Holdings Limited ADR (Information Technology, Software) Ǡ | | | | | | | 16,608 | | | | 181,858 | |
Baidu.com Incorporated ADR (Information Technology, Internet Software & Services) † | | | | | | | 7,848 | | | | 673,751 | |
The accompanying notes are an integral part of these financial statements.
| | | | |
| 8 | | Wells Fargo Advantage Diversified International Fund | | Portfolio of investments—April 30, 2013 (unaudited) |
| | | | | | | | | | | | |
| Security name | | | | | | Shares | | | Value | |
| | | | | | | | | | | | |
| | | | |
| China (continued) | | | | | | | | | | | | |
Biostime International Holdings Limited (Consumer Staples, Food Products) | | | | | | | 27,500 | | | $ | 158,405 | |
China Communications Services Corporation Limited (Telecommunication Services, Diversified
Telecommunication Services) | | | | | | | 220,000 | | | | 161,028 | |
China Mobile Limited (Telecommunication Services, Wireless Telecommunication Services) | | | | | | | 48,000 | | | | 525,454 | |
China Petroleum & Chemical Corporation (Energy, Oil, Gas & Consumable Fuels) | | | | | | | 284,000 | | | | 310,710 | |
China Railway Construction Corporation Limited (Industrials, Construction & Engineering) | | | | | | | 141,500 | | | | 142,774 | |
Industrial & Commercial Bank of China Limited Class H (Financials, Commercial Banks) | | | | | | | 513,000 | | | | 360,944 | |
Shenguan Holdings Group Limited (Consumer Staples, Food Products) | | | | | | | 172,000 | | | | 87,328 | |
Tencent Holdings Limited (Information Technology, Internet Software & Services) | | | | | | | 9,200 | | | | 315,592 | |
Xtep International Holdings Limited (Consumer Discretionary, Textiles, Apparel & Luxury Goods) | | | | | | | 444,241 | | | | 186,051 | |
| | | | |
| | | | | | | | | | | 3,103,895 | |
| | | | | | | | | | | | |
| | | | |
| Denmark: 0.19% | | | | | | | | | | | | |
H. Lundbeck A/S (Health Care, Pharmaceuticals) « | | | | | | | 4,100 | | | | 81,984 | |
Rockwool International A/S B Shares (Industrials, Building Products) | | | | | | | 563 | | | | 74,339 | |
| | | | |
| | | | | | | | | | | 156,323 | |
| | | | | | | | | | | | |
| | | | |
| Finland: 0.46% | | | | | | | | | | | | |
Metso Oyj (Industrials, Machinery) | | | | | | | 5,883 | | | | 241,648 | |
TietoEnator Oyj (Information Technology, IT Services) | | | | | | | 5,800 | | | | 124,199 | |
| | | | |
| | | | | | | | | | | 365,847 | |
| | | | | | | | | | | | |
| | | | |
| France: 5.49% | | | | | | | | | | | | |
Arkema SA (Industrials, Professional Services) | | | | | | | 910 | | | | 85,256 | |
AXA SA (Financials, Insurance) | | | | | | | 7,500 | | | | 140,403 | |
BNP Paribas SA (Financials, Commercial Banks) | | | | | | | 3,600 | | | | 200,593 | |
Credit Agricole SA (Financials, Commercial Banks) † | | | | | | | 10,900 | | | | 99,780 | |
LVMH Moet Hennessy Louis Vuitton SA (Consumer Discretionary, Textiles, Apparel & Luxury Goods) | | | | | | | 752 | | | | 130,231 | |
Pernod-Ricard SA (Consumer Staples, Beverages) | | | | | | | 2,717 | | | | 336,347 | |
Sanofi-Aventis SA (Health Care, Pharmaceuticals) | | | | | | | 6,434 | | | | 705,145 | |
Schneider Electric SA (Industrials, Electrical Equipment) | | | | | | | 6,082 | | | | 463,761 | |
SCOR SE (Financials, Insurance) « | | | | | | | 7,700 | | | | 233,688 | |
Societe Generale SA (Financials, Diversified Financial Services) † | | | | | | | 3,700 | | | | 134,390 | |
Total SA (Energy, Oil, Gas & Consumable Fuels) | | | | | | | 14,603 | | | | 735,987 | |
Unibail-Rodamco SA (Financials, Real Estate Management & Development) | | | | | | | 1,879 | | | | 491,198 | |
Vivendi SA (Telecommunication Services, Wireless Telecommunication Services) | | | | | | | 12,000 | | | | 271,819 | |
Zodiac Aerospace SA (Industrials, Aerospace & Defense) | | | | | | | 3,027 | | | | 379,387 | |
| | | | |
| | | | | | | | | | | 4,407,985 | |
| | | | | | | | | | | | |
| | | | |
| Germany: 12.24% | | | | | | | | | | | | |
Allianz AG (Financials, Insurance) « | | | | | | | 7,142 | | | | 1,053,904 | |
BASF SE (Materials, Chemicals) « | | | | | | | 2,900 | | | | 270,855 | |
Bayer AG (Health Care, Pharmaceuticals) « | | | | | | | 9,165 | | | | 956,174 | |
Beiersdorf AG (Consumer Staples, Personal Products) | | | | | | | 4,927 | | | | 445,963 | |
Brenntag AG (Materials, Chemicals) | | | | | | | 2,183 | | | | 372,156 | |
Daimler AG (Consumer Discretionary, Automobiles) | | | | | | | 4,800 | | | | 265,592 | |
Deutsche Bank AG (Financials, Commercial Banks) | | | | | | | 3,300 | | | | 151,717 | |
Deutsche Post AG (Industrials, Air Freight & Logistics) | | | | | | | 23,613 | | | | 560,371 | |
E.ON AG (Utilities, Electric Utilities) « | | | | | | | 6,200 | | | | 112,352 | |
Hannover Rueckversicherung AG (Financials, Insurance) | | | | | | | 2,200 | | | | 185,774 | |
Heidelbergcement AG (Materials, Construction Materials) « | | | | | | | 5,553 | | | | 399,803 | |
The accompanying notes are an integral part of these financial statements.
| | | | | | |
| Portfolio of investments—April 30, 2013 (unaudited) | | Wells Fargo Advantage Diversified International Fund | | | 9 | |
| | | | | | | | | | |
| Security name | | | | | | Shares | | Value | |
| | | | | | | | | | |
| | | | |
| Germany (continued) | | | | | | | | | | |
Kabel Deutschland Holding AG (Consumer Discretionary, Media) | | | | | | 5,351 | | $ | 508,582 | |
Linde AG (Materials, Chemicals) | | | | | | 5,806 | | | 1,097,996 | |
Metro AG (Consumer Staples, Food & Staples Retailing) « | | | | | | 21,723 | | | 677,297 | |
Muenchener Rueckversicherungs-Gesellschaft AG (Financials, Insurance) « | | | | | | 5,594 | | | 1,118,683 | |
Norddeutsche Affinerie AG (Materials, Metals & Mining) | | | | | | 1,800 | | | 113,097 | |
RWE AG (Utilities, Multi-Utilities) | | | | | | 2,900 | | | 104,397 | |
SAP AG (Information Technology, Software) | | | | | | 5,752 | | | 456,854 | |
Siemens AG (Industrials, Industrial Conglomerates) | | | | | | 6,372 | | | 665,455 | |
Volkswagen AG (Consumer Discretionary, Automobiles) « | | | | | | 1,600 | | | 311,011 | |
| | | | |
| | | | | | | | | 9,828,033 | |
| | | | | | | | | | |
| | | | |
| Hong Kong: 4.11% | | | | | | | | | | |
AIA Group Limited (Financials, Insurance) | | | | | | 203,000 | | | 901,187 | |
Beijing Enterprises Holdings Limited (Financials, Diversified Financial Services) | | | | | | 18,500 | | | 138,390 | |
China Everbright Limited (Financials, Capital Markets) | | | | | | 404,000 | | | 642,431 | |
China Resources Land Limited (Financials, Real Estate Management & Development) | | | | | | 104,600 | | | 316,759 | |
Guangdong Investment Limited (Utilities, Water Utilities) | | | | | | 194,000 | | | 187,746 | |
Hengdeli Holdings Limited (Consumer Discretionary, Specialty Retail) | | | | | | 1,729,424 | | | 503,663 | |
Hong Kong Land Holdings Limited (Financials, Real Estate Management & Development) | | | | | | 24,058 | | | 174,661 | |
Johnson Electric Holdings Limited (Industrials, Electrical Equipment) | | | | | | 178,500 | | | 121,681 | |
Kingboard Laminates Holdings Limited (Information Technology, Electronic Equipment, Instruments & Components) | | | | | | 226,500 | | | 101,573 | |
Sino Land Company (Financials, Real Estate Management & Development) | | | | | | 37,690 | | | 61,974 | |
Yue Yuen Industrial Holdings Limited (Consumer Discretionary, Textiles, Apparel & Luxury Goods) | | | | | | 42,000 | | | 145,319 | |
| | | | |
| | | | | | | | | 3,295,384 | |
| | | | | | | | | | |
| | | | |
| India: 0.63% | | | | | | | | | | |
Coal India Limited (Energy, Oil, Gas & Consumable Fuels) | | | | | | 16,734 | | | 99,146 | |
Grasim Industries GDR (Industrials, Construction & Engineering) | | | | | | 1,800 | | | 98,172 | |
Tata Motors Limited ADR (Consumer Discretionary, Auto Components) « | | | | | | 7,700 | | | 212,058 | |
Tata Steel Limited GDR (Industrials, Machinery) | | | | | | 17,100 | | | 97,727 | |
| | | | |
| | | | | | | | | 507,103 | |
| | | | | | | | | | |
| | | | |
| Indonesia: 0.18% | | | | | | | | | | |
PT Bank Rakyat Indonesia Tbk (Financials, Commercial Banks) | | | | | | 150,500 | | | 145,508 | |
| | | | | | | | | | |
| | | | |
| Ireland : 1.25% | | | | | | | | | | |
Covidien plc (Health Care, Health Care Equipment & Supplies) | | | | | | 10,424 | | | 665,468 | |
CRH plc (Materials, Construction Materials) | | | | | | 15,836 | | | 340,462 | |
| | | | |
| | | | | | | | | 1,005,930 | |
| | | | | | | | | | |
| | | | |
| Israel: 0.44% | | | | | | | | | | |
Bank Hapoalim Limited (Financials, Commercial Banks) † | | | | | | 38,000 | | | 176,485 | |
Teva Pharmaceutical Industries Limited (Health Care, Pharmaceuticals) | | | | | | 4,600 | | | 180,022 | |
| | | | |
| | | | | | | | | 356,507 | |
| | | | | | | | | | |
| | | | |
| Italy: 1.83% | | | | | | | | | | |
Enel SpA (Utilities, Electric Utilities) | | | | | | 48,100 | | | 185,982 | |
ENI SpA (Energy, Oil, Gas & Consumable Fuels) | | | | | | 30,391 | | | 726,825 | |
Intesa Sanpaolo SpA (Financials, Commercial Banks) | | | | | | 308,666 | | | 559,748 | |
| | | | |
| | | | | | | | | 1,472,555 | |
| | | | | | | | | | |
The accompanying notes are an integral part of these financial statements.
| | | | |
| 10 | | Wells Fargo Advantage Diversified International Fund | | Portfolio of investments—April 30, 2013 (unaudited) |
| | | | | | | | | | | | |
| Security name | | | | | | Shares | | | Value | |
| | | | | | | | | | | | |
| | | | |
| Japan: 18.25% | | | | | | | | | | | | |
Adeka Corporation (Materials, Chemicals) | | | | | | | 20,600 | | | $ | 185,112 | |
Alpine Electronics Incorporated (Information Technology, Electronic Equipment, Instruments & Components) | | | | | | | 11,600 | | | | 118,160 | |
Aozora Bank Limited (Financials, Commercial Banks) | | | | | | | 41,000 | | | | 128,276 | |
Asahi Glass Company Limited (Industrials, Building Products) | | | | | | | 76,000 | | | | 595,620 | |
Capcom Company Limited (Information Technology, Software) | | | | | | | 27,600 | | | | 454,408 | |
Credit Saison Company Limited (Financials, Consumer Finance) | | | | | | | 1,400 | | | | 40,886 | |
Daiwa Securities Group Incorporated (Financials, Capital Markets) | | | | | | | 75,000 | | | | 663,948 | |
Eizo Nanao Corporation (Information Technology, Computers & Peripherals) | | | | | | | 7,300 | | | | 126,253 | |
Fukuoka Financial Group Incorporated (Financials, Commercial Banks) | | | | | | | 23,000 | | | | 117,495 | |
Hitachi Capital Corporation (Financials, Consumer Finance) | | | | | | | 5,100 | | | | 126,918 | |
Honda Motor Company Limited (Consumer Discretionary, Automobiles) | | | | | | | 27,900 | | | | 1,109,017 | |
Ishikawajima-Harima Heavy Industries Company Limited (Industrials, Machinery) | | | | | | | 43,000 | | | | 160,117 | |
Itochu Corporation (Industrials, Trading Companies & Distributors) | | | | | | | 53,500 | | | | 661,307 | |
Japan Tobacco Incorporated (Consumer Staples, Tobacco) | | | | | | | 26,800 | | | | 1,013,058 | |
JX Holdings Incorporated (Energy, Oil, Gas & Consumable Fuels) | | | | | | | 28,500 | | | | 154,362 | |
KDDI Corporation (Telecommunication Services, Wireless Telecommunication Services) | | | | | | | 8,400 | | | | 403,262 | |
Kyorin Company Limited (Health Care, Pharmaceuticals) | | | | | | | 7,900 | | | | 211,023 | |
Maeda Road Construction Company Limited (Industrials, Construction & Engineering) | | | | | | | 11,000 | | | | 165,985 | |
Marubeni Corporation (Industrials, Trading Companies & Distributors) | | | | | | | 30,000 | | | | 214,495 | |
Miraca Holdings Incorporated (Health Care, Health Care Providers & Services) | | | | | | | 1,800 | | | | 89,737 | |
Mitsubishi Corporation (Industrials, Trading Companies & Distributors) | | | | | | | 5,500 | | | | 98,620 | |
Mitsubishi Heavy Industries Limited (Industrials, Machinery) | | | | | | | 6,000 | | | | 41,299 | |
Mitsubishi UFJ Financial Group Incorporated (Financials, Commercial Banks) | | | | | | | 90,300 | | | | 614,134 | |
Mitsui Engineering & Shipbuilding Company Limited (Industrials, Machinery) | | | | | | | 121,000 | | | | 223,419 | |
Mitsui OSK Lines Limited (Industrials, Marine) † | | | | | | | 149,000 | | | | 619,018 | |
Mizuho Financial Group Incorporated (Financials, Commercial Banks) | | | | | | | 154,300 | | | | 340,304 | |
NGK Insulators Limited (Industrials, Electrical Equipment) | | | | | | | 28,000 | | | | 337,775 | |
Nichirei Corporation (Consumer Staples, Food Products) | | | | | | | 21,000 | | | | 123,434 | |
Nippon Telegraph & Telephone Corporation (Telecommunication Services, Diversified Telecommunication Services) | | | | | | | 5,600 | | | | 277,171 | |
Nissan Motor Company Limited (Consumer Discretionary, Automobiles) | | | | | | | 24,700 | | | | 257,426 | |
Nitto Denko Corporation (Materials, Chemicals) | | | | | | | 7,200 | | | | 472,688 | |
NTT DoCoMo Incorporated (Telecommunication Services, Wireless Telecommunication Services) | | | | | | | 100 | | | | 165,154 | |
Ono Pharmaceutical Company Limited (Health Care, Pharmaceuticals) | | | | | | | 2,000 | | | | 131,713 | |
Otsuka Holdings Company Limited (Health Care, Health Care Providers & Services) | | | | | | | 6,000 | | | | 216,033 | |
Rengo Company Limited (Materials, Containers & Packaging) | | | | | | | 23,000 | | | | 111,125 | |
Sankyu Incorporated (Industrials, Road & Rail) | | | | | | | 28,000 | | | | 124,942 | |
Sega Sammy Holdings Incorporated (Consumer Discretionary, Leisure Equipment & Products) | | | | | | | 5,600 | | | | 147,116 | |
Seino Holdings Company Limited (Industrials, Transportation Infrastructure) | | | | | | | 3,000 | | | | 26,189 | |
Sharp Corporation (Consumer Discretionary, Household Durables) Ǡ | | | | | | | 114,000 | | | | 395,261 | |
Sojitz Corporation (Industrials, Trading Companies & Distributors) | | | | | | | 77,400 | | | | 121,477 | |
Sumitomo Corporation (Consumer Discretionary, Distributors) | | | | | | | 19,900 | | | | 248,227 | |
Sumitomo Mitsui Financial Group Incorporated (Financials, Commercial Banks) | | | | | | | 8,000 | | | | 377,904 | |
Sumitomo Mitsui Trust Holdings Incorporated (Financials, Commercial Banks) | | | | | | | 60,000 | | | | 300,969 | |
Takeda Pharmaceutical Company Limited (Health Care, Pharmaceuticals) | | | | | | | 2,000 | | | | 109,760 | |
Toshiba TEC Corporation (Information Technology, Office Electronics) | | | | | | | 22,000 | | | | 129,764 | |
Toyota Motor Corporation (Consumer Discretionary, Automobiles) | | | | | | | 22,000 | | | | 1,272,811 | |
Yamada Denki Company Limited (Consumer Discretionary, Specialty Retail) | | | | | | | 8,960 | | | | 431,525 | |
Yokohama Rubber Company Limited (Consumer Discretionary, Auto Components) | | | | | | | 15,000 | | | | 196,646 | |
| | | | |
| | | | | | | | | | | 14,651,343 | |
| | | | | | | | | | | | |
The accompanying notes are an integral part of these financial statements.
| | | | | | |
| Portfolio of investments—April 30, 2013 (unaudited) | | Wells Fargo Advantage Diversified International Fund | | | 11 | |
| | | | | | | | | | | | |
| Security name | | | | | | Shares | | | Value | |
| | | | | | | | | | | | |
| | | | |
| Liechtenstein: 0.14% | | | | | | | | | | | | |
Verwaltungs-Und Privat-Bank AG (Financials, Capital Markets) | | | | | | | 1,400 | | | $ | 112,175 | |
| | | | | | | | | | | | |
| | | | |
| Malaysia : 0.05% | | | | | | | | | | | | |
Astro Malaysia Holdings Bhd (Consumer Discretionary, Media) | | | | | | | 41,700 | | | | 40,432 | |
| | | | | | | | | | | | |
| | | | |
| Netherlands: 3.17% | | | | | | | | | | | | |
Aegon NV (Financials, Insurance) | | | | | | | 17,300 | | | | 114,167 | |
Akzo Nobel NV (Materials, Chemicals) « | | | | | | | 8,480 | | | | 511,259 | |
ING Groep NV (Financials, Diversified Financial Services) † | | | | | | | 16,600 | | | | 136,240 | |
Koninklijke Ahold NV (Consumer Staples, Food & Staples Retailing) | | | | | | | 16,900 | | | | 266,632 | |
Koninklijke DSM NV (Materials, Chemicals) | | | | | | | 2,500 | | | | 161,096 | |
Koninklijke Vopak NV (Industrials, Transportation Infrastructure) « | | | | | | | 3,077 | | | | 170,438 | |
Nutreco Holding NV (Consumer Staples, Food Products) | | | | | | | 1,300 | | | | 123,386 | |
Unilever NV (Consumer Staples, Food Products) | | | | | | | 21,372 | | | | 909,674 | |
Ziggo NV (Telecommunication Services, Diversified Telecommunication Services) « | | | | | | | 4,197 | | | | 150,424 | |
| | | | |
| | | | | | | | | | | 2,543,316 | |
| | | | | | | | | | | | |
| | | | |
| Nigeria: 0.18% | | | | | | | | | | | | |
Nigerian Breweries plc (Consumer Staples, Beverages) | | | | | | | 136,314 | | | | 142,267 | |
| | | | | | | | | | | | |
| | | | |
| Norway: 1.39% | | | | | | | | | | | | |
Atea ASA (Information Technology, IT Services) | | | | | | | 8,400 | | | | 89,951 | |
DnB Nor ASA (Financials, Commercial Banks) | | | | | | | 7,800 | | | | 127,486 | |
Frontline 2012 Limited (Energy, Oil, Gas & Consumable Fuels)144A † | | | | | | | 11,711 | | | | 86,109 | |
Marine Harvest ASA (Consumer Staples, Food Products) Ǡ | | | | | | | 547,586 | | | | 569,759 | |
Statoil ASA (Energy, Oil, Gas & Consumable Fuels) | | | | | | | 5,700 | | | | 139,077 | |
Yara International ASA (Materials, Chemicals) | | | | | | | 2,200 | | | | 103,009 | |
| | | | |
| | | | | | | | | | | 1,115,391 | |
| | | | | | | | | | | | |
| | | | |
| Russia: 1.21% | | | | | | | | | | | | |
Gazprom Neft Sponsored ADR (Energy, Oil, Gas & Consumable Fuels) (i) | | | | | | | 10,500 | | | | 214,200 | |
Lukoil ADR (Energy, Oil, Gas & Consumable Fuels) | | | | | | | 4,200 | | | | 267,566 | |
Mobile Telesystems ADR (Telecommunication Services, Wireless Telecommunication Services) | | | | | | | 14,461 | | | | 299,343 | |
Sberbank of Russia (Financials, Commercial Banks) | | | | | | | 60,408 | | | | 191,795 | |
| | | | |
| | | | | | | | | | | 972,904 | |
| | | | | | | | | | | | |
| | | | |
| Singapore: 0.10% | | | | | | | | | | | | |
Global Logistic Properties Limited (Financials, Real Estate Management & Development) | | | | | | | 35,000 | | | | 78,428 | |
| | | | | | | | | | | | |
| | | | |
| South Africa: 0.28% | | | | | | | | | | | | |
Exxaro Resources Limited (Materials, Metals & Mining) | | | | | | | 6,400 | | | | 100,370 | |
Imperial Holding Limited (Consumer Discretionary, Distributors) | | | | | | | 5,700 | | | | 126,215 | |
| | | | |
| | | | | | | | | | | 226,585 | |
| | | | | | | | | | | | |
| | | | |
| South Korea: 2.69% | | | | | | | | | | | | |
Hana Financial Group Incorporated (Financials, Commercial Banks) | | | | | | | 9,970 | | | | 318,663 | |
Industrial Bank of Korea (Financials, Commercial Banks) | | | | | | | 13,500 | | | | 154,454 | |
Samsung Electronics Company Limited (Information Technology, Semiconductors & Semiconductor Equipment) | | | | | | | 126 | | | | 173,904 | |
Samsung Electronics Company Limited GDR (Information Technology, Semiconductors & Semiconductor Equipment) 144A | | | | | | | 702 | | | | 485,082 | |
The accompanying notes are an integral part of these financial statements.
| | | | |
| 12 | | Wells Fargo Advantage Diversified International Fund | | Portfolio of investments—April 30, 2013 (unaudited) |
| | | | | | | | | | | | |
| Security name | | | | | | Shares | | | Value | |
| | | | | | | | | | | | |
| | | | |
| South Korea (continued) | | | | | | | | | | | | |
SK Telecom Company Limited (Telecommunication Services, Wireless Telecommunication Services) | | | | | | | 4,834 | | | $ | 849,340 | |
Woori Finance Holdings Company Limited (Financials, Commercial Banks) | | | | | | | 16,400 | | | | 177,209 | |
| | | | |
| | | | | | | | | | | 2,158,652 | |
| | | | | | | | | | | | |
| | | | |
| Spain: 0.40% | | | | | | | | | | | | |
Banco Santander Central Hispano SA (Financials, Commercial Banks) | | | | | | | 22,800 | | | | 164,875 | |
Grifols SA (Health Care, Biotechnology) | | | | | | | 3,658 | | | | 146,786 | |
Grifols SA B Shares (Health Care, Biotechnology) † | | | | | | | 232 | | | | 7,159 | |
| | | | |
| | | | | | | | | | | 318,820 | |
| | | | | | | | | | | | |
| | | | |
| Sweden: 1.03% | | | | | | | | | | | | |
Boliden AB (Materials, Metals & Mining) | | | | | | | 12,400 | | | | 196,302 | |
Saab AB (Industrials, Aerospace & Defense) | | | | | | | 9,100 | | | | 199,662 | |
Volvo AB Class B (Industrials, Machinery) | | | | | | | 30,881 | | | | 427,404 | |
| | | | |
| | | | | | | | | | | 823,368 | |
| | | | | | | | | | | | |
| | | | |
| Switzerland: 8.46% | | | | | | | | | | | | |
ABB Limited (Industrials, Electrical Equipment) | | | | | | | 23,810 | | | | 539,041 | |
Actelion Limited (Health Care, Biotechnology) | | | | | | | 590 | | | | 36,074 | |
Baloise Holding AG (Financials, Insurance) | | | | | | | 2,000 | | | | 205,851 | |
Compagnie Financiere Richemont SA (Consumer Discretionary, Textiles, Apparel & Luxury Goods) | | | | | | | 3,334 | | | | 269,287 | |
Credit Suisse Group AG (Financials, Capital Markets) | | | | | | | 16,610 | | | | 460,536 | |
Georg Fischer AG (Industrials, Machinery) | | | | | | | 400 | | | | 173,908 | |
Holcim Limited (Materials, Construction Materials) | | | | | | | 4,674 | | | | 364,198 | |
Nestle SA (Consumer Staples, Food Products) | | | | | | | 12,857 | | | | 918,160 | |
Novartis AG (Health Care, Pharmaceuticals) | | | | | | | 8,991 | | | | 667,701 | |
Roche Holdings AG (Health Care, Pharmaceuticals) | | | | | | | 3,001 | | | | 750,089 | |
Swatch Group AG Class B (Consumer Discretionary, Textiles, Apparel & Luxury Goods) | | | | | | | 501 | | | | 286,925 | |
Swiss Reinsurance AG (Financials, Insurance) | | | | | | | 5,901 | | | | 469,326 | |
UBS AG (Financials, Diversified Financial Services) | | | | | | | 20,910 | | | | 373,313 | |
Valora Holding AG (Consumer Discretionary, Specialty Retail) | | | | | | | 600 | | | | 117,961 | |
Zurich Financial Services AG (Financials, Insurance) | | | | | | | 4,164 | | | | 1,162,588 | |
| | | | |
| | | | | | | | | | | 6,794,958 | |
| | | | | | | | | | | | |
| | | | |
| United Kingdom: 16.27% | | | | | | | | | | | | |
Amlin plc (Financials, Insurance) | | | | | | | 19,500 | | | | 128,552 | |
AstraZeneca plc (Health Care, Pharmaceuticals) | | | | | | | 9,400 | | | | 488,055 | |
Aviva plc (Financials, Insurance) | | | | | | | 22,000 | | | | 104,264 | |
BAE Systems plc (Industrials, Aerospace & Defense) | | | | | | | 49,700 | | | | 289,892 | |
Barclays plc (Financials, Commercial Banks) | | | | | | | 50,000 | | | | 222,168 | |
BP plc (Energy, Oil, Gas & Consumable Fuels) | | | | | | | 139,932 | | | | 1,013,782 | |
British Land Company plc (Financials, REITs) | | | | | | | 19,177 | | | | 177,093 | |
BT Group plc (Telecommunication Services, Diversified Telecommunication Services) | | | | | | | 70,500 | | | | 302,470 | |
Capita plc (Industrials, Commercial Services & Supplies) | | | | | | | 37,924 | | | | 531,656 | |
Chemring Group plc (Industrials, Aerospace & Defense) | | | | | | | 29,395 | | | | 123,786 | |
Cobham plc (Industrials, Aerospace & Defense) | | | | | | | 38,400 | | | | 149,420 | |
Debenhams plc (Consumer Discretionary, Multiline Retail) | | | | | | | 457,053 | | | | 590,689 | |
Diageo plc (Consumer Staples, Beverages) | | | | | | | 4,429 | | | | 135,119 | |
Firstgroup plc (Industrials, Road & Rail) | | | | | | | 32,500 | | | | 106,571 | |
The accompanying notes are an integral part of these financial statements.
| | | | | | |
| Portfolio of investments—April 30, 2013 (unaudited) | | Wells Fargo Advantage Diversified International Fund | | | 13 | |
| | | | | | | | | | | | |
| Security name | | | | | | | Shares | | Value | |
| | | | | | | | | | | | |
| | | | |
| United Kingdom (continued) | | | | | | | | | | | | |
GlaxoSmithKline plc (Health Care, Pharmaceuticals) | | | | | | | | 4,400 | | $ | 113,491 | |
HSBC Holdings plc (Financials, Commercial Banks) | | | | | | | | 53,725 | | | 587,097 | |
Imperial Tobacco Group plc (Consumer Staples, Tobacco) | | | | | | | | 14,101 | | | 503,787 | |
Intercontinental Hotels Group plc (Consumer Discretionary, Hotels, Restaurants & Leisure) | | | | | | | | 3,349 | | | 98,737 | |
J Sainsbury plc (Consumer Staples, Food & Staples Retailing) | | | | | | | | 42,600 | | | 252,184 | |
Johnson Matthey plc (Materials, Chemicals) | | | | | | | | 7,231 | | | 272,270 | |
Land Securities Group plc (Financials, REITs) | | | | | | | | 24,395 | | | 331,004 | |
Man Group plc (Financials, Capital Markets) | | | | | | | | 388,612 | | | 616,931 | |
Marston’s plc (Consumer Discretionary, Hotels, Restaurants & Leisure) | | | | | | | | 36,500 | | | 82,098 | |
Meggitt plc (Industrials, Aerospace & Defense) | | | | | | | | 29,457 | | | 214,417 | |
Old Mutual plc (Financials, Commercial Banks) | | | | | | | | 59,600 | | | 189,788 | |
Pace plc (Consumer Discretionary, Household Durables) | | | | | | | | 36,800 | | | 141,936 | |
Prudential plc (Financials, Insurance) | | | | | | | | 8,667 | | | 148,765 | |
Reckitt Benckiser Group plc (Consumer Staples, Household Products) | | | | | | | | 5,706 | | | 416,226 | |
Rolls-Royce Holdings plc (Industrials, Aerospace & Defense) | | | | | | | | 10,675 | | | 187,377 | |
Rolls-Royce Holdings plc Class C (Industrials, Aerospace & Defense) †(i)(a) | | | | | | | | 1,270,325 | | | 1,973 | |
Royal & Sun Alliance Insurance Group plc (Financials, Insurance) | | | | | | | | 53,200 | | | 91,976 | |
Royal Dutch Shell plc Class B (Energy, Oil, Gas & Consumable Fuels) | | | | | | | | 19,000 | | | 664,942 | |
SABMiller plc (Consumer Staples, Beverages) | | | | | | | | 11,999 | | | 646,481 | |
Smiths Group plc (Industrials, Industrial Conglomerates) | | | | | | | | 20,061 | | | 389,522 | |
Standard Chartered plc (Financials, Commercial Banks) | | | | | | | | 8,058 | | | 202,398 | |
Tesco plc (Consumer Staples, Food & Staples Retailing) | | | | | | | | 39,100 | | | 222,385 | |
Tullett Prebon plc (Financials, Capital Markets) | | | | | | | | 20,600 | | | 78,238 | |
Vodafone Group plc (Telecommunication Services, Wireless Telecommunication Services) | | | | | | | | 111,300 | | | 339,206 | |
Vodafone Group plc ADR (Telecommunication Services, Wireless Telecommunication Services) | | | | | | | | 18,872 | | | 577,294 | |
WH Smith plc (Consumer Discretionary, Specialty Retail) | | | | | | | | 15,600 | | | 179,198 | |
William Morrison Supermarkets plc (Consumer Staples, Food & Staples Retailing) | | | | | | | | 48,700 | | | 220,968 | |
Wolseley plc (Industrials, Trading Companies & Distributors) | | | | | | | | 11,891 | | | 587,928 | |
WPP plc (Consumer Discretionary, Media) | | | | | | | | 20,646 | | | 341,230 | |
| | | | |
| | | | | | | | | | | 13,063,364 | |
| | | | | | | | | | | | |
| | | | |
| United States: 2.54% | | | | | | | | | | | | |
Apple Incorporated (Information Technology, Computers & Peripherals) | | | | | | | | 719 | | | 318,337 | |
Bank of America Corporation (Financials, Diversified Financial Services) | | | | | | | | 19,436 | | | 239,257 | |
KKR & Company LP (Financials, Capital Markets) | | | | | | | | 13,704 | | | 287,784 | |
Liberty Global Incorporated Class A (Consumer Discretionary, Media) † | | | | | | | | 2,809 | | | 203,287 | |
QUALCOMM Incorporated (Information Technology, Communications Equipment) | | | | | | | | 7,112 | | | 438,241 | |
Schlumberger Limited (Energy, Energy Equipment & Services) | | | | | | | | 5,915 | | | 440,253 | |
Virgin Media Incorporated (Consumer Discretionary, Media) « | | | | | | | | 2,329 | | | 113,606 | |
| | | | |
| | | | | | | | | | | 2,040,765 | |
| | | | | | | | | | | | |
| | | | |
Total Common Stocks (Cost $68,308,278) | | | | | | | | | | | 77,004,020 | |
| | | | | | | | | | | | |
| | | Dividend yield | | | | | | | | |
| | | | |
Preferred Stocks: 0.84% | | | | | | | | | | | | |
| | | | |
| Brazil: 0.27% | | | | | | | | | | | | |
Companhia Energetica de Minas Gerais SA (Utilities, Oil, Gas & Consumable Fuels) ± | | | 4.44 | % | | | | 6,300 | | | 80,578 | |
Companhia Vale Do Rio Doce Class A (Materials, Metals & Mining) ± | | | 3.20 | | | | | 8,400 | | | 137,037 | |
| | | | |
| | | | | | | | | | | 217,615 | |
| | | | | | | | | | | | |
The accompanying notes are an integral part of these financial statements.
| | | | |
| 14 | | Wells Fargo Advantage Diversified International Fund | | Portfolio of investments—April 30, 2013 (unaudited) |
| | | | | | | | | | | | |
| Security name | | Dividend yield | | | | | Shares | | Value | |
| | | | | | | | | | | | |
| | | | |
| Germany: 0.57% | | | | | | | | | | | | |
Henkel AG & Company KGaA ADR (Consumer Staples, Household Products) ± | | | 1.24 | % | | | | 4,872 | | $ | 459,399 | |
| | | | |
Total Preferred Stocks (Cost $653,179) | | | | | | | | | | | 677,014 | |
| | | | | | | | | | | | |
| | | | |
| | | Yield | | | | | | | | |
| Short-Term Investments: 11.06% | | | | | | | | | | | | |
| | | | |
| Investment Companies: 11.06% | | | | | | | | | | | | |
Wells Fargo Advantage Cash Investment Money Market Fund, Select Class (l)(u) | | | 0.13 | | | | | 910,389 | | | 910,389 | |
Wells Fargo Securities Lending Cash Investments, LLC (l)(u)(r)(v) | | | 0.18 | | | | | 7,964,436 | | | 7,964,436 | |
| | | | |
Total Short-Term Investments (Cost $8,874,825) | | | | | | | | | | | 8,874,825 | |
| | | | | | | | | | | | |
| | | | | | | | |
Total investments in securities (Cost $77,836,282) * | | | 107.83 | % | | | 86,555,859 | |
Other assets and liabilities, net | | | (7.83 | ) | | | (6,282,969 | ) |
| | | | | | | | |
| Total net assets | | | 100.00 | % | | $ | 80,272,890 | |
| | | | | | | | |
| † | Non-income-earning security |
| « | All or a portion of this security is on loan. |
| 144A | Security that may be resold to “qualified institutional buyers” under Rule 144A or security offered pursuant to Section 4(2) of the Securities Act of 1933, as amended. |
| ± | Variable rate investment. The rate shown is the rate in effect at period end. |
| (a) | Security is fair valued by the Management Valuation Team, and in certain instances by the Board of Trustees, in accordance with procedures approved by the Board of Trustees. |
| (l) | Investment in an affiliate |
| (u) | Rate shown is the 7-day annualized yield at period end. |
| (r) | The investment company is exempt from registration under Section 3(c)(7) of the Investment Company Act of 1940, as amended. |
| (v) | Security represents investment of cash collateral received from securities on loan. |
| * | Cost for federal income tax purposes is $80,514,199 and unrealized appreciation (depreciation) consists of: |
| | | | |
Gross unrealized appreciation | | $ | 13,696,158 | |
Gross unrealized depreciation | | | (7,654,498 | ) |
| | | | |
Net unrealized appreciation | | $ | 6,041,660 | |
The accompanying notes are an integral part of these financial statements.
| | | | | | |
| Statement of assets and liabilities—April 30, 2013 (unaudited) | | Wells Fargo Advantage Diversified International Fund | | | 15 | |
| | | | |
| | | | |
| |
Assets | | | | |
Investments | | | | |
In unaffiliated securities (including securities on loan), at value (see cost below) | | $ | 77,681,034 | |
In affiliated securities, at value (see cost below) | | | 8,874,825 | |
| | | | |
Total investments, at value (see cost below) | | | 86,555,859 | |
Foreign currency, at value (see cost below) | | | 989,766 | |
Receivable for investments sold | | | 517,772 | |
Receivable for Fund shares sold | | | 134,405 | |
Receivable for dividends | | | 447,119 | |
Receivable for securities lending income | | | 17,985 | |
Unrealized gains on forward foreign currency contracts | | | 22,351 | |
Prepaid expenses and other assets | | | 30,939 | |
| | | | |
Total assets | | | 88,716,196 | |
| | | | |
| |
Liabilities | | | | |
Payable for investments purchased | | | 230,026 | |
Payable for Fund shares redeemed | | | 87,647 | |
Unrealized losses on forward foreign currency contracts | | | 8,301 | |
Payable upon receipt of securities loaned | | | 7,964,436 | |
Advisory fee payable | | | 18,576 | |
Distribution fees payable | | | 680 | |
Due to other related parties | | | 20,901 | |
Accrued expenses and other liabilities | | | 112,739 | |
| | | | |
Total liabilities | | | 8,443,306 | |
| | | | |
Total net assets | | $ | 80,272,890 | |
| | | | |
| |
NET ASSETS CONSIST OF | | | | |
Paid-in capital | | $ | 178,671,764 | |
Undistributed net investment income | | | 713,098 | |
Accumulated net realized losses on investments | | | (107,850,395 | ) |
Net unrealized gains on investments | | | 8,738,423 | |
| | | | |
Total net assets | | $ | 80,272,890 | |
| | | | |
| |
COMPUTATION OF NET ASSET VALUE AND OFFERING PRICE PER SHARE1 | | | | |
Net assets – Class A | | $ | 26,340,113 | |
Shares outstanding – Class A | | | 2,353,453 | |
Net asset value per share – Class A | | | $11.19 | |
Maximum offering price per share – Class A2 | | | $11.87 | |
Net assets – Class B | | $ | 220,226 | |
Shares outstanding – Class B | | | 20,504 | |
Net asset value per share – Class B | | | $10.74 | |
Net assets – Class C | | $ | 961,390 | |
Shares outstanding – Class C | | | 92,361 | |
Net asset value per share – Class C | | | $10.41 | |
Net assets – Administrator Class | | $ | 4,438,825 | |
Shares outstanding – Administrator Class | | | 389,956 | |
Net asset value per share – Administrator Class | | | $11.38 | |
Net assets – Institutional Class | | $ | 3,552,753 | |
Shares outstanding – Institutional Class | | | 330,724 | |
Net asset value per share – Institutional Class | | | $10.74 | |
Net assets – Investor Class | | $ | 44,759,583 | |
Shares outstanding – Investor Class | | | 4,014,892 | |
Net asset value per share – Investor Class | | | $11.15 | |
Investments in unaffiliated securities (including securities on loan), at cost | | $ | 68,961,457 | |
| | | | |
Investments in affiliated securities, at cost | | $ | 8,874,825 | |
| | | | |
Total investments, at cost | | $ | 77,836,282 | |
| | | | |
Securities on loan, at value | | $ | 7,571,377 | |
| | | | |
Foreign currency, at cost | | $ | 988,762 | |
| | | | |
| 1. | The Fund has an unlimited number of authorized shares. |
| 2. | Maximum offering price is computed as 100/94.25 of net asset value. On investments of $50,000 or more, the offering price is reduced. |
The accompanying notes are an integral part of these financial statements.
| | | | |
| 16 | | Wells Fargo Advantage Diversified International Fund | | Statement of operations—six months ended April 30, 2013 (unaudited) |
| | | | |
| | | | |
| |
Investment income | | | | |
Dividends* | | $ | 1,207,058 | |
Securities lending income, net | | | 39,159 | |
Income from affiliated securities | | | 1,127 | |
| | | | |
Total investment income | | | 1,247,344 | |
| | | | |
| |
Expenses | | | | |
Advisory fee | | | 321,963 | |
Administration fees | | | | |
Fund level | | | 18,939 | |
Class A | | | 31,261 | |
Class B | | | 331 | |
Class C | | | 965 | |
Administrator Class | | | 1,888 | |
Institutional Class | | | 2,142 | |
Investor Class | | | 66,532 | |
Shareholder servicing fees | | | | |
Class A | | | 30,059 | |
Class B | | | 318 | |
Class C | | | 928 | |
Administrator Class | | | 4,720 | |
Investor Class | | | 51,721 | |
Distribution fees | | | | |
Class B | | | 953 | |
Class C | | | 2,783 | |
Custody and accounting fees | | | 92,394 | |
Professional fees | | | 18,109 | |
Registration fees | | | 29,896 | |
Shareholder report expenses | | | 28,908 | |
Trustees’ fees and expenses | | | 6,288 | |
Other fees and expenses | | | 33,116 | |
| | | | |
Total expenses | | | 744,214 | |
Less: Fee waivers and/or expense reimbursements | | | (210,268 | ) |
| | | | |
Net expenses | | | 533,946 | |
| | | | |
Net investment income | | | 713,398 | |
| | | | |
| |
REALIZED AND UNREALIZED GAINS (LOSSES) ON INVESTMENTS | | | | |
| |
Net realized gains (losses) on: | | | | |
Unaffiliated securities | | | 1,255,842 | |
Forward foreign currency contract transactions | | | (589 | ) |
| | | | |
Net realized gains on investments | | | 1,255,253 | |
| | | | |
| |
Net change in unrealized gains (losses) on: | | | | |
Unaffiliated securities | | | 9,061,803 | |
Forward foreign currency contract transactions | | | 14,050 | |
| | | | |
Net change in unrealized gains (losses) on investments | | | 9,075,853 | |
| | | | |
Net realized and unrealized gains (losses) on investments | | | 10,331,106 | |
| | | | |
Net increase in net assets resulting from operations | | $ | 11,044,504 | |
| | | | |
| |
* Net of foreign dividend withholding taxes in the amount of | | | $91,222 | |
The accompanying notes are an integral part of these financial statements.
| | | | | | |
| Statement of changes in net assets | | Wells Fargo Advantage Diversified International Fund | | | 17 | |
| | | | | | | | | | | | | | | | |
| | | Six months ended April 30, 2013 (unaudited) | | | Year ended October 31, 2012 | |
| | | | |
Operations | | | | | | | | | | | | | | | | |
Net investment income | | | | | | $ | 713,398 | | | | | | | $ | 4,566,595 | |
Net realized gains (losses) on investments | | | | | | | 1,255,253 | | | | | | | | (12,771,274 | ) |
Net change in unrealized gains (losses) on investments | | | | | | | 9,075,853 | | | | | | | | 14,555,023 | |
| | | | | | | | | | | | | | | | |
Net increase in net assets resulting from operations | | | | | | | 11,044,504 | | | | | | | | 6,350,344 | |
| | | | | | | | | | | | | | | | |
| | | | |
Distributions to shareholders from | | | | | | | | | | | | | | | | |
Net investment income | | | | | | | | | | | | | | | | |
Class A | | | | | | | (1,279,375 | ) | | | | | | | (338,231 | ) |
Class B | | | | | | | (14,233 | ) | | | | | | | (191 | ) |
Class C | | | | | | | (34,916 | ) | | | | | | | (4,213 | ) |
Administrator Class | | | | | | | (198,977 | ) | | | | | | | 0 | |
Institutional Class | | | | | | | (617,382 | ) | | | | | | | (8,142,523 | ) |
Investor Class | | | | | | | (2,250,592 | ) | | | | | | | (563,955 | ) |
| | | | | | | | | | | | | | | | |
Total distributions to shareholders | | | | | | | (4,395,475 | ) | | | | | | | (9,049,113 | ) |
| | | | | | | | | | | | | | | | |
| | | | |
| | | Shares | | | | | | | | Shares | | | | | |
| | | | |
Capital share transactions | | | | | | | | | | | | | | | | |
Proceeds from shares sold | | | | | | | | | | | | | | | | |
Class A | | | 215,057 | | | | 2,293,584 | | | | 67,824 | | | | 669,301 | |
Class B | | | 1,190 | | | | 12,198 | | | | 3,974 | | | | 37,717 | |
Class C | | | 25,234 | | | | 251,224 | | | | 6,076 | | | | 53,741 | |
Administrator Class | | | 94,843 | | | | 1,024,971 | | | | 71,813 | | | | 731,021 | |
Institutional Class | | | 534 | | | | 5,400 | | | | 2,051,043 | | | | 19,225,634 | |
Investor Class | | | 315,033 | | | | 3,331,095 | | | | 264,997 | | | | 2,570,757 | |
| | | | | | | | | | | | | | | | |
| | | | | | | 6,918,472 | | | | | | | | 23,288,171 | |
| | | | | | | | | | | | | | | | |
Reinvestment of distributions | | | | | | | | | | | | | | | | |
Class A | | | 124,397 | | | | 1,251,439 | | | | 36,260 | | | | 321,260 | |
Class B | | | 1,470 | | | | 14,233 | | | | 20 | | | | 170 | |
Class C | | | 3,329 | | | | 31,227 | | | | 431 | | | | 3,580 | |
Administrator Class | | | 18,794 | | | | 192,070 | | | | 0 | | | | 0 | |
Institutional Class | | | 20,974 | | | | 202,192 | | | | 626,409 | | | | 5,524,925 | |
Investor Class | | | 221,373 | | | | 2,218,157 | | | | 63,062 | | | | 556,837 | |
| | | | | | | | | | | | | | | | |
| | | | | | | 3,909,318 | | | | | | | | 6,406,772 | |
| | | | | | | | | | | | | | | | |
Payment for shares redeemed | | | | | | | | | | | | | | | | |
Class A | | | (175,431 | ) | | | (1,845,156 | ) | | | (378,146 | ) | | | (3,686,356 | ) |
Class B | | | (12,670 | ) | | | (128,612 | ) | | | (25,904 | ) | | | (243,145 | ) |
Class C | | | (2,022 | ) | | | (19,650 | ) | | | (10,077 | ) | | | (91,335 | ) |
Administrator Class | | | (59,897 | ) | | | (638,977 | ) | | | (88,963 | ) | | | (874,227 | ) |
Institutional Class | | | (412,836 | ) | | | (4,202,183 | ) | | | (45,288,152 | ) | | | (430,823,339 | ) |
Investor Class | | | (357,431 | ) | | | (3,753,227 | ) | | | (684,585 | ) | | | (6,665,092 | ) |
| | | | | | | | | | | | | | | | |
| | | | | | | (10,587,805 | ) | | | | | | | (442,383,494 | ) |
| | | | | | | | | | | | | | | | |
Net increase (decrease) in net assets resulting from capital share transactions | | | | | | | 239,985 | | | | | | | | (412,688,551 | ) |
| | | | | | | | | | | | | | | | |
Total increase (decrease) in net assets | | | | | | | 6,889,014 | | | | | | | | (415,387,320 | ) |
| | | | | | | | | | | | | | | | |
| | | | |
Net assets | | | | | | | | | | | | | | | | |
Beginning of period | | | | | | | 73,383,876 | | | | | | | | 488,771,196 | |
| | | | | | | | | | | | | | | | |
End of period | | | | | | $ | 80,272,890 | | | | | | | $ | 73,383,876 | |
| | | | | | | | | | | | | | | | |
Undistributed net investment income | | | | | | $ | 713,098 | | | | | | | $ | 4,395,175 | |
| | | | | | | | | | | | | | | | |
The accompanying notes are an integral part of these financial statements.
| | | | |
| 18 | | Wells Fargo Advantage Diversified International Fund | | Financial highlights |
(For a share outstanding throughout each period)
| | | | | | | | | | | | | | | | | | | | | | | | | | | | |
| | | Six months ended
April 30, 2013
(unaudited) | | | Year ended October 31 | | | Year ended September 30 | |
| CLASS A | | | 2012 | | | 2011 | | | 20101 | | | 2010 | | | 2009 | | | 2008 | |
Net asset value, beginning of period | | $ | 10.25 | | | $ | 9.69 | | | $ | 10.29 | | | $ | 9.84 | | | $ | 9.62 | | | $ | 11.68 | | | $ | 19.49 | |
Net investment income | | | 0.10 | 2 | | | 0.19 | 2 | | | 0.16 | | | | 0.00 | 2,3 | | | 0.09 | 2 | | | 0.14 | 2 | | | 0.31 | 2 |
Net realized and unrealized gains (losses) on investments | | | 1.44 | | | | 0.51 | | | | (0.65 | ) | | | 0.45 | | | | 0.26 | | | | (0.69 | ) | | | (5.91 | ) |
| | | | | | | | | | | | | | | | | | | | | | | | | | | | |
Total from investment operations | | | 1.54 | | | | 0.70 | | | | (0.49 | ) | | | 0.45 | | | | 0.35 | | | | (0.55 | ) | | | (5.60 | ) |
Distributions to shareholders from | | | | | | | | | | | | | | | | | | | | | | | | | | | | |
Net investment income | | | (0.60 | ) | | | (0.14 | ) | | | (0.11 | ) | | | 0.00 | | | | (0.13 | ) | | | (0.23 | ) | | | (0.23 | ) |
Net realized gains | | | 0.00 | | | | 0.00 | | | | 0.00 | | | | 0.00 | | | | 0.00 | | | | (1.28 | ) | | | (1.98 | ) |
| | | | | | | | | | | | | | | | | | | | | | | | | | | | |
Total distributions to shareholders | | | (0.60 | ) | | | (0.14 | ) | | | (0.11 | ) | | | 0.00 | | | | (0.13 | ) | | | (1.51 | ) | | | (2.21 | ) |
Net asset value, end of period | | $ | 11.19 | | | $ | 10.25 | | | $ | 9.69 | | | $ | 10.29 | | | $ | 9.84 | | | $ | 9.62 | | | $ | 11.68 | |
Total return4 | | | 15.63 | % | | | 7.45 | % | | | (4.83 | )% | | | 4.57 | % | | | 3.64 | % | | | (0.78 | )% | | | (32.12 | )% |
Ratios to average net assets (annualized) | | | | | | | | | | | | | | | | | | | | | | | | | | | | |
Gross expenses | | | 1.96 | % | | | 1.68 | % | | | 1.47 | % | | | 1.54 | % | | | 1.64 | % | | | 1.76 | % | | | 1.67 | % |
Net expenses | | | 1.41 | % | | | 1.41 | % | | | 1.41 | % | | | 1.41 | % | | | 1.38 | % | | | 1.41 | % | | | 1.48 | % |
Net investment income | | | 1.94 | % | | | 1.96 | % | | | 1.47 | % | | | 0.59 | % | | | 0.99 | % | | | 1.76 | % | | | 1.93 | % |
Supplemental data | | | | | | | | | | | | | | | | | | | | | | | | | | | | |
Portfolio turnover rate | | | 25 | % | | | 57 | % | | | 53 | % | | | 5 | % | | | 64 | % | | | 123 | % | | | 62 | % |
Net assets, end of period (000s omitted) | | | $26,340 | | | | $22,434 | | | | $23,862 | | | | $29,804 | | | | $28,926 | | | | $31,742 | | | | $37,819 | |
| 1. | For the one month ended October 31, 2010. The Fund changed its fiscal year end from September 30 to October 31, effective October 31, 2010. |
| 2. | Calculated based upon average shares outstanding |
| 3. | Amount is less than $0.005. |
| 4. | Total return calculations do not include any sales charges. Returns for periods of less than one year are not annualized. |
The accompanying notes are an integral part of these financial statements.
| | | | | | |
| Financial highlights | | Wells Fargo Advantage Diversified International Fund | | | 19 | |
(For a share outstanding throughout each period)
| | | | | | | | | | | | | | | | | | | | | | | | | | | | |
| | | Six months ended
April 30, 2013
(unaudited) | | | Year ended October 31 | | | Year ended September 30 | |
| CLASS B | | | 2012 | | | 2011 | | | 20101 | | | 2010 | | | 2009 | | | 2008 | |
Net asset value, beginning of period | | $ | 9.80 | | | $ | 9.19 | | | $ | 9.74 | | | $ | 9.32 | | | $ | 9.12 | | | $ | 11.07 | | | $ | 18.52 | |
Net investment income (loss) | | | 0.04 | 2 | | | 0.10 | 2 | | | 0.06 | 2 | | | (0.00 | )2,3 | | | (0.05 | )2 | | | 0.07 | 2 | | | 0.16 | 2 |
Net realized and unrealized gains (losses) on investments | | | 1.40 | | | | 0.51 | | | | (0.61 | ) | | | 0.42 | | | | 0.32 | | | | (0.64 | ) | | | (5.58 | ) |
| | | | | | | | | | | | | | | | | | | | | | | | | | | | |
Total from investment operations | | | 1.44 | | | | 0.61 | | | | (0.55 | ) | | | 0.42 | | | | 0.27 | | | | (0.57 | ) | | | (5.42 | ) |
Distributions to shareholders from | | | | | | | | | | | | | | | | | | | | | | | | | | | | |
Net investment income | | | (0.50 | ) | | | (0.00 | )3 | | | 0.00 | | | | 0.00 | | | | (0.07 | ) | | | (0.10 | ) | | | (0.05 | ) |
Net realized gains | | | 0.00 | | | | 0.00 | | | | 0.00 | | | | 0.00 | | | | 0.00 | | | | (1.28 | ) | | | (1.98 | ) |
| | | | | | | | | | | | | | | | | | | | | | | | | | | | |
Total distributions to shareholders | | | (0.50 | ) | | | (0.00 | )3 | | | 0.00 | | | | 0.00 | | | | (0.07 | ) | | | (1.38 | ) | | | (2.03 | ) |
Net asset value, end of period | | $ | 10.74 | | | $ | 9.80 | | | $ | 9.19 | | | $ | 9.74 | | | $ | 9.32 | | | $ | 9.12 | | | $ | 11.07 | |
Total return4 | | | 15.28 | % | | | 6.69 | % | | | (5.65 | )% | | | 4.51 | % | | | 3.00 | % | | | (1.50 | )% | | | (32.61 | )% |
Ratios to average net assets (annualized) | | | | | | | | | | | | | | | | | | | | | | | | | | | | |
Gross expenses | | | 2.71 | % | | | 2.35 | % | | | 2.23 | % | | | 2.28 | % | | | 2.39 | % | | | 2.51 | % | | | 2.43 | % |
Net expenses | | | 2.16 | % | | | 2.12 | % | | | 2.16 | % | | | 2.16 | % | | | 2.13 | % | | | 2.16 | % | | | 2.23 | % |
Net investment income (loss) | | | 0.83 | % | | | 1.11 | % | | | 0.64 | % | | | (0.16 | )% | | | (0.59 | )% | | | 0.93 | % | | | 1.03 | % |
Supplemental data | | | | | | | | | | | | | | | | | | | | | | | | | | | | |
Portfolio turnover rate | | | 25 | % | | | 57 | % | | | 53 | % | | | 5 | % | | | 64 | % | | | 123 | % | | | 62 | % |
Net assets, end of period (000s omitted) | | | $220 | | | | $299 | | | | $482 | | | | $1,084 | | | | $1,046 | | | | $1,739 | | | | $3,213 | |
| 1. | For the one month ended October 31, 2010. The Fund changed its fiscal year end from September 30 to October 31, effective October 31, 2010. |
| 2. | Calculated based upon average shares outstanding |
| 3. | Amount is less than $0.005. |
| 4. | Total return calculations do not include any sales charges. Returns for periods of less than one year are not annualized. |
The accompanying notes are an integral part of these financial statements.
| | | | |
| 20 | | Wells Fargo Advantage Diversified International Fund | | Financial highlights |
(For a share outstanding throughout each period)
| | | | | | | | | | | | | | | | | | | | | | | | | | | | |
| | | Six months ended
April 30, 2013 (unaudited) | | | Year ended October 31 | | | Year ended September 30 | |
| CLASS C | | | 2012 | | | 2011 | | | 20101 | | | 2010 | | | 2009 | | | 2008 | |
Net asset value, beginning of period | | $ | 9.54 | | | $ | 9.01 | | | $ | 9.59 | | | $ | 9.17 | | | $ | 8.98 | | | $ | 10.98 | | | $ | 18.46 | |
Net investment income (loss) | | | 0.07 | 2 | | | 0.11 | 2 | | | 0.07 | 2 | | | (0.00 | )2,3 | | | 0.02 | 2 | | | 0.07 | 2 | | | 0.17 | 2 |
Net realized and unrealized gains (losses) on investments | | | 1.33 | | | | 0.48 | | | | (0.61 | ) | | | 0.42 | | | | 0.25 | | | | (0.65 | ) | | | (5.56 | ) |
| | | | | | | | | | | | | | | | | | | | | | | | | | | | |
Total from investment operations | | | 1.40 | | | | 0.59 | | | | (0.54 | ) | | | 0.42 | | | | 0.27 | | | | (0.58 | ) | | | (5.39 | ) |
Distributions to shareholders from | | | | | | | | | | | | | | | | | | | | | | | | | | | | |
Net investment income | | | (0.53 | ) | | | (0.06 | ) | | | (0.04 | ) | | | 0.00 | | | | (0.08 | ) | | | (0.14 | ) | | | (0.11 | ) |
Net realized gains | | | 0.00 | | | | 0.00 | | | | 0.00 | | | | 0.00 | | | | 0.00 | | | | (1.28 | ) | | | (1.98 | ) |
| | | | | | | | | | | | | | | | | | | | | | | | | | | | |
Total distributions to shareholders | | | (0.53 | ) | | | (0.06 | ) | | | (0.04 | ) | | | 0.00 | | | | (0.08 | ) | | | (1.42 | ) | | | (2.09 | ) |
Net asset value, end of period | | $ | 10.41 | | | $ | 9.54 | | | $ | 9.01 | | | $ | 9.59 | | | $ | 9.17 | | | $ | 8.98 | | | $ | 10.98 | |
Total return4 | | | 15.26 | % | | | 6.67 | % | | | (5.65 | )% | | | 4.58 | % | | | 3.07 | % | | | (1.47 | )% | | | (32.64 | )% |
Ratios to average net assets (annualized) | | | | | | | | | | | | | | | | | | | | | | | | | | | | |
Gross expenses | | | 2.71 | % | | | 2.43 | % | | | 2.22 | % | | | 2.28 | % | | | 2.39 | % | | | 2.51 | % | | | 2.42 | % |
Net expenses | | | 2.16 | % | | | 2.16 | % | | | 2.16 | % | | | 2.16 | % | | | 2.12 | % | | | 2.16 | % | | | 2.23 | % |
Net investment income (loss) | | | 1.40 | % | | | 1.21 | % | | | 0.72 | % | | | (0.16 | )% | | | 0.20 | % | | | 0.92 | % | | | 1.11 | % |
Supplemental data | | | | | | | | | | | | | | | | | | | | | | | | | | | | |
Portfolio turnover rate | | | 25 | % | | | 57 | % | | | 53 | % | | | 5 | % | | | 64 | % | | | 123 | % | | | 62 | % |
Net assets, end of period (000s omitted) | | | $961 | | | | $628 | | | | $625 | | | | $744 | | | | $718 | | | | $719 | | | | $995 | |
| 1. | For the one month ended October 31, 2010. The Fund changed its fiscal year end from September 30 to October 31, effective October 31, 2010. |
| 2. | Calculated based upon average shares outstanding |
| 3. | Amount is less than $0.005. |
| 4. | Total return calculations do not include any sales charges. Returns for periods of less than one year are not annualized. |
The accompanying notes are an integral part of these financial statements.
| | | | | | |
| Financial highlights | | Wells Fargo Advantage Diversified International Fund | | | 21 | |
(For a share outstanding throughout each period)
| | | | | | | | | | | | | | | | | | | | | | | | | | | | |
| | | Six months ended
April 30, 2013 (unaudited) | | | Year ended October 31 | | | Year ended September 30 | |
| ADMINISTRATOR CLASS | | | 2012 | | | 2011 | | | 20101 | | | 2010 | | | 2009 | | | 2008 | |
Net asset value, beginning of period | | $ | 10.42 | | | $ | 9.68 | | | $ | 10.28 | | | $ | 9.83 | | | $ | 9.59 | | | $ | 11.67 | | | $ | 19.48 | |
Net investment income | | | 0.11 | 2 | | | 0.21 | 2 | | | 0.05 | 2 | | | 0.00 | 2,3 | | | 0.12 | 2 | | | 0.16 | 2 | | | 0.31 | 2 |
Net realized and unrealized gains
(losses) on investments | | | 1.46 | | | | 0.53 | | | | (0.52 | ) | | | 0.45 | | | | 0.26 | | | | (0.70 | ) | | | (5.87 | ) |
| | | | | | | | | | | | | | | | | | | | | | | | | | | | |
Total from investment operations | | | 1.57 | | | | 0.74 | | | | (0.47 | ) | | | 0.45 | | | | 0.38 | | | | (0.54 | ) | | | (5.56 | ) |
Distributions to shareholders from | | | | | | | | | | | | | | | | | | | | | | | | | | | | |
Net investment income | | | (0.61 | ) | | | 0.00 | | | | (0.13 | ) | | | 0.00 | | | | (0.14 | ) | | | (0.26 | ) | | | (0.27 | ) |
Net realized gains | | | 0.00 | | | | 0.00 | | | | 0.00 | | | | 0.00 | | | | 0.00 | | | | (1.28 | ) | | | (1.98 | ) |
| | | | | | | | | | | | | | | | | | | | | | | | | | | | |
Total distributions to shareholders | | | (0.61 | ) | | | 0.00 | | | | (0.13 | ) | | | 0.00 | | | | (0.14 | ) | | | (1.54 | ) | | | (2.25 | ) |
Net asset value, end of period | | $ | 11.38 | | | $ | 10.42 | | | $ | 9.68 | | | $ | 10.28 | | | $ | 9.83 | | | $ | 9.59 | | | $ | 11.67 | |
Total return4 | | | 15.77 | % | | | 7.64 | % | | | (4.69 | )% | | | 4.58 | % | | | 3.87 | % | | | (0.66 | )% | | | (31.98 | )% |
Ratios to average net assets (annualized) | | | | | | | | | | | | | | | | | | | | | | | | | | | | |
Gross expenses | | | 1.80 | % | | | 1.52 | % | | | 1.35 | % | | | 1.38 | % | | | 1.46 | % | | | 1.58 | % | | | 1.50 | % |
Net expenses | | | 1.25 | % | | | 1.25 | % | | | 1.24 | % | | | 1.25 | % | | | 1.22 | % | | | 1.25 | % | | | 1.25 | % |
Net investment income | | | 2.16 | % | | | 2.11 | % | | | 0.44 | % | | | 0.75 | % | | | 1.31 | % | | | 2.02 | % | | | 1.92 | % |
Supplemental data | | | | | | | | | | | | | | | | | | | | | | | | | | | | |
Portfolio turnover rate | | | 25 | % | | | 57 | % | | | 53 | % | | | 5 | % | | | 64 | % | | | 123 | % | | | 62 | % |
Net assets, end of period (000s omitted) | | | $4,439 | | | | $3,504 | | | | $3,421 | | | | $202,247 | | | | $193,626 | | | | $261,004 | | | | $293,831 | |
| 1. | For the one month ended October 31, 2010. The Fund changed its fiscal year end from September 30 to October 31, effective October 31, 2010. |
| 2. | Calculated based upon average shares outstanding |
| 3. | Amount is less than $0.005. |
| 4. | Returns for periods of less than one year are not annualized. |
The accompanying notes are an integral part of these financial statements.
| | | | |
| 22 | | Wells Fargo Advantage Diversified International Fund | | Financial highlights |
(For a share outstanding throughout each period)
| | | | | | | | | | | | | | | | | | | | | | | | | | | | |
| | | Six months ended
April 30, 2013
(unaudited) | | | Year ended October 31 | | | Year ended September 30 | |
| INSTITUTIONAL CLASS | | | 2012 | | | 2011 | | | 20101 | | | 2010 | | | 2009 | | | 2008 | |
Net asset value, beginning of period | | $ | 10.20 | | | $ | 9.69 | | | $ | 10.29 | | | $ | 9.84 | | | $ | 9.60 | | | $ | 11.69 | | | $ | 19.50 | |
Net investment income | | | 0.09 | 2 | | | 0.19 | 2 | | | 0.23 | | | | 0.00 | 2,3 | | | 0.15 | 2 | | | 0.18 | 2 | | | 0.38 | 2 |
Net realized and unrealized gains (losses) on investments | | | 1.43 | | | | 0.51 | | | | (0.68 | ) | | | 0.45 | | | | 0.24 | | | | (0.70 | ) | | | (5.90 | ) |
| | | | | | | | | | | | | | | | | | | | | | | | | | | | |
Total from investment operations | | | 1.52 | | | | 0.70 | | | | (0.45 | ) | | | 0.45 | | | | 0.39 | | | | (0.52 | ) | | | (5.52 | ) |
Distributions to shareholders from | | | | | | | | | | | | | | | | | | | | | | | | | | | | |
Net investment income | | | (0.98 | ) | | | (0.19 | ) | | | (0.15 | ) | | | 0.00 | | | | (0.15 | ) | | | (0.29 | ) | | | (0.31 | ) |
Net realized gains | | | 0.00 | | | | 0.00 | | | | 0.00 | | | | 0.00 | | | | 0.00 | | | | (1.28 | ) | | | (1.98 | ) |
| | | | | | | | | | | | | | | | | | | | | | | | | | | | |
Total distributions to shareholders | | | (0.98 | ) | | | (0.19 | ) | | | (0.15 | ) | | | 0.00 | | | | (0.15 | ) | | | (1.57 | ) | | | (2.29 | ) |
Net asset value, end of period | | $ | 10.74 | | | $ | 10.20 | | | $ | 9.69 | | | $ | 10.29 | | | $ | 9.84 | | | $ | 9.60 | | | $ | 11.69 | |
Total return4 | | | 15.94 | % | | | 7.51 | % | | | (4.48 | )% | | | 4.57 | % | | | 4.13 | % | | | (0.41 | )% | | | (31.79 | )% |
Ratios to average net assets (annualized) | | | | | | | | | | | | | | | | | | | | | | | | | | | | |
Gross expenses | | | 1.53 | % | | | 1.20 | % | | | 1.03 | % | | | 1.11 | % | | | 1.19 | % | | | 1.31 | % | | | 1.23 | % |
Net expenses | | | 0.99 | % | | | 0.99 | % | | | 0.99 | % | | | 0.99 | % | | | 0.96 | % | | | 0.99 | % | | | 1.04 | % |
Net investment income | | | 1.83 | % | | | 1.96 | % | | | 2.17 | % | | | 1.00 | % | | | 1.63 | % | | | 2.30 | % | | | 2.46 | % |
Supplemental data | | | | | | | | | | | | | | | | | | | | | | | | | | | | |
Portfolio turnover rate | | | 25 | % | | | 57 | % | | | 53 | % | | | 5 | % | | | 64 | % | | | 123 | % | | | 62 | % |
Net assets, end of period (000s omitted) | | | $3,553 | | | | $7,367 | | | | $419,925 | | | | $199,081 | | | | $194,651 | | | | $69,698 | | | | $59,620 | |
| 1. | For the one month ended October 31, 2010. The Fund changed its fiscal year end from September 30 to October 31, effective October 31, 2010. |
| 2. | Calculated based upon average shares outstanding |
| 3. | Amount is less than $0.005. |
| 4. | Returns for periods of less than one year are not annualized. |
The accompanying notes are an integral part of these financial statements.
| | | | | | |
| Financial highlights | | Wells Fargo Advantage Diversified International Fund | | | 23 | |
(For a share outstanding throughout each period)
| | | | | | | | | | | | | | | | | | | | | | | | | | | | |
| | | Six months ended
April 30, 2013
(unaudited) | | | Year ended October 31 | | | Year ended September 30 | |
| INVESTOR CLASS | | | 2012 | | | 2011 | | | 20101 | | | 2010 | | | 2009 | | | 20082 | |
Net asset value, beginning of period | | $ | 10.21 | | | $ | 9.65 | | | $ | 10.26 | | | $ | 9.81 | | | $ | 9.58 | | | $ | 11.68 | | | $ | 14.27 | |
Net investment income | | | 0.10 | 3 | | | 0.18 | | | | 0.13 | | | | 0.00 | 3,4 | | | 0.11 | 3 | | | 0.14 | 3 | | | 0.04 | 3 |
Net realized and unrealized gains (losses) on investments | | | 1.43 | | | | 0.52 | | | | (0.63 | ) | | | 0.45 | | | | 0.24 | | | | (0.70 | ) | | | (2.63 | ) |
| | | | | | | | | | | | | | | | | | | | | | | | | | | | |
Total from investment operations | | | 1.53 | | | | 0.70 | | | | (0.50 | ) | | | 0.45 | | | | 0.35 | | | | (0.56 | ) | | | (2.59 | ) |
Distributions to shareholders from | | | | | | | | | | | | | | | | | | | | | | | | | | | | |
Net investment income | | | (0.59 | ) | | | (0.14 | ) | | | (0.11 | ) | | | 0.00 | | | | (0.12 | ) | | | (0.26 | ) | | | 0.00 | |
Net realized gains | | | 0.00 | | | | 0.00 | | | | 0.00 | | | | 0.00 | | | | 0.00 | | | | (1.28 | ) | | | 0.00 | |
| | | | | | | | | | | | | | | | | | | | | | | | | | | | |
Total distributions to shareholders | | | (0.59 | ) | | | (0.14 | ) | | | (0.11 | ) | | | 0.00 | | | | (0.12 | ) | | | (1.54 | ) | | | 0.00 | |
Net asset value, end of period | | $ | 11.15 | | | $ | 10.21 | | | $ | 9.65 | | | $ | 10.26 | | | $ | 9.81 | | | $ | 9.58 | | | $ | 11.68 | |
Total return5 | | | 15.65 | % | | | 7.43 | % | | | 4.97 | % | | | 4.59 | % | | | 3.74 | % | | | (0.82 | )% | | | (18.15 | )% |
Ratios to average net assets (annualized) | | | | | | | | | | | | | | | | | | | | | | | | | | | | |
Gross expenses | | | 2.02 | % | | | 1.74 | % | | | 1.54 | % | | | 1.61 | % | | | 1.73 | % | | | 1.87 | % | | | 1.85 | % |
Net expenses | | | 1.46 | % | | | 1.46 | % | | | 1.46 | % | | | 1.46 | % | | | 1.43 | % | | | 1.46 | % | | | 1.46 | % |
Net investment income | | | 1.85 | % | | | 1.91 | % | | | 1.43 | % | | | 0.54 | % | | | 1.18 | % | | | 1.75 | % | | | 1.60 | % |
Supplemental data | | | | | | | | | | | | | | | | | | | | | | | | | | | | |
Portfolio turnover rate | | | 25 | % | | | 57 | % | | | 53 | % | | | 5 | % | | | 64 | % | | | 123 | % | | | 62 | % |
Net assets, end of period (000s omitted) | | | $44,760 | | | | $39,152 | | | | $40,456 | | | | $48,070 | | | | $46,282 | | | | $47,569 | | | | $47,062 | |
| 1. | For the one month ended October 31, 2010. The Fund changed its fiscal year end from September 30 to October 31, effective October 31, 2010. |
| 2. | For the period from July 18, 2008 (commencement of class operations) to September 30, 2008 |
| 3. | Calculated based upon average shares outstanding |
| 4. | Amount is less than $0.005 |
| 5. | Returns for periods of less than one year are not annualized. |
The accompanying notes are an integral part of these financial statements.
| | | | |
| 24 | | Wells Fargo Advantage Diversified International Fund | | Notes to financial statements (unaudited) |
1. ORGANIZATION
Wells Fargo Funds Trust (the “Trust”), a Delaware statutory trust organized on March 10, 1999, is an open-end management investment company registered under the Investment Company Act of 1940, as amended (the “1940 Act”). These financial statements report on Wells Fargo Advantage Diversified International Fund (the “Fund”) which is a diversified series of the Trust.
2. SIGNIFICANT ACCOUNTING POLICIES
The following significant accounting policies, which are consistently followed in the preparation of the financial statements of the Fund, are in conformity with U.S. generally accepted accounting principles which require management to make estimates and assumptions that affect the reported amounts of assets and liabilities, disclosure of contingent assets and liabilities at the date of the financial statements, and the reported amounts of revenues and expenses during the reporting period. Actual results could differ from those estimates.
Securities valuation
All investments are valued each business day as of the close of regular trading on the New York Stock Exchange (normally 4 p.m. Eastern Time).
Equity securities that are listed on a foreign or domestic exchange, except for The Nasdaq Stock Market, Inc. (“Nasdaq”), are valued at the official closing price or, if none, the last sales price. Securities listed on Nasdaq are valued at the Nasdaq Official Closing Price (“NOCP”). If no NOCP is available, securities are valued at the last sales price. If no sales price is shown on the Nasdaq, the bid price will be used. If no sale occurs on the primary exchange or market for the security that day or if no sale occurs and no bid price is shown on Nasdaq, the prior day’s price will be deemed “stale” and fair values will be determined in accordance with the Fund’s Valuation Procedures.
Securities denominated in foreign currencies are translated into U.S. dollars using the rates of exchange in effect on the day of valuation at a time specified by the Management Valuation Team of Wells Fargo Funds Management, LLC (“Funds Management”).
Many securities markets and exchanges outside the U.S. close prior to the close of the New York Stock Exchange and therefore may not fully reflect trading or events that occur after the close of the principal exchange in which the foreign securities are traded, but before the close of the New York Stock Exchange. If such trading or events are expected to materially affect the value of such securities, then fair value pricing procedures approved by the Board of Trustees are applied. These procedures take into account multiple factors including movements in U.S. securities markets after foreign exchanges close. Foreign securities that are fair valued under these procedures are categorized as Level 2 and the application of these procedures may result in transfers between Level 1 and Level 2. Depending on market activity, such fair valuations may be frequent. Such fair value pricing may result in NAVs that are higher or lower than NAVs based on the last reported sales price or latest quoted bid price. On April 30, 2013, fair value pricing was not used in pricing foreign securities.
Investments in registered investment companies are valued at net asset value. Non-registered investment companies are fair valued at net asset value.
Investments which are not valued using any of the methods discussed above are valued at their fair value, as determined by procedures established in good faith and approved by the Board of Trustees. The Board of Trustees has established a Valuation Committee comprised of the Trustees and has delegated to it the authority to take any actions regarding the valuation of portfolio securities that the Valuation Committee deems necessary or appropriate, including determining the fair value of portfolio securities, unless the determination has been delegated to the Management Valuation Team. The Board of Trustees retains the authority to make or ratify any valuation decisions or approve any changes to the Valuation Procedures as it deems appropriate. On a quarterly basis, the Board of Trustees receives reports on any valuation actions taken by the Valuation Committee or the Management Valuation Team which includes items for ratification.
Valuations of fair valued securities are compared to the next actual sales price when available, or other appropriate market information to assess the continued appropriateness of the fair valuation methodology used. These securities are fair valued on a day-to-day basis, taking into consideration changes to appropriate market information and any significant changes to the input factors considered in the valuation process until there is a readily available price provided on the exchange or by an independent pricing service. Valuations received from an independent pricing service or broker quotes are periodically validated by comparisons to most recent trades and valuations provided by other independent pricing services in addition to the review of prices by the adviser and/or subadviser. Unobservable inputs used in determining fair valuations are identified based on the type of security, taking into consideration factors utilized by market participants in valuing the investment, knowledge about the issuer and the current market environment.
| | | | | | |
| Notes to financial statements (unaudited) | | Wells Fargo Advantage Diversified International Fund | | | 25 | |
Foreign currency translation
The accounting records of the Fund are maintained in U.S. dollars. Assets, including investment securities, and liabilities denominated in foreign currency are translated into U.S. dollars at the rates of exchange at a time specified by the Management Valuation Team on the date of valuation. Purchases and sales of securities, and income and expenses are converted at the rate of exchange on the respective dates of such transactions. Reported net realized foreign exchange gains or losses arise from sales of foreign currencies, currency gains or losses realized between the trade and settlement dates on securities transactions, and the difference between the amounts of dividends, interest and foreign withholding taxes recorded and the U.S. dollar equivalent of the amounts actually paid or received. Net unrealized foreign exchange gains and losses arise from changes in the fair value of assets and liabilities other than investments in securities resulting in changes in exchange rates.
The changes in net assets arising from changes in exchange rates and the changes in net assets resulting from changes in market prices of securities are not separately presented. Such changes are recorded with net realized and unrealized gains or losses from investments. Gains and losses from certain foreign currency transactions are treated as ordinary income for U.S. federal income tax purposes.
Forward foreign currency contracts
The Fund may be subject to foreign currency exchange rate risk in the normal course of pursuing its investment objectives. A forward foreign currency contract is an agreement between two parties to purchase or sell a specific currency for an agreed-upon price at a future date. The Fund enters into forward foreign currency contracts to facilitate transactions in foreign-denominated securities and to attempt to minimize the risk to the Fund from adverse changes in the relationship between currencies. Forward foreign currency contracts are recorded at the forward rate and marked-to-market daily. When the contracts are closed, realized gains and losses arising from such transactions are recorded as realized gains or losses on forward foreign currency contract transactions. The Fund could be exposed to risks if the counterparties to the contracts are unable to meet the terms of their contracts or if the value of the foreign currency changes unfavorably. The Fund’s maximum risk of loss from counterparty credit risk is the unrealized gains or losses on the contracts. This risk is mitigated by having a master netting arrangement between the Fund and the counterparty.
Security loans
The Fund may lend its securities from time to time in order to earn additional income in the form of fees or interest on securities received as collateral or the investment of any cash received as collateral. The Fund continues to receive interest or dividends on the securities loaned. The Fund receives collateral in the form of cash or securities with a value at least equal to the value of the securities on loan. The value of the loaned securities is determined at the close of each business day and any additional required collateral is delivered to the Fund on the next business day. In a securities lending transaction, the net asset value of the Fund will be affected by an increase or decrease in the value of the securities loaned and by an increase or decrease in the value of the instrument in which collateral is invested. The amount of securities lending activity undertaken by the Fund fluctuates from time to time. In the event of default or bankruptcy by the borrower, the Fund may be prevented from recovering the loaned securities or gaining access to the collateral or may experience delays or costs in doing so. In addition, the investment of any cash collateral received may lose all or part of its value. The Fund has the right under the lending agreement to recover the securities from the borrower on demand.
The Fund lends its securities through an unaffiliated securities lending agent. Cash collateral received in connection with its securities lending transactions is invested in Wells Fargo Securities Lending Cash Investments, LLC (the “Cash Collateral Fund”). The Cash Collateral Fund is exempt from registration under Section 3(c)(7) of the 1940 Act and is managed by Funds Management and is subadvised by Wells Capital Management Incorporated (“WellsCap”). Funds Management receives an advisory fee starting at 0.05% and declining to 0.01% as the average daily net assets of the Cash Collateral Fund increase. All of the fees received by Funds Management are paid to WellsCap for its services as subadviser. The Cash Collateral Fund seeks to provide a positive return compared to the daily Fed Funds Open rate by investing in high-quality, U.S. dollar-denominated short-term money market instruments. Cash Collateral Fund investments are fair valued based upon the amortized cost valuation technique. Income earned from investment in the Cash Collateral Fund is included in securities lending income on the Statement of Operations.
Security transactions and income recognition
Securities transactions are recorded on a trade date basis. Realized gains or losses are recorded on the basis of identified cost.
Dividend income is recognized on the ex-dividend date, except for certain dividends from foreign securities, which are recorded as soon as the Fund is informed of the ex-dividend date. Dividend income from foreign securities is recorded net of foreign taxes withheld where recovery of such taxes is not assured.
| | | | |
| 26 | | Wells Fargo Advantage Diversified International Fund | | Notes to financial statements (unaudited) |
Distributions to shareholders
Distributions to shareholders from net investment income and net realized gains, if any, are recorded on the ex-dividend date. Such distributions are determined in conformity with federal income tax regulations, which may differ in amount or character from net investment income and realized gains recognized for purposes of U.S. generally accepted accounting principles.
Federal and other taxes
The Fund intends to continue to qualify as a regulated investment company by distributing substantially all of its investment company taxable income and any net realized capital gains (after reduction for capital loss carryforwards) sufficient to relieve it from all, or substantially all, federal income taxes. Accordingly, no provision for federal income taxes was required.
The Fund’s income and federal excise tax returns and all financial records supporting those returns for the prior three fiscal years are subject to examination by the federal and Delaware revenue authorities. Management has analyzed the Fund’s tax positions taken on federal, state, and foreign tax returns for all open tax years and does not believe that there are any uncertain tax positions that require recognition of a tax liability.
At October 31, 2012, capital loss carryforwards which are available to offset future net realized capital gains were as follows:
| | | | |
| Pre-enactment capital loss expiration* | | Post-enactment capital losses** |
| 2017 | | Short-term | | Long-term |
| $89,306,475 | | $8,730,844 | | $7,626,572 |
| * | | Losses incurred in taxable years beginning before December 22, 2010. |
| ** | | Losses incurred in taxable years which began after December 22, 2010 are carried forward for an unlimited period. |
Class allocations
The separate classes of shares offered by the Fund differ principally in applicable sales charges, distribution, shareholder servicing, and administration fees. Shareholders of each class bear certain expenses that pertain to that particular class. All shareholders bear the common expenses of the Fund, earn income from the portfolio, and are allocated any unrealized gains and losses pro rata based on the average daily net assets of each class, without distinction between share classes. Dividends are determined separately for each class based on income and expenses allocable to each class. Realized gains and losses are allocated to each class pro rata based upon the net assets of each class on the date realized. Differences in per share dividend rates generally result from the relative weightings of pro rata income and realized gain allocations and from differences in separate class expenses, including distribution, shareholder servicing, and administration fees.
3. FAIR VALUATION MEASUREMENTS
Fair value measurements of investments are determined within a framework that has established a fair value hierarchy based upon the various data inputs utilized in determining the value of the Fund’s investments. The three-level hierarchy gives the highest priority to unadjusted quoted prices in active markets for identical assets or liabilities (Level 1) and the lowest priority to significant unobservable inputs (Level 3). The Fund’s investments are classified within the fair value hierarchy based on the lowest level of input that is significant to the fair value measurement. The inputs are summarized into three broad levels as follows:
| n | | Level 1 – quoted prices in active markets for identical securities |
| n | | Level 2 – other significant observable inputs (including quoted prices for similar securities, interest rates, prepayment speeds, credit risk, use of amortized cost, etc.) |
| n | | Level 3 – significant unobservable inputs (including the Fund’s own assumptions in determining the fair value of investments) |
The inputs or methodologies used for valuing investments in securities are not necessarily an indication of the risk associated with investing in those securities.
| | | | | | |
| Notes to financial statements (unaudited) | | Wells Fargo Advantage Diversified International Fund | | | 27 | |
As of April 30, 2013, the inputs used in valuing investments in securities were as follows:
| | | | | | | | | | | | | | | | |
| Investments in securities | | Quoted prices (Level 1) | | | Significant other
observable inputs (Level 2) | | | Significant unobservable inputs (Level 3) | | | Total | |
Equity securities | | | | | | | | | | | | | | | | |
Common stocks | | $ | 76,736,454 | | | $ | 267,566 | | | $ | 0 | | | $ | 77,004,020 | |
Preferred stocks | | | 677,014 | | | | 0 | | | | 0 | | | | 677,014 | |
Short-term investments | | | | | | | | | | | | | | | | |
Investment companies | | | 910,389 | | | | 7,964,436 | | | | 0 | | | | 8,874,825 | |
| | | $ | 78,323,857 | | | $ | 8,232,002 | | | $ | 0 | | | $ | 86,555,859 | |
As of April 30, 2013, the inputs used in valuing the Fund’s other financial instruments were as follows:
| | | | | | | | | | | | | | | | |
| Other financial instruments | | Quoted prices (Level 1) | | | Significant other
observable inputs (Level 2) | | | Significant unobservable inputs (Level 3) | | | Total | |
Forward foreign currency contracts+ | | $ | 0 | | | $ | 14,050 | | | $ | 0 | | | $ | 14,050 | |
| + | Forward foreign currency contracts are presented at the unrealized gains or losses on the instrument. |
Transfers in and transfers out are recognized at the end of the reporting period. For the six months ended April 30, 2013, the Fund did not have any transfers into/out of Level 1 or Level 2.
4. TRANSACTIONS WITH AFFILIATES AND OTHER EXPENSES
Advisory fee
The Trust has entered into an advisory contract with Funds Management, an indirect wholly owned subsidiary of Wells Fargo & Company (“Wells Fargo”). The adviser is responsible for implementing investment policies and guidelines and for supervising the subadvisers, who are responsible for day-to-day portfolio management of the Fund.
Pursuant to the contract, Funds Management is entitled to receive an annual advisory fee starting at 0.85% and declining to 0.70% as the average daily net assets of the Fund increase. For the six months ended April 30, 2013, the advisory fee was equivalent to an annual rate of 0.85% of the Fund’s average daily net assets.
Funds Management has retained the services of certain subadvisers to provide daily portfolio management to the Fund. The fees for subadvisory services are borne by Funds Management. Artisan Partners Limited Partnership, LSV Asset Management, and WellsCap, an affiliate of Funds Management, are the subadvisers to the Fund and are entitled to receive a fee from Funds Management which is calculated based on the average daily net assets of each subadvisers’ portion of the Fund as follows:
| | | | | | | | |
| | | Annual sub-advisory fee | |
| | | starting at | | | declining to | |
Artisan Partners Limited Partnership | | | 0.80 | % | | | 0.50 | % |
LSV Asset Management | | | 0.35 | | | | 0.30 | |
WellsCap | | | 0.45 | | | | 0.40 | |
Administration and transfer agent fees
The Trust has entered into an administration agreement with Funds Management. Under this agreement, for providing administrative services, which includes paying fees and expenses for services provided by the transfer agent, sub-transfer agents, omnibus account servicers and record-keepers, Funds Management is entitled to receive from the Fund an annual fund level administration fee starting at 0.05% and declining to 0.03% as the average daily net assets of the Fund increase and a class level administration fee which is calculated based on the average daily net assets of each class as follows:
| | | | |
| | | Class level
administration fee | |
Class A, Class B, Class C | | | 0.26 | % |
Administrator Class | | | 0.10 | |
Institutional Class | | | 0.08 | |
Investor Class | | | 0.32 | |
| | | | |
| 28 | | Wells Fargo Advantage Diversified International Fund | | Notes to financial statements (unaudited) |
Funds Management has contractually waived and/or reimbursed advisory and administration fees to the extent necessary to maintain certain net operating expense ratios for the Fund. Waiver of fees and/or reimbursement of expenses by Funds Management were made first from fund level expenses on a proportionate basis and then from class specific expenses. Funds Management has committed through February 28, 2014 to waive fees and/or reimburse expenses to the extent necessary to cap the Fund’s expenses at 1.41% for Class A, 2.16% for Class B, 2.16% for Class C, 1.25% for Administrator Class, 0.99% for Institutional Class, and 1.46% for Investor Class.
Distribution fees
The Trust has adopted a Distribution Plan for Class B and Class C shares of the Fund pursuant to Rule 12b-1 under the 1940 Act. Distribution fees are charged to Class B and Class C shares and paid to Wells Fargo Funds Distributor, LLC, the principal underwriter, at an annual rate of 0.75% of the average daily net assets of Class B and Class C shares.
For the six months ended April 30, 2013, Wells Fargo Funds Distributor, LLC received $967 from the sale of Class A shares.
Shareholder servicing fees
The Trust has entered into contracts with one or more shareholder servicing agents, whereby Class A, Class B, Class C, Administrator Class, and Investor Class of the Fund is charged a fee at an annual rate of 0.25% of the average daily net assets of each respective class.
A portion of these total shareholder servicing fees were paid to affiliates of Wells Fargo.
5. INVESTMENT PORTFOLIO TRANSACTIONS
Purchases and sales of investments, excluding U.S. government obligations (if any) and short-term securities, for the six months ended April 30, 2013 were $19,781,294 and $18,444,748, respectively.
6. DERIVATIVE TRANSACTIONS
During the six months ended April 30, 2013, the Fund entered into forward foreign currency contracts for economic hedging purposes.
At April 30, 2013, the Fund had forward foreign currency contracts outstanding as follows:
Forward foreign currency contracts to sell:
| | | | | | | | | | | | | | | | | | |
| Exchange date | | Counterparty | | Contracts
to deliver | | | U.S. value at April 30, 2013 | | | In exchange for U.S. $ | | | Unrealized
gains
(losses) | |
| 7-8-2013 | | State Street Bank | | | 41,385,000 | JPY | | $ | 424,678 | | | $ | 416,377 | | | $ | (8,301 | ) |
| 7-8-2013 | | State Street Bank | | | 97,457,000 | JPY | | | 1,000,068 | | | | 1,022,419 | | | | 22,351 | |
The Fund had average contract amounts of $30,961 and $506,660 in forward foreign currency contracts to buy and forward foreign currency contracts to sell, respectively, during the six months ended April 30, 2013.
7. CAPITAL SHARES
As a result of the transfer of assets from Funds Management, former program manager of the 529 college savings plans for the State of Wisconsin, to a new program manager, the Fund redeemed assets from its Institutional Class on October 26, 2012 with a value of $108,356,253, representing 59.52% of the Fund. This amount is reflected in the Statement of Changes in Net Assets.
8. BANK BORROWINGS
The Trust (excluding the money market funds and certain other funds in the Trust) and Wells Fargo Variable Trust are parties to a $150,000,000 revolving credit agreement with State Street Bank and Trust Company, whereby the Fund is permitted to use bank borrowings for temporary or emergency purposes, such as to fund shareholder redemption requests. Interest under the credit agreement is charged to the Fund based on a borrowing rate equal to the higher of the Federal Funds rate in effect on that day plus 1.25% or the overnight LIBOR rate in effect on that day plus 1.25%. In addition, an annual commitment fee equal to 0.10% of the unused balance is allocated to each participating fund. For the six months ended April 30, 2013, the Fund paid $100 in commitment fees.
For the six months ended April 30, 2013, there were no borrowings by the Fund under the agreement.
| | | | | | |
| Notes to financial statements (unaudited) | | Wells Fargo Advantage Diversified International Fund | | | 29 | |
9. INDEMNIFICATION
Under the Trust’s organizational documents, the officers and directors are indemnified against certain liabilities that may arise out of performance of their duties to the Trust. Additionally, in the normal course of business, the Trust may enter into contracts with service providers that contain a variety of indemnification clauses. The Trust’s maximum exposure under these arrangements is dependent on future claims that may be made against the Fund and, therefore, cannot be estimated.
10. NEW ACCOUNTING PRONOUNCEMENT
In December 2011, the Financial Accounting Standards Board (“FASB”) issued Accounting Standard Update (“ASU”) No. 2011-11, Disclosures about Offsetting Assets and Liabilities. ASU 2011-11, which amends FASB ASC Topic 210, Balance Sheet, creates new disclosure requirements which require entities to disclose both gross and net information for derivatives and other financial instruments that are either offset in the Statement of Assets and Liabilities or subject to an enforceable master netting arrangement or similar agreement. The disclosure requirements are effective for interim and annual reporting periods beginning on or after January 1, 2013. Management is currently assessing the potential impact, in addition to expanded financial statement disclosure, that may result from adopting this ASU.
| | | | |
| 30 | | Wells Fargo Advantage Diversified International Fund | | Other information (unaudited) |
TAX INFORMATION
Pursuant to Section 853 of the Internal Revenue Code, the following amounts were designated as foreign taxes paid for the fiscal year ended October 31, 2012. These amounts may be less than the actual foreign taxes paid for financial statement purposes. Foreign taxes paid or withheld should be included in taxable income with an offsetting deduction from gross income or as a credit for taxes paid to foreign governments. None of the income was derived from ineligible foreign sources as defined under Section 901(j) of the Internal Revenue Code.
| | | | |
Creditable foreign taxes paid | | Per share amount on October 31, 2012 | | Foreign income as % of ordinary income distributions |
| $248,122 | | $0.03 | | 95.70% |
PROXY VOTING INFORMATION
A description of the policies and procedures that the Fund uses to determine how to vote proxies relating to portfolio securities is available without charge, upon request, by calling 1-800-222-8222, visiting our website at wellsfargoadvantagefunds.com, or visiting the SEC website at sec.gov. Information regarding how the Fund voted proxies relating to portfolio securities during the most recent 12-month period ended June 30 is available without charge on the Fund’s website at wellsfargoadvantagefunds.com or by visiting the SEC website at sec.gov.
PORTFOLIO HOLDINGS INFORMATION
The complete portfolio holdings for the Fund are publicly available on the Fund’s website (wellsfargoadvantagefunds.com) on a monthly, 30-day or more delayed basis. In addition, top ten holdings information for the Fund is publicly available on the Fund’s website on a monthly, seven-day or more delayed basis. The Fund files its complete schedule of portfolio holdings with the SEC for the first and third quarters of each fiscal year on Form N-Q, which is available without charge by visiting the SEC website at sec.gov. In addition, the Fund’s Form N-Q may be reviewed and copied at the SEC’s Public Reference Room in Washington, DC, and at regional offices in New York City, at 233 Broadway, and in Chicago, at 175 West Jackson Boulevard, Suite 900. Information about the Public Reference Room may be obtained by calling 1-800-SEC-0330.
| | | | | | |
| Other information (unaudited) | | Wells Fargo Advantage Diversified International Fund | | | 31 | |
BOARD OF TRUSTEES AND OFFICERS
Each of the Trustees and Officers listed in the table below acts in identical capacities for the Wells Fargo Advantage family of funds, which consists of 131 funds1 comprising the Wells Fargo Funds Trust, Wells Fargo Variable Trust, Wells Fargo Master Trust and four closed-end funds (collectively the “Fund Complex”). This table should be read in conjunction with the Prospectus and the Statement of Additional Information2. All of the Trustees are also Members of the Audit and Governance Committees of each Trust in the Fund Complex. The mailing address of each Trustee and Officer is 525 Market Street, 12th Floor, San Francisco, CA 94105. Each Trustee and Officer serves an indefinite term, however, each Trustee serves such term until reaching the mandatory retirement age established by the Trustees.
Independent Trustees
| | | | | | |
Name and year of birth | | Position held and length of service* | | Principal occupations during past five years | | Other directorships during
past five years |
| Peter G. Gordon (Born 1942) | | Trustee, since 1998; Chairman, since 2005 | | Co-Founder, Retired Chairman, President and CEO of Crystal Geyser Water Company. Trustee Emeritus, Colby College. | | Asset Allocation Trust |
| Isaiah Harris, Jr. (Born 1952) | | Trustee, since 2009 | | Retired. Prior thereto, President and CEO of BellSouth Advertising and Publishing Corp. from 2005 to 2007, President and CEO of BellSouth Enterprises from 2004 to 2005 and President of BellSouth Consumer Services from 2000 to 2003. Emeritus member of the Iowa State University Foundation Board of Governors. Emeritus Member of the Advisory Board of Iowa State University School of Business. Advisory Board Member, Palm Coast Academy (charter school). Mr. Harris is a certified public accountant. | | CIGNA Corporation; Deluxe Corporation; Asset Allocation Trust |
| Judith M. Johnson (Born 1949) | | Trustee, since 2008; Audit Committee Chairman, since 2008 | | Retired. Prior thereto, Chief Executive Officer and Chief Investment Officer of Minneapolis Employees Retirement Fund from 1996 to 2008. Ms. Johnson is an attorney, certified public accountant and a certified managerial accountant. | | Asset Allocation Trust |
| Leroy Keith, Jr. (Born 1939) | | Trustee, since 2010 | | Chairman, Bloc Global Services (development and construction). Trustee of the Evergreen Funds from 1983 to 2010. Former Managing Director, Almanac Capital Management (commodities firm), former Partner, Stonington Partners, Inc. (private equity fund), former Director, Obagi Medical Products Co. and former Director, Lincoln Educational Services. | | Trustee, Virtus Fund Complex (consisting of 48 portfolios as of 1/31/2013); Asset Allocation Trust |
| David F. Larcker (Born 1950) | | Trustee, since 2009 | | James Irvin Miller Professor of Accounting at the Graduate School of Business, Stanford University, Morgan Stanley Director of the Center for Leadership Development and Research and Senior Faculty of The Rock Center for Corporate Governance since 2006. From 2005 to 2008, Professor of Accounting at the Graduate School of Business, Stanford University. Prior thereto, Ernst & Young Professor of Accounting at The Wharton School, University of Pennsylvania from 1985 to 2005. | | Asset Allocation Trust |
| Olivia S. Mitchell (Born 1953) | | Trustee, since 2006 | | International Foundation of Employee Benefit Plans Professor, Wharton School of the University of Pennsylvania since 1993. Director of Wharton’s Pension Research Council and Boettner Center on Pensions & Retirement Research, and Research Associate at the National Bureau of Economic Research. Previously, Cornell University Professor from 1978 to 1993. | | Asset Allocation Trust |
| Timothy J. Penny (Born 1951) | | Trustee, since 1996 | | President and CEO of Southern Minnesota Initiative Foundation, a non-profit organization, since 2007 and Senior Fellow at the Humphrey Institute Policy Forum at the University of Minnesota since 1995. Member of the Board of Trustees of NorthStar Education Finance, Inc., a non-profit organization, since 2007. | | Asset Allocation Trust |
| | | | |
| 32 | | Wells Fargo Advantage Diversified International Fund | | Other information (unaudited) |
| | | | | | |
Name and year of birth | | Position held and length of service* | | Principal occupations during past five years | | Other directorships during
past five years |
| Michael S. Scofield (Born 1943) | | Trustee, since 2010 | | Served on the Investment Company Institute’s Board of Governors and Executive Committee from 2008-2011 as well the Governing Council of the Independent Directors Council from 2006-2011 and the Independent Directors Council Executive Committee from 2008-2011. Chairman of the IDC from 2008-2010. Institutional Investor (Fund Directions) Trustee of Year in 2007. Trustee of the Evergreen Funds (and its predecessors) from 1984 to 2010. Chairman of the Evergreen Funds from 2000-2010. Former Trustee of the Mentor Funds. Retired Attorney, Law Offices of Michael S. Scofield. | | Asset Allocation Trust |
| Donald C. Willeke (Born 1940) | | Trustee, since 1996 | | Principal of the law firm of Willeke & Daniels. General Counsel of the Minneapolis Employees Retirement Fund from 1984 until its consolidation into the Minnesota Public Employees Retirement Association on June 30, 2010. Director and Vice Chair of The Tree Trust (non-profit corporation). Director of the American Chestnut Foundation (non-profit corporation). | | Asset Allocation Trust |
| * | Length of service dates reflect the Trustee’s commencement of service with the Trust’s predecessor entities, where applicable. |
Officers
| | | | | | |
Name and year of birth | | Position held and
length of service | | Principal occupations during past five years | | |
| Karla M. Rabusch (Born 1959) | | President, since 2003 | | Executive Vice President of Wells Fargo Bank, N.A. and President of Wells Fargo Funds Management, LLC since 2003. | | |
| Jeremy DePalma1 (Born 1974) | | Treasurer, since 2012 | | Senior Vice President of Wells Fargo Funds Management, LLC since 2009. Senior Vice President of Evergreen Investment Management Company, LLC from 2008 to 2010. Vice President, Evergreen Investment Services, Inc. from 2004 to 2007. Head of the Fund Reporting and Control Team within Fund Administration from 2005 to 2010. | | |
| C. David Messman (Born 1960) | | Secretary, since 2000; Chief Legal Officer, since 2003 | | Senior Vice President and Secretary of Wells Fargo Funds Management, LLC since 2001. Vice President and Managing Counsel of Wells Fargo Bank, N.A. since 1996. | | |
Debra Ann Early (Born 1964) | | Chief Compliance Officer, since 2007 | | Chief Compliance Officer of Wells Fargo Funds Management, LLC since 2007. Chief Compliance Officer of Parnassus Investments from 2005 to 2007. Chief Financial Officer of Parnassus Investments from 2004 to 2007. | | |
David Berardi (Born 1975) | | Assistant Treasurer, since 2009 | | Vice President of Wells Fargo Funds Management, LLC since 2009. Vice President of Evergreen Investment Management Company, LLC from 2008 to 2010. Assistant Vice President of Evergreen Investment Services, Inc. from 2004 to 2008. Manager of Fund Reporting and Control for Evergreen Investment Management Company, LLC from 2004 to 2010. | | |
| 1. | Jeremy DePalma acts as Treasurer of 58 funds and Assistant Treasurer of 73 funds in the Fund Complex. |
| 2. | The Statement of Additional Information includes additional information about the Trustees and is available, without charge, upon request, by calling 1-800-222-8222 or by visiting the website at wellsfargoadvantagefunds.com. |
| | | | | | |
| Other information (unaudited) | | Wells Fargo Advantage Diversified International Fund | | | 33 | |
BOARD CONSIDERATION OF INVESTMENT ADVISORY AND SUB-ADVISORY AGREEMENTS:
Under Section 15 of the Investment Company Act of 1940 (the “1940 Act”), the Board of Trustees (the “Board”) of Wells Fargo Funds Trust (the “Trust”), all the members of which have no direct or indirect interest in the investment advisory and sub-advisory agreements and are not “interested persons” of the Trust, as defined in the 1940 Act (the “Independent Trustees”), must determine whether to approve the continuation of the Trust’s investment advisory and sub-advisory agreements. In this regard, at an in-person meeting held on March 28-29, 2013 (the “Meeting”), the Board reviewed: (i) an investment advisory agreement with Wells Fargo Funds Management, LLC (“Funds Management”) for Wells Fargo Advantage Diversified International Fund (the “Fund”), (ii) an investment sub-advisory agreement with Wells Capital Management Incorporated (“WellsCap”), an affiliate of Funds Management, for the Fund, (iii) an investment sub-advisory agreement with LSV Asset Management (“LSV”) for the Fund and (iv) an investment sub-advisory agreement with Artisan Partners, LP (“Artisan”) for the Fund. The investment advisory agreement with Funds Management and the investment sub-advisory agreements with WellsCap, LSV and Artisan (the “Sub-Advisers”) are collectively referred to as the “Advisory Agreements.”
At the Meeting, the Board considered the factors and reached the conclusions described below relating to the selection of Funds Management and the Sub-Advisers and the continuation of the Advisory Agreements. Prior to the Meeting, the Trustees conferred extensively among themselves and with representatives of Funds Management about these matters. The Board has adopted a team-based approach, with each team consisting of a sub-set of Trustees, to assist the Board in the discharge of its duties in reviewing performance and other matters throughout the year. The Independent Trustees were assisted in their evaluation of the Advisory Agreements by independent legal counsel, from whom they received separate legal advice and with whom they met separately.
In providing information to the Board, Funds Management and the Sub-Advisers were guided by a detailed set of requests for information submitted to them by independent legal counsel on behalf of the Independent Trustees at the start of the Board’s annual contract renewal process earlier in 2013. In considering and approving the Advisory Agreements, the Trustees considered the information they believed relevant, including but not limited to the information discussed below. The Board considered not only the specific information presented in connection with the Meeting, but also the knowledge gained over time through interaction with Funds Management and the Sub-Advisers about various topics. In this regard, the Board reviewed reports of Funds Management at each of its quarterly meetings, which included, among other things, portfolio reviews and performance reports. In addition, the Board and the teams mentioned above confer with portfolio managers at various times throughout the year. The Board did not identify any particular information or consideration that was all-important or controlling, and each individual Trustee may have attributed different weights to various factors.
After its deliberations, the Board unanimously determined that the continuation of the Advisory Agreements is in the best interests of the Fund and its shareholders, and that the compensation payable to Funds Management and the Sub-Advisers is reasonable. The Board considered the continuation of the Advisory Agreements for the Fund as part of its consideration of the continuation of advisory agreements for funds across the complex, but each decision was made on a fund-by-fund basis. The following summarizes a number of important, but not necessarily all, factors considered by the Board in reaching its determination.
Nature, extent and quality of services
The Board received and considered various information regarding the nature, extent and quality of services provided to the Fund by Funds Management and the Sub-Advisers under the Advisory Agreements. This information included, among other things, a summary of the background and experience of senior management of Funds Management, and the qualifications, background, tenure and responsibilities of each of the portfolio managers primarily responsible for the day-to-day portfolio management of the Fund.
The Board evaluated the ability of Funds Management and the Sub-Advisers, based on attributes such as their financial condition, resources and reputation, to attract and retain qualified investment professionals, including research, advisory and supervisory personnel. The Board further considered the compliance programs and compliance records of Funds Management and the Sub-Advisers. In addition, the Board took into account the administrative and other services provided to the Fund by Funds Management and its affiliates and Funds Management’s oversight of the Fund’s various service providers.
| | | | |
| 34 | | Wells Fargo Advantage Diversified International Fund | | Other information (unaudited) |
Fund performance and expenses
The Board considered the performance results for the Fund over various time periods ended December 31, 2012. The Board also considered these results in comparison to the performance of funds in a universe that was determined by Lipper Inc. (“Lipper”) to be similar to the Fund (the “Universe”), and in comparison to the Fund’s benchmark index and to other comparative data. Lipper is an independent provider of investment company data. The Board received a description of the methodology used by Lipper to select the mutual funds in the performance Universe. The Board noted that the performance of the Fund (Administrator Class) was higher than the median performance of the Universe for all periods under review, except for the ten-year period. The Board also noted that the performance of the Fund was higher than its benchmark, the Morgan Stanley Composite Index Europe Australasia and Far East Index, for all periods under review, except for the ten-year period.
The Board received information concerning, and discussed factors contributing to, the underperformance of the Fund relative to the Universe and the benchmark for the ten-year period under review. Funds Management advised the Board about the market conditions and investment decisions that it believed contributed to the underperformance during that period. The Board noted the more recent positive performance of the Fund relative to the Universe and the benchmark for the one-, three- and five-year periods under review. The Board was satisfied with the explanation of the underperformance.
The Board received and considered information regarding the Fund’s net operating expense ratios and their various components, including actual management fees (which reflect fee waivers, if any, and include advisory, administration and transfer agent fees), custodian and other non-management fees, Rule 12b-1 and non-Rule 12b-1 service fees and fee waiver and expense reimbursement arrangements. The Board also considered these ratios in comparison to the median ratios of funds in class-specific expense groups that were determined by Lipper to be similar to the Fund (the “Groups”). The Board received a description of the methodology used by Lipper to select the mutual funds in the expense Groups. Based on the Lipper reports, the Board noted that the net operating expense ratios of the Fund were in range of the median net operating expense ratios of the expense Groups.
Based on its consideration of the factors and information it deemed relevant, including those described here, the Board concluded that the overall performance and expense structure of the Fund supported the re-approval of the Advisory Agreements.
Investment advisory and sub-advisory fee rates
The Board reviewed and considered the contractual investment advisory fee rates that are payable by the Fund to Funds Management for investment advisory services (the “Advisory Agreement Rates”), both on a stand-alone basis and on a combined basis with the Fund’s fund-level and class-level contractual administration fee rates (the “Management Rates”). The Board noted that the administration fees include transfer agency costs. The Board also reviewed and considered the contractual investment sub-advisory fee rates that are payable by Funds Management to each Sub-Adviser for investment sub-advisory services (the “Sub-Advisory Agreement Rates”).
Among other information reviewed by the Board was a comparison of the Management Rates of the Fund with those of other funds in the expense Groups at a common asset level. The Board noted that the Management Rates of the Fund were higher than the median rates for the Fund’s expense Groups for all classes except the Institutional Class.
The Board also received and considered information about the portion of the total advisory fee that was retained by Funds Management after payment of the fees to the Sub-Advisers for sub-advisory services. The Board considered this amount in comparison to the median amount retained by advisers to funds in a sub-advised expense universe that was determined by Lipper to be similar to the Fund. In assessing the reasonableness of this amount, the Board received and evaluated information concerning the nature and extent of responsibilities retained and risks assumed by Funds Management and not delegated to or assumed by the Sub-Advisers, and about Funds Management’s on-going oversight services. In recognition of the fact that the Wells Fargo enterprise provides a suite of combined advisory and sub-advisory services to the Fund through affiliated entities, the Board ascribed limited relevance to the allocation of the total advisory fee between Funds Management and WellsCap. The Board also considered that the sub-advisory fees paid to LSV and Artisan had been negotiated by Funds Management on an arm’s-length basis.
The Board also received and considered information about the nature and extent of services offered and fee rates charged by Funds Management and the Sub-Advisers to other types of clients. In this regard, the Board received information about the significantly greater scope of services, and compliance, reporting and other legal burdens and risks of managing mutual funds compared with those associated with managing assets of non-mutual fund clients such as collective funds or institutional separate accounts.
| | | | | | |
| Other information (unaudited) | | Wells Fargo Advantage Diversified International Fund | | | 35 | |
Based on its consideration of the factors and information it deemed relevant, including those described here, the Board determined that the Advisory Agreement Rates and each Sub-Advisory Agreement Rate were reasonable in light of the services covered by the Advisory Agreements.
Profitability
The Board received and considered information concerning the profitability of Funds Management, as well as the profitability of Wells Fargo as a whole, from providing services to the Fund. The Board did not receive or consider to be necessary separate profitability information with respect to WellsCap, because, as an affiliate of Funds Management, its profitability information was subsumed in the collective Wells Fargo profitability analysis provided by Funds Management.
Funds Management explained the methodologies and estimates that it used in calculating the profitability from the Fund and the fund family as a whole. Among other things, the Board noted that the levels of profitability reported on a fund-by-fund basis varied widely, depending on factors such as the size and type of fund. Based on its review, the Board did not deem the profits reported by Funds Management to be at a level that would prevent it from approving the continuation of the Advisory Agreements.
The Board also received separate profitability information with respect to LSV and Artisan, which are not affiliated with Funds Management. The Board did not deem the profits reported by LSV or Artisan to be at a level that would prevent it from approving the continuation of the sub-advisory agreements with LSV or Artisan.
Economies of scale
With respect to possible economies of scale, the Board reviewed the breakpoints in the Fund’s advisory fee and administration fee structure, which operate generally to reduce the Fund’s expense ratios as the Fund grows in size. It considered that, for a small fund or a fund that shrinks in size, breakpoints conversely can result in higher fee levels. The Board also considered fee waiver and expense reimbursement arrangements as a means of sharing potential economies of scale with the Fund. The Board acknowledged the inherent limitations of any analysis of potential economies of scale and of any attempt to correlate breakpoints with such economies. Nonetheless, the Board concluded that the breakpoints and net operating expense ratio caps appeared to be a reasonable approach to sharing potential economies of scale with the Fund.
Other benefits to Funds Management and the Sub-Advisers
The Board received and considered information regarding potential “fall-out” or ancillary benefits received by Funds Management and its affiliates, including WellsCap, and LSV and Artisan as a result of their relationship with the Fund. Ancillary benefits could include, among others, benefits directly attributable to other relationships with the Fund and benefits potentially derived from an increase in Funds Management’s and the Sub-Advisers’ business as a result of their relationship with the Fund (such as the ability to market to shareholders other financial products and services offered by Funds Management and its affiliates, including WellsCap, or LSV or Artisan, or to operate other products and services that follow investment strategies similar to those of the Fund).
The Board considered that Wells Fargo Funds Distributor, LLC, an affiliate of Funds Management, serves as distributor to the Fund and receives certain compensation for those services. The Board noted that various financial institutions, including affiliates of Funds Management, may receive distribution-related fees, shareholder servicing payments (including amounts derived from payments under Rule 12b-1 plans) and sub-transfer agency fees in respect of shares sold or held through them and services provided.
The Board also reviewed information about whether and to what extent soft dollar credits are sought and how any such credits are utilized, and any benefits that might be realized by an affiliated broker that handles portfolio transactions for the Fund.
Based on its consideration of the factors and information it deemed relevant, including those described here, the Board did not find that any ancillary benefits received by Funds Management and its affiliates, including WellsCap, and LSV and Artisan were unreasonable.
Conclusion
After considering the above-described factors and based on its deliberations and its evaluation of the information described above, the Board unanimously approved the continuation of the Advisory Agreements for an additional one-year period.
| | | | |
| 36 | | Wells Fargo Advantage Diversified International Fund | | List of abbreviations |
The following is a list of common abbreviations for terms and entities that may have appeared in this report.
| ACA | — ACA Financial Guaranty Corporation |
| ADR | — American depositary receipt |
| ADS | — American depositary shares |
| AGC | — Assured Guaranty Corporation |
| AGM | — Assured Guaranty Municipal |
| Ambac | — Ambac Financial Group Incorporated |
| AMT | — Alternative minimum tax |
| BAN | — Bond anticipation notes |
| BHAC | — Berkshire Hathaway Assurance Corporation |
| CAB | — Capital appreciation bond |
| CCAB | — Convertible capital appreciation bond |
| CDA | — Community Development Authority |
| CDO | — Collateralized debt obligation |
| COP | — Certificate of participation |
| DRIVER | — Derivative inverse tax-exempt receipts |
| DW&P | — Department of Water & Power |
| DWR | — Department of Water Resources |
| ECFA | — Educational & Cultural Facilities Authority |
| EDA | — Economic Development Authority |
| EDFA | — Economic Development Finance Authority |
| ETF | — Exchange-traded fund |
| FDIC | — Federal Deposit Insurance Corporation |
| FFCB | — Federal Farm Credit Banks |
| FGIC | — Financial Guaranty Insurance Corporation |
| FHA | — Federal Housing Administration |
| FHLB | — Federal Home Loan Bank |
| FHLMC | — Federal Home Loan Mortgage Corporation |
| FICO | — The Financing Corporation |
| FNMA | — Federal National Mortgage Association |
| GDR | — Global depositary receipt |
| GNMA | — Government National Mortgage Association |
| HCFR | — Healthcare facilities revenue |
| HEFA | — Health & Educational Facilities Authority |
| HEFAR | — Higher education facilities authority revenue |
| HFA | — Housing Finance Authority |
| HFFA | — Health Facilities Financing Authority |
| HUD | — Department of Housing and Urban Development |
| IDA | — Industrial Development Authority |
| IDAG | — Industrial Development Agency |
| IDR | — Industrial development revenue |
| KRW | — Republic of Korea won |
| LIBOR | — London Interbank Offered Rate |
| LLC | — Limited liability company |
| LLP | — Limited liability partnership |
| MBIA | — Municipal Bond Insurance Association |
| MFHR | — Multifamily housing revenue |
| MSTR | — Municipal securities trust receipts |
| MUD | — Municipal Utility District |
| National | — National Public Finance Guarantee Corporation |
| PCFA | — Pollution Control Financing Authority |
| PCL | — Public Company Limited |
| PCR | — Pollution control revenue |
| PFA | — Public Finance Authority |
| PFFA | — Public Facilities Financing Authority |
| PFOTER | — Puttable floating option tax-exempt receipts |
| plc | — Public limited company |
| PUTTER | — Puttable tax-exempt receipts |
| R&D | — Research & development |
| Radian | — Radian Asset Assurance |
| RAN | — Revenue anticipation notes |
| RDA | — Redevelopment Authority |
| RDFA | — Redevelopment Finance Authority |
| REIT | — Real estate investment trust |
| ROC | — Reset option certificates |
| SAVRS | — Select auction variable rate securities |
| SBA | — Small Business Authority |
| SFHR | — Single-family housing revenue |
| SFMR | — Single-family mortgage revenue |
| SPA | — Standby purchase agreement |
| SPDR | — Standard & Poor’s Depositary Receipts |
| STRIPS | — Separate trading of registered interest and principal securities |
| TAN | — Tax anticipation notes |
| TIPS | — Treasury inflation-protected securities |
| TRAN | — Tax revenue anticipation notes |
| TTFA | — Transportation Trust Fund Authority |
| TVA | — Tennessee Valley Authority |
This page is intentionally left blank.
This page is intentionally left blank.


For more information
More information about Wells Fargo Advantage Funds is available free upon request. To obtain literature, please write, email, visit the Fund’s website, or call:
Wells Fargo Advantage Funds
P.O. Box 8266
Boston, MA 02266-8266
Email: wfaf@wellsfargo.com
Website: wellsfargoadvantagefunds.com
Individual investors: 1-800-222-8222
Retail investment professionals: 1-888-877-9275
Institutional investment professionals: 1-866-765-0778
This report and the financial statements contained herein are submitted for the general information of the shareholders of Wells Fargo Advantage Funds. If this report is used for promotional purposes, distribution of the report must be accompanied or preceded by a current prospectus. For a current prospectus and, if available, a summary prospectus containing more complete information, including charges and expenses, call 1-800-222-8222 or visit the Fund’s website at wellsfargoadvantagefunds.com. Please consider the investment objectives, risks, charges, and expenses of the investment carefully before investing. This and other information about Wells Fargo Advantage Funds can be found in the current prospectus. Read the prospectus carefully before you invest or send money.
Wells Fargo Funds Management, LLC, a wholly owned subsidiary of Wells Fargo & Company, provides investment advisory and administrative services for Wells Fargo Advantage Funds. Other affiliates of Wells Fargo & Company provide subadvisory and other services for the Funds. The Funds are distributed by Wells Fargo Funds Distributor, LLC, Member FINRA/SIPC, an affiliate of Wells Fargo & Company.
NOT FDIC INSURED ¡ NO BANK GUARANTEE ¡ MAY LOSE VALUE
© 2013 Wells Fargo Funds Management, LLC. All rights reserved.
| | |
 | | 216831 06-13 SA237/SAR237 4-13 |

Wells Fargo Advantage
Emerging Markets Equity Fund

Semi-Annual Report
April 30, 2013

Reduce clutter. Save trees.
Sign up for electronic delivery of prospectuses and shareholder reports at wellsfargo.com/advantagedelivery
Contents
The views expressed and any forward-looking statements are as of April 30, 2013, unless otherwise noted, and are those of the Fund managers and/or Wells Fargo Funds Management, LLC. Discussions of individual securities, or the markets generally, or any Wells Fargo Advantage Fund are not intended as individual recommendations. Future events or results may vary significantly from those expressed in any forward-looking statements; the views expressed are subject to change at any time in response to changing circumstances in the market. Wells Fargo Funds Management, LLC, disclaims any obligation to publicly update or revise any views expressed or forward-looking statements.
NOT FDIC INSURED ¡ NO BANK GUARANTEE ¡ MAY LOSE VALUE

Wells Fargo investment history
| | |
| 1932 | | Keystone creates one of the first mutual fund families. |
| 1971 | | Wells Fargo & Company introduces one of the first institutional index funds. |
| 1978 | | Wells Fargo applies Markowitz and Sharpe’s research on Modern Portfolio Theory to introduce one of the industry’s first tactical asset allocation models in institutional separately managed accounts. |
| 1984 | | Wells Fargo Stagecoach Funds launches its first asset allocation fund. |
| 1989 | | The Tactical Asset Allocation (TAA) Model is first applied to Wells Fargo’s asset allocation mutual funds. |
| 1994 | | Wells Fargo introduces the LifePath Funds, one of the first suites of target date funds (now the Wells Fargo Advantage Dow Jones Target Date FundsSM). |
| 1996 | | Evergreen Investments and Keystone Funds merge. |
| 1997 | | Wells Fargo launches the Wells Fargo Advantage WealthBuilder PortfoliosSM, a fund-of-funds suite of products that includes the use of quantitative models to shift assets among investment styles. |
| 1999 | | Norwest Advantage Funds and Stagecoach Funds are reorganized into Wells Fargo Funds after the merger of Norwest and Wells Fargo. |
| 2002 | | Evergreen Retail and Evergreen Institutional companies form the umbrella asset management company, Evergreen Investments. |
| 2005 | | The integration of Strong Funds with Wells Fargo Funds creates Wells Fargo Advantage Funds, resulting in one of the top 20 mutual fund companies in the United States. |
| 2006 | | Wells Fargo Advantage Funds relaunches the target date product line as Wells Fargo Advantage Dow Jones Target Date Funds. |
| 2010 | | The mergers and reorganizations of Evergreen and Wells Fargo Advantage mutual funds are completed, unifying the families under the brand of Wells Fargo Advantage Funds. |
Wells Fargo Advantage Funds®
Wells Fargo Advantage Funds skillfully guides institutions, financial advisors, and individuals through the investment terrain to help them reach their financial objectives. Everything we do on behalf of investors is backed by our unique combination of qualifications.
Strength
Our organization is built on the standards of integrity and service established by our parent company—Wells Fargo & Company—more than 150 years ago. And, because we’re part of a highly diversified financial enterprise, we offer the depth of resources to help investors succeed.
Expertise
Our multi-boutique model offers investors access to the independent thinking of premier investment managers that have been chosen for their time-tested strategies. While each team specializes in a specific investment strategy, collectively they provide investors a wide choice of distinct investment styles. Our dedication to investment excellence doesn’t end with our expertise in manager selection—risk management, analysis, and rigorous ongoing review seek to ensure each manager’s investment process remains consistent.
Partnership
Our collaborative approach is built around understanding the needs and goals of our clients. By adhering to core principles of sound judgment and steady guidance, we support you through every stage of the investment decision process.
Carefully consider the investment objectives, risks, charges, and expenses before investing. For a current prospectus and, if available, a summary prospectus, for Wells Fargo Advantage Funds, containing this and other information, visit wellsfargoadvantagefunds.com. Read it carefully before investing.
Wells Fargo Funds Management, LLC, a wholly owned subsidiary of Wells Fargo & Company, provides investment advisory and administrative services for Wells Fargo Advantage Funds. Other affiliates of Wells Fargo & Company provide subadvisory and other services for the Funds. The Funds are distributed by Wells Fargo Funds Distributor, LLC, Member FINRA/SIPC, an affiliate of Wells Fargo & Company.
“Dow Jones®” and “Dow Jones Target Date IndexesSM” are service marks of Dow Jones Trademark Holdings LLC (“Dow Jones”); have been licensed to CME Group Index Services LLC (“CME Indexes”); and have been sublicensed for use for certain purposes by Global Index Advisors, Inc., and Wells Fargo Funds Management, LLC. The Wells Fargo Advantage Dow Jones Target Date FundsSM, based on the Dow Jones Target Date Indexes, are not sponsored, endorsed, sold, or promoted by Dow Jones, CME Indexes, or their respective affiliates, and none of them makes any representation regarding the advisability of investing in such product(s).
NOT FDIC INSURED ¡ NO BANK GUARANTEE ¡ MAY LOSE VALUE
Not part of the semi-annual report.
Wells Fargo Advantage Funds offers more than 100 mutual funds across a wide range of asset classes, representing over $228 billion in assets under management, as of April 30, 2013.
| | | | |
| Equity funds | | | | |
Asia Pacific Fund | | Enterprise Fund† | | Opportunity Fund† |
C&B Large Cap Value Fund | | Global Opportunities Fund | | Precious Metals Fund |
C&B Mid Cap Value Fund | | Growth Fund | | Premier Large Company Growth Fund |
Capital Growth Fund | | Index Fund | | Small Cap Opportunities Fund |
Common Stock Fund | | International Equity Fund | | Small Cap Value Fund |
Disciplined U.S. Core Fund | | International Value Fund | | Small Company Growth Fund |
Discovery Fund† | | Intrinsic Small Cap Value Fund | | Small Company Value Fund |
Diversified Equity Fund | | Intrinsic Value Fund | | Small/Mid Cap Value Fund |
Diversified International Fund | | Intrinsic World Equity Fund | | Special Mid Cap Value Fund |
Emerging Growth Fund | | Large Cap Core Fund | | Special Small Cap Value Fund |
Emerging Markets Equity Fund | | Large Cap Growth Fund | | Specialized Technology Fund |
Emerging Markets Equity Income Fund | | Large Company Value Fund | | Traditional Small Cap Growth Fund |
Endeavor Select Fund† | | Omega Growth Fund | | Utility and Telecommunications Fund |
| Bond funds | | | | |
Adjustable Rate Government Fund | | High Yield Municipal Bond Fund | | Short-Term Bond Fund |
California Limited-Term Tax-Free Fund | | Income Plus Fund | | Short-Term High Yield Bond Fund |
California Tax-Free Fund | | Inflation-Protected Bond Fund | | Short-Term Municipal Bond Fund |
Colorado Tax-Free Fund | | Intermediate Tax/AMT-Free Fund | | Strategic Income Fund |
Conservative Income Fund | | International Bond Fund | | Strategic Municipal Bond Fund |
Core Bond Fund | | Minnesota Tax-Free Fund | | Ultra Short-Term Income Fund |
Emerging Markets Local Bond Fund | | Municipal Bond Fund | | Ultra Short-Term Municipal Income Fund |
Government Securities Fund | | North Carolina Tax-Free Fund | | Wisconsin Tax-Free Fund |
High Income Fund | | Pennsylvania Tax-Free Fund | | |
High Yield Bond Fund | | Short Duration Government Bond Fund | | |
| Asset allocation funds | | | | |
Absolute Return Fund | | WealthBuilder Equity Portfolio† | | Target 2020 Fund† |
Asset Allocation Fund | | WealthBuilder Growth Allocation Portfolio† | | Target 2025 Fund† |
Diversified Capital Builder Fund | | WealthBuilder Growth Balanced Portfolio† | | Target 2030 Fund† |
Diversified Income Builder Fund | | WealthBuilder Moderate Balanced Portfolio† | | Target 2035 Fund† |
Growth Balanced Fund | | WealthBuilder Tactical Equity Portfolio† | | Target 2040 Fund† |
Index Asset Allocation Fund | | Target Today Fund† | | Target 2045 Fund† |
Moderate Balanced Fund | | Target 2010 Fund† | | Target 2050 Fund† |
WealthBuilder Conservative Allocation Portfolio† | | Target 2015 Fund† | | Target 2055 Fund† |
| Money market funds | | | | |
100% Treasury Money Market Fund | | Heritage Money Market Fund† | | National Tax-Free Money Market Fund |
California Municipal Money Market Fund | | Money Market Fund | | Treasury Plus Money Market Fund |
Cash Investment Money Market Fund | | Municipal Cash Management Money Market Fund | | |
Government Money Market Fund | | Municipal Money Market Fund | | |
| Variable trust funds1 | | | | |
VT Discovery Fund† | | VT Intrinsic Value Fund | | VT Small Cap Growth Fund |
VT Index Asset Allocation Fund | | VT Omega Growth Fund | | VT Small Cap Value Fund |
VT International Equity Fund | | VT Opportunity Fund† | | VT Total Return Bond Fund |
An investment in a money market fund is not insured or guaranteed by the Federal Deposit Insurance Corporation or any other government agency. Although the Wells Fargo Advantage Money Market Funds seek to preserve the value of your investment at $1.00 per share, it is possible to lose money by investing in a money market fund.
| 1. | The variable trust funds are generally available only through insurance company variable contracts. |
| † | In this report, the Wells Fargo Advantage Discovery FundSM, Wells Fargo Advantage Endeavor Select FundSM, Wells Fargo Advantage Enterprise FundSM, Wells Fargo Advantage Opportunity FundSM, Wells Fargo Advantage WealthBuilder Conservative Allocation PortfolioSM, Wells Fargo Advantage WealthBuilder Equity PortfolioSM, Wells Fargo Advantage WealthBuilder Growth Allocation PortfolioSM, Wells Fargo Advantage WealthBuilder Growth Balanced PortfolioSM, Wells Fargo Advantage WealthBuilder Moderate Balanced PortfolioSM, Wells Fargo Advantage WealthBuilder Tactical Equity PortfolioSM, Wells Fargo Advantage Dow Jones Target Today FundSM, Wells Fargo Advantage Dow Jones Target 2010 FundSM, Wells Fargo Advantage Dow Jones Target 2015 FundSM, Wells Fargo Advantage Dow Jones Target 2020 FundSM, Wells Fargo Advantage Dow Jones Target 2025 FundSM, Wells Fargo Advantage Dow Jones Target 2030 FundSM, Wells Fargo Advantage Dow Jones Target 2035 FundSM, Wells Fargo Advantage Dow Jones Target 2040 FundSM, Wells Fargo Advantage Dow Jones Target 2045 FundSM, Wells Fargo Advantage Dow Jones Target 2050 FundSM, Wells Fargo Advantage Dow Jones Target 2055 FundSM, Wells Fargo Advantage Heritage Money Market FundSM, Wells Fargo Advantage VT Discovery FundSM, and Wells Fargo Advantage VT Opportunity FundSM are referred to as the Discovery Fund, Endeavor Select Fund, Enterprise Fund, Opportunity Fund, WealthBuilder Conservative Allocation Portfolio, WealthBuilder Equity Portfolio, WealthBuilder Growth Allocation Portfolio, WealthBuilder Growth Balanced Portfolio, WealthBuilder Moderate Balanced Portfolio, WealthBuilder Tactical Equity Portfolio, Target Today Fund, Target 2010 Fund, Target 2015 Fund, Target 2020 Fund, Target 2025 Fund, Target 2030 Fund, Target 2035 Fund, Target 2040 Fund, Target 2045 Fund, Target 2050 Fund, Target 2055 Fund, Heritage Money Market Fund, VT Discovery Fund, and VT Opportunity Fund, respectively. |
Not part of the semi-annual report.
| | | | |
| 2 | | Wells Fargo Advantage Emerging Markets Equity Fund | | Letter to shareholders (unaudited) |

Karla M. Rabusch
President
Wells Fargo Advantage Funds
Investors were heartened by the resilient performance of the German economy and by the fact that the United Kingdom managed to avoid another recession.
Dear Valued Shareholder:
We are pleased to offer you this semi-annual report for the Wells Fargo Advantage Emerging Markets Equity Fund for the six-month period that ended April 30, 2013. Much of the period was marked by diminished worries of a sovereign debt default in Europe, partially offset by concerns about slowing economic growth in China. Continued monetary easing by global central banks helped support rallies in developed stock markets, but major emerging markets lagged.
Developed markets posted double-digit returns, but major emerging markets lagged.
Global developed equity markets demonstrated continued strength throughout the reporting period despite a budget fight and sequestration cuts in the U.S. and Europe’s seemingly never-ending debt crisis, with Cyprus becoming the newest addition to a list of countries mired in debt. Investors were heartened by the resilient performance of the German economy and by the fact that the United Kingdom managed to avoid another recession. Relatively positive economic data from the U.S. also aided sentiment for developed-market stocks. Although reported U.S. gross domestic product (GDP) growth came in at a moderate 0.4% annualized rate in the fourth quarter of 2012—in part, due to the temporary aftereffects from Hurricane Sandy, which devastated the Eastern Seaboard in October 2012—GDP growth improved to a 2.4% annualized rate for the first quarter of 2013. Monetary easing by major central banks also supported equity markets.
As judged by various MSCI indexes, major emerging markets generally underperformed. Despite China’s smooth transition to a new generation of political leadership, the country’s decelerating growth rate caused its stock market to lag not only developed markets but also the main MSCI Emerging Markets Index (Net)1. Given China’s importance as a buyer of raw commodities from countries such as Brazil, as well as its key role in Asia’s manufacturing chain, fears of a recession in China led to single-digit returns for other emerging markets.
Central banks continued to provide stimulus.
Major central banks, including the U.S. Federal Reserve Board (Fed) and the European Central Bank (ECB), continued to inject liquidity into the banks and the market through various quantitative easing policies. Throughout the reporting period, the Federal Open Market Committee (FOMC) kept its key interest rates effectively at zero in order to support the economy and the financial system. After its September 2012 meeting, the FOMC announced its intention to keep interest rates low until at least mid-2015 and to make open-ended purchases of $40 billion per month in mortgage-backed securities to support the housing market.
After cutting its key rate to 0.75% in July 2012, the ECB announced in September 2012 that it would purchase an unlimited amount of one- to three-year sovereign debt from countries that had formally applied for a bailout. In May 2013, after the end of the reporting period, the ECB cut its key rate to a historic low of 0.50%. The ECB’s aggressive actions helped ease investor worries about a eurozone sovereign debt default. Moreover, in mid-March 2013, the governor of the Bank of Japan resigned to allow Shinzo Abe, the recently reelected prime minister, to appoint a new bank governor who supported using aggressive monetary policies to attack Japan’s persistent deflation.
| | | | | | |
| Letter to shareholders (unaudited) | | Wells Fargo Advantage Emerging Markets Equity Fund | | | 3 | |
The debt crisis in the eurozone returned to center stage but with less impact than before.
Ongoing weakness in the Greek economy made it difficult for the country to meet previously agreed upon austerity targets. Because many eurozone banks owned Greek debt and many U.S. banks had financial ties to eurozone banks, investors initially worried that a Greek default would result in another global financial crisis. However, as central banks continued to provide liquidity, investor worries about the effect of a European sovereign debt default on the global economy began to ease. When the tiny eurozone nation of Cyprus was forced to implement capital controls and impose losses on uninsured bank depositors in March 2013, global stock markets remained resilient despite short-term volatility.
Global monetary easing helped push the MSCI EAFE Index (Net)2, an index of developed stock markets, to a 16.90% return for the six-month period. By comparison, the S&P 500 Index3, a barometer of large-cap U.S. stocks, posted a 14.42% return for the reporting period. Within emerging markets, smaller markets, such as the Philippines and Thailand, strongly outperformed the larger markets, such as China, India, and Brazil. The smaller markets are benefiting from high growth rates without some of the imbalances—such as an overreliance on real estate—that are affecting the larger emerging markets.
We employ a diverse array of investment strategies, even as many variables are at work in the market.
The full effect of the European credit crisis remains unknown. Elevated unemployment in the U.S. and Southern Europe continues to pressure consumers and businesses alike. As a whole, Wells Fargo Advantage Funds represents investments across a range of asset classes and investment styles, giving you an opportunity to create a diversified investment portfolio. While diversification4 may not prevent losses in a downturn, we believe it helps manage risk.
Thank you for choosing to invest with Wells Fargo Advantage Funds. We appreciate your confidence in us and remain committed to helping you meet your financial needs. For current information about your fund investments, contact your investment professional, visit our website at wellsfargoadvantagefunds.com, or call us directly at 1-800-222-8222. We are available 24 hours a day, 7 days a week.
Sincerely,

Karla M. Rabusch
President
Wells Fargo Advantage Funds
Within emerging markets, smaller markets, such as the Philippines and Thailand, strongly outperformed the larger markets, such as China, India, and Brazil.
| 1. | The Morgan Stanley Capital International Emerging Markets (MSCI Emerging Markets) Index (Net) is a free float-adjusted market capitalization index designed to measure the equity market performance in the global emerging markets. The index is currently composed of 21 emerging markets country indexes. You cannot invest directly in an index. Source: MSCI. MSCI makes no express or implied warranties or representations and shall have no liability whatsoever with respect to any MSCI data contained herein. The MSCI data may not be further redistributed or used as a basis for other indexes or any securities or financial products. This report is not approved, reviewed, or produced by MSCI. |
| 2. | The Morgan Stanley Capital International Europe, Australasia, and Far East (MSCI EAFE) Index (Net) is an unmanaged group of securities widely regarded by investors to be representations of the stock markets of Europe, Australasia, and the Far East. You cannot invest directly in an index. |
| 3. | The S&P 500 Index consists of 500 stocks chosen for market size, liquidity, and industry group representation. It is a market-value-weighted index with each stock’s weight in the index proportionate to its market value. You cannot invest directly in an index. |
| 4. | Diversification does not assure or guarantee better performance and cannot eliminate the risk of investment losses. |
| | | | |
| 4 | | Wells Fargo Advantage Emerging Markets Equity Fund | | Performance highlights (unaudited) |
Investment objective
The Fund seeks long-term capital appreciation.
Adviser
Wells Fargo Funds Management, LLC
Subadviser
Wells Capital Management Incorporated
Portfolio managers
Derrick Irwin, CFA
Yi (Jerry) Zhang, Ph.D, CFA
Average annual total returns1 (%) as of April 30, 2013
| | | | | | | | | | | | | | | | | | | | | | | | | | | | | | | | | | |
| | | | | Including sales charge | | | Excluding sales charge | | | Expense ratios2 (%) | |
| | Inception date | | 1 year | | | 5 year | | | 10 year | | | 1 year | | | 5 year | | | 10 year | | | Gross | | | Net3 | |
| Class A (EMGAX) | | 9-6-1994 | | | (1.65 | ) | | | 0.36 | | | | 16.94 | | | | 4.36 | | | | 1.56 | | | | 17.64 | | | | 1.69 | | | | 1.69 | |
| Class B (EMGBX)* | | 9-6-1994 | | | (1.38 | ) | | | 0.49 | | | | 17.05 | | | | 3.62 | | | | 0.82 | | | | 17.05 | | | | 2.44 | | | | 2.44 | |
| Class C (EMGCX) | | 9-6-1994 | | | 2.59 | | | | 0.81 | | | | 16.79 | | | | 3.59 | | | | 0.81 | | | | 16.79 | | | | 2.44 | | | | 2.44 | |
| Administrator Class (EMGYX) | | 9-6-1994 | | | – | | | | – | | | | – | | | | 4.57 | | | | 1.79 | | | | 17.93 | | | | 1.53 | | | | 1.52 | |
| Institutional Class (EMGNX) | | 7-30-2010 | | | – | | | | – | | | | – | | | | 4.82 | | | | 1.94 | | | | 18.02 | | | | 1.26 | | | | 1.26 | |
| MSCI Emerging Markets Index (Net)4 | | – | | | – | | | | – | | | | – | | | | 3.97 | | | | (0.33 | ) | | | 16.14 | | | | – | | | | – | |
| * | | Class B shares are closed to investment, except in connection with the reinvestment of any distributions and permitted exchanges. |
Figures quoted represent past performance, which is no guarantee of future results and do not reflect the deduction of taxes that a shareholder may pay on fund distributions or the redemption of fund shares. Investment return and principal value of an investment will fluctuate so that an investor’s shares, when redeemed, may be worth more or less than their original cost. Performance shown without sales charges would be lower if sales charges were reflected. Current performance may be lower or higher than the performance data quoted, which assumes the reinvestment of dividends and capital gains. Current month-end performance is available on the Fund’s website, wellsfargoadvantagefunds.com.
Index returns do not include transaction costs associated with buying and selling securities, any mutual fund fees or expenses, or any taxes. It is not possible to invest directly in an index.
For Class A shares, the maximum front-end sales charge is 5.75%. For Class B shares, the maximum contingent deferred sales charge is 5.00%. For Class C shares, the maximum contingent deferred sales charge is 1.00%. Performance including sales charge assumes the sales charge for the corresponding time period. Administrator Class and Institutional Class shares are sold without a front-end sales charge or contingent deferred sales charge.
Stock values fluctuate in response to the activities of individual companies and general market and economic conditions. Foreign investments are especially volatile and can rise or fall dramatically due to differences in the political and economic conditions of the host country. These risks are generally intensified in emerging markets. The use of derivatives may reduce returns and/or increase volatility. Certain investment strategies tend to increase the total risk of an investment (relative to the broader market). The Fund is exposed to regional risk and smaller-company securities risk. Consult the Fund’s prospectus for additional information on these and other risks.
Please see footnotes on page 5.
| | | | | | |
| Performance highlights (unaudited) | | Wells Fargo Advantage Emerging Markets Equity Fund | | | 5 | |
| | | | |
| Ten largest equity holdings5 (%) as of April 30, 2013 | |
Taiwan Semiconductor Manufacturing Company Limited | | | 4.66 | |
Samsung Electronics Company Limited | | | 4.55 | |
Banco Bradesco SA ADR | | | 2.77 | |
China Mobile Limited | | | 2.64 | |
SINA Corporation | | | 2.27 | |
Campanhia De Bebidas ADR | | | 2.12 | |
Petroleo Brasileiro SA ADR | | | 1.98 | |
Lojas Americanas SA | | | 1.97 | |
Grupo Televisa SAB ADR | | | 1.94 | |
Fomento Economico Mexicano SAB de CV ADR | | | 1.87 | |
| | |
| Sector distribution6 as of April 30, 2013 |
|
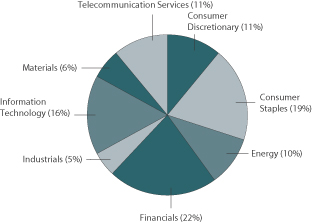
|
| 1. | Historical performance shown for the Institutional Class shares prior to their inception reflects the performance of the Administrator Class shares, and includes the higher expenses applicable to the Administrator Class shares. If these expenses had not been included, returns would be higher. Historical performance shown for all classes of the Fund prior to July 19, 2010, is based on the performance of the Fund’s predecessor, Evergreen Emerging Markets Growth Fund. |
| 2. | Reflects the expense ratios as stated in the most recent prospectuses. |
| 3. | The Adviser has committed through February 28, 2014, to waive fees and/or reimburse expenses to the extent necessary to cap the Fund’s Total Annual Fund Operating Expenses After Fee Waiver, excluding certain expenses, at 1.70% for Class A, 2.45% for Class B, 2.45% for Class C, 1.50% for Administrator Class, and 1.25% for Institutional Class. Brokerage commissions, stamp duty fees, interest, taxes, acquired fund fees and expenses, and extraordinary expenses are excluded from the cap. Without this cap, the Fund’s returns would have been lower. |
| 4. | The Morgan Stanley Capital International Emerging Markets (MSCI Emerging Markets) Index (Net) is a free float-adjusted market capitalization index designed to measure the equity market performance in the global emerging markets. The index is currently composed of 21 emerging markets country indexes. You cannot invest directly in an index. Source: MSCI. MSCI makes no express or implied warranties or representations and shall have no liability whatsoever with respect to any MSCI data contained herein. The MSCI data may not be further redistributed or used as a basis for other indexes or any securities or financial products. This report is not approved, reviewed, or produced by MSCI. |
| 5. | The ten largest equity holdings are calculated based on the value of the securities divided by total net assets of the Fund. Holdings are subject to change and may have changed since the date specified. Top holdings typically include the underlying ordinary shares combined with any depositary receipts. |
| 6. | Sector distribution is subject to change and is calculated based on the total long-term investments of the Fund. |
| | | | |
| 6 | | Wells Fargo Advantage Emerging Markets Equity Fund | | Fund expenses (unaudited) |
As a shareholder of the Fund, you incur two types of costs: (1) transaction costs, including sales charges (loads) on purchase payments and contingent deferred sales charges (if any) on redemptions and (2) ongoing costs, including management fees, distribution (12b-1) and/or shareholder service fees, and other Fund expenses. This example is intended to help you understand your ongoing costs (in dollars) of investing in the Fund and to compare these costs with the ongoing costs of investing in other mutual funds.
The example is based on an investment of $1,000 invested at the beginning of the six-month period and held for the entire period from November 1, 2012 to April 30, 2013.
Actual expenses
The “Actual” line of the table below provides information about actual account values and actual expenses. You may use the information in this line, together with the amount you invested, to estimate the expenses that you paid over the period. Simply divide your account value by $1,000 (for example, an $8,600 account value divided by $1,000 = 8.6), then multiply the result by the number in the “Actual” line under the heading entitled “Expenses paid during period” for your applicable class of shares to estimate the expenses you paid on your account during this period.
Hypothetical example for comparison purposes
The “Hypothetical” line of the table below provides information about hypothetical account values and hypothetical expenses based on the Fund’s actual expense ratio and an assumed rate of return of 5% per year before expenses, which is not the Fund’s actual return. The hypothetical account values and expenses may not be used to estimate the actual ending account balance or expenses you paid for the period. You may use this information to compare the ongoing costs of investing in the Fund and other funds. To do so, compare this 5% hypothetical example with the 5% hypothetical examples that appear in the shareholder reports of the other funds.
Please note that the expenses shown in the table are meant to highlight your ongoing costs only and do not reflect any transactional costs, such as sales charges (loads) and contingent deferred sales charges. Therefore, the “Hypothetical” line of the table is useful in comparing ongoing costs only and will not help you determine the relative total costs of owning different funds. In addition, if these transactional costs were included, your costs would have been higher.
| | | | | | | | | | | | | | | | |
| | | Beginning
account value 11-1-2012 | | | Ending
account value 4-30-2013 | | | Expenses
paid during
the period1 | | | Net annual
expense ratio | |
Class A | | | | | | | | | | | | | | | | |
Actual | | $ | 1,000.00 | | | $ | 1,058.86 | | | $ | 8.37 | | | | 1.64 | % |
Hypothetical (5% return before expenses) | | $ | 1,000.00 | | | $ | 1,016.66 | | | $ | 8.20 | | | | 1.64 | % |
Class B | | | | | | | | | | | | | | | | |
Actual | | $ | 1,000.00 | | | $ | 1,055.56 | | | $ | 12.18 | | | | 2.39 | % |
Hypothetical (5% return before expenses) | | $ | 1,000.00 | | | $ | 1,012.94 | | | $ | 11.93 | | | | 2.39 | % |
Class C | | | | | | | | | | | | | | | | |
Actual | | $ | 1,000.00 | | | $ | 1,055.40 | | | $ | 12.18 | | | | 2.39 | % |
Hypothetical (5% return before expenses) | | $ | 1,000.00 | | | $ | 1,012.94 | | | $ | 11.93 | | | | 2.39 | % |
Administrator Class | | | | | | | | | | | | | | | | |
Actual | | $ | 1,000.00 | | | $ | 1,060.30 | | | $ | 7.51 | | | | 1.47 | % |
Hypothetical (5% return before expenses) | | $ | 1,000.00 | | | $ | 1,017.50 | | | $ | 7.35 | | | | 1.47 | % |
Institutional Class | | | | | | | | | | | | | | | | |
Actual | | $ | 1,000.00 | | | $ | 1,061.33 | | | $ | 6.18 | | | | 1.21 | % |
Hypothetical (5% return before expenses) | | $ | 1,000.00 | | | $ | 1,018.79 | | | $ | 6.06 | | | | 1.21 | % |
| 1. | Expenses paid is equal to the annualized expense ratio of each class multiplied by the average account value over the period, multiplied by the number of days in the most recent fiscal half-year divided by the number of days in the fiscal year (to reflect the one-half-year period). |
| | | | | | |
| Portfolio of investments—April 30, 2013 (unaudited) | | Wells Fargo Advantage Emerging Markets Equity Fund | | | 7 | |
| | | | | | | | | | | | |
| Security name | | | | | | Shares | | | Value | |
| | | | | | | | | | | |
| | | | |
Common Stocks: 88.38% | | | | | | | | | | | | |
| | | | |
| Argentina: 0.24% | | | | | | | | | | | | |
Mercadolibre Incorporated (Information Technology, Internet Software & Services) « | | | | | | | 92,800 | | | $ | 9,334,752 | |
| | | | | | | | | | | | |
| | | | |
| Brazil: 13.26% | | | | | | | | | | | | |
All America Latina Logistica SA (Industrials, Road & Rail) | | | | | | | 7,746,970 | | | | 39,456,016 | |
B2W Companhia Global do Varejo (Consumer Discretionary, Internet & Catalog Retail) † | | | | | | | 1,555,290 | | | | 8,939,565 | |
Banco Bradesco SA ADR (Financials, Commercial Banks) « | | | | | | | 6,465,508 | | | | 107,262,778 | |
BM&FBOVESPA SA (Financials, Diversified Financial Services) | | | | | | | 4,036,300 | | | | 28,021,595 | |
BRF Brasil Foods SA ADR (Consumer Staples, Food Products) « | | | | | | | 816,278 | | | | 20,268,183 | |
Brookfield Incorporacoes SA (Financials, Real Estate Management & Development) | | | | | | | 4,603,572 | | | | 5,039,022 | |
CETIP SA (Financials, Capital Markets) | | | | | | | 3,303,137 | | | | 39,391,653 | |
Cia de Concessoes Rodoviarias (Industrials, Transportation Infrastructure) | | | | | | | 1,784,600 | | | | 17,643,078 | |
Companhia De Bebidas ADR (Consumer Staples, Beverages) « | | | | | | | 1,952,200 | | | | 82,031,444 | |
Lojas Renner SA (Consumer Discretionary, Multiline Retail) | | | | | | | 821,400 | | | | 31,304,136 | |
MRV Engenharia e Participacoes SA (Consumer Discretionary, Household Durables) | | | | | | | 2,193,800 | | | | 9,429,804 | |
Multiplan Empreendimentos IImobilianios SA (Financials, Real Estate Management & Development) | | | | | | | 351,300 | | | | 10,008,297 | |
Petroleo Brasileiro SA ADR (Energy, Oil, Gas & Consumable Fuels) « | | | | | | | 2,069,900 | | | | 39,638,585 | |
Petroleo Brasileiro SA ADR Class A (Energy, Oil, Gas & Consumable Fuels) « | | | | | | | 1,862,953 | | | | 37,203,171 | |
Raia Drogasil SA (Consumer Staples, Food & Staples Retailing) | | | | | | | 420,000 | | | | 4,523,804 | |
Tim Participacoes SA (Telecommunication Services, Wireless Telecommunication Services) | | | | | | | 2,150,963 | | | | 9,073,661 | |
Vale SA Depository Receipt (Materials, Metals & Mining) « | | | | | | | 1,441,636 | | | | 24,637,559 | |
| | | | |
| | | | | | | | | | | 513,872,351 | |
| | | | | | | | | | | | |
| | | | |
| Chile: 0.24% | | | | | | | | | | | | |
Banco Santander Chile ADR (Financials, Commercial Banks) « | | | | | | | 281,000 | | | | 7,485,840 | |
Inversiones La Construccion (Financials, Diversified Financial Services) | | | | | | | 100,000 | | | | 1,917,189 | |
| | | | |
| | | | | | | | | | | 9,403,029 | |
| | | | | | | | | | | | |
| | | | |
| China: 15.04% | | | | | | | | | | | | |
51job Incorporated ADR (Industrials, Professional Services) Ǡ | | | | | | | 573,191 | | | | 33,015,802 | |
Baidu.com Incorporated ADR (Information Technology, Internet Software & Services) † | | | | | | | 86,000 | | | | 7,383,100 | |
Bitauto Holdings Limited ADR (Information Technology, Internet Software & Services) † | | | | | | | 292,524 | | | | 3,325,998 | |
China Life Insurance Company Limited (Financials, Insurance) | | | | | | | 19,447,000 | | | | 53,127,375 | |
China Life Insurance Company Limited ADR (Financials, Insurance) | | | | | | | 257,486 | | | | 10,732,016 | |
China Mobile Limited (Telecommunication Services, Wireless Telecommunication Services) | | | | | | | 7,874,500 | | | | 86,201,784 | |
China Mobile Limited ADR (Telecommunication Services, Wireless Telecommunication Services) | | | | | | | 290,633 | | | | 16,054,567 | |
Ctrip.com International Limited ADR (Consumer Discretionary, Specialty Retail) Ǡ | | | | | | | 1,555,374 | | | | 34,187,121 | |
Dalian Port Company Limited (Industrials, Transportation Infrastructure) | | | | | | | 18,732,000 | | | | 4,103,580 | |
First Tractor Company (Industrials, Machinery) † | | | | | | | 7,532,000 | | | | 5,610,067 | |
Hengan International Group Company Limited (Consumer Staples, Personal Products) | | | | | | | 3,274,000 | | | | 33,836,305 | |
NetEase Incorporated ADR (Information Technology, Internet Software & Services) « | | | | | | | 201,800 | | | | 11,379,502 | |
New Oriental Education & Technology Group Incorporated (Consumer Discretionary, Diversified Consumer Services) « | | | | | | | 1,854,189 | | | | 35,470,636 | |
PetroChina Company Limited (Energy, Oil, Gas & Consumable Fuels) | | | | | | | 23,270,000 | | | | 29,596,709 | |
PetroChina Company Limited ADR (Energy, Oil, Gas & Consumable Fuels) | | | | | | | 26,100 | | | | 3,337,146 | |
Shandong Weigao Group Medical Polymer Company Limited Class H (Health Care, Health Care
Equipment & Supplies) | | | | | | | 4,300,000 | | | | 4,128,142 | |
Sichuan Expressway Company (Industrials, Transportation Infrastructure) | | | | | | | 22,984,000 | | | | 7,049,080 | |
SINA Corporation (Information Technology, Internet Software & Services) Ǡ | | | | | | | 1,562,917 | | | | 88,023,485 | |
Sinotrans Limited (Industrials, Air Freight & Logistics) | | | | | | | 32,149,000 | | | | 6,877,102 | |
The accompanying notes are an integral part of these financial statements.
| | | | |
| 8 | | Wells Fargo Advantage Emerging Markets Equity Fund | | Portfolio of investments—April 30, 2013 (unaudited) |
| | | | | | | | | | | | |
| Security name | | | | | | Shares | | | Value | |
| | | | | | | | | | | |
| | | | |
| China (continued) | | | | | | | | | | | | |
Sun Art Retail Group Limited (Consumer Staples, Food & Staples Retailing) | | | | | | | 13,627,000 | | | $ | 19,035,287 | |
Tingyi Holding Corporation (Consumer Staples, Food Products) | | | | | | | 12,336,000 | | | | 34,098,207 | |
Tsingtao Brewery Company Limited (Consumer Staples, Beverages) | | | | | | | 8,390,000 | | | | 56,274,621 | |
| | | | |
| | | | | | | | | | | 582,847,632 | |
| | | | | | | | | | | | |
| | | | |
| Colombia: 0.39% | | | | | | | | | | | | |
Bancolombia SA ADR (Financials, Commercial Banks) « | | | | | | | 223,900 | | | | 15,173,703 | |
| | | | | | | | | | | | |
| | | | |
| Hong Kong: 3.99% | | | | | | | | | | | | |
AIA Group Limited (Financials, Insurance) | | | | | | | 9,753,200 | | | | 43,297,841 | |
Belle International Holdings Limited (Consumer Discretionary, Specialty Retail) | | | | | | | 12,317,000 | | | | 20,094,099 | |
CNOOC Limited (Energy, Oil, Gas & Consumable Fuels) | | | | | | | 27,936,000 | | | | 52,126,992 | |
CNOOC Limited ADR (Energy, Oil, Gas & Consumable Fuels) | | | | | | | 52,100 | | | | 9,760,414 | |
Johnson Electric Holdings Limited (Industrials, Electrical Equipment) | | | | | | | 15,985,000 | | | | 10,896,780 | |
Li Ning Company Limited (Consumer Discretionary, Textiles, Apparel & Luxury Goods) Ǡ | | | | | | | 7,371,000 | | | | 4,065,370 | |
Shangri-La Asia Limited (Consumer Discretionary, Hotels, Restaurants & Leisure) | | | | | | | 3,033,500 | | | | 5,863,611 | |
Texwinca Holdings Limited (Consumer Discretionary, Textiles, Apparel & Luxury Goods) | | | | | | | 7,382,000 | | | | 8,618,509 | |
| | | | |
| | | | | | | | | | | 154,723,616 | |
| | | | | | | | | | | | |
| | | | |
| India: 7.25% | | | | | | | | | | | | |
Bharti Airtel Limited (Telecommunication Services, Wireless Telecommunication Services) | | | | | | | 4,838,728 | | | | 28,628,205 | |
Bharti Infratel Limited (Industrials, Construction & Engineering) † | | | | | | | 5,218,871 | | | | 17,223,485 | |
Hindustan Unilever Limited (Consumer Staples, Household Products) | | | | | | | 3,262,114 | | | | 35,348,903 | |
Housing Development Finance Corporation Limited (Financials, Diversified Financial Services) | | | | | | | 652,300 | | | | 10,262,450 | |
ICICI Bank Limited ADR (Financials, Commercial Banks) « | | | | | | | 1,478,355 | | | | 69,216,581 | |
Infosys Technologies Limited ADR (Information Technology, IT Services) « | | | | | | | 788,115 | | | | 32,895,920 | |
ITC Limited (Consumer Staples, Tobacco) | | | | | | | 3,907,540 | | | | 23,851,407 | |
Reliance Industries Limited (Energy, Oil, Gas & Consumable Fuels)144A | | | | | | | 1,246,587 | | | | 36,736,919 | |
Reliance Industries Limited (Energy, Oil, Gas & Consumable Fuels) | | | | | | | 1,147,500 | | | | 16,788,111 | |
Ultra Tech Cement Limited (Materials, Construction Materials) | | | | | | | 286,000 | | | | 10,090,823 | |
| | | | |
| | | | | | | | | | | 281,042,804 | |
| | | | | | | | | | | | |
| | | | |
| Indonesia: 1.20% | | | | | | | | | | | | |
PT Astra Agro Lestari Tbk (Consumer Staples, Food Products) | | | | | | | 2,659,000 | | | | 4,840,761 | |
PT Astra International Incorporated Tbk (Consumer Discretionary, Automobiles) | | | | | | | 13,535,000 | | | | 10,232,168 | |
PT Bank Central Asia Tbk (Financials, Commercial Banks) | | | | | | | 6,505,500 | | | | 7,193,019 | |
PT Matahari Department Store Tbk (Consumer Discretionary, Multiline Retail) † | | | | | | | 1,833,000 | | | | 2,281,234 | |
PT Telekomunik Indonesia Persoro Tbk (Telecommunication Services, Diversified Telecommunication Services) | | | | | | | 457,477 | | | | 21,899,424 | |
| | | | |
| | | | | | | | | | | 46,446,606 | |
| | | | | | | | | | | | |
| | | | |
| Israel: 0.53% | | | | | | | | | | | | |
Israel Chemicals Limited (Materials, Chemicals) | | | | | | | 1,719,600 | | | | 20,452,927 | |
| | | | | | | | | | | | |
| | | | |
| Malaysia: 1.73% | | | | | | | | | | | | |
Genting Bhd (Consumer Discretionary, Hotels, Restaurants & Leisure) | | | | | | | 7,052,700 | | | | 24,339,638 | |
KLCC Property Holdings Bhd (Real Estate, Real Estate Management & Development)(a) | | | | | | | 3,387,900 | | | | 8,073,057 | |
Resorts World Bhd (Consumer Discretionary, Hotels, Restaurants & Leisure) | | | | | | | 14,607,200 | | | | 18,051,955 | |
Sime Darby Bhd (Industrials, Industrial Conglomerates) | | | | | | | 5,272,137 | | | | 16,357,921 | |
| | | | |
| | | | | | | | | | | 66,822,571 | |
| | | | | | | | | | | | |
The accompanying notes are an integral part of these financial statements.
| | | | | | |
| Portfolio of investments—April 30, 2013 (unaudited) | | Wells Fargo Advantage Emerging Markets Equity Fund | | | 9 | |
| | | | | | | | | | | | |
| Security name | | | | | | Shares | | | Value | |
| | | | | | | | | | | |
| | | | |
| Mexico: 9.02% | | | | | | | | | | | | |
America Movil SAB de CV ADR (Telecommunication Services, Wireless Telecommunication Services) « | | | | | | | 2,422,420 | | | $ | 51,791,340 | |
Cemex SAB de CV ADR (Materials, Construction Materials) Ǡ | | | | | | | 2,897,890 | | | | 32,601,268 | |
Fibra Uno Administracion SAB de CV (Financials, REITs) | | | | | | | 6,285,559 | | | | 24,153,923 | |
Fomento Economico Mexicano SAB de CV ADR (Consumer Staples, Beverages) | | | | | | | 639,700 | | | | 72,535,583 | |
Grupo Financiero Banorte SAB de CV (Financials, Commercial Banks) | | | | | | | 5,814,926 | | | | 43,819,188 | |
Grupo Financiero Santander SAB de CV ADR (Financials, Commercial Banks) † | | | | | | | 1,130,741 | | | | 18,261,467 | |
Grupo Sanborns SA de CV (Consumer Discretionary, Multiline Retail) † | | | | | | | 3,645,753 | | | | 8,497,139 | |
Grupo Televisa SAB ADR (Consumer Discretionary, Media) | | | | | | | 2,965,000 | | | | 75,073,800 | |
Wal-Mart de Mexico SAB de CV (Consumer Staples, Food & Staples Retailing) | | | | | | | 7,110,500 | | | | 22,557,214 | |
| | | | |
| | | | | | | | | | | 349,290,922 | |
| | | | | | | | | | | | |
| | | | |
| Peru: 0.52% | | | | | | | | | | | | |
Compania de Minas Buenaventura SA ADR (Materials, Metals & Mining) « | | | | | | | 993,600 | | | | 19,891,872 | |
| | | | | | | | | | | | |
| | | | |
| Philippines: 0.72% | | | | | | | | | | | | |
Ayala Corporation (Financials, Diversified Financial Services) | | | | | | | 632,624 | | | | 9,852,089 | |
Metropolitan Bank & Trust Company (Financials, Commercial Banks) | | | | | | | 2,808,093 | | | | 8,493,867 | |
SM Investments Corporation (Industrials, Industrial Conglomerates) | | | | | | | 341,266 | | | | 9,493,430 | |
| | | | |
| | | | | | | | | | | 27,839,386 | |
| | | | | | | | | | | | |
| | | | |
| Russia: 4.35% | | | | | | | | | | | | |
Gazprom ADR (Energy, Oil, Gas & Consumable Fuels) | | | | | | | 839,130 | | | | 6,658,497 | |
Lukoil ADR (Energy, Oil, Gas & Consumable Fuels) | | | | | | | 763,849 | | | | 48,428,027 | |
Magnit (Consumer Staples, Food & Staples Retailing) (a) | | | | | | | 38,300 | | | | 8,165,716 | |
Mobile Telesystems ADR (Telecommunication Services, Wireless Telecommunication Services) « | | | | | | | 2,179,300 | | | | 45,111,510 | |
Sberbank of Russia (Financials, Commercial Banks) | | | | | | | 5,517,377 | | | | 17,517,672 | |
Sberbank of Russia Sponsored ADR (Financials, Commercial Banks) | | | | | | | 783,895 | | | | 10,080,890 | |
Yandex NV Class A (Information Technology, Internet Software & Services) † | | | | | | | 1,265,517 | | | | 32,574,408 | |
| | | | |
| | | | | | | | | | | 168,536,720 | |
| | | | | | | | | | | | |
| | | | |
| South Africa: 5.37% | | | | | | | | | | | | |
Anglo American Platinum Limited (Materials, Metals & Mining) Ǡ | | | | | | | 246,832 | | | | 9,363,029 | |
AngloGold Ashanti Limited ADR (Materials, Metals & Mining) « | | | | | | | 1,077,592 | | | | 21,013,044 | |
Clicks Group Limited (Consumer Staples, Food & Staples Retailing) | | | | | | | 450,000 | | | | 2,868,446 | |
Gold Fields Limited ADR (Materials, Metals & Mining) | | | | | | | 960,700 | | | | 7,166,822 | |
Impala Platinum Holdings Limited (Materials, Metals & Mining) | | | | | | | 1,290,758 | | | | 17,614,780 | |
MTN Group Limited (Telecommunication Services, Wireless Telecommunication Services) | | | | | | | 1,734,043 | | | | 31,262,437 | |
Sasol Limited (Energy, Oil, Gas & Consumable Fuels) | | | | | | | 470,000 | | | | 20,313,155 | |
Shoprite Holdings Limited (Consumer Staples, Food & Staples Retailing) | | | | | | | 1,341,500 | | | | 25,427,730 | |
Standard Bank Group Limited (Financials, Commercial Banks) | | | | | | | 1,839,990 | | | | 22,985,778 | |
Tiger Brands Limited (Consumer Staples, Food Products) | | | | | | | 1,611,133 | | | | 50,112,368 | |
| | | | |
| | | | | | | | | | | 208,127,589 | |
| | | | | | | | | | | | |
| | | | |
| South Korea: 10.10% | | | | | | | | | | | | |
Amorepacific Corporation (Consumer Staples, Personal Products) | | | | | | | 6,990 | | | | 5,712,340 | |
KB Financial Group Incorporated (Financials, Commercial Banks) | | | | | | | 330,000 | | | | 10,787,251 | |
KB Financial Group Incorporated ADR (Financials, Commercial Banks) | | | | | | | 93,117 | | | | 3,054,238 | |
KT Corporation ADR (Telecommunication Services, Diversified Telecommunication Services) | | | | | | | 3,859,813 | | | | 62,760,559 | |
KT&G Corporation (Consumer Staples, Tobacco) | | | | | | | 739,691 | | | | 53,262,051 | |
The accompanying notes are an integral part of these financial statements.
| | | | |
| 10 | | Wells Fargo Advantage Emerging Markets Equity Fund | | Portfolio of investments—April 30, 2013 (unaudited) |
| | | | | | | | | | | | |
| Security name | | | | | | Shares | | | Value | |
| | | | | | | | | | | |
| | | | |
| South Korea (continued) | | | | | | | | | | | | |
Lotte Chilsung Beverage Company Limited (Consumer Staples, Beverages) | | | | | | | 5,855 | | | $ | 9,138,968 | |
Lotte Confectionery Company Limited (Consumer Staples, Food & Staples Retailing) | | | | | | | 4,927 | | | | 8,589,703 | |
Samsung Electronics Company Limited (Information Technology, Semiconductors & Semiconductor Equipment) | | | | | | | 127,736 | | | | 176,299,573 | |
Samsung Life Insurance Company Limited (Financials, Insurance) | | | | | | | 442,137 | | | | 43,559,307 | |
Shinhan Financial Group Company Limited (Financials, Commercial Banks) | | | | | | | 525,945 | | | | 18,195,319 | |
| | | | |
| | | | | | | | | | | 391,359,309 | |
| | | | | | | | | | | | |
| | | | |
| Taiwan: 8.03% | | | | | | | | | | | | |
104 Corporation (Industrials, Commercial Services & Supplies) | | | | | | | 1,655,000 | | | | 4,626,508 | |
Far Eastern Textile Company Limited (Consumer Discretionary, Textiles, Apparel & Luxury Goods) | | | | | | | 26,613,491 | | | | 28,631,687 | |
First Financial Holding Company Limited (Financials, Commercial Banks) | | | | | | | 14,787,510 | | | | 9,094,379 | |
Fuhwa Financial Holdings Company Limited (Financials, Capital Markets) | | | | | | | 48,050,750 | | | | 24,422,650 | |
Mediatek Incorporated (Information Technology, Semiconductors & Semiconductor Equipment) | | | | | | | 1,023,881 | | | | 12,489,738 | |
President Chain Store Corporation (Consumer Staples, Food & Staples Retailing) | | | | | | | 2,418,000 | | | | 14,911,765 | |
Siliconware Precision Industries Company (Information Technology, Semiconductors & Semiconductor Equipment) | | | | | | | 8,213,000 | | | | 9,740,275 | |
Taiwan Semiconductor Manufacturing Company Limited (Information Technology, Semiconductors & Semiconductor Equipment) | | | | | | | 13,035,224 | | | | 48,365,310 | |
Taiwan Semiconductor Manufacturing Company Limited ADR (Information Technology, Semiconductors & Semiconductor Equipment) « | | | | | | | 6,919,052 | | | | 132,015,512 | |
Uni-President Enterprises Corporation (Consumer Staples, Food Products) | | | | | | | 13,689,000 | | | | 26,949,407 | |
| | | | |
| | | | | | | | | | | 311,247,231 | |
| | | | | | | | | | | | |
| | | | |
| Thailand: 3.92% | | | | | | | | | | | | |
Bangkok Bank PCL (Financials, Commercial Banks) | | | | | | | 3,729,800 | | | | 28,847,175 | |
PTT Exploration & Production PCL ADR (Energy, Oil, Gas & Consumable Fuels) | | | | | | | 4,378,739 | | | | 22,975,326 | |
PTT PCL (Energy, Oil, Gas & Consumable Fuels) | | | | | | | 2,820,600 | | | | 31,329,322 | |
Siam Commercial Bank PCL (Financials, Commercial Banks) | | | | | | | 5,543,000 | | | | 35,127,700 | |
Thai Beverage PCL (Consumer Staples, Beverages) | | | | | | | 68,328,000 | | | | 33,562,101 | |
| | | | |
| | | | | | | | | | | 151,841,624 | |
| | | | | | | | | | | | |
| | | | |
| Turkey: 1.33% | | | | | | | | | | | | |
Anadolu Efes Biracilik Ve Malt Sanayii AS (Consumer Staples, Beverages) | | | | | | | 1,999,953 | | | | 33,244,233 | |
Turkcell Iletisim Hizmetleri AS ADR (Telecommunication Services, Wireless Telecommunication Services) Ǡ | | | | | | | 1,181,462 | | | | 18,454,436 | |
| | | | |
| | | | | | | | | | | 51,698,669 | |
| | | | | | | | | | | | |
| | | | |
| United Kingdom: 1.15% | | | | | | | | | | | | |
African Barrick Gold Limited (Materials, Metals & Mining) | | | | | | | 1,428,500 | | | | 3,883,180 | |
Standard Chartered plc (Financials, Commercial Banks) | | | | | | | 1,620,902 | | | | 40,713,272 | |
| | | | |
| | | | | | | | | | | 44,596,452 | |
| | | | | | | | | | | | |
| | | | |
Total Common Stocks (Cost $3,040,373,292) | | | | | | | | | | | 3,424,549,765 | |
| | | | | | | | | | | | |
The accompanying notes are an integral part of these financial statements.
| | | | | | |
| Portfolio of investments—April 30, 2013 (unaudited) | | Wells Fargo Advantage Emerging Markets Equity Fund | | | 11 | |
| | | | | | | | | | | | | | | | |
| Security name | | Interest rate | | | Maturity date | | | Principal | | | Value | |
| | | | | | | | | | | | | |
| | | | |
Convertible Debentures: 0.00% | | | | | | | | | | | | | | | | |
| Brazil: 0.00% | | | | | | | | | | | | | | | | |
Lupatech SA (s)(a)(i) | | | 6.50 | % | | | 4-15-2018 | | | $ | 303,000 | | | $ | 7,148 | |
| | | | | | | | | | | | | | | | |
| | | | |
Total Convertible Debentures (Cost $160,691) | | | | | | | | | | | | | | | 7,148 | |
| | | | | | | | | | | | | | | | |
| | | | |
| | | Dividend yield | | | | | | Shares | | | | |
| | | | |
Preferred Stocks: 2.76% | | | | | | | | | | | | | | | | |
| Brazil: 2.71% | | | | | | | | | | | | | | | | |
Banco do Estado do Rio Grande do Sul SA (Financials, Commercial Banks) ± | | | 2.32 | | | | | | | | 1,023,000 | | | | 8,743,371 | |
Lojas Americanas SA (Consumer Discretionary, Multiline Retail) ± | | | 0.44 | | | | | | | | 8,687,103 | | | | 76,504,688 | |
Vale SA ADR (Materials, Metals & Mining) ± | | | 2.68 | | | | | | | | 1,203,500 | | | | 19,568,910 | |
| | | | |
| | | | | | | | | | | | | | | 104,816,969 | |
| | | | | | | | | | | | | | | | |
| Hong Kong: 0.05% | | | | | | | | | | | | | | | | |
Li Ning Company Limited (Consumer Discretionary, Textiles, Apparel & Luxury Goods) †(a) | | | 0.00 | | | | | | | | 3,535,500 | | | | 1,949,955 | |
| | | | | | | | | | | | | | | | |
| | | | |
Total Preferred Stocks (Cost $90,468,041) | | | | | | | | | | | | | | | 106,766,924 | |
| | | | | | | | | | | | | | | | |
| | | | |
| | | Yield | | | | | | | | | | |
| Short-Term Investments: 18.12% | | | | | | | | | | | | | | | | |
| Investment Companies: 18.12% | | | | | | | | | | | | | | | | |
Wells Fargo Advantage Cash Investment Money Market Fund,
Select Class (u)(l) | | | 0.13 | | | | | | | | 405,815,846 | | | | 405,815,846 | |
Wells Fargo Securities Lending Cash Investments, LLC (v)(r)(u)(l) | | | 0.18 | | | | | | | | 296,302,826 | | | | 296,302,826 | |
| | | | |
Total Short-Term Investments (Cost $702,118,672) | | | | | | | | | | | | | | | 702,118,672 | |
| | | | | | | | | | | | | | | | |
| | | | | | | | |
| Total investments in securities | | | | | | | | |
| (Cost $3,833,120,696) * | | | 109.26 | % | | | 4,233,442,509 | |
Other assets and liabilities, net | | | (9.26 | ) | | | (358,615,395 | ) |
| | | | | | | | |
Total net assets | | | 100.00 | % | | $ | 3,874,827,114 | |
| | | | | | | | |
| « | All or a portion of this security is on loan. |
| † | Non-income-earning security |
| 144A | Security that may be resold to “qualified institutional buyers” under Rule 144A or security offered pursuant to Section 4(2) of the Securities Act of 1933, as amended. |
| (a) | Security is fair valued by the Management Valuation Team, and in certain instances by the Board of Trustees, in accordance with procedures approved by the Board of Trustees. |
| (s) | Security is currently in default with regards to scheduled interest and/or principal payments. The Fund has stopped accruing interest on this security. |
| ± | Variable rate investment. The rate shown is the rate in effect at period end. |
| (l) | Investment in an affiliate |
| (v) | Security represents investment of cash collateral received from securities on loan. |
| (u) | Rate shown is the 7-day annualized yield at period end. |
| (r) | The investment company is exempt from registration under Section 3(c)(7) of the Investment Company Act of 1940, as amended. |
| * | Cost for federal income tax purposes is $3,840,245,279 and unrealized appreciation (depreciation) consists of: |
| | | | |
Gross unrealized appreciation | | $ | 601,122,166 | |
Gross unrealized depreciation | | | (207,924,936 | ) |
| | | | |
Net unrealized appreciation | | $ | 393,197,230 | |
The accompanying notes are an integral part of these financial statements.
| | | | |
| 12 | | Wells Fargo Advantage Emerging Markets Equity Fund | | Statement of assets and liabilities—April 30, 2013 (unaudited) |
| | | | |
| | |
| |
Assets | | | | |
Investments | | | | |
In unaffiliated securities (including securities on loan), at value (see cost below) | | $ | 3,531,323,837 | |
In affiliated securities, at value (see cost below) | | | 702,118,672 | |
| | | | |
Total investments, at value (see cost below) | | | 4,233,442,509 | |
Cash | | | 1,728,700 | |
Foreign currency, at value (see cost below) | | | 33,700,437 | |
Receivable for investments sold | | | 842,495 | |
Receivable for Fund shares sold | | | 18,475,161 | |
Receivable for dividends and interest | | | 7,624,159 | |
Receivable for securities lending income | | | 73,313 | |
Unrealized gains on forward foreign currency contracts | | | 63,117 | |
Prepaid expenses and other assets | | | 141,944 | |
| | | | |
Total assets | | | 4,296,091,835 | |
| | | | |
| |
Liabilities | | | | |
Payable for investments purchased | | | 115,075,741 | |
Payable for Fund shares redeemed | | | 5,598,816 | |
Payable upon receipt of securities loaned | | | 296,302,826 | |
Advisory fee payable | | | 2,914,269 | |
Distribution fees payable | | | 118,145 | |
Due to other related parties | | | 581,889 | |
Accrued expenses and other liabilities | | | 673,035 | |
| | | | |
Total liabilities | | | 421,264,721 | |
| | | | |
Total net assets | | $ | 3,874,827,114 | |
| | | | |
| |
NET ASSETS CONSIST OF | | | | |
Paid-in capital | | $ | 3,533,892,150 | |
Overdistributed net investment income | | | (3,526,816 | ) |
Accumulated net realized losses on investments | | | (55,608,646 | ) |
Net unrealized gains on investments | | | 400,070,426 | |
| | | | |
Total net assets | | $ | 3,874,827,114 | |
| | | | |
| |
COMPUTATION OF NET ASSET VALUE AND OFFERING PRICE PER SHARE1 | | | | |
Net assets – Class A | | $ | 1,166,354,078 | |
Shares outstanding – Class A | | | 53,939,094 | |
Net asset value per share – Class A | | | $21.62 | |
Maximum offering price per share – Class A2 | | | $22.94 | |
Net assets – Class B | | $ | 13,393,423 | |
Shares outstanding – Class B | | | 719,413 | |
Net asset value per share – Class B | | | $18.62 | |
Net assets – Class C | | $ | 181,903,093 | |
Shares outstanding – Class C | | | 9,845,600 | |
Net asset value per share – Class C | | | $18.48 | |
Net assets – Administrator Class | | $ | 911,996,978 | |
Shares outstanding – Administrator Class | | | 40,320,362 | |
Net asset value per share – Administrator Class | | | $22.62 | |
Net assets – Institutional Class | | $ | 1,601,179,542 | |
Shares outstanding – Institutional Class | | | 70,658,816 | |
Net asset value per share – Institutional Class | | | $22.66 | |
| |
Investments in unaffiliated securities (including securities on loan), at cost | | $ | 3,131,002,024 | |
| | | | |
Investments in affiliated securities, at cost | | $ | 702,118,672 | |
| | | | |
Total investments, at cost | | $ | 3,833,120,696 | |
| | | | |
Securities on loan, at value | | $ | 288,583,238 | |
| | | | |
Foreign currency, at cost | | $ | 33,896,534 | |
| | | | |
| 1. | The Fund has an unlimited number of authorized shares. |
| 2. | Maximum offering price is computed as 100/94.25 of net asset value. On investments of $50,000 or more, the offering price is reduced. |
The accompanying notes are an integral part of these financial statements.
| | | | | | |
| Statement of operations—six months ended April 30, 2013 (unaudited) | | Wells Fargo Advantage Emerging Markets Equity Fund | | | 13 | |
| | | | |
| | | | |
| |
Investment income | | | | |
Dividends * | | $ | 24,993,122 | |
Securities lending income, net | | | 448,885 | |
Income from affiliated securities | | | 198,123 | |
| | | | |
Total investment income | | | 25,640,130 | |
| | | | |
| |
Expenses | | | | |
Advisory fee | | | 16,631,307 | |
Administration fees | | | | |
Fund level | | | 821,100 | |
Class A | | | 1,406,272 | |
Class B | | | 18,876 | |
Class C | | | 237,326 | |
Administrator Class | | | 320,474 | |
Institutional Class | | | 545,850 | |
Shareholder servicing fees | | | | |
Class A | | | 1,352,185 | |
Class B | | | 17,948 | |
Class C | | | 228,198 | |
Administrator Class | | | 765,812 | |
Distribution fees | | | | |
Class B | | | 54,450 | |
Class C | | | 684,593 | |
Custody and accounting fees | | | 827,719 | |
Professional fees | | | 25,145 | |
Registration fees | | | 59,285 | |
Shareholder report expenses | | | 204,491 | |
Trustees’ fees and expenses | | | 8,174 | |
Other fees and expenses | | | 24,744 | |
| | | | |
Total expenses | | | 24,233,949 | |
| | | | |
Net investment income | | | 1,406,181 | |
| | | | |
| |
REALIZED AND UNREALIZED GAINS (LOSSES) ON INVESTMENTS | | | | |
| |
Net realized gains (losses) on: | | | | |
Unaffiliated securities | | | (17,196,891 | ) |
Forward foreign currency contract transactions | | | (7,899 | ) |
| | | | |
Net realized losses on investments | | | (17,204,790 | ) |
| | | | |
| |
Net change in unrealized gains (losses) on: | | | | |
Unaffiliated securities | | | 211,240,466 | |
Forward foreign currency contract transactions | | | 63,117 | |
| | | | |
Net change in unrealized gains (losses) on investments | | | 211,303,583 | |
| | | | |
Net realized and unrealized gains (losses) on investments | | | 194,098,793 | |
| | | | |
Net increase in net assets resulting from operations | | $ | 195,504,974 | |
| | | | |
| |
* Net of foreign dividend withholding taxes in the amount of | | | $3,349,406 | |
The accompanying notes are an integral part of these financial statements.
| | | | |
| 14 | | Wells Fargo Advantage Emerging Markets Equity Fund | | Statement of changes in net assets |
| | | | | | | | | | | | | | | | |
| | | Six months ended April 30, 2013 (unaudited) | | | Year ended October 31, 2012 | |
| | | | |
Operations | | | | | | | | | | | | | | | | |
Net investment income | | | | | | $ | 1,406,181 | | | | | | | $ | 17,499,285 | |
Net realized losses on investments | | | | | | | (17,204,790 | ) | | | | | | | (7,304,463 | ) |
Net change in unrealized gains (losses) on investments | | | | | | | 211,303,583 | | | | | | | | (1,924,517 | ) |
| | | | | | | | | | | | | | | | |
Net increase in net assets resulting from operations | | | | | | | 195,504,974 | | | | | | | | 8,270,305 | |
| | | | | | | | | | | | | | | | |
| | | | |
Distributions to shareholders from | | | | | | | | | | | | | | | | |
Net investment income | | | | | | | | | | | | | | | | |
Class A | | | | | | | (3,231,840 | ) | | | | | | | (6,574,355 | ) |
Administrator Class | | | | | | | (2,897,616 | ) | | | | | | | (4,991,113 | ) |
Institutional Class | | | | | | | (8,737,710 | ) | | | | | | | (6,431,045 | ) |
Net realized gains | | | | | | | | | | | | | | | | |
Class A | | | | | | | 0 | | | | | | | | (10,038,509 | ) |
Class B | | | | | | | 0 | | | | | | | | (255,759 | ) |
Class C | | | | | | | 0 | | | | | | | | (2,467,330 | ) |
Administrator Class | | | | | | | 0 | | | | | | | | (5,617,738 | ) |
Institutional Class | | | | | | | 0 | | | | | | | | (5,818,637 | ) |
| | | | | | | | | | | | | | | | |
Total distributions to shareholders | | | | | | | (14,867,166 | ) | | | | | | | (42,194,486 | ) |
| | | | | | | | | | | | | | | | |
| | | | |
| | | Shares | | | | | | | | Shares | | | | | |
Capital share transactions | | | | | | | | | | | | | | | | |
Proceeds from shares sold | | | | | | | | | | | | | | | | |
Class A | | | 16,666,308 | | | | 349,487,865 | | | | 17,900,209 | | | | 362,700,130 | |
Class B | | | 8,773 | | | | 162,271 | | | | 13,629 | | | | 240,600 | |
Class C | | | 1,106,723 | | | | 20,336,909 | | | | 1,930,039 | | | | 33,805,473 | |
Administrator Class | | | 18,679,000 | | | | 413,898,067 | | | | 20,310,120 | | | | 432,680,866 | |
Institutional Class | | | 25,162,855 | | | | 561,935,152 | | | | 41,870,877 | | | | 888,749,204 | |
| | | | | | | | | | | | | | | | |
| | | | | | | 1,345,820,264 | | | | | | | | 1,718,176,273 | |
| | | | | | | | | | | | | | | | |
Reinvestment of distributions | | | | | | | | | | | | | | | | |
Class A | | | 146,282 | | | | 3,088,018 | | | | 795,372 | | | | 15,535,892 | |
Class B | | | 0 | | | | 0 | | | | 12,679 | | | | 217,829 | |
Class C | | | 0 | | | | 0 | | | | 103,977 | | | | 1,772,806 | |
Administrator Class | | | 114,076 | | | | 2,516,527 | | | | 454,670 | | | | 9,252,268 | |
Institutional Class | | | 319,622 | | | | 7,057,247 | | | | 415,654 | | | | 8,450,500 | |
| | | | | | | | | | | | | | | | |
| | | | | | | 12,661,792 | | | | | | | | 35,229,295 | |
| | | | | | | | | | | | | | | | |
Payment for shares redeemed | | | | | | | | | | | | | | | | |
Class A | | | (7,830,309 | ) | | | (166,896,625 | ) | | | (17,590,030 | ) | | | (357,030,080 | ) |
Class B | | | (162,628 | ) | | | (2,980,078 | ) | | | (351,930 | ) | | | (6,181,513 | ) |
Class C | | | (1,738,867 | ) | | | (31,600,122 | ) | | | (2,758,512 | ) | | | (47,493,153 | ) |
Administrator Class | | | (8,070,253 | ) | | | (179,803,218 | ) | | | (15,327,870 | ) | | | (329,325,671 | ) |
Institutional Class | | | (9,544,307 | ) | | | (213,596,344 | ) | | | (12,229,468 | ) | | | (259,675,007 | ) |
| | | | | | | | | | | | | | | | |
| | | | | | | (594,876,387 | ) | | | | | | | (999,705,424 | ) |
| | | | | | | | | | | | | | | | |
Net increase in net assets resulting from capital share transactions | | | | | | | 763,605,669 | | | | | | | | 753,700,144 | |
| | | | | | | | | | | | | | | | |
Total increase in net assets | | | | | | | 944,243,477 | | | | | | | | 719,775,963 | |
| | | | | | | | | | | | | | | | |
| | | | |
Net assets | | | | | | | | | | | | | | | | |
Beginning of period | | | | | | | 2,930,583,637 | | | | | | | | 2,210,807,674 | |
| | | | | | | | | | | | | | | | |
End of period | | | | | | $ | 3,874,827,114 | | | | | | | $ | 2,930,583,637 | |
| | | | | | | | | | | | | | | | |
Undistributed (overdistributed) net investment
income | | | | | | $ | (3,526,816 | ) | | | | | | $ | 9,934,169 | |
| | | | | | | | | | | | | | | | |
The accompanying notes are an integral part of these financial statements.
| | | | | | |
| Financial highlights | | Wells Fargo Advantage Emerging Markets Equity Fund | | | 15 | |
(For a share outstanding throughout each period)
| | | | | | | | | | | | | | | | | | | | | | | | |
| | | Six months ended
April 30, 2013 (unaudited) | | | Year ended October 31 | |
| CLASS A | | | 2012 | | | 2011 | | | 20101 | | | 20091 | | | 20081 | |
Net asset value, beginning of period | | $ | 20.48 | | | $ | 20.93 | | | $ | 21.65 | | | $ | 16.99 | | | $ | 12.90 | | | $ | 30.53 | |
Net investment income (loss) | | | (0.02 | ) | | | 0.10 | | | | 0.08 | | | | 0.04 | 2 | | | 0.04 | 2 | | | 0.16 | |
Net realized and unrealized gains (losses) on investments | | | 1.22 | | | | (0.19 | ) | | | (0.80 | ) | | | 4.63 | | | | 5.98 | | | | (14.22 | ) |
| | | | | | | | | | | | | | | | | | | | | | | | |
Total from investment operations | | | 1.20 | | | | (0.09 | ) | | | (0.72 | ) | | | 4.67 | | | | 6.02 | | | | (14.06 | ) |
Distributions to shareholders from | | | | | | | | | | | | | | | | | | | | | | | | |
Net investment income | | | (0.06 | ) | | | (0.14 | ) | | | (0.00 | )3 | | | (0.01 | ) | | | (0.12 | ) | | | (0.15 | ) |
Net realized gains | | | 0.00 | | | | (0.22 | ) | | | 0.00 | | | | 0.00 | | | | (1.81 | ) | | | (3.42 | ) |
| | | | | | | | | | | | | | | | | | | | | | | | |
Total distributions to shareholders | | | (0.06 | ) | | | (0.36 | ) | | | (0.00 | )3 | | | (0.01 | ) | | | (1.93 | ) | | | (3.57 | ) |
Net asset value, end of period | | $ | 21.62 | | | $ | 20.48 | | | $ | 20.93 | | | $ | 21.65 | | | $ | 16.99 | | | $ | 12.90 | |
Total return4 | | | 5.89 | % | | | (0.31 | )% | | | (3.32 | )% | | | 27.51 | % | | | 57.88 | % | | | (51.64 | )% |
Ratios to average net assets (annualized) | | | | | | | | | | | | | | | | | | | | | | | | |
Gross expenses | | | 1.64 | % | | | 1.67 | % | | | 1.68 | % | | | 1.91 | % | | | 2.04 | % | | | 1.88 | % |
Net expenses | | | 1.64 | % | | | 1.67 | % | | | 1.68 | % | | | 1.89 | % | | | 2.03 | % | | | 1.84 | % |
Net investment income (loss) | | | (0.10 | )% | | | 0.51 | % | | | 0.44 | % | | | 0.27 | % | | | 0.29 | % | | | 0.69 | % |
Supplemental data | | | | | | | | | | | | | | | | | | | | | | | | |
Portfolio turnover rate | | | 9 | % | | | 7 | % | | | 5 | % | | | 6 | % | | | 23 | % | | | 39 | % |
Net assets, end of period (000s omitted) | | | $1,166,354 | | | | $920,709 | | | | $917,633 | | | | $820,716 | | | | $357,354 | | | | $128,714 | |
| 1. | After the close of business on July 16, 2010, the Fund acquired the net assets of Evergreen Emerging Markets Growth Fund and Wells Fargo Advantage Emerging Markets Equity Fund. Evergreen Emerging Markets Growth Fund became the accounting and performance survivor in the transaction. The information for the periods prior to July 19, 2010 is that of Class A of Evergreen Emerging Markets Growth Fund. |
| 2. | Calculated based upon average shares outstanding |
| 3. | Amount is less than $0.005. |
| 4. | Total return calculations do not include any sales charges. Returns for periods of less than one year are not annualized. |
The accompanying notes are an integral part of these financial statements.
| | | | |
| 16 | | Wells Fargo Advantage Emerging Markets Equity Fund | | Financial highlights |
(For a share outstanding throughout each period)
| | | | | | | | | | | | | | | | | | | | | | | | |
| | | Six months ended
April 30, 2013 (unaudited) | | | Year ended October 31 | |
| CLASS B | | | 2012 | | | 2011 | | | 20101 | | | 20091 | | | 20081 | |
Net asset value, beginning of period | | $ | 17.64 | | | $ | 18.06 | | | $ | 18.82 | | | $ | 14.87 | | | $ | 11.51 | | | $ | 27.69 | |
Net investment loss | | | (0.08 | )2 | | | (0.05 | )2 | | | (0.08 | )2 | | | (0.09 | )2 | | | (0.03 | ) | | | (0.01 | ) |
Net realized and unrealized gains (losses) on investments | | | 1.06 | | | | (0.15 | ) | | | (0.68 | ) | | | 4.04 | | | | 5.20 | | | | (12.74 | ) |
| | | | | | | | | | | | | | | | | | | | | | | | |
Total from investment operations | | | 0.98 | | | | (0.20 | ) | | | (0.76 | ) | | | 3.95 | | | | 5.17 | | | | (12.75 | ) |
Distributions to shareholders from | | | | | | | | | | | | | | | | | | | | | | | | |
Net investment income | | | 0.00 | | | | 0.00 | | | | 0.00 | | | | 0.00 | | | | 0.00 | | | | (0.01 | ) |
Net realized gains | | | 0.00 | | | | (0.22 | ) | | | 0.00 | | | | 0.00 | | | | (1.81 | ) | | | (3.42 | ) |
| | | | | | | | | | | | | | | | | | | | | | | | |
Total distributions to shareholders | | | 0.00 | | | | (0.22 | ) | | | 0.00 | | | | 0.00 | | | | (1.81 | ) | | | (3.43 | ) |
Net asset value, end of period | | $ | 18.62 | | | $ | 17.64 | | | $ | 18.06 | | | $ | 18.82 | | | $ | 14.87 | | | $ | 11.51 | |
Total return3 | | | 5.56 | % | | | (1.06 | )% | | | (4.04 | )% | | | 26.56 | % | | | 56.75 | % | | | (51.99 | )% |
Ratios to average net assets (annualized) | | | | | | | | | | | | | | | | | | | | | | | | |
Gross expenses | | | 2.39 | % | | | 2.41 | % | | | 2.43 | % | | | 2.66 | % | | | 2.80 | % | | | 2.61 | % |
Net expenses | | | 2.39 | % | | | 2.41 | % | | | 2.43 | % | | | 2.64 | % | | | 2.79 | % | | | 2.59 | % |
Net investment loss | | | (0.92 | )% | | | (0.28 | )% | | | (0.39 | )% | | | (0.54 | )% | | | (0.43 | )% | | | (0.08 | )% |
Supplemental data | | | | | | | | | | | | | | | | | | | | | | | | |
Portfolio turnover rate | | | 9 | % | | | 7 | % | | | 5 | % | | | 6 | % | | | 23 | % | | | 39 | % |
Net assets, end of period (000s omitted) | | | $13,393 | | | | $15,408 | | | | $21,652 | | | | $30,989 | | | | $25,499 | | | | $17,949 | |
| 1. | After the close of business on July 16, 2010, the Fund acquired the net assets of Evergreen Emerging Markets Growth Fund and Wells Fargo Advantage Emerging Markets Equity Fund. Evergreen Emerging Markets Growth Fund became the accounting and performance survivor in the transaction. The information for the periods prior to July 19, 2010 is that of Class B of Evergreen Emerging Markets Growth Fund. |
| 2. | Calculated based upon average shares outstanding |
| 3. | Total return calculations do not include any sales charges. Returns for periods of less than one year are not annualized. |
The accompanying notes are an integral part of these financial statements.
| | | | | | |
| Financial highlights | | Wells Fargo Advantage Emerging Markets Equity Fund | | | 17 | |
(For a share outstanding throughout each period)
| | | | | | | | | | | | | | | | | | | | | | | | |
| | | Six months ended
April 30, 2013 (unaudited) | | | Year ended October 31 | |
| CLASS C | | | 2012 | | | 2011 | | | 20101 | | | 20091 | | | 20081 | |
Net asset value, beginning of period | | $ | 17.51 | | | $ | 17.92 | | | $ | 18.68 | | | $ | 14.77 | | | $ | 11.44 | | | $ | 27.57 | |
Net investment loss | | | (0.08 | )2 | | | (0.06 | ) | | | (0.06 | )2 | | | (0.08 | )2 | | | (0.05 | ) | | | (0.02 | ) |
Net realized and unrealized gains (losses) on investments | | | 1.05 | | | | (0.13 | ) | | | (0.70 | ) | | | 3.99 | | | | 5.19 | | | | (12.66 | ) |
| | | | | | | | | | | | | | | | | | | | | | | | |
Total from investment operations | | | 0.97 | | | | (0.19 | ) | | | (0.76 | ) | | | 3.91 | | | | 5.14 | | | | (12.68 | ) |
Distributions to shareholders from | | | | | | | | | | | | | | | | | | | | | | | | |
Net investment income | | | 0.00 | | | | 0.00 | | | | 0.00 | | | | 0.00 | | | | 0.00 | | | | (0.03 | ) |
Net realized gains | | | 0.00 | | | | (0.22 | ) | | | 0.00 | | | | 0.00 | | | | (1.81 | ) | | | (3.42 | ) |
| | | | | | | | | | | | | | | | | | | | | | | | |
Total distributions to shareholders | | | 0.00 | | | | (0.22 | ) | | | 0.00 | | | | 0.00 | | | | (1.81 | ) | | | (3.45 | ) |
Net asset value, end of period | | $ | 18.48 | | | $ | 17.51 | | | $ | 17.92 | | | $ | 18.68 | | | $ | 14.77 | | | $ | 11.44 | |
Total return3 | | | 5.54 | % | | | (1.01 | )% | | | (4.07 | )% | | | 26.47 | % | | | 56.84 | % | | | (52.01 | )% |
Ratios to average net assets (annualized) | | | | | | | | | | | | | | | | | | | | | | | | |
Gross expenses | | | 2.39 | % | | | 2.42 | % | | | 2.43 | % | | | 2.66 | % | | | 2.79 | % | | | 2.61 | % |
Net expenses | | | 2.39 | % | | | 2.42 | % | | | 2.43 | % | | | 2.64 | % | | | 2.78 | % | | | 2.59 | % |
Net investment loss | | | (0.88 | )% | | | (0.24 | )% | | | (0.32 | )% | | | (0.50 | )% | | | (0.46 | )% | | | (0.07 | )% |
Supplemental data | | | | | | | | | | | | | | | | | | | | | | | | |
Portfolio turnover rate | | | 9 | % | | | 7 | % | | | 5 | % | | | 6 | % | | | 23 | % | | | 39 | % |
Net assets, end of period (000s omitted) | | | $181,903 | | | | $183,471 | | | | $200,796 | | | | $193,300 | | | | $121,216 | | | | $56,839 | |
| 1. | After the close of business on July 16, 2010, the Fund acquired the net assets of Evergreen Emerging Markets Growth Fund and Wells Fargo Advantage Emerging Markets Equity Fund. Evergreen Emerging Markets Growth Fund became the accounting and performance survivor in the transaction. The information for the periods prior to July 19, 2010 is that of Class C of Evergreen Emerging Markets Growth Fund. |
| 2. | Calculated based upon average shares outstanding |
| 3. | Total return calculations do not include any sales charges. Returns for periods of less than one year are not annualized. |
The accompanying notes are an integral part of these financial statements.
| | | | |
| 18 | | Wells Fargo Advantage Emerging Markets Equity Fund | | Financial highlights |
(For a share outstanding throughout each period)
| | | | | | | | | | | | | | | | | | | | | | | | |
| | | Six months ended
April 30, 2013 (unaudited) | | | Year ended October 31 | |
| ADMINISTRATOR CLASS | | | 2012 | | | 2011 | | | 20101 | | | 20091 | | | 20081 | |
Net asset value, beginning of period | | $ | 21.44 | | | $ | 21.90 | | | $ | 22.63 | | | $ | 17.75 | | | $ | 13.42 | | | $ | 31.59 | |
Net investment income | | | 0.00 | 2 | | | 0.14 | | | | 0.02 | | | | 0.09 | 3 | | | 0.08 | | | | 0.22 | |
Net realized and unrealized gains (losses) on investments | | | 1.28 | | | | (0.18 | ) | | | (0.73 | ) | | | 4.83 | | | | 6.25 | | | | (14.77 | ) |
| | | | | | | | | | | | | | | | | | | | | | | | |
Total from investment operations | | | 1.28 | | | | (0.04 | ) | | | (0.71 | ) | | | 4.92 | | | | 6.33 | | | | (14.55 | ) |
Distributions to shareholders from | | | | | | | | | | | | | | | | | | | | | | | | |
Net investment income | | | (0.10 | ) | | | (0.20 | ) | | | (0.02 | ) | | | (0.04 | ) | | | (0.19 | ) | | | (0.20 | ) |
Net realized gains | | | 0.00 | | | | (0.22 | ) | | | 0.00 | | | | 0.00 | | | | (1.81 | ) | | | (3.42 | ) |
| | | | | | | | | | | | | | | | | | | | | | | | |
Total distributions to shareholders | | | (0.10 | ) | | | (0.42 | ) | | | (0.02 | ) | | | (0.04 | ) | | | (2.00 | ) | | | (3.62 | ) |
Net asset value, end of period | | $ | 22.62 | | | $ | 21.44 | | | $ | 21.90 | | | $ | 22.63 | | | $ | 17.75 | | | $ | 13.42 | |
Total return4 | | | 6.03 | % | | | (0.13 | )% | | | (3.14 | )% | | | 27.78 | % | | | 58.34 | % | | | (51.51 | )% |
Ratios to average net assets (annualized) | | | | | | | | | | | | | | | | | | | | | | | | |
Gross expenses | | | 1.47 | % | | | 1.47 | % | | | 1.47 | % | | | 1.69 | % | | | 1.80 | % | | | 1.61 | % |
Net expenses | | | 1.47 | % | | | 1.47 | % | | | 1.47 | % | | | 1.65 | % | | | 1.79 | % | | | 1.59 | % |
Net investment income | | | 0.08 | % | | | 0.72 | % | | | 0.70 | % | | | 0.50 | % | | | 0.54 | % | | | 0.89 | % |
Supplemental data | | | | | | | | | | | | | | | | | | | | | | | | |
Portfolio turnover rate | | | 9 | % | | | 7 | % | | | 5 | % | | | 6 | % | | | 23 | % | | | 39 | % |
Net assets, end of period (000s omitted) | | | $911,997 | | | | $634,428 | | | | $529,083 | | | | $248,493 | | | | $178,856 | | | | $141,996 | |
| 1. | After the close of business on July 16, 2010, the Fund acquired the net assets of Evergreen Emerging Markets Growth Fund and Wells Fargo Advantage Emerging Markets Equity Fund. Evergreen Emerging Markets Growth Fund became the accounting and performance survivor in the transaction. The information for the periods prior to July 19, 2010 is that of Class I of Evergreen Emerging Markets Growth Fund. |
| 2. | Amount is less than $0.005. |
| 3. | Calculated based upon average shares outstanding |
| 4. | Returns for periods of less than one year are not annualized. |
The accompanying notes are an integral part of these financial statements.
| | | | | | |
| Financial highlights | | Wells Fargo Advantage Emerging Markets Equity Fund | | | 19 | |
(For a share outstanding throughout each period)
| | | | | | | | | | | | | | | | |
| | | Six months ended
April 30, 2013 (unaudited) | | | Year ended October 31 | |
| INSTITUTIONAL CLASS | | | 2012 | | | 2011 | | | 20101 | |
Net asset value, beginning of period | | $ | 21.50 | | | $ | 21.96 | | | $ | 22.66 | | | $ | 20.11 | |
Net investment income | | | 0.04 | 2 | | | 0.22 | | | | 0.16 | | | | 0.00 | 2,3 |
Net realized and unrealized gains (losses) on investments | | | 1.27 | | | | (0.22 | ) | | | (0.81 | ) | | | 2.55 | |
| | | | | | | | | | | | | | | | |
Total from investment operations | | | 1.31 | | | | 0.00 | | | | (0.65 | ) | | | 2.55 | |
Distributions to shareholders from | | | | | | | | | | | | | | | | |
Net investment income | | | (0.15 | ) | | | (0.24 | ) | | | (0.05 | ) | | | 0.00 | |
Net realized gains | | | 0.00 | | | | (0.22 | ) | | | 0.00 | | | | 0.00 | |
| | | | | | | | | | | | | | | | |
Total distributions to shareholders | | | (0.15 | ) | | | (0.46 | ) | | | (0.05 | ) | | | 0.00 | |
Net asset value, end of period | | $ | 22.66 | | | $ | 21.50 | | | $ | 21.96 | | | $ | 22.66 | |
Total return4 | | | 6.13 | % | | | 0.13 | % | | | (2.89 | )% | | | 12.68 | % |
Ratios to average net assets (annualized) | | | | | | | | | | | | | | | | |
Gross expenses | | | 1.21 | % | | | 1.24 | % | | | 1.24 | % | | | 1.48 | % |
Net expenses | | | 1.21 | % | | | 1.24 | % | | | 1.23 | % | | | 1.30 | % |
Net investment income | | | 0.38 | % | | | 1.04 | % | | | 0.93 | % | | | 0.02 | % |
Supplemental data | | | | | | | | | | | | | | | | |
Portfolio turnover rate | | | 9 | % | | | 7 | % | | | 5 | % | | | 6 | % |
Net assets, end of period (000s omitted) | | | $1,601,180 | | | | $1,176,567 | | | | $541,644 | | | | $197,823 | |
| 1. | For the period from July 30, 2010 (commencement of class operations) to October 31, 2010 |
| 2. | Calculated based upon average shares outstanding |
| 3. | Amount is less than $0.005. |
| 4. | Returns for periods of less than one year are not annualized. |
The accompanying notes are an integral part of these financial statements.
| | | | |
| 20 | | Wells Fargo Advantage Emerging Markets Equity Fund | | Notes to financial statements (unaudited) |
1. ORGANIZATION
Wells Fargo Funds Trust (the “Trust”), a Delaware statutory trust organized on March 10, 1999, is an open-end management investment company registered under the Investment Company Act of 1940, as amended (the “1940 Act”). These financial statements report on Wells Fargo Advantage Emerging Markets Equity Fund (the “Fund”) which is a diversified series of the Trust.
2. SIGNIFICANT ACCOUNTING POLICIES
The following significant accounting policies, which are consistently followed in the preparation of the financial statements of the Fund, are in conformity with U.S. generally accepted accounting principles which require management to make estimates and assumptions that affect the reported amounts of assets and liabilities, disclosure of contingent assets and liabilities at the date of the financial statements, and the reported amounts of revenues and expenses during the reporting period. Actual results could differ from those estimates.
Securities valuation
All investments are valued each business day as of the close of regular trading on the New York Stock Exchange (normally 4 p.m. Eastern Time).
Equity securities that are listed on a foreign or domestic exchange, except for The Nasdaq Stock Market, Inc. (“Nasdaq”), are valued at the official closing price or, if none, the last sales price. Securities listed on Nasdaq are valued at the Nasdaq Official Closing Price (“NOCP”). If no NOCP is available, securities are valued at the last sales price. If no sales price is shown on the Nasdaq, the bid price will be used. If no sale occurs on the primary exchange or market for the security that day or if no sale occurs and no bid price is shown on Nasdaq, the prior day’s price will be deemed “stale” and fair values will be determined in accordance with the Fund’s Valuation Procedures.
Securities denominated in foreign currencies are translated into U.S. dollars using the rates of exchange in effect on the day of valuation at a time specified by the Management Valuation Team of Wells Fargo Funds Management, LLC (“Funds Management”).
Many securities markets and exchanges outside the U.S. close prior to the close of the New York Stock Exchange and therefore may not fully reflect trading or events that occur after the close of the principal exchange in which the foreign securities are traded, but before the close of the New York Stock Exchange. If such trading or events are expected to materially affect the value of such securities, then fair value pricing procedures approved by the Board of Trustees are applied. These procedures take into account multiple factors including movements in U.S. securities markets after foreign exchanges close. Foreign securities that are fair valued under these procedures are categorized as Level 2 and the application of these procedures may result in transfers between Level 1 and Level 2. Depending on market activity, such fair valuations may be frequent. Such fair value pricing may result in NAVs that are higher or lower than NAVs based on the last reported sales price or latest quoted bid price. On April 30, 2013, fair value pricing was not used in pricing foreign securities.
Investments in registered open-end investment companies are valued at net asset value. Non-registered investment companies are fair valued at net asset value.
Investments which are not valued using any of the methods discussed above are valued at their fair value, as determined by procedures established in good faith and approved by the Board of Trustees. The Board of Trustees has established a Valuation Committee comprised of the Trustees and has delegated to it the authority to take any actions regarding the valuation of portfolio securities that the Valuation Committee deems necessary or appropriate, including determining the fair value of portfolio securities, unless the determination has been delegated to the Management Valuation Team. The Board of Trustees retains the authority to make or ratify any valuation decisions or approve any changes to the Valuation Procedures as it deems appropriate. On a quarterly basis, the Board of Trustees receives reports on any valuation actions taken by the Valuation Committee or the Management Valuation Team which may include items for ratification.
Valuations of fair valued securities are compared to the next actual sales price when available, or other appropriate market information to assess the continued appropriateness of the fair valuation methodology used. These securities are fair valued on a day-to-day basis, taking into consideration changes to appropriate market information and any significant changes to the input factors considered in the valuation process until there is a readily available price provided on the exchange or by an independent pricing service. Valuations received from an independent pricing service or broker quotes are periodically validated by comparisons to most recent trades and valuations provided by other independent pricing services in addition to the review of prices by the adviser and/or subadviser. Unobservable inputs used in determining fair valuations are identified based on the type of security, taking into consideration factors utilized by market participants in valuing the investment, knowledge about the issuer and the current market environment.
| | | | | | |
| Notes to financial statements (unaudited) | | Wells Fargo Advantage Emerging Markets Equity Fund | | | 21 | |
Foreign currency translation
The accounting records of the Fund are maintained in U.S. dollars. Assets, including investment securities, and liabilities denominated in foreign currency are translated into U.S. dollars at the rates of exchange at a time specified by the Management Valuation Team on the date of valuation. Purchases and sales of securities, and income and expenses are converted at the rate of exchange on the respective dates of such transactions. Reported net realized foreign exchange gains or losses arise from sales of foreign currencies, currency gains or losses realized between the trade and settlement dates on securities transactions, and the difference between the amounts of dividends, interest and foreign withholding taxes recorded and the U.S. dollar equivalent of the amounts actually paid or received. Net unrealized foreign exchange gains and losses arise from changes in the fair value of assets and liabilities other than investments in securities resulting in changes in exchange rates.
The changes in net assets arising from changes in exchange rates and the changes in net assets resulting from changes in market prices of securities are not separately presented. Such changes are recorded with net realized and unrealized gains or losses from investments. Gains and losses from certain foreign currency transactions are treated as ordinary income for U.S. federal income tax purposes.
Forward foreign currency contracts
The Fund may be subject to foreign currency exchange rate risk in the normal course of pursuing its investment objectives. A forward foreign currency contract is an agreement between two parties to purchase or sell a specific currency for an agreed-upon price at a future date. The Fund enters into forward foreign currency contracts to facilitate transactions in foreign-denominated securities and to attempt to minimize the risk to the Fund from adverse changes in the relationship between currencies. Forward foreign currency contracts are recorded at the forward rate and marked-to-market daily. When the contracts are closed, realized gains and losses arising from such transactions are recorded as realized gains or losses on forward foreign currency contract transactions. The Fund could be exposed to risks if the counterparties to the contracts are unable to meet the terms of their contracts or if the value of the foreign currency changes unfavorably. The Fund’s maximum risk of loss from counterparty credit risk is the unrealized gains or losses on the contracts. This risk is mitigated by having a master netting arrangement between the Fund and the counterparty.
Security loans
The Fund may lend its securities from time to time in order to earn additional income in the form of fees or interest on securities received as collateral or the investment of any cash received as collateral. The Fund continues to receive interest or dividends on the securities loaned. The Fund receives collateral in the form of cash or securities with a value at least equal to the value of the securities on loan. The value of the loaned securities is determined at the close of each business day and any additional required collateral is delivered to the Fund on the next business day. In a securities lending transaction, the net asset value of the Fund will be affected by an increase or decrease in the value of the securities loaned and by an increase or decrease in the value of the instrument in which collateral is invested. The amount of securities lending activity undertaken by the Fund fluctuates from time to time. In the event of default or bankruptcy by the borrower, the Fund may be prevented from recovering the loaned securities or gaining access to the collateral or may experience delays or costs in doing so. In addition, the investment of any cash collateral received may lose all or part of its value. The Fund has the right under the lending agreement to recover the securities from the borrower on demand.
The Fund lends its securities through an unaffiliated securities lending agent. Cash collateral received in connection with its securities lending transactions is invested in Wells Fargo Securities Lending Cash Investments, LLC (the “Cash Collateral Fund”). The Cash Collateral Fund is exempt from registration under Section 3(c)(7) of the 1940 Act and is managed by Funds Management and is subadvised by Wells Capital Management Incorporated (“WellsCap”). Funds Management receives an advisory fee starting at 0.05% and declining to 0.01% as the average daily net assets of the Cash Collateral Fund increase. All of the fees received by Funds Management are paid to WellsCap for its services as subadviser. The Cash Collateral Fund seeks to provide a positive return compared to the daily Fed Funds Open rate by investing in high-quality, U.S. dollar-denominated short-term money market instruments. Cash Collateral Fund investments are fair valued based upon the amortized cost valuation technique. Income earned from investment in the Cash Collateral Fund is included in securities lending income on the Statement of Operations.
Security transactions and income recognition
Securities transactions are recorded on a trade date basis. Realized gains or losses are recorded on the basis of identified cost.
Dividend income is recognized on the ex-dividend date, except for certain dividends from foreign securities, which are recorded as soon as the Fund is informed of the ex-dividend date. Dividend income from foreign securities is recorded net of foreign taxes withheld where recovery of such taxes is not assured.
| | | | |
| 22 | | Wells Fargo Advantage Emerging Markets Equity Fund | | Notes to financial statements (unaudited) |
Distributions to shareholders
Distributions to shareholders from net investment income and net realized gains, if any, are recorded on the ex-dividend date. Such distributions are determined in conformity with federal income tax regulations, which may differ in amount or character from net investment income and realized gains recognized for purposes of U.S. generally accepted accounting principles.
Federal and other taxes
The Fund intends to continue to qualify as a regulated investment company by distributing substantially all of its investment company taxable income and any net realized capital gains (after reduction for capital loss carryforwards) sufficient to relieve it from all, or substantially all, federal income taxes. Accordingly, no provision for federal income taxes was required.
The Fund’s income and federal excise tax returns and all financial records supporting those returns for the prior three fiscal years are subject to examination by the federal and Delaware revenue authorities. Management has analyzed the Fund’s tax positions taken on federal, state, and foreign tax returns for all open tax years and does not believe that there are any uncertain tax positions that require recognition of a tax liability.
At October 31, 2012, capital loss carryforwards which are available to offset future net realized capital gains were as follows:
| | | | |
Pre-enactment capital loss expiration* | | Post-enactment capital losses** |
| 2016 | | 2017 | | Short-term |
| $2,830,910 | | $22,695,719 | | $8,890,891 |
| * | | Losses incurred in taxable years beginning before December 22, 2010. |
| ** | | Losses incurred in taxable years which began after December 22, 2010 are carried forward for an unlimited period. |
Class allocations
The separate classes of shares offered by the Fund differ principally in applicable sales charges, distribution, shareholder servicing, and administration fees. Shareholders of each class bear certain expenses that pertain to that particular class. All shareholders bear the common expenses of the Fund, earn income from the portfolio, and are allocated any unrealized gains and losses pro rata based on the average daily net assets of each class, without distinction between share classes. Dividends are determined separately for each class based on income and expenses allocable to each class. Realized gains and losses are allocated to each class pro rata based upon the net assets of each class on the date realized. Differences in per share dividend rates generally result from the relative weightings of pro rata income and realized gain allocations and from differences in separate class expenses, including distribution, shareholder servicing, and administration fees.
3. FAIR VALUATION MEASUREMENTS
Fair value measurements of investments are determined within a framework that has established a fair value hierarchy based upon the various data inputs utilized in determining the value of the Fund’s investments. The three-level hierarchy gives the highest priority to unadjusted quoted prices in active markets for identical assets or liabilities (Level 1) and the lowest priority to significant unobservable inputs (Level 3). The Fund’s investments are classified within the fair value hierarchy based on the lowest level of input that is significant to the fair value measurement. The inputs are summarized into three broad levels as follows:
| n | | Level 1 – quoted prices in active markets for identical securities |
| n | | Level 2 – other significant observable inputs (including quoted prices for similar securities, interest rates, prepayment speeds, credit risk, use of amortized cost, etc.) |
| n | | Level 3 – significant unobservable inputs (including the Fund’s own assumptions in determining the fair value of investments) |
The inputs or methodologies used for valuing investments in securities are not necessarily an indication of the risk associated with investing in those securities.
| | | | | | |
| Notes to financial statements (unaudited) | | Wells Fargo Advantage Emerging Markets Equity Fund | | | 23 | |
As of April 30, 2013, the inputs used in valuing investments in securities were as follows:
| | | | | | | | | | | | | | | | |
| Investments in securities | | Quoted prices (Level 1) | | | Significant other
observable inputs (Level 2) | | | Significant unobservable inputs (Level 3) | | | Total | |
Equity securities | | | | | | | | | | | | | | | | |
Common stocks | | $ | 3,408,310,992 | | | $ | 16,238,773 | | | $ | 0 | | | $ | 3,424,549,765 | |
Preferred stocks | | | 104,816,969 | | | | 1,949,955 | | | | 0 | | | | 106,766,924 | |
Convertible debentures | | | 0 | | | | 0 | | | | 7,148 | | | | 7,148 | |
Short-term investments | | | | | | | | | | | | | | | | |
Investment companies | | | 405,815,846 | | | | 296,302,826 | | | | 0 | | | | 702,118,672 | |
| | | $ | 3,918,943,807 | | | $ | 314,491,554 | | | $ | 7,148 | | | $ | 4,233,442,509 | |
As of April 30, 2013, the inputs used in valuing the Fund’s other financial instruments were as follows:
| | | | | | | | | | | | | | | | |
| Other financial instruments | | Quoted prices (Level 1) | | | Significant other
observable inputs (Level 2) | | | Significant unobservable inputs (Level 3) | | | Total | |
Forward foreign currency contracts+ | | $ | 0 | | | $ | 63,117 | | | $ | 0 | | | $ | 63,117 | |
| + | | Forward foreign currency contracts are presented at the unrealized gains or losses on the instrument. |
Transfers in and transfers out are recognized at the end of the reporting period. For the six months ended April 30, 2013, the Fund did not have any transfers into/out of Level 1 or Level 2.
4. TRANSACTIONS WITH AFFILIATES AND OTHER EXPENSES
Advisory fee
The Trust has entered into an advisory contract with Funds Management, an indirect wholly owned subsidiary of Wells Fargo & Company (“Wells Fargo”). The adviser is responsible for implementing investment policies and guidelines and for supervising the subadviser, who is responsible for day-to-day portfolio management of the Fund.
Pursuant to the contract, Funds Management is entitled to receive an annual advisory fee starting at 1.10% and declining to 0.95% as the average daily net assets of the Fund increase. For the six months ended April 30, 2013, the advisory fee was equivalent to an annual rate of 1.01% of the Fund’s average daily net assets.
Funds Management has retained the services of a subadviser to provide daily portfolio management to the Fund. The fee for subadvisory services is borne by Funds Management. WellsCap, an affiliate of Funds Management, is the subadviser to the Fund and is entitled to receive a fee from Funds Management at an annual rate starting at 0.65% and declining to 0.45% as the average daily net assets of the Fund increase.
Administration and transfer agent fees
The Trust has entered into an administration agreement with Funds Management. Under this agreement, for providing administrative services, which includes paying fees and expenses for services provided by the transfer agent, sub-transfer agents, omnibus account servicers and record-keepers, Funds Management is entitled to receive from the Fund an annual fund level administration fee starting at 0.05% and declining to 0.03% as the average daily net assets of the Fund increase and a class level administration fee which is calculated based on the average daily net assets of each class as follows:
| | | | |
| | | Class level
administration fee | |
Class A, Class B, Class C | | | 0.26 | % |
Administrator Class | | | 0.10 | |
Institutional Class | | | 0.08 | |
Funds Management has contractually waived and/or reimbursed advisory and administration fees to the extent necessary to maintain certain net operating expense ratios for the Fund. Waiver of fees and/or reimbursement of expenses by Funds Management were made first from fund level expenses on a proportionate basis and then from class
| | | | |
| 24 | | Wells Fargo Advantage Emerging Markets Equity Fund | | Notes to financial statements (unaudited) |
specific expenses. Funds Management has committed through February 28, 2014 to waive fees and/or reimburse expenses to the extent necessary to cap the Fund’s expenses at 1.70% for Class A shares, 2.45% for Class B shares, 2.45% for Class C shares, 1.50% for Administrator Class shares and 1.25% for Institutional Class shares.
Distribution fees
The Trust has adopted a Distribution Plan for Class B and Class C shares of the Fund pursuant to Rule 12b-1 under the 1940 Act. Distribution fees are charged to Class B and Class C shares and paid to Wells Fargo Funds Distributor, LLC, the principal underwriter, at an annual rate of 0.75% of the average daily net assets of Class B and Class C shares.
For the six months year ended April 30, 2013, Wells Fargo Funds Distributor, LLC received $42,140 from the sale of Class A shares and $6,084, $2,532 and $4,388 in contingent deferred sales charges from redemptions of Class A, Class B and Class C shares, respectively.
Shareholder servicing fees
The Trust has entered into contracts with one or more shareholder servicing agents, whereby Class A, Class B, Class C and Administrator Class of the Fund is charged a fee at an annual rate of 0.25% of the average daily net assets of each respective class.
A portion of these total shareholder servicing fees were paid to affiliates of Wells Fargo.
5. INVESTMENT PORTFOLIO TRANSACTIONS
Purchases and sales of investments, excluding U.S. government obligations (if any) and short-term securities, for the six months ended April 30, 2013 were $922,638,063 and $274,454,633, respectively.
6. DERIVATIVE TRANSACTIONS
During the six months ended April 30, 2013, the Fund entered into forward foreign currency contracts for economic hedging purposes.
At April 30, 2013, the Fund had forward foreign currency contracts to buy outstanding as follows:
| | | | | | | | | | | | | | | | | | |
| Exchange date | | Counterparty | | Contracts to
receive | | | U.S. value at
April 30, 2013 | | | In exchange
for U.S. $ | | | Unrealized
gains | |
| 5-2-2013 | | State Street Bank | | | 15,400,131 | ZAR | | $ | 1,716,179 | | | $ | 1,675,767 | | | $ | 40,412 | |
| 5-3-2013 | | State Street Bank | | | 15,541,287 | ZAR | | | 1,731,909 | | | | 1,714,080 | | | | 17,829 | |
| 5-7-2013 | | State Street Bank | | | 15,319,955 | ZAR | | | 1,706,320 | | | | 1,701,444 | | | | 4,876 | |
The Fund had average contract amounts of $319,562 and $46,851 in forward foreign currency contracts to buy and forward foreign currency contracts to sell, respectively, during the six months ended April 30, 2013.
The fair value, realized gains or losses and change in unrealized gains or losses, if any, on derivative instruments are reflected in the appropriate financial statements.
7. BANK BORROWINGS
The Trust (excluding the money market funds and certain other funds in the Trust) and Wells Fargo Variable Trust are parties to a $150,000,000 revolving credit agreement with State Street Bank and Trust Company, whereby the Fund is permitted to use bank borrowings for temporary or emergency purposes, such as to fund shareholder redemption requests. Interest under the credit agreement is charged to the Fund based on a borrowing rate equal to the higher of the Federal Funds rate in effect on that day plus 1.25% or the overnight LIBOR rate in effect on that day plus 1.25%. In addition, an annual commitment fee equal to 0.10% of the unused balance is allocated to each participating fund. For the six months ended April 30, 2013, the Fund paid $3,394 in commitment fees.
For the six months ended April 30, 2013, there were no borrowings by the Fund under the agreement.
8. INDEMNIFICATION
Under the Trust’s organizational documents, the officers and directors are indemnified against certain liabilities that may arise out of performance of their duties to the Trust. Additionally, in the normal course of business, the Trust may enter into contracts with service providers that contain a variety of indemnification clauses. The Trust’s maximum exposure under these arrangements is dependent on future claims that may be made against the Fund and, therefore, cannot be estimated.
| | | | | | |
| Notes to financial statements (unaudited) | | Wells Fargo Advantage Emerging Markets Equity Fund | | | 25 | |
9. NEW ACCOUNTING PRONOUNCEMENT
In December 2011, the Financial Accounting Standards Board (“FASB”) issued Accounting Standard Update (“ASU”) No. 2011-11, Disclosures about Offsetting Assets and Liabilities. ASU 2011-11, which amends FASB ASC Topic 210, Balance Sheet, creates new disclosure requirements which require entities to disclose both gross and net information for derivatives and other financial instruments that are either offset in the Statement of Assets and Liabilities or subject to an enforceable master netting arrangement or similar agreement. The disclosure requirements are effective for interim and annual reporting periods beginning on or after January 1, 2013. Management is currently assessing the potential impact, in addition to expanded financial statement disclosure, that may result from adopting this ASU.
| | | | |
| 26 | | Wells Fargo Advantage Emerging Markets Equity Fund | | Other information (unaudited) |
TAX INFORMATION
Pursuant to Section 853 of the Internal Revenue Code, the following amounts were designated as foreign taxes paid for the fiscal year ended October 31, 2012. These amounts may be less than the actual foreign taxes paid for financial statement purposes. Foreign taxes paid or withheld should be included in taxable income with an offsetting deduction from gross income or as a credit for taxes paid to foreign governments. None of the income was derived from ineligible foreign sources as defined under Section 901(j) of the Internal Revenue Code.
| | | | |
Creditable foreign taxes paid | | Per share amount on October 31, 2012 | | Foreign income as % of ordinary income distributions |
| $3,879,037 | | $0.03 | | 97.84% |
PROXY VOTING INFORMATION
A description of the policies and procedures that the Fund uses to determine how to vote proxies relating to portfolio securities is available without charge, upon request, by calling 1-800-222-8222, visiting our website at wellsfargoadvantagefunds.com, or visiting the SEC website at sec.gov. Information regarding how the Fund voted proxies relating to portfolio securities during the most recent 12-month period ended June 30 is available without charge on the Fund’s website at wellsfargoadvantagefunds.com or by visiting the SEC website at sec.gov.
PORTFOLIO HOLDINGS INFORMATION
The complete portfolio holdings for the Fund are publicly available on the Fund’s website (wellsfargoadvantagefunds.com) on a monthly, 30-day or more delayed basis. In addition, top ten holdings information for the Fund is publicly available on the Fund’s website on a monthly, seven-day or more delayed basis. The Fund files its complete schedule of portfolio holdings with the SEC for the first and third quarters of each fiscal year on Form N-Q, which is available without charge by visiting the SEC website at sec.gov. In addition, the Fund’s Form N-Q may be reviewed and copied at the SEC’s Public Reference Room in Washington, DC, and at regional offices in New York City, at 233 Broadway, and in Chicago, at 175 West Jackson Boulevard, Suite 900. Information about the Public Reference Room may be obtained by calling 1-800-SEC-0330.
| | | | | | |
| Other information (unaudited) | | Wells Fargo Advantage Emerging Markets Equity Fund | | | 27 | |
BOARD OF TRUSTEES AND OFFICERS
Each of the Trustees and Officers listed in the table below acts in identical capacities for the Wells Fargo Advantage family of funds, which consists of 131 funds1 comprising the Wells Fargo Funds Trust, Wells Fargo Variable Trust, Wells Fargo Master Trust and four closed-end funds (collectively the “Fund Complex”). This table should be read in conjunction with the Prospectus and the Statement of Additional Information2. All of the Trustees are also Members of the Audit and Governance Committees of each Trust in the Fund Complex. The mailing address of each Trustee and Officer is 525 Market Street, 12th Floor, San Francisco, CA 94105. Each Trustee and Officer serves an indefinite term, however, each Trustee serves such term until reaching the mandatory retirement age established by the Trustees.
Independent Trustees
| | | | | | |
Name and year of birth | | Position held and length of service* | | Principal occupations during past five years | | Other directorships during
past five years |
| Peter G. Gordon (Born 1942) | | Trustee, since 1998; Chairman, since 2005 | | Co-Founder, Retired Chairman, President and CEO of Crystal Geyser Water Company. Trustee Emeritus, Colby College. | | Asset Allocation Trust |
| Isaiah Harris, Jr. (Born 1952) | | Trustee, since 2009 | | Retired. Prior thereto, President and CEO of BellSouth Advertising and Publishing Corp. from 2005 to 2007, President and CEO of BellSouth Enterprises from 2004 to 2005 and President of BellSouth Consumer Services from 2000 to 2003. Emeritus member of the Iowa State University Foundation Board of Governors. Emeritus Member of the Advisory Board of Iowa State University School of Business. Advisory Board Member, Palm Coast Academy (charter school). Mr. Harris is a certified public accountant. | | CIGNA Corporation; Deluxe Corporation; Asset Allocation Trust |
| Judith M. Johnson (Born 1949) | | Trustee, since 2008; Audit Committee Chairman, since 2008 | | Retired. Prior thereto, Chief Executive Officer and Chief Investment Officer of Minneapolis Employees Retirement Fund from 1996 to 2008. Ms. Johnson is an attorney, certified public accountant and a certified managerial accountant. | | Asset Allocation Trust |
| Leroy Keith, Jr. (Born 1939) | | Trustee, since 2010 | | Chairman, Bloc Global Services (development and construction). Trustee of the Evergreen Funds from 1983 to 2010. Former Managing Director, Almanac Capital Management (commodities firm), former Partner, Stonington Partners, Inc. (private equity fund), former Director, Obagi Medical Products Co. and former Director, Lincoln Educational Services. | | Trustee, Virtus Fund Complex (consisting of 48 portfolios as of 1/31/2013); Asset Allocation Trust |
| David F. Larcker (Born 1950) | | Trustee, since 2009 | | James Irvin Miller Professor of Accounting at the Graduate School of Business, Stanford University, Morgan Stanley Director of the Center for Leadership Development and Research and Senior Faculty of The Rock Center for Corporate Governance since 2006. From 2005 to 2008, Professor of Accounting at the Graduate School of Business, Stanford University. Prior thereto, Ernst & Young Professor of Accounting at The Wharton School, University of Pennsylvania from 1985 to 2005. | | Asset Allocation Trust |
| Olivia S. Mitchell (Born 1953) | | Trustee, since 2006 | | International Foundation of Employee Benefit Plans Professor, Wharton School of the University of Pennsylvania since 1993. Director of Wharton’s Pension Research Council and Boettner Center on Pensions & Retirement Research, and Research Associate at the National Bureau of Economic Research. Previously, Cornell University Professor from 1978 to 1993. | | Asset Allocation Trust |
| Timothy J. Penny (Born 1951) | | Trustee, since 1996 | | President and CEO of Southern Minnesota Initiative Foundation, a non-profit organization, since 2007 and Senior Fellow at the Humphrey Institute Policy Forum at the University of Minnesota since 1995. Member of the Board of Trustees of NorthStar Education Finance, Inc., a non-profit organization, since 2007. | | Asset Allocation Trust |
| | | | |
| 28 | | Wells Fargo Advantage Emerging Markets Equity Fund | | Other information (unaudited) |
| | | | | | |
Name and year of birth | | Position held and length of service* | | Principal occupations during past five years | | Other directorships during
past five years |
| Michael S. Scofield (Born 1943) | | Trustee, since 2010 | | Served on the Investment Company Institute’s Board of Governors and Executive Committee from 2008-2011 as well the Governing Council of the Independent Directors Council from 2006-2011 and the Independent Directors Council Executive Committee from 2008-2011. Chairman of the IDC from 2008-2010. Institutional Investor (Fund Directions) Trustee of Year in 2007. Trustee of the Evergreen Funds (and its predecessors) from 1984 to 2010. Chairman of the Evergreen Funds from 2000-2010. Former Trustee of the Mentor Funds. Retired Attorney, Law Offices of Michael S. Scofield. | | Asset Allocation Trust |
| Donald C. Willeke (Born 1940) | | Trustee, since 1996 | | Principal of the law firm of Willeke & Daniels. General Counsel of the Minneapolis Employees Retirement Fund from 1984 until its consolidation into the Minnesota Public Employees Retirement Association on June 30, 2010. Director and Vice Chair of The Tree Trust (non-profit corporation). Director of the American Chestnut Foundation (non-profit corporation). | | Asset Allocation Trust |
| * | Length of service dates reflect the Trustee’s commencement of service with the Trust’s predecessor entities, where applicable. |
Officers
| | | | | | |
Name and year of birth | | Position held and length of service | | Principal occupations during past five years | | |
| Karla M. Rabusch (Born 1959) | | President, since 2003 | | Executive Vice President of Wells Fargo Bank, N.A. and President of Wells Fargo Funds Management, LLC since 2003. | | |
| Jeremy DePalma1 (Born 1974) | | Treasurer, since 2012 | | Senior Vice President of Wells Fargo Funds Management, LLC since 2009. Senior Vice President of Evergreen Investment Management Company, LLC from 2008 to 2010. Vice President, Evergreen Investment Services, Inc. from 2004 to 2007. Head of the Fund Reporting and Control Team within Fund Administration from 2005 to 2010. | | |
| C. David Messman (Born 1960) | | Secretary, since 2000; Chief Legal Officer, since 2003 | | Senior Vice President and Secretary of Wells Fargo Funds Management, LLC since 2001. Vice President and Managing Counsel of Wells Fargo Bank, N.A. since 1996. | | |
Debra Ann Early (Born 1964) | | Chief Compliance Officer, since 2007 | | Chief Compliance Officer of Wells Fargo Funds Management, LLC since 2007. Chief Compliance Officer of Parnassus Investments from 2005 to 2007. Chief Financial Officer of Parnassus Investments from 2004 to 2007. | | |
David Berardi (Born 1975) | | Assistant Treasurer, since 2009 | | Vice President of Wells Fargo Funds Management, LLC since 2009. Vice President of Evergreen Investment Management Company, LLC from 2008 to 2010. Assistant Vice President of Evergreen Investment Services, Inc. from 2004 to 2008. Manager of Fund Reporting and Control for Evergreen Investment Management Company, LLC from 2004 to 2010. | | |
| 1. | Jeremy DePalma acts as Treasurer of 58 funds and Assistant Treasurer of 73 funds in the Fund Complex. |
| 2. | The Statement of Additional Information includes additional information about the Trustees and is available, without charge, upon request, by calling 1-800-222-8222 or by visiting the website at wellsfargoadvantagefunds.com. |
| | | | | | |
| Other information (unaudited) | | Wells Fargo Advantage Emerging Markets Equity Fund | | | 29 | |
BOARD CONSIDERATION OF INVESTMENT ADVISORY AND SUB-ADVISORY AGREEMENTS:
Under Section 15 of the Investment Company Act of 1940 (the “1940 Act”), the Board of Trustees (the “Board”) of Wells Fargo Funds Trust (the “Trust”), all the members of which have no direct or indirect interest in the investment advisory and sub-advisory agreements and are not “interested persons” of the Trust, as defined in the 1940 Act (the “Independent Trustees”), must determine whether to approve the continuation of the Trust’s investment advisory and sub-advisory agreements. In this regard, at an in-person meeting held on March 28-29, 2013 (the “Meeting”), the Board reviewed: (i) an investment advisory agreement with Wells Fargo Funds Management, LLC (“Funds Management”) for Wells Fargo Advantage Emerging Markets Equity Fund (the “Fund”) and (ii) an investment sub-advisory agreement with Wells Capital Management Incorporated (the “Sub-Adviser”), an affiliate of Funds Management, for the Fund. The investment advisory agreement with Funds Management and the investment sub-advisory agreement with the Sub-Adviser are collectively referred to as the “Advisory Agreements.”
At the Meeting, the Board considered the factors and reached the conclusions described below relating to the selection of Funds Management and the Sub-Adviser and the continuation of the Advisory Agreements. Prior to the Meeting, the Trustees conferred extensively among themselves and with representatives of Funds Management about these matters. The Board has adopted a team-based approach, with each team consisting of a sub-set of Trustees, to assist the Board in the discharge of its duties in reviewing performance and other matters throughout the year. The Independent Trustees were assisted in their evaluation of the Advisory Agreements by independent legal counsel, from whom they received separate legal advice and with whom they met separately.
In providing information to the Board, Funds Management and the Sub-Adviser were guided by a detailed set of requests for information submitted to them by independent legal counsel on behalf of the Independent Trustees at the start of the Board’s annual contract renewal process earlier in 2013. In considering and approving the Advisory Agreements, the Trustees considered the information they believed relevant, including but not limited to the information discussed below. The Board considered not only the specific information presented in connection with the Meeting, but also the knowledge gained over time through interaction with Funds Management and the Sub-Adviser about various topics. In this regard, the Board reviewed reports of Funds Management at each of its quarterly meetings, which included, among other things, portfolio reviews and performance reports. In addition, the Board and the teams mentioned above confer with portfolio managers at various times throughout the year. The Board did not identify any particular information or consideration that was all-important or controlling, and each individual Trustee may have attributed different weights to various factors.
After its deliberations, the Board unanimously determined that the continuation of the Advisory Agreements is in the best interests of the Fund and its shareholders, and that the compensation payable to Funds Management and the Sub-Adviser is reasonable. The Board considered the continuation of the Advisory Agreements for the Fund as part of its consideration of the continuation of advisory agreements for funds across the complex, but each decision was made on a fund-by-fund basis. The following summarizes a number of important, but not necessarily all, factors considered by the Board in reaching its determination.
Nature, extent and quality of services
The Board received and considered various information regarding the nature, extent and quality of services provided to the Fund by Funds Management and the Sub-Adviser under the Advisory Agreements. This information included, among other things, a summary of the background and experience of senior management of Funds Management, and the qualifications, background, tenure and responsibilities of each of the portfolio managers primarily responsible for the day-to-day portfolio management of the Fund.
The Board evaluated the ability of Funds Management and the Sub-Adviser, based on attributes such as their financial condition, resources and reputation, to attract and retain qualified investment professionals, including research, advisory and supervisory personnel. The Board further considered the compliance programs and compliance records of Funds Management and the Sub-Adviser. In addition, the Board took into account the administrative and other services provided to the Fund by Funds Management and its affiliates and Funds Management’s oversight of the Fund’s various service providers.
Fund performance and expenses
The Board considered the performance results for the Fund over various time periods ended December 31, 2012. The Board also considered these results in comparison to the performance of funds in a universe that was determined by Lipper Inc. (“Lipper”) to be similar to the Fund (the “Universe”), and in comparison to the Fund’s benchmark index and to other comparative data. Lipper is an independent provider of investment company data. The Board received a
| | | | |
| 30 | | Wells Fargo Advantage Emerging Markets Equity Fund | | Other information (unaudited) |
description of the methodology used by Lipper to select the mutual funds in the performance Universe. The Board noted that the performance of the Fund (Administrator Class) was higher than the median performance of the Universe for all periods under review except for the one-year period. The Board also noted that the performance of the Fund was higher than its benchmark, the Morgan Stanley Composite Index Emerging Markets Index (Net), for all periods under review except for the one-year period.
The Board received information concerning, and discussed factors contributing to, the underperformance of the Fund relative to the Universe and the benchmark for the one-year period under review. Funds Management advised the Board about the market conditions and investment decisions that it believed contributed to the underperformance during that period. Funds Management advised the Board that the short-term underperformance was attributable to high volatility in emerging markets. The Board was satisfied with the explanation of the underperformance.
The Board received and considered information regarding the Fund’s net operating expense ratios and their various components, including actual management fees (which reflect fee waivers, if any, and include advisory, administration and transfer agent fees), custodian and other non-management fees, Rule 12b-1 and non-Rule 12b-1 service fees and fee waiver and expense reimbursement arrangements. The Board also considered these ratios in comparison to the median ratios of funds in class-specific expense groups that were determined by Lipper to be similar to the Fund (the “Groups”). The Board received a description of the methodology used by Lipper to select the mutual funds in the expense Groups. Based on the Lipper reports, the Board noted that the net operating expense ratios of the Fund were in range of the median net operating expense ratios of the expense Groups. Funds Management and the Board agreed to reduce the operating expense ratio caps for Class A, Class B, Class C and the Institutional Class.
Based on its consideration of the factors and information it deemed relevant, including those described here, the Board concluded that the overall performance and expense structure of the Fund supported the re-approval of the Advisory Agreements.
Investment advisory and sub-advisory fee rates
The Board reviewed and considered the contractual investment advisory fee rates that are payable by the Fund to Funds Management for investment advisory services (the “Advisory Agreement Rates”), both on a stand-alone basis and on a combined basis with the Fund’s fund-level and class-level contractual administration fee rates (the “Management Rates”). The Board noted that the administration fees include transfer agency costs. The Board also reviewed and considered the contractual investment sub-advisory fee rates that are payable by Funds Management to the Sub-Adviser for investment sub-advisory services (the “Sub-Advisory Agreement Rates”).
Among other information reviewed by the Board was a comparison of the Management Rates of the Fund with those of other funds in the expense Groups at a common asset level. The Board noted that the Management Rates of the Fund were equal to or in range of the median rates for the Fund’s expense Groups for all classes except Class A. The Board and Funds Management agreed to reduce the operating expense ratio caps for Class A.
The Board also received and considered information about the portion of the total advisory fee that was retained by Funds Management after payment of the fee to the Sub-Adviser for sub-advisory services. In assessing the reasonableness of this amount, the Board received and evaluated information concerning the nature and extent of responsibilities retained and risks assumed by Funds Management and not delegated to or assumed by the Sub-Adviser, and about Funds Management’s on-going oversight services. In recognition of the fact that the Wells Fargo enterprise provides a suite of combined advisory and sub-advisory services to the Fund through affiliated entities, the Board ascribed limited relevance to the allocation of the total advisory fee between Funds Management and the Sub-Adviser.
The Board also received and considered information about the nature and extent of services offered and fee rates charged by Funds Management and the Sub-Adviser to other types of clients. In this regard, the Board received information about the significantly greater scope of services, and compliance, reporting and other legal burdens and risks of managing mutual funds compared with those associated with managing assets of non-mutual fund clients such as collective funds or institutional separate accounts.
Based on its consideration of the factors and information it deemed relevant, including those described here, the Board determined that the Advisory Agreement Rates and the Sub-Advisory Agreement Rates were reasonable in light of the services covered by the Advisory Agreements.
Profitability
The Board received and considered information concerning the profitability of Funds Management, as well as the profitability of Wells Fargo as a whole, from providing services to the Fund. The Board did not receive or consider to be
| | | | | | |
| Other information (unaudited) | | Wells Fargo Advantage Emerging Markets Equity Fund | | | 31 | |
necessary separate profitability information with respect to the Sub-Adviser, because, as an affiliate of Funds Management, its profitability information was subsumed in the collective Wells Fargo profitability analysis provided by Funds Management.
Funds Management explained the methodologies and estimates that it used in calculating the profitability from the Fund and the fund family as a whole. Among other things, the Board noted that the levels of profitability reported on a fund-by-fund basis varied widely, depending on factors such as the size and type of fund. Based on its review, the Board did not deem the profits reported by Funds Management to be at a level that would prevent it from approving the continuation of the Advisory Agreements.
Economies of scale
With respect to possible economies of scale, the Board reviewed the breakpoints in the Fund’s advisory fee and administration fee structure, which operate generally to reduce the Fund’s expense ratios as the Fund grows in size. It considered that, for a small fund or a fund that shrinks in size, breakpoints conversely can result in higher fee levels. The Board also considered fee waiver and expense reimbursement arrangements as a means of sharing potential economies of scale with the Fund. The Board acknowledged the inherent limitations of any analysis of potential economies of scale and of any attempt to correlate breakpoints with such economies. Nonetheless, the Board concluded that the breakpoints and net operating expense ratio caps appeared to be a reasonable approach to sharing potential economies of scale with the Fund.
Other benefits to Funds Management and the Sub-Adviser
The Board received and considered information regarding potential “fall-out” or ancillary benefits received by Funds Management and its affiliates, including the Sub-Adviser, as a result of their relationship with the Fund. Ancillary benefits could include, among others, benefits directly attributable to other relationships with the Fund and benefits potentially derived from an increase in Funds Management’s and the Sub-Adviser’s business as a result of their relationship with the Fund (such as the ability to market to shareholders other financial products and services offered by Funds Management and its affiliates, including the Sub-Adviser, or to operate other products and services that follow investment strategies similar to those of the Fund).
The Board considered that Wells Fargo Funds Distributor, LLC, an affiliate of Funds Management, serves as distributor to the Fund and receives certain compensation for those services. The Board noted that various financial institutions, including affiliates of Funds Management, may receive distribution-related fees, shareholder servicing payments (including amounts derived from payments under Rule 12b-1 plans) and sub-transfer agency fees in respect of shares sold or held through them and services provided.
The Board also reviewed information about whether and to what extent soft dollar credits are sought and how any such credits are utilized, and any benefits that might be realized by an affiliated broker that handles portfolio transactions for the Fund.
Based on its consideration of the factors and information it deemed relevant, including those described here, the Board did not find that any ancillary benefits received by Funds Management and its affiliates, including the Sub-Adviser, were unreasonable.
Conclusion
After considering the above-described factors and based on its deliberations and its evaluation of the information described above, the Board unanimously approved the continuation of the Advisory Agreements for an additional one-year period.
| | | | |
| 32 | | Wells Fargo Advantage Emerging Markets Equity Fund | | List of abbreviations |
The following is a list of common abbreviations for terms and entities that may have appeared in this report.
| ACA | — ACA Financial Guaranty Corporation |
| ADR | — American depositary receipt |
| ADS | — American depositary shares |
| AGC | — Assured Guaranty Corporation |
| AGM | — Assured Guaranty Municipal |
| Ambac | — Ambac Financial Group Incorporated |
| AMT | — Alternative minimum tax |
| BAN | — Bond anticipation notes |
| BHAC | — Berkshire Hathaway Assurance Corporation |
| CAB | — Capital appreciation bond |
| CCAB | — Convertible capital appreciation bond |
| CDA | — Community Development Authority |
| CDO | — Collateralized debt obligation |
| COP | — Certificate of participation |
| DRIVER | — Derivative inverse tax-exempt receipts |
| DW&P | — Department of Water & Power |
| DWR | — Department of Water Resources |
| ECFA | — Educational & Cultural Facilities Authority |
| EDA | — Economic Development Authority |
| EDFA | — Economic Development Finance Authority |
| ETF | — Exchange-traded fund |
| FDIC | — Federal Deposit Insurance Corporation |
| FFCB | — Federal Farm Credit Banks |
| FGIC | — Financial Guaranty Insurance Corporation |
| FHA | — Federal Housing Administration |
| FHLB | — Federal Home Loan Bank |
| FHLMC | — Federal Home Loan Mortgage Corporation |
| FICO | — The Financing Corporation |
| FNMA | — Federal National Mortgage Association |
| GDR | — Global depositary receipt |
| GNMA | — Government National Mortgage Association |
| HCFR | — Healthcare facilities revenue |
| HEFA | — Health & Educational Facilities Authority |
| HEFAR | — Higher education facilities authority revenue |
| HFA | — Housing Finance Authority |
| HFFA | — Health Facilities Financing Authority |
| HUD | — Department of Housing and Urban Development |
| IDA | — Industrial Development Authority |
| IDAG | — Industrial Development Agency |
| IDR | — Industrial development revenue |
| KRW | — Republic of Korea won |
| LIBOR | — London Interbank Offered Rate |
| LLC | — Limited liability company |
| LLP | — Limited liability partnership |
| MBIA | — Municipal Bond Insurance Association |
| MFHR | — Multifamily housing revenue |
| MSTR | — Municipal securities trust receipts |
| MUD | — Municipal Utility District |
| National | — National Public Finance Guarantee Corporation |
| PCFA | — Pollution Control Financing Authority |
| PCL | — Public Company Limited |
| PCR | — Pollution control revenue |
| PFA | — Public Finance Authority |
| PFFA | — Public Facilities Financing Authority |
| PFOTER | — Puttable floating option tax-exempt receipts |
| plc | — Public limited company |
| PUTTER | — Puttable tax-exempt receipts |
| R&D | — Research & development |
| Radian | — Radian Asset Assurance |
| RAN | — Revenue anticipation notes |
| RDA | — Redevelopment Authority |
| RDFA | — Redevelopment Finance Authority |
| REIT | — Real estate investment trust |
| ROC | — Reset option certificates |
| SAVRS | — Select auction variable rate securities |
| SBA | — Small Business Authority |
| SFHR | — Single-family housing revenue |
| SFMR | — Single-family mortgage revenue |
| SPA | — Standby purchase agreement |
| SPDR | — Standard & Poor’s Depositary Receipts |
| STRIPS | — Separate trading of registered interest and principal securities |
| TAN | — Tax anticipation notes |
| TIPS | — Treasury inflation-protected securities |
| TRAN | — Tax revenue anticipation notes |
| TTFA | — Transportation Trust Fund Authority |
| TVA | — Tennessee Valley Authority |
This page is intentionally left blank.
This page is intentionally left blank.


For more information
More information about Wells Fargo Advantage Funds is available free upon request. To obtain literature, please write, email, visit the Fund’s website, or call:
Wells Fargo Advantage Funds
P.O. Box 8266
Boston, MA 02266-8266
Email: wfaf@wellsfargo.com
Website: wellsfargoadvantagefunds.com
Individual investors: 1-800-222-8222
Retail investment professionals: 1-888-877-9275
Institutional investment professionals: 1-866-765-0778
This report and the financial statements contained herein are submitted for the general information of the shareholders of Wells Fargo Advantage Funds. If this report is used for promotional purposes, distribution of the report must be accompanied or preceded by a current prospectus. For a current prospectus and, if available, a summary prospectus containing more complete information, including charges and expenses, call 1-800-222-8222 or visit the Fund’s website at wellsfargoadvantagefunds.com. Please consider the investment objectives, risks, charges, and expenses of the investment carefully before investing. This and other information about Wells Fargo Advantage Funds can be found in the current prospectus. Read the prospectus carefully before you invest or send money.
Wells Fargo Funds Management, LLC, a wholly owned subsidiary of Wells Fargo & Company, provides investment advisory and administrative services for Wells Fargo Advantage Funds. Other affiliates of Wells Fargo & Company provide subadvisory and other services for the Funds. The Funds are distributed by Wells Fargo Funds Distributor, LLC, Member FINRA/SIPC, an affiliate of Wells Fargo & Company.
NOT FDIC INSURED ¡ NO BANK GUARANTEE ¡ MAY LOSE VALUE
© 2013 Wells Fargo Funds Management, LLC. All rights reserved.
| | |
 | | 216832 06-13 SA238/SAR238 4-13 |

Wells Fargo Advantage
Emerging Markets Equity Income Fund

Semi-Annual Report
April 30, 2013

Reduce clutter. Save trees.
Sign up for electronic delivery of prospectuses and shareholder reports at wellsfargo.com/advantagedelivery
Contents
The views expressed and any forward-looking statements are as of April 30, 2013, unless otherwise noted, and are those of the Fund managers and/or Wells Fargo Funds Management, LLC. Discussions of individual securities, or the markets generally, or any Wells Fargo Advantage Fund are not intended as individual recommendations. Future events or results may vary significantly from those expressed in any forward-looking statements; the views expressed are subject to change at any time in response to changing circumstances in the market. Wells Fargo Funds Management, LLC, disclaims any obligation to publicly update or revise any views expressed or forward-looking statements.
NOT FDIC INSURED ¡ NO BANK GUARANTEE ¡ MAY LOSE VALUE

Wells Fargo investment history
| | |
| 1932 | | Keystone creates one of the first mutual fund families. |
| 1971 | | Wells Fargo & Company introduces one of the first institutional index funds. |
| 1978 | | Wells Fargo applies Markowitz and Sharpe’s research on Modern Portfolio Theory to introduce one of the industry’s first tactical asset allocation models in institutional separately managed accounts. |
| 1984 | | Wells Fargo Stagecoach Funds launches its first asset allocation fund. |
| 1989 | | The Tactical Asset Allocation (TAA) Model is first applied to Wells Fargo’s asset allocation mutual funds. |
| 1994 | | Wells Fargo introduces the LifePath Funds, one of the first suites of target date funds (now the Wells Fargo Advantage Dow Jones Target Date FundsSM). |
| 1996 | | Evergreen Investments and Keystone Funds merge. |
| 1997 | | Wells Fargo launches the Wells Fargo Advantage WealthBuilder PortfoliosSM, a fund-of-funds suite of products that includes the use of quantitative models to shift assets among investment styles. |
| 1999 | | Norwest Advantage Funds and Stagecoach Funds are reorganized into Wells Fargo Funds after the merger of Norwest and Wells Fargo. |
| 2002 | | Evergreen Retail and Evergreen Institutional companies form the umbrella asset management company, Evergreen Investments. |
| 2005 | | The integration of Strong Funds with Wells Fargo Funds creates Wells Fargo Advantage Funds, resulting in one of the top 20 mutual fund companies in the United States. |
| 2006 | | Wells Fargo Advantage Funds relaunches the target date product line as Wells Fargo Advantage Dow Jones Target Date Funds. |
| 2010 | | The mergers and reorganizations of Evergreen and Wells Fargo Advantage mutual funds are completed, unifying the families under the brand of Wells Fargo Advantage Funds. |
Wells Fargo Advantage Funds®
Wells Fargo Advantage Funds skillfully guides institutions, financial advisors, and individuals through the investment terrain to help them reach their financial objectives. Everything we do on behalf of investors is backed by our unique combination of qualifications.
Strength
Our organization is built on the standards of integrity and service established by our parent company—Wells Fargo & Company—more than 150 years ago. And, because we’re part of a highly diversified financial enterprise, we offer the depth of resources to help investors succeed.
Expertise
Our multi-boutique model offers investors access to the independent thinking of premier investment managers that have been chosen for their time-tested strategies. While each team specializes in a specific investment strategy, collectively they provide investors a wide choice of distinct investment styles. Our dedication to investment excellence doesn’t end with our expertise in manager selection—risk management, analysis, and rigorous ongoing review seek to ensure each manager’s investment process remains consistent.
Partnership
Our collaborative approach is built around understanding the needs and goals of our clients. By adhering to core principles of sound judgment and steady guidance, we support you through every stage of the investment decision process.
Carefully consider the investment objectives, risks, charges, and expenses before investing. For a current prospectus and, if available, a summary prospectus, for Wells Fargo Advantage Funds, containing this and other information, visit wellsfargoadvantagefunds.com. Read it carefully before investing.
Wells Fargo Funds Management, LLC, a wholly owned subsidiary of Wells Fargo & Company, provides investment advisory and administrative services for Wells Fargo Advantage Funds. Other affiliates of Wells Fargo & Company provide subadvisory and other services for the Funds. The Funds are distributed by Wells Fargo Funds Distributor, LLC, Member FINRA/SIPC, an affiliate of Wells Fargo & Company.
“Dow Jones®” and “Dow Jones Target Date IndexesSM” are service marks of Dow Jones Trademark Holdings LLC (“Dow Jones”); have been licensed to CME Group Index Services LLC (“CME Indexes”); and have been sublicensed for use for certain purposes by Global Index Advisors, Inc., and Wells Fargo Funds Management, LLC. The Wells Fargo Advantage Dow Jones Target Date FundsSM, based on the Dow Jones Target Date Indexes, are not sponsored, endorsed, sold, or promoted by Dow Jones, CME Indexes, or their respective affiliates, and none of them makes any representation regarding the advisability of investing in such product(s).
NOT FDIC INSURED ¡ NO BANK GUARANTEE ¡ MAY LOSE VALUE
Not part of the semi-annual report.
Wells Fargo Advantage Funds offers more than 100 mutual funds across a wide range of asset classes, representing over $228 billion in assets under management, as of April 30, 2013.
| | | | |
| Equity funds | | | | |
Asia Pacific Fund | | Enterprise Fund† | | Opportunity Fund† |
C&B Large Cap Value Fund | | Global Opportunities Fund | | Precious Metals Fund |
C&B Mid Cap Value Fund | | Growth Fund | | Premier Large Company Growth Fund |
Capital Growth Fund | | Index Fund | | Small Cap Opportunities Fund |
Common Stock Fund | | International Equity Fund | | Small Cap Value Fund |
Disciplined U.S. Core Fund | | International Value Fund | | Small Company Growth Fund |
Discovery Fund† | | Intrinsic Small Cap Value Fund | | Small Company Value Fund |
Diversified Equity Fund | | Intrinsic Value Fund | | Small/Mid Cap Value Fund |
Diversified International Fund | | Intrinsic World Equity Fund | | Special Mid Cap Value Fund |
Emerging Growth Fund | | Large Cap Core Fund | | Special Small Cap Value Fund |
Emerging Markets Equity Fund | | Large Cap Growth Fund | | Specialized Technology Fund |
Emerging Markets Equity Income Fund | | Large Company Value Fund | | Traditional Small Cap Growth Fund |
Endeavor Select Fund† | | Omega Growth Fund | | Utility and Telecommunications Fund |
| Bond funds | | | | |
Adjustable Rate Government Fund | | High Yield Municipal Bond Fund | | Short Duration Government Bond Fund |
California Limited-Term Tax-Free Fund | | Income Plus Fund | | Short-Term Bond Fund |
California Tax-Free Fund | | Inflation-Protected Bond Fund | | Short-Term High Yield Bond Fund |
Colorado Tax-Free Fund | | Intermediate Tax/AMT-Free Fund | | Short-Term Municipal Bond Fund |
Conservative Income Fund | | | | |
Core Bond Fund | | International Bond Fund | | Strategic Income Fund |
Emerging Markets Local Bond Fund | | Minnesota Tax-Free Fund | | Strategic Municipal Bond Fund |
Government Securities Fund | | Municipal Bond Fund | | Ultra Short-Term Income Fund |
High Income Fund | | North Carolina Tax-Free Fund | | Ultra Short-Term Municipal Income Fund |
High Yield Bond Fund | | Pennsylvania Tax-Free Fund | | Wisconsin Tax-Free Fund |
| Asset allocation funds | | | | |
Absolute Return Fund | | WealthBuilder Equity Portfolio† | | Target 2020 Fund† |
Asset Allocation Fund | | WealthBuilder Growth Allocation Portfolio† | | Target 2025 Fund† |
Diversified Capital Builder Fund | | WealthBuilder Growth Balanced Portfolio† | | Target 2030 Fund† |
Diversified Income Builder Fund | | WealthBuilder Moderate Balanced Portfolio† | | Target 2035 Fund† |
Growth Balanced Fund | | WealthBuilder Tactical Equity Portfolio† | | Target 2040 Fund† |
Index Asset Allocation Fund | | Target Today Fund† | | Target 2045 Fund† |
Moderate Balanced Fund | | Target 2010 Fund† | | Target 2050 Fund† |
WealthBuilder Conservative Allocation Portfolio† | | Target 2015 Fund† | | Target 2055 Fund† |
| Money market funds | | | | |
100% Treasury Money Market Fund | | Heritage Money Market Fund† | | National Tax-Free Money Market Fund |
California Municipal Money Market Fund | | Money Market Fund | | Treasury Plus Money Market Fund |
Cash Investment Money Market Fund | | Municipal Cash Management Money Market Fund | | |
Government Money Market Fund | | Municipal Money Market Fund | | |
| Variable trust funds1 | | | | |
VT Discovery Fund† | | VT Intrinsic Value Fund | | VT Small Cap Growth Fund |
VT Index Asset Allocation Fund | | VT Omega Growth Fund | | VT Small Cap Value Fund |
VT International Equity Fund | | VT Opportunity Fund† | | VT Total Return Bond Fund |
An investment in a money market fund is not insured or guaranteed by the Federal Deposit Insurance Corporation or any other government agency. Although the Wells Fargo Advantage Money Market Funds seek to preserve the value of your investment at $1.00 per share, it is possible to lose money by investing in a money market fund.
| 1. | The variable trust funds are generally available only through insurance company variable contracts. |
| † | In this report, the Wells Fargo Advantage Discovery FundSM, Wells Fargo Advantage Endeavor Select FundSM, Wells Fargo Advantage Enterprise FundSM, Wells Fargo Advantage Opportunity FundSM, Wells Fargo Advantage WealthBuilder Conservative Allocation PortfolioSM, Wells Fargo Advantage WealthBuilder Equity PortfolioSM, Wells Fargo Advantage WealthBuilder Growth Allocation PortfolioSM, Wells Fargo Advantage WealthBuilder Growth Balanced PortfolioSM, Wells Fargo Advantage WealthBuilder Moderate Balanced PortfolioSM, Wells Fargo Advantage WealthBuilder Tactical Equity PortfolioSM, Wells Fargo Advantage Dow Jones Target Today FundSM, Wells Fargo Advantage Dow Jones Target 2010 FundSM, Wells Fargo Advantage Dow Jones Target 2015 FundSM, Wells Fargo Advantage Dow Jones Target 2020 FundSM, Wells Fargo Advantage Dow Jones Target 2025 FundSM, Wells Fargo Advantage Dow Jones Target 2030 FundSM, Wells Fargo Advantage Dow Jones Target 2035 FundSM, Wells Fargo Advantage Dow Jones Target 2040 FundSM, Wells Fargo Advantage Dow Jones Target 2045 FundSM, Wells Fargo Advantage Dow Jones Target 2050 FundSM, Wells Fargo Advantage Dow Jones Target 2055 FundSM, Wells Fargo Advantage Heritage Money Market FundSM, Wells Fargo Advantage VT Discovery FundSM, and Wells Fargo Advantage VT Opportunity FundSM are referred to as the Discovery Fund, Endeavor Select Fund, Enterprise Fund, Opportunity Fund, WealthBuilder Conservative Allocation Portfolio, WealthBuilder Equity Portfolio, WealthBuilder Growth Allocation Portfolio, WealthBuilder Growth Balanced Portfolio, WealthBuilder Moderate Balanced Portfolio, WealthBuilder Tactical Equity Portfolio, Target Today Fund, Target 2010 Fund, Target 2015 Fund, Target 2020 Fund, Target 2025 Fund, Target 2030 Fund, Target 2035 Fund, Target 2040 Fund, Target 2045 Fund, Target 2050 Fund, Target 2055 Fund, Heritage Money Market Fund, VT Discovery Fund, and VT Opportunity Fund, respectively. |
Not part of the semi-annual report.
| | | | |
| 2 | | Wells Fargo Advantage Emerging Markets Equity Income Fund | | Letter to shareholders (unaudited) |

Karla M. Rabusch
President
Wells Fargo Advantage Funds
Investors were heartened by the resilient performance of the German economy and by the fact that the United Kingdom managed to avoid another recession.
Dear Valued Shareholder:
We are pleased to offer you this semi-annual report for the Wells Fargo Advantage Emerging Markets Equity Income Fund for the six-month period that ended April 30, 2013. Much of the period was marked by diminished worries of a sovereign debt default in Europe, partially offset by concerns about slowing economic growth in China. Continued monetary easing by global central banks helped support rallies in developed stock markets, but major emerging markets lagged.
Developed markets posted double-digit returns, but major emerging markets lagged.
Global developed equity markets demonstrated continued strength throughout the reporting period despite a budget fight and sequestration cuts in the U.S. and Europe’s seemingly never-ending debt crisis, with Cyprus becoming the newest addition to a list of countries mired in debt. Investors were heartened by the resilient performance of the German economy and by the fact that the United Kingdom managed to avoid another recession. Relatively positive economic data from the U.S. also aided sentiment for developed-market stocks. Although reported U.S. gross domestic product (GDP) growth came in at a moderate 0.4% annualized rate in the fourth quarter of 2012—in part, due to the temporary aftereffects from Hurricane Sandy, which devastated the Eastern Seaboard in October 2012—GDP growth improved to a 2.4% annualized rate for the first quarter of 2013. Monetary easing by major central banks also supported equity markets.
As judged by various MSCI indexes, major emerging markets generally underperformed. Despite China’s smooth transition to a new generation of political leadership, the country’s decelerating growth rate caused its stock market to lag not only developed markets but also the main MSCI Emerging Markets Index (Net).1 Given China’s importance as a buyer of raw commodities from countries such as Brazil, as well as its key role in Asia’s manufacturing chain, fears of a recession in China led to single-digit returns for other emerging markets.
Central banks continued to provide stimulus.
Major central banks, including the U.S. Federal Reserve Board (Fed) and the European Central Bank (ECB), continued to inject liquidity into the banks and the market through various quantitative easing policies. Throughout the reporting period, the Federal Open Market Committee (FOMC) kept its key interest rates effectively at zero in order to support the economy and the financial system. After its September 2012 meeting, the FOMC announced its intention to keep interest rates low until at least mid-2015 and to make open-ended purchases of $40 billion per month in mortgage-backed securities to support the housing market.
After cutting its key rate to 0.75% in July 2012, the ECB announced in September 2012 that it would purchase an unlimited amount of one- to three-year sovereign debt from countries that had formally applied for a bailout. In May 2013, after the end of the reporting period, the ECB cut its key rate to a historic low of 0.50%. The ECB’s aggressive actions helped ease investor worries about a eurozone sovereign debt default. Moreover, in mid-March 2013, the governor of the Bank of Japan resigned to allow Shinzo Abe, the recently reelected prime minister, to appoint a new bank governor who supported using aggressive monetary policies to attack Japan’s persistent deflation.
| 1. | The Morgan Stanley Capital International Emerging Markets (MSCI Emerging Markets) Index (Net) is a free float-adjusted market capitalization index designed to measure the equity market performance in the global emerging markets. The index is currently composed of 21 emerging markets country indexes. You cannot invest directly in an index. Source: MSCI. MSCI makes no express or implied warranties or representations and shall have no liability whatsoever with respect to any MSCI data contained herein. The MSCI data may not be further redistributed or used as a basis for other indexes or any securities or financial products. This report is not approved, reviewed, or produced by MSCI. |
| | | | | | |
| Letter to shareholders (unaudited) | | Wells Fargo Advantage Emerging Markets Equity Income Fund | | | 3 | |
The debt crisis in the eurozone returned to center stage but with less impact than before.
Ongoing weakness in the Greek economy made it difficult for the country to meet previously agreed upon austerity targets. Because many eurozone banks owned Greek debt and many U.S. banks had financial ties to eurozone banks, investors initially worried that a Greek default would result in another global financial crisis. However, as central banks continued to provide liquidity, investor worries about the effect of a European sovereign debt default on the global economy began to ease. When the tiny eurozone nation of Cyprus was forced to implement capital controls and impose losses on uninsured bank depositors in March 2013, global stock markets remained resilient despite short-term volatility.
Global monetary easing helped push the MSCI EAFE Index (Net)2, an index of developed stock markets, to a 16.90% return for the six-month period. By comparison, the S&P 500 Index3, a barometer of large-cap U.S. stocks, posted a 14.42% return for the reporting period. Within emerging markets, smaller markets, such as the Philippines and Thailand, strongly outperformed the larger markets, such as China, India, and Brazil. The smaller markets are benefiting from high growth rates without some of the imbalances—such as an overreliance on real estate—that are affecting the larger emerging markets.
We employ a diverse array of investment strategies, even as many variables are at work in the market.
The full effect of the European credit crisis remains unknown. Elevated unemployment in the U.S. and Southern Europe continues to pressure consumers and businesses alike. As a whole, Wells Fargo Advantage Funds represents investments across a range of asset classes and investment styles, giving you an opportunity to create a diversified investment portfolio. While diversification4 may not prevent losses in a downturn, we believe it helps manage risk.
Thank you for choosing to invest with Wells Fargo Advantage Funds. We appreciate your confidence in us and remain committed to helping you meet your financial needs. For current information about your fund investments, contact your investment professional, visit our website at wellsfargoadvantagefunds.com, or call us directly at 1-800-222-8222. We are available 24 hours a day, 7 days a week.
Sincerely,

Karla M. Rabusch
President
Wells Fargo Advantage Funds
Within emerging markets, smaller markets, such as the Philippines and Thailand, strongly outperformed the larger markets, such as China, India, and Brazil.
| 2. | The Morgan Stanley Capital International Europe, Australasia, and Far East (MSCI EAFE) Index (Net) is an unmanaged group of securities widely regarded by investors to be representations of the stock markets of Europe, Australasia, and the Far East. You cannot invest directly in an index. |
| 3. | The S&P 500 Index consists of 500 stocks chosen for market size, liquidity, and industry group representation. It is a market-value-weighted index with each stock’s weight in the index proportionate to its market value. You cannot invest directly in an index. |
| 4. | Diversification does not assure or guarantee better performance and cannot eliminate the risk of investment losses. |
| | | | |
| 4 | | Wells Fargo Advantage Emerging Markets Equity Income Fund | | Performance highlights (unaudited) |
Investment objective
The Fund seeks to achieve long-term capital appreciation and current income.
Adviser
Wells Fargo Funds Management, LLC
Subadvisers
Wells Capital Management Incorporated
Wells Capital Management Singapore
Portfolio managers
Anthony L.T. Cragg
Alison Shimada
Average annual total returns (%) as of April 30, 2013
| | | | | | | | | | | | | | | | | | |
| | | | | Including sales charge | | | Excluding sales charge | | | Expense ratios1 (%) | |
| | | Inception date | | Since inception | | | Since inception | | | Gross | | | Net2 | |
| Class A (EQIAX) | | 5-31-2012 | | | 19.48 | | | | 26.77 | | | | 4.34 | | | | 1.65 | |
| Class C (EQICX) | | 5-31-2012 | | | 24.90 | | | | 25.90 | | | | 5.09 | | | | 2.40 | |
| Administrator Class (EQIDX) | | 5-31-2012 | | | – | | | | 27.04 | | | | 4.18 | | | | 1.45 | |
| Institutional Class (EQIIX) | | 5-31-2012 | | | – | | | | 27.20 | | | | 3.91 | | | | 1.25 | |
| MSCI Emerging Markets Index (Net)3 | | – | | | – | | | | 17.10 | | | | – | | | | – | |
Figures quoted represent past performance, which is no guarantee of future results and do not reflect the deduction of taxes that a shareholder may pay on fund distributions or the redemption of fund shares. Investment return and principal value of an investment will fluctuate so that an investor’s shares, when redeemed, may be worth more or less than their original cost. Performance shown without sales charges would be lower if sales charges were reflected. Current performance may be lower or higher than the performance data quoted, which assumes the reinvestment of dividends and capital gains. Current month-end performance is available on the Fund’s website, wellsfargoadvantagefunds.com.
Index returns do not include transaction costs associated with buying and selling securities, any mutual fund fees or expenses, or any taxes. It is not possible to invest directly in an index.
For Class A shares, the maximum front-end sales charge is 5.75%. For Class C shares, the maximum contingent deferred sales charge is 1.00%. Performance including sales charge assumes the sales charge for the corresponding time period. Administrator Class and Institutional Class shares are sold without a front-end sales charge or contingent deferred sales charge.
Stock values fluctuate in response to the activities of individual companies and general market and economic conditions. Foreign investments are especially volatile and can rise or fall dramatically due to differences in the political and economic conditions of the host country. These risks are generally intensified in emerging markets. The use of derivatives may reduce returns and/or increase volatility. Certain investment strategies tend to increase the total risk of an investment (relative to the broader market). The Fund is exposed to regional risk and smaller-company securities risk. Consult the Fund’s prospectus for additional information on these and other risks.
Please see footnotes on page 5.
| | | | | | |
| Performance highlights (unaudited) | | Wells Fargo Advantage Emerging Markets Equity Income Fund | | | 5 | |
| | | | |
| Ten largest equity holdings4 (%) as of April 30, 2013 | |
Shin Corporation PCL | | | 2.68 | |
Industrial & Commercial Bank of China Limited Class H | | | 2.25 | |
SK Telecom Company Limited ADR | | | 2.20 | |
China Construction Bank | | | 2.02 | |
United Microelectronics Corporation | | | 2.01 | |
Taiwan Semiconductor Manufacturing Company Limited ADR | | | 1.95 | |
Philippine Long Distance Telephone Company | | | 1.73 | |
Semirara Mining Corporation | | | 1.70 | |
Telefonica Brasil ADR | | | 1.67 | |
China Mobile Limited | | | 1.62 | |
|
| Sector distribution5 as of April 30, 2013 |
|
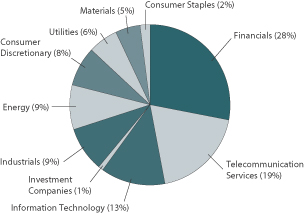 |
| 1. | Reflects the expense ratios as stated in the most recent prospectuses. |
| 2. | The Adviser has committed through February 28, 2014, to waive fees and/or reimburse expenses to the extent necessary to cap the Fund’s Total Annual Fund Operating Expenses After Fee Waiver, excluding certain expenses, at the amounts shown. Brokerage commissions, stamp duty fees, interest, taxes, acquired fund fees and expenses, and extraordinary expenses are excluded from the cap. Without this cap, the Fund’s returns would have been lower. |
| 3. | The Morgan Stanley Capital International Emerging Markets (MSCI Emerging Markets) Index (Net) is a free float-adjusted market capitalization index designed to measure the equity market performance in the global emerging markets. The index is currently composed of 21 emerging markets country indexes. You cannot invest directly in an index. Source: MSCI. MSCI makes no express or implied warranties or representations and shall have no liability whatsoever with respect to any MSCI data contained herein. The MSCI data may not be further redistributed or used as a basis for other indexes or any securities or financial products. This report is not approved, reviewed, or produced by MSCI. |
| 4. | The ten largest equity holdings are calculated based on the value of the securities divided by total net assets of the Fund. Holdings are subject to change and may have changed since the date specified. Top holdings typically include the underlying ordinary shares combined with any depositary receipts. |
| 5. | Sector distribution is subject to change and is calculated based on the total long-term investments of the Fund. |
| | | | |
| 6 | | Wells Fargo Advantage Emerging Markets Equity Income Fund | | Fund expenses (unaudited) |
As a shareholder of the Fund, you incur two types of costs: (1) transaction costs, including sales charges (loads) on purchase payments and contingent deferred sales charges (if any) on redemptions and (2) ongoing costs, including management fees, distribution (12b-1) and/or shareholder service fees, and other Fund expenses. This example is intended to help you understand your ongoing costs (in dollars) of investing in the Fund and to compare these costs with the ongoing costs of investing in other mutual funds.
The example is based on an investment of $1,000 invested at the beginning of the six-month period and held for the entire period from November 1, 2012 to April 30, 2013.
Actual expenses
The “Actual” line of the table below provides information about actual account values and actual expenses. You may use the information in this line, together with the amount you invested, to estimate the expenses that you paid over the period. Simply divide your account value by $1,000 (for example, an $8,600 account value divided by $1,000 = 8.6), then multiply the result by the number in the “Actual” line under the heading entitled “Expenses paid during period” for your applicable class of shares to estimate the expenses you paid on your account during this period.
Hypothetical example for comparison purposes
The “Hypothetical” line of the table below provides information about hypothetical account values and hypothetical expenses based on the Fund’s actual expense ratio and an assumed rate of return of 5% per year before expenses, which is not the Fund’s actual return. The hypothetical account values and expenses may not be used to estimate the actual ending account balance or expenses you paid for the period. You may use this information to compare the ongoing costs of investing in the Fund and other funds. To do so, compare this 5% hypothetical example with the 5% hypothetical examples that appear in the shareholder reports of the other funds.
Please note that the expenses shown in the table are meant to highlight your ongoing costs only and do not reflect any transactional costs, such as sales charges (loads) and contingent deferred sales charges. Therefore, the “Hypothetical” line of the table is useful in comparing ongoing costs only and will not help you determine the relative total costs of owning different funds. In addition, if these transactional costs were included, your costs would have been higher.
| | | | | | | | | | | | | | | | |
| | | Beginning
account value
11-1-2012 | | | Ending
account value
4-30-2013 | | | Expenses
paid during
the period1 | | | Net annual
expense ratio | |
Class A | | | | | | | | | | | | | | | | |
Actual | | $ | 1,000.00 | | | $ | 1,123.84 | | | $ | 8.69 | | | | 1.65 | % |
Hypothetical (5% return before expenses) | | $ | 1,000.00 | | | $ | 1,016.61 | | | $ | 8.25 | | | | 1.65 | % |
Class C | | | | | | | | | | | | | | | | |
Actual | | $ | 1,000.00 | | | $ | 1,119.29 | | | $ | 12.61 | | | | 2.40 | % |
Hypothetical (5% return before expenses) | | $ | 1,000.00 | | | $ | 1,012.89 | | | $ | 11.98 | | | | 2.40 | % |
Administrator Class | | | | | | | | | | | | | | | | |
Actual | | $ | 1,000.00 | | | $ | 1,125.30 | | | $ | 7.64 | | | | 1.45 | % |
Hypothetical (5% return before expenses) | | $ | 1,000.00 | | | $ | 1,017.60 | | | $ | 7.25 | | | | 1.45 | % |
Institutional Class | | | | | | | | | | | | | | | | |
Actual | | $ | 1,000.00 | | | $ | 1,125.87 | | | $ | 6.59 | | | | 1.25 | % |
Hypothetical (5% return before expenses) | | $ | 1,000.00 | | | $ | 1,018.60 | | | $ | 6.26 | | | | 1.25 | % |
| 1. | Expenses paid is equal to the annualized expense ratio of each class multiplied by the average account value over the period, multiplied by the number of days in the most recent fiscal half-year divided by the number of days in the fiscal year (to reflect the one-half-year period). |
| | | | | | |
| Portfolio of investments—April 30, 2013 (unaudited) | | Wells Fargo Advantage Emerging Markets Equity Income Fund | | | 7 | |
| | | | | | | | | | | | |
| Security name | | | | | | Shares | | | Value | |
| | | | | | | | | | | | |
| | | | |
Common Stocks: 90.25% | | | | | | | | | | | | |
| | | | |
| Brazil: 6.77% | | | | | | | | | | | | |
Alupar Investimento SA (Utilities, Electric Utilities) † | | | | | | | 13,560 | | | $ | 122,604 | |
BM&FBOVESPA SA (Financials, Diversified Financial Services) | | | | | | | 26,200 | | | | 181,891 | |
EDP Energias Do Brasil SA (Utilities, Electric Utilities) | | | | | | | 15,700 | | | | 96,283 | |
Natura Cosmeticos SA (Consumer Staples, Personal Products) | | | | | | | 3,500 | | | | 88,639 | |
Telefonica Brasil ADR (Telecommunication Services, Diversified Telecommunication Services) | | | | | | | 8,500 | | | | 225,930 | |
Transmissora Alianca de Energia Eletrica SA Composite Unit (Utilities, Electric Utilities) | | | | | | | 17,400 | | | | 200,199 | |
| | | | |
| | | | | | | | | | | 915,546 | |
| | | | | | | | | | | | |
| | | | |
| Chile: 3.86% | | | | | | | | | | | | |
AFP Habitat SA (Financials, Capital Markets) | | | | | | | 38,760 | | | | 77,199 | |
Aguas Andinas SA Class A (Utilities, Water Utilities) | | | | | | | 175,000 | | | | 139,346 | |
CorpBanca NPV (Financials, Commercial Banks) | | | | | | | 6,652,471 | | | | 91,110 | |
Empresa Nacional de Telecomunicaciones SA (Telecommunication Services, Wireless
Telecommunication Services) | | | | | | | 4,375 | | | | 84,351 | |
Enersis SA (Utilities, Electric Utilities) | | | | | | | 345,000 | | | | 130,030 | |
| | | | |
| | | | | | | | | | | 522,036 | |
| | | | | | | | | | | | |
| | | | |
| China: 15.44% | | | | | | | | | | | | |
ANTA Sports Products Limited (Consumer Discretionary, Textiles, Apparel & Luxury Goods) | | | | | | | 133,000 | | | | 111,402 | |
China BlueChemical Limited (Materials, Chemicals) | | | | | | | 136,000 | | | | 82,895 | |
China Construction Bank (Financials, Commercial Banks) | | | | | | | 326,000 | | | | 273,062 | |
China Mobile Limited (Telecommunication Services, Wireless Telecommunication Services) | | | | | | | 20,000 | | | | 218,939 | |
China Petroleum & Chemical Corporation (Energy, Oil, Gas & Consumable Fuels) | | | | | | | 92,000 | | | | 100,653 | |
Cosco Pacific Limited (Industrials, Transportation Infrastructure) | | | | | | | 112,000 | | | | 148,368 | |
Industrial & Commercial Bank of China Limited Class H (Financials, Commercial Banks) | | | | | | | 432,000 | | | | 303,953 | |
Jiangsu Express Company Limited (Industrials, Transportation Infrastructure) | | | | | | | 124,000 | | | | 135,822 | |
KWG Property Holding Limited (Financials, Real Estate Management & Development) | | | | | | | 164,500 | | | | 113,622 | |
PetroChina Company Limited (Energy, Oil, Gas & Consumable Fuels) | | | | | | | 152,000 | | | | 193,326 | |
Qingling Motors Company Limited (Consumer Discretionary, Automobiles) | | | | | | | 504,000 | | | | 142,884 | |
Shenzhen Expressway Company Limited (Industrials, Transportation Infrastructure) | | | | | | | 264,000 | | | | 108,524 | |
Zhejiang Expressway Company Limited (Industrials, Transportation Infrastructure) | | | | | | | 198,000 | | | | 155,641 | |
| | | | |
| | | | | | | | | | | 2,089,091 | |
| | | | | | | | | | | | |
| | | | |
| Hong Kong: 4.67% | | | | | | | | | | | | |
Bosideng International Holdings Limited (Consumer Discretionary, Textiles, Apparel & Luxury Goods) | | | | | | | 422,000 | | | | 110,936 | |
China Power International Development Limited (Utilities, Independent Power Producers & Energy Traders) | | | | | | | 200,000 | | | | 72,164 | |
Shanghai Industrial Holdings Limited (Industrials, Industrial Conglomerates) | | | | | | | 34,000 | | | | 107,781 | |
SmarTone Telecommunications Holding Limited (Telecommunication Services, Wireless
Telecommunication Services) | | | | | | | 65,500 | | | | 116,649 | |
VTech Holdings Limited (Information Technology, Communications Equipment) | | | | | | | 7,500 | | | | 95,681 | |
Wynn Macau Limited (Consumer Discretionary, Hotels, Restaurants & Leisure) † | | | | | | | 24,000 | | | | 72,834 | |
Xinyi Glass Holding Company Limited (Consumer Discretionary, Auto Components) | | | | | | | 82,000 | | | | 56,110 | |
| | | | |
| | | | | | | | | | | 632,155 | |
| | | | | | | | | | | | |
| | | | |
| India: 1.23% | | | | | | | | | | | | |
ICICI Bank Limited ADR (Financials, Commercial Banks) | | | | | | | 3,550 | | | | 166,211 | |
| | | | | | | | | | | | |
| | | | |
| Indonesia: 1.57% | | | | | | | | | | | | |
PT Telekomunikasi Indonesia Tbk (Telecommunication Services, Diversified Telecommunication Services) | | | | | | | 176,000 | | | | 211,797 | |
| | | | | | | | | | | | |
The accompanying notes are an integral part of these financial statements.
| | | | |
| 8 | | Wells Fargo Advantage Emerging Markets Equity Income Fund | | Portfolio of investments—April 30, 2013 (unaudited) |
| | | | | | | | | | | | |
| Security name | | | | | | Shares | | | Value | |
| | | | | | | | | | | | |
| | | | |
| Malaysia: 4.47% | | | | | | | | | | | | |
Berjaya Sports Toto Bhd (Consumer Discretionary, Hotels, Restaurants & Leisure) | | | | | | | 117,066 | | | $ | 161,603 | |
Malayan Banking Bhd (Financials, Commercial Banks) | | | | | | | 55,700 | | | | 176,116 | |
SP Setia Bhd (Financials, Real Estate Management & Development) | | | | | | | 125,173 | | | | 141,115 | |
Sunway Real Estate Investment (Financials, REITs) | | | | | | | 238,900 | | | | 125,634 | |
| | | | |
| | | | | | | | | | | 604,468 | |
| | | | | | | | | | | | |
| | | | |
| Mexico: 4.19% | | | | | | | | | | | | |
Bolsa Mexicana De Valores SA (Financials, Diversified Financial Services) | | | | | | | 47,500 | | | | 129,798 | |
Grupo Aeroportuario Del Pacifico SAB de CV (Industrials, Transportation Infrastructure) | | | | | | | 10,000 | | | | 57,921 | |
Grupo Financiero Santander SAB de CV (Financials, Commercial Banks) | | | | | | | 21,700 | | | | 70,092 | |
Kimberly-Clark de Mexico SAB de CV (Consumer Staples, Household Products) | | | | | | | 49,000 | | | | 171,589 | |
Macquarie Mexico Real Estate Management SA de CV (Financials, REITs) 144A† | | | | | | | 56,900 | | | | 137,537 | |
| | | | |
| | | | | | | | | | | 566,937 | |
| | | | | | | | | | | | |
| | | | |
| Norway: 0.49% | | | | | | | | | | | | |
Prosafe ASA (Energy, Energy Equipment & Services) | | | | | | | 6,890 | | | | 66,134 | |
| | | | | | | | | | | | |
| | | | |
| Panama: 0.46% | | | | | | | | | | | | |
Banco Latinoamericano De Exportaciones SA E Shares (Financials, Commercial Banks) | | | | | | | 2,750 | | | | 62,398 | |
| | | | | | | | | | | | |
| | | | |
| Philippines: 4.90% | | | | | | | | | | | | |
Globe Telecom Incorporated (Telecommunication Services, Wireless Telecommunication Services) | | | | | | | 5,710 | | | | 198,380 | |
Philippine Long Distance Telephone Company (Telecommunication Services, Wireless Telecommunication Services) | | | | | | | 3,170 | | | | 234,592 | |
Semirara Mining Corporation (Energy, Oil, Gas & Consumable Fuels) | | | | | | | 31,590 | | | | 230,248 | |
| | | | |
| | | | | | | | | | | 663,220 | |
| | | | | | | | | | | | |
| | | | |
| Poland: 2.01% | | | | | | | | | | | | |
KGHM Polska Miedz SA (Materials, Metals & Mining) | | | | | | | 1,313 | | | | 61,498 | |
Powszechny Zaklad Ubezpieczen SA (Financials, Insurance) | | | | | | | 1,530 | | | | 210,869 | |
| | | | |
| | | | | | | | | | | 272,367 | |
| | | | | | | | | | | | |
| | | | |
| Russia: 3.60% | | | | | | | | | | | | |
Lukoil ADR (Energy, Oil, Gas & Consumable Fuels) | | | | | | | 2,265 | | | | 143,601 | |
Mail.Ru Group Limited (Information Technology, Internet Software & Services) | | | | | | | 1,900 | | | | 51,300 | |
Megafon GDR (Telecommunication Services, Wireless Telecommunication Services) † | | | | | | | 2,308 | | | | 71,225 | |
Mining and Metallurgical Company Norilsk Nickel ADR (Materials, Metals & Mining) | | | | | | | 5,543 | | | | 84,919 | |
Mobile Telesystems ADR (Telecommunication Services, Wireless Telecommunication Services) | | | | | | | 6,600 | | | | 136,620 | |
| | | | |
| | | | | | | | | | | 487,665 | |
| | | | | | | | | | | | |
| | | | |
| Singapore: 5.28% | | | | | | | | | | | | |
Ascendas India Trust (Financials, Real Estate Management & Development) | | | | | | | 95,000 | | | | 63,246 | |
Hutchison Port Holdings Trust (Industrials, Transportation Infrastructure) | | | | | | | 137,000 | | | | 113,710 | |
Keppel Corporation Limited (Industrials, Industrial Conglomerates) | | | | | | | 13,000 | | | | 113,039 | |
Keppel REIT (Financials, REITs) | | | | | | | 2,600 | | | | 3,187 | |
Mapletree Greater China Commercial Trust (Financials, REITs) † | | | | | | | 76,000 | | | | 68,799 | |
Religare Health Trust (Financials, REITs) † | | | | | | | 133,000 | | | | 102,582 | |
SembCorp Industries Limited (Industrials, Industrial Conglomerates) | | | | | | | 20,000 | | | | 81,026 | |
Singapore Telecommunications Limited (Telecommunication Services, Diversified Telecommunication Services) | | | | | | | 53,000 | | | | 169,108 | |
| | | | |
| | | | | | | | | | | 714,697 | |
| | | | | | | | | | | | |
The accompanying notes are an integral part of these financial statements.
| | | | | | |
| Portfolio of investments—April 30, 2013 (unaudited) | | Wells Fargo Advantage Emerging Markets Equity Income Fund | | | 9 | |
| | | | | | | | | | | | |
| Security name | | | | | | Shares | | | Value | |
| | | | | | | | | | | | |
| | | | |
| South Africa: 3.80% | | | | | | | | | | | | |
Absa Group Limited (Financials, Commercial Banks) | | | | | | | 3,822 | | | $ | 62,904 | |
African Bank Investments Limited (Financials, Diversified Financial Services) | | | | | | | 16,103 | | | | 51,125 | |
Coronation Fund Managers Limited (Financials, Capital Markets) | | | | | | | 15,447 | | | | 92,439 | |
Kumba Iron Ore Limited (Materials, Metals & Mining) | | | | | | | 1,254 | | | | 66,138 | |
MTN Group Limited (Telecommunication Services, Wireless Telecommunication Services) | | | | | | | 3,655 | | | | 65,895 | |
Sanlam Limited (Financials, Insurance) | | | | | | | 13,100 | | | | 67,139 | |
Sasol Limited (Energy, Oil, Gas & Consumable Fuels) | | | | | | | 2,498 | | | | 107,962 | |
| | | | |
| | | | | | | | | | | 513,602 | |
| | | | | | | | | | | | |
| | | | |
| South Korea: 5.23% | | | | | | | | | | | | |
Kangwon Land Incorporated (Consumer Discretionary, Hotels, Restaurants & Leisure) | | | | | | | 5,060 | | | | 143,121 | |
KT Corporation ADR (Telecommunication Services, Diversified Telecommunication Services) | | | | | | | 13,100 | | | | 213,006 | |
S-Oil Corporation (Energy, Oil, Gas & Consumable Fuels) | | | | | | | 660 | | | | 53,037 | |
SK Telecom Company Limited ADR (Telecommunication Services, Wireless Telecommunication Services) | | | | | | | 15,300 | | | | 298,197 | |
| | | | |
| | | | | | | | | | | 707,361 | |
| | | | | | | | | | | | |
| | | | |
| Taiwan: 12.55% | | | | | | | | | | | | |
ASUSTeK Computer Incorporated (Information Technology, Computers & Peripherals) | | | | | | | 7,000 | | | | 81,475 | |
Chroma ATE Incorporated (Information Technology, Electronic Equipment, Instruments & Components) | | | | | | | 30,000 | | | | 64,347 | |
Chunghwa Telecom Company Limited (Telecommunication Services, Diversified Telecommunication Services) | | | | | | | 42,000 | | | | 133,492 | |
Cleanaway Company Limited (Industrials, Commercial Services & Supplies) | | | | | | | 19,000 | | | | 154,513 | |
CTCI Corporation (Industrials, Construction & Engineering) | | | | | | | 33,000 | | | | 65,973 | |
Huaku Development Company Limited (Financials, Real Estate Management & Development) | | | | | | | 34,680 | | | | 99,650 | |
Mega Financial Holding Company Limited (Financials, Commercial Banks) | | | | | | | 119,065 | | | | 91,784 | |
Novatek Microelectronics Corporation Limited (Information Technology, Semiconductors & Semiconductor Equipment) | | | | | | | 31,000 | | | | 151,261 | |
Radiant Opto-Electronics Corporation (Information Technology, Semiconductors & Semiconductor Equipment) | | | | | | | 17,000 | | | | 69,145 | |
Siliconware Precision Industries Company (Information Technology, Semiconductors & Semiconductor Equipment) | | | | | | | 61,000 | | | | 72,343 | |
Taiwan Semiconductor Manufacturing Company Limited ADR (Information Technology, Semiconductors & Semiconductor Equipment) | | | | | | | 13,850 | | | | 264,258 | |
United Microelectronics Corporation (Information Technology, Semiconductors & Semiconductor Equipment) | | | | | | | 176,000 | | | | 67,091 | |
United Microelectronics Corporation ADR (Information Technology, Semiconductors & Semiconductor Equipment) | | | | | | | 108,600 | | | | 205,254 | |
Wistron Corporation (Information Technology, Computers & Peripherals) | | | | | | | 107,850 | | | | 109,451 | |
WPG Holdings Company Limited (Information Technology, Electronic Equipment, Instruments & Components) | | | | | | | 56,000 | | | | 67,457 | |
| | | | |
| | | | | | | | | | | 1,697,494 | |
| | | | | | | | | | | | |
| | | | |
| Thailand: 5.77% | | | | | | | | | | | | |
Bangkok Bank PCL (Financials, Commercial Banks) | | | | | | | 22,400 | | | | 173,247 | |
Major Cineplex Group PCL (Consumer Discretionary, Media) | | | | | | | 137,400 | | | | 103,928 | |
PTT Global Chemical PCL (Materials, Chemicals) | | | | | | | 56,500 | | | | 140,528 | |
Shin Corporation PCL (Information Technology, Communications Equipment) | | | | | | | 123,600 | | | | 363,220 | |
| | | | |
| | | | | | | | | | | 780,923 | |
| | | | | | | | | | | | |
| | | | |
| Turkey: 2.51% | | | | | | | | | | | | |
Dogus Otomotiv Servis ve Ticaret AS (Consumer Discretionary, Distributors) | | | | | | | 10,062 | | | | 64,264 | |
Ford Otomotiv Sanayi AS (Consumer Discretionary, Automobiles) | | | | | | | 8,768 | | | | 121,781 | |
Turkcell Iletisim Hizmetleri AS (Telecommunication Services, Wireless Telecommunication Services) † | | | | | | | 24,900 | | | | 154,171 | |
| | | | |
| | | | | | | | | | | 340,216 | |
| | | | | | | | | | | | |
The accompanying notes are an integral part of these financial statements.
| | | | |
| 10 | | Wells Fargo Advantage Emerging Markets Equity Income Fund | | Portfolio of investments—April 30, 2013 (unaudited) |
| | | | | | | | | | | | | | |
| Security name | | | | | | | Shares | | | Value | |
| | | | | | | | | | | | | | |
| | | | |
| United Kingdom: 1.45% | | | | | | | | | | | | | | |
HSBC Holdings plc (Financials, Commercial Banks) | | | | | | | | | 18,000 | | | $ | 196,001 | |
| | | | | | | | | | | | | | |
| | | | |
Total Common Stocks (Cost $10,765,894) | | | | | | | | | | | | | 12,210,319 | |
| | | | | | | | | | | | | | |
| | | | |
| | | Dividend yield | | | | | | | | | |
| | | | |
Preferred Stocks: 4.73% | | | | | | | | | | | | | | |
| | | | |
| Brazil: 3.29% | | | | | | | | | | | | | | |
Banco Bradesco SA (Financials, Commercial Banks) ± | | | 2.94 | % | | | | | 7,700 | | | | 126,618 | |
Petroleo Brasileiro SA (Energy, Oil, Gas & Consumable Fuels) ± | | | 4.86 | | | | | | 16,000 | | | | 160,660 | |
Vale SA (Materials, Metals & Mining) ± | | | 6.22 | | | | | | 9,700 | | | | 158,245 | |
| | | | |
| | | | | | | | | | | | | 445,523 | |
| | | | | | | | | | | | | | |
| | | | |
| Russia: 1.44% | | | | | | | | | | | | | | |
Sberbank ADR (Financials, Commercial Banks) (a)± | | | 4.43 | | | | | | 55,329 | | | | 128,405 | |
Surgutneftegas ADR (Energy, Oil, Gas & Consumable Fuels) (a)± | | | 10.00 | | | | | | 94,827 | | | | 66,628 | |
| | | | |
| | | | | | | | | | | | | 195,033 | |
| | | | | | | | | | | | | | |
| | | | |
Total Preferred Stocks (Cost $591,464) | | | | | | | | | | | | | 640,556 | |
| | | | | | | | | | | | | | |
| | | | |
Investment Companies: 0.81% | | | | | | | | | | | | | | |
| | | | |
| Brazil: 0.81% | | | | | | | | | | | | | | |
FII BTG Pactual Corporate Office Fund | | | | | | | | | 1,550 | | | | 110,009 | |
| | | | |
Total Investment Companies (Cost $114,063) | | | | | | | | | | | | | 110,009 | |
| | | | | | | | | | | | | | |
| | | | |
| | | Yield | | | | | | | | | |
| | | | |
Short-Term Investments: 3.63% | | | | | | | | | | | | | | |
| | | | |
| Investment Companies: 3.63% | | | | | | | | | | | | | | |
Wells Fargo Advantage Cash Investment Money Market Fund, Select Class (l)(u) | | | 0.13 | | | | | | 490,885 | | | | 490,885 | |
| | | | | | | | | | | | | | |
| | | | |
Total Short-Term Investments (Cost $490,885) | | | | | | | | | | | | | 490,885 | |
| | | | | | | | | | | | | | |
| | | | | | | | |
Total investments in securities
(Cost $11,962,306) * | | | 99.42 | % | | | 13,451,769 | |
Other assets and liabilities, net | | | 0.58 | | | | 78,116 | |
| | | | | | | | |
| Total net assets | | | 100.00 | % | | $ | 13,529,885 | |
| | | | | | | | |
| ± | Variable rate investment. The rate shown is the rate in effect at period end. |
| (a) | Security is fair valued by the Management Valuation Team, and in certain instances by the Board of Trustees, in accordance with procedures approved by the Board of Trustees. |
| † | Non-income-earning security |
| 144A | Security that may be resold to “qualified institutional buyers” under Rule 144A or security offered pursuant to Section 4(2) of the Securities Act of 1933, as amended. |
| (l) | Investment in an affiliate |
| (u) | Rate shown is the 7-day annualized yield at period end. |
| * | Cost for federal income tax purposes is $12,042,785 and unrealized appreciation (depreciation) consists of: |
| | | | |
Gross unrealized appreciation | | $ | 1,665,393 | |
Gross unrealized depreciation | | | (256,409 | ) |
| | | | |
Net unrealized appreciation | | $ | 1,408,984 | |
The accompanying notes are an integral part of these financial statements.
| | | | | | |
| Statement of assets and liabilities—April 30, 2013 (unaudited) | | Wells Fargo Advantage Emerging Markets Equity Income Fund | | | 11 | |
| | | | |
| | | | |
| |
Assets | | | | |
Investments | | | | |
In unaffiliated securities, at value (see cost below) | | $ | 12,960,884 | |
In affiliated securities, at value (see cost below) | | | 490,885 | |
| | | | |
Total investments, at value (see cost below) | | | 13,451,769 | |
Foreign currency, at value (see cost below) | | | 46,240 | |
Receivable for investments sold | | | 169,970 | |
Receivable for dividends | | | 60,148 | |
Receivable from adviser | | | 4,509 | |
Prepaid expenses and other assets | | | 13,720 | |
| | | | |
Total assets | | | 13,746,356 | |
| | | | |
| |
Liabilities | | | | |
Payable for investments purchased | | | 171,519 | |
Payable for Fund shares redeemed | | | 1,875 | |
Distribution fees payable | | | 402 | |
Due to other related parties | | | 1,756 | |
Shareholder report expenses payable | | | 11,699 | |
Professional fees payable | | | 25,591 | |
Accrued expenses and other liabilities | | | 3,629 | |
| | | | |
Total liabilities | | | 216,471 | |
| | | | |
Total net assets | | $ | 13,529,885 | |
| | | | |
| |
NET ASSETS CONSIST OF | | | | |
Paid-in capital | | $ | 11,258,086 | |
Overdistributed net investment income | | | (22,754 | ) |
Accumulated net realized gains on investments | | | 804,864 | |
Net unrealized gains on investments | | | 1,489,689 | |
| | | | |
Total net assets | | $ | 13,529,885 | |
| | | | |
| |
COMPUTATION OF NET ASSET VALUE AND OFFERING PRICE PER SHARE1 | | | | |
Net assets – Class A | | $ | 1,057,977 | |
Shares outstanding – Class A | | | 86,856 | |
Net asset value per share – Class A | | | $12.18 | |
Maximum offering price per share – Class A2 | | | $12.92 | |
Net assets – Class C | | $ | 669,849 | |
Shares outstanding – Class C | | | 55,000 | |
Net asset value per share – Class C | | | $12.18 | |
Net assets – Administrator Class | | $ | 6,076,617 | |
Shares outstanding – Administrator Class | | | 498,634 | |
Net asset value per share – Administrator Class | | | $12.19 | |
Net assets – Institutional Class | | $ | 5,725,442 | |
Shares outstanding – Institutional Class | | | 469,968 | |
Net asset value per share – Institutional Class | | | $12.18 | |
| |
Investments in unaffiliated securities, at cost | | $ | 11,471,421 | |
| | | | |
Investments in affiliated securities, at cost | | $ | 490,885 | |
| | | | |
Total investments, at cost | | $ | 11,962,306 | |
| | | | |
Foreign currency, at cost | | $ | 46,233 | |
| | | | |
| 1. | The Fund has an unlimited number of authorized shares. |
| 2. | Maximum offering price is computed as 100/94.25 of net asset value. On investments of $50,000 or more, the offering price is reduced. |
The accompanying notes are an integral part of these financial statements.
| | | | |
| 12 | | Wells Fargo Advantage Emerging Markets Equity Income Fund | | Statement of operations—six months ended April 30, 2013 (unaudited) |
| | | | |
| | | | |
| |
Investment income | | | | |
Dividends* | | $ | 188,073 | |
Income from affiliated securities | | | 485 | |
| | | | |
Total investment income | | | 188,558 | |
| | | | |
| |
Expenses | | | | |
Advisory fee | | | 68,580 | |
Administration fees | | | | |
Fund level | | | 3,117 | |
Class A | | | 1,019 | |
Class C | | | 794 | |
Administrator Class | | | 2,842 | |
Institutional Class | | | 2,156 | |
Shareholder servicing fees | | | | |
Class A | | | 980 | |
Class C | | | 764 | |
Administrator Class | | | 7,106 | |
Distribution fees | | | | |
Class C | | | 2,292 | |
Custody and accounting fees | | | 16,310 | |
Professional fees | | | 16,927 | |
Registration fees | | | 53,987 | |
Shareholder report expenses | | | 11,004 | |
Trustees’ fees and expenses | | | 6,776 | |
Other fees and expenses | | | 11,235 | |
| | | | |
Total expenses | | | 205,889 | |
Less: Fee waivers and/or expense reimbursements | | | (117,190 | ) |
| | | | |
Net expenses | | | 88,699 | |
| | | | |
Net investment income | | | 99,859 | |
| | | | |
| |
REALIZED AND UNREALIZED GAINS (LOSSES) ON INVESTMENTS | | | | |
Net realized gains on investments | | | 804,870 | |
Net change in unrealized gains (losses) on investments | | | 559,156 | |
| | | | |
Net realized and unrealized gains (losses) on investments | | | 1,364,026 | |
| | | | |
Net increase in net assets resulting from operations | | $ | 1,463,885 | |
| | | | |
| |
* Net of foreign dividend withholding taxes in the amount of | | | $24,688 | |
The accompanying notes are an integral part of these financial statements.
| | | | | | |
| Statement of changes in net assets | | Wells Fargo Advantage Emerging Markets Equity Income Fund | | | 13 | |
| | | | | | | | | | | | | | | | |
| | | Six months ended April 30, 2013 (unaudited) | | | Year ended October 31, 20121 | |
| | | | |
Operations | | | | | | | | | | | | | | | | |
Net investment income | | | | | | $ | 99,859 | | | | | | | $ | 146,037 | |
Net realized gains on investments | | | | | | | 804,870 | | | | | | | | 219,255 | |
Net change in unrealized gains (losses) on investments | | | | | | | 559,156 | | | | | | | | 930,533 | |
| | | | | | | | | | | | | | | | |
Net increase in net assets resulting from operations | | | | | | | 1,463,885 | | | | | | | | 1,295,825 | |
| | | | | | | | | | | | | | | | |
| | | | |
Distributions to shareholders from | | | | | | | | | | | | | | | | |
Net investment income | | | | | | | | | | | | | | | | |
Class A | | | | | | | (7,108 | ) | | | | | | | (5,528 | ) |
Class C | | | | | | | (3,489 | ) | | | | | | | (3,756 | ) |
Administrator Class | | | | | | | (58,164 | ) | | | | | | | (52,526 | ) |
Institutional Class | | | | | | | (62,936 | ) | | | | | | | (55,444 | ) |
Net realized gains | | | | | | | | | | | | | | | | |
Class A | | | | | | | (13,302 | ) | | | | | | | 0 | |
Class C | | | | | | | (11,585 | ) | | | | | | | 0 | |
Administrator Class | | | | | | | (109,120 | ) | | | | | | | 0 | |
Institutional Class | | | | | | | (104,953 | ) | | | | | | | 0 | |
| | | | | | | | | | | | | | | | |
Total distributions to shareholders | | | | | | | (370,657 | ) | | | | | | | (117,254 | ) |
| | | | | | | | | | | | | | | | |
| | | | |
| | | Shares | | | | | | | | Shares | | | | | |
Capital share transactions | | | | | | | | | | | | | | | | |
Proceeds from shares sold | | | | | | | | | | | | | | | | |
Class A | | | 28,850 | | | | 340,138 | | | | 56,011 | | | | 565,063 | |
Class C | | | 3,316 | | | | 39,122 | | | | 50,000 | | | | 500,000 | |
Administrator Class | | | 34,616 | | | | 414,734 | | | | 468,443 | | | | 4,699,937 | |
Institutional Class | | | 0 | | | | 0 | | | | 450,000 | | | | 4,500,000 | |
| | | | | | | | | | | | | | | | |
| | | | | | | 793,994 | | | | | | | | 10,265,000 | |
| | | | | | | | | | | | | | | | |
Reinvestment of distributions | | | | | | | | | | | | | | | | |
Class A | | | 1,801 | | | | 20,410 | | | | 515 | | | | 5,528 | |
Class C | | | 1,333 | | | | 15,074 | | | | 351 | | | | 3,756 | |
Administrator Class | | | 14,759 | | | | 167,266 | | | | 4,897 | | | | 52,526 | |
Institutional Class | | | 14,797 | | | | 167,889 | | | | 5,171 | | | | 55,444 | |
| | | | | | | | | | | | | | | | |
| | | | | | | 370,639 | | | | | | | | 117,254 | |
| | | | | | | | | | | | | | | | |
Payment for shares redeemed | | | | | | | | | | | | | | | | |
Class A | | | (69 | ) | | | (810 | ) | | | (252 | ) | | | (2,859 | ) |
Administrator Class | | | (24,081 | ) | | | (285,132 | ) | | | 0 | | | | 0 | |
| | | | | | | | | | | | | | | | |
| | | | | | | (285,942 | ) | | | | | | | 0 | |
| | | | | | | | | | | | | | | | |
Net increase in net assets resulting from capital share transactions | | | | | | | 878,691 | | | | | | | | 10,379,395 | |
| | | | | | | | | | | | | | | | |
Total increase in net assets | | | | | | | 1,971,919 | | | | | | | | 11,557,966 | |
| | | | | | | | | | | | | | | | |
| | | | |
Net assets | | | | | | | | | | | | | | | | |
Beginning of period | | | | | | | 11,557,966 | | | | | | | | 0 | |
| | | | | | | | | | | | | | | | |
End of period | | | | | | $ | 13,529,885 | | | | | | | $ | 11,557,966 | |
| | | | | | | | | | | | | | | | |
Undistributed (overdistributed) net investment income | | | | | | $ | (22,754 | ) | | | | | | $ | 9,084 | |
| | | | | | | | | | | | | | | | |
| 1. | For the five months ended October 31, 2012. The Fund commenced operations on May 31, 2012. |
The accompanying notes are an integral part of these financial statements.
| | | | |
| 14 | | Wells Fargo Advantage Emerging Markets Equity Income Fund | | Financial highlights |
(For a share outstanding throughout each period)
| | | | | | | | |
| | | Six months ended
April 30, 2013
(unaudited) | | | Year ended
October 31, 20121 | |
| CLASS A | | |
Net asset value, beginning of period | | $ | 11.17 | | | $ | 10.00 | |
Net investment income | | | 0.10 | 2 | | | 0.13 | |
Net realized and unrealized gains (losses) on investments | | | 1.25 | | | | 1.15 | |
| | | | | | | | |
Total from investment operations | | | 1.35 | | | | 1.28 | |
Distributions to shareholders from | | | | | | | | |
Net investment income | | | (0.11 | ) | | | (0.11 | ) |
Net realized gains | | | (0.23 | ) | | | 0.00 | |
| | | | | | | | |
Total distributions to shareholders | | | (0.34 | ) | | | (0.11 | ) |
Net asset value, end of period | | $ | 12.18 | | | $ | 11.17 | |
Total return3 | | | 12.38 | % | | | 12.80 | % |
Ratios to average net assets (annualized) | | | | | | | | |
Gross expenses | | | 3.49 | % | | | 4.29 | % |
Net expenses | | | 1.65 | % | | | 1.65 | % |
Net investment income | | | 1.69 | % | | | 2.94 | % |
Supplemental data | | | | | | | | |
Portfolio turnover rate | | | 48 | % | | | 39 | % |
Net assets, end of period (000s omitted) | | | $1,058 | | | | $628 | |
| 1. | For the period from May 31, 2012 (commencement of class operations) to October 31, 2012 |
| 2. | Calculated based upon average shares outstanding |
| 3. | Total return calculations do not include any sales charges. Returns for periods of less than one year are not annualized. |
The accompanying notes are an integral part of these financial statements.
| | | | | | |
| Financial highlights | | Wells Fargo Advantage Emerging Markets Equity Income Fund | | | 15 | |
(For a share outstanding throughout each period)
| | | | | | | | |
| | | Six months ended
April 30, 2013
(unaudited) | | | Year ended
October 31, 20121 | |
| CLASS C | | |
Net asset value, beginning of period | | $ | 11.16 | | | $ | 10.00 | |
Net investment income | | | 0.04 | | | | 0.10 | |
Net realized and unrealized gains (losses) on investments | | | 1.28 | | | | 1.13 | |
| | | | | | | | |
Total from investment operations | | | 1.32 | | | | 1.23 | |
Distributions to shareholders from | | | | | | | | |
Net investment income | | | (0.07 | ) | | | (0.07 | ) |
Net realized gains | | | (0.23 | ) | | | 0.00 | |
| | | | | | | | |
Total distributions to shareholders | | | (0.30 | ) | | | (0.07 | ) |
Net asset value, end of period | | $ | 12.18 | | | $ | 11.16 | |
Total return2 | | | 11.93 | % | | | 12.49 | % |
Ratios to average net assets (annualized) | | | | | | | | |
Gross expenses | | | 4.27 | % | | | 5.03 | % |
Net expenses | | | 2.40 | % | | | 2.41 | % |
Net investment income | | | 0.64 | % | | | 2.24 | % |
Supplemental data | | | | | | | | |
Portfolio turnover rate | | | 48 | % | | | 39 | % |
Net assets, end of period (000s omitted) | | | $670 | | | | $562 | |
| 1. | For the period from May 31, 2012 (commencement of class operations) to October 31, 2012 |
| 2. | Total return calculations do not include any sales charges. Returns for periods of less than one year are not annualized. |
The accompanying notes are an integral part of these financial statements.
| | | | |
| 16 | | Wells Fargo Advantage Emerging Markets Equity Income Fund | | Financial highlights |
(For a share outstanding throughout each period)
| | | | | | | | |
| | | Six months ended
April 30, 2013
(unaudited) | | | Year ended
October 31, 20121 | |
| ADMINISTRATOR CLASS | | |
Net asset value, beginning of period | | $ | 11.17 | | | $ | 10.00 | |
Net investment income | | | 0.09 | 2 | | | 0.14 | |
Net realized and unrealized gains (losses) on investments | | | 1.28 | | | | 1.14 | |
| | | | | | | | |
Total from investment operations | | | 1.37 | | | | 1.28 | |
Distributions to shareholders from | | | | | | | | |
Net investment income | | | (0.12 | ) | | | (0.11 | ) |
Net realized gains | | | (0.23 | ) | | | 0.00 | |
| | | | | | | | |
Total distributions to shareholders | | | (0.35 | ) | | | (0.11 | ) |
Net asset value, end of period | | $ | 12.19 | | | $ | 11.17 | |
Total return3 | | | 12.53 | % | | | 12.89 | % |
Ratios to average net assets (annualized) | | | | | | | | |
Gross expenses | | | 3.36 | % | | | 4.14 | % |
Net expenses | | | 1.45 | % | | | 1.45 | % |
Net investment income | | | 1.56 | % | | | 3.17 | % |
Supplemental data | | | | | | | | |
Portfolio turnover rate | | | 48 | % | | | 39 | % |
Net assets, end of period (000s omitted) | | | $6,077 | | | | $5,285 | |
| 1. | For the period from May 31, 2012 (commencement of class operations) to October 31, 2012 |
| 2. | Calculated based upon average shares outstanding |
| 3. | Returns for periods of less than one year are not annualized. |
The accompanying notes are an integral part of these financial statements.
| | | | | | |
| Financial highlights | | Wells Fargo Advantage Emerging Markets Equity Income Fund | | | 17 | |
(For a share outstanding throughout each period)
| | | | | | | | |
| | | Six months ended
April 30, 2013
(unaudited) | | | Year ended
October 31, 20121 | |
| INSTITUTIONAL CLASS | | |
Net asset value, beginning of period | | $ | 11.17 | | | $ | 10.00 | |
Net investment income | | | 0.10 | 2 | | | 0.15 | |
Net realized and unrealized gains (losses) on investments | | | 1.28 | | | | 1.14 | |
| | | | | | | | |
Total from investment operations | | | 1.38 | | | | 1.29 | |
Distributions to shareholders from | | | | | | | | |
Net investment income | | | (0.14 | ) | | | (0.12 | ) |
Net realized gains | | | (0.23 | ) | | | 0.00 | |
| | | | | | | | |
Total distributions to shareholders | | | (0.37 | ) | | | (0.12 | ) |
Net asset value, end of period | | $ | 12.18 | | | $ | 11.17 | |
Total return3 | | | 12.59 | % | | | 12.98 | % |
Ratios to average net assets (annualized) | | | | | | | | |
Gross expenses | | | 3.10 | % | | | 3.92 | % |
Net expenses | | | 1.25 | % | | | 1.25 | % |
Net investment income | | | 1.74 | % | | | 3.39 | % |
Supplemental data | | | | | | | | |
Portfolio turnover rate | | | 48 | % | | | 39 | % |
Net assets, end of period (000s omitted) | | $ | 5,725 | | | $ | 5,082 | |
| 1. | For the period from May 31, 2012 (commencement of class operations) to October 31, 2012 |
| 2. | Calculated based upon average shares outstanding |
| 3. | Returns for periods of less than one year are not annualized. |
The accompanying notes are an integral part of these financial statements.
| | | | |
| 18 | | Wells Fargo Advantage Emerging Markets Equity Income Fund | | Notes to financial statements (unaudited) |
1. ORGANIZATION
Wells Fargo Funds Trust (the “Trust”), a Delaware statutory trust organized on March 10, 1999, is an open-end management investment company registered under the Investment Company Act of 1940, as amended (the “1940 Act”). These financial statements report on Wells Fargo Advantage Emerging Markets Equity Income Fund (the “Fund”) which is a diversified series of the Trust.
2. SIGNIFICANT ACCOUNTING POLICIES
The following significant accounting policies, which are consistently followed in the preparation of the financial statements of the Fund, are in conformity with U.S. generally accepted accounting principles which require management to make estimates and assumptions that affect the reported amounts of assets and liabilities, disclosure of contingent assets and liabilities at the date of the financial statements, and the reported amounts of revenues and expenses during the reporting period. Actual results could differ from those estimates.
Securities valuation
All investments are valued each business day as of the close of regular trading on the New York Stock Exchange (normally 4 p.m. Eastern Time).
Equity securities that are listed on a foreign or domestic exchange, except for The Nasdaq Stock Market, Inc. (“Nasdaq”), are valued at the official closing price or, if none, the last sales price. Securities listed on Nasdaq are valued at the Nasdaq Official Closing Price (“NOCP”). If no NOCP is available, securities are valued at the last sales price. If no sales price is shown on the Nasdaq, the bid price will be used. If no sale occurs on the primary exchange or market for the security that day or if no sale occurs and no bid price is shown on Nasdaq, the prior day’s price will be deemed “stale” and fair values will be determined in accordance with the Fund’s Valuation Procedures.
Securities denominated in foreign currencies are translated into U.S. dollars using the rates of exchange in effect on the day of valuation at a time specified by the Management Valuation Team of Wells Fargo Funds Management, LLC (“Funds Management”).
Many securities markets and exchanges outside the U.S. close prior to the close of the New York Stock Exchange and therefore may not fully reflect trading or events that occur after the close of the principal exchange in which the foreign securities are traded, but before the close of the New York Stock Exchange. If such trading or events are expected to materially affect the value of such securities, then fair value pricing procedures approved by the Board of Trustees are applied. These procedures take into account multiple factors including movements in U.S. securities markets after foreign exchanges close. Foreign securities that are fair valued under these procedures are categorized as Level 2 and the application of these procedures may result in transfers between Level 1 and Level 2. Depending on market activity, such fair valuations may be frequent. Such fair value pricing may result in NAVs that are higher or lower than NAVs based on the last reported sales price or latest quoted bid price. On April 30, 2013, fair value pricing was not used in pricing foreign securities.
Investments in registered open-end investment companies are valued at net asset value.
Investments which are not valued using any of the methods discussed above are valued at their fair value, as determined by procedures established in good faith and approved by the Board of Trustees. The Board of Trustees has established a Valuation Committee comprised of the Trustees and has delegated to it the authority to take any actions regarding the valuation of portfolio securities that the Valuation Committee deems necessary or appropriate, including determining the fair value of portfolio securities, unless the determination has been delegated to the Management Valuation Team. The Board of Trustees retains the authority to make or ratify any valuation decisions or approve any changes to the Valuation Procedures as it deems appropriate. On a quarterly basis, the Board of Trustees receives reports on any valuation actions taken by the Valuation Committee or the Management Valuation Team which may include items for ratification.
Valuations of fair valued securities are compared to the next actual sales price when available, or other appropriate market information to assess the continued appropriateness of the fair valuation methodology used. These securities are fair valued on a day-to-day basis, taking into consideration changes to appropriate market information and any significant changes to the input factors considered in the valuation process until there is a readily available price provided on the exchange or by an independent pricing service. Valuations received from an independent pricing service or broker quotes are periodically validated by comparisons to most recent trades and valuations provided by other independent pricing services in addition to the review of prices by the adviser and/or subadviser. Unobservable inputs used in determining fair valuations are identified based on the type of security, taking into consideration factors utilized by market participants in valuing the investment, knowledge about the issuer and the current market environment.
| | | | | | |
| Notes to financial statements (unaudited) | | Wells Fargo Advantage Emerging Markets Equity Income Fund | | | 19 | |
Foreign currency translation
The accounting records of the Fund are maintained in U.S. dollars. Assets, including investment securities, and liabilities denominated in foreign currency are translated into U.S. dollars at the rates of exchange at a time specified by the Management Valuation Team on the date of valuation. Purchases and sales of securities, and income and expenses are converted at the rate of exchange on the respective dates of such transactions. Reported net realized foreign exchange gains or losses arise from sales of foreign currencies, currency gains or losses realized between the trade and settlement dates on securities transactions, and the difference between the amounts of dividends, interest and foreign withholding taxes recorded and the U.S. dollar equivalent of the amounts actually paid or received. Net unrealized foreign exchange gains and losses arise from changes in the fair value of assets and liabilities other than investments in securities resulting in changes in exchange rates.
The changes in net assets arising from changes in exchange rates and the changes in net assets resulting from changes in market prices of securities are not separately presented. Such changes are recorded with net realized and unrealized gains or losses from investments. Gains and losses from certain foreign currency transactions are treated as ordinary income for U.S. federal income tax purposes.
Security transactions and income recognition
Securities transactions are recorded on a trade date basis. Realized gains or losses are recorded on the basis of identified cost.
Dividend income is recognized on the ex-dividend date, except for certain dividends from foreign securities, which are recorded as soon as the Fund is informed of the ex-dividend date. Dividend income from foreign securities is recorded net of foreign taxes withheld where recovery of such taxes is not assured.
Distributions to shareholders
Distributions to shareholders from net investment income and net realized gains, if any, are recorded on the ex-dividend date. Such distributions are determined in conformity with federal income tax regulations, which may differ in amount or character from net investment income and realized gains recognized for purposes of U.S. generally accepted accounting principles.
Federal and other taxes
The Fund intends to continue to qualify as a regulated investment company by distributing substantially all of its investment company taxable income and any net realized capital gains (after reduction for capital loss carryforwards) sufficient to relieve it from all, or substantially all, federal income taxes. Accordingly, no provision for federal income taxes was required.
The Fund’s income and federal excise tax returns and all financial records supporting those returns since inception are subject to examination by the federal and Delaware revenue authorities. Management has analyzed the Fund’s tax positions taken on federal, state, and foreign tax returns for all open tax years and does not believe that there are any uncertain tax positions that require recognition of a tax liability.
Class allocations
The separate classes of shares offered by the Fund differ principally in applicable sales charges, distribution, shareholder servicing, and administration fees. Shareholders of each class bear certain expenses that pertain to that particular class. All shareholders bear the common expenses of the Fund, earn income from the portfolio, and are allocated any unrealized gains and losses pro rata based on the average daily net assets of each class, without distinction between share classes. Dividends are determined separately for each class based on income and expenses allocable to each class. Realized gains and losses are allocated to each class pro rata based upon the net assets of each class on the date realized. Differences in per share dividend rates generally result from the relative weightings of pro rata income and realized gain allocations and from differences in separate class expenses, including distribution, shareholder servicing, and administration fees.
3. FAIR VALUATION MEASUREMENTS
Fair value measurements of investments are determined within a framework that has established a fair value hierarchy based upon the various data inputs utilized in determining the value of the Fund’s investments. The three-level hierarchy gives the highest priority to unadjusted quoted prices in active markets for identical assets or liabilities (Level 1) and the lowest priority to significant unobservable inputs (Level 3). The Fund’s investments are classified within the fair value hierarchy based on the lowest level of input that is significant to the fair value measurement. The inputs are summarized into three broad levels as follows:
| n | | Level 1 – quoted prices in active markets for identical securities |
| n | | Level 2 – other significant observable inputs (including quoted prices for similar securities, interest rates, prepayment speeds, credit risk, use of amortized cost, etc.) |
| n | | Level 3 – significant unobservable inputs (including the Fund’s own assumptions in determining the fair value of investments) |
| | | | |
| 20 | | Wells Fargo Advantage Emerging Markets Equity Income Fund | | Notes to financial statements (unaudited) |
The inputs or methodologies used for valuing investments in securities are not necessarily an indication of the risk associated with investing in those securities.
As of April 30, 2013, the inputs used in valuing investments in securities were as follows:
| | | | | | | | | | | | | | | | |
| Investments in securities | | Quoted prices (Level 1) | | | Significant other
observable inputs (Level 2) | | | Significant unobservable inputs (Level 3) | | | Total | |
| | | | |
Equity securities | | | | | | | | | | | | | | | | |
Common stocks | | $ | 12,069,791 | | | $ | 140,528 | | | $ | 0 | | | $ | 12,210,319 | |
Preferred stocks | | | 445,523 | | | | 195,033 | | | | 0 | | | | 640,556 | |
Investment companies | | | 110,009 | | | | 0 | | | | 0 | | | | 110,009 | |
| | | | |
Short-term investments | | | | | | | | | | | | | | | | |
Investment companies | | | 490,885 | | | | 0 | | | | 0 | | | | 490,885 | |
| | | $ | 13,116,208 | | | $ | 335,561 | | | $ | 0 | | | $ | 13,451,769 | |
Transfers in and transfers out are recognized at the end of the reporting period. For the six months ended April 30, 2013, the Fund did not have any transfers into/out of Level 1 or Level 2.
4. TRANSACTIONS WITH AFFILIATES AND OTHER EXPENSES
Advisory fee
The Trust has entered into an advisory contract with Funds Management, an indirect wholly owned subsidiary of Wells Fargo & Company (“Wells Fargo”). The adviser is responsible for implementing investment policies and guidelines and for supervising the subadviser, who is responsible for day-to-day portfolio management of the Fund.
Pursuant to the contract, Funds Management is entitled to receive an annual advisory fee starting at 1.10% and declining to 0.95% as the average daily net assets of the Fund increase. For the six months ended April 30, 2013, the advisory fee was equivalent to an annual rate of 1.10% of the Fund’s average daily net assets.
Funds Management has retained the services of certain subadvisers to provide daily portfolio management to the Fund. The fee for subadvisory services is borne by Funds Management. Wells Capital Management Incorporated (“WellsCap”), an affiliate of Funds Management, is a subadviser to the Fund and is entitled to receive a fee from Funds Management at an annual rate starting at 0.65% and declining to 0.45% as the average daily net assets of the Fund increase. Wells Capital Management Singapore, a separately identifiable department of Wells Fargo Bank, N.A., is also a subadviser to the Fund. Out of its fees, WellsCap pays Wells Capital Management Singapore a fee for its services as subadviser at an annual rate starting at 0.25% and declining to 0.15% as the average daily net assets of the Fund increase.
Administration and transfer agent fees
The Trust has entered into an administration agreement with Funds Management. Under this agreement, for providing administrative services, which includes paying fees and expenses for services provided by the transfer agent, sub-transfer agents, omnibus account servicers and record-keepers, Funds Management is entitled to receive from the Fund an annual fund level administration fee starting at 0.05% and declining to 0.03% as the average daily net assets of the Fund increase and a class level administration fee which is calculated based on the average daily net assets of each class as follows:
| | | | |
| | | Class level administration fee | |
Class A, Class C | | | 0.26 | % |
Administrator Class | | | 0.10 | |
Institutional Class | | | 0.08 | |
Funds Management has contractually waived and/or reimbursed advisory and administration fees to the extent necessary to maintain certain net operating expense ratios for the Fund. Waiver of fees and/or reimbursement of expenses by Funds Management were made first from fund level expenses on a proportionate basis and then from class specific expenses. Funds Management has committed through February 28, 2014 to waive fees and/or reimburse expenses to the extent necessary to cap the Fund’s expenses at 1.65% for Class A shares, 2.40% for Class C shares, 1.45% for Administrator Class shares, and 1.25% for Institutional Class shares.
Distribution fees
The Trust has adopted a Distribution Plan for Class C shares of the Fund pursuant to Rule 12b-1 under the 1940 Act. Distribution fees are charged to Class C shares and paid to Wells Fargo Funds Distributor, LLC, the principal underwriter, at an annual rate of 0.75% of the average daily net assets for Class C shares.
| | | | | | |
| Notes to financial statements (unaudited) | | Wells Fargo Advantage Emerging Markets Equity Income Fund | | | 21 | |
For the six months ended April 30, 2013, Wells Fargo Funds Distributor, LLC received $1,036 from the sale of Class A shares.
Shareholder servicing fees
The Trust has entered into contracts with one or more shareholder servicing agents, whereby Class A, Class C and Administrator Class of the Fund is charged a fee at an annual rate of 0.25% of the average daily net assets of each respective class.
A portion of these total shareholder servicing fees were paid to affiliates of Wells Fargo.
5. INVESTMENT PORTFOLIO TRANSACTIONS
Purchases and sales of investments, excluding U.S. government obligations (if any) and short-term securities, for the six months ended April 30, 2013 were $6,048,878 and $5,689,980, respectively.
6. BANK BORROWINGS
The Trust (excluding the money market funds and certain other funds in the Trust) and Wells Fargo Variable Trust are parties to a $150,000,000 revolving credit agreement with State Street Bank and Trust Company, whereby the Fund is permitted to use bank borrowings for temporary or emergency purposes, such as to fund shareholder redemption requests. Interest under the credit agreement is charged to the Fund based on a borrowing rate equal to the higher of the Federal Funds rate in effect on that day plus 1.25% or the overnight LIBOR rate in effect on that day plus 1.25%. In addition, an annual commitment fee equal to 0.10% of the unused balance is allocated to each participating fund. For the six months ended April 30, 2013, the Fund paid $13 in commitment fees.
For the six months ended April 30, 2013, there were no borrowings by the Fund under the agreement.
7. INDEMNIFICATION
Under the Trust’s organizational documents, the officers and directors are indemnified against certain liabilities that may arise out of performance of their duties to the Trust. Additionally, in the normal course of business, the Trust may enter into contracts with service providers that contain a variety of indemnification clauses. The Trust’s maximum exposure under these arrangements is dependent on future claims that may be made against the Fund and, therefore, cannot be estimated.
8. NEW ACCOUNTING PRONOUNCEMENT
In December 2011, the Financial Accounting Standards Board (“FASB”) issued Accounting Standard Update (“ASU”) No. 2011-11, Disclosures about Offsetting Assets and Liabilities. ASU 2011-11, which amends FASB ASC Topic 210, Balance Sheet, creates new disclosure requirements which require entities to disclose both gross and net information for derivatives and other financial instruments that are either offset in the Statement of Assets and Liabilities or subject to an enforceable master netting arrangement or similar agreement. The disclosure requirements are effective for interim and annual reporting periods beginning on or after January 1, 2013. Management is currently assessing the potential impact, in addition to expanded financial statement disclosure, that may result from adopting this ASU.
9. SUBSEQUENT DISTRIBUTION
On May 24, 2013, the Fund declared distributions from net investment income to shareholders of record on May 23, 2013. The per share amounts payable on May 28, 2013 were as follows:
| | | | |
| | | Net investment income | |
Class A | | $ | 0.06912 | |
Class C | | | 0.06046 | |
Administrator Class | | | 0.06823 | |
Institutional Class | | | 0.07093 | |
On June 24, 2013, the Fund declared distributions from net investment income to shareholders of record on June 21, 2013. The per share amounts payable on June 25, 2013 were as follows:
| | | | |
| | | Net investment income | |
Class A | | $ | 0.04714 | |
Class C | | | 0.04028 | |
Administrator Class | | | 0.04704 | |
Institutional Class | | | 0.04921 | |
These distributions are not reflected in the accompanying financial statements.
| | | | |
| 22 | | Wells Fargo Advantage Emerging Markets Equity Income Fund | | Other information (unaudited) |
PROXY VOTING INFORMATION
A description of the policies and procedures that the Fund uses to determine how to vote proxies relating to portfolio securities is available without charge, upon request, by calling 1-800-222-8222, visiting our website at wellsfargoadvantagefunds.com, or visiting the SEC website at sec.gov. Information regarding how the Fund voted proxies relating to portfolio securities during the most recent 12-month period ended June 30 is available without charge on the Fund’s website at wellsfargoadvantagefunds.com or by visiting the SEC website at sec.gov.
PORTFOLIO HOLDINGS INFORMATION
The complete portfolio holdings for the Fund are publicly available on the Fund’s website (wellsfargoadvantagefunds.com) on a monthly, 30-day or more delayed basis. In addition, top ten holdings information for the Fund is publicly available on the Fund’s website on a monthly, seven-day or more delayed basis. The Fund files its complete schedule of portfolio holdings with the SEC for the first and third quarters of each fiscal year on Form N-Q, which is available without charge by visiting the SEC website at sec.gov. In addition, the Fund’s Form N-Q may be reviewed and copied at the SEC’s Public Reference Room in Washington, DC, and at regional offices in New York City, at 233 Broadway, and in Chicago, at 175 West Jackson Boulevard, Suite 900. Information about the Public Reference Room may be obtained by calling 1-800-SEC-0330.
| | | | | | |
| Other information (unaudited) | | Wells Fargo Advantage Emerging Markets Equity Income Fund | | | 23 | |
BOARD OF TRUSTEES AND OFFICERS
Each of the Trustees and Officers listed in the table below acts in identical capacities for the Wells Fargo Advantage family of funds, which consists of 131 funds1 comprising the Wells Fargo Funds Trust, Wells Fargo Variable Trust, Wells Fargo Master Trust and four closed-end funds (collectively the “Fund Complex”). This table should be read in conjunction with the Prospectus and the Statement of Additional Information2. All of the Trustees are also Members of the Audit and Governance Committees of each Trust in the Fund Complex. The mailing address of each Trustee and Officer is 525 Market Street, 12th Floor, San Francisco, CA 94105. Each Trustee and Officer serves an indefinite term, however, each Trustee serves such term until reaching the mandatory retirement age established by the Trustees.
Independent Trustees
| | | | | | |
Name and year of birth | | Position held and length of service* | | Principal occupations during past five years | | Other directorships during
past five years |
Peter G. Gordon
(Born 1942) | | Trustee, since 1998; Chairman, since 2005 | | Co-Founder, Retired Chairman, President and CEO of Crystal Geyser Water Company. Trustee Emeritus, Colby College. | | Asset Allocation Trust |
Isaiah Harris, Jr.
(Born 1952) | | Trustee, since 2009 | | Retired. Prior thereto, President and CEO of BellSouth Advertising and Publishing Corp. from 2005 to 2007, President and CEO of BellSouth Enterprises from 2004 to 2005 and President of BellSouth Consumer Services from 2000 to 2003. Emeritus member of the Iowa State University Foundation Board of Governors. Emeritus Member of the Advisory Board of Iowa State University School of Business. Advisory Board Member, Palm Coast Academy (charter school). Mr. Harris is a certified public accountant. | | CIGNA Corporation; Deluxe Corporation; Asset Allocation Trust |
Judith M. Johnson
(Born 1949) | | Trustee, since 2008; Audit Committee Chairman, since 2008 | | Retired. Prior thereto, Chief Executive Officer and Chief Investment Officer of Minneapolis Employees Retirement Fund from 1996 to 2008. Ms. Johnson is an attorney, certified public accountant and a certified managerial accountant. | | Asset Allocation Trust |
Leroy Keith, Jr.
(Born 1939) | | Trustee, since 2010 | | Chairman, Bloc Global Services (development and construction). Trustee of the Evergreen Funds from 1983 to 2010. Former Managing Director, Almanac Capital Management (commodities firm), former Partner, Stonington Partners, Inc. (private equity fund), former Director, Obagi Medical Products Co. and former Director, Lincoln Educational Services. | | Trustee, Virtus Fund Complex (consisting of 48 portfolios as of 1/31/2013); Asset Allocation Trust |
David F. Larcker
(Born 1950) | | Trustee, since 2009 | | James Irvin Miller Professor of Accounting at the Graduate School of Business, Stanford University, Morgan Stanley Director of the Center for Leadership Development and Research and Senior Faculty of The Rock Center for Corporate Governance since 2006. From 2005 to 2008, Professor of Accounting at the Graduate School of Business, Stanford University. Prior thereto, Ernst & Young Professor of Accounting at The Wharton School, University of Pennsylvania from 1985 to 2005. | | Asset Allocation Trust |
Olivia S. Mitchell
(Born 1953) | | Trustee, since 2006 | | International Foundation of Employee Benefit Plans Professor, Wharton School of the University of Pennsylvania since 1993. Director of Wharton’s Pension Research Council and Boettner Center on Pensions & Retirement Research, and Research Associate at the National Bureau of Economic Research. Previously, Cornell University Professor from 1978 to 1993. | | Asset Allocation Trust |
Timothy J. Penny
(Born 1951) | | Trustee, since 1996 | | President and CEO of Southern Minnesota Initiative Foundation, a non-profit organization, since 2007 and Senior Fellow at the Humphrey Institute Policy Forum at the University of Minnesota since 1995. Member of the Board of Trustees of NorthStar Education Finance, Inc., a non-profit organization, since 2007. | | Asset Allocation Trust |
| | | | |
| 24 | | Wells Fargo Advantage Emerging Markets Equity Income Fund | | Other information (unaudited) |
| | | | | | |
Name and year of birth | | Position held and length of service* | | Principal occupations during past five years | | Other directorships during
past five years |
| Michael S. Scofield (Born 1943) | | Trustee, since 2010 | | Served on the Investment Company Institute’s Board of Governors and Executive Committee from 2008-2011 as well the Governing Council of the Independent Directors Council from 2006-2011 and the Independent Directors Council Executive Committee from 2008-2011. Chairman of the IDC from 2008-2010. Institutional Investor (Fund Directions) Trustee of Year in 2007. Trustee of the Evergreen Funds (and its predecessors) from 1984 to 2010. Chairman of the Evergreen Funds from 2000-2010. Former Trustee of the Mentor Funds. Retired Attorney, Law Offices of Michael S. Scofield. | | Asset Allocation Trust |
| Donald C. Willeke (Born 1940) | | Trustee, since 1996 | | Principal of the law firm of Willeke & Daniels. General Counsel of the Minneapolis Employees Retirement Fund from 1984 until its consolidation into the Minnesota Public Employees Retirement Association on June 30, 2010. Director and Vice Chair of The Tree Trust (non-profit corporation). Director of the American Chestnut Foundation (non-profit corporation). | | Asset Allocation Trust |
| * | Length of service dates reflect the Trustee’s commencement of service with the Trust’s predecessor entities, where applicable. |
Officers
| | | | | | |
Name and year of birth | | Position held and length of service | | Principal occupations during past five years | | |
Karla M. Rabusch
(Born 1959) | | President, since 2003 | | Executive Vice President of Wells Fargo Bank, N.A. and President of Wells Fargo Funds Management, LLC since 2003. | | |
Jeremy DePalma1
(Born 1974) | | Treasurer, since 2012 | | Senior Vice President of Wells Fargo Funds Management, LLC since 2009. Senior Vice President of Evergreen Investment Management Company, LLC from 2008 to 2010. Vice President, Evergreen Investment Services, Inc. from 2004 to 2007. Head of the Fund Reporting and Control Team within Fund Administration from 2005 to 2010. | | |
C. David Messman
(Born 1960) | | Secretary, since 2000; Chief Legal Officer, since 2003 | | Senior Vice President and Secretary of Wells Fargo Funds Management, LLC since 2001. Vice President and Managing Counsel of Wells Fargo Bank, N.A. since 1996. | | |
Debra Ann Early
(Born 1964) | | Chief Compliance Officer, since 2007 | | Chief Compliance Officer of Wells Fargo Funds Management, LLC since 2007. Chief Compliance Officer of Parnassus Investments from 2005 to 2007. Chief Financial Officer of Parnassus Investments from 2004 to 2007. | | |
David Berardi
(Born 1975) | | Assistant Treasurer, since 2009 | | Vice President of Wells Fargo Funds Management, LLC since 2009. Vice President of Evergreen Investment Management Company, LLC from 2008 to 2010. Assistant Vice President of Evergreen Investment Services, Inc. from 2004 to 2008. Manager of Fund Reporting and Control for Evergreen Investment Management Company, LLC from 2004 to 2010. | | |
| 1. | Jeremy DePalma acts as Treasurer of 58 funds and Assistant Treasurer of 73 funds in the Fund Complex. |
| 2. | The Statement of Additional Information includes additional information about the Trustees and is available,without charge, upon request, by calling 1-800-222-8222 or by visiting the website at wellsfargoadvantagefunds.com. |
| | | | | | |
| Other information (unaudited) | | Wells Fargo Advantage Emerging Markets Equity Income Fund | | | 25 | |
BOARD CONSIDERATION OF INVESTMENT ADVISORY AND SUB-ADVISORY AGREEMENTS:
Under Section 15 of the Investment Company Act of 1940 (the “1940 Act”), the Board of Trustees (the “Board”) of Wells Fargo Funds Trust (the “Trust”), all the members of which have no direct or indirect interest in the investment advisory and sub-advisory agreements and are not “interested persons” of the Trust, as defined in the 1940 Act (the “Independent Trustees”), must determine whether to approve the continuation of the Trust’s investment advisory and sub-advisory agreements. In this regard, at an in-person meeting held on March 28-29, 2013 (the “Meeting”), the Board reviewed: (i) an investment advisory agreement with Wells Fargo Funds Management, LLC (“Funds Management”) for Wells Fargo Advantage Emerging Markets Equity Income Fund (the “Fund”), (ii) an investment sub-advisory agreement with Wells Capital Management Incorporated (“WellsCap”), an affiliate of Funds Management, for the Fund, and (iii) an investment sub-advisory agreement with Wells Capital Management Singapore (“WellsCap Singapore”), an affiliate of Funds Management, for the Fund. The investment advisory agreement with Funds Management and the investment sub-advisory agreements with WellsCap and WellsCap Singapore (the “Sub-Advisers”) are collectively referred to as the “Advisory Agreements.”
At the Meeting, the Board considered the factors and reached the conclusions described below relating to the selection of Funds Management and the Sub-Advisers and the continuation of the Advisory Agreements. Prior to the Meeting, the Trustees conferred extensively among themselves and with representatives of Funds Management about these matters. The Board has adopted a team-based approach, with each team consisting of a sub-set of Trustees, to assist the Board in the discharge of its duties in reviewing performance and other matters throughout the year. The Independent Trustees were assisted in their evaluation of the Advisory Agreements by independent legal counsel, from whom they received separate legal advice and with whom they met separately.
In providing information to the Board, Funds Management and the Sub-Advisers were guided by a detailed set of requests for information submitted to them by independent legal counsel on behalf of the Independent Trustees at the start of the Board’s annual contract renewal process earlier in 2013. In considering and approving the Advisory Agreements, the Trustees considered the information they believed relevant, including but not limited to the information discussed below. The Board considered not only the specific information presented in connection with the Meeting, but also the knowledge gained over time through interaction with Funds Management and the Sub-Advisers about various topics. In this regard, the Board reviewed reports of Funds Management at each of its quarterly meetings, which included, among other things, portfolio reviews and performance reports. In addition, the Board and the teams mentioned above confer with portfolio managers at various times throughout the year. The Board did not identify any particular information or consideration that was all-important or controlling, and each individual Trustee may have attributed different weights to various factors.
After its deliberations, the Board unanimously determined that the continuation of the Advisory Agreements is in the best interests of the Fund and its shareholders, and that the compensation payable to Funds Management and the Sub-Advisers is reasonable. The Board considered the continuation of the Advisory Agreements for the Fund as part of its consideration of the continuation of advisory agreements for funds across the complex, but each decision was made on a fund-by-fund basis. The following summarizes a number of important, but not necessarily all, factors considered by the Board in reaching its determination.
Nature, extent and quality of services
The Board received and considered various information regarding the nature, extent and quality of services provided to the Fund by Funds Management and the Sub-Advisers under the Advisory Agreements. This information included, among other things, a summary of the background and experience of senior management of Funds Management, and the qualifications, background, tenure and responsibilities of each of the portfolio managers primarily responsible for the day-to-day portfolio management of the Fund.
The Board evaluated the ability of Funds Management and the Sub-Advisers, based on attributes such as their financial condition, resources and reputation, to attract and retain qualified investment professionals, including research, advisory and supervisory personnel. The Board further considered the compliance programs and compliance records of Funds Management and the Sub-Advisers. In addition, the Board took into account the administrative and other services provided to the Fund by Funds Management and its affiliates and Funds Management’s oversight of the Fund’s various service providers.
Fund performance and expenses
The Board considered the performance results for the Fund over various time periods ended December 31, 2012. The Board also considered these results in comparison to the performance of funds in a universe that was determined by Lipper Inc. (“Lipper”) to be similar to the Fund (the “Universe”), and in comparison to the Fund’s benchmark index and to
| | | | |
| 26 | | Wells Fargo Advantage Emerging Markets Equity Income Fund | | Other information (unaudited) |
other comparative data. Lipper is an independent provider of investment company data. The Board received a description of the methodology used by Lipper to select the mutual funds in the performance Universe. The Board noted that the performance of the Fund (Administrator Class) was higher than the median performance of the Universe for the period under review. The Board also noted that the performance of the Fund was higher than its benchmark, the Morgan Stanley Composite Index Emerging Markets Index (Net), for the period under review.
The Board received and considered information regarding the Fund’s net operating expense ratios and their various components, including actual management fees (which reflect fee waivers, if any, and include advisory, administration and transfer agent fees), custodian and other non-management fees, Rule 12b-1 and non-Rule 12b-1 service fees and fee waiver and expense reimbursement arrangements. The Board also considered these ratios in comparison to the median ratios of funds in class-specific expense groups that were determined by Lipper to be similar to the Fund (the “Groups”). The Board received a description of the methodology used by Lipper to select the mutual funds in the expense Groups. Based on the Lipper reports, the Board noted that the net operating expense ratios of the Fund were equal to, lower than or in range of the median net operating expense ratios of the expense Groups.
Based on its consideration of the factors and information it deemed relevant, including those described here, the Board concluded that the overall performance and expense structure of the Fund supported the re-approval of the Advisory Agreements.
Investment advisory and sub-advisory fee rates
The Board reviewed and considered the contractual investment advisory fee rates that are payable by the Fund to Funds Management for investment advisory services (the “Advisory Agreement Rates”), both on a stand-alone basis and on a combined basis with the Fund’s fund-level and class-level contractual administration fee rates (the “Management Rates”). The Board noted that the administration fees include transfer agency costs. The Board also reviewed and considered the contractual investment sub-advisory fee rates that are payable by Funds Management to WellsCap and by WellsCap to WellsCap Singapore for investment sub-advisory services (the “Sub-Advisory Agreement Rates”).
Among other information reviewed by the Board was a comparison of the Management Rates of the Fund with those of other funds in the expense Groups at a common asset level. The Board noted that the Management Rates of the Fund were higher than the median rates for the Fund’s expense Groups for all classes.
The Board also received and considered information about the portion of the total advisory fee that was retained by Funds Management after payment of the fee to the Sub-Advisers for sub-advisory services. In assessing the reasonableness of this amount, the Board received and evaluated information concerning the nature and extent of responsibilities retained and risks assumed by Funds Management and not delegated to or assumed by the Sub-Advisers, and about Funds Management’s on-going oversight services. In recognition of the fact that the Wells Fargo enterprise provides a suite of combined advisory and sub-advisory services to the Fund through affiliated entities, the Board ascribed limited relevance to the allocation of the total advisory fee between Funds Management and the Sub-Advisers.
The Board also received and considered information about the nature and extent of services offered and fee rates charged by Funds Management and the Sub-Advisers to other types of clients. In this regard, the Board received information about the significantly greater scope of services, and compliance, reporting and other legal burdens and risks of managing mutual funds compared with those associated with managing assets of non-mutual fund clients such as collective funds or institutional separate accounts.
Based on its consideration of the factors and information it deemed relevant, including those described here, the Board determined that the Advisory Agreement Rates and the Sub-Advisory Agreement Rates were reasonable in light of the services covered by the Advisory Agreements.
Profitability
The Board received and considered information concerning the profitability of Funds Management, as well as the profitability of Wells Fargo as a whole, from providing services to the Fund. The Board did not receive or consider to be necessary separate profitability information with respect to the Sub-Advisers, because, as affiliates of Funds Management, their profitability information was subsumed in the collective Wells Fargo profitability analysis provided by Funds Management.
Funds Management explained the methodologies and estimates that it used in calculating the profitability from the Fund and the fund family as a whole. Among other things, the Board noted that the levels of profitability reported on a fund-by-fund basis varied widely, depending on factors such as the size and type of fund. Based on its review, the Board did not deem the profits reported by Funds Management to be at a level that would prevent it from approving the continuation of the Advisory Agreements.
| | | | | | |
| Other information (unaudited) | | Wells Fargo Advantage Emerging Markets Equity Income Fund | | | 27 | |
Economies of scale
With respect to possible economies of scale, the Board reviewed the breakpoints in the Fund’s advisory fee and administration fee structure, which operate generally to reduce the Fund’s expense ratios as the Fund grows in size. It considered that, for a small fund or a fund that shrinks in size, breakpoints conversely can result in higher fee levels. The Board also considered fee waiver and expense reimbursement arrangements as a means of sharing potential economies of scale with the Fund. The Board acknowledged the inherent limitations of any analysis of potential economies of scale and of any attempt to correlate breakpoints with such economies. Nonetheless, the Board concluded that the breakpoints and net operating expense ratio caps appeared to be a reasonable approach to sharing potential economies of scale with the Fund.
Other benefits to Funds Management and the Sub-Advisers
The Board received and considered information regarding potential “fall-out” or ancillary benefits received by Funds Management and its affiliates, including the Sub-Advisers, as a result of their relationship with the Fund. Ancillary benefits could include, among others, benefits directly attributable to other relationships with the Fund and benefits potentially derived from an increase in Funds Management’s and the Sub-Advisers’ business as a result of their relationship with the Fund (such as the ability to market to shareholders other financial products and services offered by Funds Management and its affiliates, including the Sub-Advisers, or to operate other products and services that follow investment strategies similar to those of the Fund).
The Board considered that Wells Fargo Funds Distributor, LLC, an affiliate of Funds Management, serves as distributor to the Fund and receives certain compensation for those services. The Board noted that various financial institutions, including affiliates of Funds Management, may receive distribution-related fees, shareholder servicing payments (including amounts derived from payments under Rule 12b-1 plans) and sub-transfer agency fees in respect of shares sold or held through them and services provided.
The Board also reviewed information about whether and to what extent soft dollar credits are sought and how any such credits are utilized, and any benefits that might be realized by an affiliated broker that handles portfolio transactions for the Fund.
Based on its consideration of the factors and information it deemed relevant, including those described here, the Board did not find that any ancillary benefits received by Funds Management and its affiliates, including the Sub-Advisers, were unreasonable.
Conclusion
After considering the above-described factors and based on its deliberations and its evaluation of the information described above, the Board unanimously approved the continuation of the Advisory Agreements for an additional one-year period.
| | | | |
| 28 | | Wells Fargo Advantage Emerging Markets Equity Income Fund | | List of abbreviations |
The following is a list of common abbreviations for terms and entities that may have appeared in this report.
| ACA | — ACA Financial Guaranty Corporation |
| ADR | — American depositary receipt |
| ADS | — American depositary shares |
| AGC | — Assured Guaranty Corporation |
| AGM | — Assured Guaranty Municipal |
| Ambac | — Ambac Financial Group Incorporated |
| AMT | — Alternative minimum tax |
| BAN | — Bond anticipation notes |
| BHAC | — Berkshire Hathaway Assurance Corporation |
| CAB | — Capital appreciation bond |
| CCAB | — Convertible capital appreciation bond |
| CDA | — Community Development Authority |
| CDO | — Collateralized debt obligation |
| COP | — Certificate of participation |
| DRIVER | — Derivative inverse tax-exempt receipts |
| DW&P | — Department of Water & Power |
| DWR | — Department of Water Resources |
| ECFA | — Educational & Cultural Facilities Authority |
| EDA | — Economic Development Authority |
| EDFA | — Economic Development Finance Authority |
| ETF | — Exchange-traded fund |
| FDIC | — Federal Deposit Insurance Corporation |
| FFCB | — Federal Farm Credit Banks |
| FGIC | — Financial Guaranty Insurance Corporation |
| FHA | — Federal Housing Administration |
| FHLB | — Federal Home Loan Bank |
| FHLMC | — Federal Home Loan Mortgage Corporation |
| FICO | — The Financing Corporation |
| FNMA | — Federal National Mortgage Association |
| GDR | — Global depositary receipt |
| GNMA | — Government National Mortgage Association |
| HCFR | — Healthcare facilities revenue |
| HEFA | — Health & Educational Facilities Authority |
| HEFAR | — Higher education facilities authority revenue |
| HFA | — Housing Finance Authority |
| HFFA | — Health Facilities Financing Authority |
| HUD | — Department of Housing and Urban Development |
| IDA | — Industrial Development Authority |
| IDAG | — Industrial Development Agency |
| IDR | — Industrial development revenue |
| KRW | — Republic of Korea won |
| LIBOR | — London Interbank Offered Rate |
| LLC | — Limited liability company |
| LLP | — Limited liability partnership |
| MBIA | — Municipal Bond Insurance Association |
| MFHR | — Multifamily housing revenue |
| MSTR | — Municipal securities trust receipts |
| MUD | — Municipal Utility District |
| National | — National Public Finance Guarantee Corporation |
| PCFA | — Pollution Control Financing Authority |
| PCL | — Public Company Limited |
| PCR | — Pollution control revenue |
| PFA | — Public Finance Authority |
| PFFA | — Public Facilities Financing Authority |
| PFOTER | — Puttable floating option tax-exempt receipts |
| plc | — Public limited company |
| PUTTER | — Puttable tax-exempt receipts |
| R&D | — Research & development |
| Radian | — Radian Asset Assurance |
| RAN | — Revenue anticipation notes |
| RDA | — Redevelopment Authority |
| RDFA | — Redevelopment Finance Authority |
| REIT | — Real estate investment trust |
| ROC | — Reset option certificates |
| SAVRS | — Select auction variable rate securities |
| SBA | — Small Business Authority |
| SFHR | — Single-family housing revenue |
| SFMR | — Single-family mortgage revenue |
| SPA | — Standby purchase agreement |
| SPDR | — Standard & Poor’s Depositary Receipts |
| STRIPS | — Separate trading of registered interest and principal securities |
| TAN | — Tax anticipation notes |
| TIPS | — Treasury inflation-protected securities |
| TRAN | — Tax revenue anticipation notes |
| TTFA | — Transportation Trust Fund Authority |
| TVA | — Tennessee Valley Authority |
This page is intentionally left blank.
This page is intentionally left blank.


For more information
More information about Wells Fargo Advantage Funds is available free upon request. To obtain literature, please write, email, visit the Fund’s website, or call:
Wells Fargo Advantage Funds
P.O. Box 8266
Boston, MA 02266-8266
Email: wfaf@wellsfargo.com
Website: wellsfargoadvantagefunds.com
Individual investors: 1-800-222-8222
Retail investment professionals: 1-888-877-9275
Institutional investment professionals: 1-866-765-0778
This report and the financial statements contained herein are submitted for the general information of the shareholders of Wells Fargo Advantage Funds. If this report is used for promotional purposes, distribution of the report must be accompanied or preceded by a current prospectus. For a current prospectus and, if available, a summary prospectus containing more complete information, including charges and expenses, call 1-800-222-8222 or visit the Fund’s website at wellsfargoadvantagefunds.com. Please consider the investment objectives, risks, charges, and expenses of the investment carefully before investing. This and other information about Wells Fargo Advantage Funds can be found in the current prospectus. Read the prospectus carefully before you invest or send money.
Wells Fargo Funds Management, LLC, a wholly owned subsidiary of Wells Fargo & Company, provides investment advisory and administrative services for Wells Fargo Advantage Funds. Other affiliates of Wells Fargo & Company provide subadvisory and other services for the Funds. The Funds are distributed by Wells Fargo Funds Distributor, LLC, Member FINRA/SIPC, an affiliate of Wells Fargo & Company.
NOT FDIC INSURED ¡ NO BANK GUARANTEE ¡ MAY LOSE VALUE
© 2013 Wells Fargo Funds Management, LLC. All rights reserved.
| | |
 | | 216833 06-13 SA262/SAR262 4-13 |

Wells Fargo Advantage
Global Opportunities Fund

Semi-Annual Report
April 30, 2013

Reduce clutter. Save trees.
Sign up for electronic delivery of prospectuses and shareholder reports at wellsfargo.com/advantagedelivery
Contents
The views expressed and any forward-looking statements are as of April 30, 2013, unless otherwise noted, and are those of the Fund managers and/or Wells Fargo Funds Management, LLC. Discussions of individual securities, or the markets generally, or any Wells Fargo Advantage Fund are not intended as individual recommendations. Future events or results may vary significantly from those expressed in any forward-looking statements; the views expressed are subject to change at any time in response to changing circumstances in the market. Wells Fargo Funds Management, LLC, disclaims any obligation to publicly update or revise any views expressed or forward-looking statements.
NOT FDIC INSURED ¡ NO BANK GUARANTEE ¡ MAY LOSE VALUE

Wells Fargo investment history
| | |
| 1932 | | Keystone creates one of the first mutual fund families. |
| 1971 | | Wells Fargo & Company introduces one of the first institutional index funds. |
| 1978 | | Wells Fargo applies Markowitz and Sharpe’s research on Modern Portfolio Theory to introduce one of the industry’s first tactical asset allocation models in institutional separately managed accounts. |
| 1984 | | Wells Fargo Stagecoach Funds launches its first asset allocation fund. |
| 1989 | | The Tactical Asset Allocation (TAA) Model is first applied to Wells Fargo’s asset allocation mutual funds. |
| 1994 | | Wells Fargo introduces the LifePath Funds, one of the first suites of target date funds (now the Wells Fargo Advantage Dow Jones Target Date FundsSM). |
| 1996 | | Evergreen Investments and Keystone Funds merge. |
| 1997 | | Wells Fargo launches the Wells Fargo Advantage WealthBuilder PortfoliosSM, a fund-of-funds suite of products that includes the use of quantitative models to shift assets among investment styles. |
| 1999 | | Norwest Advantage Funds and Stagecoach Funds are reorganized into Wells Fargo Funds after the merger of Norwest and Wells Fargo. |
| 2002 | | Evergreen Retail and Evergreen Institutional companies form the umbrella asset management company, Evergreen Investments. |
| 2005 | | The integration of Strong Funds with Wells Fargo Funds creates Wells Fargo Advantage Funds, resulting in one of the top 20 mutual fund companies in the United States. |
| 2006 | | Wells Fargo Advantage Funds relaunches the target date product line as Wells Fargo Advantage Dow Jones Target Date Funds. |
| 2010 | | The mergers and reorganizations of Evergreen and Wells Fargo Advantage mutual funds are completed, unifying the families under the brand of Wells Fargo Advantage Funds. |
Wells Fargo Advantage Funds®
Wells Fargo Advantage Funds skillfully guides institutions, financial advisors, and individuals through the investment terrain to help them reach their financial objectives. Everything we do on behalf of investors is backed by our unique combination of qualifications.
Strength
Our organization is built on the standards of integrity and service established by our parent company—Wells Fargo & Company—more than 150 years ago. And, because we’re part of a highly diversified financial enterprise, we offer the depth of resources to help investors succeed.
Expertise
Our multi-boutique model offers investors access to the independent thinking of premier investment managers that have been chosen for their time-tested strategies. While each team specializes in a specific investment strategy, collectively they provide investors a wide choice of distinct investment styles. Our dedication to investment excellence doesn’t end with our expertise in manager selection—risk management, analysis, and rigorous ongoing review seek to ensure each manager’s investment process remains consistent.
Partnership
Our collaborative approach is built around understanding the needs and goals of our clients. By adhering to core principles of sound judgment and steady guidance, we support you through every stage of the investment decision process.
Carefully consider the investment objectives, risks, charges, and expenses before investing. For a current prospectus and, if available, a summary prospectus, for Wells Fargo Advantage Funds, containing this and other information, visit wellsfargoadvantagefunds.com. Read it carefully before investing.
Wells Fargo Funds Management, LLC, a wholly owned subsidiary of Wells Fargo & Company, provides investment advisory and administrative services for Wells Fargo Advantage Funds. Other affiliates of Wells Fargo & Company provide subadvisory and other services for the Funds. The Funds are distributed by Wells Fargo Funds Distributor, LLC, Member FINRA/SIPC, an affiliate of Wells Fargo & Company.
“Dow Jones®” and “Dow Jones Target Date IndexesSM” are service marks of Dow Jones Trademark Holdings LLC (“Dow Jones”); have been licensed to CME Group Index Services LLC (“CME Indexes”); and have been sublicensed for use for certain purposes by Global Index Advisors, Inc., and Wells Fargo Funds Management, LLC. The Wells Fargo Advantage Dow Jones Target Date FundsSM, based on the Dow Jones Target Date Indexes, are not sponsored, endorsed, sold, or promoted by Dow Jones, CME Indexes, or their respective affiliates, and none of them makes any representation regarding the advisability of investing in such product(s).
NOT FDIC INSURED ¡ NO BANK GUARANTEE ¡ MAY LOSE VALUE
Not part of the semi-annual report.
Wells Fargo Advantage Funds offers more than 100 mutual funds across a wide range of asset classes, representing over $228 billion in assets under management, as of April 30, 2013.
| | | | |
| Equity funds | | | | |
Asia Pacific Fund | | Enterprise Fund† | | Opportunity Fund† |
C&B Large Cap Value Fund | | Global Opportunities Fund | | Precious Metals Fund |
C&B Mid Cap Value Fund | | Growth Fund | | Premier Large Company Growth Fund |
Capital Growth Fund | | Index Fund | | Small Cap Opportunities Fund |
Common Stock Fund | | International Equity Fund | | Small Cap Value Fund |
Disciplined U.S. Core Fund | | International Value Fund | | Small Company Growth Fund |
Discovery Fund† | | Intrinsic Small Cap Value Fund | | Small Company Value Fund |
Diversified Equity Fund | | Intrinsic Value Fund | | Small/Mid Cap Value Fund |
Diversified International Fund | | Intrinsic World Equity Fund | | Special Mid Cap Value Fund |
Emerging Growth Fund | | Large Cap Core Fund | | Special Small Cap Value Fund |
Emerging Markets Equity Fund | | Large Cap Growth Fund | | Specialized Technology Fund |
Emerging Markets Equity Income Fund | | Large Company Value Fund | | Traditional Small Cap Growth Fund |
Endeavor Select Fund† | | Omega Growth Fund | | Utility and Telecommunications Fund |
| Bond funds | | | | |
Adjustable Rate Government Fund | | High Yield Municipal Bond Fund | | Short-Term Bond Fund |
California Limited-Term Tax-Free Fund | | Income Plus Fund | | Short-Term High Yield Bond Fund |
California Tax-Free Fund | | Inflation-Protected Bond Fund | | Short-Term Municipal Bond Fund |
Colorado Tax-Free Fund | | Intermediate Tax/AMT-Free Fund | | Strategic Income Fund |
Conservative Income Fund | | International Bond Fund | | Strategic Municipal Bond Fund |
Core Bond Fund | | Minnesota Tax-Free Fund | | Ultra Short-Term Income Fund |
Emerging Markets Local Bond Fund | | Municipal Bond Fund | | Ultra Short-Term Municipal Income Fund |
Government Securities Fund | | North Carolina Tax-Free Fund | | Wisconsin Tax-Free Fund |
High Income Fund | | Pennsylvania Tax-Free Fund | | |
High Yield Bond Fund | | Short Duration Government Bond Fund | | |
| Asset allocation funds | | | | |
Absolute Return Fund | | WealthBuilder Equity Portfolio† | | Target 2020 Fund† |
Asset Allocation Fund | | WealthBuilder Growth Allocation Portfolio† | | Target 2025 Fund† |
Diversified Capital Builder Fund | | WealthBuilder Growth Balanced Portfolio† | | Target 2030 Fund† |
Diversified Income Builder Fund | | WealthBuilder Moderate Balanced Portfolio† | | Target 2035 Fund† |
Growth Balanced Fund | | WealthBuilder Tactical Equity Portfolio† | | Target 2040 Fund† |
Index Asset Allocation Fund | | Target Today Fund† | | Target 2045 Fund† |
Moderate Balanced Fund | | Target 2010 Fund† | | Target 2050 Fund† |
WealthBuilder Conservative Allocation Portfolio† | | Target 2015 Fund† | | Target 2055 Fund† |
| Money market funds | | | | |
100% Treasury Money Market Fund | | Heritage Money Market Fund† | | National Tax-Free Money Market Fund |
California Municipal Money Market Fund | | Money Market Fund | | Treasury Plus Money Market Fund |
Cash Investment Money Market Fund | | Municipal Cash Management Money Market Fund | | |
Government Money Market Fund | | Municipal Money Market Fund | | |
| Variable trust funds1 | | | | |
VT Discovery Fund† | | VT Intrinsic Value Fund | | VT Small Cap Growth Fund |
VT Index Asset Allocation Fund | | VT Omega Growth Fund | | VT Small Cap Value Fund |
VT International Equity Fund | | VT Opportunity Fund† | | VT Total Return Bond Fund |
An investment in a money market fund is not insured or guaranteed by the Federal Deposit Insurance Corporation or any other government agency. Although the Wells Fargo Advantage Money Market Funds seek to preserve the value of your investment at $1.00 per share, it is possible to lose money by investing in a money market fund.
| 1. | The variable trust funds are generally available only through insurance company variable contracts. |
| † | In this report, the Wells Fargo Advantage Discovery FundSM, Wells Fargo Advantage Endeavor Select FundSM, Wells Fargo Advantage Enterprise FundSM, Wells Fargo Advantage Opportunity FundSM, Wells Fargo Advantage WealthBuilder Conservative Allocation PortfolioSM, Wells Fargo Advantage WealthBuilder Equity PortfolioSM, Wells Fargo Advantage WealthBuilder Growth Allocation PortfolioSM, Wells Fargo Advantage WealthBuilder Growth Balanced PortfolioSM, Wells Fargo Advantage WealthBuilder Moderate Balanced PortfolioSM, Wells Fargo Advantage WealthBuilder Tactical Equity PortfolioSM, Wells Fargo Advantage Dow Jones Target Today FundSM, Wells Fargo Advantage Dow Jones Target 2010 FundSM, Wells Fargo Advantage Dow Jones Target 2015 FundSM, Wells Fargo Advantage Dow Jones Target 2020 FundSM, Wells Fargo Advantage Dow Jones Target 2025 FundSM, Wells Fargo Advantage Dow Jones Target 2030 FundSM, Wells Fargo Advantage Dow Jones Target 2035 FundSM, Wells Fargo Advantage Dow Jones Target 2040 FundSM, Wells Fargo Advantage Dow Jones Target 2045 FundSM, Wells Fargo Advantage Dow Jones Target 2050 FundSM, Wells Fargo Advantage Dow Jones Target 2055 FundSM, Wells Fargo Advantage Heritage Money Market FundSM, Wells Fargo Advantage VT Discovery FundSM, and Wells Fargo Advantage VT Opportunity FundSM are referred to as the Discovery Fund, Endeavor Select Fund, Enterprise Fund, Opportunity Fund, WealthBuilder Conservative Allocation Portfolio, WealthBuilder Equity Portfolio, WealthBuilder Growth Allocation Portfolio, WealthBuilder Growth Balanced Portfolio, WealthBuilder Moderate Balanced Portfolio, WealthBuilder Tactical Equity Portfolio, Target Today Fund, Target 2010 Fund, Target 2015 Fund, Target 2020 Fund, Target 2025 Fund, Target 2030 Fund, Target 2035 Fund, Target 2040 Fund, Target 2045 Fund, Target 2050 Fund, Target 2055 Fund, Heritage Money Market Fund, VT Discovery Fund, and VT Opportunity Fund, respectively. |
Not part of the semi-annual report.
| | | | |
| 2 | | Wells Fargo Advantage Global Opportunities Fund | | Letter to shareholders (unaudited) |

Karla M. Rabusch
President
Wells Fargo Advantage Funds
Investors were heartened by the resilient performance of the German economy and by the fact that the United Kingdom managed to avoid another recession.
Dear Valued Shareholder:
We are pleased to offer you this semi-annual report for the Wells Fargo Advantage Global Opportunities Fund for the six-month period that ended April 30, 2013. Much of the period was marked by diminished worries of a sovereign debt default in Europe, partially offset by concerns about slowing economic growth in China. Continued monetary easing by global central banks helped support rallies in developed stock markets, but major emerging markets lagged.
Developed markets posted double-digit returns, but major emerging markets lagged.
Global developed equity markets demonstrated continued strength throughout the reporting period despite a budget fight and sequestration cuts in the U.S. and Europe’s seemingly never-ending debt crisis, with Cyprus becoming the newest addition to a list of countries mired in debt. Investors were heartened by the resilient performance of the German economy and by the fact that the United Kingdom managed to avoid another recession. Relatively positive economic data from the U.S. also aided sentiment for developed-market stocks. Although reported U.S. gross domestic product (GDP) growth came in at a moderate 0.4% annualized rate in the fourth quarter of 2012—in part, due to the temporary aftereffects from Hurricane Sandy, which devastated the Eastern Seaboard in October 2012—GDP growth improved to a 2.4% annualized rate for the first quarter of 2013. Monetary easing by major central banks also supported equity markets.
As judged by various MSCI indexes, major emerging markets generally underperformed. Despite China’s smooth transition to a new generation of political leadership, the country’s decelerating growth rate caused its stock market to lag not only developed markets but also the main MSCI Emerging Markets Index (Net)1. Given China’s importance as a buyer of raw commodities from countries such as Brazil, as well as its key role in Asia’s manufacturing chain, fears of a recession in China led to single-digit returns for other emerging markets.
Central banks continued to provide stimulus.
Major central banks, including the U.S. Federal Reserve Board (Fed) and the European Central Bank (ECB), continued to inject liquidity into the banks and the market through various quantitative easing policies. Throughout the reporting period, the Federal Open Market Committee (FOMC) kept its key interest rates effectively at zero in order to support the economy and the financial system. After its September 2012 meeting, the FOMC announced its intention to keep interest rates low until at least mid-2015 and to make open-ended purchases of $40 billion per month in mortgage-backed securities to support the housing market.
After cutting its key rate to 0.75% in July 2012, the ECB announced in September 2012 that it would purchase an unlimited amount of one- to three-year sovereign debt from countries that had formally applied for a bailout. In May 2013, after the end of the reporting period, the ECB cut its key rate to a historic low of 0.50%. The ECB’s aggressive actions helped ease investor worries about a eurozone sovereign debt default. Moreover, in mid-March 2013, the governor of the Bank of Japan resigned to allow Shinzo Abe, the recently reelected prime minister, to appoint a new bank governor who supported using aggressive monetary policies to attack Japan’s persistent deflation.
| 1. | The Morgan Stanley Capital International Emerging Markets (MSCI Emerging Markets) Index (Net) is a free float-adjusted market capitalization index designed to measure the equity market performance in the global emerging markets. The index is currently composed of 21 emerging markets country indexes. You cannot invest directly in an index. Source: MSCI. MSCI makes no express or implied warranties or representations and shall have no liability whatsoever with respect to any MSCI data contained herein. The MSCI data may not be further redistributed or used as a basis for other indexes or any securities or financial products. This report is not approved, reviewed, or produced by MSCI. |
| | | | | | |
| Letter to shareholders (unaudited) | | Wells Fargo Advantage Global Opportunities Fund | | | 3 | |
The debt crisis in the eurozone returned to center stage but with less impact than before.
Ongoing weakness in the Greek economy made it difficult for the country to meet previously agreed upon austerity targets. Because many eurozone banks owned Greek debt and many U.S. banks had financial ties to eurozone banks, investors initially worried that a Greek default would result in another global financial crisis. However, as central banks continued to provide liquidity, investor worries about the effect of a European sovereign debt default on the global economy began to ease. When the tiny eurozone nation of Cyprus was forced to implement capital controls and impose losses on uninsured bank depositors in March 2013, global stock markets remained resilient despite short-term volatility.
Global monetary easing helped push the MSCI EAFE Index (Net)2, an index of developed stock markets, to a 16.90% return for the six-month period. By comparison, the S&P 500 Index3, a barometer of large-cap U.S. stocks, posted a 14.42% return for the reporting period. Within emerging markets, smaller markets, such as the Philippines and Thailand, strongly outperformed the larger markets, such as China, India, and Brazil. The smaller markets are benefiting from high growth rates without some of the imbalances—such as an overreliance on real estate—that are affecting the larger emerging markets.
We employ a diverse array of investment strategies, even as many variables are at work in the market.
The full effect of the European credit crisis remains unknown. Elevated unemployment in the U.S. and Southern Europe continues to pressure consumers and businesses alike. As a whole, Wells Fargo Advantage Funds represents investments across a range of asset classes and investment styles, giving you an opportunity to create a diversified investment portfolio. While diversification4 may not prevent losses in a downturn, we believe it helps manage risk.
Thank you for choosing to invest with Wells Fargo Advantage Funds. We appreciate your confidence in us and remain committed to helping you meet your financial needs. For current information about your fund investments, contact your investment professional, visit our website at wellsfargoadvantagefunds.com, or call us directly at 1-800-222-8222. We are available 24 hours a day, 7 days a week.
Sincerely,

Karla M. Rabusch
President
Wells Fargo Advantage Funds
Within emerging markets, smaller markets, such as the Philippines and Thailand, strongly outperformed the larger markets, such as China, India, and Brazil.
| 2. | The Morgan Stanley Capital International Europe, Australasia, and Far East (MSCI EAFE) Index (Net) is an unmanaged group of securities widely regarded by investors to be representations of the stock markets of Europe, Australasia, and the Far East. You cannot invest directly in an index. |
| 3. | The S&P 500 Index consists of 500 stocks chosen for market size, liquidity, and industry group representation. It is a market-value-weighted index with each stock’s weight in the index proportionate to its market value. You cannot invest directly in an index. |
| 4. | Diversification does not assure or guarantee better performance and cannot eliminate the risk of investment losses. |
| | | | |
| 4 | | Wells Fargo Advantage Global Opportunities Fund | | Performance highlights (unaudited) |
Investment objective
The Fund seeks long-term capital appreciation.
Adviser
Wells Fargo Funds Management, LLC
Subadviser
Wells Capital Management Incorporated
Portfolio managers
Oleg Makhorine
James M. Tringas, CFA
Average annual total returns1 (%) as of April 30, 2013
| | | | | | | | | | | | | | | | | | | | | | | | | | | | | | | | | | |
| | | | | Including sales charge | | | Excluding sales charge | | | Expense ratios2 (%) | |
| | | Inception date | | 1 year | | | 5 year | | | 10 year | | | 1 year | | | 5 year | | | 10 year | | | Gross | | | Net3 | |
| Class A (EKGAX) | | 3-16-1988 | | | 7.19 | | | | 1.33 | | | | 12.12 | | | | 13.73 | | | | 2.54 | | | | 12.79 | | | | 1.56 | | | | 1.56 | |
| Class B (EKGBX)* | | 2-1-1993 | | | 7.89 | | | | 1.39 | | | | 12.22 | | | | 12.89 | | | | 1.77 | | | | 12.22 | | | | 2.31 | | | | 2.31 | |
| Class C (EKGCX) | | 2-1-1993 | | | 11.90 | | | | 1.77 | | | | 11.97 | | | | 12.90 | | | | 1.77 | | | | 11.97 | | | | 2.31 | | | | 2.31 | |
| Administrator Class (EKGYX) | | 1-13-1997 | | | – | | | | – | | | | – | | | | 13.92 | | | | 2.75 | | | | 13.07 | | | | 1.40 | | | | 1.40 | |
| Institutional Class (EKGIX) | | 7-30-2010 | | | – | | | | – | | | | – | | | | 14.22 | | | | 2.90 | | | | 13.15 | | | | 1.13 | | | | 1.13 | |
| S&P Developed SmallCap Index4 | | – | | | – | | | | – | | | | – | | | | 17.62 | | | | 4.30 | | | | 11.91 | | | | – | | | | – | |
| * | | Class B shares are closed to investment, except in connection with the reinvestment of any distributions and permitted exchanges. |
Figures quoted represent past performance, which is no guarantee of future results and do not reflect the deduction of taxes that a shareholder may pay on fund distributions or the redemption of fund shares. Investment return and principal value of an investment will fluctuate so that an investor’s shares, when redeemed, may be worth more or less than their original cost. Performance shown without sales charges would be lower if sales charges were reflected. Current performance may be lower or higher than the performance data quoted, which assumes the reinvestment of dividends and capital gains. Current month-end performance is available on the Fund’s website, wellsfargoadvantagefunds.com.
Index returns do not include transaction costs associated with buying and selling securities, any mutual fund fees or expenses, or any taxes. It is not possible to invest directly in an index.
For Class A shares, the maximum front-end sales charge is 5.75%. For Class B shares, the maximum contingent deferred sales charge is 5.00%. For Class C shares, the maximum contingent deferred sales charge is 1.00%. Performance including sales charge assumes the sales charge for the corresponding time period. Administrator Class and Institutional Class shares are sold without a front-end sales charge or contingent deferred sales charge.
Stock values fluctuate in response to the activities of individual companies and general market and economic conditions. Foreign investments are especially volatile and can rise or fall dramatically due to differences in the political and economic conditions of the host country. These risks are generally intensified in emerging markets. The use of derivatives may reduce returns and/or increase volatility. Certain investment strategies tend to increase the total risk of an investment (relative to the broader market). The Fund is exposed to country concentration risk, regional risk and smallercompany securities risk. Consult the Fund’s prospectus for additional information on these and other risks.
Please see footnotes on page 5.
| | | | | | |
| Performance highlights (unaudited) | | Wells Fargo Advantage Global Opportunities Fund | | | 5 | |
| | | | |
| Ten largest equity holdings5 (%) as of April 30, 2013 | |
Bovis Homes Group plc | | | 1.56 | |
Macquarie Infrastructure Company LLC | | | 1.48 | |
Franklin Electric Company Incorporated | | | 1.47 | |
Kadant Incorporated | | | 1.41 | |
First Citizens BancShares Incorporated | | | 1.39 | |
ACI Worldwide Incorporated | | | 1.37 | |
The Men’s Wearhouse Incorporated | | | 1.34 | |
TreeHouse Foods Incorporated | | | 1.34 | |
Brown & Brown Incorporated | | | 1.30 | |
First Niagara Financial Group Incorporated | | | 1.27 | |
| | |
| Sector distribution6 as of April 30, 2013 |
|
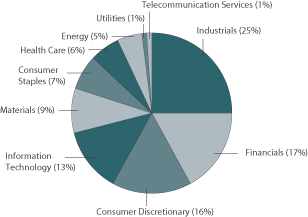 |
| 1. | Historical performance shown for the Institutional Class shares prior to their inception reflects the performance of the Administrator Class shares, and includes the higher expenses applicable to the Administrator Class shares. If these expenses had not been included, returns would be higher. Historical performance shown for all classes of the Fund prior to July 19, 2010, is based on the performance of the Fund’s predecessor, Evergreen Global Opportunities Fund. |
| 2. | Reflects the expense ratios as stated in the most recent prospectuses. |
| 3. | The Adviser has committed through February 28, 2014, to waive fees and/or reimburse expenses to the extent necessary to cap the Fund’s Total Annual Fund Operating Expenses After Fee Waiver, excluding certain expenses, at 1.55% for Class A, 2.30% for Class B, 2.30% for Class C, 1.40% for Administrator Class, and 1.15% for Institutional Class. Brokerage commissions, stamp duty fees, interest, taxes, acquired fund fees and expenses, and extraordinary expenses are excluded from the cap. Without this cap, the Fund’s returns would have been lower. |
| 4. | The S&P Developed SmallCap Index is a float-adjusted market capitalization index designed to measure the equity market performance of small capitalization companies located in developed markets. The index is comprised of companies within the bottom 15% of the cumulative market capitalization in developed markets. The index covers all publicly listed equities with float-adjusted market values of U.S. $100 million or more and annual dollar value traded of at least U.S. $50 million in all included countries. You cannot invest directly in an index. |
| 5. | The ten largest equity holdings are calculated based on the value of the securities divided by total net assets of the Fund. Holdings are subject to change and may have changed since the date specified. Top holdings typically include the underlying ordinary shares combined with any depositary receipts. |
| 6. | Sector distribution is subject to change and is calculated based on the total long-term investments of the Fund. |
| | | | |
| 6 | | Wells Fargo Advantage Global Opportunities Fund | | Fund expenses (unaudited) |
As a shareholder of the Fund, you incur two types of costs: (1) transaction costs, including sales charges (loads) on purchase payments and contingent deferred sales charges (if any) on redemptions and (2) ongoing costs, including management fees, distribution (12b-1) and/or shareholder service fees, and other Fund expenses. This example is intended to help you understand your ongoing costs (in dollars) of investing in the Fund and to compare these costs with the ongoing costs of investing in other mutual funds.
The example is based on an investment of $1,000 invested at the beginning of the six-month period and held for the entire period from November 1, 2012 to April 30, 2013.
Actual expenses
The “Actual” line of the table below provides information about actual account values and actual expenses. You may use the information in this line, together with the amount you invested, to estimate the expenses that you paid over the period. Simply divide your account value by $1,000 (for example, an $8,600 account value divided by $1,000 = 8.6), then multiply the result by the number in the “Actual” line under the heading entitled “Expenses paid during period” for your applicable class of shares to estimate the expenses you paid on your account during this period.
Hypothetical example for comparison purposes
The “Hypothetical” line of the table below provides information about hypothetical account values and hypothetical expenses based on the Fund’s actual expense ratio and an assumed rate of return of 5% per year before expenses, which is not the Fund’s actual return. The hypothetical account values and expenses may not be used to estimate the actual ending account balance or expenses you paid for the period. You may use this information to compare the ongoing costs of investing in the Fund and other funds. To do so, compare this 5% hypothetical example with the 5% hypothetical examples that appear in the shareholder reports of the other funds.
Please note that the expenses shown in the table are meant to highlight your ongoing costs only and do not reflect any transactional costs, such as sales charges (loads) and contingent deferred sales charges. Therefore, the “Hypothetical” line of the table is useful in comparing ongoing costs only and will not help you determine the relative total costs of owning different funds. In addition, if these transactional costs were included, your costs would have been higher.
| | | | | | | | | | | | | | | | |
| | | Beginning
account value
11-1-2012 | | | Ending
account value
4-30-2013 | | | Expenses
paid during
the period¹ | | | Net annual
expense ratio | |
Class A | | | | | | | | | | | | | | | | |
Actual | | $ | 1,000.00 | | | $ | 1,123.58 | | | $ | 8.16 | | | | 1.55 | % |
Hypothetical (5% return before expenses) | | $ | 1,000.00 | | | $ | 1,017.11 | | | $ | 7.75 | | | | 1.55 | % |
Class B | | | | | | | | | | | | | | | | |
Actual | | $ | 1,000.00 | | | $ | 1,119.59 | | | $ | 12.09 | | | | 2.30 | % |
Hypothetical (5% return before expenses) | | $ | 1,000.00 | | | $ | 1,013.39 | | | $ | 11.48 | | | | 2.30 | % |
Class C | | | | | | | | | | | | | | | | |
Actual | | $ | 1,000.00 | | | $ | 1,119.72 | | | $ | 12.09 | | | | 2.30 | % |
Hypothetical (5% return before expenses) | | $ | 1,000.00 | | | $ | 1,013.39 | | | $ | 11.48 | | | | 2.30 | % |
Administrator Class | | | | | | | | | | | | | | | | |
Actual | | $ | 1,000.00 | | | $ | 1,124.56 | | | $ | 7.37 | | | | 1.40 | % |
Hypothetical (5% return before expenses) | | $ | 1,000.00 | | | $ | 1,017.85 | | | $ | 7.00 | | | | 1.40 | % |
Institutional Class | | | | | | | | | | | | | | | | |
Actual | | $ | 1,000.00 | | | $ | 1,126.15 | | | $ | 6.06 | | | | 1.15 | % |
Hypothetical (5% return before expenses) | | $ | 1,000.00 | | | $ | 1,019.09 | | | $ | 5.76 | | | | 1.15 | % |
| 1. | Expenses paid is equal to the annualized expense ratio of each class multiplied by the average account value over the period, multiplied by the number of days in the most recent fiscal half-year divided by the number of days in the fiscal year (to reflect the one-half-year period). |
| | | | | | |
| Portfolio of investments—April 30, 2013 (unaudited) | | Wells Fargo Advantage Global Opportunities Fund | | | 7 | |
| | | | | | | | | | | | |
| Security name | | | | | | Shares | | | Value | |
| | | | | | | | | | | | |
| | | | |
Common Stocks: 97.66% | | | | | | | | | | | | |
| | | | |
| Argentina: 0.47% | | | | | | | | | | | | |
IRSA Inversiones y Representaciones SA ADR (Financials, Real Estate Management & Development) | | | | | | | 148,202 | | | $ | 1,277,501 | |
| | | | | | | | | | | | |
| | | | |
| Australia: 1.29% | | | | | | | | | | | | |
Atlas Iron Limited (Materials, Metals & Mining) | | | | | | | 1,411,882 | | | | 1,222,188 | |
Perseus Mining Limited (Materials, Metals & Mining) † | | | | | | | 515,237 | | | | 723,768 | |
Tiger Resources Limited (Materials, Metals & Mining) † | | | | | | | 6,290,400 | | | | 1,565,102 | |
| | | | |
| | | | | | | | | | | 3,511,058 | |
| | | | | | | | | | | | |
| | | | |
| Austria: 0.54% | | | | | | | | | | | | |
RHI AG (Materials, Chemicals) « | | | | | | | 44,429 | | | | 1,468,328 | |
| | | | | | | | | | | | |
| | | | |
| Brazil: 0.29% | | | | | | | | | | | | |
Cyrela Brazil Realty SA Empreendimentos e Participacoes (Consumer Discretionary, Household Durables) | | | | | | | 86,300 | | | | 784,173 | |
| | | | | | | | | | | | |
| | | | |
| Canada: 3.56% | | | | | | | | | | | | |
Alamos Gold Incorporated (Materials, Metals & Mining) | | | | | | | 121,531 | | | | 1,697,296 | |
B2Gold Corporation (Materials, Metals & Mining) † | | | | | | | 278,843 | | | | 700,256 | |
Copper Mountain Mining Corporation (Materials, Metals & Mining) † | | | | | | | 334,443 | | | | 670,579 | |
First Quantum Minerals Limited (Materials, Metals & Mining) | | | | | | | 35,302 | | | | 616,373 | |
MBAC Fertilizer Corporation (Materials, Chemicals) †« | | | | | | | 662,864 | | | | 1,473,835 | |
Mercator Minerals Limited (Materials, Metals & Mining) † | | | | | | | 2,230,671 | | | | 619,969 | |
Parex Resources Incorporated (Energy, Oil, Gas & Consumable Fuels) † | | | | | | | 282,382 | | | | 1,261,322 | |
Surge Energy Incorporated (Energy, Oil, Gas & Consumable Fuels) †« | | | | | | | 626,418 | | | | 1,896,446 | |
Taseko Mines Limited (Materials, Metals & Mining) † | | | | | | | 319,893 | | | | 752,540 | |
| | | | |
| | | | | | | | | | | 9,688,616 | |
| | | | | | | | | | | | |
| | | | |
| China: 1.86% | | | | | | | | | | | | |
51job Incorporated ADR (Industrials, Professional Services) † | | | | | | | 30,323 | | | | 1,746,605 | |
Pactera Technology International Limited ADR (Information Technology, IT Services) †« | | | | | | | 261,547 | | | | 1,331,274 | |
Sinotrans Limited (Industrials, Air Freight & Logistics) | | | | | | | 9,264,000 | | | | 1,981,694 | |
| | | | |
| | | | | | | | | | | 5,059,573 | |
| | | | | | | | | | | | |
| | | | |
| Denmark: 1.03% | | | | | | | | | | | | |
Jyske Bank (Financials, Commercial Banks) † | | | | | | | 71,949 | | | | 2,799,874 | |
| | | | | | | | | | | | |
| | | | |
| France: 4.57% | | | | | | | | | | | | |
ALTEN (Information Technology, IT Services) | | | | | | | 62,095 | | | | 2,237,392 | |
Atos Origin SA (Information Technology, IT Services) | | | | | | | 29,237 | | | | 2,034,920 | |
Laurent Perrier Group (Consumer Staples, Beverages) | | | | | | | 6,601 | | | | 534,631 | |
Mersen (Materials, Chemicals) | | | | | | | 64,404 | | | | 1,488,536 | |
SCOR SE (Financials, Insurance)« | | | | | | | 107,396 | | | | 3,259,374 | |
Teleperformance (Industrials, Commercial Services & Supplies) | | | | | | | 65,487 | | | | 2,882,246 | |
| | | | |
| | | | | | | | | | | 12,437,099 | |
| | | | | | | | | | | | |
| | | | |
| Germany: 2.55% | | | | | | | | | | | | |
Amadeus Fire AG (Industrials, Commercial Services & Supplies) | | | | | | | 24,378 | | | | 1,451,129 | |
Gerresheimer AG (Health Care, Health Care Equipment & Supplies) | | | | | | | 15,744 | | | | 898,926 | |
GSW Immobilien AG (Financials, Real Estate Management & Development) | | | | | | | 45,155 | | | | 1,811,956 | |
Hochtief AG (Industrials, Construction & Engineering) † | | | | | | | 32,160 | | | | 2,232,010 | |
United Internet AG (Information Technology, Internet Software & Services) | | | | | | | 20,093 | | | | 550,928 | |
| | | | |
| | | | | | | | | | | 6,944,949 | |
| | | | | | | | | | | | |
The accompanying notes are an integral part of these financial statements.
| | | | |
| 8 | | Wells Fargo Advantage Global Opportunities Fund | | Portfolio of investments—April 30, 2013 (unaudited) |
| | | | | | | | | | | | |
| Security name | | | | | | Shares | | | Value | |
| | | | | | | | | | | | |
| | | | |
| Hong Kong: 1.24% | | | | | | | | | | | | |
China High Precision Automation Group (Information Technology, Electronic Equipment, Instruments & Components) «(a)(i) | | | | | | | 3,447,000 | | | $ | 177,677 | |
Emperor Watch & Jewellery Limited (Consumer Discretionary, Specialty Retail) | | | | | | | 11,230,000 | | | | 1,143,238 | |
Luk Fook Holdings International Limited (Consumer Discretionary, Specialty Retail) | | | | | | | 356,000 | | | | 1,009,259 | |
Techtronic Industries Company Limited (Consumer Discretionary, Household Durables) | | | | | | | 437,500 | | | | 1,045,244 | |
| | | | |
| | | | | | | | | | | 3,375,418 | |
| | | | | | | | | | | | |
| | | | |
| Ireland: 0.43% | | | | | | | | | | | | |
C&C Group plc (Consumer Staples, Beverages) | | | | | | | 185,219 | | | | 1,157,908 | |
| | | | | | | | | | | | |
| | | | |
| Israel: 0.69% | | | | | | | | | | | | |
Bezeq The Israeli Telecommunication Corporation Limited (Telecommunication Services, Diversified Telecommunication Services) | | | | | | | 1,300,259 | | | | 1,886,010 | |
| | | | | | | | | | | | |
| | | | |
| Italy: 1.35% | | | | | | | | | | | | |
Amplifon SpA (Health Care, Health Care Equipment & Supplies) | | | | | | | 221,585 | | | | 1,141,002 | |
Davide Campari-Milano SpA (Consumer Staples, Beverages) | | | | | | | 150,106 | | | | 1,219,699 | |
Mediobanca SpA (Financials, Capital Markets) | | | | | | | 205,273 | | | | 1,304,634 | |
| | | | |
| | | | | | | | | | | 3,665,335 | |
| | | | | | | | | | | | |
| | | | |
| Japan: 10.54% | | | | | | | | | | | | |
Aeon Delight Company Limited (Industrials, Commercial Services & Supplies) | | | | | | | 119,100 | | | | 2,466,666 | |
Anritsu Corporation (Information Technology, Electronic Equipment, Instruments & Components) | | | | | | | 131,000 | | | | 1,955,224 | |
Credit Saison Company Limited (Financials, Consumer Finance) | | | | | | | 37,300 | | | | 1,089,328 | |
FamilyMart Company Limited (Consumer Staples, Food & Staples Retailing) | | | | | | | 53,300 | | | | 2,435,775 | |
Hitachi Chemical Company Limited (Industrials, Machinery) | | | | | | | 151,700 | | | | 2,373,109 | |
Isuzu Motors Limited (Consumer Discretionary, Automobiles) | | | | | | | 366,000 | | | | 2,436,621 | |
Musashi Seimitsu Industry Company Limited (Consumer Discretionary, Auto Components) | | | | | | | 121,200 | | | | 2,920,437 | |
ORIX JREIT Incorporated (Financials, REITs) | | | | | | | 1,815 | | | | 2,450,162 | |
Shimanura Company Limited (Consumer Discretionary, Specialty Retail) | | | | | | | 12,900 | | | | 1,628,958 | |
Sumitomo Heavy Industries Limited (Industrials, Machinery) | | | | | | | 314,000 | | | | 1,391,476 | |
Taikisha Limited (Industrials, Building Products) | | | | | | | 27,200 | | | | 615,233 | |
Tamron Company Limited (Materials, Chemicals) | | | | | | | 46,737 | | | | 1,023,099 | |
Tokai Carbon Company Limited (Industrials, Electrical Equipment) | | | | | | | 223,000 | | | | 752,598 | |
Tokyo Ohka Kogyo Company Limited (Materials, Chemicals) | | | | | | | 68,155 | | | | 1,475,171 | |
Toshiba Machine Company Limited (Industrials, Machinery) | | | | | | | 348,263 | | | | 2,125,624 | |
Yusen Logistics Company Limited (Industrials, Air Freight & Logistics) | | | | | | | 145,000 | | | | 1,523,106 | |
| | | | |
| | | | | | | | | | | 28,662,587 | |
| | | | | | | | | | | | |
| | | | |
| Luxembourg: 0.59% | | | | | | | | | | | | |
Eurofins Scientific (Health Care, Life Sciences Tools & Services) | | | | | | | 7,351 | | | | 1,597,349 | |
| | | | | | | | | | | | |
| | | | |
| Netherlands: 1.48% | | | | | | | | | | | | |
Nutreco Holding NV (Consumer Staples, Food Products) | | | | | | | 26,374 | | | | 2,503,225 | |
USG People NV (Industrials, Commercial Services & Supplies) | | | | | | | 193,209 | | | | 1,510,650 | |
| | | | |
| | | | | | | | | | | 4,013,875 | |
| | | | | | | | | | | | |
| | | | |
| Norway: 2.42% | | | | | | | | | | | | |
Hoegh LNG Holdings Limited (Energy, Oil, Gas & Consumable Fuels) † | | | | | | | 256,797 | | | | 2,048,498 | |
Ocean Rig UDW Incorporated (Energy, Energy Equipment & Services) † | | | | | | | 62,849 | | | | 1,029,467 | |
The accompanying notes are an integral part of these financial statements.
| | | | | | |
| Portfolio of investments—April 30, 2013 (unaudited) | | Wells Fargo Advantage Global Opportunities Fund | | | 9 | |
| | | | | | | | | | | | |
| Security name | | | | | | Shares | | | Value | |
| | | | | | | | | | | | |
| | | | |
| Norway (continued) | | | | | | | | | | | | |
Petroleum Geo-Services ASA (Energy, Energy Equipment & Services) | | | | | | | 50,120 | | | $ | 733,569 | |
SpareBank 1 SR Bank ASA (Financials, Commercial Banks)« | | | | | | | 309,565 | | | | 2,764,692 | |
| | | | |
| | | | | | | | | | | 6,576,226 | |
| | | | | | | | | | | | |
| | | | |
| Russia: 0.76% | | | | | | | | | | | | |
Sollers OJSC (Consumer Discretionary, Automobiles) | | | | | | | 98,599 | | | | 2,058,515 | |
| | | | | | | | | | | | |
| | | |
| South Korea: 1.64% | | | | | | | | | | |
BS Financial Group Incorporated (Financials, Commercial Banks) | | | | | | | 159,950 | | | | 2,105,943 | |
Handsome Company Limited (Consumer Discretionary, Textiles, Apparel & Luxury Goods) | | | | | | | 28,060 | | | | 839,532 | |
Kiwoom Securities Company (Financials, Capital Markets)† | | | | | | | 24,720 | | | | 1,515,119 | |
| | | | |
| | | | | | | | | | | 4,460,594 | |
| | | | | | | | | | | | |
| | | |
| Spain: 0.51% | | | | | | | | | | |
Prosegur Compania de Seguridad SA (Industrials, Commercial Services & Supplies) | | | | | | | 246,033 | | | | 1,373,816 | |
| | | | | | | | | | | | |
| | | |
| Sweden: 0.59% | | | | | | | | | | |
Meda AB Class A (Health Care, Pharmaceuticals) | | | | | | | 134,804 | | | | 1,609,898 | |
| | | | | | | | | | | | |
| | | |
| Switzerland: 3.08% | | | | | | | | | | |
ARYZTA AG (Consumer Staples, Food Products) | | | | | | | 37,768 | | | | 2,343,744 | |
Barry Callebaut AG (Consumer Staples, Food Products) | | | | | | | 1,931 | | | | 1,885,726 | |
Dufry AG (Consumer Discretionary, Specialty Retail)† | | | | | | | 15,311 | | | | 2,040,259 | |
Lonza Group AG (Health Care, Biotechnology) | | | | | | | 30,219 | | | | 2,104,410 | |
| | | | |
| | | | | | | | | | | 8,374,139 | |
| | | | | | | | | | | | |
| | | |
| Taiwan: 1.33% | | | | | | | | | | |
Catcher Technology Company Limited (Information Technology, Computers & Peripherals) | | | | | | | 354,000 | | | | 1,793,271 | |
Siliconware Precision Industries Company (Information Technology, Semiconductors &
Semiconductor Equipment) | | | | | | | 1,142,000 | | | | 1,354,364 | |
Siliconware Precision Industries Company ADR (Information Technology, Semiconductors &
Semiconductor Equipment)« | | | | | | | 75,440 | | | | 459,430 | |
| | | | |
| | | | | | | | | | | 3,607,065 | |
| | | | | | | | | | | | |
| | | |
| United Kingdom: 12.09% | | | | | | | | | | |
Aberdeen Asset Management plc (Financials, Capital Markets) | | | | | | | 179,530 | | | | 1,251,303 | |
Ashtead Group plc (Financials, Consumer Finance) | | | | | | | 168,078 | | | | 1,533,868 | |
Babcock International Group plc (Industrials, Commercial Services & Supplies) | | | | | | | 145,985 | | | | 2,426,394 | |
Bovis Homes Group plc (Consumer Discretionary, Household Durables) | | | | | | | 355,550 | | | | 4,241,614 | |
Britvic plc (Consumer Staples, Beverages) | | | | | | | 220,416 | | | | 1,506,486 | |
Capita plc (Industrials, Commercial Services & Supplies) | | | | | | | 156,342 | | | | 2,191,756 | |
Catlin Group Limited (Financials, Insurance) | | | | | | | 355,102 | | | | 2,898,645 | |
Enquest plc (Energy, Oil, Gas & Consumable Fuels)† | | | | | | | 705,926 | | | | 1,413,453 | |
Hays plc (Industrials, Commercial Services & Supplies) | | | | | | | 398,557 | | | | 578,238 | |
Hiscox Limited (Financials, Insurance) | | | | | | | 243,906 | | | | 2,125,465 | |
Mitie Group plc (Industrials, Commercial Services & Supplies) | | | | | | | 411,580 | | | | 1,765,823 | |
Perform Group plc (Consumer Discretionary, Media)† | | | | | | | 214,722 | | | | 1,727,729 | |
Savills plc (Industrials, Commercial Services & Supplies) | | | | | | | 344,799 | | | | 3,117,154 | |
SIG plc (Industrials, Building Products) | | | | | | | 655,994 | | | | 1,651,780 | |
Subsea 7 SA (Energy, Energy Equipment & Services) | | | | | | | 51,244 | | | | 1,103,703 | |
Taylor Wimpey plc (Consumer Discretionary, Household Durables) | | | | | | | 2,321,815 | | | | 3,354,130 | |
| | | | |
| | | | | | | | | | | 32,887,541 | |
| | | | | | | | | | | | |
The accompanying notes are an integral part of these financial statements.
| | | | |
| 10 | | Wells Fargo Advantage Global Opportunities Fund | | Portfolio of investments—April 30, 2013 (unaudited) |
| | | | | | | | | | | | |
| Security name | | | | | | Shares | | | Value | |
| | | | | | | | | | | | |
| | | |
| United States: 42.76% | | | | | | | | | | |
A. Schulman Incorporated (Materials, Chemicals) | | | | | | | 87,411 | | | $ | 2,270,064 | |
ACCO Brands Corporation (Industrials, Commercial Services & Supplies)†« | | | | | | | 341,800 | | | | 2,307,150 | |
ACI Worldwide Incorporated (Information Technology, Software)† | | | | | | | 79,300 | | | | 3,727,893 | |
ALLETE Incorporated (Utilities, Electric Utilities)« | | | | | | | 53,900 | | | | 2,767,765 | |
Atlas Air Worldwide Holdings Incorporated (Industrials, Air Freight & Logistics)† | | | | | | | 30,000 | | | | 1,122,000 | |
ATMI Incorporated (Information Technology, Semiconductors & Semiconductor Equipment)† | | | | | | | 156,400 | | | | 3,401,700 | |
Bio-Rad Laboratories Incorporated Class A (Health Care, Life Sciences Tools & Services)† | | | | | | | 26,800 | | | | 3,209,300 | |
Brown & Brown Incorporated (Financials, Insurance) | | | | | | | 113,700 | | | | 3,523,563 | |
Cambrex Corporation (Health Care, Life Sciences Tools & Services)† | | | | | | | 97,900 | | | | 1,222,771 | |
Carbo Ceramics Incorporated (Energy, Energy Equipment & Services) | | | | | | | 8,200 | | | | 579,330 | |
Casey’s General Stores Incorporated (Consumer Staples, Food & Staples Retailing) | | | | | | | 31,500 | | | | 1,824,165 | |
Comstock Resources Incorporated (Energy, Oil, Gas & Consumable Fuels)†« | | | | | | | 190,280 | | | | 2,979,785 | |
Delta Apparel Incorporated (Consumer Discretionary, Textiles, Apparel & Luxury Goods)† | | | | | | | 102,600 | | | | 1,372,788 | |
Denny’s Corporation (Consumer Discretionary, Hotels, Restaurants & Leisure)† | | | | | | | 426,000 | | | | 2,415,420 | |
Douglas Dynamics Incorporated (Industrials, Machinery)« | | | | | | | 176,300 | | | | 2,466,437 | |
EMCOR Group Incorporated (Industrials, Construction & Engineering) | | | | | | | 35,800 | | | | 1,338,920 | |
Endurance Specialty Holdings Limited (Financials, Insurance)« | | | | | | | 48,000 | | | | 2,350,560 | |
First Citizens BancShares Incorporated (Financials, Commercial Banks) | | | | | | | 20,212 | | | | 3,767,921 | |
First Niagara Financial Group Incorporated (Financials, Commercial Banks) | | | | | | | 364,300 | | | | 3,464,493 | |
Forward Air Corporation (Industrials, Air Freight & Logistics) | | | | | | | 58,505 | | | | 2,158,249 | |
Franklin Electric Company Incorporated (Industrials, Electrical Equipment) | | | | | | | 123,362 | | | | 3,993,228 | |
Global Payments Incorporated (Information Technology, IT Services) | | | | | | | 51,600 | | | | 2,394,240 | |
Guess? Incorporated (Consumer Discretionary, Specialty Retail)« | | | | | | | 109,300 | | | | 3,025,424 | |
Haemonetics Corporation (Health Care, Health Care Equipment & Supplies)†« | | | | | | | 77,400 | | | | 2,979,900 | |
Imation Corporation (Information Technology, Computers & Peripherals)† | | | | | | | 478,254 | | | | 1,759,975 | |
Kadant Incorporated (Industrials, Machinery) | | | | | | | 138,441 | | | | 3,830,662 | |
Lattice Semiconductor Corporation (Information Technology, Semiconductors & Semiconductor Equipment)† | | | | | | | 456,800 | | | | 2,124,120 | |
Macquarie Infrastructure Company LLC (Industrials, Transportation Infrastructure) | | | | | | | 69,167 | | | | 4,031,053 | |
Maidenform Brands Incorporated (Consumer Discretionary, Textiles, Apparel & Luxury Goods)† | | | | | | | 178,400 | | | | 3,211,200 | |
Matthews International Corporation Class A (Consumer Discretionary, Diversified Consumer Services)« | | | | | | | 75,640 | | | | 2,784,308 | |
Mueller Industries Incorporated (Industrials, Machinery) | | | | | | | 63,800 | | | | 3,303,564 | |
Neenah Paper Incorporated (Materials, Paper & Forest Products) | | | | | | | 72,125 | | | | 2,074,315 | |
NetScout Systems Incorporated (Information Technology, Software)† | | | | | | | 66,200 | | | | 1,510,022 | |
Post Properties Incorporated (Financials, REITs) | | | | | | | 60,900 | | | | 3,010,287 | |
Progress Software Corporation (Information Technology, Software)† | | | | | | | 107,200 | | | | 2,419,504 | |
Quanex Building Products Corporation (Industrials, Building Products)« | | | | | | | 120,089 | | | | 1,953,848 | |
Schweitzer Manduit International Incorporated (Materials, Paper & Forest Products) | | | | | | | 54,039 | | | | 2,177,231 | |
Silgan Holdings Incorporated (Materials, Containers & Packaging) | | | | | | | 56,100 | | | | 2,685,507 | |
Simpson Manufacturing Company Incorporated (Industrials, Building Products)« | | | | | | | 100,600 | | | | 2,891,244 | |
Stone Energy Corporation (Energy, Oil, Gas & Consumable Fuels)† | | | | | | | 129,364 | | | | 2,552,352 | |
The Men’s Wearhouse Incorporated (Consumer Discretionary, Specialty Retail) | | | | | | | 109,100 | | | | 3,654,850 | |
Thoratec Corporation (Health Care, Health Care Equipment & Supplies)† | | | | | | | 24,200 | | | | 876,040 | |
TIBCO Software Incorporated (Information Technology, Software)† | | | | | | | 108,900 | | | | 2,113,749 | |
TreeHouse Foods Incorporated (Consumer Staples, Food Products)† | | | | | | | 57,200 | | | | 3,644,212 | |
Vishay Intertechnology Incorporated (Information Technology, Electronic Equipment,
Instruments & Components)†« | | | | | | | 213,990 | | | | 3,004,420 | |
| | | | |
| | | | | | | | | | | 116,275,529 | |
| | | | | | | | | | | | |
| | | | |
Total Common Stocks (Cost $233,881,752) | | | | | | | | | | | 265,552,976 | |
| | | | | | | | | | | | |
The accompanying notes are an integral part of these financial statements.
| | | | | | |
| Portfolio of investments—April 30, 2013 (unaudited) | | Wells Fargo Advantage Global Opportunities Fund | | | 11 | |
| | | | | | | | | | | | | | |
| Security name | | | | Yield | | | Shares | | | Value | |
| | | | | | | | | | | | | | |
| | | | |
Short-Term Investments: 11.34% | | | | | | | | | | | | | | |
| | | | |
| Investment Companies: 11.34% | | | | | | | | | | | | | | |
Wells Fargo Advantage Cash Investment Money Market Fund, Select Class (l)(u) | | | | | 0.13 | % | | | 2,644,039 | | | $ | 2,644,039 | |
Wells Fargo Securities Lending Cash Investments, LLC (l)(u)(r)(v) | | | | | 0.18 | | | | 28,178,207 | | | | 28,178,207 | |
| | | | |
Total Short-Term Investments (Cost $30,822,246) | | | | | | | | | | | | | 30,822,246 | |
| | | | | | | | | | | | | | |
| | | | | | | | |
| | |
| Total investments in securities | | | | | | | | |
| (Cost $264,703,998) * | | | 109.00 | % | | | 296,375,222 | |
Other assets and liabilities, net | | | (9.00 | ) | | | (24,465,123 | ) |
| | | | | | | | |
Total net assets | | | 100.00 | % | | $ | 271,910,099 | |
| | | | | | | | |
| † | Non-income-earning security |
| « | All or a portion of this security is on loan. |
| (a) | Security is fair valued by the Management Valuation Team, and in certain instances by the Board of Trustees, in accordance with procedures approved by the Board of Trustees. |
| (l) | Investment in an affiliate |
| (u) | Rate shown is the 7-day annualized yield at period end. |
| (r) | The investment company is exempt from registration under Section 3(c)(7) of the Investment Company Act of 1940, as amended. |
| (v) | Security represents investment of cash collateral received from securities on loan. |
| * | Cost for federal income tax purposes is $266,032,169 and unrealized appreciation (depreciation) consists of: |
| | | | |
Gross unrealized appreciation | | $ | 45,583,457 | |
Gross unrealized depreciation | | | (15,240,404 | ) |
| | | | |
Net unrealized appreciation | | $ | 30,343,053 | |
The accompanying notes are an integral part of these financial statements.
| | | | |
| 12 | | Wells Fargo Advantage Global Opportunities Fund | | Statement of assets and liabilities—April 30, 2013 (unaudited) |
| | | | |
| |
Assets | | | | |
Investments | | | | |
In unaffiliated securities (including securities on loan), at value (see cost below) | | $ | 265,552,976 | |
In affiliated securities, at value (see cost below) | | | 30,822,246 | |
| | | | |
Total investments, at value (see cost below) | | | 296,375,222 | |
Foreign currency, at value (see cost below) | | | 1,139,804 | |
Receivable for investments sold | | | 2,348,496 | |
Receivable for Fund shares sold | | | 230,481 | |
Receivable for dividends | | | 1,244,921 | |
Receivable for securities lending income | | | 20,324 | |
Unrealized gains on forward foreign currency contracts | | | 187,904 | |
Prepaid expenses and other assets | | | 38,210 | |
| | | | |
Total assets | | | 301,585,362 | |
| | | | |
| |
Liabilities | | | | |
Payable for investments purchased | | | 838,220 | |
Payable for Fund shares redeemed | | | 276,736 | |
Payable upon receipt of securities loaned | | | 28,178,207 | |
Advisory fee payable | | | 192,327 | |
Distribution fees payable | | | 37,344 | |
Due to other related parties | | | 62,456 | |
Accrued expenses and other liabilities | | | 89,973 | |
| | | | |
Total liabilities | | | 29,675,263 | |
| | | | |
Total net assets | | $ | 271,910,099 | |
| | | | |
| |
NET ASSETS CONSIST OF | | | | |
Paid-in capital | | $ | 250,728,120 | |
Undistributed net investment income | | | 545,715 | |
Accumulated net realized losses on investments | | | (11,229,733 | ) |
Net unrealized gains on investments | | | 31,865,997 | |
| | | | |
Total net assets | | $ | 271,910,099 | |
| | | | |
| |
COMPUTATION OF NET ASSET VALUE AND OFFERING PRICE PER SHARE1 | | | | |
Net assets – Class A | | $ | 163,330,175 | |
Shares outstanding – Class A | | | 4,410,473 | |
Net asset value per share – Class A | | | $37.03 | |
Maximum offering price per share – Class A2 | | | $39.29 | |
Net assets – Class B | | $ | 19,955,514 | |
Shares outstanding – Class B | | | 670,422 | |
Net asset value per share – Class B | | | $29.77 | |
Net assets – Class C | | $ | 41,003,527 | |
Shares outstanding – Class C | | | 1,370,172 | |
Net asset value per share – Class C | | | $29.93 | |
Net assets — Administrator Class | | $ | 45,976,791 | |
Shares outstanding – Administrator Class | | | 1,205,065 | |
Net asset value per share – Administrator Class | | | $38.15 | |
Net assets – Institutional Class | | $ | 1,644,092 | |
Shares outstanding – Institutional Class | | | 43,100 | |
Net asset value per share – Institutional Class | | | $38.15 | |
| |
Investments in unaffiliated securities (including securities on loan), at cost | | $ | 233,881,752 | |
| | | | |
Investments in affiliated securities, at cost | | $ | 30,822,246 | |
| | | | |
Total investments, at cost | | $ | 264,703,998 | |
| | | | |
Securities on loan, at value | | $ | 27,138,341 | |
| | | | |
Foreign currency, at cost | | $ | 1,130,033 | |
| | | | |
| 1. | The Fund has an unlimited number of authorized shares. |
| 2. | Maximum offering price is computed as 100/94.25 of net asset value. On investments of $50,000 or more, the offering price is reduced. |
The accompanying notes are an integral part of these financial statements.
| | | | | | |
| Statement of operations—six months ended April 30, 2013 (unaudited) | | Wells Fargo Advantage Global Opportunities Fund | | | 13 | |
| | | | |
| |
Investment income | | | | |
Dividends * | | $ | 2,746,118 | |
Securities lending income, net | | | 57,293 | |
Income from affiliated securities | | | 5,684 | |
| | | | |
Total investment income | | | 2,809,095 | |
| | | | |
| |
Expenses | | | | |
Advisory fee | | | 1,198,504 | |
Administration fees | | | | |
Fund level | | | 66,584 | |
Class A | | | 209,214 | |
Class B | | | 26,870 | |
Class C | | | 50,958 | |
Administrator Class | | | 22,056 | |
Institutional Class | | | 568 | |
Shareholder servicing fees | | | | |
Class A | | | 201,167 | |
Class B | | | 25,614 | |
Class C | | | 48,998 | |
Administrator Class | | | 53,213 | |
Distribution fees | | | | |
Class B | | | 77,510 | |
Class C | | | 146,995 | |
Custody and accounting fees | | | 43,552 | |
Professional fees | | | 21,937 | |
Registration fees | | | 45,552 | |
Shareholder report expenses | | | 35,603 | |
Trustees’ fees and expenses | | | 6,368 | |
Other fees and expenses | | | 14,208 | |
| | | | |
Total expenses | | | 2,295,471 | |
Less: Fee waivers and/or expense reimbursements | | | (42,906 | ) |
| | | | |
Net expenses | | | 2,252,565 | |
| | | | |
Net investment income | | | 556,530 | |
| | | | |
| |
REALIZED AND UNREALIZED GAINS (LOSSES) ON INVESTMENTS | | | | |
Net realized gains on investments | | | 16,816,953 | |
| |
Net change in unrealized gains (losses) on: | | | | |
Unaffiliated securities | | | 13,443,895 | |
Forward foreign currency contract transactions | | | 187,904 | |
| | | | |
Net change in unrealized gains (losses) on investments | | | 13,631,799 | |
| | | | |
Net realized and unrealized gains (losses) on investments | | | 30,448,752 | |
| | | | |
Net increase in net assets resulting from operations | | $ | 31,005,282 | |
| | | | |
| |
* Net of foreign dividend withholding taxes in the amount of | | | $122,982 | |
The accompanying notes are an integral part of these financial statements.
| | | | |
| 14 | | Wells Fargo Advantage Global Opportunities Fund | | Statement of changes in net assets |
| | | | | | | | | | | | | | | | |
| | | Six months ended April 30, 2013 (unaudited) | | | Year ended October 31, 2012 | |
| | | | |
Operations | | | | | | | | | | | | | | | | |
Net investment income | | | | | | $ | 556,530 | | | | | | | $ | 1,373,645 | |
Net realized gains on investments | | | | | | | 16,816,953 | | | | | | | | 17,711,649 | |
Net change in unrealized gains (losses) on investments | | | | | | | 13,631,799 | | | | | | | | 6,542,284 | |
| | | | | | | | | | | | | | | | |
Net increase in net assets resulting from operations | | | | | | | 31,005,282 | | | | | | | | 25,627,578 | |
| | | | | | | | | | | | | | | | |
| | | | |
Distributions to shareholders from | | | | | | | | | | | | | | | | |
Net investment income | | | | | | | | | | | | | | | | |
Class A | | | | | | | (1,067,960 | ) | | | | | | | (223,301 | ) |
Administrator Class | | | | | | | (373,726 | ) | | | | | | | (175,333 | ) |
Institutional Class | | | | | | | (14,154 | ) | | | | | | | (10,282 | ) |
| | | | | | | | | | | | | | | | |
Total distributions to shareholders | | | | | | | (1,455,840 | ) | | | | | | | (408,916 | ) |
| | | | | | | | | | | | | | | | |
| | | | |
| | | Shares | | | | | | | | Shares | | | | | |
Capital share transactions | | | | | | | | | | | | | | | | |
Proceeds from shares sold | | | | | | | | | | | | | | | | |
Class A | | | 299,217 | | | | 10,538,466 | | | | 492,552 | | | | 15,375,650 | |
Class B | | | 3,570 | | | | 103,395 | | | | 4,694 | | | | 114,095 | |
Class C | | | 119,188 | | | | 3,470,589 | | | | 60,733 | | | | 1,514,184 | |
Administrator Class | | | 230,492 | | | | 8,413,999 | | | | 311,447 | | | | 10,080,434 | |
Institutional Class | | | 8,991 | | | | 332,283 | | | | 38,056 | | | | 1,255,099 | |
| | | | | | | | | | | | | | | | |
| | | | | | | 22,858,732 | | | | | | | | 28,339,462 | |
| | | | | | | | | | | | | | | | |
Reinvestment of distributions | | | | | | | | | | | | | | | | |
Class A | | | 28,779 | | | | 974,154 | | | | 7,231 | | | | 198,310 | |
Administrator Class | | | 9,897 | | | | 344,916 | | | | 5,762 | | | | 162,732 | |
Institutional Class | | | 383 | | | | 13,316 | | | | 364 | | | | 10,282 | |
| | | | | | | | | | | | | | | | |
| | | | | | | 1,332,386 | | | | | | | | 371,324 | |
| | | | | | | | | | | | | | | | |
Payment for shares redeemed | | | | | | | | | | | | | | | | |
Class A | | | (632,976 | ) | | | (22,419,416 | ) | | | (1,588,957 | ) | | | (49,363,172 | ) |
Class B | | | (129,878 | ) | | | (3,693,570 | ) | | | (302,659 | ) | | | (7,546,513 | ) |
Class C | | | (161,532 | ) | | | (4,588,257 | ) | | | (495,923 | ) | | | (12,471,336 | ) |
Administrator Class | | | (332,064 | ) | | | (12,006,371 | ) | | | (623,430 | ) | | | (20,063,577 | ) |
Institutional Class | | | (3,153 | ) | | | (112,528 | ) | | | (49,205 | ) | | | (1,511,205 | ) |
| | | | | | | | | | | | | | | | |
| | | | | | | (42,820,142 | ) | | | | | | | (90,955,803 | ) |
| | | | | | | | | | | | | | | | |
Net decrease in net assets resulting from capital share transactions | | | | | | | (18,629,024 | ) | | | | | | | (62,245,017 | ) |
| | | | | | | | | | | | | | | | |
Total increase (decrease) in net assets | | | | | | | 10,920,418 | | | | | | | | (37,026,355 | ) |
| | | | | | | | | | | | | | | | |
| | | | |
Net assets | | | | | | | | | | | | | | | | |
Beginning of period | | | | | | | 260,989,681 | | | | | | | | 298,016,036 | |
| | | | | | | | | | | | | | | | |
End of period | | | | | | $ | 271,910,099 | | | | | | | $ | 260,989,681 | |
| | | | | | | | | | | | | | | | |
Undistributed net investment income | | | | | | $ | 545,715 | | | | | | | $ | 1,445,025 | |
| | | | | | | | | | | | | | | | |
The accompanying notes are an integral part of these financial statements.
| | | | | | |
| Financial highlights | | Wells Fargo Advantage Global Opportunities Fund | | | 15 | |
(For a share outstanding throughout each period)
| | | | | | | | | | | | | | | | | | | | | | | | |
| | | Six months ended
April 30, 2013
(unaudited) | | | Year ended October 31 | |
| CLASS A | | | 2012 | | | 2011 | | | 20101 | | | 20091 | | | 20081 | |
Net asset value, beginning of period | | $ | 33.17 | | | $ | 30.14 | | | $ | 31.91 | | | $ | 24.96 | | | $ | 21.20 | | | $ | 40.22 | |
Net investment income | | | 0.10 | 2 | | | 0.20 | 2 | | | 0.12 | 2 | | | 0.07 | 2 | | | 0.10 | 2 | | | 0.04 | 2 |
Net realized and unrealized gains (losses) on investments | | | 3.99 | | | | 2.87 | | | | (1.89 | ) | | | 6.99 | | | | 3.74 | | | | (16.97 | ) |
| | | | | | | | | | | | | | | | | | | | | | | | |
Total from investment operations | | | 4.09 | | | | 3.07 | | | | (1.77 | ) | | | 7.06 | | | | 3.84 | | | | (16.93 | ) |
Distributions to shareholders from | | | | | | | | | | | | | | | | | | | | | | | | |
Net investment income | | | (0.23 | ) | | | (0.04 | ) | | | 0.00 | | | | (0.11 | ) | | | (0.08 | ) | | | 0.00 | |
Net realized gains | | | 0.00 | | | | 0.00 | | | | 0.00 | | | | 0.00 | | | | 0.00 | | | | (2.09 | ) |
| | | | | | | | | | | | | | | | | | | | | | | | |
Total distributions to shareholders | | | (0.23 | ) | | | (0.04 | ) | | | 0.00 | | | | (0.11 | ) | | | (0.08 | ) | | | (2.09 | ) |
Net asset value, end of period | | $ | 37.03 | | | $ | 33.17 | | | $ | 30.14 | | | $ | 31.91 | | | $ | 24.96 | | | $ | 21.20 | |
Total return3 | | | 12.36 | % | | | 10.24 | % | | | (5.55 | )% | | | 28.41 | % | | | 18.22 | % | | | (44.14 | )% |
Ratios to average net assets (annualized) | | | | | | | | | | | | | | | | | | | | | | | | |
Gross expenses | | | 1.59 | % | | | 1.55 | % | | | 1.55 | % | | | 1.66 | % | | | 1.72 | % | | | 1.54 | % |
Net expenses | | | 1.55 | % | | | 1.54 | % | | | 1.53 | % | | | 1.63 | % | | | 1.72 | % | | | 1.52 | % |
Net investment income | | | 0.55 | % | | | 0.65 | % | | | 0.34 | % | | | 0.25 | % | | | 0.45 | % | | | 0.13 | % |
Supplemental data | | | | | | | | | | | | | | | | | | | | | | | | |
Portfolio turnover rate | | | 35 | % | | | 85 | % | | | 76 | % | | | 104 | % | | | 170 | % | | | 161 | % |
Net assets, end of period (000s omitted) | | | $163,330 | | | | $156,433 | | | | $174,937 | | | | $212,729 | | | | $197,721 | | | | $214,883 | |
| 1. | After the close of business on July 16 2010, the Fund acquired the net assets of Evergreen Global Opportunities Fund which became the accounting and performance survivor in the transaction. The information for the periods prior to July 19, 2010 is that of Class A of Evergreen Global Opportunities Fund. |
| 2. | Calculated based upon average shares outstanding |
| 3. | Total return calculations do not include any sales charges. Returns for periods of less than one year are not annualized. |
The accompanying notes are an integral part of these financial statements.
| | | | |
| 16 | | Wells Fargo Advantage Global Opportunities Fund | | Financial highlights |
(For a share outstanding throughout each period)
| | | | | | | | | | | | | | | | | | | | | | | | |
| | | Six months ended
April 30, 2013
(unaudited) | | | Year ended October 31 | |
| CLASS B | | | 2012 | | | 2011 | | | 20101 | | | 20091 | | | 20081 | |
Net asset value, beginning of period | | $ | 26.58 | | | $ | 24.30 | | | $ | 25.92 | | | $ | 20.33 | | | $ | 17.34 | | | $ | 33.54 | |
Net investment loss | | | (0.03 | )2 | | | (0.03 | )2 | | | (0.12 | )2 | | | (0.11 | )2 | | | (0.05 | )2 | | | (0.16 | )2 |
Net realized and unrealized gains (losses) on investments | | | 3.22 | | | | 2.31 | | | | (1.50 | ) | | | 5.70 | | | | 3.04 | | | | (13.95 | ) |
| | | | | | | | | | | | | | | | | | | | | | | | |
Total from investment operations | | | 3.19 | | | | 2.28 | | | | (1.62 | ) | | | 5.59 | | | | 2.99 | | | | (14.11 | ) |
Distributions to shareholders from | | | | | | | | | | | | | | | | | | | | | | | | |
Net realized gains | | | 0.00 | | | | 0.00 | | | | 0.00 | | | | 0.00 | | | | 0.00 | | | | (2.09 | ) |
Net asset value, end of period | | $ | 29.77 | | | $ | 26.58 | | | $ | 24.30 | | | $ | 25.92 | | | $ | 20.33 | | | $ | 17.34 | |
Total return3 | | | 11.96 | % | | | 9.42 | % | | | (6.25 | )% | | | 27.43 | % | | | 17.30 | % | | | (44.54 | )% |
Ratios to average net assets (annualized) | | | | | | | | | | | | | | | | | | | | | | | | |
Gross expenses | | | 2.33 | % | | | 2.30 | % | | | 2.30 | % | | | 2.41 | % | | | 2.47 | % | | | 2.27 | % |
Net expenses | | | 2.30 | % | | | 2.29 | % | | | 2.28 | % | | | 2.38 | % | | | 2.47 | % | | | 2.27 | % |
Net investment loss | | | (0.22 | )% | | | (0.10 | )% | | | (0.43 | )% | | | (0.49 | )% | | | (0.30 | )% | | | (0.62 | )% |
Supplemental data | | | | | | | | | | | | | | | | | | | | | | | | |
Portfolio turnover rate | | | 35 | % | | | 85 | % | | | 76 | % | | | 104 | % | | | 170 | % | | | 161 | % |
Net assets, end of period (000s omitted) | | $ | 19,956 | | | $ | 21,181 | | | $ | 26,598 | | | $ | 37,752 | | | $ | 34,934 | | | $ | 39,980 | |
| 1. | After the close of business on July 16, 2010, the Fund acquired the net assets of Evergreen Global Opportunities Fund which became the accounting and performance survivor in the transaction. The information for the periods prior to July 19, 2010 is that of Class B of Evergreen Global Opportunities Fund. |
| 2. | Calculated based upon average shares outstanding |
| 3. | Total return calculations do not include any sales charges. Returns for periods of less than one year are not annualized. |
The accompanying notes are an integral part of these financial statements.
| | | | | | |
| Financial highlights | | Wells Fargo Advantage Global Opportunities Fund | | | 17 | |
(For a share outstanding throughout each period)
| | | | | | | | | | | | | | | | | | | | | | | | |
| | | Six months ended
April 30, 2013
(unaudited) | | | Year ended October 31 | |
| CLASS C | | | 2012 | | | 2011 | | | 20101 | | | 20091 | | | 20081 | |
Net asset value, beginning of period | | | $26.73 | | | $ | 24.43 | | | $ | 26.05 | | | $ | 20.44 | | | $ | 17.44 | | | $ | 33.72 | |
Net investment loss | | | (0.03 | )2 | | | (0.03 | )2 | | | (0.11 | )2 | | | (0.11 | )2 | | | (0.05 | )2 | | | (0.16 | )2 |
Net realized and unrealized gains (losses) on investments | | | 3.23 | | | | 2.33 | | | | (1.51 | ) | | | 5.72 | | | | 3.05 | | | | (14.03 | ) |
| | | | | | | | | | | | | | | | | | | | | | | | |
Total from investment operations | | | 3.20 | | | | 2.30 | | | | (1.62 | ) | | | 5.61 | | | | 3.00 | | | | (14.19 | ) |
Distributions to shareholders from | | | | | | | | | | | | | | | | | | | | | | | | |
Net realized gains | | | 0.00 | | | | 0.00 | | | | 0.00 | | | | 0.00 | | | | 0.00 | | | | (2.09 | ) |
Net asset value, end of period | | $ | 29.93 | | | $ | 26.73 | | | $ | 24.43 | | | $ | 26.05 | | | $ | 20.44 | | | $ | 17.44 | |
Total return3 | | | 11.97 | % | | | 9.41 | % | | | (6.25 | )% | | | 27.43 | % | | | 17.33 | % | | | (44.56 | )% |
Ratios to average net assets (annualized) | | | | | | | | | | | | | | | | | | | | | | | | |
Gross expenses | | | 2.34 | % | | | 2.30 | % | | | 2.30 | % | | | 2.41 | % | | | 2.47 | % | | | 2.27 | % |
Net expenses | | | 2.30 | % | | | 2.29 | % | | | 2.28 | % | | | 2.38 | % | | | 2.47 | % | | | 2.27 | % |
Net investment loss | | | (0.18 | )% | | | (0.11 | )% | | | (0.41 | )% | | | (0.50 | )% | | | (0.30 | )% | | | (0.61 | )% |
Supplemental data | | | | | | | | | | | | | | | | | | | | | | | | |
Portfolio turnover rate | | | 35 | % | | | 85 | % | | | 76 | % | | | 104 | % | | | 170 | % | | | 161 | % |
Net assets, end of period (000s omitted) | | | $41,004 | | | | $37,753 | | | | $45,135 | | | | $52,866 | | | | $50,218 | | | | $59,382 | |
| 1. | After the close of business on July 16, 2010, the Fund acquired the net assets of Evergreen Global Opportunities Fund which became the accounting and performance survivor in the transaction. The information for the periods prior to July 19, 2010 is that of Class C of Evergreen Global Opportunities Fund. |
| 2. | Calculated based upon average shares outstanding |
| 3. | Total return calculations do not include any sales charges. Returns for periods of less than one year are not annualized. |
The accompanying notes are an integral part of these financial statements.
| | | | |
| 18 | | Wells Fargo Advantage Global Opportunities Fund | | Financial highlights |
(For a share outstanding throughout each period)
| | | | | | | | | | | | | | | | | | | | | | | | |
| | | Six months ended
April 30, 2013
(unaudited) | | | Year ended October 31 | |
| ADMINISTRATOR CLASS | | | 2012 | | | 2011 | | | 20101 | | | 20091 | | | 20081 | |
Net asset value, beginning of period | | | $34.21 | | | | $31.10 | | | | $32.92 | | | | $25.73 | | | | $21.91 | | | | $41.42 | |
Net investment income | | | 0.13 | 2 | | | 0.26 | 2 | | | 0.15 | | | | 0.14 | 2 | | | 0.16 | | | | 0.15 | 2 |
Net realized and unrealized gains (losses) on investments | | | 4.10 | | | | 2.96 | | | | (1.93 | ) | | | 7.23 | | | | 3.85 | | | | (17.57 | ) |
| | | | | | | | | | | | | | | | | | | | | | | | |
Total from investment operations | | | 4.23 | | | | 3.22 | | | | (1.78 | ) | | | 7.37 | | | | 4.01 | | | | (17.42 | ) |
Distributions to shareholders from | | | | | | | | | | | | | | | | | | | | | | | | |
Net investment income | | | (0.29 | ) | | | (0.11 | ) | | | (0.04 | ) | | | (0.18 | ) | | | (0.19 | ) | | | 0.00 | |
Net realized gains | | | 0.00 | | | | 0.00 | | | | 0.00 | | | | 0.00 | | | | 0.00 | | | | (2.09 | ) |
| | | | | | | | | | | | | | | | | | | | | | | | |
Total distributions to shareholders | | | (0.29 | ) | | | (0.11 | ) | | | (0.04 | ) | | | (0.18 | ) | | | (0.19 | ) | | | (2.09 | ) |
Net asset value, end of period | | | $38.15 | | | | $34.21 | | | | $31.10 | | | | $32.92 | | | | $25.73 | | | | $21.91 | |
Total return3 | | | 12.46 | % | | | 10.44 | % | | | (5.39 | )% | | | 28.77 | % | | | 18.45 | % | | | (43.98 | )% |
Ratios to average net assets (annualized) | | | | | | | | | | | | | | | | | | | | | | | | |
Gross expenses | | | 1.42 | % | | | 1.38 | % | | | 1.37 | % | | | 1.43 | % | | | 1.47 | % | | | 1.28 | % |
Net expenses | | | 1.40 | % | | | 1.38 | % | | | 1.36 | % | | | 1.40 | % | | | 1.47 | % | | | 1.28 | % |
Net investment income | | | 0.73 | % | | | 0.81 | % | | | 0.53 | % | | | 0.49 | % | | | 0.69 | % | | | 0.46 | % |
Supplemental data | | | | | | | | | | | | | | | | | | | | | | | | |
Portfolio turnover rate | | | 35 | % | | | 85 | % | | | 76 | % | | | 104 | % | | | 170 | % | | | 161 | % |
Net assets, end of period (000s omitted) | | $ | 45,977 | | | $ | 44,360 | | | $ | 49,860 | | | $ | 46,106 | | | $ | 38,977 | | | $ | 36,027 | |
| 1. | After the close of business on July 16, 2010, the Fund acquired the net assets of Evergreen Global Opportunities Fund which became the accounting and performance survivor in the transaction. The information for the periods prior to July 19, 2010 is that of Class I of Evergreen Global Opportunities Fund. |
| 2. | Calculated based upon average shares outstanding |
| 3. | Returns for periods of less than one year are not annualized. |
The accompanying notes are an integral part of these financial statements.
| | | | | | |
| Financial highlights | | Wells Fargo Advantage Global Opportunities Fund | | | 19 | |
(For a share outstanding throughout each period)
| | | | | | | | | | | | | | | | |
| | | Six months ended
April 30, 2013
(unaudited) | | | Year ended October 31 | |
| INSTITUTIONAL CLASS | | | 2012 | | | 2011 | | | 20101 | |
Net asset value, beginning of period | | | $34.25 | | | | $31.18 | | | | $32.94 | | | $ | 28.37 | |
Net investment income | | | 0.19 | 2 | | | 0.36 | 2 | | | 0.25 | | | | 0.04 | 2 |
Net realized and unrealized gains (losses) on investments | | | 4.09 | | | | 2.93 | | | | (1.94 | ) | | | 4.53 | |
| | | | | | | | | | | | | | | | |
Total from investment operations | | | 4.28 | | | | 3.29 | | | | (1.69 | ) | | | 4.57 | |
Distributions to shareholders from | | | | | | | | | | | | | | | | |
Net investment income | | | (0.38 | ) | | | (0.22 | ) | | | (0.07 | ) | | | 0.00 | |
Net asset value, end of period | | | $38.15 | | | | $34.25 | | | | $31.18 | | | $ | 32.94 | |
Total return3 | | | 12.62 | % | | | 10.70 | % | | | (5.15 | )% | | | 16.11 | % |
Ratios to average net assets (annualized) | | | | | | | | | | | | | | | | |
Gross expenses | | | 1.16 | % | | | 1.12 | % | | | 1.08 | % | | | 1.22 | % |
Net expenses | | | 1.15 | % | | | 1.12 | % | | | 1.08 | % | | | 1.15 | % |
Net investment income | | | 1.03 | % | | | 1.13 | % | | | 1.18 | % | | | 0.53 | % |
Supplemental data | | | | | | | | | | | | | | | | |
Portfolio turnover rate | | | 35 | % | | | 85 | % | | | 76 | % | | | 104 | % |
Net assets, end of period (000s omitted) | | | $1,644 | | | | $1,263 | | | | $1,486 | | | | $12 | |
| 1. | For the period from July 30, 2010 (commencement of class operations) to October 31, 2010 |
| 2. | Calculated based upon average shares outstanding |
| 3. | Returns for periods of less than one year are not annualized. |
The accompanying notes are an integral part of these financial statements.
| | | | |
| 20 | | Wells Fargo Advantage Global Opportunities Fund | | Notes to financial statements (unaudited) |
1. ORGANIZATION
Wells Fargo Funds Trust (the “Trust”), a Delaware statutory trust organized on March 10, 1999, is an open-end management investment company registered under the Investment Company Act of 1940, as amended (the “1940 Act”). These financial statements report on Wells Fargo Advantage Global Opportunities Fund (the “Fund”) which is a diversified series of the Trust.
2. SIGNIFICANT ACCOUNTING POLICIES
The following significant accounting policies, which are consistently followed in the preparation of the financial statements of the Fund, are in conformity with U.S. generally accepted accounting principles which require management to make estimates and assumptions that affect the reported amounts of assets and liabilities, disclosure of contingent assets and liabilities at the date of the financial statements, and the reported amounts of revenues and expenses during the reporting period. Actual results could differ from those estimates.
Securities valuation
All investments are valued each business day as of the close of regular trading on the New York Stock Exchange (normally 4 p.m. Eastern Time).
Equity securities that are listed on a foreign or domestic exchange, except for The Nasdaq Stock Market, Inc. (“Nasdaq”), are valued at the official closing price or, if none, the last sales price. Securities listed on Nasdaq are valued at the Nasdaq Official Closing Price (“NOCP”). If no NOCP is available, securities are valued at the last sales price. If no sales price is shown on the Nasdaq, the bid price will be used. If no sale occurs on the primary exchange or market for the security that day or if no sale occurs and no bid price is shown on Nasdaq, the prior day’s price will be deemed “stale” and fair values will be determined in accordance with the Fund’s Valuation Procedures.
Securities denominated in foreign currencies are translated into U.S. dollars using the rates of exchange in effect on the day of valuation at a time specified by the Management Valuation Team of Wells Fargo Funds Management, LLC (“Funds Management”).
Many securities markets and exchanges outside the U.S. close prior to the close of the New York Stock Exchange and therefore may not fully reflect trading or events that occur after the close of the principal exchange in which the foreign securities are traded, but before the close of the New York Stock Exchange. If such trading or events are expected to materially affect the value of such securities, then fair value pricing procedures approved by the Board of Trustees are applied. These procedures take into account multiple factors including movements in U.S. securities markets after foreign exchanges close. Foreign securities that are fair valued under these procedures are categorized as Level 2 and the application of these procedures may result in transfers between Level 1 and Level 2. Depending on market activity, such fair valuations may be frequent. Such fair value pricing may result in NAVs that are higher or lower than NAVs based on the last reported sales price or latest quoted bid price. On April 30, 2013, fair value pricing was not used in pricing foreign securities.
Investments in registered open-end investment companies are valued at net asset value. Non-registered investment companies are fair valued at net asset value.
Investments which are not valued using any of the methods discussed above are valued at their fair value, as determined by procedures established in good faith and approved by the Board of Trustees. The Board of Trustees has established a Valuation Committee comprised of the Trustees and has delegated to it the authority to take any actions regarding the valuation of portfolio securities that the Valuation Committee deems necessary or appropriate, including determining the fair value of portfolio securities, unless the determination has been delegated to the Management Valuation Team. The Board of Trustees retains the authority to make or ratify any valuation decisions or approve any changes to the Valuation Procedures as it deems appropriate. On a quarterly basis, the Board of Trustees receives reports on any valuation actions taken by the Valuation Committee or the Management Valuation Team which may include items for ratification.
Valuations of fair valued securities are compared to the next actual sales price when available, or other appropriate market information to assess the continued appropriateness of the fair valuation methodology used. These securities are fair valued on a day-to-day basis, taking into consideration changes to appropriate market information and any significant changes to the input factors considered in the valuation process until there is a readily available price provided on the exchange or by an independent pricing service. Valuations received from an independent pricing service or broker quotes are periodically validated by comparisons to most recent trades and valuations provided by other independent pricing services in addition to the review of prices by the adviser and/or subadviser. Unobservable inputs used in determining fair valuations are identified based on the type of security, taking into consideration factors utilized by market participants in valuing the investment, knowledge about the issuer and the current market environment.
| | | | | | |
| Notes to financial statements (unaudited) | | Wells Fargo Advantage Global Opportunities Fund | | | 21 | |
Foreign currency translation
The accounting records of the Fund are maintained in U.S. dollars. Assets, including investment securities, and liabilities denominated in foreign currency are translated into U.S. dollars at the rates of exchange at a time specified by the Management Valuation Team on the date of valuation. Purchases and sales of securities, and income and expenses are converted at the rate of exchange on the respective dates of such transactions. Reported net realized foreign exchange gains or losses arise from sales of foreign currencies, currency gains or losses realized between the trade and settlement dates on securities transactions, and the difference between the amounts of dividends, interest and foreign withholding taxes recorded and the U.S. dollar equivalent of the amounts actually paid or received. Net unrealized foreign exchange gains and losses arise from changes in the fair value of assets and liabilities other than investments in securities resulting in changes in exchange rates.
The changes in net assets arising from changes in exchange rates and the changes in net assets resulting from changes in market prices of securities are not separately presented. Such changes are recorded with net realized and unrealized gains or losses from investments. Gains and losses from certain foreign currency transactions are treated as ordinary income for U.S. federal income tax purposes.
Forward foreign currency contracts
The Fund may be subject to foreign currency exchange rate risk in the normal course of pursuing its investment objectives. A forward foreign currency contract is an agreement between two parties to purchase or sell a specific currency for an agreed-upon price at a future date. The Fund enters into forward foreign currency contracts to facilitate transactions in foreign-denominated securities and to attempt to minimize the risk to the Fund from adverse changes in the relationship between currencies. Forward foreign currency contracts are recorded at the forward rate and marked-to-market daily. When the contracts are closed, realized gains and losses arising from such transactions are recorded as realized gains or losses on forward foreign currency contract transactions. The Fund could be exposed to risks if the counterparties to the contracts are unable to meet the terms of their contracts or if the value of the foreign currency changes unfavorably. The Fund’s maximum risk of loss from counterparty credit risk is the unrealized gains or losses on the contracts. This risk is mitigated by having a master netting arrangement between the Fund and the counterparty.
Security loans
The Fund may lend its securities from time to time in order to earn additional income in the form of fees or interest on securities received as collateral or the investment of any cash received as collateral. The Fund continues to receive interest or dividends on the securities loaned. The Fund receives collateral in the form of cash or securities with a value at least equal to the value of the securities on loan. The value of the loaned securities is determined at the close of each business day and any additional required collateral is delivered to the Fund on the next business day. In a securities lending transaction, the net asset value of the Fund will be affected by an increase or decrease in the value of the securities loaned and by an increase or decrease in the value of the instrument in which collateral is invested. The amount of securities lending activity undertaken by the Fund fluctuates from time to time. In the event of default or bankruptcy by the borrower, the Fund may be prevented from recovering the loaned securities or gaining access to the collateral or may experience delays or costs in doing so. In addition, the investment of any cash collateral received may lose all or part of its value. The Fund has the right under the lending agreement to recover the securities from the borrower on demand.
The Fund lends its securities through an unaffiliated securities lending agent. Cash collateral received in connection with its securities lending transactions is invested in Wells Fargo Securities Lending Cash Investments, LLC (the “Cash Collateral Fund”). The Cash Collateral Fund is exempt from registration under Section 3(c)(7) of the 1940 Act and is managed by Funds Management and is subadvised by Wells Capital Management Incorporated (“WellsCap”). Funds Management receives an advisory fee starting at 0.05% and declining to 0.01% as the average daily net assets of the Cash Collateral Fund increase. All of the fees received by Funds Management are paid to WellsCap for its services as subadviser. The Cash Collateral Fund seeks to provide a positive return compared to the daily Fed Funds Open rate by investing in high-quality, U.S. dollar-denominated short-term money market instruments. Cash Collateral Fund investments are fair valued based upon the amortized cost valuation technique. Income earned from investment in the Cash Collateral Fund is included in securities lending income on the Statement of Operations.
Security transactions and income recognition
Securities transactions are recorded on a trade date basis. Realized gains or losses are recorded on the basis of identified cost.
Dividend income is recognized on the ex-dividend date, except for certain dividends from foreign securities, which are recorded as soon as the Fund is informed of the ex-dividend date. Dividend income from foreign securities is recorded net of foreign taxes withheld where recovery of such taxes is not assured.
| | | | |
| 22 | | Wells Fargo Advantage Global Opportunities Fund | | Notes to financial statements (unaudited) |
Distributions to shareholders
Distributions to shareholders from net investment income and net realized gains, if any, are recorded on the ex-dividend date. Such distributions are determined in conformity with federal income tax regulations, which may differ in amount or character from net investment income and realized gains recognized for purposes of U.S. generally accepted accounting principles.
Federal and other taxes
The Fund intends to continue to qualify as a regulated investment company by distributing substantially all of its investment company taxable income and any net realized capital gains (after reduction for capital loss carryforwards) sufficient to relieve it from all, or substantially all, federal income taxes. Accordingly, no provision for federal income taxes was required.
The Fund’s income and federal excise tax returns and all financial records supporting those returns for the prior three fiscal years are subject to examination by the federal and Delaware revenue authorities. Management has analyzed the Fund’s tax positions taken on federal, state, and foreign tax returns for all open tax years and does not believe that there are any uncertain tax positions that require recognition of a tax liability.
As of October 31, 2012, the Fund had pre-enactment capital loss carryforwards incurred in taxable years beginning before December 22, 2010, which were available to offset future net realized capital gains, in the amount of $26,594,713 expiring in 2017.
Class allocations
The separate classes of shares offered by the Fund differ principally in applicable sales charges, distribution, shareholder servicing, and administration fees. Shareholders of each class bear certain expenses that pertain to that particular class. All shareholders bear the common expenses of the Fund, earn income from the portfolio, and are allocated any unrealized gains and losses pro rata based on the average daily net assets of each class, without distinction between share classes. Dividends are determined separately for each class based on income and expenses allocable to each class. Realized gains and losses are allocated to each class pro rata based upon the net assets of each class on the date realized. Differences in per share dividend rates generally result from the relative weightings of pro rata income and realized gain allocations and from differences in separate class expenses, including distribution, shareholder servicing, and administration fees.
3. FAIR VALUATION MEASUREMENTS
Fair value measurements of investments are determined within a framework that has established a fair value hierarchy based upon the various data inputs utilized in determining the value of the Fund’s investments. The three-level hierarchy gives the highest priority to unadjusted quoted prices in active markets for identical assets or liabilities (Level 1) and the lowest priority to significant unobservable inputs (Level 3). The Fund’s investments are classified within the fair value hierarchy based on the lowest level of input that is significant to the fair value measurement. The inputs are summarized into three broad levels as follows:
| n | | Level 1 – quoted prices in active markets for identical securities |
| n | | Level 2 – other significant observable inputs (including quoted prices for similar securities, interest rates, prepayment speeds, credit risk, use of amortized cost, etc.) |
| n | | Level 3 – significant unobservable inputs (including the Fund’s own assumptions in determining the fair value of investments) |
The inputs or methodologies used for valuing investments in securities are not necessarily an indication of the risk associated with investing in those securities.
As of April 30, 2013, the inputs used in valuing investments in securities were as follows:
| | | | | | | | | | | | | | | | |
| Investments in Securities | | Quoted prices (Level 1) | | | Significant other
observable inputs (Level 2) | | | Significant unobservable inputs (Level 3) | | | Total | |
| | | | |
Equity securities | | | | | | | | | | | | | | | | |
Common stocks | | $ | 263,316,784 | | | $ | 2,058,515 | | | $ | 177,677 | | | $ | 265,552,976 | |
| | | | |
Short-term investments | | | | | | | | | | | | | | | | |
Investment companies | | | 2,644,039 | | | | 28,178,207 | | | | 0 | | | | 30,822,246 | |
| | | $ | 265,960,823 | | | $ | 30,236,722 | | | $ | 177,677 | | | $ | 296,375,222 | |
| | | | | | |
| Notes to financial statements (unaudited) | | Wells Fargo Advantage Global Opportunities Fund | | | 23 | |
As of April 30, 2013, the inputs used in valuing the Fund’s other financial instruments were as follows:
| | | | | | | | | | | | | | | | |
| Other financial instruments | | Quoted prices (Level 1) | | | Significant other
observable inputs (Level 2) | | | Significant unobservable inputs (Level 3) | | | Total | |
Forward foreign currency contracts+ | | $ | 0 | | | $ | 187,904 | | | $ | 0 | | | $ | 187,904 | |
| + | Forward foreign currency contracts are presented at the unrealized gains or losses on the instrument. |
Transfers in and transfers out are recognized at the end of the reporting period. For the six months ended April 30, 2013, the Fund did not have any transfers into/out of Level 1 or Level 2.
4. TRANSACTIONS WITH AFFILIATES AND OTHER EXPENSES
Advisory Fee
The Trust has entered into an advisory contract with Funds Management, an indirect wholly owned subsidiary of Wells Fargo & Company (“Wells Fargo”). The adviser is responsible for implementing investment policies and guidelines and for supervising the subadviser, who is responsible for day-to-day portfolio management of the Fund.
Pursuant to the contract, Funds Management is entitled to receive an annual advisory fee starting at 0.90% and declining to 0.80% as the average daily net assets of the Fund increase. For the six months ended April 30, 2013, the advisory fee was equivalent to an annual rate of 0.90% of the Fund’s average daily net assets.
Funds Management has retained the services of a subadviser to provide daily portfolio management to the Fund. The fee for subadvisory services is borne by Funds Management. WellsCap, an affiliate of Funds Management, is the subadviser to the Fund and is entitled to receive a fee from Funds Management at an annual rate starting at 0.55% and declining to 0.40% as the average daily net assets of the Fund increase.
Administration and transfer agent fees
The Trust has entered into an administration agreement with Funds Management. Under this agreement, for providing administrative services, which includes paying fees and expenses for services provided by the transfer agent, sub-transfer agents, omnibus account servicers and record-keepers, Funds Management is entitled to receive from the Fund an annual fund level administration fee starting at 0.05% and declining to 0.03% as the average daily net assets of the Fund increase and a class level administration fee which is calculated based on the average daily net assets of each class as follows:
| | | | |
| | | Class level administration fee | |
Class A, Class B, Class C | | | 0.26 | % |
Administrator Class | | | 0.10 | |
Institutional Class | | | 0.08 | |
Funds Management has contractually waived and/or reimbursed advisory and administration fees to the extent necessary to maintain certain net operating expense ratios for the Fund. Waiver of fees and/or reimbursement of expenses by Funds Management were made first from fund level expenses on a proportionate basis and then from class specific expenses. Funds Management has committed through February 28, 2014 to waive fees and/or reimburse expenses to the extent necessary to cap the Fund’s expenses at 1.55% for Class A shares, 2.30% for Class B shares, 2.30% for Class C shares, 1.40% for Administrator Class shares, and 1.15% for Institutional Class shares.
Distribution fees
The Trust has adopted a Distribution Plan for Class B and Class C shares of the Fund pursuant to Rule 12b-1 under the 1940 Act. Distribution fees are charged to Class B and Class C shares and paid to Wells Fargo Funds Distributor, LLC, the principal underwriter, at an annual rate of 0.75% of the average daily net assets of Class B and Class C shares.
For the six months ended April 30, 2013, Wells Fargo Funds Distributor, LLC received $7,281 from the sale of Class A shares and $3,374 and $13 in contingent deferred sales charges from redemptions of Class B and Class C shares, respectively.
| | | | |
| 24 | | Wells Fargo Advantage Global Opportunities Fund | | Notes to financial statements (unaudited) |
Shareholder servicing fees
The Trust has entered into contracts with one or more shareholder servicing agents, whereby Class A, Class B, Class C, and Administrator Class of the Fund is charged a fee at an annual rate of 0.25% of the average daily net assets of each respective class.
A portion of these total shareholder servicing fees were paid to affiliates of Wells Fargo.
5. INVESTMENT PORTFOLIO TRANSACTIONS
Purchases and sales of investments, excluding U.S. government obligations (if any) and short-term securities, for the six months ended April 30, 2013 were $90,924,620 and $103,034,311, respectively.
6. DERIVATIVE TRANSACTIONS
During the six months ended April 30, 2013, the Fund entered into forward foreign currency exchange contracts for economic hedging purposes.
At April 30, 2013, the Fund had forward foreign currency contracts outstanding as follows:
Forward foreign currency contracts to sell:
| | | | | | | | | | |
Exchange date | | Counterparty | | Contracts to deliver | | U.S. value at April 30, 2013 | | In exchange for U.S. $ | | Unrealized gains |
| 9-9-2013 | | State Street Bank | | 439,245,000 JPY | | $4,509,401 | | $4,697,305 | | $187,904 |
The Fund had average contract amounts of $5,637 and $1,427,358 in forward foreign currency contracts to buy and forward foreign currency contracts to sell, respectively, during the six months ended April 30, 2013.
The fair value, realized gains or losses and change in unrealized gains or losses, if any, on derivative instruments are reflected in the appropriate financial statements.
7. BANK BORROWINGS
The Trust (excluding the money market funds and certain other funds in the Trust) and Wells Fargo Variable Trust are parties to a $150,000,000 revolving credit agreement with State Street Bank and Trust Company, whereby the Fund is permitted to use bank borrowings for temporary or emergency purposes, such as to fund shareholder redemption requests. Interest under the credit agreement is charged to the Fund based on a borrowing rate equal to the higher of the Federal Funds rate in effect on that day plus 1.25% or the overnight LIBOR rate in effect on that day plus 1.25%. In addition, an annual commitment fee equal to 0.10% of the unused balance is allocated to each participating fund. For the six months ended April 30, 2013, the Fund paid $283 in commitment fees.
For the six months ended April 30, 2013, there were no borrowings by the Fund under the agreement.
8. INDEMNIFICATION
Under the Trust’s organizational documents, the officers and directors are indemnified against certain liabilities that may arise out of performance of their duties to the Trust. Additionally, in the normal course of business, the Trust may enter into contracts with service providers that contain a variety of indemnification clauses. The Trust’s maximum exposure under these arrangements is dependent on future claims that may be made against the Fund and, therefore, cannot be estimated.
9. NEW ACCOUNTING PRONOUNCEMENT
In December 2011, the Financial Accounting Standards Board (“FASB”) issued Accounting Standard Update (“ASU”) No. 2011-11, Disclosures about Offsetting Assets and Liabilities. ASU 2011-11, which amends FASB ASC Topic 210, Balance Sheet, creates new disclosure requirements which require entities to disclose both gross and net information for derivatives and other financial instruments that are either offset in the Statement of Assets and Liabilities or subject to an enforceable master netting arrangement or similar agreement. The disclosure requirements are effective for interim and annual reporting periods beginning on or after January 1, 2013. Management is currently assessing the potential impact, in addition to expanded financial statement disclosure, that may result from adopting this ASU.
| | | | | | |
| Other information (unaudited) | | Wells Fargo Advantage Global Opportunities Fund | | | 25 | |
PROXY VOTING INFORMATION
A description of the policies and procedures that the Fund uses to determine how to vote proxies relating to portfolio securities is available without charge, upon request, by calling 1-800-222-8222, visiting our website at wellsfargoadvantagefunds.com, or visiting the SEC website at sec.gov. Information regarding how the Fund voted proxies relating to portfolio securities during the most recent 12-month period ended June 30 is available without charge on the Fund’s website at wellsfargoadvantagefunds.com or by visiting the SEC website at sec.gov.
PORTFOLIO HOLDINGS INFORMATION
The complete portfolio holdings for the Fund are publicly available on the Fund’s website (wellsfargoadvantagefunds.com) on a monthly, 30-day or more delayed basis. In addition, top ten holdings information for the Fund is publicly available on the Fund’s website on a monthly, seven-day or more delayed basis. The Fund files its complete schedule of portfolio holdings with the SEC for the first and third quarters of each fiscal year on Form N-Q, which is available without charge by visiting the SEC website at sec.gov. In addition, the Fund’s Form N-Q may be reviewed and copied at the SEC’s Public Reference Room in Washington, DC, and at regional offices in New York City, at 233 Broadway, and in Chicago, at 175 West Jackson Boulevard, Suite 900. Information about the Public Reference Room may be obtained by calling 1-800-SEC-0330.
| | | | |
| 26 | | Wells Fargo Advantage Global Opportunities Fund | | Other information (unaudited) |
BOARD OF TRUSTEES AND OFFICERS
Each of the Trustees and Officers listed in the table below acts in identical capacities for the Wells Fargo Advantage family of funds, which consists of 131 funds1 comprising the Wells Fargo Funds Trust, Wells Fargo Variable Trust, Wells Fargo Master Trust and four closed-end funds (collectively the “Fund Complex”). This table should be read in conjunction with the Prospectus and the Statement of Additional Information2. All of the Trustees are also Members of the Audit and Governance Committees of each Trust in the Fund Complex. The mailing address of each Trustee and Officer is 525 Market Street, 12th Floor, San Francisco, CA 94105. Each Trustee and Officer serves an indefinite term, however, each Trustee serves such term until reaching the mandatory retirement age established by the Trustees.
Independent Trustees
| | | | | | |
Name and year of birth | | Position held and length of service* | | Principal occupations during past five years | | Other directorships during past five years |
| Peter G. Gordon (Born 1942) | | Trustee, since 1998; Chairman, since 2005 | | Co-Founder, Retired Chairman, President and CEO of Crystal Geyser Water Company. Trustee Emeritus, Colby College. | | Asset Allocation Trust |
Isaiah Harris, Jr. (Born 1952) | | Trustee, since 2009 | | Retired. Prior thereto, President and CEO of BellSouth Advertising and Publishing Corp. from 2005 to 2007, President and CEO of BellSouth Enterprises from 2004 to 2005 and President of BellSouth Consumer Services from 2000 to 2003. Emeritus member of the Iowa State University Foundation Board of Governors. Emeritus Member of the Advisory Board of Iowa State University School of Business. Advisory Board Member, Palm Coast Academy (charter school). Mr. Harris is a certified public accountant. | | CIGNA Corporation; Deluxe Corporation; Asset Allocation Trust |
Judith M. Johnson (Born 1949) | | Trustee, since 2008; Audit Committee Chairman, since 2008 | | Retired. Prior thereto, Chief Executive Officer and Chief Investment Officer of Minneapolis Employees Retirement Fund from 1996 to 2008. Ms. Johnson is an attorney, certified public accountant and a certified managerial accountant. | | Asset Allocation Trust |
Leroy Keith, Jr. (Born 1939) | | Trustee, since 2010 | | Chairman, Bloc Global Services (development and construction). Trustee of the Evergreen Funds from 1983 to 2010. Former Managing Director, Almanac Capital Management (commodities firm), former Partner, Stonington Partners, Inc. (private equity fund), former Director, Obagi Medical Products Co. and former Director, Lincoln Educational Services. | | Trustee, Virtus Fund Complex (consisting of 48 portfolios as of 1/31/2013); Asset Allocation Trust |
David F. Larcker (Born 1950) | | Trustee, since 2009 | | James Irvin Miller Professor of Accounting at the Graduate School of Business, Stanford University, Morgan Stanley Director of the Center for Leadership Development and Research and Senior Faculty of The Rock Center for Corporate Governance since 2006. From 2005 to 2008, Professor of Accounting at the Graduate School of Business, Stanford University. Prior thereto, Ernst & Young Professor of Accounting at The Wharton School, University of Pennsylvania from 1985 to 2005. | | Asset Allocation Trust |
Olivia S. Mitchell (Born 1953) | | Trustee, since 2006 | | International Foundation of Employee Benefit Plans Professor, Wharton School of the University of Pennsylvania since 1993. Director of Wharton’s Pension Research Council and Boettner Center on Pensions & Retirement Research, and Research Associate at the National Bureau of Economic Research. Previously, Cornell University Professor from 1978 to 1993. | | Asset Allocation Trust |
Timothy J. Penny (Born 1951) | | Trustee, since 1996 | | President and CEO of Southern Minnesota Initiative Foundation, a non-profit organization, since 2007 and Senior Fellow at the Humphrey Institute Policy Forum at the University of Minnesota since 1995. Member of the Board of Trustees of NorthStar Education Finance, Inc., a non-profit organization,
since 2007. | | Asset Allocation Trust |
| | | | | | |
| Other information (unaudited) | | Wells Fargo Advantage Global Opportunities Fund | | | 27 | |
| | | | | | |
Name and year of birth | | Position held and length of service* | | Principal occupations during past five years | | Other directorships during past five years |
Michael S. Scofield (Born 1943) | | Trustee, since 2010 | | Served on the Investment Company Institute’s Board of Governors and Executive Committee from 2008-2011 as well the Governing Council of the Independent Directors Council from 2006-2011 and the Independent Directors Council Executive Committee from 2008-2011. Chairman of the IDC from 2008-2010. Institutional Investor (Fund Directions) Trustee of Year in 2007. Trustee of the Evergreen Funds (and its predecessors) from 1984 to 2010. Chairman of the Evergreen Funds from 2000-2010. Former Trustee of the Mentor Funds. Retired Attorney, Law Offices of Michael S. Scofield. | | Asset Allocation Trust |
| Donald C. Willeke (Born 1940) | | Trustee, since 1996 | | Principal of the law firm of Willeke & Daniels. General Counsel of the Minneapolis Employees Retirement Fund from 1984 until its consolidation into the Minnesota Public Employees Retirement Association on June 30, 2010. Director and Vice Chair of The Tree Trust (non-profit corporation). Director of the American Chestnut Foundation (non-profit corporation). | | Asset Allocation Trust |
| * | Length of service dates reflect the Trustee’s commencement of service with the Trust’s predecessor entities, where applicable. |
Officers
| | | | | | |
Name and year of birth | | Position held and
length of service | | Principal occupations during past five years | | |
Karla M. Rabusch (Born 1959) | | President, since 2003 | | Executive Vice President of Wells Fargo Bank, N.A. and President of Wells Fargo Funds Management, LLC since 2003. | | |
Jeremy DePalma1 (Born 1974) | | Treasurer, since 2012 | | Senior Vice President of Wells Fargo Funds Management, LLC since 2009. Senior Vice President of Evergreen Investment Management Company, LLC from 2008 to 2010. Vice President, Evergreen Investment Services, Inc. from 2004 to 2007. Head of the Fund Reporting and Control Team within Fund Administration from 2005 to 2010. | | |
C. David Messman (Born 1960) | | Secretary, since 2000; Chief Legal Officer, since 2003 | | Senior Vice President and Secretary of Wells Fargo Funds Management, LLC since 2001. Vice President and Managing Counsel of Wells Fargo Bank, N.A. since 1996. | | |
Debra Ann Early (Born 1964) | | Chief Compliance Officer, since 2007 | | Chief Compliance Officer of Wells Fargo Funds Management, LLC since 2007. Chief Compliance Officer of Parnassus Investments from 2005 to 2007. Chief Financial Officer of Parnassus Investments from 2004 to 2007. | | |
David Berardi (Born 1975) | | Assistant Treasurer, since 2009 | | Vice President of Wells Fargo Funds Management, LLC since 2009. Vice President of Evergreen Investment Management Company, LLC from 2008 to 2010. Assistant Vice President of Evergreen Investment Services, Inc. from 2004 to 2008. Manager of Fund Reporting and Control for Evergreen Investment Management Company, LLC from 2004 to 2010. | | |
| 1. | Jeremy DePalma acts as Treasurer of 58 funds and Assistant Treasurer of 73 funds in the Fund Complex. |
| 2. | The Statement of Additional Information includes additional information about the Trustees and is available,without charge, upon request, by calling 1-800-222-8222 or by visiting the website at wellsfargoadvantagefunds.com. |
| | | | |
| 28 | | Wells Fargo Advantage Global Opportunities Fund | | Other information (unaudited) |
BOARD CONSIDERATION OF INVESTMENT ADVISORY AND SUBADVISORY AGREEMENTS:
Under Section 15 of the Investment Company Act of 1940 (the “1940 Act”), the Board of Trustees (the “Board”) of Wells Fargo Funds Trust (the “Trust”), all the members of which have no direct or indirect interest in the investment advisory and sub-advisory agreements and are not “interested persons” of the Trust, as defined in the 1940 Act (the “Independent Trustees”), must determine whether to approve the continuation of the Trust’s investment advisory and sub-advisory agreements. In this regard, at an in-person meeting held on March 28-29, 2013 (the “Meeting”), the Board reviewed: (i) an investment advisory agreement with Wells Fargo Funds Management, LLC (“Funds Management”) for Wells Fargo Advantage Global Opportunities Fund (the “Fund”) and (ii) an investment sub-advisory agreement with Wells Capital Management Incorporated (the “Sub-Adviser”), an affiliate of Funds Management, for the Fund. The investment advisory agreement with Funds Management and the investment sub-advisory agreement with the Sub-Adviser are collectively referred to as the “Advisory Agreements.”
At the Meeting, the Board considered the factors and reached the conclusions described below relating to the selection of Funds Management and the Sub-Adviser and the continuation of the Advisory Agreements. Prior to the Meeting, the Trustees conferred extensively among themselves and with representatives of Funds Management about these matters. The Board has adopted a team-based approach, with each team consisting of a sub-set of Trustees, to assist the Board in the discharge of its duties in reviewing performance and other matters throughout the year. The Independent Trustees were assisted in their evaluation of the Advisory Agreements by independent legal counsel, from whom they received separate legal advice and with whom they met separately.
In providing information to the Board, Funds Management and the Sub-Adviser were guided by a detailed set of requests for information submitted to them by independent legal counsel on behalf of the Independent Trustees at the start of the Board’s annual contract renewal process earlier in 2013. In considering and approving the Advisory Agreements, the Trustees considered the information they believed relevant, including but not limited to the information discussed below. The Board considered not only the specific information presented in connection with the Meeting, but also the knowledge gained over time through interaction with Funds Management and the Sub-Adviser about various topics. In this regard, the Board reviewed reports of Funds Management at each of its quarterly meetings, which included, among other things, portfolio reviews and performance reports. In addition, the Board and the teams mentioned above confer with portfolio managers at various times throughout the year. The Board did not identify any particular information or consideration that was all-important or controlling, and each individual Trustee may have attributed different weights to various factors.
After its deliberations, the Board unanimously determined that the continuation of the Advisory Agreements is in the best interests of the Fund and its shareholders, and that the compensation payable to Funds Management and the Sub-Adviser is reasonable. The Board considered the continuation of the Advisory Agreements for the Fund as part of its consideration of the continuation of advisory agreements for funds across the complex, but each decision was made on a fund-by-fund basis. The following summarizes a number of important, but not necessarily all, factors considered by the Board in reaching its determination.
Nature, extent and quality of services
The Board received and considered various information regarding the nature, extent and quality of services provided to the Fund by Funds Management and the Sub-Adviser under the Advisory Agreements. This information included, among other things, a summary of the background and experience of senior management of Funds Management, and the qualifications, background, tenure and responsibilities of each of the portfolio managers primarily responsible for the day-to-day portfolio management of the Fund.
The Board evaluated the ability of Funds Management and the Sub-Adviser, based on attributes such as their financial condition, resources and reputation, to attract and retain qualified investment professionals, including research, advisory and supervisory personnel. The Board further considered the compliance programs and compliance records of Funds Management and the Sub-Adviser. In addition, the Board took into account the administrative and other services provided to the Fund by Funds Management and its affiliates and Funds Management’s oversight of the Fund’s various service providers.
Fund performance and expenses
The Board considered the performance results for the Fund over various time periods ended December 31, 2012. The Board also considered these results in comparison to the performance of funds in a universe that was determined by Lipper Inc. (“Lipper”) to be similar to the Fund (the “Universe”), and in comparison to the Fund’s benchmark index and to other comparative data. Lipper is an independent provider of investment company data. The Board received a
| | | | | | |
| Other information (unaudited) | | Wells Fargo Advantage Global Opportunities Fund | | | 29 | |
description of the methodology used by Lipper to select the mutual funds in the performance Universe. The Board noted that the performance of the Fund (Administrator Class) was higher than or in range of the median performance of the Universe for all periods under review. The Board also noted that the performance of the Fund was higher than its benchmark, the S&P Developed SmallCap Index, for the one- and ten-year periods under review, but was lower than the benchmark for the three- and five-year periods under review.
The Board received information concerning, and discussed factors contributing to, the underperformance of the Fund relative to the benchmark for the three- and five-year periods under review. Funds Management advised the Board about the market conditions and investment decisions that it believed contributed to the underperformance during that period. Funds Management advised the Board that the underperformance relative to the benchmark was attributable to defensive international positions in 2009 and 2010. The Board was apprised of the fact that the portfolio manager of the non-domestic allocation is no longer with the Sub-Adviser and the Board noted the more recent positive performance of the Fund relative to the benchmark for the one-year period under review. The Board also noted the positive performance of the Fund relative to the Universe for all periods under review. The Board was satisfied with the explanation of the underperformance.
The Board received and considered information regarding the Fund’s net operating expense ratios and their various components, including actual management fees (which reflect fee waivers, if any, and include advisory, administration and transfer agent fees), custodian and other non-management fees, Rule 12b-1 and non-Rule 12b-1 service fees and fee waiver and expense reimbursement arrangements. The Board also considered these ratios in comparison to the median ratios of funds in class-specific expense groups that were determined by Lipper to be similar to the Fund (the “Groups”). The Board received a description of the methodology used by Lipper to select the mutual funds in the expense Groups. Based on the Lipper reports, the Board noted that the net operating expense ratios of the Fund were lower than or in range of the median net operating expense ratios of the expense Groups for all classes. The Board and Funds Management agreed to maintain the current contractual net expense ratio caps for the Fund.
Based on its consideration of the factors and information it deemed relevant, including those described here, the Board concluded that the overall performance and expense structure of the Fund supported the re-approval of the Advisory Agreements.
Investment advisory and sub-advisory fee rates
The Board reviewed and considered the contractual investment advisory fee rates that are payable by the Fund to Funds Management for investment advisory services (the “Advisory Agreement Rates”), both on a stand-alone basis and on a combined basis with the Fund’s fund-level and class-level contractual administration fee rates (the “Management Rates”). The Board noted that the administration fees include transfer agency costs. The Board also reviewed and considered the contractual investment sub-advisory fee rates that are payable by Funds Management to the Sub-Adviser for investment sub-advisory services (the “Sub-Advisory Agreement Rates”).
Among other information reviewed by the Board was a comparison of the Management Rates of the Fund with those of other funds in the expense Groups at a common asset level. The Board noted that the Management Rates of the Fund were in range of the median rates for the Fund’s expense Groups for all classes except Class A. The Board and Funds Management agreed to maintain the current contractual net expense ratio caps for the Fund, including Class A.
The Board also received and considered information about the portion of the total advisory fee that was retained by Funds Management after payment of the fee to the Sub-Adviser for sub-advisory services. In assessing the reasonableness of this amount, the Board received and evaluated information concerning the nature and extent of responsibilities retained and risks assumed by Funds Management and not delegated to or assumed by the Sub-Adviser, and about Funds Management’s on-going oversight services. In recognition of the fact that the Wells Fargo enterprise provides a suite of combined advisory and sub-advisory services to the Fund through affiliated entities, the Board ascribed limited relevance to the allocation of the total advisory fee between Funds Management and the Sub-Adviser.
The Board also received and considered information about the nature and extent of services offered and fee rates charged by Funds Management and the Sub-Adviser to other types of clients. In this regard, the Board received information about the significantly greater scope of services, and compliance, reporting and other legal burdens and risks of managing mutual funds compared with those associated with managing assets of non-mutual fund clients such as collective funds or institutional separate accounts.
Based on its consideration of the factors and information it deemed relevant, including those described here, the Board determined that the Advisory Agreement Rates and the Sub-Advisory Agreement Rates were reasonable in light of the services covered by the Advisory Agreements.
| | | | |
| 30 | | Wells Fargo Advantage Global Opportunities Fund | | Other information (unaudited) |
Profitability
The Board received and considered information concerning the profitability of Funds Management, as well as the profitability of Wells Fargo as a whole, from providing services to the Fund. The Board did not receive or consider to be necessary separate profitability information with respect to the Sub-Adviser, because, as an affiliate of Funds Management, its profitability information was subsumed in the collective Wells Fargo profitability analysis provided by Funds Management.
Funds Management explained the methodologies and estimates that it used in calculating the profitability from the Fund and the fund family as a whole. Among other things, the Board noted that the levels of profitability reported on a fund-by-fund basis varied widely, depending on factors such as the size and type of fund. Based on its review, the Board did not deem the profits reported by Funds Management to be at a level that would prevent it from approving the continuation of the Advisory Agreements.
Economies of scale
With respect to possible economies of scale, the Board reviewed the breakpoints in the Fund’s advisory fee and administration fee structure, which operate generally to reduce the Fund’s expense ratios as the Fund grows in size. It considered that, for a small fund or a fund that shrinks in size, breakpoints conversely can result in higher fee levels. The Board also considered fee waiver and expense reimbursement arrangements as a means of sharing potential economies of scale with the Fund. The Board acknowledged the inherent limitations of any analysis of potential economies of scale and of any attempt to correlate breakpoints with such economies. Nonetheless, the Board concluded that the breakpoints and net operating expense ratio caps appeared to be a reasonable approach to sharing potential economies of scale with the Fund.
Other benefits to Funds Management and the Sub-Adviser
The Board received and considered information regarding potential “fall-out” or ancillary benefits received by Funds Management and its affiliates, including the Sub-Adviser, as a result of their relationship with the Fund. Ancillary benefits could include, among others, benefits directly attributable to other relationships with the Fund and benefits potentially derived from an increase in Funds Management’s and the Sub-Adviser’s business as a result of their relationship with the Fund (such as the ability to market to shareholders other financial products and services offered by Funds Management and its affiliates, including the Sub-Adviser, or to operate other products and services that follow investment strategies similar to those of the Fund).
The Board considered that Wells Fargo Funds Distributor, LLC, an affiliate of Funds Management, serves as distributor to the Fund and receives certain compensation for those services. The Board noted that various financial institutions, including affiliates of Funds Management, may receive distribution-related fees, shareholder servicing payments (including amounts derived from payments under Rule 12b-1 plans) and sub-transfer agency fees in respect of shares sold or held through them and services provided.
The Board also reviewed information about whether and to what extent soft dollar credits are sought and how any such credits are utilized, and any benefits that might be realized by an affiliated broker that handles portfolio transactions for the Fund.
Based on its consideration of the factors and information it deemed relevant, including those described here, the Board did not find that any ancillary benefits received by Funds Management and its affiliates, including the Sub-Adviser, were unreasonable.
Conclusion
After considering the above-described factors and based on its deliberations and its evaluation of the information described above, the Board unanimously approved the continuation of the Advisory Agreements for an additional one-year period.
| | | | | | |
| List of abbreviations | | Wells Fargo Advantage Global Opportunities Fund | | | 31 | |
The following is a list of common abbreviations for terms and entities that may have appeared in this report.
| ACA | — ACA Financial Guaranty Corporation |
| ADR | — American depositary receipt |
| ADS | — American depositary shares |
| AGC | — Assured Guaranty Corporation |
| AGM | — Assured Guaranty Municipal |
| Ambac | — Ambac Financial Group Incorporated |
| AMT | — Alternative minimum tax |
| BAN | — Bond anticipation notes |
| BHAC | — Berkshire Hathaway Assurance Corporation |
| CAB | — Capital appreciation bond |
| CCAB | — Convertible capital appreciation bond |
| CDA | — Community Development Authority |
| CDO | — Collateralized debt obligation |
| COP | — Certificate of participation |
| DRIVER | — Derivative inverse tax-exempt receipts |
| DW&P | — Department of Water & Power |
| DWR | — Department of Water Resources |
| ECFA | — Educational & Cultural Facilities Authority |
| EDA | — Economic Development Authority |
| EDFA | — Economic Development Finance Authority |
| ETF | — Exchange-traded fund |
| FDIC | — Federal Deposit Insurance Corporation |
| FFCB | — Federal Farm Credit Banks |
| FGIC | — Financial Guaranty Insurance Corporation |
| FHA | — Federal Housing Administration |
| FHLB | — Federal Home Loan Bank |
| FHLMC | — Federal Home Loan Mortgage Corporation |
| FICO | — The Financing Corporation |
| FNMA | — Federal National Mortgage Association |
| GDR | — Global depositary receipt |
| GNMA | — Government National Mortgage Association |
| HCFR | — Healthcare facilities revenue |
| HEFA | — Health & Educational Facilities Authority |
| HEFAR | — Higher education facilities authority revenue |
| HFA | — Housing Finance Authority |
| HFFA | — Health Facilities Financing Authority |
| HUD | — Department of Housing and Urban Development |
| IDA | — Industrial Development Authority |
| IDAG | — Industrial Development Agency |
| IDR | — Industrial development revenue |
| KRW | — Republic of Korea won |
| LIBOR | — London Interbank Offered Rate |
| LLC | — Limited liability company |
| LLP | — Limited liability partnership |
| MBIA | — Municipal Bond Insurance Association |
| MFHR | — Multifamily housing revenue |
| MSTR | — Municipal securities trust receipts |
| MUD | — Municipal Utility District |
| National | — National Public Finance Guarantee Corporation |
| PCFA | — Pollution Control Financing Authority |
| PCL | — Public Company Limited |
| PCR | — Pollution control revenue |
| PFA | — Public Finance Authority |
| PFFA | — Public Facilities Financing Authority |
| PFOTER | — Puttable floating option tax-exempt receipts |
| plc | — Public limited company |
| PUTTER | — Puttable tax-exempt receipts |
| R&D | — Research & development |
| Radian | — Radian Asset Assurance |
| RAN | — Revenue anticipation notes |
| RDA | — Redevelopment Authority |
| RDFA | — Redevelopment Finance Authority |
| REIT | — Real estate investment trust |
| ROC | — Reset option certificates |
| SAVRS | — Select auction variable rate securities |
| SBA | — Small Business Authority |
| SFHR | — Single-family housing revenue |
| SFMR | — Single-family mortgage revenue |
| SPA | — Standby purchase agreement |
| SPDR | — Standard & Poor’s Depositary Receipts |
| STRIPS | — Separate trading of registered interest and principal securities |
| TAN | — Tax anticipation notes |
| TIPS | — Treasury inflation-protected securities |
| TRAN | — Tax revenue anticipation notes |
| TTFA | — Transportation Trust Fund Authority |
| TVA | — Tennessee Valley Authority |
This page is intentionally left blank.
This page is intentionally left blank.
This page is intentionally left blank.


For more information
More information about Wells Fargo Advantage Funds is available free upon request. To obtain literature, please write, email, visit the Fund’s website, or call:
Wells Fargo Advantage Funds
P.O. Box 8266
Boston, MA 02266-8266
Email: wfaf@wellsfargo.com
Website: wellsfargoadvantagefunds.com
Individual investors: 1-800-222-8222
Retail investment professionals: 1-888-877-9275
Institutional investment professionals: 1-866-765-0778
This report and the financial statements contained herein are submitted for the general information of the shareholders of Wells Fargo Advantage Funds. If this report is used for promotional purposes, distribution of the report must be accompanied or preceded by a current prospectus. For a current prospectus and, if available, a summary prospectus containing more complete information, including charges and expenses, call 1-800-222-8222 or visit the Fund’s website at wellsfargoadvantagefunds.com. Please consider the investment objectives, risks, charges, and expenses of the investment carefully before investing. This and other information about Wells Fargo Advantage Funds can be found in the current prospectus. Read the prospectus carefully before you invest or send money.
Wells Fargo Funds Management, LLC, a wholly owned subsidiary of Wells Fargo & Company, provides investment advisory and administrative services for Wells Fargo Advantage Funds. Other affiliates of Wells Fargo & Company provide subadvisory and other services for the Funds. The Funds are distributed by Wells Fargo Funds Distributor, LLC, Member FINRA/SIPC, an affiliate of Wells Fargo & Company.
NOT FDIC INSURED ¡ NO BANK GUARANTEE ¡ MAY LOSE VALUE
© 2013 Wells Fargo Funds Management, LLC. All rights reserved.
| | |
 | | 216834 06-13 SA239/SAR239 4-13 |

Wells Fargo Advantage
International Equity Fund

Semi-Annual Report
April 30, 2013

Reduce clutter. Save trees.
Sign up for electronic delivery of prospectuses and shareholder reports at wellsfargo.com/advantagedelivery
Contents
The views expressed and any forward-looking statements are as of April 30, 2013, unless otherwise noted, and are those of the Fund managers and/or Wells Fargo Funds Management, LLC. Discussions of individual securities, or the markets generally, or any Wells Fargo Advantage Fund are not intended as individual recommendations. Future events or results may vary significantly from those expressed in any forward-looking statements; the views expressed are subject to change at any time in response to changing circumstances in the market. Wells Fargo Funds Management, LLC, disclaims any obligation to publicly update or revise any views expressed or forward-looking statements.
NOT FDIC INSURED ¡ NO BANK GUARANTEE ¡ MAY LOSE VALUE

Wells Fargo investment history
| | |
| 1932 | | Keystone creates one of the first mutual fund families. |
| 1971 | | Wells Fargo & Company introduces one of the first institutional index funds. |
| 1978 | | Wells Fargo applies Markowitz and Sharpe’s research on Modern Portfolio Theory to introduce one of the industry’s first tactical asset allocation models in institutional separately managed accounts. |
| 1984 | | Wells Fargo Stagecoach Funds launches its first asset allocation fund. |
| 1989 | | The Tactical Asset Allocation (TAA) Model is first applied to Wells Fargo’s asset allocation mutual funds. |
| 1994 | | Wells Fargo introduces the LifePath Funds, one of the first suites of target date funds (now the Wells Fargo Advantage Dow Jones Target Date FundsSM). |
| 1996 | | Evergreen Investments and Keystone Funds merge. |
| 1997 | | Wells Fargo launches the Wells Fargo Advantage WealthBuilder PortfoliosSM, a fund-of-funds suite of products that includes the use of quantitative models to shift assets among investment styles. |
| 1999 | | Norwest Advantage Funds and Stagecoach Funds are reorganized into Wells Fargo Funds after the merger of Norwest and Wells Fargo. |
| 2002 | | Evergreen Retail and Evergreen Institutional companies form the umbrella asset management company, Evergreen Investments. |
| 2005 | | The integration of Strong Funds with Wells Fargo Funds creates Wells Fargo Advantage Funds, resulting in one of the top 20 mutual fund companies in the United States. |
| 2006 | | Wells Fargo Advantage Funds relaunches the target date product line as Wells Fargo Advantage Dow Jones Target Date Funds. |
| 2010 | | The mergers and reorganizations of Evergreen and Wells Fargo Advantage mutual funds are completed, unifying the families under the brand of Wells Fargo Advantage Funds. |
Wells Fargo Advantage Funds®
Wells Fargo Advantage Funds skillfully guides institutions, financial advisors, and individuals through the investment terrain to help them reach their financial objectives. Everything we do on behalf of investors is backed by our unique combination of qualifications.
Strength
Our organization is built on the standards of integrity and service established by our parent company—Wells Fargo & Company—more than 150 years ago. And, because we’re part of a highly diversified financial enterprise, we offer the depth of resources to help investors succeed.
Expertise
Our multi-boutique model offers investors access to the independent thinking of premier investment managers that have been chosen for their time-tested strategies. While each team specializes in a specific investment strategy, collectively they provide investors a wide choice of distinct investment styles. Our dedication to investment excellence doesn’t end with our expertise in manager selection—risk management, analysis, and rigorous ongoing review seek to ensure each manager’s investment process remains consistent.
Partnership
Our collaborative approach is built around understanding the needs and goals of our clients. By adhering to core principles of sound judgment and steady guidance, we support you through every stage of the investment decision process.
Carefully consider the investment objectives, risks, charges, and expenses before investing. For a current prospectus and, if available, a summary prospectus, for Wells Fargo Advantage Funds, containing this and other information, visit wellsfargoadvantagefunds.com. Read it carefully before investing.
Wells Fargo Funds Management, LLC, a wholly owned subsidiary of Wells Fargo & Company, provides investment advisory and administrative services for Wells Fargo Advantage Funds. Other affiliates of Wells Fargo & Company provide subadvisory and other services for the Funds. The Funds are distributed by Wells Fargo Funds Distributor, LLC, Member FINRA/SIPC, an affiliate of Wells Fargo & Company.
“Dow Jones®” and “Dow Jones Target Date IndexesSM” are service marks of Dow Jones Trademark Holdings LLC (“Dow Jones”); have been licensed to CME Group Index Services LLC (“CME Indexes”); and have been sublicensed for use for certain purposes by Global Index Advisors, Inc., and Wells Fargo Funds Management, LLC. The Wells Fargo Advantage Dow Jones Target Date FundsSM, based on the Dow Jones Target Date Indexes, are not sponsored, endorsed, sold, or promoted by Dow Jones, CME Indexes, or their respective affiliates, and none of them makes any representation regarding the advisability of investing in such product(s).
NOT FDIC INSURED ¡ NO BANK GUARANTEE ¡ MAY LOSE VALUE
Not part of the semi-annual report.
Wells Fargo Advantage Funds offers more than 100 mutual funds across a wide range of asset classes, representing over $228 billion in assets under management, as of April 30, 2013.
| | | | |
| Equity funds | | | | |
Asia Pacific Fund | | Enterprise Fund† | | Opportunity Fund† |
C&B Large Cap Value Fund | | Global Opportunities Fund | | Precious Metals Fund |
C&B Mid Cap Value Fund | | Growth Fund | | Premier Large Company Growth Fund |
Capital Growth Fund | | Index Fund | | Small Cap Opportunities Fund |
Common Stock Fund | | International Equity Fund | | Small Cap Value Fund |
Disciplined U.S. Core Fund | | International Value Fund | | Small Company Growth Fund |
Discovery Fund† | | Intrinsic Small Cap Value Fund | | Small Company Value Fund |
Diversified Equity Fund | | Intrinsic Value Fund | | Small/Mid Cap Value Fund |
Diversified International Fund | | Intrinsic World Equity Fund | | Special Mid Cap Value Fund |
Emerging Growth Fund | | Large Cap Core Fund | | Special Small Cap Value Fund |
Emerging Markets Equity Fund | | Large Cap Growth Fund | | Specialized Technology Fund |
Emerging Markets Equity Income Fund | | Large Company Value Fund | | Traditional Small Cap Growth Fund |
Endeavor Select Fund† | | Omega Growth Fund | | Utility and Telecommunications Fund |
| Bond funds | | | | |
Adjustable Rate Government Fund | | High Yield Municipal Bond Fund | | Short Duration Government Bond Fund |
California Limited-Term Tax-Free Fund | | Income Plus Fund | | Short-Term Bond Fund |
California Tax-Free Fund | | Inflation-Protected Bond Fund | | Short-Term High Yield Bond Fund |
Colorado Tax-Free Fund | | Intermediate Tax/AMT-Free Fund | | Short-Term Municipal Bond Fund |
Conservative Income Fund | | International Bond Fund | | Strategic Income Fund |
Core Bond Fund | | Minnesota Tax-Free Fund | | Strategic Municipal Bond Fund |
Emerging Markets Local Bond Fund | | Municipal Bond Fund | | Ultra Short-Term Income Fund |
Government Securities Fund | | North Carolina Tax-Free Fund | | Ultra Short-Term Municipal Income Fund |
High Income Fund | | Pennsylvania Tax-Free Fund | | Wisconsin Tax-Free Fund |
High Yield Bond Fund | | | | |
| Asset allocation funds | | | | |
Absolute Return Fund | | WealthBuilder Equity Portfolio† | | Target 2020 Fund† |
Asset Allocation Fund | | WealthBuilder Growth Allocation Portfolio† | | Target 2025 Fund† |
Diversified Capital Builder Fund | | WealthBuilder Growth Balanced Portfolio† | | Target 2030 Fund† |
Diversified Income Builder Fund | | WealthBuilder Moderate Balanced Portfolio† | | Target 2035 Fund† |
Growth Balanced Fund | | WealthBuilder Tactical Equity Portfolio† | | Target 2040 Fund† |
Index Asset Allocation Fund | | Target Today Fund† | | Target 2045 Fund† |
Moderate Balanced Fund | | Target 2010 Fund† | | Target 2050 Fund† |
WealthBuilder Conservative Allocation Portfolio† | | Target 2015 Fund† | | Target 2055 Fund† |
| Money market funds | | | | |
100% Treasury Money Market Fund | | Heritage Money Market Fund† | | National Tax-Free Money Market Fund |
California Municipal Money Market Fund | | Money Market Fund | | Treasury Plus Money Market Fund |
Cash Investment Money Market Fund | | Municipal Cash Management Money Market Fund | | |
Government Money Market Fund | | Municipal Money Market Fund | | |
| Variable trust funds1 | | | | |
VT Discovery Fund† | | VT Intrinsic Value Fund | | VT Small Cap Growth Fund |
VT Index Asset Allocation Fund | | VT Omega Growth Fund | | VT Small Cap Value Fund |
VT International Equity Fund | | VT Opportunity Fund† | | VT Total Return Bond Fund |
An investment in a money market fund is not insured or guaranteed by the Federal Deposit Insurance Corporation or any other government agency. Although the Wells Fargo Advantage Money Market Funds seek to preserve the value of your investment at $1.00 per share, it is possible to lose money by investing in a money market fund.
| 1. | The variable trust funds are generally available only through insurance company variable contracts. |
| † | In this report, the Wells Fargo Advantage Discovery FundSM, Wells Fargo Advantage Endeavor Select FundSM, Wells Fargo Advantage Enterprise FundSM, Wells Fargo Advantage Opportunity FundSM, Wells Fargo Advantage WealthBuilder Conservative Allocation PortfolioSM, Wells Fargo Advantage WealthBuilder Equity PortfolioSM, Wells Fargo Advantage WealthBuilder Growth Allocation PortfolioSM, Wells Fargo Advantage WealthBuilder Growth Balanced PortfolioSM, Wells Fargo Advantage WealthBuilder Moderate Balanced PortfolioSM, Wells Fargo Advantage WealthBuilder Tactical Equity PortfolioSM, Wells Fargo Advantage Dow Jones Target Today FundSM, Wells Fargo Advantage Dow Jones Target 2010 FundSM, Wells Fargo Advantage Dow Jones Target 2015 FundSM, Wells Fargo Advantage Dow Jones Target 2020 FundSM, Wells Fargo Advantage Dow Jones Target 2025 FundSM, Wells Fargo Advantage Dow Jones Target 2030 FundSM, Wells Fargo Advantage Dow Jones Target 2035 FundSM, Wells Fargo Advantage Dow Jones Target 2040 FundSM, Wells Fargo Advantage Dow Jones Target 2045 FundSM, Wells Fargo Advantage Dow Jones Target 2050 FundSM, Wells Fargo Advantage Dow Jones Target 2055 FundSM, Wells Fargo Advantage Heritage Money Market FundSM, Wells Fargo Advantage VT Discovery FundSM, and Wells Fargo Advantage VT Opportunity FundSM are referred to as the Discovery Fund, Endeavor Select Fund, Enterprise Fund, Opportunity Fund, WealthBuilder Conservative Allocation Portfolio, WealthBuilder Equity Portfolio, WealthBuilder Growth Allocation Portfolio, WealthBuilder Growth Balanced Portfolio, WealthBuilder Moderate Balanced Portfolio, WealthBuilder Tactical Equity Portfolio, Target Today Fund, Target 2010 Fund, Target 2015 Fund, Target 2020 Fund, Target 2025 Fund, Target 2030 Fund, Target 2035 Fund, Target 2040 Fund, Target 2045 Fund, Target 2050 Fund, Target 2055 Fund, Heritage Money Market Fund, VT Discovery Fund, and VT Opportunity Fund, respectively. |
Not part of the semi-annual report.
| | | | |
| 2 | | Wells Fargo Advantage International Equity Fund | | Letter to shareholders (unaudited) |

Karla M. Rabusch
President
Wells Fargo Advantage Funds
Investors were heartened by the resilient performance of the German economy and by the fact that the United Kingdom managed to avoid another recession.
Dear Valued Shareholder:
We are pleased to offer you this semi-annual report for the Wells Fargo Advantage International Equity Fund for the six-month period that ended April 30, 2013. Much of the period was marked by diminished worries of a sovereign debt default in Europe, partially offset by concerns about slowing economic growth in China. Continued monetary easing by global central banks helped support rallies in developed stock markets, but major emerging markets lagged.
Developed markets posted double-digit returns, but major emerging markets lagged.
Global developed equity markets demonstrated continued strength throughout the reporting period despite a budget fight and sequestration cuts in the U.S. and Europe’s seemingly never-ending debt crisis, with Cyprus becoming the newest addition to a list of countries mired in debt. Investors were heartened by the resilient performance of the German economy and by the fact that the United Kingdom managed to avoid another recession. Relatively positive economic data from the U.S. also aided sentiment for developed-market stocks. Although reported U.S. gross domestic product (GDP) growth came in at a moderate 0.4% annualized rate in the fourth quarter of 2012—in part, due to the temporary aftereffects from Hurricane Sandy, which devastated the Eastern Seaboard in October 2012—GDP growth improved to a 2.4% annualized rate for the first quarter of 2013. Monetary easing by major central banks also supported equity markets.
As judged by various MSCI indexes, major emerging markets generally underperformed. Despite China’s smooth transition to a new generation of political leadership, the country’s decelerating growth rate caused its stock market to lag not only developed markets but also the main MSCI Emerging Markets Index (Net).1 Given China’s importance as a buyer of raw commodities from countries such as Brazil, as well as its key role in Asia’s manufacturing chain, fears of a recession in China led to single-digit returns for other emerging markets.
Central banks continued to provide stimulus.
Major central banks, including the U.S. Federal Reserve Board (Fed) and the European Central Bank (ECB), continued to inject liquidity into the banks and the market through various quantitative easing policies. Throughout the reporting period, the Federal Open Market Committee (FOMC) kept its key interest rates effectively at zero in order to support the economy and the financial system. After its September 2012 meeting, the FOMC announced its intention to keep interest rates low until at least mid-2015 and to make open-ended purchases of $40 billion per month in mortgage-backed securities to support the housing market.
After cutting its key rate to 0.75% in July 2012, the ECB announced in September 2012 that it would purchase an unlimited amount of one- to three-year sovereign debt from countries that had formally applied for a bailout. In May 2013, after the end of the reporting period, the ECB cut its key rate to a historic low of 0.50%. The ECB’s aggressive actions helped ease investor worries about a eurozone sovereign debt default. Moreover, in mid-March 2013, the governor of the Bank of Japan
| 1. | The Morgan Stanley Capital International Emerging Markets (MSCI Emerging Markets) Index (Net) is a free float-adjusted market capitalization index designed to measure the equity market performance in the global emerging markets. The index is currently composed of 21 emerging markets country indexes. You cannot invest directly in an index. Source: MSCI. MSCI makes no express or implied warranties or representations and shall have no liability whatsoever with respect to any MSCI data contained herein. The MSCI data may not be further redistributed or used as a basis for other indexes or any securities or financial products. This report is not approved, reviewed, or produced by MSCI. |
| | | | | | |
| Letter to shareholders (unaudited) | | Wells Fargo Advantage International Equity Fund | | | 3 | |
resigned to allow Shinzo Abe, the recently reelected prime minister, to appoint a new bank governor who supported using aggressive monetary policies to attack Japan’s persistent deflation.
The debt crisis in the eurozone returned to center stage but with less impact than before.
Ongoing weakness in the Greek economy made it difficult for the country to meet previously agreed upon austerity targets. Because many eurozone banks owned Greek debt and many U.S. banks had financial ties to eurozone banks, investors initially worried that a Greek default would result in another global financial crisis. However, as central banks continued to provide liquidity, investor worries about the effect of a European sovereign debt default on the global economy began to ease. When the tiny eurozone nation of Cyprus was forced to implement capital controls and impose losses on uninsured bank depositors in March 2013, global stock markets remained resilient despite short-term volatility.
Global monetary easing helped push the MSCI EAFE Index (Net)2, an index of developed stock markets, to a 16.90% return for the six-month period. By comparison, the S&P 500 Index3, a barometer of large-cap U.S. stocks, posted a 14.42% return for the reporting period. Within emerging markets, smaller markets, such as the Philippines and Thailand, strongly outperformed the larger markets, such as China, India, and Brazil. The smaller markets are benefiting from high growth rates without some of the imbalances—such as an overreliance on real estate—that are affecting the larger emerging markets.
We employ a diverse array of investment strategies, even as many variables are at work in the market.
The full effect of the European credit crisis remains unknown. Elevated unemployment in the U.S. and Southern Europe continues to pressure consumers and businesses alike. As a whole, Wells Fargo Advantage Funds represents investments across a range of asset classes and investment styles, giving you an opportunity to create a diversified investment portfolio. While diversification4 may not prevent losses in a downturn, we believe it helps manage risk.
Thank you for choosing to invest with Wells Fargo Advantage Funds. We appreciate your confidence in us and remain committed to helping you meet your financial needs. For current information about your fund investments, contact your investment professional, visit our website at wellsfargoadvantagefunds.com, or call us directly at 1-800-222-8222. We are available 24 hours a day, 7 days a week.
Sincerely,

Karla M. Rabusch
President
Wells Fargo Advantage Funds
Within emerging markets, smaller markets, such as the Philippines and Thailand, strongly outperformed the larger markets, such as China, India, and Brazil.
| 2. | The Morgan Stanley Capital International Europe, Australasia, and Far East (MSCI EAFE) Index (Net) is an unmanaged group of securities widely regarded by investors to be representations of the stock markets of Europe, Australasia, and the Far East. You cannot invest directly in an index. |
| 3. | The S&P 500 Index consists of 500 stocks chosen for market size, liquidity, and industry group representation. It is a market-value-weighted index with each stock’s weight in the index proportionate to its market value. You cannot invest directly in an index. |
| 4. | Diversification does not assure or guarantee better performance and cannot eliminate the risk of investment losses. |
| | | | |
| 4 | | Wells Fargo Advantage International Equity Fund | | Performance highlights (unaudited) |
Investment objective
The Fund seeks long-term capital appreciation.
Adviser
Wells Fargo Funds Management, LLC
Subadviser
Wells Capital Management Incorporated
Portfolio managers
Jeffrey Everett, CFA
Dale Winner, CFA
Average annual total returns1 (%) as of April 30, 2013
| | | | | | | | | | | | | | | | | | | | | | | | | | | | | | | | | | |
| | | | | Including sales charge | | | Excluding sales charge | | | Expense ratios2 (%) | |
| | | Inception date | | 1 year | | | 5 year | | | 10 year | | | 1 year | | | 5 year | | | 10 year | | | Gross | | | Net3 | |
| Class A (WFEAX) | | 1-20-1998 | | | 7.26 | | | | (4.05 | ) | | | 6.98 | | | | 13.78 | | | | (2.91 | ) | | | 7.61 | | | | 1.54 | | | | 1.10 | |
| Class B (WFEBX)* | | 9-6-1979 | | | 7.97 | | | | (4.02 | ) | | | 7.07 | | | | 12.97 | | | | (3.66 | ) | | | 7.07 | | | | 2.29 | | | | 1.85 | |
| Class C (WFEFX) | | 3-6-1998 | | | 11.98 | | | | (3.65 | ) | | | 6.83 | | | | 12.98 | | | | (3.65 | ) | | | 6.83 | | | | 2.29 | | | | 1.85 | |
| Class R (WFERX) | | 10-10-2003 | | | – | | | | – | | | | – | | | | 13.47 | | | | (3.18 | ) | | | 7.34 | | | | 1.79 | | | | 1.35 | |
| Administrator Class (WFEDX) | | 7-16-2010 | | | – | | | | – | | | | – | | | | 13.82 | | | | (2.81 | ) | | | 7.84 | | | | 1.38 | | | | 1.10 | |
| Institutional Class (WFENX) | | 3-9-1998 | | | – | | | | – | | | | – | | | | 14.07 | | | | (2.67 | ) | | | 7.92 | | | | 1.11 | | | | 0.85 | |
| MSCI ACWI Index Ex USA (Net)4 | | – | | | – | | | | – | | | | – | | | | 14.15 | | | | (0.84 | ) | | | 10.32 | | | | – | | | | – | |
| * | | Class B shares are closed to investment, except in connection with the reinvestment of any distributions and permitted exchanges. |
Figures quoted represent past performance, which is no guarantee of future results and do not reflect the deduction of taxes that a shareholder may pay on fund distributions or the redemption of fund shares. Investment return and principal value of an investment will fluctuate so that an investor’s shares, when redeemed, may be worth more or less than their original cost. Performance shown without sales charges would be lower if sales charges were reflected. Current performance may be lower or higher than the performance data quoted, which assumes the reinvestment of dividends and capital gains. Current month-end performance is available on the Fund’s website, wellsfargoadvantagefunds.com.
Index returns do not include transaction costs associated with buying and selling securities, any mutual fund fees or expenses, or any taxes. It is not possible to invest directly in an index.
For Class A shares, the maximum front-end sales charge is 5.75%. For Class B shares, the maximum contingent deferred sales charge is 5.00%. For Class C shares, the maximum contingent deferred sales charge is 1.00%. Performance including sales charge assumes the sales charge for the corresponding time period. Class R, Administrator Class, and Institutional Class shares are sold without a front-end sales charge or contingent deferred sales charge.
Stock values fluctuate in response to the activities of individual companies and general market and economic conditions. Foreign investments are especially volatile and can rise or fall dramatically due to differences in the political and economic conditions of the host country. These risks are generally intensified in emerging markets. The use of derivatives may reduce returns and/or increase volatility. Certain investment strategies tend to increase the total risk of an investment (relative to the broader market). The Fund is exposed to smaller-company securities risk. Consult the Fund’s prospectus for additional information on these and other risks.
Please see footnotes on page 5.
| | | | | | |
| Performance highlights (unaudited) | | Wells Fargo Advantage International Equity Fund | | | 5 | |
|
| Sector distribution6 as of April 30, 2013 |
|
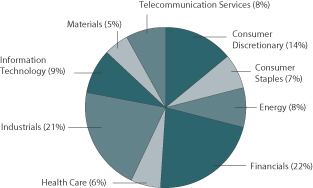 |
| | | | |
| Ten largest equity holdings5 (%) as of April 30, 2013 | |
Toyota Motor Corporation | | | 3.13 | |
BP plc | | | 2.66 | |
Daiwa Securities Group Incorporated | | | 2.62 | |
Siemens AG | | | 2.60 | |
China Everbright Limited | | | 2.58 | |
SK Telecom Company Limited | | | 2.45 | |
Mitsui OSK Lines Limited | | | 2.36 | |
Man Group plc | | | 2.35 | |
Zurich Financial Services AG | | | 2.34 | |
Intesa Sanpaolo SpA | | | 2.31 | |
| 1. | Historical performance shown for the Administrator Class shares prior to their inception reflects the performance of the Institutional Class shares, adjusted to reflect the higher expenses applicable to the Administrator Class shares. Historical performance shown for Class R shares prior to their inception reflects the performance of Class A shares, adjusted to reflect the higher expenses applicable to Class R shares. Historical performance shown for all classes of the Fund prior to July 19, 2010, is based on the performance of the Fund’s predecessor, Evergreen International Equity Fund. |
| 2. | Reflects the expense ratios as stated in the most recent prospectuses. |
| 3. | The Adviser has committed through February 28, 2014, to waive fees and/or reimburse expenses to the extent necessary to cap the Fund’s Total Annual Fund Operating Expenses After Fee Waiver, excluding certain expenses, at 1.09% for Class A, 1.84% for Class B, 1.84% for Class C, 1.34% for Class R, 1.09% for Administrator Class, and 0.84% for Institutional Class. Brokerage commissions, stamp duty fees, interest, taxes, acquired fund fees and expenses, and extraordinary expenses are excluded from the cap. Without this cap, the Fund’s returns would have been lower. |
| 4. | The Morgan Stanley Capital International All Country World Index Ex USA (Net) (MSCI ACWI Index Ex USA (Net)) is a free float-adjusted market capitalization weighted index that is designed to measure the equity market performance of developed and emerging markets. You cannot invest directly in an index. Source: MSCI. MSCI makes no express or implied warranties or representations and shall have no liability whatsoever with respect to any MSCI data contained herein. The MSCI data may not be further redistributed or used as a basis for other indexes or any securities or financial products. This report is not approved, reviewed or produced by MSCI. |
| 5. | The ten largest equity holdings are calculated based on the value of the securities divided by total net assets of the Fund. Holdings are subject to change and may have changed since the date specified. Top holdings typically include the underlying ordinary shares combined with any depositary receipts. |
| 6. | Sector distribution is subject to change and is calculated based on the total long-term investments of the Fund. |
| | | | |
| 6 | | Wells Fargo Advantage International Equity Fund | | Fund expenses (unaudited) |
As a shareholder of the Fund, you incur two types of costs: (1) transaction costs, including sales charges (loads) on purchase payments and contingent deferred sales charges (if any) on redemptions and (2) ongoing costs, including management fees, distribution (12b-1) and/or shareholder service fees, and other Fund expenses. This example is intended to help you understand your ongoing costs (in dollars) of investing in the Fund and to compare these costs with the ongoing costs of investing in other mutual funds.
The example is based on an investment of $1,000 invested at the beginning of the six-month period and held for the entire period from November 1, 2012 to April 30, 2013.
Actual expenses
The “Actual” line of the table below provides information about actual account values and actual expenses. You may use the information in this line, together with the amount you invested, to estimate the expenses that you paid over the period. Simply divide your account value by $1,000 (for example, an $8,600 account value divided by $1,000 = 8.6), then multiply the result by the number in the “Actual” line under the heading entitled “Expenses paid during period” for your applicable class of shares to estimate the expenses you paid on your account during this period.
Hypothetical example for comparison purposes
The “Hypothetical” line of the table below provides information about hypothetical account values and hypothetical expenses based on the Fund’s actual expense ratio and an assumed rate of return of 5% per year before expenses, which is not the Fund’s actual return. The hypothetical account values and expenses may not be used to estimate the actual ending account balance or expenses you paid for the period. You may use this information to compare the ongoing costs of investing in the Fund and other funds. To do so, compare this 5% hypothetical example with the 5% hypothetical examples that appear in the shareholder reports of the other funds.
Please note that the expenses shown in the table are meant to highlight your ongoing costs only and do not reflect any transactional costs, such as sales charges (loads) and contingent deferred sales charges. Therefore, the “Hypothetical” line of the table is useful in comparing ongoing costs only and will not help you determine the relative total costs of owning different funds. In addition, if these transactional costs were included, your costs would have been higher.
| | | | | | | | | | | | | | | | |
| | | Beginning
account value
11-1-2012 | | | Ending
account value
4-30-2013 | | | Expenses
paid during
the period1 | | | Net annual
expense ratio | |
Class A | | | | | | | | | | | | | | | | |
Actual | | $ | 1,000.00 | | | $ | 1,149.48 | | | $ | 5.81 | | | | 1.09 | % |
Hypothetical (5% return before expenses) | | $ | 1,000.00 | | | $ | 1,019.39 | | | $ | 5.46 | | | | 1.09 | % |
Class B | | | | | | | | | | | | | | | | |
Actual | | $ | 1,000.00 | | | $ | 1,145.20 | | | $ | 9.79 | | | | 1.84 | % |
Hypothetical (5% return before expenses) | | $ | 1,000.00 | | | $ | 1,015.67 | | | $ | 9.20 | | | | 1.84 | % |
Class C | | | | | | | | | | | | | | | | |
Actual | | $ | 1,000.00 | | | $ | 1,145.09 | | | $ | 9.79 | | | | 1.84 | % |
Hypothetical (5% return before expenses) | | $ | 1,000.00 | | | $ | 1,015.67 | | | $ | 9.20 | | | | 1.84 | % |
Class R | | | | | | | | | | | | | | | | |
Actual | | $ | 1,000.00 | | | $ | 1,147.54 | | | $ | 7.14 | | | | 1.34 | % |
Hypothetical (5% return before expenses) | | $ | 1,000.00 | | | $ | 1,018.15 | | | $ | 6.71 | | | | 1.34 | % |
Administrator Class | | | | | | | | | | | | | | | | |
Actual | | $ | 1,000.00 | | | $ | 1,148.86 | | | $ | 5.81 | | | | 1.09 | % |
Hypothetical (5% return before expenses) | | $ | 1,000.00 | | | $ | 1,019.39 | | | $ | 5.46 | | | | 1.09 | % |
Institutional Class | | | | | | | | | | | | | | | | |
Actual | | $ | 1,000.00 | | | $ | 1,151.17 | | | $ | 4.48 | | | | 0.84 | % |
Hypothetical (5% return before expenses) | | $ | 1,000.00 | | | $ | 1,020.63 | | | $ | 4.21 | | | | 0.84 | % |
| 1. | Expenses paid is equal to the annualized expense ratio of each class multiplied by the average account value over the period, multiplied by the number of days in the most recent fiscal half-year divided by the number of days in the fiscal year (to reflect the one-half-year period). |
| | | | | | |
| Portfolio of investments—April 30, 2013 (unaudited) | | Wells Fargo Advantage International Equity Fund | | | 7 | |
| | | | | | | | | | | | |
| Security name | | | | | | Shares | | | Value | |
| | | | | | | | | | | | |
| | | | |
Common Stocks: 95.59% | | | | | | | | | | | | |
| | | | |
| Brazil: 0.70% | | | | | | | | | | | | |
Cosan Limited Class A (Energy, Oil, Gas & Consumable Fuels) | | | | | | | 86,873 | | | $ | 1,802,615 | |
| | | | | | | | | | | | |
| | | | |
| Canada: 5.13% | | | | | | | | | | | | |
Barrick Gold Corporation (Materials, Metals & Mining) | | | | | | | 149,205 | | | | 2,941,299 | |
Cenovus Energy Incorporated (Energy, Oil, Gas & Consumable Fuels) | | | | | | | 110,482 | | | | 3,307,831 | |
Suncor Energy Incorporated (Energy, Oil, Gas & Consumable Fuels) | | | | | | | 53,023 | | | | 1,653,137 | |
Valeant Pharmaceuticals International Incorporated (Health Care, Pharmaceuticals) † | | | | | | | 69,194 | | | | 5,264,280 | |
| | | | |
| | | | | | | | | | | 13,166,547 | |
| | | | | | | | | | | | |
| | | | |
| China: 5.57% | | | | | | | | | | | | |
AutoNavi Holdings Limited ADR (Information Technology, Software) † | | | | | | | 171,799 | | | | 1,881,199 | |
Biostime International Holdings Limited (Consumer Staples, Food Products) | | | | | | | 302,000 | | | | 1,739,580 | |
China Mobile Limited (Telecommunication Services, Wireless Telecommunication Services) | | | | | | | 424,000 | | | | 4,641,508 | |
Industrial & Commercial Bank of China Limited Class H (Financials, Commercial Banks) | | | | | | | 4,660,000 | | | | 3,278,751 | |
Shenguan Holdings Group Limited (Consumer Staples, Food Products) | | | | | | | 1,886,000 | | | | 957,564 | |
Xtep International Holdings Limited (Consumer Discretionary, Textiles, Apparel & Luxury Goods) | | | | | | | 4,317,715 | | | | 1,808,286 | |
| | | | |
| | | | | | | | | | | 14,306,888 | |
| | | | | | | | | | | | |
| | | | |
| Finland: 1.01% | | | | | | | | | | | | |
Metso Oyj (Industrials, Machinery) | | | | | | | 63,318 | | | | 2,600,830 | |
| | | | | | | | | | | | |
| | | | |
| Germany: 9.38% | | | | | | | | | | | | |
Allianz AG (Financials, Insurance) | | | | | | | 26,525 | | | | 3,914,143 | |
Bayer AG (Health Care, Pharmaceuticals) « | | | | | | | 38,291 | | | | 3,994,855 | |
Metro AG (Consumer Staples, Food & Staples Retailing) « | | | | | | | 173,962 | | | | 5,423,927 | |
SAP AG (Information Technology, Software) | | | | | | | 51,197 | | | | 4,066,336 | |
Siemens AG (Industrials, Industrial Conglomerates) | | | | | | | 63,864 | | | | 6,669,584 | |
| | | | |
| | | | | | | | | | | 24,068,845 | |
| | | | | | | | | | | | |
| | | | |
| Hong Kong: 4.49% | | | | | | | | | | | | |
China Everbright Limited (Financials, Capital Markets) | | | | | | | 4,160,000 | | | | 6,615,130 | |
Hengdeli Holdings Limited (Consumer Discretionary, Specialty Retail) | | | | | | | 16,893,522 | | | | 4,919,925 | |
| | | | |
| | | | | | | | | | | 11,535,055 | |
| | | | | | | | | | | | |
| | | | |
| Italy: 4.34% | | | | | | | | | | | | |
ENI SpA (Energy, Oil, Gas & Consumable Fuels) | | | | | | | 218,061 | | | | 5,215,108 | |
Intesa Sanpaolo SpA (Financials, Commercial Banks) | | | | | | | 3,267,402 | | | | 5,925,240 | |
| | | | |
| | | | | | | | | | | 11,140,348 | |
| | | | | | | | | | | | |
| | | | |
| Japan: 20.95% | | | | | | | | | | | | |
Asahi Glass Company Limited (Industrials, Building Products) | | | | | | | 746,000 | | | | 5,846,479 | |
Capcom Company Limited (Information Technology, Software) | | | | | | | 277,700 | | | | 4,572,073 | |
Daiwa Securities Group Incorporated (Financials, Capital Markets) | | | | | | | 759,000 | | | | 6,719,157 | |
Itochu Corporation (Industrials, Trading Companies & Distributors) | | | | | | | 375,600 | | | | 4,642,745 | |
Mitsubishi UFJ Financial Group Incorporated (Financials, Commercial Banks) | | | | | | | 868,500 | | | | 5,906,709 | |
Mitsui OSK Lines Limited (Industrials, Marine) † | | | | | | | 1,456,000 | | | | 6,048,931 | |
Nitto Denko Corporation (Materials, Chemicals) | | | | | | | 71,588 | | | | 4,699,833 | |
Sharp Corporation (Consumer Discretionary, Household Durables) †« | | | | | | | 1,116,000 | | | | 3,869,395 | |
The accompanying notes are an integral part of these financial statements.
| | | | |
| 8 | | Wells Fargo Advantage International Equity Fund | | Portfolio of investments—April 30, 2013 (unaudited) |
| | | | | | | | | | | | |
| Security name | | | | | | Shares | | | Value | |
| | | | | | | | | | | | |
| | | | |
| Japan (continued) | | | | | | | | | | | | |
Toyota Motor Corporation (Consumer Discretionary, Automobiles) | | | | | | | 138,900 | | | $ | 8,036,067 | |
Yamada Denki Company Limited (Consumer Discretionary, Specialty Retail) « | | | | | | | 71,820 | | | | 3,458,941 | |
| | | | |
| | | | | | | | | | | 53,800,330 | |
| | | | | | | | | | | | |
| | | | |
| Netherlands: 2.07% | | | | | | | | | | | | |
Akzo Nobel NV (Materials, Chemicals) | | | | | | | 88,066 | | | | 5,309,498 | |
| | | | | | | | | | | | |
| | | | |
| Norway: 2.52% | | | | | | | | | | | | |
Frontline 2012 Limited (Energy, Oil, Gas & Consumable Fuels)144A † | | | | | | | 123,728 | | | | 909,749 | |
Marine Harvest ASA (Consumer Staples, Food Products) † | | | | | | | 5,351,950 | | | | 5,568,664 | |
| | | | |
| | | | | | | | | | | 6,478,413 | |
| | | | | | | | | | | | |
| | | | |
| Russia: 1.81% | | | | | | | | | | | | |
Mobile Telesystems ADR (Telecommunication Services, Wireless Telecommunication Services) | | | | | | | 127,250 | | | | 2,634,075 | |
Sberbank of Russia (Financials, Commercial Banks) | | | | | | | 629,774 | | | | 1,999,532 | |
| | | | |
| | | | | | | | | | | 4,633,607 | |
| | | | | | | | | | | | |
| | | | |
| South Korea: 5.60% | | | | | | | | | | | | |
Hana Financial Group Incorporated (Financials, Commercial Banks) | | | | | | | 95,960 | | | | 3,067,095 | |
Samsung Electronics Company Limited GDR (Information Technology, Semiconductors & Semiconductor Equipment)144A | | | | | | | 7,286 | | | | 5,034,626 | |
SK Telecom Company Limited (Telecommunication Services, Wireless Telecommunication Services) | | | | | | | 35,780 | | | | 6,286,598 | |
| | | | |
| | | | | | | | | | | 14,388,319 | |
| | | | | | | | | | | | |
| | | | |
| Sweden: 1.59% | | | | | | | | | | | | |
Volvo AB Class B (Industrials, Machinery) | | | | | | | 295,609 | | | | 4,091,332 | |
| | | | | | | | | | | | |
| | | | |
| Switzerland: 8.45% | | | | | | | | | | | | |
ABB Limited (Industrials, Electrical Equipment) | | | | | | | 250,196 | | | | 5,664,257 | |
Compagnie Financiere Richemont SA (Consumer Discretionary, Textiles, Apparel & Luxury Goods) | | | | | | | 31,411 | | | | 2,537,068 | |
Novartis AG (Health Care, Pharmaceuticals) | | | | | | | 58,076 | | | | 4,312,914 | |
Swatch Group AG Class B (Consumer Discretionary, Textiles, Apparel & Luxury Goods) | | | | | | | 5,508 | | | | 3,154,453 | |
Zurich Financial Services AG (Financials, Insurance) | | | | | | | 21,542 | | | | 6,014,523 | |
| | | | |
| | | | | | | | | | | 21,683,215 | |
| | | | | | | | | | | | |
| | | | |
| United Kingdom: 17.00% | | | | | | | | | | | | |
BP plc (Energy, Oil, Gas & Consumable Fuels) | | | | | | | 944,243 | | | | 6,840,874 | |
Capita plc (Industrials, Commercial Services & Supplies) | | | | | | | 333,832 | | | | 4,679,985 | |
Chemring Group plc (Industrials, Aerospace & Defense) | | | | | | | 293,983 | | | | 1,238,001 | |
Debenhams plc (Consumer Discretionary, Multiline Retail) | | | | | | | 4,430,623 | | | | 5,726,080 | |
Man Group plc (Financials, Capital Markets) | | | | | | | 3,794,182 | | | | 6,023,353 | |
Reckitt Benckiser Group plc (Consumer Staples, Household Products) | | | | | | | 55,366 | | | | 4,038,690 | |
Smiths Group plc (Industrials, Industrial Conglomerates) | | | | | | | 193,130 | | | | 3,749,981 | |
Vodafone Group plc ADR (Telecommunication Services, Wireless Telecommunication Services) | | | | | | | 184,658 | | | | 5,648,688 | |
Wolseley plc (Industrials, Trading Companies & Distributors) | | | | | | | 115,510 | | | | 5,711,175 | |
| | | | |
| | | | | | | | | | | 43,656,827 | |
| | | | | | | | | | | | |
| | | | |
| United States: 4.98% | | | | | | | | | | | | |
Apple Incorporated (Information Technology, Computers & Peripherals) | | | | | | | 7,254 | | | | 3,211,709 | |
Bank of America Corporation (Financials, Diversified Financial Services) | | | | | | | 219,731 | | | | 2,704,889 | |
The accompanying notes are an integral part of these financial statements.
| | | | | | |
| Portfolio of investments—April 30, 2013 (unaudited) | | Wells Fargo Advantage International Equity Fund | | | 9 | |
| | | | | | | | | | | | | | |
| Security name | | | | | | | Shares | | | Value | |
| | | | | | | | | | | | | | |
| | | | |
| United States (continued) | | | | | | | | | | | | | | |
KKR & Company LP (Financials, Capital Markets) | | | | | | | | | 124,794 | | | $ | 2,620,674 | |
QUALCOMM Incorporated (Information Technology, Communications Equipment) | | | | | | | | | 68,745 | | | | 4,236,064 | |
| | | | |
| | | | | | | | | | | | | 12,773,336 | |
| | | | | | | | | | | | | | |
| | | | |
Total Common Stocks (Cost $206,888,332) | | | | | | | | | | | | | 245,436,005 | |
| | | | | | | | | | | | | | |
| | | Yield | | | | | | | | | |
| Short-Term Investments: 7.67% | | | | | | | | | | | | | | |
| | | | |
| Investment Companies: 7.67% | | | | | | | | | | | | | | |
Wells Fargo Advantage Cash Investment Money Market Fund, Select Class (u)(l) | | | 0.13 | % | | | | | 5,910,195 | | | | 5,910,195 | |
Wells Fargo Securities Lending Cash Investments, LLC (v)(r)(u)(l) | | | 0.18 | | | | | | 13,799,393 | | | | 13,799,393 | |
| | | | |
Total Short-Term Investments (Cost $19,709,588) | | | | | | | | | | | | | 19,709,588 | |
| | | | | | | | | | | | | | |
| | | | | | | | |
| Total investments in securities | | | | | | | | |
| (Cost $226,597,920) * | | | 103.26 | % | | | 265,145,593 | |
Other assets and liabilities, net | | | (3.26 | ) | | | (8,381,590 | ) |
| | | | | | | | |
Total net assets | | | 100.00 | % | | $ | 256,764,003 | |
| | | | | | | | |
| † | Non-income-earning security |
| « | All or a portion of this security is on loan. |
| 144A | Security that may be resold to “qualified institutional buyers” under Rule 144A or security offered pursuant to Section 4(2) of the Securities Act of 1933, as amended. |
| (u) | Rate shown is the 7-day annualized yield at period end. |
| (l) | Investment in an affiliate |
| (v) | Security represents investment of cash collateral received from securities on loan. |
| (r) | The investment company is exempt from registration under Section 3(c)(7) of the Investment Company Act of 1940, as amended. |
| * | Cost for federal income tax purposes is $230,479,041 and unrealized appreciation (depreciation) consists of: |
| | | | |
Gross unrealized appreciation | | $ | 46,792,531 | |
Gross unrealized depreciation | | | (12,125,979 | ) |
| | | | |
Net unrealized appreciation | | $ | 34,666,552 | |
The accompanying notes are an integral part of these financial statements.
| | | | |
| 10 | | Wells Fargo Advantage International Equity Fund | | Statement of assets and liabilities—April 30, 2013 (unaudited) |
| | | | |
| | | | |
| |
Assets | | | | |
Investments | | | | |
In unaffiliated securities (including securities on loan), at value (see cost below) | | $ | 245,436,005 | |
In affiliated securities, at value (see cost below) | | | 19,709,588 | |
| | | | |
Total investments, at value (see cost below) | | | 265,145,593 | |
Foreign currency, at value (see cost below) | | | 3,669,345 | |
Receivable for investments sold | | | 1,276,520 | |
Receivable for Fund shares sold | | | 797,907 | |
Receivable for dividends | | | 2,040,350 | |
Receivable for securities lending income | | | 64,617 | |
Unrealized gains on forward foreign currency contracts | | | 228,263 | |
Prepaid expenses and other assets | | | 44,615 | |
| | | | |
Total assets | | | 273,267,210 | |
| | | | |
| |
Liabilities | | | | |
Payable for investments purchased | | | 770,720 | |
Payable for Fund shares redeemed | | | 1,483,105 | |
Unrealized losses on forward foreign currency contracts | | | 81,472 | |
Payable upon receipt of securities loaned | | | 13,799,393 | |
Advisory fee payable | | | 94,939 | |
Distribution fees payable | | | 15,363 | |
Due to other related parties | | | 47,199 | |
Accrued expenses and other liabilities | | | 211,016 | |
| | | | |
Total liabilities | | | 16,503,207 | |
| | | | |
Total net assets | | $ | 256,764,003 | |
| | | | |
| |
NET ASSETS CONSIST OF | | | | |
Paid-in capital | | $ | 278,698,083 | |
Undistributed net investment income | | | 2,137,490 | |
Accumulated net realized losses on investments | | | (62,829,208 | ) |
Net unrealized gains on investments | | | 38,757,638 | |
| | | | |
Total net assets | | $ | 256,764,003 | |
| | | | |
| |
COMPUTATION OF NET ASSET VALUE AND OFFERING PRICE PER SHARE1 | | | | |
Net assets – Class A | | $ | 114,652,803 | |
Shares outstanding – Class A | | | 10,489,965 | |
Net asset value per share – Class A | | | $10.93 | |
Maximum offering price per share – Class A2 | | | $11.60 | |
Net assets – Class B | | $ | 7,611,085 | |
Shares outstanding – Class B | | | 715,221 | |
Net asset value per share – Class B | | | $10.64 | |
Net assets – Class C | | $ | 17,215,387 | |
Shares outstanding – Class C | | | 1,599,914 | |
Net asset value per share – Class C | | | $10.76 | |
Net assets – Class R | | $ | 1,890,930 | |
Shares outstanding – Class R | | | 173,121 | |
Net asset value per share – Class R | | | $10.92 | |
Net assets – Administrator Class | | $ | 4,473,193 | |
Shares outstanding – Administrator Class | | | 415,948 | |
Net asset value per share – Administrator Class | | | $10.75 | |
Net assets – Institutional Class | | $ | 110,920,605 | |
Shares outstanding – Institutional Class | | | 10,179,078 | |
Net asset value per share – Institutional Class | | | $10.90 | |
Investments in unaffiliated securities (including securities on loan), at cost | | $ | 206,888,332 | |
| | | | |
Investments in affiliated securities, at cost | | $ | 19,709,588 | |
| | | | |
Total investments, at cost | | $ | 226,597,920 | |
| | | | |
Securities on loan, at value | | $ | 13,108,577 | |
| | | | |
Foreign currency, at cost | | $ | 3,674,633 | |
| | | | |
| 1. | The Fund has an unlimited number of authorized shares. |
| 2. | Maximum offering price is computed as 100/94.25 of net asset value. On investments of $50,000 or more, the offering price is reduced. |
The accompanying notes are an integral part of these financial statements.
| | | | | | |
| Statement of operations—six months ended April 30, 2013 (unaudited) | | Wells Fargo Advantage International Equity Fund | | | 11 | |
| | | | |
| | | | |
| |
Investment income | | | | |
Dividends * | | $ | 3,896,421 | |
Securities lending income, net | | | 155,360 | |
Income from affiliated securities | | | 1,643 | |
| | | | |
Total investment income | | | 4,053,424 | |
| | | | |
| |
Expenses | | | | |
Advisory fee | | | 1,112,138 | |
Administration fees | | | | |
Fund level | | | 65,420 | |
Class A | | | 146,691 | |
Class B | | | 10,313 | |
Class C | | | 22,047 | |
Class R | | | 2,554 | |
Administrator Class | | | 1,771 | |
Institutional Class | | | 47,377 | |
Shareholder servicing fees | | | | |
Class A | | | 141,050 | |
Class B | | | 9,916 | |
Class C | | | 21,199 | |
Class R | | | 2,456 | |
Administrator Class | | | 4,133 | |
Distribution fees | | | | |
Class B | | | 29,749 | |
Class C | | | 63,597 | |
Class R | | | 2,456 | |
Custody and accounting fees | | | 60,665 | |
Professional fees | | | 25,552 | |
Registration fees | | | 45,453 | |
Shareholder report expenses | | | 53,093 | |
Trustees’ fees and expenses | | | 6,158 | |
Other fees and expenses | | | 14,085 | |
| | | | |
Total expenses | | | 1,887,873 | |
Less: Fee waivers and/or expense reimbursements | | | (513,141 | ) |
| | | | |
Net expenses | | | 1,374,732 | |
| | | | |
Net investment income | | | 2,678,692 | |
| | | | |
| |
REALIZED AND UNREALIZED GAINS (LOSSES) ON INVESTMENTS | | | | |
| |
Net realized gains (losses) on: | | | | |
Unaffiliated securities | | | 4,759,134 | |
Forward foreign currency contract transactions | | | 194,829 | |
| | | | |
Net change in unrealized gains (losses) on investments | | | 4,953,963 | |
| | | | |
| |
Net change in unrealized gains (losses) on: | | | | |
Unaffiliated securities | | | 29,000,030 | |
Forward foreign currency contract transactions | | | 146,791 | |
| | | | |
Net change in unrealized gains (losses) on investments | | | 29,146,821 | |
| | | | |
Net realized and unrealized gains (losses) on investments | | | 34,100,784 | |
| | | | |
Net increase in net assets resulting from operations | | $ | 36,779,476 | |
| | | | |
| |
* Net of foreign dividend withholding taxes in the amount of | | | $287,848 | |
The accompanying notes are an integral part of these financial statements.
| | | | |
| 12 | | Wells Fargo Advantage International Equity Fund | | Statement of changes in net assets |
| | | | | | | | | | | | | | | | |
| | | Six months ended April 30, 2013 (unaudited) | | | Year ended October 31, 2012 | |
| | | | |
Operations | | | | | | | | | | | | | | | | |
Net investment income | | | | | | $ | 2,678,692 | | | | | | | $ | 8,746,400 | |
Net realized gains on investments | | | | | | | 4,953,963 | | | | | | | | 51,095,753 | |
Net change in unrealized gains (losses) on investments | | | | | | | 29,146,821 | | | | | | | | (56,343,362 | ) |
| | | | | | | | | | | | | | | | |
Net increase in net assets resulting from operations | | | | | | | 36,779,476 | | | | | | | | 3,498,791 | |
| | | | | | | | | | | | | | | | |
| | | | |
Distributions to shareholders from | | | | | | | | | | | | | | | | |
Net investment income | | | | | | | | | | | | | | | | |
Class A | | | | | | | (3,098,267 | ) | | | | | | | (3,362,916 | ) |
Class B | | | | | | | (154,513 | ) | | | | | | | (122,321 | ) |
Class C | | | | | | | (326,365 | ) | | | | | | | (235,205 | ) |
Class R | | | | | | | (50,218 | ) | | | | | | | (54,384 | ) |
Administrator Class | | | | | | | (96,415 | ) | | | | | | | (72,248 | ) |
Institutional Class | | | | | | | (3,727,082 | ) | | | | | | | (5,313,952 | ) |
| | | | | | | | | | | | | | | | |
Total distributions to shareholders | | | | | | | (7,452,860 | ) | | | | | | | (9,161,026 | ) |
| | | | | | | | | | | | | | | | |
| | | | |
| | | Shares | | | | | | | | Shares | | | | | |
Capital share transactions | | | | | | | | | | | | | | | | |
Proceeds from shares sold | | | | | | | | | | | | | | | | |
Class A | | | 630,320 | | | | 6,442,922 | | | | 1,206,830 | | | | 11,443,305 | |
Class B | | | 5,575 | | | | 57,182 | | | | 1,568 | | | | 13,641 | |
Class C | | | 31,956 | | | | 317,248 | | | | 66,557 | | | | 636,551 | |
Class R | | | 15,983 | | | | 163,470 | | | | 56,096 | | | | 527,631 | |
Administrator Class | | | 100,731 | | | | 1,053,279 | | | | 128,059 | | | | 1,224,190 | |
Institutional Class | | | 519,870 | | | | 5,362,884 | | | | 1,400,005 | | | | 13,336,247 | |
| | | | | | | | | | | | | | | | |
| | | | | | | 13,396,985 | | | | | | | | 27,181,565 | |
| | | | | | | | | | | | | | | | |
Reinvestment of distributions | | | | | | | | | | | | | | | | |
Class A | | | 277,238 | | | | 2,736,335 | | | | 337,645 | | | | 2,998,289 | |
Class B | | | 14,857 | | | | 143,218 | | | | 12,825 | | | | 111,195 | |
Class C | | | 28,842 | | | | 281,219 | | | | 22,553 | | | | 197,786 | |
Class R | | | 2,608 | | | | 25,768 | | | | 3,603 | | | | 31,998 | |
Administrator Class | | | 6,902 | | | | 67,021 | | | | 5,501 | | | | 48,081 | |
Institutional Class | | | 152,962 | | | | 1,503,617 | | | | 173,700 | | | | 1,538,983 | |
| | | | | | | | | | | | | | | | |
| | | | | | | 4,757,178 | | | | | | | | 4,926,332 | |
| | | | | | | | | | | | | | | | |
Payment for shares redeemed | | | | | | | | | | | | | | | | |
Class A | | | (2,110,658 | ) | | | (21,527,163 | ) | | | (6,445,573 | ) | | | (60,959,836 | ) |
Class B | | | (181,948 | ) | | | (1,816,874 | ) | | | (496,265 | ) | | | (4,633,839 | ) |
Class C | | | (210,902 | ) | | | (2,130,346 | ) | | | (693,161 | ) | | | (6,490,529 | ) |
Class R | | | (70,742 | ) | | | (723,966 | ) | | | (146,002 | ) | | | (1,424,583 | ) |
Administrator Class | | | (56,164 | ) | | | (567,265 | ) | | | (124,322 | ) | | | (1,176,862 | ) |
Institutional Class | | | (4,660,985 | ) | | | (47,177,952 | ) | | | (10,520,941 | ) | | | (100,582,966 | ) |
| | | | | | | | | | | | | | | | |
| | | | | | | (73,943,566 | ) | | | | | | | (175,268,615 | ) |
| | | | | | | | | | | | | | | | |
Net decrease in net assets resulting from capital share transactions | | | | | | | (55,789,403 | ) | | | | | | | (143,160,718 | ) |
| | | | | | | | | | | | | | | | |
Total decrease in net assets | | | | | | | (26,462,787 | ) | | | | | | | (148,822,953 | ) |
| | | | | | | | | | | | | | | | |
| | | | |
Net assets | | | | | | | | | | | | | | | | |
Beginning of period | | | | | | | 283,226,790 | | | | | | | | 432,049,743 | |
| | | | | | | | | | | | | | | | |
End of period | | | | | | $ | 256,764,003 | | | | | | | $ | 283,226,790 | |
| | | | | | | | | | | | | | | | |
Undistributed net investment income | | | | | | $ | 2,137,490 | | | | | | | $ | 6,911,658 | |
| | | | | | | | | | | | | | | | |
The accompanying notes are an integral part of these financial statements.
| | | | | | |
| Financial highlights | | Wells Fargo Advantage International Equity Fund | | | 13 | |
(For a share outstanding throughout each period)
| | | | | | | | | | | | | | | | | | | | | | | | |
| | | Six months ended
April 30, 2013
(unaudited) | | | Year ended October 31 | |
| CLASS A | | | 2012 | | | 2011 | | | 20101 | | | 20091 | | | 20081 | |
Net asset value, beginning of period | | $ | 9.77 | | | $ | 9.82 | | | $ | 10.41 | | | $ | 9.14 | | | $ | 8.54 | | | $ | 17.72 | |
Net investment income | | | 0.10 | | | | 0.25 | | | | 0.17 | | | | 0.09 | 2 | | | 0.17 | | | | 0.31 | 2 |
Net realized and unrealized gains (losses) on investments | | | 1.33 | | | | (0.09 | ) | | | (0.75 | ) | | | 1.42 | | | | 0.69 | | | | (7.50 | ) |
| | | | | | | | | | | | | | | | | | | | | | | | |
Total from investment operations | | | 1.43 | | | | 0.16 | | | | (0.58 | ) | | | 1.51 | | | | 0.86 | | | | (7.19 | ) |
Distributions to shareholders from | | | | | | | | | | | | | | | | | | | | | | | | |
Net investment income | | | (0.27 | ) | | | (0.21 | ) | | | (0.01 | ) | | | (0.24 | ) | | | (0.26 | ) | | | (0.36 | ) |
Net realized gains | | | 0.00 | | | | 0.00 | | | | 0.00 | | | | 0.00 | | | | 0.00 | | | | (1.63 | ) |
| | | | | | | | | | | | | | | | | | | | | | | | |
Total distributions to shareholders | | | (0.27 | ) | | | (0.21 | ) | | | (0.01 | ) | | | (0.24 | ) | | | (0.26 | ) | | | (1.99 | ) |
Net asset value, end of period | | $ | 10.93 | | | $ | 9.77 | | | $ | 9.82 | | | $ | 10.41 | | | $ | 9.14 | | | $ | 8.54 | |
Total return3 | | | 14.95 | % | | | 1.83 | % | | | (5.62 | )% | | | 16.90 | % | | | 10.55 | % | | | (45.46 | )% |
Ratios to average net assets (annualized) | | | | | | | | | | | | | | | | | | | | | | | | |
Gross expenses | | | 1.57 | % | | | 1.53 | % | | | 1.46 | % | | | 1.19 | % | | | 1.08 | % | | | 0.97 | % |
Net expenses | | | 1.09 | % | | | 1.09 | % | | | 1.09 | % | | | 1.07 | % | | | 1.08 | % | | | 0.95 | % |
Net investment income | | | 2.05 | % | | | 2.49 | % | | | 1.55 | % | | | 0.91 | % | | | 2.16 | % | | | 2.30 | % |
Supplemental data | | | | | | | | | | | | | | | | | | | | | | | | |
Portfolio turnover rate | | | 26 | % | | | 115 | % | | | 44 | % | | | 42 | % | | | 203 | % | | | 111 | % |
Net assets, end of period (000s omitted) | | | $114,653 | | | | $114,219 | | | | $162,954 | | | | $216,096 | | | | $255,075 | | | | $298,809 | |
| 1. | After the close of business on July 16, 2010, the Fund acquired the net assets of Evergreen International Equity Fund which became the accounting and performance survivor in the transaction. The information for the periods prior to July 19, 2010 is that of Class A of Evergreen International Equity Fund. |
| 2. | Calculated based upon average shares outstanding |
| 3. | Total return calculations do not include any sales charges. Returns for periods of less than one year are not annualized. |
The accompanying notes are an integral part of these financial statements.
| | | | |
| 14 | | Wells Fargo Advantage International Equity Fund | | Financial highlights |
(For a share outstanding throughout each period)
| | | | | | | | | | | | | | | | | | | | | | | | |
| | | Six months ended
April 30, 2013
(unaudited) | | | Year ended October 31 | |
| CLASS B | | | 2012 | | | 2011 | | | 20101 | | | 20091 | | | 20081 | |
Net asset value, beginning of period | | $ | 9.47 | | | $ | 9.48 | | | $ | 10.12 | | | $ | 8.81 | | | $ | 8.18 | | | $ | 17.02 | |
Net investment income | | | 0.06 | 2 | | | 0.16 | 2 | | | 0.08 | 2 | | | 0.01 | 2 | | | 0.11 | 2 | | | 0.21 | 2 |
Net realized and unrealized gains (losses) on investments | | | 1.30 | | | | (0.07 | ) | | | (0.72 | ) | | | 1.41 | | | | 0.66 | | | | (7.20 | ) |
| | | | | | | | | | | | | | | | | | | | | | | | |
Total from investment operations | | | 1.36 | | | | 0.09 | | | | (0.64 | ) | | | 1.42 | | | | 0.77 | | | | (6.99 | ) |
Distributions to shareholders from | | | | | | | | | | | | | | | | | | | | | | | | |
Net investment income | | | (0.19 | ) | | | (0.10 | ) | | | 0.00 | | | | (0.11 | ) | | | (0.14 | ) | | | (0.23 | ) |
Net realized gains | | | 0.00 | | | | 0.00 | | | | 0.00 | | | | 0.00 | | | | 0.00 | | | | (1.62 | ) |
| | | | | | | | | | | | | | | | | | | | | | | | |
Total distributions to shareholders | | | (0.19 | ) | | | (0.10 | ) | | | 0.00 | | | | (0.11 | ) | | | (0.14 | ) | | | (1.85 | ) |
Net asset value, end of period | | $ | 10.64 | | | $ | 9.47 | | | $ | 9.48 | | | $ | 10.12 | | | $ | 8.81 | | | $ | 8.18 | |
Total return3 | | | 14.52 | % | | | 0.99 | % | | | (6.32 | )% | | | 16.15 | % | | | 9.64 | % | | | (45.86 | )% |
Ratios to average net assets (annualized) | | | | | | | | | | | | | | | | | | | | | | | | |
Gross expenses | | | 2.32 | % | | | 2.28 | % | | | 2.21 | % | | | 1.94 | % | | | 1.83 | % | | | 1.70 | % |
Net expenses | | | 1.84 | % | | | 1.84 | % | | | 1.84 | % | | | 1.82 | % | | | 1.83 | % | | | 1.70 | % |
Net investment income | | | 1.24 | % | | | 1.67 | % | | | 0.77 | % | | | 0.15 | % | | | 1.45 | % | | | 1.59 | % |
Supplemental data | | | | | | | | | | | | | | | | | | | | | | | | |
Portfolio turnover rate | | | 26 | % | | | 115 | % | | | 44 | % | | | 42 | % | | | 203 | % | | | 111 | % |
Net assets, end of period (000s omitted) | | | $7,611 | | | | $8,303 | | | | $12,873 | | | | $20,450 | | | | $22,300 | | | | $29,756 | |
| 1. | After the close of business on July 16, 2010, the Fund acquired the net assets of Evergreen International Equity Fund which became the accounting and performance survivor in the transaction. The information for the periods prior to July 19, 2010 is that of Class B of Evergreen International Equity Fund. |
| 2. | Calculated based upon average shares outstanding |
| 3. | Total return calculations do not include any sales charges. Returns for periods of less than one year are not annualized. |
The accompanying notes are an integral part of these financial statements.
| | | | | | |
| Financial highlights | | Wells Fargo Advantage International Equity Fund | | | 15 | |
(For a share outstanding throughout each period)
| | | | | | | | | | | | | | | | | | | | | | | | |
| | | Six months ended
April 30, 2013
(unaudited) | | | Year ended October 31 | |
| CLASS C | | | 2012 | | | 2011 | | | 20101 | | | 20091 | | | 20081 | |
Net asset value, beginning of period | | $ | 9.58 | | | $ | 9.59 | | | $ | 10.24 | | | $ | 8.93 | | | $ | 8.27 | | | $ | 17.22 | |
Net investment income | | | 0.07 | 2 | | | 0.16 | 2 | | | 0.06 | | | | 0.01 | 2 | | | 0.07 | 2 | | | 0.21 | 2 |
Net realized and unrealized gains (losses) on investments | | | 1.30 | | | | (0.07 | ) | | | (0.71 | ) | | | 1.41 | | | | 0.72 | | | | (7.27 | ) |
| | | | | | | | | | | | | | | | | | | | | | | | |
Total from investment operations | | | 1.37 | | | | 0.09 | | | | (0.65 | ) | | | 1.42 | | | | 0.79 | | | | (7.06 | ) |
Distributions to shareholders from | | | | | | | | | | | | | | | | | | | | | | | | |
Net investment income | | | (0.19 | ) | | | (0.10 | ) | | | 0.00 | | | | (0.11 | ) | | | (0.13 | ) | | | (0.25 | ) |
Net realized gains | | | 0.00 | | | | 0.00 | | | | 0.00 | | | | 0.00 | | | | 0.00 | | | | (1.64 | ) |
| | | | | | | | | | | | | | | | | | | | | | | | |
Total distributions to shareholders | | | (0.19 | ) | | | (0.10 | ) | | | 0.00 | | | | (0.11 | ) | | | (0.13 | ) | | | (1.89 | ) |
Net asset value, end of period | | $ | 10.76 | | | $ | 9.58 | | | $ | 9.59 | | | $ | 10.24 | | | $ | 8.93 | | | $ | 8.27 | |
Total return3 | | | 14.51 | % | | | 1.08 | % | | | (6.35 | )% | | | 16.13 | % | | | 9.62 | % | | | (45.85 | )% |
Ratios to average net assets (annualized) | | | | | | | | | | | | | | | | | | | | | | | | |
Gross expenses | | | 2.32 | % | | | 2.28 | % | | | 2.21 | % | | | 1.94 | % | | | 1.83 | % | | | 1.70 | % |
Net expenses | | | 1.84 | % | | | 1.84 | % | | | 1.84 | % | | | 1.82 | % | | | 1.83 | % | | | 1.70 | % |
Net investment income | | | 1.31 | % | | | 1.72 | % | | | 0.79 | % | | | 0.16 | % | | | 1.39 | % | | | 1.61 | % |
Supplemental data | | | | | | | | | | | | | | | | | | | | | | | | |
Portfolio turnover rate | | | 26 | % | | | 115 | % | | | 44 | % | | | 42 | % | | | 203 | % | | | 111 | % |
Net assets, end of period (000s omitted) | | | $17,215 | | | | $16,760 | | | | $22,578 | | | | $30,439 | | | | $36,718 | | | | $47,114 | |
| 1. | After the close of business on July 16, 2010, the Fund acquired the net assets of Evergreen International Equity Fund which became the accounting and performance survivor in the transaction. The information for the periods prior to July 19, 2010 is that of Class C of Evergreen International Equity Fund. |
| 2. | Calculated based upon average shares outstanding |
| 3. | Total return calculations do not include any sales charges. Returns for periods of less than one year are not annualized. |
The accompanying notes are an integral part of these financial statements.
| | | | |
| 16 | | Wells Fargo Advantage International Equity Fund | | Financial highlights |
(For a share outstanding throughout each period)
| | | | | | | | | | | | | | | | | | | | | | | | |
| | | Six months ended
April 30, 2013
(unaudited) | | | Year ended October 31 | |
| CLASS R | | | 2012 | | | 2011 | | | 20101 | | | 20091 | | | 20081 | |
Net asset value, beginning of period | | $ | 9.75 | | | $ | 9.79 | | | $ | 10.40 | | | $ | 9.13 | | | $ | 8.51 | | | $ | 17.70 | |
Net investment income | | | 0.09 | 2 | | | 0.20 | 2 | | | 0.14 | 2 | | | 0.06 | 2 | | | 0.14 | | | | 0.27 | 2 |
Net realized and unrealized gains (losses) on investments | | | 1.32 | | | | (0.06 | ) | | | (0.75 | ) | | | 1.42 | | | | 0.71 | | | | (7.46 | ) |
| | | | | | | | | | | | | | | | | | | | | | | | |
Total from investment operations | | | 1.41 | | | | 0.14 | | | | (0.61 | ) | | | 1.48 | | | | 0.85 | | | | (7.19 | ) |
Distributions to shareholders from | | | | | | | | | | | | | | | | | | | | | | | | |
Net investment income | | | (0.24 | ) | | | (0.18 | ) | | | 0.00 | | | | (0.21 | ) | | | (0.23 | ) | | | (0.35 | ) |
Net realized gains | | | 0.00 | | | | 0.00 | | | | 0.00 | | | | 0.00 | | | | 0.00 | | | | (1.65 | ) |
| | | | | | | | | | | | | | | | | | | | | | | | |
Total distributions to shareholders | | | (0.24 | ) | | | (0.18 | ) | | | 0.00 | | | | (0.21 | ) | | | (0.23 | ) | | | (2.00 | ) |
Net asset value, end of period | | $ | 10.92 | | | $ | 9.75 | | | $ | 9.79 | | | $ | 10.40 | | | $ | 9.13 | | | $ | 8.51 | |
Total return3 | | | 14.75 | % | | | 1.58 | % | | | (5.87 | )% | | | 16.58 | % | | | 10.13 | % | | | (45.52 | )% |
Ratios to average net assets (annualized) | | | | | | | | | | | | | | | | | | | | | | | | |
Gross expenses | | | 1.82 | % | | | 1.78 | % | | | 1.71 | % | | | 1.45 | % | | | 1.33 | % | | | 1.20 | % |
Net expenses | | | 1.34 | % | | | 1.34 | % | | | 1.34 | % | | | 1.33 | % | | | 1.33 | % | | | 1.20 | % |
Net investment income | | | 1.72 | % | | | 2.11 | % | | | 1.31 | % | | | 0.66 | % | | | 1.79 | % | | | 2.03 | % |
Supplemental data | | | | | | | | | | | | | | | | | | | | | | | | |
Portfolio turnover rate | | | 26 | % | | | 115 | % | | | 44 | % | | | 42 | % | | | 203 | % | | | 111 | % |
Net assets, end of period (000s omitted) | | | $1,891 | | | | $2,196 | | | | $3,050 | | | | $4,066 | | | | $3,811 | | | | $3,603 | |
| 1. | After the close of business on July 16, 2010, the Fund acquired the net assets of Evergreen International Equity Fund which became the accounting and performance survivor in the transaction. The information for the periods prior to July 19, 2010 is that of Class R of Evergreen International Equity Fund. |
| 2. | Calculated based upon average shares outstanding |
| 3. | Returns for periods of less than one year are not annualized. |
The accompanying notes are an integral part of these financial statements.
| | | | | | |
| Financial highlights | | Wells Fargo Advantage International Equity Fund | | | 17 | |
(For a share outstanding throughout each period)
| | | | | | | | | | | | | | | | |
| | | Six months ended
April 30, 2013
(unaudited) | | | Year ended October 31 | |
| ADMINISTRATOR CLASS | | | 2012 | | | 2011 | | | 20101 | |
Net asset value, beginning of period | | $ | 9.62 | | | $ | 9.67 | | | $ | 10.28 | | | $ | 8.82 | |
Net investment income | | | 0.11 | 2 | | | 0.25 | | | | 0.16 | | | | 0.01 | |
Net realized and unrealized gains (losses) on investments | | | 1.29 | | | | (0.09 | ) | | | (0.74 | ) | | | 1.45 | |
| | | | | | | | | | | | | | | | |
Total from investment operations | | | 1.40 | | | | 0.16 | | | | (0.58 | ) | | | 1.46 | |
Distributions to shareholders from | | | | | | | | | | | | | | | | |
Net investment income | | | (0.27 | ) | | | (0.21 | ) | | | (0.03 | ) | | | 0.00 | |
Net asset value, end of period | | $ | 10.75 | | | $ | 9.62 | | | $ | 9.67 | | | $ | 10.28 | |
Total return3 | | | 14.89 | % | | | 1.88 | % | | | (5.68 | )% | | | 16.55 | % |
Ratios to average net assets (annualized) | | | | | | | | | | | | | | | | |
Gross expenses | | | 1.39 | % | | | 1.36 | % | | | 1.25 | % | | | 1.36 | % |
Net expenses | | | 1.09 | % | | | 1.09 | % | | | 1.09 | % | | | 1.09 | % |
Net investment income | | | 2.14 | % | | | 2.52 | % | | | 1.58 | % | | | 0.32 | % |
Supplemental data | | | | | | | | | | | | | | | | |
Portfolio turnover rate | | | 26 | % | | | 115 | % | | | 44 | % | | | 42 | % |
Net assets, end of period (000s omitted) | | | $4,473 | | | | $3,505 | | | | $3,436 | | | | $89 | |
| 1. | For the period from July 16, 2010 (commencement of class operations) to October 31, 2010 |
| 2. | Calculated based upon average shares outstanding |
| 3. | Returns for periods of less than one year are not annualized. |
The accompanying notes are an integral part of these financial statements.
| | | | |
| 18 | | Wells Fargo Advantage International Equity Fund | | Financial highlights |
(For a share outstanding throughout each period)
| | | | | | | | | | | | | | | | | | | | | | | | |
| | | Six months ended
April 30, 2013
(unaudited) | | | Year ended October 31 | |
| INSTITUTIONAL CLASS | | | 2012 | | | 2011 | | | 20101 | | | 20091 | | | 20081 | |
Net asset value, beginning of period | | $ | 9.76 | | | $ | 9.83 | | | $ | 10.42 | | | $ | 9.17 | | | $ | 8.59 | | | $ | 17.82 | |
Net investment income | | | 0.11 | 2 | | | 0.37 | | | | 0.19 | 2 | | | 0.11 | 2 | | | 0.21 | | | | 0.32 | 2 |
Net realized and unrealized gains (losses) on investments | | | 1.33 | | | | (0.19 | ) | | | (0.75 | ) | | | 1.43 | | | | 0.67 | | | | (7.52 | ) |
| | | | | | | | | | | | | | | | | | | | | | | | |
Total from investment operations | | | 1.44 | | | | 0.18 | | | | (0.56 | ) | | | 1.54 | | | | 0.88 | | | | (7.20 | ) |
Distributions to shareholders from | | | | | | | | | | | | | | | | | | | | | | | | |
Net investment income | | | (0.30 | ) | | | (0.25 | ) | | | (0.03 | ) | | | (0.29 | ) | | | (0.30 | ) | | | (0.41 | ) |
Net realized gains | | | 0.00 | | | | 0.00 | | | | 0.00 | | | | 0.00 | | | | 0.00 | | | | (1.62 | ) |
| | | | | | | | | | | | | | | | | | | | | | | | |
Total distributions to shareholders | | | (0.30 | ) | | | (0.25 | ) | | | (0.03 | ) | | | (0.29 | ) | | | (0.30 | ) | | | (2.03 | ) |
Net asset value, end of period | | $ | 10.90 | | | $ | 9.76 | | | $ | 9.83 | | | $ | 10.42 | | | $ | 9.17 | | | $ | 8.59 | |
Total return3 | | | 15.12 | % | | | 2.05 | % | | | (5.38 | )% | | | 17.17 | % | | | 10.73 | % | | | (45.26 | )% |
Ratios to average net assets (annualized) | | | | | | | | | | | | | | | | | | | | | | | | |
Gross expenses | | | 1.14 | % | | | 1.10 | % | | | 1.03 | % | | | 0.87 | % | | | 0.83 | % | | | 0.69 | % |
Net expenses | | | 0.84 | % | | | 0.84 | % | | | 0.84 | % | | | 0.82 | % | | | 0.83 | % | | | 0.69 | % |
Net investment income | | | 2.21 | % | | | 2.67 | % | | | 1.78 | % | | | 1.15 | % | | | 2.39 | % | | | 2.34 | % |
Supplemental data | | | | | | | | | | | | | | | | | | | | | | | | |
Portfolio turnover rate | | | 26 | % | | | 115 | % | | | 44 | % | | | 42 | % | | | 203 | % | | | 111 | % |
Net assets, end of period (000s omitted) | | | $110,921 | | | | $138,245 | | | | $227,158 | | | | $373,200 | | | | $671,417 | | | | $795,416 | |
| 1. | After the close of business on July 16, 2010, the Fund acquired the net assets of Evergreen International Equity Fund which became the accounting and performance survivor in the transaction. The information for the periods prior to July 19, 2010 is that of Class I of Evergreen International Equity Fund. |
| 2. | Calculated based upon average shares outstanding |
| 3. | Returns for periods of less than one year are not annualized. |
The accompanying notes are an integral part of these financial statements.
| | | | | | |
| Notes to financial statements (unaudited) | | Wells Fargo Advantage International Equity Fund | | | 19 | |
1. ORGANIZATION
Wells Fargo Funds Trust (the “Trust”), a Delaware statutory trust organized on March 10, 1999, is an open-end management investment company registered under the Investment Company Act of 1940, as amended (the “1940 Act”). These financial statements report on Wells Fargo Advantage International Equity Fund (the “Fund”) which is a diversified series of the Trust.
2. SIGNIFICANT ACCOUNTING POLICIES
The following significant accounting policies, which are consistently followed in the preparation of the financial statements of the Fund, are in conformity with U.S. generally accepted accounting principles which require management to make estimates and assumptions that affect the reported amounts of assets and liabilities, disclosure of contingent assets and liabilities at the date of the financial statements, and the reported amounts of revenues and expenses during the reporting period. Actual results could differ from those estimates.
Securities valuation
All investments are valued each business day as of the close of regular trading on the New York Stock Exchange (normally 4 p.m. Eastern Time).
Equity securities that are listed on a foreign or domestic exchange, except for The Nasdaq Stock Market, Inc. (“Nasdaq”), are valued at the official closing price or, if none, the last sales price. Securities listed on Nasdaq are valued at the Nasdaq Official Closing Price (“NOCP”). If no NOCP is available, securities are valued at the last sales price. If no sales price is shown on the Nasdaq, the bid price will be used. If no sale occurs on the primary exchange or market for the security that day or if no sale occurs and no bid price is shown on Nasdaq, the prior day’s price will be deemed “stale” and fair values will be determined in accordance with the Fund’s Valuation Procedures.
Securities denominated in foreign currencies are translated into U.S. dollars using the rates of exchange in effect on the day of valuation at a time specified by the Management Valuation Team of Wells Fargo Funds Management, LLC (“Funds Management”).
Many securities markets and exchanges outside the U.S. close prior to the close of the New York Stock Exchange and therefore may not fully reflect trading or events that occur after the close of the principal exchange in which the foreign securities are traded, but before the close of the New York Stock Exchange. If such trading or events are expected to materially affect the value of such securities, then fair value pricing procedures approved by the Board of Trustees are applied. These procedures take into account multiple factors including movements in U.S. securities markets after foreign exchanges close. Foreign securities that are fair valued under these procedures are categorized as Level 2 and the application of these procedures may result in transfers between Level 1 and Level 2. Depending on market activity, such fair valuations may be frequent. Such fair value pricing may result in NAVs that are higher or lower than NAVs based on the last reported sales price or latest quoted bid price. On April 30, 2013, fair value pricing was not used in pricing foreign securities.
Investments in registered open-end investment companies are valued at net asset value. Non-registered investment companies are fair valued at net asset value.
Investments which are not valued using any of the methods discussed above are valued at their fair value, as determined by procedures established in good faith and approved by the Board of Trustees. The Board of Trustees has established a Valuation Committee comprised of the Trustees and has delegated to it the authority to take any actions regarding the valuation of portfolio securities that the Valuation Committee deems necessary or appropriate, including determining the fair value of portfolio securities, unless the determination has been delegated to the Management Valuation Team. The Board of Trustees retains the authority to make or ratify any valuation decisions or approve any changes to the Valuation Procedures as it deems appropriate. On a quarterly basis, the Board of Trustees receives reports on any valuation actions taken by the Valuation Committee or the Management Valuation Team which may include items for ratification.
Valuations of fair valued securities are compared to the next actual sales price when available, or other appropriate market information to assess the continued appropriateness of the fair valuation methodology used. These securities are fair valued on a day-to-day basis, taking into consideration changes to appropriate market information and any significant changes to the input factors considered in the valuation process until there is a readily available price provided on the exchange or by an independent pricing service. Valuations received from an independent pricing service or broker quotes are periodically validated by comparisons to most recent trades and valuations provided by other independent pricing services in addition to the review of prices by the adviser and/or subadviser. Unobservable inputs used in determining fair valuations are identified based on the type of security, taking into consideration factors utilized by market participants in valuing the investment, knowledge about the issuer and the current market environment.
| | | | |
| 20 | | Wells Fargo Advantage International Equity Fund | | Notes to financial statements (unaudited) |
Foreign currency translation
The accounting records of the Fund are maintained in U.S. dollars. Assets, including investment securities, and liabilities denominated in foreign currency are translated into U.S. dollars at the rates of exchange at a time specified by the Management Valuation Team on the date of valuation. Purchases and sales of securities, and income and expenses are converted at the rate of exchange on the respective dates of such transactions. Reported net realized foreign exchange gains or losses arise from sales of foreign currencies, currency gains or losses realized between the trade and settlement dates on securities transactions, and the difference between the amounts of dividends, interest and foreign withholding taxes recorded and the U.S. dollar equivalent of the amounts actually paid or received. Net unrealized foreign exchange gains and losses arise from changes in the fair value of assets and liabilities other than investments in securities resulting in changes in exchange rates.
The changes in net assets arising from changes in exchange rates and the changes in net assets resulting from changes in market prices of securities are not separately presented. Such changes are recorded with net realized and unrealized gains or losses from investments. Gains and losses from certain foreign currency transactions are treated as ordinary income for U.S. federal income tax purposes.
Forward foreign currency contracts
The Fund may be subject to foreign currency exchange rate risk in the normal course of pursuing its investment objectives. A forward foreign currency contract is an agreement between two parties to purchase or sell a specific currency for an agreed-upon price at a future date. The Fund enters into forward foreign currency contracts to facilitate transactions in foreign-denominated securities and to attempt to minimize the risk to the Fund from adverse changes in the relationship between currencies. Forward foreign currency contracts are recorded at the forward rate and marked-to-market daily. When the contracts are closed, realized gains and losses arising from such transactions are recorded as realized gains or losses on forward foreign currency contract transactions. The Fund could be exposed to risks if the counterparties to the contracts are unable to meet the terms of their contracts or if the value of the foreign currency changes unfavorably. The Fund’s maximum risk of loss from counterparty credit risk is the unrealized gains or losses on the contracts. This risk is mitigated by having a master netting arrangement between the Fund and the counterparty.
Security loans
The Fund may lend its securities from time to time in order to earn additional income in the form of fees or interest on securities received as collateral or the investment of any cash received as collateral. The Fund continues to receive interest or dividends on the securities loaned. The Fund receives collateral in the form of cash or securities with a value at least equal to the value of the securities on loan. The value of the loaned securities is determined at the close of each business day and any additional required collateral is delivered to the Fund on the next business day. In a securities lending transaction, the net asset value of the Fund will be affected by an increase or decrease in the value of the securities loaned and by an increase or decrease in the value of the instrument in which collateral is invested. The amount of securities lending activity undertaken by the Fund fluctuates from time to time. In the event of default or bankruptcy by the borrower, the Fund may be prevented from recovering the loaned securities or gaining access to the collateral or may experience delays or costs in doing so. In addition, the investment of any cash collateral received may lose all or part of its value. The Fund has the right under the lending agreement to recover the securities from the borrower on demand.
The Fund lends its securities through an unaffiliated securities lending agent. Cash collateral received in connection with its securities lending transactions is invested in Wells Fargo Securities Lending Cash Investments, LLC (the “Cash Collateral Fund”). The Cash Collateral Fund is exempt from registration under Section 3(c)(7) of the 1940 Act and is managed by Funds Management and is subadvised by Wells Capital Management Incorporated (“WellsCap”). Funds Management receives an advisory fee starting at 0.05% and declining to 0.01% as the average daily net assets of the Cash Collateral Fund increase. All of the fees received by Funds Management are paid to WellsCap for its services as subadviser. The Cash Collateral Fund seeks to provide a positive return compared to the daily Fed Funds Open rate by investing in high-quality, U.S. dollar-denominated short-term money market instruments. Cash Collateral Fund investments are fair valued based upon the amortized cost valuation technique. Income earned from investment in the Cash Collateral Fund is included in securities lending income on the Statement of Operations.
Security transactions and income recognition
Securities transactions are recorded on a trade date basis. Realized gains or losses are recorded on the basis of identified cost.
Dividend income is recognized on the ex-dividend date, except for certain dividends from foreign securities, which are recorded as soon as the Fund is informed of the ex-dividend date. Dividend income from foreign securities is recorded net of foreign taxes withheld where recovery of such taxes is not assured.
| | | | | | |
| Notes to financial statements (unaudited) | | Wells Fargo Advantage International Equity Fund | | | 21 | |
Distributions to shareholders
Distributions to shareholders from net investment income and net realized gains, if any, are recorded on the ex-dividend date. Such distributions are determined in conformity with federal income tax regulations, which may differ in amount or character from net investment income and realized gains recognized for purposes of U.S. generally accepted accounting principles.
Federal and other taxes
The Fund intends to continue to qualify as a regulated investment company by distributing substantially all of its investment company taxable income and any net realized capital gains (after reduction for capital loss carryforwards) sufficient to relieve it from all, or substantially all, federal income taxes. Accordingly, no provision for federal income taxes was required.
The Fund’s income and federal excise tax returns and all financial records supporting those returns for the prior three fiscal years are subject to examination by the federal and Delaware revenue authorities. Management has analyzed the Fund’s tax positions taken on federal, state, and foreign tax returns for all open tax years and does not believe that there are any uncertain tax positions that require recognition of a tax liability.
As of October 31, 2012, the Fund had pre-enactment capital loss carryforwards incurred in taxable years beginning before December 22, 2010, which are available to offset future net realized capital gains, in the amount of $62,820,004 expiring in 2016.
Class allocations
The separate classes of shares offered by the Fund differ principally in applicable sales charges, distribution, shareholder servicing, and administration fees. Shareholders of each class bear certain expenses that pertain to that particular class. All shareholders bear the common expenses of the Fund, earn income from the portfolio, and are allocated any unrealized gains and losses pro rata based on the average daily net assets of each class, without distinction between share classes. Dividends are determined separately for each class based on income and expenses allocable to each class. Realized gains and losses are allocated to each class pro rata based upon the net assets of each class on the date realized. Differences in per share dividend rates generally result from the relative weightings of pro rata income and realized gain allocations and from differences in separate class expenses, including distribution, shareholder servicing, and administration fees.
3. FAIR VALUATION MEASUREMENTS
Fair value measurements of investments are determined within a framework that has established a fair value hierarchy based upon the various data inputs utilized in determining the value of the Fund’s investments. The three-level hierarchy gives the highest priority to unadjusted quoted prices in active markets for identical assets or liabilities (Level 1) and the lowest priority to significant unobservable inputs (Level 3). The Fund’s investments are classified within the fair value hierarchy based on the lowest level of input that is significant to the fair value measurement. The inputs are summarized into three broad levels as follows:
| n | | Level 1 – quoted prices in active markets for identical securities |
| n | | Level 2 – other significant observable inputs (including quoted prices for similar securities, interest rates, prepayment speeds, credit risk, use of amortized cost, etc.) |
| n | | Level 3 – significant unobservable inputs (including the Fund’s own assumptions in determining the fair value of investments) |
The inputs or methodologies used for valuing investments in securities are not necessarily an indication of the risk associated with investing in those securities.
As of April 30, 2013, the inputs used in valuing investments in securities were as follows:
| | | | | | | | | | | | | | | | |
| Investments in securities | | Quoted prices (Level 1) | | | Significant other
observable inputs (Level 2) | | | Significant unobservable inputs (Level 3) | | | Total | |
Equity securities | | | | | | | | | | | | | | | | |
Common stocks | | $ | 245,436,005 | | | $ | 0 | | | $ | 0 | | | $ | 245,436,005 | |
Short-term investments | | | | | | | | | | | | | | | | |
Investment companies | | | 5,910,195 | | | | 13,799,393 | | | | 0 | | | | 19,709,588 | |
| | | $ | 251,346,200 | | | $ | 13,799,393 | | | $ | 0 | | | $ | 265,145,593 | |
| | | | |
| 22 | | Wells Fargo Advantage International Equity Fund | | Notes to financial statements (unaudited) |
As of April 30, 2013, the inputs used in valuing the Fund’s other financial instruments were as follows:
| | | | | | | | | | | | | | | | |
| Other financial instruments | | Quoted prices (Level 1) | | | Significant other
observable inputs (Level 2) | | | Significant unobservable inputs (Level 3) | | | Total | |
Forward foreign currency contracts+ | | $ | 0 | | | $ | 146,791 | | | $ | 0 | | | $ | 146,791 | |
| + | Forward foreign currency contracts are presented at the unrealized gains or losses on the instrument. |
Transfers in and transfers out are recognized at the end of the reporting period. For the six months ended April 30, 2013, the Fund did not have any significant transfers into/out of Level 1 or Level 2.
4. TRANSACTIONS WITH AFFILIATES AND OTHER EXPENSES
Advisory fee
The Trust has entered into an advisory contract with Funds Management, an indirect wholly owned subsidiary of Wells Fargo & Company (“Wells Fargo”). The adviser is responsible for implementing investment policies and guidelines and for supervising the subadviser, who is responsible for day-to-day portfolio management of the Fund.
Pursuant to the contract, Funds Management is entitled to receive an annual advisory fee starting at 0.85% and declining to 0.70% as the average daily net assets of the Fund increase. For the six months ended April 30, 2013, the advisory fee was equivalent to an annual rate of 0.85% of the Fund’s average daily net assets.
Funds Management has retained the services of a subadviser to provide daily portfolio management to the Fund. The fee for subadvisory services is borne by Funds Management. WellsCap, an affiliate of Funds Management, is the subadviser to the Fund and is entitled to receive a fee from Funds Management at an annual rate starting at 0.45% and declining to 0.40% as the average daily net assets of the Fund increase.
Administration and transfer agent fees
The Trust has entered into an administration agreement with Funds Management. Under this agreement, for providing administrative services, which includes paying fees and expenses for services provided by the transfer agent, sub-transfer agents, omnibus account servicers and record-keepers, Funds Management is entitled to receive from the Fund an annual fund level administration fee starting at 0.05% and declining to 0.03% as the average daily net assets of the Fund increase and a class level administration fee which is calculated based on the average daily net assets of each class as follows:
| | | | |
| | | Class level
administration fee | |
Class A, Class B, Class C, Class R | | | 0.26 | % |
Administrator Class | | | 0.10 | |
Institutional Class | | | 0.08 | |
Funds Management has contractually waived and/or reimbursed advisory and administration fees to the extent necessary to maintain certain net operating expense ratios for the Fund. Waiver of fees and/or reimbursement of expenses by Funds Management were made first from fund level expenses on a proportionate basis and then from class specific expenses. Funds Management has committed through February 28, 2014 to waive fees and/or reimburse expenses to the extent necessary to cap the Fund’s expenses at 1.09% for Class A shares, 1.84% for Class B shares, 1.84% for Class C shares, 1.34% for Class R shares, 1.09% for Administrator Class shares, and 0.84% for Institutional Class shares.
Distribution fees
The Trust has adopted a Distribution Plan for Class B, Class C and Class R shares of the Fund pursuant to Rule 12b-1 under the 1940 Act. Distribution fees are charged to Class B, Class C and Class R shares and paid to Wells Fargo Funds Distributor, LLC, the principal underwriter, at an annual rate of 0.75% of the average daily net assets of Class B and Class C shares and 0.25% of the average daily net assets of Class R shares.
For the six months ended April 30, 2013, Wells Fargo Funds Distributor, LLC received $1,677 from the sale of Class A shares and $1,263 in contingent deferred sales charges from redemptions of Class B shares.
Shareholder servicing fees
The Trust has entered into contracts with one or more shareholder servicing agents, whereby Class A, Class B, Class C, Class R, and Administrator Class of the Fund is charged a fee at an annual rate of 0.25% of the average daily net assets of each respective class.
| | | | | | |
| Notes to financial statements (unaudited) | | Wells Fargo Advantage International Equity Fund | | | 23 | |
A portion of these total shareholder servicing fees were paid to affiliates of Wells Fargo.
5. INVESTMENT PORTFOLIO TRANSACTIONS
Purchases and sales of investments, excluding U.S. government obligations (if any) and short-term securities, for the six months ended April 30, 2013 were $66,024,880 and $133,007,717, respectively.
6. DERIVATIVE TRANSACTIONS
During the six months ended April 30, 2013, the Fund entered into forward foreign currency contracts for economic hedging purposes.
At April 30, 2013, the Fund had forward foreign currency contracts outstanding as follows:
Forward foreign currency contracts to sell:
| | | | | | | | | | | | | | | | | | |
| Exchange date | | Counterparty | | Contracts to
receive/deliver | | | U.S. value at
April 30, 2013 | | | In exchange
for U.S. $ | | | Unrealized
gains
(losses) | |
| 7-8-2013 | | State Street Bank | | | 995,278,000 | JPY | | $ | 10,213,177 | | | $ | 10,441,439 | | | $ | 228,262 | |
| 7-8-2013 | | State Street Bank | | | 406,177,400 | JPY | | | 4,168,042 | | | | 4,086,571 | | | | (81,471 | ) |
The Fund had average contract amounts of $316,662 and $5,450,257 in forward foreign currency contracts to buy and forward foreign currency contracts to sell, respectively, during the six months ended April 30, 2013.
The fair value, realized gains or losses and change in unrealized gains or losses, if any, on derivative instruments are reflected in the appropriate financial statements.
7. BANK BORROWINGS
The Trust (excluding the money market funds and certain other funds in the Trust) and Wells Fargo Variable Trust are parties to a $150,000,000 revolving credit agreement with State Street Bank and Trust Company, whereby the Fund is permitted to use bank borrowings for temporary or emergency purposes, such as to fund shareholder redemption requests. Interest under the credit agreement is charged to the Fund based on a borrowing rate equal to the higher of the Federal Funds rate in effect on that day plus 1.25% or the overnight LIBOR rate in effect on that day plus 1.25%. In addition, an annual commitment fee equal to 0.10% of the unused balance is allocated to each participating fund. For the six months ended April 30, 2013, the Fund paid $292 in commitment fees.
For the six months ended April 30, 2013, there were no borrowings by the Fund under the agreement.
8. INDEMNIFICATION
Under the Trust’s organizational documents, the officers and directors are indemnified against certain liabilities that may arise out of performance of their duties to the Trust. Additionally, in the normal course of business, the Trust may enter into contracts with service providers that contain a variety of indemnification clauses. The Trust’s maximum exposure under these arrangements is dependent on future claims that may be made against the Fund and, therefore, cannot be estimated.
9. NEW ACCOUNTING PRONOUNCEMENT
In December 2011, the Financial Accounting Standards Board (“FASB”) issued Accounting Standard Update (“ASU”) No. 2011-11, Disclosures about Offsetting Assets and Liabilities. ASU 2011-11, which amends FASB ASC Topic 210, Balance Sheet, creates new disclosure requirements which require entities to disclose both gross and net information for derivatives and other financial instruments that are either offset in the Statement of Assets and Liabilities or subject to an enforceable master netting arrangement or similar agreement. The disclosure requirements are effective for interim and annual reporting periods beginning on or after January 1, 2013. Management is currently assessing the potential impact, in addition to expanded financial statement disclosure, that may result from adopting this ASU.
| | | | |
| 24 | | Wells Fargo Advantage International Equity Fund | | Other information (unaudited) |
TAX INFORMATION
Pursuant to Section 853 of the Internal Revenue Code, the following amounts were designated as foreign taxes paid for the fiscal year ended October 31, 2012. These amounts may be less than the actual foreign taxes paid for financial statement purposes. Foreign taxes paid or withheld should be included in taxable income with an offsetting deduction from gross income or as a credit for taxes paid to foreign governments. None of the income was derived from ineligible foreign sources as defined under Section 901(j) of the Internal Revenue Code.
| | | | |
Creditable foreign taxes paid | | Per share amount on October 31, 2012 | | Foreign income as % of ordinary income distributions |
| $480,518 | | $0.02 | | 97.46% |
PROXY VOTING INFORMATION
A description of the policies and procedures that the Fund uses to determine how to vote proxies relating to portfolio securities is available without charge, upon request, by calling 1-800-222-8222, visiting our website at wellsfargoadvantagefunds.com, or visiting the SEC website at sec.gov. Information regarding how the Fund voted proxies relating to portfolio securities during the most recent 12-month period ended June 30 is available without charge on the Fund’s website at wellsfargoadvantagefunds.com or by visiting the SEC website at sec.gov.
PORTFOLIO HOLDINGS INFORMATION
The complete portfolio holdings for the Fund are publicly available on the Fund’s website (wellsfargoadvantagefunds.com) on a monthly, 30-day or more delayed basis. In addition, top ten holdings information for the Fund is publicly available on the Fund’s website on a monthly, seven-day or more delayed basis. The Fund files its complete schedule of portfolio holdings with the SEC for the first and third quarters of each fiscal year on Form N-Q, which is available without charge by visiting the SEC website at sec.gov. In addition, the Fund’s Form N-Q may be reviewed and copied at the SEC’s Public Reference Room in Washington, DC, and at regional offices in New York City, at 233 Broadway, and in Chicago, at 175 West Jackson Boulevard, Suite 900. Information about the Public Reference Room may be obtained by calling 1-800-SEC-0330.
| | | | | | |
| Other information (unaudited) | | Wells Fargo Advantage International Equity Fund | | | 25 | |
BOARD OF TRUSTEES AND OFFICERS
Each of the Trustees and Officers listed in the table below acts in identical capacities for the Wells Fargo Advantage family of funds, which consists of 131 funds1 comprising the Wells Fargo Funds Trust, Wells Fargo Variable Trust, Wells Fargo Master Trust and four closed-end funds (collectively the “Fund Complex”). This table should be read in conjunction with the Prospectus and the Statement of Additional Information2. All of the Trustees are also Members of the Audit and Governance Committees of each Trust in the Fund Complex. The mailing address of each Trustee and Officer is 525 Market Street, 12th Floor, San Francisco, CA 94105. Each Trustee and Officer serves an indefinite term, however, each Trustee serves such term until reaching the mandatory retirement age established by the Trustees.
Independent Trustees
| | | | | | |
Name and year of birth | | Position held and length of service* | | Principal occupations during past five years | | Other directorships during
past five years |
| Peter G. Gordon (Born 1942) | | Trustee, since 1998; Chairman, since 2005 | | Co-Founder, Retired Chairman, President and CEO of Crystal Geyser Water Company. Trustee Emeritus, Colby College. | | Asset Allocation Trust |
| Isaiah Harris, Jr. (Born 1952) | | Trustee, since 2009 | | Retired. Prior thereto, President and CEO of BellSouth Advertising and Publishing Corp. from 2005 to 2007, President and CEO of BellSouth Enterprises from 2004 to 2005 and President of BellSouth Consumer Services from 2000 to 2003. Emeritus member of the Iowa State University Foundation Board of Governors. Emeritus Member of the Advisory Board of Iowa State University School of Business. Advisory Board Member, Palm Coast Academy (charter school). Mr. Harris is a certified public accountant. | | CIGNA Corporation; Deluxe Corporation; Asset Allocation Trust |
| Judith M. Johnson (Born 1949) | | Trustee, since 2008; Audit Committee Chairman, since 2008 | | Retired. Prior thereto, Chief Executive Officer and Chief Investment Officer of Minneapolis Employees Retirement Fund from 1996 to 2008. Ms. Johnson is an attorney, certified public accountant and a certified managerial accountant. | | Asset Allocation Trust |
| Leroy Keith, Jr. (Born 1939) | | Trustee, since 2010 | | Chairman, Bloc Global Services (development and construction). Trustee of the Evergreen Funds from 1983 to 2010. Former Managing Director, Almanac Capital Management (commodities firm), former Partner, Stonington Partners, Inc. (private equity fund), former Director, Obagi Medical Products Co. and former Director, Lincoln Educational Services. | | Trustee, Virtus Fund Complex (consisting of 48 portfolios as of 1/31/13); Asset Allocation Trust |
| David F. Larcker (Born 1950) | | Trustee, since 2009 | | James Irvin Miller Professor of Accounting at the Graduate School of Business, Stanford University, Morgan Stanley Director of the Center for Leadership Development and Research and Senior Faculty of The Rock Center for Corporate Governance since 2006. From 2005 to 2008, Professor of Accounting at the Graduate School of Business, Stanford University. Prior thereto, Ernst & Young Professor of Accounting at The Wharton School, University of Pennsylvania from 1985 to 2005. | | Asset Allocation Trust |
| Olivia S. Mitchell (Born 1953) | | Trustee, since 2006 | | International Foundation of Employee Benefit Plans Professor, Wharton School of the University of Pennsylvania since 1993. Director of Wharton’s Pension Research Council and Boettner Center on Pensions & Retirement Research, and Research Associate at the National Bureau of Economic Research. Previously, Cornell University Professor from 1978 to 1993. | | Asset Allocation Trust |
| Timothy J. Penny (Born 1951) | | Trustee, since 1996 | | President and CEO of Southern Minnesota Initiative Foundation, a non-profit organization, since 2007 and Senior Fellow at the Humphrey Institute Policy Forum at the University of Minnesota since 1995. Member of the Board of Trustees of NorthStar Education Finance, Inc., a non-profit organization, since 2007. | | Asset Allocation Trust |
| | | | |
| 26 | | Wells Fargo Advantage International Equity Fund | | Other information (unaudited) |
| | | | | | |
Name and year of birth | | Position held and length of service* | | Principal occupations during past five years | | Other directorships during
past five years |
| Michael S. Scofield (Born 1943) | | Trustee, since 2010 | | Served on the Investment Company Institute’s Board of Governors and Executive Committee from 2008-2011 as well the Governing Council of the Independent Directors Council from 2006-2011 and the Independent Directors Council Executive Committee from 2008-2011. Chairman of the IDC from 2008-2010. Institutional Investor (Fund Directions) Trustee of Year in 2007. Trustee of the Evergreen Funds (and its predecessors) from 1984 to 2010. Chairman of the Evergreen Funds from 2000-2010. Former Trustee of the Mentor Funds. Retired Attorney, Law Offices of Michael S. Scofield. | | Asset Allocation Trust |
| Donald C. Willeke (Born 1940) | | Trustee, since 1996 | | Principal of the law firm of Willeke & Daniels. General Counsel of the Minneapolis Employees Retirement Fund from 1984 until its consolidation into the Minnesota Public Employees Retirement Association on June 30, 2010. Director and Vice Chair of The Tree Trust (non-profit corporation). Director of the American Chestnut Foundation (non-profit corporation). | | Asset Allocation Trust |
| * | Length of service dates reflect the Trustee’s commencement of service with the Trust’s predecessor entities, where applicable. |
Officers
| | | | | | |
Name and year of birth | | Position held and
length of service | | Principal occupations during past five years | | |
| Karla M. Rabusch (Born 1959) | | President, since 2003 | | Executive Vice President of Wells Fargo Bank, N.A. and President of Wells Fargo Funds Management, LLC since 2003. | | |
| Jeremy DePalma1 (Born 1974) | | Treasurer, since 2012 | | Senior Vice President of Wells Fargo Funds Management, LLC since 2009. Senior Vice President of Evergreen Investment Management Company, LLC from 2008 to 2010. Vice President, Evergreen Investment Services, Inc. from 2004 to 2007. Head of the Fund Reporting and Control Team within Fund Administration from 2005 to 2010. | | |
| C. David Messman (Born 1960) | | Secretary, since 2000; Chief Legal Officer, | | Senior Vice President and Secretary of Wells Fargo Funds Management, LLC since 2001. Vice President and Managing Counsel of Wells Fargo Bank, N.A. since 2003 since 1996. | | |
Debra Ann Early (Born 1964) | | Chief Compliance Officer, since 2007 | | Chief Compliance Officer of Wells Fargo Funds Management, LLC since 2007. Chief Compliance Officer of Parnassus Investments from 2005 to 2007. Chief Financial Officer of Parnassus Investments from 2004 to 2007. | | |
David Berardi (Born 1975) | | Assistant Treasurer, since 2009 | | Vice President of Wells Fargo Funds Management, LLC since 2009. Vice President of Evergreen Investment Management Company, LLC from 2008 to 2010. Assistant Vice President of Evergreen Investment Services, Inc. from 2004 to 2008. Manager of Fund Reporting and Control for Evergreen Investment Management Company, LLC from 2004 to 2010. | | |
| 1. | Jeremy DePalma acts as Treasurer of 58 funds and Assistant Treasurer of 73 funds in the Fund Complex. |
| 2. | The Statement of Additional Information includes additional information about the Trustees and is available, without charge, upon request, by calling 1-800-222-8222 or by visiting the website at wellsfargoadvantagefunds.com. |
| | | | | | |
| Other information (unaudited) | | Wells Fargo Advantage International Equity Fund | | | 27 | |
BOARD CONSIDERATION OF INVESTMENT ADVISORY AND SUBADVISORY AGREEMENTS:
Under Section 15 of the Investment Company Act of 1940 (the “1940 Act”), the Board of Trustees (the “Board”) of Wells Fargo Funds Trust (the “Trust”), all the members of which have no direct or indirect interest in the investment advisory and sub-advisory agreements and are not “interested persons” of the Trust, as defined in the 1940 Act (the “Independent Trustees”), must determine whether to approve the continuation of the Trust’s investment advisory and sub-advisory agreements. In this regard, at an in-person meeting held on March 28-29, 2013 (the “Meeting”), the Board reviewed: (i) an investment advisory agreement with Wells Fargo Funds Management, LLC (“Funds Management”) for Wells Fargo Advantage International Equity Fund (the “Fund”) and (ii) an investment sub-advisory agreement with Wells Capital Management Incorporated (the “Sub-Adviser”), an affiliate of Funds Management, for the Fund. The investment advisory agreement with Funds Management and the investment sub-advisory agreement with the Sub-Adviser are collectively referred to as the “Advisory Agreements.”
At the Meeting, the Board considered the factors and reached the conclusions described below relating to the selection of Funds Management and the Sub-Adviser and the continuation of the Advisory Agreements. Prior to the Meeting, the Trustees conferred extensively among themselves and with representatives of Funds Management about these matters. The Board has adopted a team-based approach, with each team consisting of a sub-set of Trustees, to assist the Board in the discharge of its duties in reviewing performance and other matters throughout the year. The Independent Trustees were assisted in their evaluation of the Advisory Agreements by independent legal counsel, from whom they received separate legal advice and with whom they met separately.
In providing information to the Board, Funds Management and the Sub-Adviser were guided by a detailed set of requests for information submitted to them by independent legal counsel on behalf of the Independent Trustees at the start of the Board’s annual contract renewal process earlier in 2013. In considering and approving the Advisory Agreements, the Trustees considered the information they believed relevant, including but not limited to the information discussed below. The Board considered not only the specific information presented in connection with the Meeting, but also the knowledge gained over time through interaction with Funds Management and the Sub-Adviser about various topics. In this regard, the Board reviewed reports of Funds Management at each of its quarterly meetings, which included, among other things, portfolio reviews and performance reports. In addition, the Board and the teams mentioned above confer with portfolio managers at various times throughout the year. The Board did not identify any particular information or consideration that was all-important or controlling, and each individual Trustee may have attributed different weights to various factors.
After its deliberations, the Board unanimously determined that the continuation of the Advisory Agreements is in the best interests of the Fund and its shareholders, and that the compensation payable to Funds Management and the Sub-Adviser is reasonable. The Board considered the continuation of the Advisory Agreements for the Fund as part of its consideration of the continuation of advisory agreements for funds across the complex, but each decision was made on a fund-by-fund basis. The following summarizes a number of important, but not necessarily all, factors considered by the Board in reaching its determination.
Nature, extent and quality of services
The Board received and considered various information regarding the nature, extent and quality of services provided to the Fund by Funds Management and the Sub-Adviser under the Advisory Agreements. This information included, among other things, a summary of the background and experience of senior management of Funds Management, and the qualifications, background, tenure and responsibilities of each of the portfolio managers primarily responsible for the day-to-day portfolio management of the Fund.
The Board evaluated the ability of Funds Management and the Sub-Adviser, based on attributes such as their financial condition, resources and reputation, to attract and retain qualified investment professionals, including research, advisory and supervisory personnel. The Board further considered the compliance programs and compliance records of Funds Management and the Sub-Adviser. In addition, the Board took into account the administrative and other services provided to the Fund by Funds Management and its affiliates and Funds Management’s oversight of the Fund’s various service providers.
Fund performance and expenses
The Board considered the performance results for the Fund over various time periods ended December 31, 2012. The Board also considered these results in comparison to the performance of funds in a universe that was determined by Lipper Inc. (“Lipper”) to be similar to the Fund (the “Universe”), and in comparison to the Fund’s benchmark index and to
| | | | |
| 28 | | Wells Fargo Advantage International Equity Fund | | Other information (unaudited) |
other comparative data. Lipper is an independent provider of investment company data. The Board received a description of the methodology used by Lipper to select the mutual funds in the performance Universe. The Board noted that the performance of the Fund (Class A) was higher than or in range of the median performance of the Universe for all periods under review except for the one- and five-year periods under review. The Board also noted that the performance of the Fund was lower than its benchmark, the Morgan Stanley Composite Index All Country World Index ex USA (Net), for all periods under review except for the three-year period.
The Board received information concerning, and discussed factors contributing to, the underperformance of the Fund relative to the benchmark and the Universe for the periods noted above. Funds Management advised the Board about the market conditions and investment decisions that it believed contributed to the underperformance during that period. The Board noted that the Fund’s Universe had changed from the International Large Cap Core classification to the International Multi Cap Core classification. The Board also noted that the Fund experienced a portfolio manager change in 2012. The Board was satisfied with the explanation of the underperformance.
The Board received and considered information regarding the Fund’s net operating expense ratios and their various components, including actual management fees (which reflect fee waivers, if any, and include advisory, administration and transfer agent fees), custodian and other non-management fees, Rule 12b-1 and non-Rule 12b-1 service fees and fee waiver and expense reimbursement arrangements. The Board also considered these ratios in comparison to the median ratios of funds in class-specific expense groups that were determined by Lipper to be similar to the Fund (the “Groups”). The Board received a description of the methodology used by Lipper to select the mutual funds in the expense Groups. Based on the Lipper reports, the Board noted that the net operating expense ratios of the Fund were lower than the median net operating expense ratios of the expense Groups. The Board and Funds Management agreed to maintain the current contractual net expense ratio caps for the Fund.
Based on its consideration of the factors and information it deemed relevant, including those described here, the Board concluded that the overall performance and expense structure of the Fund supported the re-approval of the Advisory Agreements.
Investment advisory and sub-advisory fee rates
The Board reviewed and considered the contractual investment advisory fee rates that are payable by the Fund to Funds Management for investment advisory services (the “Advisory Agreement Rates”), both on a stand-alone basis and on a combined basis with the Fund’s fund-level and class-level contractual administration fee rates (the “Management Rates”). The Board noted that the administration fees include transfer agency costs. The Board also reviewed and considered the contractual investment sub-advisory fee rates that are payable by Funds Management to the Sub-Adviser for investment sub-advisory services (the “Sub-Advisory Agreement Rates”).
Among other information reviewed by the Board was a comparison of the Management Rates of the Fund with those of other funds in the expense Groups at a common asset level. The Board noted that the Management Rates of the Fund were higher than the median rates for the Fund’s expense Groups for all classes except the Institutional Class. The Board and Funds Management agreed to maintain the current contractual net expense ratio caps for the Fund, including the Institutional Class.
The Board also received and considered information about the portion of the total advisory fee that was retained by Funds Management after payment of the fee to the Sub-Adviser for sub-advisory services. In assessing the reasonableness of this amount, the Board received and evaluated information concerning the nature and extent of responsibilities retained and risks assumed by Funds Management and not delegated to or assumed by the Sub-Adviser, and about Funds Management’s on-going oversight services. In recognition of the fact that the Wells Fargo enterprise provides a suite of combined advisory and sub-advisory services to the Fund through affiliated entities, the Board ascribed limited relevance to the allocation of the total advisory fee between Funds Management and the Sub-Adviser.
The Board also received and considered information about the nature and extent of services offered and fee rates charged by Funds Management and the Sub-Adviser to other types of clients. In this regard, the Board received information about the significantly greater scope of services, and compliance, reporting and other legal burdens and risks of managing mutual funds compared with those associated with managing assets of non-mutual fund clients such as collective funds or institutional separate accounts.
Based on its consideration of the factors and information it deemed relevant, including those described here, the Board determined that the Advisory Agreement Rates and the Sub-Advisory Agreement Rates were reasonable in light of the services covered by the Advisory Agreements.
| | | | | | |
| Other information (unaudited) | | Wells Fargo Advantage International Equity Fund | | | 29 | |
Profitability
The Board received and considered information concerning the profitability of Funds Management, as well as the profitability of Wells Fargo as a whole, from providing services to the Fund. The Board did not receive or consider to be necessary separate profitability information with respect to the Sub-Adviser, because, as an affiliate of Funds Management, its profitability information was subsumed in the collective Wells Fargo profitability analysis provided by Funds Management.
Funds Management explained the methodologies and estimates that it used in calculating the profitability from the Fund and the fund family as a whole. Among other things, the Board noted that the levels of profitability reported on a fund-by-fund basis varied widely, depending on factors such as the size and type of fund. Based on its review, the Board did not deem the profits reported by Funds Management to be at a level that would prevent it from approving the continuation of the Advisory Agreements.
Economies of scale
With respect to possible economies of scale, the Board reviewed the breakpoints in the Fund’s advisory fee and administration fee structure, which operate generally to reduce the Fund’s expense ratios as the Fund grows in size. It considered that, for a small fund or a fund that shrinks in size, breakpoints conversely can result in higher fee levels. The Board also considered fee waiver and expense reimbursement arrangements as a means of sharing potential economies of scale with the Fund. The Board acknowledged the inherent limitations of any analysis of potential economies of scale and of any attempt to correlate breakpoints with such economies. Nonetheless, the Board concluded that the breakpoints and net operating expense ratio caps appeared to be a reasonable approach to sharing potential economies of scale with the Fund.
Other benefits to Funds Management and the Sub-Adviser
The Board received and considered information regarding potential “fall-out” or ancillary benefits received by Funds Management and its affiliates, including the Sub-Adviser, as a result of their relationship with the Fund. Ancillary benefits could include, among others, benefits directly attributable to other relationships with the Fund and benefits potentially derived from an increase in Funds Management’s and the Sub-Adviser’s business as a result of their relationship with the Fund (such as the ability to market to shareholders other financial products and services offered by Funds Management and its affiliates, including the Sub-Adviser, or to operate other products and services that follow investment strategies similar to those of the Fund).
The Board considered that Wells Fargo Funds Distributor, LLC, an affiliate of Funds Management, serves as distributor to the Fund and receives certain compensation for those services. The Board noted that various financial institutions, including affiliates of Funds Management, may receive distribution-related fees, shareholder servicing payments (including amounts derived from payments under Rule 12b-1 plans) and sub-transfer agency fees in respect of shares sold or held through them and services provided.
The Board also reviewed information about whether and to what extent soft dollar credits are sought and how any such credits are utilized, and any benefits that might be realized by an affiliated broker that handles portfolio transactions for the Fund.
Based on its consideration of the factors and information it deemed relevant, including those described here, the Board did not find that any ancillary benefits received by Funds Management and its affiliates, including the Sub-Adviser, were unreasonable.
Conclusion
After considering the above-described factors and based on its deliberations and its evaluation of the information described above, the Board unanimously approved the continuation of the Advisory Agreements for an additional one-year period.
| | | | |
| 30 | | Wells Fargo Advantage International Equity Fund | | List of abbreviations |
The following is a list of common abbreviations for terms and entities that may have appeared in this report.
| ACA | — ACA Financial Guaranty Corporation |
| ADR | — American depositary receipt |
| ADS | — American depositary shares |
| AGC | — Assured Guaranty Corporation |
| AGM | — Assured Guaranty Municipal |
| Ambac | — Ambac Financial Group Incorporated |
| AMT | — Alternative minimum tax |
| BAN | — Bond anticipation notes |
| BHAC | — Berkshire Hathaway Assurance Corporation |
| CAB | — Capital appreciation bond |
| CCAB | — Convertible capital appreciation bond |
| CDA | — Community Development Authority |
| CDO | — Collateralized debt obligation |
| COP | — Certificate of participation |
| DRIVER | — Derivative inverse tax-exempt receipts |
| DW&P | — Department of Water & Power |
| DWR | — Department of Water Resources |
| ECFA | — Educational & Cultural Facilities Authority |
| EDA | — Economic Development Authority |
| EDFA | — Economic Development Finance Authority |
| ETF | — Exchange-traded fund |
| FDIC | — Federal Deposit Insurance Corporation |
| FFCB | — Federal Farm Credit Banks |
| FGIC | — Financial Guaranty Insurance Corporation |
| FHA | — Federal Housing Administration |
| FHLB | — Federal Home Loan Bank |
| FHLMC | — Federal Home Loan Mortgage Corporation |
| FICO | — The Financing Corporation |
| FNMA | — Federal National Mortgage Association |
| GDR | — Global depositary receipt |
| GNMA | — Government National Mortgage Association |
| HCFR | — Healthcare facilities revenue |
| HEFA | — Health & Educational Facilities Authority |
| HEFAR | — Higher education facilities authority revenue |
| HFA | — Housing Finance Authority |
| HFFA | — Health Facilities Financing Authority |
| HUD | — Department of Housing and Urban Development |
| IDA | — Industrial Development Authority |
| IDAG | — Industrial Development Agency |
| IDR | — Industrial development revenue |
| KRW | — Republic of Korea won |
| LIBOR | — London Interbank Offered Rate |
| LLC | — Limited liability company |
| LLP | — Limited liability partnership |
| MBIA | — Municipal Bond Insurance Association |
| MFHR | — Multifamily housing revenue |
| MSTR | — Municipal securities trust receipts |
| MUD | — Municipal Utility District |
| National | — National Public Finance Guarantee Corporation |
| PCFA | — Pollution Control Financing Authority |
| PCL | — Public Company Limited |
| PCR | — Pollution control revenue |
| PFA | — Public Finance Authority |
| PFFA | — Public Facilities Financing Authority |
| PFOTER | — Puttable floating option tax-exempt receipts |
| plc | — Public limited company |
| PUTTER | — Puttable tax-exempt receipts |
| R&D | — Research & development |
| Radian | — Radian Asset Assurance |
| RAN | — Revenue anticipation notes |
| RDA | — Redevelopment Authority |
| RDFA | — Redevelopment Finance Authority |
| REIT | — Real estate investment trust |
| ROC | — Reset option certificates |
| SAVRS | — Select auction variable rate securities |
| SBA | — Small Business Authority |
| SFHR | — Single-family housing revenue |
| SFMR | — Single-family mortgage revenue |
| SPA | — Standby purchase agreement |
| SPDR | — Standard & Poor’s Depositary Receipts |
| STRIPS | — Separate trading of registered interest and principal securities |
| TAN | — Tax anticipation notes |
| TIPS | — Treasury inflation-protected securities |
| TRAN | — Tax revenue anticipation notes |
| TTFA | — Transportation Trust Fund Authority |
| TVA | — Tennessee Valley Authority |


For more information
More information about Wells Fargo Advantage Funds is available free upon request. To obtain literature, please write, email, visit the Fund’s website, or call:
Wells Fargo Advantage Funds
P.O. Box 8266
Boston, MA 02266-8266
Email: wfaf@wellsfargo.com
Website: wellsfargoadvantagefunds.com
Individual investors: 1-800-222-8222
Retail investment professionals: 1-888-877-9275
Institutional investment professionals: 1-866-765-0778
This report and the financial statements contained herein are submitted for the general information of the shareholders of Wells Fargo Advantage Funds. If this report is used for promotional purposes, distribution of the report must be accompanied or preceded by a current prospectus. For a current prospectus and, if available, a summary prospectus containing more complete information, including charges and expenses, call 1-800-222-8222 or visit the Fund’s website at wellsfargoadvantagefunds.com. Please consider the investment objectives, risks, charges, and expenses of the investment carefully before investing. This and other information about Wells Fargo Advantage Funds can be found in the current prospectus. Read the prospectus carefully before you invest or send money.
Wells Fargo Funds Management, LLC, a wholly owned subsidiary of Wells Fargo & Company, provides investment advisory and administrative services for Wells Fargo Advantage Funds. Other affiliates of Wells Fargo & Company provide subadvisory and other services for the Funds. The Funds are distributed by Wells Fargo Funds Distributor, LLC, Member FINRA/SIPC, an affiliate of Wells Fargo & Company.
NOT FDIC INSURED ¡ NO BANK GUARANTEE ¡ MAY LOSE VALUE
© 2013 Wells Fargo Funds Management, LLC. All rights reserved.
| | |
 | | 216835 06-13 SA240/SAR240 4-13 |

Wells Fargo Advantage
Intrinsic World Equity Fund

Semi-Annual Report
April 30, 2013

Reduce clutter. Save trees.
Sign up for electronic delivery of prospectuses and shareholder reports at wellsfargo.com/advantagedelivery
Contents
The views expressed and any forward-looking statements are as of April 30, 2013, unless otherwise noted, and are those of the Fund managers and/or Wells Fargo Funds Management, LLC. Discussions of individual securities, or the markets generally, or any Wells Fargo Advantage Fund are not intended as individual recommendations. Future events or results may vary significantly from those expressed in any forward-looking statements; the views expressed are subject to change at any time in response to changing circumstances in the market. Wells Fargo Funds Management, LLC, disclaims any obligation to publicly update or revise any views expressed or forward-looking statements.
NOT FDIC INSURED ¡ NO BANK GUARANTEE ¡ MAY LOSE VALUE

Wells Fargo investment history
| | |
| 1932 | | Keystone creates one of the first mutual fund families. |
| 1971 | | Wells Fargo & Company introduces one of the first institutional index funds. |
| 1978 | | Wells Fargo applies Markowitz and Sharpe’s research on Modern Portfolio Theory to introduce one of the industry’s first tactical asset allocation models in institutional separately managed accounts. |
| 1984 | | Wells Fargo Stagecoach Funds launches its first asset allocation fund. |
| 1989 | | The Tactical Asset Allocation (TAA) Model is first applied to Wells Fargo’s asset allocation mutual funds. |
| 1994 | | Wells Fargo introduces the LifePath Funds, one of the first suites of target date funds (now the Wells Fargo Advantage Dow Jones Target Date FundsSM). |
| 1996 | | Evergreen Investments and Keystone Funds merge. |
| 1997 | | Wells Fargo launches the Wells Fargo Advantage WealthBuilder PortfoliosSM, a fund-of-funds suite of products that includes the use of quantitative models to shift assets among investment styles. |
| 1999 | | Norwest Advantage Funds and Stagecoach Funds are reorganized into Wells Fargo Funds after the merger of Norwest and Wells Fargo. |
| 2002 | | Evergreen Retail and Evergreen Institutional companies form the umbrella asset management company, Evergreen Investments. |
| 2005 | | The integration of Strong Funds with Wells Fargo Funds creates Wells Fargo Advantage Funds, resulting in one of the top 20 mutual fund companies in the United States. |
| 2006 | | Wells Fargo Advantage Funds relaunches the target date product line as Wells Fargo Advantage Dow Jones Target Date Funds. |
| 2010 | | The mergers and reorganizations of Evergreen and Wells Fargo Advantage mutual funds are completed, unifying the families under the brand of Wells Fargo Advantage Funds. |
Wells Fargo Advantage Funds®
Wells Fargo Advantage Funds skillfully guides institutions, financial advisors, and individuals through the investment terrain to help them reach their financial objectives. Everything we do on behalf of investors is backed by our unique combination of qualifications.
Strength
Our organization is built on the standards of integrity and service established by our parent company—Wells Fargo & Company—more than 150 years ago. And, because we’re part of a highly diversified financial enterprise, we offer the depth of resources to help investors succeed.
Expertise
Our multi-boutique model offers investors access to the independent thinking of premier investment managers that have been chosen for their time-tested strategies. While each team specializes in a specific investment strategy, collectively they provide investors a wide choice of distinct investment styles. Our dedication to investment excellence doesn’t end with our expertise in manager selection—risk management, analysis, and rigorous ongoing review seek to ensure each manager’s investment process remains consistent.
Partnership
Our collaborative approach is built around understanding the needs and goals of our clients. By adhering to core principles of sound judgment and steady guidance, we support you through every stage of the investment decision process.
Carefully consider the investment objectives, risks, charges, and expenses before investing. For a current prospectus and, if available, a summary prospectus, for Wells Fargo Advantage Funds, containing this and other information, visit wellsfargoadvantagefunds.com. Read it carefully before investing.
Wells Fargo Funds Management, LLC, a wholly owned subsidiary of Wells Fargo & Company, provides investment advisory and administrative services for Wells Fargo Advantage Funds. Other affiliates of Wells Fargo & Company provide subadvisory and other services for the Funds. The Funds are distributed by Wells Fargo Funds Distributor, LLC, Member FINRA/SIPC, an affiliate of Wells Fargo & Company.
“Dow Jones®” and “Dow Jones Target Date IndexesSM” are service marks of Dow Jones Trademark Holdings LLC (“Dow Jones”); have been licensed to CME Group Index Services LLC (“CME Indexes”); and have been sublicensed for use for certain purposes by Global Index Advisors, Inc., and Wells Fargo Funds Management, LLC. The Wells Fargo Advantage Dow Jones Target Date FundsSM, based on the Dow Jones Target Date Indexes, are not sponsored, endorsed, sold, or promoted by Dow Jones, CME Indexes, or their respective affiliates, and none of them makes any representation regarding the advisability of investing in such product(s).
NOT FDIC INSURED ¡ NO BANK GUARANTEE ¡ MAY LOSE VALUE
Not part of the semi-annual report.
Wells Fargo Advantage Funds offers more than 100 mutual funds across a wide range of asset classes, representing over $228 billion in assets under management, as of April 30, 2013.
| | | | |
| Equity funds | | | | |
Asia Pacific Fund | | Enterprise Fund† | | Opportunity Fund† |
C&B Large Cap Value Fund | | Global Opportunities Fund | | Precious Metals Fund |
C&B Mid Cap Value Fund | | Growth Fund | | Premier Large Company Growth Fund |
Capital Growth Fund | | Index Fund | | Small Cap Opportunities Fund |
Common Stock Fund | | International Equity Fund | | Small Cap Value Fund |
Disciplined U.S. Core Fund | | International Value Fund | | Small Company Growth Fund |
Discovery Fund† | | Intrinsic Small Cap Value Fund | | Small Company Value Fund |
Diversified Equity Fund | | Intrinsic Value Fund | | Small/Mid Cap Value Fund |
Diversified International Fund | | Intrinsic World Equity Fund | | Special Mid Cap Value Fund |
Emerging Growth Fund | | Large Cap Core Fund | | Special Small Cap Value Fund |
Emerging Markets Equity Fund | | Large Cap Growth Fund | | Specialized Technology Fund |
Emerging Markets Equity Income Fund | | Large Company Value Fund | | Traditional Small Cap Growth Fund |
Endeavor Select Fund† | | Omega Growth Fund | | Utility and Telecommunications Fund |
| Bond funds | | | | |
Adjustable Rate Government Fund | | High Yield Municipal Bond Fund | | Short Duration Government Bond Fund |
California Limited-Term Tax-Free Fund | | Income Plus Fund | | Short-Term Bond Fund |
California Tax-Free Fund | | Inflation-Protected Bond Fund | | Short-Term High Yield Bond Fund |
Colorado Tax-Free Fund | | Intermediate Tax/AMT-Free Fund | | Short-Term Municipal Bond Fund |
Conservative Income Fund | | International Bond Fund | | Strategic Income Fund |
Core Bond Fund | | Minnesota Tax-Free Fund | | Strategic Municipal Bond Fund |
Emerging Markets Local Bond Fund | | Municipal Bond Fund | | Ultra Short-Term Income Fund |
Government Securities Fund | | North Carolina Tax-Free Fund | | Ultra Short-Term Municipal Income Fund |
High Income Fund | | Pennsylvania Tax-Free Fund | | Wisconsin Tax-Free Fund |
High Yield Bond Fund | | | | |
| Asset allocation funds | | | | |
Absolute Return Fund | | WealthBuilder Equity Portfolio† | | Target 2020 Fund† |
Asset Allocation Fund | | WealthBuilder Growth Allocation Portfolio† | | Target 2025 Fund† |
Diversified Capital Builder Fund | | WealthBuilder Growth Balanced Portfolio† | | Target 2030 Fund† |
Diversified Income Builder Fund | | WealthBuilder Moderate Balanced Portfolio† | | Target 2035 Fund† |
Growth Balanced Fund | | WealthBuilder Tactical Equity Portfolio† | | Target 2040 Fund† |
Index Asset Allocation Fund | | Target Today Fund† | | Target 2045 Fund† |
Moderate Balanced Fund | | Target 2010 Fund† | | Target 2050 Fund† |
WealthBuilder Conservative Allocation Portfolio† | | Target 2015 Fund† | | Target 2055 Fund† |
| Money market funds | | | | |
100% Treasury Money Market Fund | | Heritage Money Market Fund† | | National Tax-Free Money Market Fund |
California Municipal Money Market Fund | | Money Market Fund | | Treasury Plus Money Market Fund |
Cash Investment Money Market Fund | | Municipal Cash Management Money Market Fund | | |
Government Money Market Fund | | Municipal Money Market Fund | | |
| Variable trust funds1 | | | | |
VT Discovery Fund† | | VT Intrinsic Value Fund | | VT Small Cap Growth Fund |
VT Index Asset Allocation Fund | | VT Omega Growth Fund | | VT Small Cap Value Fund |
VT International Equity Fund | | VT Opportunity Fund† | | VT Total Return Bond Fund |
An investment in a money market fund is not insured or guaranteed by the Federal Deposit Insurance Corporation or any other government agency. Although the Wells Fargo Advantage Money Market Funds seek to preserve the value of your investment at $1.00 per share, it is possible to lose money by investing in a money market fund.
| 1. | The variable trust funds are generally available only through insurance company variable contracts. |
| † | In this report, the Wells Fargo Advantage Discovery FundSM, Wells Fargo Advantage Endeavor Select FundSM, Wells Fargo Advantage Enterprise FundSM, Wells Fargo Advantage Opportunity FundSM, Wells Fargo Advantage WealthBuilder Conservative Allocation PortfolioSM, Wells Fargo Advantage WealthBuilder Equity PortfolioSM, Wells Fargo Advantage WealthBuilder Growth Allocation PortfolioSM, Wells Fargo Advantage WealthBuilder Growth Balanced PortfolioSM, Wells Fargo Advantage WealthBuilder Moderate Balanced PortfolioSM, Wells Fargo Advantage WealthBuilder Tactical Equity PortfolioSM, Wells Fargo Advantage Dow Jones Target Today FundSM, Wells Fargo Advantage Dow Jones Target 2010 FundSM, Wells Fargo Advantage Dow Jones Target 2015 FundSM, Wells Fargo Advantage Dow Jones Target 2020 FundSM, Wells Fargo Advantage Dow Jones Target 2025 FundSM, Wells Fargo Advantage Dow Jones Target 2030 FundSM, Wells Fargo Advantage Dow Jones Target 2035 FundSM, Wells Fargo Advantage Dow Jones Target 2040 FundSM, Wells Fargo Advantage Dow Jones Target 2045 FundSM, Wells Fargo Advantage Dow Jones Target 2050 FundSM, Wells Fargo Advantage Dow Jones Target 2055 FundSM, Wells Fargo Advantage Heritage Money Market FundSM, Wells Fargo Advantage VT Discovery FundSM, and Wells Fargo Advantage VT Opportunity FundSM are referred to as the Discovery Fund, Endeavor Select Fund, Enterprise Fund, Opportunity Fund, WealthBuilder Conservative Allocation Portfolio, WealthBuilder Equity Portfolio, WealthBuilder Growth Allocation Portfolio, WealthBuilder Growth Balanced Portfolio, WealthBuilder Moderate Balanced Portfolio, WealthBuilder Tactical Equity Portfolio, Target Today Fund, Target 2010 Fund, Target 2015 Fund, Target 2020 Fund, Target 2025 Fund, Target 2030 Fund, Target 2035 Fund, Target 2040 Fund, Target 2045 Fund, Target 2050 Fund, Target 2055 Fund, Heritage Money Market Fund, VT Discovery Fund, and VT Opportunity Fund, respectively. |
Not part of the semi-annual report.
| | | | |
| 2 | | Wells Fargo Advantage Intrinsic World Equity Fund | | Letter to shareholders (unaudited) |

Karla M. Rabusch
President
Wells Fargo Advantage Funds
Investors were heartened by the resilient performance of the German economy and by the fact that the United Kingdom managed to avoid another recession.
Dear Valued Shareholder:
We are pleased to offer you this semi-annual report for the Wells Fargo Advantage Intrinsic World Equity Fund for the six-month period that ended April 30, 2013. Much of the period was marked by diminished worries of a sovereign debt default in Europe, partially offset by concerns about slowing economic growth in China. Continued monetary easing by global central banks helped support rallies in developed stock markets, but major emerging markets lagged.
Developed markets posted double-digit returns, but major emerging markets lagged.
Global developed equity markets demonstrated continued strength throughout the reporting period despite a budget fight and sequestration cuts in the U.S. and Europe’s seemingly never-ending debt crisis, with Cyprus becoming the newest addition to a list of countries mired in debt. Investors were heartened by the resilient performance of the German economy and by the fact that the United Kingdom managed to avoid another recession. Relatively positive economic data from the U.S. also aided sentiment for developed-market stocks. Although reported U.S. gross domestic product (GDP) growth came in at a moderate 0.4% annualized rate in the fourth quarter of 2012—in part, due to the temporary aftereffects from Hurricane Sandy, which devastated the Eastern Seaboard in October 2012—GDP growth improved to a 2.4% annualized rate for the first quarter of 2013. Monetary easing by major central banks also supported equity markets.
As judged by various MSCI indexes, major emerging markets generally underperformed. Despite China’s smooth transition to a new generation of political leadership, the country’s decelerating growth rate caused its stock market to lag not only developed markets but also the main MSCI Emerging Markets Index (Net)1. Given China’s importance as a buyer of raw commodities from countries such as Brazil, as well as its key role in Asia’s manufacturing chain, fears of a recession in China led to single-digit returns for other emerging markets.
Central banks continued to provide stimulus.
Major central banks, including the U.S. Federal Reserve Board (Fed) and the European Central Bank (ECB), continued to inject liquidity into the banks and the market through various quantitative easing policies. Throughout the reporting period, the Federal Open Market Committee (FOMC) kept its key interest rates effectively at zero in order to support the economy and the financial system. After its September 2012 meeting, the FOMC announced its intention to keep interest rates low until at least mid-2015 and to make open-ended purchases of $40 billion per month in mortgage-backed securities to support the housing market.
After cutting its key rate to 0.75% in July 2012, the ECB announced in September 2012 that it would purchase an unlimited amount of one- to three-year sovereign debt from countries that had formally applied for a bailout. In May 2013, after the end of the reporting period, the ECB cut its key rate to a historic low of 0.50%. The ECB’s aggressive actions helped ease investor worries about a eurozone sovereign debt default. Moreover, in mid-March 2013, the governor of the Bank of Japan resigned to allow Shinzo Abe, the recently reelected prime minister, to appoint a new bank governor who supported using aggressive monetary policies to attack Japan’s persistent deflation.
| 1. | The Morgan Stanley Capital International Emerging Markets (MSCI Emerging Markets) Index (Net) is a free float-adjusted market capitalization index designed to measure the equity market performance in the global emerging markets. The index is currently composed of 21 emerging markets country indexes. You cannot invest directly in an index. Source: MSCI. MSCI makes no express or implied warranties or representations and shall have no liability whatsoever with respect to any MSCI data contained herein. The MSCI data may not be further redistributed or used as a basis for other indexes or any securities or financial products. This report is not approved, reviewed, or produced by MSCI. |
| | | | | | |
| Letter to shareholders (unaudited) | | Wells Fargo Advantage Intrinsic World Equity Fund | | | 3 | |
The debt crisis in the eurozone returned to center stage but with less impact than before.
Ongoing weakness in the Greek economy made it difficult for the country to meet previously agreed upon austerity targets. Because many eurozone banks owned Greek debt and many U.S. banks had financial ties to eurozone banks, investors initially worried that a Greek default would result in another global financial crisis. However, as central banks continued to provide liquidity, investor worries about the effect of a European sovereign debt default on the global economy began to ease. When the tiny eurozone nation of Cyprus was forced to implement capital controls and impose losses on uninsured bank depositors in March 2013, global stock markets remained resilient despite short-term volatility.
Global monetary easing helped push the MSCI EAFE Index (Net)2, an index of developed stock markets, to a 16.90% return for the six-month period. By comparison, the S&P 500 Index3, a barometer of large-cap U.S. stocks, posted a 14.42% return for the reporting period. Within emerging markets, smaller markets, such as the Philippines and Thailand, strongly outperformed the larger markets, such as China, India, and Brazil. The smaller markets are benefiting from high growth rates without some of the imbalances—such as an overreliance on real estate—that are affecting the larger emerging markets.
We employ a diverse array of investment strategies, even as many variables are at work in the market.
The full effect of the European credit crisis remains unknown. Elevated unemployment in the U.S. and Southern Europe continues to pressure consumers and businesses alike. As a whole, Wells Fargo Advantage Funds represents investments across a range of asset classes and investment styles, giving you an opportunity to create a diversified investment portfolio. While diversification4 may not prevent losses in a downturn, we believe it helps manage risk.
Thank you for choosing to invest with Wells Fargo Advantage Funds. We appreciate your confidence in us and remain committed to helping you meet your financial needs. For current information about your fund investments, contact your investment professional, visit our website at wellsfargoadvantagefunds.com, or call us directly at 1-800-222-8222. We are available 24 hours a day, 7 days a week.
Sincerely,

Karla M. Rabusch
President
Wells Fargo Advantage Funds
Within emerging markets, smaller markets, such as the Philippines and Thailand, strongly outperformed the larger markets, such as China, India, and Brazil.
| 2. | The Morgan Stanley Capital International Europe, Australasia, and Far East (MSCI EAFE) Index (Net) is an unmanaged group of securities widely regarded by investors to be representations of the stock markets of Europe, Australasia, and the Far East. You cannot invest directly in an index. |
| 3. | The S&P 500 Index consists of 500 stocks chosen for market size, liquidity, and industry group representation. It is a market-value-weighted index with each stock’s weight in the index proportionate to its market value. You cannot invest directly in an index. |
| 4. | Diversification does not assure or guarantee better performance and cannot eliminate the risk of investment losses. |
| | | | |
| 4 | | Wells Fargo Advantage Intrinsic World Equity Fund | | Performance highlights (unaudited) |
Investment objective
The Fund seeks long-term capital appreciation.
Adviser
Wells Fargo Funds Management, LLC
Subadviser
Metropolitan West Capital Management, LLC
Portfolio managers
Jean-Baptiste Nadal, CFA
Jeffrey Peck
Average annual total returns1 (%) as of April 30, 2013
| | | | | | | | | | | | | | | | | | | | | | | | | | | | | | | | | | |
| | | | | Including sales charge | | | Excluding sales charge | | | Expense ratios2 (%) | |
| | | Inception date | | 1 year | | | 5 year | | | 10 year | | | 1 year | | | 5 year | | | 10 year | | | Gross | | | Net3 | |
| Class A (EWEAX) | | 4-30-1996 | | | 8.61 | | | | 2.75 | | | | 9.90 | | | | 15.26 | | | | 3.97 | | | | 10.56 | | | | 1.52 | | | | 1.41 | |
| Class C (EWECX) | | 5-18-2007 | | | 13.36 | | | | 3.20 | | | | 9.74 | | | | 14.36 | | | | 3.20 | | | | 9.74 | | | | 2.27 | | | | 2.16 | |
| Administrator Class (EWEIX) | | 5-18-2007 | | | – | | | | – | | | | – | | | | 15.59 | | | | 4.22 | | | | 10.71 | | | | 1.36 | | | | 1.16 | |
| Institutional Class (EWENX) | | 7-30-2010 | | | – | | | | – | | | | – | | | | 15.79 | | | | 4.33 | | | | 10.77 | | | | 1.09 | | | | 0.96 | |
| MSCI World Index (Net)4 | | – | | | – | | | | – | | | | – | | | | 16.70 | | | | 1.81 | | | | 8.29 | | | | – | | | | – | |
Figures quoted represent past performance, which is no guarantee of future results and do not reflect the deduction of taxes that a shareholder may pay on fund distributions or the redemption of fund shares. Investment return and principal value of an investment will fluctuate so that an investor’s shares, when redeemed, may be worth more or less than their original cost. Performance shown without sales charges would be lower if sales charges were reflected. Current performance may be lower or higher than the performance data quoted, which assumes the reinvestment of dividends and capital gains. Current month-end performance is available on the Fund’s website, wellsfargoadvantagefunds.com.
Index returns do not include transaction costs associated with buying and selling securities, any mutual fund fees or expenses, or any taxes. It is not possible to invest directly in an index.
For Class A shares, the maximum front-end sales charge is 5.75%. For Class C shares, the maximum contingent deferred sales charge is 1.00%. Performance including sales charge assumes the sales charge for the corresponding time period. Administrator Class and Institutional Class shares are sold without a front-end sales charge or contingent deferred sales charge.
Stock values fluctuate in response to the activities of individual companies and general market and economic conditions. Foreign investments are especially volatile and can rise or fall dramatically due to differences in the political and economic conditions of the host country. These risks are generally intensified in emerging markets. The use of derivatives may reduce returns and/or increase volatility. Certain investment strategies tend to increase the total risk of an investment (relative to the broader market). The Fund is exposed to smaller-company securities risk. Consult the Fund’s prospectus for additional information on these and other risks.
Please see footnotes on page 5.
| | | | | | |
| Performance highlights (unaudited) | | Wells Fargo Advantage Intrinsic World Equity Fund | | | 5 | |
| | | | |
| Ten largest equity holdings5 (%) as of April 30, 2013 | |
Samsung Electronics Company Limited | | | 2.98 | |
Oracle Corporation | | | 2.92 | |
Unilever NV | | | 2.76 | |
European Aeronautic Defence & Space Company NV | | | 2.75 | |
Franklin Resources Incorporated | | | 2.57 | |
Visa Incorporated Class A | | | 2.53 | |
JPMorgan Chase & Company | | | 2.52 | |
Baxter International Incorporated | | | 2.41 | |
Adidas-Salomon AG | | | 2.40 | |
DBS Group Holdings Limited | | | 2.37 | |
| | |
| Sector distribution6 as of April 30, 2013 |
|
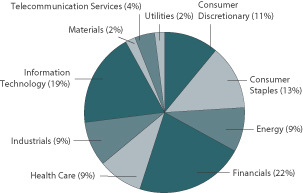
|
| 1. | Historical performance shown for Class C shares prior to their inception reflects the performance of Class A shares, adjusted to reflect the higher expenses applicable to Class C shares. Historical performance shown for the Institutional Class shares prior to their inception reflects the performance of the Administrator Class shares, and includes the higher expenses applicable to the Administrator Class shares. If these expenses had not been included, returns would be higher. Historical performance shown for the Administrator Class shares prior to their inception reflects the performance of Class A shares, and includes the higher expenses applicable to Class A shares. If these expenses had not been included, returns would be higher. Historical performance shown for all classes of the Fund prior to July 19, 2010, is based on the performance of the Fund’s predecessor, Evergreen Intrinsic World Equity Fund. |
| 2. | Reflects the expense ratios as stated in the most recent prospectuses. |
| 3. | The Adviser has committed through February 28, 2014, to waive fees and/or reimburse expenses to the extent necessary to cap the Fund’s Total Annual Fund Operating Expenses After Fee Waiver, excluding certain expenses, at 1.40% for Class A, 2.15% for Class C, 1.15% for Administrator Class, and 0.95% for Institutional Class. Brokerage commissions, stamp duty fees, interest, taxes, acquired fund fees and expenses, and extraordinary expenses are excluded from the cap. Without this cap, the Fund’s returns would have been lower. |
| 4. | The Morgan Stanley Capital International World Index (Net) (MSCI World Index (Net)) is a free float-adjusted market capitalization weighted index that is designed to measure the equity market performance of developed markets. You cannot invest directly in an index. Source: MSCI. MSCI makes no express or implied warranties or representations and shall have no liability whatsoever with respect to any MSCI data contained herein. The MSCI data may not be further redistributed or used as a basis for other indexes or any securities or financial products. This report is not approved, reviewed, or produced by MSCI. |
| 5. | The ten largest equity holdings are calculated based on the value of the securities divided by total net assets of the Fund. Holdings are subject to change and may have changed since the date specified. Top holdings typically include the underlying ordinary shares combined with any depositary receipts. |
| 6. | Sector distribution is subject to change and is calculated based on the total long-term investments of the Fund. |
| | | | |
| 6 | | Wells Fargo Advantage Intrinsic World Equity Fund | | Fund expenses (unaudited) |
As a shareholder of the Fund, you incur two types of costs: (1) transaction costs, including sales charges (loads) on purchase payments and contingent deferred sales charges (if any) on redemptions and (2) ongoing costs, including management fees, distribution (12b-1) and/or shareholder service fees, and other Fund expenses. This example is intended to help you understand your ongoing costs (in dollars) of investing in the Fund and to compare these costs with the ongoing costs of investing in other mutual funds.
The example is based on an investment of $1,000 invested at the beginning of the six-month period and held for the entire period from November 1, 2012 to April 30, 2013.
Actual expenses
The “Actual” line of the table below provides information about actual account values and actual expenses. You may use the information in this line, together with the amount you invested, to estimate the expenses that you paid over the period. Simply divide your account value by $1,000 (for example, an $8,600 account value divided by $1,000 = 8.6), then multiply the result by the number in the “Actual” line under the heading entitled “Expenses paid during period” for your applicable class of shares to estimate the expenses you paid on your account during this period.
Hypothetical example for comparison purposes
The “Hypothetical” line of the table below provides information about hypothetical account values and hypothetical expenses based on the Fund’s actual expense ratio and an assumed rate of return of 5% per year before expenses, which is not the Fund’s actual return. The hypothetical account values and expenses may not be used to estimate the actual ending account balance or expenses you paid for the period. You may use this information to compare the ongoing costs of investing in the Fund and other funds. To do so, compare this 5% hypothetical example with the 5% hypothetical examples that appear in the shareholder reports of the other funds.
Please note that the expenses shown in the table are meant to highlight your ongoing costs only and do not reflect any transactional costs, such as sales charges (loads) and contingent deferred sales charges. Therefore, the “Hypothetical” line of the table is useful in comparing ongoing costs only and will not help you determine the relative total costs of owning different funds. In addition, if these transactional costs were included, your costs would have been higher.
| | | | | | | | | | | | | | | | |
| | | Beginning
account value
11-1-2012 | | | Ending
account value
4-30-2013 | | | Expenses
paid during
the period¹ | | | Net annual
expense ratio | |
Class A | | | | | | | | | | | | | | | | |
Actual | | $ | 1,000.00 | | | $ | 1,142.96 | | | $ | 7.44 | | | | 1.40 | % |
Hypothetical (5% return before expenses) | | $ | 1,000.00 | | | $ | 1,017.85 | | | $ | 7.00 | | | | 1.40 | % |
Class C | | | | | | | | | | | | | | | | |
Actual | | $ | 1,000.00 | | | $ | 1,138.38 | | | $ | 11.40 | | | | 2.15 | % |
Hypothetical (5% return before expenses) | | $ | 1,000.00 | | | $ | 1,014.13 | | | $ | 10.74 | | | | 2.15 | % |
Administrator Class | | | | | | | | | | | | | | | | |
Actual | | $ | 1,000.00 | | | $ | 1,144.24 | | | $ | 6.11 | | | | 1.15 | % |
Hypothetical (5% return before expenses) | | $ | 1,000.00 | | | $ | 1,019.09 | | | $ | 5.76 | | | | 1.15 | % |
Institutional Class | | | | | | | | | | | | | | | | |
Actual | | $ | 1,000.00 | | | $ | 1,145.61 | | | $ | 5.05 | | | | 0.95 | % |
Hypothetical (5% return before expenses) | | $ | 1,000.00 | | | $ | 1,020.08 | | | $ | 4.76 | | | | 0.95 | % |
| 1. | Expenses paid is equal to the annualized expense ratio of each class multiplied by the average account value over the period, multiplied by the number of days in the most recent fiscal half-year divided by the number of days in the fiscal year (to reflect the one-half-year period). |
| | | | | | |
| Portfolio of investments—April 30, 2013 (unaudited) | | Wells Fargo Advantage Intrinsic World Equity Fund | | | 7 | |
| | | | | | | | | | | | |
| Security name | | | | | | Shares | | | Value | |
| | | | | | | | | | | | |
| | | | |
Common Stocks: 97.36% | | | | | | | | | | | | |
| | | | |
| Chile: 1.85% | | | | | | | | | | | | |
Enersis SA ADR (Utilities, Electric Utilities) | | | | | | | 174,600 | | | $ | 3,296,448 | |
| | | | | | | | | | | | |
| | | | |
| France: 5.52% | | | | | | | | | | | | |
L’Oreal SA (Consumer Staples, Personal Products) | | | | | | | 20,500 | | | | 3,655,459 | |
Total SA (Energy, Oil, Gas & Consumable Fuels) | | | | | | | 51,880 | | | | 2,614,736 | |
Total SA ADR (Energy, Oil, Gas & Consumable Fuels) | | | | | | | 11,300 | | | | 567,712 | |
Vivendi SA (Telecommunication Services, Wireless Telecommunication Services) | | | | | | | 132,500 | | | | 3,001,330 | |
| | | | |
| | | | | | | | | | | 9,839,237 | |
| | | | | | | | | | | | |
| | | | |
| Germany: 2.40% | | | | | | | | | | | | |
Adidas-Salomon AG (Consumer Discretionary, Textiles, Apparel & Luxury Goods) « | | | | | | | 41,000 | | | | 4,281,801 | |
| | | | | | | | | | | | |
| | | | |
| Israel: 1.78% | | | | | | | | | | | | |
Teva Pharmaceutical Industries Limited ADR (Health Care, Pharmaceuticals) | | | | | | | 83,000 | | | | 3,178,070 | |
| | | | | | | | | | | | |
| | | | |
| Japan: 7.90% | | | | | | | | | | | | |
Kao Corporation (Consumer Staples, Personal Products) | | | | | | | 85,800 | | | | 2,966,056 | |
Kao Corporation ADR (Consumer Staples, Personal Products) | | | | | | | 15,500 | | | | 536,238 | |
Komatsu Limited (Industrials, Machinery) | | | | | | | 123,000 | | | | 3,354,947 | |
Komatsu Limited ADR (Industrials, Machinery) « | | | | | | | 13,500 | | | | 368,510 | |
ORIX Corporation (Financials, Consumer Finance) | | | | | | | 149,000 | | | | 2,286,547 | |
ORIX Corporation ADR (Financials, Consumer Finance) « | | | | | | | 14,500 | | | | 1,116,500 | |
TOTO Limited (Industrials, Building Products) | | | | | | | 333,000 | | | | 3,450,069 | |
| | | | |
| | | | | | | | | | | 14,078,867 | |
| | | | | | | | | | | | |
| | | | |
| Luxembourg: 1.83% | | | | | | | | | | | | |
Millicom International Cellular SA (Telecommunication Services, Wireless Telecommunication Services) | | | | | | | 39,930 | | | | 3,265,351 | |
| | | | | | | | | | | | |
| | | | |
| Netherlands: 7.41% | | | | | | | | | | | | |
European Aeronautic Defence & Space Company NV (Industrials, Aerospace & Defense) | | | | | | | 92,695 | | | | 4,895,807 | |
Heineken NV (Consumer Staples, Beverages) « | | | | | | | 48,000 | | | | 3,389,514 | |
Unilever NV (Consumer Staples, Food Products) | | | | | | | 116,000 | | | | 4,927,680 | |
| | | | |
| | | | | | | | | | | 13,213,001 | |
| | | | | | | | | | | | |
| | | | |
| Singapore: 2.37% | | | | | | | | | | | | |
DBS Group Holdings Limited (Financials, Commercial Banks) | | | | | | | 310,282 | | | | 4,222,072 | |
| | | | | | | | | | | | |
| | | | |
| South Korea: 2.98% | | | | | | | | | | | | |
Samsung Electronics Company Limited (Information Technology, Semiconductors & Semiconductor Equipment) | | | | | | | 3,850 | | | | 5,313,720 | |
| | | | | | | | | | | | |
| | | | |
| Spain: 1.68% | | | | | | | | | | | | |
Banco Santander Central Hispano SA ADR (Financials, Commercial Banks) « | | | | | | | 412,064 | | | | 2,987,464 | |
| | | | | | | | | | | | |
| | | | |
| Switzerland: 5.75% | | | | | | | | | | | | |
Novartis AG ADR (Health Care, Pharmaceuticals) | | | | | | | 51,300 | | | | 3,783,888 | |
Transocean Limited (Energy, Energy Equipment & Services) † | | | | | | | 57,000 | | | | 2,933,790 | |
UBS AG (Financials, Diversified Financial Services) | | | | | | | 198,000 | | | | 3,534,954 | |
| | | | |
| | | | | | | | | | | 10,252,632 | |
| | | | | | | | | | | | |
The accompanying notes are an integral part of these financial statements.
| | | | |
| 8 | | Wells Fargo Advantage Intrinsic World Equity Fund | | Portfolio of investments—April 30, 2013 (unaudited) |
| | | | | | | | | | | | | | |
| Security name | | | | | | | Shares | | | Value | |
| | | | |
| United Kingdom: 6.13% | | | | | | | | | | | | | | |
Diageo plc (Consumer Staples, Beverages) | | | | | | | | | 86,764 | | | $ | 2,646,978 | |
HSBC Holdings plc ADR (Financials, Commercial Banks) « | | | | | | | | | 38,734 | | | | 2,124,947 | |
Royal Dutch Shell plc Class A (Energy, Oil, Gas & Consumable Fuels) | | | | | | | | | 78,620 | | | | 2,674,921 | |
Standard Chartered plc (Financials, Commercial Banks) | | | | | | | | | 138,248 | | | | 3,472,467 | |
| | | | |
| | | | | | | | | | | | | 10,919,313 | |
| | | | | | | | | | | | | | |
| | | | |
| United States: 49.76% | | | | | | | | | | | | | | |
Abbott Laboratories (Health Care, Health Care Equipment & Supplies) | | | | | | | | | 101,000 | | | | 3,728,920 | |
Air Products & Chemicals Incorporated (Materials, Chemicals) | | | | | | | | | 37,580 | | | | 3,267,957 | |
Apple Incorporated (Information Technology, Computers & Peripherals) | | | | | | | | | 8,300 | | | | 3,674,825 | |
Autoliv Incorporated GDR (Consumer Discretionary, Auto Components) | | | | | | | | | 51,350 | | | | 3,912,426 | |
Baxter International Incorporated (Health Care, Health Care Equipment & Supplies) | | | | | | | | | 61,500 | | | | 4,297,005 | |
Charles Schwab Corporation (Financials, Capital Markets) « | | | | | | | | | 228,500 | | | | 3,875,360 | |
eBay Incorporated (Information Technology, Internet Software & Services) † | | | | | | | | | 67,000 | | | | 3,510,130 | |
EMC Corporation (Information Technology, Computers & Peripherals) † | | | | | | | | | 186,500 | | | | 4,183,195 | |
Franklin Resources Incorporated (Financials, Capital Markets) | | | | | | | | | 29,600 | | | | 4,577,936 | |
Home Depot Incorporated (Consumer Discretionary, Specialty Retail) | | | | | | | | | 52,000 | | | | 3,814,200 | |
JPMorgan Chase & Company (Financials, Diversified Financial Services) | | | | | | | | | 91,500 | | | | 4,484,415 | |
NVR Incorporated (Consumer Discretionary, Household Durables) † | | | | | | | | | 3,400 | | | | 3,502,000 | |
Occidental Petroleum Corporation (Energy, Oil, Gas & Consumable Fuels) | | | | | | | | | 41,000 | | | | 3,659,660 | |
Oracle Corporation (Information Technology, Software) | | | | | | | | | 159,000 | | | | 5,212,020 | |
PepsiCo Incorporated (Consumer Staples, Beverages) | | | | | | | | | 46,500 | | | | 3,834,855 | |
QUALCOMM Incorporated (Information Technology, Communications Equipment) | | | | | | | | | 48,500 | | | | 2,988,570 | |
Schlumberger Limited (Energy, Energy Equipment & Services) | | | | | | | | | 50,000 | | | | 3,721,500 | |
SunTrust Banks Incorporated (Financials, Commercial Banks) | | | | | | | | | 67,000 | | | | 1,959,750 | |
Texas Instruments Incorporated (Information Technology, Semiconductors & Semiconductor Equipment) | | | | | | | | | 109,500 | | | | 3,964,995 | |
United Parcel Service Incorporated Class B (Industrials, Air Freight & Logistics) | | | | | | | | | 44,000 | | | | 3,776,960 | |
Visa Incorporated Class A (Information Technology, IT Services) | | | | | | | | | 26,767 | | | | 4,509,169 | |
Walt Disney Company (Consumer Discretionary, Media) | | | | | | | | | 65,500 | | | | 4,116,020 | |
Zions Bancorporation (Financials, Commercial Banks) « | | | | | | | | | 167,000 | | | | 4,111,540 | |
| | | | |
| | | | | | | | | | | | | 88,683,408 | |
| | | | | | | | | | | | | | |
| | | | |
Total Common Stocks (Cost $132,739,351) | | | | | | | | | | | | | 173,531,384 | |
| | | | | | | | | | | | | | |
| | | | |
| | | Yield | | | | | | | | | |
| Short-Term Investments: 11.47% | | | | | | | | | | | | | | |
| | | | |
| Investment Companies: 11.47% | | | | | | | | | | | | | | |
Wells Fargo Advantage Cash Investment Money Market Fund, Select Class (l)(u) | | | 0.13 | % | | | | | 4,444,416 | | | | 4,444,416 | |
Wells Fargo Securities Lending Cash Investments, LLC (l)(u)(r)(v) | | | 0.18 | | | | | | 16,007,849 | | | | 16,007,849 | |
| | | | | | | | | | | | | | |
| | | | |
Total Short-Term Investments (Cost $20,452,265) | | | | | | | | | | | | | 20,452,265 | |
| | | | | | | | | | | | | | |
| | | | | | | | | | |
| Total investments in securities | | | | | | | | | | |
| (Cost $153,191,616)* | | | 108.83 | % | | | | | 193,983,649 | |
Other assets and liabilities, net | | | (8.83 | ) | | | | | (15,736,661 | ) |
| | | | | | | | | | |
| Total net assets | | | 100.00 | % | | | | $ | 178,246,988 | |
| | | | | | | | | | |
The accompanying notes are an integral part of these financial statements.
| | | | | | |
| Portfolio of investments—April 30, 2013 (unaudited) | | Wells Fargo Advantage Intrinsic World Equity Fund | | | 9 | |
| † | Non-income-earning security |
| « | All or a portion of this security is on loan. |
| (l) | Investment in an affiliate |
| (u) | Rate shown is the 7-day annualized yield at period end. |
| (v) | Security represents investment of cash collateral received from securities on loan. |
| (r) | The investment company is exempt from registration under Section 3(c)(7) of the Investment Company Act of 1940, as amended. |
| * | Cost for federal income tax purposes is $153,624,067 and unrealized appreciation (depreciation) consists of: |
| | | | |
Gross unrealized appreciation | | $ | 43,907,288 | |
Gross unrealized depreciation | | | (3,547,706 | ) |
| | | | |
Net unrealized appreciation | | $ | 40,359,582 | |
| | | | |
| 10 | | Wells Fargo Advantage Intrinsic World Equity Fund | | Statement of assets and liabilities—April 30, 2013 (unaudited) |
| | | | |
| | | | |
| |
Assets | | | | |
Investments | | | | |
In unaffiliated securities (including securities on loan), at value (see cost below) | | $ | 173,531,384 | |
In affiliated securities, at value (see cost below) | | | 20,452,265 | |
| | | | |
Total investments, at value (see cost below) | | | 193,983,649 | |
Foreign currency, at value (see cost below) | | | 20,537 | |
Receivable for Fund shares sold | | | 122,286 | |
Receivable for dividends | | | 443,905 | |
Receivable for securities lending income | | | 3,877 | |
Prepaid expenses and other assets | | | 42,761 | |
| | | | |
Total assets | | | 194,617,015 | |
| | | | |
| |
Liabilities | | | | |
Payable for Fund shares redeemed | | | 130,077 | |
Payable upon receipt of securities loaned | | | 16,007,849 | |
Advisory fee payable | | | 101,487 | |
Distribution fees payable | | | 5,770 | |
Due to other related parties | | | 43,419 | |
Accrued expenses and other liabilities | | | 81,425 | |
| | | | |
Total liabilities | | | 16,370,027 | |
| | | | |
Total net assets | | $ | 178,246,988 | |
| | | | |
| |
NET ASSETS CONSIST OF | | | | |
Paid-in capital | | $ | 151,622,436 | |
Undistributed net investment income | | | 352,868 | |
Accumulated net realized losses on investments | | | (14,538,212 | ) |
Net unrealized gains on investments | | | 40,809,896 | |
| | | | |
Total net assets | | $ | 178,246,988 | |
| | | | |
| |
COMPUTATION OF NET ASSET VALUE AND OFFERING PRICE PER SHARE1 | | | | |
Net assets – Class A | | $ | 161,780,389 | |
Shares outstanding – Class A | | | 8,004,563 | |
Net asset value per share – Class A | | | $20.21 | |
Maximum offering price per share – Class A2 | | | $21.44 | |
Net assets – Class C | | $ | 9,578,179 | |
Shares outstanding – Class C | | | 487,647 | |
Net asset value per share – Class C | | | $19.64 | |
Net assets – Administrator Class | | $ | 5,321,569 | |
Shares outstanding – Administrator Class | | | 264,501 | |
Net asset value per share – Administrator Class | | | $20.12 | |
Net assets – Institutional Class | | $ | 1,566,851 | |
Shares outstanding – Institutional Class | | | 77,738 | |
Net asset value per share – Institutional Class | | | $20.16 | |
| |
Investments in unaffiliated securities (including securities on loan), at cost | | $ | 132,739,351 | |
| | | | |
Investments in affiliated securities, at cost | | $ | 20,452,265 | |
| | | | |
Total investments, at cost | | $ | 153,191,616 | |
| | | | |
Securities on loan, at value | | $ | 15,520,724 | |
| | | | |
Foreign currency, at cost | | $ | 20,030 | |
| | | | |
| 1. | The Fund has an unlimited number of authorized shares. |
| 2. | Maximum offering price is computed as 100/94.25 of net asset value. On investments of $50,000 or more, the offering price is reduced. |
The accompanying notes are an integral part of these financial statements.
| | | | | | |
| Statement of operations— six months ended April 30, 2013 (unaudited) | | Wells Fargo Advantage Intrinsic World Equity Fund | | | 11 | |
| | | | |
| | | | |
| |
Investment income | | | | |
Dividends * | | $ | 1,812,023 | |
Securities lending income, net | | | 30,593 | |
Income from affiliated securities | | | 2,260 | |
| | | | |
Total investment income | | | 1,844,876 | |
| | | | |
| |
Expenses | | | | |
Advisory fee | | | 663,504 | |
Administration fees | | | | |
Fund level | | | 41,469 | |
Class A | | | 198,486 | |
Class C | | | 10,825 | |
Administrator Class | | | 1,838 | |
Institutional Class | | | 476 | |
Shareholder servicing fees | | | | |
Class A | | | 190,853 | |
Class C | | | 10,409 | |
Administrator Class | | | 4,077 | |
Distribution fees | | | | |
Class C | | | 31,227 | |
Custody and accounting fees | | | 15,244 | |
Professional fees | | | 19,398 | |
Registration fees | | | 28,527 | |
Shareholder report expenses | | | 27,878 | |
Trustees’ fees and expenses | | | 6,502 | |
Other fees and expenses | | | 4,823 | |
| | | | |
Total expenses | | | 1,255,536 | |
Less: Fee waivers and/or expense reimbursements | | | (70,451 | ) |
| | | | |
Net expenses | | | 1,185,085 | |
| | | | |
Net investment income | | | 659,791 | |
| | | | |
| |
REALIZED AND UNREALIZED GAINS (LOSSES) ON INVESTMENTS | | | | |
Net realized gains on investments | | | 3,427,304 | |
Net change in unrealized gains (losses) on investments | | | 18,146,313 | |
| | | | |
Net realized and unrealized gains (losses) on investments | | | 21,573,617 | |
| | | | |
Net increase in net assets resulting from operations | | $ | 22,233,408 | |
| | | | |
| |
* Net of foreign dividend withholding taxes in the amount of | | | $98,227 | |
The accompanying notes are an integral part of these financial statements.
| | | | |
| 12 | | Wells Fargo Advantage Intrinsic World Equity Fund | | Statement of changes in net assets |
| | | | | | | | | | | | | | | | |
| | | | | | Six months ended
April 30, 2013
(unaudited) | | | | | | Year ended
October 31, 2012 | |
| | | | |
Operations | | | | | | | | | | | | | | | | |
Net investment income | | | | | | $ | 659,791 | | | | | | | $ | 1,349,462 | |
Net realized gains (losses) on investments | | | | | | | 3,427,304 | | | | | | | | (378,736 | ) |
Net change in unrealized gains (losses) on investments | | | | | | | 18,146,313 | | | | | | | | 17,725,103 | |
| | | | | | | | | | | | | | | | |
Net increase in net assets resulting from operations | | | | | | | 22,233,408 | | | | | | | | 18,695,829 | |
| | | | | | | | | | | | | | | | |
| | | | |
Distributions to shareholders from | | | | | | | | | | | | | | | | |
Net investment income | | | | | | | | | | | | | | | | |
Class A | | | | | | | (2,139,717 | ) | | | | | | | (981,690 | ) |
Class C | | | | | | | (49,898 | ) | | | | | | | (39,737 | ) |
Administrator Class | | | | | | | (41,171 | ) | | | | | | | (19,766 | ) |
Institutional Class | | | | | | | (18,116 | ) | | | | | | | (6,171 | ) |
| | | | | | | | | | | | | | | | |
Total distributions to shareholders | | | | | | | (2,248,902 | ) | | | | | | | (1,047,364 | ) |
| | | | | | | | | | | | | | | | |
| | | | |
| | | Shares | | | | | | Shares | | | | |
| | | | |
Capital share transactions | | | | | | | | | | | | | | | | |
Proceeds from shares sold | | | | | | | | | | | | | | | | |
Class A | | | 252,979 | | | | 4,847,342 | | | | 406,469 | | | | 6,928,424 | |
Class C | | | 101,913 | | | | 1,907,609 | | | | 33,421 | | | | 523,790 | |
Administrator Class | | | 174,143 | | | | 3,304,485 | | | | 29,733 | | | | 509,987 | |
Institutional Class | | | 53,937 | | | | 992,886 | | | | 39,841 | | | | 674,385 | |
| | | | | | | | | | | | | | | | |
| | | | | | | 11,052,322 | | | | | | | | 8,636,586 | |
| | | | | | | | | | | | | | | | |
Reinvestment of distributions | | | | | | | | | | | | | | | | |
Class A | | | 114,035 | | | | 2,068,598 | | | | 63,733 | | | | 936,881 | |
Class C | | | 2,582 | | | | 45,654 | | | | 2,512 | | | | 36,002 | |
Administrator Class | | | 1,888 | | | | 34,067 | | | | 1,171 | | | | 17,126 | |
Institutional Class | | | 1,003 | | | | 18,116 | | | | 422 | | | | 6,171 | |
| | | | | | | | | | | | | | | | |
| | | | | | | 2,166,435 | | | | | | | | 996,180 | |
| | | | | | | | | | | | | | | | |
Payment for shares redeemed | | | | | | | | | | | | | | | | |
Class A | | | (550,743 | ) | | | (10,448,667 | ) | | | (1,224,370 | ) | | | (20,648,463 | ) |
Class C | | | (39,510 | ) | | | (730,508 | ) | | | (63,197 | ) | | | (1,027,543 | ) |
Administrator Class | | | (23,387 | ) | | | (448,731 | ) | | | (47,012 | ) | | | (781,978 | ) |
Institutional Class | | | (8,468 | ) | | | (161,017 | ) | | | (45,885 | ) | | | (758,985 | ) |
| | | | | | | | | | | | | | | | |
| | | | | | | (11,788,923 | ) | | | | | | | (23,216,969 | ) |
| | | | | | | | | | | | | | | | |
Net increase (decrease) in net assets resulting from capital share transactions | | | | | | | 1,429,834 | | | | | | | | (13,584,203 | ) |
| | | | | | | | | | | | | | | | |
Net increase from regulatory settlement | | | | | | | 0 | | | | | | | | 4,292,515 | |
| | | | | | | | | | | | | | | | |
Total increase in net assets | | | | | | | 21,414,340 | | | | | | | | 8,356,777 | |
| | | | | | | | | | | | | | | | |
| | | | |
Net assets | | | | | | | | | | | | | | | | |
Beginning of period | | | | | | | 156,832,648 | | | | | | | | 148,475,871 | |
| | | | | | | | | | | | | | | | |
End of period | | | | | | $ | 178,246,988 | | | | | | | $ | 156,832,648 | |
| | | | | | | | | | | | | | | | |
Undistributed net investment income | | | | | | $ | 352,868 | | | | | | | $ | 1,941,979 | |
| | | | | | | | | | | | | | | | |
The accompanying notes are an integral part of these financial statements.
| | | | | | |
| Financial highlights | | Wells Fargo Advantage Intrinsic World Equity Fund | | | 13 | |
(For a share outstanding throughout each period)
| | | | | | | | | | | | | | | | | | | | | | | | |
| | | Six months ended April 30, 2013 (unaudited) | | | Year ended October 31 | |
| CLASS A | | | 2012 | | | 2011 | | | 20101 | | | 20091 | | | 20081 | |
Net asset value, beginning of period | | $ | 17.94 | | | $ | 15.55 | | | $ | 15.06 | | | $ | 13.27 | | | $ | 13.76 | | | $ | 24.23 | |
Net investment income | | | 0.08 | | | | 0.16 | | | | 0.12 | 2 | | | 0.12 | | | | 0.09 | 2 | | | 0.29 | |
Net realized and unrealized gains (losses) on investments | | | 2.45 | | | | 1.87 | | | | 0.48 | | | | 1.78 | | | | 1.89 | | | | (9.55 | ) |
| | | | | | | | | | | | | | | | | | | | | | | | |
Total from investment operations | | | 2.53 | | | | 2.03 | | | | 0.60 | | | | 1.90 | | | | 1.98 | | | | (9.26 | ) |
Distributions to shareholders from | | | | | | | | | | | | | | | | | | | | | | | | |
Net investment income | | | (0.26 | ) | | | (0.11 | ) | | | (0.11 | ) | | | (0.11 | ) | | | (0.24 | ) | | | (0.13 | ) |
Net realized gains | | | 0.00 | | | | 0.00 | | | | 0.00 | | | | 0.00 | | | | (2.23 | ) | | | (1.08 | ) |
| | | | | | | | | | | | | | | | | | | | | | | | |
Total distributions to shareholders | | | (0.26 | ) | | | (0.11 | ) | | | (0.11 | ) | | | (0.11 | ) | | | (2.47 | ) | | | (1.21 | ) |
Regulatory settlement proceeds | | | 0.00 | | | | 0.47 | | | | 0.00 | | | | 0.00 | | | | 0.00 | | | | 0.00 | |
Net asset value, end of period | | $ | 20.21 | | | $ | 17.94 | | | $ | 15.55 | | | $ | 15.06 | | | $ | 13.27 | | | $ | 13.76 | |
Total return3 | | | 14.30 | % | | | 16.25 | %4 | | | 4.00 | % | | | 14.43 | % | | | 20.29 | % | | | (40.11 | )% |
Ratios to average net assets (annualized) | | | | | | | | | | | | | | | | | | | | | | | | |
Gross expenses | | | 1.48 | % | | | 1.51 | % | | | 1.50 | % | | | 1.53 | % | | | 1.57 | % | | | 1.36 | % |
Net expenses | | | 1.40 | % | | | 1.40 | % | | | 1.40 | % | | | 1.46 | % | | | 1.57 | % | | | 1.36 | % |
Net investment income | | | 0.83 | % | | | 0.91 | % | | | 0.79 | % | | | 0.75 | % | | | 0.77 | % | | | 1.04 | % |
Supplemental data | | | | | | | | | | | | | | | | | | | | | | | | |
Portfolio turnover rate | | | 14 | % | | | 27 | % | | | 12 | % | | | 11 | % | | | 16 | % | | | 44 | % |
Net assets, end of period (000s omitted) | | | $161,780 | | | | $146,930 | | | | $139,100 | | | | $100,460 | | | | $103,995 | | | | $107,210 | |
| 1. | After the close of business on July 16, 2010, the Fund acquired the net assets of Evergreen Intrinsic World Equity Fund which became the accounting and performance survivor in the transaction. The information for the periods prior to July 19, 2010 is that of Class A of Evergreen Intrinsic World Equity Fund. |
| 2. | Calculated based upon average shares outstanding |
| 3. | Total return calculations do not include any sales charges. Returns for periods of less than one year are not annualized. |
| 4. | During the year ended October 31, 2012, the Fund received a regulatory settlement from an unaffiliated third party which had an impact of 2.92% on the total return. |
The accompanying notes are an integral part of these financial statements.
| | | | |
| 14 | | Wells Fargo Advantage Intrinsic World Equity Fund | | Financial highlights |
(For a share outstanding throughout each period)
| | | | | | | | | | | | | | | | | | | | | | | | |
| | | Six months ended
April 30, 2013
(unaudited) | | | Year ended October 31 | |
| CLASS C | | | 2012 | | | 2011 | | | 20101 | | | 20091 | | | 20081 | |
Net asset value, beginning of period | | $ | 17.37 | | | $ | 15.15 | | | $ | 14.68 | | | $ | 12.96 | | | $ | 13.58 | | | $ | 24.14 | |
Net investment income (loss) | | | 0.03 | | | | 0.02 | | | | (0.01 | )2 | | | 0.07 | | | | (0.03 | )2 | | | (0.03 | )2 |
Net realized and unrealized gains (losses) on investments | | | 2.36 | | | | 1.82 | | | | 0.49 | | | | 1.69 | | | | 1.87 | | | | (9.28 | ) |
| | | | | | | | | | | | | | | | | | | | | | | | |
Total from investment operations | | | 2.39 | | | | 1.84 | | | | 0.48 | | | | 1.76 | | | | 1.84 | | | | (9.31 | ) |
Distributions to shareholders from | | | | | | | | | | | | | | | | | | | | | | | | |
Net investment income | | | (0.12 | ) | | | (0.09 | ) | | | (0.01 | ) | | | (0.04 | ) | | | (0.23 | ) | | | (0.17 | ) |
Net realized gains | | | 0.00 | | | | 0.00 | | | | 0.00 | | | | 0.00 | | | | (2.23 | ) | | | (1.08 | ) |
| | | | | | | | | | | | | | | | | | | | | | | | |
Total distributions to shareholders | | | (0.12 | ) | | | (0.09 | ) | | | (0.01 | ) | | | (0.04 | ) | | | (2.46 | ) | | | (1.25 | ) |
Regulatory settlement proceeds | | | 0.00 | | | | 0.47 | | | | 0.00 | | | | 0.00 | | | | 0.00 | | | | 0.00 | |
Net asset value, end of period | | $ | 19.64 | | | $ | 17.37 | | | $ | 15.15 | | | $ | 14.68 | | | $ | 12.96 | | | $ | 13.58 | |
Total return3 | | | 13.84 | % | | | 15.39 | %4 | | | 3.27 | % | | | 13.58 | % | | | 19.35 | % | | | (40.55 | )% |
Ratios to average net assets (annualized) | | | | | | | | | | | | | | | | | | | | | | | | |
Gross expenses | | | 2.23 | % | | | 2.26 | % | | | 2.20 | % | | | 2.28 | % | | | 2.33 | % | | | 2.21 | % |
Net expenses | | | 2.15 | % | | | 2.15 | % | | | 2.15 | % | | | 2.21 | % | | | 2.33 | % | | | 2.21 | % |
Net investment income (loss) | | | 0.07 | % | | | 0.16 | % | | | (0.05 | )% | | | 0.04 | % | | | (0.28 | )% | | | (0.19 | )% |
Supplemental data | | | | | | | | | | | | | | | | | | | | | | | | |
Portfolio turnover rate | | | 14 | % | | | 27 | % | | | 12 | % | | | 11 | % | | | 16 | % | | | 44 | % |
Net assets, end of period (000s omitted) | | $ | 9,578 | | | $ | 7,341 | | | $ | 6,817 | | | $ | 588 | | | $ | 427 | | | $ | 154 | |
| 1. | After the close of business on July 16, 2010, the Fund acquired the net assets of Evergreen Intrinsic World Equity Fund which became the accounting and performance survivor in the transaction. The information for the periods prior to July 19, 2010 is that of Class C of Evergreen Intrinsic World Equity Fund. |
| 2. | Calculated based upon average shares outstanding |
| 3. | Total return calculations do not include any sales charges. Returns for periods of less than one year are not annualized. |
| 4. | During the year ended October 31, 2012, the Fund received a regulatory settlement from an unaffiliated third party which had an impact of 2.92% on the total return. |
The accompanying notes are an integral part of these financial statements.
| | | | | | |
| Financial highlights | | Wells Fargo Advantage Intrinsic World Equity Fund | | | 15 | |
(For a share outstanding throughout each period)
| | | | | | | | | | | | | | | | | | | | | | | | |
| | | Six months ended
April 30, 2013
(unaudited) | | | Year ended October 31 | |
| ADMINISTRATOR CLASS | | | 2012 | | | 2011 | | | 20101 | | | 20091 | | | 20081 | |
Net asset value, beginning of period | | $ | 17.89 | | | $ | 15.52 | | | $ | 15.02 | | | $ | 13.23 | | | $ | 13.76 | | | $ | 24.26 | |
Net investment income | | | 0.09 | 2 | | | 0.19 | 2 | | | 0.15 | 2 | | | 0.15 | 2 | | | 0.15 | 2 | | | 0.38 | 2 |
Net realized and unrealized gains (losses) on investments | | | 2.45 | | | | 1.87 | | | | 0.49 | | | | 1.78 | | | | 1.85 | | | | (9.60 | ) |
| | | | | | | | | | | | | | | | | | | | | | | | |
Total from investment operations | | | 2.54 | | | | 2.06 | | | | 0.64 | | | | 1.93 | | | | 2.00 | | | | (9.22 | ) |
Distributions to shareholders from | | | | | | | | | | | | | | | | | | | | | | | | |
Net investment income | | | (0.31 | ) | | | (0.16 | ) | | | (0.14 | ) | | | (0.14 | ) | | | (0.30 | ) | | | (0.20 | ) |
Net realized gains | | | 0.00 | | | | 0.00 | | | | 0.00 | | | | 0.00 | | | | (2.23 | ) | | | (1.08 | ) |
| | | | | | | | | | | | | | | | | | | | | | | | |
Total distributions to shareholders | | | (0.31 | ) | | | (0.16 | ) | | | (0.14 | ) | | | (0.14 | ) | | | (2.53 | ) | | | (1.28 | ) |
Regulatory settlement proceeds | | | 0.00 | | | | 0.47 | | | | 0.00 | | | | 0.00 | | | | 0.00 | | | | 0.00 | |
Net asset value, end of period | | $ | 20.12 | | | $ | 17.89 | | | $ | 15.52 | | | $ | 15.02 | | | $ | 13.23 | | | $ | 13.76 | |
Total return3 | | | 14.42 | % | | | 16.52 | %4 | | | 4.27 | % | | | 14.72 | % | | | 20.60 | % | | | (40.01 | )% |
Ratios to average net assets (annualized) | | | | | | | | | | | | | | | | | | | | | | | | |
Gross expenses | | | 1.30 | % | | | 1.34 | % | | | 1.30 | % | | | 1.29 | % | | | 1.31 | % | | | 1.01 | % |
Net expenses | | | 1.15 | % | | | 1.15 | % | | | 1.15 | % | | | 1.21 | % | | | 1.31 | % | | | 1.01 | % |
Net investment income | | | 0.96 | % | | | 1.14 | % | | | 0.99 | % | | | 1.06 | % | | | 1.33 | % | | | 1.70 | % |
Supplemental data | | | | | | | | | | | | | | | | | | | | | | | | |
Portfolio turnover rate | | | 14 | % | | | 27 | % | | | 12 | % | | | 11 | % | | | 16 | % | | | 44 | % |
Net assets, end of period (000s omitted) | | $ | 5,322 | | | $ | 2,001 | | | $ | 1,986 | | | $ | 144 | | | $ | 161 | | | $ | 1,567 | |
| 1. | After the close of business on July 16, 2010, the Fund acquired the net assets of Evergreen Intrinsic World Equity Fund which became the accounting and performance survivor in the transaction. The information for the periods prior to July 19, 2010 is that of Class I of Evergreen Intrinsic World Equity Fund. |
| 2. | Calculated based upon average shares outstanding |
| 3. | Returns for periods of less than one year are not annualized. |
| 4. | During the year ended October 31, 2012, the Fund received a regulatory settlement from an unaffiliated third party which had an impact of 2.93% on the total return. |
The accompanying notes are an integral part of these financial statements.
| | | | |
| 16 | | Wells Fargo Advantage Intrinsic World Equity Fund | | Financial highlights |
(For a share outstanding throughout each period)
| | | | | | | | | | | | | | | | |
| | | Six months ended
April 30, 2013
(unaudited) | | | Year ended October 31 | |
| INSTITUTIONAL CLASS | | | 2012 | | | 2011 | | | 20101 | |
Net asset value, beginning of period | | $ | 17.93 | | | $ | 15.54 | | | $ | 15.02 | | | $ | 13.80 | |
Net investment income | | | 0.11 | 2 | | | 0.17 | 2 | | | 0.16 | | | | 0.03 | 2 |
Net realized and unrealized gains (losses) on investments | | | 2.46 | | | | 1.92 | | | | 0.51 | | | | 1.19 | |
| | | | | | | | | | | | | | | | |
Total from investment operations | | | 2.57 | | | | 2.09 | | | | 0.67 | | | | 1.22 | |
Distributions to shareholders from | | | | | | | | | | | | | | | | |
Net investment income | | | (0.34 | ) | | | (0.17 | ) | | | (0.15 | ) | | | 0.00 | |
Regulatory settlement proceeds | | | 0.00 | | | | 0.47 | | | | 0.00 | | | | 0.00 | |
Net asset value, end of period | | $ | 20.16 | | | $ | 17.93 | | | $ | 15.54 | | | $ | 15.02 | |
Total return3 | | | 14.56 | % | | | 16.74 | %4 | | | 4.50 | % | | | 8.84 | % |
Ratios to average net assets (annualized) | | | | | | | | | | | | | | | | |
Gross expenses | | | 1.05 | % | | | 1.10 | % | | | 1.00 | % | | | 1.23 | % |
Net expenses | | | 0.95 | % | | | 0.95 | % | | | 0.95 | % | | | 0.95 | % |
Net investment income | | | 1.21 | % | | | 1.03 | % | | | 1.12 | % | | | 0.91 | % |
Supplemental data | | | | | | | | | | | | | | | | |
Portfolio turnover rate | | | 14 | % | | | 27 | % | | | 12 | % | | | 11 | % |
Net assets, end of period (000s omitted) | | $ | 1,567 | | | $ | 561 | | | $ | 573 | | | $ | 11 | |
| 1. | For the period from July 30, 2010 (commencement of class operations), to October 31, 2010 |
| 2. | Calculated based upon average shares outstanding |
| 3. | Returns for periods of less than one year are not annualized. |
| 4. | During the year ended October 31, 2012, the Fund received a regulatory settlement from an unaffiliated third party which had an impact of 2.93% on the total return. |
The accompanying notes are an integral part of these financial statements.
| | | | | | |
| Notes to financial statements (unaudited) | | Wells Fargo Advantage Intrinsic World Equity Fund | | | 17 | |
1. ORGANIZATION
Wells Fargo Funds Trust (the “Trust”), a Delaware statutory trust organized on March 10, 1999, is an open-end management investment company registered under the Investment Company Act of 1940, as amended (the “1940 Act”). These financial statements report on Wells Fargo Advantage Intrinsic World Equity Fund (the “Fund”) which is a diversified series of the Trust.
2. SIGNIFICANT ACCOUNTING POLICIES
The following significant accounting policies, which are consistently followed in the preparation of the financial statements of the Fund, are in conformity with U.S. generally accepted accounting principles which require management to make estimates and assumptions that affect the reported amounts of assets and liabilities, disclosure of contingent assets and liabilities at the date of the financial statements, and the reported amounts of revenues and expenses during the reporting period. Actual results could differ from those estimates.
Securities valuation
All investments are valued each business day as of the close of regular trading on the New York Stock Exchange (normally 4 p.m. Eastern Time).
Equity securities that are listed on a foreign or domestic exchange, except for The Nasdaq Stock Market, Inc. (“Nasdaq”), are valued at the official closing price or, if none, the last sales price. Securities listed on Nasdaq are valued at the Nasdaq Official Closing Price (“NOCP”). If no NOCP is available, securities are valued at the last sales price. If no sales price is shown on the Nasdaq, the bid price will be used. If no sale occurs on the primary exchange or market for the security that day or if no sale occurs and no bid price is shown on Nasdaq, the prior day’s price will be deemed “stale” and fair values will be determined in accordance with the Fund’s Valuation Procedures.
Securities denominated in foreign currencies are translated into U.S. dollars using the rates of exchange in effect on the day of valuation at a time specified by the Management Valuation Team of Wells Fargo Funds Management, LLC (“Funds Management”).
Many securities markets and exchanges outside the U.S. close prior to the close of the New York Stock Exchange and therefore may not fully reflect trading or events that occur after the close of the principal exchange in which the foreign securities are traded, but before the close of the New York Stock Exchange. If such trading or events are expected to materially affect the value of such securities, then fair value pricing procedures approved by the Board of Trustees are applied. These procedures take into account multiple factors including movements in U.S. securities markets after foreign exchanges close. Foreign securities that are fair valued under these procedures are categorized as Level 2 and the application of these procedures may result in transfers between Level 1 and Level 2. Depending on market activity, such fair valuations may be frequent. Such fair value pricing may result in NAVs that are higher or lower than NAVs based on the last reported sales price or latest quoted bid price. On April 30, 2013, fair value pricing was not used in pricing foreign securities.
Investments in registered open-end investment companies are valued at net asset value. Non-registered investment companies are fair valued at net asset value.
Investments which are not valued using any of the methods discussed above are valued at their fair value, as determined by procedures established in good faith and approved by the Board of Trustees. The Board of Trustees has established a Valuation Committee comprised of the Trustees and has delegated to it the authority to take any actions regarding the valuation of portfolio securities that the Valuation Committee deems necessary or appropriate, including determining the fair value of portfolio securities, unless the determination has been delegated to the Management Valuation Team. The Board of Trustees retains the authority to make or ratify any valuation decisions or approve any changes to the Valuation Procedures as it deems appropriate. On a quarterly basis, the Board of Trustees receives reports on any valuation actions taken by the Valuation Committee or the Management Valuation Team which may include items for ratification.
Valuations of fair valued securities are compared to the next actual sales price when available, or other appropriate market information to assess the continued appropriateness of the fair valuation methodology used. These securities are fair valued on a day-to-day basis, taking into consideration changes to appropriate market information and any significant changes to the input factors considered in the valuation process until there is a readily available price provided on the exchange or by an independent pricing service. Valuations received from an independent pricing service or broker quotes are periodically validated by comparisons to most recent trades and valuations provided by other independent pricing services in addition to the review of prices by the adviser and/or subadviser. Unobservable inputs used in determining fair valuations are identified based on the type of security, taking into consideration factors utilized by market participants in valuing the investment, knowledge about the issuer and the current market environment.
| | | | |
| 18 | | Wells Fargo Advantage Intrinsic World Equity Fund | | Notes to financial statements (unaudited) |
Foreign currency translation
The accounting records of the Fund are maintained in U.S. dollars. Assets, including investment securities, and liabilities denominated in foreign currency are translated into U.S. dollars at the rates of exchange at a time specified by the Management Valuation Team on the date of valuation. Purchases and sales of securities, and income and expenses are translated at the rate of exchange on the respective dates of such transactions. Reported net realized foreign exchange gains or losses arise from sales of foreign currencies, currency gains or losses realized between the trade and settlement dates on securities transactions, and the difference between the amounts of dividends, interest and foreign withholding taxes recorded and the U.S. dollar equivalent of the amounts actually paid or received. Net unrealized foreign exchange gains and losses arise from changes in the fair value of assets and liabilities other than investments in securities resulting in changes in exchange rates.
The changes in net assets arising from changes in exchange rates and the changes in net assets resulting from changes in market prices of securities are not separately presented. Such changes are recorded with net realized and unrealized gains or losses from investments. Gains and losses from certain foreign currency transactions are treated as ordinary income for U.S. federal income tax purposes.
Security loans
The Fund may lend its securities from time to time in order to earn additional income in the form of fees or interest on securities received as collateral or the investment of any cash received as collateral. The Fund continues to receive interest or dividends on the securities loaned. The Fund receives collateral in the form of cash or securities with a value at least equal to the value of the securities on loan. The value of the loaned securities is determined at the close of each business day and any additional required collateral is delivered to the Fund on the next business day. In a securities lending transaction, the net asset value of the Fund will be affected by an increase or decrease in the value of the securities loaned and by an increase or decrease in the value of the instrument in which collateral is invested. The amount of securities lending activity undertaken by the Fund fluctuates from time to time. In the event of default or bankruptcy by the borrower, the Fund may be prevented from recovering the loaned securities or gaining access to the collateral or may experience delays or costs in doing so. In addition, the investment of any cash collateral received may lose all or part of its value. The Fund has the right under the lending agreement to recover the securities from the borrower on demand.
The Fund lends its securities through an unaffiliated securities lending agent. Cash collateral received in connection with its securities lending transactions is invested in Wells Fargo Securities Lending Cash Investments, LLC (the “Cash Collateral Fund”). The Cash Collateral Fund is exempt from registration under Section 3(c)(7) of the 1940 Act and is managed by Funds Management and is subadvised by Wells Capital Management Incorporated (“WellsCap”). Funds Management receives an advisory fee starting at 0.05% and declining to 0.01% as the average daily net assets of the Cash Collateral Fund increase. All of the fees received by Funds Management are paid to WellsCap for its services as subadviser. The Cash Collateral Fund seeks to provide a positive return compared to the daily Fed Funds Open rate by investing in high-quality, U.S. dollar-denominated short-term money market instruments. Cash Collateral Fund investments are fair valued based upon the amortized cost valuation technique. Income earned from investment in the Cash Collateral Fund is included in securities lending income on the Statement of Operations.
Security transactions and income recognition
Securities transactions are recorded on a trade date basis. Realized gains or losses are recorded on the basis of identified cost.
Dividend income is recognized on the ex-dividend date, except for certain dividends from foreign securities, which are recorded as soon as the Fund is informed of the ex-dividend date. Dividend income from foreign securities is recorded net of foreign taxes withheld where recovery of such taxes is not assured.
Distributions to shareholders
Distributions to shareholders from net investment income and net realized gains, if any, are recorded on the ex-dividend date. Such distributions are determined in conformity with federal income tax regulations, which may differ in amount or character from net investment income and realized gains recognized for purposes of U.S. generally accepted accounting principles.
Federal and other taxes
The Fund intends to continue to qualify as a regulated investment company by distributing substantially all of its investment company taxable income and any net realized capital gains (after reduction for capital loss carryforwards) sufficient to relieve it from all, or substantially all, federal income taxes. Accordingly, no provision for federal income taxes was required.
The Fund’s income and federal excise tax returns and all financial records supporting those returns for the prior three fiscal years are subject to examination by the federal and Delaware revenue authorities. Management has analyzed the
| | | | | | |
| Notes to financial statements (unaudited) | | Wells Fargo Advantage Intrinsic World Equity Fund | | | 19 | |
Fund’s tax positions taken on federal, state, and foreign tax returns for all open tax years and does not believe that there are any uncertain tax positions that require recognition of a tax liability.
As of October 31, 2012, the Fund had pre-enactment capital loss carryforwards incurred in taxable years beginning before December 22, 2010, which are available to offset future net realized capital gains, in the amount of $17,547,659 with $4,209,099 expiring in 2016; $12,065,555 expiring in 2017; and $1,273,005 expiring in 2018.
Class allocations
The separate classes of shares offered by the Fund differ principally in applicable sales charges, distribution, shareholder servicing, and administration fees. Shareholders of each class bear certain expenses that pertain to that particular class. All shareholders bear the common expenses of the Fund, earn income from the portfolio, and are allocated any unrealized gains and losses pro rata based on the average daily net assets of each class, without distinction between share classes. Dividends are determined separately for each class based on income and expenses allocable to each class. Realized gains and losses are allocated to each class pro rata based upon the net assets of each class on the date realized. Differences in per share dividend rates generally result from the relative weightings of pro rata income and realized gain allocations and from differences in separate class expenses, including distribution, shareholder servicing, and administration fees.
3. FAIR VALUATION MEASUREMENTS
Fair value measurements of investments are determined within a framework that has established a fair value hierarchy based upon the various data inputs utilized in determining the value of the Fund’s investments. The three-level hierarchy gives the highest priority to unadjusted quoted prices in active markets for identical assets or liabilities (Level 1) and the lowest priority to significant unobservable inputs (Level 3). The Fund’s investments are classified within the fair value hierarchy based on the lowest level of input that is significant to the fair value measurement. The inputs are summarized into three broad levels as follows:
| n | | Level 1 – quoted prices in active markets for identical securities |
| n | | Level 2 – other significant observable inputs (including quoted prices for similar securities, interest rates, prepayment speeds, credit risk, use of amortized cost, etc.) |
| n | | Level 3 – significant unobservable inputs (including the Fund’s own assumptions in determining the fair value of investments) |
The inputs or methodologies used for valuing investments in securities are not necessarily an indication of the risk associated with investing in those securities.
As of April 30, 2013, the inputs used in valuing investments in securities were as follows:
| | | | | | | | | | | | | | | | |
| Investments in securities | | Quoted prices (Level 1) | | | Significant other
observable inputs (Level 2) | | | Significant unobservable inputs (Level 3) | | | Total | |
| | | | |
Equity securities | | | | | | | | | | | | | | | | |
Common stocks | | $ | 172,626,636 | | | $ | 904,748 | | | $ | 0 | | | $ | 173,531,384 | |
| | | | |
Short-term investments | | | | | | | | | | | | | | | | |
Investment companies | | | 4,444,416 | | | | 16,007,849 | | | | 0 | | | | 20,452,265 | |
| | | $ | 177,071,052 | | | $ | 16,912,597 | | | $ | 0 | | | $ | 193,983,649 | |
Transfers in and transfers out are recognized at the end of the reporting period. For the six months ended April 30, 2013, the Fund did not have any transfers into/out of Level 1 or Level 2.
4. TRANSACTIONS WITH AFFILIATES AND OTHER EXPENSES
Advisory fee
The Trust has entered into an advisory contract with Funds Management, an indirect wholly owned subsidiary of Wells Fargo & Company (“Wells Fargo”). The adviser is responsible for implementing investment policies and guidelines and for supervising the subadviser, who is responsible for day-to-day portfolio management of the Fund.
Pursuant to the contract, Funds Management is entitled to receive an annual advisory fee starting at 0.80% and declining to 0.65% as the average daily net assets of the Fund increase. For the six months ended April 30, 2013, the advisory fee was equivalent to an annual rate of 0.80% of the Fund’s average daily net assets.
| | | | |
| 20 | | Wells Fargo Advantage Intrinsic World Equity Fund | | Notes to financial statements (unaudited) |
Funds Management has retained the services of a subadviser to provide daily portfolio management to the Fund. The fee for subadvisory services is borne by Funds Management. Metropolitan West Capital Management, LLC, an affiliate of Funds Management, is the subadviser to the Fund and is entitled to receive a fee from Funds Management at an annual rate starting at 0.35% and declining to 0.20% as the average daily net assets of the Fund increase.
Administration and transfer agent fees
The Trust has entered into an administration agreement with Funds Management. Under this agreement, for providing administrative services, which includes paying fees and expenses for services provided by the transfer agent, sub-transfer agents, omnibus account servicers and record-keepers, Funds Management is entitled to receive from the Fund an annual fund level administration fee starting at 0.05% and declining to 0.03% as the average daily net assets of the Fund increase and a class level administration fee which is calculated based on the average daily net assets of each class as follows:
| | | | |
| | | Class level
administration fee | |
Class A, Class C | | | 0.26 | % |
Administrator Class | | | 0.10 | |
Institutional Class | | | 0.08 | |
Funds Management has contractually waived and/or reimbursed advisory and administration fees to the extent necessary to maintain certain net operating expense ratios for the Fund. Waiver of fees and/or reimbursement of expenses by Funds Management were made first from fund level expenses on a proportionate basis and then from class specific expenses. Funds Management has committed through February 28, 2014 to waive fees and/or reimburse expenses to the extent necessary to cap the Fund’s expenses at 1.40% for Class A shares, 2.15% for Class C shares, 1.15% for Administrator Class shares, and 0.95% for Institutional Class shares.
Distribution fees
The Trust has adopted a Distribution Plan for Class C shares of the Fund pursuant to Rule 12b-1 under the 1940 Act. Distribution fees are charged to Class C shares and paid to Wells Fargo Funds Distributor, LLC, the principal underwriter, at an annual rate of 0.75% of the average daily net assets of Class C shares.
For the six months ended April 30, 2013, Wells Fargo Funds Distributor, LLC received $3,446 from the sale of Class A shares and $22 in contingent deferred sales charges from redemptions of Class C shares.
Shareholder servicing fees
The Trust has entered into contracts with one or more shareholder servicing agents, whereby Class A, Class C and Administrator Class of the Fund is charged a fee at an annual rate of 0.25% of the average daily net assets of each respective class.
A portion of these total shareholder servicing fees were paid to affiliates of Wells Fargo.
5. INVESTMENT PORTFOLIO TRANSACTIONS
Purchases and sales of investments, excluding U.S. government obligations (if any) and short-term securities, for the six months ended April 30, 2013 were $23,427,543 and $24,725,105, respectively.
6. BANK BORROWINGS
The Trust (excluding the money market funds and certain other funds in the Trust) and Wells Fargo Variable Trust are parties to a $150,000,000 revolving credit agreement with State Street Bank and Trust Company, whereby the Fund is permitted to use bank borrowings for temporary or emergency purposes, such as to fund shareholder redemption requests. Interest under the credit agreement is charged to the Fund based on a borrowing rate equal to the higher of the Federal Funds rate in effect on that day plus 1.25% or the overnight LIBOR rate in effect on that day plus 1.25%. In addition, an annual commitment fee equal to 0.10% of the unused balance is allocated to each participating fund. For the six months ended April 30, 2013, the Fund paid $173 in commitment fees.
For the six months ended April 30, 2013, there were no borrowings by the Fund under the agreement.
7. REGULATORY SETTLEMENT PROCEEDS
During the year ended October 31, 2012, the Fund received proceeds from an unaffiliated third party in a regulatory settlement with the SEC involving marketing timing of mutual funds. The proceeds received in the amount of $4,292,515 are reflected in the accompanying financial statements.
| | | | | | |
| Notes to financial statements (unaudited) | | Wells Fargo Advantage Intrinsic World Equity Fund | | | 21 | |
8. INDEMNIFICATION
Under the Trust’s organizational documents, the officers and directors are indemnified against certain liabilities that may arise out of performance of their duties to the Trust. Additionally, in the normal course of business, the Trust may enter into contracts with service providers that contain a variety of indemnification clauses. The Trust’s maximum exposure under these arrangements is dependent on future claims that may be made against the Fund and, therefore, cannot be estimated.
9. NEW ACCOUNTING PRONOUNCEMENT
In December 2011, the Financial Accounting Standards Board (“FASB”) issued Accounting Standard Update (“ASU”) No. 2011-11, Disclosures about Offsetting Assets and Liabilities. ASU 2011-11, which amends FASB ASC Topic 210, Balance Sheet, creates new disclosure requirements which require entities to disclose both gross and net information for derivatives and other financial instruments that are either offset in the Statement of Assets and Liabilities or subject to an enforceable master netting arrangement or similar agreement. The disclosure requirements are effective for interim and annual reporting periods beginning on or after January 1, 2013. Management is currently assessing the potential impact, in addition to expanded financial statement disclosure, that may result from adopting this ASU.
| | | | |
| 22 | | Wells Fargo Advantage Intrinsic World Equity Fund | | Other information (unaudited) |
PROXY VOTING INFORMATION
A description of the policies and procedures that the Fund uses to determine how to vote proxies relating to portfolio securities is available without charge, upon request, by calling 1-800-222-8222, visiting our website at wellsfargoadvantagefunds.com, or visiting the SEC website at sec.gov. Information regarding how the Fund voted proxies relating to portfolio securities during the most recent 12-month period ended June 30 is available without charge on the Fund’s website at wellsfargoadvantagefunds.com or by visiting the SEC website at sec.gov.
PORTFOLIO HOLDINGS INFORMATION
The complete portfolio holdings for the Fund are publicly available on the Fund’s website (wellsfargoadvantagefunds.com) on a monthly, 30-day or more delayed basis. In addition, top ten holdings information for the Fund is publicly available on the Fund’s website on a monthly, seven-day or more delayed basis. The Fund files its complete schedule of portfolio holdings with the SEC for the first and third quarters of each fiscal year on Form N-Q, which is available without charge by visiting the SEC website at sec.gov. In addition, the Fund’s Form N-Q may be reviewed and copied at the SEC’s Public Reference Room in Washington, DC, and at regional offices in New York City, at 233 Broadway, and in Chicago, at 175 West Jackson Boulevard, Suite 900. Information about the Public Reference Room may be obtained by calling 1-800-SEC-0330.
| | | | | | |
| Other information (unaudited) | | Wells Fargo Advantage Intrinsic World Equity Fund | | | 23 | |
BOARD OF TRUSTEES AND OFFICERS
Each of the Trustees and Officers listed in the table below acts in identical capacities for the Wells Fargo Advantage family of funds, which consists of 131 funds1 comprising the Wells Fargo Funds Trust, Wells Fargo Variable Trust, Wells Fargo Master Trust and four closed-end funds (collectively the “Fund Complex”). This table should be read in conjunction with the Prospectus and the Statement of Additional Information2. All of the Trustees are also Members of the Audit and Governance Committees of each Trust in the Fund Complex. The mailing address of each Trustee and Officer is 525 Market Street, 12th Floor, San Francisco, CA 94105. Each Trustee and Officer serves an indefinite term, however, each Trustee serves such term until reaching the mandatory retirement age established by the Trustees.
Independent Trustees
| | | | | | |
Name and year of birth | | Position held and length of service* | | Principal occupations during past five years | | Other directorships during past five years |
| Peter G. Gordon (Born 1942) | | Trustee, since 1998; Chairman, since 2005 | | Co-Founder, Retired Chairman, President and CEO of Crystal Geyser Water Company. Trustee Emeritus, Colby College. | | Asset Allocation Trust |
Isaiah Harris, Jr. (Born 1952) | | Trustee, since 2009 | | Retired. Prior thereto, President and CEO of BellSouth Advertising and Publishing Corp. from 2005 to 2007, President and CEO of BellSouth Enterprises from 2004 to 2005 and President of BellSouth Consumer Services from 2000 to 2003. Emeritus member of the Iowa State University Foundation Board of Governors. Emeritus Member of the Advisory Board of Iowa State University School of Business. Advisory Board Member, Palm Coast Academy (charter school). Mr. Harris is a certified public accountant. | | CIGNA Corporation; Deluxe Corporation; Asset Allocation Trust |
Judith M. Johnson (Born 1949) | | Trustee, since 2008; Audit Committee Chairman, since 2008 | | Retired. Prior thereto, Chief Executive Officer and Chief Investment Officer of Minneapolis Employees Retirement Fund from 1996 to 2008. Ms. Johnson is an attorney, certified public accountant and a certified managerial accountant. | | Asset Allocation Trust |
Leroy Keith, Jr. (Born 1939) | | Trustee, since 2010 | | Chairman, Bloc Global Services (development and construction). Trustee of the Evergreen Funds from 1983 to 2010. Former Managing Director, Almanac Capital Management (commodities firm), former Partner, Stonington Partners, Inc. (private equity fund), former Director, Obagi Medical Products Co. and former Director, Lincoln Educational Services. | | Trustee, Virtus Fund Complex (consisting of 48 portfolios as of 1/31/2013); Asset Allocation Trust |
David F. Larcker (Born 1950) | | Trustee, since 2009 | | James Irvin Miller Professor of Accounting at the Graduate School of Business, Stanford University, Morgan Stanley Director of the Center for Leadership Development and Research and Senior Faculty of The Rock Center for Corporate Governance since 2006. From 2005 to 2008, Professor of Accounting at the Graduate School of Business, Stanford University. Prior thereto, Ernst & Young Professor of Accounting at The Wharton School, University of Pennsylvania from 1985 to 2005. | | Asset Allocation Trust |
Olivia S. Mitchell (Born 1953) | | Trustee, since 2006 | | International Foundation of Employee Benefit Plans Professor, Wharton School of the University of Pennsylvania since 1993. Director of Wharton’s Pension Research Council and Boettner Center on Pensions & Retirement Research, and Research Associate at the National Bureau of Economic Research. Previously, Cornell University Professor from 1978 to 1993. | | Asset Allocation Trust |
Timothy J. Penny (Born 1951) | | Trustee, since 1996 | | President and CEO of Southern Minnesota Initiative Foundation, a non-profit organization, since 2007 and Senior Fellow at the Humphrey Institute Policy Forum at the University of Minnesota since 1995. Member of the Board of Trustees of NorthStar Education Finance, Inc., a non-profit organization, since 2007. | | Asset Allocation Trust |
| | | | |
| 24 | | Wells Fargo Advantage Intrinsic World Equity Fund | | Other information (unaudited) |
| | | | | | |
Name and year of birth | | Position held and length of service* | | Principal occupations during past five years | | Other directorships during past five years |
Michael S. Scofield (Born 1943) | | Trustee, since 2010 | | Served on the Investment Company Institute’s Board of Governors and Executive Committee from 2008-2011 as well the Governing Council of the Independent Directors Council from 2006-2011 and the Independent Directors Council Executive Committee from 2008-2011. Chairman of the IDC from 2008-2010. Institutional Investor (Fund Directions) Trustee of Year in 2007. Trustee of the Evergreen Funds (and its predecessors) from 1984 to 2010. Chairman of the Evergreen Funds from 2000-2010. Former Trustee of the Mentor Funds. Retired Attorney, Law Offices of Michael S. Scofield. | | Asset Allocation Trust |
Donald C. Willeke (Born 1940) | | Trustee, since 1996 | | Principal of the law firm of Willeke & Daniels. General Counsel of the Minneapolis Employees Retirement Fund from 1984 until its consolidation into the Minnesota Public Employees Retirement Association on June 30, 2010. Director and Vice Chair of The Tree Trust (non-profit corporation). Director of the American Chestnut Foundation (non-profit corporation). | | Asset Allocation Trust |
| * | Length of service dates reflect the Trustee’s commencement of service with the Trust’s predecessor entities, where applicable. |
Officers
| | | | | | |
Name and year of birth | | Position held and length of service | | Principal occupations during past five years | | |
Karla M. Rabusch (Born 1959) | | President, since 2003 | | Executive Vice President of Wells Fargo Bank, N.A. and President of Wells Fargo Funds Management, LLC since 2003. | | |
Jeremy DePalma1 (Born 1974) | | Treasurer, since 2012 | | Senior Vice President of Wells Fargo Funds Management, LLC since 2009. Senior Vice President of Evergreen Investment Management Company, LLC from 2008 to 2010. Vice President, Evergreen Investment Services, Inc. from 2004 to 2007. Head of the Fund Reporting and Control Team within Fund Administration from 2005 to 2010. | | |
C. David Messman (Born 1960) | | Secretary, since 2000; Chief Legal Officer, since 2003 | | Senior Vice President and Secretary of Wells Fargo Funds Management, LLC since 2001. Vice President and Managing Counsel of Wells Fargo Bank, N.A. since 1996. | | |
Debra Ann Early (Born 1964) | | Chief Compliance Officer, since 2007 | | Chief Compliance Officer of Wells Fargo Funds Management, LLC since 2007. Chief Compliance Officer of Parnassus Investments from 2005 to 2007. Chief Financial Officer of Parnassus Investments from 2004 to 2007. | | |
David Berardi (Born 1975) | | Assistant Treasurer, since 2009 | | Vice President of Wells Fargo Funds Management, LLC since 2009. Vice President of Evergreen Investment Management Company, LLC from 2008 to 2010. Assistant Vice President of Evergreen Investment Services, Inc. from 2004 to 2008. Manager of Fund Reporting and Control for Evergreen Investment Management Company, LLC from 2004 to 2010. | | |
| 1. | Jeremy DePalma acts as Treasurer of 58 funds and Assistant Treasurer of 73 funds in the Fund Complex. |
| 2. | The Statement of Additional Information includes additional information about the Trustees and is available, without charge, upon request, by calling 1-800-222-8222 or by visiting the website at wellsfargoadvantagefunds.com. |
| | | | | | |
| Other information (unaudited) | | Wells Fargo Advantage Intrinsic World Equity Fund | | | 25 | |
BOARD CONSIDERATION OF INVESTMENT ADVISORY AND SUBADVISORY AGREEMENTS:
Under Section 15 of the Investment Company Act of 1940 (the “1940 Act”), the Board of Trustees (the “Board”) of Wells Fargo Funds Trust (the “Trust”), all the members of which have no direct or indirect interest in the investment advisory and sub-advisory agreements and are not “interested persons” of the Trust, as defined in the 1940 Act (the “Independent Trustees”), must determine whether to approve the continuation of the Trust’s investment advisory and sub-advisory agreements. In this regard, at an in-person meeting held on March 28-29, 2013 (the “Meeting”), the Board reviewed: (i) an investment advisory agreement with Wells Fargo Funds Management, LLC (“Funds Management”) for Wells Fargo Advantage Intrinsic World Equity Fund (the “Fund”) and (ii) an investment sub-advisory agreement with Metropolitan West Capital Management, LLC (the “Sub-Adviser”), an affiliate of Funds Management, for the Fund. The investment advisory agreement with Funds Management and the investment sub-advisory agreement with the Sub-Adviser are collectively referred to as the “Advisory Agreements.”
At the Meeting, the Board considered the factors and reached the conclusions described below relating to the selection of Funds Management and the Sub-Adviser and the continuation of the Advisory Agreements. Prior to the Meeting, the Trustees conferred extensively among themselves and with representatives of Funds Management about these matters. The Board has adopted a team-based approach, with each team consisting of a sub-set of Trustees, to assist the Board in the discharge of its duties in reviewing performance and other matters throughout the year. The Independent Trustees were assisted in their evaluation of the Advisory Agreements by independent legal counsel, from whom they received separate legal advice and with whom they met separately.
In providing information to the Board, Funds Management and the Sub-Adviser were guided by a detailed set of requests for information submitted to them by independent legal counsel on behalf of the Independent Trustees at the start of the Board’s annual contract renewal process earlier in 2013. In considering and approving the Advisory Agreements, the Trustees considered the information they believed relevant, including but not limited to the information discussed below. The Board considered not only the specific information presented in connection with the Meeting, but also the knowledge gained over time through interaction with Funds Management and the Sub-Adviser about various topics. In this regard, the Board reviewed reports of Funds Management at each of its quarterly meetings, which included, among other things, portfolio reviews and performance reports. In addition, the Board and the teams mentioned above confer with portfolio managers at various times throughout the year. The Board did not identify any particular information or consideration that was all-important or controlling, and each individual Trustee may have attributed different weights to various factors.
After its deliberations, the Board unanimously determined that the continuation of the Advisory Agreements is in the best interests of the Fund and its shareholders, and that the compensation payable to Funds Management and the Sub-Adviser is reasonable. The Board considered the continuation of the Advisory Agreements for the Fund as part of its consideration of the continuation of advisory agreements for funds across the complex, but each decision was made on a fund-by-fund basis. The following summarizes a number of important, but not necessarily all, factors considered by the Board in reaching its determination.
Nature, extent and quality of services
The Board received and considered various information regarding the nature, extent and quality of services provided to the Fund by Funds Management and the Sub-Adviser under the Advisory Agreements. This information included, among other things, a summary of the background and experience of senior management of Funds Management, and the qualifications, background, tenure and responsibilities of each of the portfolio managers primarily responsible for the day-to-day portfolio management of the Fund.
The Board evaluated the ability of Funds Management and the Sub-Adviser, based on attributes such as their financial condition, resources and reputation, to attract and retain qualified investment professionals, including research, advisory and supervisory personnel. The Board further considered the compliance programs and compliance records of Funds Management and the Sub-Adviser. In addition, the Board took into account the administrative and other services provided to the Fund by Funds Management and its affiliates and Funds Management’s oversight of the Fund’s various service providers.
Fund performance and expenses
The Board considered the performance results for the Fund over various time periods ended December 31, 2012. The Board also considered these results in comparison to the performance of funds in a universe that was determined by Lipper Inc. (“Lipper”) to be similar to the Fund (the “Universe”), and in comparison to the Fund’s benchmark index and to other comparative data. Lipper is an independent provider of investment company data. The Board received a description of the methodology used by Lipper to select the mutual funds in the performance Universe. The Board noted
| | | | |
| 26 | | Wells Fargo Advantage Intrinsic World Equity Fund | | Other information (unaudited) |
that the performance of the Fund (Administrator Class) was higher than or in range of the median performance of the Universe for all periods under review. The Board also noted that the performance of the Fund was higher than its benchmark, the Morgan Stanley Composite Index World Index (Net), for all periods under review.
The Board received information concerning, and discussed factors contributing to, the underperformance of the Fund relative to the benchmark for all periods under review. Funds Management advised the Board about the market conditions and investment decisions that it believed contributed to the underperformance during that period. The Board noted the performance of the Fund relative to the Universe for all periods under review and was satisfied with the explanation of the underperformance.
The Board received and considered information regarding the Fund’s net operating expense ratios and their various components, including actual management fees (which reflect fee waivers, if any, and include advisory, administration and transfer agent fees), custodian and other non-management fees, Rule 12b-1 and non-Rule 12b-1 service fees and fee waiver and expense reimbursement arrangements. The Board also considered these ratios in comparison to the median ratios of funds in class-specific expense groups that were determined by Lipper to be similar to the Fund (the “Groups”). The Board received a description of the methodology used by Lipper to select the mutual funds in the expense Groups. Based on the Lipper reports, the Board noted that the net operating expense ratios of the Fund were lower than or in range of the median net operating expense ratios of the expense Groups.
Based on its consideration of the factors and information it deemed relevant, including those described here, the Board concluded that the overall performance and expense structure of the Fund supported the re-approval of the Advisory Agreements.
Investment advisory and sub-advisory fee rates
The Board reviewed and considered the contractual investment advisory fee rates that are payable by the Fund to Funds Management for investment advisory services (the “Advisory Agreement Rates”), both on a stand-alone basis and on a combined basis with the Fund’s fund-level and class-level contractual administration fee rates (the “Management Rates”). The Board noted that the administration fees include transfer agency costs. The Board also reviewed and considered the contractual investment sub-advisory fee rates that are payable by Funds Management to the Sub-Adviser for investment sub-advisory services (the “Sub-Advisory Agreement Rates”).
Among other information reviewed by the Board was a comparison of the Management Rates of the Fund with those of other funds in the expense Groups at a common asset level. The Board noted that the Management Rates of the Fund were in range of the Fund’s expense Groups for all classes except Class A and Institutional Class.
The Board also received and considered information about the portion of the total advisory fee that was retained by Funds Management after payment of the fee to the Sub-Adviser for sub-advisory services. In assessing the reasonableness of this amount, the Board received and evaluated information concerning the nature and extent of responsibilities retained and risks assumed by Funds Management and not delegated to or assumed by the Sub-Adviser, and about Funds Management’s on-going oversight services. In recognition of the fact that the Wells Fargo enterprise provides a suite of combined advisory and sub-advisory services to the Fund through affiliated entities, the Board ascribed limited relevance to the allocation of the total advisory fee between Funds Management and the Sub-Adviser.
The Board also received and considered information about the nature and extent of services offered and fee rates charged by Funds Management and the Sub-Adviser to other types of clients. In this regard, the Board received information about the significantly greater scope of services, and compliance, reporting and other legal burdens and risks of managing mutual funds compared with those associated with managing assets of non-mutual fund clients such as collective funds or institutional separate accounts.
Based on its consideration of the factors and information it deemed relevant, including those described here, the Board determined that the Advisory Agreement Rates and the Sub-Advisory Agreement Rates were reasonable in light of the services covered by the Advisory Agreements.
Profitability
The Board received and considered information concerning the profitability of Funds Management, as well as the profitability of Wells Fargo as a whole, from providing services to the Fund. The Board did not receive or consider to be necessary separate profitability information with respect to the Sub-Adviser, because, as an affiliate of Funds Management, its profitability information was subsumed in the collective Wells Fargo profitability analysis provided by Funds Management.
| | | | | | |
| Other information (unaudited) | | Wells Fargo Advantage Intrinsic World Equity Fund | | | 27 | |
Funds Management explained the methodologies and estimates that it used in calculating the profitability from the Fund and the fund family as a whole. Among other things, the Board noted that the levels of profitability reported on a fund-by-fund basis varied widely, depending on factors such as the size and type of fund. Based on its review, the Board did not deem the profits reported by Funds Management to be at a level that would prevent it from approving the continuation of the Advisory Agreements.
Economies of scale
With respect to possible economies of scale, the Board reviewed the breakpoints in the Fund’s advisory fee and administration fee structure, which operate generally to reduce the Fund’s expense ratios as the Fund grows in size. It considered that, for a small fund or a fund that shrinks in size, breakpoints conversely can result in higher fee levels. The Board also considered fee waiver and expense reimbursement arrangements as a means of sharing potential economies of scale with the Fund. The Board acknowledged the inherent limitations of any analysis of potential economies of scale and of any attempt to correlate breakpoints with such economies. Nonetheless, the Board concluded that the breakpoints and net operating expense ratio caps appeared to be a reasonable approach to sharing potential economies of scale with the Fund.
Other benefits to Funds Management and the Sub-Adviser
The Board received and considered information regarding potential “fall-out” or ancillary benefits received by Funds Management and its affiliates, including the Sub-Adviser, as a result of their relationship with the Fund. Ancillary benefits could include, among others, benefits directly attributable to other relationships with the Fund and benefits potentially derived from an increase in Funds Management’s and the Sub-Adviser’s business as a result of their relationship with the Fund (such as the ability to market to shareholders other financial products and services offered by Funds Management and its affiliates, including the Sub-Adviser, or to operate other products and services that follow investment strategies similar to those of the Fund).
The Board considered that Wells Fargo Funds Distributor, LLC, an affiliate of Funds Management, serves as distributor to the Fund and receives certain compensation for those services. The Board noted that various financial institutions, including affiliates of Funds Management, may receive distribution-related fees, shareholder servicing payments (including amounts derived from payments under Rule 12b-1 plans) and sub-transfer agency fees in respect of shares sold or held through them and services provided.
The Board also reviewed information about whether and to what extent soft dollar credits are sought and how any such credits are utilized, and any benefits that might be realized by an affiliated broker that handles portfolio transactions for the Fund.
Based on its consideration of the factors and information it deemed relevant, including those described here, the Board did not find that any ancillary benefits received by Funds Management and its affiliates, including the Sub-Adviser, were unreasonable.
Conclusion
After considering the above-described factors and based on its deliberations and its evaluation of the information described above, the Board unanimously approved the continuation of the Advisory Agreements for an additional one-year period.
| | | | |
| 28 | | Wells Fargo Advantage Intrinsic World Equity Fund | | List of abbreviations |
The following is a list of common abbreviations for terms and entities that may have appeared in this report.
| ACA | — ACA Financial Guaranty Corporation |
| ADR | — American depositary receipt |
| ADS | — American depositary shares |
| AGC | — Assured Guaranty Corporation |
| AGM | — Assured Guaranty Municipal |
| Ambac | — Ambac Financial Group Incorporated |
| AMT | — Alternative minimum tax |
| BAN | — Bond anticipation notes |
| BHAC | — Berkshire Hathaway Assurance Corporation |
| CAB | — Capital appreciation bond |
| CCAB | — Convertible capital appreciation bond |
| CDA | — Community Development Authority |
| CDO | — Collateralized debt obligation |
| COP | — Certificate of participation |
| DRIVER | — Derivative inverse tax-exempt receipts |
| DW&P | — Department of Water & Power |
| DWR | — Department of Water Resources |
| ECFA | — Educational & Cultural Facilities Authority |
| EDA | — Economic Development Authority |
| EDFA | — Economic Development Finance Authority |
| ETF | — Exchange-traded fund |
| FDIC | — Federal Deposit Insurance Corporation |
| FFCB | — Federal Farm Credit Banks |
| FGIC | — Financial Guaranty Insurance Corporation |
| FHA | — Federal Housing Administration |
| FHLB | — Federal Home Loan Bank |
| FHLMC | — Federal Home Loan Mortgage Corporation |
| FICO | — The Financing Corporation |
| FNMA | — Federal National Mortgage Association |
| GDR | — Global depositary receipt |
| GNMA | — Government National Mortgage Association |
| HCFR | — Healthcare facilities revenue |
| HEFA | — Health & Educational Facilities Authority |
| HEFAR | — Higher education facilities authority revenue |
| HFA | — Housing Finance Authority |
| HFFA | — Health Facilities Financing Authority |
| HUD | — Department of Housing and Urban Development |
| IDA | — Industrial Development Authority |
| IDAG | — Industrial Development Agency |
| IDR | — Industrial development revenue |
| KRW | — Republic of Korea won |
| LIBOR | — London Interbank Offered Rate |
| LLC | — Limited liability company |
| LLP | — Limited liability partnership |
| MBIA | — Municipal Bond Insurance Association |
| MFHR | — Multifamily housing revenue |
| MSTR | — Municipal securities trust receipts |
| MUD | — Municipal Utility District |
| National | — National Public Finance Guarantee Corporation |
| PCFA | — Pollution Control Financing Authority |
| PCL | — Public Company Limited |
| PCR | — Pollution control revenue |
| PFA | — Public Finance Authority |
| PFFA | — Public Facilities Financing Authority |
| PFOTER | — Puttable floating option tax-exempt receipts |
| plc | — Public limited company |
| PUTTER | — Puttable tax-exempt receipts |
| R&D | — Research & development |
| Radian | — Radian Asset Assurance |
| RAN | — Revenue anticipation notes |
| RDA | — Redevelopment Authority |
| RDFA | — Redevelopment Finance Authority |
| REIT | — Real estate investment trust |
| ROC | — Reset option certificates |
| SAVRS | — Select auction variable rate securities |
| SBA | — Small Business Authority |
| SFHR | — Single-family housing revenue |
| SFMR | — Single-family mortgage revenue |
| SPA | — Standby purchase agreement |
| SPDR | — Standard & Poor’s Depositary Receipts |
| STRIPS | — Separate trading of registered interest and principal securities |
| TAN | — Tax anticipation notes |
| TIPS | — Treasury inflation-protected securities |
| TRAN | — Tax revenue anticipation notes |
| TTFA | — Transportation Trust Fund Authority |
| TVA | — Tennessee Valley Authority |
This page is intentionally left blank.
This page is intentionally left blank.


For more information
More information about Wells Fargo Advantage Funds is available free upon request. To obtain literature, please write, email, visit the Fund’s website, or call:
Wells Fargo Advantage Funds
P.O. Box 8266
Boston, MA 02266-8266
Email: wfaf@wellsfargo.com
Website: wellsfargoadvantagefunds.com
Individual investors: 1-800-222-8222
Retail investment professionals: 1-888-877-9275
Institutional investment professionals: 1-866-765-0778
This report and the financial statements contained herein are submitted for the general information of the shareholders of Wells Fargo Advantage Funds. If this report is used for promotional purposes, distribution of the report must be accompanied or preceded by a current prospectus. For a current prospectus and, if available, a summary prospectus containing more complete information, including charges and expenses, call 1-800-222-8222 or visit the Fund’s website at wellsfargoadvantagefunds.com. Please consider the investment objectives, risks, charges, and expenses of the investment carefully before investing. This and other information about Wells Fargo Advantage Funds can be found in the current prospectus. Read the prospectus carefully before you invest or send money.
Wells Fargo Funds Management, LLC, a wholly owned subsidiary of Wells Fargo & Company, provides investment advisory and administrative services for Wells Fargo Advantage Funds. Other affiliates of Wells Fargo & Company provide subadvisory and other services for the Funds. The Funds are distributed by Wells Fargo Funds Distributor, LLC, Member FINRA/SIPC, an affiliate of Wells Fargo & Company.
NOT FDIC INSURED ¡ NO BANK GUARANTEE ¡ MAY LOSE VALUE
© 2013 Wells Fargo Funds Management, LLC. All rights reserved.
| | |
 | | 216836 06-13 SA241/SAR241 4-13 |

Wells Fargo Advantage
Intrinsic Small Cap Value Fund

Semi-Annual Report
April 30, 2013

Reduce clutter. Save trees.
Sign up for electronic delivery of prospectuses and shareholder reports at wellsfargo.com/advantagedelivery
Contents
The views expressed and any forward-looking statements are as of April 30, 2013, unless otherwise noted, and are those of the Fund managers and/or Wells Fargo Funds Management, LLC. Discussions of individual securities, or the markets generally, or any Wells Fargo Advantage Fund are not intended as individual recommendations. Future events or results may vary significantly from those expressed in any forward-looking statements; the views expressed are subject to change at any time in response to changing circumstances in the market. Wells Fargo Funds Management, LLC, disclaims any obligation to publicly update or revise any views expressed or forward-looking statements.
NOT FDIC INSURED ¡ NO BANK GUARANTEE ¡ MAY LOSE VALUE

Wells Fargo investment history
| | |
| 1932 | | Keystone creates one of the first mutual fund families. |
| 1971 | | Wells Fargo & Company introduces one of the first institutional index funds. |
| 1978 | | Wells Fargo applies Markowitz and Sharpe’s research on Modern Portfolio Theory to introduce one of the industry’s first tactical asset allocation models in institutional separately managed accounts. |
| 1984 | | Wells Fargo Stagecoach Funds launches its first asset allocation fund. |
| 1989 | | The Tactical Asset Allocation (TAA) Model is first applied to Wells Fargo’s asset allocation mutual funds. |
| 1994 | | Wells Fargo introduces the LifePath Funds, one of the first suites of target date funds (now the Wells Fargo Advantage Dow Jones Target Date FundsSM). |
| 1996 | | Evergreen Investments and Keystone Funds merge. |
| 1997 | | Wells Fargo launches the Wells Fargo Advantage WealthBuilder PortfoliosSM, a fund-of-funds suite of products that includes the use of quantitative models to shift assets among investment styles. |
| 1999 | | Norwest Advantage Funds and Stagecoach Funds are reorganized into Wells Fargo Funds after the merger of Norwest and Wells Fargo. |
| 2002 | | Evergreen Retail and Evergreen Institutional companies form the umbrella asset management company, Evergreen Investments. |
| 2005 | | The integration of Strong Funds with Wells Fargo Funds creates Wells Fargo Advantage Funds, resulting in one of the top 20 mutual fund companies in the United States. |
| 2006 | | Wells Fargo Advantage Funds relaunches the target date product line as Wells Fargo Advantage Dow Jones Target Date Funds. |
| 2010 | | The mergers and reorganizations of Evergreen and Wells Fargo Advantage mutual funds are completed, unifying the families under the brand of Wells Fargo Advantage Funds. |
Wells Fargo Advantage Funds®
Wells Fargo Advantage Funds skillfully guides institutions, financial advisors, and individuals through the investment terrain to help them reach their financial objectives. Everything we do on behalf of investors is backed by our unique combination of qualifications.
Strength
Our organization is built on the standards of integrity and service established by our parent company—Wells Fargo & Company—more than 150 years ago. And, because we’re part of a highly diversified financial enterprise, we offer the depth of resources to help investors succeed.
Expertise
Our multi-boutique model offers investors access to the independent thinking of premier investment managers that have been chosen for their time-tested strategies. While each team specializes in a specific investment strategy, collectively they provide investors a wide choice of distinct investment styles. Our dedication to investment excellence doesn’t end with our expertise in manager selection—risk management, analysis, and rigorous ongoing review seek to ensure each manager’s investment process remains consistent.
Partnership
Our collaborative approach is built around understanding the needs and goals of our clients. By adhering to core principles of sound judgment and steady guidance, we support you through every stage of the investment decision process.
Carefully consider the investment objectives, risks, charges, and expenses before investing. For a current prospectus and, if available, a summary prospectus, for Wells Fargo Advantage Funds, containing this and other information, visit wellsfargoadvantagefunds.com. Read it carefully before investing.
Wells Fargo Funds Management, LLC, a wholly owned subsidiary of Wells Fargo & Company, provides investment advisory and administrative services for Wells Fargo Advantage Funds. Other affiliates of Wells Fargo & Company provide subadvisory and other services for the Funds. The Funds are distributed by Wells Fargo Funds Distributor, LLC, Member FINRA/SIPC, an affiliate of Wells Fargo & Company.
“Dow Jones®” and “Dow Jones Target Date IndexesSM” are service marks of Dow Jones Trademark Holdings LLC (“Dow Jones”); have been licensed to CME Group Index Services LLC (“CME Indexes”); and have been sublicensed for use for certain purposes by Global Index Advisors, Inc., and Wells Fargo Funds Management, LLC. The Wells Fargo Advantage Dow Jones Target Date FundsSM, based on the Dow Jones Target Date Indexes, are not sponsored, endorsed, sold, or promoted by Dow Jones, CME Indexes, or their respective affiliates, and none of them makes any representation regarding the advisability of investing in such product(s).
NOT FDIC INSURED ¡ NO BANK GUARANTEE ¡ MAY LOSE VALUE
Not part of the semi-annual report.
Wells Fargo Advantage Funds offers more than 100 mutual funds across a wide range of asset classes, representing over $228 billion in assets under management, as of April 30, 2013.
| | | | |
| Equity funds | | | | |
Asia Pacific Fund | | Enterprise Fund† | | Opportunity Fund† |
C&B Large Cap Value Fund | | Global Opportunities Fund | | Precious Metals Fund |
C&B Mid Cap Value Fund | | Growth Fund | | Premier Large Company Growth Fund |
Capital Growth Fund | | Index Fund | | Small Cap Opportunities Fund |
Common Stock Fund | | International Equity Fund | | Small Cap Value Fund |
Disciplined U.S. Core Fund | | International Value Fund | | Small Company Growth Fund |
Discovery Fund† | | Intrinsic Small Cap Value Fund | | Small Company Value Fund |
Diversified Equity Fund | | Intrinsic Value Fund | | Small/Mid Cap Value Fund |
Diversified International Fund | | Intrinsic World Equity Fund | | Special Mid Cap Value Fund |
Emerging Growth Fund | | Large Cap Core Fund | | Special Small Cap Value Fund |
Emerging Markets Equity Fund | | Large Cap Growth Fund | | Specialized Technology Fund |
Emerging Markets Equity Income Fund | | Large Company Value Fund | | Traditional Small Cap Growth Fund |
Endeavor Select Fund† | | Omega Growth Fund | | Utility and Telecommunications Fund |
| Bond funds | | | | |
Adjustable Rate Government Fund | | High Yield Municipal Bond Fund | | Short-Term Bond Fund |
California Limited-Term Tax-Free Fund | | Income Plus Fund | | Short-Term High Yield Bond Fund |
California Tax-Free Fund | | Inflation-Protected Bond Fund | | Short-Term Municipal Bond Fund |
Colorado Tax-Free Fund | | Intermediate Tax/AMT-Free Fund | | Strategic Income Fund |
Conservative Income Fund | | International Bond Fund | | Strategic Municipal Bond Fund |
Core Bond Fund | | Minnesota Tax-Free Fund | | Ultra Short-Term Income Fund |
Emerging Markets Local Bond Fund | | Municipal Bond Fund | | Ultra Short-Term Municipal Income Fund |
Government Securities Fund | | North Carolina Tax-Free Fund | | Wisconsin Tax-Free Fund |
High Income Fund | | Pennsylvania Tax-Free Fund | | |
High Yield Bond Fund | | Short Duration Government Bond Fund | | |
| Asset allocation funds | | | | |
Absolute Return Fund | | WealthBuilder Equity Portfolio† | | Target 2020 Fund† |
Asset Allocation Fund | | WealthBuilder Growth Allocation Portfolio† | | Target 2025 Fund† |
Diversified Capital Builder Fund | | WealthBuilder Growth Balanced Portfolio† | | Target 2030 Fund† |
Diversified Income Builder Fund | | WealthBuilder Moderate Balanced Portfolio† | | Target 2035 Fund† |
Growth Balanced Fund | | WealthBuilder Tactical Equity Portfolio† | | Target 2040 Fund† |
Index Asset Allocation Fund | | Target Today Fund† | | Target 2045 Fund† |
Moderate Balanced Fund | | Target 2010 Fund† | | Target 2050 Fund† |
WealthBuilder Conservative Allocation Portfolio† | | Target 2015 Fund† | | Target 2055 Fund† |
| Money market funds | | | | |
100% Treasury Money Market Fund | | Heritage Money Market Fund† | | National Tax-Free Money Market Fund |
California Municipal Money Market Fund | | Money Market Fund | | Treasury Plus Money Market Fund |
Cash Investment Money Market Fund | | Municipal Cash Management Money Market Fund | | |
Government Money Market Fund | | Municipal Money Market Fund | | |
| Variable trust funds1 | | | | |
VT Discovery Fund† | | VT Intrinsic Value Fund | | VT Small Cap Growth Fund |
VT Index Asset Allocation Fund | | VT Omega Growth Fund | | VT Small Cap Value Fund |
VT International Equity Fund | | VT Opportunity Fund† | | VT Total Return Bond Fund |
An investment in a money market fund is not insured or guaranteed by the Federal Deposit Insurance Corporation or any other government agency. Although the Wells Fargo Advantage Money Market Funds seek to preserve the value of your investment at $1.00 per share, it is possible to lose money by investing in a money market fund.
| 1. | The variable trust funds are generally available only through insurance company variable contracts. |
| † | In this report, the Wells Fargo Advantage Discovery FundSM, Wells Fargo Advantage Endeavor Select FundSM, Wells Fargo Advantage Enterprise FundSM, Wells Fargo Advantage Opportunity FundSM, Wells Fargo Advantage WealthBuilder Conservative Allocation PortfolioSM, Wells Fargo Advantage WealthBuilder Equity PortfolioSM, Wells Fargo Advantage WealthBuilder Growth Allocation PortfolioSM, Wells Fargo Advantage WealthBuilder Growth Balanced PortfolioSM, Wells Fargo Advantage WealthBuilder Moderate Balanced PortfolioSM, Wells Fargo Advantage WealthBuilder Tactical Equity PortfolioSM, Wells Fargo Advantage Dow Jones Target Today FundSM, Wells Fargo Advantage Dow Jones Target 2010 FundSM, Wells Fargo Advantage Dow Jones Target 2015 FundSM, Wells Fargo Advantage Dow Jones Target 2020 FundSM, Wells Fargo Advantage Dow Jones Target 2025 FundSM, Wells Fargo Advantage Dow Jones Target 2030 FundSM, Wells Fargo Advantage Dow Jones Target 2035 FundSM, Wells Fargo Advantage Dow Jones Target 2040 FundSM, Wells Fargo Advantage Dow Jones Target 2045 FundSM, Wells Fargo Advantage Dow Jones Target 2050 FundSM, Wells Fargo Advantage Dow Jones Target 2055 FundSM, Wells Fargo Advantage Heritage Money Market FundSM, Wells Fargo Advantage VT Discovery FundSM, and Wells Fargo Advantage VT Opportunity FundSM are referred to as the Discovery Fund, Endeavor Select Fund, Enterprise Fund, Opportunity Fund, WealthBuilder Conservative Allocation Portfolio, WealthBuilder Equity Portfolio, WealthBuilder Growth Allocation Portfolio, WealthBuilder Growth Balanced Portfolio, WealthBuilder Moderate Balanced Portfolio, WealthBuilder Tactical Equity Portfolio, Target Today Fund, Target 2010 Fund, Target 2015 Fund, Target 2020 Fund, Target 2025 Fund, Target 2030 Fund, Target 2035 Fund, Target 2040 Fund, Target 2045 Fund, Target 2050 Fund, Target 2055 Fund, Heritage Money Market Fund, VT Discovery Fund, and VT Opportunity Fund, respectively. |
Not part of the semi-annual report.
| | | | |
| 2 | | Wells Fargo Advantage Intrinsic Small Cap Value Fund | | Letter to shareholders (unaudited) |

Karla M. Rabusch
President
Wells Fargo Advantage Funds
Relatively improving economic data in the U.S. and efforts by European authorities to address the sovereign debt issue alleviated investor fears and supported global stock markets.
Dear Valued Shareholder:
We are pleased to offer you this semi-annual report for the Wells Fargo Advantage Intrinsic Small Cap Value Fund for the six-month period that ended April 30, 2013. Much of the six-month period was marked by continued concerns about the possible effects that the ongoing European sovereign debt crisis would have on the global economy. However, relatively improving economic data in the U.S. and efforts by European authorities to address the sovereign debt issue alleviated investor fears and supported global stock markets. This backdrop enabled most equity asset classes to generate positive returns. For the six-month period, the small-cap-oriented Russell 2000® Index1 returned 16.58%, while the mid-cap-focused Russell Midcap® Index2 posted an 18.90% total return.
The U.S. economy improved with the support of accommodative monetary policy.
The U.S. economy grew modestly, but the recovery remained weak compared with previous business cycles. Curtailed government spending and weak household income expectations were economic headwinds. However, the unemployment rate continued to decline, reaching 7.5% in April 2013, and housing market activity, as measured by many metrics—sales, building permits, and prices—continued to improve from its recessionary levels.
Citing its dual mandate of fostering maximum employment and price stability, the U.S. Federal Reserve (Fed) reaffirmed its commitment to highly accommodative monetary policy. In addition, the Fed formally announced that exceptionally low interest rates would be appropriate at least as long as the unemployment rate remains above 6.5% and inflation remains no more than half a percentage point above its 2.0% inflation target.
The Fed also continued its quantitative easing program. Just prior to the beginning of the reporting period, the Federal Open Market Committee announced its intention to keep interest rates low until at least mid-2015 in order to support the sluggish economy. The Fed also announced open-ended purchases of $40 billion per month in mortgage-backed securities in an effort to support the housing market.
The global economy continues to be affected by bouts of uncertainty, including political questions in the U.S., Europe, and China.
Global economic growth varied across countries. Eurozone economies remained in recession. However, the European Central Bank (ECB) and several key members of the eurozone, including France and Germany, continued their commitment to maintaining a single currency. Subsequently, investor fears about a sovereign debt crisis in Europe abated. Furthermore, the ECB maintained its accommodative monetary policy by lowering its key rate at a historic low of 0.75%.
For most of the six-month period, uncertainty about political outcomes was a constant. U.S. presidential elections in November 2012, the debate over the fiscal cliff and tax rates at year-end, and speculation about the effects of sequestration at the end of February 2013 weighed on business leaders and investors. Elections in eurozone countries such as Greece, France, and Italy sparked speculation about the future of the eurozone. New leadership in China also figured into the political landscape. In the end, investors managed around these concerns, and capital markets generally advanced during this time period.
| 1. | The Russell 2000® Index measures the performance of the 2,000 smallest companies in the Russell 3000® Index, which represents approximately 8% of the total market capitalization of the Russell 3000 Index. You cannot invest directly in an index. |
| 2. | The Russell Midcap® Index measures the performance of the 800 smallest companies in the Russell 1000® Index, which represent approximately 25% of the total market capitalization of the Russell 1000 Index. You cannot invest directly in an index. |
| | | | | | |
| Letter to shareholders (unaudited) | | Wells Fargo Advantage Intrinsic Small Cap Value Fund | | | 3 | |
Our goal is to meet the financial needs of our shareholders.
We are committed to providing our shareholders long-term investment strategies and focusing on appropriate risk while seeking to deliver consistent returns. We know that your ability to meet your long-term investment goals depends on the investment decisions you make today. Despite economic uncertainties and investment challenges, staying invested and adapting to emerging opportunities and threats will help you manage investment risk.
Thank you for choosing to invest with Wells Fargo Advantage Funds. We appreciate your confidence in us and remain committed to helping you meet your financial needs. For current information about your fund investments, contact your investment professional, visit our website at wellsfargoadvantagefunds.com, or call us directly at 1-800-222-8222. We are available 24 hours a day, 7 days a week.
Sincerely,

Karla M. Rabusch
President
Wells Fargo Advantage Funds
Despite economic uncertainties and investment challenges, staying invested and adapting to emerging opportunities and threats will help you manage investment risk.
| | | | |
| 4 | | Wells Fargo Advantage Intrinsic Small Cap Value Fund | | Performance highlights (unaudited) |
Investment objective
The Fund seeks long-term capital appreciation.
Adviser
Wells Fargo Funds Management, LLC
Subadviser
Metropolitan West Capital Management, LLC
Portfolio managers
Alex Alvarez, CFA Samir Sikka
Average annual total returns1 (%) as of April 30, 2013
| | | | | | | | | | | | | | | | | | | | | | | | | | | | | | | | | | |
| | | | | Including sales charge | | | Excluding sales charge | | | Expense ratios2 (%) | |
| | | Inception date | | 1 year | | | 5 year | | | 10 year | | | 1 year | | | 5 year | | | 10 year | | | Gross | | | Net3 | |
| Class A (WFSMX) | | 3-31-2008 | | | 15.77 | | | | 4.70 | | | | 10.02 | | | | 22.81 | | | | 5.95 | | | | 10.67 | | | | 1.48 | | | | 1.46 | |
| Class C (WSCDX) | | 3-31-2008 | | | 20.97 | | | | 5.17 | | | | 9.95 | | | | 21.97 | | | | 5.17 | | | | 9.95 | | | | 2.23 | | | | 2.21 | |
| Administrator Class (WFSDX) | | 4-8-2005 | | | – | | | | – | | | | – | | | | 23.06 | | | | 6.20 | | | | 10.93 | | | | 1.32 | | | | 1.21 | |
| Institutional Class (WFSSX) | | 4-8-2005 | | | – | | | | – | | | | – | | | | 23.48 | | | | 6.44 | | | | 11.11 | | | | 1.05 | | | | 1.01 | |
| Investor Class (SCOVX) | | 3-28-2002 | | | – | | | | – | | | | – | | | | 22.84 | | | | 5.91 | | | | 10.65 | | | | 1.54 | | | | 1.50 | |
| Russell 2000® Value Index4 | | – | | | – | | | | – | | | | – | | | | 19.71 | | | | 6.60 | | | | 10.28 | | | | – | | | | – | |
Figures quoted represent past performance, which is no guarantee of future results and do not reflect the deduction of taxes that a shareholder may pay on fund distributions or the redemption of fund shares. Investment return and principal value of an investment will fluctuate so that an investor’s shares, when redeemed, may be worth more or less than their original cost. Performance shown without sales charges would be lower if sales charges were reflected. Current performance may be lower or higher than the performance data quoted, which assumes the reinvestment of dividends and capital gains. Current month-end performance is available on the Fund’s website, wellsfargoadvantagefunds.com.
Index returns do not include transaction costs associated with buying and selling securities, any mutual fund fees or expenses, or any taxes. It is not possible to invest directly in an index.
For Class A shares, the maximum front-end sales charge is 5.75%. For Class C shares, the maximum contingent deferred sales charge is 1.00%. Performance including sales charge assumes the sales charge for the corresponding time period. Administrator Class, Institutional Class, and Investor Class shares are sold without a front-end sales charge or contingent deferred sales charge.
Stock values fluctuate in response to the activities of individual companies and general market and economic conditions. Smaller-company stocks tend to be more volatile and less liquid than those of larger companies. Certain investment strategies tend to increase the total risk of an investment (relative to the broader market). Consult the Fund’s prospectus for additional information on these and other risks.
Please see footnotes on page 5.
| | | | | | |
| Performance highlights (unaudited) | | Wells Fargo Advantage Intrinsic Small Cap Value Fund | | | 5 | |
| | | | |
| Ten largest equity holdings5 (%) as of April 30, 2013 | |
Kar Auction Services Incorporated | | | 3.73 | |
OfficeMax Incorporated | | | 2.58 | |
Stancorp Financial Group Incorporated | | | 2.56 | |
Zions Bancorporation | | | 2.55 | |
Jones Group Incorporated | | | 2.42 | |
Ascena Retail Group Incorporated | | | 2.38 | |
IDEX Corporation | | | 2.20 | |
VeriFone Systems Incorporated | | | 2.04 | |
Jabil Circuit Incorporated | | | 1.96 | |
Steris Corporation | | | 1.96 | |
|
| Sector distribution6 as of April 30, 2013 |
|
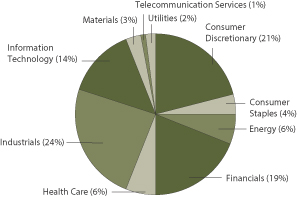
|
| 1. | Prior to June 1, 2010, the Fund was named Wells Fargo Advantage Small Cap Disciplined Fund. Metropolitan West Capital Management, LLC replaced Wells Capital Management as a subadviser for the Fund effective June 1, 2010. Accordingly, performance figures shown prior to June 1, 2010, do not reflect the principal investment strategies or performance of Metropolitan West Capital Management, LLC. Historical performance shown for Class A, the Administrator Class, and the Institutional Class shares prior to their inception reflects the performance of the Investor Class shares, and includes the higher expenses applicable to the Investor Class shares. If these expenses had not been included, returns would be higher. Historical performance shown for Class C shares prior to their inception reflects the performance of the Investor Class shares, adjusted to reflect the higher expenses applicable to Class C shares. |
| 2. | Reflects the expense ratios as stated in the most recent prospectuses. |
| 3. | The Adviser has committed through February 28, 2014, to waive fees and/or reimburse expenses to the extent necessary to cap the Fund’s Total Annual Fund Operating Expenses After Fee Waiver, excluding certain expenses, at 1.45% for Class A, 2.20% for Class C, 1.20% for Administrator Class, 1.00% for Institutional Class, and 1.49% for Investor Class. Brokerage commissions, stamp duty fees, interest, taxes, acquired fund fees and expenses, and extraordinary expenses are excluded from the cap. Without this cap, the Fund’s returns would have been lower. |
| 4. | The Russell 2000® Value Index measures the performance of those Russell 2000 companies with lower price-to-book ratios and lower forecasted growth values. You cannot invest directly in an index. |
| 5. | The ten largest equity holdings are calculated based on the value of the securities divided by total net assets of the Fund. Holdings are subject to change and may have changed since the date specified. |
| 6. | Sector distribution is subject to change and is calculated based on the total long-term investments of the Fund. |
| | | | |
| 6 | | Wells Fargo Advantage Intrinsic Small Cap Value Fund | | Fund expenses (unaudited) |
As a shareholder of the Fund, you incur two types of costs: (1) transaction costs, including sales charges (loads) on purchase payments and contingent deferred sales charges (if any) on redemptions and (2) ongoing costs, including management fees, distribution (12b-1) and/or shareholder service fees, and other Fund expenses. This example is intended to help you understand your ongoing costs (in dollars) of investing in the Fund and to compare these costs with the ongoing costs of investing in other mutual funds.
The example is based on an investment of $1,000 invested at the beginning of the six-month period and held for the entire period from November 1, 2012 to April 30, 2013.
Actual expenses
The “Actual” line of the table below provides information about actual account values and actual expenses. You may use the information in this line, together with the amount you invested, to estimate the expenses that you paid over the period. Simply divide your account value by $1,000 (for example, an $8,600 account value divided by $1,000 = 8.6), then multiply the result by the number in the “Actual” line under the heading entitled “Expenses paid during period” for your
applicable class of shares to estimate the expenses you paid on your account during this period.
Hypothetical example for comparison purposes
The “Hypothetical” line of the table below provides information about hypothetical account values and hypothetical expenses based on the Fund’s actual expense ratio and an assumed rate of return of 5% per year before expenses, which is not the Fund’s actual return. The hypothetical account values and expenses may not be used to estimate the actual ending account balance or expenses you paid for the period. You may use this information to compare the ongoing costs of investing in the Fund and other funds. To do so, compare this 5% hypothetical example with the 5% hypothetical examples that appear in the shareholder reports of the other funds.
Please note that the expenses shown in the table are meant to highlight your ongoing costs only and do not reflect any transactional costs, such as sales charges (loads) and contingent deferred sales charges. Therefore, the “Hypothetical” line of the table is useful in comparing ongoing costs only and will not help you determine the relative total costs of owning different funds. In addition, if these transactional costs were included, your costs would have been higher.
| | | | | | | | | | | | | | | | |
| | | Beginning
account value
11-1-2012 | | | Ending
account value
4-30-2013 | | | Expenses
paid during
the period1 | | | Net annual
expense ratio | |
Class A | | | | | | | | | | | | | | | | |
Actual | | $ | 1,000.00 | | | $ | 1,214.28 | | | $ | 7.96 | | | | 1.45 | % |
Hypothetical (5% return before expenses) | | $ | 1,000.00 | | | $ | 1,017.60 | | | $ | 7.25 | | | | 1.45 | % |
Class C | | | | | | | | | | | | | | | | |
Actual | | $ | 1,000.00 | | | $ | 1,210.18 | | | $ | 12.06 | | | | 2.20 | % |
Hypothetical (5% return before expenses) | | $ | 1,000.00 | | | $ | 1,013.88 | | | $ | 10.99 | | | | 2.20 | % |
Administrator Class | | | | | | | | | | | | | | | | |
Actual | | $ | 1,000.00 | | | $ | 1,215.35 | | | $ | 6.59 | | | | 1.20 | % |
Hypothetical (5% return before expenses) | | $ | 1,000.00 | | | $ | 1,018.84 | | | $ | 6.01 | | | | 1.20 | % |
Institutional Class | | | | | | | | | | | | | | | | |
Actual | | $ | 1,000.00 | | | $ | 1,218.14 | | | $ | 5.50 | | | | 1.00 | % |
Hypothetical (5% return before expenses) | | $ | 1,000.00 | | | $ | 1,019.84 | | | $ | 5.01 | | | | 1.00 | % |
Investor Class | | | | | | | | | | | | | | | | |
Actual | | $ | 1,000.00 | | | $ | 1,213.65 | | | $ | 8.18 | | | | 1.49 | % |
Hypothetical (5% return before expenses) | | $ | 1,000.00 | | | $ | 1,017.41 | | | $ | 7.45 | | | | 1.49 | % |
| 1. | Expenses paid is equal to the annualized expense ratio of each class multiplied by the average account value over the period, multiplied by the number of days in the most recent fiscal half-year divided by the number of days in the fiscal year (to reflect the one-half-year period). |
| | | | | | |
| Portfolio of investments—April 30, 2013 (unaudited) | | Wells Fargo Advantage Intrinsic Small Cap Value Fund | | | 7 | |
| | | | | | | | | | | | |
| Security name | | | | | | Shares | | | Value | |
| | | | | | | | | | | |
| | | | |
Common Stocks: 94.91% | | | | | | | | | | | | |
| | | | |
Consumer Discretionary: 20.25% | | | | | | | | | | | | |
| | | | |
| Auto Components: 1.53% | | | | | | | | | | | | |
Dana Holding Corporation | | | | | | | 64,000 | | | $ | 1,104,000 | |
| | | | | | | | | | | | |
| | | | |
| Automobiles: 1.51% | | | | | | | | | | | | |
Thor Industries Incorporated « | | | | | | | 29,500 | | | | 1,094,153 | |
| | | | | | | | | | | | |
| | | | |
| Hotels, Restaurants & Leisure: 1.26% | | | | | | | | | | | | |
Six Flags Entertainment Corporation | | | | | | | 12,500 | | | | 910,875 | |
| | | | | | | | | | | | |
| | | | |
| Specialty Retail: 11.99% | | | | | | | | | | | | |
Abercrombie & Fitch Company Class A | | | | | | | 28,000 | | | | 1,387,680 | |
Aeropostale Incorporated Ǡ | | | | | | | 81,000 | | | | 1,187,460 | |
Ascena Retail Group Incorporated † | | | | | | | 93,000 | | | | 1,720,500 | |
Chico’s FAS Incorporated | | | | | | | 52,780 | | | | 964,291 | |
DSW Incorporated Class A | | | | | | | 10,500 | | | | 694,260 | |
Group 1 Automotive Incorporated « | | | | | | | 14,000 | | | | 846,720 | |
OfficeMax Incorporated | | | | | | | 162,000 | | | | 1,864,620 | |
| | | | |
| | | | | | | | | | | 8,665,531 | |
| | | | | | | | | | | | |
| | | | |
| Textiles, Apparel & Luxury Goods: 3.96% | | | | | | | | | | | | |
Carter’s Incorporated † | | | | | | | 17,000 | | | | 1,111,630 | |
Jones Group Incorporated « | | | | | | | 125,080 | | | | 1,751,120 | |
| | | | |
| | | | | | | | | | | 2,862,750 | |
| | | | | | | | | | | | |
| | | | |
Consumer Staples: 3.43% | | | | | | | | | | | | |
| | | | |
| Food Products: 3.43% | | | | | | | | | | | | |
Flowers Foods Incorporated | | | | | | | 32,000 | | | | 1,054,080 | |
J & J Snack Foods Corporation | | | | | | | 9,250 | | | | 693,935 | |
TreeHouse Foods Incorporated † | | | | | | | 11,500 | | | | 732,665 | |
| | | | |
| | | | | | | | | | | 2,480,680 | |
| | | | | | | | | | | | |
| | | | |
Energy: 5.38% | | | | | | | | | | | | |
| | | | |
| Energy Equipment & Services: 3.58% | | | | | | | | | | | | |
Forum Energy Technologies Incorporated Ǡ | | | | | | | 47,500 | | | | 1,320,975 | |
Helix Energy Solutions Group Incorporated † | | | | | | | 32,500 | | | | 748,800 | |
Tetra Technologies Incorporated † | | | | | | | 56,500 | | | | 515,845 | |
| | | | |
| | | | | | | | | | | 2,585,620 | |
| | | | | | | | | | | | |
| | | | |
| Oil, Gas & Consumable Fuels: 1.80% | | | | | | | | | | | | |
Oasis Petroleum Incorporated † | | | | | | | 38,000 | | | | 1,300,740 | |
| | | | | | | | | | | | |
| | | | |
Financials: 18.68% | | | | | | | | | | | | |
| | | | |
| Capital Markets: 3.68% | | | | | | | | | | | | |
E*TRADE Financial Corporation † | | | | | | | 78,500 | | | | 807,765 | |
Eaton Vance Corporation « | | | | | | | 17,000 | | | | 677,960 | |
Stifel Financial Corporation Ǡ | | | | | | | 36,500 | | | | 1,176,030 | |
| | | | |
| | | | | | | | | | | 2,661,755 | |
| | | | | | | | | | | | |
The accompanying notes are an integral part of these financial statements.
| | | | |
| 8 | | Wells Fargo Advantage Intrinsic Small Cap Value Fund | | Portfolio of investments—April 30, 2013 (unaudited) |
| | | | | | | | | | | | |
| Security name | | | | | | Shares | | | Value | |
| | | | | | | | | | | |
| | | | |
| Commercial Banks: 9.55% | | | | | | | | | | | | |
Associated Banc-Corp « | | | | | | | 88,000 | | | $ | 1,255,760 | |
Cathay General Bancorp | | | | | | | 34,000 | | | | 670,140 | |
Glacier Bancorp Incorporated « | | | | | | | 49,500 | | | | 913,275 | |
Hancock Holding Company | | | | | | | 47,030 | | | | 1,282,508 | |
TCF Financial Corporation « | | | | | | | 64,000 | | | | 931,200 | |
Zions Bancorporation « | | | | | | | 75,000 | | | | 1,846,500 | |
| | | | |
| | | | | | | | | | | 6,899,383 | |
| | | | | | | | | | | | |
| | | | |
| Insurance: 3.53% | | | | | | | | | | | | |
Horace Mann Educators Corporation | | | | | | | 31,300 | | | | 705,815 | |
Stancorp Financial Group Incorporated « | | | | | | | 42,800 | | | | 1,848,104 | |
| | | | |
| | | | | | | | | | | 2,553,919 | |
| | | | | | | | | | | | |
| | | | |
| Real Estate Management & Development: 1.92% | | | | | | | | | | | | |
Jones Lang LaSalle Incorporated | | | | | | | 14,000 | | | | 1,386,280 | |
| | | | | | | | | | | | |
| | | | |
Health Care: 6.03% | | | | | | | | | | | | |
| | | | |
| Health Care Equipment & Supplies: 1.95% | | | | | | | | | | | | |
Steris Corporation | | | | | | | 34,000 | | | | 1,414,060 | |
| | | | | | | | | | | | |
| | | | |
| Health Care Providers & Services: 1.56% | | | | | | | | | | | | |
AMN Healthcare Services Incorporated † | | | | | | | 82,000 | | | | 1,125,860 | |
| | | | | | | | | | | | |
| | | | |
| Life Sciences Tools & Services: 2.52% | | | | | | | | | | | | |
Bio-Rad Laboratories Incorporated Class A † | | | | | | | 8,300 | | | | 993,925 | |
Charles River Laboratories International Incorporated † | | | | | | | 19,000 | | | | 826,310 | |
| | | | |
| | | | | | | | | | | 1,820,235 | |
| | | | | | | | | | | | |
| | | | |
Industrials: 23.20% | | | | | | | | | | | | |
| | | | |
| Commercial Services & Supplies: 8.04% | | | | | | | | | | | | |
ACCO Brands Corporation Ǡ | | | | | | | 66,000 | | | | 445,500 | |
Herman Miller Incorporated | | | | | | | 20,250 | | | | 508,073 | |
Kar Auction Services Incorporated | | | | | | | 120,500 | | | | 2,695,585 | |
Resources Connection Incorporated « | | | | | | | 82,000 | | | | 931,520 | |
Schawk Incorporated « | | | | | | | 44,300 | | | | 450,974 | |
United Stationers Incorporated « | | | | | | | 24,000 | | | | 779,280 | |
| | | | |
| | | | | | | | | | | 5,810,932 | |
| | | | | | | | | | | | |
| | | | |
| Construction & Engineering: 3.19% | | | | | | | | | | | | |
EMCOR Group Incorporated | | | | | | | 30,000 | | | | 1,122,000 | |
Pike Electric Corporation | | | | | | | 75,700 | | | | 1,183,191 | |
| | | | |
| | | | | | | | | | | 2,305,191 | |
| | | | | | | | | | | | |
| | | | |
| Machinery: 6.74% | | | | | | | | | | | | |
Harsco Corporation | | | | | | | 40,500 | | | | 884,115 | |
IDEX Corporation | | | | | | | 30,500 | | | | 1,586,915 | |
Trinity Industries Incorporated | | | | | | | 12,000 | | | | 506,520 | |
The accompanying notes are an integral part of these financial statements.
| | | | | | |
| Portfolio of investments—April 30, 2013 (unaudited) | | Wells Fargo Advantage Intrinsic Small Cap Value Fund | | | 9 | |
| | | | | | | | | | | | |
| Security name | | | | | | Shares | | | Value | |
| | | | | | | | | | | |
| | | | |
| Machinery (continued) | | | | | | | | | | | | |
Wabtec Corporation | | | | | | | 12,850 | | | $ | 1,348,479 | |
Watts Water Technologies Incorporated | | | | | | | 11,500 | | | | 541,190 | |
| | | | |
| | | | | | | | | | | 4,867,219 | |
| | | | | | | | | | | | |
| | | | |
| Marine: 1.45% | | | | | | | | | | | | |
Kirby Corporation Ǡ | | | | | | | 14,000 | | | | 1,048,460 | |
| | | | | | | | | | | | |
| | | | |
| Professional Services: 1.10% | | | | | | | | | | | | |
Korn/Ferry International † | | | | | | | 48,000 | | | | 794,400 | |
| | | | | | | | | | | | |
| | | | |
| Road & Rail: 1.17% | | | | | | | | | | | | |
Landstar System Incorporated | | | | | | | 15,500 | | | | 847,230 | |
| | | | | | | | | | | | |
| | | | |
| Trading Companies & Distributors: 1.51% | | | | | | | | | | | | |
Aercap Holdings NV † | | | | | | | 68,750 | | | | 1,091,063 | |
| | | | | | | | | | | | |
| | | | |
Information Technology: 13.12% | | | | | | | | | | | | |
| | | | |
| Communications Equipment: 1.00% | | | | | | | | | | | | |
Plantronics Incorporated | | | | | | | 16,500 | | | | 723,030 | |
| | | | | | | | | | | | |
| | | | |
| Computers & Peripherals: 2.17% | | | | | | | | | | | | |
Avid Technology Incorporated † | | | | | | | 118,500 | | | | 780,915 | |
Electronics For Imaging Incorporated † | | | | | | | 29,400 | | | | 785,568 | |
| | | | | | | | | | | 1,566,483 | |
| | | | | | | | | | | | |
| | | | |
| Electronic Equipment, Instruments & Components: 1.96% | | | | | | | | | | | | |
Jabil Circuit Incorporated | | | | | | | 79,500 | | | | 1,415,100 | |
| | | | | | | | | | | | |
| | | | |
| Internet Software & Services: 0.98% | | | | | | | | | | | | |
WebMD Health Corporation Ǡ | | | | | | | 29,500 | | | | 712,425 | |
| | | | | | | | | | | | |
| | | | |
| IT Services: 2.99% | | | | | | | | | | | | |
DST Systems Incorporated | | | | | | | 10,000 | | | | 691,500 | |
VeriFone Systems Incorporated † | | | | | | | 68,500 | | | | 1,471,380 | |
| | | | | | | | | | | 2,162,880 | |
| | | | | | | | | | | | |
| | | | |
| Semiconductors & Semiconductor Equipment: 2.24% | | | | | | | | | | | | |
ATMI Incorporated † | | | | | | | 28,000 | | | | 609,000 | |
International Rectifier Corporation Ǡ | | | | | | | 47,500 | | | | 1,007,475 | |
| | | | | | | | | | | 1,616,475 | |
| | | | | | | | | | | | |
| | | | |
| Software: 1.78% | | | | | | | | | | | | |
Informatica Corporation † | | | | | | | 39,000 | | | | 1,284,270 | |
| | | | | | | | | | | | |
| | | | |
Materials: 2.55% | | | | | | | | | | | | |
| | | | |
| Construction Materials: 1.21% | | | | | | | | | | | | |
Texas Industries Incorporated Ǡ | | | | | | | 13,750 | | | | 875,600 | |
| | | | | | | | | | | | |
| | | | |
| Metals & Mining: 1.34% | | | | | | | | | | | | |
Walter Industries Incorporated | | | | | | | 54,000 | | | | 967,680 | |
| | | | | | | | | | | | |
The accompanying notes are an integral part of these financial statements.
| | | | |
| 10 | | Wells Fargo Advantage Intrinsic Small Cap Value Fund | | Portfolio of investments—April 30, 2013 (unaudited) |
| | | | | | | | | | | | | | | | |
| Security name | | | | | | | | | Shares | | | Value | |
| | | | | | | | | | | | | | |
| | | | | |
Telecommunication Services: 0.70% | | | | | | | | | | | | | | | | |
| | | | | |
| Diversified Telecommunication Services: 0.70% | | | | | | | | | | | | | | | | |
General Communication Incorporated Class A Ǡ | | | | | | | | | | | 52,000 | | | $ | 504,920 | |
| | | | | | | | | | | | | | | | |
| | | | | |
Utilities: 1.57% | | | | | | | | | | | | | | | | |
| | | | | |
| Electric Utilities: 1.57% | | | | | | | | | | | | | | | | |
Westar Energy Incorporated | | | | | | | | | | | 32,500 | | | | 1,136,201 | |
| | | | | | | | | | | | | | | | |
| | | | | |
Total Common Stocks (Cost $57,207,798) | | | | | | | | | | | | | | | 68,595,400 | |
| | | | | | | | | | | | | | | | |
| | | | | |
| | | Yield | | | | | | | | | | | |
| | | | | |
Short-Term Investments: 25.44% | | | | | | | | | | | | | | | | |
| | | | | |
| Investment Companies: 25.44% | | | | | | | | | | | | | | | | |
Wells Fargo Advantage Cash Investment Money Market Fund, Select Class (l)(u) | | | 0.13 | % | | | | | | | 3,864,145 | | | | 3,864,145 | |
Wells Fargo Securities Lending Cash Investments, LLC (l)(r)(u)(v) | | | 0.18 | | | | | | | | 14,524,544 | | | | 14,524,544 | |
Total Short-Term Investments (Cost $18,388,689) | | | | | | | | | | | | | | | 18,388,689 | |
| | | | | | | | | | | | | | | | |
| | | | | | | | |
Total investments in securities
(Cost $75,596,487) * | | | 120.35 | % | | | 86,984,089 | |
Other assets and liabilities, net | | | (20.35 | ) | | | (14,709,661 | ) |
| | | | | | | | |
| Total net assets | | | 100.00 | % | | $ | 72,274,428 | |
| | | | | | | | |
| « | All or a portion of this security is on loan. |
| † | Non-income-earning security |
| (l) | Investment in an affiliate |
| (u) | Rate shown is the 7-day annualized yield at period end. |
| (r) | The investment company is exempt from registration under Section 3(c)(7) of the Investment Company Act of 1940, as amended. |
| (v) | Security represents investment of cash collateral received from securities on loan. |
| * | Cost for federal income tax purposes is $76,301,370 and unrealized appreciation (depreciation) consists of: |
| | | | |
Gross unrealized appreciation | | $ | 13,594,610 | |
Gross unrealized depreciation | | | (2,911,891 | ) |
| | | | |
Net unrealized appreciation | | $ | 10,682,719 | |
The accompanying notes are an integral part of these financial statements.
| | | | | | |
| Statement of assets and liabilities—April 30, 2013 (unaudited) | | Wells Fargo Advantage Intrinsic Small Cap Value Fund | | | 11 | |
| | | | |
| | | | |
| |
Assets | | | | |
Investments | | | | |
In unaffiliated securities (including securities on loan), at value (see cost below) | | $ | 68,595,400 | |
In affiliated securities, at value (see cost below) | | | 18,388,689 | |
| | | | |
Total investments, at value (see cost below) | | | 86,984,089 | |
Receivable for investments sold | | | 1,047,419 | |
Receivable for Fund shares sold | | | 59,554 | |
Receivable for dividends | | | 12,059 | |
Receivable for securities lending income | | | 1,714 | |
Prepaid expenses and other assets | | | 48,452 | |
| | | | |
Total assets | | | 88,153,287 | |
| | | | |
| |
Liabilities | | | | |
Payable for investments purchased | | | 1,185,463 | |
Payable for Fund shares redeemed | | | 67,797 | |
Payable upon receipt of securities loaned | | | 14,524,544 | |
Advisory fee payable | | | 36,385 | |
Distribution fees payable | | | 103 | |
Due to other related parties | | | 19,581 | |
Accrued expenses and other liabilities | | | 44,986 | |
| | | | |
Total liabilities | | | 15,878,859 | |
| | | | |
Total net assets | | $ | 72,274,428 | |
| | | | |
| |
NET ASSETS CONSIST OF | | | | |
Paid-in capital | | $ | 136,449,630 | |
Accumulated net investment loss | | | (82,406 | ) |
Accumulated net realized losses on investments | | | (75,480,398 | ) |
Net unrealized gains on investments | | | 11,387,602 | |
| | | | |
Total net assets | | $ | 72,274,428 | |
| | | | |
| |
COMPUTATION OF NET ASSET VALUE AND OFFERING PRICE PER SHARE1 | | | | |
Net assets – Class A | | $ | 722,128 | |
Shares outstanding – Class A | | | 37,260 | |
Net asset value per share – Class A | | | $19.38 | |
Maximum offering price per share – Class A2 | | | $20.56 | |
Net assets – Class C | | $ | 178,099 | |
Shares outstanding – Class C | | | 9,611 | |
Net asset value per share – Class C | | | $18.53 | |
Net assets – Administrator Class | | $ | 10,573,979 | |
Shares outstanding – Administrator Class | | | 538,225 | |
Net asset value per share – Administrator Class | | | $19.65 | |
Net assets – Institutional Class | | $ | 119,462 | |
Shares outstanding – Institutional Class | | | 6,009 | |
Net asset value per share – Institutional Class | | | $19.88 | |
Net assets – Investor Class | | $ | 60,680,760 | |
Shares outstanding – Investor Class | | | 3,160,508 | |
Net asset value per share – Investor Class | | | $19.20 | |
| |
Investments in unaffiliated securities (including securities on loan), at cost | | $ | 57,207,798 | |
| | | | |
Investments in affiliated securities, at cost | | $ | 18,388,689 | |
| | | | |
Total investments, at cost | | $ | 75,596,487 | |
| | | | |
Securities on loan, at value | | $ | 14,156,154 | |
| | | | |
| 1. | The Fund has an unlimited number of authorized shares. |
| 2. | Maximum offering price is computed as 100/94.25 of net asset value. On investments of $50,000 or more, the offering price is reduced. |
The accompanying notes are an integral part of these financial statements.
| | | | |
| 12 | | Wells Fargo Advantage Intrinsic Small Cap Value Fund | | Statement of operations—six months ended April 30, 2013 (unaudited) |
| | | | |
| | | | |
| |
Investment income | | | | |
Dividends | | $ | 526,722 | |
Securities lending income, net | | | 12,283 | |
Income from affiliated securities | | | 2,737 | |
| | | | |
Total investment income | | | 541,742 | |
| | | | |
| |
Expenses | | | | |
Advisory fee | | | 266,736 | |
Administration fees | | | | |
Fund level | | | 16,671 | |
Class A | | | 732 | |
Class C | | | 150 | |
Administrator Class | | | 4,006 | |
Institutional Class | | | 1,791 | |
Investor Class | | | 85,624 | |
Shareholder servicing fees | | | | |
Class A | | | 704 | |
Class C | | | 145 | |
Administrator Class | | | 9,694 | |
Investor Class | | | 66,894 | |
Distribution fees | | | | |
Class C | | | 434 | |
Custody and accounting fees | | | 5,723 | |
Professional fees | | | 14,441 | |
Registration fees | | | 31,657 | |
Shareholder report expenses | | | 15,398 | |
Trustees’ fees and expenses | | | 7,132 | |
Other fees and expenses | | | 2,947 | |
| | | | |
Total expenses | | | 530,879 | |
Less: Fee waivers and/or expense reimbursements | | | (56,373 | ) |
| | | | |
Net expenses | | | 474,506 | |
| | | | |
Net investment income | | | 67,236 | |
| | | | |
| |
REALIZED AND UNREALIZED GAINS (LOSSES) ON INVESTMENTS | | | | |
Net realized gains on investments | | | 9,311,822 | |
Net change in unrealized gains (losses) on investments | | | 2,769,155 | |
| | | | |
Net realized and unrealized gains (losses) on investments | | | 12,080,977 | |
| | | | |
Net increase in net assets resulting from operations | | $ | 12,148,213 | |
| | | | |
The accompanying notes are an integral part of these financial statements.
| | | | | | |
| Statement of changes in net assets | | Wells Fargo Advantage Intrinsic Small Cap Value Fund | | | 13 | |
| | | | | | | | | | | | | | | | |
| | | Six months ended
April 30, 2013 (unaudited) | | | Year ended October 31, 2012 | |
| | | | |
Operations | | | | | | | | | | | | | | | | |
Net investment income (loss) | | | | | | $ | 67,236 | | | | | | | $ | (186,213 | ) |
Net realized gains on investments | | | | | | | 9,311,822 | | | | | | | | 6,704,703 | |
Net change in unrealized gains (losses) on investments | | | | | | | 2,769,155 | | | | | | | | 6,428,200 | |
| | | | | | | | | | | | | | | | |
Net increase in net assets resulting from operations | | | | | | | 12,148,213 | | | | | | | | 12,946,690 | |
| | | | | | | | | | | | | | | | |
| | | | |
| | | Shares | | | | | | | | Shares | | | | | |
Capital share transactions | | | | | | | | | | | | | | | | |
Proceeds from shares sold | | | | | | | | | | | | | | | | |
Class A | | | 18,230 | | | | 323,924 | | | | 13,328 | | | | 199,512 | |
Class C | | | 3,999 | | | | 72,842 | | | | 355 | | | | 5,000 | |
Administrator Class | | | 214,835 | | | | 3,988,466 | | | | 56,016 | | | | 844,905 | |
Institutional Class | | | 6,578 | | | | 110,650 | | | | 259,458 | | | | 3,949,026 | |
Investor Class | | | 546,292 | | | | 9,973,971 | | | | 221,052 | | | | 3,388,707 | |
| | | | | | | | | | | | | | | | |
| | | | | | | 14,469,853 | | | | | | | | 8,387,150 | |
| | | | | | | | | | | | | | | | |
Payment for shares redeemed | | | | | | | | | | | | | | | | |
Class A | | | (3,349 | ) | | | (62,781 | ) | | | (4,395 | ) | | | (65,907 | ) |
Class C | | | (218 | ) | | | (3,925 | ) | | | (2,446 | ) | | | (37,063 | ) |
Administrator Class | | | (97,527 | ) | | | (1,789,745 | ) | | | (319,650 | ) | | | (4,906,982 | ) |
Institutional Class | | | (2,455,438 | ) | | | (40,472,444 | ) | | | (728,732 | ) | | | (11,279,038 | ) |
Investor Class | | | (356,351 | ) | | | (6,312,953 | ) | | | (976,289 | ) | | | (14,554,201 | ) |
| | | | | | | | | | | | | | | | |
| | | | | | | (48,641,848 | ) | | | | | | | (30,843,191 | ) |
| | | | | | | | | | | | | | | | |
Net decrease in net assets resulting from capital share transactions | | | | | | | (34,171,995 | ) | | | | | | | (22,456,041 | ) |
| | | | | | | | | | | | | | | | |
Total decrease in net assets | | | | | | | (22,023,782 | ) | | | | | | | (9,509,351 | ) |
| | | | | | | | | | | | | | | | |
| | | | |
Net assets | | | | | | | | | | | | | | | | |
Beginning of period | | | | | | | 94,298,210 | | | | | | | | 103,807,561 | |
| | | | | | | | | | | | | | | | |
End of period | | | | | | $ | 72,274,428 | | | | | | | $ | 94,298,210 | |
| | | | | | | | | | | | | | | | |
Accumulated net investment loss | | | | | | $ | (82,406 | ) | | | | | | $ | (149,642 | ) |
| | | | | | | | | | | | | | | | |
The accompanying notes are an integral part of these financial statements.
| | | | |
| 14 | | Wells Fargo Advantage Intrinsic Small Cap Value Fund | | Financial highlights |
(For a share outstanding throughout each period)
| | | | | | | | | | | | | | | | | | | | | | | | |
| | | Six months ended
April 30, 2013 (unaudited) | | | Year ended October 31 | |
| CLASS A | | | 2012 | | | 2011 | | | 2010 | | | 2009 | | | 20081 | |
Net asset value, beginning of period | | $ | 15.96 | | | $ | 14.06 | | | $ | 13.81 | | | $ | 11.52 | | | $ | 11.08 | | | $ | 13.72 | |
Net investment income (loss) | | | (0.01 | )2 | | | (0.06 | )2 | | | (0.06 | )2 | | | (0.06 | ) | | | (0.02 | )2 | | | 0.00 | 2,3 |
Net realized and unrealized gains (losses) on investments | | | 3.43 | | | | 1.96 | | | | 0.31 | | | | 2.35 | | | | 0.47 | | | | (2.64 | ) |
| | | | | | | | | | | | | | | | | | | | | | | | |
Total from investment operations | | | 3.42 | | | | 1.90 | | | | 0.25 | | | | 2.29 | | | | 0.45 | | | | (2.64 | ) |
Distributions to shareholders from | | | | | | | | | | | | | | | | | | | | | | | | |
Tax basis return of capital | | | 0.00 | | | | 0.00 | | | | 0.00 | | | | 0.00 | | | | (0.01 | ) | | | 0.00 | |
Net asset value, end of period | | $ | 19.38 | | | $ | 15.96 | | | $ | 14.06 | | | $ | 13.81 | | | $ | 11.52 | | | $ | 11.08 | |
Total return4 | | | 21.43 | % | | | 13.51 | % | | | 1.81 | % | | | 19.88 | % | | | 4.09 | % | | | (19.24 | )% |
Ratios to average net assets (annualized) | | | | | | | | | | | | | | | | | | | | | | | | |
Gross expenses | | | 1.60 | % | | | 1.48 | % | | | 1.44 | % | | | 1.54 | % | | | 1.57 | % | | | 1.55 | % |
Net expenses | | | 1.45 | % | | | 1.45 | % | | | 1.42 | % | | | 1.45 | % | | | 1.45 | % | | | 1.45 | % |
Net investment income (loss) | | | (0.09 | )% | | | (0.38 | )% | | | (0.41 | )% | | | (0.49 | )% | | | (0.17 | )% | | | 0.01 | % |
Supplemental data | | | | | | | | | | | | | | | | | | | | | | | | |
Portfolio turnover rate | | | 31 | % | | | 33 | % | | | 54 | % | | | 147 | % | | | 64 | % | | | 77 | % |
Net assets, end of period (000s omitted) | | | $722 | | | | $357 | | | | $189 | | | | $354 | | | | $290 | | | | $29 | |
| 1. | For the period from March 31, 2008 (commencement of class operations) to October 31, 2008. |
| 2. | Calculated based upon average shares outstanding |
| 3. | Amount is less than $0.005. |
| 4. | Total return calculations do not include any sales charges. Returns for periods of less than one year are not annualized. |
The accompanying notes are an integral part of these financial statements.
| | | | | | |
| Financial highlights | | Wells Fargo Advantage Intrinsic Small Cap Value Fund | | | 15 | |
(For a share outstanding throughout each period)
| | | | | | | | | | | | | | | | | | | | | | | | |
| | | Six months ended
April 30, 2013 (unaudited) | | | Year ended October 31 | |
| CLASS C | | | 2012 | | | 2011 | | | 2010 | | | 2009 | | | 20081 | |
Net asset value, beginning of period | | $ | 15.32 | | | $ | 13.60 | | | $ | 13.45 | | | $ | 11.31 | | | $ | 10.95 | | | $ | 13.61 | |
Net investment loss | | | (0.06 | )2 | | | (0.16 | )2 | | | (0.17 | )2 | | | (0.18 | ) | | | (0.09 | )2 | | | (0.06 | )2 |
Net realized and unrealized gains (losses) on investments | | | 3.27 | | | | 1.88 | | | | 0.32 | | | | 2.32 | | | | 0.45 | | | | (2.60 | ) |
| | | | | | | | | | | | | | | | | | | | | | | | |
Total from investment operations | | | 3.21 | | | | 1.72 | | | | 0.15 | | | | 2.14 | | | | 0.36 | | | | (2.66 | ) |
Net asset value, end of period | | $ | 18.53 | | | $ | 15.32 | | | $ | 13.60 | | | $ | 13.45 | | | $ | 11.31 | | | $ | 10.95 | |
Total return3 | | | 21.02 | % | | | 12.65 | % | | | 1.12 | % | | | 18.92 | % | | | 3.29 | % | | | (19.54 | )% |
Ratios to average net assets (annualized) | | | | | | | | | | | | | | | | | | | | | | | | |
Gross expenses | | | 2.35 | % | | | 2.22 | % | | | 2.19 | % | | | 2.30 | % | | | 2.31 | % | | | 2.33 | % |
Net expenses | | | 2.20 | % | | | 2.20 | % | | | 2.17 | % | | | 2.20 | % | | | 2.20 | % | | | 2.20 | % |
Net investment loss | | | (0.73 | )% | | | (1.12 | )% | | | (1.19 | )% | | | (1.24 | )% | | | (0.90 | )% | | | (0.76 | )% |
Supplemental data | | | | | | | | | | | | | | | | | | | | | | | | |
Portfolio turnover rate | | | 31 | % | | | 33 | % | | | 54 | % | | | 147 | % | | | 64 | % | | | 77 | % |
Net assets, end of period (000s omitted) | | | $178 | | | | $89 | | | | $108 | | | | $142 | | | | $132 | | | | $26 | |
| 1. | For the period from March 31, 2008 (commencement of class operations) to October 31, 2008. |
| 2. | Calculated based upon average shares outstanding |
| 3. | Total return calculations do not include any sales charges. Returns for periods of less than one year are not annualized. |
The accompanying notes are an integral part of these financial statements.
| | | | |
| 16 | | Wells Fargo Advantage Intrinsic Small Cap Value Fund | | Financial highlights |
(For a share outstanding throughout each period)
| | | | | | | | | | | | | | | | | | | | | | | | |
| | | Six months ended
April 30, 2013 (unaudited) | | | Year ended October 31 | |
| ADMINISTRATOR CLASS | | | 2012 | | | 2011 | | | 2010 | | | 2009 | | | 2008 | |
Net asset value, beginning of period | | $ | 16.16 | | | $ | 14.20 | | | $ | 13.91 | | | $ | 11.58 | | | $ | 11.10 | | | $ | 18.10 | |
Net investment income (loss) | | | 0.03 | 1 | | | (0.02 | )1 | | | (0.05 | )1 | | | (0.02 | ) | | | 0.02 | 1 | | | 0.06 | 1 |
Net realized and unrealized gains (losses) on investments | | | 3.46 | | | | 1.98 | | | | 0.34 | | | | 2.35 | | | | 0.46 | | | | (5.70 | ) |
| | | | | | | | | | | | | | | | | | | | | | | | |
Total from investment operations | | | 3.49 | | | | 1.96 | | | | 0.29 | | | | 2.33 | | | | 0.48 | | | | (5.64 | ) |
Distributions to shareholders from | | | | | | | | | | | | | | | | | | | | | | | | |
Net investment income | | | 0.00 | | | | 0.00 | | | | 0.00 | | | | 0.00 | | | | 0.00 | | | | (0.22 | ) |
Net realized gains | | | 0.00 | | | | 0.00 | | | | 0.00 | | | | 0.00 | | | | 0.00 | | | | (1.14 | ) |
| | | | | | | | | | | | | | | | | | | | | | | | |
Total distributions to shareholders | | | 0.00 | | | | 0.00 | | | | 0.00 | | | | 0.00 | | | | 0.00 | | | | (1.36 | ) |
Net asset value, end of period | | $ | 19.65 | | | $ | 16.16 | | | $ | 14.20 | | | $ | 13.91 | | | $ | 11.58 | | | $ | 11.10 | |
Total return2 | | | 21.53 | % | | | 13.80 | % | | | 2.08 | % | | | 20.12 | % | | | 4.32 | % | | | (33.26 | )% |
Ratios to average net assets (annualized) | | | | | | | | | | | | | | | | | | | | | | | | |
Gross expenses | | | 1.43 | % | | | 1.30 | % | | | 1.22 | % | | | 1.37 | % | | | 1.38 | % | | | 1.38 | % |
Net expenses | | | 1.20 | % | | | 1.20 | % | | | 1.19 | % | | | 1.20 | % | | | 1.20 | % | | | 1.20 | % |
Net investment income (loss) | | | 0.34 | % | | | (0.12 | )% | | | (0.30 | )% | | | (0.23 | )% | | | 0.18 | % | | | 0.41 | % |
Supplemental data | | | | | | | | | | | | | | | | | | | | | | | | |
Portfolio turnover rate | | | 31 | % | | | 33 | % | | | 54 | % | | | 147 | % | | | 64 | % | | | 77 | % |
Net assets, end of period (000s omitted) | | $ | 10,574 | | | $ | 6,801 | | | $ | 9,722 | | | $ | 5,774 | | | $ | 5,730 | | | $ | 6,447 | |
| 1. | Calculated based upon average shares outstanding |
| 2. | Returns for period of less than one year are not annualized. |
The accompanying notes are an integral part of these financial statements.
| | | | | | |
| Financial highlights | | Wells Fargo Advantage Intrinsic Small Cap Value Fund | | | 17 | |
(For a share outstanding throughout each period)
| | | | | | | | | | | | | | | | | | | | | | | | |
| | | Six months ended
April 30, 2013 (unaudited) | | | Year ended October 31 | |
| INSTITUTIONAL CLASS | | | 2012 | | | 2011 | | | 2010 | | | 2009 | | | 2008 | |
Net asset value, beginning of period | | $ | 16.32 | | | $ | 14.32 | | | $ | 14.00 | | | $ | 11.63 | | | $ | 11.15 | | | $ | 18.19 | |
Net investment income (loss) | | | 0.11 | 1 | | | 0.01 | 1 | | | 0.00 | 1,2 | | | (0.00 | )1,2 | | | 0.04 | 1 | | | 0.09 | 1 |
Net realized and unrealized gains (losses) on investments | | | 3.45 | | | | 1.99 | | | | 0.32 | | | | 2.37 | | | | 0.47 | | | | (5.73 | ) |
| | | | | | | | | | | | | | | | | | | | | | | | |
Total from investment operations | | | 3.56 | | | | 2.00 | | | | 0.32 | | | | 2.37 | | | | 0.51 | | | | (5.64 | ) |
Distributions to shareholders from | | | | | | | | | | | | | | | | | | | | | | | | |
Net investment income | | | 0.00 | | | | 0.00 | | | | 0.00 | | | | 0.00 | | | | 0.00 | | | | (0.26 | ) |
Net realized gains | | | 0.00 | | | | 0.00 | | | | 0.00 | | | | 0.00 | | | | 0.00 | | | | (1.14 | ) |
Tax basis return of capital | | | 0.00 | | | | 0.00 | | | | 0.00 | | | | 0.00 | | | | (0.03 | ) | | | 0.00 | |
| | | | | | | | | | | | | | | | | | | | | | | | |
Total distributions to shareholders | | | 0.00 | | | | 0.00 | | | | 0.00 | | | | 0.00 | | | | (0.03 | ) | | | (1.40 | ) |
Net asset value, end of period | | $ | 19.88 | | | $ | 16.32 | | | $ | 14.32 | | | $ | 14.00 | | | $ | 11.63 | | | $ | 11.15 | |
Total return3 | | | 21.81 | % | | | 13.97 | % | | | 2.29 | % | | | 20.38 | % | | | 4.61 | % | | | (33.17 | )% |
Ratios to average net assets (annualized) | | | | | | | | | | | | | | | | | | | | | | | | |
Gross expenses | | | 1.10 | % | | | 1.05 | % | | | 1.01 | % | | | 1.10 | % | | | 1.11 | % | | | 1.11 | % |
Net expenses | | | 1.00 | % | | | 1.00 | % | | | 0.98 | % | | | 1.00 | % | | | 1.00 | % | | | 1.00 | % |
Net investment income (loss) | | | 1.33 | % | | | 0.07 | % | | | 0.02 | % | | | (0.03 | )% | | | 0.36 | % | | | 0.60 | % |
Supplemental data | | | | | | | | | | | | | | | | | | | | | | | | |
Portfolio turnover rate | | | 31 | % | | | 33 | % | | | 54 | % | | | 147 | % | | | 64 | % | | | 77 | % |
Net assets, end of period (000s omitted) | | | $119 | | | | $40,073 | | | | $41,861 | | | | $72,200 | | | | $65,014 | | | | $64,444 | |
| 1. | Calculated based upon average shares outstanding |
| 2. | Amount is less than $0.005. |
| 3. | Returns for period of less than one year are not annualized. |
The accompanying notes are an integral part of these financial statements.
| | | | |
| 18 | | Wells Fargo Advantage Intrinsic Small Cap Value Fund | | Financial highlights |
(For a share outstanding throughout each period)
| | | | | | | | | | | | | | | | | | | | | | | | |
| | | Six months ended
April 30, 2013 (unaudited) | | | Year ended October 31 | |
| INVESTOR CLASS | | | 2012 | | | 2011 | | | 2010 | | | 2009 | | | 2008 | |
Net asset value, beginning of period | | $ | 15.81 | | | $ | 13.94 | | | $ | 13.70 | | | $ | 11.43 | | | $ | 10.99 | | | $ | 17.92 | |
Net investment income (loss) | | | 0.01 | 1 | | | (0.06 | )1 | | | (0.07 | )1 | | | (0.06 | )1 | | | (0.01 | )1 | | | 0.02 | 1 |
Net realized and unrealized gains (losses) on investments | | | 3.38 | | | | 1.93 | | | | 0.31 | | | | 2.33 | | | | 0.45 | | | | (5.65 | ) |
| | | | | | | | | | | | | | | | | | | | | | | | |
Total from investment operations | | | 3.39 | | | | 1.87 | | | | 0.24 | | | | 2.27 | | | | 0.44 | | | | (5.63 | ) |
Distributions to shareholders from | | | | | | | | | | | | | | | | | | | | | | | | |
Net investment income | | | 0.00 | | | | 0.00 | | | | 0.00 | | | | 0.00 | | | | 0.00 | | | | (0.16 | ) |
Net realized gains | | | 0.00 | | | | 0.00 | | | | 0.00 | | | | 0.00 | | | | 0.00 | | | | (1.14 | ) |
| | | | | | | | | | | | | | | | | | | | | | | | |
Total distributions to shareholders | | | 0.00 | | | | 0.00 | | | | 0.00 | | | | 0.00 | | | | 0.00 | | | | (1.30 | ) |
Net asset value, end of period | | $ | 19.20 | | | $ | 15.81 | | | $ | 13.94 | | | $ | 13.70 | | | $ | 11.43 | | | $ | 10.99 | |
Total return2 | | | 21.37 | % | | | 13.49 | % | | | 1.75 | % | | | 19.86 | % | | | 4.00 | % | | | (33.46 | )% |
Ratios to average net assets (annualized) | | | | | | | | | | | | | | | | | | | | | | | | |
Gross expenses | | | 1.66 | % | | | 1.54 | % | | | 1.50 | % | | | 1.63 | % | | | 1.67 | % | | | 1.70 | % |
Net expenses | | | 1.49 | % | | | 1.49 | % | | | 1.48 | % | | | 1.49 | % | | | 1.49 | % | | | 1.49 | % |
Net investment income (loss) | | | 0.09 | % | | | (0.42 | )% | | | (0.48 | )% | | | (0.47 | )% | | | (0.12 | )% | | | 0.11 | % |
Supplemental data | | | | | | | | | | | | | | | | | | | | | | | | |
Portfolio turnover rate | | | 31 | % | | | 33 | % | | | 54 | % | | | 147 | % | | | 64 | % | | | 77 | % |
Net assets, end of period (000s omitted) | | | $60,681 | | | | $46,977 | | | | $51,927 | | | | $79,132 | | | | $180,060 | | | | $213,243 | |
| 1. | Calculated based upon average shares outstanding |
| 2. | Returns for period of less than one year are not annualized. |
The accompanying notes are an integral part of these financial statements.
| | | | | | |
| Notes to financial statements (unaudited) | | Wells Fargo Advantage Intrinsic Small Cap Value Fund | | | 19 | |
1. ORGANIZATION
Wells Fargo Funds Trust (the “Trust”), a Delaware statutory trust organized on March 10, 1999, is an open-end management investment company registered under the Investment Company Act of 1940, as amended (the “1940 Act”). These financial statements report on Wells Fargo Advantage Intrinsic Small Cap Value Fund (the “Fund”) which is a diversified series of the Trust.
2. SIGNIFICANT ACCOUNTING POLICIES
The following significant accounting policies, which are consistently followed in the preparation of the financial statements of the Fund, are in conformity with U.S. generally accepted accounting principles which require management to make estimates and assumptions that affect the reported amounts of assets and liabilities, disclosure of contingent assets and liabilities at the date of the financial statements, and the reported amounts of revenues and expenses during the reporting period. Actual results could differ from those estimates.
Securities valuation
All investments are valued each business day as of the close of regular trading on the New York Stock Exchange (normally 4 p.m. Eastern Time).
Equity securities that are listed on a foreign or domestic exchange, except for The Nasdaq Stock Market, Inc. (“Nasdaq”), are valued at the official closing price or, if none, the last sales price. Securities listed on Nasdaq are valued at the Nasdaq Official Closing Price (“NOCP”). If no NOCP is available, securities are valued at the last sales price. If no sales price is shown on the Nasdaq, the bid price will be used. If no sale occurs on the primary exchange or market for the security that day or if no sale occurs and no bid price is shown on Nasdaq, the prior day’s price will be deemed “stale” and fair values will be determined in accordance with the Fund’s Valuation Procedures.
Investments in registered open-end investment companies are valued at net asset value. Non-registered investment companies are fair valued at net asset value.
Investments which are not valued using any of the methods discussed above are valued at their fair value, as determined by procedures established in good faith and approved by the Board of Trustees. The Board of Trustees has established a Valuation Committee comprised of the Trustees and has delegated to it the authority to take any actions regarding the valuation of portfolio securities that the Valuation Committee deems necessary or appropriate, including determining the fair value of portfolio securities, unless the determination has been delegated to the Management Valuation Team of Wells Fargo Funds Management, LLC (“Funds Management”). The Board of Trustees retains the authority to make or ratify any valuation decisions or approve any changes to the Valuation Procedures as it deems appropriate. On a quarterly basis, the Board of Trustees receives reports on any valuation actions taken by the Valuation Committee or the Management Valuation Team which may include items for ratification.
Valuations of fair valued securities are compared to the next actual sales price when available, or other appropriate market information to assess the continued appropriateness of the fair valuation methodology used. These securities are fair valued on a day-to-day basis, taking into consideration changes to appropriate market information and any significant changes to the input factors considered in the valuation process until there is a readily available price provided on the exchange or by an independent pricing service. Valuations received from an independent pricing service or broker quotes are periodically validated by comparisons to most recent trades and valuations provided by other independent pricing services in addition to the review of prices by the adviser and/or subadviser. Unobservable inputs used in determining fair valuations are identified based on the type of security, taking into consideration factors utilized by market participants in valuing the investment, knowledge about the issuer and the current market environment.
Security loans
The Fund may lend its securities from time to time in order to earn additional income in the form of fees or interest on securities received as collateral or the investment of any cash received as collateral. The Fund continues to receive interest or dividends on the securities loaned. The Fund receives collateral in the form of cash or securities with a value at least equal to the value of the securities on loan. The value of the loaned securities is determined at the close of each business day and any additional required collateral is delivered to the Fund on the next business day. In a securities lending transaction, the net asset value of the Fund will be affected by an increase or decrease in the value of the securities loaned and by an increase or decrease in the value of the instrument in which collateral is invested. The amount of securities lending activity undertaken by the Fund fluctuates from time to time. In the event of default or bankruptcy by the borrower, the Fund may be prevented from recovering the loaned securities or gaining access to the collateral or
may experience delays or costs in doing so. In addition, the investment of any cash collateral received may lose all or part of its value. The Fund has the right under the lending agreement to recover the securities from the borrower on demand.
| | | | |
| 20 | | Wells Fargo Advantage Intrinsic Small Cap Value Fund | | Notes to financial statements (unaudited) |
The Fund lends its securities through an unaffiliated securities lending agent. Cash collateral received in connection with its securities lending transactions is invested in Wells Fargo Securities Lending Cash Investments, LLC (the “Cash Collateral Fund”). The Cash Collateral Fund is exempt from registration under Section 3(c)(7) of the 1940 Act and is managed by Funds Management and is subadvised by Wells Capital Management Incorporated (“WellsCap”). Funds Management receives an advisory fee starting at 0.05% and declining to 0.01% as the average daily net assets of the Cash Collateral Fund increase. All of the fees received by Funds Management are paid to WellsCap for its services as subadviser. The Cash Collateral Fund seeks to provide a positive return compared to the daily Fed Funds Open rate by investing in high-quality, U.S. dollar-denominated short-term money market instruments. Cash Collateral Fund investments are fair valued based upon the amortized cost valuation technique. Income earned from investment in the Cash Collateral Fund is included in securities lending income on the Statement of Operations.
Security transactions and income recognition
Securities transactions are recorded on a trade date basis. Realized gains or losses are recorded on the basis of identified cost.
Dividend income is recognized on the ex-dividend date.
Distributions to shareholders
Distributions to shareholders from net investment income and net realized gains, if any, are recorded on the ex-dividend date. Such distributions are determined in conformity with federal income tax regulations, which may differ in amount or character from net investment income and realized gains recognized for purposes of U.S. generally accepted accounting principles.
Federal and other taxes
The Fund intends to continue to qualify as a regulated investment company by distributing substantially all of its investment company taxable income and any net realized capital gains (after reduction for capital loss carryforwards) sufficient to relieve it from all, or substantially all, federal income taxes. Accordingly, no provision for federal income taxes was required.
The Fund’s income and federal excise tax returns and all financial records supporting those returns for the prior three fiscal years are subject to examination by the federal and Delaware revenue authorities. Management has analyzed the Fund’s tax positions taken on federal, state, and foreign tax returns for all open tax years and does not believe that there are any uncertain tax positions that require recognition of a tax liability.
As of October 31, 2012, the Fund had pre-enactment capital loss carryforwards incurred in taxable years beginning before December 22, 2010, which were available to offset future net realized capital gains, in the amount of $82,596,033 with $74,906,323 expiring in 2017 and $7,689,710 expiring in 2018.
As of October 31, 2012, the Fund had a qualified late-year ordinary loss of $149,642 which will be recognized on the first day of the current fiscal year. A late-year ordinary loss is the net loss comprised of (a) net gain or loss from the sale or other disposition of certain capital assets for the portion of the taxable year after October 31 and (b) other ordinary income or loss for the portion of the taxable year after December 31.
Class allocations
The separate classes of shares offered by the Fund differ principally in applicable sales charges, distribution, shareholder servicing, and administration fees. Shareholders of each class bear certain expenses that pertain to that particular class. All shareholders bear the common expenses of the Fund, earn income from the portfolio, and are allocated any unrealized gains and losses pro rata based on the average daily net assets of each class, without distinction between share classes. Dividends are determined separately for each class based on income and expenses allocable to each class. Realized gains and losses are allocated to each class pro rata based upon the net assets of each class on the date realized. Differences in per share dividend rates generally result from the relative weightings of pro rata income and realized gain allocations and from differences in separate class expenses, including distribution, shareholder servicing, and administration fees.
3. FAIR VALUATION MEASUREMENTS
Fair value measurements of investments are determined within a framework that has established a fair value hierarchy based upon the various data inputs utilized in determining the value of the Fund’s investments. The three-level hierarchy gives the highest priority to unadjusted quoted prices in active markets for identical assets or liabilities (Level 1) and the
lowest priority to significant unobservable inputs (Level 3). The Fund’s investments are classified within the fair value
| | | | | | |
| Notes to financial statements (unaudited) | | Wells Fargo Advantage Intrinsic Small Cap Value Fund | | | 21 | |
hierarchy based on the lowest level of input that is significant to the fair value measurement. The inputs are summarized into three broad levels as follows:
| n | | Level 1 – quoted prices in active markets for identical securities |
| n | | Level 2 – other significant observable inputs (including quoted prices for similar securities, interest rates, prepayment speeds, credit risk, use of amortized cost, etc.) |
| n | | Level 3 – significant unobservable inputs (including the Fund’s own assumptions in determining the fair value of investments) |
The inputs or methodologies used for valuing investments in securities are not necessarily an indication of the risk associated with investing in those securities.
As of April 30, 2013, the inputs used in valuing investments in securities were as follows:
| | | | | | | | | | | | | | | | |
| Investments in securities | | Quoted prices (Level 1) | | | Significant other observable inputs (Level 2) | | | Significant unobservable inputs (Level 3) | | | Total | |
| | | | |
Equity securities | | | | | | | | | | | | | | | | |
Common stocks | | $ | 68,595,400 | | | $ | 0 | | | $ | 0 | | | $ | 68,595,400 | |
| | | | |
Short-term investments | | | | | | | | | | | | | | | | |
Investment companies | | | 3,864,145 | | | | 14,524,544 | | | | 0 | | | | 18,388,689 | |
| | | $ | 72,459,545 | | | $ | 14,524,544 | | | $ | 0 | | | $ | 86,984,089 | |
Transfers in and transfers out are recognized at the end of the reporting period. For the six months ended April 30, 2013, the Fund did not have any transfers into/out of Level 1 or Level 2.
4. TRANSACTIONS WITH AFFILIATES AND OTHER EXPENSES
Advisory fee
The Trust has entered into an advisory contract with Funds Management, an indirect wholly owned subsidiary of Wells Fargo & Company (“Wells Fargo”). The adviser is responsible for implementing investment policies and guidelines and for supervising the subadviser, who is responsible for day-to-day portfolio management of the Fund.
Pursuant to the contract, Funds Management is entitled to receive an annual advisory fee starting at 0.80% and declining to 0.70% as the average daily net assets of the Fund increase. For the six months ended April 30, 2013, the advisory fee was equivalent to an annual rate of 0.80% of the Fund’s average daily net assets.
Funds Management has retained the services of a subadviser to provide daily portfolio management to the Fund. The fee for subadvisory services is borne by Funds Management. Metropolitan West Capital Management, LLC, an affiliate of Funds Management, is the subadviser to the Fund and is entitled to receive a fee from Funds Management at an annual rate starting at 0.55% and declining to 0.40% as the average daily net assets of the Fund increase.
Administration and transfer agent fees
The Trust has entered into an administration agreement with Funds Management. Under this agreement, for providing administrative services, which includes paying fees and expenses for services provided by the transfer agent, sub-transfer agents, omnibus account servicers and record-keepers, Funds Management is entitled to receive from the Fund an annual fund level administration fee starting at 0.05% and declining to 0.03% as the average daily net assets of the Fund increase and a class level administration fee which is calculated based on the average daily net assets of each class as follows:
| | | | |
| | | Class level
administration fee | |
Class A, Class C | | | 0.26 | % |
Administrator Class | | | 0.10 | |
Institutional Class | | | 0.08 | |
Investor Class | | | 0.32 | |
| | | | |
| 22 | | Wells Fargo Advantage Intrinsic Small Cap Value Fund | | Notes to financial statements (unaudited) |
Funds Management has contractually waived and/or reimbursed advisory and administration fees to the extent necessary to maintain certain net operating expense ratios for the Fund. Waiver of fees and/or reimbursement of expenses by Funds Management were made first from fund level expenses on a proportionate basis and then from class specific expenses. Funds Management has committed through February 28, 2014 to waive fees and/or reimburse expenses to the extent necessary to cap the Fund’s expenses at 1.45% for Class A shares, 2.20% for Class C shares, 1.20% for Administrator Class shares, 1.00% for Institutional Class shares, and 1.49% for Investor Class shares.
Distribution fees
The Trust has adopted a Distribution Plan for Class C shares of the Fund pursuant to Rule 12b-1 under the 1940 Act. Distribution fees are charged to Class C shares and paid to Wells Fargo Funds Distributor, LLC, the principal underwriter, at an annual rate of 0.75% of the average daily net assets of Class C shares.
For the six months ended April 30, 2013, Wells Fargo Funds Distributor, LLC received $637 from the sale of Class A shares.
Shareholder servicing fees
The Trust has entered into contracts with one or more shareholder servicing agents, whereby Class A, Class C, Administrator Class, and Investor Class of the Fund is charged a fee at an annual rate of 0.25% of the average daily net assets of each respective class.
A portion of these total shareholder servicing fees were paid to affiliates of Wells Fargo.
5. INVESTMENT PORTFOLIO TRANSACTIONS
Purchases and sales of investments, excluding U.S. government obligations (if any) and short-term securities, for the six months ended April 30, 2013 were $25,290,793 and $20,166,367, respectively.
6. BANK BORROWINGS
The Trust (excluding the money market funds and certain other funds in the Trust) and Wells Fargo Variable Trust are parties to a $150,000,000 revolving credit agreement with State Street Bank and Trust Company, whereby the Fund is permitted to use bank borrowings for temporary or emergency purposes, such as to fund shareholder redemption requests. Interest under the credit agreement is charged to the Fund based on a borrowing rate equal to the higher of the Federal Funds rate in effect on that day plus 1.25% or the overnight LIBOR rate in effect on that day plus 1.25%. In addition, an annual commitment fee equal to 0.10% of the unused balance is allocated to each participating fund. For the six months ended April 30, 2013, the Fund paid $78 in commitment fees.
For the six months ended April 30, 2013, there were no borrowings by the Fund under the agreement.
7. INDEMNIFICATION
Under the Trust’s organizational documents, the officers and directors are indemnified against certain liabilities that may arise out of performance of their duties to the Trust. Additionally, in the normal course of business, the Trust may enter into contracts with service providers that contain a variety of indemnification clauses. The Trust’s maximum exposure under these arrangements is dependent on future claims that may be made against the Fund and, therefore, cannot be estimated.
8. REDEMPTION IN-KIND
After the close of business on November 20, 2012, the Fund redeemed assets through an in-kind redemption. In the redemption transaction, the Fund issued securities with a value of $38,549,389 and cash in the amount of $1,451,872. The Fund recognized gains in the amount of $6,259,544, which are reflected on the Statement of Operations. The redemption in-kind by a shareholder of the Institutional Class represented 42% of the Fund and is reflected on the Statement of Changes in Net Assets.
9. NEW ACCOUNTING PRONOUNCEMENT
In December 2011, the Financial Accounting Standards Board (“FASB”) issued Accounting Standard Update (“ASU”) No. 2011-11, Disclosures about Offsetting Assets and Liabilities. ASU 2011-11, which amends FASB ASC Topic 210, Balance Sheet, creates new disclosure requirements which require entities to disclose both gross and net information for derivatives and other financial instruments that are either offset in the Statement of Assets and Liabilities or subject to an enforceable master netting arrangement or similar agreement. The disclosure requirements are effective for interim and annual reporting periods beginning on or after January 1, 2013. Management is currently assessing the potential impact, in addition to expanded financial statement disclosure, that may result from adopting this ASU.
| | | | | | |
| Other information (unaudited) | | Wells Fargo Advantage Intrinsic Small Cap Value Fund | | | 23 | |
PROXY VOTING INFORMATION
A description of the policies and procedures that the Fund uses to determine how to vote proxies relating to portfolio securities is available without charge, upon request, by calling 1-800-222-8222, visiting our website at wellsfargoadvantagefunds.com, or visiting the SEC website at sec.gov. Information regarding how the Fund voted proxies relating to portfolio securities during the most recent 12-month period ended June 30 is available without charge on the Fund’s website at wellsfargoadvantagefunds.com or by visiting the SEC website at sec.gov.
PORTFOLIO HOLDINGS INFORMATION
The complete portfolio holdings for the Fund are publicly available on the Fund’s website (wellsfargoadvantagefunds.com) on a monthly, 30-day or more delayed basis. In addition, top ten holdings information for the Fund is publicly available on the Fund’s website on a monthly, seven-day or more delayed basis. The Fund files its complete schedule of portfolio holdings with the SEC for the first and third quarters of each fiscal year on Form N-Q, which is available without charge by visiting the SEC website at sec.gov. In addition, the Fund’s Form N-Q may be reviewed and copied at the SEC’s Public Reference Room in Washington, DC, and at regional offices in New York City, at 233 Broadway, and in Chicago, at 175 West Jackson Boulevard, Suite 900. Information about the Public Reference Room may be obtained by calling 1-800-SEC-0330.
| | | | |
| 24 | | Wells Fargo Advantage Intrinsic Small Cap Value Fund | | Other information (unaudited) |
BOARD OF TRUSTEES AND OFFICERS
Each of the Trustees and Officers listed in the table below acts in identical capacities for the Wells Fargo Advantage family of funds, which consists of 131 funds1 comprising the Wells Fargo Funds Trust, Wells Fargo Variable Trust, Wells Fargo Master Trust and four closed-end funds (collectively the “Fund Complex”). This table should be read in conjunction with the Prospectus and the Statement of Additional Information2. All of the Trustees are also Members of the Audit and Governance Committees of each Trust in the Fund Complex. The mailing address of each Trustee and Officer is 525 Market Street, 12th Floor, San Francisco, CA 94105. Each Trustee and Officer serves an indefinite term, however, each Trustee serves such term until reaching the mandatory retirement age established by the Trustees.
Independent Trustees
| | | | | | |
Name and year of birth | | Position held and length of service* | | Principal occupations during past five years | | Other directorships during
past five years |
| Peter G. Gordon (Born 1942) | | Trustee, since 1998; Chairman, since 2005 | | Co-Founder, Retired Chairman, President and CEO of Crystal Geyser Water Company. Trustee Emeritus, Colby College. | | Asset Allocation Trust |
| Isaiah Harris, Jr. (Born 1952) | | Trustee, since 2009 | | Retired. Prior thereto, President and CEO of BellSouth Advertising and Publishing Corp. from 2005 to 2007, President and CEO of BellSouth Enterprises from 2004 to 2005 and President of BellSouth Consumer Services from 2000 to 2003. Emeritus member of the Iowa State University Foundation Board of Governors. Emeritus Member of the Advisory Board of Iowa State University School of Business. Advisory Board Member, Palm Coast Academy (charter school). Mr. Harris is a certified public accountant. | | CIGNA Corporation; Deluxe Corporation; Asset Allocation Trust |
| Judith M. Johnson (Born 1949) | | Trustee, since 2008; Audit Committee Chairman, since 2008 | | Retired. Prior thereto, Chief Executive Officer and Chief Investment Officer of Minneapolis Employees Retirement Fund from 1996 to 2008. Ms. Johnson is an attorney, certified public accountant and a certified managerial accountant. | | Asset Allocation Trust |
| Leroy Keith, Jr. (Born 1939) | | Trustee, since 2010 | | Chairman, Bloc Global Services (development and construction). Trustee of the Evergreen Funds from 1983 to 2010. Former Managing Director, Almanac Capital Management (commodities firm), former Partner, Stonington Partners, Inc. (private equity fund), former Director, Obagi Medical Products Co. and former Director, Lincoln Educational Services. | | Trustee, Virtus Fund Complex (consisting of 48 portfolios as of 1/31/2013); Asset Allocation Trust |
| David F. Larcker (Born 1950) | | Trustee, since 2009 | | James Irvin Miller Professor of Accounting at the Graduate School of Business, Stanford University, Morgan Stanley Director of the Center for Leadership Development and Research and Senior Faculty of The Rock Center for Corporate Governance since 2006. From 2005 to 2008, Professor of Accounting at the Graduate School of Business, Stanford University. Prior thereto, Ernst & Young Professor of Accounting at The Wharton School, University of Pennsylvania from 1985 to 2005. | | Asset Allocation Trust |
| Olivia S. Mitchell (Born 1953) | | Trustee, since 2006 | | International Foundation of Employee Benefit Plans Professor, Wharton School of the University of Pennsylvania since 1993. Director of Wharton’s Pension Research Council and Boettner Center on Pensions & Retirement Research, and Research Associate at the National Bureau of Economic Research. Previously, Cornell University Professor from 1978 to 1993. | | Asset Allocation Trust |
| Timothy J. Penny (Born 1951) | | Trustee, since 1996 | | President and CEO of Southern Minnesota Initiative Foundation, a non-profit organization, since 2007 and Senior Fellow at the Humphrey Institute Policy Forum at the University of Minnesota since 1995. Member of the Board of Trustees of NorthStar Education Finance, Inc., a non-profit organization, since 2007. | | Asset Allocation Trust |
| | | | | | |
| Other information (unaudited) | | Wells Fargo Advantage Intrinsic Small Cap Value Fund | | | 25 | |
| | | | | | |
Name and year of birth | | Position held and length of service* | | Principal occupations during past five years | | Other directorships during
past five years |
| Michael S. Scofield (Born 1943) | | Trustee, since 2010 | | Served on the Investment Company Institute’s Board of Governors and Executive Committee from 2008-2011 as well the Governing Council of the Independent Directors Council from 2006-2011 and the Independent Directors Council Executive Committee from 2008-2011. Chairman of the IDC from 2008-2010. Institutional Investor (Fund Directions) Trustee of Year in 2007. Trustee of the Evergreen Funds (and its predecessors) from 1984 to 2010. Chairman of the Evergreen Funds from 2000-2010. Former Trustee of the Mentor Funds. Retired Attorney, Law Offices of Michael S. Scofield. | | Asset Allocation Trust |
| Donald C. Willeke (Born 1940) | | Trustee, since 1996 | | Principal of the law firm of Willeke & Daniels. General Counsel of the Minneapolis Employees Retirement Fund from 1984 until its consolidation into the Minnesota Public Employees Retirement Association on June 30, 2010. Director and Vice Chair of The Tree Trust (non-profit corporation). Director of the American Chestnut Foundation (non-profit corporation). | | Asset Allocation Trust |
| * | Length of service dates reflect the Trustee’s commencement of service with the Trust’s predecessor entities, where applicable. |
Officers
| | | | | | |
Name and year of birth | | Position held and
length of service | | Principal occupations during past five years | | |
Karla M. Rabusch (Born 1959) | | President, since 2003 | | Executive Vice President of Wells Fargo Bank, N.A. and President of Wells Fargo Funds Management, LLC since 2003. | | |
Nancy Wiser1 (Born 1967) | | Treasurer, since 2012 | | Executive Vice President of Wells Fargo Funds Management, LLC since 2011. Chief Operating Officer and Chief Compliance Officer at LightBox Capital Management LLC, from 2008 to 2011. Owned and operated a consulting business providing services to various hedge funds including acting as Chief Operating Officer and Chief Compliance Officer for a hedge fund from 2007 to 2008. Chief Operating Officer and Chief Compliance Officer of GMN Capital LLC from 2006 to 2007. | | |
C. David Messman (Born 1960) | | Secretary, since 2000; Chief Legal Officer, since 2003 | | Senior Vice President and Secretary of Wells Fargo Funds Management, LLC since 2001. Vice President and Managing Counsel of Wells Fargo Bank, N.A. since 1996. | | |
Debra Ann Early (Born 1964) | | Chief Compliance Officer, since 2007 | | Chief Compliance Officer of Wells Fargo Funds Management, LLC since 2007. Chief Compliance Officer of Parnassus Investments from 2005 to 2007. Chief Financial Officer of Parnassus Investments from 2004 to 2007. | | |
David Berardi (Born 1975) | | Assistant Treasurer, since 2009 | | Vice President of Wells Fargo Funds Management, LLC since 2009. Vice President of Evergreen Investment Management Company, LLC from 2008 to 2010. Assistant Vice President of Evergreen Investment Services, Inc. from 2004 to 2008. Manager of Fund Reporting and Control for Evergreen Investment Management Company, LLC from 2004 to 2010. | | |
Jeremy DePalma1 (Born 1974) | | Assistant Treasurer, since 2009 | | Senior Vice President of Wells Fargo Funds Management, LLC since 2009. Senior Vice President of Evergreen Investment Management Company, LLC from 2008 to 2010. Vice President, Evergreen Investment Services, Inc. from 2004 to 2007. Head of the Fund Reporting and Control Team within Fund Administration from 2005 to 2010. | | |
| 1. | Nancy Wiser acts as Treasurer of 73 funds in the Fund Complex. Jeremy DePalma acts as Treasurer of 58 funds and Assistant Treasurer of 73 funds in the Fund Complex. |
| 2. | The Statement of Additional Information includes additional information about the Trustees and is available, without charge, upon request, by calling 1-800-222-8222 or by visiting the website at wellsfargoadvantagefunds.com. |
| | | | |
| 26 | | Wells Fargo Advantage Intrinsic Small Cap Value Fund | | Other information (unaudited) |
BOARD CONSIDERATION OF INVESTMENT ADVISORY AND SUBADVISORY AGREEMENTS:
Under Section 15 of the Investment Company Act of 1940 (the “1940 Act”), the Board of Trustees (the “Board”) of Wells Fargo Funds Trust (the “Trust”), all the members of which have no direct or indirect interest in the investment advisory and sub-advisory agreements and are not “interested persons” of the Trust, as defined in the 1940 Act (the “Independent Trustees”), must determine whether to approve the continuation of the Trust’s investment advisory and sub-advisory agreements. In this regard, at an in-person meeting held on March 28-29, 2013 (the “Meeting”), the Board reviewed: (i) an investment advisory agreement with Wells Fargo Funds Management, LLC (“Funds Management”) for Wells Fargo Advantage Intrinsic Small Cap Value Fund (the “Fund”) and (ii) an investment sub-advisory agreement with Metropolitan West Capital Management, LLC (the “Sub-Adviser”), an affiliate of Funds Management, for the Fund. The investment advisory agreement with Funds Management and the investment sub-advisory agreement with the Sub-Adviser are collectively referred to as the “Advisory Agreements.”
At the Meeting, the Board considered the factors and reached the conclusions described below relating to the selection of Funds Management and the Sub-Adviser and the continuation of the Advisory Agreements. Prior to the Meeting, the Trustees conferred extensively among themselves and with representatives of Funds Management about these matters. The Board has adopted a team-based approach, with each team consisting of a sub-set of Trustees, to assist the Board in the discharge of its duties in reviewing performance and other matters throughout the year. The Independent Trustees were assisted in their evaluation of the Advisory Agreements by independent legal counsel, from whom they received separate legal advice and with whom they met separately.
In providing information to the Board, Funds Management and the Sub-Adviser were guided by a detailed set of requests for information submitted to them by independent legal counsel on behalf of the Independent Trustees at the start of the Board’s annual contract renewal process earlier in 2013. In considering and approving the Advisory Agreements, the Trustees considered the information they believed relevant, including but not limited to the information discussed below. The Board considered not only the specific information presented in connection with the Meeting, but also the knowledge gained over time through interaction with Funds Management and the Sub-Adviser about various topics. In this regard, the Board reviewed reports of Funds Management at each of its quarterly meetings, which included, among other things, portfolio reviews and performance reports. In addition, the Board and the teams mentioned above confer with portfolio managers at various times throughout the year. The Board did not identify any particular information or consideration that was all-important or controlling, and each individual Trustee may have attributed different weights to various factors.
After its deliberations, the Board unanimously determined that the continuation of the Advisory Agreements is in the best interests of the Fund and its shareholders, and that the compensation payable to Funds Management and the Sub-Adviser is reasonable. The Board considered the continuation of the Advisory Agreements for the Fund as part of its consideration of the continuation of advisory agreements for funds across the complex, but each decision was made on a fund-by-fund basis. The following summarizes a number of important, but not necessarily all, factors considered by the Board in reaching its determination.
Nature, extent and quality of services
The Board received and considered various information regarding the nature, extent and quality of services provided to the Fund by Funds Management and the Sub-Adviser under the Advisory Agreements. This information included, among other things, a summary of the background and experience of senior management of Funds Management, and the qualifications, background, tenure and responsibilities of each of the portfolio managers primarily responsible for the day-to-day portfolio management of the Fund.
The Board evaluated the ability of Funds Management and the Sub-Adviser, based on attributes such as their financial condition, resources and reputation, to attract and retain qualified investment professionals, including research, advisory and supervisory personnel. The Board further considered the compliance programs and compliance records of Funds Management and the Sub-Adviser. In addition, the Board took into account the administrative and other services provided to the Fund by Funds Management and its affiliates and Funds Management’s oversight of the Fund’s various service providers.
Fund performance and expenses
The Board considered the performance results for the Fund over various time periods ended December 31, 2012. The Board also considered these results in comparison to the performance of funds in a universe that was determined by Lipper Inc. (“Lipper”) to be similar to the Fund (the “Universe”), and in comparison to the Fund’s benchmark index and to other comparative data. Lipper is an independent provider of investment company data. The Board received a
| | | | | | |
| Other information (unaudited) | | Wells Fargo Advantage Intrinsic Small Cap Value Fund | | | 27 | |
description of the methodology used by Lipper to select the mutual funds in the performance Universe. The Board noted that the performance of the Fund (Administrator Class) was higher than or in range of the median performance of the Universe for the one- and ten-year periods under review, and lower than the median performance of the Universe for the three- and five-year periods under review. The Board also noted that the performance of the Fund was higher than or in range of its benchmark, the Russell 2000® Value Index, for the one- and ten-year periods under review, and lower than the benchmark for the three- and five-year periods under review.
The Board received information concerning, and discussed factors contributing to, the underperformance of the Fund relative to the Universe and the benchmark for the three- and five-year periods under review. Funds Management advised the Board about the market conditions and investment decisions that it believed contributed to the underperformance during that period. The Board also noted that the Fund underwent a lead portfolio manager change in 2010 and has experienced positive performance in seven of the ten quarters since that change. The Board was satisfied with the explanation of factors contributing to underperformance and with the steps being taken by Funds Management and the Sub-Adviser to address the Fund’s investment performance.
The Board received and considered information regarding the Fund’s net operating expense ratios and their various components, including actual management fees (which reflect fee waivers, if any, and include advisory, administration and transfer agent fees), custodian and other non-management fees, Rule 12b-1 and non-Rule 12b-1 service fees and fee waiver and expense reimbursement arrangements. The Board also considered these ratios in comparison to the median ratios of funds in class-specific expense groups that were determined by Lipper to be similar to the Fund (the “Groups”). The Board received a description of the methodology used by Lipper to select the mutual funds in the expense Groups. Based on the Lipper reports, the Board noted that the net operating expense ratios of the Fund, after giving effect to agreed-upon reductions in the net operating expense ratio caps of the Fund’s Investor Class, Class A and Class C, were lower than or in range of the median net operating expense ratios of the expense Groups.
Based on its consideration of the factors and information it deemed relevant, including those described here, the Board concluded that the overall performance and expense structure of the Fund supported the re-approval of the Advisory Agreements.
Investment advisory and sub-advisory fee rates
The Board reviewed and considered the contractual investment advisory fee rates that are payable by the Fund to Funds Management for investment advisory services (the “Advisory Agreement Rates”), both on a stand-alone basis and on a combined basis with the Fund’s fund-level and class-level contractual administration fee rates (the “Management Rates”). The Board noted that the administration fees include transfer agency costs. The Board also reviewed and considered the contractual investment sub-advisory fee rates that are payable by Funds Management to the Sub-Adviser for investment sub-advisory services (the “Sub-Advisory Agreement Rates”).
Among other information reviewed by the Board was a comparison of the Management Rates of the Fund with those of other funds in the expense Groups at a common asset level. The Board noted that the Management Rates of the Fund were in range of the median rate for the Fund’s expense Groups for all classes except the Investor Class and Class A. The Board and Funds Management agreed to revise the advisory fee schedule for the Fund by adding an additional breakpoint. The Board also viewed favorably the fact that the net operating expense ratios of the Fund, after giving effect to agreed-upon reductions in the net operating expense ratio caps of the Fund’s Investor Class, Class A and Class C, were lower than or in range of the median net operating expense ratios of the expense Groups.
The Board also received and considered information about the portion of the total advisory fee that was retained by Funds Management after payment of the fee to the Sub-Adviser for sub-advisory services. In assessing the reasonableness of this amount, the Board received and evaluated information concerning the nature and extent of responsibilities retained and risks assumed by Funds Management and not delegated to or assumed by the Sub-Adviser, and about Funds Management’s on-going oversight services. In recognition of the fact that the Wells Fargo enterprise provides a suite of combined advisory and sub-advisory services to the Fund through affiliated entities, the Board ascribed limited relevance to the allocation of the total advisory fee between Funds Management and the Sub-Adviser.
The Board also received and considered information about the nature and extent of services offered and fee rates charged by Funds Management and the Sub-Adviser to other types of clients. In this regard, the Board received information about the significantly greater scope of services, and compliance, reporting and other legal burdens and risks of managing mutual funds compared with those associated with managing assets of non-mutual fund clients such as collective funds or institutional separate accounts.
| | | | |
| 28 | | Wells Fargo Advantage Intrinsic Small Cap Value Fund | | Other information (unaudited) |
Based on its consideration of the factors and information it deemed relevant, including those described here, the Board determined that the Advisory Agreement Rates and the Sub-Advisory Agreement Rates were reasonable in light of the services covered by the Advisory Agreements.
Profitability
The Board received and considered information concerning the profitability of Funds Management, as well as the profitability of Wells Fargo as a whole, from providing services to the Fund. The Board did not receive or consider to be necessary separate profitability information with respect to the Sub-Adviser, because, as an affiliate of Funds Management, its profitability information was subsumed in the collective Wells Fargo profitability analysis provided by Funds Management.
Funds Management explained the methodologies and estimates that it used in calculating the profitability from the Fund and the fund family as a whole. Among other things, the Board noted that the levels of profitability reported on a fund-by-fund basis varied widely, depending on factors such as the size and type of fund. Based on its review, the Board did not deem the profits reported by Funds Management to be at a level that would prevent it from approving the continuation of the Advisory Agreements.
Economies of scale
With respect to possible economies of scale, the Board reviewed the breakpoints in the Fund’s advisory fee and administration fee structure, which operate generally to reduce the Fund’s expense ratios as the Fund grows in size. It considered that, for a small fund or a fund that shrinks in size, breakpoints conversely can result in higher fee levels. The Board also considered fee waiver and expense reimbursement arrangements as a means of sharing potential economies of scale with the Fund. The Board acknowledged the inherent limitations of any analysis of potential economies of scale and of any attempt to correlate breakpoints with such economies. Nonetheless, the Board concluded that the breakpoints and net operating expense ratio caps appeared to be a reasonable approach to sharing potential economies of scale with the Fund.
Other benefits to Funds Management and the Sub-Adviser
The Board received and considered information regarding potential “fall-out” or ancillary benefits received by Funds Management and its affiliates, including the Sub-Adviser, as a result of their relationship with the Fund. Ancillary benefits could include, among others, benefits directly attributable to other relationships with the Fund and benefits potentially derived from an increase in Funds Management’s and the Sub-Adviser’s business as a result of their relationship with the Fund (such as the ability to market to shareholders other financial products and services offered by Funds Management and its affiliates, including the Sub-Adviser, or to operate other products and services that follow investment strategies similar to those of the Fund).
The Board considered that Wells Fargo Funds Distributor, LLC, an affiliate of Funds Management, serves as distributor to the Fund and receives certain compensation for those services. The Board noted that various financial institutions, including affiliates of Funds Management, may receive distribution-related fees, shareholder servicing payments (including amounts derived from payments under Rule 12b-1 plans) and sub-transfer agency fees in respect of shares sold or held through them and services provided.
The Board also reviewed information about whether and to what extent soft dollar credits are sought and how any such credits are utilized, and any benefits that might be realized by an affiliated broker that handles portfolio transactions for the Fund.
Based on its consideration of the factors and information it deemed relevant, including those described here, the Board did not find that any ancillary benefits received by Funds Management and its affiliates, including the Sub-Adviser, were unreasonable.
Conclusion
After considering the above-described factors and based on its deliberations and its evaluation of the information described above, the Board unanimously approved the continuation of the Advisory Agreements for an additional one-year period.
| | | | | | |
| List of abbreviations | | Wells Fargo Advantage Intrinsic Small Cap Value Fund | | | 29 | |
The following is a list of common abbreviations for terms and entities that may have appeared in this report.
| ACA | — ACA Financial Guaranty Corporation |
| ADR | — American depositary receipt |
| ADS | — American depositary shares |
| AGC | — Assured Guaranty Corporation |
| AGM | — Assured Guaranty Municipal |
| Ambac | — Ambac Financial Group Incorporated |
| AMT | — Alternative minimum tax |
| BAN | — Bond anticipation notes |
| BHAC | — Berkshire Hathaway Assurance Corporation |
| CAB | — Capital appreciation bond |
| CCAB | — Convertible capital appreciation bond |
| CDA | — Community Development Authority |
| CDO | — Collateralized debt obligation |
| COP | — Certificate of participation |
| DRIVER | — Derivative inverse tax-exempt receipts |
| DW&P | — Department of Water & Power |
| DWR | — Department of Water Resources |
| ECFA | — Educational & Cultural Facilities Authority |
| EDA | — Economic Development Authority |
| EDFA | — Economic Development Finance Authority |
| ETF | — Exchange-traded fund |
| FDIC | — Federal Deposit Insurance Corporation |
| FFCB | — Federal Farm Credit Banks |
| FGIC | — Financial Guaranty Insurance Corporation |
| FHA | — Federal Housing Administration |
| FHLB | — Federal Home Loan Bank |
| FHLMC | — Federal Home Loan Mortgage Corporation |
| FICO | — The Financing Corporation |
| FNMA | — Federal National Mortgage Association |
| GDR | — Global depositary receipt |
| GNMA | — Government National Mortgage Association |
| HCFR | — Healthcare facilities revenue |
| HEFA | — Health & Educational Facilities Authority |
| HEFAR | — Higher education facilities authority revenue |
| HFA | — Housing Finance Authority |
| HFFA | — Health Facilities Financing Authority |
| HUD | — Department of Housing and Urban Development |
| IDA | — Industrial Development Authority |
| IDAG | — Industrial Development Agency |
| IDR | — Industrial development revenue |
| KRW | — Republic of Korea won |
| LIBOR | — London Interbank Offered Rate |
| LLC | — Limited liability company |
| LLP | — Limited liability partnership |
| MBIA | — Municipal Bond Insurance Association |
| MFHR | — Multifamily housing revenue |
| MSTR | — Municipal securities trust receipts |
| MUD | — Municipal Utility District |
| National | — National Public Finance Guarantee Corporation |
| PCFA | — Pollution Control Financing Authority |
| PCL | — Public Company Limited |
| PCR | — Pollution control revenue |
| PFA | — Public Finance Authority |
| PFFA | — Public Facilities Financing Authority |
| PFOTER | — Puttable floating option tax-exempt receipts |
| plc | — Public limited company |
| PUTTER | — Puttable tax-exempt receipts |
| R&D | — Research & development |
| Radian | — Radian Asset Assurance |
| RAN | — Revenue anticipation notes |
| RDA | — Redevelopment Authority |
| RDFA | — Redevelopment Finance Authority |
| REIT | — Real estate investment trust |
| ROC | — Reset option certificates |
| SAVRS | — Select auction variable rate securities |
| SBA | — Small Business Authority |
| SFHR | — Single-family housing revenue |
| SFMR | — Single-family mortgage revenue |
| SPA | — Standby purchase agreement |
| SPDR | — Standard & Poor’s Depositary Receipts |
| STRIPS | — Separate trading of registered interest and principal securities |
| TAN | — Tax anticipation notes |
| TIPS | — Treasury inflation-protected securities |
| TRAN | — Tax revenue anticipation notes |
| TTFA | — Transportation Trust Fund Authority |
| TVA | — Tennessee Valley Authority |
This page is intentionally left blank.


For more information
More information about Wells Fargo Advantage Funds is available free upon request. To obtain literature, please write, email, visit the Fund’s website, or call:
Wells Fargo Advantage Funds
P.O. Box 8266
Boston, MA 02266-8266
Email: wfaf@wellsfargo.com
Website: wellsfargoadvantagefunds.com
Individual investors: 1-800-222-8222
Retail investment professionals: 1-888-877-9275
Institutional investment professionals: 1-866-765-0778
This report and the financial statements contained herein are submitted for the general information of the shareholders of Wells Fargo Advantage Funds. If this report is used for promotional purposes, distribution of the report must be accompanied or preceded by a current prospectus. For a current prospectus and, if available, a summary prospectus containing more complete information, including charges and expenses, call 1-800-222-8222 or visit the Fund’s website at wellsfargoadvantagefunds.com. Please consider the investment objectives, risks, charges, and expenses of the investment carefully before investing. This and other information about Wells Fargo Advantage Funds can be found in the current prospectus. Read the prospectus carefully before you invest or send money.
Wells Fargo Funds Management, LLC, a wholly owned subsidiary of Wells Fargo & Company, provides investment advisory and administrative services for Wells Fargo Advantage Funds. Other affiliates of Wells Fargo & Company provide subadvisory and other services for the Funds. The Funds are distributed by Wells Fargo Funds Distributor, LLC, Member FINRA/SIPC, an affiliate of Wells Fargo & Company.
NOT FDIC INSURED ¡ NO BANK GUARANTEE ¡ MAY LOSE VALUE
© 2013 Wells Fargo Funds Management, LLC. All rights reserved.
| | |
 | | 216837 06-13 SA242/SAR242 4-13 |

Wells Fargo Advantage
Small Cap Opportunities Fund

Semi-Annual Report
April 30, 2013

Reduce clutter. Save trees.
Sign up for electronic delivery of prospectuses and shareholder reports at wellsfargo.com/advantagedelivery
Contents
The views expressed and any forward-looking statements are as of April 30, 2013, unless otherwise noted, and are those of the Fund managers and/or Wells Fargo Funds Management, LLC. Discussions of individual securities, or the markets generally, or any Wells Fargo Advantage Fund are not intended as individual recommendations. Future events or results may vary significantly from those expressed in any forward-looking statements; the views expressed are subject to change at any time in response to changing circumstances in the market. Wells Fargo Funds Management, LLC, disclaims any obligation to publicly update or revise any views expressed or forward-looking statements.
NOT FDIC INSURED ¡ NO BANK GUARANTEE ¡ MAY LOSE VALUE

Wells Fargo investment history
| | |
| 1932 | | Keystone creates one of the first mutual fund families. |
| 1971 | | Wells Fargo & Company introduces one of the first institutional index funds. |
| 1978 | | Wells Fargo applies Markowitz and Sharpe’s research on Modern Portfolio Theory to introduce one of the industry’s first tactical asset allocation models in institutional separately managed accounts. |
| 1984 | | Wells Fargo Stagecoach Funds launches its first asset allocation fund. |
| 1989 | | The Tactical Asset Allocation (TAA) Model is first applied to Wells Fargo’s asset allocation mutual funds. |
| 1994 | | Wells Fargo introduces the LifePath Funds, one of the first suites of target date funds (now the Wells Fargo Advantage Dow Jones Target Date FundsSM). |
| 1996 | | Evergreen Investments and Keystone Funds merge. |
| 1997 | | Wells Fargo launches the Wells Fargo Advantage WealthBuilder PortfoliosSM, a fund-of-funds suite of products that includes the use of quantitative models to shift assets among investment styles. |
| 1999 | | Norwest Advantage Funds and Stagecoach Funds are reorganized into Wells Fargo Funds after the merger of Norwest and Wells Fargo. |
| 2002 | | Evergreen Retail and Evergreen Institutional companies form the umbrella asset management company, Evergreen Investments. |
| 2005 | | The integration of Strong Funds with Wells Fargo Funds creates Wells Fargo Advantage Funds, resulting in one of the top 20 mutual fund companies in the United States. |
| 2006 | | Wells Fargo Advantage Funds relaunches the target date product line as Wells Fargo Advantage Dow Jones Target Date Funds. |
| 2010 | | The mergers and reorganizations of Evergreen and Wells Fargo Advantage mutual funds are completed, unifying the families under the brand of Wells Fargo Advantage Funds. |
Wells Fargo Advantage Funds®
Wells Fargo Advantage Funds skillfully guides institutions, financial advisors, and individuals through the investment terrain to help them reach their financial objectives. Everything we do on behalf of investors is backed by our unique combination of qualifications.
Strength
Our organization is built on the standards of integrity and service established by our parent company—Wells Fargo & Company—more than 150 years ago. And, because we’re part of a highly diversified financial enterprise, we offer the depth of resources to help investors succeed.
Expertise
Our multi-boutique model offers investors access to the independent thinking of premier investment managers that have been chosen for their time-tested strategies. While each team specializes in a specific investment strategy, collectively they provide investors a wide choice of distinct investment styles. Our dedication to investment excellence doesn��t end with our expertise in manager selection—risk management, analysis, and rigorous ongoing review seek to ensure each manager’s investment process remains consistent.
Partnership
Our collaborative approach is built around understanding the needs and goals of our clients. By adhering to core principles of sound judgment and steady guidance, we support you through every stage of the investment decision process.
Carefully consider the investment objectives, risks, charges, and expenses before investing. For a current prospectus and, if available, a summary prospectus, for Wells Fargo Advantage Funds, containing this and other information, visit wellsfargoadvantagefunds.com. Read it carefully before investing.
Wells Fargo Funds Management, LLC, a wholly owned subsidiary of Wells Fargo & Company, provides investment advisory and administrative services for Wells Fargo Advantage Funds. Other affiliates of Wells Fargo & Company provide subadvisory and other services for the Funds. The Funds are distributed by Wells Fargo Funds Distributor, LLC, Member FINRA/SIPC, an affiliate of Wells Fargo & Company.
“Dow Jones®” and “Dow Jones Target Date IndexesSM” are service marks of Dow Jones Trademark Holdings LLC (“Dow Jones”); have been licensed to CME Group Index Services LLC (“CME Indexes”); and have been sublicensed for use for certain purposes by Global Index Advisors, Inc., and Wells Fargo Funds Management, LLC. The Wells Fargo Advantage Dow Jones Target Date FundsSM, based on the Dow Jones Target Date Indexes, are not sponsored, endorsed, sold, or promoted by Dow Jones, CME Indexes, or their respective affiliates, and none of them makes any representation regarding the advisability of investing in such product(s).
NOT FDIC INSURED ¡ NO BANK GUARANTEE ¡ MAY LOSE VALUE
Not part of the semi-annual report.
Wells Fargo Advantage Funds offers more than 100 mutual funds across a wide range of asset classes, representing over $228 billion in assets under management, as of April 30, 2013.
| | | | |
| Equity funds | | | | |
Asia Pacific Fund | | Enterprise Fund† | | Opportunity Fund† |
C&B Large Cap Value Fund | | Global Opportunities Fund | | Precious Metals Fund |
C&B Mid Cap Value Fund | | Growth Fund | | Premier Large Company Growth Fund |
Capital Growth Fund | | Index Fund | | Small Cap Opportunities Fund |
Common Stock Fund | | International Equity Fund | | Small Cap Value Fund |
Disciplined U.S. Core Fund | | International Value Fund | | Small Company Growth Fund |
Discovery Fund† | | Intrinsic Small Cap Value Fund | | Small Company Value Fund |
Diversified Equity Fund | | Intrinsic Value Fund | | Small/Mid Cap Value Fund |
Diversified International Fund | | Intrinsic World Equity Fund | | Special Mid Cap Value Fund |
Emerging Growth Fund | | Large Cap Core Fund | | Special Small Cap Value Fund |
Emerging Markets Equity Fund | | Large Cap Growth Fund | | Specialized Technology Fund |
Emerging Markets Equity Income Fund | | Large Company Value Fund | | Traditional Small Cap Growth Fund |
Endeavor Select Fund† | | Omega Growth Fund | | Utility and Telecommunications Fund |
| Bond funds | | | | |
Adjustable Rate Government Fund | | High Yield Municipal Bond Fund | | Short-Term Bond Fund |
California Limited-Term Tax-Free Fund | | Income Plus Fund | | Short-Term High Yield Bond Fund |
California Tax-Free Fund | | Inflation-Protected Bond Fund | | Short-Term Municipal Bond Fund |
Colorado Tax-Free Fund | | Intermediate Tax/AMT-Free Fund | | Strategic Income Fund |
Conservative Income Fund | | International Bond Fund | | Strategic Municipal Bond Fund |
Core Bond Fund | | Minnesota Tax-Free Fund | | Ultra Short-Term Income Fund |
Emerging Markets Local Bond Fund | | Municipal Bond Fund | | Ultra Short-Term Municipal Income Fund |
Government Securities Fund | | North Carolina Tax-Free Fund | | Wisconsin Tax-Free Fund |
High Income Fund | | Pennsylvania Tax-Free Fund | | |
High Yield Bond Fund | | Short Duration Government Bond Fund | | |
| Asset allocation funds | | | | |
Absolute Return Fund | | WealthBuilder Equity Portfolio† | | Target 2020 Fund† |
Asset Allocation Fund | | WealthBuilder Growth Allocation Portfolio† | | Target 2025 Fund† |
Diversified Capital Builder Fund | | WealthBuilder Growth Balanced Portfolio† | | Target 2030 Fund† |
Diversified Income Builder Fund | | WealthBuilder Moderate Balanced Portfolio† | | Target 2035 Fund† |
Growth Balanced Fund | | WealthBuilder Tactical Equity Portfolio† | | Target 2040 Fund† |
Index Asset Allocation Fund | | Target Today Fund† | | Target 2045 Fund† |
Moderate Balanced Fund | | Target 2010 Fund† | | Target 2050 Fund† |
WealthBuilder Conservative Allocation Portfolio† | | Target 2015 Fund† | | Target 2055 Fund† |
| Money market funds | | | | |
100% Treasury Money Market Fund | | Heritage Money Market Fund† | | National Tax-Free Money Market Fund |
California Municipal Money Market Fund | | Money Market Fund | | Treasury Plus Money Market Fund |
Cash Investment Money Market Fund | | Municipal Cash Management Money Market Fund | | |
Government Money Market Fund | | Municipal Money Market Fund | | |
| Variable trust funds1 | | | | |
VT Discovery Fund† | | VT Intrinsic Value Fund | | VT Small Cap Growth Fund |
VT Index Asset Allocation Fund | | VT Omega Growth Fund | | VT Small Cap Value Fund |
VT International Equity Fund | | VT Opportunity Fund† | | VT Total Return Bond Fund |
An investment in a money market fund is not insured or guaranteed by the Federal Deposit Insurance Corporation or any other government agency. Although the Wells Fargo Advantage Money Market Funds seek to preserve the value of your investment at $1.00 per share, it is possible to lose money by investing in a money market fund.
| 1. | The variable trust funds are generally available only through insurance company variable contracts. |
| † | In this report, the Wells Fargo Advantage Discovery FundSM, Wells Fargo Advantage Endeavor Select FundSM, Wells Fargo Advantage Enterprise FundSM, Wells Fargo Advantage Opportunity FundSM, Wells Fargo Advantage WealthBuilder Conservative Allocation PortfolioSM, Wells Fargo Advantage WealthBuilder Equity PortfolioSM, Wells Fargo Advantage WealthBuilder Growth Allocation PortfolioSM, Wells Fargo Advantage WealthBuilder Growth Balanced PortfolioSM, Wells Fargo Advantage WealthBuilder Moderate Balanced PortfolioSM, Wells Fargo Advantage WealthBuilder Tactical Equity PortfolioSM, Wells Fargo Advantage Dow Jones Target Today FundSM, Wells Fargo Advantage Dow Jones Target 2010 FundSM, Wells Fargo Advantage Dow Jones Target 2015 FundSM, Wells Fargo Advantage Dow Jones Target 2020 FundSM, Wells Fargo Advantage Dow Jones Target 2025 FundSM, Wells Fargo Advantage Dow Jones Target 2030 FundSM, Wells Fargo Advantage Dow Jones Target 2035 FundSM, Wells Fargo Advantage Dow Jones Target 2040 FundSM, Wells Fargo Advantage Dow Jones Target 2045 FundSM, Wells Fargo Advantage Dow Jones Target 2050 FundSM, Wells Fargo Advantage Dow Jones Target 2055 FundSM, Wells Fargo Advantage Heritage Money Market FundSM, Wells Fargo Advantage VT Discovery FundSM, and Wells Fargo Advantage VT Opportunity FundSM are referred to as the Discovery Fund, Endeavor Select Fund, Enterprise Fund, Opportunity Fund, WealthBuilder Conservative Allocation Portfolio, WealthBuilder Equity Portfolio, WealthBuilder Growth Allocation Portfolio, WealthBuilder Growth Balanced Portfolio, WealthBuilder Moderate Balanced Portfolio, WealthBuilder Tactical Equity Portfolio, Target Today Fund, Target 2010 Fund, Target 2015 Fund, Target 2020 Fund, Target 2025 Fund, Target 2030 Fund, Target 2035 Fund, Target 2040 Fund, Target 2045 Fund, Target 2050 Fund, Target 2055 Fund, Heritage Money Market Fund, VT Discovery Fund, and VT Opportunity Fund, respectively. |
Not part of the semi-annual report.
| | | | |
| 2 | | Wells Fargo Advantage Small Cap Opportunities Fund | | Letter to shareholders (unaudited) |

Karla M. Rabusch
President
Wells Fargo Advantage Funds
Relatively improving economic data in the U.S. and efforts by European authorities to address the sovereign debt issue alleviated investor fears and supported global stock markets.
Dear Valued Shareholder:
We are pleased to offer you this semi-annual report for the Wells Fargo Advantage Small Cap Opportunities Fund for the six-month period that ended April 30, 2013. Much of the six-month period was marked by continued concerns about the possible effects that the ongoing European sovereign debt crisis would have on the global economy. However, relatively improving economic data in the U.S. and efforts by European authorities to address the sovereign debt issue alleviated investor fears and supported global stock markets. This backdrop enabled most equity asset classes to generate positive returns. For the six-month period, the small-cap-oriented Russell 2000® Index1 returned 16.58%, while the mid-cap-focused Russell Midcap® Index2 posted an 18.90% total return.
The U.S. economy improved with the support of accommodative monetary policy.
The U.S. economy grew modestly, but the recovery remained weak compared with previous business cycles. Curtailed government spending and weak household income expectations were economic headwinds. However, the unemployment rate continued to decline, reaching 7.5% in April 2013, and housing market activity, as measured by many metrics—sales, building permits, and prices—continued to improve from its recessionary levels.
Citing its dual mandate of fostering maximum employment and price stability, the U.S. Federal Reserve (Fed) reaffirmed its commitment to highly accommodative monetary policy. In addition, the Fed formally announced that exceptionally low interest rates would be appropriate at least as long as the unemployment rate remains above 6.5% and inflation remains no more than half a percentage point above its 2.0% inflation target.
The Fed also continued its quantitative easing program. Just prior to the beginning of the reporting period, the Federal Open Market Committee announced its intention to keep interest rates low until at least mid-2015 in order to support the sluggish economy. The Fed also announced open-ended purchases of $40 billion per month in mortgage-backed securities in an effort to support the housing market.
The global economy continues to be affected by bouts of uncertainty, including political questions in the U.S., Europe, and China.
Global economic growth varied across countries. Eurozone economies remained in recession. However, the European Central Bank (ECB) and several key members of the eurozone, including France and Germany, continued their commitment to maintaining a single currency. Subsequently, investor fears about a sovereign debt crisis in Europe abated. Furthermore, the ECB maintained its accommodative monetary policy by lowering its key rate at a historic low of 0.75%.
For most of the six-month period, uncertainty about political outcomes was a constant. U.S. presidential elections in November 2012, the debate over the fiscal cliff and tax rates at year-end, and speculation about the effects of sequestration at the end of February 2013 weighed on business leaders and investors. Elections in eurozone countries such as Greece, France, and Italy sparked speculation about the future of the eurozone. New leadership in China also figured into the political landscape. In the end, investors managed around these concerns, and capital markets generally advanced during this time period.
| 1. | The Russell 2000® Index measures the performance of the 2,000 smallest companies in the Russell 3000® Index, which represents approximately 8% of the total market capitalization of the Russell 3000 Index. You cannot invest directly in an index. |
| 2. | The Russell Midcap® Index measures the performance of the 800 smallest companies in the Russell 1000® Index, which represent approximately 25% of the total market capitalization of the Russell 1000 Index. You cannot invest directly in an index. |
| | | | | | |
| Letter to shareholders (unaudited) | | Wells Fargo Advantage Small Cap Opportunities Fund | | | 3 | |
Our goal is to meet the financial needs of our shareholders.
We are committed to providing our shareholders long-term investment strategies and focusing on appropriate risk while seeking to deliver consistent returns. We know that your ability to meet your long-term investment goals depends on the investment decisions you make today. Despite economic uncertainties and investment challenges, staying invested and adapting to emerging opportunities and threats will help you manage investment risk.
Thank you for choosing to invest with Wells Fargo Advantage Funds. We appreciate your confidence in us and remain committed to helping you meet your financial needs. For current information about your fund investments, contact your investment professional, visit our website at wellsfargoadvantagefunds.com, or call us directly at 1-800-222-8222. We are available 24 hours a day, 7 days a week.
Sincerely,

Karla M. Rabusch
President
Wells Fargo Advantage Funds
Despite economic uncertainties and investment challenges, staying invested and adapting to emerging opportunities and threats will help you manage investment risk.
| | | | |
| 4 | | Wells Fargo Advantage Small Cap Opportunities Fund | | Performance highlights (unaudited) |
Investment objective
The Fund seeks long-term capital appreciation.
Adviser
Wells Fargo Funds Management, LLC
Subadviser
Schroder Investment Management North America Inc.
Portfolio manager
Jenny B. Jones
Average annual total returns (%) as of April 30, 2013
| | | | | | | | | | | | | | | | | | | | | | | | |
| | | | | | | | | | | | | | | | Expense ratios1 (%) | |
| | | Inception date | | 1 year | | | 5 year | | | 10 year | | | | | Gross | | | Net2 | |
| Administrator Class (NVSOX) | | 8-1-1993 | | | 15.03 | | | | 6.25 | | | | 12.51 | | | | | | 1.24 | | | | 1.22 | |
| Russell 2000® Index3 | | – | | | 17.69 | | | | 7.27 | | | | 10.47 | | | | | | – | | | | – | |
Figures quoted represent past performance, which is no guarantee of future results and do not reflect the deduction of taxes that a shareholder may pay on fund distributions or the redemption of fund shares. Investment return and principal value of an investment will fluctuate so that an investor’s shares, when redeemed, may be worth more or less than their original cost. Current performance may be lower or higher than the performance data quoted, which assumes the reinvestment of dividends and capital gains. Current month-end performance is available on the Fund’s website, wellsfargoadvantagefunds.com.
Index returns do not include transaction costs associated with buying and selling securities, any mutual fund fees or expenses, or any taxes. It is not possible to invest directly in an index.
Administrator Class shares are sold without a front-end sales charge or contingent deferred sales charge.
Stock values fluctuate in response to the activities of individual companies and general market and economic conditions. Smaller-company stocks tend to be more volatile and less liquid than those of larger companies. The use of derivatives may reduce returns and/or increase volatility. Consult the Fund’s prospectus for additional information on these and other risks.
Please see footnotes on page 5.
| | | | | | |
| Performance highlights (unaudited) | | Wells Fargo Advantage Small Cap Opportunities Fund | | | 5 | |
| | | | |
| Ten largest equity holdings4 (%) as of April 30, 2013 | |
Northwestern Corporation | | | 1.82 | |
Parexel International Corporation | | | 1.48 | |
Finish Line Incorporated | | | 1.42 | |
Brinker International Incorporated | | | 1.39 | |
PTC Incorporated | | | 1.38 | |
Alterra Capital Holdings Limited | | | 1.34 | |
Applied Industrial Technologies Incorporated | | | 1.28 | |
Brown & Brown Incorporated | | | 1.27 | |
IDACORP Incorporated | | | 1.23 | |
EnerSys | | | 1.23 | |
|
| Sector distribution5 as of April 30, 2013 |
|
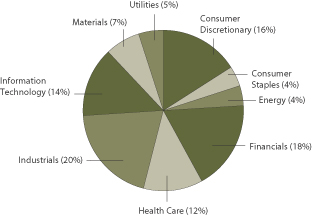
|
| 1. | Reflects the expense ratios as stated in the most recent prospectus. |
| 2. | The Adviser has committed through February 28, 2014, to waive fees and/or reimburse expenses to the extent necessary to cap the Fund’s Total Annual Fund Operating Expenses After Fee Waiver, excluding certain expenses, at 1.20% for Administrator Class. Brokerage commissions, stamp duty fees, interest, taxes, acquired fund fees and expenses, and extraordinary expenses are excluded from the cap. Without this cap, the Fund’s returns would have been lower. |
| 3. | The Russell 2000® Index measures the performance of the 2,000 smallest companies in the Russell 3000® Index, which represents approximately 8% of the total market capitalization of the Russell 3000 Index. You cannot invest directly in an index. |
| 4. | The ten largest equity holdings are calculated based on the value of the securities divided by total net assets of the Fund. Holdings are subject to change and may have changed since the date specified. |
| 5. | Sector distribution is subject to change and is calculated based on the total long-term investments of the Fund. |
| | | | |
| 6 | | Wells Fargo Advantage Small Cap Opportunities Fund | | Fund expenses (unaudited) |
As a shareholder of the Fund, you incur ongoing costs and other Fund expenses. This example is intended to help you understand your ongoing costs (in dollars) of investing in the Fund and to compare these costs with the ongoing costs of investing in other mutual funds.
The example is based on an investment of $1,000 invested at the beginning of the six-month period and held for the entire period from November 1, 2012 to April 30, 2013.
Actual expenses
The “Actual” line of the table below provides information about actual account values and actual expenses. You may use
the information in this line, together with the amount you invested, to estimate the expenses that you paid over the period. Simply divide your account value by $1,000 (for example, an $8,600 account value divided by $1,000 = 8.6), then multiply the result by the number in the “Actual” line under the heading entitled “Expenses paid during period” for your applicable class of shares to estimate the expenses you paid on your account during this period.
Hypothetical example for comparison purposes
The “Hypothetical” line of the table below provides information about hypothetical account values and hypothetical expenses based on the Fund’s actual expense ratio and an assumed rate of return of 5% per year before expenses, which is not the Fund’s actual return. The hypothetical account values and expenses may not be used to estimate the actual ending account balance or expenses you paid for the period. You may use this information to compare the ongoing costs of investing in the Fund and other funds. To do so, compare this 5% hypothetical example with the 5% hypothetical examples that appear in the shareholder reports of the other funds.
Please note that the expenses shown in the table are meant to highlight your ongoing costs. Therefore, the “Hypothetical” line of the table is useful in comparing ongoing costs only and will not help you determine the relative total costs of owning different funds.
| | | | | | | | | | | | | | | | |
| | | Beginning
account value
11-1-2012 | | | Ending
account value
4-30-2013 | | | Expenses
paid during
the period¹ | | | Net annual
expense ratio | |
Administrator Class | | | | | | | | | | | | | | | | |
Actual | | $ | 1,000.00 | | | $ | 1,143.26 | | | $ | 6.38 | | | | 1.20 | % |
Hypothetical (5% return before expenses) | | $ | 1,000.00 | | | $ | 1,018.84 | | | $ | 6.01 | | | | 1.20 | % |
| 1. | Expenses paid is equal to the annualized expense ratio multiplied by the average account value over the period, multiplied by the number of days in the most recent fiscal half-year divided by the number of days in the fiscal year (to reflect the one-half-year period). |
| | | | | | |
| Portfolio of investments—April 30, 2013 (unaudited) | | Wells Fargo Advantage Small Cap Opportunities Fund | | | 7 | |
| | | | | | | | | | | | |
| Security name | | | | | | Shares | | | Value | |
| | | |
Common Stocks: 92.67% | | | | | | | | | | |
| | | | |
Consumer Discretionary: 14.58% | | | | | | | | | | | | |
| | | |
| Distributors: 1.17% | | | | | | | | | | |
Core Mark Holding Company Incorporated | | | | | | | 90,600 | | | $ | 4,714,824 | |
LKQ Corporation † | | | | | | | 117,800 | | | | 2,836,624 | |
| | | | |
| | | | | | | | | | | 7,551,448 | |
| | | | | | | | | | | | |
| | | | |
| Diversified Consumer Services: 0.51% | | | | | | | | | | | | |
Steiner Leisure Limited † | | | | | | | 67,700 | | | | 3,278,711 | |
| | | | | | | | | | | | |
| | | | |
| Hotels, Restaurants & Leisure: 6.12% | | | | | | | | | | | | |
Ameristar Casinos Incorporated | | | | | | | 98,600 | | | | 2,602,054 | |
Bally Technologies Incorporated Ǡ | | | | | | | 117,700 | | | | 6,271,056 | |
Brinker International Incorporated « | | | | | | | 230,600 | | | | 8,970,340 | |
Domino’s Pizza Incorporated « | | | | | | | 110,100 | | | | 6,077,520 | |
Home Inns & Hotels Management ADR Ǡ | | | | | | | 71,700 | | | | 1,786,764 | |
Ignite Restaurant Group Incorporated Ǡ | | | | | | | 264,400 | | | | 4,611,136 | |
Red Robin Gourmet Burgers Incorporated † | | | | | | | 92,100 | | | | 4,454,877 | |
Six Flags Entertainment Corporation | | | | | | | 65,700 | | | | 4,787,559 | |
| | | | |
| | | | | | | | | | | 39,561,306 | |
| | | | | | | | | | | | |
| | | | |
| Household Durables: 0.75% | | | | | | | | | | | | |
Harman International Industries Incorporated | | | | | | | 109,200 | | | | 4,882,332 | |
| | | | | | | | | | | | |
| | | | |
| Leisure Equipment & Products: 0.63% | | | | | | | | | | | | |
Callaway Golf Company « | | | | | | | 607,100 | | | | 4,067,570 | |
| | | | | | | | | | | | |
| | | | |
| Media: 1.00% | | | | | | | | | | | | |
John Wiley & Sons Incorporated | | | | | | | 76,900 | | | | 2,935,273 | |
Madison Square Garden Incorporated Class A † | | | | | | | 58,500 | | | | 3,525,795 | |
| | | | |
| | | | | | | | | | | 6,461,068 | |
| | | | | | | | | | | | |
| | | | |
| Specialty Retail: 4.40% | | | | | | | | | | | | |
Aeropostale Incorporated † | | | | | | | 83,400 | | | | 1,222,644 | |
Asbury Automotive Group Incorporated † | | | | | | | 66,200 | | | | 2,653,958 | |
Children’s Place Retail Stores Incorporated † | | | | | | | 101,416 | | | | 4,961,271 | |
Finish Line Incorporated « | | | | | | | 473,800 | | | | 9,186,982 | |
Group 1 Automotive Incorporated | | | | | | | 42,900 | | | | 2,594,592 | |
Hot Topic Incorporated | | | | | | | 357,800 | | | | 4,991,310 | |
Rent-A-Center Incorporated | | | | | | | 81,800 | | | | 2,857,274 | |
| | | | |
| | | | | | | | | | | 28,468,031 | |
| | | | | | | | | | | | |
| | | | |
Consumer Staples: 3.33% | | | | | | | | | | | | |
| | | | |
| Food & Staples Retailing: 0.84% | | | | | | | | | | | | |
Casey’s General Stores Incorporated « | | | | | | | 85,700 | | | | 4,962,887 | |
Chef’s Warehouse Incorporated † | | | | | | | 27,200 | | | | 500,208 | |
| | | | |
| | | | | | | | | | | 5,463,095 | |
| | | | | | | | | | | | |
The accompanying notes are an integral part of these financial statements.
| | | | |
| 8 | | Wells Fargo Advantage Small Cap Opportunities Fund | | Portfolio of investments—April 30, 2013 (unaudited) |
| | | | | | | | | | | | |
| Security name | | | | | | Shares | | | Value | |
| | | | |
| Food Products: 1.42% | | | | | | | | | | | | |
Dean Foods Company Ǡ | | | | | | | 238,200 | | | $ | 4,559,148 | |
Pinnacle Foods Incorporated † | | | | | | | 192,900 | | | | 4,604,523 | |
| | | | |
| | | | | | | | | | | 9,163,671 | |
| | | | | | | | | | | | |
| | | | |
| Personal Products: 0.72% | | | | | | | | | | | | |
Elizabeth Arden Incorporated † | | | | | | | 113,800 | | | | 4,660,110 | |
| | | | | | | | | | | | |
| | | | |
| Tobacco: 0.35% | | | | | | | | | | | | |
Universal Corporation « | | | | | | | 39,200 | | | | 2,255,960 | |
| | | | | | | | | | | | |
| | | | |
Energy: 3.90% | | | | | | | | | | | | |
| | | | |
| Energy Equipment & Services: 1.56% | | | | | | | | | | | | |
Helix Energy Solutions Group Incorporated † | | | | | | | 264,500 | | | | 6,094,080 | |
Oil States International Incorporated † | | | | | | | 44,226 | | | | 3,952,035 | |
| | | | |
| | | | | | | | | | | 10,046,115 | |
| | | | | | | | | | | | |
| | | | |
| Oil, Gas & Consumable Fuels: 2.34% | | | | | | | | | | | | |
Carrizo Oil & Gas Incorporated Ǡ | | | | | | | 229,900 | | | | 5,568,178 | |
Laredo Petroleum Holdings Incorporated Ǡ | | | | | | | 263,800 | | | | 4,537,360 | |
Stealthgas Incorporated † | | | | | | | 160,000 | | | | 1,654,400 | |
Teekay Corporation | | | | | | | 94,834 | | | | 3,376,090 | |
| | | | |
| | | | | | | | | | | 15,136,028 | |
| | | | | | | | | | | | |
| | | | |
Financials: 16.94% | | | | | | | | | | | | |
| | | | |
| Capital Markets: 1.18% | | | | | | | | | | | | |
FXCM Incorporated Class A « | | | | | | | 116,900 | | | | 1,583,995 | |
HFF Incorporated Class A « | | | | | | | 217,500 | | | | 4,556,625 | |
Stifel Financial Corporation Ǡ | | | | | | | 45,731 | | | | 1,473,453 | |
| | | | |
| | | | | | | | | | | 7,614,073 | |
| | | | | | | | | | | | |
| | | | |
| Commercial Banks: 4.29% | | | | | | | | | | | | |
Bank of Hawaii Corporation « | | | | | | | 32,700 | | | | 1,559,463 | |
First Horizon National Corporation | | | | | | | 248,600 | | | | 2,585,440 | |
FirstMerit Corporation « | | | | | | | 343,800 | | | | 5,889,294 | |
Lakeland Financial Corporation | | | | | | | 123,000 | | | | 3,296,400 | |
MB Financial Incorporated | | | | | | | 143,400 | | | | 3,550,584 | |
Old National Bancorp | | | | | | | 369,900 | | | | 4,505,382 | |
Simmons First National Corporation « | | | | | | | 115,500 | | | | 2,832,060 | |
Susquehanna Bancshares Incorporated | | | | | | | 300,100 | | | | 3,502,167 | |
| | | | |
| | | | | | | | | | | 27,720,790 | |
| | | | | | | | | | | | |
| | | | |
| Diversified Financial Services: 0.53% | | | | | | | | | | | | |
Compass Diversified Holdings | | | | | | | 202,300 | | | | 3,420,893 | |
| | | | | | | | | | | | |
| | | | |
| Insurance: 5.23% | | | | | | | | | | | | |
Alterra Capital Holdings Limited | | | | | | | 265,616 | | | | 8,645,801 | |
Amerisafe Incorporated | | | | | | | 102,800 | | | | 3,357,448 | |
Brown & Brown Incorporated | | | | | | | 265,700 | | | | 8,234,043 | |
The accompanying notes are an integral part of these financial statements.
| | | | | | |
| Portfolio of investments—April 30, 2013 (unaudited) | | Wells Fargo Advantage Small Cap Opportunities Fund | | | 9 | |
| | | | | | | | | | | | |
| Security name | | | | | | Shares | | | Value | |
| | | | |
| Insurance (continued) | | | | | | | | | | | | |
eHealth Incorporated † | | | | | | | 91,600 | | | $ | 1,918,104 | |
Infinity Property & Casualty Corporation | | | | | | | 33,500 | | | | 1,900,790 | |
Primerica Incorporated | | | | | | | 39,300 | | | | 1,334,628 | |
ProAssurance Corporation | | | | | | | 48,900 | | | | 2,395,611 | |
Reinsurance Group of America Incorporated | | | | | | | 96,400 | | | | 6,029,820 | |
| | | | |
| | | | | | | | | | | 33,816,245 | |
| | | | | | | | | | | | |
| | | | |
| REITs: 5.13% | | | | | | | | | | | | |
Colonial Properties Trust « | | | | | | | 309,164 | | | | 7,175,696 | |
Equity Lifestyle Properties Incorporated | | | | | | | 78,235 | | | | 6,356,594 | |
Health Care REIT Incorporated | | | | | | | 12,508 | | | | 937,725 | |
LaSalle Hotel Properties | | | | | | | 126,024 | | | | 3,267,802 | |
Mid-America Apartment Communities Incorporated « | | | | | | | 95,657 | | | | 6,574,506 | |
Parkway Properties Incorporated | | | | | | | 132,292 | | | | 2,411,683 | |
Redwood Trust Incorporated « | | | | | | | 283,553 | | | | 6,470,679 | |
| | | | |
| | | | | | | | | | | 33,194,685 | |
| | | | | | | | | | | | |
| | | | |
| Thrifts & Mortgage Finance: 0.58% | | | | | | | | | | | | |
Everbank Financial Corporation | | | | | | | 110,600 | | | | 1,769,600 | |
Ocwen Financial Corporation † | | | | | | | 53,700 | | | | 1,964,346 | |
| | | | |
| | | | | | | | | | | 3,733,946 | |
| | | | | | | | | | | | |
| | | | |
Health Care: 11.17% | | | | | | | | | | | | |
| | | | |
| Biotechnology: 1.76% | | | | | | | | | | | | |
Cepheid Incorporated Ǡ | | | | | | | 98,500 | | | | 3,755,805 | |
Lexicon Genetics Incorporated † | | | | | | | 1,020,800 | | | | 2,021,184 | |
Myriad Genetics Incorporated † | | | | | | | 72,800 | | | | 2,027,480 | |
Onyx Pharmaceuticals Incorporated Ǡ | | | | | | | 29,500 | | | | 2,796,600 | |
Puma Biotechnology Incorporated Ǡ | | | | | | | 23,400 | | | | 753,012 | |
| | | | |
| | | | | | | | | | | 11,354,081 | |
| | | | | | | | | | | | |
| | | | |
| Health Care Equipment & Supplies: 4.42% | | | | | | | | | | | | |
Cooper Companies Incorporated | | | | | | | 59,600 | | | | 6,579,840 | |
Haemonetics Corporation Ǡ | | | | | | | 122,100 | | | | 4,700,850 | |
Masimo Corporation « | | | | | | | 113,200 | | | | 2,270,792 | |
Sirona Dental Systems Incorporated † | | | | | | | 96,800 | | | | 7,118,672 | |
Spectranetics Corporation † | | | | | | | 87,600 | | | | 1,633,740 | |
Unilife Corporation Ǡ | | | | | | | 523,869 | | | | 1,037,261 | |
Volcano Corporation Ǡ | | | | | | | 122,300 | | | | 2,481,467 | |
West Pharmaceutical Services Incorporated | | | | | | | 43,200 | | | | 2,758,752 | |
| | | | |
| | | | | | | | | | | 28,581,374 | |
| | | | | | | | | | | | |
| | | | |
| Health Care Providers & Services: 2.17% | | | | | | | | | | | | |
Centene Corporation † | | | | | | | 42,600 | | | | 1,968,120 | |
HealthSouth Rehabilitation Corporation Ǡ | | | | | | | 272,700 | | | | 7,499,250 | |
Lifepoint Hospitals Incorporated † | | | | | | | 95,400 | | | | 4,579,200 | |
| | | | |
| | | | | | | | | | | 14,046,570 | |
| | | | | | | | | | | | |
The accompanying notes are an integral part of these financial statements.
| | | | |
| 10 | | Wells Fargo Advantage Small Cap Opportunities Fund | | Portfolio of investments—April 30, 2013 (unaudited) |
| | | | | | | | | | | | |
| Security name | | | | | | Shares | | | Value | |
| | | | |
| Life Sciences Tools & Services: 2.08% | | | | | | | | | | | | |
Fluidigm Corporation Ǡ | | | | | | | 103,200 | | | $ | 1,737,888 | |
Parexel International Corporation † | | | | | | | 233,000 | | | | 9,541,350 | |
TECHNE Corporation | | | | | | | 33,700 | | | | 2,161,518 | |
| | | | |
| | | | | | | | | | | 13,440,756 | |
| | | | | | | | | | | | |
| | | | |
| Pharmaceuticals: 0.74% | | | | | | | | | | | | |
Salix Pharmaceuticals Limited † | | | | | | | 92,000 | | | | 4,810,680 | |
| | | | | | | | | | | | |
| | | | |
Industrials: 18.56% | | | | | | | | | | | | |
| | | | |
| Aerospace & Defense: 0.72% | | | | | | | | | | | | |
Hexcel Corporation Ǡ | | | | | | | 152,500 | | | | 4,651,250 | |
| | | | | | | | | | | | |
| | | | |
| Airlines: 0.85% | | | | | | | | | | | | |
Spirit Airlines Incorporated † | | | | | | | 205,700 | | | | 5,492,190 | |
| | | | | | | | | | | | |
| | | | |
| Building Products: 1.38% | | | | | | | | | | | | |
Armstrong World Industries Incorporated † | | | | | | | 91,600 | | | | 4,675,264 | |
Fortune Brands Home & Security Incorporated † | | | | | | | 75,400 | | | | 2,743,806 | |
Universal Forest Products Incorporated | | | | | | | 39,700 | | | | 1,532,420 | |
| | | | |
| | | | | | | | | | | 8,951,490 | |
| | | | | | | | | | | | |
| | | | |
| Commercial Services & Supplies: 2.96% | | | | | | | | | | | | |
ABM Industries Incorporated | | | | | | | 253,700 | | | | 5,720,935 | |
Standard Parking Corporation † | | | | | | | 237,661 | | | | 5,107,335 | |
Stantec Incorporated | | | | | | | 40,694 | | | | 1,740,134 | |
Waste Connections Incorporated | | | | | | | 173,290 | | | | 6,576,356 | |
| | | | |
| | | | | | | | | | | 19,144,760 | |
| | | | | | | | | | | | |
| | | | |
| Construction & Engineering: 1.39% | | | | | | | | | | | | |
Great Lakes Dredge & Dock Company | | | | | | | 265,100 | | | | 1,834,492 | |
MYR Group Incorporated † | | | | | | | 130,400 | | | | 2,973,120 | |
Primoris Services Corporation | | | | | | | 190,000 | | | | 4,187,600 | |
| | | | |
| | | | | | | | | | | 8,995,212 | |
| | | | | | | | | | | | |
| | | | |
| Electrical Equipment: 3.21% | | | | | | | | | | | | |
Belden Incorporated | | | | | | | 47,300 | | | | 2,337,566 | |
EnerSys Ǡ | | | | | | | 173,600 | | | | 7,957,824 | |
PLX Technology Incorporated † | | | | | | | 341,600 | | | | 1,595,272 | |
Regal-Beloit Corporation | | | | | | | 53,300 | | | | 4,190,446 | |
Thermon Group Holdings Incorporated Ǡ | | | | | | | 238,100 | | | | 4,666,760 | |
| | | | |
| | | | | | | | | | | 20,747,868 | |
| | | | | | | | | | | | |
| | | | |
| Machinery: 2.70% | | | | | | | | | | | | |
Enpro Industries Incorporated Ǡ | | | | | | | 152,800 | | | | 7,529,984 | |
IDEX Corporation | | | | | | | 124,773 | | | | 6,491,939 | |
Wabash National Corporation Ǡ | | | | | | | 366,100 | | | | 3,452,323 | |
| | | | |
| | | | | | | | | | | 17,474,246 | |
| | | | | | | | | | | | |
The accompanying notes are an integral part of these financial statements.
| | | | | | |
| Portfolio of investments—April 30, 2013 (unaudited) | | Wells Fargo Advantage Small Cap Opportunities Fund | | | 11 | |
| | | | | | | | | | | | |
| Security name | | | | | | Shares | | | Value | |
| | | | |
| Professional Services: 1.19% | | | | | | | | | | | | |
On Assignment Incorporated † | | | | | | | 76,100 | | | $ | 1,846,947 | |
Towers Watson & Company Class A | | | | | | | 79,700 | | | | 5,811,724 | |
| | | | |
| | | | | | | | | | | 7,658,671 | |
| | | | | | | | | | | | |
| | | | |
| Road & Rail: 1.58% | | | | | | | | | | | | |
Genesee & Wyoming Incorporated Ǡ | | | | | | | 56,200 | | | | 4,788,240 | |
Roadrunner Transportation Systems Incorporated † | | | | | | | 240,300 | | | | 5,409,153 | |
| | | | |
| | | | | | | | | | | 10,197,393 | |
| | | | | | | | | | | | |
| | | | |
| Trading Companies & Distributors: 2.58% | | | | | | | | | | | | |
Applied Industrial Technologies Incorporated | | | | | | | 196,400 | | | | 8,297,900 | |
CAI International Incorporated † | | | | | | | 55,400 | | | | 1,412,146 | |
MRC Global Incorporated † | | | | | | | 232,300 | | | | 6,957,385 | |
| | | | |
| | | | | | | | | | | 16,667,431 | |
| | | | | | | | | | | | |
| | | | |
Information Technology: 12.91% | | | | | | | | | | | | |
| | | | |
| Communications Equipment: 0.90% | | | | | | | | | | | | |
Finisar Corporation Ǡ | | | | | | | 151,900 | | | | 1,950,396 | |
JDS Uniphase Corporation † | | | | | | | 284,500 | | | | 3,840,750 | |
| | | | |
| | | | | | | | | | | 5,791,146 | |
| | | | | | | | | | | | |
| | | | |
| Electronic Equipment, Instruments & Components: 1.60% | | | | | | | | | | | | |
Electro Rent Corporation | | | | | | | 56,100 | | | | 929,577 | |
Fabrinet † | | | | | | | 162,300 | | | | 2,228,379 | |
MTS Systems Corporation | | | | | | | 90,700 | | | | 5,528,165 | |
ScanSource Incorporated † | | | | | | | 57,500 | | | | 1,665,775 | |
| | | | |
| | | | | | | | | | | 10,351,896 | |
| | | | | | | | | | | | |
| | | | |
| Internet Software & Services: 0.69% | | | | | | | | | | | | |
Allegiant Travel Company | | | | | | | 49,600 | | | | 4,459,040 | |
| | | | | | | | | | | | |
| | | | |
| IT Services: 1.92% | | | | | | | | | | | | |
Gartner Incorporated † | | | | | | | 33,700 | | | | 1,949,545 | |
Genpact Limited | | | | | | | 230,200 | | | | 4,281,720 | |
Sapient Corporation † | | | | | | | 528,200 | | | | 6,169,376 | |
| | | | |
| | | | | | | | | | | 12,400,641 | |
| | | | | | | | | | | | |
| | | | |
| Office Electronics: 0.78% | | | | | | | | | | | | |
Zebra Technologies Corporation † | | | | | | | 108,800 | | | | 5,075,520 | |
| | | | | | | | | | | | |
| | | | |
| Semiconductors & Semiconductor Equipment: 3.80% | | | | | | | | | | | | |
Atmel Corporation † | | | | | | | 673,900 | | | | 4,360,133 | |
Entegris Incorporated † | | | | | | | 168,700 | | | | 1,599,276 | |
Fairchild Semiconductor International Incorporated † | | | | | | | 361,400 | | | | 4,662,060 | |
Hittite Microwave Corporation † | | | | | | | 27,200 | | | | 1,526,192 | |
Integrated Device Technology Incorporated † | | | | | | | 643,400 | | | | 4,574,574 | |
MA-COM Technology Solutions Holdings Incorporated † | | | | | | | 217,400 | | | | 3,050,122 | |
The accompanying notes are an integral part of these financial statements.
| | | | |
| 12 | | Wells Fargo Advantage Small Cap Opportunities Fund | | Portfolio of investments—April 30, 2013 (unaudited) |
| | | | | | | | | | | | |
| Security name | | | | | | Shares | | | Value | |
| | | | |
| Semiconductors & Semiconductor Equipment (continued) | | | | | | | | | | | | |
Monolithic Power Systems Incorporated « | | | | | | | 89,000 | | | $ | 2,146,680 | |
Nanometrics Incorporated † | | | | | | | 190,900 | | | | 2,678,327 | |
| | | | |
| | | | | | | | | | | 24,597,364 | |
| | | | | | | | | | | | |
| | | | |
| Software: 3.22% | | | | | | | | | | | | |
Cadence Design Systems Incorporated Ǡ | | | | | | | 220,300 | | | | 3,040,140 | |
Comverse Incorporated † | | | | | | | 81,330 | | | | 2,157,685 | |
NetScout Systems Incorporated † | | | | | | | 181,000 | | | | 4,128,610 | |
PTC Incorporated † | | | | | | | 372,600 | | | | 8,946,126 | |
Verint Systems Incorporated † | | | | | | | 76,825 | | | | 2,538,298 | |
| | | | |
| | | | | | | | | | | 20,810,859 | |
| | | | | | | | | | | | |
| | | | |
Materials: 6.22% | | | | | | | | | | | | |
| | | | |
| Chemicals: 2.33% | | | | | | | | | | | | |
Cabot Corporation | | | | | | | 60,431 | | | | 2,269,788 | |
Innophos Holdings Incorporated | | | | | | | 98,800 | | | | 5,069,428 | |
Minerals Technologies Incorporated | | | | | | | 80,300 | | | | 3,262,589 | |
Quaker Chemical Corporation | | | | | | | 21,700 | | | | 1,339,324 | |
Taminco Corporation Ǡ | | | | | | | 205,800 | | | | 3,101,406 | |
| | | | |
| | | | | | | | | | | 15,042,535 | |
| | | | | | | | | | | | |
| | | | |
| Containers & Packaging: 2.15% | | | | | | | | | | | | |
Berry Plastics Group Incorporated † | | | | | | | 389,500 | | | | 7,400,500 | |
Packaging Corporation of America | | | | | | | 136,100 | | | | 6,472,916 | |
| | | | |
| | | | | | | | | | | 13,873,416 | |
| | | | | | | | | | | | |
| | | | |
| Metals & Mining: 1.74% | | | | | | | | | | | | |
Globe Specialty Metals Incorporated « | | | | | | | 157,600 | | | | 2,058,256 | |
Horsehead Holding Corporation † | | | | | | | 160,900 | | | | 1,721,630 | |
Kaiser Aluminum Corporation « | | | | | | | 70,300 | | | | 4,428,900 | |
Pretium Resources Incorporated Ǡ | | | | | | | 419,600 | | | | 3,075,668 | |
| | | | |
| | | | | | | | | | | 11,284,454 | |
| | | | | | | | | | | | |
| | | | |
Utilities: 5.06% | | | | | | | | | | | | |
| | | | |
| Electric Utilities: 2.89% | | | | | | | | | | | | |
Cleco Corporation | | | | | | | 146,800 | | | | 7,269,536 | |
IDACORP Incorporated | | | | | | | 161,900 | | | | 7,967,099 | |
UNS Energy Corporation | | | | | | | 67,700 | | | | 3,449,992 | |
| | | | |
| | | | | | | | | | | 18,686,627 | |
| | | | | | | | | | | | |
| | | | |
| Multi-Utilities: 1.82% | | | | | | | | | | | | |
Northwestern Corporation | | | | | | | 272,981 | | | | 11,743,643 | |
| | | | | | | | | | | | |
| | | | |
| Water Utilities: 0.35% | | | | | | | | | | | | |
SJW Corporation | | | | | | | 90,300 | | | | 2,290,007 | |
| | | | | | | | | | | | |
| | | | |
Total Common Stocks (Cost $482,661,813) | | | | | | | | | | | 599,117,197 | |
| | | | | | | | | | | | |
The accompanying notes are an integral part of these financial statements.
| | | | | | |
| Portfolio of investments—April 30, 2013 (unaudited) | | Wells Fargo Advantage Small Cap Opportunities Fund | | | 13 | |
| | | | | | | | | | | | | | |
| Security name | | Yield | | | | | Shares | | | Value | |
| | | | |
Short-Term Investments: 20.95% | | | | | | | | | | | | | | |
| | | | |
| Investment Companies: 20.95% | | | | | | | | | | | | | | |
Wells Fargo Advantage Cash Investment Money Market Fund, Select Class (l)(u) | | | 0.13 | % | | | | | 49,667,991 | | | $ | 49,667,991 | |
Wells Fargo Securities Lending Cash Investments, LLC (v)(r)(l)(u) | | | 0.18 | | | | | | 85,739,988 | | | | 85,739,988 | |
| | | | |
Total Short-Term Investments (Cost $135,407,979) | | | | | | | | | | | | | 135,407,979 | |
| | | | | | | | | | | | | | |
| | | | | | | | |
| Total investments in securities | | | | | | | | |
| (Cost $618,069,792) * | | | 113.62 | % | | | 734,525,176 | |
Other assets and liabilities, net | | | (13.62 | ) | | | (88,042,947 | ) |
| | | | | | | | |
| Total net assets | | | 100.00 | % | | $ | 646,482,229 | |
| | | | | | | | |
| † | Non-income-earning security |
| « | All or a portion of this security is on loan. |
| (l) | Investment in an affiliate |
| (u) | Rate shown is the 7-day annualized yield at period end. |
| (v) | Security represents investment of cash collateral received from securities on loan. |
| (r) | The investment company is exempt from registration under Section 3(c)(7) of the Investment Company Act of 1940, as amended. |
| * | Cost for federal income tax purposes is $621,648,280 and unrealized appreciation (depreciation) consists of: |
| | | | |
Gross unrealized appreciation | | $ | 125,159,443 | |
Gross unrealized depreciation | | | (12,282,547 | ) |
| | | | |
Net unrealized appreciation | | $ | 112,876,896 | |
The accompanying notes are an integral part of these financial statements.
| | | | |
| 14 | | Wells Fargo Advantage Small Cap Opportunities Fund | | Statement of assets and liabilities—April 30, 2013 (unaudited) |
| | | | |
| | | | |
| |
Assets | | | | |
Investments | | | | |
In unaffiliated securities (including securities on loan), at value (see cost below) | | $ | 599,117,197 | |
In affiliated securities, at value (see cost below) | | | 135,407,979 | |
| | | | |
Total investments, at value (see cost below) | | | 734,525,176 | |
Receivable for investments sold | | | 5,206,311 | |
Receivable for Fund shares sold | | | 1,045,063 | |
Receivable for dividends | | | 185,021 | |
Receivable for securities lending income | | | 10,927 | |
Prepaid expenses and other assets | | | 18,072 | |
| | | | |
Total assets | | | 740,990,570 | |
| | | | |
| |
Liabilities | | | | |
Payable for investments purchased | | | 7,369,987 | |
Payable for Fund shares redeemed | | | 735,620 | |
Payable upon receipt of securities loaned | | | 85,739,988 | |
Advisory fee payable | | | 407,662 | |
Due to other related parties | | | 78,609 | |
Accrued expenses and other liabilities | | | 176,475 | |
| | | | |
Total liabilities | | | 94,508,341 | |
| | | | |
Total net assets | | $ | 646,482,229 | |
| | | | |
| |
NET ASSETS CONSIST OF | | | | |
Paid-in capital | | $ | 478,056,567 | |
Undistributed net investment income | | | 1,038,532 | |
Accumulated net realized gains on investments | | | 50,931,746 | |
Net unrealized gains on investments | | | 116,455,384 | |
| | | | |
Total net assets | | $ | 646,482,229 | |
| | | | |
| |
COMPUTATION OF NET ASSET VALUE PER SHARE1 | | | | |
Net assets – Administrator Class | | $ | 646,482,229 | |
Shares outstanding – Administrator Class | | | 17,752,230 | |
Net asset value per share – Administrator Class | | | $36.42 | |
| |
Investments in unaffiliated securities (including securities on loan), at cost | | $ | 482,661,813 | |
| | | | |
Investments in affiliated securities, at cost | | $ | 135,407,979 | |
| | | | |
Total investments, at cost | | $ | 618,069,792 | |
| | | | |
Securities on loan, at value | | $ | 83,582,402 | |
| | | | |
| 1. | The Fund has an unlimited number of authorized shares. |
The accompanying notes are an integral part of these financial statements.
| | | | | | |
| Statement of operations—six months ended April 30, 2013 (unaudited) | | Wells Fargo Advantage Small Cap Opportunities Fund | | | 15 | |
| | | | |
| | | | |
| |
Investment income | | | | |
Dividends* | | $ | 6,198,239 | |
Securities lending income, net | | | 98,608 | |
Income from affiliated securities | | | 35,530 | |
| | | | |
Total investment income | | | 6,332,377 | |
| | | | |
| |
Expenses | | | | |
Advisory fee | | | 2,479,007 | |
Administration fees | | | | |
Fund level | | | 155,936 | |
Administrator Class | | | 311,874 | |
Shareholder servicing fees | | | | |
Administrator Class | | | 779,380 | |
Custody and accounting fees | | | 21,609 | |
Professional fees | | | 13,195 | |
Registration fees | | | 9,075 | |
Shareholder report expenses | | | 11,341 | |
Trustees’ fees and expenses | | | 7,175 | |
Other fees and expenses | | | 7,341 | |
| | | | |
Total expenses | | | 3,795,933 | |
Less: Fee waivers and/or expense reimbursements | | | (53,450 | ) |
| | | | |
Net expenses | | | 3,742,483 | |
| | | | |
Net investment income | | | 2,589,894 | |
| | | | |
| |
REALIZED AND UNREALIZED GAINS (LOSSES) ON INVESTMENTS | | | | |
Net realized gains on investments | | | 55,349,735 | |
Net change in unrealized gains (losses) on investments | | | 25,983,164 | |
| | | | |
Net realized and unrealized gains (losses) on investments | | | 81,332,899 | |
| | | | |
Net increase in net assets resulting from operations | | $ | 83,922,793 | |
| | | | |
| |
* Net of foreign dividend withholding taxes in the amount of | | | $2,207 | |
The accompanying notes are an integral part of these financial statements.
| | | | |
| 16 | | Wells Fargo Advantage Small Cap Opportunities Fund | | Statement of changes in net assets |
| | | | | | | | | | | | | | | | |
| | | Six months ended
April 30, 2013
(unaudited) | | | Year ended
October 31, 2012 | |
| | | | |
Operations | | | | | | | | | | | | | | | | |
Net investment income | | | | | | $ | 2,589,894 | | | | | | | $ | 856,204 | |
Net realized gains on investments | | | | | | | 55,349,735 | | | | | | | | 46,905,106 | |
Net change in unrealized gains (losses) on investments | | | | | | | 25,983,164 | | | | | | | | 14,456,955 | |
| | | | | | | | | | | | | | | | |
Net increase in net assets resulting from operations | | | | | | | 83,922,793 | | | | | | | | 62,218,265 | |
| | | | | | | | | | | | | | | | |
| | | | |
Distributions to shareholders from | | | | | | | | | | | | | | | | |
Net investment income | | | | | | | | | | | | | | | | |
Administrator Class | | | | | | | (1,493,440 | ) | | | | | | | 0 | |
Net realized gains | | | | | | | | | | | | | | | | |
Administrator Class | | | | | | | (44,504,060 | ) | | | | | | | (24,479,270 | ) |
| | | | | | | | | | | | | | | | |
Total distributions to shareholders | | | | | | | (45,997,500 | ) | | | | | | | (24,479,270 | ) |
| | | | | | | | | | | | | | | | |
| | | | |
| | | Shares | | | | | | Shares | | | | |
Capital share transactions | | | | | | | | | | | | | | | | |
Proceeds from shares sold | | | | | | | | | | | | | | | | |
Administrator Class | | | 1,089,204 | | | | 37,812,772 | | | | 2,166,689 | | | | 72,318,770 | |
Reinvestment of distributions | | | | | | | | | | | | | | | | |
Administrator Class | | | 1,419,026 | | | | 45,545,649 | | | | 765,523 | | | | 24,182,866 | |
Payment for shares redeemed | | | | | | | | | | | | | | | | |
Administrator Class | | | (2,893,461 | ) | | | (99,645,484 | ) | | | (5,000,111 | ) | | | (166,116,470 | ) |
| | | | | | | | | | | | | | | | |
Net decrease in net assets resulting from capital share transactions | | | | | | | (16,287,063 | ) | | | | | | | (69,614,834 | ) |
| | | | | | | | | | | | | | | | |
Total increase (decrease) in net assets | | | | | | | 21,638,230 | | | | | | | | (31,875,839 | ) |
| | | | | | | | | | | | | | | | |
| | | | |
Net assets | | | | | | | | | | | | | | | | |
Beginning of period | | | | | | | 624,843,999 | | | | | | | | 656,719,838 | |
| | | | | | | | | | | | | | | | |
End of period | | | | | | $ | 646,482,229 | | | | | | | $ | 624,843,999 | |
| | | | | | | | | | | | | | | | |
Undistributed (overdistributed) net investment income | | | | | | $ | 1,038,532 | | | | | | | $ | (57,922 | ) |
| | | | | | | | | | | | | | | | |
The accompanying notes are an integral part of these financial statements.
| | | | | | |
| Financial highlights | | Wells Fargo Advantage Small Cap Opportunities Fund | | | 17 | |
(For a share outstanding throughout each period)
| | | | | | | | | | | | | | | | | | | | | | | | |
| | | Six months ended
April 30, 2013
(unaudited) | | | Year ended October 31 | |
| ADMINISTRATOR CLASS | | | 2012 | | | 2011 | | | 2010 | | | 2009 | | | 2008 | |
Net asset value, beginning of period | | $ | 34.45 | | | $ | 32.50 | | | $ | 31.33 | | | $ | 25.88 | | | $ | 23.47 | | | $ | 39.68 | |
Net investment income (loss) | | | 0.14 | | | | 0.05 | | | | 0.00 | 1 | | | (0.06 | ) | | | (0.02 | ) | | | 0.01 | |
Net realized and unrealized gains (losses) on investments | | | 4.44 | | | | 3.13 | | | | 1.17 | | | | 5.51 | | | | 3.38 | | | | (11.23 | ) |
| | | | | | | | | | | | | | | | | | | | | | | | |
Total from investment operations | | | 4.58 | | | | 3.18 | | | | 1.17 | | | | 5.45 | | | | 3.36 | | | | (11.22 | ) |
Distributions to shareholders from | | | | | | | | | | | | | | | | | | | | | | | | |
Net investment income | | | (0.08 | ) | | | 0.00 | | | | 0.00 | | | | 0.00 | | | | 0.00 | | | | (0.10 | ) |
Net realized gains | | | (2.53 | ) | | | (1.23 | ) | | | 0.00 | | | | 0.00 | | | | (0.93 | ) | | | (4.89 | ) |
Tax basis return of capital | | | 0.00 | | | | 0.00 | | | | 0.00 | | | | 0.00 | | | | (0.02 | ) | | | 0.00 | |
| | | | | | | | | | | | | | | | | | | | | | | | |
Total distributions to shareholders | | | (2.61 | ) | | | (1.23 | ) | | | 0.00 | | | | 0.00 | | | | (0.95 | ) | | | (4.99 | ) |
Net asset value, end of period | | $ | 36.42 | | | $ | 34.45 | | | $ | 32.50 | | | $ | 31.33 | | | $ | 25.88 | | | $ | 23.47 | |
Total return | | | 14.33 | % | | | 10.12 | % | | | 3.73 | % | | | 21.06 | % | | | 15.44 | % | | | (31.65 | )% |
Ratios to average net assets (annualized) | | | | | | | | | | | | | | | | | | | | | | | | |
Gross expenses | | | 1.22 | % | | | 1.22 | % | | | 1.22 | % | | | 1.25 | % | | | 1.31 | % | | | 1.28 | % |
Net expenses | | | 1.20 | % | | | 1.20 | % | | | 1.20 | % | | | 1.20 | % | | | 1.20 | % | | | 1.20 | % |
Net investment income (loss) | | | 0.83 | % | | | 0.13 | % | | | 0.00 | % | | | (0.20 | )% | | | (0.07 | )% | | | 0.08 | % |
Supplemental data | | | | | | | | | | | | | | | | | | | | | | | | |
Portfolio turnover rate | | | 39 | % | | | 78 | % | | | 100 | % | | | 66 | % | | | 68 | % | | | 72 | % |
Net assets, end of period (000s omitted) | | | $646,482 | | | | $624,844 | | | | $656,720 | | | | $707,958 | | | | $612,110 | | | | $541,369 | |
| 1. | Amount is less than $0.005. |
The accompanying notes are an integral part of these financial statements.
| | | | |
| 18 | | Wells Fargo Advantage Small Cap Opportunities Fund | | Notes to financial statements (unaudited) |
1. ORGANIZATION
Wells Fargo Funds Trust (the “Trust”), a Delaware statutory trust organized on March 10, 1999, is an open-end management investment company registered under the Investment Company Act of 1940, as amended (the “1940 Act”). These financial statements report on Wells Fargo Advantage Small Cap Opportunities Fund (the “Fund”) which is a diversified series of the Trust.
2. SIGNIFICANT ACCOUNTING POLICIES
The following significant accounting policies, which are consistently followed in the preparation of the financial statements of the Fund, are in conformity with U.S. generally accepted accounting principles which require management to make estimates and assumptions that affect the reported amounts of assets and liabilities, disclosure of contingent assets and liabilities at the date of the financial statements, and the reported amounts of revenues and expenses during the reporting period. Actual results could differ from those estimates.
Securities valuation
All investments are valued each business day as of the close of regular trading on the New York Stock Exchange (normally 4 p.m. Eastern Time).
Equity securities that are listed on a foreign or domestic exchange, except for The Nasdaq Stock Market, Inc. (“Nasdaq”), are valued at the official closing price or, if none, the last sales price. Securities listed on Nasdaq are valued at the Nasdaq Official Closing Price (“NOCP”). If no NOCP is available, securities are valued at the last sales price. If no sales price is shown on the Nasdaq, the bid price will be used. If no sale occurs on the primary exchange or market for the security that day or if no sale occurs and no bid price is shown on Nasdaq, the prior day’s price will be deemed “stale” and fair values will be determined in accordance with the Fund’s Valuation Procedures.
Securities denominated in foreign currencies are translated into U.S. dollars using the rates of exchange in effect on the day of valuation at a time specified by the Management Valuation Team of Wells Fargo Funds Management, LLC (“Funds Management”).
Many securities markets and exchanges outside the U.S. close prior to the close of the New York Stock Exchange and therefore may not fully reflect trading or events that occur after the close of the principal exchange in which the foreign securities are traded, but before the close of the New York Stock Exchange. If such trading or events are expected to materially affect the value of such securities, then fair value pricing procedures approved by the Board of Trustees are applied. These procedures take into account multiple factors including movements in U.S. securities markets after foreign exchanges close. Foreign securities that are fair valued under these procedures are categorized as Level 2 and the application of these procedures may result in transfers between Level 1 and Level 2. Depending on market activity, such fair valuations may be frequent. Such fair value pricing may result in NAVs that are higher or lower than NAVs based on the last reported sales price or latest quoted bid price. On April 30, 2013, fair value pricing was not used in pricing foreign securities.
Investments in registered open-end investment companies are valued at net asset value. Non-registered investment companies are fair valued at net asset value.
Investments which are not valued using any of the methods discussed above are valued at their fair value, as determined by procedures established in good faith and approved by the Board of Trustees. The Board of Trustees has established a Valuation Committee comprised of the Trustees and has delegated to it the authority to take any actions regarding the valuation of portfolio securities that the Valuation Committee deems necessary or appropriate, including determining the fair value of portfolio securities, unless the determination has been delegated to the Management Valuation Team. The Board of Trustees retains the authority to make or ratify any valuation decisions or approve any changes to the Valuation Procedures as it deems appropriate. On a quarterly basis, the Board of Trustees receives reports on any valuation actions taken by the Valuation Committee or the Management Valuation Team which may include items for ratification.
Valuations of fair valued securities are compared to the next actual sales price when available, or other appropriate market information to assess the continued appropriateness of the fair valuation methodology used. These securities are fair valued on a day-to-day basis, taking into consideration changes to appropriate market information and any significant changes to the input factors considered in the valuation process until there is a readily available price provided on the exchange or by an independent pricing service. Valuations received from an independent pricing service or broker quotes are periodically validated by comparisons to most recent trades and valuations provided by other independent pricing services in addition to the review of prices by the adviser and/or subadviser. Unobservable inputs used in determining fair valuations are identified based on the type of security, taking into consideration factors utilized by market participants in valuing the investment, knowledge about the issuer and the current market environment.
| | | | | | |
| Notes to financial statements (unaudited) | | Wells Fargo Advantage Small Cap Opportunities Fund | | | 19 | |
Foreign currency translation
The accounting records of the Fund are maintained in U.S. dollars. Assets, including investment securities, and liabilities denominated in foreign currency are translated into U.S. dollars at the rates of exchange at a time specified by the Management Valuation Team on the date of valuation. Purchases and sales of securities, and income and expenses are converted at the rate of exchange on the respective dates of such transactions. Reported net realized foreign exchange gains or losses arise from sales of foreign currencies, currency gains or losses realized between the trade and settlement dates on securities transactions, and the difference between the amounts of dividends, interest and foreign withholding taxes recorded and the U.S. dollar equivalent of the amounts actually paid or received. Net unrealized foreign exchange gains and losses arise from changes in the fair value of assets and liabilities other than investments in securities resulting in changes in exchange rates.
The changes in net assets arising from changes in exchange rates and the changes in net assets resulting from changes in market prices of securities are not separately presented. Such changes are recorded with net realized and unrealized gains or losses from investments. Gains and losses from certain foreign currency transactions are treated as ordinary income for U.S. federal income tax purposes.
Security loans
The Fund may lend its securities from time to time in order to earn additional income in the form of fees or interest on securities received as collateral or the investment of any cash received as collateral. The Fund continues to receive interest or dividends on the securities loaned. The Fund receives collateral in the form of cash or securities with a value at least equal to the value of the securities on loan. The value of the loaned securities is determined at the close of each business day and any additional required collateral is delivered to the Fund on the next business day. In a securities lending transaction, the net asset value of the Fund will be affected by an increase or decrease in the value of the securities loaned and by an increase or decrease in the value of the instrument in which collateral is invested. The amount of securities lending activity undertaken by the Fund fluctuates from time to time. In the event of default or bankruptcy by the borrower, the Fund may be prevented from recovering the loaned securities or gaining access to the collateral or may experience delays or costs in doing so. In addition, the investment of any cash collateral received may lose all or part of its value. The Fund has the right under the lending agreement to recover the securities from the borrower on demand.
The Fund lends its securities through an unaffiliated securities lending agent. Cash collateral received in connection with its securities lending transactions is invested in Wells Fargo Securities Lending Cash Investments, LLC (the “Cash Collateral Fund”). The Cash Collateral Fund is exempt from registration under Section 3(c)(7) of the 1940 Act and is managed by Funds Management and is subadvised by Wells Capital Management Incorporated (“WellsCap”). Funds Management receives an advisory fee starting at 0.05% and declining to 0.01% as the average daily net assets of the Cash Collateral Fund increase. All of the fees received by Funds Management are paid to WellsCap for its services as subadviser. The Cash Collateral Fund seeks to provide a positive return compared to the daily Fed Funds Open rate by investing in high-quality, U.S. dollar-denominated short-term money market instruments. Cash Collateral Fund investments are fair valued based upon the amortized cost valuation technique. Income earned from investment in the Cash Collateral Fund is included in securities lending income on the Statement of Operations.
Security transactions and income recognition
Securities transactions are recorded on a trade date basis. Realized gains or losses are recorded on the basis of identified cost.
Dividend income is recognized on the ex-dividend date, except for certain dividends from foreign securities, which are recorded as soon as the Fund is informed of the ex-dividend date. Dividend income from foreign securities is recorded net of foreign taxes withheld where recovery of such taxes is not assured.
Distributions to shareholders
Distributions to shareholders from net investment income and net realized gains, if any, are recorded on the ex-dividend date. Such distributions are determined in conformity with federal income tax regulations, which may differ in amount or character from net investment income and realized gains recognized for purposes of U.S. generally accepted accounting principles.
Federal and other taxes
The Fund intends to continue to qualify as a regulated investment company by distributing substantially all of its investment company taxable income and any net realized capital gains (after reduction for capital loss carryforwards) sufficient to relieve it from all, or substantially all, federal income taxes. Accordingly, no provision for federal income taxes was required.
| | | | |
| 20 | | Wells Fargo Advantage Small Cap Opportunities Fund | | Notes to financial statements (unaudited) |
The Fund’s income and federal excise tax returns and all financial records supporting those returns for the prior three fiscal years are subject to examination by the federal and Delaware revenue authorities. Management has analyzed the Fund’s tax positions taken on federal, state, and foreign tax returns for all open tax years and does not believe that there are any uncertain tax positions that require recognition of a tax liability.
3. FAIR VALUATION MEASUREMENTS
Fair value measurements of investments are determined within a framework that has established a fair value hierarchy based upon the various data inputs utilized in determining the value of the Fund’s investments. The three-level hierarchy gives the highest priority to unadjusted quoted prices in active markets for identical assets or liabilities (Level 1) and the lowest priority to significant unobservable inputs (Level 3). The Fund’s investments are classified within the fair value hierarchy based on the lowest level of input that is significant to the fair value measurement. The inputs are summarized into three broad levels as follows:
| n | | Level 1 – quoted prices in active markets for identical securities |
| n | | Level 2 – other significant observable inputs (including quoted prices for similar securities, interest rates, prepayment speeds, credit risk, use of amortized cost, etc.) |
| n | | Level 3 – significant unobservable inputs (including the Fund’s own assumptions in determining the fair value of investments) |
The inputs or methodologies used for valuing investments in securities are not necessarily an indication of the risk associated with investing in those securities.
As of April 30, 2013, the inputs used in valuing investments in securities were as follows:
| | | | | | | | | | | | | | | | |
| Investments in securities | | Quoted prices (Level 1) | | | Significant other
observable inputs (Level 2) | | | Significant unobservable inputs (Level 3) | | | Total | |
Equity securities | | | | | | | | | | | | | | | | |
Common stocks | | $ | 599,117,197 | | | $ | 0 | | | $ | 0 | | | $ | 599,117,197 | |
Short-term investments | | | | | | | | | | | | | | | | |
Investment companies | | | 49,667,991 | | | | 85,739,988 | | | | 0 | | | | 135,407,979 | |
| | | $ | 648,785,188 | | | $ | 85,739,988 | | | $ | 0 | | | $ | 734,525,176 | |
Transfers in and transfers out are recognized at the end of the reporting period. For the six months ended April 30, 2013, the Fund did not have any transfers into/out of Level 1 or Level 2.
4. TRANSACTIONS WITH AFFILIATES AND OTHER EXPENSES
Advisory fee
The Trust has entered into an advisory contract with Funds Management, an indirect wholly owned subsidiary of Wells Fargo & Company (“Wells Fargo”). The adviser is responsible for implementing investment policies and guidelines and for supervising the subadviser, who is responsible for day-to-day portfolio management of the Fund.
Pursuant to the contract, Funds Management is entitled to receive an annual advisory fee starting at 0.80% and declining to 0.70% as the average daily net assets of the Fund increase. For the six months ended April 30, 2013, the advisory fee was equivalent to an annual rate of 0.79% of the Fund’s average daily net assets.
Funds Management has retained the services of a subadviser to provide daily portfolio management to the Fund. The fee for subadvisory services is borne by Funds Management. Schroder Investment Management North America Inc. is the subadviser to the Fund and is entitled to receive a fee from Funds Management at an annual rate starting at 0.50% and declining to 0.45% as the average daily net assets of the Fund increase.
Administration and transfer agent fees
The Trust has entered into an administration agreement with Funds Management. Under this agreement, for providing administrative services, which includes paying fees and expenses for services provided by the transfer agent, sub-transfer agents, omnibus account servicers and record-keepers, Funds Management is entitled to receive from the Fund an annual fund level administration fee starting at 0.05% and declining to 0.03% as the average daily net assets of the Fund increase and a class level administration fee of 0.10% of the average daily net assets of Administrator Class.
| | | | | | |
| Notes to financial statements (unaudited) | | Wells Fargo Advantage Small Cap Opportunities Fund | | | 21 | |
Funds Management has contractually waived and/or reimbursed advisory and administration fees to the extent necessary to maintain certain net operating expense ratios for the Fund. Waiver of fees and/or reimbursement of expenses by Funds Management were made first from fund level expenses on a proportionate basis and then from class specific expenses. Funds Management has committed through February 28, 2014 to waive fees and/or reimburse expenses to the extent necessary to cap the Fund’s expenses at 1.20% for Administrator Class shares.
Shareholder servicing fees
The Trust has entered into contracts with one or more shareholder servicing agents, whereby Administrator Class of the Fund is charged a fee at an annual rate of 0.25% of its average daily net assets.
A portion of these total shareholder servicing fees were paid to affiliates of Wells Fargo.
5. INVESTMENT PORTFOLIO TRANSACTIONS
Purchases and sales of investments, excluding U.S. government obligations (if any) and short-term securities, for the six months ended April 30, 2013 were $224,250,160 and $244,810,624, respectively.
6. BANK BORROWINGS
The Trust (excluding the money market funds and certain other funds in the Trust) and Wells Fargo Variable Trust are parties to a $150,000,000 revolving credit agreement with State Street Bank and Trust Company, whereby the Fund is permitted to use bank borrowings for temporary or emergency purposes, such as to fund shareholder redemption requests. Interest under the credit agreement is charged to the Fund based on a borrowing rate equal to the higher of the Federal Funds rate in effect on that day plus 1.25% or the overnight LIBOR rate in effect on that day plus 1.25%. In addition, an annual commitment fee equal to 0.10% of the unused balance is allocated to each participating fund. For the six months ended April 30, 2013, the Fund paid $670 in commitment fees.
For the six months ended April 30, 2013, there were no borrowings by the Fund under the agreement.
7. INDEMNIFICATION
Under the Trust’s organizational documents, the officers and directors are indemnified against certain liabilities that may arise out of performance of their duties to the Trust. Additionally, in the normal course of business, the Trust may enter into contracts with service providers that contain a variety of indemnification clauses. The Trust’s maximum exposure under these arrangements is dependent on future claims that may be made against the Fund and, therefore, cannot be estimated.
8. NEW ACCOUNTING PRONOUNCEMENT
In December 2011, the Financial Accounting Standards Board (“FASB”) issued Accounting Standard Update (“ASU”) No. 2011-11, Disclosures about Offsetting Assets and Liabilities. ASU 2011-11, which amends FASB ASC Topic 210, Balance Sheet, creates new disclosure requirements which require entities to disclose both gross and net information for derivatives and other financial instruments that are either offset in the Statement of Assets and Liabilities or subject to an enforceable master netting arrangement or similar agreement. The disclosure requirements are effective for interim and annual reporting periods beginning on or after January 1, 2013. Management is currently assessing the potential impact, in addition to expanded financial statement disclosure, that may result from adopting this ASU.
| | | | |
| 22 | | Wells Fargo Advantage Small Cap Opportunities Fund | | Other information (unaudited) |
PROXY VOTING INFORMATION
A description of the policies and procedures that the Fund uses to determine how to vote proxies relating to portfolio securities is available without charge, upon request, by calling 1-800-222-8222, visiting our website at wellsfargoadvantagefunds.com, or visiting the SEC website at sec.gov. Information regarding how the Fund voted proxies relating to portfolio securities during the most recent 12-month period ended June 30 is available without charge on the Fund’s website at wellsfargoadvantagefunds.com or by visiting the SEC website at sec.gov.
PORTFOLIO HOLDINGS INFORMATION
The complete portfolio holdings for the Fund are publicly available on the Fund’s website (wellsfargoadvantagefunds.com) on a monthly, 30-day or more delayed basis. In addition, top ten holdings information for the Fund is publicly available on the Fund’s website on a monthly, seven-day or more delayed basis. The Fund files its complete schedule of portfolio holdings with the SEC for the first and third quarters of each fiscal year on Form N-Q, which is available without charge by visiting the SEC website at sec.gov. In addition, the Fund’s Form N-Q may be reviewed and copied at the SEC’s Public Reference Room in Washington, DC, and at regional offices in New York City, at 233 Broadway, and in Chicago, at 175 West Jackson Boulevard, Suite 900. Information about the Public Reference Room may be obtained by calling 1-800-SEC-0330.
| | | | | | |
| Other information (unaudited) | | Wells Fargo Advantage Small Cap Opportunities Fund | | | 23 | |
BOARD OF TRUSTEES AND OFFICERS
Each of the Trustees and Officers listed in the table below acts in identical capacities for the Wells Fargo Advantage family of funds, which consists of 131 funds1 comprising the Wells Fargo Funds Trust, Wells Fargo Variable Trust, Wells Fargo Master Trust and four closed-end funds (collectively the “Fund Complex”). This table should be read in conjunction with the Prospectus and the Statement of Additional Information2. All of the Trustees are also Members of the Audit and Governance Committees of each Trust in the Fund Complex. The mailing address of each Trustee and Officer is 525 Market Street, 12th Floor, San Francisco, CA 94105. Each Trustee and Officer serves an indefinite term, however, each Trustee serves such term until reaching the mandatory retirement age established by the Trustees.
Independent Trustees
| | | | | | |
Name and
year of birth | | Position held and
length of service* | | Principal occupations during past five years | | Other
directorships during
past five years |
Peter G. Gordon
(Born 1942) | | Trustee, since 1998; Chairman, since 2005 | | Co-Founder, Retired Chairman, President and CEO of Crystal Geyser Water Company. Trustee Emeritus, Colby College. | | Asset Allocation Trust |
Isaiah Harris, Jr.
(Born 1952) | | Trustee, since 2009 | | Retired. Prior thereto, President and CEO of BellSouth Advertising and Publishing Corp. from 2005 to 2007, President and CEO of BellSouth Enterprises from 2004 to 2005 and President of BellSouth Consumer Services from 2000 to 2003. Emeritus member of the Iowa State University Foundation Board of Governors. Emeritus Member of the Advisory Board of Iowa State University School of Business. Advisory Board Member, Palm Coast Academy (charter school). Mr. Harris is a certified public accountant. | | CIGNA Corporation; Deluxe Corporation; Asset Allocation Trust |
Judith M. Johnson
(Born 1949) | | Trustee, since 2008; Audit Committee Chairman, since 2008 | | Retired. Prior thereto, Chief Executive Officer and Chief Investment Officer of Minneapolis Employees Retirement Fund from 1996 to 2008. Ms. Johnson is an attorney, certified public accountant and a certified managerial accountant. | | Asset Allocation Trust |
Leroy Keith, Jr.
(Born 1939) | | Trustee, since 2010 | | Chairman, Bloc Global Services (development and construction). Trustee of the Evergreen Funds from 1983 to 2010. Former Managing Director, Almanac Capital Management (commodities firm), former Partner, Stonington Partners, Inc. (private equity fund), former Director, Obagi Medical Products Co. and former Director, Lincoln Educational Services. | | Trustee, Virtus Fund Complex (consisting of 48 portfolios as of 1/31/2013); Asset Allocation Trust |
David F. Larcker
(Born 1950) | | Trustee, since 2009 | | James Irvin Miller Professor of Accounting at the Graduate School of Business, Stanford University, Morgan Stanley Director of the Center for Leadership Development and Research and Senior Faculty of The Rock Center for Corporate Governance since 2006. From 2005 to 2008, Professor of Accounting at the Graduate School of Business, Stanford University. Prior thereto, Ernst & Young Professor of Accounting at The Wharton School, University of Pennsylvania from 1985 to 2005. | | Asset Allocation Trust |
Olivia S. Mitchell
(Born 1953) | | Trustee, since 2006 | | International Foundation of Employee Benefit Plans Professor, Wharton School of the University of Pennsylvania since 1993. Director of Wharton’s Pension Research Council and Boettner Center on Pensions & Retirement Research, and Research Associate at the National Bureau of Economic Research. Previously, Cornell University Professor from 1978 to 1993. | | Asset Allocation Trust |
Timothy J. Penny
(Born 1951) | | Trustee, since 1996 | | President and CEO of Southern Minnesota Initiative Foundation, a non-profit organization, since 2007 and Senior Fellow at the Humphrey Institute Policy Forum at the University of Minnesota since 1995. Member of the Board of Trustees of NorthStar Education Finance, Inc., a non-profit organization, since 2007. | | Asset Allocation Trust |
| | | | |
| 24 | | Wells Fargo Advantage Small Cap Opportunities Fund | | Other information (unaudited) |
| | | | | | |
Name and
year of birth | | Position held and
length of service* | | Principal occupations during past five years | | Other
directorships during
past five years |
Michael S. Scofield
(Born 1943) | | Trustee, since 2010 | | Served on the Investment Company Institute’s Board of Governors and Executive Committee from 2008-2011 as well the Governing Council of the Independent Directors Council from 2006-2011 and the Independent Directors Council Executive Committee from 2008-2011. Chairman of the IDC from 2008-2010. Institutional Investor (Fund Directions) Trustee of Year in 2007. Trustee of the Evergreen Funds (and its predecessors) from 1984 to 2010. Chairman of the Evergreen Funds from 2000-2010. Former Trustee of the Mentor Funds. Retired Attorney, Law Offices of Michael S. Scofield. | | Asset Allocation Trust |
Donald C. Willeke
(Born 1940) | | Trustee, since 1996 | | Principal of the law firm of Willeke & Daniels. General Counsel of the Minneapolis Employees Retirement Fund from 1984 until its consolidation into the Minnesota Public Employees Retirement Association on June 30, 2010. Director and Vice Chair of The Tree Trust (non-profit corporation). Director of the American Chestnut Foundation (non-profit corporation). | | Asset Allocation Trust |
| * | Length of service dates reflect the Trustee’s commencement of service with the Trust’s predecessor entities, where applicable. |
Officers
| | | | | | |
Name and
year of birth | | Position held and
length of service | | Principal occupations during past five years | | |
Karla M. Rabusch
(Born 1959) | | President, since 2003 | | Executive Vice President of Wells Fargo Bank, N.A. and President of Wells Fargo Funds Management, LLC since 2003. | | |
Nancy Wiser1
(Born 1967) | | Treasurer, since 2012 | | Executive Vice President of Wells Fargo Funds Management, LLC since 2011. Chief Operating Officer and Chief Compliance Officer at LightBox Capital Management LLC, from 2008 to 2011. Owned and operated a consulting business providing services to various hedge funds including acting as Chief Operating Officer and Chief Compliance Officer for a hedge fund from 2007 to 2008. Chief Operating Officer and Chief Compliance Officer of GMN Capital LLC from 2006 to 2007. | | |
C. David Messman
(Born 1960) | | Secretary, since 2000; Chief Legal Officer, since 2003 | | Senior Vice President and Secretary of Wells Fargo Funds Management, LLC since 2001. Vice President and Managing Counsel of Wells Fargo Bank, N.A. since 1996. | | |
Debra Ann Early
(Born 1964) | | Chief Compliance Officer, since 2007 | | Chief Compliance Officer of Wells Fargo Funds Management, LLC since 2007. Chief Compliance Officer of Parnassus Investments from 2005 to 2007. Chief Financial Officer of Parnassus Investments from 2004 to 2007. | | |
David Berardi
(Born 1975) | | Assistant Treasurer, since 2009 | | Vice President of Wells Fargo Funds Management, LLC since 2009. Vice President of Evergreen Investment Management Company, LLC from 2008 to 2010. Assistant Vice President of Evergreen Investment Services, Inc. from 2004 to 2008. Manager of Fund Reporting and Control for Evergreen Investment Management Company, LLC from 2004 to 2010. | | |
Jeremy DePalma1
(Born 1974) | | Assistant Treasurer, since 2009 | | Senior Vice President of Wells Fargo Funds Management, LLC since 2009. Senior Vice President of Evergreen Investment Management Company, LLC from 2008 to 2010. Vice President, Evergreen Investment Services, Inc. from 2004 to 2007. Head of the Fund Reporting and Control Team within Fund Administration from 2005 to 2010. | | |
| 1. | Nancy Wiser acts as Treasurer of 73 funds in the Fund Complex. Jeremy DePalma acts as Treasurer of 58 funds and Assistant Treasurer of 73 funds in the Fund Complex. |
| 2. | The Statement of Additional Information includes additional information about the Trustees and is available,without charge, upon request, by calling 1-800-222-8222 or by visiting the website at wellsfargoadvantagefunds.com. |
| | | | | | |
| Other information (unaudited) | | Wells Fargo Advantage Small Cap Opportunities Fund | | | 25 | |
BOARD CONSIDERATION OF INVESTMENT ADVISORY AND SUBADVISORY AGREEMENTS:
Under Section 15 of the Investment Company Act of 1940 (the “1940 Act”), the Board of Trustees (the “Board”) of Wells Fargo Funds Trust (the “Trust”), all the members of which have no direct or indirect interest in the investment advisory and sub-advisory agreements and are not “interested persons” of the Trust, as defined in the 1940 Act (the “Independent Trustees”), must determine whether to approve the continuation of the Trust’s investment advisory and sub-advisory agreements. In this regard, at an in-person meeting held on March 28-29, 2013 (the “Meeting”), the Board reviewed: (i) an investment advisory agreement with Wells Fargo Funds Management, LLC (“Funds Management”) for Wells Fargo Advantage Small Cap Opportunities Fund (the “Fund”) and (ii) an investment sub-advisory agreement with Schroder Investment Management North America Inc. (the “Sub-Adviser”) for the Fund. The investment advisory agreement with Funds Management and the investment sub-advisory agreement with the Sub-Adviser are collectively referred to as the “Advisory Agreements.”
At the Meeting, the Board considered the factors and reached the conclusions described below relating to the selection of Funds Management and the Sub-Adviser and the continuation of the Advisory Agreements. Prior to the Meeting, the Trustees conferred extensively among themselves and with representatives of Funds Management about these matters. The Board has adopted a team-based approach, with each team consisting of a sub-set of Trustees, to assist the Board in the discharge of its duties in reviewing performance and other matters throughout the year. The Independent Trustees were assisted in their evaluation of the Advisory Agreements by independent legal counsel, from whom they received separate legal advice and with whom they met separately.
In providing information to the Board, Funds Management and the Sub-Adviser were guided by a detailed set of requests for information submitted to them by independent legal counsel on behalf of the Independent Trustees at the start of the Board’s annual contract renewal process earlier in 2013. In considering and approving the Advisory Agreements, the Trustees considered the information they believed relevant, including but not limited to the information discussed below. The Board considered not only the specific information presented in connection with the Meeting, but also the knowledge gained over time through interaction with Funds Management and the Sub-Adviser about various topics. In this regard, the Board reviewed reports of Funds Management at each of its quarterly meetings, which included, among other things, portfolio reviews and performance reports. In addition, the Board and the teams mentioned above confer with portfolio managers at various times throughout the year. The Board did not identify any particular information or consideration that was all-important or controlling, and each individual Trustee may have attributed different weights to various factors.
After its deliberations, the Board unanimously determined that the continuation of the Advisory Agreements is in the best interests of the Fund and its shareholders, and that the compensation payable to Funds Management and the Sub-Adviser is reasonable. The Board considered the continuation of the Advisory Agreements for the Fund as part of its consideration of the continuation of advisory agreements for funds across the complex, but each decision was made on a fund-by-fund basis. The following summarizes a number of important, but not necessarily all, factors considered by the Board in reaching its determination.
Nature, extent and quality of services
The Board received and considered various information regarding the nature, extent and quality of services provided to the Fund by Funds Management and the Sub-Adviser under the Advisory Agreements. This information included, among other things, a summary of the background and experience of senior management of Funds Management, and the qualifications, background, tenure and responsibilities of each of the portfolio managers primarily responsible for the day-to-day portfolio management of the Fund.
The Board evaluated the ability of Funds Management and the Sub-Adviser, based on attributes such as their financial condition, resources and reputation, to attract and retain qualified investment professionals, including research, advisory and supervisory personnel. The Board further considered the compliance programs and compliance records of Funds Management and the Sub-Adviser. In addition, the Board took into account the administrative and other services provided to the Fund by Funds Management and its affiliates and Funds Management’s oversight of the Fund’s various service providers.
Fund performance and expenses
The Board considered the performance results for the Fund over various time periods ended December 31, 2012. The Board also considered these results in comparison to the performance of funds in a universe that was determined by Lipper Inc. (“Lipper”) to be similar to the Fund (the “Universe”), and in comparison to the Fund’s benchmark index and to other comparative data. Lipper is an independent provider of investment company data. The Board received a description of the methodology used by Lipper to select the mutual funds in the performance Universe. The Board noted
| | | | |
| 26 | | Wells Fargo Advantage Small Cap Opportunities Fund | | Other information (unaudited) |
that the performance of the Fund (Administrator Class) was higher than or in range of the median performance of the Universe for the five- and ten-year periods under review, and lower than the median performance of the Universe for the one- and three-year periods under review. The Board also noted that the performance of the Fund was higher than or in range of its benchmark, the Russell 2000® Index, for the five- and ten-year periods under review, and lower than the benchmark for the one- and three-year periods under review.
The Board received information concerning, and discussed factors contributing to, the underperformance of the Fund relative to the Universe and the benchmark for the one- and three-year periods under review. Funds Management advised the Board about the market conditions and investment decisions that it believed contributed to the underperformance during those periods. The Board noted that the performance of the Fund was affected by market volatility and the Fund’s cash position. The Board noted that the Fund’s strong performance in six consecutive calendar years between 2004 and 2009 and was satisfied with the explanation it received.
The Board received and considered information regarding the Fund’s net operating expense ratio and its various components, including actual management fees (which reflect fee waivers, if any, and include advisory, administration and transfer agent fees) custodian and other non-management fees, Rule 12b-1 and non-Rule 12b-1 service fees and fee waiver and expense reimbursement arrangements. The Board also considered this ratio in comparison to the median ratio of funds in a class-specific expense group that was determined by Lipper to be similar to the Fund (the “Group”). The Board received a description of the methodology used by Lipper to select the mutual funds in the expense Group. Based on the Lipper reports, the Board noted that the net operating expense ratio of the Fund was lower than the median net operating expense ratio of the expense Group. The Board and Funds Management agreed to maintain the current contractual net expense ratio cap for the Fund.
Based on its consideration of the factors and information it deemed relevant, including those described here, the Board concluded that the overall performance and expense structure of the Fund supported the re-approval of the Advisory Agreements.
Investment advisory and sub-advisory fee rates
The Board reviewed and considered the contractual investment advisory fee rates that are payable by the Fund to Funds Management for investment advisory services (the “Advisory Agreement Rates”), both on a stand-alone basis and on a combined basis with the Fund’s fund-level and class-level contractual administration fee rates (the “Management Rates”). The Board considered that the administration fees include transfer agency costs. The Board also reviewed and considered the contractual investment sub-advisory fee rates that are payable by Funds Management to the Sub-Adviser for investment sub-advisory services (the “Sub-Advisory Agreement Rates”).
Among other information reviewed by the Board was a comparison of the Management Rate of the Fund with that of other funds in the expense Group at a common asset level. The Board noted that the Management Rate of the Fund was in range of the median rate for the Fund’s expense Group. The Board and Funds Management agreed to revise the advisory fee schedule for the Fund by adding an additional breakpoint.
The Board also received and considered information about the portion of the total advisory fee that was retained by Funds Management after payment of the fee to the Sub-Adviser for sub-advisory services. The Board considered this amount in comparison to the median amount retained by advisers to funds in a sub-advised expense universe that was determined by Lipper to be similar to the Fund. In assessing the reasonableness of this amount, the Board received and evaluated extensive information about the nature and extent of responsibilities retained and risks assumed by Funds Management and not delegated to or assumed by the Sub-Adviser and about Funds Management’s on-going oversight services. The Board also considered that the sub-advisory fees paid to the Sub-Adviser had been negotiated by Funds Management on an arm’s-length basis. The Board considered that the Sub-Adviser agreed to reduce the sub-advisory fee schedule for the Fund.
The Board also received and considered information about the nature and extent of services offered and fee rates charged by Funds Management and the Sub-Adviser to other types of clients. In this regard, the Board received information about the significantly greater scope of services, and compliance, reporting and other legal burdens and risks of managing mutual funds compared with those associated with managing assets of non-mutual fund clients such as collective funds or institutional separate accounts.
Based on its consideration of the factors and information it deemed relevant, including those described here, the Board determined that the Advisory Agreement Rates and the Sub-Advisory Agreement Rates were reasonable in light of the services covered by the Advisory Agreements.
| | | | | | |
| Other information (unaudited) | | Wells Fargo Advantage Small Cap Opportunities Fund | | | 27 | |
Profitability
The Board received and considered an analysis of the profitability of Funds Management, as well as an analysis of the profitability of Wells Fargo as a whole, from providing services to the Fund. Funds Management explained the methodologies and estimates that it used in calculating the profitability from the Fund and the fund family as a whole. Among other things, the Board noted that the levels of profitability reported on a fund-by-fund basis varied widely, depending on factors such as the size and type of fund. Based on its review, the Board did not deem the profits reported by Funds Management to be at a level that would prevent it from approving the continuation of the Advisory Agreement.
The Board also received separate profitability information with respect to the Sub-Adviser, which is not affiliated with Funds Management. The Board did not deem the profits reported by the Sub-Adviser to be at a level that would prevent it from approving the continuation of the sub-advisory agreement.
Economies of scale
With respect to possible economies of scale, the Board reviewed the breakpoints in the Fund’s advisory fee and administration fee structure, which operate generally to reduce the Fund’s expense ratios as the Fund grows in size. It considered that, for a small fund or a fund that shrinks in size, breakpoints conversely can result in higher fee levels. The Board also considered fee waiver and expense reimbursement arrangements as a means of sharing potential economies of scale with the Fund. The Board also took into account the agreed-upon revision to the advisory fee schedule for the Fund that adds an additional breakpoint. The Board acknowledged the inherent limitations of any analysis of potential economies of scale and of any attempt to correlate breakpoints with such economies. Nonetheless, the Board concluded that the breakpoints and net operating expense ratio caps appeared to be a reasonable approach to sharing potential economies of scale with the Fund.
Other benefits to Funds Management and the Sub-Adviser
The Board received and considered information regarding potential “fall-out” or ancillary benefits received by Funds Management and its affiliates and the Sub-Adviser as a result of their relationship with the Fund. Ancillary benefits could include, among others, benefits directly attributable to other relationships with the Fund and benefits potentially derived from an increase in Funds Management’s and the Sub-Adviser’s business as a result of their relationship with the Fund (such as the ability to market to shareholders other financial products and services offered by Funds Management and its affiliates or the Sub-Adviser, or to operate other products and services that follow investment strategies similar to those of the Fund).
The Board considered that Wells Fargo Funds Distributor, LLC, an affiliate of Funds Management, serves as distributor to the Fund and receives certain compensation for those services. The Board noted that various financial institutions, including affiliates of Funds Management, may receive distribution-related fees, shareholder servicing payments (including amounts derived from payments under Rule 12b-1 plans) and sub-transfer agency fees in respect of shares sold or held through them and services provided.
The Board also reviewed information about whether and to what extent soft dollar credits are sought and how any such credits are utilized, and any benefits that might be realized by an affiliated broker that handles portfolio transactions for the Fund.
Based on its consideration of the factors and information it deemed relevant, including those described here, the Board did not find that any ancillary benefits received by Funds Management and its affiliates and the Sub-Adviser were unreasonable.
Conclusion
After considering the above-described factors and based on its deliberations and its evaluation of the information described above, the Board unanimously approved the continuation of the Advisory Agreements for an additional one-year period.
| | | | |
| 28 | | Wells Fargo Advantage Small Cap Opportunities Fund | | List of abbreviations |
The following is a list of common abbreviations for terms and entities that may have appeared in this report.
| ACA | — ACA Financial Guaranty Corporation |
| ADR | — American depositary receipt |
| ADS | — American depositary shares |
| AGC | — Assured Guaranty Corporation |
| AGM | — Assured Guaranty Municipal |
| Ambac | — Ambac Financial Group Incorporated |
| AMT | — Alternative minimum tax |
| BAN | — Bond anticipation notes |
| BHAC | — Berkshire Hathaway Assurance Corporation |
| CAB | — Capital appreciation bond |
| CCAB | — Convertible capital appreciation bond |
| CDA | — Community Development Authority |
| CDO | — Collateralized debt obligation |
| COP | — Certificate of participation |
| DRIVER | — Derivative inverse tax-exempt receipts |
| DW&P | — Department of Water & Power |
| DWR | — Department of Water Resources |
| ECFA | — Educational & Cultural Facilities Authority |
| EDA | — Economic Development Authority |
| EDFA | — Economic Development Finance Authority |
| ETF | — Exchange-traded fund |
| FDIC | — Federal Deposit Insurance Corporation |
| FFCB | — Federal Farm Credit Banks |
| FGIC | — Financial Guaranty Insurance Corporation |
| FHA | — Federal Housing Administration |
| FHLB | — Federal Home Loan Bank |
| FHLMC | — Federal Home Loan Mortgage Corporation |
| FICO | — The Financing Corporation |
| FNMA | — Federal National Mortgage Association |
| GDR | — Global depositary receipt |
| GNMA | — Government National Mortgage Association |
| HCFR | — Healthcare facilities revenue |
| HEFA | — Health & Educational Facilities Authority |
| HEFAR | — Higher education facilities authority revenue |
| HFA | — Housing Finance Authority |
| HFFA | — Health Facilities Financing Authority |
| HUD | — Department of Housing and Urban Development |
| IDA | — Industrial Development Authority |
| IDAG | — Industrial Development Agency |
| IDR | — Industrial development revenue |
| KRW | — Republic of Korea won |
| LIBOR | — London Interbank Offered Rate |
| LLC | — Limited liability company |
| LLP | — Limited liability partnership |
| MBIA | — Municipal Bond Insurance Association |
| MFHR | — Multifamily housing revenue |
| MSTR | — Municipal securities trust receipts |
| MUD | — Municipal Utility District |
| National | — National Public Finance Guarantee Corporation |
| PCFA | — Pollution Control Financing Authority |
| PCL | — Public Company Limited |
| PCR | — Pollution control revenue |
| PFA | — Public Finance Authority |
| PFFA | — Public Facilities Financing Authority |
| PFOTER | — Puttable floating option tax-exempt receipts |
| plc | — Public limited company |
| PUTTER | — Puttable tax-exempt receipts |
| R&D | — Research & development |
| Radian | — Radian Asset Assurance |
| RAN | — Revenue anticipation notes |
| RDA | — Redevelopment Authority |
| RDFA | — Redevelopment Finance Authority |
| REIT | — Real estate investment trust |
| ROC | — Reset option certificates |
| SAVRS | — Select auction variable rate securities |
| SBA | — Small Business Authority |
| SFHR | — Single-family housing revenue |
| SFMR | — Single-family mortgage revenue |
| SPA | — Standby purchase agreement |
| SPDR | — Standard & Poor’s Depositary Receipts |
| STRIPS | — Separate trading of registered interest and principal securities |
| TAN | — Tax anticipation notes |
| TIPS | — Treasury inflation-protected securities |
| TRAN | — Tax revenue anticipation notes |
| TTFA | — Transportation Trust Fund Authority |
| TVA | — Tennessee Valley Authority |
This page is intentionally left blank.
This page is intentionally left blank.


For more information
More information about Wells Fargo Advantage Funds is available free upon request. To obtain literature, please write, email, visit the Fund’s website, or call:
Wells Fargo Advantage Funds
P.O. Box 8266
Boston, MA 02266-8266
Email: wfaf@wellsfargo.com
Website: wellsfargoadvantagefunds.com
Individual investors: 1-800-222-8222
Retail investment professionals: 1-888-877-9275
Institutional investment professionals: 1-866-765-0778
This report and the financial statements contained herein are submitted for the general information of the shareholders of Wells Fargo Advantage Funds. If this report is used for promotional purposes, distribution of the report must be accompanied or preceded by a current prospectus. For a current prospectus and, if available, a summary prospectus containing more complete information, including charges and expenses, call 1-800-222-8222 or visit the Fund’s website at wellsfargoadvantagefunds.com. Please consider the investment objectives, risks, charges, and expenses of the investment carefully before investing. This and other information about Wells Fargo Advantage Funds can be found in the current prospectus. Read the prospectus carefully before you invest or send money.
Wells Fargo Funds Management, LLC, a wholly owned subsidiary of Wells Fargo & Company, provides investment advisory and administrative services for Wells Fargo Advantage Funds. Other affiliates of Wells Fargo & Company provide subadvisory and other services for the Funds. The Funds are distributed by Wells Fargo Funds Distributor, LLC, Member FINRA/SIPC, an affiliate of Wells Fargo & Company.
NOT FDIC INSURED ¡ NO BANK GUARANTEE ¡ MAY LOSE VALUE
© 2013 Wells Fargo Funds Management, LLC. All rights reserved.
| | |
 | | 216838 06-13 SA243/SAR243 4-13 |

Wells Fargo Advantage Small Cap Value Fund

Semi-Annual Report
April 30, 2013

Reduce clutter. Save trees.
Sign up for electronic delivery of prospectuses and shareholder reports at wellsfargo.com/advantagedelivery
Contents
The views expressed and any forward-looking statements are as of April 30, 2013, unless otherwise noted, and are those of the Fund managers and/or Wells Fargo Funds Management, LLC. Discussions of individual securities, or the markets generally, or any Wells Fargo Advantage Fund are not intended as individual recommendations. Future events or results may vary significantly from those expressed in any forward-looking statements; the views expressed are subject to change at any time in response to changing circumstances in the market. Wells Fargo Funds Management, LLC, disclaims any obligation to publicly update or revise any views expressed or forward-looking statements.
NOT FDIC INSURED ¡ NO BANK GUARANTEE ¡ MAY LOSE VALUE

Wells Fargo investment history
| | |
| 1932 | | Keystone creates one of the first mutual fund families. |
| 1971 | | Wells Fargo & Company introduces one of the first institutional index funds. |
| 1978 | | Wells Fargo applies Markowitz and Sharpe’s research on Modern Portfolio Theory to introduce one of the industry’s first tactical asset allocation models in institutional separately managed accounts. |
| 1984 | | Wells Fargo Stagecoach Funds launches its first asset allocation fund. |
| 1989 | | The Tactical Asset Allocation (TAA) Model is first applied to Wells Fargo’s asset allocation mutual funds. |
| 1994 | | Wells Fargo introduces the LifePath Funds, one of the first suites of target date funds (now the Wells Fargo Advantage Dow Jones Target Date FundsSM). |
| 1996 | | Evergreen Investments and Keystone Funds merge. |
| 1997 | | Wells Fargo launches the Wells Fargo Advantage WealthBuilder PortfoliosSM, a fund-of-funds suite of products that includes the use of quantitative models to shift assets among investment styles. |
| 1999 | | Norwest Advantage Funds and Stagecoach Funds are reorganized into Wells Fargo Funds after the merger of Norwest and Wells Fargo. |
| 2002 | | Evergreen Retail and Evergreen Institutional companies form the umbrella asset management company, Evergreen Investments. |
| 2005 | | The integration of Strong Funds with Wells Fargo Funds creates Wells Fargo Advantage Funds, resulting in one of the top 20 mutual fund companies in the United States. |
| 2006 | | Wells Fargo Advantage Funds relaunches the target date product line as Wells Fargo Advantage Dow Jones Target Date Funds. |
| 2010 | | The mergers and reorganizations of Evergreen and Wells Fargo Advantage mutual funds are completed, unifying the families under the brand of Wells Fargo Advantage Funds. |
Wells Fargo Advantage Funds®
Wells Fargo Advantage Funds skillfully guides institutions, financial advisors, and individuals through the investment terrain to help them reach their financial objectives. Everything we do on behalf of investors is backed by our unique combination of qualifications.
Strength
Our organization is built on the standards of integrity and service established by our parent company—Wells Fargo & Company—more than 150 years ago. And, because we’re part of a highly diversified financial enterprise, we offer the depth of resources to help investors succeed.
Expertise
Our multi-boutique model offers investors access to the independent thinking of premier investment managers that have been chosen for their time-tested strategies. While each team specializes in a specific investment strategy, collectively they provide investors a wide choice of distinct investment styles. Our dedication to investment excellence doesn’t end with our expertise in manager selection—risk management, analysis, and rigorous ongoing review seek to ensure each manager’s investment process remains consistent.
Partnership
Our collaborative approach is built around understanding the needs and goals of our clients. By adhering to core principles of sound judgment and steady guidance, we support you through every stage of the investment decision process.
Carefully consider the investment objectives, risks, charges, and expenses before investing. For a current prospectus and, if available, a summary prospectus, for Wells Fargo Advantage Funds, containing this and other information, visit wellsfargoadvantagefunds.com. Read it carefully before investing.
Wells Fargo Funds Management, LLC, a wholly owned subsidiary of Wells Fargo & Company, provides investment advisory and administrative services for Wells Fargo Advantage Funds. Other affiliates of Wells Fargo & Company provide subadvisory and other services for the Funds. The Funds are distributed by Wells Fargo Funds Distributor, LLC, Member FINRA/SIPC, an affiliate of Wells Fargo & Company.
“Dow Jones®” and “Dow Jones Target Date IndexesSM” are service marks of Dow Jones Trademark Holdings LLC (“Dow Jones”); have been licensed to CME Group Index Services LLC (“CME Indexes”); and have been sublicensed for use for certain purposes by Global Index Advisors, Inc., and Wells Fargo Funds Management, LLC. The Wells Fargo Advantage Dow Jones Target Date FundsSM, based on the Dow Jones Target Date Indexes, are not sponsored, endorsed, sold, or promoted by Dow Jones, CME Indexes, or their respective affiliates, and none of them makes any representation regarding the advisability of investing in such product(s).
NOT FDIC INSURED ¡ NO BANK GUARANTEE ¡ MAY LOSE VALUE
Not part of the semi-annual report.
Wells Fargo Advantage Funds offers more than 100 mutual funds across a wide range of asset classes, representing over $228 billion in assets under management, as of April 30, 2013.
| | | | |
| Equity funds | | | | |
Asia Pacific Fund | | Enterprise Fund† | | Opportunity Fund† |
C&B Large Cap Value Fund | | Global Opportunities Fund | | Precious Metals Fund |
C&B Mid Cap Value Fund | | Growth Fund | | Premier Large Company Growth Fund |
Capital Growth Fund | | Index Fund | | Small Cap Opportunities Fund |
Common Stock Fund | | International Equity Fund | | Small Cap Value Fund |
Disciplined U.S. Core Fund | | International Value Fund | | Small Company Growth Fund |
Discovery Fund† | | Intrinsic Small Cap Value Fund | | Small Company Value Fund |
Diversified Equity Fund | | Intrinsic Value Fund | | Small/Mid Cap Value Fund |
Diversified International Fund | | Intrinsic World Equity Fund | | Special Mid Cap Value Fund |
Emerging Growth Fund | | Large Cap Core Fund | | Special Small Cap Value Fund |
Emerging Markets Equity Fund | | Large Cap Growth Fund | | Specialized Technology Fund |
Emerging Markets Equity Income Fund | | Large Company Value Fund | | Traditional Small Cap Growth Fund |
Endeavor Select Fund† | | Omega Growth Fund | | Utility and Telecommunications Fund |
| Bond funds | | | | |
Adjustable Rate Government Fund | | High Yield Municipal Bond Fund | | Short-Term Bond Fund |
California Limited-Term Tax-Free Fund | | Income Plus Fund | | Short-Term High Yield Bond Fund |
California Tax-Free Fund | | Inflation-Protected Bond Fund | | Short-Term Municipal Bond Fund |
Colorado Tax-Free Fund | | Intermediate Tax/AMT-Free Fund | | Strategic Income Fund |
Conservative Income Fund | | International Bond Fund | | Strategic Municipal Bond Fund |
Core Bond Fund | | Minnesota Tax-Free Fund | | Ultra Short-Term Income Fund |
Emerging Markets Local Bond Fund | | Municipal Bond Fund | | Ultra Short-Term Municipal Income Fund |
Government Securities Fund | | North Carolina Tax-Free Fund | | Wisconsin Tax-Free Fund |
High Income Fund | | Pennsylvania Tax-Free Fund | | |
High Yield Bond Fund | | Short Duration Government Bond Fund | | |
| Asset allocation funds | | | | |
Absolute Return Fund | | WealthBuilder Equity Portfolio† | | Target 2020 Fund† |
Asset Allocation Fund | | WealthBuilder Growth Allocation Portfolio† | | Target 2025 Fund† |
Diversified Capital Builder Fund | | WealthBuilder Growth Balanced Portfolio† | | Target 2030 Fund† |
Diversified Income Builder Fund | | WealthBuilder Moderate Balanced Portfolio† | | Target 2035 Fund† |
Growth Balanced Fund | | WealthBuilder Tactical Equity Portfolio† | | Target 2040 Fund† |
Index Asset Allocation Fund | | Target Today Fund† | | Target 2045 Fund† |
Moderate Balanced Fund | | Target 2010 Fund† | | Target 2050 Fund† |
WealthBuilder Conservative Allocation Portfolio† | | Target 2015 Fund† | | Target 2055 Fund† |
| Money market funds | | | | |
100% Treasury Money Market Fund | | Heritage Money Market Fund† | | National Tax-Free Money Market Fund |
California Municipal Money Market Fund | | Money Market Fund | | Treasury Plus Money Market Fund |
Cash Investment Money Market Fund | | Municipal Cash Management Money Market Fund | | |
Government Money Market Fund | | Municipal Money Market Fund | | |
| Variable trust funds1 | | | | |
VT Discovery Fund† | | VT Intrinsic Value Fund | | VT Small Cap Growth Fund |
VT Index Asset Allocation Fund | | VT Omega Growth Fund | | VT Small Cap Value Fund |
VT International Equity Fund | | VT Opportunity Fund† | | VT Total Return Bond Fund |
An investment in a money market fund is not insured or guaranteed by the Federal Deposit Insurance Corporation or any other government agency. Although the Wells Fargo Advantage Money Market Funds seek to preserve the value of your investment at $1.00 per share, it is possible to lose money by investing in a money market fund.
| 1. | The variable trust funds are generally available only through insurance company variable contracts. |
| † | In this report, the Wells Fargo Advantage Discovery FundSM, Wells Fargo Advantage Endeavor Select FundSM, Wells Fargo Advantage Enterprise FundSM, Wells Fargo Advantage Opportunity FundSM, Wells Fargo Advantage WealthBuilder Conservative Allocation PortfolioSM, Wells Fargo Advantage WealthBuilder Equity PortfolioSM, Wells Fargo Advantage WealthBuilder Growth Allocation PortfolioSM, Wells Fargo Advantage WealthBuilder Growth Balanced PortfolioSM, Wells Fargo Advantage WealthBuilder Moderate Balanced PortfolioSM, Wells Fargo Advantage WealthBuilder Tactical Equity PortfolioSM, Wells Fargo Advantage Dow Jones Target Today FundSM, Wells Fargo Advantage Dow Jones Target 2010 FundSM, Wells Fargo Advantage Dow Jones Target 2015 FundSM, Wells Fargo Advantage Dow Jones Target 2020 FundSM, Wells Fargo Advantage Dow Jones Target 2025 FundSM, Wells Fargo Advantage Dow Jones Target 2030 FundSM, Wells Fargo Advantage Dow Jones Target 2035 FundSM, Wells Fargo Advantage Dow Jones Target 2040 FundSM, Wells Fargo Advantage Dow Jones Target 2045 FundSM, Wells Fargo Advantage Dow Jones Target 2050 FundSM, Wells Fargo Advantage Dow Jones Target 2055 FundSM, Wells Fargo Advantage Heritage Money Market FundSM, Wells Fargo Advantage VT Discovery FundSM, and Wells Fargo Advantage VT Opportunity FundSM are referred to as the Discovery Fund, Endeavor Select Fund, Enterprise Fund, Opportunity Fund, WealthBuilder Conservative Allocation Portfolio, WealthBuilder Equity Portfolio, WealthBuilder Growth Allocation Portfolio, WealthBuilder Growth Balanced Portfolio, WealthBuilder Moderate Balanced Portfolio, WealthBuilder Tactical Equity Portfolio, Target Today Fund, Target 2010 Fund, Target 2015 Fund, Target 2020 Fund, Target 2025 Fund, Target 2030 Fund, Target 2035 Fund, Target 2040 Fund, Target 2045 Fund, Target 2050 Fund, Target 2055 Fund, Heritage Money Market Fund, VT Discovery Fund, and VT Opportunity Fund, respectively. |
Not part of the semi-annual report.
| | | | |
| 2 | | Wells Fargo Advantage Small Cap Value Fund | | Letter to shareholders (unaudited) |

Karla M. Rabusch
President
Wells Fargo Advantage Funds
Relatively improving economic data in the U.S. and efforts by European authorities to address the sovereign debt issue alleviated investor fears and supported global stock markets.
Dear Valued Shareholder:
We are pleased to offer you this semi-annual report for the Wells Fargo Advantage Small Cap Value Fund for the six-month period that ended April 30, 2013. Much of the six-month period was marked by continued concerns about the possible effects that the ongoing European sovereign debt crisis would have on the global economy. However, relatively improving economic data in the U.S. and efforts by European authorities to address the sovereign debt issue alleviated investor fears and supported global stock markets. This backdrop enabled most equity asset classes to generate positive returns. For the six-month period, the small-cap-oriented Russell 2000® Index1 returned 16.58%, while the mid-cap-focused Russell Midcap® Index2 posted an 18.90% total return.
The U.S. economy improved with the support of accommodative monetary policy.
The U.S. economy grew modestly, but the recovery remained weak compared with previous business cycles. Curtailed government spending and weak household income expectations were economic headwinds. However, the unemployment rate continued to decline, reaching 7.5% in April 2013, and housing market activity, as measured by many metrics—sales, building permits, and prices—continued to improve from its recessionary levels.
Citing its dual mandate of fostering maximum employment and price stability, the U.S. Federal Reserve (Fed) reaffirmed its commitment to highly accommodative monetary policy. In addition, the Fed formally announced that exceptionally low interest rates would be appropriate at least as long as the unemployment rate remains above 6.5% and inflation remains no more than half a percentage point above its 2.0% inflation target.
The Fed also continued its quantitative easing program. Just prior to the beginning of the reporting period, the Federal Open Market Committee announced its intention to keep interest rates low until at least mid-2015 in order to support the sluggish economy. The Fed also announced open-ended purchases of $40 billion per month in mortgage-backed securities in an effort to support the housing market.
The global economy continues to be affected by bouts of uncertainty, including political questions in the U.S., Europe, and China.
Global economic growth varied across countries. Eurozone economies remained in recession. However, the European Central Bank (ECB) and several key members of the eurozone, including France and Germany, continued their commitment to maintaining a single currency. Subsequently, investor fears about a sovereign debt crisis in Europe abated. Furthermore, the ECB maintained its accommodative monetary policy by lowering its key rate at a historic low of 0.75%.
For most of the six-month period, uncertainty about political outcomes was a constant. U.S. presidential elections in November 2012, the debate over the fiscal cliff and tax rates at year-end, and speculation about the effects of sequestration at the end of February 2013 weighed on business leaders and investors. Elections in eurozone countries such as Greece, France, and Italy sparked speculation about the future of the eurozone. New leadership in China also figured into the political landscape. In the end, investors managed around these concerns, and capital markets generally advanced during this time period.
| 1. | The Russell 2000® Index measures the performance of the 2,000 smallest companies in the Russell 3000® Index, which represents approximately 8% of the total market capitalization of the Russell 3000 Index. You cannot invest directly in an index. |
| 2. | The Russell Midcap® Index measures the performance of the 800 smallest companies in the Russell 1000® Index, which represent approximately 25% of the total market capitalization of the Russell 1000 Index. You cannot invest directly in an index. |
| | | | | | |
| Letter to shareholders (unaudited) | | Wells Fargo Advantage Small Cap Value Fund | | | 3 | |
Our goal is to meet the financial needs of our shareholders.
We are committed to providing our shareholders long-term investment strategies and focusing on appropriate risk while seeking to deliver consistent returns. We know that your ability to meet your long-term investment goals depends on the investment decisions you make today. Despite economic uncertainties and investment challenges, staying invested and adapting to emerging opportunities and threats will help you manage investment risk.
Thank you for choosing to invest with Wells Fargo Advantage Funds. We appreciate your confidence in us and remain committed to helping you meet your financial needs. For current information about your fund investments, contact your investment professional, visit our website at wellsfargoadvantagefunds.com, or call us directly at 1-800-222-8222. We are available 24 hours a day, 7 days a week.
Sincerely,

Karla M. Rabusch
President
Wells Fargo Advantage Funds
Despite economic uncertainties and investment challenges, staying invested and adapting to emerging opportunities and threats will help you manage investment risk.
| | | | |
| 4 | | Wells Fargo Advantage Small Cap Value Fund | | Performance highlights (unaudited) |
Investment objective
The Fund seeks long-term capital appreciation.
Adviser
Wells Fargo Funds Management, LLC
Subadviser
Wells Capital Management Incorporated
Portfolio managers
Erik C. Astheimer
I. Charles Rinaldi
Michael Schneider, CFA
Average annual total returns1 (%) as of April 30, 2013
| | | | | | | | | | | | | | | | | | | | | | | | | | | | | | | | | | | | |
| | | Including sales charge | | | Excluding sales charge | | | | | Expense ratios2 (%) | |
| | | Inception date | | 1 year | | | 5 year | | | 10 year | | | 1 year | | | 5 year | | | 10 year | | | | | Gross | | | Net3 | |
| Class A (SMVAX) | | 11-30-2000 | | | 6.82 | | | | 4.01 | | | | 11.53 | | | | 13.35 | | | | 5.25 | | | | 12.19 | | | | | | 1.36 | | | | 1.32 | |
| Class B (SMVBX)* | | 11-30-2000 | | | 7.53 | | | | 4.12 | | | | 11.60 | | | | 12.53 | | | | 4.46 | | | | 11.60 | | | | | | 2.11 | | | | 2.07 | |
| Class C (SMVCX) | | 11-30-2000 | | | 11.51 | | | | 4.46 | | | | 11.36 | | | | 12.51 | | | | 4.46 | | | | 11.36 | | | | | | 2.11 | | | | 2.07 | |
| Administrator Class (SMVDX) | | 7-30-2010 | | | – | | | | – | | | | – | | | | 13.59 | | | | 5.52 | | | | 12.34 | | | | | | 1.20 | | | | 1.12 | |
| Institutional Class (WFSVX) | | 7-31-2007 | | | – | | | | – | | | | – | | | | 13.80 | | | | 5.71 | | | | 12.54 | | | | | | 0.93 | | | | 0.92 | |
| Investor Class (SSMVX) | | 12-31-1997 | | | – | | | | – | | | | – | | | | 13.34 | | | | 5.26 | | | | 12.27 | | | | | | 1.42 | | | | 1.35 | |
| Russell 2000® Value Index4 | | – | | | – | | | | – | | | | – | | | | 19.71 | | | | 6.60 | | | | 10.28 | | | | | | – | | | | – | |
| * | | Class B shares are closed to investment, except in connection with the reinvestment of any distributions and permitted exchanges. |
Figures quoted represent past performance, which is no guarantee of future results and do not reflect the deduction of taxes that a shareholder may pay on fund distributions or the redemption of fund shares. Investment return and principal value of an investment will fluctuate so that an investor’s shares, when redeemed, may be worth more or less than their original cost. Performance shown without sales charges would be lower if sales charges were reflected. Current performance may be lower or higher than the performance data quoted, which assumes the reinvestment of dividends and capital gains. Current month-end performance is available on the Fund’s website, wellsfargoadvantagefunds.com.
Index returns do not include transaction costs associated with buying and selling securities, any mutual fund fees or expenses, or any taxes. It is not possible to invest directly in an index.
For Class A shares, the maximum front-end sales charge is 5.75%. For Class B shares, the maximum contingent deferred sales charge is 5.00%. For Class C shares, the maximum contingent deferred sales charge is 1.00%. Performance including sales charge assumes the sales charge for the corresponding time period. Administrator Class, Institutional Class, and Investor Class shares are sold without a front-end sales charge or contingent deferred sales charge.
Stock values fluctuate in response to the activities of individual companies and general market and economic conditions. Smaller-company stocks tend to be more volatile and less liquid than those of larger companies. The use of derivatives may reduce returns and/or increase volatility. Certain investment strategies tend to increase the total risk of an investment (relative to the broader market). The Fund is exposed to foreign investment risk. Consult the Fund’s prospectus for additional information on these and other risks.
Please see footnotes on page 5.
| | | | | | |
| Performance highlights (unaudited) | | Wells Fargo Advantage Small Cap Value Fund | | | 5 | |
| | | | |
| Ten largest equity holdings5 (%) as of April 30, 2013 | |
InterOil Corporation | | | 11.04 | |
Randgold Resources Limited ADR | | | 6.87 | |
Chimera Investment Corporation | | | 4.18 | |
United Continental Holdings Incorporated | | | 3.02 | |
Argo Group International Holdings Limited | | | 2.36 | |
Range Resources Corporation | | | 2.30 | |
Delta Air Lines Incorporated | | | 2.21 | |
Newpark Resources Incorporated | | | 2.10 | |
Trilogy Energy Corporation | | | 1.95 | |
Cray Incorporated | | | 1.76 | |
| | |
| Sector distribution6 as of April 30, 2013 |
|
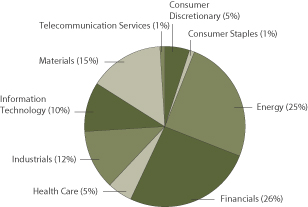
|
| 1. | Historical performance shown for the Administrator Class shares prior to their inception reflects the performance of the Institutional Class shares, adjusted to reflect the higher expenses applicable to the Administrator Class shares. Historical performance shown for the Institutional Class shares prior to their inception reflects the performance of the Investor Class shares, and includes the higher expenses applicable to the Investor Class shares. If these expenses had not been included, returns would be higher. Effective June 20, 2008, Class Z was renamed Investor Class and modified to assume the features and attributes of the Investor Class. Historical performance shown for Investor Class shares through June 19, 2008, includes Class Z expenses. |
| 2. | Reflects the expense ratios as stated in the most recent prospectuses. |
| 3. | The Adviser has committed through February 28, 2014, to waive fees and/or reimburse expenses to the extent necessary to cap the Fund’s Total Annual Fund Operating Expenses After Fee Waiver, excluding certain expenses, at 1.30% for Class A, 2.05% for Class B, 2.05% for Class C, 1.10% for Administrator Class, 0.90% for Institutional Class, and 1.33% for Investor Class. Brokerage commissions, stamp duty fees, interest, taxes, acquired fund fees and expenses, and extraordinary expenses are excluded from the cap. Without this cap, the Fund’s returns would have been lower. |
| 4. | The Russell 2000® Value Index measures the performance of those Russell 2000 companies with lower price-to-book ratios and lower forecasted growth values. You cannot invest directly in an index. |
| 5. | The ten largest equity holdings are calculated based on the value of the securities divided by total net assets of the Fund. Holdings are subject to change and may have changed since the date specified. |
| 6. | Sector distribution is subject to change and is calculated based on the total long-term investments of the Fund. |
| | | | |
| 6 | | Wells Fargo Advantage Small Cap Value Fund | | Fund expenses (unaudited) |
As a shareholder of the Fund, you incur two types of costs: (1) transaction costs, including sales charges (loads) on purchase payments and contingent deferred sales charges (if any) on redemptions and (2) ongoing costs, including management fees, distribution (12b-1) and/or shareholder service fees, and other Fund expenses. This example is intended to help you understand your ongoing costs (in dollars) of investing in the Fund and to compare these costs with the ongoing costs of investing in other mutual funds.
The example is based on an investment of $1,000 invested at the beginning of the six-month period and held for the entire period from November 1, 2012 to April 30, 2013.
Actual expenses
The “Actual” line of the table below provides information about actual account values and actual expenses. You may use the information in this line, together with the amount you invested, to estimate the expenses that you paid over the period. Simply divide your account value by $1,000 (for example, an $8,600 account value divided by $1,000 = 8.6), then multiply the result by the number in the “Actual” line under the heading entitled “Expenses paid during period” for your applicable class of shares to estimate the expenses you paid on your account during this period.
Hypothetical example for comparison purposes
The “Hypothetical” line of the table below provides information about hypothetical account values and hypothetical expenses based on the Fund’s actual expense ratio and an assumed rate of return of 5% per year before expenses, which is not the Fund’s actual return. The hypothetical account values and expenses may not be used to estimate the actual ending account balance or expenses you paid for the period. You may use this information to compare the ongoing costs of investing in the Fund and other funds. To do so, compare this 5% hypothetical example with the 5% hypothetical examples that appear in the shareholder reports of the other funds.
Please note that the expenses shown in the table are meant to highlight your ongoing costs only and do not reflect any transactional costs, such as sales charges (loads) and contingent deferred sales charges. Therefore, the “Hypothetical” line of the table is useful in comparing ongoing costs only and will not help you determine the relative total costs of owning different funds. In addition, if these transactional costs were included, your costs would have been higher.
| | | | | | | | | | | | | | | | |
| | | Beginning
account value
11-1-2012 | | | Ending
account value
4-30-2013 | | | Expenses
paid during
the period¹ | | | Net annual
expense ratio | |
Class A | | | | | | | | | | | | | | | | |
Actual | | $ | 1,000.00 | | | $ | 1,083.16 | | | $ | 6.71 | | | | 1.30 | % |
Hypothetical (5% return before expenses) | | $ | 1,000.00 | | | $ | 1,018.35 | | | $ | 6.51 | | | | 1.30 | % |
Class B | | | | | | | | | | | | | | | | |
Actual | | $ | 1,000.00 | | | $ | 1,079.17 | | | $ | 10.57 | | | | 2.05 | % |
Hypothetical (5% return before expenses) | | $ | 1,000.00 | | | $ | 1,014.63 | | | $ | 10.24 | | | | 2.05 | % |
Class C | | | | | | | | | | | | | | | | |
Actual | | $ | 1,000.00 | | | $ | 1,079.03 | | | $ | 10.57 | | | | 2.05 | % |
Hypothetical (5% return before expenses) | | $ | 1,000.00 | | | $ | 1,014.63 | | | $ | 10.24 | | | | 2.05 | % |
Administrator Class | | | | | | | | | | | | | | | | |
Actual | | $ | 1,000.00 | | | $ | 1,084.24 | | | $ | 5.68 | | | | 1.10 | % |
Hypothetical (5% return before expenses) | | $ | 1,000.00 | | | $ | 1,019.34 | | | $ | 5.51 | | | | 1.10 | % |
Institutional Class | | | | | | | | | | | | | | | | |
Actual | | $ | 1,000.00 | | | $ | 1,085.12 | | | $ | 4.65 | | | | 0.90 | % |
Hypothetical (5% return before expenses) | | $ | 1,000.00 | | | $ | 1,020.33 | | | $ | 4.51 | | | | 0.90 | % |
Investor Class | | | | | | | | | | | | | | | | |
Actual | | $ | 1,000.00 | | | $ | 1,082.91 | | | $ | 6.87 | | | | 1.33 | % |
Hypothetical (5% return before expenses) | | $ | 1,000.00 | | | $ | 1,018.20 | | | $ | 6.66 | | | | 1.33 | % |
| 1. | Expenses paid is equal to the annualized expense ratio of each class multiplied by the average account value over the period, multiplied by the number of days in the most recent fiscal half-year divided by the number of days in the fiscal year (to reflect the one-half-year period). |
| | | | | | |
| Portfolio of investments—April 30, 2013 (unaudited) | | Wells Fargo Advantage Small Cap Value Fund | | | 7 | |
| | | | | | | | | | | | |
| Security name | | | | | | Shares | | | Value | |
| | | | |
Common Stocks: 92.20% | | | | | | | | | | | | |
| | | | |
Consumer Discretionary: 4.98% | | | | | | | | | | | | |
| | | | |
| Auto Components: 0.46% | | | | | | | | | | | | |
Gentex Corporation | | | | | | | 748,100 | | | $ | 16,832,250 | |
| | | | | | | | | | | | |
| | | | |
| Diversified Consumer Services: 0.46% | | | | | | | | | | | | |
Cambium Learning Group Incorporated † | | | | | | | 1,415,600 | | | | 1,344,820 | |
Corinthian Colleges Incorporated †** | | | | | | | 7,625,800 | | | | 15,251,600 | |
Voyager Expanded Learning Incorporated †(a)(i) | | | | | | | 1,649,100 | | | | 2 | |
| | | | |
| | | | | | | | | | | 16,596,422 | |
| | | | | | | | | | | | |
| | | | |
| Hotels, Restaurants & Leisure: 2.25% | | | | | | | | | | | | |
Denny’s Corporation † | | | | | | | 3,177,400 | | | | 18,015,858 | |
Scientific Games Corporation Class A † | | | | | | | 3,006,900 | | | | 26,701,272 | |
The Wendy’s Company | | | | | | | 6,496,100 | | | | 36,962,809 | |
| | | | |
| | | | | | | | | | | 81,679,939 | |
| | | | | | | | | | | | |
| | | | |
| Household Durables: 1.23% | | | | | | | | | | | | |
Cavco Industries Incorporated †** | | | | | | | 596,800 | | | | 27,226,016 | |
Harman International Industries Incorporated | | | | | | | 210,300 | | | | 9,402,513 | |
KB Home Incorporated | | | | | | | 173,200 | | | | 3,903,928 | |
Skyline Corporation †** | | | | | | | 945,400 | | | | 4,282,662 | |
| | | | |
| | | | | | | | | | | 44,815,119 | |
| | | | | | | | | | | | |
| | | | |
| Internet & Catalog Retail: 0.03% | | | | | | | | | | | | |
dELiA*s Incorporated †** | | | | | | | 1,904,500 | | | | 1,256,208 | |
| | | | | | | | | | | | |
| | | | |
| Specialty Retail: 0.22% | | | | | | | | | | | | |
rue21 Incorporated † | | | | | | | 246,800 | | | | 7,872,920 | |
| | | | | | | | | | | | |
| | | | |
| Textiles, Apparel & Luxury Goods: 0.33% | | | | | | | | | | | | |
Crocs Incorporated † | | | | | | | 761,800 | | | | 12,204,036 | |
| | | | | | | | | | | | |
| | | | |
Consumer Staples: 0.71% | | | | | | | | | | | | |
| | | | |
| Personal Products: 0.71% | | | | | | | | | | | | |
Prestige Brands Holdings Incorporated † | | | | | | | 957,000 | | | | 25,791,150 | |
| | | | | | | | | | | | |
| | | | |
Energy: 24.56% | | | | | | | | | | | | |
| | | | |
| Energy Equipment & Services: 8.45% | | | | | | | | | | | | |
Ensco plc Class A | | | | | | | 198,100 | | | | 11,426,408 | |
Helix Energy Solutions Group Incorporated † | | | | | | | 1,294,600 | | | | 29,827,584 | |
Helmerich & Payne Incorporated | | | | | | | 647,100 | | | | 37,933,002 | |
ION Geophysical Corporation † | | | | | | | 6,464,900 | | | | 40,340,976 | |
Key Energy Services Incorporated † | | | | | | | 2,345,600 | | | | 13,932,864 | |
Newpark Resources Incorporated †** | | | | | | | 7,266,356 | | | | 76,296,738 | |
Oceaneering International Incorporated | | | | | | | 461,600 | | | | 32,390,472 | |
Parker Drilling Company † | | | | | | | 3,139,960 | | | | 12,936,635 | |
PHI Incorporated (non-voting) † | | | | | | | 653,000 | | | | 18,133,810 | |
PHI Incorporated (voting) †** | | | | | | | 149,430 | | | | 4,034,610 | |
The accompanying notes are an integral part of these financial statements.
| | | | |
| 8 | | Wells Fargo Advantage Small Cap Value Fund | | Portfolio of investments—April 30, 2013 (unaudited) |
| | | | | | | | | | | | |
| Security name | | | | | | Shares | | | Value | |
| | | | |
| Energy Equipment & Services (continued) | | | | | | | | | | | | |
Vantage Drilling Company † | | | | | | | 3,586,300 | | | $ | 6,060,847 | |
Willbros Group Incorporated †** | | | | | | | 2,505,700 | | | | 23,804,150 | |
| | | | |
| | | | | | | | | | | 307,118,096 | |
| | | | | | | | | | | | |
| | | | |
| Oil, Gas & Consumable Fuels: 16.11% | | | | | | | | | | | | |
Clean Energy Fuels Corporation † | | | | | | | 223,400 | | | | 2,946,646 | |
Comstock Resources Incorporated † | | | | | | | 509,600 | | | | 7,980,336 | |
Forest Oil Corporation † | | | | | | | 2,028,100 | | | | 8,497,739 | |
InterOil Corporation †**# | | | | | | | 5,076,700 | | | | 401,668,504 | |
Newfield Exploration Company † | | | | | | | 413,300 | | | | 9,005,807 | |
PetroQuest Energy Incorporated † | | | | | | | 314,600 | | | | 1,346,488 | |
Range Resources Corporation | | | | | | | 1,136,300 | | | | 83,540,776 | |
Trilogy Energy Corporation | | | | | | | 2,429,300 | | | | 71,013,832 | |
| | | | |
| | | | | | | | | | | 586,000,128 | |
| | | | | | | | | | | | |
| | | | |
Financials: 18.41% | | | | | | | | | | | | |
| | | | |
| Commercial Banks: 3.74% | | | | | | | | | | | | |
Ameris Bancorp † | | | | | | | 375,500 | | | | 5,208,185 | |
Associated Banc-Corp | | | | | | | 247,000 | | | | 3,524,690 | |
Bancorp Incorporated † | | | | | | | 1,413,500 | | | | 18,375,500 | |
BBCN Bancorp Incorporated | | | | | | | 654,500 | | | | 8,429,960 | |
CenterState Banks Incorporated | | | | | | | 1,158,300 | | | | 9,637,056 | |
City National Corporation | | | | | | | 261,700 | | | | 14,977,091 | |
First Horizon National Corporation | | | | | | | 1,467,900 | | | | 15,266,160 | |
First Niagara Financial Group Incorporated | | | | | | | 2,392,500 | | | | 22,752,675 | |
IBERIABANK Corporation | | | | | | | 332,300 | | | | 15,159,526 | |
National Bank Holdings Corporation Class A | | | | | | | 752,000 | | | | 13,581,120 | |
Park Sterling Corporation † | | | | | | | 963,200 | | | | 5,519,136 | |
Sandy Spring Bancorp Incorporated | | | | | | | 167,200 | | | | 3,424,256 | |
| | | | |
| | | | | | | | | | | 135,855,355 | |
| | | | | | | | | | | | |
| | | | |
| Consumer Finance: 0.14% | | | | | | | | | | | | |
Green Dot Corporation Class A † | | | | | | | 316,100 | | | | 4,965,931 | |
| | | | | | | | | | | | |
| | | | |
| Insurance: 3.86% | | | | | | | | | | | | |
Argo Group International Holdings Limited ** | | | | | | | 2,068,400 | | | | 85,735,180 | |
Hilltop Holdings Incorporated † | | | | | | | 1,789,600 | | | | 23,962,744 | |
Mercury General Corporation | | | | | | | 374,400 | | | | 17,113,824 | |
OneBeacon Insurance Group Limited | | | | | | | 1,009,600 | | | | 13,720,464 | |
| | | | |
| | | | | | | | | | | 140,532,212 | |
| | | | | | | | | | | | |
| | | | |
| REITs: 10.55% | | | | | | | | | | | | |
Anworth Mortgage Asset Corporation | | | | | | | 1,790,400 | | | | 11,297,424 | |
Capstead Mortgage Corporation | | | | | | | 2,514,100 | | | | 33,387,248 | |
Chimera Investment Corporation | | | | | | | 46,107,200 | | | | 152,153,760 | |
Hatteras Financial Corporation | | | | | | | 448,100 | | | | 12,246,573 | |
Invesco Mortgage Capital Incorporated | | | | | | | 2,564,800 | | | | 54,886,720 | |
MFA Mortgage Investments Incorporated | | | | | | | 4,422,900 | | | | 41,000,283 | |
The accompanying notes are an integral part of these financial statements.
| | | | | | |
| Portfolio of investments—April 30, 2013 (unaudited) | | Wells Fargo Advantage Small Cap Value Fund | | | 9 | |
| | | | | | | | | | | | |
| Security name | | | | | | Shares | | | Value | |
| | | | |
| REITs (continued) | | | | | | | | | | | | |
Redwood Trust Incorporated | | | | | | | 1,900,900 | | | $ | 43,378,538 | |
Sun Communities Incorporated | | | | | | | 692,200 | | | | 35,406,030 | |
| | | | |
| | | | | | | | | | | 383,756,576 | |
| | | | | | | | | | | | |
| | | | |
| Thrifts & Mortgage Finance: 0.12% | | | | | | | | | | | | |
Northwest Bancshares Incorporated | | | | | | | 354,400 | | | | 4,341,400 | |
| | | | | | | | | | | | |
| | | | |
Health Care: 5.40% | | | | | | | | | | | | |
| | | | |
| Biotechnology: 0.36% | | | | | | | | | | | | |
Amarin Corporation plc ADR † | | | | | | | 1,741,700 | | | | 12,905,997 | |
| | | | | | | | | | | | |
| | | | |
| Health Care Equipment & Supplies: 2.06% | | | | | | | | | | | | |
Hologic Incorporated † | | | | | | | 987,200 | | | | 20,109,264 | |
OraSure Technologies Incorporated †** | | | | | | | 7,248,100 | | | | 32,326,526 | |
Symmetry Medical Incorporated † | | | | | | | 248,600 | | | | 2,963,312 | |
Thoratec Corporation † | | | | | | | 310,800 | | | | 11,250,960 | |
Varian Medical Systems Incorporated † | | | | | | | 129,300 | | | | 8,422,602 | |
| | | | |
| | | | | | | | | | | 75,072,664 | |
| | | | | | | | | | | | |
| | | | |
| Health Care Providers & Services: 1.95% | | | | | | | | | | | | |
Amedisys Incorporated † | | | | | | | 1,297,400 | | | | 13,025,896 | |
Cross Country Healthcare Incorporated †** | | | | | | | 2,566,200 | | | | 12,831,000 | |
Gentiva Health Services Incorporated †** | | | | | | | 2,527,300 | | | | 26,511,377 | |
Healthways Incorporated † | | | | | | | 1,330,000 | | | | 18,473,700 | |
| | | | |
| | | | | | | | | | | 70,841,973 | |
| | | | | | | | | | | | |
| | | | |
| Health Care Technology: 0.26% | | | | | | | | | | | | |
Allscripts Healthcare Solutions Incorporated † | | | | | | | 274,600 | | | | 3,800,464 | |
Medidata Solutions Incorporated † | | | | | | | 87,400 | | | | 5,799,864 | |
| | | | |
| | | | | | | | | | | 9,600,328 | |
| | | | | | | | | | | | |
| | | | |
| Life Sciences Tools & Services: 0.77% | | | | | | | | | | | | |
Nordion Incorporated | | | | | | | 1,480,100 | | | | 10,375,501 | |
Parexel International Corporation † | | | | | | | 433,000 | | | | 17,731,350 | |
| | | | |
| | | | | | | | | | | 28,106,851 | |
| | | | | | | | | | | | |
| | | | |
Industrials: 12.77% | | | | | | | | | | | | |
| | | | |
| Airlines: 6.34% | | | | | | | | | | | | |
Alaska Air Group Incorporated †# | | | | | | | 383,200 | | | | 23,620,448 | |
Delta Air Lines Incorporated †# | | | | | | | 4,683,200 | | | | 80,270,048 | |
Latam Airlines Group SP ADR | | | | | | | 191,300 | | | | 3,959,910 | |
United Continental Holdings Incorporated †# | | | | | | | 3,401,700 | | | | 109,874,910 | |
US Airways Group Incorporated †# | | | | | | | 755,800 | | | | 12,773,020 | |
| | | | |
| | | | | | | | | | | 230,498,336 | |
| | | | | | | | | | | | |
| | | | |
| Commercial Services & Supplies: 2.94% | | | | | | | | | | | | |
ABM Industries Incorporated | | | | | | | 1,925,700 | | | | 43,424,535 | |
The accompanying notes are an integral part of these financial statements.
| | | | |
| 10 | | Wells Fargo Advantage Small Cap Value Fund | | Portfolio of investments—April 30, 2013 (unaudited) |
| | | | | | | | | | | | |
| Security name | | | | | | Shares | | | Value | |
| | | | |
| Commercial Services & Supplies (continued) | | | | | | | | | | | | |
ACCO Brands Corporation † | | | | | | | 3,521,000 | | | $ | 23,766,750 | |
GEO Group Incorporated | | | | | | | 597,600 | | | | 22,380,120 | |
Healthcare Services Group Incorporated | | | | | | | 778,800 | | | | 17,359,452 | |
| | | | |
| | | | | | | | | | | 106,930,857 | |
| | | | | | | | | | | | |
| | | | |
| Construction & Engineering: 2.06% | | | | | | | | | | | | |
Chicago Bridge & Iron Company NV # | | | | | | | 859,200 | | | | 46,216,368 | |
Primoris Services Corporation | | | | | | | 1,296,800 | | | | 28,581,472 | |
| | | | |
| | | | | | | | | | | 74,797,840 | |
| | | | | | | | | | | | |
| | | | |
| Electrical Equipment: 0.60% | | | | | | | | | | | | |
GrafTech International Limited † | | | | | | | 3,043,600 | | | | 21,853,048 | |
| | | | | | | | | | | | |
| | | | |
| Professional Services: 0.41% | | | | | | | | | | | | |
Hill International Incorporated †** | | | | | | | 2,833,700 | | | | 7,792,675 | |
Kforce Incorporated | | | | | | | 464,500 | | | | 7,023,240 | |
| | | | |
| | | | | | | | | | | 14,815,915 | |
| | | | | | | | | | | | |
| | | | |
| Road & Rail: 0.22% | | | | | | | | | | | | |
Covenant Transport Incorporated Class A †** | | | | | | | 1,421,200 | | | | 7,887,660 | |
| | | | | | | | | | | | |
| | | | |
| Trading Companies & Distributors: 0.20% | | | | | | | | | | | | |
Applied Industrial Technologies Incorporated | | | | | | | 175,700 | | | | 7,423,325 | |
| | | | | | | | | | | | |
| | | | |
Information Technology: 9.82% | | | | | | | | | | | | |
| | | | |
| Communications Equipment: 1.16% | | | | | | | | | | | | |
Alcatel-Lucent SA ADR † | | | | | | | 2,267,900 | | | | 3,107,023 | |
Brocade Communications Systems Incorporated † | | | | | | | 4,019,700 | | | | 23,394,654 | |
Harmonic Incorporated † | | | | | | | 2,779,000 | | | | 15,784,720 | |
| | | | |
| | | | | | | | | | | 42,286,397 | |
| | | | | | | | | | | | |
| | | | |
| Computers & Peripherals: 3.69% | | | | | | | | | | | | |
Cray Incorporated †**# | | | | | | | 3,026,500 | | | | 64,040,740 | |
Intermec Incorporated †** | | | | | | | 3,695,600 | | | | 36,364,704 | |
Lexmark International Incorporated | | | | | | | 777,700 | | | | 23,572,087 | |
Quantum Corporation † | | | | | | | 7,194,800 | | | | 10,288,564 | |
| | | | |
| | | | | | | | | | | 134,266,095 | |
| | | | | | | | | | | | |
| | | | |
| Electronic Equipment, Instruments & Components: 4.20% | | | | | | | | | | | | |
Checkpoint Systems Incorporated † | | | | | | | 1,256,213 | | | | 14,534,384 | |
Cognex Corporation | | | | | | | 710,500 | | | | 28,206,850 | |
Coherent Incorporated | | | | | | | 863,200 | | | | 48,278,776 | |
OSI Systems Incorporated †** | | | | | | | 1,074,800 | | | | 61,586,040 | |
| | | | |
| | | | | | | | | | | 152,606,050 | |
| | | | | | | | | | | | |
| | | | |
| Internet Software & Services: 0.20% | | | | | | | | | | | | |
Monster Worldwide Incorporated † | | | | | | | 1,625,900 | | | | 7,121,442 | |
| | | | | | | | | | | | |
The accompanying notes are an integral part of these financial statements.
| | | | | | |
| Portfolio of investments—April 30, 2013 (unaudited) | | Wells Fargo Advantage Small Cap Value Fund | | | 11 | |
| | | | | | | | | | | | | | |
| Security name | | | | | | | Shares | | | Value | |
| | | | |
| Office Electronics: 0.09% | | | | | | | | | | | | | | |
Zebra Technologies Corporation † | | | | | | | | | 71,100 | | | $ | 3,316,815 | |
| | | | | | | | | | | | | | |
| | | | |
| Software: 0.48% | | | | | | | | | | | | | | |
Accelrys Incorporated † | | | | | | | | | 1,791,100 | | | | 17,642,335 | |
| | | | | | | | | | | | | | |
| | | | |
Materials: 14.34% | | | | | | | | | | | | | | |
| | | | |
| Chemicals: 0.49% | | | | | | | | | | | | | | |
Calgon Carbon Corporation † | | | | | | | | | 1,050,000 | | | | 17,892,000 | |
| | | | | | | | | | | | | | |
| | | | |
| Containers & Packaging: 0.37% | | | | | | | | | | | | | | |
Intertape Polymer Group Incorporated | | | | | | | | | 1,209,600 | | | | 13,420,512 | |
| | | | | | | | | | | | | | |
| | | | |
| Metals & Mining: 13.04% | | | | | | | | | | | | | | |
Agnico-Eagle Mines Limited | | | | | | | | | 1,385,700 | | | | 44,744,253 | |
Carpenter Technology Corporation | | | | | | | | | 900,100 | | | | 40,468,496 | |
Dominion Diamond Corporation † | | | | | | | | | 476,200 | | | | 7,528,722 | |
Randgold Resources Limited ADR | | | | | | | | | 3,055,200 | | | | 249,854,256 | |
Royal Gold Incorporated | | | | | | | | | 724,100 | | | | 40,245,478 | |
Sandstorm Gold Limited †(i) | | | | | | | | | 2,443,711 | | | | 19,744,706 | |
Silver Standard Resources Incorporated † | | | | | | | | | 2,157,500 | | | | 15,404,550 | |
Steel Dynamics Incorporated | | | | | | | | | 2,299,500 | | | | 34,584,480 | |
United States Steel Corporation | | | | | | | | | 635,700 | | | | 11,315,460 | |
Webco Industries Incorporated †(a)**(i) | | | | | | | | | 90,050 | | | | 10,265,700 | |
| | | | |
| | | | | | | | | | | | | 474,156,101 | |
| | | | | | | | | | | | | | |
| | | | |
| Paper & Forest Products: 0.44% | | | | | | | | | | | | | | |
Wausau Paper Corporation | | | | | | | | | 1,589,300 | | | | 16,179,074 | |
| | | | | | | | | | | | | | |
| | | | |
Telecommunication Services: 1.21% | | | | | | | | | | | | | | |
| | | | |
| Diversified Telecommunication Services: 1.21% | | | | | | | | | | | | | | |
Cincinnati Bell Incorporated †** | | | | | | | | | 12,506,000 | | | | 44,021,120 | |
| | | | | | | | | | | | | | |
| | | | |
Total Common Stocks (Cost $2,483,709,430) | | | | | | | | | | | | | 3,353,260,477 | |
| | | | | | | | | | | | | | |
| | | | |
Investment Companies: 1.32% | | | | | | | | | | | | | | |
KBW Regional Banking ETF | | | | | | | | | 203,200 | | | | 6,309,360 | |
Market Vectors Gold Miners ETF | | | | | | | | | 805,059 | | | | 24,441,591 | |
Market Vectors Junior Gold Miners ETF | | | | | | | | | 1,329,197 | | | | 17,040,306 | |
| | | | |
Total Investment Companies (Cost $57,100,072) | | | | | | | | | | | | | 47,791,257 | |
| | | | | | | | | | | | | | |
| | | | |
| | | | | Expiration date | | | | | | | |
| | | | |
Warrants: 0.01% | | | | | | | | | | | | | | |
| | | | |
Materials: 0.01% | | | | | | | | | | | | | | |
| | | | |
| Metals & Mining: 0.01% | | | | | | | | | | | | | | |
Sandstorm Gold Limited †(i) | | | | | 10-19-2015 | | | | 470,263 | | | | 340,753 | |
| | | | | | | | | | | | | | |
| | | | |
Total Warrants (Cost $0) | | | | | | | | | | | | | 340,753 | |
| | | | | | | | | | | | | | |
The accompanying notes are an integral part of these financial statements.
| | | | |
| 12 | | Wells Fargo Advantage Small Cap Value Fund | | Portfolio of investments—April 30, 2013 (unaudited) |
| | | | | | | | | | | | | | |
| Security name | | Yield | | | | | Shares | | | Value | |
| | | | |
Short-Term Investments: 6.74% | | | | | | | | | | | | | | |
| | | | |
| Investment Companies: 6.74% | | | | | | | | | | | | | | |
Wells Fargo Advantage Cash Investment Money Market Fund, Select
Class (l)(u) | | | 0.13 | % | | | | | 245,221,258 | | | $ | 245,221,258 | |
| | | | | | | | | | | | | | |
| | | | |
Total Short-Term Investments (Cost $245,221,258) | | | | | | | | | | | | | 245,221,258 | |
| | | | | | | | | | | | | | |
| | | | | | | | |
| | |
| Total investments in securities | | | | | | | | |
| (Cost $2,786,030,760) * | | | 100.27 | % | | | 3,646,613,745 | |
Other assets and liabilities, net | | | (0.27 | ) | | | (9,719,914 | ) |
| | | | | | | | |
| Total net assets | | | 100.00 | % | | $ | 3,636,893,831 | |
| | | | | | | | |
| † | Non-income-earning security |
| ** | Represents an affiliate of the Fund under Section 2(a)(2) and 2(a)(3) of the Investment Company Act of 1940, as amended, as the Fund holds 5% or more of the issuer’s outstanding voting shares. |
| (l) | Investment in an affiliate |
| (a) | Security is fair valued by the Management Valuation Team, and in certain instances by the Board of Trustees, in accordance with procedures approved by the Board of Trustees. |
| # | All or a portion of this security is segregated as collateral for investments in derivative instruments. |
| (u) | Rate shown is the 7-day annualized yield at period end. |
| * | Cost for federal income tax purposes is $2,826,003,645 and unrealized appreciation (depreciation) consists of: |
| | | | |
Gross unrealized appreciation | | $ | 1,203,976,727 | |
Gross unrealized depreciation | | | (383,366,627 | ) |
| | | | |
Net unrealized appreciation | | $ | 820,610,100 | |
The accompanying notes are an integral part of these financial statements.
| | | | | | |
| Statement of assets and liabilities—April 30, 2013 (unaudited) | | Wells Fargo Advantage Small Cap Value Fund | | | 13 | |
| | | | |
| | | | |
| |
Assets | | | | |
Investments | | | | |
In unaffiliated securities, at value (see cost below) | | $ | 2,458,209,277 | |
In affiliated securities, at value (see cost below) | | | 1,188,404,468 | |
| | | | |
Total investments, at value (see cost below) | | | 3,646,613,745 | |
Receivable for investments sold | | | 1,276,606 | |
Receivable for Fund shares sold | | | 4,066,922 | |
Receivable for dividends | | | 594,166 | |
Prepaid expenses and other assets | | | 112,267 | |
| | | | |
Total assets | | | 3,652,663,706 | |
| | | | |
| |
Liabilities | | | | |
Payable for investments purchased | | | 2,873,957 | |
Payable for Fund shares redeemed | | | 8,399,600 | |
Written options, at value | | | 697,950 | |
Advisory fee payable | | | 2,101,497 | |
Distribution fees payable | | | 64,544 | |
Due to other related parties | | | 725,278 | |
Accrued expenses and other liabilities | | | 907,049 | |
| | | | |
Total liabilities | | | 15,769,875 | |
| | | | |
Total net assets | | $ | 3,636,893,831 | |
| | | | |
| |
NET ASSETS CONSIST OF | | | | |
Paid-in capital | | $ | 2,592,104,412 | |
Undistributed net investment income | | | 13,070,772 | |
Accumulated net realized gains on investments | | | 170,745,981 | |
Net unrealized gains on investments | | | 860,972,666 | |
| | | | |
Total net assets | | $ | 3,636,893,831 | |
| | | | |
| |
COMPUTATION OF NET ASSET VALUE AND OFFERING PRICE PER SHARE1 | | | | |
Net assets – Class A | | $ | 549,831,191 | |
Shares outstanding – Class A | | | 16,167,896 | |
Net asset value per share – Class A | | | $34.01 | |
Maximum offering price per share – Class A2 | | | $36.08 | |
Net assets – Class B | | $ | 947,638 | |
Shares outstanding – Class B | | | 30,800 | |
Net asset value per share – Class B | | | $30.77 | |
Net assets – Class C | | $ | 105,595,879 | |
Shares outstanding – Class C | | | 3,428,709 | |
Net asset value per share – Class C | | | $30.80 | |
Net assets – Administrator Class | | $ | 606,850,692 | |
Shares outstanding – Administrator Class | | | 17,545,498 | |
Net asset value per share – Administrator Class | | | $34.59 | |
Net assets – Institutional Class | | $ | 1,206,993,338 | |
Shares outstanding – Institutional Class | | | 34,799,472 | |
Net asset value per share – Institutional Class | | | $34.68 | |
Net assets – Investor Class | | $ | 1,166,675,093 | |
Shares outstanding – Investor Class | | | 33,692,198 | |
Net asset value per share – Investor Class | | | $34.63 | |
| |
Investments in unaffiliated securities, at cost | | $ | 1,793,139,299 | |
| | | | |
Investments in affiliated securities, at cost | | $ | 992,891,461 | |
| | | | |
Total investments, at cost | | $ | 2,786,030,760 | |
| | | | |
Premiums received on written options | | $ | 1,086,964 | |
| | | | |
| 1. | The Fund has an unlimited number of authorized shares. |
| 2. | Maximum offering price is computed as 100/94.25 of net asset value. On investments of $50,000 or more, the offering price is reduced. |
The accompanying notes are an integral part of these financial statements.
| | | | |
| 14 | | Wells Fargo Advantage Small Cap Value Fund | | Statement of operations—six months ended April 30, 2013 (unaudited) |
| | | | |
| | | | |
| |
Investment income | | | | |
Dividends* | | $ | 38,947,509 | |
Income from affiliated securities | | | 3,004,374 | |
| | | | |
Total investment income | | | 41,951,883 | |
| | | | |
| |
Expenses | | | | |
Advisory fee | | | 13,542,888 | |
Administration fees | | | | |
Fund level | | | 909,790 | |
Class A | | | 768,337 | |
Class B | | | 1,406 | |
Class C | | | 133,845 | |
Administrator Class | | | 280,576 | |
Institutional Class | | | 463,407 | |
Investor Class | | | 1,959,081 | |
Shareholder servicing fees | | | | |
Class A | | | 738,785 | |
Class B | | | 1,352 | |
Class C | | | 128,697 | |
Administrator Class | | | 691,590 | |
Investor Class | | | 1,516,287 | |
Distribution fees | | | | |
Class B | | | 4,057 | |
Class C | | | 386,091 | |
Custody and accounting fees | | | 113,955 | |
Professional fees | | | 18,509 | |
Registration fees | | | 51,453 | |
Shareholder report expenses | | | 271,476 | |
Trustees’ fees and expenses | | | 7,113 | |
Other fees and expenses | | | 33,614 | |
| | | | |
Total expenses | | | 22,022,309 | |
Less: Fee waivers and/or expense reimbursements | | | (674,007 | ) |
| | | | |
Net expenses | | | 21,348,302 | |
| | | | |
Net investment income | | | 20,603,581 | |
| | | | |
| |
REALIZED AND UNREALIZED GAINS (LOSSES) ON INVESTMENTS | | | | |
| |
Net realized gains (losses) on: | | | | |
Unaffiliated securities | | | 205,046,660 | |
Affiliated securities | | | 8,871,714 | |
Written options | | | (65,734 | ) |
| | | | |
Net realized gains on investments | | | 213,852,640 | |
| | | | |
| |
Net change in unrealized gains (losses) on: | | | | |
Unaffiliated securities | | | (72,542,771 | ) |
Affiliated securities | | | 131,478,156 | |
Written options | | | (65,545 | ) |
| | | | |
Net change in unrealized gains (losses) on investments | | | 58,869,840 | |
| | | | |
Net realized and unrealized gains (losses) on investments | | | 272,722,480 | |
| | | | |
Net increase in net assets resulting from operations | | $ | 293,326,061 | |
| | | | |
| |
* Net of foreign dividend withholding taxes in the amount of | | | $217,800 | |
The accompanying notes are an integral part of these financial statements.
| | | | | | |
| Statement of changes in net assets | | Wells Fargo Advantage Small Cap Value Fund | | | 15 | |
| | | | | | | | | | | | | | | | |
| | | Six months ended April 30, 2013 (unaudited) | | | Year ended October 31, 2012 | |
| | | | |
Operations | | | | | | | | | | | | | | | | |
Net investment income | | | | | | $ | 20,603,581 | | | | | | | $ | 26,142,518 | |
Net realized gains on investments | | | | | | | 213,852,640 | | | | | | | | 139,148,632 | |
Net change in unrealized gains (losses) on investments | | | | | | | 58,869,840 | | | | | | | | 252,824,374 | |
| | | | | | | | | | | | | | | | |
Net increase in net assets resulting from operations | | | | | | | 293,326,061 | | | | | | | | 418,115,524 | |
| | | | | | | | | | | | | | | | |
| | | | |
Distributions to shareholders from | | | | | | | | | | | | | | | | |
Net investment income | | | | | | | | | | | | | | | | |
Class A | | | | | | | (4,536,414 | ) | | | | | | | (2,385,351 | ) |
Class C | | | | | | | (171,443 | ) | | | | | | | 0 | |
Administrator Class | | | | | | | (5,359,165 | ) | | | | | | | (3,013,023 | ) |
Institutional Class | | | | | | | (13,128,793 | ) | | | | | | | (9,038,092 | ) |
Investor Class | | | | | | | (8,580,979 | ) | | | | | | | (4,239,216 | ) |
Net realized gains | | | | | | | | | | | | | | | | |
Class A | | | | | | | (21,797,929 | ) | | | | | | | (3,005,579 | ) |
Class B | | | | | | | (46,936 | ) | | | | | | | (16,445 | ) |
Class C | | | | | | | (4,121,715 | ) | | | | | | | (554,099 | ) |
Administrator Class | | | | | | | (19,576,380 | ) | | | | | | | (2,132,516 | ) |
Institutional Class | | | | | | | (41,054,563 | ) | | | | | | | (5,234,087 | ) |
Investor Class | | | | | | | (44,728,095 | ) | | | | | | | (7,077,075 | ) |
| | | | | | | | | | | | | | | | |
Total distributions to shareholders | | | | | | | (163,102,412 | ) | | | | | | | (36,695,483 | ) |
| | | | | | | | | | | | | | | | |
| | | | |
| | | Shares | | | | | | Shares | | | | |
Capital share transactions | | | | | | | | | | | | | | | | |
Proceeds from shares sold | | | | | | | | | | | | | | | | |
Class A | | | 1,448,461 | | | | 47,413,663 | | | | 3,271,507 | | | | 102,734,371 | |
Class B | | | 362 | | | | 10,571 | | | | 1,749 | | | | 50,221 | |
Class C | | | 231,175 | | | | 6,864,728 | | | | 373,475 | | | | 10,626,384 | |
Administrator Class | | | 3,142,883 | | | | 104,656,812 | | | | 8,699,513 | | | | 283,757,915 | |
Institutional Class | | | 3,291,195 | | | | 111,997,990 | | | | 7,555,736 | | | | 241,434,555 | |
Investor Class | | | 2,684,811 | | | | 89,684,705 | | | | 4,765,054 | | | | 152,159,048 | |
| | | | | | | | | | | | | | | | |
| | | | | | | 360,628,469 | | | | | | | | 790,762,494 | |
| | | | | | | | | | | | | | | | |
Reinvestment of distributions | | | | | | | | | | | | | | | | |
Class A | | | 761,276 | | | | 23,762,292 | | | | 169,315 | | | | 4,974,950 | |
Class B | | | 1,521 | | | | 42,714 | | | | 538 | | | | 14,784 | |
Class C | | | 133,666 | | | | 3,766,646 | | | | 17,425 | | | | 480,227 | |
Administrator Class | | | 117,215 | | | | 3,725,339 | | | | 36,716 | | | | 1,086,412 | |
Institutional Class | | | 1,663,325 | | | | 53,039,903 | | | | 468,480 | | | | 13,849,753 | |
Investor Class | | | 1,659,987 | | | | 52,731,227 | | | | 373,334 | | | | 11,203,611 | |
| | | | | | | | | | | | | | | | |
| | | | | | | 137,068,121 | | | | | | | | 31,609,737 | |
| | | | | | | | | | | | | | | | |
Payment for shares redeemed | | | | | | | | | | | | | | | | |
Class A | | | (4,405,634 | ) | | | (146,182,470 | ) | | | (5,262,977 | ) | | | (164,249,938 | ) |
Class B | | | (15,129 | ) | | | (451,231 | ) | | | (104,525 | ) | | | (2,945,559 | ) |
Class C | | | (379,179 | ) | | | (11,296,513 | ) | | | (663,883 | ) | | | (18,779,465 | ) |
Administrator Class | | | (1,967,962 | ) | | | (65,869,946 | ) | | | (5,441,330 | ) | | | (173,762,351 | ) |
Institutional Class | | | (4,233,775 | ) | | | (142,472,558 | ) | | | (9,499,751 | ) | | | (300,294,182 | ) |
Investor Class | | | (9,018,933 | ) | | | (302,271,781 | ) | | | (14,990,335 | ) | | | (479,580,135 | ) |
| | | | | | | | | | | | | | | | |
| | | | | | | (668,544,499 | ) | | | | | | | (1,139,611,630 | ) |
| | | | | | | | | | | | | | | | |
Net decrease in net assets resulting from capital share transactions | | | | | | | (170,847,909 | ) | | | | | | | (317,239,399 | ) |
| | | | | | | | | | | | | | | | |
Total increase (decrease) in net assets | | | | | | | (40,624,260 | ) | | | | | | | 64,180,642 | |
| | | | | | | | | | | | | | | | |
| | | | |
Net assets | | | | | | | | | | | | | | | | |
Beginning of period | | | | | | | 3,677,518,091 | | | | | | | | 3,613,337,449 | |
| | | | | | | | | | | | | | | | |
End of period | | | | | | $ | 3,636,893,831 | | | | | | | $ | 3,677,518,091 | |
| | | | | | | | | | | | | | | | |
Undistributed net investment income | | | | | | $ | 13,070,772 | | | | | | | $ | 24,243,985 | |
| | | | | | | | | | | | | | | | |
The accompanying notes are an integral part of these financial statements.
| | | | |
| 16 | | Wells Fargo Advantage Small Cap Value Fund | | Financial highlights |
(For a share outstanding throughout each period)
| | | | | | | | | | | | | | | | | | | | | | | | |
| | | Six months ended
April 30, 2013
(unaudited) | | | Year ended October 31 | |
| CLASS A | | | 2012 | | | 2011 | | | 2010 | | | 2009 | | | 2008 | |
Net asset value, beginning of period | | $ | 32.87 | | | $ | 29.56 | | | $ | 29.71 | | | $ | 23.32 | | | $ | 18.22 | | | $ | 36.28 | |
Net investment income (loss) | | | 0.16 | | | | 0.19 | | | | 0.16 | | | | 0.22 | 1 | | | 0.15 | 1 | | | (0.02 | )1 |
Net realized and unrealized gains (losses) on investments | | | 2.43 | | | | 3.39 | | | | (0.11 | ) | | | 6.29 | | | | 4.95 | | | | (13.25 | ) |
| | | | | | | | | | | | | | | | | | | | | | | | |
Total from investment operations | | | 2.59 | | | | 3.58 | | | | 0.05 | | | | 6.51 | | | | 5.10 | | | | (13.27 | ) |
Distributions to shareholders from | | | | | | | | | | | | | | | | | | | | | | | | |
Net investment income | | | (0.24 | ) | | | (0.12 | ) | | | (0.20 | ) | | | (0.12 | ) | | | 0.00 | | | | (0.01 | ) |
Net realized gains | | | (1.21 | ) | | | (0.15 | ) | | | 0.00 | | | | 0.00 | | | | 0.00 | | | | (4.78 | ) |
| | | | | | | | | | | | | | | | | | | | | | | | |
Total distributions to shareholders | | | (1.45 | ) | | | (0.27 | ) | | | (0.20 | ) | | | (0.12 | ) | | | 0.00 | | | | (4.79 | ) |
Net asset value, end of period | | $ | 34.01 | | | $ | 32.87 | | | $ | 29.56 | | | $ | 29.71 | | | $ | 23.32 | | | $ | 18.22 | |
Total return2 | | | 8.32 | % | | | 12.22 | % | | | 0.11 | % | | | 28.01 | % | | | 27.99 | % | | | (41.27 | )% |
Ratios to average net assets (annualized) | | | | | | | | | | | | | | | | | | | | | | | | |
Gross expenses | | | 1.33 | % | | | 1.34 | % | | | 1.32 | % | | | 1.38 | % | | | 1.44 | % | | | 1.44 | % |
Net expenses | | | 1.30 | % | | | 1.30 | % | | | 1.30 | % | | | 1.37 | % | | | 1.44 | % | | | 1.44 | % |
Net investment income (loss) | | | 1.02 | % | | | 0.61 | % | | | 0.50 | % | | | 0.79 | % | | | 0.79 | % | | | (0.08 | )% |
Supplemental data | | | | | | | | | | | | | | | | | | | | | | | | |
Portfolio turnover rate | | | 10 | % | | | 16 | % | | | 17 | % | | | 21 | % | | | 27 | % | | | 27 | % |
Net assets, end of period (000s omitted) | | | $549,831 | | | | $603,622 | | | | $596,741 | | | | $645,371 | | | | $438,744 | | | | $382,412 | |
| 1. | Calculated based upon average shares outstanding |
| 2. | Total return calculations do not include any sales charges. Returns for periods of less than one year are not annualized. |
The accompanying notes are an integral part of these financial statements.
| | | | | | |
| Financial highlights | | Wells Fargo Advantage Small Cap Value Fund | | | 17 | |
(For a share outstanding throughout each period)
| | | | | | | | | | | | | | | | | | | | | | | | |
| | | Six months ended
April 30, 2013
(unaudited) | | | Year ended October 31 | |
| CLASS B | | | 2012 | | | 2011 | | | 2010 | | | 2009 | | | 2008 | |
Net asset value, beginning of period | | $ | 29.74 | | | $ | 26.85 | | | $ | 27.02 | | | $ | 21.28 | | | $ | 16.75 | | | $ | 33.98 | |
Net investment income (loss) | | | 0.04 | 1 | | | (0.03 | )1 | | | (0.16 | )1 | | | 0.00 | 1,2 | | | 0.01 | 1 | | | (0.22 | )1 |
Net realized and unrealized gains (losses) on investments | | | 2.20 | | | | 3.07 | | | | (0.01 | ) | | | 5.74 | | | | 4.52 | | | | (12.23 | ) |
| | | | | | | | | | | | | | | | | | | | | | | | |
Total from investment operations | | | 2.24 | | | | 3.04 | | | | (0.17 | ) | | | 5.74 | | | | 4.53 | | | | (12.45 | ) |
Distributions to shareholders from | | | | | | | | | | | | | | | | | | | | | | | | |
Net realized gains | | | (1.21 | ) | | | (0.15 | ) | | | 0.00 | | | | 0.00 | | | | 0.00 | | | | (4.78 | ) |
Net asset value, end of period | | $ | 30.77 | | | $ | 29.74 | | | $ | 26.85 | | | $ | 27.02 | | | $ | 21.28 | | | $ | 16.75 | |
Total return3 | | | 7.92 | % | | | 11.37 | % | | | (0.63 | )% | | | 26.97 | % | | | 27.04 | % | | | (41.68 | )% |
Ratios to average net assets (annualized) | | | | | | | | | | | | | | | | | | | | | | | | |
Gross expenses | | | 2.08 | % | | | 2.08 | % | | | 2.06 | % | | | 2.13 | % | | | 2.19 | % | | | 2.19 | % |
Net expenses | | | 2.05 | % | | | 2.05 | % | | | 2.04 | % | | | 2.13 | % | | | 2.19 | % | | | 2.19 | % |
Net investment income (loss) | | | 0.27 | % | | | (0.12 | )% | | | (0.57 | )% | | | 0.00 | % | | | 0.03 | % | | | (0.87 | )% |
Supplemental data | | | | | | | | | | | | | | | | | | | | | | | | |
Portfolio turnover rate | | | 10 | % | | | 16 | % | | | 17 | % | | | 21 | % | | | 27 | % | | | 27 | % |
Net assets, end of period (000s omitted) | | | $948 | | | | $1,310 | | | | $3,928 | | | | $36,436 | | | | $46,175 | | | | $53,515 | |
| 1. | Calculated based upon average shares outstanding |
| 2. | Amount is less than $0.005. |
| 3. | Total return calculations do not include any sales charges. Returns for periods of less than one year are not annualized. |
The accompanying notes are an integral part of these financial statements.
| | | | |
| 18 | | Wells Fargo Advantage Small Cap Value Fund | | Financial highlights |
(For a share outstanding throughout each period)
| | | | | | | | | | | | | | | | | | | | | | | | |
| | | Six months ended
April 30, 2013 (unaudited) | | | Year ended October 31 | |
| CLASS C | | | 2012 | | | 2011 | | | 2010 | | | 2009 | | | 2008 | |
Net asset value, beginning of period | | $ | 29.82 | | | $ | 26.92 | | | $ | 27.11 | | | $ | 21.34 | | | $ | 16.80 | | | $ | 34.07 | |
Net investment income (loss) | | | 0.04 | 1 | | | (0.04 | )1 | | | (0.07 | )1 | | | 0.01 | 1 | | | 0.01 | 1 | | | (0.22 | )1 |
Net realized and unrealized gains (losses) on investments | | | 2.20 | | | | 3.09 | | | | (0.10 | ) | | | 5.76 | | | | 4.53 | | | | (12.27 | ) |
| | | | | | | | | | | | | | | | | | | | | | | | |
Total from investment operations | | | 2.24 | | | | 3.05 | | | | (0.17 | ) | | | 5.77 | | | | 4.54 | | | | (12.49 | ) |
Distributions to shareholders from | | | | | | | | | | | | | | | | | | | | | | | | |
Net investment income | | | (0.05 | ) | | | 0.00 | | | | (0.02 | ) | | | 0.00 | | | | 0.00 | | | | 0.00 | |
Net realized gains | | | (1.21 | ) | | | (0.15 | ) | | | 0.00 | | | | 0.00 | | | | 0.00 | | | | (4.78 | ) |
| | | | | | | | | | | | | | | | | | | | | | | | |
Total distributions to shareholders | | | (1.26 | ) | | | (0.15 | ) | | | (0.02 | ) | | | 0.00 | | | | 0.00 | | | | (4.78 | ) |
Net asset value, end of period | | $ | 30.80 | | | $ | 29.82 | | | $ | 26.92 | | | $ | 27.11 | | | $ | 21.34 | | | $ | 16.80 | |
Total return2 | | | 7.90 | % | | | 11.38 | % | | | (0.62 | )% | | | 27.04 | % | | | 27.02 | % | | | (41.69 | )% |
Ratios to average net assets (annualized) | | | | | | | | | | | | | | | | | | | | | | | | |
Gross expenses | | | 2.08 | % | | | 2.09 | % | | | 2.07 | % | | | 2.13 | % | | | 2.19 | % | | | 2.19 | % |
Net expenses | | | 2.05 | % | | | 2.05 | % | | | 2.05 | % | | | 2.12 | % | | | 2.19 | % | | | 2.19 | % |
Net investment income (loss) | | | 0.25 | % | | | (0.14 | )% | | | (0.24 | )% | | | 0.04 | % | | | 0.03 | % | | | (0.85 | )% |
Supplemental data | | | | | | | | | | | | | | | | | | | | | | | | |
Portfolio turnover rate | | | 10 | % | | | 16 | % | | | 17 | % | | | 21 | % | | | 27 | % | | | 27 | % |
Net assets, end of period (000s omitted) | | | $105,596 | | | | $102,663 | | | | $100,032 | | | | $97,675 | | | | $70,558 | | | | $69,952 | |
| 1. | Calculated based upon average shares outstanding |
| 2. | Total return calculations do not include any sales charges. Returns for periods of less than one year are not annualized. |
The accompanying notes are an integral part of these financial statements.
| | | | | | |
| Financial highlights | | Wells Fargo Advantage Small Cap Value Fund | | | 19 | |
(For a share outstanding throughout each period)
| | | | | | | | | | | | | | | | |
| | | Six months ended
April 30, 2013 (unaudited) | | | Year ended October 31 | |
| ADMINISTRATOR CLASS | | | 2012 | | | 2011 | | | 20101 | |
Net asset value, beginning of period | | $ | 33.45 | | | $ | 30.12 | | | $ | 30.32 | | | $ | 28.12 | |
Net investment income | | | 0.20 | | | | 0.25 | 2 | | | 0.29 | 2 | | | 0.05 | 2 |
Net realized and unrealized gains (losses) on investments | | | 2.47 | | | | 3.44 | | | | (0.17 | ) | | | 2.15 | |
| | | | | | | | | | | | | | | | |
Total from investment operations | | | 2.67 | | | | 3.69 | | | | 0.12 | | | | 2.20 | |
Distributions to shareholders from | | | | | | | | | | | | | | | | |
Net investment income | | | (0.32 | ) | | | (0.21 | ) | | | (0.32 | ) | | | 0.00 | |
Net realized gains | | | (1.21 | ) | | | (0.15 | ) | | | 0.00 | | | | 0.00 | |
| | | | | | | | | | | | | | | | |
Total distributions to shareholders | | | (1.53 | ) | | | (0.36 | ) | | | (0.32 | ) | | | 0.00 | |
Net asset value, end of period | | $ | 34.59 | | | $ | 33.45 | | | $ | 30.12 | | | $ | 30.32 | |
Total return3 | | | 8.42 | % | | | 12.42 | % | | | 0.32 | % | | | 7.82 | % |
Ratios to average net assets (annualized) | | | | | | | | | | | | | | | | |
Gross expenses | | | 1.17 | % | | | 1.17 | % | | | 1.15 | % | | | 1.28 | % |
Net expenses | | | 1.10 | % | | | 1.10 | % | | | 1.10 | % | | | 1.10 | % |
Net investment income | | | 1.20 | % | | | 0.80 | % | | | 0.91 | % | | | 0.79 | % |
Supplemental data | | | | | | | | | | | | | | | | |
Portfolio turnover rate | | | 10 | % | | | 16 | % | | | 17 | % | | | 21 | % |
Net assets, end of period (000s omitted) | | | $606,851 | | | | $543,683 | | | | $390,266 | | | | $8,841 | |
| 1. | For the period from July 30, 2010 (commencement of class operations) to October 31, 2010 |
| 2. | Calculated based upon average shares outstanding |
| 3. | Returns for periods of less than one year are not annualized. |
The accompanying notes are an integral part of these financial statements.
| | | | |
| 20 | | Wells Fargo Advantage Small Cap Value Fund | | Financial highlights |
(For a share outstanding throughout each period)
| | | | | | | | | | | | | | | | | | | | | | | | |
| | | Six months ended
April 30, 2013 (unaudited) | | | Year ended October 31 | |
| INSTITUTIONAL CLASS | | | 2012 | | | 2011 | | | 2010 | | | 2009 | | | 2008 | |
Net asset value, beginning of period | | $ | 33.56 | | | $ | 30.21 | | | $ | 30.33 | | | $ | 23.80 | | | $ | 18.50 | | | $ | 36.77 | |
Net investment income | | | 0.22 | | | | 0.34 | | | | 0.31 | | | | 0.34 | 1 | | | 0.25 | 1 | | | 0.13 | 1 |
Net realized and unrealized gains (losses) on investments | | | 2.48 | | | | 3.42 | | | | (0.12 | ) | | | 6.42 | | | | 5.05 | | | | (13.45 | ) |
| | | | | | | | | | | | | | | | | | | | | | | | |
Total from investment operations | | | 2.70 | | | | 3.76 | | | | 0.19 | | | | 6.76 | | | | 5.30 | | | | (13.32 | ) |
Distributions to shareholders from | | | | | | | | | | | | | | | | | | | | | | | | |
Net investment income | | | (0.37 | ) | | | (0.26 | ) | | | (0.31 | ) | | | (0.23 | ) | | | 0.00 | | | | (0.17 | ) |
Net realized gains | | | (1.21 | ) | | | (0.15 | ) | | | 0.00 | | | | 0.00 | | | | 0.00 | | | | (4.78 | ) |
| | | | | | | | | | | | | | | | | | | | | | | | |
Total distributions to shareholders | | | (1.58 | ) | | | (0.41 | ) | | | (0.31 | ) | | | (0.23 | ) | | | 0.00 | | | | (4.95 | ) |
Net asset value, end of period | | $ | 34.68 | | | $ | 33.56 | | | $ | 30.21 | | | $ | 30.33 | | | $ | 23.80 | | | $ | 18.50 | |
Total return2 | | | 8.51 | % | | | 12.68 | % | | | 0.52 | % | | | 28.53 | % | | | 28.65 | % | | | (40.96 | )% |
Ratios to average net assets (annualized) | | | | | | | | | | | | | | | | | | | | | | | | |
Gross expenses | | | 0.90 | % | | | 0.91 | % | | | 0.89 | % | | | 0.94 | % | | | 1.00 | % | | | 0.99 | % |
Net expenses | | | 0.90 | % | | | 0.90 | % | | | 0.89 | % | | | 0.93 | % | | | 0.95 | % | | | 0.95 | % |
Net investment income | | | 1.40 | % | | | 1.01 | % | | | 0.97 | % | | | 1.23 | % | | | 1.24 | % | | | 0.49 | % |
Supplemental data | | | | | | | | | | | | | | | | | | | | | | | | |
Portfolio turnover rate | | | 10 | % | | | 16 | % | | | 17 | % | | | 21 | % | | | 27 | % | | | 27 | % |
Net assets, end of period (000s omitted) | | | $1,206,993 | | | | $1,143,730 | | | | $1,073,943 | | | | $1,279,201 | | | | $843,753 | | | | $340,878 | |
| 1. | Calculated based upon average shares outstanding |
| 2. | Returns for periods of less than one year are not annualized. |
The accompanying notes are an integral part of these financial statements.
| | | | | | |
| Financial highlights | | Wells Fargo Advantage Small Cap Value Fund | | | 21 | |
(For a share outstanding throughout each period)
| | | | | | | | | | | | | | | | | | | | | | | | |
| | | Six months ended
April 30, 2013 (unaudited) | | | Year ended October 31 | |
| INVESTOR CLASS | | | 2012 | | | 2011 | | | 2010 | | | 2009 | | | 20081 | |
Net asset value, beginning of period | | $ | 33.43 | | | $ | 30.04 | | | $ | 30.18 | | | $ | 23.70 | | | $ | 18.50 | | | $ | 36.73 | |
Net investment income (loss) | | | 0.16 | 2 | | | 0.19 | 2 | | | 0.14 | 2 | | | 0.22 | 2 | | | 0.17 | 2 | | | (0.01 | )2 |
Net realized and unrealized gains (losses) on investments | | | 2.47 | | | | 3.44 | | | | (0.10 | ) | | | 6.39 | | | | 5.03 | | | | (13.43 | ) |
| | | | | | | | | | | | | | | | | | | | | | | | |
Total from investment operations | | | 2.63 | | | | 3.63 | | | | 0.04 | | | | 6.61 | | | | 5.20 | | | | (13.44 | ) |
Distributions to shareholders from | | | | | | | | | | | | | | | | | | | | | | | | |
Net investment income | | | (0.22 | ) | | | (0.09 | ) | | | (0.18 | ) | | | (0.13 | ) | | | 0.00 | | | | (0.01 | ) |
Net realized gains | | | (1.21 | ) | | | (0.15 | ) | | | 0.00 | | | | 0.00 | | | | 0.00 | | | | (4.78 | ) |
| | | | | | | | | | | | | | | | | | | | | | | | |
Total distributions to shareholders | | | (1.43 | ) | | | (0.24 | ) | | | (0.18 | ) | | | (0.13 | ) | | | 0.00 | | | | (4.79 | ) |
Net asset value, end of period | | $ | 34.63 | | | $ | 33.43 | | | $ | 30.04 | | | $ | 30.18 | | | $ | 23.70 | | | $ | 18.50 | |
Total return3 | | | 8.29 | % | | | 12.18 | % | | | 0.09 | % | | | 27.99 | % | | | 28.11 | % | | | (41.20 | )% |
Ratios to average net assets (annualized) | | | | | | | | | | | | | | | | | | | | | | | | |
Gross expenses | | | 1.39 | % | | | 1.40 | % | | | 1.39 | % | | | 1.47 | % | | | 1.55 | % | | | 1.57 | % |
Net expenses | | | 1.33 | % | | | 1.33 | % | | | 1.33 | % | | | 1.35 | % | | | 1.36 | % | | | 1.36 | % |
Net investment income (loss) | | | 0.98 | % | | | 0.58 | % | | | 0.45 | % | | | 0.80 | % | | | 0.88 | % | | | (0.02 | )% |
Supplemental data | | | | | | | | | | | | | | | | | | | | | | | | |
Portfolio turnover rate | | | 10 | % | | | 16 | % | | | 17 | % | | | 21 | % | | | 27 | % | | | 27 | % |
Net assets, end of period (000s omitted) | | | $1,166,675 | | | | $1,282,510 | | | | $1,448,429 | | | | $1,968,601 | | | | $1,523,637 | | | | $1,461,833 | |
| 1. | Effective June 20, 2008, Class Z was renamed Investor Class. |
| 2. | Calculated based upon average shares outstanding |
| 3. | Returns for periods of less than one year are not annualized. |
The accompanying notes are an integral part of these financial statements.
| | | | |
| 22 | | Wells Fargo Advantage Small Cap Value Fund | | Notes to financial statements (unaudited) |
1. ORGANIZATION
Wells Fargo Funds Trust (the “Trust”), a Delaware statutory trust organized on March 10, 1999, is an open-end management investment company registered under the Investment Company Act of 1940, as amended (the “1940 Act”). These financial statements report on Wells Fargo Advantage Small Cap Value Fund (the “Fund”) which is a diversified series of the Trust.
2. SIGNIFICANT ACCOUNTING POLICIES
The following significant accounting policies, which are consistently followed in the preparation of the financial statements of the Fund, are in conformity with U.S. generally accepted accounting principles which require management to make estimates and assumptions that affect the reported amounts of assets and liabilities, disclosure of contingent assets and liabilities at the date of the financial statements, and the reported amounts of revenues and expenses during the reporting period. Actual results could differ from those estimates.
Securities valuation
All investments are valued each business day as of the close of regular trading on the New York Stock Exchange (normally 4 p.m. Eastern Time).
Equity securities that are listed on a foreign or domestic exchange, except for The Nasdaq Stock Market, Inc. (“Nasdaq”), are valued at the official closing price or, if none, the last sales price. Securities listed on Nasdaq are valued at the Nasdaq Official Closing Price (“NOCP”). If no NOCP is available, securities are valued at the last sales price. If no sales price is shown on the Nasdaq, the bid price will be used. If no sale occurs on the primary exchange or market for the security that day or if no sale occurs and no bid price is shown on Nasdaq, the prior day’s price will be deemed “stale” and fair values will be determined in accordance with the Fund’s Valuation Procedures.
Securities denominated in foreign currencies are translated into U.S. dollars using the rates of exchange in effect on the day of valuation at a time specified by the Management Valuation Team of Wells Fargo Funds Management, LLC (“Funds Management”).
Many securities markets and exchanges outside the U.S. close prior to the close of the New York Stock Exchange and therefore may not fully reflect trading or events that occur after the close of the principal exchange in which the foreign securities are traded, but before the close of the New York Stock Exchange. If such trading or events are expected to materially affect the value of such securities, then fair value pricing procedures approved by the Board of Trustees are applied. These procedures take into account multiple factors including movements in U.S. securities markets after foreign exchanges close. Foreign securities that are fair valued under these procedures are categorized as Level 2 and the application of these procedures may result in transfers between Level 1 and Level 2. Depending on market activity, such fair valuations may be frequent. Such fair value pricing may result in NAVs that are higher or lower than NAVs based on the last reported sales price or latest quoted bid price. On April 30, 2013, fair value pricing was not used in pricing foreign securities.
Investments in registered open-end investment companies are valued at net asset value.
Investments which are not valued using any of the methods discussed above are valued at their fair value, as determined by procedures established in good faith and approved by the Board of Trustees. The Board of Trustees has established a Valuation Committee comprised of the Trustees and has delegated to it the authority to take any actions regarding the valuation of portfolio securities that the Valuation Committee deems necessary or appropriate, including determining the fair value of portfolio securities, unless the determination has been delegated to the Management Valuation Team. The Board of Trustees retains the authority to make or ratify any valuation decisions or approve any changes to the Valuation Procedures as it deems appropriate. On a quarterly basis, the Board of Trustees receives reports on any valuation actions taken by the Valuation Committee or the Management Valuation Team which may include items for ratification.
Valuations of fair valued securities are compared to the next actual sales price when available, or other appropriate market information to assess the continued appropriateness of the fair valuation methodology used. These securities are fair valued on a day-to-day basis, taking into consideration changes to appropriate market information and any significant changes to the input factors considered in the valuation process until there is a readily available price provided on the exchange or by an independent pricing service. Valuations received from an independent pricing service or broker quotes are periodically validated by comparisons to most recent trades and valuations provided by other independent pricing services in addition to the review of prices by the adviser and/or subadviser. Unobservable inputs used in determining fair valuations are identified based on the type of security, taking into consideration factors utilized by market participants in valuing the investment, knowledge about the issuer and the current market environment.
| | | | | | |
| Notes to financial statements (unaudited) | | Wells Fargo Advantage Small Cap Value Fund | | | 23 | |
Foreign currency translation
The accounting records of the Fund are maintained in U.S. dollars. Assets, including investment securities, and liabilities denominated in foreign currency are translated into U.S. dollars at the rates of exchange at a time specified by the Management Valuation Team on the date of valuation. Purchases and sales of securities, and income and expenses are translated at the rate of exchange on the respective dates of such transactions. Reported net realized foreign exchange gains or losses arise from sales of foreign currencies, currency gains or losses realized between the trade and settlement dates on securities transactions, and the difference between the amounts of dividends, interest and foreign withholding taxes recorded and the U.S. dollar equivalent of the amounts actually paid or received. Net unrealized foreign exchange gains and losses arise from changes in the fair value of assets and liabilities other than investments in securities resulting in changes in exchange rates.
The changes in net assets arising from changes in exchange rates and the changes in net assets resulting from changes in market prices of securities are not separately presented. Such changes are recorded with net realized and unrealized gains or losses from investments. Gains and losses from certain foreign currency transactions are treated as ordinary income for U.S. federal income tax purposes.
Options
The Fund may be subject to equity price risk in the normal course of pursuing its investment objectives. The Fund may write covered call options or secured put options on individual securities and/or indexes. When the Fund writes an option, an amount equal to the premium received is recorded as a liability and is subsequently adjusted to the current market value of the written option. Premiums received from written options that expire unexercised are recognized as realized gains from investments on the expiration date. The difference between the premium received and the amount paid on effecting a closing purchase transaction, including brokerage commissions, is treated as a realized gain or loss. If a call option is exercised, the premium is added to the proceeds from the sale of the underlying security in calculating the realized gain or loss on the sale. If a put option is exercised, the premium reduces the cost of the security purchased. The Fund, as a writer of an option, bears the market risk of an unfavorable change in the price of the security and/or index underlying the written option.
The Fund may also purchase call or put options. The premium is included in the Statement of Assets and Liabilities as an investment, the value of which is subsequently adjusted based on to the current market value of the option. Premiums paid for purchased options that expire are recognized as realized losses from investments on the expiration date. Premiums paid for purchased options that are exercised or closed are added to the amount paid or offset against the proceeds received for the underlying security to determine the realized gain or loss. The risk of loss associated with purchased options is limited to the premium paid.
Options traded on an exchange are regulated and terms of the options are standardized. Options traded over the counter expose the Fund to counterparty risk in the event the counterparty does not perform. This risk is mitigated by having a master netting arrangement between the Fund and the counterparty and by having the counterparty post collateral to cover the Fund’s exposure to the counterparty.
Security transactions and income recognition
Securities transactions are recorded on a trade date basis. Realized gains or losses are recorded on the basis of identified cost.
Dividend income is recognized on the ex-dividend date, except for certain dividends from foreign securities, which are recorded as soon as the Fund is informed of the ex-dividend date. Dividend income from foreign securities is recorded net of foreign taxes withheld where recovery of such taxes is not assured.
Distributions to shareholders
Distributions to shareholders from net investment income and net realized gains, if any, are recorded on the ex-dividend date. Such distributions are determined in conformity with federal income tax regulations, which may differ in amount or character from net investment income and realized gains recognized for purposes of U.S. generally accepted accounting principles.
Federal and other taxes
The Fund intends to continue to qualify as a regulated investment company by distributing substantially all of its investment company taxable income and any net realized capital gains (after reduction for capital loss carryforwards) sufficient to relieve it from all, or substantially all, federal income taxes. Accordingly, no provision for federal income taxes was required.
| | | | |
| 24 | | Wells Fargo Advantage Small Cap Value Fund | | Notes to financial statements (unaudited) |
The Fund’s income and federal excise tax returns and all financial records supporting those returns for the prior three fiscal years are subject to examination by the federal and Delaware revenue authorities. Management has analyzed the Fund’s tax positions taken on federal, state, and foreign tax returns for all open tax years and does not believe that there are any uncertain tax positions that require recognition of a tax liability.
Class allocations
The separate classes of shares offered by the Fund differ principally in applicable sales charges, distribution, shareholder servicing, and administration fees. Shareholders of each class bear certain expenses that pertain to that particular class. All shareholders bear the common expenses of the Fund, earn income from the portfolio, and are allocated any unrealized gains and losses pro rata based on the average daily net assets of each class, without distinction between share classes. Dividends are determined separately for each class based on income and expenses allocable to each class. Realized gains and losses are allocated to each class pro rata based upon the net assets of each class on the date realized. Differences in per share dividend rates generally result from the relative weightings of pro rata income and realized gain allocations and from differences in separate class expenses, including distribution, shareholder servicing, and administration fees.
3. FAIR VALUATION MEASUREMENTS
Fair value measurements of investments are determined within a framework that has established a fair value hierarchy based upon the various data inputs utilized in determining the value of the Fund’s investments. The three-level hierarchy gives the highest priority to unadjusted quoted prices in active markets for identical assets or liabilities (Level 1) and the lowest priority to significant unobservable inputs (Level 3). The Fund’s investments are classified within the fair value hierarchy based on the lowest level of input that is significant to the fair value measurement. The inputs are summarized into three broad levels as follows:
| n | | Level 1 – quoted prices in active markets for identical securities |
| n | | Level 2 – other significant observable inputs (including quoted prices for similar securities, interest rates, prepayment speeds, credit risk, use of amortized cost, etc.) |
| n | | Level 3 – significant unobservable inputs (including the Fund’s own assumptions in determining the fair value of investments) |
The inputs or methodologies used for valuing investments in securities are not necessarily an indication of the risk associated with investing in those securities.
As of April 30, 2013, the inputs used in valuing investments in securities were as follows:
| | | | | | | | | | | | | | | | |
| Investments in securities | | Quoted prices (Level 1) | | | Significant other
observable inputs (Level 2) | | | Significant unobservable inputs (Level 3) | | | Total | |
| | | | |
Equity securities | | | | | | | | | | | | | | | | |
Common stocks | | $ | 3,342,994,775 | | | $ | 10,265,702 | | | $ | 0 | | | $ | 3,353,260,477 | |
Investment companies | | | 47,791,257 | | | | 0 | | | | 0 | | | | 47,791,257 | |
Warrants | | | 0 | | | | 340,753 | | | | 0 | | | | 340,753 | |
| | | | |
Short-term investments | | | | | | | | | | | | | | | | |
Investment companies | | | 245,221,258 | | | | 0 | | | | 0 | | | | 245,221,258 | |
| | | $ | 3,636,007,290 | | | $ | 10,606,455 | | | $ | 0 | | | $ | 3,646,613,745 | |
As of April 30, 2013, the inputs used in valuing the Fund’s other financial instruments were as follows:
| | | | | | | | | | | | | | | | |
| Other financial instruments | | Quoted prices (Level 1) | | | Significant other
observable inputs (Level 2) | | | Significant unobservable inputs (Level 3) | | | Total | |
Written options | | $ | 0 | | | $ | (697,950 | ) | | $ | 0 | | | $ | (697,950 | ) |
Transfers in and transfers out are recognized at the end of the reporting period. For the six months ended April 30, 2013, the Fund did not have any transfers into/out of Level 1 or Level 2.
| | | | | | |
| Notes to financial statements (unaudited) | | Wells Fargo Advantage Small Cap Value Fund | | | 25 | |
4. TRANSACTIONS WITH AFFILIATES AND OTHER EXPENSES
Advisory fee
The Trust has entered into an advisory contract with Funds Management, an indirect wholly owned subsidiary of Wells Fargo & Company (“Wells Fargo”). The adviser is responsible for implementing investment policies and guidelines and for supervising the subadviser, who is responsible for day-to-day portfolio management of the Fund.
Pursuant to the contract, Funds Management is entitled to receive an annual advisory fee starting at 0.80% and declining to 0.70% as the average daily net assets of the Fund increase. For the six months ended April 30, 2013, the advisory fee was equivalent to an annual rate of 0.74% of the Fund’s average daily net assets.
Funds Management has retained the services of a subadviser to provide daily portfolio management to the Fund. The fee for subadvisory services is borne by Funds Management. Wells Capital Management Incorporated, an affiliate of Funds Management, is the subadviser to the Fund and is entitled to receive a fee from Funds Management at an annual rate starting at 0.55% and declining to 0.40% as the average daily net assets of the Fund increase.
Administration and transfer agent fees
The Trust has entered into an administration agreement with Funds Management. Under this agreement, for providing administrative services, which includes paying fees and expenses for services provided by the transfer agent, sub-transfer agents, omnibus account servicers and record-keepers, Funds Management is entitled to receive from the Fund an annual fund level administration fee starting at 0.05% and declining to 0.03% as the average daily net assets of the Fund increase and a class level administration fee which is calculated based on the average daily net assets of each class as follows:
| | | | |
| | | Class level
administration fee | |
Class A, Class B, and Class C | | | 0.26 | % |
Administrator Class | | | 0.10 | |
Institutional Class | | | 0.08 | |
Investor Class | | | 0.32 | |
Funds Management has contractually waived and/or reimbursed advisory and administration fees to the extent necessary to maintain certain net operating expense ratios for the Fund. Waiver of fees and/or reimbursement of expenses by Funds Management were made first from fund level expenses on a proportionate basis and then from class specific expenses. Funds Management has committed through February 28, 2014 to waive fees and/or reimburse expenses to the extent necessary to cap the Fund’s expenses at 1.30% for Class A shares, 2.05% for Class B shares, 2.05% for Class C shares, 1.10% for Administrator Class shares, 0.90% for Institutional Class shares, and 1.33% for Investor Class shares.
Distribution fees
The Trust has adopted a Distribution Plan for Class B and Class C shares of the Fund pursuant to Rule 12b-1 under the 1940 Act. Distribution fees are charged to Class B and Class C shares and paid to Wells Fargo Funds Distributor, LLC, the principal underwriter, at an annual rate of 0.75% of the average daily net assets of Class B and Class C shares.
For the six months ended April 30, 2013, Wells Fargo Funds Distributor, LLC received $14,117 from the sale of Class A shares and $1,447 in contingent deferred sales charges from redemptions of Class C shares.
Shareholder servicing fees
The Trust has entered into contracts with one or more shareholder servicing agents, whereby Class A, Class B, Class C, Administrator Class, and Investor Class of the Fund is charged a fee at an annual rate of 0.25% of the average daily net assets of each respective class.
A portion of these total shareholder servicing fees were paid to affiliates of Wells Fargo.
5. INVESTMENT PORTFOLIO TRANSACTIONS
Purchases and sales of investments, excluding U.S. government obligations (if any) and short-term securities, for the six months ended April 30, 2013 were $337,908,241 and $550,101,810, respectively.
6. INVESTMENTS IN AFFILIATES
An affiliated investment is a company in which the Fund has ownership of at least 5% of the outstanding voting shares.
| | | | |
| 26 | | Wells Fargo Advantage Small Cap Value Fund | | Notes to financial statements (unaudited) |
The following is a summary of transactions in issuers that were either affiliates of the Fund at the beginning of the period or the end of the period.
| | | | | | | | | | | | | | | | | | | | | | | | | | | | |
| | | Shares, beginning
of period | | | Shares
purchased | | | Shares
sold | | | Shares, end of
period | | | Value, end of
period | | | Income from
affiliated securities | | | Realized gains
(losses) | |
Argo Group International Holdings Limited | | | 2,115,700 | | | | 10,500 | | | | 57,800 | | | | 2,068,400 | | | $ | 85,735,180 | | | $ | 573,510 | | | $ | (329,824 | ) |
Cavco Industries Incorporated | | | 539,500 | | | | 57,300 | | | | 0 | | | | 596,800 | | | | 27,226,016 | | | | 0 | | | | 0 | |
Cincinnati Bell Incorporated | | | 9,419,300 | | | | 3,383,900 | | | | 297,200 | | | | 12,506,000 | | | | 44,021,120 | | | | 0 | | | | 75,343 | |
Corinthian Colleges Incorporated | | | 5,019,300 | | | | 2,606,500 | | | | 0 | | | | 7,625,800 | | | | 15,251,600 | | | | 0 | | | | 0 | |
Covenant Transport Incorporated Class A | | | 1,412,300 | | | | 8,900 | | | | 0 | | | | 1,421,200 | | | | 7,887,660 | | | | 0 | | | | 0 | |
Cray Incorporated | | | 3,468,455 | | | | 0 | | | | 441,955 | | | | 3,026,500 | | | | 64,040,740 | | | | 0 | | | | 4,817,392 | |
Crexus Investment Corporation | | | 4,085,800 | | | | 0 | | | | 4,085,800 | | | | 0 | | | | 0 | | | | 2,099,456 | | | | 5,870,820 | |
Cross Country Healthcare Incorporated | | | 2,581,900 | | | | 4,900 | | | | 20,600 | | | | 2,566,200 | | | | 12,831,000 | | | | 0 | | | | (255,280 | ) |
dELiA*s Incorporated | | | 1,916,100 | | | | 16,100 | | | | 27,700 | | | | 1,904,500 | | | | 1,256,208 | | | | 0 | | | | (20,738 | ) |
Gentiva Health Services Incorporated | | | 2,421,800 | | | | 150,600 | | | | 45,100 | | | | 2,527,300 | | | | 26,511,377 | | | | 0 | | | | (6,889 | ) |
Hill International Incorporated | | | 2,775,200 | | | | 58,500 | | | | 0 | | | | 2,833,700 | | | | 7,792,675 | | | | 0 | | | | 0 | |
Intermec Incorporated | | | 3,718,000 | | | | 0 | | | | 22,400 | | | | 3,695,600 | | | | 36,364,704 | | | | 0 | | | | 54,922 | |
InterOil Corporation | | | 4,627,800 | | | | 472,300 | | | | 23,400 | | | | 5,076,700 | | | | 401,668,504 | | | | 0 | | | | (51,908 | ) |
MRV Communications Incorporated | | | 3,470,950 | | | | 0 | | | | 3,470,950 | | | | 0 | | | | 0 | | | | 158,904 | | | | (1,377,375 | ) |
Newpark Resources Incorporated | | | 7,309,456 | | | | 9,400 | | | | 52,500 | | | | 7,266,356 | | | | 76,296,738 | | | | 0 | | | | 95,251 | |
OraSure Technologies Incorporated | | | 6,780,100 | | | | 468,000 | | | | 0 | | | | 7,248,100 | | | | 32,326,526 | | | | 0 | | | | 0 | |
OSI Systems Incorporated | | | 614,140 | | | | 460,660 | | | | 0 | | | | 1,074,800 | | | | 61,586,040 | | | | 0 | | | | 0 | |
PHI Incorporated (voting) | | | 147,530 | | | | 1,900 | | | | 0 | | | | 149,430 | | | | 4,034,610 | | | | 0 | | | | 0 | |
Skyline Corporation | | | 874,400 | | | | 71,000 | | | | 0 | | | | 945,400 | | | | 4,282,662 | | | | 0 | | | | 0 | |
Webco Industries Incorporated | | | 89,900 | | | | 150 | | | | 0 | | | | 90,050 | | | | 10,265,700 | | | | 0 | | | | 0 | |
Willbros Group Incorporated | | | 2,070,000 | | | | 435,700 | | | | 0 | | | | 2,505,700 | | | | 23,804,150 | | | | 0 | | | | 0 | |
| | | | | | | | | | | | | | | | | | | $ | 943,183,210 | | | $ | 2,831,870 | | | $ | 8,871,714 | |
7. DERIVATIVE TRANSACTIONS
During the six months ended April 30, 2013, the Fund entered into written options for economic hedging purposes.
During the six months ended April 30, 2013, the Fund had written option activities as follows:
| | | | | | | | | | | | |
| | | Call options | | | Put options | |
| | | Number of contracts | | Premiums
received | | | Number of
contracts | | Premiums
received | |
Options outstanding at October 31, 2012 | | 2,100 | | $ | 735,209 | | | 0 | | $ | 0 | |
Options written | | 17,251 | | | 4,142,940 | | | 200 | | | 38,599 | |
Options expired | | (3,375) | | | (411,403 | ) | | 0 | | | 0 | |
Options closed | | (10,961) | | | (3,342,558 | ) | | (200) | | | (38,599 | ) |
Options exercised | | (215) | | | (37,224 | ) | | 0 | | | 0 | |
Options outstanding at April 30, 2013 | | 4,800 | | $ | 1,086,964 | | | 0 | | $ | 0 | |
| | | | | | |
| Notes to financial statements (unaudited) | | Wells Fargo Advantage Small Cap Value Fund | | | 27 | |
Open call options written at April 30, 2013 were as follow for the Fund:
| | | | | | | | | | | | | | |
Expiration date | | | | Number of
contracts | | | Strike price | | | Value | |
| 5-18-2013 | | Chicago Bridge & Iron Company NV | | | 300 | | | $ | 65.00 | | | $ | (1,500 | ) |
| 5-18-2013 | | Cray Incorporated | | | 100 | | | | 22.50 | | | | (5,500 | ) |
| 5-18-2013 | | Delta Air Lines Incorporated | | | 500 | | | | 17.00 | | | | (35,500 | ) |
| 5-18-2013 | | United Continental Holdings Incorporated | | | 300 | | | | 33.00 | | | | (20,700 | ) |
| 5-18-2013 | | Chicago Bridge & Iron Company NV | | | 450 | | | | 60.00 | | | | (11,250 | ) |
| 5-18-2013 | | US Airways Group Incorporated | | | 500 | | | | 17.00 | | | | (22,000 | ) |
| 5-18-2013 | | Alaska Air Group Incorporated | | | 300 | | | | 60.00 | | | | (72,000 | ) |
| 6-22-2013 | | InterOil Corporation | | | 100 | | | | 100.00 | | | | (22,300 | ) |
| 7-20-2013 | | Cray Incorporated | | | 100 | | | | 25.00 | | | | (4,000 | ) |
| 7-20-2013 | | Alaska Air Group Incorporated | | | 300 | | | | 60.00 | | | | (121,800 | ) |
| 7-20-2013 | | Chicago Bridge & Iron Company NV | | | 1,000 | | | | 60.00 | | | | (98,000 | ) |
| 7-20-2013 | | Chicago Bridge & Iron Company NV | | | 500 | | | | 55.00 | | | | (127,500 | ) |
| 7-20-2013 | | Alaska Air Group Incorporated | | | 150 | | | | 55.00 | | | | (118,500 | ) |
| 9-21-2013 | | InterOil Corporation | | | 100 | | | | 120.00 | | | | (23,400 | ) |
| 9-21-2013 | | InterOil Corporation | | | 100 | | | | 135.00 | | | | (14,000 | ) |
The Fund had outstanding written options with total premiums received that averaged $637,285 during the six months ended April 30, 2013.
The fair value, realized gains or losses and change in unrealized gains or losses, if any, on derivative instruments are reflected in the appropriate financial statements.
8. BANK BORROWINGS
The Trust (excluding the money market funds and certain other funds in the Trust) and Wells Fargo Variable Trust are parties to a $150,000,000 revolving credit agreement with State Street Bank and Trust Company, whereby the Fund is permitted to use bank borrowings for temporary or emergency purposes, such as to fund shareholder redemption requests. Interest under the credit agreement is charged to the Fund based on a borrowing rate equal to the higher of the Federal Funds rate in effect on that day plus 1.25% or the overnight LIBOR rate in effect on that day plus 1.25%. In addition, an annual commitment fee equal to 0.10% of the unused balance is allocated to each participating fund. For the six months ended April 30, 2013, the Fund paid $3,894 in commitment fees.
For the six months ended April 30, 2013, there were no borrowings by the Fund under the agreement.
9. INDEMNIFICATION
Under the Trust’s organizational documents, the officers and directors are indemnified against certain liabilities that may arise out of performance of their duties to the Trust. Additionally, in the normal course of business, the Trust may enter into contracts with service providers that contain a variety of indemnification clauses. The Trust’s maximum exposure under these arrangements is dependent on future claims that may be made against the Fund and, therefore, cannot be estimated.
10. NEW ACCOUNTING PRONOUNCEMENT
In December 2011, the Financial Accounting Standards Board (“FASB”) issued Accounting Standard Update (“ASU”) No. 2011-11, Disclosures about Offsetting Assets and Liabilities. ASU 2011-11, which amends FASB ASC Topic 210, Balance Sheet, creates new disclosure requirements which require entities to disclose both gross and net information for derivatives and other financial instruments that are either offset in the Statement of Assets and Liabilities or subject to an enforceable master netting arrangement or similar agreement. The disclosure requirements are effective for interim and annual reporting periods beginning on or after January 1, 2013. Management is currently assessing the potential impact, in addition to expanded financial statement disclosure, that may result from adopting this ASU.
| | | | |
| 28 | | Wells Fargo Advantage Small Cap Value Fund | | Other information (unaudited) |
PROXY VOTING INFORMATION
A description of the policies and procedures that the Fund uses to determine how to vote proxies relating to portfolio securities is available without charge, upon request, by calling 1-800-222-8222, visiting our website at wellsfargoadvantagefunds.com, or visiting the SEC website at sec.gov. Information regarding how the Fund voted proxies relating to portfolio securities during the most recent 12-month period ended June 30 is available without charge on the Fund’s website at wellsfargoadvantagefunds.com or by visiting the SEC website at sec.gov.
PORTFOLIO HOLDINGS INFORMATION
The complete portfolio holdings for the Fund are publicly available on the Fund’s website (wellsfargoadvantagefunds.com) on a monthly, 30-day or more delayed basis. In addition, top ten holdings information for the Fund is publicly available on the Fund’s website on a monthly, seven-day or more delayed basis. The Fund files its complete schedule of portfolio holdings with the SEC for the first and third quarters of each fiscal year on Form N-Q, which is available without charge by visiting the SEC website at sec.gov. In addition, the Fund’s Form N-Q may be reviewed and copied at the SEC’s Public Reference Room in Washington, DC, and at regional offices in New York City, at 233 Broadway, and in Chicago, at 175 West Jackson Boulevard, Suite 900. Information about the Public Reference Room may be obtained by calling 1-800-SEC-0330.
| | | | | | |
| Other information (unaudited) | | Wells Fargo Advantage Small Cap Value Fund | | | 29 | |
BOARD OF TRUSTEES AND OFFICERS
Each of the Trustees and Officers listed in the table below acts in identical capacities for the Wells Fargo Advantage family of funds, which consists of 131 funds1 comprising the Wells Fargo Funds Trust, Wells Fargo Variable Trust, Wells Fargo Master Trust and four closed-end funds (collectively the “Fund Complex”). This table should be read in conjunction with the Prospectus and the Statement of Additional Information2. All of the Trustees are also Members of the Audit and Governance Committees of each Trust in the Fund Complex. The mailing address of each Trustee and Officer is 525 Market Street, 12th Floor, San Francisco, CA 94105. Each Trustee and Officer serves an indefinite term, however, each Trustee serves such term until reaching the mandatory retirement age established by the Trustees.
Independent Trustees
| | | | | | |
Name and year of birth | | Position held and length of service* | | Principal occupations during past five years | | Other directorships during
past five years |
| Peter G. Gordon (Born 1942) | | Trustee, since 1998; Chairman, since 2005 | | Co-Founder, Retired Chairman, President and CEO of Crystal Geyser Water Company. Trustee Emeritus, Colby College. | | Asset Allocation Trust |
| Isaiah Harris, Jr. (Born 1952) | | Trustee, since 2009 | | Retired. Prior thereto, President and CEO of BellSouth Advertising and Publishing Corp. from 2005 to 2007, President and CEO of BellSouth Enterprises from 2004 to 2005 and President of BellSouth Consumer Services from 2000 to 2003. Emeritus member of the Iowa State University Foundation Board of Governors. Emeritus Member of the Advisory Board of Iowa State University School of Business. Advisory Board Member, Palm Coast Academy (charter school). Mr. Harris is a certified public accountant. | | CIGNA Corporation; Deluxe Corporation; Asset Allocation Trust |
| Judith M. Johnson (Born 1949) | | Trustee, since 2008; Audit Committee Chairman, since 2008 | | Retired. Prior thereto, Chief Executive Officer and Chief Investment Officer of Minneapolis Employees Retirement Fund from 1996 to 2008. Ms. Johnson is an attorney, certified public accountant and a certified managerial accountant. | | Asset Allocation Trust |
| Leroy Keith, Jr. (Born 1939) | | Trustee, since 2010 | | Chairman, Bloc Global Services (development and construction). Trustee of the Evergreen Funds from 1983 to 2010. Former Managing Director, Almanac Capital Management (commodities firm), former Partner, Stonington Partners, Inc. (private equity fund), former Director, Obagi Medical Products Co. and former Director, Lincoln Educational Services. | | Trustee, Virtus Fund Complex (consisting of 48 portfolios as of 1/31/2013); Asset Allocation Trust |
| David F. Larcker (Born 1950) | | Trustee, since 2009 | | James Irvin Miller Professor of Accounting at the Graduate School of Business, Stanford University, Morgan Stanley Director of the Center for Leadership Development and Research and Senior Faculty of The Rock Center for Corporate Governance since 2006. From 2005 to 2008, Professor of Accounting at the Graduate School of Business, Stanford University. Prior thereto, Ernst & Young Professor of Accounting at The Wharton School, University of Pennsylvania from 1985 to 2005. | | Asset Allocation Trust |
| Olivia S. Mitchell (Born 1953) | | Trustee, since 2006 | | International Foundation of Employee Benefit Plans Professor, Wharton School of the University of Pennsylvania since 1993. Director of Wharton’s Pension Research Council and Boettner Center on Pensions & Retirement Research, and Research Associate at the National Bureau of Economic Research. Previously, Cornell University Professor from 1978 to 1993. | | Asset Allocation Trust |
| Timothy J. Penny (Born 1951) | | Trustee, since 1996 | | President and CEO of Southern Minnesota Initiative Foundation, a non-profit organization, since 2007 and Senior Fellow at the Humphrey Institute Policy Forum at the University of Minnesota since 1995. Member of the Board of Trustees of NorthStar Education Finance, Inc., a non-profit organization, since 2007. | | Asset Allocation Trust |
| | | | |
| 30 | | Wells Fargo Advantage Small Cap Value Fund | | Other information (unaudited) |
| | | | | | |
Name and year of birth | | Position held and length of service* | | Principal occupations during past five years | | Other directorships during
past five years |
| Michael S. Scofield (Born 1943) | | Trustee, since 2010 | | Served on the Investment Company Institute’s Board of Governors and Executive Committee from 2008-2011 as well the Governing Council of the Independent Directors Council from 2006-2011 and the Independent Directors Council Executive Committee from 2008-2011. Chairman of the IDC from 2008-2010. Institutional Investor (Fund Directions) Trustee of Year in 2007. Trustee of the Evergreen Funds (and its predecessors) from 1984 to 2010. Chairman of the Evergreen Funds from 2000-2010. Former Trustee of the Mentor Funds. Retired Attorney, Law Offices of Michael S. Scofield. | | Asset Allocation Trust |
| Donald C. Willeke (Born 1940) | | Trustee, since 1996 | | Principal of the law firm of Willeke & Daniels. General Counsel of the Minneapolis Employees Retirement Fund from 1984 until its consolidation into the Minnesota Public Employees Retirement Association on June 30, 2010. Director and Vice Chair of The Tree Trust (non-profit corporation). Director of the American Chestnut Foundation (non-profit corporation). | | Asset Allocation Trust |
| * | Length of service dates reflect the Trustee’s commencement of service with the Trust’s predecessor entities, where applicable. |
Officers
| | | | | | |
Name and year of birth | | Position held and
length of service | | Principal occupations during past five years | | |
| Karla M. Rabusch (Born 1959) | | President, since 2003 | | Executive Vice President of Wells Fargo Bank, N.A. and President of Wells Fargo Funds Management, LLC since 2003. | | |
Nancy Wiser1 (Born 1967) | | Treasurer, since 2012 | | Executive Vice President of Wells Fargo Funds Management, LLC since 2011. Chief Operating Officer and Chief Compliance Officer at LightBox Capital Management LLC, from 2008 to 2011. Owned and operated a consulting business providing services to various hedge funds including acting as Chief Operating Officer and Chief Compliance Officer for a hedge fund from 2007 to 2008. Chief Operating Officer and Chief Compliance Officer of GMN Capital LLC from 2006 to 2007. | | |
| C. David Messman (Born 1960) | | Secretary, since 2000; Chief Legal Officer, since 2003 | | Senior Vice President and Secretary of Wells Fargo Funds Management, LLC since 2001. Vice President and Managing Counsel of Wells Fargo Bank, N.A. since 1996. | | |
Debra Ann Early (Born 1964) | | Chief Compliance Officer, since 2007 | | Chief Compliance Officer of Wells Fargo Funds Management, LLC since 2007. Chief Compliance Officer of Parnassus Investments from 2005 to 2007. Chief Financial Officer of Parnassus Investments from 2004 to 2007. | | |
David Berardi (Born 1975) | | Assistant Treasurer, since 2009 | | Vice President of Wells Fargo Funds Management, LLC since 2009. Vice President of Evergreen Investment Management Company, LLC from 2008 to 2010. Assistant Vice President of Evergreen Investment Services, Inc. from 2004 to 2008. Manager of Fund Reporting and Control for Evergreen Investment Management Company, LLC from 2004 to 2010. | | |
| Jeremy DePalma1 (Born 1974) | | Assistant Treasurer, since 2009 | | Senior Vice President of Wells Fargo Funds Management, LLC since 2009. Senior Vice President of Evergreen Investment Management Company, LLC from 2008 to 2010. Vice President, Evergreen Investment Services, Inc. from 2004 to 2007. Head of the Fund Reporting and Control Team within Fund Administration from 2005 to 2010. | | |
| 1. | Nancy Wiser acts as Treasurer of 73 funds in the Fund Complex. Jeremy DePalma acts as Treasurer of 58 funds and Assistant Treasurer of 73 funds in the Fund Complex. |
| 2. | The Statement of Additional Information includes additional information about the Trustees and is available, without charge, upon request, by calling 1-800-222-8222 or by visiting the website at wellsfargoadvantagefunds.com. |
| | | | | | |
| Other information (unaudited) | | Wells Fargo Advantage Small Cap Value Fund | | | 31 | |
BOARD CONSIDERATION OF INVESTMENT ADVISORY AND SUBADVISORY AGREEMENTS:
Under Section 15 of the Investment Company Act of 1940 (the “1940 Act”), the Board of Trustees (the “Board”) of Wells Fargo Funds Trust (the “Trust”), all the members of which have no direct or indirect interest in the investment advisory and sub-advisory agreements and are not “interested persons” of the Trust, as defined in the 1940 Act (the “Independent Trustees”), must determine whether to approve the continuation of the Trust’s investment advisory and sub-advisory agreements. In this regard, at an in-person meeting held on March 28-29, 2013 (the “Meeting”), the Board reviewed: (i) an investment advisory agreement with Wells Fargo Funds Management, LLC (“Funds Management”) for Wells Fargo Advantage Small Cap Value Fund (the “Fund”) and (ii) an investment sub-advisory agreement with Wells Capital Management Incorporated (the “Sub-Adviser”), an affiliate of Funds Management, for the Fund. The investment advisory agreement with Funds Management and the investment sub-advisory agreement with the Sub-Adviser are collectively referred to as the “Advisory Agreements.”
At the Meeting, the Board considered the factors and reached the conclusions described below relating to the selection of Funds Management and the Sub-Adviser and the continuation of the Advisory Agreements. Prior to the Meeting, the Trustees conferred extensively among themselves and with representatives of Funds Management about these matters. The Board has adopted a team-based approach, with each team consisting of a sub-set of Trustees, to assist the Board in the discharge of its duties in reviewing performance and other matters throughout the year. The Independent Trustees were assisted in their evaluation of the Advisory Agreements by independent legal counsel, from whom they received separate legal advice and with whom they met separately.
In providing information to the Board, Funds Management and the Sub-Adviser were guided by a detailed set of requests for information submitted to them by independent legal counsel on behalf of the Independent Trustees at the start of the Board’s annual contract renewal process earlier in 2013. In considering and approving the Advisory Agreements, the Trustees considered the information they believed relevant, including but not limited to the information discussed below. The Board considered not only the specific information presented in connection with the Meeting, but also the knowledge gained over time through interaction with Funds Management and the Sub-Adviser about various topics. In this regard, the Board reviewed reports of Funds Management at each of its quarterly meetings, which included, among other things, portfolio reviews and performance reports. In addition, the Board and the teams mentioned above confer with portfolio managers at various times throughout the year. The Board did not identify any particular information or consideration that was all-important or controlling, and each individual Trustee may have attributed different weights to various factors.
After its deliberations, the Board unanimously determined that the continuation of the Advisory Agreements is in the best interests of the Fund and its shareholders, and that the compensation payable to Funds Management and the Sub-Adviser is reasonable. The Board considered the continuation of the Advisory Agreements for the Fund as part of its consideration of the continuation of advisory agreements for funds across the complex, but each decision was made on a fund-by-fund basis. The following summarizes a number of important, but not necessarily all, factors considered by the Board in reaching its determination.
Nature, extent and quality of services
The Board received and considered various information regarding the nature, extent and quality of services provided to the Fund by Funds Management and the Sub-Adviser under the Advisory Agreements. This information included, among other things, a summary of the background and experience of senior management of Funds Management, and the qualifications, background, tenure and responsibilities of each of the portfolio managers primarily responsible for the day-to-day portfolio management of the Fund.
The Board evaluated the ability of Funds Management and the Sub-Adviser, based on attributes such as their financial condition, resources and reputation, to attract and retain qualified investment professionals, including research, advisory and supervisory personnel. The Board further considered the compliance programs and compliance records of Funds Management and the Sub-Adviser. In addition, the Board took into account the administrative and other services provided to the Fund by Funds Management and its affiliates and Funds Management’s oversight of the Fund’s various service providers.
Fund performance and expenses
The Board considered the performance results for the Fund over various time periods ended December 31, 2012. The Board also considered these results in comparison to the performance of funds in a universe that was determined by Lipper Inc. (“Lipper”) to be similar to the Fund (the “Universe”), and in comparison to the Fund’s benchmark index and to other comparative data. Lipper is an independent provider of investment company data. The Board received a description of the methodology used by Lipper to select the mutual funds in the performance Universe. The Board noted
| | | | |
| 32 | | Wells Fargo Advantage Small Cap Value Fund | | Other information (unaudited) |
that the performance of the Fund (Class A) was higher than or in range of the median performance of the Universe for the five- and ten-year periods under review, and lower than the median performance of the Universe for the one- and three-year periods under review. The Board also noted that the performance of the Fund was higher than or in range of its benchmark, the Russell 2000® Value Index, for the five- and ten-year periods under review, and lower than its benchmark for the one- and three-year periods under review.
The Board received information concerning, and discussed factors contributing to, the underperformance of the Fund relative to the Universe and the benchmark for the one- and three-year periods under review. Funds Management advised the Board about the market conditions and investment decisions that it believed contributed to the underperformance during that period. Funds Management advised the Board that the Fund’s performance was affected by underperformance in the consumer discretionary sector, and market and performance volatility. The Board also noted that the Lipper category for the Fund was changed from Mid-Cap Core to Small-Cap Core. The Board was satisfied with the explanation it received.
The Board received and considered information regarding the Fund’s net operating expense ratios and their various components, including actual management fees (which reflect fee waivers, if any, and include advisory, administration and transfer agent fees), custodian and other non-management fees, Rule 12b-1 and non-Rule 12b-1 service fees and fee waiver and expense reimbursement arrangements. The Board also considered these ratios in comparison to the median ratios of funds in class-specific expense groups that were determined by Lipper to be similar to the Fund (the “Groups”). The Board received a description of the methodology used by Lipper to select the mutual funds in the expense Groups. Based on the Lipper reports, the Board noted that the net operating expense ratios of the Fund were lower than or in range of the median net operating expense ratios of the expense Groups for all classes of the Fund except for the Investor Class. However, the Board viewed favorably the agreed-upon reduction in the operating expense ratio cap of the Fund’s Investor Class.
Based on its consideration of the factors and information it deemed relevant, including those described here, the Board concluded that the overall performance and expense structure of the Fund supported the re-approval of the Advisory Agreements.
Investment advisory and sub-advisory fee rates
The Board reviewed and considered the contractual investment advisory fee rates that are payable by the Fund to Funds Management for investment advisory services (the “Advisory Agreement Rates”), both on a stand-alone basis and on a combined basis with the Fund’s fund-level and class-level contractual administration fee rates (the “Management Rates”). The Board noted that the administration fees include transfer agency costs. The Board also reviewed and considered the contractual investment sub-advisory fee rates that are payable by Funds Management to the Sub-Adviser for investment sub-advisory services (the “Sub-Advisory Agreement Rates”).
Among other information reviewed by the Board was a comparison of the Management Rates of the Fund with those of other funds in the expense Groups at a common asset level. The Board noted that the Management Rates of the Fund were higher than the median rates for the Fund’s expense Groups. The Board and Funds Management agreed to revise the advisory fee schedule for the Fund by adding an additional breakpoint. The Board also viewed favorably the agreed-upon reduction in the net operating expense ratio cap of the Fund’s Investor Class.
The Board also received and considered information about the portion of the total advisory fee that was retained by Funds Management after payment of the fee to the Sub-Adviser for sub-advisory services. In assessing the reasonableness of this amount, the Board received and evaluated information concerning the nature and extent of responsibilities retained and risks assumed by Funds Management and not delegated to or assumed by the Sub-Adviser, and about Funds Management’s on-going oversight services. In recognition of the fact that the Wells Fargo enterprise provides a suite of combined advisory and sub-advisory services to the Fund through affiliated entities, the Board ascribed limited relevance to the allocation of the total advisory fee between Funds Management and the Sub-Adviser.
The Board also received and considered information about the nature and extent of services offered and fee rates charged by Funds Management and the Sub-Adviser to other types of clients. In this regard, the Board received information about the significantly greater scope of services, and compliance, reporting and other legal burdens and risks of managing mutual funds compared with those associated with managing assets of non-mutual fund clients such as collective funds or institutional separate accounts.
Based on its consideration of the factors and information it deemed relevant, including those described here, the Board determined that the Advisory Agreement Rates and the Sub-Advisory Agreement Rates were reasonable in light of the services covered by the Advisory Agreements.
| | | | | | |
| Other information (unaudited) | | Wells Fargo Advantage Small Cap Value Fund | | | 33 | |
Profitability
The Board received and considered information concerning the profitability of Funds Management, as well as the profitability of Wells Fargo as a whole, from providing services to the Fund. The Board did not receive or consider to be necessary separate profitability information with respect to the Sub-Adviser, because, as an affiliate of Funds Management, its profitability information was subsumed in the collective Wells Fargo profitability analysis provided by Funds Management.
Funds Management explained the methodologies and estimates that it used in calculating the profitability from the Fund and the fund family as a whole. Among other things, the Board noted that the levels of profitability reported on a fund-by-fund basis varied widely, depending on factors such as the size and type of fund. Based on its review, the Board did not deem the profits reported by Funds Management to be at a level that would prevent it from approving the continuation of the Advisory Agreements.
Economies of scale
With respect to possible economies of scale, the Board reviewed the breakpoints in the Fund’s advisory fee and administration fee structure, which operate generally to reduce the Fund’s expense ratios as the Fund grows in size. It considered that, for a small fund or a fund that shrinks in size, breakpoints conversely can result in higher fee levels. The Board also considered fee waiver and expense reimbursement arrangements as a means of sharing potential economies of scale with the Fund. The Board also took into account the agreed-upon revision to the advisory fee schedule for the Fund that adds an additional breakpoint. The Board acknowledged the inherent limitations of any analysis of potential economies of scale and of any attempt to correlate breakpoints with such economies. Nonetheless, the Board concluded that the breakpoints and net operating expense ratio caps appeared to be a reasonable approach to sharing potential economies of scale with the Fund.
Other benefits to Funds Management and the Sub-Adviser
The Board received and considered information regarding potential “fall-out” or ancillary benefits received by Funds Management and its affiliates, including the Sub-Adviser, as a result of their relationship with the Fund. Ancillary benefits could include, among others, benefits directly attributable to other relationships with the Fund and benefits potentially derived from an increase in Funds Management’s and the Sub-Adviser’s business as a result of their relationship with the Fund (such as the ability to market to shareholders other financial products and services offered by Funds Management and its affiliates, including the Sub-Adviser, or to operate other products and services that follow investment strategies similar to those of the Fund).
The Board considered that Wells Fargo Funds Distributor, LLC, an affiliate of Funds Management, serves as distributor to the Fund and receives certain compensation for those services. The Board noted that various financial institutions, including affiliates of Funds Management, may receive distribution-related fees, shareholder servicing payments (including amounts derived from payments under Rule 12b-1 plans) and sub-transfer agency fees in respect of shares sold or held through them and services provided.
The Board also reviewed information about whether and to what extent soft dollar credits are sought and how any such credits are utilized, and any benefits that might be realized by an affiliated broker that handles portfolio transactions for the Fund.
Based on its consideration of the factors and information it deemed relevant, including those described here, the Board did not find that any ancillary benefits received by Funds Management and its affiliates, including the Sub-Adviser, were unreasonable.
Conclusion
After considering the above-described factors and based on its deliberations and its evaluation of the information described above, the Board unanimously approved the continuation of the Advisory Agreements for an additional one-year period.
| | | | |
| 34 | | Wells Fargo Advantage Small Cap Value Fund | | List of abbreviations |
The following is a list of common abbreviations for terms and entities that may have appeared in this report.
| ACA | — ACA Financial Guaranty Corporation |
| ADR | — American depositary receipt |
| ADS | — American depositary shares |
| AGC | — Assured Guaranty Corporation |
| AGM | — Assured Guaranty Municipal |
| Ambac | — Ambac Financial Group Incorporated |
| AMT | — Alternative minimum tax |
| BAN | — Bond anticipation notes |
| BHAC | — Berkshire Hathaway Assurance Corporation |
| CAB | — Capital appreciation bond |
| CCAB | — Convertible capital appreciation bond |
| CDA | — Community Development Authority |
| CDO | — Collateralized debt obligation |
| COP | — Certificate of participation |
| DRIVER | — Derivative inverse tax-exempt receipts |
| DW&P | — Department of Water & Power |
| DWR | — Department of Water Resources |
| ECFA | — Educational & Cultural Facilities Authority |
| EDA | — Economic Development Authority |
| EDFA | — Economic Development Finance Authority |
| ETF | — Exchange-traded fund |
| FDIC | — Federal Deposit Insurance Corporation |
| FFCB | — Federal Farm Credit Banks |
| FGIC | — Financial Guaranty Insurance Corporation |
| FHA | — Federal Housing Administration |
| FHLB | — Federal Home Loan Bank |
| FHLMC | — Federal Home Loan Mortgage Corporation |
| FICO | — The Financing Corporation |
| FNMA | — Federal National Mortgage Association |
| GDR | — Global depositary receipt |
| GNMA | — Government National Mortgage Association |
| HCFR | — Healthcare facilities revenue |
| HEFA | — Health & Educational Facilities Authority |
| HEFAR | — Higher education facilities authority revenue |
| HFA | — Housing Finance Authority |
| HFFA | — Health Facilities Financing Authority |
| HUD | — Department of Housing and Urban Development |
| IDA | — Industrial Development Authority |
| IDAG | — Industrial Development Agency |
| IDR | — Industrial development revenue |
| KRW | — Republic of Korea won |
| LIBOR | — London Interbank Offered Rate |
| LLC | — Limited liability company |
| LLP | — Limited liability partnership |
| MBIA | — Municipal Bond Insurance Association |
| MFHR | — Multifamily housing revenue |
| MSTR | — Municipal securities trust receipts |
| MUD | — Municipal Utility District |
| National | — National Public Finance Guarantee Corporation |
| PCFA | — Pollution Control Financing Authority |
| PCL | — Public Company Limited |
| PCR | — Pollution control revenue |
| PFA | — Public Finance Authority |
| PFFA | — Public Facilities Financing Authority |
| PFOTER | — Puttable floating option tax-exempt receipts |
| plc | — Public limited company |
| PUTTER | — Puttable tax-exempt receipts |
| R&D | — Research & development |
| Radian | — Radian Asset Assurance |
| RAN | — Revenue anticipation notes |
| RDA | — Redevelopment Authority |
| RDFA | — Redevelopment Finance Authority |
| REIT | — Real estate investment trust |
| ROC | — Reset option certificates |
| SAVRS | — Select auction variable rate securities |
| SBA | — Small Business Authority |
| SFHR | — Single-family housing revenue |
| SFMR | — Single-family mortgage revenue |
| SPA | — Standby purchase agreement |
| SPDR | — Standard & Poor’s Depositary Receipts |
| STRIPS | — Separate trading of registered interest and principal securities |
| TAN | — Tax anticipation notes |
| TIPS | — Treasury inflation-protected securities |
| TRAN | — Tax revenue anticipation notes |
| TTFA | — Transportation Trust Fund Authority |
| TVA | — Tennessee Valley Authority |


For more information
More information about Wells Fargo Advantage Funds is available free upon request. To obtain literature, please write, email, visit the Fund’s website, or call:
Wells Fargo Advantage Funds
P.O. Box 8266
Boston, MA 02266-8266
Email: wfaf@wellsfargo.com
Website: wellsfargoadvantagefunds.com
Individual investors: 1-800-222-8222
Retail investment professionals: 1-888-877-9275
Institutional investment professionals: 1-866-765-0778
This report and the financial statements contained herein are submitted for the general information of the shareholders of Wells Fargo Advantage Funds. If this report is used for promotional purposes, distribution of the report must be accompanied or preceded by a current prospectus. For a current prospectus and, if available, a summary prospectus containing more complete information, including charges and expenses, call 1-800-222-8222 or visit the Fund’s website at wellsfargoadvantagefunds.com. Please consider the investment objectives, risks, charges, and expenses of the investment carefully before investing. This and other information about Wells Fargo Advantage Funds can be found in the current prospectus. Read the prospectus carefully before you invest or send money.
Wells Fargo Funds Management, LLC, a wholly owned subsidiary of Wells Fargo & Company, provides investment advisory and administrative services for Wells Fargo Advantage Funds. Other affiliates of Wells Fargo & Company provide subadvisory and other services for the Funds. The Funds are distributed by Wells Fargo Funds Distributor, LLC, Member FINRA/SIPC, an affiliate of Wells Fargo & Company.
NOT FDIC INSURED ¡ NO BANK GUARANTEE ¡ MAY LOSE VALUE
© 2013 Wells Fargo Funds Management, LLC. All rights reserved.
| | |
 | | 216839 06-13 SA244/SAR244 4-13 |

Wells Fargo Advantage
Small/Mid Cap Value Fund

Semi-Annual Report
April 30, 2013

Reduce clutter. Save trees.
Sign up for electronic delivery of prospectuses and shareholder reports at wellsfargo.com/advantagedelivery
Contents
The views expressed and any forward-looking statements are as of April 30, 2013, unless otherwise noted, and are those of the Fund managers and/or Wells Fargo Funds Management, LLC. Discussions of individual securities, or the markets generally, or any Wells Fargo Advantage Fund are not intended as individual recommendations. Future events or results may vary significantly from those expressed in any forward-looking statements; the views expressed are subject to change at any time in response to changing circumstances in the market. Wells Fargo Funds Management, LLC, disclaims any obligation to publicly update or revise any views expressed or forward-looking statements.
NOT FDIC INSURED ¡ NO BANK GUARANTEE ¡ MAY LOSE VALUE

Wells Fargo investment history
| | |
| 1932 | | Keystone creates one of the first mutual fund families. |
| 1971 | | Wells Fargo & Company introduces one of the first institutional index funds. |
| 1978 | | Wells Fargo applies Markowitz and Sharpe’s research on Modern Portfolio Theory to introduce one of the industry’s first tactical asset allocation models in institutional separately managed accounts. |
| 1984 | | Wells Fargo Stagecoach Funds launches its first asset allocation fund. |
| 1989 | | The Tactical Asset Allocation (TAA) Model is first applied to Wells Fargo’s asset allocation mutual funds. |
| 1994 | | Wells Fargo introduces the LifePath Funds, one of the first suites of target date funds (now the Wells Fargo Advantage Dow Jones Target Date FundsSM). |
| 1996 | | Evergreen Investments and Keystone Funds merge. |
| 1997 | | Wells Fargo launches the Wells Fargo Advantage WealthBuilder PortfoliosSM, a fund-of-funds suite of products that includes the use of quantitative models to shift assets among investment styles. |
| 1999 | | Norwest Advantage Funds and Stagecoach Funds are reorganized into Wells Fargo Funds after the merger of Norwest and Wells Fargo. |
| 2002 | | Evergreen Retail and Evergreen Institutional companies form the umbrella asset management company, Evergreen Investments. |
| 2005 | | The integration of Strong Funds with Wells Fargo Funds creates Wells Fargo Advantage Funds, resulting in one of the top 20 mutual fund companies in the United States. |
| 2006 | | Wells Fargo Advantage Funds relaunches the target date product line as Wells Fargo Advantage Dow Jones Target Date Funds. |
| 2010 | | The mergers and reorganizations of Evergreen and Wells Fargo Advantage mutual funds are completed, unifying the families under the brand of Wells Fargo Advantage Funds. |
Wells Fargo Advantage Funds®
Wells Fargo Advantage Funds skillfully guides institutions, financial advisors, and individuals through the investment terrain to help them reach their financial objectives. Everything we do on behalf of investors is backed by our unique combination of qualifications.
Strength
Our organization is built on the standards of integrity and service established by our parent company—Wells Fargo & Company—more than 150 years ago. And, because we’re part of a highly diversified financial enterprise, we offer the depth of resources to help investors succeed.
Expertise
Our multi-boutique model offers investors access to the independent thinking of premier investment managers that have been chosen for their time-tested strategies. While each team specializes in a specific investment strategy, collectively they provide investors a wide choice of distinct investment styles. Our dedication to investment excellence doesn’t end with our expertise in manager selection—risk management, analysis, and rigorous ongoing review seek to ensure each manager’s investment process remains consistent.
Partnership
Our collaborative approach is built around understanding the needs and goals of our clients. By adhering to core principles of sound judgment and steady guidance, we support you through every stage of the investment decision process.
Carefully consider the investment objectives, risks, charges, and expenses before investing. For a current prospectus and, if available, a summary prospectus, for Wells Fargo Advantage Funds, containing this and other information, visit wellsfargoadvantagefunds.com. Read it carefully before investing.
Wells Fargo Funds Management, LLC, a wholly owned subsidiary of Wells Fargo & Company, provides investment advisory and administrative services for Wells Fargo Advantage Funds. Other affiliates of Wells Fargo & Company provide subadvisory and other services for the Funds. The Funds are distributed by Wells Fargo Funds Distributor, LLC, Member FINRA/SIPC, an affiliate of Wells Fargo & Company.
“Dow Jones®” and “Dow Jones Target Date IndexesSM” are service marks of Dow Jones Trademark Holdings LLC (“Dow Jones”); have been licensed to CME Group Index Services LLC (“CME Indexes”); and have been sublicensed for use for certain purposes by Global Index Advisors, Inc., and Wells Fargo Funds Management, LLC. The Wells Fargo Advantage Dow Jones Target Date FundsSM, based on the Dow Jones Target Date Indexes, are not sponsored, endorsed, sold, or promoted by Dow Jones, CME Indexes, or their respective affiliates, and none of them makes any representation regarding the advisability of investing in such product(s).
NOT FDIC INSURED ¡ NO BANK GUARANTEE ¡ MAY LOSE VALUE
Not part of the semi-annual report.
Wells Fargo Advantage Funds offers more than 100 mutual funds across a wide range of asset classes, representing over $228 billion in assets under management, as of April 30, 2013.
| | | | |
| Equity funds | | | | |
Asia Pacific Fund | | Enterprise Fund† | | Opportunity Fund† |
C&B Large Cap Value Fund | | Global Opportunities Fund | | Precious Metals Fund |
C&B Mid Cap Value Fund | | Growth Fund | | Premier Large Company Growth Fund |
Capital Growth Fund | | Index Fund | | Small Cap Opportunities Fund |
Common Stock Fund | | International Equity Fund | | Small Cap Value Fund |
Disciplined U.S. Core Fund | | International Value Fund | | Small Company Growth Fund |
Discovery Fund† | | Intrinsic Small Cap Value Fund | | Small Company Value Fund |
Diversified Equity Fund | | Intrinsic Value Fund | | Small/Mid Cap Value Fund |
Diversified International Fund | | Intrinsic World Equity Fund | | Special Mid Cap Value Fund |
Emerging Growth Fund | | Large Cap Core Fund | | Special Small Cap Value Fund |
Emerging Markets Equity Fund | | Large Cap Growth Fund | | Specialized Technology Fund |
Emerging Markets Equity Income Fund | | Large Company Value Fund | | Traditional Small Cap Growth Fund |
Endeavor Select Fund† | | Omega Growth Fund | | Utility and Telecommunications Fund |
| Bond funds | | | | |
Adjustable Rate Government Fund | | High Yield Municipal Bond Fund | | Short-Term Bond Fund |
California Limited-Term Tax-Free Fund | | Income Plus Fund | | Short-Term High Yield Bond Fund |
California Tax-Free Fund | | Inflation-Protected Bond Fund | | Short-Term Municipal Bond Fund |
Colorado Tax-Free Fund | | Intermediate Tax/AMT-Free Fund | | Strategic Income Fund |
Conservative Income Fund | | International Bond Fund | | Strategic Municipal Bond Fund |
Core Bond Fund | | Minnesota Tax-Free Fund | | Ultra Short-Term Income Fund |
Emerging Markets Local Bond Fund | | Municipal Bond Fund | | Ultra Short-Term Municipal Income Fund |
Government Securities Fund | | North Carolina Tax-Free Fund | | Wisconsin Tax-Free Fund |
High Income Fund | | Pennsylvania Tax-Free Fund | | |
High Yield Bond Fund | | Short Duration Government Bond Fund | | |
| Asset allocation funds | | | | |
Absolute Return Fund | | WealthBuilder Equity Portfolio† | | Target 2020 Fund† |
Asset Allocation Fund | | WealthBuilder Growth Allocation Portfolio† | | Target 2025 Fund† |
Diversified Capital Builder Fund | | WealthBuilder Growth Balanced Portfolio† | | Target 2030 Fund† |
Diversified Income Builder Fund | | WealthBuilder Moderate Balanced Portfolio† | | Target 2035 Fund† |
Growth Balanced Fund | | WealthBuilder Tactical Equity Portfolio† | | Target 2040 Fund† |
Index Asset Allocation Fund | | Target Today Fund† | | Target 2045 Fund† |
Moderate Balanced Fund | | Target 2010 Fund† | | Target 2050 Fund† |
WealthBuilder Conservative Allocation Portfolio† | | Target 2015 Fund† | | Target 2055 Fund† |
| Money market funds | | | | |
100% Treasury Money Market Fund | | Heritage Money Market Fund† | | National Tax-Free Money Market Fund |
California Municipal Money Market Fund | | Money Market Fund | | Treasury Plus Money Market Fund |
Cash Investment Money Market Fund | | Municipal Cash Management Money Market Fund | | |
Government Money Market Fund | | Municipal Money Market Fund | | |
| Variable trust funds1 | | | | |
VT Discovery Fund† | | VT Intrinsic Value Fund | | VT Small Cap Growth Fund |
VT Index Asset Allocation Fund | | VT Omega Growth Fund | | VT Small Cap Value Fund |
VT International Equity Fund | | VT Opportunity Fund† | | VT Total Return Bond Fund |
An investment in a money market fund is not insured or guaranteed by the Federal Deposit Insurance Corporation or any other government agency. Although the Wells Fargo Advantage Money Market Funds seek to preserve the value of your investment at $1.00 per share, it is possible to lose money by investing in a money market fund.
| 1. | The variable trust funds are generally available only through insurance company variable contracts. |
| † | In this report, the Wells Fargo Advantage Discovery FundSM, Wells Fargo Advantage Endeavor Select FundSM, Wells Fargo Advantage Enterprise FundSM, Wells Fargo Advantage Opportunity FundSM, Wells Fargo Advantage WealthBuilder Conservative Allocation PortfolioSM, Wells Fargo Advantage WealthBuilder Equity PortfolioSM, Wells Fargo Advantage WealthBuilder Growth Allocation PortfolioSM, Wells Fargo Advantage WealthBuilder Growth Balanced PortfolioSM, Wells Fargo Advantage WealthBuilder Moderate Balanced PortfolioSM, Wells Fargo Advantage WealthBuilder Tactical Equity PortfolioSM, Wells Fargo Advantage Dow Jones Target Today FundSM, Wells Fargo Advantage Dow Jones Target 2010 FundSM, Wells Fargo Advantage Dow Jones Target 2015 FundSM, Wells Fargo Advantage Dow Jones Target 2020 FundSM, Wells Fargo Advantage Dow Jones Target 2025 FundSM, Wells Fargo Advantage Dow Jones Target 2030 FundSM, Wells Fargo Advantage Dow Jones Target 2035 FundSM, Wells Fargo Advantage Dow Jones Target 2040 FundSM, Wells Fargo Advantage Dow Jones Target 2045 FundSM, Wells Fargo Advantage Dow Jones Target 2050 FundSM, Wells Fargo Advantage Dow Jones Target 2055 FundSM, Wells Fargo Advantage Heritage Money Market FundSM, Wells Fargo Advantage VT Discovery FundSM, and Wells Fargo Advantage VT Opportunity FundSM are referred to as the Discovery Fund, Endeavor Select Fund, Enterprise Fund, Opportunity Fund, WealthBuilder Conservative Allocation Portfolio, WealthBuilder Equity Portfolio, WealthBuilder Growth Allocation Portfolio, WealthBuilder Growth Balanced Portfolio, WealthBuilder Moderate Balanced Portfolio, WealthBuilder Tactical Equity Portfolio, Target Today Fund, Target 2010 Fund, Target 2015 Fund, Target 2020 Fund, Target 2025 Fund, Target 2030 Fund, Target 2035 Fund, Target 2040 Fund, Target 2045 Fund, Target 2050 Fund, Target 2055 Fund, Heritage Money Market Fund, VT Discovery Fund, and VT Opportunity Fund, respectively. |
Not part of the semi-annual report.
| | | | |
| 2 | | Wells Fargo Advantage Small/Mid Cap Value Fund | | Letter to shareholders (unaudited) |

Karla M. Rabusch
President
Wells Fargo Advantage Funds
Relatively improving economic data in the U.S. and efforts by European authorities to address the sovereign debt issue alleviated investor fears and supported global stock markets.
Dear Valued Shareholder:
We are pleased to offer you this semi-annual report for the Wells Fargo Advantage Small/Mid Cap Value Fund for the six-month period that ended April 30, 2013. Much of the six-month period was marked by continued concerns about the possible effects that the ongoing European sovereign debt crisis would have on the global economy. However, relatively improving economic data in the U.S. and efforts by European authorities to address the sovereign debt issue alleviated investor fears and supported global stock markets. This backdrop enabled most equity asset classes to generate positive returns. For the six-month period, the small-cap-oriented Russell 2000® Index1 returned 16.58%, while the mid-cap-focused Russell Midcap® Index2 posted an 18.90% total return.
The U.S. economy improved with the support of accommodative monetary policy.
The U.S. economy grew modestly, but the recovery remained weak compared with previous business cycles. Curtailed government spending and weak household income expectations were economic headwinds. However, the unemployment rate continued to decline, reaching 7.5% in April 2013, and housing market activity, as measured by many metrics—sales, building permits, and prices—continued to improve from its recessionary levels.
Citing its dual mandate of fostering maximum employment and price stability, the U.S. Federal Reserve (Fed) reaffirmed its commitment to highly accommodative monetary policy. In addition, the Fed formally announced that exceptionally low interest rates would be appropriate at least as long as the unemployment rate remains above 6.5% and inflation remains no more than half a percentage point above its 2.0% inflation target.
The Fed also continued its quantitative easing program. Just prior to the beginning of the reporting period, the Federal Open Market Committee announced its intention to keep interest rates low until at least mid-2015 in order to support the sluggish economy. The Fed also announced open-ended purchases of $40 billion per month in mortgage-backed securities in an effort to support the housing market.
The global economy continues to be affected by bouts of uncertainty, including political questions in the U.S., Europe, and China.
Global economic growth varied across countries. Eurozone economies remained in recession. However, the European Central Bank (ECB) and several key members of the eurozone, including France and Germany, continued their commitment to maintaining a single currency. Subsequently, investor fears about a sovereign debt crisis in Europe abated. Furthermore, the ECB maintained its accommodative monetary policy by lowering its key rate at a historic low of 0.75%.
For most of the six-month period, uncertainty about political outcomes was a constant. U.S. presidential elections in November 2012, the debate over the fiscal
| 1. | The Russell 2000® Index measures the performance of the 2,000 smallest companies in the Russell 3000® Index, which represents approximately 8% of the total market capitalization of the Russell 3000 Index. You cannot invest directly in an index. |
| 2. | The Russell Midcap® Index measures the performance of the 800 smallest companies in the Russell 1000® Index, which represent approximately 25% of the total market capitalization of the Russell 1000 Index. You cannot invest directly in an index. |
| | | | | | |
| Letter to shareholders (unaudited) | | Wells Fargo Advantage Small/Mid Cap Value Fund | | | 3 | |
cliff and tax rates at year-end, and speculation about the effects of sequestration at the end of February 2013 weighed on business leaders and investors. Elections in eurozone countries such as Greece, France, and Italy sparked speculation about the future of the eurozone. New leadership in China also figured into the political landscape. In the end, investors managed around these concerns, and capital markets generally advanced during this time period.
Our goal is to meet the financial needs of our shareholders.
We are committed to providing our shareholders long-term investment strategies and focusing on appropriate risk while seeking to deliver consistent returns. We know that your ability to meet your long-term investment goals depends on the investment decisions you make today. Despite economic uncertainties and investment challenges, staying invested and adapting to emerging opportunities and threats will help you manage investment risk.
Thank you for choosing to invest with Wells Fargo Advantage Funds. We appreciate your confidence in us and remain committed to helping you meet your financial needs. For current information about your fund investments, contact your investment professional, visit our website at wellsfargoadvantagefunds.com, or call us directly at 1-800-222-8222. We are available 24 hours a day, 7 days a week.
Sincerely,

Karla M. Rabusch
President
Wells Fargo Advantage Funds
Despite economic uncertainties and investment challenges, staying invested and adapting to emerging opportunities and threats will help you manage investment risk.
| | | | |
| 4 | | Wells Fargo Advantage Small/Mid Cap Value Fund | | Performance highlights (unaudited) |
Investment objective
The Fund seeks long-term capital appreciation.
Adviser
Wells Fargo Funds Management, LLC
Subadviser
Wells Capital Management Incorporated
Portfolio managers
Erik C. Astheimer
I. Charles Rinaldi
Michael Schneider, CFA
Average annual total returns1 (%) as of April 30, 2013
| | | | | | | | | | | | | | | | | | | | | | | | | | | | | | | | | | |
| | | | | Including sales charge | | | Excluding sales charge | | | Expense ratios2 (%) | |
| | | Inception date | | 1 year | | | 5 year | | | 10 year | | | 1 year | | | 5 year | | | 10 year | | | Gross | | | Net3 | |
| Class A (WFVAX) | | 7-31-2007 | | | 0.23 | | | | 1.71 | | | | 9.42 | | | | 6.35 | | | | 2.92 | | | | 10.07 | | | | 1.42 | | | | 1.41 | |
| Class C (WFCVX) | | 7-31-2007 | | | 4.54 | | | | 2.18 | | | | 9.41 | | | | 5.54 | | | | 2.18 | | | | 9.41 | | | | 2.17 | | | | 2.16 | |
| Administrator Class (WWMDX) | | 4-8-2005 | | | – | | | | – | | | | – | | | | 6.63 | | | | 3.19 | | | | 10.34 | | | | 1.26 | | | | 1.16 | |
| Institutional Class (WWMSX) | | 8-31-2006 | | | – | | | | – | | | | – | | | | 6.90 | | | | 3.40 | | | | 10.48 | | | | 0.99 | | | | 0.96 | |
| Investor Class (SMMVX) | | 3-28-2002 | | | – | | | | – | | | | – | | | | 6.33 | | | | 2.86 | | | | 10.03 | | | | 1.48 | | | | 1.47 | |
| Russell 2500™ Value Index4 | | – | | | – | | | | – | | | | – | | | | 22.25 | | | | 7.90 | | | | 11.20 | | | | – | | | | – | |
Figures quoted represent past performance, which is no guarantee of future results and do not reflect the deduction of taxes that a shareholder may pay on fund distributions or the redemption of fund shares. Investment return and principal value of an investment will fluctuate so that an investor’s shares, when redeemed, may be worth more or less than their original cost. Performance shown without sales charges would be lower if sales charges were reflected. Current performance may be lower or higher than the performance data quoted, which assumes the reinvestment of dividends and capital gains. Current month-end performance is available on the Fund’s website, wellsfargoadvantagefunds.com.
Index returns do not include transaction costs associated with buying and selling securities, any mutual fund fees or expenses, or any taxes. It is not possible to invest directly in an index.
For Class A shares, the maximum front-end sales charge is 5.75%. For Class C shares, the maximum contingent deferred sales charge is 1.00%. Performance including sales charge assumes the sales charge for the corresponding time period. Administrator Class, Institutional Class, and Investor Class shares are sold without a front-end sales charge or contingent deferred sales charge.
Stock values fluctuate in response to the activities of individual companies and general market and economic conditions. Smaller-company stocks tend to be more volatile and less liquid than those of larger companies. The use of derivatives may reduce returns and/or increase volatility. Certain investment strategies tend to increase the total risk of an investment (relative to the broader market). The Fund is exposed to foreign investment risk. Consult the Fund’s prospectus for additional information on these and other risks.
Please see footnotes on page 5.
| | | | | | |
| Performance highlights (unaudited) | | Wells Fargo Advantage Small/Mid Cap Value Fund | | | 5 | |
|
| Sector distribution6 as of April 30, 2013 |
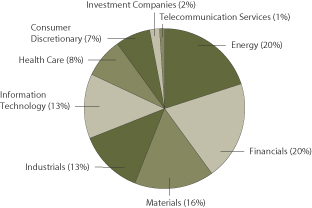
|
| | | | |
| Ten largest equity holdings5 (%) as of April 30, 2013 | |
InterOil Corporation | | | 8.40 | |
Randgold Resources Limited ADR | | | 5.26 | |
Chimera Investment Corporation | | | 4.09 | |
Trilogy Energy Corporation | | | 2.09 | |
UMH Properties Incorporated | | | 2.05 | |
Argo Group International Holdings Limited | | | 1.86 | |
Gentex Corporation | | | 1.80 | |
Official Payments Holdings Incorporated | | | 1.73 | |
Newpark Resources Incorporated | | | 1.55 | |
Micron Technology Incorporated | | | 1.53 | |
| 1. | Historical performance shown for Class A and the Administrator Class shares prior to their inception reflects the performance of the Investor Class shares, and includes the higher expenses applicable to the Investor Class shares. If these expenses had not been included, returns would be higher. Historical performance shown for Class C shares prior to their inception reflects the performance of the Investor Class shares, adjusted to reflect the higher expenses applicable to Class C shares. Historical performance shown for the Institutional Class shares prior to their inception reflects the performance of the Administrator Class shares, and includes the higher expenses applicable to the Administrator Class shares. If these expenses had not been included, returns would be higher. |
| 2. | Reflects the expense ratios as stated in the most recent prospectuses. |
| 3. | The Adviser has committed through February 28, 2014, to waive fees and/or reimburse expenses to the extent necessary to cap the Fund’s Total Annual Fund Operating Expenses After Fee Waiver, excluding certain expenses, at 1.40% for Class A, 2.15% for Class C, 1.15% for Administrator Class, 0.95% for Institutional Class, and 1.46% for Investor Class. Brokerage commissions, stamp duty fees, interest, taxes, acquired fund fees and expenses, and extraordinary expenses are excluded from the cap. Without this cap, the Fund’s returns would have been lower. |
| 4. | The Russell 2500TM Value Index measures the performance of those Russell 2500TM companies with lower price-to-book ratios and lower forecasted growth values. You cannot invest directly in an index. |
| 5. | The ten largest equity holdings are calculated based on the value of the securities divided by total net assets of the Fund. Holdings are subject to change and may have changed since the date specified. |
| 6. | Sector distribution is subject to change and is calculated based on the total long-term investments of the Fund. |
| | | | |
| 6 | | Wells Fargo Advantage Small/Mid Cap Value Fund | | Fund expenses (unaudited) |
As a shareholder of the Fund, you incur two types of costs: (1) transaction costs, including sales charges (loads) on purchase payments and contingent deferred sales charges (if any) on redemptions and (2) ongoing costs, including management fees, distribution (12b-1) and/or shareholder service fees, and other Fund expenses. This example is intended to help you understand your ongoing costs (in dollars) of investing in the Fund and to compare these costs with the ongoing costs of investing in other mutual funds.
The example is based on an investment of $1,000 invested at the beginning of the six-month period and held for the entire period from November 1, 2012 to April 30, 2013.
Actual expenses
The “Actual” line of the table below provides information about actual account values and actual expenses. You may use the information in this line, together with the amount you invested, to estimate the expenses that you paid over the period. Simply divide your account value by $1,000 (for example, an $8,600 account value divided by $1,000 = 8.6), then multiply the result by the number in the “Actual” line under the heading entitled “Expenses paid during period” for your applicable class of shares to estimate the expenses you paid on your account during this period.
Hypothetical example for comparison purposes
The “Hypothetical” line of the table below provides information about hypothetical account values and hypothetical expenses based on the Fund’s actual expense ratio and an assumed rate of return of 5% per year before expenses, which is not the Fund’s actual return. The hypothetical account values and expenses may not be used to estimate the actual ending account balance or expenses you paid for the period. You may use this information to compare the ongoing costs of investing in the Fund and other funds. To do so, compare this 5% hypothetical example with the 5% hypothetical examples that appear in the shareholder reports of the other funds.
Please note that the expenses shown in the table are meant to highlight your ongoing costs only and do not reflect any transactional costs, such as sales charges (loads) and contingent deferred sales charges. Therefore, the “Hypothetical” line of the table is useful in comparing ongoing costs only and will not help you determine the relative total costs of owning different funds. In addition, if these transactional costs were included, your costs would have been higher.
| | | | | | | | | | | | | | | | |
| | | Beginning
account value
11-1-2012 | | | Ending
account value
4-30-2013 | | | Expenses
paid during
the period¹ | | | Net annual
expense ratio | |
Class A | | | | | | | | | | | | | | | | |
Actual | | $ | 1,000.00 | | | $ | 1,012.88 | | | $ | 6.99 | | | | 1.40 | % |
Hypothetical (5% return before expenses) | | $ | 1,000.00 | | | $ | 1,017.85 | | | $ | 7.00 | | | | 1.40 | % |
Class C | | | | | | | | | | | | | | | | |
Actual | | $ | 1,000.00 | | | $ | 1,009.47 | | | $ | 10.71 | | | | 2.15 | % |
Hypothetical (5% return before expenses) | | $ | 1,000.00 | | | $ | 1,014.13 | | | $ | 10.74 | | | | 2.15 | % |
Administrator Class | | | | | | | | | | | | | | | | |
Actual | | $ | 1,000.00 | | | $ | 1,014.46 | | | $ | 5.74 | | | | 1.15 | % |
Hypothetical (5% return before expenses) | | $ | 1,000.00 | | | $ | 1,019.09 | | | $ | 5.76 | | | | 1.15 | % |
Institutional Class | | | | | | | | | | | | | | | | |
Actual | | $ | 1,000.00 | | | $ | 1,015.97 | | | $ | 4.75 | | | | 0.95 | % |
Hypothetical (5% return before expenses) | | $ | 1,000.00 | | | $ | 1,020.08 | | | $ | 4.76 | | | | 0.95 | % |
Investor Class | | | | | | | | | | | | | | | | |
Actual | | $ | 1,000.00 | | | $ | 1,013.50 | | | $ | 7.29 | | | | 1.46 | % |
Hypothetical (5% return before expenses) | | $ | 1,000.00 | | | $ | 1,017.55 | | | $ | 7.30 | | | | 1.46 | % |
| 1. | Expenses paid is equal to the annualized expense ratio of each class multiplied by the average account value over the period, multiplied by the number of days in the most recent fiscal half-year divided by the number of days in the fiscal year (to reflect the one-half-year period). |
| | | | | | |
| Portfolio of investments—April 30, 2013 (unaudited) | | Wells Fargo Advantage Small/Mid Cap Value Fund | | | 7 | |
| | | | | | | | | | | | |
| Security name | | | | | | Shares | | | Value | |
| | | | | | | | | | | | |
| | | | |
Common Stocks: 98.30% | | | | | | | | | | | | |
| | | | |
Consumer Discretionary: 7.03% | | | | | | | | | | | | |
| | | | |
| Auto Components: 1.80% | | | | | | | | | | | | |
Gentex Corporation | | | | | | | 161,500 | | | $ | 3,633,750 | |
| | | | | | | | | | | | |
| | | | |
| Hotels, Restaurants & Leisure: 1.56% | | | | | | | | | | | | |
Century Casinos Incorporated † | | | | | | | 947,900 | | | | 2,767,868 | |
Empire Resorts Incorporated † | | | | | | | 204,800 | | | | 391,168 | |
| | | | |
| | | | | | | | | | | 3,159,036 | |
| | | | | | | | | | | | |
| | | | |
| Household Durables: 1.32% | | | | | | | | | | | | |
Cavco Industries Incorporated † | | | | | | | 58,600 | | | | 2,673,332 | |
| | | | | | | | | | | | |
| | | | |
| Leisure Equipment & Products: 0.37% | | | | | | | | | | | | |
Black Diamond Incorporated † | | | | | | | 77,300 | | | | 757,540 | |
| | | | | | | | | | | | |
| | | | |
| Media: 1.98% | | | | | | | | | | | | |
Cinemark Holdings Incorporated | | | | | | | 26,400 | | | | 815,496 | |
Entravision Communications Corporation Class A | | | | | | | 511,300 | | | | 1,973,618 | |
Interpublic Group of Companies Incorporated | | | | | | | 88,200 | | | | 1,220,688 | |
| | | | |
| | | | | | | | | | | 4,009,802 | |
| | | | | | | | | | | | |
| | | | |
Consumer Staples: 0.41% | | | | | | | | | | | | |
| | | | |
| Household Products: 0.41% | | | | | | | | | | | | |
WD-40 Company | | | | | | | 15,100 | | | | 814,343 | |
| | | | | | | | | | | | |
| | | | |
Energy: 20.38% | | | | | | | | | | | | |
| | | | |
| Energy Equipment & Services: 5.53% | | | | | | | | | | | | |
Cal Dive International Incorporated † | | | | | | | 697,000 | | | | 1,163,990 | |
Helix Energy Solutions Group Incorporated † | | | | | | | 109,250 | | | | 2,517,120 | |
Helmerich & Payne Incorporated | | | | | | | 12,495 | | | | 732,457 | |
Key Energy Services Incorporated † | | | | | | | 136,200 | | | | 809,028 | |
Newpark Resources Incorporated † | | | | | | | 299,576 | | | | 3,145,548 | |
Parker Drilling Company † | | | | | | | 177,300 | | | | 730,476 | |
Willbros Group Incorporated † | | | | | | | 220,400 | | | | 2,093,800 | |
| | | | |
| | | | | | | | | | | 11,192,419 | |
| | | | | | | | | | | | |
| | | | |
| Oil, Gas & Consumable Fuels: 14.85% | | | | | | | | | | | | |
Canadian Natural Resources Limited | | | | | | | 69,100 | | | | 2,027,394 | |
Clean Energy Fuels Corporation † | | | | | | | 19,300 | | | | 254,567 | |
Comstock Resources Incorporated † | | | | | | | 17,000 | | | | 266,220 | |
Gulfport Energy Corporation † | | | | | | | 17,100 | | | | 892,449 | |
InterOil Corporation † | | | | | | | 214,800 | | | | 16,994,976 | |
James River Coal Company † | | | | | | | 380,600 | | | | 627,990 | |
Penn West Petroleum Limited | | | | | | | 96,735 | | | | 892,864 | |
PostRock Energy Corporation † | | | | | | | 442,400 | | | | 641,480 | |
Range Resources Corporation | | | | | | | 34,900 | | | | 2,565,848 | |
Triangle Petroleum Corporation † | | | | | | | 122,478 | | | | 672,404 | |
Trilogy Energy Corporation | | | | | | | 144,700 | | | | 4,229,902 | |
| | | | |
| | | | | | | | | | | 30,066,094 | |
| | | | | | | | | | | | |
The accompanying notes are an integral part of these financial statements.
| | | | |
| 8 | | Wells Fargo Advantage Small/Mid Cap Value Fund | | Portfolio of investments—April 30, 2013 (unaudited) |
| | | | | | | | | | | | |
| Security name | | | | | | Shares | | | Value | |
| | | | | | | | | | | | |
| | | | |
Financials: 20.33% | | | | | | | | | | | | |
| | | | |
| Capital Markets: 0.79% | | | | | | | | | | | | |
Artio Global Investors Incorporated | | | | | | | 234,500 | | | $ | 642,530 | |
Safeguard Scientifics Incorporated † | | | | | | | 59,100 | | | | 953,874 | |
| | | | |
| | | | | | | | | | | 1,596,404 | |
| | | | | | | | | | | | |
| | | | |
| Commercial Banks: 5.43% | | | | | | | | | | | | |
1st United Bancorp Incorporated | | | | | | | 157,600 | | | | 1,044,888 | |
American River Bankshares † | | | | | | | 112,100 | | | | 874,380 | |
Bancorp Incorporated † | | | | | | | 95,400 | | | | 1,240,200 | |
BBCN Bancorp Incorporated | | | | | | | 25,906 | | | | 333,669 | |
First Niagara Financial Group Incorporated | | | | | | | 132,600 | | | | 1,261,026 | |
IBERIABANK Corporation | | | | | | | 12,298 | | | | 561,035 | |
Midsouth Bancorp Incorporated | | | | | | | 33,200 | | | | 521,572 | |
Pacific Premier Bancorp Incorporated † | | | | | | | 229,300 | | | | 2,785,995 | |
Sierra Bancorp | | | | | | | 111,700 | | | | 1,443,164 | |
Sterling Bancorp | | | | | | | 41,155 | | | | 464,228 | |
Univest Corporation of Pennsylvania | | | | | | | 26,700 | | | | 468,051 | |
| | | | |
| | | | | | | | | | | 10,998,208 | |
| | | | | | | | | | | | |
| | | | |
| Insurance: 3.75% | | | | | | | | | | | | |
Argo Group International Holdings Limited | | | | | | | 91,000 | | | | 3,771,950 | |
First Acceptance Corporation † | | | | | | | 755,600 | | | | 929,388 | |
Health Insurance Innovations Incorporated Class A † | | | | | | | 75,512 | | | | 1,132,680 | |
Hilltop Holdings Incorporated † | | | | | | | 69,386 | | | | 929,079 | |
Mercury General Corporation | | | | | | | 18,100 | | | | 827,351 | |
| | | | |
| | | | | | | | | | | 7,590,448 | |
| | | | | | | | | | | | |
| | | | |
| REITs: 10.23% | | | | | | | | | | | | |
Capstead Mortgage Corporation | | | | | | | 80,500 | | | | 1,069,040 | |
Chimera Investment Corporation | | | | | | | 2,505,900 | | | | 8,269,470 | |
Hatteras Financial Corporation | | | | | | | 23,100 | | | | 631,323 | |
MFA Mortgage Investments Incorporated | | | | | | | 121,820 | | | | 1,129,271 | |
Origen Financial Incorporated | | | | | | | 779,190 | | | | 1,168,785 | |
Redwood Trust Incorporated | | | | | | | 93,700 | | | | 2,138,234 | |
Sun Communities Incorporated | | | | | | | 41,798 | | | | 2,137,968 | |
UMH Properties Incorporated | | | | | | | 376,100 | | | | 4,155,905 | |
| | | | |
| | | | | | | | | | | 20,699,996 | |
| | | | | | | | | | | | |
| | | | |
| Thrifts & Mortgage Finance: 0.13% | | | | | | | | | | | | |
Northwest Bancshares Incorporated | | | | | | | 22,200 | | | | 271,950 | |
| | | | | | | | | | | | |
| | | | |
Health Care: 7.30% | | | | | | | | | | | | |
| | | | |
| Biotechnology: 1.35% | | | | | | | | | | | | |
Amarin Corporation plc ADR † | | | | | | | 154,400 | | | | 1,144,104 | |
Discovery Laboratories Incorporated † | | | | | | | 942,100 | | | | 1,592,149 | |
| | | | |
| | | | | | | | | | | 2,736,253 | |
| | | | | | | | | | | | |
The accompanying notes are an integral part of these financial statements.
| | | | | | |
| Portfolio of investments—April 30, 2013 (unaudited) | | Wells Fargo Advantage Small/Mid Cap Value Fund | | | 9 | |
| | | | | | | | | | | | |
| Security name | | | | | | Shares | | | Value | |
| | | | | | | | | | | | |
| | | | |
| Health Care Equipment & Supplies: 2.64% | | | | | | | | | | | | |
Allied Healthcare Products Incorporated †** | | | | | | | 422,897 | | | $ | 1,137,593 | |
EnteroMedics Incorporated † | | | | | | | 953,400 | | | | 915,264 | |
OraSure Technologies Incorporated † | | | | | | | 553,090 | | | | 2,466,781 | |
Stryker Corporation | | | | | | | 12,490 | | | | 819,094 | |
| | | | |
| | | | | | | | | | | 5,338,732 | |
| | | | | | | | | | | | |
| | | | |
| Health Care Providers & Services: 1.13% | | | | | | | | | | | | |
Accretive Health Incorporated † | | | | | | | 66,600 | | | | 701,964 | |
Cross Country Healthcare Incorporated † | | | | | | | 121,300 | | | | 606,500 | |
Ensign Group Incorporated | | | | | | | 28,000 | | | | 976,360 | |
| | | | |
| | | | | | | | | | | 2,284,824 | |
| | | | | | | | | | | | |
| | | | |
| Health Care Technology: 2.18% | | | | | | | | | | | | |
Computer Programs & Systems Incorporated | | | | | | | 34,950 | | | | 1,833,477 | |
Merge Healthcare Incorporated † | | | | | | | 570,300 | | | | 1,779,336 | |
Omnicell Incorporated † | | | | | | | 44,700 | | | | 805,494 | |
| | | | |
| | | | | | | | | | | 4,418,307 | |
| | | | | | | | | | | | |
| | | | |
Industrials: 13.25% | | | | | | | | | | | | |
| | | | |
| Aerospace & Defense : 0.92% | | | | | | | | | | | | |
Orbital Sciences Corporation † | | | | | | | 103,170 | | | | 1,859,123 | |
| | | | | | | | | | | | |
| | | | |
| Airlines: 1.34% | | | | | | | | | | | | |
JetBlue Airways Corporation † | | | | | | | 295,000 | | | | 2,032,550 | |
US Airways Group Incorporated † | | | | | | | 39,800 | | | | 672,620 | |
| | | | |
| | | | | | | | | | | 2,705,170 | |
| | | | | | | | | | | | |
| | | | |
| Building Products: 1.32% | | | | | | | | | | | | |
Patrick Industries Incorporated † | | | | | | | 132,300 | | | | 2,680,398 | |
| | | | | | | | | | | | |
| | | | |
| Commercial Services & Supplies: 4.50% | | | | | | | | | | | | |
ABM Industries Incorporated | | | | | | | 88,698 | | | | 2,000,140 | |
ACCO Brands Corporation † | | | | | | | 283,800 | | | | 1,915,650 | |
Avery Dennison Corporation | | | | | | | 34,300 | | | | 1,421,735 | |
Cintas Corporation | | | | | | | 15,350 | | | | 688,755 | |
GEO Group Incorporated | | | | | | | 32,400 | | | | 1,213,380 | |
Healthcare Services Group Incorporated | | | | | | | 44,123 | | | | 983,502 | |
Standard Parking Corporation † | | | | | | | 41,700 | | | | 896,133 | |
| | | | |
| | | | | | | | | | | 9,119,295 | |
| | | | | | | | | | | | |
| | | | |
| Construction & Engineering: 2.43% | | | | | | | | | | | | |
Integrated Electrical Services Incorporated † | | | | | | | 376,000 | | | | 2,192,080 | |
Primoris Services Corporation | | | | | | | 123,500 | | | | 2,721,940 | |
| | | | |
| | | | | | | | | | | 4,914,020 | |
| | | | | | | | | | | | |
| | | | |
| Electrical Equipment: 0.53% | | | | | | | | | | | | |
GrafTech International Limited † | | | | | | | 148,100 | | | | 1,063,358 | |
| | | | | | | | | | | | |
The accompanying notes are an integral part of these financial statements.
| | | | |
| 10 | | Wells Fargo Advantage Small/Mid Cap Value Fund | | Portfolio of investments—April 30, 2013 (unaudited) |
| | | | | | | | | | | | |
| Security name | | | | | | Shares | | | Value | |
| | | | | | | | | | | | |
| | | | |
| Machinery: 1.40% | | | | | | | | | | | | |
Actuant Corporation Class A | | | | | | | 37,300 | | | $ | 1,167,490 | |
Kaydon Corporation | | | | | | | 22,800 | | | | 543,552 | |
Kennametal Incorporated | | | | | | | 28,200 | | | | 1,127,718 | |
| | | | |
| | | | | | | | | | | 2,838,760 | |
| | | | | | | | | | | | |
| | | | |
| Professional Services: 0.81% | | | | | | | | | | | | |
Hill International Incorporated † | | | | | | | 597,500 | | | | 1,643,125 | |
| | | | | | | | | | | | |
| | | | |
Information Technology: 13.04% | | | | | | | | | | | | |
| | | | |
| Communications Equipment: 3.34% | | | | | | | | | | | | |
Brocade Communications Systems Incorporated † | | | | | | | 263,800 | | | | 1,535,316 | |
Research In Motion Limited † | | | | | | | 147,500 | | | | 2,402,775 | |
Sandvine Corporation † | | | | | | | 1,359,600 | | | | 2,833,950 | |
| | | | |
| | | | | | | | | | | 6,772,041 | |
| | | | | | | | | | | | |
| | | | |
| Computers & Peripherals: 2.30% | | | | | | | | | | | | |
Cray Incorporated † | | | | | | | 127,000 | | | | 2,687,320 | |
Intermec Incorporated † | | | | | | | 200,084 | | | | 1,968,827 | |
| | | | |
| | | | | | | | | | | 4,656,147 | |
| | | | | | | | | | | | |
| | | | |
| Electronic Equipment, Instruments & Components: 0.48% | | | | | | | | | | | | |
GSI Group Incorporated † | | | | | | | 114,100 | | | | 974,416 | |
| | | | | | | | | | | | |
| | | | |
| IT Services: 2.93% | | | | | | | | | | | | |
Henry Jack & Associates Incorporated | | | | | | | 8,000 | | | | 371,200 | |
Official Payments Holdings Incorporated † | | | | | | | 624,500 | | | | 3,509,690 | |
Western Union Company | | | | | | | 138,570 | | | | 2,052,222 | |
| | | | |
| | | | | | | | | | | 5,933,112 | |
| | | | | | | | | | | | |
| | | | |
| Semiconductors & Semiconductor Equipment: 3.09% | | | | | | | | | | | | |
Advanced Micro Devices Incorporated † | | | | | | | 521,800 | | | | 1,471,476 | |
FormFactor Incorporated † | | | | | | | 340,100 | | | | 1,683,495 | |
Micron Technology Incorporated † | | | | | | | 328,400 | | | | 3,093,528 | |
| | | | |
| | | | | | | | | | | 6,248,499 | |
| | | | | | | | | | | | |
| | | | |
| Software: 0.90% | | | | | | | | | | | | |
Accelrys Incorporated † | | | | | | | 73,760 | | | | 726,536 | |
Informatica Corporation † | | | | | | | 33,000 | | | | 1,086,690 | |
| | | | |
| | | | | | | | | | | 1,813,226 | |
| | | | | | | | | | | | |
| | | | |
Materials: 15.36% | | | | | | | | | | | | |
| | | | |
| Containers & Packaging: 0.35% | | | | | | | | | | | | |
Intertape Polymer Group Incorporated | | | | | | | 64,075 | | | | 710,912 | |
| | | | | | | | | | | | |
| | | | |
| Metals & Mining: 15.01% | | | | | | | | | | | | |
Agnico-Eagle Mines Limited | | | | | | | 42,500 | | | | 1,372,325 | |
Endeavour Mining Corporation † | | | | | | | 1,111,300 | | | | 1,202,359 | |
Goldcorp Incorporated | | | | | | | 46,300 | | | | 1,369,554 | |
The accompanying notes are an integral part of these financial statements.
| | | | | | |
| Portfolio of investments—April 30, 2013 (unaudited) | | Wells Fargo Advantage Small/Mid Cap Value Fund | | | 11 | |
| | | | | | | | | | | | | | |
| Security name | | | | | | | Shares | | | Value | |
| | | | | | | | | | | | | | |
| | | | |
| Metals & Mining (continued) | | | | | | | | | | | | | | |
Goldgroup Mining Incorporated † | | | | | | | | | 1,030,800 | | | $ | 163,708 | |
Goldgroup Mining Incorporated - Legend Shares † | | | | | | | | | 1,041,000 | | | | 165,328 | |
Lucara Diamond Corporation † | | | | | | | | | 1,249,800 | | | | 749,880 | |
McEwen Mining Incorporated † | | | | | | | | | 1,044,000 | | | | 2,432,520 | |
Newmont Mining Corporation | | | | | | | | | 51,300 | | | | 1,662,120 | |
Randgold Resources Limited ADR | | | | | | | | | 130,100 | | | | 10,639,578 | |
Rockwell Diamonds Incorporated † | | | | | | | | | 442,400 | | | | 80,074 | |
Rockwell Diamonds Incorporated - Canada Exchange † | | | | | | | | | 193,750 | | | | 32,694 | |
Rockwell Diamonds Incorporated - Legend Shares † | | | | | | | | | 500,000 | | | | 84,371 | |
Rockwell Diamonds Incorporated - Legend Shares †(i) | | | | | | | | | 672,000 | | | | 113,395 | |
Royal Gold Incorporated | | | | | | | | | 43,900 | | | | 2,439,962 | |
Sandstorm Gold Limited † | | | | | | | | | 191,243 | | | | 1,545,206 | |
Sandstorm Gold Limited - Legend Shares †(i) | | | | | | | | | 331,400 | | | | 2,677,648 | |
Sandstorm Metals & Energy Limited † | | | | | | | | | 3,985,100 | | | | 1,325,136 | |
Silver Standard Resources Incorporated † | | | | | | | | | 176,068 | | | | 1,257,126 | |
United States Steel Corporation | | | | | | | | | 59,685 | | | | 1,062,393 | |
| | | | |
| | | | | | | | | | | | | 30,375,377 | |
| | | | | | | | | | | | | | |
| | | | |
Telecommunication Services: 1.20% | | | | | | | | | | | | | | |
| | | | |
| Diversified Telecommunication Services: 1.20% | | | | | | | | | | | | | | |
Cincinnati Bell Incorporated † | | | | | | | | | 689,600 | | | | 2,427,392 | |
| | | | | | | | | | | | | | |
| | | | |
Total Common Stocks (Cost $155,639,787) | | | | | | | | | | | | | 198,975,809 | |
| | | | | | | | | | | | | | |
| | | | |
Investment Companies: 1.36% | | | | | | | | | | | | | | |
Market Vectors Junior Gold Miners ETF | | | | | | | | | 215,468 | | | | 2,762,300 | |
| | | | |
Total Investment Companies (Cost $5,156,084) | | | | | | | | | | | | | 2,762,300 | |
| | | | | | | | | | | | | | |
| | | | |
| | | | | Expiration date | | | | | | | |
| | | | |
Warrants: 0.50% | | | | | | | | | | | | | | |
| | | | |
| Health Care: 0.06% | | | | | | | | | | | | | | |
| | | | |
| Health Care Equipment & Supplies: 0.06% | | | | | | | | | | | | | | |
EnteroMedics Incorporated †(a)(i) | | | | | 5-14-2016 | | | | 270,908 | | | | 96,741 | |
EnteroMedics Incorporated †(a)(i) | | | | | 9-28-2016 | | | | 13,680 | | | | 5,867 | |
EnteroMedics Incorporated †(a)(i) | | | | | 2-27-2018 | | | | 48,280 | | | | 11,944 | |
| | | | |
| | | | | | | | | | | | | 114,552 | |
| | | | | | | | | | | | | | |
| | | | |
Materials: 0.44% | | | | | | | | | | | | | | |
| | | | |
| Metals & Mining: 0.44% | | | | | | | | | | | | | | |
Sandstorm Gold Limited †(i) | | | | | 4-23-2014 | | | | 904,067 | | | | 897,382 | |
| | | | | | | | | | | | | | |
| | | | |
Total Warrants (Cost $15,993) | | | | | | | | | | | | | 1,011,934 | |
| | | | | | | | | | | | | | |
The accompanying notes are an integral part of these financial statements.
| | | | |
| 12 | | Wells Fargo Advantage Small/Mid Cap Value Fund | | Portfolio of investments—April 30, 2013 (unaudited) |
| | | | | | | | | | | | | | |
| Security name | | Yield | | | | | Shares | | | Value | |
| | | | | | | | | | | | | | |
| | | | |
Short-Term Investments: 0.28% | | | | | | | | | | | | | | |
| | | | |
| Investment Companies: 0.28% | | | | | | | | | | | | | | |
Wells Fargo Advantage Cash Investment Money Market Fund, Select Class (l)(u) | | | 0.13 | % | | | | | 560,381 | | | $ | 560,381 | |
| | | | |
Total Short-Term Investments (Cost $560,381) | | | | | | | | | | | | | 560,381 | |
| | | | | | | | | | | | | | |
| | | | | | | | |
Total investments in securities
(Cost $161,372,245) * | | | 100.44 | % | | | 203,310,424 | |
Other assets and liabilities, net | | | (0.44 | ) | | | (882,759 | ) |
| | | | | | | | |
| Total net assets | | | 100.00 | % | | $ | 202,427,665 | |
| | | | | | | | |
| † | Non-income-earning security |
| ** | Represents an affiliate of the Fund under Section 2(a)(2) and 2(a)(3) of the Investment Company Act of 1940, as amended, as the Fund holds 5% or more of the issuer’s outstanding voting shares. |
| (a) | Security is fair valued by the Management Valuation Team, and in certain instances by the Board of Trustees, in accordance with procedures approved by the Board of Trustees. |
| (l) | Investment in an affiliate |
| (u) | Rate shown is the 7-day annualized yield at period end. |
| * | Cost for federal income tax purposes is $169,433,127 and unrealized appreciation (depreciation) consists of: |
| | | | |
Gross unrealized appreciation | | $ | 67,628,765 | |
Gross unrealized depreciation | | | (33,751,468 | ) |
| | | | |
Net unrealized appreciation | | $ | 33,877,297 | |
The accompanying notes are an integral part of these financial statements.
| | | | | | |
| Statement of assets and liabilities—April 30, 2013 (unaudited) | | Wells Fargo Advantage Small/Mid Cap Value Fund | | | 13 | |
| | | | |
| | | | |
| |
Assets | | | | |
Investments | | | | |
In unaffiliated securities, at value (see cost below) | | $ | 201,612,450 | |
In affiliated securities, at value (see cost below) | | | 1,697,974 | |
| | | | |
Total investments, at value (see cost below) | | | 203,310,424 | |
Receivable for investments sold | | | 379,941 | |
Receivable for Fund shares sold | | | 378,764 | |
Receivable for dividends | | | 33,278 | |
Prepaid expenses and other assets | | | 42,463 | |
| | | | |
Total assets | | | 204,144,870 | |
| | | | |
| |
Liabilities | | | | |
Payable for investments purchased | | | 101,998 | |
Payable for Fund shares redeemed | | | 1,387,509 | |
Advisory fee payable | | | 120,262 | |
Distribution fees payable | | | 5,734 | |
Due to other related parties | | | 39,762 | |
Accrued expenses and other liabilities | | | 61,940 | |
| | | | |
Total liabilities | | | 1,717,205 | |
| | | | |
Total net assets | | $ | 202,427,665 | |
| | | | |
| |
NET ASSETS CONSIST OF | | | | |
Paid-in capital | | $ | 169,808,719 | |
Undistributed net investment income | | | 262,026 | |
Accumulated net realized losses on investments | | | (9,581,299 | ) |
Net unrealized gains on investments | | | 41,938,219 | |
| | | | |
Total net assets | | $ | 202,427,665 | |
| | | | |
| |
COMPUTATION OF NET ASSET VALUE AND OFFERING PRICE PER SHARE1 | | | | |
Net assets – Class A | | $ | 22,248,361 | |
Shares outstanding – Class A | | | 1,361,219 | |
Net asset value per share – Class A | | | $16.34 | |
Maximum offering price per share – Class A2 | | | $17.34 | |
Net assets – Class C | | $ | 9,258,681 | |
Shares outstanding – Class C | | | 579,035 | |
Net asset value per share – Class C | | | $15.99 | |
Net assets – Administrator Class | | $ | 64,379,960 | |
Shares outstanding – Administrator Class | | | 3,875,557 | |
Net asset value per share – Administrator Class | | | $16.61 | |
Net assets – Institutional Class | | $ | 44,745,498 | |
Shares outstanding – Institutional Class | | | 2,683,283 | |
Net asset value per share – Institutional Class | | | $16.68 | |
Net assets – Investor Class | | $ | 61,795,165 | |
Shares outstanding – Investor Class | | | 3,766,335 | |
Net asset value per share – Investor Class | | | $16.41 | |
| |
Investments in unaffiliated securities, at cost | | $ | 159,016,852 | |
| | | | |
Investments in affiliated securities, at cost | | $ | 2,355,393 | |
| | | | |
Total investments, at cost | | $ | 161,372,245 | |
| | | | |
| 1. | The Fund has an unlimited number of authorized shares. |
| 2. | Maximum offering price is computed as 100/94.25 of net asset value. On investments of $50,000 or more, the offering price is reduced. |
The accompanying notes are an integral part of these financial statements.
| | | | |
| 14 | | Wells Fargo Advantage Small/Mid Cap Value Fund | | Statement of operations—six months ended April 30, 2013 (unaudited) |
| | | | |
| | | | |
| |
Investment income | | | | |
Dividends* | | $ | 2,609,192 | |
Income from affiliated securities | | | 1,285 | |
| | | | |
Total investment income | | | 2,610,477 | |
| | | | |
| |
Expenses | | | | |
Advisory fee | | | 796,223 | |
Administration fees | | | | |
Fund level | | | 53,082 | |
Class A | | | 31,095 | |
Class C | | | 12,803 | |
Administrator Class | | | 33,069 | |
Institutional Class | | | 18,778 | |
Investor Class | | | 104,761 | |
Shareholder servicing fees | | | | |
Class A | | | 29,899 | |
Class C | | | 12,311 | |
Administrator Class | | | 78,209 | |
Investor Class | | | 81,713 | |
Distribution fees | | | | |
Class C | | | 36,932 | |
Custody and accounting fees | | | 13,212 | |
Professional fees | | | 16,029 | |
Registration fees | | | 40,917 | |
Shareholder report expenses | | | 18,051 | |
Trustees’ fees and expenses | | | 6,465 | |
Other fees and expenses | | | 3,072 | |
| | | | |
Total expenses | | | 1,386,621 | |
Less: Fee waivers and/or expense reimbursements | | | (32,136 | ) |
| | | | |
Net expenses | | | 1,354,485 | |
| | | | |
Net investment income | | | 1,255,992 | |
| | | | |
| |
REALIZED AND UNREALIZED GAINS (LOSSES) ON INVESTMENTS | | | | |
Net realized gains (losses) on: | | | | |
Unaffiliated securities | | | 5,215,062 | |
Affiliated securities | | | (86,940 | ) |
| | | | |
Net realized gains on investments | | | 5,128,122 | |
| | | | |
| |
Net change in unrealized gains (losses) on: | | | | |
Unaffiliated securities | | | (3,701,619 | ) |
Affiliated securities | | | 58,743 | |
| | | | |
Net change in unrealized gains (losses) on investments | | | (3,642,876 | ) |
| | | | |
Net realized and unrealized gains (losses) on investments | | | 1,485,246 | |
| | | | |
Net increase in net assets resulting from operations | | $ | 2,741,238 | |
| | | | |
| |
* Net of foreign dividend withholding taxes of | | | $20,734 | |
The accompanying notes are an integral part of these financial statements.
| | | | | | |
| Statement of changes in net assets | | Wells Fargo Advantage Small/Mid Cap Value Fund | | | 15 | |
| | | | | | | | | | | | | | | | |
| | | Six months ended April 30, 2013 (unaudited) | | | Year ended October 31, 2012 | |
| | | | |
Operations | | | | | | | | | | | | | | | | |
Net investment income | | | | | | $ | 1,255,992 | | | | | | | $ | 985,214 | |
Net realized gains on investments | | | | | | | 5,128,122 | | | | | | | | 13,474,636 | |
Net change in unrealized gains (losses) on investments | | | | | | | (3,642,876 | ) | | | | | | | 9,336,762 | |
| | | | | | | | | | | | | | | | |
Net increase in net assets resulting from operations | | | | | | | 2,741,238 | | | | | | | | 23,796,612 | |
| | | | | | | | | | | | | | | | |
| | | | |
Distributions to shareholders from | | | | | | | | | | | | | | | | |
Net investment income | | | | | | | | | | | | | | | | |
Class A | | | | | | | (56,717 | ) | | | | | | | (126,295 | ) |
Administrator Class | | | | | | | (348,872 | ) | | | | | | | (547,916 | ) |
Institutional Class | | | | | | | (341,385 | ) | | | | | | | (281,177 | ) |
Investor Class | | | | | | | (118,474 | ) | | | | | | | (266,567 | ) |
| | | | | | | | | | | | | | | | |
Total distributions to shareholders | | | | | | | (865,448 | ) | | | | | | | (1,221,955 | ) |
| | | | | | | | | | | | | | | | |
| | | | |
Capital share transactions | | | Shares | | | | | | | | Shares | | | | | |
Proceeds from shares sold | | | | | | | | | | | | | | | | |
Class A | | | 129,018 | | | | 2,058,157 | | | | 179,302 | | | | 2,730,973 | |
Class C | | | 19,428 | | | | 297,948 | | | | 74,001 | | | | 1,098,745 | |
Administrator Class | | | 187,471 | | | | 3,064,248 | | | | 994,230 | | | | 15,338,130 | |
Institutional Class | | | 281,050 | | | | 4,607,579 | | | | 1,510,723 | | | | 23,919,067 | |
Investor Class | | | 159,835 | | | | 2,573,755 | | | | 447,236 | | | | 7,022,404 | |
| | | | | | | | | | | | | | | | |
| | | | | | | 12,601,687 | | | | | | | | 50,109,319 | |
| | | | | | | | | | | | | | | | |
Reinvestment of distributions | | | | | | | | | | | | | | | | |
Class A | | | 3,589 | | | | 56,210 | | | | 9,119 | | | | 124,748 | |
Administrator Class | | | 18,852 | | | | 299,730 | | | | 34,536 | | | | 479,706 | |
Institutional Class | | | 15,067 | | | | 240,313 | | | | 9,441 | | | | 131,603 | |
Investor Class | | | 7,332 | | | | 115,265 | | | | 18,909 | | | | 259,615 | |
| | | | | | | | | | | | | | | | |
| | | | | | | 711,518 | | | | | | | | 995,672 | |
| | | | | | | | | | | | | | | | |
Payment for shares redeemed | | | | | | | | | | | | | | | | |
Class A | | | (355,654 | ) | | | (5,710,695 | ) | | | (974,938 | ) | | | (14,704,216 | ) |
Class C | | | (119,964 | ) | | | (1,887,345 | ) | | | (244,095 | ) | | | (3,609,215 | ) |
Administrator Class | | | (514,305 | ) | | | (8,461,200 | ) | | | (1,992,730 | ) | | | (31,214,045 | ) |
Institutional Class | | | (498,855 | ) | | | (8,202,442 | ) | | | (629,935 | ) | | | (9,957,101 | ) |
Investor Class | | | (908,699 | ) | | | (14,606,422 | ) | | | (1,350,765 | ) | | | (20,581,962 | ) |
| | | | | | | | | | | | | | | | |
| | | | | | | (38,868,104 | ) | | | | | | | (80,066,539 | ) |
| | | | | | | | | | | | | | | | |
Net decrease in net assets resulting from capital share transactions | | | | | | | (25,554,899 | ) | | | | | | | (28,961,548 | ) |
| | | | | | | | | | | | | | | | |
Total decrease in net assets | | | | | | | (23,679,109 | ) | | | | | | | (6,386,891 | ) |
| | | | | | | | | | | | | | | | |
| | | | |
Net assets | | | | | | | | | | | | | | | | |
Beginning of period | | | | | | | 226,106,774 | | | | | | | | 232,493,665 | |
| | | | | | | | | | | | | | | | |
End of period | | | | | | $ | 202,427,665 | | | | | | | $ | 226,106,774 | |
| | | | | | | | | | | | | | | | |
Undistributed (overdistributed) net investment income | | | | | | $ | 262,026 | | | | | | | $ | (128,518 | ) |
| | | | | | | | | | | | | | | | |
The accompanying notes are an integral part of these financial statements.
| | | | |
| 16 | | Wells Fargo Advantage Small/Mid Cap Value Fund | | Financial highlights |
(For a share outstanding throughout each period)
| | | | | | | | | | | | | | | | | | | | | | | | |
| | | Six months ended
April 30, 2013
(unaudited) | | | Year ended October 31 | |
| CLASS A | | | 2012 | | | 2011 | | | 2010 | | | 2009 | | | 2008 | |
Net asset value, beginning of period | | $ | 16.17 | | | $ | 14.61 | | | $ | 14.33 | | | $ | 11.78 | | | $ | 8.78 | | | $ | 18.19 | |
Net investment income | | | 0.08 | 1 | | | 0.07 | | | | 0.06 | | | | 0.08 | | | | 0.11 | 1 | | | 0.11 | 1 |
Net realized and unrealized gains (losses) on investments | | | 0.13 | | | | 1.55 | | | | 0.35 | | | | 2.56 | | | | 2.89 | | | | (7.84 | ) |
| | | | | | | | | | | | | | | | | | | | | | | | |
Total from investment operations | | | 0.21 | | | | 1.62 | | | | 0.41 | | | | 2.64 | | | | 3.00 | | | | (7.73 | ) |
Distributions to shareholders from | | | | | | | | | | | | | | | | | | | | | | | | |
Net investment income | | | (0.04 | ) | | | (0.06 | ) | | | (0.13 | ) | | | (0.09 | ) | | | 0.00 | | | | (0.09 | ) |
Net realized gains | | | 0.00 | | | | 0.00 | | | | 0.00 | | | | 0.00 | | | | 0.00 | | | | (1.59 | ) |
| | | | | | | | | | | | | | | | | | | | | | | | |
Total distributions to shareholders | | | (0.04 | ) | | | (0.06 | ) | | | (0.13 | ) | | | (0.09 | ) | | | 0.00 | | | | (1.68 | ) |
Net asset value, end of period | | $ | 16.34 | | | $ | 16.17 | | | $ | 14.61 | | | $ | 14.33 | | | $ | 11.78 | | | $ | 8.78 | |
Total return2 | | | 1.29 | % | | | 11.13 | % | | | 2.76 | % | | | 22.63 | % | | | 34.17 | % | | | (46.09 | )% |
Ratios to average net assets (annualized) | | | | | | | | | | | | | | | | | | | | | | | | |
Gross expenses | | | 1.40 | % | | | 1.41 | % | | | 1.40 | % | | | 1.47 | % | | | 1.57 | % | | | 1.55 | % |
Net expenses | | | 1.40 | % | | | 1.40 | % | | | 1.40 | % | | | 1.40 | % | | | 1.40 | % | | | 1.40 | % |
Net investment income | | | 1.07 | % | | | 0.37 | % | | | 0.37 | % | | | 0.77 | % | | | 1.12 | % | | | 0.83 | % |
Supplemental data | | | | | | | | | | | | | | | | | | | | | | | | |
Portfolio turnover rate | | | 15 | % | | | 32 | % | | | 34 | % | | | 41 | % | | | 35 | % | | | 43 | % |
Net assets, end of period (000s omitted) | | | $22,248 | | | | $25,612 | | | | $34,642 | | | | $41,491 | | | | $27,370 | | | | $12,859 | |
| 1. | Calculated based upon average shares outstanding |
| 2. | Total return calculations do not include any sales charges. Returns for periods of less than one year are not annualized. |
The accompanying notes are an integral part of these financial statements.
| | | | | | |
| Financial highlights | | Wells Fargo Advantage Small/Mid Cap Value Fund | | | 17 | |
(For a share outstanding throughout each period)
| | | | | | | | | | | | | | | | | | | | | | | | |
| | | Six months ended
April 30, 2013
(unaudited) | | | Year ended October 31 | |
| CLASS C | | | 2012 | | | 2011 | | | 2010 | | | 2009 | | | 2008 | |
Net asset value, beginning of period | | $ | 15.84 | | | $ | 14.36 | | | $ | 14.10 | | | $ | 11.62 | | | $ | 8.72 | | | $ | 18.15 | |
Net investment income (loss) | | | 0.00 | 1 | | | (0.08 | ) | | | (0.06 | ) | | | 0.00 | 1 | | | 0.04 | 2 | | | 0.02 | 2 |
Net realized and unrealized gains (losses) on investments | | | 0.15 | | | | 1.56 | | | | 0.35 | | | | 2.51 | | | | 2.86 | | | | (7.81 | ) |
| | | | | | | | | | | | | | | | | | | | | | | | |
Total from investment operations | | | 0.15 | | | | 1.48 | | | | 0.29 | | | | 2.51 | | | | 2.90 | | | | (7.79 | ) |
Distributions to shareholders from | | | | | | | | | | | | | | | | | | | | | | | | |
Net investment income | | | 0.00 | | | | 0.00 | | | | (0.03 | ) | | | (0.03 | ) | | | 0.00 | | | | (0.05 | ) |
Net realized gains | | | 0.00 | | | | 0.00 | | | | 0.00 | | | | 0.00 | | | | 0.00 | | | | (1.59 | ) |
| | | | | | | | | | | | | | | | | | | | | | | | |
Total distributions to shareholders | | | 0.00 | | | | 0.00 | | | | (0.03 | ) | | | (0.03 | ) | | | 0.00 | | | | (1.64 | ) |
Net asset value, end of period | | $ | 15.99 | | | $ | 15.84 | | | $ | 14.36 | | | $ | 14.10 | | | $ | 11.62 | | | $ | 8.72 | |
Total return3 | | | 0.95 | % | | | 10.31 | % | | | 2.05 | % | | | 21.62 | % | | | 33.26 | % | | | (46.46 | )% |
Ratios to average net assets (annualized) | | | | | | | | | | | | | | | | | | | | | | | | |
Gross expenses | | | 2.15 | % | | | 2.16 | % | | | 2.15 | % | | | 2.22 | % | | | 2.26 | % | | | 2.30 | % |
Net expenses | | | 2.15 | % | | | 2.15 | % | | | 2.15 | % | | | 2.15 | % | | | 2.11 | % | | | 2.15 | % |
Net investment income (loss) | | | 0.34 | % | | | (0.40 | )% | | | (0.38 | )% | | | 0.00 | % | | | 0.40 | % | | | 0.16 | % |
Supplemental data | | | | | | | | | | | | | | | | | | | | | | | | |
Portfolio turnover rate | | | 15 | % | | | 32 | % | | | 34 | % | | | 41 | % | | | 35 | % | | | 43 | % |
Net assets, end of period (000s omitted) | | | $9,259 | | | | $10,763 | | | | $12,204 | | | | $12,379 | | | | $9,052 | | | | $4,700 | |
| 1. | Amount is less than $0.005. |
| 2. | Calculated based upon average shares outstanding |
| 3. | Total return calculations do not include any sales charges. Returns for periods of less than one year are not annualized. |
The accompanying notes are an integral part of these financial statements.
| | | | |
| 18 | | Wells Fargo Advantage Small/Mid Cap Value Fund | | Financial highlights |
(For a share outstanding throughout each period)
| | | | | | | | | | | | | | | | | | | | | | | | |
| | | Six months ended
April 30, 2013
(unaudited) | | | Year ended October 31 | |
| ADMINISTRATOR CLASS | | | 2012 | | | 2011 | | | 2010 | | | 2009 | | | 2008 | |
Net asset value, beginning of period | | $ | 16.46 | | | $ | 14.89 | | | $ | 14.60 | | | $ | 11.99 | | | $ | 8.92 | | | $ | 18.37 | |
Net investment income | | | 0.11 | | | | 0.10 | | | | 0.09 | | | | 0.13 | | | | 0.13 | 1 | | | 0.12 | 1 |
Net realized and unrealized gains (losses) on investments | | | 0.12 | | | | 1.58 | | | | 0.36 | | | | 2.59 | | | | 2.94 | | | | (7.91 | ) |
| | | | | | | | | | | | | | | | | | | | | | | | |
Total from investment operations | | | 0.23 | | | | 1.68 | | | | 0.45 | | | | 2.72 | | | | 3.07 | | | | (7.79 | ) |
Distributions to shareholders from | | | | | | | | | | | | | | | | | | | | | | | | |
Net investment income | | | (0.08 | ) | | | (0.11 | ) | | | (0.16 | ) | | | (0.11 | ) | | | 0.00 | | | | (0.07 | ) |
Net realized gains | | | 0.00 | | | | 0.00 | | | | 0.00 | | | | 0.00 | | | | 0.00 | | | | (1.59 | ) |
| | | | | | | | | | | | | | | | | | | | | | | | |
Total distributions to shareholders | | | (0.08 | ) | | | (0.11 | ) | | | (0.16 | ) | | | (0.11 | ) | | | 0.00 | | | | (1.66 | ) |
Net asset value, end of period | | $ | 16.61 | | | $ | 16.46 | | | $ | 14.89 | | | $ | 14.60 | | | $ | 11.99 | | | $ | 8.92 | |
Total return2 | | | 1.45 | % | | | 11.33 | % | | | 3.13 | % | | | 22.82 | % | | | 34.42 | % | | | (45.89 | )% |
Ratios to average net assets (annualized) | | | | | | | | | | | | | | | | | | | | | | | | |
Gross expenses | | | 1.23 | % | | | 1.24 | % | | | 1.24 | % | | | 1.29 | % | | | 1.39 | % | | | 1.43 | % |
Net expenses | | | 1.15 | % | | | 1.15 | % | | | 1.15 | % | | | 1.15 | % | | | 1.15 | % | | | 1.15 | % |
Net investment income | | | 1.30 | % | | | 0.59 | % | | | 0.61 | % | | | 1.00 | % | | | 1.34 | % | | | 0.86 | % |
Supplemental data | | | | | | | | | | | | | | | | | | | | | | | | |
Portfolio turnover rate | | | 15 | % | | | 32 | % | | | 34 | % | | | 41 | % | | | 35 | % | | | 43 | % |
Net assets, end of period (000s omitted) | | | $64,380 | | | | $68,857 | | | | $76,668 | | | | $71,246 | | | | $55,463 | | | | $35,489 | |
| 1. | Calculated based upon average shares outstanding |
| 2. | Returns for periods of less than one year are not annualized. |
The accompanying notes are an integral part of these financial statements.
| | | | | | |
| Financial highlights | | Wells Fargo Advantage Small/Mid Cap Value Fund | | | 19 | |
(For a share outstanding throughout each period)
| | | | | | | | | | | | | | | | | | | | | | | | |
| | | Six months ended
April 30, 2013
(unaudited) | | | Year ended October 31 | |
| INSTITUTIONAL CLASS | | | 2012 | | | 2011 | | | 2010 | | | 2009 | | | 2008 | |
Net asset value, beginning of period | | $ | 16.54 | | | $ | 14.97 | | | $ | 14.67 | | | $ | 12.04 | | | $ | 8.93 | | | $ | 18.40 | |
Net investment income | | | 0.13 | | | | 0.11 | | | | 0.11 | | | | 0.17 | 1 | | | 0.15 | 1 | | | 0.15 | 1 |
Net realized and unrealized gains (losses) on investments | | | 0.13 | | | | 1.60 | | | | 0.38 | | | | 2.59 | | | | 2.96 | | | | (7.93 | ) |
| | | | | | | | | | | | | | | | | | | | | | | | |
Total from investment operations | | | 0.26 | | | | 1.71 | | | | 0.49 | | | | 2.76 | | | | 3.11 | | | | (7.78 | ) |
Distributions to shareholders from | | | | | | | | | | | | | | | | | | | | | | | | |
Net investment income | | | (0.12 | ) | | | (0.14 | ) | | | (0.19 | ) | | | (0.13 | ) | | | 0.00 | | | | (0.10 | ) |
Net realized gains | | | 0.00 | | | | 0.00 | | | | 0.00 | | | | 0.00 | | | | 0.00 | | | | (1.59 | ) |
| | | | | | | | | | | | | | | | | | | | | | | | |
Total distributions to shareholders | | | (0.12 | ) | | | (0.14 | ) | | | (0.19 | ) | | | (0.13 | ) | | | 0.00 | | | | (1.69 | ) |
Net asset value, end of period | | $ | 16.68 | | | $ | 16.54 | | | $ | 14.97 | | | $ | 14.67 | | | $ | 12.04 | | | $ | 8.93 | |
Total return2 | | | 1.60 | % | | | 11.61 | % | | | 3.28 | % | | | 23.08 | % | | | 34.83 | % | | | (45.83 | )% |
Ratios to average net assets (annualized) | | | | | | | | | | | | | | | | | | | | | | | | |
Gross expenses | | | 0.97 | % | | | 0.98 | % | | | 0.97 | % | | | 1.02 | % | | | 1.12 | % | | | 1.16 | % |
Net expenses | | | 0.95 | % | | | 0.95 | % | | | 0.95 | % | | | 0.95 | % | | | 0.95 | % | | | 0.95 | % |
Net investment income | | | 1.49 | % | | | 0.74 | % | | | 0.79 | % | | | 1.22 | % | | | 1.58 | % | | | 1.07 | % |
Supplemental data | | | | | | | | | | | | | | | | | | | | | | | | |
Portfolio turnover rate | | | 15 | % | | | 32 | % | | | 34 | % | | | 41 | % | | | 35 | % | | | 43 | % |
Net assets, end of period (000s omitted) | | | $44,745 | | | | $47,737 | | | | $29,881 | | | | $19,005 | | | | $9,895 | | | | $6,679 | |
| 1. | Calculated based upon average shares outstanding |
| 2. | Returns for periods of less than one year are not annualized. |
The accompanying notes are an integral part of these financial statements.
| | | | |
| 20 | | Wells Fargo Advantage Small/Mid Cap Value Fund | | Financial highlights |
(For a share outstanding throughout each period)
| | | | | | | | | | | | | | | | | | | | | | | | |
| | | Six months ended
April 30, 2013
(unaudited) | | | Year ended October 31 | |
| INVESTOR CLASS | | | 2012 | | | 2011 | | | 2010 | | | 2009 | | | 2008 | |
Net asset value, beginning of period | | $ | 16.22 | | | $ | 14.67 | | | $ | 14.38 | | | $ | 11.81 | | | $ | 8.81 | | | $ | 18.18 | |
Net investment income | | | 0.08 | 1 | | | 0.03 | | | | 0.05 | 1 | | | 0.09 | | | | 0.10 | 1 | | | 0.06 | 1 |
Net realized and unrealized gains (losses) on investments | | | 0.14 | | | | 1.57 | | | | 0.35 | | | | 2.56 | | | | 2.90 | | | | (7.82 | ) |
| | | | | | | | | | | | | | | | | | | | | | | | |
Total from investment operations | | | 0.22 | | | | 1.60 | | | | 0.40 | | | | 2.65 | | | | 3.00 | | | | (7.76 | ) |
Distributions to shareholders from | | | | | | | | | | | | | | | | | | | | | | | | |
Net investment income | | | (0.03 | ) | | | (0.05 | ) | | | (0.11 | ) | | | (0.08 | ) | | | 0.00 | | | | (0.02 | ) |
Net realized gains | | | 0.00 | | | | 0.00 | | | | 0.00 | | | | 0.00 | | | | 0.00 | | | | (1.59 | ) |
| | | | | | | | | | | | | | | | | | | | | | | | |
Total distributions to shareholders | | | (0.03 | ) | | | (0.05 | ) | | | (0.11 | ) | | | (0.08 | ) | | | 0.00 | | | | (1.61 | ) |
Net asset value, end of period | | $ | 16.41 | | | $ | 16.22 | | | $ | 14.67 | | | $ | 14.38 | | | $ | 11.81 | | | $ | 8.81 | |
Total return2 | | | 1.35 | % | | | 10.97 | % | | | 2.73 | % | | | 22.49 | % | | | 34.05 | % | | | (46.14 | )% |
Ratios to average net assets (annualized) | | | | | | | | | | | | | | | | | | | | | | | | |
Gross expenses | | | 1.46 | % | | | 1.47 | % | | | 1.47 | % | | | 1.56 | % | | | 1.67 | % | | | 1.69 | % |
Net expenses | | | 1.46 | % | | | 1.47 | % | | | 1.47 | % | | | 1.48 | % | | | 1.49 | % | | | 1.49 | % |
Net investment income | | | 1.02 | % | | | 0.27 | % | | | 0.30 | % | | | 0.67 | % | | | 1.02 | % | | | 0.44 | % |
Supplemental data | | | | | | | | | | | | | | | | | | | | | | | | |
Portfolio turnover rate | | | 15 | % | | | 32 | % | | | 34 | % | | | 41 | % | | | 35 | % | | | 43 | % |
Net assets, end of period (000s omitted) | | | $61,795 | | | | $73,138 | | | | $79,099 | | | | $99,424 | | | | $94,728 | | | | $75,324 | |
| 1. | Calculated based upon average shares outstanding |
| 2. | Returns for periods of less than one year are not annualized. |
The accompanying notes are an integral part of these financial statements.
| | | | | | |
| Notes to financial statements (unaudited) | | Wells Fargo Advantage Small/Mid Cap Value Fund | | | 21 | |
1. ORGANIZATION
Wells Fargo Funds Trust (the “Trust”), a Delaware statutory trust organized on March 10, 1999, is an open-end management investment company registered under the Investment Company Act of 1940, as amended (the “1940 Act”). These financial statements report on Wells Fargo Advantage Small/Mid Cap Value Fund (the “Fund”) which is a diversified series of the Trust.
2. SIGNIFICANT ACCOUNTING POLICIES
The following significant accounting policies, which are consistently followed in the preparation of the financial statements of the Fund, are in conformity with U.S. generally accepted accounting principles which require management to make estimates and assumptions that affect the reported amounts of assets and liabilities, disclosure of contingent assets and liabilities at the date of the financial statements, and the reported amounts of revenues and expenses during the reporting period. Actual results could differ from those estimates.
Securities valuation
All investments are valued each business day as of the close of regular trading on the New York Stock Exchange (normally 4 p.m. Eastern Time).
Equity securities that are listed on a foreign or domestic exchange, except for The Nasdaq Stock Market, Inc. (“Nasdaq”), are valued at the official closing price or, if none, the last sales price. Securities listed on Nasdaq are valued at the Nasdaq Official Closing Price (“NOCP”). If no NOCP is available, securities are valued at the last sales price. If no sales price is shown on the Nasdaq, the bid price will be used. If no sale occurs on the primary exchange or market for the security that day or if no sale occurs and no bid price is shown on Nasdaq, the prior day’s price will be deemed “stale” and fair values will be determined in accordance with the Fund’s Valuation Procedures.
Securities denominated in foreign currencies are translated into U.S. dollars using the rates of exchange in effect on the day of valuation at a time specified by the Management Valuation Team of Wells Fargo Funds Management, LLC (“Funds Management”).
Many securities markets and exchanges outside the U.S. close prior to the close of the New York Stock Exchange and therefore may not fully reflect trading or events that occur after the close of the principal exchange in which the foreign securities are traded, but before the close of the New York Stock Exchange. If such trading or events are expected to materially affect the value of such securities, then fair value pricing procedures approved by the Board of Trustees are applied. These procedures take into account multiple factors including movements in U.S. securities markets after foreign exchanges close. Foreign securities that are fair valued under these procedures are categorized as Level 2 and the application of these procedures may result in transfers between Level 1 and Level 2. Depending on market activity, such fair valuations may be frequent. Such fair value pricing may result in NAVs that are higher or lower than NAVs based on the last reported sales price or latest quoted bid price. On April 30, 2013, fair value pricing was not used in pricing foreign securities.
Investments in registered open-end investment companies are valued at net asset value.
Investments which are not valued using any of the methods discussed above are valued at their fair value, as determined by procedures established in good faith and approved by the Board of Trustees. The Board of Trustees has established a Valuation Committee comprised of the Trustees and has delegated to it the authority to take any actions regarding the valuation of portfolio securities that the Valuation Committee deems necessary or appropriate, including determining the fair value of portfolio securities, unless the determination has been delegated to the Management Valuation Team. The Board of Trustees retains the authority to make or ratify any valuation decisions or approve any changes to the Valuation Procedures as it deems appropriate. On a quarterly basis, the Board of Trustees receives reports on any valuation actions taken by the Valuation Committee or the Management Valuation Team which may include items for ratification.
Valuations of fair valued securities are compared to the next actual sales price when available, or other appropriate market information to assess the continued appropriateness of the fair valuation methodology used. These securities are fair valued on a day-to-day basis, taking into consideration changes to appropriate market information and any significant changes to the input factors considered in the valuation process until there is a readily available price provided on the exchange or by an independent pricing service. Valuations received from an independent pricing service or broker quotes are periodically validated by comparisons to most recent trades and valuations provided by other independent pricing services in addition to the review of prices by the adviser and/or subadviser. Unobservable inputs used in determining fair valuations are identified based on the type of security, taking into consideration factors utilized by market participants in valuing the investment, knowledge about the issuer and the current market environment.
| | | | |
| 22 | | Wells Fargo Advantage Small/Mid Cap Value Fund | | Notes to financial statements (unaudited) |
Foreign currency translation
The accounting records of the Fund are maintained in U.S. dollars. Assets, including investment securities, and liabilities denominated in foreign currency are translated into U.S. dollars at the rates of exchange at a time specified by the Management Valuation Team on the date of valuation. Purchases and sales of securities, and income and expenses are converted at the rate of exchange on the respective dates of such transactions. Reported net realized foreign exchange gains or losses arise from sales of foreign currencies, currency gains or losses realized between the trade and settlement dates on securities transactions, and the difference between the amounts of dividends, interest and foreign withholding taxes recorded and the U.S. dollar equivalent of the amounts actually paid or received. Net unrealized foreign exchange gains and losses arise from changes in the fair value of assets and liabilities other than investments in securities resulting in changes in exchange rates.
The changes in net assets arising from changes in exchange rates and the changes in net assets resulting from changes in market prices of securities are not separately presented. Such changes are recorded with net realized and unrealized gains or losses from investments. Gains and losses from certain foreign currency transactions are treated as ordinary income for U.S. federal income tax purposes.
Options
The Fund may be subject to equity price risk in the normal course of pursuing its investment objectives. The Fund may write covered call options or secured put options on individual securities and/or indexes. When the Fund writes an option, an amount equal to the premium received is recorded as a liability and is subsequently adjusted to the current market value of the written option. Premiums received from written options that expire unexercised are recognized as realized gains from investments on the expiration date. The difference between the premium received and the amount paid on effecting a closing purchase transaction, including brokerage commissions, is treated as a realized gain or loss. If a call option is exercised, the premium is added to the proceeds from the sale of the underlying security in calculating the realized gain or loss on the sale. If a put option is exercised, the premium reduces the cost of the security purchased. The Fund, as a writer of an option, bears the market risk of an unfavorable change in the price of the security and/or index underlying the written option.
The Fund may also purchase call or put options. The premium is included in the Statement of Assets and Liabilities as an investment, the value of which is subsequently adjusted based on to the current market value of the option. Premiums paid for purchased options that expire are recognized as realized losses from investments on the expiration date. Premiums paid for purchased options that are exercised or closed are added to the amount paid or offset against the proceeds received for the underlying security to determine the realized gain or loss. The risk of loss associated with purchased options is limited to the premium paid.
Options traded on an exchange are regulated and terms of the options are standardized. Options traded over the counter expose the Fund to counterparty risk in the event the counterparty does not perform. This risk is mitigated by having a master netting arrangement between the Fund and the counterparty and by having the counterparty post collateral to cover the Fund’s exposure to the counterparty.
Security transactions and income recognition
Securities transactions are recorded on a trade date basis. Realized gains or losses are recorded on the basis of identified cost.
Dividend income is recognized on the ex-dividend date, except for certain dividends from foreign securities, which are recorded as soon as the Fund is informed of the ex-dividend date. Dividend income from foreign securities is recorded net of foreign taxes withheld where recovery of such taxes is not assured.
Distributions to shareholders
Distributions to shareholders from net investment income and net realized gains, if any, are recorded on the ex-dividend date. Such distributions are determined in conformity with federal income tax regulations, which may differ in amount or character from net investment income and realized gains recognized for purposes of U.S. generally accepted accounting principles.
Federal and other taxes
The Fund intends to continue to qualify as a regulated investment company by distributing substantially all of its investment company taxable income and any net realized capital gains (after reduction for capital loss carryforwards) sufficient to relieve it from all, or substantially all, federal income taxes. Accordingly, no provision for federal income taxes was required.
The Fund’s income and federal excise tax returns and all financial records supporting those returns for the prior three fiscal years are subject to examination by the federal and Delaware revenue authorities. Management has analyzed the Fund’s tax positions taken on federal, state, and foreign tax returns for all open tax years and does not believe that there are any uncertain tax positions that require recognition of a tax liability.
| | | | | | |
| Notes to financial statements (unaudited) | | Wells Fargo Advantage Small/Mid Cap Value Fund | | | 23 | |
As of October 31, 2012, the Fund had pre-enactment capital loss carryforwards incurred in taxable years beginning before December 22, 2010, which are available to offset future net realized capital gains, in the amount of $7,105,980 expiring in 2017.
Class allocations
The separate classes of shares offered by the Fund differ principally in applicable sales charges, distribution, shareholder servicing, and administration fees. Shareholders of each class bear certain expenses that pertain to that particular class. All shareholders bear the common expenses of the Fund, earn income from the portfolio, and are allocated any unrealized gains and losses pro rata based on the average daily net assets of each class, without distinction between share classes. Dividends are determined separately for each class based on income and expenses allocable to each class. Realized gains and losses are allocated to each class pro rata based upon the net assets of each class on the date realized. Differences in per share dividend rates generally result from the relative weightings of pro rata income and realized gain allocations and from differences in separate class expenses, including distribution, shareholder servicing, and administration fees.
3. FAIR VALUATION MEASUREMENTS
Fair value measurements of investments are determined within a framework that has established a fair value hierarchy based upon the various data inputs utilized in determining the value of the Fund’s investments. The three-level hierarchy gives the highest priority to unadjusted quoted prices in active markets for identical assets or liabilities (Level 1) and the lowest priority to significant unobservable inputs (Level 3). The Fund’s investments are classified within the fair value hierarchy based on the lowest level of input that is significant to the fair value measurement. The inputs are summarized into three broad levels as follows:
| n | | Level 1 – quoted prices in active markets for identical securities |
| n | | Level 2 – other significant observable inputs (including quoted prices for similar securities, interest rates, prepayment speeds, credit risk, use of amortized cost, etc.) |
| n | | Level 3 – significant unobservable inputs (including the Fund’s own assumptions in determining the fair value of investments) |
The inputs or methodologies used for valuing investments in securities are not necessarily an indication of the risk associated with investing in those securities.
As of April 30, 2013, the inputs used in valuing investments in securities were as follows:
| | | | | | | | | | | | | | | | |
| Investments in Securities | | Quoted prices (Level 1) | | | Significant other
observable inputs (Level 2) | | | Significant unobservable inputs (Level 3) | | | Total | |
| | | | |
Equity securities | | | | | | | | | | | | | | | | |
Common stocks | | $ | 198,975,809 | | | $ | 0 | | | $ | 0 | | | $ | 198,975,809 | |
Investment companies | | | 2,762,300 | | | | 0 | | | | 0 | | | | 2,762,300 | |
Warrants | | | 0 | | | | 1,011,934 | | | | 0 | | | | 1,011,934 | |
| | | | |
Short-term investments | | | | | | | | | | | | | | | | |
Investment companies | | | 560,381 | | | | 0 | | | | 0 | | | | 560,381 | |
| | | $ | 202,298,490 | | | $ | 1,011,934 | | | $ | 0 | | | $ | 203,310,424 | |
Transfers in and transfers out are recognized at the end of the reporting period. For the six months ended April 30, 2013, the Fund did not have any significant transfers into/out of Level 1 or Level 2
4. TRANSACTIONS WITH AFFILIATES AND OTHER EXPENSES
Advisory fee
The Trust has entered into an advisory contract with Funds Management, an indirect wholly owned subsidiary of Wells Fargo & Company (“Wells Fargo”). The adviser is responsible for implementing investment policies and guidelines and for supervising the subadviser, who is responsible for day-to-day portfolio management of the Fund.
Pursuant to the contract, Funds Management is entitled to receive an annual advisory fee starting at 0.75% and declining to 0.60% as the average daily net assets of the Fund increase. For the six months ended April 30, 2013, the advisory fee was equivalent to an annual rate of 0.75% of the Fund’s average daily net assets.
| | | | |
| 24 | | Wells Fargo Advantage Small/Mid Cap Value Fund | | Notes to financial statements (unaudited) |
Funds Management has retained the services of a subadviser to provide daily portfolio management to the Fund. The fee for subadvisory services is borne by Funds Management. Wells Capital Management Incorporated, an affiliate of Funds Management, is the subadviser to the Fund and is entitled to receive a fee from Funds Management at an annual rate starting at 0.45% and declining to 0.35% as the average daily net assets of the Fund increase.
Administration and transfer agent fees
The Trust has entered into an administration agreement with Funds Management. Under this agreement, for providing administrative services, which includes paying fees and expenses for services provided by the transfer agent, sub-transfer agents, omnibus account servicers and record-keepers, Funds Management is entitled to receive from the Fund an annual fund level administration fee starting at 0.05% and declining to 0.03% as the average daily net assets of the Fund increase and a class level administration fee which is calculated based on the average daily net assets of each class as follows:
| | | | |
| | | Class level
administration fee | |
Class A, Class C | | | 0.26 | % |
Administrator Class | | | 0.10 | |
Institutional Class | | | 0.08 | |
Investor Class | | | 0.32 | |
Funds Management has contractually waived and/or reimbursed advisory and administration fees to the extent necessary to maintain certain net operating expense ratios for the Fund. Waiver of fees and/or reimbursement of expenses by Funds Management were made first from fund level expenses on a proportionate basis and then from class specific expenses. Funds Management has committed through February 28, 2014 to waive fees and/or reimburse expenses to the extent necessary to cap the Fund’s expenses at 1.40% for Class A shares, 2.15% for Class C shares, 1.15% for Administrator Class shares, 0.95% for Institutional Class shares, and 1.46% for Investor Class shares.
Distribution fees
The Trust has adopted a Distribution Plan for Class C shares of the Fund pursuant to Rule 12b-1 under the 1940 Act. Distribution fees are charged to Class C shares and paid to Wells Fargo Funds Distributor, LLC, the principal underwriter, at an annual rate of 0.75% of the average daily net assets of Class C shares.
For the six months ended April 30, 2013, Wells Fargo Funds Distributor, LLC received $2,023 from the sale of Class A shares and $261 in contingent deferred sales charges from redemptions of Class C shares.
Shareholder servicing fees
The Trust has entered into contracts with one or more shareholder servicing agents, whereby Class A, Class C, Administrator Class, and Investor Class of the Fund is charged a fee at an annual rate of 0.25% of the average daily net assets of each respective class.
A portion of these total shareholder servicing fees were paid to affiliates of Wells Fargo.
5. INVESTMENT PORTFOLIO TRANSACTIONS
Purchases and sales of investments, excluding U.S. government obligations (if any) and short-term securities, for the six months ended April 30, 2013 were $30,905,137 and $55,684,018, respectively.
6. INVESTMENTS IN AFFILIATES
An affiliated investment is a company in which the Fund has ownership of at least 5% of the outstanding voting shares. The following is a summary of transactions in issuers that were either affiliates of the Fund at the beginning of the period or the end of the period.
| | | | | | | | | | | | | | | | | | | | | | | | | | | | |
| | | Shares,
beginning of
period | | | Shares
purchased | | | Shares
sold | | | Shares, end of period | | | Value, end of period | | | Income from
affiliated securities | | | Realized (losses) | |
Allied Healthcare Products Incorporated | | | 453,100 | | | | 0 | | | | 30,203 | | | | 422,897 | | | $ | 1,137,593 | | | $ | 0 | | | $ | (74,079 | ) |
Evans & Sutherland Computer Corporation | | | 104,000 | | | | 0 | | | | 104,000 | | | | 0 | | | | 0 | | | | 0 | | | | (12,861 | ) |
| | | | | | |
| Notes to financial statements (unaudited) | | Wells Fargo Advantage Small/Mid Cap Value Fund | | | 25 | |
7. BANK BORROWINGS
The Trust (excluding the money market funds and certain other funds in the Trust) and Wells Fargo Variable Trust are parties to a $150,000,000 revolving credit agreement with State Street Bank and Trust Company, whereby the Fund is permitted to use bank borrowings for temporary or emergency purposes, such as to fund shareholder redemption requests. Interest under the credit agreement is charged to the Fund based on a borrowing rate equal to the higher of the Federal Funds rate in effect on that day plus 1.25% or the overnight LIBOR rate in effect on that day plus 1.25%. In addition, an annual commitment fee equal to 0.10% of the unused balance is allocated to each participating fund. For the six months ended April 30, 2013, the Fund paid $187 in commitment fees.
For the six months ended April 30, 2013, there were no borrowings by the Fund under the agreement.
8. INDEMNIFICATION
Under the Trust’s organizational documents, the officers and directors are indemnified against certain liabilities that may arise out of performance of their duties to the Trust. Additionally, in the normal course of business, the Trust may enter into contracts with service providers that contain a variety of indemnification clauses. The Trust’s maximum exposure under these arrangements is dependent on future claims that may be made against the Fund and, therefore, cannot be estimated.
9. NEW ACCOUNTING PRONOUNCEMENT
In December 2011, the Financial Accounting Standards Board (“FASB”) issued Accounting Standard Update (“ASU”) No. 2011-11, Disclosures about Offsetting Assets and Liabilities. ASU 2011-11, which amends FASB ASC Topic 210, Balance Sheet, creates new disclosure requirements which require entities to disclose both gross and net information for derivatives and other financial instruments that are either offset in the Statement of Assets and Liabilities or subject to an enforceable master netting arrangement or similar agreement. The disclosure requirements are effective for interim and annual reporting periods beginning on or after January 1, 2013. Management is currently assessing the potential impact, in addition to expanded financial statement disclosure, that may result from adopting this ASU.
| | | | |
| 26 | | Wells Fargo Advantage Small/Mid Cap Value Fund | | Other information (unaudited) |
PROXY VOTING INFORMATION
A description of the policies and procedures that the Fund uses to determine how to vote proxies relating to portfolio securities is available without charge, upon request, by calling 1-800-222-8222, visiting our website at wellsfargoadvantagefunds.com, or visiting the SEC website at sec.gov. Information regarding how the Fund voted proxies relating to portfolio securities during the most recent 12-month period ended June 30 is available without charge on the Fund’s website at wellsfargoadvantagefunds.com or by visiting the SEC website at sec.gov.
PORTFOLIO HOLDINGS INFORMATION
The complete portfolio holdings for the Fund are publicly available on the Fund’s website (wellsfargoadvantagefunds.com) on a monthly, 30-day or more delayed basis. In addition, top ten holdings information for the Fund is publicly available on the Fund’s website on a monthly, seven-day or more delayed basis. The Fund files its complete schedule of portfolio holdings with the SEC for the first and third quarters of each fiscal year on Form N-Q, which is available without charge by visiting the SEC website at sec.gov. In addition, the Fund’s Form N-Q may be reviewed and copied at the SEC’s Public Reference Room in Washington, DC, and at regional offices in New York City, at 233 Broadway, and in Chicago, at 175 West Jackson Boulevard, Suite 900. Information about the Public Reference Room may be obtained by calling 1-800-SEC-0330.
.
| | | | | | |
| Other information (unaudited) | | Wells Fargo Advantage Small/Mid Cap Value Fund | | | 27 | |
BOARD OF TRUSTEES AND OFFICERS
Each of the Trustees and Officers listed in the table below acts in identical capacities for the Wells Fargo Advantage family of funds, which consists of 131 funds1 comprising the Wells Fargo Funds Trust, Wells Fargo Variable Trust, Wells Fargo Master Trust and four closed-end funds (collectively the “Fund Complex”). This table should be read in conjunction with the Prospectus and the Statement of Additional Information2. All of the Trustees are also Members of the Audit and Governance Committees of each Trust in the Fund Complex. The mailing address of each Trustee and Officer is 525 Market Street, 12th Floor, San Francisco, CA 94105. Each Trustee and Officer serves an indefinite term, however, each Trustee serves such term until reaching the mandatory retirement age established by the Trustees.
Independent Trustees
| | | | | | |
Name and year of birth | | Position held and length of service* | | Principal occupations during past five years | | Other
directorships during
past five years |
Peter G. Gordon (Born 1942) | | Trustee, since 1998; Chairman, since 2005 | | Co-Founder, Retired Chairman, President and CEO of Crystal Geyser Water Company. Trustee Emeritus, Colby College. | | Asset Allocation Trust |
Isaiah Harris, Jr. (Born 1952) | | Trustee, since 2009 | | Retired. Prior thereto, President and CEO of BellSouth Advertising and Publishing Corp. from 2005 to 2007, President and CEO of BellSouth Enterprises from 2004 to 2005 and President of BellSouth Consumer Services from 2000 to 2003. Emeritus member of the Iowa State University Foundation Board of Governors. Emeritus Member of the Advisory Board of Iowa State University School of Business. Advisory Board Member, Palm Coast Academy (charter school). Mr. Harris is a certified public accountant. | | CIGNA Corporation; Deluxe Corporation; Asset Allocation Trust |
Judith M. Johnson (Born 1949) | | Trustee, since 2008; Audit Committee Chairman, since 2008 | | Retired. Prior thereto, Chief Executive Officer and Chief Investment Officer of Minneapolis Employees Retirement Fund from 1996 to 2008. Ms. Johnson is an attorney, certified public accountant and a certified managerial accountant. | | Asset Allocation Trust |
Leroy Keith, Jr. (Born 1939) | | Trustee, since 2010 | | Chairman, Bloc Global Services (development and construction). Trustee of the Evergreen Funds from 1983 to 2010. Former Managing Director, Almanac Capital Management (commodities firm), former Partner, Stonington Partners, Inc. (private equity fund), former Director, Obagi Medical Products Co. and former Director, Lincoln Educational Services. | | Trustee, Virtus Fund Complex (consisting of 48 portfolios as of 1/31/13); Asset Allocation Trust |
David F. Larcker (Born 1950) | | Trustee, since 2009 | | James Irvin Miller Professor of Accounting at the Graduate School of Business, Stanford University, Morgan Stanley Director of the Center for Leadership Development and Research and Senior Faculty of The Rock Center for Corporate Governance since 2006. From 2005 to 2008, Professor of Accounting at the Graduate School of Business, Stanford University. Prior thereto, Ernst & Young Professor of Accounting at The Wharton School, University of Pennsylvania from 1985 to 2005. | | Asset Allocation Trust |
Olivia S. Mitchell (Born 1953) | | Trustee, since 2006 | | International Foundation of Employee Benefit Plans Professor, Wharton School of the University of Pennsylvania since 1993. Director of Wharton’s Pension Research Council and Boettner Center on Pensions & Retirement Research, and Research Associate at the National Bureau of Economic Research. Previously, Cornell University Professor from 1978 to 1993. | | Asset Allocation Trust |
Timothy J. Penny (Born 1951) | | Trustee, since 1996 | | President and CEO of Southern Minnesota Initiative Foundation, a non-profit organization, since 2007 and Senior Fellow at the Humphrey Institute Policy Forum at the University of Minnesota since 1995. Member of the Board of Trustees of NorthStar Education Finance, Inc., a non-profit organization, since 2007. | | Asset Allocation Trust |
| | | | |
| 28 | | Wells Fargo Advantage Small/Mid Cap Value Fund | | Other information (unaudited) |
| | | | | | |
Name and year of birth | | Position held and length of service* | | Principal occupations during past five years | | Other
directorships during past five years |
| Michael S. Scofield (Born 1943) | | Trustee, since 2010 | | Served on the Investment Company Institute’s Board of Governors and Executive Committee from 2008-2011 as well the Governing Council of the Independent Directors Council from 2006-2011 and the Independent Directors Council Executive Committee from 2008-2011. Chairman of the IDC from 2008-2010. Institutional Investor (Fund Directions) Trustee of Year in 2007. Trustee of the Evergreen Funds (and its predecessors) from 1984 to 2010. Chairman of the Evergreen Funds from 2000-2010. Former Trustee of the Mentor Funds. Retired Attorney, Law Offices of Michael S. Scofield. | | Asset Allocation Trust |
Donald C. Willeke (Born 1940) | | Trustee, since 1996 | | Principal of the law firm of Willeke & Daniels. General Counsel of the Minneapolis Employees Retirement Fund from 1984 until its consolidation into the Minnesota Public Employees Retirement Association on June 30, 2010. Director and Vice Chair of The Tree Trust (non-profit corporation). Director of the American Chestnut Foundation (non-profit corporation). | | Asset Allocation Trust |
| * | Length of service dates reflect the Trustee’s commencement of service with the Trust’s predecessor entities, where applicable. |
Officers
| | | | | | |
Name and year of birth | | Position held and
length of service | | Principal occupations during past five years | | |
| Karla M. Rabusch (Born 1959) | | President, since 2003 | | Executive Vice President of Wells Fargo Bank, N.A. and President of Wells Fargo Funds Management, LLC since 2003. | | |
Nancy Wiser1 (Born 1967) | | Treasurer, since 2012 | | Executive Vice President of Wells Fargo Funds Management, LLC since 2011. Chief Operating Officer and Chief Compliance Officer at LightBox Capital Management LLC, from 2008 to 2011. Owned and operated a consulting business providing services to various hedge funds including acting as Chief Operating Officer and Chief Compliance Officer for a hedge fund from 2007 to 2008. Chief Operating Officer and Chief Compliance Officer of GMN Capital LLC from 2006 to 2007. | | |
C. David Messman (Born 1960) | | Secretary, since 2000; Chief Legal Officer, since 2003 | | Senior Vice President and Secretary of Wells Fargo Funds Management, LLC since 2001. Vice President and Managing Counsel of Wells Fargo Bank, N.A. since 1996. | | |
Debra Ann Early (Born 1964) | | Chief Compliance Officer, since 2007 | | Chief Compliance Officer of Wells Fargo Funds Management, LLC since 2007. Chief Compliance Officer of Parnassus Investments from 2005 to 2007. Chief Financial Officer of Parnassus Investments from 2004 to 2007. | | |
David Berardi (Born 1975) | | Assistant Treasurer, since 2009 | | Vice President of Wells Fargo Funds Management, LLC since 2009. Vice President of Evergreen Investment Management Company, LLC from 2008 to 2010. Assistant Vice President of Evergreen Investment Services, Inc. from 2004 to 2008. Manager of Fund Reporting and Control for Evergreen Investment Management Company, LLC from 2004 to 2010. | | |
Jeremy DePalma1 (Born 1974) | | Assistant Treasurer, since 2009 | | Senior Vice President of Wells Fargo Funds Management, LLC since 2009. Senior Vice President of Evergreen Investment Management Company, LLC from 2008 to 2010. Vice President, Evergreen Investment Services, Inc. from 2004 to 2007. Head of the Fund Reporting and Control Team within Fund Administration from 2005 to 2010. | | |
| 1. | Nancy Wiser acts as Treasurer of 73 funds in the Fund Complex. Jeremy DePalma acts as Treasurer of 58 funds and Assistant Treasurer of 73 funds in the Fund Complex. |
| 2. | The Statement of Additional Information includes additional information about the Trustees and is available, without charge, upon request, by calling 1-800-222-8222 or by visiting the website at wellsfargoadvantagefunds.com. |
| | | | | | |
| Other information (unaudited) | | Wells Fargo Advantage Small/Mid Cap Value Fund | | | 29 | |
BOARD CONSIDERATION OF INVESTMENT ADVISORY AND SUBADVISORY AGREEMENTS:
Under Section 15 of the Investment Company Act of 1940 (the “1940 Act”), the Board of Trustees (the “Board”) of Wells Fargo Funds Trust (the “Trust”), all the members of which have no direct or indirect interest in the investment advisory and sub-advisory agreements and are not “interested persons” of the Trust, as defined in the 1940 Act (the “Independent Trustees”), must determine whether to approve the continuation of the Trust’s investment advisory and sub-advisory agreements. In this regard, at an in-person meeting held on March 28-29, 2013 (the “Meeting”), the Board reviewed: (i) an investment advisory agreement with Wells Fargo Funds Management, LLC (“Funds Management”) for Wells Fargo Advantage Small/Mid Cap Value Fund (the “Fund”) and (ii) an investment sub-advisory agreement with Wells Capital Management Incorporated (the “Sub-Adviser”), an affiliate of Funds Management, for the Fund. The investment advisory agreement with Funds Management and the investment sub-advisory agreement with the Sub-Adviser are collectively referred to as the “Advisory Agreements.”
At the Meeting, the Board considered the factors and reached the conclusions described below relating to the selection of Funds Management and the Sub-Adviser and the continuation of the Advisory Agreements. Prior to the Meeting, the Trustees conferred extensively among themselves and with representatives of Funds Management about these matters. The Board has adopted a team-based approach, with each team consisting of a sub-set of Trustees, to assist the Board in the discharge of its duties in reviewing performance and other matters throughout the year. The Independent Trustees were assisted in their evaluation of the Advisory Agreements by independent legal counsel, from whom they received separate legal advice and with whom they met separately.
In providing information to the Board, Funds Management and the Sub-Adviser were guided by a detailed set of requests for information submitted to them by independent legal counsel on behalf of the Independent Trustees at the start of the Board’s annual contract renewal process earlier in 2013. In considering and approving the Advisory Agreements, the Trustees considered the information they believed relevant, including but not limited to the information discussed below. The Board considered not only the specific information presented in connection with the Meeting, but also the knowledge gained over time through interaction with Funds Management and the Sub-Adviser about various topics. In this regard, the Board reviewed reports of Funds Management at each of its quarterly meetings, which included, among other things, portfolio reviews and performance reports. In addition, the Board and the teams mentioned above confer with portfolio managers at various times throughout the year. The Board did not identify any particular information or consideration that was all-important or controlling, and each individual Trustee may have attributed different weights to various factors.
After its deliberations, the Board unanimously determined that the continuation of the Advisory Agreements is in the best interests of the Fund and its shareholders, and that the compensation payable to Funds Management and the Sub-Adviser is reasonable. The Board considered the continuation of the Advisory Agreements for the Fund as part of its consideration of the continuation of advisory agreements for funds across the complex, but each decision was made on a fund-by-fund basis. The following summarizes a number of important, but not necessarily all, factors considered by the Board in reaching its determination.
Nature, extent and quality of services
The Board received and considered various information regarding the nature, extent and quality of services provided to the Fund by Funds Management and the Sub-Adviser under the Advisory Agreements. This information included, among other things, a summary of the background and experience of senior management of Funds Management, and the qualifications, background, tenure and responsibilities of each of the portfolio managers primarily responsible for the day-to-day portfolio management of the Fund.
The Board evaluated the ability of Funds Management and the Sub-Adviser, based on attributes such as their financial condition, resources and reputation, to attract and retain qualified investment professionals, including research, advisory and supervisory personnel. The Board further considered the compliance programs and compliance records of Funds Management and the Sub-Adviser. In addition, the Board took into account the administrative and other services provided to the Fund by Funds Management and its affiliates and Funds Management’s oversight of the Fund’s various service providers.
Fund performance and expenses
The Board considered the performance results for the Fund over various time periods ended December 31, 2012. The Board also considered these results in comparison to the performance of funds in a universe that was determined by Lipper Inc. (“Lipper”) to be similar to the Fund (the “Universe”), and in comparison to the Fund’s benchmark index and to other comparative data. Lipper is an independent provider of investment company data. The Board received a
| | | | |
| 30 | | Wells Fargo Advantage Small/Mid Cap Value Fund | | Other information (unaudited) |
description of the methodology used by Lipper to select the mutual funds in the performance Universe. The Board noted that the performance of the Fund (Administrator Class) was higher than the median performance of the Universe for the ten-year period under review, but lower than the median performance of the Universe for the one-, three- and five-year periods under review. The Board also noted that the performance of the Fund was in range of its benchmark, the Russell 2500™ Value Index, for the ten-year period under review, but lower than its benchmark for the one-, three- and five-year periods under review.
The Board received information concerning, and discussed factors contributing to, the underperformance of the Fund relative to the Universe and benchmark for the one-, three- and five-year periods under review. Funds Management advised the Board about the market conditions and investment decisions that it believed contributed to the underperformance during those periods. Funds Management advised the Board that the three-year performance of the Fund was affected by allocations in the information technology and financial sectors, while the five-year performance of the Fund was affected by the 2008 credit crisis and market volatility. The Board was satisfied with the explanation it received.
The Board received and considered information regarding the Fund’s net operating expense ratios and their various components, including actual management fees (which reflect fee waivers, if any, and include advisory, administration and transfer agent fees), custodian and other non-management fees, Rule 12b-1 and non-Rule 12b-1 service fees and fee waiver and expense reimbursement arrangements. The Board also considered these ratios in comparison to the median ratios of funds in class-specific expense groups that were determined by Lipper to be similar to the Fund (the “Groups”). The Board received a description of the methodology used by Lipper to select the mutual funds in the expense Groups. Based on the Lipper reports, the Board noted that the net operating expense ratios of the Fund were in range of the median net operating expense ratios of the expense Groups, except for the net operating expense ratio of the Investor Class which was higher than the median of its expense Group. The Board and Funds Management agreed to reduce the operating expense ratio caps for the Fund’s Investor Class, Class A and Class C.
Based on its consideration of the factors and information it deemed relevant, including those described here, the Board concluded that the overall performance and expense structure of the Fund supported the re-approval of the Advisory Agreements.
Investment advisory and sub-advisory fee rates
The Board reviewed and considered the contractual investment advisory fee rates that are payable by the Fund to Funds Management for investment advisory services (the “Advisory Agreement Rates”), both on a stand-alone basis and on a combined basis with the Fund’s fund-level and class-level contractual administration fee rates (the “Management Rates”). The Board noted that the administration fees include transfer agency costs. The Board also reviewed and considered the contractual investment sub-advisory fee rates that are payable by Funds Management to the Sub-Adviser for investment sub-advisory services (the “Sub-Advisory Agreement Rates”).
Among other information reviewed by the Board was a comparison of the Management Rates of the Fund with those of other funds in the expense Groups at a common asset level. The Board noted that the Management Rates of the Fund were in range of or equal to the median rates for the Fund’s expense Groups for all classes except the Class A. The Board viewed favorably the agreed-upon reduction in the operating expense ratio caps for the Investor Class, Class A and Class C.
The Board also received and considered information about the portion of the total advisory fee that was retained by Funds Management after payment of the fee to the Sub-Adviser for sub-advisory services. In assessing the reasonableness of this amount, the Board received and evaluated information concerning the nature and extent of responsibilities retained and risks assumed by Funds Management and not delegated to or assumed by the Sub-Adviser, and about Funds Management’s on-going oversight services. In recognition of the fact that the Wells Fargo enterprise provides a suite of combined advisory and sub-advisory services to the Fund through affiliated entities, the Board ascribed limited relevance to the allocation of the total advisory fee between Funds Management and the Sub-Adviser.
The Board also received and considered information about the nature and extent of services offered and fee rates charged by Funds Management and the Sub-Adviser to other types of clients. In this regard, the Board received information about the significantly greater scope of services, and compliance, reporting and other legal burdens and risks of managing mutual funds compared with those associated with managing assets of non-mutual fund clients such as collective funds or institutional separate accounts.
Based on its consideration of the factors and information it deemed relevant, including those described here, the Board determined that the Advisory Agreement Rates and the Sub-Advisory Agreement Rates were reasonable in light of the services covered by the Advisory Agreements.
| | | | | | |
| Other information (unaudited) | | Wells Fargo Advantage Small/Mid Cap Value Fund | | | 31 | |
Profitability
The Board received and considered information concerning the profitability of Funds Management, as well as the profitability of Wells Fargo as a whole, from providing services to the Fund. The Board did not receive or consider to be necessary separate profitability information with respect to the Sub-Adviser, because, as an affiliate of Funds Management, its profitability information was subsumed in the collective Wells Fargo profitability analysis provided by Funds Management.
Funds Management explained the methodologies and estimates that it used in calculating the profitability from the Fund and the fund family as a whole. Among other things, the Board noted that the levels of profitability reported on a fund-by-fund basis varied widely, depending on factors such as the size and type of fund. Based on its review, the Board did not deem the profits reported by Funds Management to be at a level that would prevent it from approving the continuation of the Advisory Agreements.
Economies of scale
With respect to possible economies of scale, the Board reviewed the breakpoints in the Fund’s advisory fee and administration fee structure, which operate generally to reduce the Fund’s expense ratios as the Fund grows in size. It considered that, for a small fund or a fund that shrinks in size, breakpoints conversely can result in higher fee levels. The Board also considered fee waiver and expense reimbursement arrangements as a means of sharing potential economies of scale with the Fund. The Board acknowledged the inherent limitations of any analysis of potential economies of scale and of any attempt to correlate breakpoints with such economies. Nonetheless, the Board concluded that the breakpoints and net operating expense ratio caps appeared to be a reasonable approach to sharing potential economies of scale with the Fund.
Other benefits to Funds Management and the Sub-Adviser
The Board received and considered information regarding potential “fall-out” or ancillary benefits received by Funds Management and its affiliates, including the Sub-Adviser, as a result of their relationship with the Fund. Ancillary benefits could include, among others, benefits directly attributable to other relationships with the Fund and benefits potentially derived from an increase in Funds Management’s and the Sub-Adviser’s business as a result of their relationship with the Fund (such as the ability to market to shareholders other financial products and services offered by Funds Management and its affiliates, including the Sub-Adviser, or to operate other products and services that follow investment strategies similar to those of the Fund).
The Board considered that Wells Fargo Funds Distributor, LLC, an affiliate of Funds Management, serves as distributor to the Fund and receives certain compensation for those services. The Board noted that various financial institutions, including affiliates of Funds Management, may receive distribution-related fees, shareholder servicing payments (including amounts derived from payments under Rule 12b-1 plans) and sub-transfer agency fees in respect of shares sold or held through them and services provided.
The Board also reviewed information about whether and to what extent soft dollar credits are sought and how any such credits are utilized, and any benefits that might be realized by an affiliated broker that handles portfolio transactions for the Fund.
Based on its consideration of the factors and information it deemed relevant, including those described here, the Board did not find that any ancillary benefits received by Funds Management and its affiliates, including the Sub-Adviser, were unreasonable.
Conclusion
After considering the above-described factors and based on its deliberations and its evaluation of the information described above, the Board unanimously approved the continuation of the Advisory Agreements for an additional one-year period.
| | | | |
| 32 | | Wells Fargo Advantage Small/Mid Cap Value Fund | | List of abbreviations |
The following is a list of common abbreviations for terms and entities that may have appeared in this report.
| ACA | — ACA Financial Guaranty Corporation |
| ADR | — American depositary receipt |
| ADS | — American depositary shares |
| AGC | — Assured Guaranty Corporation |
| AGM | — Assured Guaranty Municipal |
| Ambac | — Ambac Financial Group Incorporated |
| AMT | — Alternative minimum tax |
| BAN | — Bond anticipation notes |
| BHAC | — Berkshire Hathaway Assurance Corporation |
| CAB | — Capital appreciation bond |
| CCAB | — Convertible capital appreciation bond |
| CDA | — Community Development Authority |
| CDO | — Collateralized debt obligation |
| COP | — Certificate of participation |
| DRIVER | — Derivative inverse tax-exempt receipts |
| DW&P | — Department of Water & Power |
| DWR | — Department of Water Resources |
| ECFA | — Educational & Cultural Facilities Authority |
| EDA | — Economic Development Authority |
| EDFA | — Economic Development Finance Authority |
| ETF | — Exchange-traded fund |
| FDIC | — Federal Deposit Insurance Corporation |
| FFCB | — Federal Farm Credit Banks |
| FGIC | — Financial Guaranty Insurance Corporation |
| FHA | — Federal Housing Administration |
| FHLB | — Federal Home Loan Bank |
| FHLMC | — Federal Home Loan Mortgage Corporation |
| FICO | — The Financing Corporation |
| FNMA | — Federal National Mortgage Association |
| GDR | — Global depositary receipt |
| GNMA | — Government National Mortgage Association |
| HCFR | — Healthcare facilities revenue |
| HEFA | — Health & Educational Facilities Authority |
| HEFAR | — Higher education facilities authority revenue |
| HFA | — Housing Finance Authority |
| HFFA | — Health Facilities Financing Authority |
| HUD | — Department of Housing and Urban Development |
| IDA | — Industrial Development Authority |
| IDAG | — Industrial Development Agency |
| IDR | — Industrial development revenue |
| KRW | — Republic of Korea won |
| LIBOR | — London Interbank Offered Rate |
| LLC | — Limited liability company |
| LLP | — Limited liability partnership |
| MBIA | — Municipal Bond Insurance Association |
| MFHR | — Multifamily housing revenue |
| MSTR | — Municipal securities trust receipts |
| MUD | — Municipal Utility District |
| National | — National Public Finance Guarantee Corporation |
| PCFA | — Pollution Control Financing Authority |
| PCL | — Public Company Limited |
| PCR | — Pollution control revenue |
| PFA | — Public Finance Authority |
| PFFA | — Public Facilities Financing Authority |
| PFOTER | — Puttable floating option tax-exempt receipts |
| plc | — Public limited company |
| PUTTER | — Puttable tax-exempt receipts |
| R&D | — Research & development |
| Radian | — Radian Asset Assurance |
| RAN | — Revenue anticipation notes |
| RDA | — Redevelopment Authority |
| RDFA | — Redevelopment Finance Authority |
| REIT | — Real estate investment trust |
| ROC | — Reset option certificates |
| SAVRS | — Select auction variable rate securities |
| SBA | — Small Business Authority |
| SFHR | — Single-family housing revenue |
| SFMR | — Single-family mortgage revenue |
| SPA | — Standby purchase agreement |
| SPDR | — Standard & Poor’s Depositary Receipts |
| STRIPS | — Separate trading of registered interest and principal securities |
| TAN | — Tax anticipation notes |
| TIPS | — Treasury inflation-protected securities |
| TRAN | — Tax revenue anticipation notes |
| TTFA | — Transportation Trust Fund Authority |
| TVA | — Tennessee Valley Authority |
This page is intentionally left blank.
This page is intentionally left blank.


For more information
More information about Wells Fargo Advantage Funds is available free upon request. To obtain literature, please write, email, visit the Fund’s website, or call:
Wells Fargo Advantage Funds
P.O. Box 8266
Boston, MA 02266-8266
Email: wfaf@wellsfargo.com
Website: wellsfargoadvantagefunds.com
Individual investors: 1-800-222-8222
Retail investment professionals: 1-888-877-9275
Institutional investment professionals: 1-866-765-0778
This report and the financial statements contained herein are submitted for the general information of the shareholders of Wells Fargo Advantage Funds. If this report is used for promotional purposes, distribution of the report must be accompanied or preceded by a current prospectus. For a current prospectus and, if available, a summary prospectus containing more complete information, including charges and expenses, call 1-800-222-8222 or visit the Fund’s website at wellsfargoadvantagefunds.com. Please consider the investment objectives, risks, charges, and expenses of the investment carefully before investing. This and other information about Wells Fargo Advantage Funds can be found in the current prospectus. Read the prospectus carefully before you invest or send money.
Wells Fargo Funds Management, LLC, a wholly owned subsidiary of Wells Fargo & Company, provides investment advisory and administrative services for Wells Fargo Advantage Funds. Other affiliates of Wells Fargo & Company provide subadvisory and other services for the Funds. The Funds are distributed by Wells Fargo Funds Distributor, LLC, Member FINRA/SIPC, an affiliate of Wells Fargo & Company.
NOT FDIC INSURED ¡ NO BANK GUARANTEE ¡ MAY LOSE VALUE
© 2013 Wells Fargo Funds Management, LLC. All rights reserved.
| | |
 | | 216840 06-13 SA245/SAR245 4-13 |

Wells Fargo Advantage
Special Small Cap Value Fund

Semi-Annual Report
April 30, 2013

Reduce clutter. Save trees.
Sign up for electronic delivery of prospectuses and shareholder reports at wellsfargo.com/advantagedelivery
Contents
The views expressed and any forward-looking statements are as of April 30, 2013, unless otherwise noted, and are those of the Fund managers and/or Wells Fargo Funds Management, LLC. Discussions of individual securities, or the markets generally, or any Wells Fargo Advantage Fund are not intended as individual recommendations. Future events or results may vary significantly from those expressed in any forward-looking statements; the views expressed are subject to change at any time in response to changing circumstances in the market. Wells Fargo Funds Management, LLC, disclaims any obligation to publicly update or revise any views expressed or forward-looking statements.
NOT FDIC INSURED ¡ NO BANK GUARANTEE ¡ MAY LOSE VALUE

Wells Fargo investment history
| | |
| 1932 | | Keystone creates one of the first mutual fund families. |
| 1971 | | Wells Fargo & Company introduces one of the first institutional index funds. |
| 1978 | | Wells Fargo applies Markowitz and Sharpe’s research on Modern Portfolio Theory to introduce one of the industry’s first tactical asset allocation models in institutional separately managed accounts. |
| 1984 | | Wells Fargo Stagecoach Funds launches its first asset allocation fund. |
| 1989 | | The Tactical Asset Allocation (TAA) Model is first applied to Wells Fargo’s asset allocation mutual funds. |
| 1994 | | Wells Fargo introduces the LifePath Funds, one of the first suites of target date funds (now the Wells Fargo Advantage Dow Jones Target Date FundsSM). |
| 1996 | | Evergreen Investments and Keystone Funds merge. |
| 1997 | | Wells Fargo launches the Wells Fargo Advantage WealthBuilder PortfoliosSM, a fund-of-funds suite of products that includes the use of quantitative models to shift assets among investment styles. |
| 1999 | | Norwest Advantage Funds and Stagecoach Funds are reorganized into Wells Fargo Funds after the merger of Norwest and Wells Fargo. |
| 2002 | | Evergreen Retail and Evergreen Institutional companies form the umbrella asset management company, Evergreen Investments. |
| 2005 | | The integration of Strong Funds with Wells Fargo Funds creates Wells Fargo Advantage Funds, resulting in one of the top 20 mutual fund companies in the United States. |
| 2006 | | Wells Fargo Advantage Funds relaunches the target date product line as Wells Fargo Advantage Dow Jones Target Date Funds. |
| 2010 | | The mergers and reorganizations of Evergreen and Wells Fargo Advantage mutual funds are completed, unifying the families under the brand of Wells Fargo Advantage Funds. |
Wells Fargo Advantage Funds®
Wells Fargo Advantage Funds skillfully guides institutions, financial advisors, and individuals through the investment terrain to help them reach their financial objectives. Everything we do on behalf of investors is backed by our unique combination of qualifications.
Strength
Our organization is built on the standards of integrity and service established by our parent company—Wells Fargo & Company—more than 150 years ago. And, because we’re part of a highly diversified financial enterprise, we offer the depth of resources to help investors succeed.
Expertise
Our multi-boutique model offers investors access to the independent thinking of premier investment managers that have been chosen for their time-tested strategies. While each team specializes in a specific investment strategy, collectively they provide investors a wide choice of distinct investment styles. Our dedication to investment excellence doesn’t end with our expertise in manager selection—risk management, analysis, and rigorous ongoing review seek to ensure each manager’s investment process remains consistent.
Partnership
Our collaborative approach is built around understanding the needs and goals of our clients. By adhering to core principles of sound judgment and steady guidance, we support you through every stage of the investment decision process.
Carefully consider the investment objectives, risks, charges, and expenses before investing. For a current prospectus and, if available, a summary prospectus, for Wells Fargo Advantage Funds, containing this and other information, visit wellsfargoadvantagefunds.com. Read it carefully before investing.
Wells Fargo Funds Management, LLC, a wholly owned subsidiary of Wells Fargo & Company, provides investment advisory and administrative services for Wells Fargo Advantage Funds. Other affiliates of Wells Fargo & Company provide subadvisory and other services for the Funds. The Funds are distributed by Wells Fargo Funds Distributor, LLC, Member FINRA/SIPC, an affiliate of Wells Fargo & Company.
“Dow Jones®” and “Dow Jones Target Date IndexesSM” are service marks of Dow Jones Trademark Holdings LLC (“Dow Jones”); have been licensed to CME Group Index Services LLC (“CME Indexes”); and have been sublicensed for use for certain purposes by Global Index Advisors, Inc., and Wells Fargo Funds Management, LLC. The Wells Fargo Advantage Dow Jones Target Date FundsSM, based on the Dow Jones Target Date Indexes, are not sponsored, endorsed, sold, or promoted by Dow Jones, CME Indexes, or their respective affiliates, and none of them makes any representation regarding the advisability of investing in such product(s).
NOT FDIC INSURED ¡ NO BANK GUARANTEE ¡ MAY LOSE VALUE
Not part of the semi-annual report.
Wells Fargo Advantage Funds offers more than 100 mutual funds across a wide range of asset classes, representing over $228 billion in assets under management, as of April 30, 2013.
| | | | |
| Equity funds | | | | |
Asia Pacific Fund | | Enterprise Fund† | | Opportunity Fund† |
C&B Large Cap Value Fund | | Global Opportunities Fund | | Precious Metals Fund |
C&B Mid Cap Value Fund | | Growth Fund | | Premier Large Company Growth Fund |
Capital Growth Fund | | Index Fund | | Small Cap Opportunities Fund |
Common Stock Fund | | International Equity Fund | | Small Cap Value Fund |
Disciplined U.S. Core Fund | | International Value Fund | | Small Company Growth Fund |
Discovery Fund† | | Intrinsic Small Cap Value Fund | | Small Company Value Fund |
Diversified Equity Fund | | Intrinsic Value Fund | | Small/Mid Cap Value Fund |
Diversified International Fund | | Intrinsic World Equity Fund | | Special Mid Cap Value Fund |
Emerging Growth Fund | | Large Cap Core Fund | | Special Small Cap Value Fund |
Emerging Markets Equity Fund | | Large Cap Growth Fund | | Specialized Technology Fund |
Emerging Markets Equity Income Fund | | Large Company Value Fund | | Traditional Small Cap Growth Fund |
Endeavor Select Fund† | | Omega Growth Fund | | Utility and Telecommunications Fund |
| Bond funds | | | | |
Adjustable Rate Government Fund | | High Yield Municipal Bond Fund | | Short Duration Government Bond Fund |
California Limited-Term Tax-Free Fund | | Income Plus Fund | | Short-Term Bond Fund |
California Tax-Free Fund | | Inflation-Protected Bond Fund | | Short-Term High Yield Bond Fund |
Colorado Tax-Free Fund | | Intermediate Tax/AMT-Free Fund | | Short-Term Municipal Bond Fund |
Conservative Income Fund | | International Bond Fund | | Strategic Income Fund |
Core Bond Fund | | Minnesota Tax-Free Fund | | Strategic Municipal Bond Fund |
Emerging Markets Local Bond Fund | | Municipal Bond Fund | | Ultra Short-Term Income Fund |
Government Securities Fund | | North Carolina Tax-Free Fund | | Ultra Short-Term Municipal Income Fund |
High Income Fund | | Pennsylvania Tax-Free Fund | | Wisconsin Tax-Free Fund |
High Yield Bond Fund | | | | |
| Asset allocation funds | | | | |
Absolute Return Fund | | WealthBuilder Equity Portfolio† | | Target 2020 Fund† |
Asset Allocation Fund | | WealthBuilder Growth Allocation Portfolio† | | Target 2025 Fund† |
Diversified Capital Builder Fund | | WealthBuilder Growth Balanced Portfolio† | | Target 2030 Fund† |
Diversified Income Builder Fund | | WealthBuilder Moderate Balanced Portfolio† | | Target 2035 Fund† |
Growth Balanced Fund | | WealthBuilder Tactical Equity Portfolio† | | Target 2040 Fund† |
Index Asset Allocation Fund | | Target Today Fund† | | Target 2045 Fund† |
Moderate Balanced Fund | | Target 2010 Fund† | | Target 2050 Fund† |
WealthBuilder Conservative Allocation Portfolio† | | Target 2015 Fund† | | Target 2055 Fund† |
| Money market funds | | | | |
100% Treasury Money Market Fund | | Heritage Money Market Fund† | | National Tax-Free Money Market Fund |
California Municipal Money Market Fund | | Money Market Fund | | Treasury Plus Money Market Fund |
Cash Investment Money Market Fund | | Municipal Cash Management Money Market Fund | | |
Government Money Market Fund | | Municipal Money Market Fund | | |
| Variable trust funds1 | | | | |
VT Discovery Fund† | | VT Intrinsic Value Fund | | VT Small Cap Growth Fund |
VT Index Asset Allocation Fund | | VT Omega Growth Fund | | VT Small Cap Value Fund |
VT International Equity Fund | | VT Opportunity Fund† | | VT Total Return Bond Fund |
An investment in a money market fund is not insured or guaranteed by the Federal Deposit Insurance Corporation or any other government agency. Although the Wells Fargo Advantage Money Market Funds seek to preserve the value of your investment at $1.00 per share, it is possible to lose money by investing in a money market fund.
| 1. | The variable trust funds are generally available only through insurance company variable contracts. |
| † | In this report, the Wells Fargo Advantage Discovery FundSM, Wells Fargo Advantage Endeavor Select FundSM, Wells Fargo Advantage Enterprise FundSM, Wells Fargo Advantage Opportunity FundSM, Wells Fargo Advantage WealthBuilder Conservative Allocation PortfolioSM, Wells Fargo Advantage WealthBuilder Equity PortfolioSM, Wells Fargo Advantage WealthBuilder Growth Allocation PortfolioSM, Wells Fargo Advantage WealthBuilder Growth Balanced PortfolioSM, Wells Fargo Advantage WealthBuilder Moderate Balanced PortfolioSM, Wells Fargo Advantage WealthBuilder Tactical Equity PortfolioSM, Wells Fargo Advantage Dow Jones Target Today FundSM, Wells Fargo Advantage Dow Jones Target 2010 FundSM, Wells Fargo Advantage Dow Jones Target 2015 FundSM, Wells Fargo Advantage Dow Jones Target 2020 FundSM, Wells Fargo Advantage Dow Jones Target 2025 FundSM, Wells Fargo Advantage Dow Jones Target 2030 FundSM, Wells Fargo Advantage Dow Jones Target 2035 FundSM, Wells Fargo Advantage Dow Jones Target 2040 FundSM, Wells Fargo Advantage Dow Jones Target 2045 FundSM, Wells Fargo Advantage Dow Jones Target 2050 FundSM, Wells Fargo Advantage Dow Jones Target 2055 FundSM, Wells Fargo Advantage Heritage Money Market FundSM, Wells Fargo Advantage VT Discovery FundSM, and Wells Fargo Advantage VT Opportunity FundSM are referred to as the Discovery Fund, Endeavor Select Fund, Enterprise Fund, Opportunity Fund, WealthBuilder Conservative Allocation Portfolio, WealthBuilder Equity Portfolio, WealthBuilder Growth Allocation Portfolio, WealthBuilder Growth Balanced Portfolio, WealthBuilder Moderate Balanced Portfolio, WealthBuilder Tactical Equity Portfolio, Target Today Fund, Target 2010 Fund, Target 2015 Fund, Target 2020 Fund, Target 2025 Fund, Target 2030 Fund, Target 2035 Fund, Target 2040 Fund, Target 2045 Fund, Target 2050 Fund, Target 2055 Fund, Heritage Money Market Fund, VT Discovery Fund, and VT Opportunity Fund, respectively. |
Not part of the semi-annual report.
| | | | |
| 2 | | Wells Fargo Advantage Special Small Cap Value Fund | | Letter to shareholders (unaudited) |

Karla M. Rabusch
President
Wells Fargo Advantage Funds
Relatively improving economic data in the U.S. and efforts by European authorities to address the sovereign debt issue alleviated investor fears and supported global stock markets.
Dear Valued Shareholder:
We are pleased to offer you this semi-annual report for the Wells Fargo Advantage Special Small Cap Value Fund for the six-month period that ended April 30, 2013. Much of the six-month period was marked by continued concerns about the possible effects that the ongoing European sovereign debt crisis would have on the global economy. However, relatively improving economic data in the U.S. and efforts by European authorities to address the sovereign debt issue alleviated investor fears and supported global stock markets. This backdrop enabled most equity asset classes to generate positive returns. For the six-month period, the small-cap-oriented Russell 2000® Index1 returned 16.58%, while the mid-cap-focused Russell Midcap® Index2 posted an 18.90% total return.
The U.S. economy improved with the support of accommodative monetary policy.
The U.S. economy grew modestly, but the recovery remained weak compared with previous business cycles. Curtailed government spending and weak household income expectations were economic headwinds. However, the unemployment rate continued to decline, reaching 7.5% in April 2013, and housing market activity, as measured by many metrics—sales, building permits, and prices—continued to improve from its recessionary levels.
Citing its dual mandate of fostering maximum employment and price stability, the U.S. Federal Reserve (Fed) reaffirmed its commitment to highly accommodative monetary policy. In addition, the Fed formally announced that exceptionally low interest rates would be appropriate at least as long as the unemployment rate remains above 6.5% and inflation remains no more than half a percentage point above its 2.0% inflation target.
The Fed also continued its quantitative easing program. Just prior to the beginning of the reporting period, the Federal Open Market Committee announced its intention to keep interest rates low until at least mid-2015 in order to support the sluggish economy. The Fed also announced open-ended purchases of $40 billion per month in mortgage-backed securities in an effort to support the housing market.
The global economy continues to be affected by bouts of uncertainty, including political questions in the U.S., Europe, and China.
Global economic growth varied across countries. Eurozone economies remained in recession. However, the European Central Bank (ECB) and several key members of the eurozone, including France and Germany, continued their commitment to maintaining a single currency. Subsequently, investor fears about a sovereign debt crisis in Europe abated. Furthermore, the ECB maintained its accommodative monetary policy by lowering its key rate at a historic low of 0.75%.
For most of the six-month period, uncertainty about political outcomes was a constant. U.S. presidential elections in November 2012, the debate over the fiscal cliff and tax rates at year-end, and speculation about the effects of sequestration at the end of February 2013 weighed on business leaders and investors. Elections in eurozone countries such as Greece, France, and Italy sparked speculation about the future of the eurozone. New leadership in China also figured into the political
| 1. | The Russell 2000® Index measures the performance of the 2,000 smallest companies in the Russell 3000® Index, which represents approximately 8% of the total market capitalization of the Russell 3000 Index. You cannot invest directly in an index. |
| 2. | The Russell Midcap® Index measures the performance of the 800 smallest companies in the Russell 1000® Index, which represent approximately 25% of the total market capitalization of the Russell 1000 Index. You cannot invest directly in an index. |
| | | | | | |
| Letter to shareholders (unaudited) | | Wells Fargo Advantage Special Small Cap Value Fund | | | 3 | |
landscape. In the end, investors managed around these concerns, and capital markets generally advanced during this time period.
Our goal is to meet the financial needs of our shareholders.
We are committed to providing our shareholders long-term investment strategies and focusing on appropriate risk while seeking to deliver consistent returns. We know that your ability to meet your long-term investment goals depends on the investment decisions you make today. Despite economic uncertainties and investment challenges, staying invested and adapting to emerging opportunities and threats will help you manage investment risk.
Thank you for choosing to invest with Wells Fargo Advantage Funds. We appreciate your confidence in us and remain committed to helping you meet your financial needs. For current information about your fund investments, contact your investment professional, visit our website at wellsfargoadvantagefunds.com, or call us directly at 1-800-222-8222. We are available 24 hours a day, 7 days a week.
Sincerely,

Karla M. Rabusch
President
Wells Fargo Advantage Funds
Despite economic uncertainties and investment challenges, staying invested and adapting to emerging opportunities and threats will help you manage investment risk.
| | | | |
| 4 | | Wells Fargo Advantage Special Small Cap Value Fund | | Performance highlights (unaudited) |
Investment objective
The Fund seeks long-term capital appreciation.
Adviser
Wells Fargo Funds Management, LLC
Subadviser
Wells Capital Management Incorporated
Portfolio managers
Robert Rifkin, CFA
James M. Tringas, CFA, CPA
Average annual total returns1 (%) as of April 30, 2013
| | | | | | | | | | | | | | | | | | | | | | | | | | | | | | | | | | |
| | | | | Including sales charge | | | Excluding sales charge | | | Expense ratios2 (%) | |
| | | Inception date | | 1 year | | | 5 year | | | 10 year | | | 1 year | | | 5 year | | | 10 year | | | Gross | | | Net3 | |
| Class A (ESPAX) | | 5-7-1993 | | | 3.78 | | | | 4.57 | | | | 9.19 | | | | 10.10 | | | | 5.81 | | | | 9.84 | | | | 1.39 | | | | 1.35 | |
| Class B (ESPBX)* | | 3-26-1999 | | | 4.28 | | | | 4.67 | | | | 9.27 | | | | 9.28 | | | | 5.00 | | | | 9.27 | | | | 2.14 | | | | 2.10 | |
| Class C (ESPCX) | | 12-12-2000 | | | 8.29 | | | | 5.01 | | | | 9.03 | | | | 9.29 | | | | 5.01 | | | | 9.03 | | | | 2.14 | | | | 2.10 | |
| Administrator Class (ESPIX) | | 7-23-1996 | | | – | | | | – | | | | – | | | | 10.40 | | | | 6.07 | | | | 10.13 | | | | 1.23 | | | | 1.10 | |
| Institutional Class (ESPNX) | | 7-30-2010 | | | – | | | | – | | | | – | | | | 10.56 | | | | 6.16 | | | | 10.17 | | | | 0.96 | | | | 0.95 | |
| Russell 2000® Value Index4 | | – | | | – | | | | – | | | | – | | | | 19.71 | | | | 6.60 | | | | 10.28 | | | | – | | | | – | |
| * | | Class B shares are closed to investment, except in connection with the reinvestment of any distributions and permitted exchanges. |
Figures quoted represent past performance, which is no guarantee of future results and do not reflect the deduction of taxes that a shareholder may pay on fund distributions or the redemption of fund shares. Investment return and principal value of an investment will fluctuate so that an investor’s shares, when redeemed, may be worth more or less than their original cost. Performance shown without sales charges would be lower if sales charges were reflected. Current performance may be lower or higher than the performance data quoted, which assumes the reinvestment of dividends and capital gains. Current month-end performance is available on the Fund’s website, wellsfargoadvantagefunds.com.
Index returns do not include transaction costs associated with buying and selling securities, any mutual fund fees or expenses, or any taxes. It is not possible to invest directly in an index.
For Class A shares, the maximum front-end sales charge is 5.75%. For Class B shares, the maximum contingent deferred sales charge is 5.00%. For Class C shares, the maximum contingent deferred sales charge is 1.00%. Performance including sales charge assumes the sales charge for the corresponding time period. Administrator Class and Institutional Class shares are sold without a front-end sales charge or contingent deferred sales charge.
Stock values fluctuate in response to the activities of individual companies and general market and economic conditions. Smaller-company stocks tend to be more volatile and less liquid than those of larger companies. Consult the Fund’s prospectus for additional information on these and other risks.
Please see footnotes on page 5.
| | | | | | |
| Performance highlights (unaudited) | | Wells Fargo Advantage Special Small Cap Value Fund | | | 5 | |
| | | | |
| Ten largest equity holdings5 (%) as of April 30, 2013 | |
First Citizens BancShares Incorporated | | | 4.12 | |
Kadant Incorporated | | | 3.28 | |
Matthews International Corporation Class A | | | 2.17 | |
UMB Financial Corporation | | | 2.04 | |
ATMI Incorporated | | | 1.95 | |
Franklin Electric Company Incorporated | | | 1.94 | |
Mueller Industries Incorporated | | | 1.66 | |
TreeHouse Foods Incorporated | | | 1.65 | |
Simpson Manufacturing Company Incorporated | | | 1.58 | |
ACI Worldwide Incorporated | | | 1.56 | |
| | |
| Sector distribution6 as of April 30, 2013 |
|
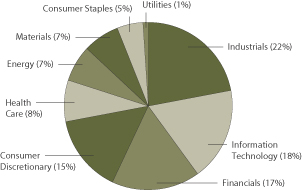
|
| 1. | Historical performance shown for the Institutional Class shares prior to their inception, reflects the performance of the Administrator Class shares, and includes the higher expenses applicable to the Administrator Class shares. If these expenses had not been included, returns would be higher. Historical performance shown for all classes of the Fund prior to July 19, 2010, is based on the performance of the Fund’s predecessor, Evergreen Special Values Fund. |
| 2. | Reflects the expense ratios as stated in the most recent prospectuses. |
| 3. | The Adviser has committed through February 28, 2014, to waive fees and/or reimburse expenses to the extent necessary to cap the Fund’s Total Annual Fund Operating Expenses After Fee Waiver, excluding certain expenses, at 1.34% for Class A, 2.09% for Class B, 2.09% for Class C, 1.09% for Administrator Class, and 0.94% for Institutional Class. Brokerage commissions, stamp duty fees, interest, taxes, acquired fund fees and expenses, and extraordinary expenses are excluded from the cap. Without this cap, the Fund’s returns would have been lower. |
| 4. | The Russell 2000® Value Index measures the performance of those Russell 2000 companies with lower price-to-book ratios and lower forecasted growth values. You cannot invest directly in an index. |
| 5. | The ten largest equity holdings are calculated based on the value of the securities divided by total net assets of the Fund. Holdings are subject to change and may have changed since the date specified. |
| 6. | Sector distribution is subject to change and is calculated based on the total long-term investments of the Fund. |
| | | | |
| 6 | | Wells Fargo Advantage Special Small Cap Value Fund | | Fund expenses (unaudited) |
As a shareholder of the Fund, you incur two types of costs: (1) transaction costs, including sales charges (loads) on purchase payments and contingent deferred sales charges (if any) on redemptions and (2) ongoing costs, including management fees, distribution (12b-1) and/or shareholder service fees, and other Fund expenses. This example is intended to help you understand your ongoing costs (in dollars) of investing in the Fund and to compare these costs with the ongoing costs of investing in other mutual funds.
The example is based on an investment of $1,000 invested at the beginning of the six-month period and held for the entire period from November 1, 2012 to April 30, 2013.
Actual expenses
The “Actual” line of the table below provides information about actual account values and actual expenses. You may use the information in this line, together with the amount you invested, to estimate the expenses that you paid over the period. Simply divide your account value by $1,000 (for example, an $8,600 account value divided by $1,000 = 8.6), then
multiply the result by the number in the “Actual” line under the heading entitled “Expenses paid during period” for your applicable class of shares to estimate the expenses you paid on your account during this period.
Hypothetical example for comparison purposes
The “Hypothetical” line of the table below provides information about hypothetical account values and hypothetical expenses based on the Fund’s actual expense ratio and an assumed rate of return of 5% per year before expenses, which is not the Fund’s actual return. The hypothetical account values and expenses may not be used to estimate the actual ending account balance or expenses you paid for the period. You may use this information to compare the ongoing costs of investing in the Fund and other funds. To do so, compare this 5% hypothetical example with the 5% hypothetical examples that appear in the shareholder reports of the other funds.
Please note that the expenses shown in the table are meant to highlight your ongoing costs only and do not reflect any transactional costs, such as sales charges (loads) and contingent deferred sales charges. Therefore, the “Hypothetical” line of the table is useful in comparing ongoing costs only and will not help you determine the relative total costs of owning different funds. In addition, if these transactional costs were included, your costs would have been higher.
| | | | | | | | | | | | | | | | |
| | | Beginning
account value
11-1-2012 | | | Ending
account value
4-30-2013 | | | Expenses
paid during
the period¹ | | | Net annual
expense ratio | |
Class A | | | | | | | | | | | | | | | | |
Actual | | $ | 1,000.00 | | | $ | 1,134.09 | | | $ | 7.09 | | | | 1.34 | % |
Hypothetical (5% return before expenses) | | $ | 1,000.00 | | | $ | 1,018.15 | | | $ | 6.71 | | | | 1.34 | % |
Class B | | | | | | | | | | | | | | | | |
Actual | | $ | 1,000.00 | | | $ | 1,129.75 | | | $ | 11.04 | | | | 2.09 | % |
Hypothetical (5% return before expenses) | | $ | 1,000.00 | | | $ | 1,014.43 | | | $ | 10.44 | | | | 2.09 | % |
Class C | | | | | | | | | | | | | | | | |
Actual | | $ | 1,000.00 | | | $ | 1,129.73 | | | $ | 11.04 | | | | 2.09 | % |
Hypothetical (5% return before expenses) | | $ | 1,000.00 | | | $ | 1,014.43 | | | $ | 10.44 | | | | 2.09 | % |
Administrator Class | | | | | | | | | | | | | | | | |
Actual | | $ | 1,000.00 | | | $ | 1,135.78 | | | $ | 5.77 | | | | 1.09 | % |
Hypothetical (5% return before expenses) | | $ | 1,000.00 | | | $ | 1,019.39 | | | $ | 5.46 | | | | 1.09 | % |
Institutional Class | | | | | | | | | | | | | | | | |
Actual | | $ | 1,000.00 | | | $ | 1,136.37 | | | $ | 4.98 | | | | 0.94 | % |
Hypothetical (5% return before expenses) | | $ | 1,000.00 | | | $ | 1,020.13 | | | $ | 4.71 | | | | 0.94 | % |
| 1. | Expenses paid is equal to the annualized expense ratio of each class multiplied by the average account value over the period, multiplied by the number of days in the most recent fiscal half-year divided by the number of days in the fiscal year (to reflect the one-half-year period). |
| | | | | | |
| Portfolio of investments—April 30, 2013 (unaudited) | | Wells Fargo Advantage Special Small Cap Value Fund | | | 7 | |
| | | | | | | | | | | | |
| Security name | | | | | | Shares | | | Value | |
| | | | |
Common Stocks: 96.30% | | | | | | | | | | | | |
| | | | |
Consumer Discretionary: 14.18% | | | | | | | | | | | | |
| | | | |
| Auto Components: 0.61% | | | | | | | | | | | | |
Modine Manufacturing Company † | | | | | | | 505,798 | | | $ | 4,622,991 | |
| | | | | | | | | | | | |
| | | | |
| Diversified Consumer Services: 3.60% | | | | | | | | | | | | |
Hillenbrand Incorporated | | | | | | | 428,902 | | | | 10,778,307 | |
Matthews International Corporation Class A « | | | | | | | 445,622 | | | | 16,403,346 | |
| | | | |
| | | | | | | | | | | 27,181,653 | |
| | | | | | | | | | | | |
| | | | |
| Hotels, Restaurants & Leisure: 1.92% | | | | | | | | | | | | |
Denny’s Corporation † | | | | | | | 1,691,844 | | | | 9,592,755 | |
The Wendy’s Company | | | | | | | 851,900 | | | | 4,847,311 | |
| | | | |
| | | | | | | | | | | 14,440,066 | |
| | | | | | | | | | | | |
| | | | |
| Household Durables: 1.96% | | | | | | | | | | | | |
Blyth Incorporated | | | | | | | 194,070 | | | | 3,198,274 | |
Cavco Industries Incorporated † | | | | | | | 117,967 | | | | 5,381,655 | |
Dixie Group Incorporated †** | | | | | | | 733,977 | | | | 4,389,182 | |
Helen of Troy Limited † | | | | | | | 52,700 | | | | 1,838,176 | |
| | | | |
| | | | | | | | | | | 14,807,287 | |
| | | | | | | | | | | | |
| | | | |
| Media: 0.90% | | | | | | | | | | | | |
AH Belo Corporation ** | | | | | | | 1,171,760 | | | | 6,796,208 | |
| | | | | | | | | | | | |
| | | | |
| Specialty Retail: 3.16% | | | | | | | | | | | | |
Christopher & Banks Corporation † | | | | | | | 711,645 | | | | 4,945,933 | |
Guess? Incorporated « | | | | | | | 346,400 | | | | 9,588,352 | |
The Men’s Wearhouse Incorporated | | | | | | | 277,400 | | | | 9,292,900 | |
| | | | |
| | | | | | | | | | | 23,827,185 | |
| | | | | | | | | | | | |
| | | | |
| Textiles, Apparel & Luxury Goods: 2.03% | | | | | | | | | | | | |
Delta Apparel Incorporated † | | | | | | | 304,839 | | | | 4,078,746 | |
Maidenform Brands Incorporated † | | | | | | | 623,300 | | | | 11,219,400 | |
| | | | |
| | | | | | | | | | | 15,298,146 | |
| | | | | | | | | | | | |
| | | | |
Consumer Staples: 4.62% | | | | | | | | | | | | |
| | | | |
| Food & Staples Retailing: 0.52% | | | | | | | | | | | | |
Casey’s General Stores Incorporated « | | | | | | | 68,300 | | | | 3,955,253 | |
| | | | | | | | | | | | |
| | | | |
| Food Products: 2.11% | | | | | | | | | | | | |
Seneca Foods Corporation Class A Ǡ | | | | | | | 104,892 | | | | 3,418,430 | |
TreeHouse Foods Incorporated † | | | | | | | 195,800 | | | | 12,474,418 | |
| | | | |
| | | | | | | | | | | 15,892,848 | |
| | | | | | | | | | | | |
| | | | |
| Household Products: 1.99% | | | | | | | | | | | | |
Central Garden & Pet Company † | | | | | | | 256,792 | | | | 2,246,930 | |
Central Garden & Pet Company Class A † | | | | | | | 218,702 | | | | 1,924,578 | |
The accompanying notes are an integral part of these financial statements.
| | | | |
| 8 | | Wells Fargo Advantage Special Small Cap Value Fund | | Portfolio of investments—April 30, 2013 (unaudited) |
| | | | | | | | | | | | |
| Security name | | | | | | Shares | | | Value | |
| | | | |
| Household Products (continued) | | | | | | | | | | | | |
WD-40 Company « | | | | | | | 201,536 | | | $ | 10,868,836 | |
| | | | |
| | | | | | | | | | | 15,040,344 | |
| | | | | | | | | | | | |
| | | | |
Energy: 6.90% | | | | | | | | | | | | |
| | | | |
| Energy Equipment & Services: 2.72% | | | | | | | | | | | | |
Atwood Oceanics Incorporated † | | | | | | | 104,800 | | | | 5,140,440 | |
Carbo Ceramics Incorporated « | | | | | | | 70,400 | | | | 4,973,760 | |
Steel Excel Incorporated † | | | | | | | 382,959 | | | | 10,416,485 | |
| | | | |
| | | | | | | | | | | 20,530,685 | |
| | | | | | | | | | | | |
| | | | |
| Oil, Gas & Consumable Fuels: 4.18% | | | | | | | | | | | | |
Bill Barrett Corporation Ǡ | | | | | | | 188,886 | | | | 3,751,276 | |
Comstock Resources Incorporated † | | | | | | | 696,263 | | | | 10,903,479 | |
Penn Virginia Corporation « | | | | | | | 723,300 | | | | 2,914,899 | |
Stone Energy Corporation † | | | | | | | 478,737 | | | | 9,445,481 | |
Swift Energy Company Ǡ | | | | | | | 350,147 | | | | 4,530,902 | |
| | | | |
| | | | | | | | | | | 31,546,037 | |
| | | | | | | | | | | | |
| | | | |
Financials: 15.99% | | | | | | | | | | | | |
| | | | |
| Capital Markets: 2.41% | | | | | | | | | | | | |
CIFC Corporation † | | | | | | | 253,585 | | | | 1,985,571 | |
Investment Technology Group Incorporated † | | | | | | | 678,651 | | | | 7,390,509 | |
Westwood Holdings Group Incorporated « | | | | | | | 201,612 | | | | 8,810,444 | |
| | | | |
| | | | | | | | | | | 18,186,524 | |
| | | | | | | | | | | | |
| | | | |
| Commercial Banks: 8.03% | | | | | | | | | | | | |
BBCN Bancorp Incorporated | | | | | | | 189,200 | | | | 2,436,896 | |
First Citizens BancShares Incorporated | | | | | | | 166,550 | | | | 31,048,251 | |
First Niagara Financial Group Incorporated | | | | | | | 718,450 | | | | 6,832,460 | |
TCF Financial Corporation « | | | | | | | 331,200 | | | | 4,818,960 | |
UMB Financial Corporation « | | | | | | | 306,161 | | | | 15,412,145 | |
| | | | |
| | | | | | | | | | | 60,548,712 | |
| | | | | | | | | | | | |
| | | | |
| Insurance: 3.45% | | | | | | | | | | | | |
Brown & Brown Incorporated | | | | | | | 288,000 | | | | 8,925,120 | |
Endurance Specialty Holdings Limited | | | | | | | 151,100 | | | | 7,399,367 | |
Fortegra Financial Corporation † | | | | | | | 289,220 | | | | 2,328,221 | |
Stewart Information Services Corporation | | | | | | | 183,974 | | | | 4,980,176 | |
Tower Group International Limited « | | | | | | | 127,700 | | | | 2,416,084 | |
| | | | |
| | | | | | | | | | | 26,048,968 | |
| | | | | | | | | | | | |
| | | | |
| REITs: 1.48% | | | | | | | | | | | | |
Pebblebrook Hotel Trust « | | | | | | | 64,300 | | | | 1,746,388 | |
Post Properties Incorporated | | | | | | | 139,581 | | | | 6,899,489 | |
Select Income REIT | | | | | | | 88,266 | | | | 2,518,229 | |
| | | | |
| | | | | | | | | | | 11,164,106 | |
| | | | | | | | | | | | |
The accompanying notes are an integral part of these financial statements.
| | | | | | |
| Portfolio of investments—April 30, 2013 (unaudited) | | Wells Fargo Advantage Special Small Cap Value Fund | | | 9 | |
| | | | | | | | | | | | |
| Security name | | | | | | Shares | | | Value | |
| | | | |
| Thrifts & Mortgage Finance: 0.62% | | | | | | | | | | | | |
Provident New York Bancorp | | | | | | | 517,116 | | | $ | 4,674,729 | |
| | | | | | | | | | | | |
| | | | |
Health Care: 7.77% | | | | | | | | | | | | |
| | | | |
| Health Care Equipment & Supplies: 4.10% | | | | | | | | | | | | |
Haemonetics Corporation † | | | | | | | 178,400 | | | | 6,868,400 | |
ICU Medical Incorporated † | | | | | | | 114,103 | | | | 6,874,706 | |
Steris Corporation | | | | | | | 127,700 | | | | 5,311,043 | |
Thoratec Corporation † | | | | | | | 124,100 | | | | 4,492,420 | |
West Pharmaceutical Services Incorporated | | | | | | | 115,300 | | | | 7,363,058 | |
| | | | |
| | | | | | | | | | | 30,909,627 | |
| | | | | | | | | | | | |
| | | | |
| Health Care Providers & Services: 1.17% | | | | | | | | | | | | |
Owens & Minor Incorporated « | | | | | | | 141,000 | | | | 4,592,370 | |
VCA Antech Incorporated † | | | | | | | 174,600 | | | | 4,207,860 | |
| | | | |
| | | | | | | | | | | 8,800,230 | |
| | | | | | | | | | | | |
| | | | |
| Health Care Technology: 0.67% | | | | | | | | | | | | |
Omnicell Incorporated † | | | | | | | 281,700 | | | | 5,076,234 | |
| | | | | | | | | | | | |
| | | | |
| Life Sciences Tools & Services: 1.54% | | | | | | | | | | | | |
Bio-Rad Laboratories Incorporated Class A † | | | | | | | 41,300 | | | | 4,945,675 | |
Cambrex Corporation † | | | | | | | 531,648 | | | | 6,640,284 | |
| | | | |
| | | | | | | | | | | 11,585,959 | |
| | | | | | | | | | | | |
| | | | |
| Pharmaceuticals: 0.29% | | | | | | | | | | | | |
Impax Laboratories Incorporated † | | | | | | | 126,500 | | | | 2,213,750 | |
| | | | | | | | | | | | |
| | | | |
Industrials: 21.73% | | | | | | | | | | | | |
| | | | |
| Air Freight & Logistics: 2.00% | | | | | | | | | | | | |
Atlas Air Worldwide Holdings Incorporated † | | | | | | | 97,853 | | | | 3,659,702 | |
Forward Air Corporation « | | | | | | | 310,409 | | | | 11,450,988 | |
| | | | |
| | | | | | | | | | | 15,110,690 | |
| | | | | | | | | | | | |
| | | | |
| Building Products: 2.58% | | | | | | | | | | | | |
Quanex Building Products Corporation | | | | | | | 461,999 | | | | 7,516,724 | |
Simpson Manufacturing Company Incorporated « | | | | | | | 414,600 | | | | 11,915,604 | |
| | | | |
| | | | | | | | | | | 19,432,328 | |
| | | | | | | | | | | | |
| | | | |
| Commercial Services & Supplies: 2.81% | | | | | | | | | | | | |
ACCO Brands Corporation Ǡ | | | | | | | 910,969 | | | | 6,149,041 | |
Courier Corporation | | | | | | | 248,912 | | | | 3,584,333 | |
Viad Corporation | | | | | | | 441,344 | | | | 11,497,011 | |
| | | | |
| | | | | | | | | | | 21,230,385 | |
| | | | | | | | | | | | |
| | | | |
| Electrical Equipment: 1.94% | | | | | | | | | | | | |
Franklin Electric Company Incorporated | | | | | | | 451,274 | | | | 14,607,739 | |
| | | | | | | | | | | | |
The accompanying notes are an integral part of these financial statements.
| | | | |
| 10 | | Wells Fargo Advantage Special Small Cap Value Fund | | Portfolio of investments—April 30, 2013 (unaudited) |
| | | | | | | | | | | | |
| Security name | | | | | | Shares | | | Value | |
| | | | |
| Machinery: 6.95% | | | | | | | | | | | | |
Commercial Vehicle Group Incorporated † | | | | | | | 325,670 | | | $ | 2,282,947 | |
Douglas Dynamics Incorporated « | | | | | | | 538,748 | | | | 7,537,085 | |
John Bean Technologies Corporation | | | | | | | 256,200 | | | | 5,313,588 | |
Kadant Incorporated ** | | | | | | | 894,680 | | | | 24,755,796 | |
Mueller Industries Incorporated | | | | | | | 242,320 | | | | 12,547,330 | |
| | | | |
| | | | | | | | | | | 52,436,746 | |
| | | | | | | | | | | | |
| | | | |
| Professional Services: 4.14% | | | | | | | | | | | | |
FTI Consulting Incorporated Ǡ | | | | | | | 208,800 | | | | 6,915,456 | |
Heidrick & Struggles International Incorporated | | | | | | | 272,500 | | | | 3,602,450 | |
Insperity Incorporated « | | | | | | | 179,800 | | | | 4,967,874 | |
Korn/Ferry International † | | | | | | | 487,500 | | | | 8,068,125 | |
Towers Watson & Company Class A | | | | | | | 105,600 | | | | 7,700,352 | |
| | | | |
| | | | | | | | | | | 31,254,257 | |
| | | | | | | | | | | | |
| | | | |
| Road & Rail: 0.36% | | | | | | | | | | | | |
Arkansas Best Corporation | | | | | | | 256,525 | | | | 2,696,078 | |
| | | | | | | | | | | | |
| | | | |
| Transportation Infrastructure: 0.95% | | | | | | | | | | | | |
Macquarie Infrastructure Company LLC | | | | | | | 122,765 | | | | 7,154,744 | |
| | | | | | | | | | | | |
| | | | |
Information Technology: 17.58% | | | | | | | | | | | | |
| | | | |
| Communications Equipment: 1.09% | | | | | | | | | | | | |
Aviat Networks Incorporated † | | | | | | | 1,005,347 | | | | 3,217,110 | |
Black Box Corporation | | | | | | | 130,300 | | | | 2,830,116 | |
NETGEAR Incorporated † | | | | | | | 72,400 | | | | 2,156,796 | |
| | | | |
| | | | | | | | | | | 8,204,022 | |
| | | | | | | | | | | | |
| | | | |
| Computers & Peripherals: 1.36% | | | | | | | | | | | | |
Imation Corporation †** | | | | | | | 2,781,521 | | | | 10,235,997 | |
| | | | | | | | | | | | |
| | | | |
| Electronic Equipment, Instruments & Components: 3.63% | | | | | | | | | | | | |
AVX Corporation | | | | | | | 698,448 | | | | 7,899,447 | |
Celestica Incorporated † | | | | | | | 270,314 | | | | 2,335,513 | |
Orbotech Limited † | | | | | | | 613,815 | | | | 6,291,604 | |
ScanSource Incorporated † | | | | | | | 96,700 | | | | 2,801,399 | |
Vishay Intertechnology Incorporated Ǡ | | | | | | | 574,721 | | | | 8,069,083 | |
| | | | |
| | | | | | | | | | | 27,397,046 | |
| | | | | | | | | | | | |
| | | | |
| Internet Software & Services: 0.74% | | | | | | | | | | | | |
EarthLink Incorporated | | | | | | | 985,975 | | | | 5,610,198 | |
| | | | | | | | | | | | |
| | | | |
| IT Services: 2.09% | | | | | | | | | | | | |
CACI International Incorporated Class A Ǡ | | | | | | | 71,000 | | | | 4,152,790 | |
Global Payments Incorporated | | | | | | | 122,400 | | | | 5,679,360 | |
Sykes Enterprises Incorporated Ǡ | | | | | | | 383,000 | | | | 5,894,370 | |
| | | | |
| | | | | | | | | | | 15,726,520 | |
| | | | | | | | | | | | |
The accompanying notes are an integral part of these financial statements.
| | | | | | |
| Portfolio of investments—April 30, 2013 (unaudited) | | Wells Fargo Advantage Special Small Cap Value Fund | | | 11 | |
| | | | | | | | | | | | | | |
| Security name | | | | | | | Shares | | | Value | |
| | | | |
| Semiconductors & Semiconductor Equipment: 4.54% | | | | | | | | | | | | | | |
ATMI Incorporated † | | | | | | | | | 676,233 | | | $ | 14,708,068 | |
DSP Group Incorporated † | | | | | | | | | 716,964 | | | | 5,785,899 | |
Exar Corporation Ǡ | | | | | | | | | 533,172 | | | | 5,747,594 | |
Lattice Semiconductor Corporation † | | | | | | | | | 1,720,881 | | | | 8,002,097 | |
| | | | |
| | | | | | | | | | | | | 34,243,658 | |
| | | | | | | | | | | | | | |
| | | | |
| Software: 4.13% | | | | | | | | | | | | | | |
ACI Worldwide Incorporated † | | | | | | | | | 250,332 | | | | 11,768,107 | |
NetScout Systems Incorporated † | | | | | | | | | 256,743 | | | | 5,856,308 | |
Progress Software Corporation Ǡ | | | | | | | | | 318,897 | | | | 7,197,505 | |
TIBCO Software Incorporated † | | | | | | | | | 327,500 | | | | 6,356,775 | |
| | | | |
| | | | | | | | | | | | | 31,178,695 | |
| | | | | | | | | | | | | | |
| | | | |
Materials: 6.28% | | | | | | | | | | | | | | |
| | | | |
| Chemicals: 2.18% | | | | | | | | | | | | | | |
A. Schulman Incorporated | | | | | | | | | 302,105 | | | | 7,845,667 | |
American Pacific Corporation † | | | | | | | | | 120,433 | | | | 2,951,813 | |
Plastec Technologies Limited Ǡ(a)(i) | | | | | | | | | 152,638 | | | | 961,619 | |
Sensient Technologies Corporation | | | | | | | | | 120,000 | | | | 4,722,000 | |
| | | | |
| | | | | | | | | | | | | 16,481,099 | |
| | | | | | | | | | | | | | |
| | | | |
| Metals & Mining: 0.84% | | | | | | | | | | | | | | |
Royal Gold Incorporated | | | | | | | | | 113,400 | | | | 6,302,772 | |
| | | | | | | | | | | | | | |
| | | | |
| Paper & Forest Products: 3.26% | | | | | | | | | | | | | | |
Clearwater Paper Corporation † | | | | | | | | | 57,894 | | | | 2,664,282 | |
Neenah Paper Incorporated | | | | | | | | | 397,168 | | | | 11,422,552 | |
Schweitzer Manduit International Incorporated | | | | | | | | | 260,424 | | | | 10,492,483 | |
| | | | |
| | | | | | | | | | | | | 24,579,317 | |
| | | | | | | | | | | | | | |
| | | | |
Utilities: 1.25% | | | | | | | | | | | | | | |
| | | | |
| Electric Utilities: 1.25% | | | | | | | | | | | | | | |
ALLETE Incorporated | | | | | | | | | 184,302 | | | | 9,463,907 | |
| | | | | | | | | | | | | | |
| | | | |
Total Common Stocks (Cost $688,272,095) | | | | | | | | | | | | | 726,493,740 | |
| | | | | | | | | | | | | | |
| | | | |
| | | | | Expiration date | | | | | | | |
| Warrants: 0.00% | | | | | | | | | | | | | | |
| | | | |
| Aerospace & Defense: 0.00% | | | | | | | | | | | | | | |
Plastec Technologies Limited †(a)(i) | | | | | 11-18-2014 | | | | 145,800 | | | | 0 | |
| | | | | | | | | | | | | | |
| | | | |
Total Warrants (Cost $0) | | | | | | | | | | | | | 0 | |
| | | | | | | | | | | | | | |
The accompanying notes are an integral part of these financial statements.
| | | | |
| 12 | | Wells Fargo Advantage Special Small Cap Value Fund | | Portfolio of investments—April 30, 2013 (unaudited) |
| | | | | | | | | | | | | | |
| Security name | | Yield | | | | | Shares | | | Value | |
| | | | |
Short-Term Investments: 12.50% | | | | | | | | | | | | | | |
| | | | |
| Investment Companies: 12.50% | | | | | | | | | | | | | | |
Wells Fargo Advantage Cash Investment Money Market Fund, Select Class (l)(u) | | | 0.13 | % | | | | | 23,370,599 | | | $ | 23,370,599 | |
Wells Fargo Securities Lending Cash Investments, LLC (l)(u)(r)(v) | | | 0.18 | | | | | | 70,878,799 | | | | 70,878,799 | |
| | | | |
Total Short-Term Investments (Cost $94,249,398) | | | | | | | | | | | | | 94,249,398 | |
| | | | | | | | | | | | | | |
| | | | | | | | |
Total investments in securities (Cost $782,521,493) * | | | 108.80 | % | | | 820,743,138 | |
Other assets and liabilities, net | | | (8.80 | ) | | | (66,363,661 | ) |
| | | | | | | | |
| Total net assets | | | 100.00 | % | | $ | 754,379,477 | |
| | | | | | | | |
| † | Non-income-earning security |
| « | All or a portion of this security is on loan. |
| ** | Represents an affiliate of the Fund under Section 2(a)(2) and 2(a)(3) of the Investment Company Act of 1940, as amended, as the Fund holds 5% or more of the issuer’s outstanding voting shares. |
| (l) | Investment in an affiliate |
| (a) | Security is fair valued by the Management Valuation Team, and in certain instances by the Board of Trustees, in accordance with procedures approved by the Board of Trustees. |
| (u) | Rate shown is the 7-day annualized yield at period end. |
| (r) | The investment company is exempt from registration under Section 3(c)(7) of the Investment Company Act of 1940, as amended. |
| (v) | Security represents investment of cash collateral received from securities on loan. |
| * | Cost for federal income tax purposes is $792,957,682 and unrealized appreciation (depreciation) consists of: |
| | | | |
Gross unrealized appreciation | | $ | 147,327,497 | |
Gross unrealized depreciation | | | (119,542,041 | ) |
| | | | |
Net unrealized appreciation | | $ | 27,785,456 | |
The accompanying notes are an integral part of these financial statements.
| | | | | | |
| Statement of assets and liabilities—April 30, 2013 (unaudited) | | Wells Fargo Advantage Special Small Cap Value Fund | | | 13 | |
| | | | |
| | | | |
| |
Assets | | | | |
Investments | | | | |
In unaffiliated securities (including securities on loan), at value (see cost below) | | $ | 680,316,557 | |
In affiliated securities, at value (see cost below) | | | 140,426,581 | |
| | | | |
Total investments, at value (see cost below) | | | 820,743,138 | |
Receivable for investments sold | | | 5,833,059 | |
Receivable for Fund shares sold | | | 270,836 | |
Receivable for dividends | | | 355,642 | |
Receivable for securities lending income | | | 7,927 | |
Prepaid expenses and other assets | | | 45,585 | |
| | | | |
Total assets | | | 827,256,187 | |
| | | | |
| |
Liabilities | | | | |
Payable for investments purchased | | | 530,653 | |
Payable for Fund shares redeemed | | | 564,411 | |
Payable upon receipt of securities loaned | | | 70,878,799 | |
Advisory fee payable | | | 439,211 | |
Distribution fees payable | | | 23,904 | |
Due to other related parties | | | 144,826 | |
Accrued expenses and other liabilities | | | 294,906 | |
| | | | |
Total liabilities | | | 72,876,710 | |
| | | | |
Total net assets | | $ | 754,379,477 | |
| | | | |
| |
NET ASSETS CONSIST OF | | | | |
Paid-in capital | | $ | 757,869,809 | |
Undistributed net investment income | | | 87,892 | |
Accumulated net realized losses on investments | | | (41,799,869 | ) |
Net unrealized gains on investments | | | 38,221,645 | |
| | | | |
Total net assets | | $ | 754,379,477 | |
| | | | |
| |
COMPUTATION OF NET ASSET VALUE AND OFFERING PRICE PER SHARE1 | | | | |
Net assets – Class A | | $ | 372,455,373 | |
Shares outstanding – Class A | | | 14,298,838 | |
Net asset value per share – Class A | | | $26.05 | |
Maximum offering price per share – Class A2 | | | $27.64 | |
Net assets – Class B | | $ | 5,028,038 | |
Shares outstanding – Class B | | | 206,223 | |
Net asset value per share – Class B | | | $24.38 | |
Net assets – Class C | | $ | 33,842,067 | |
Shares outstanding – Class C | | | 1,382,975 | |
Net asset value per share – Class C | | | $24.47 | |
Net assets – Administrator Class | | $ | 232,964,193 | |
Shares outstanding – Administrator Class | | | 8,812,212 | |
Net asset value per share – Administrator Class | | | $26.44 | |
Net assets – Institutional Class | | $ | 110,089,806 | |
Shares outstanding – Institutional Class | | | 4,155,864 | |
Net asset value per share – Institutional Class | | | $26.49 | |
| |
Investments in unaffiliated securities (including securities on loan), at cost | | $ | 588,037,875 | |
| | | | |
Investments in affiliated securities, at cost | | $ | 194,483,618 | |
| | | | |
Total investments, at cost | | $ | 782,521,493 | |
| | | | |
Securities on loan, at value | | $ | 69,091,148 | |
| | | | |
| 1. | The Fund has an unlimited number of authorized shares. |
| 2. | Maximum offering price is computed as 100/94.25 of net asset value. On investments of $50,000 or more, the offering price is reduced. |
The accompanying notes are an integral part of these financial statements.
| | | | |
| 14 | | Wells Fargo Advantage Special Small Cap Value Fund | | Statement of operations—six months ended April 30, 2013 (unaudited) |
| | | | |
| | | | |
| |
Investment income | | | | |
Dividends | | $ | 5,052,302 | |
Income from affiliated securities | | | 551,167 | |
Securities lending income, net | | | 144,882 | |
Interest | | | 11,267 | |
| | | | |
Total investment income | | | 5,759,618 | |
| | | | |
| |
Expenses | | | | |
Advisory fee | | | 2,960,531 | |
Administration fees | | | | |
Fund level | | | 187,003 | |
Class A | | | 486,674 | |
Class B | | | 9,110 | |
Class C | | | 43,910 | |
Administrator Class | | | 113,095 | |
Institutional Class | | | 42,669 | |
Shareholder servicing fees | | | | |
Class A | | | 467,956 | |
Class B | | | 8,760 | |
Class C | | | 42,221 | |
Administrator Class | | | 281,444 | |
Distribution fees | | | | |
Class B | | | 26,279 | |
Class C | | | 126,663 | |
Custody and accounting fees | | | 31,141 | |
Professional fees | | | 8,969 | |
Registration fees | | | 38,343 | |
Shareholder report expenses | | | 77,987 | |
Trustees’ fees and expenses | | | 6,854 | |
Other fees and expenses | | | 7,138 | |
| | | | |
Total expenses | | | 4,966,747 | |
Less: Fee waivers and/or expense reimbursements | | | (298,365 | ) |
| | | | |
Net expenses | | | 4,668,382 | |
| | | | |
Net investment income | | | 1,091,236 | |
| | | | |
| |
REALIZED AND UNREALIZED GAINS (LOSSES) ON INVESTMENTS | | | | |
| |
Net realized gains on: | | | | |
Unaffiliated securities | | | 19,178,825 | |
Affiliated securities | | | 290,030 | |
| | | | |
Net realized gains on investments | | | 19,468,855 | |
| | | | |
| |
Net change in unrealized gains (losses) on: | | | | |
Unaffiliated securities | | | 71,901,798 | |
Affiliated securities | | | 2,809,020 | |
| | | | |
Net change in unrealized gains (losses) on investments | | | 74,710,818 | |
| | | | |
Net realized and unrealized gains (losses) on investments | | | 94,179,673 | |
| | | | |
Net increase in net assets resulting from operations | | $ | 95,270,909 | |
| | | | |
The accompanying notes are an integral part of these financial statements.
| | | | | | |
| Statement of changes in net assets | | Wells Fargo Advantage Special Small Cap Value Fund | | | 15 | |
| | | | | | | | | | | | | | | | |
| | | Six months ended April 30, 2013 (unaudited) | | | Year ended October 31, 2012 | |
| | | | |
Operations | | | | | | | | | | | | | | | | |
Net investment income (loss) | | | | | | $ | 1,091,236 | | | | | | | $ | (673,295 | ) |
Net realized gains on investments | | | | | | | 19,468,855 | | | | | | | | 27,228,632 | |
Net change in unrealized gains (losses) on investments | | | | | | | 74,710,818 | | | | | | | | 43,238,994 | |
| | | | | | | | | | | | | | | | |
Net increase in net assets resulting from operations | | | | | | | 95,270,909 | | | | | | | | 69,794,331 | |
| | | | | | | | | | | | | | | | |
| | | | |
Distributions to shareholders from | | | | | | | | | | | | | | | | |
Net investment income | | | | | | | | | | | | | | | | |
Administrator Class | | | | | | | (8,070 | ) | | | | | | | 0 | |
Institutional Class | | | | | | | (231,386 | ) | | | | | | | 0 | |
| | | | | | | | | | | | | | | | |
Total distributions to shareholders | | | | | | | (239,456 | ) | | | | | | | 0 | |
| | | | | | | | | | | | | | | | |
| | | | |
| | | Shares | | | | | | Shares | | | | |
| | | | |
Capital share transactions | | | | | | | | | | | | | | | | |
Proceeds from shares sold | | | | | | | | | | | | | | | | |
Class A | | | 679,357 | | | | 16,805,640 | | | | 2,091,715 | | | | 47,245,601 | |
Class B | | | 327 | | | | 7,567 | | | | 11,587 | | | | 258,982 | |
Class C | | | 57,879 | | | | 1,355,010 | | | | 124,491 | | | | 2,676,874 | |
Administrator Class | | | 449,414 | | | | 11,532,283 | | | | 931,468 | | | | 21,315,513 | |
Institutional Class | | | 1,298,877 | | | | 31,765,466 | | | | 2,983,669 | | | | 66,616,552 | |
| | | | | | | | | | | | | | | | |
| | | | | | | 61,465,966 | | | | | | | | 138,113,522 | |
| | | | | | | | | | | | | | | | |
Reinvestment of distributions | | | | | | | | | | | | | | | | |
Administrator Class | | | 332 | | | | 7,912 | | | | 0 | | | | 0 | |
Institutional Class | | | 5,226 | | | | 124,733 | | | | 0 | | | | 0 | |
| | | | | | | | | | | | | | | | |
| | | | | | | 132,645 | | | | | | | | 0 | |
| | | | | | | | | | | | | | | | |
Payment for shares redeemed | | | | | | | | | | | | | | | | |
Class A | | | (2,330,420 | ) | | | (58,101,163 | ) | | | (4,631,572 | ) | | | (104,361,770 | ) |
Class B | | | (219,098 | ) | | | (5,074,838 | ) | | | (697,355 | ) | | | (14,889,685 | ) |
Class C | | | (220,768 | ) | | | (5,171,333 | ) | | | (298,688 | ) | | | (6,382,861 | ) |
Administrator Class | | | (1,614,259 | ) | | | (39,547,206 | ) | | | (3,851,721 | ) | | | (86,359,235 | ) |
Institutional Class | | | (918,383 | ) | | | (23,674,319 | ) | | | (494,829 | ) | | | (11,412,744 | ) |
| | | | | | | | | | | | | | | | |
| | | | | | | (131,568,859 | ) | | | | | | | (223,406,295 | ) |
| | | | | | | | | | | | | | | | |
Net decrease in net assets resulting from capital share transactions | | | | | | | (69,970,248 | ) | | | | | | | (85,292,773 | ) |
| | | | | | | | | | | | | | | | |
Total increase (decrease) in net assets | | | | | | | 25,061,205 | | | | | | | | (15,498,442 | ) |
| | | | | | | | | | | | | | | | |
| | | | |
Net assets | | | | | | | | | | | | | | | | |
Beginning of period | | | | | | | 729,318,272 | | | | | | | | 744,816,714 | |
| | | | | | | | | | | | | | | | |
End of period | | | | | | $ | 754,379,477 | | | | | | | $ | 729,318,272 | |
| | | | | | | | | | | | | | | | |
Undistributed net investment income (loss) | | | | | | $ | 87,892 | | | | | | | $ | (763,888 | ) |
| | | | | | | | | | | | | | | | |
The accompanying notes are an integral part of these financial statements.
| | | | |
| 16 | | Wells Fargo Advantage Special Small Cap Value Fund | | Financial highlights |
(For a share outstanding throughout each period)
| | | | | | | | | | | | | | | | | | | | | | | | | | | | |
| | | Six months ended
April 30, 2013 (unaudited) | | | Year ended October 31 | | | Year ended July 31 | |
| CLASS A | | | 2012 | | | 2011 | | | 20101 | | | 20102 | | | 20092 | | | 20082 | |
Net asset value, beginning of period | | $ | 22.97 | | | $ | 20.97 | | | $ | 19.78 | | | $ | 18.50 | | | $ | 15.51 | | | $ | 18.78 | | | $ | 27.25 | |
Net investment income (loss) | | | 0.02 | | | | (0.05 | ) | | | (0.05 | ) | | | (0.01 | ) | | | (0.02 | ) | | | 0.11 | | | | 0.15 | |
Net realized and unrealized gains (losses)
on investments | | | 3.06 | | | | 2.05 | | | | 1.24 | | | | 1.29 | | | | 3.07 | | | | (3.19 | ) | | | (3.83 | ) |
| | | | | | | | | | | | | | | | | | | | | | | | | | | | |
Total from investment operations | | | 3.08 | | | | 2.00 | | | | 1.19 | | | | 1.28 | | | | 3.05 | | | | (3.08 | ) | | | (3.68 | ) |
Distributions to shareholders from | | | | | | | | | | | | | | | | | | | | | | | | | | | | |
Net investment income | | | 0.00 | | | | 0.00 | | | | 0.00 | | | | 0.00 | | | | (0.01 | ) | | | (0.19 | ) | | | (0.27 | ) |
Net realized gains | | | 0.00 | | | | 0.00 | | | | 0.00 | | | | 0.00 | | | | 0.00 | | | | (0.00 | )3 | | | (4.52 | ) |
Tax basis return of capital | | | 0.00 | | | | 0.00 | | | | 0.00 | | | | 0.00 | | | | (0.05 | )4 | | | 0.00 | | | | 0.00 | |
| | | | | | | | | | | | | | | | | | | | | | | | | | | | |
Total distributions to shareholders | | | 0.00 | | | | 0.00 | | | | 0.00 | | | | 0.00 | | | | (0.06 | ) | | | (0.19 | ) | | | (4.79 | ) |
Net asset value, end of period | | $ | 26.05 | | | $ | 22.97 | | | $ | 20.97 | | | $ | 19.78 | | | $ | 18.50 | | | $ | 15.51 | | | $ | 18.78 | |
Total return5 | | | 13.41 | % | | | 9.54 | % | | | 6.02 | % | | | 6.92 | % | | | 19.72 | % | | | (16.17 | )% | | | (15.22 | )% |
Ratios to average net assets (annualized) | | | | | | | | | | | | | | | | | | | | | | | | | | | | |
Gross expenses | | | 1.40 | % | | | 1.38 | % | | | 1.37 | % | | | 1.46 | % | | | 1.43 | % | | | 1.43 | % | | | 1.36 | % |
Net expenses | | | 1.34 | % | | | 1.34 | % | | | 1.34 | % | | | 1.34 | % | | | 1.39 | % | | | 1.33 | % | | | 1.31 | % |
Net investment income (loss) | | | 0.20 | % | | | (0.16 | )% | | | (0.14 | )% | | | (0.19 | )% | | | (0.07 | )% | | | 0.69 | % | | | 0.73 | % |
Supplemental data | | | | | | | | | | | | | | | | | | | | | | | | | | | | |
Portfolio turnover rate | | | 30 | % | | | 69 | % | | | 54 | % | | | 7 | % | | | 45 | % | | | 43 | % | | | 48 | % |
Net assets, end of period (000s omitted) | | | $372,455 | | | | $366,320 | | | | $387,767 | | | | $477,079 | | | | $472,903 | | | | $442,973 | | | | $598,656 | |
| 1. | For the three months ended October 31, 2010. The Fund changed its fiscal year end from July 31 to October 31, effective October 31, 2010. |
| 2. | After the close of business on July 16, 2010, the Fund acquired the net assets of Evergreen Special Values Fund and Evergreen Small Cap Value Fund. Evergreen Special Values Fund became the accounting and performance survivor in the transaction. The information for the periods prior to July 19, 2010 is that of Class A of Evergreen Special Values Fund. |
| 3. | Amount is less than $0.005. |
| 4. | Calculated based upon average shares outstanding |
| 5. | Total return calculations do not include any sales charges. Returns for periods of less than one year are not annualized. |
The accompanying notes are an integral part of these financial statements.
| | | | | | |
| Financial highlights | | Wells Fargo Advantage Special Small Cap Value Fund | | | 17 | |
(For a share outstanding throughout each period)
| | | | | | | | | | | | | | | | | | | | | | | | | | | | |
| | | Six months ended
April 30, 2013 (unaudited) | | | Year ended October 31 | | | Year ended July 31 | |
| CLASS B | | | 2012 | | | 2011 | | | 20101 | | | 20102 | | | 20092 | | | 20082 | |
Net asset value, beginning of period | | $ | 21.58 | | | $ | 19.85 | | | $ | 18.87 | | | $ | 17.68 | | | $ | 14.88 | | | $ | 17.92 | | | $ | 26.17 | |
Net investment income (loss) | | | (0.06 | )3 | | | (0.19 | )3 | | | (0.18 | )3 | | | (0.08 | ) | | | (0.14 | )3 | | | 0.00 | 3,4 | | | (0.00 | )3,4 |
Net realized and unrealized gains (losses)
on investments | | | 2.86 | | | | 1.92 | | | | 1.16 | | | | 1.27 | | | | 2.94 | | | | (3.02 | ) | | | (3.67 | ) |
| | | | | | | | | | | | | | | | | | | | | | | | | | | | |
Total from investment operations | | | 2.80 | | | | 1.73 | | | | 0.98 | | | | 1.19 | | | | 2.80 | | | | (3.02 | ) | | | (3.67 | ) |
Distributions to shareholders from | | | | | | | | | | | | | | | | | | | | | | | | | | | | |
Net investment income | | | 0.00 | | | | 0.00 | | | | 0.00 | | | | 0.00 | | | | 0.00 | | | | (0.02 | ) | | | (0.06 | ) |
Net realized gains | | | 0.00 | | | | 0.00 | | | | 0.00 | | | | 0.00 | | | | 0.00 | | | | (0.00 | )4 | | | (4.52 | ) |
| | | | | | | | | | | | | | | | | | | | | | | | | | | | |
Total distributions to shareholders | | | 0.00 | | | | 0.00 | | | | 0.00 | | | | 0.00 | | | | 0.00 | | | | (0.02 | ) | | | (4.58 | ) |
Net asset value, end of period | | $ | 24.38 | | | $ | 21.58 | | | $ | 19.85 | | | $ | 18.87 | | | $ | 17.68 | | | $ | 14.88 | | | $ | 17.92 | |
Total return5 | | | 12.97 | % | | | 8.72 | % | | | 5.19 | % | | | 6.73 | % | | | 18.82 | % | | | (16.83 | )% | | | (15.80 | )% |
Ratios to average net assets (annualized) | | | | | | | | | | | | | | | | | | | | | | | | | | | | |
Gross expenses | | | 2.15 | % | | | 2.12 | % | | | 2.13 | % | | | 2.21 | % | | | 2.18 | % | | | 2.17 | % | | | 2.11 | % |
Net expenses | | | 2.09 | % | | | 2.09 | % | | | 2.09 | % | | | 2.09 | % | | | 2.15 | % | | | 2.07 | % | | | 2.06 | % |
Net investment income (loss) | | | (0.49 | )% | | | (0.89 | )% | | | (0.88 | )% | | | (0.93 | )% | | | (0.82 | )% | | | 0.01 | % | | | (0.02 | )% |
Supplemental data | | | | | | | | | | | | | | | | | | | | | | | | | | | | |
Portfolio turnover rate | | | 30 | % | | | 69 | % | | | 54 | % | | | 7 | % | | | 45 | % | | | 43 | % | | | 48 | % |
Net assets, end of period (000s omitted) | | | $5,028 | | | | $9,171 | | | | $22,053 | | | | $36,922 | | | | $36,654 | | | | $41,008 | | | | $91,409 | |
| 1. | For the three months ended October 31, 2010. The Fund changed its fiscal year end from July 31 to October 31, effective October 31, 2010. |
| 2. | After the close of business on July 16, 2010, the Fund acquired the net assets of Evergreen Special Values Fund and Evergreen Small Cap Value Fund. Evergreen Special Values Fund became the accounting and performance survivor in the transaction. The information for the periods prior to July 19, 2010 is that of Class B of Evergreen Special Values Fund. |
| 3. | Calculated based upon average shares outstanding |
| 4. | Amount is less than $0.005. |
| 5. | Total return calculations do not include any sales charges. Returns for periods of less than one year are not annualized. |
The accompanying notes are an integral part of these financial statements.
| | | | |
| 18 | | Wells Fargo Advantage Special Small Cap Value Fund | | Financial highlights |
(For a share outstanding throughout each period)
| | | | | | | | | | | | | | | | | | | | | | | | | | | | |
| | | Six months ended
April 30, 2013 (unaudited) | | | Year ended October 31 | | | Year ended July 31 | |
| CLASS C | | | 2012 | | | 2011 | | | 20101 | | | 20102 | | | 20092 | | | 20082 | |
Net asset value, beginning of period | | $ | 21.66 | | | $ | 19.92 | | | $ | 18.94 | | | $ | 17.74 | | | $ | 14.93 | | | $ | 17.98 | | | $ | 26.24 | |
Net investment loss | | | (0.06 | )3 | | | (0.19 | )3 | | | (0.18 | )3 | | | (0.07 | ) | | | (0.18 | ) | | | (0.00 | )3,4 | | | (0.00 | )3,4 |
Net realized and unrealized gains (losses)
on investments | | | 2.87 | | | | 1.93 | | | | 1.16 | | | | 1.27 | | | | 2.99 | | | | (3.03 | ) | | | (3.69 | ) |
| | | | | | | | | | | | | | | | | | | | | | | | | | | | |
Total from investment operations | | | 2.81 | | | | 1.74 | | | | 0.98 | | | | 1.20 | | | | 2.81 | | | | (3.03 | ) | | | (3.69 | ) |
Distributions to shareholders from | | | | | | | | | | | | | | | | | | | | | | | | | | | | |
Net investment income | | | 0.00 | | | | 0.00 | | | | 0.00 | | | | 0.00 | | | | 0.00 | | | | (0.02 | ) | | | (0.05 | ) |
Net realized gains | | | 0.00 | | | | 0.00 | | | | 0.00 | | | | 0.00 | | | | 0.00 | | | | (0.00 | )4 | | | (4.52 | ) |
| | | | | | | | | | | | | | | | | | | | | | | | | | | | |
Total distributions to shareholders | | | 0.00 | | | | 0.00 | | | | 0.00 | | | | 0.00 | | | | 0.00 | | | | (0.02 | ) | | | (4.57 | ) |
Net asset value, end of period | | $ | 24.47 | | | $ | 21.66 | | | $ | 19.92 | | | $ | 18.94 | | | $ | 17.74 | | | $ | 14.93 | | | $ | 17.98 | |
Total return5 | | | 12.97 | % | | | 8.73 | % | | | 5.17 | % | | | 6.76 | % | | | 18.82 | % | | | (16.79 | )% | | | (15.86 | )% |
Ratios to average net assets (annualized) | | | | | | | | | | | | | | | | | | | | | | | | | | | | |
Gross expenses | | | 2.15 | % | | | 2.13 | % | | | 2.13 | % | | | 2.21 | % | | | 2.18 | % | | | 2.17 | % | | | 2.11 | % |
Net expenses | | | 2.09 | % | | | 2.09 | % | | | 2.09 | % | | | 2.09 | % | | | 2.12 | % | | | 2.07 | % | | | 2.06 | % |
Net investment loss | | | (0.55 | )% | | | (0.91 | )% | | | (0.89 | )% | | | (0.93 | )% | | | (0.80 | )% | | | (0.03 | )% | | | (0.02 | )% |
Supplemental data | | | | | | | | | | | | | | | | | | | | | | | | | | | | |
Portfolio turnover rate | | | 30 | % | | | 69 | % | | | 54 | % | | | 7 | % | | | 45 | % | | | 43 | % | | | 48 | % |
Net assets, end of period (000s omitted) | | | $33,842 | | | | $33,478 | | | | $34,270 | | | | $40,850 | | | | $40,968 | | | | $38,744 | | | | $61,307 | |
| 1. | For the three months ended October 31, 2010. The Fund changed its fiscal year end from July 31 to October 31, effective October 31, 2010. |
| 2. | After the close of business on July 16, 2010, the Fund acquired the net assets of Evergreen Special Values Fund and Evergreen Small Cap Value Fund. Evergreen Special Values Fund became the accounting and performance survivor in the transaction. The information for the periods prior to July 19, 2010 is that of Class C of Evergreen Special Values Fund. |
| 3. | Calculated based upon average shares outstanding |
| 4. | Amount is less than $0.005. |
| 5. | Total return calculations do not include any sales charges. Returns for periods of less than one year are not annualized. |
The accompanying notes are an integral part of these financial statements.
| | | | | | |
| Financial highlights | | Wells Fargo Advantage Special Small Cap Value Fund | | | 19 | |
(For a share outstanding throughout each period)
| | | | | | | | | | | | | | | | | | | | | | | | | | | | |
| | | Six months ended
April 30, 2013 (unaudited) | | | Year ended October 31 | | | Year ended July 31 | |
| ADMINISTRATOR CLASS | | | 2012 | | | 2011 | | | 20101 | | | 20102 | | | 20092 | | | 20082 | |
Net asset value, beginning of period | | $ | 23.28 | | | $ | 21.21 | | | $ | 19.96 | | | $ | 18.65 | | | $ | 15.63 | | | $ | 18.95 | | | $ | 27.46 | |
Net investment income | | | 0.06 | 3 | | | 0.02 | 3 | | | 0.02 | 3 | | | 0.01 | | | | 0.04 | 3 | | | 0.16 | | | | 0.21 | |
Net realized and unrealized gains (losses)
on investments | | | 3.10 | | | | 2.05 | | | | 1.23 | | | | 1.30 | | | | 3.04 | | | | (3.23 | ) | | | (3.87 | ) |
| | | | | | | | | | | | | | | | | | | | | | | | | | | | |
Total from investment operations | | | 3.16 | | | | 2.07 | | | | 1.25 | | | | 1.31 | | | | 3.08 | | | | (3.07 | ) | | | (3.66 | ) |
Distributions to shareholders from | | | | | | | | | | | | | | | | | | | | | | | | | | | | |
Net investment income | | | (0.00 | )4 | | | 0.00 | | | | 0.00 | | | | 0.00 | | | | (0.01 | ) | | | (0.25 | ) | | | (0.33 | ) |
Net realized gains | | | 0.00 | | | | 0.00 | | | | 0.00 | | | | 0.00 | | | | 0.00 | | | | (0.00 | )4 | | | (4.52 | ) |
Tax basis return of capital | | | 0.00 | | | | 0.00 | | | | 0.00 | | | | 0.00 | | | | (0.05 | )3 | | | 0.00 | | | | 0.00 | |
| | | | | | | | | | | | | | | | | | | | | | | | | | | | |
Total distributions to shareholders | | | 0.00 | | | | 0.00 | | | | 0.00 | | | | 0.00 | | | | (0.06 | ) | | | (0.25 | ) | | | (4.85 | ) |
Net asset value, end of period | | $ | 26.44 | | | $ | 23.28 | | | $ | 21.21 | | | $ | 19.96 | | | $ | 18.65 | | | $ | 15.63 | | | $ | 18.95 | |
Total return5 | | | 13.58 | % | | | 9.76 | % | | | 6.26 | % | | | 7.02 | % | | | 20.02 | % | | | (15.96 | )% | | | (15.00 | )% |
Ratios to average net assets (annualized) | | | | | | | | | | | | | | | | | | | | | | | | | | | | |
Gross expenses | | | 1.24 | % | | | 1.22 | % | | | 1.22 | % | | | 1.30 | % | | | 1.17 | % | | | 1.18 | % | | | 1.11 | % |
Net expenses | | | 1.09 | % | | | 1.09 | % | | | 1.09 | % | | | 1.09 | % | | | 1.13 | % | | | 1.08 | % | | | 1.06 | % |
Net investment income | | | 0.45 | % | | | 0.10 | % | | | 0.12 | % | | | 0.05 | % | | | 0.21 | % | | | 0.95 | % | | | 0.98 | % |
Supplemental data | | | | | | | | | | | | | | | | | | | | | | | | | | | | |
Portfolio turnover rate | | | 30 | % | | | 69 | % | | | 54 | % | | | 7 | % | | | 45 | % | | | 43 | % | | | 48 | % |
Net assets, end of period (000s omitted) | | | $232,964 | | | | $232,283 | | | | $273,510 | | | | $335,766 | | | | $320,814 | | | | $525,865 | | | | $722,786 | |
| 1. | For the three months ended October 31, 2010. The Fund changed its fiscal year end from July 31 to October 31, effective October 31, 2010. |
| 2. | After the close of business on July 16, 2010, the Fund acquired the net assets of Evergreen Special Values Fund and Evergreen Small Cap Value Fund. Evergreen Special Values Fund became the accounting and performance survivor in the transaction. The information for the periods prior to July 19, 2010 is that of Class I of Evergreen Special Values Fund. |
| 3. | Calculated based upon average shares outstanding |
| 4. | Amount is less than $0.005. |
| 5. | Returns for periods of less than one year are not annualized. |
The accompanying notes are an integral part of these financial statements.
| | | | |
| 20 | | Wells Fargo Advantage Special Small Cap Value Fund | | Financial highlights |
(For a share outstanding throughout each period)
| | | | | | | | | | | | | | | | | | | | |
| | | Six months ended
April 30, 2013 (unaudited) | | | Year ended October 31 | | | Year ended
July 31, 20122 | |
| INSTITUTIONAL CLASS | | | 2012 | | | 2011 | | | 20101 | | |
Net asset value, beginning of period | | $ | 23.36 | | | $ | 21.24 | | | $ | 19.96 | | | $ | 18.66 | | | $ | 18.66 | |
Net Investment income (loss) | | | 0.07 | 3 | | | 0.05 | 3 | | | 0.04 | | | | (0.02 | )3 | | | 0.00 | 3,4 |
Net realized and unrealized gains (losses) on investments | | | 3.11 | | | | 2.07 | | | | 1.24 | | | | 1.32 | | | | 0.00 | 4 |
| | | | | | | | | | | | | | | | | | | | |
Total from investment operations | | | 3.18 | | | | 2.12 | | | | 1.28 | | | | 1.30 | | | | 0.00 | 4 |
Distributions to shareholders from | | | | | | | | | | | | | | | | | | | | |
Net investment income | | | (0.05 | ) | | | 0.00 | | | | 0.00 | | | | 0.00 | | | | 0.00 | |
Net asset value, end of period | | $ | 26.49 | | | $ | 23.36 | | | $ | 21.24 | | | $ | 19.96 | | | $ | 18.66 | |
Total return5 | | | 13.64 | % | | | 9.98 | % | | | 6.41 | % | | | 7.02 | % | | | 0.00 | % |
Ratios to average net assets (annualized) | | | | | | | | | | | | | | | | | | | | |
Gross expenses | | | 0.97 | % | | | 0.95 | % | | | 0.94 | % | | | 1.10 | % | | | 0.00 | % |
Net expenses | | | 0.94 | % | | | 0.94 | % | | | 0.93 | % | | | 0.94 | % | | | 0.00 | % |
Net investment income (loss) | | | 0.58 | % | | | 0.21 | % | | | 0.19 | % | | | (0.38 | )% | | | 0.00 | % |
Supplemental data | | | | | | | | | | | | | | | | | | | | |
Portfolio turnover rate | | | 30 | % | | | 69 | % | | | 54 | % | | | 7 | % | | | 45 | % |
Net assets, end of period (000s omitted) | | | $110,090 | | | | $88,067 | | | | $27,217 | | | | $3,106 | | | | $10 | |
| 1. | For the three months ended October 31, 2010. The Fund changed its fiscal year end from July 31 to October 31, effective October 31, 2010. |
| 2. | For the period from July 30, 2010 (commencement of class operations) to July 31, 2010 |
| 3. | Calculated based upon average shares outstanding |
| 4. | Amount is less than $0.005. |
| 5. | Returns for periods of less than one year are not annualized. |
The accompanying notes are an integral part of these financial statements.
| | | | | | |
| Notes to financial statements (unaudited) | | Wells Fargo Advantage Special Small Cap Value Fund | | | 21 | |
1. ORGANIZATION
Wells Fargo Funds Trust (the “Trust”), a Delaware statutory trust organized on March 10, 1999, is an open-end management investment company registered under the Investment Company Act of 1940, as amended (the “1940 Act”). These financial statements report on Wells Fargo Advantage Special Small Cap Value Fund (the “Fund”) which is a diversified series of the Trust.
2. SIGNIFICANT ACCOUNTING POLICIES
The following significant accounting policies, which are consistently followed in the preparation of the financial statements of the Fund, are in conformity with U.S. generally accepted accounting principles which require management to make estimates and assumptions that affect the reported amounts of assets and liabilities, disclosure of contingent assets and liabilities at the date of the financial statements, and the reported amounts of revenues and expenses during the reporting period. Actual results could differ from those estimates.
Securities valuation
All investments are valued each business day as of the close of regular trading on the New York Stock Exchange (normally 4 p.m. Eastern Time).
Equity securities that are listed on a foreign or domestic exchange, except for The Nasdaq Stock Market, Inc. (“Nasdaq”), are valued at the official closing price or, if none, the last sales price. Securities listed on Nasdaq are valued at the Nasdaq Official Closing Price (“NOCP”). If no NOCP is available, securities are valued at the last sales price. If no sales price is shown on the Nasdaq, the bid price will be used. If no sale occurs on the primary exchange or market for the security that day or if no sale occurs and no bid price is shown on Nasdaq, the prior day’s price will be deemed “stale” and fair values will be determined in accordance with the Fund’s Valuation Procedures.
Investments in registered open-end investment companies are valued at net asset value. Non-registered investment companies are fair valued at net asset value.
Investments which are not valued using any of the methods discussed above are valued at their fair value, as determined by procedures established in good faith and approved by the Board of Trustees. The Board of Trustees has established a Valuation Committee comprised of the Trustees and has delegated to it the authority to take any actions regarding the valuation of portfolio securities that the Valuation Committee deems necessary or appropriate, including determining the fair value of portfolio securities, unless the determination has been delegated to the Management Valuation Team of Wells Fargo Funds Management, LLC (“Funds Management”). The Board of Trustees retains the authority to make or ratify any valuation decisions or approve any changes to the Valuation Procedures as it deems appropriate. On a quarterly basis, the Board of Trustees receives reports on any valuation actions taken by the Valuation Committee or the Management Valuation Team which may include items for ratification.
Valuations of fair valued securities are compared to the next actual sales price when available, or other appropriate market information to assess the continued appropriateness of the fair valuation methodology used. These securities are fair valued on a day-to-day basis, taking into consideration changes to appropriate market information and any significant changes to the input factors considered in the valuation process until there is a readily available price provided on the exchange or by an independent pricing service. Valuations received from an independent pricing service or broker quotes are periodically validated by comparisons to most recent trades and valuations provided by other independent pricing services in addition to the review of prices by the adviser and/or subadviser. Unobservable inputs used in determining fair valuations are identified based on the type of security, taking into consideration factors utilized by market participants in valuing the investment, knowledge about the issuer and the current market environment.
Security loans
The Fund may lend its securities from time to time in order to earn additional income in the form of fees or interest on securities received as collateral or the investment of any cash received as collateral. The Fund continues to receive interest or dividends on the securities loaned. The Fund receives collateral in the form of cash or securities with a value at least equal to the value of the securities on loan. The value of the loaned securities is determined at the close of each business day and any additional required collateral is delivered to the Fund on the next business day. In a securities lending transaction, the net asset value of the Fund will be affected by an increase or decrease in the value of the securities loaned and by an increase or decrease in the value of the instrument in which collateral is invested. The amount of securities lending activity undertaken by the Fund fluctuates from time to time. In the event of default or bankruptcy by the borrower, the Fund may be prevented from recovering the loaned securities or gaining access to the collateral or may experience delays or costs in doing so. In addition, the investment of any cash collateral received may lose all or part of its value. The Fund has the right under the lending agreement to recover the securities from the borrower on demand.
| | | | |
| 22 | | Wells Fargo Advantage Special Small Cap Value Fund | | Notes to financial statements (unaudited) |
The Fund lends its securities through an unaffiliated securities lending agent. Cash collateral received in connection with its securities lending transactions is invested in Wells Fargo Securities Lending Cash Investments, LLC (the “Cash Collateral Fund”). The Cash Collateral Fund is exempt from registration under Section 3(c)(7) of the 1940 Act and is managed by Funds Management and is subadvised by Wells Capital Management Incorporated (“WellsCap”). Funds Management receives an advisory fee starting at 0.05% and declining to 0.01% as the average daily net assets of the Cash Collateral Fund increase. All of the fees received by Funds Management are paid to WellsCap for its services as subadviser. The Cash Collateral Fund seeks to provide a positive return compared to the daily Fed Funds Open rate by investing in high-quality, U.S. dollar-denominated short-term money market instruments. Cash Collateral Fund investments are fair valued based upon the amortized cost valuation technique. Income earned from investment in the Cash Collateral Fund is included in securities lending income on the Statement of Operations.
Security transactions and income recognition
Securities transactions are recorded on a trade date basis. Realized gains or losses are recorded on the basis of identified cost.
Dividend income is recognized on the ex-dividend date.
Distributions to shareholders
Distributions to shareholders from net investment income and net realized gains, if any, are recorded on the ex-dividend date. Such distributions are determined in conformity with federal income tax regulations, which may differ in amount or character from net investment income and realized gains recognized for purposes of U.S. generally accepted accounting principles.
Federal and other taxes
The Fund intends to continue to qualify as a regulated investment company by distributing substantially all of its investment company taxable income and any net realized capital gains (after reduction for capital loss carryforwards) sufficient to relieve it from all, or substantially all, federal income taxes. Accordingly, no provision for federal income taxes was required.
The Fund’s income and federal excise tax returns and all financial records supporting those returns for the prior three fiscal years are subject to examination by the federal and Delaware revenue authorities. Management has analyzed the Fund’s tax positions taken on federal, state, and foreign tax returns for all open tax years and does not believe that there are any uncertain tax positions that require recognition of a tax liability.
As of October 31, 2012, the Fund had pre-enactment capital loss carryforwards incurred in taxable years beginning before December 22, 2010, which are available to offset future net realized capital gains, in the amount of $44,690,351 with $44,328,219 expiring in 2017 and $362,132 expiring in 2018.
As of October 31, 2012, the Fund had a qualified late-year ordinary loss of $325,905 which was recognized on the first day of the current fiscal year. A late-year ordinary loss is the net loss comprised of (a) net gain or loss from the sale or other disposition of certain capital assets for the portion of the taxable year after October 31 and (b) other ordinary income or loss for the portion of the taxable year after December 31.
Class allocations
The separate classes of shares offered by the Fund differ principally in applicable sales charges, distribution, shareholder servicing, and administration fees. Shareholders of each class bear certain expenses that pertain to that particular class. All shareholders bear the common expenses of the Fund, earn income from the portfolio, and are allocated any unrealized gains and losses pro rata based on the average daily net assets of each class, without distinction between share classes. Dividends are determined separately for each class based on income and expenses allocable to each class. Realized gains and losses are allocated to each class pro rata based upon the net assets of each class on the date realized. Differences in per share dividend rates generally result from the relative weightings of pro rata income and realized gain allocations and from differences in separate class expenses, including distribution, shareholder servicing, and administration fees.
3. FAIR VALUATION MEASUREMENTS
Fair value measurements of investments are determined within a framework that has established a fair value hierarchy based upon the various data inputs utilized in determining the value of the Fund’s investments. The three-level hierarchy gives the highest priority to unadjusted quoted prices in active markets for identical assets or liabilities (Level 1) and the lowest priority to significant unobservable inputs (Level 3). The Fund’s investments are classified within the fair value hierarchy based on the lowest level of input that is significant to the fair value measurement. The inputs are summarized into three broad levels as follows
| n | | Level 1 – quoted prices in active markets for identical securities |
| | | | | | |
| Notes to financial statements (unaudited) | | Wells Fargo Advantage Special Small Cap Value Fund | | | 23 | |
| n | | Level 2 – other significant observable inputs (including quoted prices for similar securities, interest rates, prepayment speeds, credit risk, use of amortized cost, etc.) |
| n | | Level 3 – significant unobservable inputs (including the Fund’s own assumptions in determining the fair value of investments) |
The inputs or methodologies used for valuing investments in securities are not necessarily an indication of the risk associated with investing in those securities.
As of April 30, 2013, the inputs used in valuing investments in securities were as follows:
| | | | | | | | | | | | | | | | |
| Investments in securities | | Quoted prices (Level 1) | | | Significant other
observable inputs (Level 2) | | | Significant unobservable inputs (Level 3) | | | Total | |
Equity securities | | | | | | | | | | | | | | | | |
Common stocks | | $ | 725,532,121 | | | $ | 0 | | | $ | 961,619 | | | $ | 726,493,740 | |
Short-term investments | | | | | | | | | | | | | | | | |
Investment companies | | | 23,370,599 | | | | 70,878,799 | | | | 0 | | | | 94,249,398 | |
| | | $ | 748,902,720 | | | $ | 70,878,799 | | | $ | 961,619 | | | $ | 820,743,138 | |
Transfers in and transfers out are recognized at the end of the reporting period. For the six months ended April 30, 2013, the Fund did not have any significant transfers into/out of Level 1 or Level 2.
4. TRANSACTIONS WITH AFFILIATES AND OTHER EXPENSES
Advisory fee
The Trust has entered into an advisory contract with Funds Management, an indirect wholly owned subsidiary of Wells Fargo & Company (“Wells Fargo”). The adviser is responsible for implementing investment policies and guidelines and for supervising the subadviser, who is responsible for day-to-day portfolio management of the Fund.
Pursuant to the contract, Funds Management is entitled to receive an annual advisory fee starting at 0.80% and declining to 0.70% as the average daily net assets of the Fund increase. For the six months ended April 30, 2013, the advisory fee was equivalent to an annual rate of 0.79% of the Fund’s average daily net assets.
Funds Management has retained the services of a subadviser to provide daily portfolio management to the Fund. The fee for subadvisory services is borne by Funds Management. WellsCap, an affiliate of Funds Management, is the subadviser to the Fund and is entitled to receive a fee from Funds Management at an annual rate starting at 0.55% and declining to 0.40% as the average daily net assets of the Fund increase.
Administration and transfer agent fees
The Trust has entered into an administration agreement with Funds Management. Under this agreement, for providing administrative services, which includes paying fees and expenses for services provided by the transfer agent, sub-transfer agents, omnibus account servicers and record-keepers, Funds Management is entitled to receive from the Fund an annual fund level administration fee starting at 0.05% and declining to 0.03% as the average daily net assets of the Fund increase and a class level administration fee which is calculated based on the average daily net assets of each class as follows:
| | | | |
| | | Class level administration fee | |
Class A, Class B, Class C | | | 0.26 | % |
Administrator Class | | | 0.10 | |
Institutional Class | | | 0.08 | |
Funds Management has contractually waived and/or reimbursed advisory and administration fees to the extent necessary to maintain certain net operating expense ratios for the Fund. Waiver of fees and/or reimbursement of expenses by Funds Management were made first from fund level expenses on a proportionate basis and then from class specific expenses. Funds Management has committed through February 28, 2014 to waive fees and/or reimburse expenses to the extent necessary to cap the Fund’s expenses at 1.34% for Class A shares, 2.09% for Class B shares, 2.09% for Class C shares, 1.09% for Administrator Class shares, and 0.94% for Institutional Class shares.
| | | | |
| 24 | | Wells Fargo Advantage Special Small Cap Value Fund | | Notes to financial statements (unaudited) |
Distribution fees
The Trust has adopted a Distribution Plan for Class B and Class C shares of the Fund pursuant to Rule 12b-1 under the 1940 Act. Distribution fees are charged to Class B and Class C shares and paid to Wells Fargo Funds Distributor, LLC, the principal underwriter, at an annual rate of 0.75% of the average daily net assets of Class B and Class C shares.
For the six months ended April 30, 2013, Wells Fargo Funds Distributor, LLC received $2,462 from the sale of Class A shares and $192 and $153 in contingent deferred sales charges from redemptions of Class B and Class C shares, respectively.
Shareholder servicing fees
The Trust has entered into contracts with one or more shareholder servicing agents, whereby Class A, Class B, Class C, and Administrator Class of the Fund is charged a fee at an annual rate of 0.25% of the average daily net assets of each respective class.
A portion of these total shareholder servicing fees were paid to affiliates of Wells Fargo.
5. INVESTMENT PORTFOLIO TRANSACTIONS
Purchases and sales of investments, excluding U.S. government obligations (if any) and short-term securities, for the six months ended April 30, 2013 were $220,163,654 and $283,914,470, respectively.
6. INVESTMENTS IN AFFILIATES
An affiliated investment is a company in which the Fund has ownership of at least 5% of the outstanding voting shares. The following is a summary of transactions in issuers that were either affiliates of the Fund at the beginning of the period or the end of the period.
| | | | | | | | | | | | | | | | | | | | | | | | | | | | |
| | | Shares,
beginning of
period | | | Shares
purchased | | | Shares
sold | | | Shares, end of period | | | Value, end of period | | | Income from
affiliated securities | | | Realized gains (losses) | |
AH Belo Corporation | | | 1,165,260 | | | | 6,500 | | | | 0 | | | | 1,171,760 | | | $ | 6,796,208 | | | $ | 419,884 | | | $ | 0 | |
Dixie Group Incorporated | | | 728,577 | | | | 5,400 | | | | 0 | | | | 733,977 | | | | 4,389,182 | | | | 0 | | | | 0 | |
Imation Corporation | | | 2,708,521 | | | | 73,000 | | | | 0 | | | | 2,781,521 | | | | 10,235,997 | | | | 0 | | | | 0 | |
Kadant Incorporated | | | 986,302 | | | | 13,500 | | | | 105,122 | | | | 894,680 | | | | 24,755,796 | | | | 111,835 | | | | 290,030 | |
| | | | | | | | | | | | | | | | | | | | $46,177,183 | | | $ | 531,719 | | | $ | 290,030 | |
7. BANK BORROWINGS
The Trust (excluding the money market funds) and Wells Fargo Variable Trust are parties to a $150,000,000 revolving credit agreement with State Street Bank and Trust Company, whereby the Fund is permitted to use bank borrowings for temporary or emergency purposes, such as to fund shareholder redemption requests. Interest under the credit agreement is charged to the Fund based on a borrowing rate equal to the higher of the Federal Funds rate in effect on that day plus 1.25% or the overnight LIBOR rate in effect on that day plus 1.25%. In addition, an annual commitment fee equal to 0.10% of the unused balance is allocated to each participating fund. For the six months ended April 30, 2013, the Fund paid $638 in commitment fees.
For the six months ended April 30, 2013, there were no borrowings by the Fund under the agreement.
8. INDEMNIFICATION
Under the Trust’s organizational documents, the officers and directors are indemnified against certain liabilities that may arise out of performance of their duties to the Trust. Additionally, in the normal course of business, the Trust may enter into contracts with service providers that contain a variety of indemnification clauses. The Trust’s maximum exposure under these arrangements is dependent on future claims that may be made against the Fund and, therefore, cannot be estimated.
9. NEW ACCOUNTING PRONOUNCEMENT
In December 2011, the Financial Accounting Standards Board (“FASB”) issued Accounting Standard Update (“ASU”) No. 2011-11, Disclosures about Offsetting Assets and Liabilities. ASU 2011-11, which amends FASB ASC Topic 210, Balance Sheet, creates new disclosure requirements which require entities to disclose both gross and net information for derivatives and other financial instruments that are either offset in the Statement of Assets and Liabilities or subject to an enforceable master netting arrangement or similar agreement. The disclosure requirements are effective for interim and annual reporting periods beginning on or after January 1, 2013. Management is currently assessing the potential impact, in addition to expanded financial statement disclosure, that may result from adopting this ASU.
| | | | | | |
| Other information (unaudited) | | Wells Fargo Advantage Special Small Cap Value Fund | | | 25 | |
PROXY VOTING INFORMATION
A description of the policies and procedures that the Fund uses to determine how to vote proxies relating to portfolio securities is available without charge, upon request, by calling 1-800-222-8222, visiting our website at wellsfargoadvantagefunds.com, or visiting the SEC website at sec.gov. Information regarding how the Fund voted proxies relating to portfolio securities during the most recent 12-month period ended June 30 is available without charge on the Fund’s website at wellsfargoadvantagefunds.com or by visiting the SEC website at sec.gov.
PORTFOLIO HOLDINGS INFORMATION
The complete portfolio holdings for the Fund are publicly available on the Fund’s website (wellsfargoadvantagefunds.com) on a monthly, 30-day or more delayed basis. In addition, top ten holdings information for the Fund is publicly available on the Fund’s website on a monthly, seven-day or more delayed basis. The Fund files its complete schedule of portfolio holdings with the SEC for the first and third quarters of each fiscal year on Form N-Q, which is available without charge by visiting the SEC website at sec.gov. In addition, the Fund’s Form N-Q may be reviewed and copied at the SEC’s Public Reference Room in Washington, DC, and at regional offices in New York City, at 233 Broadway, and in Chicago, at 175 West Jackson Boulevard, Suite 900. Information about the Public Reference Room may be obtained by calling 1-800-SEC-0330.
| | | | |
| 26 | | Wells Fargo Advantage Special Small Cap Value Fund | | Other information (unaudited) |
BOARD OF TRUSTEES AND OFFICERS
Each of the Trustees and Officers listed in the table below acts in identical capacities for the Wells Fargo Advantage family of funds, which consists of 131 funds1 comprising the Wells Fargo Funds Trust, Wells Fargo Variable Trust, Wells Fargo Master Trust and four closed-end funds (collectively the “Fund Complex”). This table should be read in conjunction with the Prospectus and the Statement of Additional Information2. All of the Trustees are also Members of the Audit and Governance Committees of each Trust in the Fund Complex. The mailing address of each Trustee and Officer is 525 Market Street, 12th Floor, San Francisco, CA 94105. Each Trustee and Officer serves an indefinite term, however, each Trustee serves such term until reaching the mandatory retirement age established by the Trustees.
Independent Trustees
| | | | | | |
Name and year of birth | | Position held and length of service* | | Principal occupations during past five years | | Other directorships during
past five years |
Peter G. Gordon
(Born 1942) | | Trustee, since 1998; Chairman, since 2005 | | Co-Founder, Retired Chairman, President and CEO of Crystal Geyser Water Company. Trustee Emeritus, Colby College. | | Asset Allocation Trust |
Isaiah Harris, Jr.
(Born 1952) | | Trustee, since 2009 | | Retired. Prior thereto, President and CEO of BellSouth Advertising and Publishing Corp. from 2005 to 2007, President and CEO of BellSouth Enterprises from 2004 to 2005 and President of BellSouth Consumer Services from 2000 to 2003. Emeritus member of the Iowa State University Foundation Board of Governors. Emeritus Member of the Advisory Board of Iowa State University School of Business. Advisory Board Member, Palm Coast Academy (charter school). Mr. Harris is a certified public accountant. | | CIGNA Corporation; Deluxe Corporation; Asset Allocation Trust |
Judith M. Johnson
(Born 1949) | | Trustee, since 2008; Audit Committee Chairman, since 2008 | | Retired. Prior thereto, Chief Executive Officer and Chief Investment Officer of Minneapolis Employees Retirement Fund from 1996 to 2008. Ms. Johnson is an attorney, certified public accountant and a certified managerial accountant. | | Asset Allocation Trust |
Leroy Keith, Jr.
(Born 1939) | | Trustee, since 2010 | | Chairman, Bloc Global Services (development and construction). Trustee of the Evergreen Funds from 1983 to 2010. Former Managing Director, Almanac Capital Management (commodities firm), former Partner, Stonington Partners, Inc. (private equity fund), former Director, Obagi Medical Products Co. and former Director, Lincoln Educational Services. | | Trustee, Virtus Fund Complex (consisting of 48 portfolios as of 1/31/2013); Asset Allocation Trust |
David F. Larcker
(Born 1950) | | Trustee, since 2009 | | James Irvin Miller Professor of Accounting at the Graduate School of Business, Stanford University, Morgan Stanley Director of the Center for Leadership Development and Research and Senior Faculty of The Rock Center for Corporate Governance since 2006. From 2005 to 2008, Professor of Accounting at the Graduate School of Business, Stanford University. Prior thereto, Ernst & Young Professor of Accounting at The Wharton School, University of Pennsylvania from 1985 to 2005. | | Asset Allocation Trust |
Olivia S. Mitchell
(Born 1953) | | Trustee, since 2006 | | International Foundation of Employee Benefit Plans Professor, Wharton School of the University of Pennsylvania since 1993. Director of Wharton’s Pension Research Council and Boettner Center on Pensions & Retirement Research, and Research Associate at the National Bureau of Economic Research. Previously, Cornell University Professor from 1978 to 1993. | | Asset Allocation Trust |
Timothy J. Penny
(Born 1951) | | Trustee, since 1996 | | President and CEO of Southern Minnesota Initiative Foundation, a non-profit organization, since 2007 and Senior Fellow at the Humphrey Institute Policy Forum at the University of Minnesota since 1995. Member of the Board of Trustees of NorthStar Education Finance, Inc., a non-profit organization, since 2007. | | Asset Allocation Trust |
| | | | | | |
| Other information (unaudited) | | Wells Fargo Advantage Special Small Cap Value Fund | | | 27 | |
| | | | | | |
Name and year of birth | | Position held and length of service* | | Principal occupations during past five years | | Other directorships during
past five years |
Michael S. Scofield
(Born 1943) | | Trustee, since 2010 | | Served on the Investment Company Institute’s Board of Governors and Executive Committee from 2008-2011 as well the Governing Council of the Independent Directors Council from 2006-2011 and the Independent Directors Council Executive Committee from 2008-2011. Chairman of the IDC from 2008-2010. Institutional Investor (Fund Directions) Trustee of Year in 2007. Trustee of the Evergreen Funds (and its predecessors) from 1984 to 2010. Chairman of the Evergreen Funds from 2000-2010. Former Trustee of the Mentor Funds. Retired Attorney, Law Offices of Michael S. Scofield. | | Asset Allocation Trust |
Donald C. Willeke
(Born 1940) | | Trustee, since 1996 | | Principal of the law firm of Willeke & Daniels. General Counsel of the Minneapolis Employees Retirement Fund from 1984 until its consolidation into the Minnesota Public Employees Retirement Association on June 30, 2010. Director and Vice Chair of The Tree Trust (non-profit corporation). Director of the American Chestnut Foundation (non-profit corporation). | | Asset Allocation Trust |
| * | Length of service dates reflect the Trustee’s commencement of service with the Trust’s predecessor entities, where applicable. |
Officers
| | | | | | |
Name and year of birth | | Position held and length of service | | Principal occupations during past five years | | |
Karla M. Rabusch
(Born 1959) | | President, since 2003 | | Executive Vice President of Wells Fargo Bank, N.A. and President of Wells Fargo Funds Management, LLC since 2003. | | |
Nancy Wiser1
(Born 1967) | | Treasurer, since 2012 | | Executive Vice President of Wells Fargo Funds Management, LLC since 2011. Chief Operating Officer and Chief Compliance Officer at LightBox Capital Management LLC, from 2008 to 2011. Owned and operated a consulting business providing services to various hedge funds including acting as Chief Operating Officer and Chief Compliance Officer for a hedge fund from 2007 to 2008. Chief Operating Officer and Chief Compliance Officer of GMN Capital LLC from 2006 to 2007. | | |
C. David Messman
(Born 1960) | | Secretary, since 2000; Chief Legal Officer, since 2003 | | Senior Vice President and Secretary of Wells Fargo Funds Management, LLC since 2001. Vice President and Managing Counsel of Wells Fargo Bank, N.A. since 1996. | | |
Debra Ann Early
(Born 1964) | | Chief Compliance Officer, since 2007 | | Chief Compliance Officer of Wells Fargo Funds Management, LLC since 2007. Chief Compliance Officer of Parnassus Investments from 2005 to 2007. Chief Financial Officer of Parnassus Investments from 2004 to 2007. | | |
David Berardi
(Born 1975) | | Assistant Treasurer, since 2009 | | Vice President of Wells Fargo Funds Management, LLC since 2009. Vice President of Evergreen Investment Management Company, LLC from 2008 to 2010. Assistant Vice President of Evergreen Investment Services, Inc. from 2004 to 2008. Manager of Fund Reporting and Control for Evergreen Investment Management Company, LLC from 2004 to 2010. | | |
Jeremy DePalma1
(Born 1974) | | Assistant Treasurer, since 2009 | | Senior Vice President of Wells Fargo Funds Management, LLC since 2009. Senior Vice President of Evergreen Investment Management Company, LLC from 2008 to 2010. Vice President, Evergreen Investment Services, Inc. from 2004 to 2007. Head of the Fund Reporting and Control Team within Fund Administration from 2005 to 2010. | | |
| 1. | Nancy Wiser acts as Treasurer of 73 funds in the Fund Complex. Jeremy DePalma acts as Treasurer of 58 funds and Assistant Treasurer of 73 funds in the Fund Complex. |
| 2. | The Statement of Additional Information includes additional information about the Trustees and is available,without charge, upon request, by calling 1-800-222-8222 or by visiting the website at wellsfargoadvantagefunds.com. |
| | | | |
| 28 | | Wells Fargo Advantage Special Small Cap Value Fund | | Other information (unaudited) |
BOARD CONSIDERATION OF INVESTMENT ADVISORY AND SUBADVISORY AGREEMENTS:
Under Section 15 of the Investment Company Act of 1940 (the “1940 Act”), the Board of Trustees (the “Board”) of Wells Fargo Funds Trust (the “Trust”), all the members of which have no direct or indirect interest in the investment advisory and sub-advisory agreements and are not “interested persons” of the Trust, as defined in the 1940 Act (the “Independent Trustees”), must determine whether to approve the continuation of the Trust’s investment advisory and sub-advisory agreements. In this regard, at an in-person meeting held on March 28-29, 2013 (the “Meeting”), the Board reviewed: (i) an investment advisory agreement with Wells Fargo Funds Management, LLC (“Funds Management”) for Wells Fargo Advantage Special Small Cap Value Fund (the “Fund”) and (ii) an investment sub-advisory agreement with Wells Capital Management Incorporated (the “Sub-Adviser”), an affiliate of Funds Management, for the Fund. The investment advisory agreement with Funds Management and the investment sub-advisory agreement with the Sub-Adviser are collectively referred to as the “Advisory Agreements.”
At the Meeting, the Board considered the factors and reached the conclusions described below relating to the selection of Funds Management and the Sub-Adviser and the continuation of the Advisory Agreements. Prior to the Meeting, the Trustees conferred extensively among themselves and with representatives of Funds Management about these matters. The Board has adopted a team-based approach, with each team consisting of a sub-set of Trustees, to assist the Board in the discharge of its duties in reviewing performance and other matters throughout the year. The Independent Trustees were assisted in their evaluation of the Advisory Agreements by independent legal counsel, from whom they received separate legal advice and with whom they met separately.
In providing information to the Board, Funds Management and the Sub-Adviser were guided by a detailed set of requests for information submitted to them by independent legal counsel on behalf of the Independent Trustees at the start of the Board’s annual contract renewal process earlier in 2013. In considering and approving the Advisory Agreements, the Trustees considered the information they believed relevant, including but not limited to the information discussed below. The Board considered not only the specific information presented in connection with the Meeting, but also the knowledge gained over time through interaction with Funds Management and the Sub-Adviser about various topics. In this regard, the Board reviewed reports of Funds Management at each of its quarterly meetings, which included, among other things, portfolio reviews and performance reports. In addition, the Board and the teams mentioned above confer with portfolio managers at various times throughout the year. The Board did not identify any particular information or consideration that was all-important or controlling, and each individual Trustee may have attributed different weights to various factors.
After its deliberations, the Board unanimously determined that the continuation of the Advisory Agreements is in the best interests of the Fund and its shareholders, and that the compensation payable to Funds Management and the Sub-Adviser is reasonable. The Board considered the continuation of the Advisory Agreements for the Fund as part of its consideration of the continuation of advisory agreements for funds across the complex, but each decision was made on a fund-by-fund basis. The following summarizes a number of important, but not necessarily all, factors considered by the Board in reaching its determination.
Nature, extent and quality of services
The Board received and considered various information regarding the nature, extent and quality of services provided to the Fund by Funds Management and the Sub-Adviser under the Advisory Agreements. This information included, among other things, a summary of the background and experience of senior management of Funds Management, and the qualifications, background, tenure and responsibilities of each of the portfolio managers primarily responsible for the day-to-day portfolio management of the Fund.
The Board evaluated the ability of Funds Management and the Sub-Adviser, based on attributes such as their financial condition, resources and reputation, to attract and retain qualified investment professionals, including research, advisory and supervisory personnel. The Board further considered the compliance programs and compliance records of Funds Management and the Sub-Adviser. In addition, the Board took into account the administrative and other services provided to the Fund by Funds Management and its affiliates and Funds Management’s oversight of the Fund’s various service providers.
Fund performance and expenses
The Board considered the performance results for the Fund over various time periods ended December 31, 2012. The Board also considered these results in comparison to the performance of funds in a universe that was determined by Lipper Inc. (“Lipper”) to be similar to the Fund (the “Universe”), and in comparison to the Fund’s benchmark index and to other comparative data. Lipper is an independent provider of investment company data. The Board received a description of the methodology used by Lipper to select the mutual funds in the performance Universe.
| | | | | | |
| Other information (unaudited) | | Wells Fargo Advantage Special Small Cap Value Fund | | | 29 | |
The Board noted that while the performance of the Fund (Administrator Class) was lower than the median performance of the Universe for the one-year period under review, the performance of the Fund was in range of the median performance of the Universe for the three-, five- and ten-year periods under review. The Board also noted that while the performance of the Fund was lower than its benchmark, the Russell 2000® Value Index, for the one-year period under review, the performance of the Fund was higher than or in range of its benchmark for the three-, five- and ten-year periods under review.
The Board received information concerning, and discussed factors contributing to, the underperformance of the Fund relative to the Universe and benchmark for the one-year period under review. Funds Management advised the Board about the market conditions and investment decisions that it believed contributed to the underperformance during that period. The Board was satisfied with the explanation of the factors contributing to underperformance and with the steps being taken by Funds Management and the Sub-Adviser to address the Fund’s investment performance.
The Board received and considered information regarding the Fund’s net operating expense ratios and their various components, including actual management fees (which reflect fee waivers, if any, and include advisory, administration and transfer agent fees), custodian and other non-management fees, Rule 12b-1 and non-Rule 12b-1 service fees and fee waiver and expense reimbursement arrangements. The Board also considered these ratios in comparison to the median ratios of funds in class-specific expense groups that were determined by Lipper to be similar to the Fund (the “Groups”). The Board received a description of the methodology used by Lipper to select the mutual funds in the expense Groups. Based on the Lipper reports, the Board noted that the net operating expense ratios of the Fund were lower than or in range of the median net operating expense ratios of the expense Groups.
Based on its consideration of the factors and information it deemed relevant, including those described here, the Board concluded that the overall performance and expense structure of the Fund supported the re-approval of the Advisory Agreements.
Investment advisory and sub-advisory fee rates
The Board reviewed and considered the contractual investment advisory fee rates that are payable by the Fund to Funds Management for investment advisory services (the “Advisory Agreement Rates”), both on a stand-alone basis and on a combined basis with the Fund’s fund-level and class-level contractual administration fee rates (the “Management Rates”). The Board noted that the administration fees include transfer agency costs. The Board also reviewed and considered the contractual investment sub-advisory fee rates that are payable by Funds Management to the Sub-Adviser for investment sub-advisory services (the “Sub-Advisory Agreement Rates”).
Among other information reviewed by the Board was a comparison of the Management Rates of the Fund with those of other funds in the expense Groups at a common asset level. The Board noted that the Management Rates of the Fund were in range of the median rate for the Fund’s expense Groups for all classes except Class A. The Board and Funds Management agreed to revise the advisory fee schedule for the Fund by adding an additional breakpoint. The Board also viewed favorably the fact that the net operating expense ratios of the Fund were lower than or in range of the median net operating expense ratios of the expense Groups.
The Board also received and considered information about the portion of the total advisory fee that was retained by Funds Management after payment of the fee to the Sub-Adviser for sub-advisory services. In assessing the reasonableness of this amount, the Board received and evaluated information concerning the nature and extent of responsibilities retained and risks assumed by Funds Management and not delegated to or assumed by the Sub-Adviser, and about Funds Management’s on-going oversight services. In recognition of the fact that the Wells Fargo enterprise provides a suite of combined advisory and sub-advisory services to the Fund through affiliated entities, the Board ascribed limited relevance to the allocation of the total advisory fee between Funds Management and the Sub-Adviser.
The Board also received and considered information about the nature and extent of services offered and fee rates charged by Funds Management and the Sub-Adviser to other types of clients. In this regard, the Board received information about the significantly greater scope of services, and compliance, reporting and other legal burdens and risks of managing mutual funds compared with those associated with managing assets of non-mutual fund clients such as collective funds or institutional separate accounts.
Based on its consideration of the factors and information it deemed relevant, including those described here, the Board determined that the Advisory Agreement Rates and the Sub-Advisory Agreement Rates were reasonable in light of the services covered by the Advisory Agreements.
| | | | |
| 30 | | Wells Fargo Advantage Special Small Cap Value Fund | | Other information (unaudited) |
Profitability
The Board received and considered information concerning the profitability of Funds Management, as well as the profitability of Wells Fargo as a whole, from providing services to the Fund. The Board did not receive or consider to be necessary separate profitability information with respect to the Sub-Adviser, because, as an affiliate of Funds Management, its profitability information was subsumed in the collective Wells Fargo profitability analysis provided by Funds Management.
Funds Management explained the methodologies and estimates that it used in calculating the profitability from the Fund and the fund family as a whole. Among other things, the Board noted that the levels of profitability reported on a fund-by-fund basis varied widely, depending on factors such as the size and type of fund. Based on its review, the Board did not deem the profits reported by Funds Management to be at a level that would prevent it from approving the continuation of the Advisory Agreements.
Economies of scale
With respect to possible economies of scale, the Board reviewed the breakpoints in the Fund’s advisory fee and administration fee structure, which operate generally to reduce the Fund’s expense ratios as the Fund grows in size. It considered that, for a small fund or a fund that shrinks in size, breakpoints conversely can result in higher fee levels. The Board also considered fee waiver and expense reimbursement arrangements as a means of sharing potential economies of scale with the Fund. The Board also took into account the agreed-upon revision to the advisory fee schedule for the Fund that adds an additional breakpoint. The Board acknowledged the inherent limitations of any analysis of potential economies of scale and of any attempt to correlate breakpoints with such economies. Nonetheless, the Board concluded that the breakpoints and net operating expense ratio caps appeared to be a reasonable approach to sharing potential economies of scale with the Fund.
Other benefits to Funds Management and the Sub-Adviser
The Board received and considered information regarding potential “fall-out” or ancillary benefits received by Funds Management and its affiliates, including the Sub-Adviser, as a result of their relationship with the Fund. Ancillary benefits could include, among others, benefits directly attributable to other relationships with the Fund and benefits potentially derived from an increase in Funds Management’s and the Sub-Adviser’s business as a result of their relationship with the Fund (such as the ability to market to shareholders other financial products and services offered by Funds Management and its affiliates, including the Sub-Adviser, or to operate other products and services that follow investment strategies similar to those of the Fund).
The Board considered that Wells Fargo Funds Distributor, LLC, an affiliate of Funds Management, serves as distributor to the Fund and receives certain compensation for those services. The Board noted that various financial institutions, including affiliates of Funds Management, may receive distribution-related fees, shareholder servicing payments (including amounts derived from payments under Rule 12b-1 plans) and sub-transfer agency fees in respect of shares sold or held through them and services provided.
The Board also reviewed information about whether and to what extent soft dollar credits are sought and how any such credits are utilized, and any benefits that might be realized by an affiliated broker that handles portfolio transactions for the Fund.
Based on its consideration of the factors and information it deemed relevant, including those described here, the Board did not find that any ancillary benefits received by Funds Management and its affiliates, including the Sub-Adviser, were unreasonable.
Conclusion
After considering the above-described factors and based on its deliberations and its evaluation of the information described above, the Board unanimously approved the continuation of the Advisory Agreements for an additional one-year period.
| | | | | | |
| List of abbreviations | | Wells Fargo Advantage Special Small Cap Value Fund | | | 31 | |
The following is a list of common abbreviations for terms and entities that may have appeared in this report.
| ACA | — ACA Financial Guaranty Corporation |
| ADR | — American depositary receipt |
| ADS | — American depositary shares |
| AGC | — Assured Guaranty Corporation |
| AGM | — Assured Guaranty Municipal |
| Ambac | — Ambac Financial Group Incorporated |
| AMT | — Alternative minimum tax |
| BAN | — Bond anticipation notes |
| BHAC | — Berkshire Hathaway Assurance Corporation |
| CAB | — Capital appreciation bond |
| CCAB | — Convertible capital appreciation bond |
| CDA | — Community Development Authority |
| CDO | — Collateralized debt obligation |
| COP | — Certificate of participation |
| DRIVER | — Derivative inverse tax-exempt receipts |
| DW&P | — Department of Water & Power |
| DWR | — Department of Water Resources |
| ECFA | — Educational & Cultural Facilities Authority |
| EDA | — Economic Development Authority |
| EDFA | — Economic Development Finance Authority |
| ETF | — Exchange-traded fund |
| FDIC | — Federal Deposit Insurance Corporation |
| FFCB | — Federal Farm Credit Banks |
| FGIC | — Financial Guaranty Insurance Corporation |
| FHA | — Federal Housing Administration |
| FHLB | — Federal Home Loan Bank |
| FHLMC | — Federal Home Loan Mortgage Corporation |
| FICO | — The Financing Corporation |
| FNMA | — Federal National Mortgage Association |
| GDR | — Global depositary receipt |
| GNMA | — Government National Mortgage Association |
| HCFR | — Healthcare facilities revenue |
| HEFA | — Health & Educational Facilities Authority |
| HEFAR | — Higher education facilities authority revenue |
| HFA | — Housing Finance Authority |
| HFFA | — Health Facilities Financing Authority |
| HUD | — Department of Housing and Urban Development |
| IDA | — Industrial Development Authority |
| IDAG | — Industrial Development Agency |
| IDR | — Industrial development revenue |
| KRW | — Republic of Korea won |
| LIBOR | — London Interbank Offered Rate |
| LLC | — Limited liability company |
| LLP | — Limited liability partnership |
| MBIA | — Municipal Bond Insurance Association |
| MFHR | — Multifamily housing revenue |
| MSTR | — Municipal securities trust receipts |
| MUD | — Municipal Utility District |
| National | — National Public Finance Guarantee Corporation |
| PCFA | — Pollution Control Financing Authority |
| PCL | — Public Company Limited |
| PCR | — Pollution control revenue |
| PFA | — Public Finance Authority |
| PFFA | — Public Facilities Financing Authority |
| PFOTER | — Puttable floating option tax-exempt receipts |
| plc | — Public limited company |
| PUTTER | — Puttable tax-exempt receipts |
| R&D | — Research & development |
| Radian | — Radian Asset Assurance |
| RAN | — Revenue anticipation notes |
| RDA | — Redevelopment Authority |
| RDFA | — Redevelopment Finance Authority |
| REIT | — Real estate investment trust |
| ROC | — Reset option certificates |
| SAVRS | — Select auction variable rate securities |
| SBA | — Small Business Authority |
| SFHR | — Single-family housing revenue |
| SFMR | — Single-family mortgage revenue |
| SPA | — Standby purchase agreement |
| SPDR | — Standard & Poor’s Depositary Receipts |
| STRIPS | — Separate trading of registered interest and principal securities |
| TAN | — Tax anticipation notes |
| TIPS | — Treasury inflation-protected securities |
| TRAN | — Tax revenue anticipation notes |
| TTFA | — Transportation Trust Fund Authority |
| TVA | — Tennessee Valley Authority |
This page is intentionally left blank.
This page is intentionally left blank.
This page is intentionally left blank.


For more information
More information about Wells Fargo Advantage Funds is available free upon request. To obtain literature, please write, email, visit the Fund’s website, or call:
Wells Fargo Advantage Funds
P.O. Box 8266
Boston, MA 02266-8266
Email: wfaf@wellsfargo.com
Website: wellsfargoadvantagefunds.com
Individual investors: 1-800-222-8222
Retail investment professionals: 1-888-877-9275
Institutional investment professionals: 1-866-765-0778
This report and the financial statements contained herein are submitted for the general information of the shareholders of Wells Fargo Advantage Funds. If this report is used for promotional purposes, distribution of the report must be accompanied or preceded by a current prospectus. For a current prospectus and, if available, a summary prospectus containing more complete information, including charges and expenses, call 1-800-222-8222 or visit the Fund’s website at wellsfargoadvantagefunds.com. Please consider the investment objectives, risks, charges, and expenses of the investment carefully before investing. This and other information about Wells Fargo Advantage Funds can be found in the current prospectus. Read the prospectus carefully before you invest or send money.
Wells Fargo Funds Management, LLC, a wholly owned subsidiary of Wells Fargo & Company, provides investment advisory and administrative services for Wells Fargo Advantage Funds. Other affiliates of Wells Fargo & Company provide subadvisory and other services for the Funds. The Funds are distributed by Wells Fargo Funds Distributor, LLC, Member FINRA/SIPC, an affiliate of Wells Fargo & Company.
NOT FDIC INSURED ¡ NO BANK GUARANTEE ¡ MAY LOSE VALUE
© 2013 Wells Fargo Funds Management, LLC. All rights reserved.
| | |
 | | 216841 06-13 SA246/SAR246 4-13 |

Traditional Small Cap Growth Fund

Semi-Annual Report
April 30, 2013

Reduce clutter. Save trees.
Sign up for electronic delivery of prospectuses and shareholder reports at wellsfargo.com/advantagedelivery
Contents
The views expressed and any forward-looking statements are as of April 30, 2013, unless otherwise noted, and are those of the Fund managers and/or Wells Fargo Funds Management, LLC. Discussions of individual securities, or the markets generally, or any Wells Fargo Advantage Fund are not intended as individual recommendations. Future events or results may vary significantly from those expressed in any forward-looking statements; the views expressed are subject to change at any time in response to changing circumstances in the market. Wells Fargo Funds Management, LLC, disclaims any obligation to publicly update or revise any views expressed or forward-looking statements.
NOT FDIC INSURED ¡ NO BANK GUARANTEE ¡ MAY LOSE VALUE

Wells Fargo investment history
| | |
| 1932 | | Keystone creates one of the first mutual fund families. |
| 1971 | | Wells Fargo & Company introduces one of the first institutional index funds. |
| 1978 | | Wells Fargo applies Markowitz and Sharpe’s research on Modern Portfolio Theory to introduce one of the industry’s first tactical asset allocation models in institutional separately managed accounts. |
| 1984 | | Wells Fargo Stagecoach Funds launches its first asset allocation fund. |
| 1989 | | The Tactical Asset Allocation (TAA) Model is first applied to Wells Fargo’s asset allocation mutual funds. |
| 1994 | | Wells Fargo introduces the LifePath Funds, one of the first suites of target date funds (now the Wells Fargo Advantage Dow Jones Target Date FundsSM). |
| 1996 | | Evergreen Investments and Keystone Funds merge. |
| 1997 | | Wells Fargo launches the Wells Fargo Advantage WealthBuilder PortfoliosSM, a fund-of-funds suite of products that includes the use of quantitative models to shift assets among investment styles. |
| 1999 | | Norwest Advantage Funds and Stagecoach Funds are reorganized into Wells Fargo Funds after the merger of Norwest and Wells Fargo. |
| 2002 | | Evergreen Retail and Evergreen Institutional companies form the umbrella asset management company, Evergreen Investments. |
| 2005 | | The integration of Strong Funds with Wells Fargo Funds creates Wells Fargo Advantage Funds, resulting in one of the top 20 mutual fund companies in the United States. |
| 2006 | | Wells Fargo Advantage Funds relaunches the target date product line as Wells Fargo Advantage Dow Jones Target Date Funds. |
| 2010 | | The mergers and reorganizations of Evergreen and Wells Fargo Advantage mutual funds are completed, unifying the families under the brand of Wells Fargo Advantage Funds. |
Wells Fargo Advantage Funds®
Wells Fargo Advantage Funds skillfully guides institutions, financial advisors, and individuals through the investment terrain to help them reach their financial objectives. Everything we do on behalf of investors is backed by our unique combination of qualifications.
Strength
Our organization is built on the standards of integrity and service established by our parent company—Wells Fargo & Company—more than 150 years ago. And, because we’re part of a highly diversified financial enterprise, we offer the depth of resources to help investors succeed.
Expertise
Our multi-boutique model offers investors access to the independent thinking of premier investment managers that have been chosen for their time-tested strategies. While each team specializes in a specific investment strategy, collectively they provide investors a wide choice of distinct investment styles. Our dedication to investment excellence doesn’t end with our expertise in manager selection—risk management, analysis, and rigorous ongoing review seek to ensure each manager’s investment process remains consistent.
Partnership
Our collaborative approach is built around understanding the needs and goals of our clients. By adhering to core principles of sound judgment and steady guidance, we support you through every stage of the investment decision process.
Carefully consider the investment objectives, risks, charges, and expenses before investing. For a current prospectus and, if available, a summary prospectus, for Wells Fargo Advantage Funds, containing this and other information, visit wellsfargoadvantagefunds.com. Read it carefully before investing.
Wells Fargo Funds Management, LLC, a wholly owned subsidiary of Wells Fargo & Company, provides investment advisory and administrative services for Wells Fargo Advantage Funds. Other affiliates of Wells Fargo & Company provide subadvisory and other services for the Funds. The Funds are distributed by Wells Fargo Funds Distributor, LLC, Member FINRA/SIPC, an affiliate of Wells Fargo & Company.
“Dow Jones®” and “Dow Jones Target Date IndexesSM” are service marks of Dow Jones Trademark Holdings LLC (“Dow Jones”); have been licensed to CME Group Index Services LLC (“CME Indexes”); and have been sublicensed for use for certain purposes by Global Index Advisors, Inc., and Wells Fargo Funds Management, LLC. The Wells Fargo Advantage Dow Jones Target Date FundsSM, based on the Dow Jones Target Date Indexes, are not sponsored, endorsed, sold, or promoted by Dow Jones, CME Indexes, or their respective affiliates, and none of them makes any representation regarding the advisability of investing in such product(s).
NOT FDIC INSURED ¡ NO BANK GUARANTEE ¡ MAY LOSE VALUE
Not part of the semi-annual report.
Wells Fargo Advantage Funds offers more than 100 mutual funds across a wide range of asset classes, representing over $228 billion in assets under management, as of April 30, 2013.
| | | | |
| Equity funds | | | | |
Asia Pacific Fund | | Enterprise Fund† | | Opportunity Fund† |
C&B Large Cap Value Fund | | Global Opportunities Fund | | Precious Metals Fund |
C&B Mid Cap Value Fund | | Growth Fund | | Premier Large Company Growth Fund |
Capital Growth Fund | | Index Fund | | Small Cap Opportunities Fund |
Common Stock Fund | | International Equity Fund | | Small Cap Value Fund |
Disciplined U.S. Core Fund | | International Value Fund | | Small Company Growth Fund |
Discovery Fund† | | Intrinsic Small Cap Value Fund | | Small Company Value Fund |
Diversified Equity Fund | | Intrinsic Value Fund | | Small/Mid Cap Value Fund |
Diversified International Fund | | Intrinsic World Equity Fund | | Special Mid Cap Value Fund |
Emerging Growth Fund | | Large Cap Core Fund | | Special Small Cap Value Fund |
Emerging Markets Equity Fund | | Large Cap Growth Fund | | Specialized Technology Fund |
Emerging Markets Equity Income Fund | | Large Company Value Fund | | Traditional Small Cap Growth Fund |
Endeavor Select Fund† | | Omega Growth Fund | | Utility and Telecommunications Fund |
| Bond funds | | | | |
Adjustable Rate Government Fund | | High Yield Municipal Bond Fund | | Short-Term Bond Fund |
California Limited-Term Tax-Free Fund | | Income Plus Fund | | Short-Term High Yield Bond Fund |
California Tax-Free Fund | | Inflation-Protected Bond Fund | | Short-Term Municipal Bond Fund |
Colorado Tax-Free Fund | | Intermediate Tax/AMT-Free Fund | | Strategic Income Fund |
Conservative Income Fund | | International Bond Fund | | Strategic Municipal Bond Fund |
Core Bond Fund | | Minnesota Tax-Free Fund | | Ultra Short-Term Income Fund |
Emerging Markets Local Bond Fund | | Municipal Bond Fund | | Ultra Short-Term Municipal Income Fund |
Government Securities Fund | | North Carolina Tax-Free Fund | | Wisconsin Tax-Free Fund |
High Income Fund | | Pennsylvania Tax-Free Fund | | |
High Yield Bond Fund | | Short Duration Government Bond Fund | | |
| Asset allocation funds | | | | |
Absolute Return Fund | | WealthBuilder Equity Portfolio† | | Target 2020 Fund† |
Asset Allocation Fund | | WealthBuilder Growth Allocation Portfolio† | | Target 2025 Fund† |
Diversified Capital Builder Fund | | WealthBuilder Growth Balanced Portfolio† | | Target 2030 Fund† |
Diversified Income Builder Fund | | WealthBuilder Moderate Balanced Portfolio† | | Target 2035 Fund† |
Growth Balanced Fund | | WealthBuilder Tactical Equity Portfolio† | | Target 2040 Fund† |
Index Asset Allocation Fund | | Target Today Fund† | | Target 2045 Fund† |
Moderate Balanced Fund | | Target 2010 Fund† | | Target 2050 Fund† |
WealthBuilder Conservative Allocation Portfolio† | | Target 2015 Fund† | | Target 2055 Fund† |
| Money market funds | | | | |
100% Treasury Money Market Fund | | Heritage Money Market Fund† | | National Tax-Free Money Market Fund |
California Municipal Money Market Fund | | Money Market Fund | | Treasury Plus Money Market Fund |
Cash Investment Money Market Fund | | Municipal Cash Management Money Market Fund | | |
Government Money Market Fund | | Municipal Money Market Fund | | |
| Variable trust funds1 | | | | |
VT Discovery Fund† | | VT Intrinsic Value Fund | | VT Small Cap Growth Fund |
VT Index Asset Allocation Fund | | VT Omega Growth Fund | | VT Small Cap Value Fund |
VT International Equity Fund | | VT Opportunity Fund† | | VT Total Return Bond Fund |
An investment in a money market fund is not insured or guaranteed by the Federal Deposit Insurance Corporation or any other government agency. Although the Wells Fargo Advantage Money Market Funds seek to preserve the value of your investment at $1.00 per share, it is possible to lose money by investing in a money market fund.
| 1. | The variable trust funds are generally available only through insurance company variable contracts. |
| † | In this report, the Wells Fargo Advantage Discovery FundSM, Wells Fargo Advantage Endeavor Select FundSM, Wells Fargo Advantage Enterprise FundSM, Wells Fargo Advantage Opportunity FundSM, Wells Fargo Advantage WealthBuilder Conservative Allocation PortfolioSM, Wells Fargo Advantage WealthBuilder Equity PortfolioSM, Wells Fargo Advantage WealthBuilder Growth Allocation PortfolioSM, Wells Fargo Advantage WealthBuilder Growth Balanced PortfolioSM, Wells Fargo Advantage WealthBuilder Moderate Balanced PortfolioSM, Wells Fargo Advantage WealthBuilder Tactical Equity PortfolioSM, Wells Fargo Advantage Dow Jones Target Today FundSM, Wells Fargo Advantage Dow Jones Target 2010 FundSM, Wells Fargo Advantage Dow Jones Target 2015 FundSM, Wells Fargo Advantage Dow Jones Target 2020 FundSM, Wells Fargo Advantage Dow Jones Target 2025 FundSM, Wells Fargo Advantage Dow Jones Target 2030 FundSM, Wells Fargo Advantage Dow Jones Target 2035 FundSM, Wells Fargo Advantage Dow Jones Target 2040 FundSM, Wells Fargo Advantage Dow Jones Target 2045 FundSM, Wells Fargo Advantage Dow Jones Target 2050 FundSM, Wells Fargo Advantage Dow Jones Target 2055 FundSM, Wells Fargo Advantage Heritage Money Market FundSM, Wells Fargo Advantage VT Discovery FundSM, and Wells Fargo Advantage VT Opportunity FundSM are referred to as the Discovery Fund, Endeavor Select Fund, Enterprise Fund, Opportunity Fund, WealthBuilder Conservative Allocation Portfolio, WealthBuilder Equity Portfolio, WealthBuilder Growth Allocation Portfolio, WealthBuilder Growth Balanced Portfolio, WealthBuilder Moderate Balanced Portfolio, WealthBuilder Tactical Equity Portfolio, Target Today Fund, Target 2010 Fund, Target 2015 Fund, Target 2020 Fund, Target 2025 Fund, Target 2030 Fund, Target 2035 Fund, Target 2040 Fund, Target 2045 Fund, Target 2050 Fund, Target 2055 Fund, Heritage Money Market Fund, VT Discovery Fund, and VT Opportunity Fund, respectively. |
Not part of the semi-annual report.
| | | | |
| 2 | | Wells Fargo Advantage Traditional Small Cap Growth Fund | | Letter to shareholders (unaudited) |

Karla M. Rabusch
President
Wells Fargo Advantage Funds
Relatively improving economic data in the U.S. and efforts by European authorities to address the sovereign debt issue alleviated investor fears and supported global stock markets.
Dear Valued Shareholder:
We are pleased to offer you this semi-annual report for the Wells Fargo Advantage Traditional Small Cap Growth Fund for the six-month period that ended April 30, 2013. Much of the six-month period was marked by continued concerns about the possible effects that the ongoing European sovereign debt crisis would have on the global economy. However, relatively improving economic data in the U.S. and efforts by European authorities to address the sovereign debt issue alleviated investor fears and supported global stock markets. This backdrop enabled most equity asset classes to generate positive returns. For the six-month period, the small-cap-oriented Russell 2000® Index1 returned 16.58%, while the mid-cap-focused Russell Midcap® Index2 posted an 18.90% total return.
The U.S. economy improved with the support of accommodative monetary policy.
The U.S. economy grew modestly, but the recovery remained weak compared with previous business cycles. Curtailed government spending and weak household income expectations were economic headwinds. However, the unemployment rate continued to decline, reaching 7.5% in April 2013, and housing market activity, as measured by many metrics—sales, building permits, and prices—continued to improve from its recessionary levels.
Citing its dual mandate of fostering maximum employment and price stability, the U.S. Federal Reserve (Fed) reaffirmed its commitment to highly accommodative monetary policy. In addition, the Fed formally announced that exceptionally low interest rates would be appropriate at least as long as the unemployment rate remains above 6.5% and inflation remains no more than half a percentage point above its 2.0% inflation target.
The Fed also continued its quantitative easing program. Just prior to the beginning of the reporting period, the Federal Open Market Committee announced its intention to keep interest rates low until at least mid-2015 in order to support the sluggish economy. The Fed also announced open-ended purchases of $40 billion per month in mortgage-backed securities in an effort to support the housing market.
The global economy continues to be affected by bouts of uncertainty, including political questions in the U.S., Europe, and China.
Global economic growth varied across countries. Eurozone economies remained in recession. However, the European Central Bank (ECB) and several key members of the eurozone, including France and Germany, continued their commitment to maintaining a single currency. Subsequently, investor fears about a sovereign debt crisis in Europe abated. Furthermore, the ECB maintained its accommodative monetary policy by lowering its key rate at a historic low of 0.75%.
For most of the six-month period, uncertainty about political outcomes was a constant. U.S. presidential elections in November 2012, the debate over the fiscal cliff and tax rates at year-end, and speculation about the effects of sequestration at the end of February 2013 weighed on business leaders and investors. Elections in eurozone countries such as Greece, France, and Italy sparked speculation about the future of the eurozone. New leadership in China also figured into the political landscape. In the end, investors managed around these concerns, and capital markets generally advanced during this time period.
| 1. | The Russell 2000® Index measures the performance of the 2,000 smallest companies in the Russell 3000® Index, which represents approximately 8% of the total market capitalization of the Russell 3000 Index. You cannot invest directly in an index. |
| 2. | The Russell Midcap® Index measures the performance of the 800 smallest companies in the Russell 1000® Index, which represent approximately 25% of the total market capitalization of the Russell 1000 Index. You cannot invest directly in an index. |
| | | | | | |
| Letter to shareholders (unaudited) | | Wells Fargo Advantage Traditional Small Cap Growth Fund | | | 3 | |
Our goal is to meet the financial needs of our shareholders.
We are committed to providing our shareholders long-term investment strategies and focusing on appropriate risk while seeking to deliver consistent returns. We know that your ability to meet your long-term investment goals depends on the investment decisions you make today. Despite economic uncertainties and investment challenges, staying invested and adapting to emerging opportunities and threats will help you manage investment risk.
Thank you for choosing to invest with Wells Fargo Advantage Funds. We appreciate your confidence in us and remain committed to helping you meet your financial needs. For current information about your fund investments, contact your investment professional, visit our website at wellsfargoadvantagefunds.com, or call us directly at 1-800-222-8222. We are available 24 hours a day, 7 days a week.
Sincerely,

Karla M. Rabusch
President
Wells Fargo Advantage Funds
Despite economic uncertainties and investment challenges, staying invested and adapting to emerging opportunities and threats will help you manage investment risk.
| | | | |
| 4 | | Wells Fargo Advantage Traditional Small Cap Growth Fund | | Performance highlights (unaudited) |
Investment objective
The Fund seeks long-term capital appreciation.
Adviser
Wells Fargo Funds Management, LLC
Subadviser
Wells Capital Management Incorporated
Portfolio managers
Paul Carder, CFA
Jeffrey S. Drummond, CFA
Linda Freeman, CFA
Jeffrey Harrison, CFA
Average annual total returns1 (%) as of April 30, 2013
| | | | | | | | | | | | | | | | | | | | | | | | | | | | | | | | | | |
| | | | | Including sales charge | | | Excluding sales charge | | | Expense ratios2 (%) | |
| | | Inception date | | 1 year | | | 5 year | | | 10 year | | | 1 year | | | 5 year | | | 10 year | | | Gross | | | Net3 | |
| Class A (EGWAX) | | 6-5-1995 | | | 1.13 | | | | 5.29 | | | | 8.43 | | | | 7.29 | | | | 6.54 | | | | 9.07 | | | | 1.48 | | | | 1.33 | |
| Class C (EGWCX) | | 7-30-2010 | | | 5.51 | | | | 5.76 | | | | 8.26 | | | | 6.51 | | | | 5.76 | | | | 8.26 | | | | 2.23 | | | | 2.08 | |
| Administrator Class (EGWDX) | | 7-30-2010 | | | – | | | | – | | | | – | | | | 7.44 | | | | 6.64 | | | | 9.17 | | | | 1.32 | | | | 1.20 | |
| Institutional Class (EGRYX) | | 11-19-1997 | | | – | | | | – | | | | – | | | | 7.63 | | | | 6.87 | | | | 9.40 | | | | 1.05 | | | | 0.98 | |
| Russell 2000® Growth Index4 | | – | | | – | | | | – | | | | – | | | | 15.67 | | | | 7.81 | | | | 10.53 | | | | – | | | | – | |
Figures quoted represent past performance, which is no guarantee of future results and do not reflect the deduction of taxes that a shareholder may pay on fund distributions or the redemption of fund shares. Investment return and principal value of an investment will fluctuate so that an investor’s shares, when redeemed, may be worth more or less than their original cost. Performance shown without sales charges would be lower if sales charges were reflected. Current performance may be lower or higher than the performance data quoted, which assumes the reinvestment of dividends and capital gains. Current month-end performance is available on the Fund’s website, wellsfargoadvantagefunds.com.
Index returns do not include transaction costs associated with buying and selling securities, any mutual fund fees or expenses, or any taxes. It is not possible to invest directly in an index.
For Class A shares, the maximum front-end sales charge is 5.75%. For Class C shares, the maximum contingent deferred sales charge is 1.00%. Performance including sales charge assumes the sales charge for the corresponding time period. Administrator Class and Institutional Class shares are sold without a front-end sales charge or contingent deferred sales charge.
Stock values fluctuate in response to the activities of individual companies and general market and economic conditions. Smaller-company stocks tend to be more volatile and less liquid than those of larger companies. Consult the Fund’s prospectus for additional information on these and other risks.
Please see footnotes on page 5.
| | | | | | |
| Performance highlights (unaudited) | | Wells Fargo Advantage Traditional Small Cap Growth Fund | | | 5 | |
| | | | |
| Ten largest equity holdings5 (%) as of April 30, 2013 | |
Cogent Communications Group Incorporated | | | 2.91 | |
Cavium Incorporated | | | 2.48 | |
Financial Engines Incorporated | | | 2.40 | |
Concur Technologies Incorporated | | | 2.36 | |
DexCom Incorporated | | | 2.28 | |
Hexcel Corporation | | | 2.26 | |
Shutterfly Incorporated | | | 2.05 | |
Barnes Group Incorporated | | | 2.04 | |
ExamWorks Group Incorporated | | | 1.93 | |
Ultimate Software Group Incorporated | | | 1.84 | |
|
| Sector distribution6 as of April 30, 2013 |
|
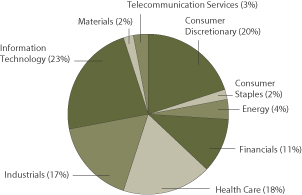
|
| 1. | Historical performance shown for Class C shares prior to their inception reflects the performance of Class A shares, adjusted to reflect the higher expenses applicable to Class C shares. Historical performance shown for the Administrator Class shares prior to their inception reflects the performance of the Institutional Class shares, adjusted to reflect the higher expenses applicable to the Administrator Class shares. Historical performance shown for all classes of the Fund prior to July 19, 2010, is based on the performance of the Fund’s predecessor, Evergreen Growth Fund. |
| 2. | Reflects the expense ratios as stated in the most recent prospectuses. |
| 3. | The Adviser has committed through February 28, 2014, to waive fees and/or reimburse expenses to the extent necessary to cap the Fund’s Total Annual Fund Operating Expenses After Fee Waiver, excluding certain expenses, at the amounts shown. Brokerage commissions, stamp duty fees, interest, taxes, acquired fund fees and expenses, and extraordinary expenses are excluded from the cap. Without this cap, the Fund’s returns would have been lower. |
| 4. | The Russell 2000® Growth Index measures the performance of those Russell 2000 companies with higher price-to-book ratios and higher forecasted growth values. You cannot invest directly in an index. |
| 5. | The ten largest equity holdings are calculated based on the value of the securities divided by total net assets of the Fund. Holdings are subject to change and may have changed since the date specified. |
| 6. | Sector distribution is subject to change and is calculated based on the total long-term investments of the Fund. |
| | | | |
| 6 | | Wells Fargo Advantage Traditional Small Cap Growth Fund | | Fund expenses (unaudited) |
As a shareholder of the Fund, you incur two types of costs: (1) transaction costs, including sales charges (loads) on purchase payments and contingent deferred sales charges (if any) on redemptions and (2) ongoing costs, including management fees, distribution (12b-1) and/or shareholder service fees, and other Fund expenses. This example is intended to help you understand your ongoing costs (in dollars) of investing in the Fund and to compare these costs with the ongoing costs of investing in other mutual funds.
The example is based on an investment of $1,000 invested at the beginning of the six-month period and held for the entire period from November 1, 2012 to April 30, 2013.
Actual expenses
The “Actual” line of the table below provides information about actual account values and actual expenses. You may use the information in this line, together with the amount you invested, to estimate the expenses that you paid over the period. Simply divide your account value by $1,000 (for example, an $8,600 account value divided by $1,000 = 8.6), then multiply the result by the number in the “Actual” line under the heading entitled “Expenses paid during period” for your applicable class of shares to estimate the expenses you paid on your account during this period.
Hypothetical example for comparison purposes
The “Hypothetical” line of the table below provides information about hypothetical account values and hypothetical expenses based on the Fund’s actual expense ratio and an assumed rate of return of 5% per year before expenses, which is not the Fund’s actual return. The hypothetical account values and expenses may not be used to estimate the actual ending account balance or expenses you paid for the period. You may use this information to compare the ongoing costs of investing in the Fund and other funds. To do so, compare this 5% hypothetical example with the 5% hypothetical examples that appear in the shareholder reports of the other funds.
Please note that the expenses shown in the table are meant to highlight your ongoing costs only and do not reflect any transactional costs, such as sales charges (loads) and contingent deferred sales charges. Therefore, the “Hypothetical” line of the table is useful in comparing ongoing costs only and will not help you determine the relative total costs of owning different funds. In addition, if these transactional costs were included, your costs would have been higher.
| | | | | | | | | | | | | | | | |
| | | Beginning
account value
11-1-2012 | | | Ending
account value
4-30-2013 | | | Expenses
paid during
the period1 | | | Net annual
expense ratio | |
Class A | | | | | | | | | | | | | | | | |
Actual | | $ | 1,000.00 | | | $ | 1,092.38 | | | $ | 6.90 | | | | 1.33 | % |
Hypothetical (5% return before expenses) | | $ | 1,000.00 | | | $ | 1,018.20 | | | $ | 6.66 | | | | 1.33 | % |
Class C | | | | | | | | | | | | | | | | |
Actual | | $ | 1,000.00 | | | $ | 1,088.53 | | | $ | 10.77 | | | | 2.08 | % |
Hypothetical (5% return before expenses) | | $ | 1,000.00 | | | $ | 1,014.48 | | | $ | 10.39 | | | | 2.08 | % |
Administrator Class | | | | | | | | | | | | | | | | |
Actual | | $ | 1,000.00 | | | $ | 1,093.54 | | | $ | 6.02 | | | | 1.16 | % |
Hypothetical (5% return before expenses) | | $ | 1,000.00 | | | $ | 1,019.04 | | | $ | 5.81 | | | | 1.16 | % |
Institutional Class | | | | | | | | | | | | | | | | |
Actual | | $ | 1,000.00 | | | $ | 1,094.18 | | | $ | 5.09 | | | | 0.98 | % |
Hypothetical (5% return before expenses) | | $ | 1,000.00 | | | $ | 1,019.93 | | | $ | 4.91 | | | | 0.98 | % |
| 1. | Expenses paid is equal to the annualized expense ratio of each class multiplied by the average account value over the period, multiplied by the number of days in the most recent fiscal half-year divided by the number of days in the fiscal year (to reflect the one-half-year period). |
| | | | | | |
| Portfolio of investments—April 30, 2013 (unaudited) | | Wells Fargo Advantage Traditional Small Cap Growth Fund | | | 7 | |
| | | | | | | | | | | | |
| Security name | | | | | | Shares | | | Value | |
| | | |
Common Stocks: 97.67% | | | | | | | | | | |
| | | | |
Consumer Discretionary: 18.86% | | | | | | | | | | | | |
| | | |
| Auto Components: 0.75% | | | | | | | | | | |
Dana Holding Corporation | | | | | | | 63,300 | | | $ | 1,091,925 | |
| | | | | | | | | | | | |
| | | | |
| Diversified Consumer Services: 0.68% | | | | | | | | | | | | |
Sotheby’s Holdings Incorporated | | | | | | | 28,000 | | | | 993,440 | |
| | | | | | | | | | | | |
| | | | |
| Hotels, Restaurants & Leisure: 1.95% | | | | | | | | | | | | |
BJ’s Restaurants Incorporated † | | | | | | | 32,400 | | | | 1,111,320 | |
SHFL entertainment Incorporated † | | | | | | | 108,900 | | | | 1,720,620 | |
| | | | |
| | | | | | | | | | | 2,831,940 | |
| | | | | | | | | | | | |
| | | | |
| Household Durables: 2.55% | | | | | | | | | | | | |
Ethan Allen Interiors Incorporated « | | | | | | | 62,318 | | | | 1,824,671 | |
SodaStream International Limited Ǡ | | | | | | | 35,000 | | | | 1,884,400 | |
| | | | |
| | | | | | | | | | | 3,709,071 | |
| | | | | | | | | | | | |
| | | | |
| Internet & Catalog Retail: 2.05% | | | | | | | | | | | | |
Shutterfly Incorporated † | | | | | | | 67,100 | | | | 2,987,963 | |
| | | | | | | | | | | | |
| | | | |
| Media: 1.65% | | | | | | | | | | | | |
Pandora Media Incorporated Ǡ | | | | | | | 138,900 | | | | 1,934,877 | |
Shutterstock Incorporated Ǡ | | | | | | | 11,382 | | | | 474,629 | |
| | | | |
| | | | | | | | | | | 2,409,506 | |
| | | | | | | | | | | | |
| | | | |
| Specialty Retail: 8.29% | | | | | | | | | | | | |
Francescas Holdings Corporation † | | | | | | | 24,800 | | | | 708,288 | |
Group 1 Automotive Incorporated « | | | | | | | 39,200 | | | | 2,370,816 | |
Lumber Liquidators Holdings Incorporated † | | | | | | | 20,900 | | | | 1,712,964 | |
Pier 1 Imports Incorporated « | | | | | | | 96,900 | | | | 2,249,049 | |
Ulta Salon Cosmetics & Fragrance Incorporated † | | | | | | | 28,000 | | | | 2,454,200 | |
Vitamin Shoppe Incorporated † | | | | | | | 52,338 | | | | 2,572,413 | |
| | | | |
| | | | | | | | | | | 12,067,730 | |
| | | | | | | | | | | | |
| | | | |
| Textiles, Apparel & Luxury Goods: 0.94% | | | | | | | | | | | | |
Oxford Industries Incorporated | | | | | | | 23,100 | | | | 1,365,903 | |
| | | | | | | | | | | | |
| | | | |
Consumer Staples: 2.05% | | | | | | | | | | | | |
| | | | |
| Food Products: 0.92% | | | | | | | | | | | | |
Annie’s Incorporated «† | | | | | | | 35,500 | | | | 1,341,545 | |
| | | | | | | | | | | | |
| | | | |
| Personal Products: 1.13% | | | | | | | | | | | | |
Elizabeth Arden Incorporated † | | | | | | | 40,100 | | | | 1,642,095 | |
| | | | | | | | | | | | |
| | | | |
Energy: 3.98% | | | | | | | | | | | | |
| | | | |
| Energy Equipment & Services: 1.45% | | | | | | | | | | | | |
ION Geophysical Corporation Ǡ | | | | | | | 168,800 | | | | 1,053,312 | |
Lufkin Industries Incorporated | | | | | | | 12,000 | | | | 1,059,480 | |
| | | | |
| | | | | | | | | | | 2,112,792 | |
| | | | | | | | | | | | |
The accompanying notes are an integral part of these financial statements.
| | | | |
| 8 | | Wells Fargo Advantage Traditional Small Cap Growth Fund | | Portfolio of investments—April 30, 2013 (unaudited) |
| | | | | | | | | | | | |
| Security name | | | | | | Shares | | | Value | |
| | | | |
| Oil, Gas & Consumable Fuels: 2.53% | | | | | | | | | | | | |
Comstock Resources Incorporated † | | | | | | | 60,900 | | | $ | 953,694 | |
Energy XXI (Bermuda) Limited | | | | | | | 59,400 | | | | 1,350,756 | |
Oasis Petroleum Incorporated † | | | | | | | 40,200 | | | | 1,376,046 | |
| | | | |
| | | | | | | | | | | 3,680,496 | |
| | | | | | | | | | | | |
| | | | |
Financials: 11.06% | | | | | | | | | | | | |
| | | | |
| Capital Markets: 3.48% | | | | | | | | | | | | |
Financial Engines Incorporated | | | | | | | 96,000 | | | | 3,491,520 | |
Stifel Financial Corporation Ǡ | | | | | | | 49,100 | | | | 1,582,002 | |
| | | | |
| | | | | | | | | | | 5,073,522 | |
| | | | | | | | | | | | |
| | | | |
| Commercial Banks: 1.41% | | | | | | | | | | | | |
SVB Financial Group † | | | | | | | 29,000 | | | | 2,062,190 | |
| | | | | | | | | | | | |
| | | | |
| Consumer Finance: 1.77% | | | | | | | | | | | | |
Portfolio Recovery Associates Incorporated Ǡ | | | | | | | 21,000 | | | | 2,577,750 | |
| | | | | | | | | | | | |
| | | | |
| Diversified Financial Services: 1.38% | | | | | | | | | | | | |
MarketAxess Holdings Incorporated | | | | | | | 47,400 | | | | 2,005,968 | |
| | | | | | | | | | | | |
| | | | |
| Insurance: 1.36% | | | | | | | | | | | | |
First American Financial Corporation | | | | | | | 73,800 | | | | 1,975,626 | |
| | | | | | | | | | | | |
| | | | |
| REITs: 1.66% | | | | | | | | | | | | |
Ryman Hospitality Properties Incorporated « | | | | | | | 54,387 | | | | 2,418,046 | |
| | | | | | | | | | | | |
| | | | |
Health Care: 17.81% | | | | | | | | | | | | |
| | | | |
| Biotechnology: 3.49% | | | | | | | | | | | | |
Achillion Pharmaceuticals Incorporated Ǡ | | | | | | | 65,979 | | | | 497,482 | |
Alnylam Pharmaceuticals Incorporated † | | | | | | | 28,300 | | | | 677,785 | |
Ariad Pharmaceuticals Incorporated † | | | | | | | 57,900 | | | | 1,034,673 | |
Cepheid Incorporated Ǡ | | | | | | | 54,400 | | | | 2,074,272 | |
Exact Sciences Corporation Ǡ | | | | | | | 84,800 | | | | 792,032 | |
| | | | |
| | | | | | | | | | | 5,076,244 | |
| | | | | | | | | | | | |
| | | | |
| Health Care Equipment & Supplies: 6.78% | | | | | | | | | | | | |
Align Technology Incorporated Ǡ | | | | | | | 47,000 | | | | 1,556,640 | |
Cardiovascular Systems Incorporated Ǡ | | | | | | | 62,784 | | | | 1,077,373 | |
DexCom Incorporated Ǡ | | | | | | | 202,037 | | | | 3,315,427 | |
Endologix Incorporated † | | | | | | | 176,000 | | | | 2,643,520 | |
Volcano Corporation Ǡ | | | | | | | 63,377 | | | | 1,285,919 | |
| | | | |
| | | | | | | | | | | 9,878,879 | |
| | | | | | | | | | | | |
| | | | |
| Health Care Providers & Services: 3.26% | | | | | | | | | | | | |
ExamWorks Group Incorporated Ǡ | | | | | | | 155,100 | | | | 2,807,310 | |
HMS Holdings Corporation Ǡ | | | | | | | 77,100 | | | | 1,943,691 | |
| | | | |
| | | | | | | | | | | 4,751,001 | |
| | | | | | | | | | | | |
The accompanying notes are an integral part of these financial statements.
| | | | | | |
| Portfolio of investments—April 30, 2013 (unaudited) | | Wells Fargo Advantage Traditional Small Cap Growth Fund | | | 9 | |
| | | | | | | | | | | | |
| Security name | | | | | | Shares | | | Value | |
| | | | |
| Health Care Technology: 1.47% | | | | | | | | | | | | |
HealthStream Incorporated † | | | | | | | 93,100 | | | $ | 2,137,576 | |
| | | | | | | | | | | | |
| | | | |
| Pharmaceuticals: 2.81% | | | | | | | | | | | | |
Akorn Incorporated Ǡ | | | | | | | 158,100 | | | | 2,379,405 | |
The Medicines Company † | | | | | | | 50,600 | | | | 1,708,256 | |
| | | | |
| | | | | | | | | | | 4,087,661 | |
| | | | | | | | | | | | |
| | | |
Industrials: 16.52% | | | | | | | | | | |
| | | |
| Aerospace & Defense: 4.60% | | | | | | | | | | |
Hexcel Corporation † | | | | | | | 107,943 | | | | 3,292,262 | |
KEYW Holding Corporation Ǡ | | | | | | | 104,298 | | | | 1,417,410 | |
TASER International Incorporated † | | | | | | | 224,700 | | | | 1,979,607 | |
| | | | |
| | | | | | | | | | | 6,689,279 | |
| | | | | | | | | | | | |
| | | |
| Air Freight & Logistics: 1.05% | | | | | | | | | | |
Forward Air Corporation | | | | | | | 41,561 | | | | 1,533,185 | |
| | | | | | | | | | | | |
| | | |
| Building Products: 1.73% | | | | | | | | | | |
Gibraltar Industries Incorporated † | | | | | | | 76,900 | | | | 1,438,030 | |
USG Corporation † | | | | | | | 41,800 | | | | 1,086,382 | |
| | | | |
| | | | | | | | | | | 2,524,412 | |
| | | | | | | | | | | | |
| | | |
| Commercial Services & Supplies: 0.94% | | | | | | | | | | |
InnerWorkings Incorporated Ǡ | | | | | | | 135,349 | | | | 1,362,964 | |
| | | | | | | | | | | | |
| | | |
| Electrical Equipment: 0.53% | | | | | | | | | | |
Polypore International Incorporated Ǡ | | | | | | | 18,337 | | | | 768,870 | |
| | | | | | | | | | | | |
| | | |
| Machinery: 2.53% | | | | | | | | | | |
Barnes Group Incorporated | | | | | | | 107,100 | | | | 2,974,167 | |
RBC Bearings Incorporated Ǡ | | | | | | | 14,847 | | | | 714,141 | |
| | | | |
| | | | | | | | | | | 3,688,308 | |
| | | | | | | | | | | | |
| | | |
| Professional Services: 1.83% | | | | | | | | | | |
The Advisory Board Company † | | | | | | | 15,400 | | | | 756,910 | |
Wageworks Incorporated † | | | | | | | 74,420 | | | | 1,905,896 | |
| | | | |
| | | | | | | | | | | 2,662,806 | |
| | | | | | | | | | | | |
| | | |
| Trading Companies & Distributors: 3.31% | | | | | | | | | | |
Beacon Roofing Supply Incorporated Ǡ | | | | | | | 66,600 | | | | 2,539,458 | |
MSC Industrial Direct Company | | | | | | | 29,000 | | | | 2,285,200 | |
| | | | |
| | | | | | | | | | | 4,824,658 | |
| | | | | | | | | | | | |
| | | |
Information Technology: 22.06% | | | | | | | | | | |
| | | |
| Communications Equipment: 1.91% | | | | | | | | | | |
Aruba Networks Incorporated † | | | | | | | 75,700 | | | | 1,702,493 | |
Procera Networks Incorporated Ǡ | | | | | | | 96,571 | | | | 1,070,972 | |
| | | | |
| | | | | | | | | | | 2,773,465 | |
| | | | | | | | | | | | |
| | | |
| Electronic Equipment, Instruments & Components: 0.84% | | | | | | | | | | |
IPG Photonics Corporation « | | | | | | | 19,300 | | | | 1,229,024 | |
| | | | | | | | | | | | |
The accompanying notes are an integral part of these financial statements.
| | | | |
| 10 | | Wells Fargo Advantage Traditional Small Cap Growth Fund | | Portfolio of investments—April 30, 2013 (unaudited) |
| | | | | | | | | | | | | | |
| Security name | | | | | | | Shares | | | Value | |
| | | |
| Internet Software & Services: 7.96% | | | | | | | | | | | |
Angie’s List Incorporated «† | | | | | | | | | 70,734 | | | $ | 1,714,592 | |
Bankrate Incorporated Ǡ | | | | | | | | | 119,600 | | | | 1,612,208 | |
Demandware Incorporated Ǡ | | | | | | | | | 86,000 | | | | 2,347,800 | |
LivePerson Incorporated † | | | | | | | | | 124,442 | | | | 1,595,346 | |
SPS Commerce Incorporated † | | | | | | | | | 41,809 | | | | 1,970,458 | |
Support.com Incorporated † | | | | | | | | | 588,637 | | | | 2,348,664 | |
| | | | |
| | | | | | | | | | | | | 11,589,068 | |
| | | | | | | | | | | | | | |
| | | |
| Semiconductors & Semiconductor Equipment: 4.27% | | | | | | | | | | | |
Cavium Incorporated Ǡ | | | | | | | | | 114,600 | | | | 3,604,170 | |
Mellanox Technologies Limited Ǡ | | | | | | | | | 17,200 | | | | 876,856 | |
Power Integrations Incorporated « | | | | | | | | | 41,800 | | | | 1,730,938 | |
| | | | |
| | | | | | | | | | | | | 6,211,964 | |
| | | | | | | | | | | | | | |
| | | |
| Software: 7.08% | | | | | | | | | | | |
Concur Technologies Incorporated Ǡ | | | | | | | | | 47,078 | | | | 3,441,873 | |
Fleetmatics Group plc † | | | | | | | | | 40,800 | | | | 957,576 | |
Qlik Technologies Incorporated Ǡ | | | | | | | | | 68,300 | | | | 1,776,483 | |
Sourcefire Incorporated † | | | | | | | | | 30,700 | | | | 1,466,232 | |
Ultimate Software Group Incorporated † | | | | | | | | | 27,674 | | | | 2,673,032 | |
| | | | |
| | | | | | | | | | | | | 10,315,196 | |
| | | | | | | | | | | | | | |
| | | |
Materials: 2.42% | | | | | | | | | | | |
| | | |
| Chemicals: 0.75% | | | | | | | | | | | |
Rockwood Holdings Incorporated | | | | | | | | | 16,752 | | | | 1,087,037 | |
| | | | | | | | | | | | | | |
| | | |
| Metals & Mining: 1.67% | | | | | | | | | | | |
Materion Corporation « | | | | | | | | | 92,066 | | | | 2,438,828 | |
| | | | | | | | | | | | | | |
| | | |
Telecommunication Services: 2.91% | | | | | | | | | | | |
| | | |
| Diversified Telecommunication Services: 2.91% | | | | | | | | | | | |
Cogent Communications Group Incorporated | | | | | | | | | 147,800 | | | | 4,232,992 | |
| | | | | | | | | | | | | | |
| | | |
Total Common Stocks (Cost $109,332,271) | | | | | | | | | | 142,210,925 | |
| | | | | | | | | | | | | | |
| | | |
Investment Companies: 0.40% | | | | | | | | | | | |
iShares Russell 2000 Growth Index Fund | | | | | | | | | 5,485 | | | | 586,895 | |
| | | | | | | | | | | | | | |
| | | |
Total Investment Companies (Cost $584,720) | | | | | | | | | | 586,895 | |
| | | | | | | | | | | | | | |
| | | | |
| | | Yield | | | | | | | | | |
| | | |
Short-Term Investments: 35.21% | | | | | | | | | | | |
| | | |
| Investment Companies: 35.21% | | | | | | | | | | | |
Wells Fargo Advantage Cash Investment Money Market Fund, Select Class (u)(l) | | | 0.13 | % | | | | | 3,343,798 | | | | 3,343,798 | |
Wells Fargo Securities Lending Cash Investments, LLC (v)(r)(u)(l) | | | 0.18 | | | | | | 47,914,521 | | | | 47,914,521 | |
| | | | | | | | | | | | | | |
| | | |
Total Short-Term Investments (Cost $51,258,319) | | | | | | | | | | 51,258,319 | |
| | | | | | | | | | | | | | |
| | | | | | | | |
| Total investments in securities | | | | | | | | |
| (Cost $161,175,310) * | | | 133.28 | % | | | 194,056,139 | |
Other assets and liabilities, net | | | (33.28 | ) | | | (48,459,204 | ) |
| | | | | | | | |
| Total net assets | | | 100.00 | % | | $ | 145,596,935 | |
| | | | | | | | |
The accompanying notes are an integral part of these financial statements.
| | | | | | |
| Portfolio of investments—April 30, 2013 (unaudited) | | Wells Fargo Advantage Traditional Small Cap Growth Fund | | | 11 | |
| † | Non-income-earning security |
| « | All or a portion of this security is on loan. |
| (u) | Rate shown is the 7-day annualized yield at period end. |
| (l) | Investment in an affiliate |
| (v) | Security represents investment of cash collateral received from securities on loan. |
| (r) | The investment company is exempt from registration under Section 3(c)(7) of the Investment Company Act of 1940, as amended. |
| * | Cost for federal income tax purposes is $162,461,068 and unrealized appreciation (depreciation) consists of: |
| | | | |
Gross unrealized appreciation | | $ | 35,802,897 | |
Gross unrealized depreciation | | | (4,207,826 | ) |
| | | | |
Net unrealized appreciation | | $ | 31,595,071 | |
The accompanying notes are an integral part of these financial statements.
| | | | |
| 12 | | Wells Fargo Advantage Traditional Small Cap Growth Fund | | Statement of assets and liabilities—April 30, 2013 (unaudited) |
| | | | |
| | | | |
| |
Assets | | | | |
Investments | | | | |
In unaffiliated securities (including securities on loan), at value (see cost below) | | $ | 142,797,820 | |
In affiliated securities, at value (see cost below) | | | 51,258,319 | |
| | | | |
Total investments, at value (see cost below) | | | 194,056,139 | |
Receivable for investments sold | | | 2,312,148 | |
Receivable for Fund shares sold | | | 7,867 | |
Receivable for dividends | | | 9,261 | |
Receivable for securities lending income | | | 30,725 | |
Prepaid expenses and other assets | | | 23,053 | |
| | | | |
Total assets | | | 196,439,193 | |
| | | | |
| |
Liabilities | | | | |
Payable for investments purchased | | | 2,265,801 | |
Payable for Fund shares redeemed | | | 466,474 | |
Payable upon receipt of securities loaned | | | 47,914,521 | |
Advisory fee payable | | | 80,518 | |
Distribution fees payable | | | 71 | |
Due to other related parties | | | 33,304 | |
Accrued expenses and other liabilities | | | 81,569 | |
| | | | |
Total liabilities | | | 50,842,258 | |
| | | | |
Total net assets | | $ | 145,596,935 | |
| | | | |
| |
NET ASSETS CONSIST OF | | | | |
Paid-in capital | | $ | 105,251,608 | |
Accumulated net investment loss | | | (832,188 | ) |
Accumulated net realized gains on investments | | | 8,296,686 | |
Net unrealized gains on investments | | | 32,880,829 | |
| | | | |
Total net assets | | $ | 145,596,935 | |
| | | | |
| |
COMPUTATION OF NET ASSET VALUE AND OFFERING PRICE PER SHARE1 | | | | |
Net assets – Class A | | $ | 118,775,828 | |
Shares outstanding – Class A | | | 6,443,687 | |
Net asset value per share – Class A | | | $18.43 | |
Maximum offering price per share – Class A2 | | | $19.55 | |
Net assets – Class C | | $ | 117,850 | |
Shares outstanding – Class C | | | 6,526 | |
Net asset value per share – Class C | | | $18.06 | |
Net assets – Administrator Class | | $ | 3,223,661 | |
Shares outstanding – Administrator Class | | | 166,236 | |
Net asset value per share – Administrator Class | | | $19.39 | |
Net assets – Institutional Class | | $ | 23,479,596 | |
Shares outstanding – Institutional Class | | | 1,203,831 | |
Net asset value per share – Institutional Class | | | $19.50 | |
| |
Investments in unaffiliated securities (including securities on loan), at cost | | $ | 109,916,991 | |
| | | | |
Investments in affiliated securities, at cost | | $ | 51,258,319 | |
| | | | |
Total investments, at cost | | $ | 161,175,310 | |
| | | | |
Securities on loan, at value | | $ | 46,717,922 | |
| | | | |
| 1. | The Fund has an unlimited number of authorized shares. |
| 2. | Maximum offering price is computed as 100/94.25 of net asset value. On investments of $50,000 or more, the offering price is reduced. |
The accompanying notes are an integral part of these financial statements.
| | | | | | |
| Statement of operations—six months ended April 30, 2013 (unaudited) | | Wells Fargo Advantage Traditional Small Cap Growth Fund | | | 13 | |
| | | | |
| | | | |
| |
Investment income | | | | |
Dividends | | $ | 745,763 | |
Securities lending income, net | | | 228,294 | |
Income from affiliated securities | | | 1,712 | |
| | | | |
Total investment income | | | 975,769 | |
| | | | |
| |
Expenses | | | | |
Advisory fee | | | 615,744 | |
Administration fees | | | | |
Fund level | | | 38,484 | |
Class A | | | 152,534 | |
Class C | | | 133 | |
Administrator Class | | | 1,550 | |
Institutional Class | | | 13,360 | |
Shareholder servicing fees | | | | |
Class A | | | 146,667 | |
Class C | | | 128 | |
Administrator Class | | | 2,531 | |
Distribution fees | | | | |
Class C | | | 383 | |
Custody and accounting fees | | | 8,879 | |
Professional fees | | | 19,296 | |
Registration fees | | | 30,169 | |
Shareholder report expenses | | | 21,673 | |
Trustees’ fees and expenses | | | 8,032 | |
Other fees and expenses | | | 2,320 | |
| | | | |
Total expenses | | | 1,061,883 | |
Less: Fee waivers and/or expense reimbursements | | | (98,840 | ) |
| | | | |
Net expenses | | | 963,043 | |
| | | | |
Net investment income | | | 12,726 | |
| | | | |
| |
REALIZED AND UNREALIZED GAINS (LOSSES) ON INVESTMENTS | | | | |
Net realized gains on investments | | | 10,108,196 | |
Net change in unrealized gains (losses) on investments | | | 3,402,872 | |
| | | | |
Net realized and unrealized gains (losses) on investments | | | 13,511,068 | |
| | | | |
Net increase in net assets resulting from operations | | $ | 13,523,794 | |
| | | | |
The accompanying notes are an integral part of these financial statements.
| | | | |
| 14 | | Wells Fargo Advantage Traditional Small Cap Growth Fund | | Statement of changes in net assets |
| | | | | | | | | | | | | | | | |
| | | Six months ended April 30, 2013 (unaudited) | | | Year ended October 31, 2012 | |
| | | | |
Operations | | | | | | | | | | | | | | | | |
Net investment income (loss) | | | | | | $ | 12,726 | | | | | | | $ | (1,103,895 | ) |
Net realized gains on investments | | | | | | | 10,108,196 | | | | | | | | 21,234,892 | |
Net change in unrealized gains (losses) on investments | | | | | | | 3,402,872 | | | | | | | | 1,779,794 | |
| | | | | | | | | | | | | | | | |
Net increase in net assets resulting from operations | | | | | | | 13,523,794 | | | | | | | | 21,910,791 | |
| | | | | | | | | | | | | | | | |
| | | | |
Distributions to shareholders from | | | | | | | | | | | | | | | | |
Net realized gains | | | | | | | | | | | | | | | | |
Class A | | | | | | | (1,390,341 | ) | | | | | | | 0 | |
Class C | | | | | | | (1,120 | ) | | | | | | | 0 | |
Administrator Class | | | | | | | (34,634 | ) | | | | | | | 0 | |
Institutional Class | | | | | | | (435,430 | ) | | | | | | | 0 | |
| | | | | | | | | | | | | | | | |
Total distributions to shareholders | | | | | | | (1,861,525 | ) | | | | | | | 0 | |
| | | | | | | | | | | | | | | | |
| | | | |
| | | Shares | | | | | | | | Shares | | | | | |
Capital share transactions | | | | | | | | | | | | | | | | |
Proceeds from shares sold | | | | | | | | | | | | | | | | |
Class A | | | 81,511 | | | | 1,422,107 | | | | 448,411 | | | | 7,492,791 | |
Class C | | | 1,150 | | | | 20,407 | | | | 3,671 | | | | 60,566 | |
Administrator Class | | | 8,338 | | | | 155,529 | | | | 12,871 | | | | 224,956 | |
Institutional Class | | | 96,457 | | | | 1,798,340 | | | | 323,996 | | | | 5,718,207 | |
| | | | | | | | | | | | | | | | |
| | | | | | | 3,396,383 | | | | | | | | 13,496,520 | |
| | | | | | | | | | | | | | | | |
Reinvestment of distributions | | | | | | | | | | | | | | | | |
Class A | | | 80,585 | | | | 1,329,468 | | | | 0 | | | | 0 | |
Class C | | | 51 | | | | 831 | | | | 0 | | | | 0 | |
Administrator Class | | | 1,839 | | | | 31,884 | | | | 0 | | | | 0 | |
Institutional Class | | | 12,276 | | | | 213,954 | | | | 0 | | | | 0 | |
| | | | | | | | | | | | | | | | |
| | | | | | | 1,576,137 | | | | | | | | 0 | |
| | | | | | | | | | | | | | | | |
Payment for shares redeemed | | | | | | | | | | | | | | | | |
Class A | | | (714,172 | ) | | | (12,500,446 | ) | | | (1,488,763 | ) | | | (24,960,878 | ) |
Class C | | | (1,559 | ) | | | (25,183 | ) | | | (4,370 | ) | | | (71,416 | ) |
Administrator Class | | | (14,633 | ) | | | (269,282 | ) | | | (54,670 | ) | | | (930,097 | ) |
Institutional Class | | | (1,298,687 | ) | | | (24,071,005 | ) | | | (2,368,280 | ) | | | (41,700,975 | ) |
| | | | | | | | | | | | | | | | |
| | | | | | | (36,865,916 | ) | | | | | | | (67,663,366 | ) |
| | | | | | | | | | | | | | | | |
Net decrease in net assets resulting from capital share transactions | | | | | | | (31,893,396 | ) | | | | | | | (54,166,846 | ) |
| | | | | | | | | | | | | | | | |
Total decrease in net assets | | | | | | | (20,231,127 | ) | | | | | | | (32,256,055 | ) |
| | | | | | | | | | | | | | | | |
| | | | |
Net assets | | | | | | | | | | | | | | | | |
Beginning of period | | | | | | | 165,828,062 | | | | | | | | 198,084,117 | |
| | | | | | | | | | | | | | | | |
End of period | | | | | | $ | 145,596,935 | | | | | | | $ | 165,828,062 | |
| | | | | | | | | | | | | | | | |
Accumulated net investment loss | | | | | | $ | (832,188 | ) | | | | | | $ | (844,914 | ) |
| | | | | | | | | | | | | | | | |
The accompanying notes are an integral part of these financial statements.
| | | | | | |
| Financial highlights | | Wells Fargo Advantage Traditional Small Cap Growth Fund | | | 15 | |
(For a share outstanding throughout each period)
| | | | | | | | | | | | | | | | | | | | | | | | | | | | |
| | | Six months ended
April 30, 2013
(unaudited) | | | Year ended October 31 | | | Year ended September 30 | |
| CLASS A | | | 2012 | | | 2011 | | | 20101 | | | 20102 | | | 20092 | | | 20082 | |
Net asset value, beginning of period | | $ | 17.08 | | | $ | 15.31 | | | $ | 14.31 | | | $ | 13.77 | | | $ | 12.24 | | | $ | 12.20 | | | $ | 18.70 | |
Net investment loss | | | (0.01 | )3 | | | (0.11 | )3 | | | (0.16 | )3 | | | (0.02 | )3 | | | (0.12 | )3 | | | (0.04 | )3 | | | (0.03 | )3 |
Net realized and unrealized gains (losses) on investments | | | 1.56 | | | | 1.88 | | | | 1.16 | | | | 0.56 | | | | 1.65 | | | | 0.10 | | | | (3.61 | ) |
| | | | | | | | | | | | | | | | | | | | | | | | | | | | |
Total from investment operations | | | 1.55 | | | | 1.77 | | | | 1.00 | | | | 0.54 | | | | 1.53 | | | | 0.06 | | | | (3.64 | ) |
Distributions to shareholders from | | | | | | | | | | | | | | | | | | | | | | | | | | | | |
Net realized gains | | | (0.20 | ) | | | 0.00 | | | | 0.00 | | | | 0.00 | | | | 0.00 | | | | (0.02 | ) | | | (2.84 | ) |
Tax basis return of capital | | | 0.00 | | | | 0.00 | | | | 0.00 | | | | 0.00 | | | | 0.00 | | | | 0.00 | | | | (0.02 | ) |
| | | | | | | | | | | | | | | | | | | | | | | | | | | | |
Total distributions to shareholders | | | (0.20 | ) | | | 0.00 | | | | 0.00 | | | | 0.00 | | | | 0.00 | | | | (0.02 | ) | | | (2.86 | ) |
Net asset value, end of period | | | $18.43 | | | | $17.08 | | | | $15.31 | | | | $14.31 | | | | $13.77 | | | | $12.24 | | | | $12.20 | |
Total return4 | | | 9.24 | % | | | 11.56 | % | | | 6.99 | % | | | 3.92 | % | | | 12.50 | % | | | 0.53 | % | | | (22.75 | )% |
Ratios to average net assets (annualized) | | | | | | | | | | | | | | | | | | | | | | | | | |
Gross expenses | | | 1.48 | % | | | 1.48 | % | | | 1.43 | % | | | 1.47 | % | | | 1.39 | % | | | 1.33 | % | | | 1.27 | % |
Net expenses | | | 1.33 | % | | | 1.33 | % | | | 1.33 | % | | | 1.33 | % | | | 1.33 | % | | | 1.33 | % | | | 1.25 | % |
Net investment loss | | | (0.09 | )% | | | (0.69 | )% | | | (0.96 | )% | | | (0.64 | )% | | | (0.92 | )% | | | (0.45 | )% | | | (0.24 | )% |
Supplemental data | | | | | | | | | | | | | | | | | | | | | | | | | | | | |
Portfolio turnover rate | | | 42 | % | | | 57 | % | | | 123 | % | | | 9 | % | | | 80 | % | | | 118 | % | | | 113 | % |
Net assets, end of period (000s omitted) | | | $118,776 | | | | $119,490 | | | | $123,063 | | | | $136,332 | | | | $133,166 | | | | $48,067 | | | | $56,067 | |
| 1. | For the one month ended October 31, 2010. The Fund changed its fiscal year end from September 30 to October 31, effective October 31, 2010. |
| 2. | After the close of business on July 16, 2010, the Fund acquired the net assets of Evergreen Growth Fund which became the accounting and performance survivor in the transaction. The information for the periods prior to July 19, 2010 is that of Class A of Evergreen Growth Fund. |
| 3. | Calculated based upon average shares outstanding |
| 4. | Total return calculations do not include any sales charges. Returns for periods of less than one year are not annualized. |
The accompanying notes are an integral part of these financial statements.
| | | | |
| 16 | | Wells Fargo Advantage Traditional Small Cap Growth Fund | | Financial highlights |
(For a share outstanding throughout each period)
| | | | | | | | | | | | | | | | | | | | |
| | | Six months ended
April 30, 2013
(unaudited) | | | Year ended October 31 | | | Year ended
September 30
20102 | |
| CLASS C | | | 2012 | | | 2011 | | | 20101 | | |
Net asset value, beginning of period | | $ | 16.80 | | | $ | 15.18 | | | $ | 14.29 | | | $ | 13.66 | | | $ | 13.18 | |
Net investment loss | | | (0.08 | ) | | | (0.25 | ) | | | (0.27 | )3 | | | (0.02 | )3 | | | (0.04 | )3 |
Net realized and unrealized gains (losses) on investments | | | 1.54 | | | | 1.87 | | | | 1.16 | | | | 0.65 | | | | 0.52 | |
| | | | | | | | | | | | | | | | | | | | |
Total from investment operations | | | 1.46 | | | | 1.62 | | | | 0.89 | | | | 0.63 | | | | 0.48 | |
Distributions to shareholders from | | | | | | | | | | | | | | | | | | | | |
Net realized gains | | | (0.20 | ) | | | 0.00 | | | | 0.00 | | | | 0.00 | | | | 0.00 | |
Net asset value, end of period | | $ | 18.06 | | | $ | 16.80 | | | $ | 15.18 | | | $ | 14.29 | | | $ | 13.66 | |
Total return4 | | | 8.85 | % | | | 10.74 | % | | | 6.16 | % | | | 3.93 | % | | | 4.32 | % |
Ratios to average net assets (annualized) | | | | | | | | | | | | | | | | | | | | |
Gross expenses | | | 2.23 | % | | | 2.23 | % | | | 2.18 | % | | | 2.25 | % | | | 2.19 | % |
Net expenses | | | 2.08 | % | | | 2.08 | % | | | 2.08 | % | | | 2.08 | % | | | 2.08 | % |
Net investment loss | | | (0.82 | )% | | | (1.44 | )% | | | (1.72 | )% | | | (1.31 | )% | | | (1.67 | )% |
Supplemental data | | | | | | | | | | | | | | | | | | | | |
Portfolio turnover rate | | | 42 | % | | | 57 | % | | | 123 | % | | | 9 | % | | | 80 | % |
Net assets, end of period (000s omitted) | | | $118 | | | | $116 | | | | $115 | | | | $99 | | | | $10 | |
| 1. | For the one month ended October 31, 2010. The Fund changed its fiscal year end from September 30 to October 31, effective October 31, 2010. |
| 2. | For the period from July 30, 2010 (commencement of class operations) to September 30, 2010. |
| 3. | Calculated based upon average shares outstanding |
| 4. | Total return calculations do not include any sales charges. Returns for periods of less than one year are not annualized. |
The accompanying notes are an integral part of these financial statements.
| | | | | | |
| Financial highlights | | Wells Fargo Advantage Traditional Small Cap Growth Fund | | | 17 | |
(For a share outstanding throughout each period)
| | | | | | | | | | | | | | | | | | | | |
| | | Six months ended
April 30, 2013
(unaudited) | | | Year ended October 31 | | | Year ended
September 30
20102 | |
| ADMINISTRATOR CLASS | | | 2012 | | | 2011 | | | 20101 | | |
Net asset value, beginning of period | | $ | 17.94 | | | $ | 16.06 | | | $ | 14.99 | | | $ | 14.43 | | | $ | 13.80 | |
Net investment income (loss) | | | 0.01 | 3 | | | (0.09 | )3 | | | (0.14 | )3 | | | (0.01 | )3 | | | (0.02 | )3 |
Net realized and unrealized gains (losses) on investments | | | 1.64 | | | | 1.97 | | | | 1.21 | | | | 0.57 | | | | 0.65 | |
| | | | | | | | | | | | | | | | | | | | |
Total from investment operations | | | 1.65 | | | | 1.88 | | | | 1.07 | | | | 0.56 | | | | 0.63 | |
Distributions to shareholders from | | | | | | | | | | | | | | | | | | | | |
Net realized gains | | | (0.20 | ) | | | 0.00 | | | | 0.00 | | | | 0.00 | | | | 0.00 | |
Net asset value, end of period | | $ | 19.39 | | | $ | 17.94 | | | $ | 16.06 | | | $ | 14.99 | | | $ | 14.43 | |
Total return4 | | | 9.35 | % | | | 11.71 | % | | | 7.14 | % | | | 3.95 | % | | | 4.49 | % |
Ratios to average net assets (annualized) | | | | | | | | | | | | | | | | | | | | |
Gross expenses | | | 1.23 | % | | | 1.26 | % | | | 1.23 | % | | | 1.31 | % | | | 1.37 | % |
Net expenses | | | 1.16 | % | | | 1.17 | % | | | 1.19 | % | | | 1.20 | % | | | 1.20 | % |
Net investment income (loss) | | | 0.06 | % | | | (0.54 | )% | | | (0.83 | )% | | | (0.55 | )% | | | (0.77 | )% |
Supplemental data | | | | | | | | | | | | | | | | | | | | |
Portfolio turnover rate | | | 42 | % | | | 57 | % | | | 123 | % | | | 9 | % | | | 80 | % |
Net assets, end of period (000s omitted) | | $ | 3,224 | | | $ | 3,063 | | | $ | 3,413 | | | | $11 | | | | $10 | |
| 1. | For the one month ended October 31, 2010. The Fund changed its fiscal year end from September 30 to October 31, effective October 31, 2010. |
| 2. | For the period from July 30, 2010 (commencement of class operations) to September 30, 2010. |
| 3. | Calculated based upon average shares outstanding |
| 4. | Returns for periods of less than one year are not annualized. |
The accompanying notes are an integral part of these financial statements.
| | | | |
| 18 | | Wells Fargo Advantage Traditional Small Cap Growth Fund | | Financial highlights |
(For a share outstanding throughout each period)
| | | | | | | | | | | | | | | | | | | | | | | | | | | | |
| | | Six months ended
April 30, 2013
(unaudited) | | | Year ended October 31 | | | Year ended September 30 | |
| INSTITUTIONAL CLASS | | | 2012 | | | 2011 | | | 20101 | | | 20102 | | | 20092 | | | 20082 | |
Net asset value, beginning of period | | | $18.03 | | | | $16.11 | | | | $15.01 | | | | $14.43 | | | | $12.79 | | | | $12.75 | | | | $19.37 | |
Net investment income (loss) | | | 0.04 | 3 | | | (0.06 | )3 | | | (0.10 | ) | | | (0.00 | )3,4 | | | (0.10 | )3 | | | (0.02 | )3 | | | 0.01 | |
Net realized and unrealized gains (losses) on investments | | | 1.63 | | | | 1.98 | | | | 1.20 | | | | 0.58 | | | | 1.74 | | | | 0.10 | | | | (3.77 | ) |
| | | | | | | | | | | | | | | | | | | | | | | | | | | | |
Total from investment operations | | | 1.67 | | | | 1.92 | | | | 1.10 | | | | 0.58 | | | | 1.64 | | | | 0.08 | | | | (3.76 | ) |
Distributions to shareholders from | | | | | | | | | | | | | | | | | | | | | | | | | | | | |
Net investment income | | | 0.00 | | | | 0.00 | | | | 0.00 | | | | 0.00 | | | | (0.00 | )4 | | | (0.02 | ) | | | 0.00 | |
Net realized gains | | | (0.20 | ) | | | 0.00 | | | | 0.00 | | | | 0.00 | | | | 0.00 | | | | (0.02 | ) | | | (2.84 | ) |
Tax basis return of capital | | | 0.00 | | | | 0.00 | | | | 0.00 | | | | 0.00 | | | | 0.00 | | | | 0.00 | | | | (0.02 | ) |
| | | | | | | | | | | | | | | | | | | | | | | | | | | | |
Total distributions to shareholders | | | (0.20 | ) | | | 0.00 | | | | 0.00 | | | | 0.00 | | | | (0.00 | )4 | | | (0.04 | ) | | | (2.86 | ) |
Net asset value, end of period | | $ | 19.50 | | | $ | 18.03 | | | $ | 16.11 | | | $ | 15.01 | | | $ | 14.43 | | | $ | 12.79 | | | $ | 12.75 | |
Total return5 | | | 9.42 | % | | | 11.92 | % | | | 7.33 | % | | | 4.02 | % | | | 12.87 | % | | | 0.74 | % | | | (22.56 | )% |
Ratios to average net assets (annualized) | | | | | | | | | | | | | | | | | | | | | | | | | |
Gross expenses | | | 1.04 | % | | | 1.05 | % | | | 1.00 | % | | | 1.04 | % | | | 1.06 | % | | | 1.08 | % | | | 0.99 | % |
Net expenses | | | 0.98 | % | | | 0.98 | % | | | 0.98 | % | | | 0.98 | % | | | 1.05 | % | | | 1.08 | % | | | 0.99 | % |
Net investment income (loss) | | | 0.40 | % | | | (0.35 | )% | | | (0.61 | )% | | | (0.29 | )% | | | (0.78 | )% | | | (0.20 | )% | | | 0.02 | % |
Supplemental data | | | | | | | | | | | | | | | | | | | | | | | | | | | | |
Portfolio turnover rate | | | 42 | % | | | 57 | % | | | 123 | % | | | 9 | % | | | 80 | % | | | 118 | % | | | 113 | % |
Net assets, end of period (000s omitted) | | | $23,480 | | | | $43,160 | | | | $71,493 | | | | $105,475 | | | | $102,499 | | | | $344,313 | | | | $395,954 | |
| 1. | For the one month ended October 31, 2010. The Fund changed its fiscal year end from September 30 to October 31, effective October 31, 2010. |
| 2. | After the close of business on July 16, 2010, the Fund acquired the net assets of Evergreen Growth Fund which became the accounting and performance survivor in the transaction. The information for the periods prior to July 19, 2010 is that of Class I of Evergreen Growth Fund. |
| 3. | Calculated based upon average shares outstanding |
| 4. | Amount is less than $0.005. |
| 5. | Returns for periods of less than one year are not annualized. |
The accompanying notes are an integral part of these financial statements.
| | | | | | |
| Notes to financial statements (unaudited) | | Wells Fargo Advantage Traditional Small Cap Growth Fund | | | 19 | |
1. ORGANIZATION
Wells Fargo Funds Trust (the “Trust”), a Delaware statutory trust organized on March 10, 1999, is an open-end management investment company registered under the Investment Company Act of 1940, as amended (the “1940 Act”). These financial statements report on Wells Fargo Advantage Traditional Small Cap Growth Fund (the “Fund”) which is a diversified series of the Trust.
2. SIGNIFICANT ACCOUNTING POLICIES
The following significant accounting policies, which are consistently followed in the preparation of the financial statements of the Fund, are in conformity with U.S. generally accepted accounting principles which require management to make estimates and assumptions that affect the reported amounts of assets and liabilities, disclosure of contingent assets and liabilities at the date of the financial statements, and the reported amounts of revenues and expenses during the reporting period. Actual results could differ from those estimates.
Securities valuation
All investments are valued each business day as of the close of regular trading on the New York Stock Exchange (normally
4 p.m. Eastern Time).
Equity securities that are listed on a foreign or domestic exchange, except for The Nasdaq Stock Market, Inc. (“Nasdaq”), are valued at the official closing price or, if none, the last sales price. Securities listed on Nasdaq are valued at the Nasdaq Official Closing Price (“NOCP”). If no NOCP is available, securities are valued at the last sales price. If no sales price is shown on the Nasdaq, the bid price will be used. If no sale occurs on the primary exchange or market for the security that day or if no sale occurs and no bid price is shown on Nasdaq, the prior day’s price will be deemed “stale” and fair values will be determined in accordance with the Fund’s Valuation Procedures.
Investments in registered open-end investment companies are valued at net asset value. Non-registered investment companies are fair valued at net asset value.
Investments which are not valued using any of the methods discussed above are valued at their fair value, as determined by procedures established in good faith and approved by the Board of Trustees. The Board of Trustees has established a Valuation Committee comprised of the Trustees and has delegated to it the authority to take any actions regarding the valuation of portfolio securities that the Valuation Committee deems necessary or appropriate, including determining the fair value of portfolio securities, unless the determination has been delegated to the Management Valuation Team of Wells Fargo Funds Management, LLC (“Funds Management”). The Board of Trustees retains the authority to make or ratify any valuation decisions or approve any changes to the Valuation Procedures as it deems appropriate. On a quarterly basis, the Board of Trustees receives reports on any valuation actions taken by the Valuation Committee or the Management Valuation Team which may include items for ratification.
Valuations of fair valued securities are compared to the next actual sales price when available, or other appropriate market information to assess the continued appropriateness of the fair valuation methodology used. These securities are fair valued on a day-to-day basis, taking into consideration changes to appropriate market information and any significant changes to the input factors considered in the valuation process until there is a readily available price provided on the exchange or by an independent pricing service. Valuations received from an independent pricing service or broker quotes are periodically validated by comparisons to most recent trades and valuations provided by other independent pricing services in addition to the review of prices by the adviser and/or subadviser. Unobservable inputs used in determining fair valuations are identified based on the type of security, taking into consideration factors utilized by market participants in valuing the investment, knowledge about the issuer and the current market environment.
Security loans
The Fund may lend its securities from time to time in order to earn additional income in the form of fees or interest on securities received as collateral or the investment of any cash received as collateral. The Fund continues to receive interest or dividends on the securities loaned. The Fund receives collateral in the form of cash or securities with a value at least equal to the value of the securities on loan. The value of the loaned securities is determined at the close of each business day and any additional required collateral is delivered to the Fund on the next business day. In a securities lending transaction, the net asset value of the Fund will be affected by an increase or decrease in the value of the securities loaned and by an increase or decrease in the value of the instrument in which collateral is invested. The amount of securities lending activity undertaken by the Fund fluctuates from time to time. In the event of default or bankruptcy by the borrower, the Fund may be prevented from recovering the loaned securities or gaining access to the collateral or may
| | | | |
| 20 | | Wells Fargo Advantage Traditional Small Cap Growth Fund | | Notes to financial statements (unaudited) |
experience delays or costs in doing so. In addition, the investment of any cash collateral received may lose all or part of its value. The Fund has the right under the lending agreement to recover the securities from the borrower on demand.
The Fund lends its securities through an unaffiliated securities lending agent. Cash collateral received in connection with its securities lending transactions is invested in Wells Fargo Securities Lending Cash Investments, LLC (the “Cash Collateral Fund”). The Cash Collateral Fund is exempt from registration under Section 3(c)(7) of the 1940 Act and is managed by Funds Management and is subadvised by Wells Capital Management Incorporated (“WellsCap”). Funds Management receives an advisory fee starting at 0.05% and declining to 0.01% as the average daily net assets of the Cash Collateral Fund increase. All of the fees received by Funds Management are paid to WellsCap for its services as subadviser. The Cash Collateral Fund seeks to provide a positive return compared to the daily Fed Funds Open rate by investing in high-quality, U.S. dollar-denominated short-term money market instruments. Cash Collateral Fund investments are fair valued based upon the amortized cost valuation technique. Income earned from investment in the Cash Collateral Fund is included in securities lending income on the Statement of Operations.
Security transactions and income recognition
Securities transactions are recorded on a trade date basis. Realized gains or losses are recorded on the basis of identified cost.
Dividend income is recognized on the ex-dividend date.
Distributions to shareholders
Distributions to shareholders from net investment income and net realized gains, if any, are recorded on the ex-dividend date. Such distributions are determined in conformity with federal income tax regulations, which may differ in amount or character from net investment income and realized gains recognized for purposes of U.S. generally accepted accounting principles.
Federal and other taxes
The Fund intends to continue to qualify as a regulated investment company by distributing substantially all of its investment company taxable income and any net realized capital gains (after reduction for capital loss carryforwards) sufficient to relieve it from all, or substantially all, federal income taxes. Accordingly, no provision for federal income taxes was required.
The Fund’s income and federal excise tax returns and all financial records supporting those returns for the prior three fiscal years are subject to examination by the federal and Delaware revenue authorities. Management has analyzed the Fund’s tax positions taken on federal, state, and foreign tax returns for all open tax years and does not believe that there are any uncertain tax positions that require recognition of a tax liability.
As of October 31, 2012, the Fund had a qualified late-year ordinary loss of $826,973 which will be recognized on the first day of the curent fiscal year. A late-year ordinary loss is the net loss comprised of (a) net gain or loss from the sale or other disposition of certain capital assets for the portion of the taxable year after October 31 and (b) other ordinary income or loss for the portion of the taxable year after December 31.
Class allocations
The separate classes of shares offered by the Fund differ principally in distribution, shareholder servicing, and administration fees. Shareholders of each class bear certain expenses that pertain to that particular class. All shareholders bear the common expenses of the Fund, earn income from the portfolio, and are allocated any unrealized gains and losses pro rata based on the average daily net assets of each class, without distinction between share classes. Dividends are determined separately for each class based on income and expenses allocable to each class. Realized gains and losses are allocated to each class pro rata based upon the net assets of each class on the date realized. Differences in per share dividend rates generally result from the relative weightings of pro rata income and realized gain allocations and from differences in separate class expenses, including distribution, shareholder servicing, and administration fees.
3. FAIR VALUATION MEASUREMENTS
Fair value measurements of investments are determined within a framework that has established a fair value hierarchy based upon the various data inputs utilized in determining the value of the Fund’s investments. The three-level hierarchy gives the highest priority to unadjusted quoted prices in active markets for identical assets or liabilities (Level 1) and the lowest priority to significant unobservable inputs (Level 3). The Fund’s investments are classified within the fair value hierarchy based on the lowest level of input that is significant to the fair value measurement. The inputs are summarized into three broad levels as follows:
| n | | Level 1 – quoted prices in active markets for identical securities |
| | | | | | |
| Notes to financial statements (unaudited) | | Wells Fargo Advantage Traditional Small Cap Growth Fund | | | 21 | |
| n | | Level 2 – other significant observable inputs (including quoted prices for similar securities, interest rates, prepayment speeds, credit risk, use of amortized cost, etc.) |
| n | | Level 3 – significant unobservable inputs (including the Fund’s own assumptions in determining the fair value of investments) |
The inputs or methodologies used for valuing investments in securities are not necessarily an indication of the risk associated with investing in those securities.
As of April 30, 2013, the inputs used in valuing investments in securities were as follows:
| | | | | | | | | | | | | | | | |
| Investments in securities | | Quoted prices (Level 1) | | | Significant other
observable inputs (Level 2) | | | Significant unobservable inputs (Level 3) | | | Total | |
Equity securities | | | | | | | | | | | | | | | | |
Common stocks | | $ | 142,210,925 | | | $ | 0 | | | $ | 0 | | | $ | 142,210,925 | |
Investment companies | | | 586,895 | | | | 0 | | | | 0 | | | | 586,895 | |
Short-term investments | | | | | | | | | | | | | | | | |
Investment companies | | | 3,343,798 | | | | 47,914,521 | | | | 0 | | | | 51,258,319 | |
| | | $ | 146,141,618 | | | $ | 47,914,521 | | | $ | 0 | | | $ | 194,056,139 | |
Transfers in and transfers out are recognized at the end of the reporting period. For the six months ended April 30, 2013, the Fund did not have any significant transfers into/out of Level 1 or Level 2.
4. TRANSACTIONS WITH AFFILIATES AND OTHER EXPENSES
Advisory fee
The Trust has entered into an advisory contract with Funds Management, an indirect wholly owned subsidiary of Wells Fargo & Company (“Wells Fargo”). The adviser is responsible for implementing investment policies and guidelines and for supervising the subadviser, who is responsible for day-to-day portfolio management of the Fund.
Pursuant to the contract, Funds Management is entitled to receive an annual advisory fee starting at 0.80% and declining to 0.70% as the average daily net assets of the Fund increase. For the six months ended April 30, 2013, the advisory fee was equivalent to an annual rate of 0.80% of the Fund’s average daily net assets.
Funds Management has retained the services of a subadviser to provide daily portfolio management to the Fund. The fee for subadvisory services is borne by Funds Management. WellsCap, an affiliate of Funds Management, is the subadviser to the Fund and is entitled to receive a fee from Funds Management at an annual rate starting at 0.55% and declining to 0.40% as the average daily net assets of the Fund increase.
Administration and transfer agent fees
The Trust has entered into an administration agreement with Funds Management. Under this agreement, for providing administrative services, which includes paying fees and expenses for services provided by the transfer agent, sub-transfer agents, omnibus account servicers and record-keepers, Funds Management is entitled to receive from the Fund an annual fund level administration fee starting at 0.05% and declining to 0.03% as the average daily net assets of the Fund increase and a class level administration fee which is calculated based on the average daily net assets of each class as follows:
| | | | |
| | | Class level
administration fee | |
Class A, Class C | | | 0.26 | % |
Administrator Class | | | 0.10 | |
Institutional Class | | | 0.08 | |
Funds Management has contractually waived and/or reimbursed advisory and administration fees to the extent necessary to maintain certain net operating expense ratios for the Fund. Waiver of fees and/or reimbursement of expenses by Funds Management were made first from fund level expenses on a proportionate basis and then from class specific expenses. Funds Management has committed through February 28, 2014 to waive fees and/or reimburse expenses to the extent necessary to cap the Fund’s expenses at 1.33% for Class A shares, 2.08% for Class C shares, 1.20% for Administrator Class shares, and 0.98% for Institutional Class shares.
| | | | |
| 22 | | Wells Fargo Advantage Traditional Small Cap Growth Fund | | Notes to financial statements (unaudited) |
Distribution fees
The Trust has adopted a Distribution Plan for Class C shares of the Fund pursuant to Rule 12b-1 under the 1940 Act. Distribution fees are charged to Class C shares and paid to Wells Fargo Funds Distributor, LLC, the principal underwriter, at an annual rate of 0.75% of the average daily net assets of Class C shares.
For the six months ended April 30, 2013, Wells Fargo Funds Distributor, LLC received $575 from the sale of Class A shares.
Shareholder servicing fees
The Trust has entered into contracts with one or more shareholder servicing agents, whereby Class A, Class C, and Administrator Class of the Fund is charged a fee at an annual rate of 0.25% of the average daily net assets of each respective class.
A portion of these total shareholder servicing fees were paid to affiliates of Wells Fargo.
5. INVESTMENT PORTFOLIO TRANSACTIONS
Purchases and sales of investments, excluding U.S. government obligations (if any) and short-term securities, for the six months ended April 30, 2013 were $64,742,797 and $95,649,505, respectively.
6. BANK BORROWINGS
The Trust (excluding the money market funds and certain other funds in the Trust) and Wells Fargo Variable Trust are parties to a $150,000,000 revolving credit agreement with State Street Bank and Trust Company, whereby the Fund is permitted to use bank borrowings for temporary or emergency purposes, such as to fund shareholder redemption requests. Interest under the credit agreement is charged to the Fund based on a borrowing rate equal to the higher of the Federal Funds rate in effect on that day plus 1.25% or the overnight LIBOR rate in effect on that day plus 1.25%. In addition, an annual commitment fee equal to 0.10% of the unused balance is allocated to each participating fund. For the six months ended April 30, 2013, the Fund paid $137 in commitment fees.
For the six months ended April 30, 2013, there were no borrowings by the Fund under the agreement.
7. INDEMNIFICATION
Under the Trust’s organizational documents, the officers and directors are indemnified against certain liabilities that may arise out of performance of their duties to the Trust. Additionally, in the normal course of business, the Trust may enter into contracts with service providers that contain a variety of indemnification clauses. The Trust’s maximum exposure under these arrangements is dependent on future claims that may be made against the Fund and, therefore, cannot be estimated.
8. NEW ACCOUNTING PRONOUNCEMENT
In December 2011, the Financial Accounting Standards Board (“FASB”) issued Accounting Standard Update (“ASU”) No. 2011-11, Disclosures about Offsetting Assets and Liabilities. ASU 2011-11, which amends FASB ASC Topic 210, Balance Sheet, creates new disclosure requirements which require entities to disclose both gross and net information for derivatives and other financial instruments that are either offset in the Statement of Assets and Liabilities or subject to an enforceable master netting arrangement or similar agreement. The disclosure requirements are effective for interim and annual reporting periods beginning on or after January 1, 2013. Management is currently assessing the potential impact, in addition to expanded financial statement disclosure, that may result from adopting this ASU.
| | | | | | |
| Other information (unaudited) | | Wells Fargo Advantage Traditional Small Cap Growth Fund | | | 23 | |
PROXY VOTING INFORMATION
A description of the policies and procedures that the Fund uses to determine how to vote proxies relating to portfolio securities is available without charge, upon request, by calling 1-800-222-8222, visiting our website at wellsfargoadvantagefunds.com, or visiting the SEC website at sec.gov. Information regarding how the Fund voted proxies relating to portfolio securities during the most recent 12-month period ended June 30 is available without charge on the Fund’s website at wellsfargoadvantagefunds.com or by visiting the SEC website at sec.gov.
PORTFOLIO HOLDINGS INFORMATION
The complete portfolio holdings for the Fund are publicly available on the Fund’s website (wellsfargoadvantagefunds.com) on a monthly, 30-day or more delayed basis. In addition, top ten holdings information for the Fund is publicly available on the Fund’s website on a monthly, seven-day or more delayed basis. The Fund files its complete schedule of portfolio holdings with the SEC for the first and third quarters of each fiscal year on Form N-Q, which is available without charge by visiting the SEC website at sec.gov. In addition, the Fund’s Form N-Q may be reviewed and copied at the SEC’s Public Reference Room in Washington, DC, and at regional offices in New York City, at 233 Broadway, and in Chicago, at 175 West Jackson Boulevard, Suite 900. Information about the Public Reference Room may be obtained by calling 1-800-SEC-0330.
| | | | |
| 24 | | Wells Fargo Advantage Traditional Small Cap Growth Fund | | Other information (unaudited) |
BOARD OF TRUSTEES AND OFFICERS
Each of the Trustees and Officers listed in the table below acts in identical capacities for the Wells Fargo Advantage family of funds, which consists of 131 funds1 comprising the Wells Fargo Funds Trust, Wells Fargo Variable Trust, Wells Fargo Master Trust and four closed-end funds (collectively the “Fund Complex”). This table should be read in conjunction with the Prospectus and the Statement of Additional Information2. All of the Trustees are also Members of the Audit and Governance Committees of each Trust in the Fund Complex. The mailing address of each Trustee and Officer is 525 Market Street, 12th Floor, San Francisco, CA 94105. Each Trustee and Officer serves an indefinite term, however, each Trustee serves such term until reaching the mandatory retirement age established by the Trustees.
Independent Trustees
| | | | | | |
Name and year of birth | | Position held and length of service* | | Principal occupations during past five years | | Other directorships during
past five years |
| Peter G. Gordon (Born 1942) | | Trustee, since 1998; Chairman, since 2005 | | Co-Founder, Retired Chairman, President and CEO of Crystal Geyser Water Company. Trustee Emeritus, Colby College. | | Asset Allocation Trust |
| Isaiah Harris, Jr. (Born 1952) | | Trustee, since 2009 | | Retired. Prior thereto, President and CEO of BellSouth Advertising and Publishing Corp. from 2005 to 2007, President and CEO of BellSouth Enterprises from 2004 to 2005 and President of BellSouth Consumer Services from 2000 to 2003. Emeritus member of the Iowa State University Foundation Board of Governors. Emeritus Member of the Advisory Board of Iowa State University School of Business. Advisory Board Member, Palm Coast Academy (charter school). Mr. Harris is a certified public accountant. | | CIGNA Corporation; Deluxe Corporation; Asset Allocation Trust |
| Judith M. Johnson (Born 1949) | | Trustee, since 2008; Audit Committee Chairman, since 2008 | | Retired. Prior thereto, Chief Executive Officer and Chief Investment Officer of Minneapolis Employees Retirement Fund from 1996 to 2008. Ms. Johnson is an attorney, certified public accountant and a certified managerial accountant. | | Asset Allocation Trust |
| Leroy Keith, Jr. (Born 1939) | | Trustee, since 2010 | | Chairman, Bloc Global Services (development and construction). Trustee of the Evergreen Funds from 1983 to 2010. Former Managing Director, Almanac Capital Management (commodities firm), former Partner, Stonington Partners, Inc. (private equity fund), former Director, Obagi Medical Products Co. and former Director, Lincoln Educational Services. | | Trustee, Virtus Fund Complex (consisting of 48 portfolios as of 1/31/2013); Asset Allocation Trust |
| David F. Larcker (Born 1950) | | Trustee, since 2009 | | James Irvin Miller Professor of Accounting at the Graduate School of Business, Stanford University, Morgan Stanley Director of the Center for Leadership Development and Research and Senior Faculty of The Rock Center for Corporate Governance since 2006. From 2005 to 2008, Professor of Accounting at the Graduate School of Business, Stanford University. Prior thereto, Ernst & Young Professor of Accounting at The Wharton School, University of Pennsylvania from 1985 to 2005. | | Asset Allocation Trust |
| Olivia S. Mitchell (Born 1953) | | Trustee, since 2006 | | International Foundation of Employee Benefit Plans Professor, Wharton School of the University of Pennsylvania since 1993. Director of Wharton’s Pension Research Council and Boettner Center on Pensions & Retirement Research, and Research Associate at the National Bureau of Economic Research. Previously, Cornell University Professor from 1978 to 1993. | | Asset Allocation Trust |
| Timothy J. Penny (Born 1951) | | Trustee, since 1996 | | President and CEO of Southern Minnesota Initiative Foundation, a non-profit organization, since 2007 and Senior Fellow at the Humphrey Institute Policy Forum at the University of Minnesota since 1995. Member of the Board of Trustees of NorthStar Education Finance, Inc., a non-profit organization, since 2007. | | Asset Allocation Trust |
| | | | | | |
| Other information (unaudited) | | Wells Fargo Advantage Traditional Small Cap Growth Fund | | | 25 | |
| | | | | | |
Name and year of birth | | Position held and length of service* | | Principal occupations during past five years | | Other directorships during
past five years |
| Michael S. Scofield (Born 1943) | | Trustee, since 2010 | | Served on the Investment Company Institute’s Board of Governors and Executive Committee from 2008-2011 as well the Governing Council of the Independent Directors Council from 2006-2011 and the Independent Directors Council Executive Committee from 2008-2011. Chairman of the IDC from 2008-2010. Institutional Investor (Fund Directions) Trustee of Year in 2007. Trustee of the Evergreen Funds (and its predecessors) from 1984 to 2010. Chairman of the Evergreen Funds from 2000-2010. Former Trustee of the Mentor Funds. Retired Attorney, Law Offices of Michael S. Scofield. | | Asset Allocation Trust |
| Donald C. Willeke (Born 1940) | | Trustee, since 1996 | | Principal of the law firm of Willeke & Daniels. General Counsel of the Minneapolis Employees Retirement Fund from 1984 until its consolidation into the Minnesota Public Employees Retirement Association on June 30, 2010. Director and Vice Chair of The Tree Trust (non-profit corporation). Director of the American Chestnut Foundation (non-profit corporation). | | Asset Allocation Trust |
| * | Length of service dates reflect the Trustee’s commencement of service with the Trust’s predecessor entities, where applicable. |
Officers
| | | | | | |
Name and year of birth | | Position held and
length of service | | Principal occupations during past five years |
| Karla M. Rabusch (Born 1959) | | President, since 2003 | | Executive Vice President of Wells Fargo Bank, N.A. and President of Wells Fargo Funds Management, LLC since 2003. | | |
Nancy Wiser1 (Born 1967) | | Treasurer, since 2012 | | Executive Vice President of Wells Fargo Funds Management, LLC since 2011. Chief Operating Officer and Chief Compliance Officer at LightBox Capital Management LLC, from 2008 to 2011. Owned and operated a consulting business providing services to various hedge funds including acting as Chief Operating Officer and Chief Compliance Officer for a hedge fund from 2007 to 2008. Chief Operating Officer and Chief Compliance Officer of GMN Capital LLC from 2006 to 2007. | | |
| C. David Messman (Born 1960) | | Secretary, since 2000; Chief Legal Officer, since 2003 | | Senior Vice President and Secretary of Wells Fargo Funds Management, LLC since 2001. Vice President and Managing Counsel of Wells Fargo Bank, N.A. since 1996. | | |
Debra Ann Early (Born 1964) | | Chief Compliance Officer, since 2007 | | Chief Compliance Officer of Wells Fargo Funds Management, LLC since 2007. Chief Compliance Officer of Parnassus Investments from 2005 to 2007. Chief Financial Officer of Parnassus Investments from 2004 to 2007. | | |
David Berardi (Born 1975) | | Assistant Treasurer, since 2009 | | Vice President of Wells Fargo Funds Management, LLC since 2009. Vice President of Evergreen Investment Management Company, LLC from 2008 to 2010. Assistant Vice President of Evergreen Investment Services, Inc. from 2004 to 2008. Manager of Fund Reporting and Control for Evergreen Investment Management Company, LLC from 2004 to 2010. | | |
| Jeremy DePalma1 (Born 1974) | | Assistant Treasurer, since 2009 | | Senior Vice President of Wells Fargo Funds Management, LLC since 2009. Senior Vice President of Evergreen Investment Management Company, LLC from 2008 to 2010. Vice President, Evergreen Investment Services, Inc. from 2004 to 2007. Head of the Fund Reporting and Control Team within Fund Administration from 2005 to 2010. | | |
| 1. | Nancy Wiser acts as Treasurer of 73 funds in the Fund Complex. Jeremy DePalma acts as Treasurer of 58 funds and Assistant Treasurer of 73 funds in the Fund Complex. |
| 2. | The Statement of Additional Information includes additional information about the Trustees and is available,without charge, upon request, by calling 1-800-222-8222 or by visiting the website at wellsfargoadvantagefunds.com. |
| | | | |
| 26 | | Wells Fargo Advantage Traditional Small Cap Growth Fund | | Other information (unaudited) |
BOARD CONSIDERATION OF INVESTMENT ADVISORY AND SUBADVISORY AGREEMENTS:
Under Section 15 of the Investment Company Act of 1940 (the “1940 Act”), the Board of Trustees (the “Board”) of Wells Fargo Funds Trust (the “Trust”), all the members of which have no direct or indirect interest in the investment advisory and sub-advisory agreements and are not “interested persons” of the Trust, as defined in the 1940 Act (the “Independent Trustees”), must determine whether to approve the continuation of the Trust’s investment advisory and sub-advisory agreements. In this regard, at an in-person meeting held on March 28-29, 2013 (the “Meeting”), the Board reviewed: (i) an investment advisory agreement with Wells Fargo Funds Management, LLC (“Funds Management”) for Wells Fargo Advantage Traditional Small Cap Growth Fund (the “Fund”) and (ii) an investment sub-advisory agreement with Wells Capital Management Incorporated (the “Sub-Adviser”), an affiliate of Funds Management, for the Fund. The investment advisory agreement with Funds Management and the investment sub-advisory agreement with the Sub-Adviser are collectively referred to as the “Advisory Agreements.”
At the Meeting, the Board considered the factors and reached the conclusions described below relating to the selection of Funds Management and the Sub-Adviser and the continuation of the Advisory Agreements. Prior to the Meeting, the Trustees conferred extensively among themselves and with representatives of Funds Management about these matters. The Board has adopted a team-based approach, with each team consisting of a sub-set of Trustees, to assist the Board in the discharge of its duties in reviewing performance and other matters throughout the year. The Independent Trustees were assisted in their evaluation of the Advisory Agreements by independent legal counsel, from whom they received separate legal advice and with whom they met separately.
In providing information to the Board, Funds Management and the Sub-Adviser were guided by a detailed set of requests for information submitted to them by independent legal counsel on behalf of the Independent Trustees at the start of the Board’s annual contract renewal process earlier in 2013. In considering and approving the Advisory Agreements, the Trustees considered the information they believed relevant, including but not limited to the information discussed below. The Board considered not only the specific information presented in connection with the Meeting, but also the knowledge gained over time through interaction with Funds Management and the Sub-Adviser about various topics. In this regard, the Board reviewed reports of Funds Management at each of its quarterly meetings, which included, among other things, portfolio reviews and performance reports. In addition, the Board and the teams mentioned above confer with portfolio managers at various times throughout the year. The Board did not identify any particular information or consideration that was all-important or controlling, and each individual Trustee may have attributed different weights to various factors.
After its deliberations, the Board unanimously determined that the continuation of the Advisory Agreements is in the best interests of the Fund and its shareholders, and that the compensation payable to Funds Management and the Sub-Adviser is reasonable. The Board considered the continuation of the Advisory Agreements for the Fund as part of its consideration of the continuation of advisory agreements for funds across the complex, but each decision was made on a fund-by-fund basis. The following summarizes a number of important, but not necessarily all, factors considered by the Board in reaching its determination.
Nature, extent and quality of services
The Board received and considered various information regarding the nature, extent and quality of services provided to the Fund by Funds Management and the Sub-Adviser under the Advisory Agreements. This information included, among other things, a summary of the background and experience of senior management of Funds Management, and the qualifications, background, tenure and responsibilities of each of the portfolio managers primarily responsible for the day-to-day portfolio management of the Fund.
The Board evaluated the ability of Funds Management and the Sub-Adviser, based on attributes such as their financial condition, resources and reputation, to attract and retain qualified investment professionals, including research, advisory and supervisory personnel. The Board further considered the compliance programs and compliance records of Funds Management and the Sub-Adviser. In addition, the Board took into account the administrative and other services provided to the Fund by Funds Management and its affiliates and Funds Management’s oversight of the Fund’s various service providers.
Fund performance and expenses
The Board considered the performance results for the Fund over various time periods ended December 31, 2012. The Board also considered these results in comparison to the performance of funds in a universe that was determined by Lipper Inc. (“Lipper”) to be similar to the Fund (the “Universe”), and in comparison to the Fund’s benchmark index and to other comparative data. Lipper is an independent provider of investment company data. The Board received a
| | | | | | |
| Other information (unaudited) | | Wells Fargo Advantage Traditional Small Cap Growth Fund | | | 27 | |
description of the methodology used by Lipper to select the mutual funds in the performance Universe. The Board noted that the performance of the Fund (Class A) was in range of or equal to the median performance of the Universe for all periods under review except the three-year period. The Board also noted that the performance of the Fund was lower than its benchmark, the Russell 2000® Growth Index, for all periods under review.
The Board received information concerning, and discussed factors contributing to, the underperformance of the Fund relative to the Universe for the three-year period and relative to the benchmark for all periods under review. Funds Management advised the Board about the market conditions and investment decisions that it believed contributed to the underperformance during those periods. The Board noted that market volatility in 2010 and 2011 affected the Fund’s performance during the three-year period under review. The Board was satisfied with the explanation it received.
The Board received and considered information regarding the Fund’s net operating expense ratios and their various components, including actual management fees (which reflect fee waivers, if any, and include advisory, administration and transfer agent fees), custodian and other non-management fees, Rule 12b-1 and non-Rule 12b-1 service fees and fee waiver and expense reimbursement arrangements. The Board also considered these ratios in comparison to the median ratios of funds in class-specific expense groups that were determined by Lipper to be similar to the Fund (the “Groups”). The Board received a description of the methodology used by Lipper to select the mutual funds in the expense Groups. Based on the Lipper reports, the Board noted that the net operating expense ratios of the Fund were lower than or in range of the median net operating expense ratios of the expense Groups. The Board and Funds Management agreed to maintain the current operating expense ratio caps for the Fund.
Based on its consideration of the factors and information it deemed relevant, including those described here, the Board concluded that the overall performance and expense structure of the Fund supported the re-approval of the Advisory Agreements.
Investment advisory and sub-advisory fee rates
The Board reviewed and considered the contractual investment advisory fee rates that are payable by the Fund to Funds Management for investment advisory services (the “Advisory Agreement Rates”), both on a stand-alone basis and on a combined basis with the Fund’s fund-level and class-level contractual administration fee rates (the “Management Rates”). The Board noted that the administration fees include transfer agency costs. The Board also reviewed and considered the contractual investment sub-advisory fee rates that are payable by Funds Management to the Sub-Adviser for investment sub-advisory services (the “Sub-Advisory Agreement Rates”).
Among other information reviewed by the Board was a comparison of the Management Rates of the Fund with those of other funds in the expense Groups at a common asset level. The Board noted that the Management Rates of the Fund were in range of the median rate for the Fund’s expense Groups for all classes except Class A. The Board and Funds Management agreed to revise the advisory fee schedule for the Fund by adding an additional breakpoint and to maintain the current operating expense ratio caps for the Fund. The Board also viewed favorably the fact that the net operating expense ratios of the Fund were lower than or in range of the median net operating expense ratios of the expense Groups.
The Board also received and considered information about the portion of the total advisory fee that was retained by Funds Management after payment of the fee to the Sub-Adviser for sub-advisory services. In assessing the reasonableness of this amount, the Board received and evaluated information concerning the nature and extent of responsibilities retained and risks assumed by Funds Management and not delegated to or assumed by the Sub-Adviser, and about Funds Management’s on-going oversight services. In recognition of the fact that the Wells Fargo enterprise provides a suite of combined advisory and sub-advisory services to the Fund through affiliated entities, the Board ascribed limited relevance to the allocation of the total advisory fee between Funds Management and the Sub-Adviser.
The Board also received and considered information about the nature and extent of services offered and fee rates charged by Funds Management and the Sub-Adviser to other types of clients. In this regard, the Board received information about the significantly greater scope of services, and compliance, reporting and other legal burdens and risks of managing mutual funds compared with those associated with managing assets of non-mutual fund clients such as collective funds or institutional separate accounts.
Based on its consideration of the factors and information it deemed relevant, including those described here, the Board determined that the Advisory Agreement Rates and the Sub-Advisory Agreement Rates were reasonable in light of the services covered by the Advisory Agreements.
| | | | |
| 28 | | Wells Fargo Advantage Traditional Small Cap Growth Fund | | Other information (unaudited) |
Profitability
The Board received and considered information concerning the profitability of Funds Management, as well as the profitability of Wells Fargo as a whole, from providing services to the Fund. The Board did not receive or consider to be necessary separate profitability information with respect to the Sub-Adviser, because, as an affiliate of Funds Management, its profitability information was subsumed in the collective Wells Fargo profitability analysis provided by Funds Management.
Funds Management explained the methodologies and estimates that it used in calculating the profitability from the Fund and the fund family as a whole. Among other things, the Board noted that the levels of profitability reported on a fund-by-fund basis varied widely, depending on factors such as the size and type of fund. Based on its review, the Board did not deem the profits reported by Funds Management to be at a level that would prevent it from approving the continuation of the Advisory Agreements.
Economies of scale
With respect to possible economies of scale, the Board reviewed the breakpoints in the Fund’s advisory fee and administration fee structure, which operate generally to reduce the Fund’s expense ratios as the Fund grows in size. It considered that, for a small fund or a fund that shrinks in size, breakpoints conversely can result in higher fee levels. The Board also considered fee waiver and expense reimbursement arrangements as a means of sharing potential economies of scale with the Fund. The Board also took into account the agreed-upon revision to the advisory fee schedule for the Fund that adds an additional breakpoint. The Board acknowledged the inherent limitations of any analysis of potential economies of scale and of any attempt to correlate breakpoints with such economies. Nonetheless, the Board concluded that the breakpoints and net operating expense ratio caps appeared to be a reasonable approach to sharing potential economies of scale with the Fund.
Other benefits to Funds Management and the Sub-Adviser
The Board received and considered information regarding potential “fall-out” or ancillary benefits received by Funds Management and its affiliates, including the Sub-Adviser, as a result of their relationship with the Fund. Ancillary benefits could include, among others, benefits directly attributable to other relationships with the Fund and benefits potentially derived from an increase in Funds Management’s and the Sub-Adviser’s business as a result of their relationship with the Fund (such as the ability to market to shareholders other financial products and services offered by Funds Management and its affiliates, including the Sub-Adviser, or to operate other products and services that follow investment strategies similar to those of the Fund).
The Board considered that Wells Fargo Funds Distributor, LLC, an affiliate of Funds Management, serves as distributor to the Fund and receives certain compensation for those services. The Board noted that various financial institutions, including affiliates of Funds Management, may receive distribution-related fees, shareholder servicing payments (including amounts derived from payments under Rule 12b-1 plans) and sub-transfer agency fees in respect of shares sold or held through them and services provided.
The Board also reviewed information about whether and to what extent soft dollar credits are sought and how any such credits are utilized, and any benefits that might be realized by an affiliated broker that handles portfolio transactions for the Fund.
Based on its consideration of the factors and information it deemed relevant, including those described here, the Board did not find that any ancillary benefits received by Funds Management and its affiliates, including the Sub-Adviser, were unreasonable.
Conclusion
After considering the above-described factors and based on its deliberations and its evaluation of the information described above, the Board unanimously approved the continuation of the Advisory Agreements for an additional one-year period.
| | | | | | |
List of abbreviations | | Wells Fargo Advantage Traditional Small Cap Growth Fund | | | 29 | |
The following is a list of common abbreviations for terms and entities that may have appeared in this report.
| ACA | — ACA Financial Guaranty Corporation |
| ADR | — American depositary receipt |
| ADS | — American depositary shares |
| AGC | — Assured Guaranty Corporation |
| AGM | — Assured Guaranty Municipal |
| Ambac | — Ambac Financial Group Incorporated |
| AMT | — Alternative minimum tax |
| BAN | — Bond anticipation notes |
| BHAC | — Berkshire Hathaway Assurance Corporation |
| CAB | — Capital appreciation bond |
| CCAB | — Convertible capital appreciation bond |
| CDA | — Community Development Authority |
| CDO | — Collateralized debt obligation |
| COP | — Certificate of participation |
| DRIVER | — Derivative inverse tax-exempt receipts |
| DW&P | — Department of Water & Power |
| DWR | — Department of Water Resources |
| ECFA | — Educational & Cultural Facilities Authority |
| EDA | — Economic Development Authority |
| EDFA | — Economic Development Finance Authority |
| ETF | — Exchange-traded fund |
| FDIC | — Federal Deposit Insurance Corporation |
| FFCB | — Federal Farm Credit Banks |
| FGIC | — Financial Guaranty Insurance Corporation |
| FHA | — Federal Housing Administration |
| FHLB | — Federal Home Loan Bank |
| FHLMC | — Federal Home Loan Mortgage Corporation |
| FICO | — The Financing Corporation |
| FNMA | — Federal National Mortgage Association |
| GDR | — Global depositary receipt |
| GNMA | — Government National Mortgage Association |
| HCFR | — Healthcare facilities revenue |
| HEFA | — Health & Educational Facilities Authority |
| HEFAR | — Higher education facilities authority revenue |
| HFA | — Housing Finance Authority |
| HFFA | — Health Facilities Financing Authority |
| HUD | — Department of Housing and Urban Development |
| IDA | — Industrial Development Authority |
| IDAG | — Industrial Development Agency |
| IDR | — Industrial development revenue |
| KRW | — Republic of Korea won |
| LIBOR | — London Interbank Offered Rate |
| LLC | — Limited liability company |
| LLP | — Limited liability partnership |
| MBIA | — Municipal Bond Insurance Association |
| MFHR | — Multifamily housing revenue |
| MSTR | — Municipal securities trust receipts |
| MUD | — Municipal Utility District |
| National | — National Public Finance Guarantee Corporation |
| PCFA | — Pollution Control Financing Authority |
| PCL | — Public Company Limited |
| PCR | — Pollution control revenue |
| PFA | — Public Finance Authority |
| PFFA | — Public Facilities Financing Authority |
| PFOTER | — Puttable floating option tax-exempt receipts |
| plc | — Public limited company |
| PUTTER | — Puttable tax-exempt receipts |
| R&D | — Research & development |
| Radian | — Radian Asset Assurance |
| RAN | — Revenue anticipation notes |
| RDA | — Redevelopment Authority |
| RDFA | — Redevelopment Finance Authority |
| REIT | — Real estate investment trust |
| ROC | — Reset option certificates |
| SAVRS | — Select auction variable rate securities |
| SBA | — Small Business Authority |
| SFHR | — Single-family housing revenue |
| SFMR | — Single-family mortgage revenue |
| SPA | — Standby purchase agreement |
| SPDR | — Standard & Poor’s Depositary Receipts |
| STRIPS | — Separate trading of registered interest and principal securities |
| TAN | — Tax anticipation notes |
| TIPS | — Treasury inflation-protected securities |
| TRAN | — Tax revenue anticipation notes |
| TTFA | — Transportation Trust Fund Authority |
| TVA | — Tennessee Valley Authority |
This page is intentionally left blank.


For more information
More information about Wells Fargo Advantage Funds is available free upon request. To obtain literature, please write, email, visit the Fund’s website, or call:
Wells Fargo Advantage Funds
P.O. Box 8266
Boston, MA 02266-8266
Email: wfaf@wellsfargo.com
Website: wellsfargoadvantagefunds.com
Individual investors: 1-800-222-8222
Retail investment professionals: 1-888-877-9275
Institutional investment professionals: 1-866-765-0778
This report and the financial statements contained herein are submitted for the general information of the shareholders of Wells Fargo Advantage Funds. If this report is used for promotional purposes, distribution of the report must be accompanied or preceded by a current prospectus. For a current prospectus and, if available, a summary prospectus containing more complete information, including charges and expenses, call 1-800-222-8222 or visit the Fund’s website at wellsfargoadvantagefunds.com. Please consider the investment objectives, risks, charges, and expenses of the investment carefully before investing. This and other information about Wells Fargo Advantage Funds can be found in the current prospectus. Read the prospectus carefully before you invest or send money.
Wells Fargo Funds Management, LLC, a wholly owned subsidiary of Wells Fargo & Company, provides investment advisory and administrative services for Wells Fargo Advantage Funds. Other affiliates of Wells Fargo & Company provide subadvisory and other services for the Funds. The Funds are distributed by Wells Fargo Funds Distributor, LLC, Member FINRA/SIPC, an affiliate of Wells Fargo & Company.
NOT FDIC INSURED ¡ NO BANK GUARANTEE ¡ MAY LOSE VALUE
© 2013 Wells Fargo Funds Management, LLC. All rights reserved.
| | |
 | | 216842 06-13 SA247/SAR247 4-13 |
Not applicable.
| ITEM 3. | AUDIT COMMITTEE FINANCIAL EXPERT |
Not applicable.
| ITEM 4. | PRINCIPAL ACCOUNTANT FEES AND SERVICES |
Not applicable.
| ITEM 5. | AUDIT COMMITTEE OF LISTED REGISTRANTS |
Not applicable.
The Portfolio of investments for each series is included as part of the report to shareholders filed under Item 1 of this Form.
| ITEM 7. | DISCLOSURE OF PROXY VOTING POLICIES AND PROCEDURES FOR CLOSED-END MANAGEMENT INVESTMENT COMPANIES |
Not applicable.
| ITEM 8. | PORTFOLIO MANAGERS OF CLOSED-END MANAGEMENT INVESTMENT COMPANIES |
Not applicable.
| ITEM 9. | PURCHASES OF EQUITY SECURITIES BY CLOSED-END MANAGEMENT INVESTMENT COMPANY AND AFFILIATED PURCHASERS |
Not applicable.
| ITEM 10. | SUBMISSION OF MATTERS TO A VOTE OF SECURITY HOLDERS |
There have been no material changes to the procedures by which shareholders may recommend nominees to the Registrant’s board of trustees that have been implemented since the Registrant’s last provided disclosure in response to the requirements of this Item.
| ITEM 11. | CONTROLS AND PROCEDURES |
(a) The President and Treasurer have concluded that the Wells Fargo Funds Trust (the “Trust”) disclosure controls and procedures (as defined in Rule 30a-3(c) under the Investment Company Act of 1940) provide reasonable assurances that material information relating to the Trust is made known to them by the appropriate persons, based on their evaluation of these controls and procedures as of a date within 90 days of the filing of this report.
(b) There were no significant changes in the Trust’s internal controls over financial reporting (as defined in Rule 30a-3(d) under the Investment Company Act of 1940) that occurred during the fiscal period covered by this report that materially affected, or is reasonably likely to materially affect, the registrant’s internal control over financial reporting.
(a)(1) Not applicable.
(a)(2) Certification pursuant to Rule 30a-2(a) under the Investment Company Act of 1940 (17 CFR 270.30a-2(a)) is filed and attached hereto as Exhibit 99.CERT.
(a)(3) Not applicable.
(b) Certification pursuant to Rule 30a-2(b) under the Investment Company Act of 1940 (17 CFR 270.30a-2(b)) is filed and attached hereto as Exhibit 99.906CERT.
SIGNATURES
Pursuant to the requirements of the Securities Exchange Act of 1934 and the Investment Company Act of 1940, the registrant has duly caused this report to be signed on its behalf by the undersigned, thereunto duly authorized.
| | |
| Wells Fargo Funds Trust |
| |
| By: | | |
| |
| | /s/ Karla M. Rabusch |
| |
| | Karla M. Rabusch |
| | President |
| |
| Date: | | June 24, 2013 |
Pursuant to the requirements of the Securities Exchange Act of 1934 and the Investment Company Act of 1940, this report has been signed below by the following persons on behalf of the registrant and in the capacities and on the date indicated.
| | |
| Wells Fargo Funds Trust |
| |
| By: | | |
| |
| | /s/ Karla M. Rabusch |
| |
| | Karla M. Rabusch |
| | President |
| |
| Date: | | June 24, 2013 |
| |
| By: | | |
| |
| | /s/ Nancy Wiser |
| |
| | Nancy Wiser |
| | Treasurer |
| |
| Date: | | June 24, 2013 |
| |
| By: | | |
| |
| | /s/ Jeremy DePalma |
| |
| | Jeremy DePalma |
| | Treasurer |
| |
| Date: | | June 24, 2013 |