
UNITED STATES
SECURITIES AND EXCHANGE COMMISSION
Washington, D.C. 20549
FORM N-CSR
CERTIFIED SHAREHOLDER REPORT OF REGISTERED
MANAGEMENT INVESTMENT COMPANIES
Investment Company Act file number: 811-09253
Wells Fargo Funds Trust
(Exact name of registrant as specified in charter)
525 Market St., San Francisco, CA 94105
(Address of principal executive offices) (Zip code)
C. David Messman
Wells Fargo Funds Management, LLC
525 Market St., San Francisco, CA 94105
(Name and address of agent for service)
Registrant’s telephone number, including area code: 800-222-8222
Date of fiscal year end: August 31
Registrant is making a filing for 10 of its series:
Wells Fargo Advantage Adjustable Rate Government Bond Fund, Wells Fargo Advantage Conservative Income Fund, Wells Fargo Advantage Government Securities Fund, Wells Fargo Advantage High Income Fund, Wells Fargo Advantage High Yield Bond Fund, Wells Fargo Advantage Income Plus Fund, Wells Fargo Advantage Short Duration Government Bond Fund, Wells Fargo Advantage Short-Term Bond Fund, Wells Fargo Advantage Short-Term High Yield Bond Fund, and Wells Fargo Advantage Ultra Short-Term Income Fund.
Date of reporting period: August 31, 2015
ITEM 1. REPORT TO STOCKHOLDERS

Wells Fargo Advantage
Adjustable Rate Government Fund

Annual Report
August 31, 2015

Reduce clutter. Save trees.
Sign up for electronic delivery of prospectuses and shareholder reports at wellsfargo.com/advantagedelivery
Contents
| * | A complete schedule of portfolio holdings as of the report date may be obtained, free of charge, by accessing the following website: https://www.wellsfargoadvantagefunds.com/assets/edocs/regulatory/holdings/adjustable-rate-government-ann.pdf or by calling Wells Fargo Advantage Funds at 1-800-222-8222. This complete schedule, filed on Form N-CSR, is also available on the SEC’s website at sec.gov. |
The views expressed and any forward-looking statements are as of August 31, 2015, unless otherwise noted, and are those of the Fund managers and/or Wells Fargo Funds Management, LLC. Discussions of individual securities, or the markets generally, or any Wells Fargo Advantage Fund are not intended as individual recommendations. Future events or results may vary significantly from those expressed in any forward-looking statements; the views expressed are subject to change at any time in response to changing circumstances in the market. Wells Fargo Funds Management, LLC and the Fund disclaim any obligation to publicly update or revise any views expressed or forward-looking statements.
NOT FDIC INSURED ¡ NO BANK GUARANTEE ¡ MAY LOSE VALUE
| | | | |
| 2 | | Wells Fargo Advantage Adjustable Rate Government Fund | | Letter to shareholders (unaudited) |

Karla M. Rabusch
President
Wells Fargo Advantage Funds
Major central banks continued to inject liquidity into global banks and markets through various accommodative monetary policies, including quantitative easing.
Dear Valued Shareholder:
We are pleased to offer you this annual report for the Wells Fargo Advantage Adjustable Rate Government Fund for the 12-month period that ended August 31, 2015. The period was marked by low interest rates, low oil prices, and moderate U.S. economic growth. Short-term investment-grade bonds, as measured by the Barclays U.S. 1–3 Year Government/Credit Bond Index,1 returned 0.81% during the period. Meanwhile, strong demand for high-quality, liquid assets kept returns on Treasury bills more modest; the Barclays 6-Month Treasury Bill Index2 returned 0.15% during the period.
Major central banks continued to provide stimulus.
Major central banks continued to inject liquidity into global banks and markets through various accommodative monetary policies, including quantitative easing. In the U.S., the Federal Reserve (Fed) kept its key interest rate near zero in order to support the economy and the financial system. However, it set expectations for it to begin normalizing monetary policy with higher target ranges for the federal funds rate.
Meanwhile, European markets continued to benefit from the European Central Bank’s (ECB’s) willingness to maintain low interest rates. In addition to its targeted longer-term refinancing operations that are designed to increase bank lending, the ECB expanded its quantitative easing program to include the purchase of eurozone government bonds. In Japan, the Bank of Japan maintained an aggressive monetary program aimed at combating deflation.
Economic growth was moderate, and oil prices plummeted.
U.S. economic growth advanced during the reporting period, the unemployment rate ticked lower to 5.1% as of August 2015, and inflation remained below the Fed’s longer-run objective of a 2% pace. The period was also marked by lower oil prices, which began the reporting period near $90 per barrel but declined to $46 per barrel at the end of August 2015. While lower oil prices benefited consumers of oil products, the lower prices pressured companies within the energy sector.
Bond yields rose but remained low by historical standards.
Short-term interest rates increased during the reporting period, with a flattening in the shape of the short-term yield curve. During this time frame, 1-year Treasury bills rose 29 basis points (bps; 100 bps equals 1.00%) to yield 0.38%, 2-year Treasury note yields rose 21 bps to yield 0.74%, and 3-year Treasury note yields rose only 8 bps to yield 1.05%. Meanwhile, ultra-short-term yields were little changed at ultralow levels, anchored by the easy monetary policy.
Since the end of the financial crisis, structural changes in the fixed-income markets have reduced trading liquidity (the degree to which assets can be bought or sold without affecting the price). New regulations and capital requirements have caused traditional liquidity suppliers (banks and broker/dealers) to be more risk-averse and hold less inventory. Meanwhile, corporate-debt issuance has spiked as companies finance themselves at record-low yields, bond mutual funds hold larger amounts of this new debt supply, trading volumes are lower, and large-size trades are more difficult to execute. However, fixed-income markets appear to have functioned well over the past year with sufficient liquidity and muted volatility.
| 1 | The Barclays U.S. 1–3 Year Government/Credit Bond Index is the one- to three-year component of the Barclays U.S. Government/Credit Bond Index that includes securities in the Government and Credit Indexes. The Government Index includes Treasuries (that is, public obligations of the U.S. Treasury that have remaining maturities of more than one year) and agencies (that is, publicly issued debt of U.S. government agencies, quasi-federal corporations, and corporate or foreign debt guaranteed by the U.S. government).The Credit Index includes publicly issued U.S. corporate and foreign debentures and secured notes that meet specified maturity, liquidity, and quality requirements. You cannot invest directly in an index. |
| 2 | The Barclays 6-Month Treasury Bill Index tracks the performance and attributes of recently issued 6-month U.S. Treasury bills. The index follows Barclays’ monthly rebalancing conventions. You cannot invest directly in an index. |
| | | | | | |
| Letter to shareholders (unaudited) | | Wells Fargo Advantage Adjustable Rate Government Fund | | | 3 | |
Don’t let short-term uncertainty derail long-term investment goals.
Periods of uncertainty can present challenges, but experience has taught us that maintaining long-term investment goals can be an effective way to plan for the future. To help you create a sound strategy based on your personal goals and risk tolerance, Wells Fargo Advantage Funds offers more than 100 mutual funds spanning a wide range of asset classes and investment styles. Although diversification cannot guarantee an investment profit or prevent losses, we believe it can be an effective way to manage investment risk and potentially smooth out overall portfolio performance. We encourage investors to know their investments and to understand that appropriate levels of risk-taking may unlock opportunities.
Thank you for choosing to invest in Wells Fargo Advantage Funds. We appreciate your confidence in us and remain committed to helping you meet your financial needs.
Sincerely,

Karla M. Rabusch
President
Wells Fargo Advantage Funds
Periods of uncertainty can present challenges, but experience has taught us that maintaining long-term investment goals can be an effective way to plan for the future.
Notice to shareholders
At a meeting held on August 11–12, 2015, the Board of Trustees of the Fund approved a change in the name of the Fund whereby the word “Advantage” will be removed from its name, effective December 15, 2015.
For current information about your fund investments, contact your investment professional, visit our website at wellsfargoadvantagefunds.com, or call us directly at 1-800-222-8222. We are available 24 hours a day, 7 days a week.
| | | | |
| 4 | | Wells Fargo Advantage Adjustable Rate Government Fund | | Performance highlights (unaudited) |
Investment objective
The Fund seeks current income consistent with capital preservation.
Adviser
Wells Fargo Funds Management, LLC
Subadviser
Wells Capital Management Incorporated
Portfolio managers
Christopher Y. Kauffman, CFA
Michal Stanczyk
Average annual total returns1 (%) as of August 31, 2015
| | | | | | | | | | | | | | | | | | | | | | | | | | | | | | | | | | |
| | | | | Including sales charge | | | Excluding sales charge | | | Expense ratios2 (%) | |
| | | Inception date | | 1 year | | | 5 year | | | 10 year | | | 1 year | | | 5 year | | | 10 year | | | Gross | | | Net3 | |
| Class A (ESAAX) | | 6-30-2000 | | | (1.80 | ) | | | 0.63 | | | | 2.02 | | | | 0.24 | | | | 1.05 | | | | 2.22 | | | | 0.79 | | | | 0.74 | |
| Class B (ESABX)* | | 6-30-2000 | | | (1.98 | ) | | | 0.44 | | | | 1.93 | | | | (0.49 | ) | | | 0.44 | | | | 1.93 | | | | 1.54 | | | | 1.49 | |
| Class C (ESACX) | | 6-30-2000 | | | (1.51 | ) | | | 0.29 | | | | 1.47 | | | | (0.51 | ) | | | 0.29 | | | | 1.47 | | | | 1.54 | | | | 1.49 | |
| Administrator Class (ESADX) | | 7-30-2010 | | | – | | | | – | | | | – | | | | 0.38 | | | | 1.19 | | | | 2.37 | | | | 0.73 | | | | 0.60 | |
| Institutional Class (EKIZX) | | 10-1-1991 | | | – | | | | – | | | | – | | | | 0.52 | | | | 1.32 | | | | 2.50 | | | | 0.46 | | | | 0.46 | |
| Barclays 6-Month Treasury Bill Index4 | | – | | | – | | | | – | | | | – | | | | 0.15 | | | | 0.20 | | | | 1.70 | | | | – | | | | – | |
| * | | Class B shares are closed to investment, except in connection with the reinvestment of any distributions and permitted exchanges. |
Figures quoted represent past performance, which is no guarantee of future results, and do not reflect taxes that a shareholder may pay on fund distributions or the redemption of fund shares. Investment return and principal value of an investment will fluctuate so that an investor’s shares, when redeemed, may be worth more or less than their original cost. Performance shown without sales charges would be lower if sales charges were reflected. Current performance may be lower or higher than the performance data quoted, which assumes the reinvestment of dividends and capital gains. Current month-end performance is available on the Fund’s website, wellsfargoadvantagefunds.com.
Index returns do not include transaction costs associated with buying and selling securities, any mutual fund fees or expenses, or any taxes. It is not possible to invest directly in an index.
For Class A shares, the maximum front-end sales charge is 2.00%. For Class B shares, the maximum contingent deferred sales charge is 1.50%. For Class C shares, the maximum contingent deferred sales charge is 1.00%. Performance including a contigent deferred sales charge assumes the sales charge for the corresponding time period. Administrator Class and Institutional Class shares are sold without a front-end sales charge or contingent deferred sales charge.
Bond values fluctuate in response to the financial condition of individual issuers, general market and economic conditions, and changes in interest rates. Changes in market conditions and government policies may lead to periods of heightened volatility in the bond market and reduced liquidity for certain bonds held by the fund. In general, when interest rates rise, bond values fall and investors may lose principal value. Interest-rate changes and their impact on the Fund and its share price can be sudden and unpredictable. The use of derivatives may reduce returns and/or increase volatility. Securities issued by U.S. government agencies or government-sponsored entities may not be guaranteed by the U.S. Treasury. Certain investment strategies tend to increase the total risk of an investment (relative to the broader market). The Fund is exposed to mortgage- and asset-backed securities risk. The U.S. government guarantee applies to certain underlying securities and not to shares of the Fund. Consult the Fund’s prospectus for additional information on these and other risks.
Please see footnotes on page 5.
| | | | | | |
| Performance highlights (unaudited) | | Wells Fargo Advantage Adjustable Rate Government Fund | | | 5 | |
|
| Growth of $10,000 investment5 as of August 31, 2015 |
|
 |
| 1 | Historical performance shown for Administrator Class shares prior to their inception reflects the performance of Institutional Class shares, adjusted to reflect the higher expenses applicable to Administrator Class shares. Historical performance shown for all classes of the Fund prior to July 12, 2010, is based on the performance of the Fund’s predecessor, Evergreen Adjustable Rate Fund. |
| 2 | Reflects the expense ratios as stated in the most recent prospectuses. The expense ratios shown are subject to change and may differ from the annualized expense ratios shown in the financial highlights of this report. |
| 3 | The Adviser has contractually committed through December 31, 2015, to waive fees and/or reimburse expenses to the extent necessary to cap the Fund’s Total Annual Fund Operating Expenses After Fee Waiver, excluding certain expenses, at the amounts shown. After this time, the cap may be increased or the commitment to maintain the cap may be terminated only with the approval of the Board of Trustees. Brokerage commissions, stamp duty fees, interest, taxes, acquired fund fees and expenses, and extraordinary expenses are excluded from the cap. Without this cap, the Fund’s returns would have been lower. |
| 4 | The Barclays 6-Month Treasury Bill Index tracks the performance and attributes of recently issued 6-month U.S. Treasury Bills. The index follows Barclays’ monthly rebalancing conventions. You cannot invest directly in an index. |
| 5 | The chart compares the performance of Class A shares for the most recent 10 years with the performance of the Barclays 6-Month Treasury Bill Index. The chart assumes a hypothetical investment of $10,000 in Class A shares and reflects all operating expenses and assumes the maximum initial sales charge of 2.00%. |
| 6 | The ten largest holdings, excluding cash and cash equivalents, are calculated based on the value of the investments divided by total net assets of the Fund. Holdings are subject to change and may have changed since the date specified. |
| 7 | Amounts are calculated based on the total long-term investments of the Fund. These amounts are subject to change and may have changed since the date specified. |
| | | | |
| 6 | | Wells Fargo Advantage Adjustable Rate Government Fund | | Performance highlights (unaudited) |
MANAGER’S DISCUSSION
Fund highlights
| n | | The Fund (Class A, excluding sales charges) outperformed its benchmark, the Barclays 6-Month Treasury Bill Index, for the 12-month period that ended August 31, 2015. |
| n | | Positive yield spread from adjustable-rate mortgages (ARMs) over short-term Treasuries contributed to outperformance during the period, although spread widening in the sector resulted in negative price performance. |
| n | | The Fund’s focus on seasoned ARMs that have already had rate-adjustment resets helped performance because these securities generally exhibited slower, more stable prepayments compared with ARMs with rate-adjustment resets still pending. |
| n | | The Fund’s duration during the period was increased from roughly 0.5 years to 0.7 years. |
| | | | |
| Ten largest holdings6 (%) as of August 31, 2015 | |
FNMA Series 2003-W18 Class 2A, 3.46%, 6-25-2043 | | | 1.14 | |
FNMA, 2.86%, 11-1-2035 | | | 0.97 | |
FHLMC Series T-67 Class 1A1C, 2.91%, 3-25-2036 | | | 0.94 | |
FNMA, 2.41%, 2-1-2036 | | | 0.94 | |
FHLMC, 2.02%, 7-1-2034 | | | 0.91 | |
FNMA Series 2002-66 Class A3, 3.19%, 4-25-2042 | | | 0.87 | |
FHLMC, 2.54%, 9-1-2030 | | | 0.82 | |
FNMA Series 2006-W1 Class 3A, 2.18%, 10-25-2045 | | | 0.80 | |
FNMA Series 2004-W15 Class 3A, 2.69%, 6-25-2044 | | | 0.76 | |
FNMA, 2.42%, 12-1-2040 | | | 0.73 | |
The economic climate remained benign.
The U.S. economy featured trend-like growth, a steadily improving labor market, and generally stable inflation over the past 12 months. Real gross domestic product growth averaged about 2.7% in the most recent four quarters as personal income gains supported consumption. In contrast, business investment softened, in part, due to weakness in the energy industry brought on by a collapse in global oil prices.
The labor market continued to tighten over the past 12 months, as evidenced by a full percentage point decline in the unemployment rate to 5.1%. Nonfarm payrolls expanded at an average pace of about 240,000 per month over the period. Following a persistent theme of this
expansion, some of the improvement in the unemployment rate can be attributed to a decline in the labor force participation rate, which fell to 62.6% at the end of the period versus 62.8% a year ago.
The inflationary environment was mixed over the past 12 months as the drop in oil prices pushed the year-over-year change in the headline Consumer Price Index (CPI) down to 0.2% compared with a 1.7% headline inflation rate a year ago. Excluding food and energy, however, the CPI rose 1.8%, which is in line with the average rate of core inflation recorded over the past five years.
Monetary policy transitioned from maximal accommodation to the beginning of a tightening cycle over the past 12 months. The Federal Open Market Committee (FOMC) completed its third round of asset purchases (popularly known as quantitative easing) in the fourth quarter of 2014, though the monetary authorities continue to reinvest the proceeds of maturing principal and interest payments from their existing portfolio. The U.S. Federal Reserve’s overnight rate target remained unchanged throughout the period, with the federal funds rate held to a range of 0.00% to 0.25%. The FOMC has said an initial hike to the federal funds target rate may be appropriate before the end of 2015, to be followed by a very gradual normalization of monetary policy.
|
| Portfolio allocation7 as of August 31, 2015 |
|
 |
The Fund was predominantly invested in adjustable-rate residential mortgage securities.
The Fund remains defensively positioned with a significant out-of-benchmark allocation to ARMs and floating-rate collateralized mortgage obligations that have frequent rate resets. In addition, we increased the Fund’s duration to approximately 0.7 years over the reporting period. We continue to find value in seasoned ARMs that have already had their rates reset with favorable prepayment characteristics.
Please see footnotes on page 5.
| | | | | | |
| Performance highlights (unaudited) | | Wells Fargo Advantage Adjustable Rate Government Fund | | | 7 | |
We expect a gradual rise in short-term interest rates.
The relatively benign domestic economic conditions described above are likely to result in an increase in interest rates. We believe the FOMC is likely to raise its target rate by 0.75% to 1.00% over the next 12 months, a result which is largely reflected in the current term structure of interest rates. Should market rates diverge from the policy path we think most likely, we will be prepared to modify our duration and yield-curve posture in response to the opportunities presented. The Fund’s short duration and its heavy emphasis on floating-rate assets are expected to result in higher income as short-term rates rise.
| | | | |
| 8 | | Wells Fargo Advantage Adjustable Rate Government Fund | | Fund expenses (unaudited) |
As a shareholder of the Fund, you incur two types of costs: (1) transaction costs, including sales charges (loads) on purchase payments and contingent deferred sales charges (if any) on redemptions and (2) ongoing costs, including management fees, distribution (12b-1) and/or shareholder servicing fees, and other Fund expenses. This example is intended to help you understand your ongoing costs (in dollars) of investing in the Fund and to compare these costs with the ongoing costs of investing in other mutual funds.
The example is based on an investment of $1,000 invested at the beginning of the six-month period and held for the entire period from March 1, 2015 to August 31, 2015.
Actual expenses
The “Actual” line of the table below provides information about actual account values and actual expenses. You may use the information in this line, together with the amount you invested, to estimate the expenses that you paid over the period. Simply divide your account value by $1,000 (for example, an $8,600 account value divided by $1,000 = 8.6), then multiply the result by the number in the “Actual” line under the heading entitled “Expenses paid during period” for your applicable class of shares to estimate the expenses you paid on your account during this period.
Hypothetical example for comparison purposes
The “Hypothetical” line of the table below provides information about hypothetical account values and hypothetical expenses based on the Fund’s actual expense ratio and an assumed rate of return of 5% per year before expenses, which is not the Fund’s actual return. The hypothetical account values and expenses may not be used to estimate the actual ending account balance or expenses you paid for the period. You may use this information to compare the ongoing costs of investing in the Fund and other funds. To do so, compare this 5% hypothetical example with the 5% hypothetical examples that appear in the shareholder reports of the other funds.
Please note that the expenses shown in the table are meant to highlight your ongoing costs only and do not reflect any transactional costs, such as sales charges (loads) and contingent deferred sales charges. Therefore, the “Hypothetical” line of the table is useful in comparing ongoing costs only and will not help you determine the relative total costs of owning different funds. In addition, if these transactional costs were included, your costs would have been higher.
| | | | | | | | | | | | | | | | |
| | | Beginning
account value
3-1-2015 | | | Ending
account value
8-31-2015 | | | Expenses
paid during
the period1 | | | Net annualized
expense ratio | |
Class A | | | | | | | | | | | | | | | | |
Actual | | $ | 1,000.00 | | | $ | 1,001.80 | | | $ | 3.73 | | | | 0.74 | % |
Hypothetical (5% return before expenses) | | $ | 1,000.00 | | | $ | 1,021.48 | | | $ | 3.77 | | | | 0.74 | % |
Class B | | | | | | | | | | | | | | | | |
Actual | | $ | 1,000.00 | | | $ | 998.16 | | | $ | 7.30 | | | | 1.45 | % |
Hypothetical (5% return before expenses) | | $ | 1,000.00 | | | $ | 1,017.90 | | | $ | 7.38 | | | | 1.45 | % |
Class C | | | | | | | | | | | | | | | | |
Actual | | $ | 1,000.00 | | | $ | 998.02 | | | $ | 7.50 | | | | 1.49 | % |
Hypothetical (5% return before expenses) | | $ | 1,000.00 | | | $ | 1,017.69 | | | $ | 7.58 | | | | 1.49 | % |
Administrator Class | | | | | | | | | | | | | | | | |
Actual | | $ | 1,000.00 | | | $ | 1,002.50 | | | $ | 3.03 | | | | 0.60 | % |
Hypothetical (5% return before expenses) | | $ | 1,000.00 | | | $ | 1,022.18 | | | $ | 3.06 | | | | 0.60 | % |
Institutional Class | | | | | | | | | | | | | | | | |
Actual | | $ | 1,000.00 | | | $ | 1,003.23 | | | $ | 2.27 | | | | 0.45 | % |
Hypothetical (5% return before expenses) | | $ | 1,000.00 | | | $ | 1,022.94 | | | $ | 2.29 | | | | 0.45 | % |
| 1 | Expenses paid is equal to the annualized expense ratio of each class multiplied by the average account value over the period, multiplied by the number of days in the most recent fiscal half-year divided by the number of days in the fiscal year (to reflect the one-half-year period). |
| | | | | | |
| Summary portfolio of investments—August 31, 2015 | | Wells Fargo Advantage Adjustable Rate Government Fund | | | 9 | |
The Summary portfolio of investments shows the 50 largest portfolio holdings in unaffiliated issuers and any holdings exceeding 1% of the total net assets as of the report date. The remaining securities held are grouped as “Other securities” in each category.
| | | | | | | | | | | | | | | | | | | | |
| Security name | | Interest rate | | | Maturity date | | | Principal | | | Value | | | Percent of
net assets | |
| | | | | |
Agency Securities: 93.87% | | | | | | | | | | | | | | | | | | | | |
FHLMC | | | 0.24-8.50 | % | | | 1-1-2016 to 2-25-2045 | | | $ | 316,843,272 | | | $ | 334,857,745 | | | | 25.52 | % |
FHLMC ± | | | 2.02 | | | | 7-1-2034 | | | | 11,303,596 | | | | 11,963,007 | | | | 0.91 | |
FHLMC ± | | | 2.39 | | | | 9-1-2034 | | | | 5,750,029 | | | | 6,124,814 | | | | 0.47 | |
FHLMC ± | | | 2.43 | | | | 9-1-2035 | | | | 7,203,669 | | | | 7,663,631 | | | | 0.59 | |
FHLMC ± | | | 2.45 | | | | 6-1-2037 | | | | 7,455,243 | | | | 7,949,431 | | | | 0.61 | |
FHLMC ± | | | 2.45 | | | | 2-1-2035 | | | | 5,740,780 | | | | 6,126,882 | | | | 0.47 | |
FHLMC ± | | | 2.45 | | | | 4-1-2038 | | | | 7,392,534 | | | | 7,884,172 | | | | 0.60 | |
FHLMC ± | | | 2.46 | | | | 6-1-2037 | | | | 7,446,519 | | | | 7,957,377 | | | | 0.61 | |
FHLMC ± | | | 2.48 | | | | 1-1-2038 | | | | 7,756,443 | | | | 8,315,691 | | | | 0.64 | |
FHLMC ± | | | 2.51 | | | | 12-1-2034 | | | | 5,601,651 | | | | 5,992,920 | | | | 0.46 | |
FHLMC ± | | | 2.53 | | | | 4-1-2034 | | | | 5,252,394 | | | | 5,619,538 | | | | 0.43 | |
FHLMC ± | | | 2.54 | | | | 9-1-2030 | | | | 10,080,026 | | | | 10,693,719 | | | | 0.82 | |
FHLMC ± | | | 2.71 | | | | 2-1-2036 | | | | 5,009,906 | | | | 5,385,657 | | | | 0.41 | |
FHLMC ± | | | 2.75 | | | | 8-1-2030 | | | | 5,602,947 | | | | 5,991,240 | | | | 0.46 | |
FHLMC Series T-62 Class 1A1 ± | | | 1.37 | | | | 10-25-2044 | | | | 5,775,941 | | | | 5,907,026 | | | | 0.45 | |
FHLMC Series T-67 Class 1A1C ± | | | 2.91 | | | | 3-25-2036 | | | | 11,682,136 | | | | 12,327,387 | | | | 0.94 | |
FHLMC Series T-67 Class 2A1C ± | | | 2.88 | | | | 3-25-2036 | | | | 7,259,215 | | | | 7,562,207 | | | | 0.58 | |
FNMA | | | 0.44-11.00 | | | | 2-1-2016 to 12-1-2046 | | | | 476,396,223 | | | | 506,651,067 | | | | 38.68 | |
FNMA ± | | | 2.04 | | | | 10-1-2035 | | | | 8,199,443 | | | | 8,605,789 | | | | 0.66 | |
FNMA ± | | | 2.07 | | | | 12-1-2035 | | | | 6,196,903 | | | | 6,486,289 | | | | 0.50 | |
FNMA ± | | | 2.26 | | | | 5-1-2033 | | | | 5,435,597 | | | | 5,801,498 | | | | 0.44 | |
FNMA ± | | | 2.26 | | | | 2-1-2036 | | | | 5,635,587 | | | | 6,002,542 | | | | 0.46 | |
FNMA ± | | | 2.29 | | | | 9-1-2032 | | | | 6,940,067 | | | | 7,377,965 | | | | 0.56 | |
FNMA ± | | | 2.35 | | | | 5-1-2038 | | | | 5,120,569 | | | | 5,451,035 | | | | 0.42 | |
FNMA ± | | | 2.35 | | | | 7-1-2038 | | | | 6,606,841 | | | | 7,050,988 | | | | 0.54 | |
FNMA ± | | | 2.37 | | | | 9-1-2035 | | | | 7,635,779 | | | | 8,127,562 | | | | 0.62 | |
FNMA ± | | | 2.38 | | | | 1-1-2038 | | | | 7,005,939 | | | | 7,499,881 | | | | 0.57 | |
FNMA ± | | | 2.40 | | | | 8-1-2039 | | | | 5,163,696 | | | | 5,499,079 | | | | 0.42 | |
FNMA ± | | | 2.40 | | | | 9-1-2039 | | | | 7,463,271 | | | | 7,955,220 | | | | 0.61 | |
FNMA ± | | | 2.40 | | | | 12-1-2044 | | | | 6,021,083 | | | | 6,400,645 | | | | 0.49 | |
FNMA ± | | | 2.40 | | | | 7-1-2039 | | | | 5,157,361 | | | | 5,491,980 | | | | 0.42 | |
FNMA ± | | | 2.40 | | | | 8-1-2037 | | | | 5,138,720 | | | | 5,488,507 | | | | 0.42 | |
FNMA ± | | | 2.40 | | | | 1-1-2037 | | | | 8,598,833 | | | | 9,160,417 | | | | 0.70 | |
FNMA ± | | | 2.40 | | | | 12-1-2040 | | | | 5,574,437 | | | | 5,930,876 | | | | 0.45 | |
FNMA ± | | | 2.41 | | | | 9-1-2034 | | | | 5,140,779 | | | | 5,473,147 | | | | 0.42 | |
FNMA ± | | | 2.41 | | | | 2-1-2036 | | | | 11,516,300 | | | | 12,322,460 | | | | 0.94 | |
FNMA ± | | | 2.41 | | | | 7-1-2036 | | | | 5,141,918 | | | | 5,472,014 | | | | 0.42 | |
FNMA ± | | | 2.42 | | | | 12-1-2040 | | | | 9,041,046 | | | | 9,609,314 | | | | 0.73 | |
FNMA ± | | | 2.42 | | | | 1-1-2035 | | | | 6,088,020 | | | | 6,462,571 | | | | 0.49 | |
FNMA ± | | | 2.43 | | | | 12-1-2035 | | | | 5,438,788 | | | | 5,792,671 | | | | 0.44 | |
FNMA ± | | | 2.46 | | | | 12-1-2040 | | | | 5,875,677 | | | | 6,222,103 | | | | 0.48 | |
FNMA ± | | | 2.48 | | | | 2-1-2038 | | | | 6,399,072 | | | | 6,820,687 | | | | 0.52 | |
FNMA ± | | | 2.50 | | | | 3-1-2037 | | | | 5,355,053 | | | | 5,743,458 | | | | 0.44 | |
FNMA ± | | | 2.86 | | | | 11-1-2035 | | | | 11,809,341 | | | | 12,709,958 | | | | 0.97 | |
FNMA Series 2001-T12 Class A4 ± | | | 3.47 | | | | 8-25-2041 | | | | 7,175,168 | | | | 7,426,787 | | | | 0.57 | |
FNMA Series 2002-66 Class A3 ± | | | 3.19 | | | | 4-25-2042 | | | | 10,703,098 | | | | 11,342,287 | | | | 0.87 | |
The accompanying notes are an integral part of these financial statements.
| | | | |
| 10 | | Wells Fargo Advantage Adjustable Rate Government Fund | | Summary portfolio of investments—August 31, 2015 |
| | | | | | | | | | | | | | | | | | | | |
| Security name | | Interest rate | | | Maturity date | | | Principal | | | Value | | | Percent of
net assets | |
| | | | | |
Agency Securities (continued) | | | | | | | | | | | | | | | | | | | | |
FNMA Series 2003-W18 Class 2A ± | | | 3.46 | % | | | 6-25-2043 | | | $ | 13,876,110 | | | $ | 14,905,107 | | | | 1.14 | % |
FNMA Series 2004-W12 Class 2A ± | | | 3.43 | | | | 6-25-2044 | | | | 7,168,626 | | | | 7,593,633 | | | | 0.58 | |
FNMA Series 2004-W15 Class 3A ± | | | 2.69 | | | | 6-25-2044 | | | | 9,233,840 | | | | 10,001,310 | | | | 0.76 | |
FNMA Series 2006-W1 Class 3A ± | | | 2.18 | | | | 10-25-2045 | | | | 9,783,242 | | | | 10,418,429 | | | | 0.80 | |
GNMA ± | | | 2.07 | | | | 8-20-2062 | | | | 7,473,014 | | | | 7,878,844 | | | | 0.60 | |
GNMA | | | 0.68-9.00 | | | | 5-15-2016 to 9-20-2062 | | | | 8,396,596 | | | | 8,703,387 | | | | 0.66 | |
Other securities | | | | | | | | | | | | | | | 1,408,857 | | | | 0.11 | |
| | | | | |
Total Agency Securities
(Cost $1,208,326,955) | | | | | | | | | | | | | | | 1,229,610,808 | | | | 93.87 | |
| | | | | | | | | | | | | | | | | | | | |
| | | | | |
Non-Agency Mortgage-Backed
Securities: 0.47% | | | | | | | | | | | | | | | | | | | | |
NCUA Guaranteed Notes Program
Series 2010-C1 Class A2 | | | 2.90 | | | | 10-29-2020 | | | | 6,121,289 | | | | 6,163,354 | | | | 0.47 | |
| | | | | | | | | | | | | | | | | | | | |
| | | | | |
Total Non-Agency Mortgage-Backed Securities (Cost $6,164,966) | | | | | | | | | | | | | | | 6,163,354 | | | | 0.47 | |
| | | | | | | | | | | | | | | | | | | | |
| | | | | |
| | | Yield | | | | | | Shares | | | | | | | |
| Short-Term Investments: 5.18% | | | | | | | | | | | | | | | | | | | | |
| | | | | |
| Investment Companies: 5.11% | | | | | | | | | | | | | | | | | | | | |
Wells Fargo Advantage Government Money Market Fund, Institutional Class (l)(u) | | | 0.01 | | | | | | | | 66,990,777 | | | | 66,990,777 | | | | 5.11 | |
| | | | | | | | | | | | | | | | | | | | |
| | | | | |
| | | | | | | | | Principal | | | | | | | |
| | | | | |
| U.S. Treasury Securities: 0.07% | | | | | | | | | | | | | | | | | | | | |
U.S. Treasury Bill #(z) | | | 0.01 | | | | 9-17-2015 | | | $ | 900,000 | | | | 899,999 | | | | 0.07 | |
| | | | | | | | | | | | | | | | | | | | |
| | | | | |
Total Short-Term Investments
(Cost $67,890,774) | | | | | | | | | | | | | | | 67,890,776 | | | | 5.18 | |
| | | | | | | | | | | | | | | | | | | | |
| | | | |
| Total investments in securities (Cost $1,282,382,695) * | | | | | | | | | | | | 1,303,664,938 | | | | 99.52 | % |
Other assets and liabilities, net | | | | | | | | | | | | | | | 6,269,362 | | | | 0.48 | |
| | | | | | | | | | | | | | | | | | | | |
| Total net assets | | | | | | | | | | | | | | $ | 1,309,934,300 | | | | 100.00 | % |
| | | | | | | | | | | | | | | | | | | | |
| ± | Variable rate investment. The rate shown is the rate in effect at period end. |
| (l) | The security represents an affiliate of the Fund as defined in the Investment Company Act of 1940. |
| (u) | The rate represents the 7-day annualized yield at period end. |
| # | All or a portion of this security is segregated as collateral for investments in derivative instruments. |
| (z) | Zero coupon security. The rate represents the current yield to maturity. |
| * | Cost for federal income tax purposes is $1,283,147,636 and unrealized gains (losses) consists of: |
| | | | |
Gross unrealized gains | | $ | 22,123,207 | |
Gross unrealized losses | | | (1,605,905 | ) |
| | | | |
Net unrealized gains | | $ | 20,517,302 | |
The accompanying notes are an integral part of these financial statements.
| | | | | | |
| Statement of assets and liabilities—August 31, 2015 | | Wells Fargo Advantage Adjustable Rate Government Fund | | | 11 | |
| | | | |
| | | | |
| |
Assets | | | | |
Investments | | | | |
In unaffiliated securities, at value (cost $1,215,391,918) | | $ | 1,236,674,161 | |
In affiliated securities, at value (cost $66,990,777) | | | 66,990,777 | |
| | | | |
Total investments, at value (cost $1,282,382,695) | | | 1,303,664,938 | |
Cash | | | 5,417,472 | |
Principal paydown receivable | | | 5,942,991 | |
Receivable for Fund shares sold | | | 164,130 | |
Receivable for interest | | | 3,159,567 | |
Prepaid expenses and other assets | | | 25,420 | |
| | | | |
Total assets | | | 1,318,374,518 | |
| | | | |
| |
Liabilities | | | | |
Dividends payable | | | 198,760 | |
Payable for investments purchased | | | 6,720,706 | |
Payable for Fund shares redeemed | | | 644,055 | |
Management fee payable | | | 357,897 | |
Distribution fees payable | | | 78,135 | |
Administration fees payable | | | 112,184 | |
Accrued expenses and other liabilities | | | 328,481 | |
| | | | |
Total liabilities | | | 8,440,218 | |
| | | | |
Total net assets | | $ | 1,309,934,300 | |
| | | | |
| |
NET ASSETS CONSIST OF | | | | |
Paid-in capital | | $ | 1,327,239,172 | |
Overdistributed net investment income | | | (305,548 | ) |
Accumulated net realized losses on investments | | | (38,281,567 | ) |
Net unrealized gains on investments | | | 21,282,243 | |
| | | | |
Total net assets | | $ | 1,309,934,300 | |
| | | | |
| |
COMPUTATION OF NET ASSET VALUE AND OFFERING PRICE PER SHARE | | | | |
Net assets – Class A | | $ | 215,829,758 | |
Shares outstanding – Class A1 | | | 23,727,708 | |
Net asset value per share – Class A | | | $9.10 | |
Maximum offering price per share – Class A2 | | | $9.29 | |
Net assets – Class B | | $ | 414,933 | |
Shares outstanding – Class B1 | | | 45,610 | |
Net asset value per share – Class B | | | $9.10 | |
Net assets – Class C | | $ | 121,116,921 | |
Shares outstanding – Class C1 | | | 13,314,996 | |
Net asset value per share – Class C | | | $9.10 | |
Net assets – Administrator Class | | $ | 66,036,633 | |
Shares outstanding – Administrator Class1 | | | 7,260,120 | |
Net asset value per share – Administrator Class | | | $9.10 | |
Net assets – Institutional Class | | $ | 906,536,055 | |
Shares outstanding – Institutional Class1 | | | 99,643,898 | |
Net asset value per share – Institutional Class | | | $9.10 | |
| 1 | The Fund has an unlimited number of authorized shares. |
| 2 | Maximum offering price is computed as 100/98 of net asset value. On investments of $50,000 or more, the offering price is reduced. |
The accompanying notes are an integral part of these financial statements.
| | | | |
| 12 | | Wells Fargo Advantage Adjustable Rate Government Fund | | Statement of operations—year ended August 31, 2015 |
| | | | |
| | | | |
| |
Investment income | | | | |
Interest | | $ | 17,549,041 | |
Income from affiliated securities | | | 4,970 | |
| | | | |
Total investment income | | | 17,554,011 | |
| | | | |
| |
Expenses | | | | |
Management fee | | | 4,553,071 | |
Administration fees | | | | |
Class A | | | 370,749 | |
Class B | | | 1,194 | |
Class C | | | 214,266 | |
Administrator Class | | | 88,251 | |
Institutional Class | | | 695,681 | |
Shareholder servicing fees | | | | |
Class A | | | 579,296 | |
Class B | | | 1,663 | |
Class C | | | 334,791 | |
Administrator Class | | | 219,666 | |
Distribution fees | | | | |
Class B | | | 5,596 | |
Class C | | | 1,004,371 | |
Custody and accounting fees | | | 102,380 | |
Professional fees | | | 66,077 | |
Registration fees | | | 98,018 | |
Shareholder report expenses | | | 81,347 | |
Trustees’ fees and expenses | | | 11,590 | |
Other fees and expenses | | | 61,964 | |
| | | | |
Total expenses | | | 8,489,971 | |
Less: Fee waivers and/or expense reimbursements | | | (276,904 | ) |
| | | | |
Net expenses | | | 8,213,067 | |
| | | | |
Net investment income | | | 9,340,944 | |
| | | | |
| |
REALIZED AND UNREALIZED GAINS (LOSSES) ON INVESTMENTS | | | | |
| |
Net realized gains (losses) on: | | | | |
Unaffiliated securities | | | 1,164,928 | |
Futures transactions | | | (2,026,616 | ) |
| | | | |
Net realized losses on investments | | | (861,688 | ) |
| | | | |
| |
Net change in unrealized gains (losses) on: | | | | |
Unaffiliated securities | | | (4,742,139 | ) |
Futures transactions | | | 282,276 | |
| | | | |
Net change in unrealized gains (losses) on investments | | | (4,459,863 | ) |
| | | | |
Net realized and unrealized gains (losses) on investments | | | (5,321,551 | ) |
| | | | |
Net increase in net assets resulting from operations | | $ | 4,019,393 | |
| | | | |
The accompanying notes are an integral part of these financial statements.
| | | | | | |
| Statement of changes in net assets | | Wells Fargo Advantage Adjustable Rate Government Fund | | | 13 | |
| | | | | | | | | | | | | | | | |
| | | Year ended August 31, 2015 | | | Year ended August 31, 2014 | |
| | | | |
Operations | | | | | | | | | | | | | | | | |
Net investment income | | | | | | $ | 9,340,944 | | | | | | | $ | 10,805,581 | |
Net realized gains (losses) on investments | | | | | | | (861,688 | ) | | | | | | | 593,005 | |
Net change in unrealized gains (losses) on investments | | | | | | | (4,459,863 | ) | | | | | | | 3,546,510 | |
| | | | |
Net increase in net assets resulting from operations | | | | | | | 4,019,393 | | | | | | | | 14,945,096 | |
| | | | |
| | | | |
Distributions to shareholders from | | | | | | | | | | | | | | | | |
Net investment income | | | | | | | | | | | | | | | | |
Class A | | | | | | | (1,404,414 | ) | | | | | | | (1,733,771 | ) |
Class B | | | | | | | (319 | ) | | | | | | | (575 | ) |
Class C | | | | | | | (36,268 | ) | | | | | | | (56,786 | ) |
Administrator Class | | | | | | | (629,900 | ) | | | | | | | (875,098 | ) |
Institutional Class | | | | | | | (7,185,378 | ) | | | | | | | (8,075,183 | ) |
Tax basis return of capital | | | | | | | | | | | | | | | | |
Class A | | | | | | | (415,038 | ) | | | | | | | (366,434 | ) |
Class B | | | | | | | (94 | ) | | | | | | | (121 | ) |
Class C | | | | | | | (10,718 | ) | | | | | | | (12,002 | ) |
Administrator Class | | | | | | | (186,151 | ) | | | | | | | (184,953 | ) |
Institutional Class | | | | | | | (2,123,451 | ) | | | | | | | (1,706,699 | ) |
| | | | |
Total distributions to shareholders | | | | | | | (11,991,731 | ) | | | | | | | (13,011,622 | ) |
| | | | |
| | | | |
Capital share transactions | | | Shares | | | | | | | | Shares | | | | | |
Proceeds from shares sold | | | | | | | | | | | | | | | | |
Class A | | | 4,112,767 | | | | 37,551,166 | | | | 7,244,221 | | | | 66,263,594 | |
Class B | | | 4,653 | | | | 42,472 | | | | 3,858 | | | | 35,285 | |
Class C | | | 248,392 | | | | 2,269,918 | | | | 452,217 | | | | 4,137,215 | |
Administrator Class | | | 3,453,369 | | | | 31,554,369 | | | | 6,986,964 | | | | 63,914,051 | |
Institutional Class | | | 67,145,587 | | | | 613,368,221 | | | | 62,792,794 | | | | 574,754,504 | |
| | | | |
| | | | | | | 684,786,146 | | | | | | | | 709,104,649 | |
| | | | |
Reinvestment of distributions | | | | | | | | | | | | | | | | |
Class A | | | 170,092 | | | | 1,552,037 | | | | 193,274 | | | | 1,767,656 | |
Class B | | | 39 | | | | 359 | | | | 70 | | | | 646 | |
Class C | | | 3,834 | | | | 34,986 | | | | 5,609 | | | | 51,307 | |
Administrator Class | | | 79,070 | | | | 721,555 | | | | 77,012 | | | | 704,495 | |
Institutional Class | | | 751,073 | | | | 6,854,023 | | | | 729,403 | | | | 6,672,314 | |
| | | | |
| | | | | | | 9,162,960 | | | | | | | | 9,196,418 | |
| | | | |
Payment for shares redeemed | | | | | | | | | | | | | | | | |
Class A | | | (8,062,085 | ) | | | (73,611,767 | ) | | | (10,685,135 | ) | | | (97,752,051 | ) |
Class B | | | (89,311 | ) | | | (816,162 | ) | | | (189,405 | ) | | | (1,734,110 | ) |
Class C | | | (3,168,935 | ) | | | (28,936,430 | ) | | | (5,030,472 | ) | | | (46,016,981 | ) |
Administrator Class | | | (9,860,896 | ) | | | (90,104,047 | ) | | | (4,667,752 | ) | | | (42,695,260 | ) |
Institutional Class | | | (60,499,655 | ) | | | (552,540,872 | ) | | | (70,479,287 | ) | | | (645,076,343 | ) |
| | | | |
| | | | | | | (746,009,278 | ) | | | | | | | (833,274,745 | ) |
| | | | |
Net decrease in net assets resulting from capital share transactions | | | | | | | (52,060,172 | ) | | | | | | | (114,973,678 | ) |
| | | | |
Total decrease in net assets | | | | | | | (60,032,510 | ) | | | | | | | (113,040,204 | ) |
| | | | |
| | | | |
Net assets | | | | | | | | | | | | | | | | |
Beginning of period | | | | | | | 1,369,966,810 | | | | | | | | 1,483,007,014 | |
| | | | |
End of period | | | | | | $ | 1,309,934,300 | | | | | | | $ | 1,369,966,810 | |
| | | | |
Overdistributed net investment income | | | | | | $ | (305,548 | ) | | | | | | $ | (390,213 | ) |
| | | | |
The accompanying notes are an integral part of these financial statements.
| | | | |
| 14 | | Wells Fargo Advantage Adjustable Rate Government Fund | | Financial highlights |
(For a share outstanding throughout each period)
| | | | | | | | | | | | | | | | | | | | |
| | | Year ended August 31 | |
| CLASS A | | 2015 | | | 2014 | | | 2013 | | | 2012 | | | 2011 | |
Net asset value, beginning of period | | | $9.15 | | | | $9.14 | | | | $9.19 | | | | $9.12 | | | | $9.12 | |
Net investment income | | | 0.05 | | | | 0.06 | | | | 0.06 | | | | 0.09 | | | | 0.14 | |
Net realized and unrealized gains (losses) on investments | | | (0.03 | ) | | | 0.02 | | | | (0.04 | ) | | | 0.08 | | | | 0.04 | |
| | | | | | | | | | | | | | | | | | | | |
Total from investment operations | | | 0.02 | | | | 0.08 | | | | 0.02 | | | | 0.17 | | | | 0.18 | |
Distributions to shareholders from | | | | | | | | | | | | | | | | | | | | |
Net investment income | | | (0.05 | ) | | | (0.06 | ) | | | (0.07 | ) | | | (0.09 | ) | | | (0.13 | )1 |
Tax basis return of capital | | | (0.02 | ) | | | (0.01 | ) | | | (0.00 | )2 | | | (0.01 | ) | | | (0.05 | )1 |
| | | | | | | | | | | | | | | | | | | | |
Total distributions to shareholders | | | (0.07 | ) | | | (0.07 | ) | | | (0.07 | ) | | | (0.10 | ) | | | (0.18 | ) |
Net asset value, end of period | | | $9.10 | | | | $9.15 | | | | $9.14 | | | | $9.19 | | | | $9.12 | |
Total return3 | | | 0.24 | % | | | 0.90 | % | | | 0.23 | % | | | 1.84 | % | | | 2.04 | % |
Ratios to average net assets (annualized) | | | | | | | | | | | | | | | | | | | | |
Gross expenses | | | 0.79 | % | | | 0.80 | % | | | 0.84 | % | | | 0.86 | % | | | 0.88 | % |
Net expenses | | | 0.74 | % | | | 0.74 | % | | | 0.74 | % | | | 0.74 | % | | | 0.74 | % |
Net investment income | | | 0.58 | % | | | 0.64 | % | | | 0.71 | % | | | 1.01 | % | | | 1.50 | % |
Supplemental data | | | | | | | | | | | | | | | | | | | | |
Portfolio turnover rate | | | 10 | % | | | 18 | % | | | 10 | % | | | 9 | % | | | 18 | % |
Net assets, end of period (000s omitted) | | | $215,830 | | | | $251,686 | | | | $281,028 | | | | $309,827 | | | | $328,427 | |
| 1 | Calculated based upon average shares outstanding |
| 2 | Amount is less than $0.005. |
| 3 | Total return calculations do not include any sales charges. |
The accompanying notes are an integral part of these financial statements.
| | | | | | |
| Financial highlights | | Wells Fargo Advantage Adjustable Rate Government Fund | | | 15 | |
(For a share outstanding throughout each period)
| | | | | | | | | | | | | | | | | | | | |
| | | Year ended August 31 | |
| CLASS B | | 2015 | | | 2014 | | | 2013 | | | 2012 | | | 2011 | |
Net asset value, beginning of period | | | $9.15 | | | | $9.14 | | | | $9.19 | | | | $9.12 | | | | $9.12 | |
Net investment income (loss) | | | (0.01 | )1 | | | (0.01 | )1 | | | (0.00 | )1,2 | | | 0.03 | 1 | | | 0.07 | 1 |
Net realized and unrealized gains (losses) on investments | | | (0.03 | ) | | | 0.02 | | | | (0.05 | ) | | | 0.07 | | | | 0.05 | |
| | | | | | | | | | | | | | | | | | | | |
Total from investment operations | | | (0.04 | ) | | | 0.01 | | | | (0.05 | ) | | | 0.10 | | | | 0.12 | |
Distributions to shareholders from | | | | | | | | | | | | | | | | | | | | |
Net investment income | | | (0.01 | ) | | | (0.00 | )2 | | | (0.00 | )2 | | | (0.03 | ) | | | (0.07 | )1 |
Tax basis return of capital | | | (0.00 | )2 | | | (0.00 | )2 | | | (0.00 | )2 | | | (0.00 | )2 | | | (0.05 | )1 |
| | | | | | | | | | | | | | | | | | | | |
Total distributions to shareholders | | | (0.01 | ) | | | (0.00 | )2 | | | (0.00 | )2 | | | (0.03 | ) | | | (0.12 | ) |
Net asset value, end of period | | | $9.10 | | | | $9.15 | | | | $9.14 | | | | $9.19 | | | | $9.12 | |
Total return3 | | | (0.49 | )% | | | 0.15 | % | | | (0.52 | )% | | | 1.08 | % | | | 1.28 | % |
Ratios to average net assets (annualized) | | | | | | | | | | | | | | | | | | | | |
Gross expenses | | | 1.51 | % | | | 1.55 | % | | | 1.60 | % | | | 1.61 | % | | | 1.63 | % |
Net expenses | | | 1.47 | % | | | 1.49 | % | | | 1.49 | % | | | 1.49 | % | | | 1.49 | % |
Net investment income (loss) | | | (0.14 | )% | | | (0.11 | )% | | | (0.03 | )% | | | 0.27 | % | | | 0.81 | % |
Supplemental data | | | | | | | | | | | | | | | | | | | | |
Portfolio turnover rate | | | 10 | % | | | 18 | % | | | 10 | % | | | 9 | % | | | 18 | % |
Net assets, end of period (000s omitted) | | | $415 | | | | $1,192 | | | | $2,886 | | | | $6,660 | | | | $14,911 | |
| 1 | Calculated based upon average shares outstanding |
| 2 | Amount is less than $0.005. |
| 3 | Total return calculations do not include any sales charges. |
The accompanying notes are an integral part of these financial statements.
| | | | |
| 16 | | Wells Fargo Advantage Adjustable Rate Government Fund | | Financial highlights |
(For a share outstanding throughout each period)
| | | | | | | | | | | | | | | | | | | | |
| | | Year ended August 31 | |
| CLASS C | | 2015 | | | 2014 | | | 2013 | | | 2012 | | | 2011 | |
Net asset value, beginning of period | | | $9.15 | | | | $9.14 | | | | $9.19 | | | | $9.12 | | | | $9.12 | |
Net investment income (loss) | | | (0.01 | )1 | | | (0.01 | )1 | | | (0.00 | )1,2 | | | 0.02 | 1 | | | 0.06 | |
Net realized and unrealized gains (losses) on investments | | | (0.04 | ) | | | 0.02 | | | | (0.05 | ) | | | 0.08 | | | | 0.06 | |
| | | | | | | | | | | | | | | | | | | | |
Total from investment operations | | | (0.05 | ) | | | 0.01 | | | | (0.05 | ) | | | 0.10 | | | | 0.12 | |
Distributions to shareholders from | | | | | | | | | | | | | | | | | | | | |
Net investment income | | | (0.00 | )2 | | | (0.00 | )2 | | | (0.00 | )2 | | | (0.03 | ) | | | (0.07 | )1 |
Tax basis return of capital | | | (0.00 | )2 | | | (0.00 | )2 | | | (0.00 | )2 | | | (0.00 | )2 | | | (0.05 | )1 |
| | | | | | | | | | | | | | | | | | | | |
Total distributions to shareholders | | | (0.00 | )2 | | | (0.00 | )2 | | | (0.00 | )2 | | | (0.03 | ) | | | (0.12 | ) |
Net asset value, end of period | | | $9.10 | | | | $9.15 | | | | $9.14 | | | | $9.19 | | | | $9.12 | |
Total return3 | | | (0.51 | )% | | | 0.15 | % | | | (0.52 | )% | | | 1.08 | % | | | 1.28 | % |
Ratios to average net assets (annualized) | | | | | | | | | | | | | | | | | | | | |
Gross expenses | | | 1.54 | % | | | 1.55 | % | | | 1.59 | % | | | 1.61 | % | | | 1.63 | % |
Net expenses | | | 1.49 | % | | | 1.49 | % | | | 1.49 | % | | | 1.49 | % | | | 1.49 | % |
Net investment income (loss) | | | (0.16 | )% | | | (0.11 | )% | | | (0.04 | )% | | | 0.26 | % | | | 0.74 | % |
Supplemental data | | | | | | | | | | | | | | | | | | | | |
Portfolio turnover rate | | | 10 | % | | | 18 | % | | | 10 | % | | | 9 | % | | | 18 | % |
Net assets, end of period (000s omitted) | | | $121,117 | | | | $148,523 | | | | $190,110 | | | | $248,392 | | | | $296,645 | |
| 1 | Calculated based upon average shares outstanding |
| 2 | Amount is less than $0.005. |
| 3 | Total return calculations do not include any sales charges. |
The accompanying notes are an integral part of these financial statements.
| | | | | | |
| Financial highlights | | Wells Fargo Advantage Adjustable Rate Government Fund | | | 17 | |
(For a share outstanding throughout each period)
| | | | | | | | | | | | | | | | | | | | |
| | | Year ended August 31 | |
| ADMINISTRATOR CLASS | | 2015 | | | 2014 | | | 2013 | | | 2012 | | | 2011 | |
Net asset value, beginning of period | | | $9.15 | | | | $9.14 | | | | $9.19 | | | | $9.12 | | | | $9.12 | |
Net investment income | | | 0.06 | | | | 0.07 | | | | 0.08 | | | | 0.11 | | | | 0.14 | 1 |
Net realized and unrealized gains (losses) on investments | | | (0.03 | ) | | | 0.03 | | | | (0.05 | ) | | | 0.07 | | | | 0.06 | |
| | | | | | | | | | | | | | | | | | | | |
Total from investment operations | | | 0.03 | | | | 0.10 | | | | 0.03 | | | | 0.18 | | | | 0.20 | |
Distributions to shareholders from | | | | | | | | | | | | | | | | | | | | |
Net investment income | | | (0.06 | ) | | | (0.07 | ) | | | (0.08 | ) | | | (0.10 | ) | | | (0.15 | )1 |
Tax basis return of capital | | | (0.02 | ) | | | (0.02 | ) | | | (0.00 | )2 | | | (0.01 | ) | | | (0.05 | )1 |
| | | | | | | | | | | | | | | | | | | | |
Total distributions to shareholders | | | (0.08 | ) | | | (0.09 | ) | | | (0.08 | ) | | | (0.11 | ) | | | (0.20 | ) |
Net asset value, end of period | | | $9.10 | | | | $9.15 | | | | $9.14 | | | | $9.19 | | | | $9.12 | |
Total return | | | 0.38 | % | | | 1.05 | % | | | 0.37 | % | | | 1.98 | % | | | 2.18 | % |
Ratios to average net assets (annualized) | | | | | | | | | | | | | | | | | | | | |
Gross expenses | | | 0.72 | % | | | 0.73 | % | | | 0.77 | % | | | 0.79 | % | | | 0.78 | % |
Net expenses | | | 0.60 | % | | | 0.60 | % | | | 0.60 | % | | | 0.60 | % | | | 0.60 | % |
Net investment income | | | 0.72 | % | | | 0.78 | % | | | 0.85 | % | | | 1.14 | % | | | 1.49 | % |
Supplemental data | | | | | | | | | | | | | | | | | | | | |
Portfolio turnover rate | | | 10 | % | | | 18 | % | | | 10 | % | | | 9 | % | | | 18 | % |
Net assets, end of period (000s omitted) | | | $66,037 | | | | $124,345 | | | | $102,284 | | | | $112,319 | | | | $34,946 | |
| 1 | Calculated based upon average shares outstanding |
| 2 | Amount is less than $0.005. |
The accompanying notes are an integral part of these financial statements.
| | | | |
| 18 | | Wells Fargo Advantage Adjustable Rate Government Fund | | Financial highlights |
(For a share outstanding throughout each period)
| | | | | | | | | | | | | | | | | | | | |
| | | Year ended August 31 | |
| INSTITUTIONAL CLASS | | 2015 | | | 2014 | | | 2013 | | | 2012 | | | 2011 | |
Net asset value, beginning of period | | | $9.15 | | | | $9.14 | | | | $9.19 | | | | $9.12 | | | | $9.12 | |
Net investment income | | | 0.08 | | | | 0.08 | | | | 0.09 | 1 | | | 0.12 | 1 | | | 0.15 | |
Net realized and unrealized gains (losses) on investments | | | (0.03 | ) | | | 0.03 | | | | (0.04 | ) | | | 0.07 | | | | 0.06 | |
| | | | | | | | | | | | | | | | | | | | |
Total from investment operations | | | 0.05 | | | | 0.11 | | | | 0.05 | | | | 0.19 | | | | 0.21 | |
Distributions to shareholders from | | | | | | | | | | | | | | | | | | | | |
Net investment income | | | (0.08 | ) | | | (0.08 | ) | | | (0.10 | ) | | | (0.11 | ) | | | (0.16 | )1 |
Tax basis return of capital | | | (0.02 | ) | | | (0.02 | ) | | | (0.00 | )2 | | | (0.01 | ) | | | (0.05 | )1 |
| | | | | | | | | | | | | | | | | | | | |
Total distributions to shareholders | | | (0.10 | ) | | | (0.10 | ) | | | (0.10 | ) | | | (0.12 | ) | | | (0.21 | ) |
Net asset value, end of period | | | $9.10 | | | | $9.15 | | | | $9.14 | | | | $9.19 | | | | $9.12 | |
Total return | | | 0.52 | % | | | 1.19 | % | | | 0.50 | % | | | 2.09 | % | | | 2.30 | % |
Ratios to average net assets (annualized) | | | | | | | | | | | | | | | | | | | | |
Gross expenses | | | 0.46 | % | | | 0.47 | % | | | 0.51 | % | | | 0.53 | % | | | 0.55 | % |
Net expenses | | | 0.46 | % | | | 0.46 | % | | | 0.47 | % | | | 0.49 | % | | | 0.49 | % |
Net investment income | | | 0.87 | % | | | 0.93 | % | | | 0.98 | % | | | 1.25 | % | | | 1.72 | % |
Supplemental data | | | | | | | | | | | | | | | | | | | | |
Portfolio turnover rate | | | 10 | % | | | 18 | % | | | 10 | % | | | 9 | % | | | 18 | % |
Net assets, end of period (000s omitted) | | | $906,536 | | | | $844,221 | | | | $906,698 | | | | $686,587 | | | | $597,521 | |
| 1 | Calculated based upon average shares outstanding |
| 2 | Amount is less than $0.005. |
The accompanying notes are an integral part of these financial statements.
| | | | | | |
| Notes to financial statements | | Wells Fargo Advantage Adjustable Rate Government Fund | | | 19 | |
1. ORGANIZATION
Wells Fargo Funds Trust (the “Trust”), a Delaware statutory trust organized on March 10, 1999, is an open-end management investment company registered under the Investment Company Act of 1940, as amended (the “1940 Act”). As an investment company, the Trust follows the accounting and reporting guidance in Financial Accounting Standards Board (“FASB”) Accounting Standards Codification Topic 946, Financial Services – Investment Companies. These financial statements report on the Wells Fargo Advantage Adjustable Rate Government Fund (the “Fund”) which is a diversified series of the Trust.
2. SIGNIFICANT ACCOUNTING POLICIES
The following significant accounting policies, which are consistently followed in the preparation of the financial statements of the Fund, are in conformity with U.S. generally accepted accounting principles which require management to make estimates and assumptions that affect the reported amounts of assets and liabilities, disclosure of contingent assets and liabilities at the date of the financial statements, and the reported amounts of revenues and expenses during the reporting period. Actual results could differ from those estimates.
Securities valuation
All investments are valued each business day as of the close of regular trading on the New York Stock Exchange (generally 4 p.m. Eastern Time).
Debt securities are valued at the evaluated bid price provided by an independent pricing service or, if a reliable price is not available, the quoted bid price from an independent broker-dealer.
Futures that are listed on a foreign or domestic exchange or market are valued at the official closing price or, if none, the last sales price.
Investments in registered open-end investment companies are valued at net asset value.
Investments which are not valued using any of the methods discussed above are valued at their fair value, as determined in good faith by the Board of Trustees of the Fund. The Board of Trustees has established a Valuation Committee comprised of the Trustees and has delegated to it the authority to take any actions regarding the valuation of portfolio securities that the Valuation Committee deems necessary or appropriate, including determining the fair value of portfolio securities, unless the determination has been delegated to the Management Valuation Team of Wells Fargo Funds Management, LLC (“Funds Management”). The Board of Trustees retains the authority to make or ratify any valuation decisions or approve any changes to the Valuation Procedures as it deems appropriate. On a quarterly basis, the Board of Trustees receives reports on any valuation actions taken by the Valuation Committee or the Management Valuation Team which may include items for ratification.
Valuations of fair valued securities are compared to the next actual sales price when available, or other appropriate market values, to assess the continued appropriateness of the fair valuation methodologies used. These securities are fair valued on a day-to-day basis, taking into consideration changes to appropriate market information and any significant changes to the inputs considered in the valuation process until there is a readily available price provided on an exchange or by an independent pricing service. Valuations received from an independent pricing service or independent broker-dealer quotes are periodically validated by comparisons to most recent trades and valuations provided by other independent pricing services in addition to the review of prices by the manager and/or subadviser. Unobservable inputs used in determining fair valuations are identified based on the type of security, taking into consideration factors utilized by market participants in valuing the investment, knowledge about the issuer and the current market environment.
Futures contracts
The Fund is subject to interest rate risk in the normal course of pursuing its investment objectives. The Fund may buy and sell futures contracts in order to gain exposure to, or protect against, changes in security values and interest rates. The primary risks associated with the use of futures contracts are the imperfect correlation between changes in market values of securities held by the Fund and the prices of futures contracts, and the possibility of an illiquid market.
The aggregate principal amounts of the contracts are not recorded in the financial statements. Fluctuations in the value of the contracts are recorded in the Statement of Assets and Liabilities as an asset or liability and in the Statement of Operations as unrealized gains or losses until the contracts are closed, at which point they are recorded as net realized gains or losses on futures contracts. With futures contracts, there is minimal counterparty risk to the Fund since futures are exchange traded and the exchange’s clearinghouse, as counterparty to all exchange traded futures, guarantees the futures against default.
| | | | |
| 20 | | Wells Fargo Advantage Adjustable Rate Government Fund | | Notes to financial statements |
Security transactions and income recognition
Securities transactions are recorded on a trade date basis. Realized gains or losses are recorded on the basis of identified cost.
Interest income is accrued daily and bond discounts are accreted and premiums are amortized daily based on the effective interest method. To the extent debt obligations are placed on non-accrual status, any related interest income may be reduced by writing off interest receivables when the collection of all or a portion of interest has become doubtful based on consistently applied procedures. If the issuer subsequently resumes interest payments or when the collectability of interest is reasonably assured, the debt obligation is removed from non-accrual status.
Distributions to shareholders
Distributions to shareholders from net investment income are accrued daily and paid monthly. Distributions from net realized gains, if any, are recorded on the ex-dividend date. Such distributions are determined in conformity with federal income tax regulations, which may differ in amount or character from net investment income and realized gains recognized for purposes of U.S. generally accepted accounting principles.
Federal and other taxes
The Fund intends to continue to qualify as a regulated investment company by distributing substantially all of its investment company taxable income and any net realized capital gains (after reduction for capital loss carryforwards) sufficient to relieve it from all, or substantially all, federal income taxes. Accordingly, no provision for federal income taxes was required.
The Fund’s income and federal excise tax returns and all financial records supporting those returns for the prior three fiscal years are subject to examination by the federal and Delaware revenue authorities. Management has analyzed the Fund’s tax positions taken on federal, state, and foreign tax returns for all open tax years and does not believe that there are any uncertain tax positions that require recognition of a tax liability.
Reclassifications are made to the Fund’s capital accounts for permanent tax differences to reflect income and gains available for distribution (or available capital loss carryforwards) under federal income tax regulations. U.S. generally accepted accounting principles require that certain components of net assets be adjusted to reflect permanent differences between financial and tax reporting. These reclassifications have no effect on net assets or net asset values per share. The primary permanent difference causing such reclassifications is due to expiration of capital loss carryforwards. At August 31, 2015, as a result of permanent book-to-tax differences, the following reclassification adjustments were made on the Statement of Assets and Liabilities:
| | |
| Paid-in capital | | Accumulated net realized losses on investments |
| $(18,541,278) | | $18,541,278 |
As of August 31, 2015, capital loss carryforwards available to offset future net realized capital gains were as follows through the indicated expiration dates:
| | | | | | | | | | |
| | | | | | | | | No expiration |
| 2016 | | 2017 | | 2018 | | 2019 | | Short-term | | Long-term |
| $10,766,785 | | $24,262,054 | | $1,705,150 | | $66,443 | | $169,319 | | $57,466 |
As of August 31, 2015, the Fund had current year deferred post-October capital losses consisting of $489,409 in short-term losses which will be recognized on the first day of the following fiscal year.
Class allocations
The separate classes of shares offered by the Fund differ principally in applicable sales charges, distribution, shareholder servicing, and administration fees. Class specific expenses are charged directly to that share class. Investment income, common expenses, and realized and unrealized gains (losses) on investments are allocated daily to each class of shares based on the relative proportion of net assets of each class.
3. FAIR VALUATION MEASUREMENTS
Fair value measurements of investments are determined within a framework that has established a fair value hierarchy based upon the various data inputs utilized in determining the value of the Fund’s investments. The three-level hierarchy gives the highest priority to unadjusted quoted prices in active markets for identical assets or liabilities (Level 1) and the
| | | | | | |
| Notes to financial statements | | Wells Fargo Advantage Adjustable Rate Government Fund | | | 21 | |
lowest priority to significant unobservable inputs (Level 3). The Fund’s investments are classified within the fair value hierarchy based on the lowest level of input that is significant to the fair value measurement. The inputs are summarized into three broad levels as follows:
| n | | Level 1 – quoted prices in active markets for identical securities |
| n | | Level 2 – other significant observable inputs (including quoted prices for similar securities, interest rates, prepayment speeds, credit risk, use of amortized cost, etc.) |
| n | | Level 3 – significant unobservable inputs (including the Fund’s own assumptions in determining the fair value of investments) |
The inputs or methodologies used for valuing investments in securities are not necessarily an indication of the risk associated with investing in those securities.
The following is a summary of the inputs used in valuing the Fund’s assets and liabilities as of August 31, 2015:
| | | | | | | | | | | | | | | | |
| | | Quoted prices
(Level 1) | | | Other significant
observable inputs
(Level 2) | | | Significant
unobservable inputs
(Level 3) | | | Total | |
Assets | | | | | | | | | | | | | | | | |
Investments in: | | | | | | | | | | | | | | | | |
| | | | |
Agency securities | | $ | 0 | | | $ | 1,229,610,808 | | | $ | 0 | | | $ | 1,229,610,808 | |
| | | | |
Non-agency mortgage-backed securities | | | 0 | | | | 6,163,354 | | | | 0 | | | | 6,163,354 | |
| | | | |
Short-term investments | | | | | | | | | | | | | | | | |
Investment companies | | | 66,990,777 | | | | 0 | | | | 0 | | | | 66,990,777 | |
U.S. Treasury securities | | | 899,999 | | | | 0 | | | | 0 | | | | 899,999 | |
| | | $ | 67,890,776 | | | $ | 1,235,774,162 | | | $ | 0 | | | $ | 1,303,664,938 | |
The Fund recognizes transfers between levels within the fair value hierarchy at the end of the reporting period. At August 31, 2015, the Fund did not have any transfers into/out of Level 1, Level 2, or Level 3.
4. TRANSACTIONS WITH AFFILIATES
Management fee
Funds Management, an indirect wholly owned subsidiary of Wells Fargo & Company (“Wells Fargo”), is the manager of the Fund and provides advisory and fund-level administrative services under an investment management agreement. Under the investment management agreement, Funds Management is responsible for, among other services, implementing the investment objectives and strategies of the Fund, supervising the applicable subadviser, providing fund-level administrative services in connection with the Fund’s operations, and providing any other fund-level administrative services reasonably necessary for the operation of the Fund. As compensation for its services under the investment management agreement, Funds Management is entitled to receive an annual management fee starting at 0.35% and declining to 0.255% as the average daily net assets of the Fund increase.
Prior to July 1, 2015, Funds Management provided advisory services pursuant to an investment advisory agreement and was entitled to receive an annual fee which started at 0.30% and declined to 0.225% as the average daily net assets of the Fund increased. In addition, fund-level administrative services were provided by Funds Management under a separate administration agreement at an annual fee which started at 0.05% and declined to 0.03% as the average daily net assets of the Fund increased. For financial statement purposes, the advisory fee and fund-level administration fee for the year ended August 31, 2015 have been included in management fee on the Statement of Operations.
For the year ended August 31, 2015, the management fee was equivalent to an annual rate of 0.34% of the Fund’s average daily net assets.
Funds Management has retained the services of a subadviser to provide daily portfolio management to the Fund. The fee for subadvisory services is borne by Funds Management. Wells Capital Management Incorporated, an affiliate of Funds Management and an indirect wholly owned subsidiary of Wells Fargo, is the subadviser to the Fund and is entitled to receive a fee from Funds Management at an annual rate starting at 0.20% and declining to 0.10% as the average daily net assets of the Fund increase.
| | | | |
| 22 | | Wells Fargo Advantage Adjustable Rate Government Fund | | Notes to financial statements |
Administration fees
Under a class-level administration agreement, Funds Management provides class-level administrative services to the Fund, which includes paying fees and expenses for services provided by the transfer agent, sub-transfer agents, omnibus account servicers and record-keepers. As compensation for its services under the class-level administration agreement, Funds Management receives an annual fee which is calculated based on the average daily net assets of each class as follows:
| | | | |
| | | Class-level administration fee | |
Class A, Class B, Class C | | | 0.16 | % |
Administrator Class | | | 0.10 | |
Institutional Class | | | 0.08 | |
Funds Management has contractually waived and/or reimbursed management and administration fees to the extent necessary to maintain certain net operating expense ratios for the Fund. Waiver of fees and/or reimbursement of expenses by Funds Management were made first from fund level expenses on a proportionate basis and then from class specific expenses. Funds Management has committed through December 31, 2015 to waive fees and/or reimburse expenses to the extent necessary to cap the Fund’s expenses at 0.74% for Class A shares, 1.49% for Class B shares, 1.49% for Class C shares, 0.60% for Administrator Class shares, and 0.46% for Institutional Class shares. After this time, the cap may be increased or the commitment to maintain the cap may be terminated only with the approval of the Board of Trustees.
Distribution fees
The Trust has adopted a distribution plan for Class B and Class C shares of the Fund pursuant to Rule 12b-1 under the 1940 Act. Distribution fees are charged to Class B and Class C shares and paid to Wells Fargo Funds Distributor, LLC (“Funds Distributor”), the principal underwriter, at an annual rate of 0.75% of the average daily net assets of Class B and Class C shares.
In addition, Funds Distributor is entitled to receive the front-end sales charge from the purchase of Class A shares and a contingent deferred sales charge on the redemption of certain Class A shares. Funds Distributor is also entitled to receive the contingent deferred sales charges from redemptions of Class B and Class C shares. For the year ended August 31, 2015, Funds Distributor received $1,616 from the sale of Class A shares and $792 and $1,086 in contingent deferred sales charges from redemptions of Class A and Class C shares, respectively.
Shareholder servicing fees
The Trust has entered into contracts with one or more shareholder servicing agents, whereby Class A, Class B, Class C, and Administrator Class of the Fund is charged a fee at an annual rate of 0.25% of the average daily net assets of each respective class.
A portion of these total shareholder servicing fees were paid to affiliates of Wells Fargo.
5. INVESTMENT PORTFOLIO TRANSACTIONS
Purchases and sales of investments, excluding U.S. government obligations (if any) and short-term securities, for the year ended August 31, 2015 were $266,222,788 and $129,419,228, respectively.
6. DERIVATIVE TRANSACTIONS
During the year ended August 31, 2015, the Fund entered into futures contracts to speculate on interest rates and to help manage the duration of the portfolio.
As of August 31, 2015, the Fund did not have any open futures contracts. The Fund had an average notional amount of $72,372,027 in short futures contracts during the year ended August 31, 2015.
The realized losses and change in unrealized gains (losses) on futures contracts are reflected in the Statement of Operations.
7. BANK BORROWINGS
The Trust (excluding the money market funds and certain other funds in the Trust) and Wells Fargo Variable Trust are parties to a $150,000,000 revolving credit agreement, whereby the Fund is permitted to use bank borrowings for
| | | | | | |
| Notes to financial statements | | Wells Fargo Advantage Adjustable Rate Government Fund | | | 23 | |
temporary or emergency purposes, such as to fund shareholder redemption requests. Interest under the credit agreement is charged to the Fund based on a borrowing rate equal to the higher of the Federal Funds rate in effect on that day plus 1.25% or the overnight LIBOR rate in effect on that day plus 1.25%. In addition, an annual commitment fee equal to 0.10% of the unused balance is allocated to each participating fund. For the year ended August 31, 2015, the Fund paid $488 in commitment fees.
For the year ended August 31, 2015, there were no borrowings by the Fund under the agreement.
8. DISTRIBUTIONS TO SHAREHOLDERS
The tax character of distributions paid during the years ended August 31, 2015 and August 31, 2014 were as follows:
| | | | | | | | |
| | | Year ended August 31 | |
| | | 2015 | | | 2014 | |
Ordinary income | | $ | 9,256,279 | | | $ | 10,741,413 | |
Tax basis return of capital | | | 2,735,452 | | | | 2,270,209 | |
As of August 31, 2015, the components of distributable earnings on a tax basis were as follows:
| | | | |
Unrealized gains | | Post-October capital losses deferred | | Capital loss carryforward |
| $20,517,302 | | $(489,409) | | $(37,027,217) |
9. INDEMNIFICATION
Under the Trust’s organizational documents, the officers and Trustees have been granted certain indemnification rights against certain liabilities that may arise out of performance of their duties to the Trust. Additionally, in the normal course of business, the Trust may enter into contracts with service providers that contain a variety of indemnification clauses. The Trust’s maximum exposure under these arrangements is dependent on future claims that may be made against the Fund and, therefore, cannot be estimated.
| | | | |
| 24 | | Wells Fargo Advantage Adjustable Rate Government Fund | | Report of independent registered public accounting firm |
BOARD OF TRUSTEES AND SHAREHOLDERS OF WELLS FARGO FUNDS TRUST:
We have audited the accompanying statement of assets and liabilities, including the portfolio of investments and the summary portfolio of investments, of the Wells Fargo Advantage Adjustable Rate Government Fund (the “Fund”), one of the funds constituting the Wells Fargo Funds Trust, as of August 31, 2015, and the related statement of operations for the year then ended, the statements of changes in net assets for each of the years in the two-year period then ended, and the financial highlights for each of the years in the five-year period then ended. These financial statements and financial highlights are the responsibility of the Fund’s management. Our responsibility is to express an opinion on these financial statements and financial highlights based on our audits.
We conducted our audits in accordance with the standards of the Public Company Accounting Oversight Board (United States). Those standards require that we plan and perform the audit to obtain reasonable assurance about whether the financial statements and financial highlights are free of material misstatement. An audit includes examining, on a test basis, evidence supporting the amounts and disclosures in the financial statements. Our procedures included confirmation of securities owned as of August 31, 2015, by correspondence with the custodian and brokers, or by other appropriate auditing procedures. An audit also includes assessing the accounting principles used and significant estimates made by management, as well as evaluating the overall financial statement presentation. We believe that our audits provide a reasonable basis for our opinion.
In our opinion, the financial statements and financial highlights referred to above present fairly, in all material respects, the financial position of the Wells Fargo Advantage Adjustable Rate Government Fund as of August 31, 2015, the results of its operations for the year then ended, the changes in its net assets for each of the years in the two-year period then ended, and the financial highlights for each of the years in the five-year period then ended, in conformity with U.S. generally accepted accounting principles.

Boston, Massachusetts
October 22, 2015
| | | | | | |
| Other information (unaudited) | | Wells Fargo Advantage Adjustable Rate Government Fund | | | 25 | |
TAX INFORMATION
For the fiscal year ended August 31, 2015, $9,315,901 has been designated as interest-related dividends for nonresident alien shareholders pursuant to Section 871 of the Internal Revenue Code.
PROXY VOTING INFORMATION
A description of the policies and procedures that the Fund uses to determine how to vote proxies relating to portfolio securities is available, upon request, by calling 1-800-222-8222, visiting our website at wellsfargoadvantagefunds.com, or visiting the SEC website at sec.gov. Information regarding how the Fund voted proxies relating to portfolio securities during the most recent 12-month period ended June 30 is available on the Fund’s website at wellsfargoadvantagefunds.com or by visiting the SEC website at sec.gov.
PORTFOLIO HOLDINGS INFORMATION
The complete portfolio holdings for the Fund are publicly available monthly on the Fund’s website (wellsfargoadvantagefunds.com), on a one-month delayed basis. In addition, top ten holdings information (excluding derivative positions) for the Fund is publicly available on the Fund’s website on a monthly, seven-day or more delayed basis. The Fund files its complete schedule of portfolio holdings with the SEC for the first and third quarters of each fiscal year on Form N-Q, which is available by visiting the SEC website at sec.gov. In addition, the Fund’s Form N-Q may be reviewed and copied at the SEC’s Public Reference Room in Washington, DC, and at regional offices in New York City, at 233 Broadway, and in Chicago, at 175 West Jackson Boulevard, Suite 900. Information about the Public Reference Room may be obtained by calling 1-800-SEC-0330.
| | | | |
| 26 | | Wells Fargo Advantage Adjustable Rate Government Fund | | Other information (unaudited) |
BOARD OF TRUSTEES AND OFFICERS
Each of the Trustees and Officers1 listed in the table below acts in identical capacities for each fund in the Wells Fargo Advantage family of funds, which consists of 133 mutual funds comprising the Wells Fargo Funds Trust, Wells Fargo Variable Trust, Wells Fargo Master Trust and four closed-end funds (collectively the “Fund Complex”). This table should be read in conjunction with the Prospectus and the Statement of Additional Information2. The mailing address of each Trustee and Officer is 525 Market Street, 12th Floor, San Francisco, CA 94105. Each Trustee and Officer serves an indefinite term, however, each Trustee serves such term until reaching the mandatory retirement age established by the Trustees.
Independent Trustees
| | | | | | |
Name and year of birth | | Position held and length of service* | | Principal occupations during past five years or longer | | Other public company or investment company
directorships during
past 5 years |
William R. Ebsworth (Born 1957) | | Trustee, since 2015** | | Retired. From 1984 to 2013, equities analyst, portfolio manager, research director at Fidelity Management and Research Company and retired in 2013 as Chief Investment Officer of Fidelity Strategic Advisers, Inc. in Boston, Tokyo, and Hong Kong where he led a team of investment professionals managing client assets. Prior thereto, Board member of Hong Kong Securities Clearing Co., Hong Kong Options Clearing Corp., the Thailand International Fund, Ltd., Fidelity Investments Life Insurance Company, and Empire Fidelity Investments Life Insurance Company. Mr. Ebsworth is a CFA® charterholder and an Adjunct Lecturer, Finance, at Babson College. | | Asset Allocation Trust |
| Jane A. Freeman (Born 1953) | | Trustee, since 2015** | | Retired. From 2012 to 2014 and 1999 to 2008, Chief Financial Officer of Scientific Learning Corporation. From 2008 to 2012, Ms. Freeman provided consulting services related to strategic business projects. Prior to 1999, Portfolio Manager at Rockefeller & Co. and Scudder, Stevens & Clark. Board member of the Harding Loevner Funds from 1996 to 2014, serving as both Lead Independent Director and chair of the Audit Committee. Board member of the Russell Exchange Traded Funds Trust from 2011 to 2012 and the chair of the Audit Committee. Ms. Freeman is Chair of Taproot Foundation (non-profit organization), a Board Member of Ruth Bancroft Garden (non-profit organization) and an inactive chartered financial analyst. | | Asset Allocation Trust; Harding Loevner Funds; Russell Exchange Traded Funds Trust |
| Peter G. Gordon (Born 1942) | | Trustee, since 1998; Chairman, since 2005 | | Co-Founder, Retired Chairman, President and CEO of Crystal Geyser Water Company. Trustee Emeritus, Colby College. | | Asset Allocation Trust |
| Isaiah Harris, Jr. (Born 1952) | | Trustee, since 2009 | | Retired. Chairman of the Board of CIGNA Corporation since 2009, and Director since 2005. From 2003 to 2011, Director of Deluxe Corporation. Prior thereto, President and CEO of BellSouth Advertising and Publishing Corp. from 2005 to 2007, President and CEO of BellSouth Enterprises from 2004 to 2005 and President of BellSouth Consumer Services from 2000 to 2003. Emeritus member of the Iowa State University Foundation Board of Governors. Emeritus Member of the Advisory Board of Iowa State University School of Business. Advisory Board Member, Palm Harbor Academy (charter school). Mr. Harris is a certified public accountant. | | CIGNA Corporation; Asset Allocation Trust |
| Judith M. Johnson (Born 1949) | | Trustee, since 2008; Audit Committee Chairman, since 2008 | | Retired. Prior thereto, Chief Executive Officer and Chief Investment Officer of Minneapolis Employees Retirement Fund from 1996 to 2008. Ms. Johnson is an attorney, certified public accountant and a certified managerial accountant. | | Asset Allocation Trust |
David F. Larcker (Born 1950) | | Trustee, since 2009 | | James Irvin Miller Professor of Accounting at the Graduate School of Business, Stanford University, Morgan Stanley Director of the Center for Leadership Development and Research and Senior Faculty of The Rock Center for Corporate Governance since 2006. From 2005 to 2008, Professor of Accounting at the Graduate School of Business, Stanford University. Prior thereto, Ernst & Young Professor of Accounting at The Wharton School, University of Pennsylvania from 1985 to 2005. | | Asset Allocation Trust |
Olivia S. Mitchell (Born 1953) | | Trustee, since 2006 | | International Foundation of Employee Benefit Plans Professor, Wharton School of the University of Pennsylvania since 1993. Director of Wharton’s Pension Research Council and Boettner Center on Pensions & Retirement Research, and Research Associate at the National Bureau of Economic Research. Previously, Cornell University Professor from 1978 to 1993. | | Asset Allocation Trust |
| | | | | | |
| Other information (unaudited) | | Wells Fargo Advantage Adjustable Rate Government Fund | | | 27 | |
| | | | | | |
Name and year of birth | | Position held and length of service* | | Principal occupations during past five years or longer | | Other public company or investment company directorships during past 5 years |
Timothy J. Penny (Born 1951) | | Trustee, since 1996 | | President and Chief Executive Officer of Southern Minnesota Initiative Foundation, a non-profit organization, since 2007 and Senior Fellow at the Humphrey Institute Policy Forum at the University of Minnesota since 1995. Member of the Board of Trustees of NorthStar Education Finance, Inc., a non-profit organization, since 2007. | | Asset Allocation Trust |
Michael S. Scofield (Born 1943) | | Trustee, since 2010 | | Served on the Investment Company Institute’s Board of Governors and Executive Committee from 2008-2011 as well the Governing Council of the Independent Directors Council from 2006-2011 and the Independent Directors Council Executive Committee from 2008-2011. Chairman of the IDC from 2008-2010. Institutional Investor (Fund Directions) Trustee of Year in 2007. Trustee of the Evergreen Funds complex (and its predecessors) from 1984 to 2010. Chairman of the Evergreen Funds from 2000-2010. Former Trustee of the Mentor Funds. Retired Attorney, Law Offices of Michael S. Scofield. | | Asset Allocation Trust |
Donald C. Willeke (Born 1940) | | Trustee, since 1996 | | Principal of the law firm of Willeke & Daniels. General Counsel of the Minneapolis Employees Retirement Fund from 1984 until its consolidation into the Minnesota Public Employees Retirement Association on June 30, 2010. Director and Vice Chair of The Tree Trust (non-profit corporation). Director of the American Chestnut Foundation (non-profit corporation). | | Asset Allocation Trust |
| * | | Length of service dates reflect the Trustee’s commencement of service with the Trust’s predecessor entities, where applicable. |
| ** | | William R. Ebsworth and Jane A. Freeman each became a Trustee effective January 1, 2015. |
Officers
| | | | | | |
Name and year of birth | | Position held and length of service | | Principal occupations during past five years or longer | | |
Karla M. Rabusch (Born 1959) | | President, since 2003 | | Executive Vice President of Wells Fargo Bank, N.A. and President of Wells Fargo Funds Management, LLC since 2003. | | |
Nancy Wiser1 (Born 1967) | | Treasurer, since 2012 | | Executive Vice President of Wells Fargo Funds Management, LLC since 2011. Chief Operating Officer and Chief Compliance Officer at LightBox Capital Management LLC, from 2008 to 2011. | | |
C. David Messman (Born 1960) | | Secretary, since 2000; Chief Legal Officer, since 2003 | | Senior Vice President and Secretary of Wells Fargo Funds Management, LLC since 2001. Assistant General Counsel of Wells Fargo Bank, N.A. since 2013 and Vice President and Managing Counsel of Wells Fargo Bank N.A. from 1996 to 2013. | | |
Debra Ann Early (Born 1964) | | Chief Compliance Officer, since 2007 | | Executive Vice President of Wells Fargo Funds Management, LLC since 2014, Senior Vice President and Chief Compliance Officer from 2007 to 2014. | | |
David Berardi (Born 1975) | | Assistant Treasurer, since 2009 | | Vice President of Wells Fargo Funds Management, LLC since 2009. Vice President of Evergreen Investment Management Company, LLC from 2008 to 2010. Manager of Fund Reporting and Control for Evergreen Investment Management Company, LLC from 2004 to 2010. | | |
Jeremy DePalma1 (Born 1974) | | Assistant Treasurer, since 2009 | | Senior Vice President of Wells Fargo Funds Management, LLC since 2009. Senior Vice President of Evergreen Investment Management Company, LLC from 2008 to 2010 and head of the Fund Reporting and Control Team within Fund Administration from 2005 to 2010. | | |
| 1 | Nancy Wiser acts as Treasurer of 72 funds in the Fund Complex. Jeremy DePalma acts as Treasurer of 61 funds and Assistant Treasurer of 72 funds in the Fund Complex. |
| 2 | The Statement of Additional Information includes additional information about the Trustees and is available, without charge, upon request, by calling 1-800-222-8222 or by visiting the website at wellsfargoadvantagefunds.com. |
| | | | |
| 28 | | Wells Fargo Advantage Adjustable Rate Government Fund | | Other information (unaudited) |
BOARD CONSIDERATION OF INVESTMENT ADVISORY, INVESTMENT MANAGEMENT AND SUB-ADVISORY AGREEMENTS:
Under the Investment Company Act of 1940 (the “1940 Act”), the Board of Trustees (the “Board”) of Wells Fargo Funds Trust (the “Trust”) must determine annually whether to approve the continuation of the Trust’s investment advisory and sub-advisory agreements. In this regard, at an in-person meeting held on May 19-20, 2015 (the “Meeting”), the Board, all the members of which have no direct or indirect interest in the investment advisory and sub-advisory agreements and are not “interested persons” of the Trust, as defined in the 1940 Act (the “Independent Trustees”), reviewed and approved for Wells Fargo Advantage Adjustable Rate Government Fund (the “Fund”): (i) an investment advisory agreement (the “Advisory Agreement”) with Wells Fargo Funds Management, LLC (“Funds Management”); (ii) an investment management agreement (the “Management Agreement”) with Funds Management; and (iii) an investment sub-advisory agreement (the “Sub-Advisory Agreement”) with Wells Capital Management Incorporated (the “Sub-Adviser”), an affiliate of Funds Management. The Management Agreement combines the terms of the Advisory Agreement with the terms of the Fund’s Amended and Restated Administration Agreement (the “Administration Agreement”) applicable to Fund-level administrative services. The Advisory Agreement, the Management Agreement and the Sub-Advisory Agreement are collectively referred to as the “Advisory Agreements.”
At the Meeting, the Board considered the factors and reached the conclusions described below relating to the selection of Funds Management and the Sub-Adviser and the approval of the Advisory Agreements. Prior to the Meeting, including at an in-person meeting in March 2015, the Trustees conferred extensively among themselves and with representatives of Funds Management about these matters. Also, the Board has adopted a team-based approach, with each team consisting of a sub-set of Trustees, to assist the full Board in the discharge of its duties in reviewing performance and other matters throughout the year. The Independent Trustees were assisted in their evaluation of the Advisory Agreements by independent legal counsel, from whom they received separate legal advice and with whom they met separately.
In providing information to the Board, Funds Management and the Sub-Adviser were guided by a detailed set of requests for information submitted to them by independent legal counsel on behalf of the Independent Trustees at the start of the Board’s annual contract renewal process earlier in 2015. In considering and approving the Advisory Agreements, the Trustees considered the information they believed relevant, including but not limited to the information discussed below. The Board considered not only the specific information presented in connection with the Meeting, but also the knowledge gained over time through interaction with Funds Management and the Sub-Adviser about various topics. In this regard, the Board reviewed reports of Funds Management at each of its quarterly meetings, which included, among other things, portfolio reviews and performance reports. In addition, the Board and the teams mentioned above confer with portfolio managers at various times throughout the year. The Board did not identify any particular information or consideration that was all-important or controlling, and each individual Trustee may have attributed different weights to various factors.
After its deliberations, the Board unanimously approved the continuation of the Advisory Agreement for the period from June 1, 2015 through June 30, 2015, approved the Management Agreement for the period from July 1, 2015 through May 31, 2016, and approved the continuation of the Sub-Advisory Agreement for a one-year term through May 31, 2016. The Board also determined that the compensation payable to Funds Management and the Sub-Adviser under each of the Advisory Agreements was reasonable. The Board considered the approval of the Advisory Agreements for the Fund as part of its consideration of agreements for funds across the complex, but its approvals were made on a fund-by-fund basis. The following summarizes a number of important, but not necessarily all, factors considered by the Board in support of its approvals.
Nature, extent and quality of services
The Board received and considered various information regarding the nature, extent and quality of services provided to the Fund by Funds Management and the Sub-Adviser under the Advisory Agreements. This information included, among other things, a summary of the background and experience of senior management of Funds Management, and the qualifications, background, tenure and responsibilities of each of the portfolio managers primarily responsible for the day-to-day portfolio management of the Fund. The Board noted that the services to be provided to the Fund pursuant to the Management Agreement combined the advisory services previously provided to the Fund pursuant to the Fund’s Advisory Agreement with the Fund-level administrative services previously provided to the Fund pursuant to the Fund’s Administration Agreement. The Board received a representation from Funds Management that combining these services would not result in any change to the nature or level of services provided by Funds Management to the Fund.
The Board evaluated the ability of Funds Management and the Sub-Adviser to attract and retain qualified investment professionals, including research, advisory and supervisory personnel. The Board further considered the compliance
| | | | | | |
| Other information (unaudited) | | Wells Fargo Advantage Adjustable Rate Government Fund | | | 29 | |
programs and compliance records of Funds Management and the Sub-Adviser. In addition, the Board took into account the full range of services provided to the Fund by Funds Management and its affiliates.
Fund performance and expenses
The Board considered the performance results for the Fund over various time periods ended March 31, 2015. The Board considered these results in comparison to the performance of funds in a universe that was determined by Lipper Inc. (“Lipper”) to be similar to the Fund (the “Universe”), and in comparison to the Fund’s benchmark index and to other comparative data. Lipper is an independent provider of investment company data. The Board received a description of the methodology used by Lipper to select the mutual funds in the performance Universe. The Board noted that the performance of the Fund (Class A) was higher than or equal to the average performance of the Universe for all periods under review except for the first quarter of 2015. The Board also noted that the performance of the Fund was higher than or in range of its benchmark, the Barclays 6-Month Treasury Bill Index, for all periods under review.
The Board also received and considered information regarding the Fund’s net operating expense ratios and their various components, including actual management fees (which reflect fee waivers, if any, and include advisory, administration and transfer agent fees), custodian and other non-management fees, and Rule 12b-1 and non-Rule 12b-1 service fees. The Board considered these ratios in comparison to the median ratios of funds in class-specific expense groups that were determined by Lipper to be similar to the Fund (the “Groups”). The Board received a description of the methodology used by Lipper to select the mutual funds in the expense Groups and an explanation of how funds comprising expense groups and their expense ratios may vary from year-to-year. Based on the Lipper reports, the Board noted that the net operating expense ratios of the Fund were lower than or in range of the median net operating expense ratios of the expense Groups.
The Board took into account the Fund performance and expense information provided to it among the factors considered in deciding to re-approve the Advisory Agreement and Sub-Advisory Agreement and approve the Management Agreement.
Investment advisory and sub-advisory fee rates
The Board reviewed and considered the contractual investment advisory fee rates that are payable by the Fund to Funds Management for investment advisory services (the “Advisory Agreement Rates”), both on a stand-alone basis and on a combined basis with the Fund’s fund-level and class-level contractual administration fee rates (the “Management Rates”). The Board noted that the Management Rates include transfer agency and sub-transfer agency costs. The Board also noted that the fee rate to be paid by the Fund under the Management Agreement will incorporate the advisory fee and Fund-level administration fee previously payable separately by the Fund under the Fund’s Advisory Agreement and Administration Agreement with Funds Management. The Board also reviewed and considered the contractual investment sub-advisory fee rates that are payable by Funds Management to the Sub-Adviser for investment sub-advisory services (the “Sub-Advisory Agreement Rates”).
Among other information reviewed by the Board was a comparison of the Management Rates of the Fund with those of other funds in the expense Groups at a common asset level. The Board noted that the Management Rates of the Fund were lower than or in range of the average rates for the Fund’s expense Groups for all share classes.
The Board also received and considered information about the portion of the total advisory fee that was retained by Funds Management after payment of the fee to the Sub-Adviser for sub-advisory services. In assessing the reasonableness of this amount, the Board received and evaluated information about the nature and extent of responsibilities retained and risks assumed by Funds Management and not delegated to or assumed by the Sub-Adviser, and about Funds Management’s on-going oversight services. However, given the affiliation between Funds Management and the Sub-Adviser, the Board ascribed limited relevance to the allocation of the advisory fee between them.
The Board also received and considered information about the nature and extent of services offered and fee rates charged by Funds Management and the Sub-Adviser to other types of clients with investment strategies similar to those of the Fund. In this regard, the Board received information about the significantly greater scope of services, and compliance, reporting and other legal burdens and risks of managing mutual funds compared with those associated with managing assets of non-mutual fund clients such as collective funds or institutional separate accounts.
Based on its consideration of the factors and information it deemed relevant, including those described here, the Board determined that the compensation payable to Funds Management under the Management Agreement and Advisory Agreement and to the Sub-Adviser under the Sub-Advisory Agreement was reasonable, in light of the services covered by the Advisory Agreements.
| | | | |
| 30 | | Wells Fargo Advantage Adjustable Rate Government Fund | | Other information (unaudited) |
Profitability
The Board received and considered information concerning the profitability of Funds Management, as well as the profitability of Wells Fargo as a whole, from providing services to the Fund and the fund family as a whole. The Board also received and considered information concerning the profitability of the Sub-Adviser from providing services to the fund family as a whole, noting that the Sub-Adviser’s profitability information with respect to providing services to the Fund was subsumed in the Wells Fargo profitability analysis.
Funds Management reported on the methodologies and estimates used in calculating profitability. Among other things, the Board noted that the levels of profitability reported on a fund-by-fund basis varied widely, depending on factors such as the size and type of fund. Based on its review, the Board did not deem the profits reported by Funds Management or Wells Fargo from its services to the Fund to be at a level that would prevent it from approving the continuation of the Advisory Agreements.
Economies of scale
With respect to possible economies of scale, the Board noted the existence of breakpoints in the Fund’s advisory and management fee structures, and the Fund’s administration fee structure, which operate generally to reduce the Fund’s expense ratios as the Fund grows in size. It considered that, for a small fund or a fund that shrinks in size, breakpoints conversely can result in higher fee levels. The Board also considered that fee waiver and expense reimbursement arrangements and competitive fee rates at the outset are means of sharing potential economies of scale with shareholders of the Fund and the fund family as a whole. The Board considered Funds Management’s view that any analyses of potential economies of scale in managing a particular fund are inherently limited in light of the joint and common costs and investments that Funds Management incurs across the fund family as a whole.
The Board concluded that the Fund’s fee and expense arrangements, including contractual breakpoints, constituted a reasonable approach to sharing potential economies of scale with the Fund and its shareholders.
Other benefits to Funds Management and the Sub-Adviser
The Board received and considered information regarding potential “fall-out” or ancillary benefits received by Funds Management and its affiliates, including the Sub-Adviser, as a result of their relationships with the Fund. Ancillary benefits could include, among others, benefits directly attributable to other relationships with the Fund and benefits potentially derived from an increase in Funds Management’s and the Sub-Adviser’s business as a result of their relationships with the Fund. The Board noted that various affiliates of Funds Management may receive distribution-related fees, shareholder servicing payments and sub-transfer agency fees in respect of shares sold or held through them and services provided.
The Board also reviewed information about soft dollar credits earned and utilized by the Sub-Adviser, fees earned by Funds Management and the Sub-Adviser from managing a private investment vehicle for the fund family’s securities lending collateral and commissions earned by an affiliated broker from portfolio transactions.
Based on its consideration of the factors and information it deemed relevant, including those described here, the Board did not find that any ancillary benefits received by Funds Management and its affiliates, including the Sub-Adviser, were unreasonable.
Conclusion
At the Meeting, after considering the above-described factors and based on its deliberations and its evaluation of the information described above, the Board unanimously approved the continuation of the Advisory Agreement for the period from June 1, 2015 through June 30, 2015, approved the Management Agreement for the period from July 1, 2015 through May 31, 2016, and approved the continuation of the Sub-Advisory Agreement for a one-year term through May 31, 2016. The Board also determined that the compensation payable to Funds Management and the Sub-Adviser under each of the Advisory Agreements was reasonable.
| | | | | | |
| List of abbreviations | | Wells Fargo Advantage Adjustable Rate Government Fund | | | 31 | |
The following is a list of common abbreviations for terms and entities that may have appeared in this report.
| ACA | — ACA Financial Guaranty Corporation |
| ADR | — American depositary receipt |
| ADS | — American depositary shares |
| AGC | — Assured Guaranty Corporation |
| AGM | — Assured Guaranty Municipal |
| Ambac | — Ambac Financial Group Incorporated |
| AMT | — Alternative minimum tax |
| BAN | — Bond anticipation notes |
| BHAC | — Berkshire Hathaway Assurance Corporation |
| CAB | — Capital appreciation bond |
| CCAB | — Convertible capital appreciation bond |
| CDA | — Community Development Authority |
| CDO | — Collateralized debt obligation |
| DRIVER | — Derivative inverse tax-exempt receipts |
| DW&P | — Department of Water & Power |
| DWR | — Department of Water Resources |
| ECFA | — Educational & Cultural Facilities Authority |
| EDA | — Economic Development Authority |
| EDFA | — Economic Development Finance Authority |
| ETF | — Exchange-traded fund |
| FDIC | — Federal Deposit Insurance Corporation |
| FFCB | — Federal Farm Credit Banks |
| FGIC | — Financial Guaranty Insurance Corporation |
| FHA | — Federal Housing Administration |
| FHLB | — Federal Home Loan Bank |
| FHLMC | — Federal Home Loan Mortgage Corporation |
| FICO | — The Financing Corporation |
| FNMA | — Federal National Mortgage Association |
| GDR | — Global depositary receipt |
| GNMA | — Government National Mortgage Association |
| HCFR | — Healthcare facilities revenue |
| HEFA | — Health & Educational Facilities Authority |
| HEFAR | — Higher education facilities authority revenue |
| HFA | — Housing Finance Authority |
| HFFA | — Health Facilities Financing Authority |
| HUD | — Department of Housing and Urban Development |
| IDA | — Industrial Development Authority |
| IDAG | — Industrial Development Agency |
| KRW | — Republic of Korea won |
| LIBOR | — London Interbank Offered Rate |
| LIFER | — Long Inverse Floating Exempt Receipts |
| LLC | — Limited liability company |
| LLLP | — Limited liability limited partnership |
| LLP | — Limited liability partnership |
| MBIA | — Municipal Bond Insurance Association |
| MFHR | — Multifamily housing revenue |
| MSTR | — Municipal securities trust receipts |
| MUD | — Municipal Utility District |
| National | — National Public Finance Guarantee Corporation |
| PCFA | — Pollution Control Financing Authority |
| PCL | — Public Company Limited |
| PCR | — Pollution control revenue |
| PFA | — Public Finance Authority |
| PFFA | — Public Facilities Financing Authority |
| PFOTER | — Puttable floating option tax-exempt receipts |
| plc | — Public limited company |
| PUTTER | — Puttable tax-exempt receipts |
| R&D | — Research & development |
| Radian | — Radian Asset Assurance |
| RAN | — Revenue anticipation notes |
| RDA | — Redevelopment Authority |
| RDFA | — Redevelopment Finance Authority |
| REIT | — Real estate investment trust |
| ROC | — Reset option certificates |
| SAVRS | — Select auction variable rate securities |
| SBA | — Small Business Authority |
| SDR | — Swedish depositary receipt |
| SFHR | — Single-family housing revenue |
| SFMR | — Single-family mortgage revenue |
| SPA | — Standby purchase agreement |
| SPDR | — Standard & Poor’s Depositary Receipts |
| SPEAR | — Short Puttable Exempt Adjustable Receipts |
| STRIPS | — Separate trading of registered interest and |
| TAN | — Tax anticipation notes |
| TIPS | — Treasury inflation-protected securities |
| TRAN | — Tax revenue anticipation notes |
| TTFA | — Transportation Trust Fund Authority |
| TVA | — Tennessee Valley Authority |
This page is intentionally left blank.


For more information
More information about Wells Fargo Advantage Funds is available free upon request. To obtain literature, please write, email, visit the Fund’s website, or call:
Wells Fargo Advantage Funds
P.O. Box 8266
Boston, MA 02266-8266
Email: wfaf@wellsfargo.com
Website: wellsfargoadvantagefunds.com
Individual investors: 1-800-222-8222
Retail investment professionals: 1-888-877-9275
Institutional investment professionals: 1-866-765-0778
This report and the financial statements contained herein are submitted for the general information of the shareholders of Wells Fargo Advantage Funds. If this report is used for promotional purposes, distribution of the report must be accompanied or preceded by a current prospectus. Before investing, please consider the investment objectives, risks, charges, and expenses of the investment. For a current prospectus and, if available, a summary prospectus, containing this information, call 1-800-222-8222 or visit the Fund’s website at wellsfargoadvantagefunds.com. Read the prospectus carefully before you invest or send money.
Wells Fargo Funds Management, LLC, a wholly owned subsidiary of Wells Fargo & Company, provides investment advisory and administrative services for Wells Fargo Advantage Funds. Other affiliates of Wells Fargo & Company provide subadvisory and other services for the Funds. The Funds are distributed by Wells Fargo Funds Distributor, LLC, Member FINRA, an affiliate of Wells Fargo & Company.
NOT FDIC INSURED ¡ NO BANK GUARANTEE ¡ MAY LOSE VALUE
© 2015 Wells Fargo Funds Management, LLC. All rights reserved.
| | |
 | | 236800 10-15 A215/AR215 08-15 |

Wells Fargo Advantage
Conservative Income Fund

Annual Report
August 31, 2015

Reduce clutter. Save trees.
Sign up for electronic delivery of prospectuses and shareholder reports at wellsfargo.com/advantagedelivery
Contents
The views expressed and any forward-looking statements are as of August 31, 2015, unless otherwise noted, and are those of the Fund managers and/or Wells Fargo Funds Management, LLC. Discussions of individual securities, or the markets generally, or any Wells Fargo Advantage Fund are not intended as individual recommendations. Future events or results may vary significantly from those expressed in any forward-looking statements; the views expressed are subject to change at any time in response to changing circumstances in the market. Wells Fargo Funds Management, LLC and the Fund disclaim any obligation to publicly update or revise any views expressed or forward-looking statements.
NOT FDIC INSURED ¡ NO BANK GUARANTEE ¡ MAY LOSE VALUE
| | | | |
| 2 | | Wells Fargo Advantage Conservative Income Fund | | Letter to shareholders (unaudited) |

Karla M. Rabusch
President
Wells Fargo Advantage Funds
Major central banks continued to inject liquidity into global banks and markets through various accommodative monetary policies, including quantitative easing.
Dear Valued Shareholder:
We are pleased to offer you this annual report for the Wells Fargo Advantage Conservative Income Fund for the 12-month period that ended August 31, 2015. The period was marked by low interest rates, low oil prices, and moderate U.S. economic growth. Short-term investment-grade bonds, as measured by the Barclays U.S. 1–3 Year Government/Credit Bond Index,1 returned 0.81% during the period. Meanwhile, strong demand for high-quality, liquid assets kept returns on Treasury bills more modest; the Barclays 6-Month Treasury Bill Index2 returned 0.15% during the period.
Major central banks continued to provide stimulus.
Major central banks continued to inject liquidity into global banks and markets through various accommodative monetary policies, including quantitative easing. In the U.S., the Federal Reserve (Fed) kept its key interest rate near zero in order to support the economy and the financial system. However, it set expectations for it to begin normalizing monetary policy with higher target ranges for the federal funds rate.
Meanwhile, European markets continued to benefit from the European Central Bank’s (ECB’s) willingness to maintain low interest rates. In addition to its targeted longer-term refinancing operations that are designed to increase bank lending, the ECB expanded its quantitative easing program to include the purchase of eurozone government bonds. In Japan, the Bank of Japan maintained an aggressive monetary program aimed at combating deflation.
Economic growth was moderate, and oil prices plummeted.
U.S. economic growth advanced during the reporting period, the unemployment rate ticked lower to 5.1% as of August 2015, and inflation remained below the Fed’s longer-run objective of a 2% pace. The period was also marked by lower oil prices, which began the reporting period near $90 per barrel but declined to $46 per barrel at the end of August 2015. While lower oil prices benefited consumers of oil products, the lower prices pressured companies within the energy sector.
Bond yields rose but remained low by historical standards.
Short-term interest rates increased during the reporting period, with a flattening in the shape of the short-term yield curve. During this time frame, 1-year Treasury bills rose 29 basis points (bps; 100 bps equals 1.00%) to yield 0.38%, 2-year Treasury note yields rose 21 bps to yield 0.74%, and 3-year Treasury note yields rose only 8 bps to yield 1.05%. Meanwhile, ultra-short-term yields were little changed at ultralow levels, anchored by the easy monetary policy.
Since the end of the financial crisis, structural changes in the fixed-income markets have reduced trading liquidity (the degree to which assets can be bought or sold without affecting the price). New regulations and capital requirements have caused traditional liquidity suppliers (banks and broker/dealers) to be more risk-averse and hold less inventory. Meanwhile, corporate-debt issuance has spiked as companies finance themselves at record-low yields, bond mutual funds hold
| 1 | The Barclays U.S. 1–3 Year Government/Credit Bond Index is the one- to three-year component of the Barclays U.S. Government/Credit Bond Index that includes securities in the Government and Credit Indexes. The Government Index includes Treasuries (that is, public obligations of the U.S. Treasury that have remaining maturities of more than one year) and agencies (that is, publicly issued debt of U.S. government agencies, quasi-federal corporations, and corporate or foreign debt guaranteed by the U.S. government).The Credit Index includes publicly issued U.S. corporate and foreign debentures and secured notes that meet specified maturity, liquidity, and quality requirements. You cannot invest directly in an index. |
| 2 | The Barclays 6-Month Treasury Bill Index tracks the performance and attributes of recently issued 6-month U.S. Treasury bills. The index follows Barclays’ monthly rebalancing conventions. You cannot invest directly in an index. |
| | | | | | |
| Letter to shareholders (unaudited) | | Wells Fargo Advantage Conservative Income Fund | | | 3 | |
larger amounts of this new debt supply, trading volumes are lower, and large-size trades are more difficult to execute. However, fixed-income markets appear to have functioned well over the past year with sufficient liquidity and muted volatility.
Don’t let short-term uncertainty derail long-term investment goals.
Periods of uncertainty can present challenges, but experience has taught us that maintaining long-term investment goals can be an effective way to plan for the future. To help you create a sound strategy based on your personal goals and risk tolerance, Wells Fargo Advantage Funds offers more than 100 mutual funds spanning a wide range of asset classes and investment styles. Although diversification cannot guarantee an investment profit or prevent losses, we believe it can be an effective way to manage investment risk and potentially smooth out overall portfolio performance. We encourage investors to know their investments and to understand that appropriate levels of risk-taking may unlock opportunities.
Thank you for choosing to invest in Wells Fargo Advantage Funds. We appreciate your confidence in us and remain committed to helping you meet your financial needs.
Sincerely,

Karla M. Rabusch
President
Wells Fargo Advantage Funds
Periods of uncertainty can present challenges, but experience has taught us that maintaining long-term investment goals can be an effective way to plan for the future.
Notice to shareholders
At a meeting held on August 11–12, 2015, the Board of Trustees of the Fund approved a change in the name of the Fund whereby the word “Advantage” will be removed from its name, effective December 15, 2015.
For current information about your fund investments, contact your investment professional, visit our website at wellsfargoadvantagefunds.com, or call us directly at 1-800-222-8222. We are available 24 hours a day, 7 days a week.
| | | | |
| 4 | | Wells Fargo Advantage Conservative Income Fund | | Performance highlights (unaudited) |
Investment objective
The Fund seeks current income consistent with capital preservation.
Manager
Wells Fargo Funds Management, LLC
Subadviser
Wells Capital Management Incorporated
Portfolio managers
Andrew M. Greenberg, CFA
Anthony J. Melville, CFA
Jeffrey L. Weaver, CFA
Average annual total returns (%) as of August 31, 2015
| | | | | | | | | | | | | | | | | | |
| | | | | | | | | | | Expense ratios1 (%) | |
| | | Inception date | | 1 year | | | Since inception | | | Gross | | | Net2 | |
| Institutional Class (WCIIX) | | 5-31-2013 | | | 0.28 | | | | 0.46 | | | | 0.43 | | | | 0.27 | |
| Barclays 6-9 Month Treasury Bill Index3 | | – | | | 0.13 | | | | 0.12 | * | | | – | | | | – | |
| * | | Based on inception date of Institutional Class. |
Figures quoted represent past performance, which is no guarantee of future results, and do not reflect taxes that a shareholder may pay on fund distributions or the redemption of fund shares. Investment return and principal value of an investment will fluctuate so that an investor’s shares, when redeemed, may be worth more or less than their original cost. Current performance may be lower or higher than the performance data quoted, which assumes the reinvestment of dividends and capital gains. Current month-end performance is available on the Fund’s website, wellsfargoadvantagefunds.com.
Index returns do not include transaction costs associated with buying and selling securities, any mutual fund fees or expenses, or any taxes. It is not possible to invest directly in an index.
Institutional Class Class shares are sold without a front-end sales charge or contingent deferred sales charge.
Bond values fluctuate in response to the financial condition of individual issuers, general market and economic conditions, and changes in interest rates. Changes in market conditions and government policies may lead to periods of heightened volatility in the bond market and reduced liquidity for certain bonds held by the Fund. In general, when interest rates rise, bond values fall and investors may lose principal value. Interest-rate changes and their impact on the fund and its share price can be sudden and unpredictable. The use of derivatives may reduce returns and/or increase volatility. Certain investment strategies tend to increase the total risk of an investment (relative to the broader market). The use of derivatives may reduce returns and/or increase volatility. The Fund is exposed to foreign investment risk, mortgage- and asset-backed securities risk, and municipal securities risk. Consult the Fund’s prospectus for additional information on these and other risks.
Please see footnotes on page 5.
| | | | | | |
| Performance highlights (unaudited) | | Wells Fargo Advantage Conservative Income Fund | | | 5 | |
|
| Growth of $1,000,000 investment4 as of August 31, 2015 |
|
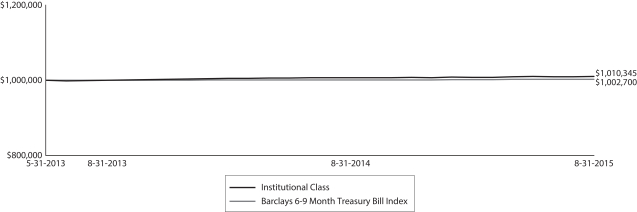 |
| 1 | Reflects the expense ratios as stated in the most recent prospectus. The expense ratios shown are subject to change and may differ from the annualized expense ratio shown in the financial highlights of this report. |
| 2 | The manager has contractually committed through December 31, 2015, to waive fees and/or reimburse expenses to the extent necessary to cap the Fund’s Total Annual Fund Operating Expenses After Fee Waiver at the amount shown. After this time, the cap may be increased or the commitment to maintain the cap may be terminated only with the approval of the Board of Trustees. Brokerage commissions, stamp duty fees, interest, taxes, acquired fund fees and expenses, and extraordinary expenses are excluded from the cap. Without this cap, the Fund’s returns would have been lower. |
| 3 | The Barclays 6–9 Month Treasury Bill Index includes all publicly issued zero-coupon U.S. Treasury bills that have a remaining maturity of less than nine months and more than six, are rated investment-grade, and have $250 million or more of outstanding face value. You cannot invest directly in an index. |
| 4 | The chart compares the performance of Institutional Class shares since inception with the performance of the Barclays 6–9 Month Treasury Bill Index. The chart assumes a hypothetical investment of $1,000,000 in Institutional Class shares and reflects all operating expenses. |
| 5 | The ten largest holdings, excluding cash and cash equivalents, are calculated based on the value of the investments divided by total net assets of the Fund. Holdings are subject to change and may have changed since the date specified. |
| 6 | The BofA Merrill Lynch U.S. Fixed-Rate Asset-Backed Securities, AAA Rated, 1–3 Year Index is an unmanaged index that generally tracks the performance of AAA-rated asset-backed securities with maturities between one and three years. You cannot invest directly in an index. |
| 7 | Amounts are calculated based on the total long-term investments of the Fund. These amounts are subject to change and may have changed since the date specified. |
| | | | |
| 6 | | Wells Fargo Advantage Conservative Income Fund | | Performance highlights (unaudited) |
MANAGER’S DISCUSSION
Fund highlights
| n | | The Fund outperformed its benchmark, the Barclays 6–9 Month Treasury Bill Index, for the 12-month period that ended August 31, 2015. Fund performance was driven by an emphasis on yield-advantaged sectors. |
| n | | The portfolio is primarily invested in yield-advantaged securities and all of the sectors added to the performance of the Fund. Asset-backed securities (ABS), municipals, and sovereign bonds had the highest returns over the past year. The allocation to corporate bonds, the largest sector represented in the Fund, and commercial paper, used for liquidity purposes, both contributed to relative results. |
| n | | In order to minimize the Fund’s price volatility with the U.S. Federal Reserve (Fed) on the verge of entering a tightening cycle, we shortened the Fund’s duration even further from 0.56 years to 0.38 years. We believe it is likely that the Fed will begin tightening monetary policy by the end of 2015 or shortly thereafter. We expect interest-rate increases to occur at a slower pace than previous tightening cycles, and this should serve to limit the impact on the portfolio. |
| n | | While the portfolio’s duration was reduced in anticipation of higher rates, the longer corporate positions in both fixed-rate (maturities between one and one and a half years) and floating-rate (final maturities between two and three years) generally underperformed versus the benchmark. |
| | | | |
| Ten largest holdings5 (%) as of August 31, 2015 | |
North Carolina Eastern Municipal Power Agency, 1.09%, 7-1-2016 | | | 1.72 | |
Kentucky Municipal Power Agency Series B002, 0.54%, 9-1-2037 | | | 1.48 | |
ING Bank NV, 2.00%, 9-25-2015 | | | 1.44 | |
BAT International Finance plc, 0.80%, 6-15-2018 | | | 1.31 | |
Volkswagen Auto Lease Trust Series 2014-A Class A3, 0.80%, 4-20-2017 | | | 1.27 | |
Citibank Credit Card Issuance Trust Series 2013-A3 Class A3, 1.11%, 7-23-2018 | | | 1.26 | |
Golden Credit Card Trust Series 2012-2A Class A1, 1.77%, 1-15-2019 | | | 1.20 | |
Honda Auto Receivables Owner Trust Series 2015-3 Class A2, 0.92%, 11-20-2017 | | | 1.19 | |
JPMorgan Chase & Company, 0.84%, 2-15-2017 | | | 1.19 | |
Wesfarmers Limited, 2.98%, 5-18-2016 | | | 1.14 | |
We found value in ABS.
The ABS sector had the highest return among the sectors within the Fund. The BofA Merrill Lynch U.S. Fixed-Rate Asset-Backed Securities, AAA Rated, 1-3 Year Index6 returned 34 basis points (bps; 100 bps equals 1.00%) of excess return versus comparable-maturity Treasuries. We favored AAA-rated short-dated tranches (one-year weighted average life) across ABS sectors, with particular emphasis on senior classes in the equipment and prime auto-related ABS sectors.
Corporate bonds with maturities greater than one year underperformed comparable-maturity Treasuries over the past 12 months due to heavy new issuance and the expectation of higher interest rates. Another factor pressuring corporate bonds was an emphasis on increasing shareholder value, which in turn caused higher leverage, most notably in industrial issuers. Within the Fund, we focused on shorter-term corporate notes as well as floating-rate notes, both of which offered better
performance than longer-dated corporates. A majority of the Fund’s corporate exposure was in the bank and finance issues, which outperformed similarly rated industrials.
|
| Portfolio allocation7 as of August 31, 2015 |
|
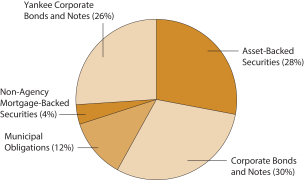 |
We decreased duration due to concerns about higher interest rates.
Short-term interest rates increased during the reporting period, with a flattening in the shape of the short-term yield curve. During the 12-month period that ended August 31, 2015, 1-year Treasury bills rose 29 bps to yield 0.38%, 2-year Treasury note yields rose 21 bps to yield 0.74%, and 3-year Treasury note yields rose only 8 bps to yield 1.05%.
We decreased the Fund’s duration from 0.56 years to 0.38 years over the past 12 months, and the Fund benefited as rates moved higher. Additionally, the Fed appeared ready to increase the federal funds target rate by the end of 2015, which could cause interest rates in the front end of the yield curve (out to three years) to move higher.
Please see footnotes on page 5.
| | | | | | |
| Performance highlights (unaudited) | | Wells Fargo Advantage Conservative Income Fund | | | 7 | |
The Fund’s allocation to the sectors we emphasize (commercial paper, ABS, municipal securities, and corporate bonds) remained stable during the year. However, we shortened the portfolio by investing in securities that generally had less than one and a half years’ maturity. Short-term, high-grade corporate yields widened relative to comparable-maturity Treasury yields over the past year, which led to the underperformance of that sector. The Fund benefited from the ABS sector and floating-rate corporate notes, both of which had positive returns versus Treasuries.
We see opportunities ahead.
Looking forward, we will continue to seek to protect the portfolio from a rising rate environment by maintaining duration below 0.5 years and limiting exposure to securities with maturities longer than 18 months. This should help mitigate the effect of higher interest rates on the Fund’s net asset value. An improving economy should prove beneficial to corporate bond investments. We will continue to rely on our credit research capabilities in order to avoid credit downgrades from companies engaging in merger and acquisition activity or other leveraging events. Investments in banks and finance companies continue to look attractive to us as well as investments in ABS. AAA-rated ABS are secured, bankruptcy-remote investments that offer attractive return potential as well as strong credit fundamentals.
Please see footnotes on page 5.
| | | | |
| 8 | | Wells Fargo Advantage Conservative Income Fund | | Fund expenses (unaudited) |
As a shareholder of the Fund, you incur ongoing costs and other Fund expenses. This example is intended to help you understand your ongoing costs (in dollars) of investing in the Fund and to compare these costs with the ongoing costs of investing in other mutual funds.
The example is based on an investment of $1,000 invested at the beginning of the six-month period and held for the entire period from March 1, 2015 to August 31, 2015.
Actual expenses
The “Actual” line of the table below provides information about actual account values and actual expenses. You may use the information in this line, together with the amount you invested, to estimate the expenses that you paid over the period. Simply divide your account value by $1,000 (for example, an $8,600 account value divided by $1,000 = 8.6), then multiply the result by the number in the “Actual” line under the heading entitled “Expenses paid during period” for your applicable class of shares to estimate the expenses you paid on your account during this period.
Hypothetical example for comparison purposes
The “Hypothetical” line of the table below provides information about hypothetical account values and hypothetical expenses based on the Fund’s actual expense ratio and an assumed rate of return of 5% per year before expenses, which is not the Fund’s actual return. The hypothetical account values and expenses may not be used to estimate the actual ending account balance or expenses you paid for the period. You may use this information to compare the ongoing costs of investing in the Fund and other funds. To do so, compare this 5% hypothetical example with the 5% hypothetical examples that appear in the shareholder reports of the other funds.
Please note that the expenses shown in the table are meant to highlight your ongoing costs. Therefore, the “Hypothetical” line of the table is useful in comparing ongoing costs only and will not help you determine the relative total costs of owning different funds.
| | | | | | | | | | | | | | | | |
| | | Beginning account value 3-1-2015 | | | Ending account value 8-31-2015 | | | Expenses paid during the period1 | | | Net annualized expense ratio | |
Institutional Class | | | | | | | | | | | | | | | | |
Actual | | $ | 1,000.00 | | | $ | 1,002.30 | | | $ | 1.36 | | | | 0.27 | % |
Hypothetical (5% return before expenses) | | $ | 1,000.00 | | | $ | 1,023.84 | | | $ | 1.38 | | | | 0.27 | % |
| 1 | Expenses paid is equal to the annualized expense ratio multiplied by the average account value over the period, multiplied by the number of days in the most recent fiscal half-year divided by the number of days in the fiscal year (to reflect the one-half-year period). |
| | | | | | |
| Portfolio of investments—August 31, 2015 | | Wells Fargo Advantage Conservative Income Fund | | | 9 | |
| | | | | | | | | | | | | | | | |
| Security name | | Interest rate | | | Maturity date | | | Principal | | | Value | |
| | | | | | | | | | | | | | | | |
| | | | |
Asset-Backed Securities: 21.94% | | | | | | | | | | | | | | | | |
Ally Auto Receivables Trust Series 2014-3 Class A2 | | | 0.81 | % | | | 9-15-2017 | | | $ | 905,201 | | | $ | 905,574 | |
Bank of the West Auto Trust Series 2014-1 Class A2 144A | | | 0.69 | | | | 7-17-2017 | | | | 2,274,073 | | | | 2,273,177 | |
BMW Vehicle Lease Trust Series 2014-1 Class A2 | | | 0.45 | | | | 3-21-2016 | | | | 85,000 | | | | 84,986 | |
California Republic Auto Receivables Trust Series 2014-3 Class A3 | | | 1.09 | | | | 11-15-2018 | | | | 1,500,000 | | | | 1,497,798 | |
Capital One Multi Asset Execution Trust Series 2006-A3 Class A3 | | | 5.05 | | | | 12-17-2018 | | | | 1,805,000 | | | | 1,840,952 | |
CarMax Auto Owner Trust Series 2014-4 Class A2A | | | 0.67 | | | | 2-15-2018 | | | | 2,455,406 | | | | 2,454,176 | |
CarMax Auto Owner Trust Series 2015-2 Class A2A | | | 0.82 | | | | 6-15-2018 | | | | 500,000 | | | | 499,711 | |
Citibank Credit Card Issuance Trust Series 2013-A3 Class A3 | | | 1.11 | | | | 7-23-2018 | | | | 4,220,000 | | | | 4,228,592 | |
Fifth Third Auto Trust Series 2014-1 Class A3 | | | 0.68 | | | | 4-16-2018 | | | | 1,856,305 | | | | 1,854,874 | |
Ford Credit Auto Lease Trust Series 2013-B Class A3 | | | 0.76 | | | | 9-15-2016 | | | | 374,702 | | | | 374,732 | |
Ford Credit Auto Lease Trust Series 2014-A Class A3 | | | 0.68 | | | | 4-15-2017 | | | | 900,000 | | | | 899,421 | |
Ford Credit Auto Lease Trust Series 2015-A Class A2A | | | 0.79 | | | | 12-15-2017 | | | | 2,000,000 | | | | 2,000,906 | |
Ford Credit Auto Lease Trust Series 2015-A Class A2A | | | 0.81 | | | | 1-15-2018 | | | | 1,000,000 | | | | 999,763 | |
GE Equipment Transportation LLC Series 2015-1 Class A2 | | | 0.89 | | | | 11-24-2017 | | | | 1,825,000 | | | | 1,826,119 | |
GM Financial Automobile Leasing Trust Series 2014-1A Class A2 144A | | | 0.61 | | | | 7-20-2016 | | | | 650,951 | | | | 650,548 | |
GM Financial Automobile Leasing Trust Series 2014-2A Class A3 144A | | | 1.22 | | | | 1-22-2018 | | | | 2,500,000 | | | | 2,502,498 | |
GM Financial Automobile Leasing Trust Series 2015-2 Class A2A | | | 1.18 | | | | 4-20-2018 | | | | 1,000,000 | | | | 1,001,771 | |
Golden Credit Card Trust Series 2012-2A Class A1 144A | | | 1.77 | | | | 1-15-2019 | | | | 4,000,000 | | | | 4,033,148 | |
Honda Auto Receivables Owner Trust Series 2015-3 Class A2 | | | 0.92 | | | | 11-20-2017 | | | | 4,000,000 | | | | 4,000,356 | |
Hyundai Auto Lease Securitization Trust Series 2013-B Class A3 144A | | | 0.98 | | | | 10-17-2016 | | | | 1,063,144 | | | | 1,063,572 | |
Hyundai Auto Lease Securitization Trust Series 2015-A Class A2 144A | | | 1.00 | | | | 10-16-2017 | | | | 1,000,000 | | | | 1,000,349 | |
Hyundai Auto Receivables Trust Series 2012-C Class A3 | | | 0.53 | | | | 4-17-2017 | | | | 106,438 | | | | 106,423 | |
John Deere Owner Trust Series 2015-A Class A2A | | | 0.87 | | | | 2-15-2018 | | | | 2,000,000 | | | | 1,999,092 | |
Leaf II Receivables Funding LLC Series 2015-1 Class A2 144A | | | 1.13 | | | | 3-15-2017 | | | | 3,500,000 | | | | 3,493,042 | |
M&T Bank Auto Receivables Trust Series 2013-1A Class A3 144A | | | 1.06 | | | | 11-15-2017 | | | | 630,992 | | | | 631,198 | |
Mercedes-Benz Auto Lease Trust Series 2013-B Class A3 | | | 0.62 | | | | 7-15-2016 | | | | 311,369 | | | | 311,327 | |
MMAF Equipment Finance LLC Series 2014-AA Class A2 144A | | | 0.52 | | | | 4-10-2017 | | | | 1,431,666 | | | | 1,429,658 | |
MMAF Equipment Finance LLC Series 2015-AA Class A2 144A | | | 0.96 | | | | 9-18-2017 | | | | 2,200,000 | | | | 2,196,218 | |
Nissan Auto Lease Trust Series 2013-B Class A3 | | | 0.75 | | | | 6-15-2016 | | | | 558,572 | | | | 558,520 | |
Nissan Auto Lease Trust Series 2014-A Class A2A | | | 0.48 | | | | 9-15-2016 | | | | 2,029,610 | | | | 2,028,433 | |
Oscar US Funding Trust Series 2015-1A Class A2A 144A | | | 1.30 | | | | 2-15-2018 | | | | 3,000,000 | | | | 3,012,564 | |
Penarth Master Issuer Series 2013-1A Class A1 144A± | | | 0.59 | | | | 11-18-2017 | | | | 2,000,000 | | | | 1,999,826 | |
Porsche Innovative Lease Owner Trust Series 2015-1 Class A2 144A | | | 0.79 | | | | 11-21-2017 | | | | 1,000,000 | | | | 1,000,055 | |
Smart Trust Series 2013-2US Class A3A | | | 0.83 | | | | 1-14-2017 | | | | 1,120,486 | | | | 1,119,524 | |
Smart Trust Series 2014-1US Class A2A | | | 0.58 | | | | 7-14-2016 | | | | 101,713 | | | | 101,699 | |
Smart Trust Series 2015-1US Class A2A | | | 0.99 | | | | 8-14-2017 | | | | 1,880,000 | | | | 1,881,359 | |
SunTrust Auto Receivables Trust Series 2015-1A Class A2 144A | | | 0.99 | | | | 6-15-2018 | | | | 2,000,000 | | | | 1,994,984 | |
Toyota Auto Receivables Owner Trust Series 2015-C Class A2A | | | 0.92 | | | | 2-15-2018 | | | | 3,700,000 | | | | 3,701,706 | |
Volkswagen Auto Lease Trust Series 2014-A Class A3 | | | 0.80 | | | | 4-20-2017 | | | | 4,265,000 | | | | 4,264,002 | |
Volkswagen Auto Lease Trust Series 2014-A Class A2A | | | 0.52 | | | | 10-20-2016 | | | | 305,655 | | | | 305,551 | |
Volkswagen Auto Lease Trust Series 2015-A Class A2A | | | 0.87 | | | | 6-20-2017 | | | | 958,644 | | | | 958,553 | |
Volvo Financial Equipment LLC Series 2014-1A Class A2 144A | | | 0.54 | | | | 11-15-2016 | | | | 896,497 | | | | 896,229 | |
World Omni Automobile Lease Series 2015-A Class A2A | | | 1.06 | | | | 5-15-2018 | | | | 2,900,000 | | | | 2,899,081 | |
World Omni Automobile Receivables Trust Series 2015-A Class A2A | | | 0.79 | | | | 7-16-2018 | | | | 976,467 | | | | 976,052 | |
| | | | |
Total Asset-Backed Securities (Cost $73,861,406) | | | | | | | | | | | | | | | 73,858,119 | |
| | | | | | | | | | | | | | | | |
The accompanying notes are an integral part of these financial statements.
| | | | |
| 10 | | Wells Fargo Advantage Conservative Income Fund | | Portfolio of investments—August 31, 2015 |
| | | | | | | | | | | | | | | | |
| Security name | | Interest rate | | | Maturity date | | | Principal | | | Value | |
| | | | | | | | | | | | | | | | |
| | | | |
Corporate Bonds and Notes: 23.52% | | | | | | | | | | | | | | | | |
| | | | |
Consumer Discretionary: 0.75% | | | | | | | | | | | | | | | | |
| | | | |
| Specialty Retail: 0.75% | | | | | | | | | | | | | | | | |
Lowe’s Companies Incorporated | | | 2.13 | % | | | 4-15-2016 | | | $ | 2,500,000 | | | $ | 2,518,410 | |
| | | | | | | | | | | | | | | | |
| | | | |
Financials: 19.96% | | | | | | | | | | | | | | | | |
| | | | |
| Banks: 10.06% | | | | | | | | | | | | | | | | |
Bank of America Corporation ± | | | 0.73 | | | | 6-5-2017 | | | | 1,000,000 | | | | 997,388 | |
Bank of America Corporation ± | | | 0.78 | | | | 2-14-2017 | | | | 1,890,000 | | | | 1,888,038 | |
Branch Banking & Trust Company ± | | | 0.61 | | | | 9-13-2016 | | | | 1,050,000 | | | | 1,050,531 | |
Branch Banking & Trust Company | | | 5.63 | | | | 9-15-2016 | | | | 250,000 | | | | 260,948 | |
Branch Banking & Trust Corporation | | | 3.95 | | | | 4-29-2016 | | | | 1,884,000 | | | | 1,921,433 | |
Capital One NA ± | | | 0.98 | | | | 2-5-2018 | | | | 1,500,000 | | | | 1,496,931 | |
Citigroup Incorporated ± | | | 0.82 | | | | 3-10-2017 | | | | 1,350,000 | | | | 1,346,724 | |
Citigroup Incorporated ± | | | 1.00 | | | | 11-15-2016 | | | | 500,000 | | | | 501,740 | |
Citigroup Incorporated ± | | | 1.18 | | | | 7-30-2018 | | | | 900,000 | | | | 900,201 | |
Citigroup Incorporated ± | | | 1.26 | | | | 7-25-2016 | | | | 500,000 | | | | 501,195 | |
Credit Suisse New York ± | | | 0.98 | | | | 4-27-2018 | | | | 2,500,000 | | | | 2,477,070 | |
Credit Suisse New York ± | | | 0.98 | | | | 1-29-2018 | | | | 1,750,000 | | | | 1,746,465 | |
Fifth Third Bank | | | 0.90 | | | | 2-26-2016 | | | | 2,300,000 | | | | 2,300,041 | |
HSBC USA Incorporated ± | | | 1.08 | | | | 8-7-2018 | | | | 2,000,000 | | | | 1,996,482 | |
JPMorgan Chase & Company ± | | | 0.84 | | | | 2-15-2017 | | | | 4,000,000 | | | | 3,994,656 | |
JPMorgan Chase & Company | | | 1.10 | | | | 10-15-2015 | | | | 375,000 | | | | 375,263 | |
Merrill Lynch & Company Incorporated | | | 5.30 | | | | 9-30-2015 | | | | 595,000 | | | | 596,936 | |
MUFG Union Bank NA ± | | | 1.03 | | | | 9-26-2016 | | | | 1,625,000 | | | | 1,628,356 | |
PNC Bank NA ± | | | 0.60 | | | | 8-1-2017 | | | | 1,650,000 | | | | 1,642,339 | |
PNC Bank NA ± | | | 0.70 | | | | 6-1-2018 | | | | 500,000 | | | | 497,294 | |
PNC Bank NA | | | 1.13 | | | | 1-27-2017 | | | | 750,000 | | | | 747,174 | |
PNC Bank NA | | | 1.30 | | | | 10-3-2016 | | | | 2,000,000 | | | | 2,005,128 | |
UBS AG ± | | | 0.84 | | | | 6-1-2017 | | | | 1,000,000 | | | | 999,481 | |
UBS AG ± | | | 0.98 | | | | 3-26-2018 | | | | 2,000,000 | | | | 1,998,912 | |
| | | | |
| | | | | | | | | | | | | | | 33,870,726 | |
| | | | | | | | | | | | | | | | |
| | | | |
| Capital Markets: 1.68% | | | | | | | | | | | | | | | | |
Goldman Sachs Group Incorporated ± | | | 0.73 | | | | 3-22-2016 | | | | 1,000,000 | | | | 999,756 | |
Goldman Sachs Group Incorporated | | | 3.63 | | | | 2-7-2016 | | | | 1,750,000 | | | | 1,770,129 | |
Morgan Stanley ± | | | 1.02 | | | | 1-5-2018 | | | | 1,350,000 | | | | 1,349,992 | |
Morgan Stanley | | | 3.80 | | | | 4-29-2016 | | | | 1,500,000 | | | | 1,528,446 | |
| | | | |
| | | | | | | | | | | | | | | 5,648,323 | |
| | | | | | | | | | | | | | | | |
| | | | |
| Consumer Finance: 5.32% | | | | | | | | | | | | | | | | |
American Express Centurion Bank | | | 0.88 | | | | 11-13-2015 | | | | 900,000 | | | | 900,459 | |
American Express Credit Corporation | | | 1.30 | | | | 7-29-2016 | | | | 1,750,000 | | | | 1,755,464 | |
American Express Credit Corporation | | | 2.75 | | | | 9-15-2015 | | | | 1,021,000 | | | | 1,021,690 | |
American Honda Finance Corporation ± | | | 0.41 | | | | 9-2-2016 | | | | 1,150,000 | | | | 1,149,933 | |
Daimler Finance North America LLC 144A | | | 1.45 | | | | 8-1-2016 | | | | 3,550,000 | | | | 3,559,922 | |
Harley-Davidson Financial Services Incorporated 144A | | | 3.88 | | | | 3-15-2016 | | | | 3,400,000 | | | | 3,453,778 | |
HSBC Finance Corporation | | | 5.50 | | | | 1-19-2016 | | | | 2,200,000 | | | | 2,238,766 | |
Nissan Motor Acceptance Corporation 144A | | | 1.00 | | | | 3-15-2016 | | | | 1,845,000 | | | | 1,845,867 | |
The accompanying notes are an integral part of these financial statements.
| | | | | | |
| Portfolio of investments—August 31, 2015 | | Wells Fargo Advantage Conservative Income Fund | | | 11 | |
| | | | | | | | | | | | | | | | |
| Security name | | Interest rate | | | Maturity date | | | Principal | | | Value | |
| | | | | | | | | | | | | | | | |
| | | | |
| Consumer Finance (continued) | | | | | | | | | | | | | | | | |
Volkswagen Group of America Finance LLC 144A± | | | 0.77 | % | | | 11-20-2017 | | | $ | 725,000 | | | $ | 722,942 | |
Volkswagen Group of America Finance LLC 144A± | | | 0.80 | | | | 5-22-2018 | | | | 1,250,000 | | | | 1,249,503 | |
| | | | |
| | | | | | | | | | | | | | | 17,898,324 | |
| | | | | | | | | | | | | | | | |
| | | | |
| Diversified Financial Services: 0.97% | | | | | | | | | | | | | | | | |
General Electric Capital Corporation | | | 5.00 | | | | 1-8-2016 | | | | 1,650,000 | | | | 1,675,613 | |
General Electric Capital Corporation Series A | | | 5.38 | | | | 10-20-2016 | | | | 1,500,000 | | | | 1,570,817 | |
| | | | |
| | | | | | | | | | | | | | | 3,246,430 | |
| | | | | | | | | | | | | | | | |
| | | | |
| Insurance: 1.93% | | | | | | | | | | | | | | | | |
ACE INA Holdings Incorporated | | | 2.60 | | | | 11-23-2015 | | | | 3,810,000 | | | | 3,824,550 | |
Jackson National Life Global Funding Company 144A± | | | 0.54 | | | | 7-29-2016 | | | | 2,000,000 | | | | 2,001,018 | |
Principal Life Global Funding II 144A | | | 1.00 | | | | 12-11-2015 | | | | 675,000 | | | | 675,859 | |
| | | | |
| | | | | | | | | | | | | | | 6,501,427 | |
| | | | | | | | | | | | | | | | |
| | | | |
Health Care: 1.68% | | | | | | | | | | | | | | | | |
| | | | |
| Health Care Providers & Services: 1.32% | | | | | | | | | | | | | | | | |
Novant Health Incorporated | | | 5.35 | | | | 11-1-2016 | | | | 3,300,000 | | | | 3,461,746 | |
Providence Health & Services Obligated Group ± | | | 0.93 | | | | 10-1-2015 | | | | 1,000,000 | | | | 1,000,137 | |
| | | | |
| | | | | | | | | | | | | | | 4,461,883 | |
| | | | | | | | | | | | | | | | |
| | | | |
| Pharmaceuticals: 0.36% | | | | | | | | | | | | | | | | |
Bayer US Finance LLC 144A± | | | 0.53 | | | | 10-7-2016 | | | | 1,200,000 | | | | 1,198,577 | |
| | | | | | | | | | | | | | | | |
| | | | |
Information Technology: 0.59% | | | | | | | | | | | | | | | | |
| | | | |
| Communications Equipment: 0.59% | | | | | | | | | | | | | | | | |
Cisco Systems Incorporated ± | | | 0.59 | | | | 6-15-2018 | | | | 2,000,000 | | | | 1,994,456 | |
| | | | | | | | | | | | | | | | |
| | | | |
Utilities: 0.54% | | | | | | | | | | | | | | | | |
| | | | |
| Electric Utilities: 0.54% | | | | | | | | | | | | | | | | |
Southern Company | | | 2.38 | | | | 9-15-2015 | | | | 1,825,000 | | | | 1,825,944 | |
| | | | | | | | | | | | | | | | |
| | | | |
Total Corporate Bonds and Notes (Cost $79,262,472) | | | | | | | | | | | | | | | 79,164,500 | |
| | | | | | | | | | | | | | | | |
| | | | |
Municipal Obligations: 9.23% | | | | | | | | | | | | | | | | |
| | | | |
| California: 3.13% | | | | | | | | | | | | | | | | |
California Earthquake Authority (Miscellaneous Revenue) | | | 1.19 | | | | 7-1-2016 | | | | 1,750,000 | | | | 1,752,520 | |
California Industry Public Facilities Authority Series A (Tax Revenue, AGM Insured) | | | 1.76 | | | | 1-1-2017 | | | | 2,500,000 | | | | 2,507,350 | |
Oakland-Alameda County CA Coliseum Authority Series A (Miscellaneous Revenue) | | | 1.25 | | | | 2-1-2017 | | | | 2,250,000 | | | | 2,241,495 | |
Riverside County CA Public Financing Authority Indian Wells Project Series A Class T (Tax Revenue) | | | 0.83 | | | | 9-1-2015 | | | | 1,045,000 | | | | 1,045,000 | |
University of California Series Y-1 (Education Revenue) ± | | | 0.69 | | | | 7-1-2041 | | | | 2,985,000 | | | | 2,984,552 | |
| | | | |
| | | | | | | | | | | | | | | 10,530,917 | |
| | | | | | | | | | | | | | | | |
| | | | |
| Florida: 0.79% | | | | | | | | | | | | | | | | |
Village Center Florida Community Development District (Miscellaneous Revenue) 144A | | | 1.30 | | | | 11-1-2015 | | | | 2,665,000 | | | | 2,664,440 | |
| | | | | | | | | | | | | | | | |
The accompanying notes are an integral part of these financial statements.
| | | | |
| 12 | | Wells Fargo Advantage Conservative Income Fund | | Portfolio of investments—August 31, 2015 |
| | | | | | | | | | | | | | | | |
| Security name | | Interest rate | | | Maturity date | | | Principal | | | Value | |
| | | | | | | | | | | | | | | | |
| | | | |
| Illinois: 0.59% | | | | | | | | | | | | | | | | |
Chicago IL Midway Airport Series C (Airport Revenue) | | | 1.32 | % | | | 1-1-2016 | | | $ | 600,000 | | | $ | 601,818 | |
Illinois (GO Revenue) | | | 4.96 | | | | 3-1-2016 | | | | 1,365,000 | | | | 1,386,854 | |
| | | | |
| | | | | | | | | | | | | | | 1,988,672 | |
| | | | | | | | | | | | | | | | |
| | | | |
| Kentucky: 1.48% | | | | | | | | | | | | | | | | |
Kentucky Municipal Power Agency Series B002 (Miscellaneous Revenue, AGM Insured, Morgan Stanley Bank LIQ) 144A± | | | 0.54 | | | | 9-1-2037 | | | | 5,000,000 | | | | 5,000,000 | |
| | | | | | | | | | | | | | | | |
| | | | |
| Minnesota: 0.33% | | | | | | | | | | | | | | | | |
Saint Paul MN Housing & Redevelopment Authority HealthPartners Obligated Group Series B (Health Revenue) | | | 1.04 | | | | 7-1-2016 | | | | 1,100,000 | | | | 1,099,549 | |
| | | | | | | | | | | | | | | | |
| | | | |
| New Jersey: 0.27% | | | | | | | | | | | | | | | | |
New Jersey EDA School Facilities Construction Series QQ (Miscellaneous Revenue) | | | 1.10 | | | | 6-15-2016 | | | | 900,000 | | | | 898,524 | |
| | | | | | | | | | | | | | | | |
| | | | |
| New York: 0.92% | | | | | | | | | | | | | | | | |
Nassau County NY Series C (GO Revenue) | | | 1.13 | | | | 12-15-2016 | | | | 1,400,000 | | | | 1,396,766 | |
New York NY Housing Development Corporation Series B1 (Housing Revenue) | | | 0.75 | | | | 5-1-2016 | | | | 1,700,000 | | | | 1,701,802 | |
| | | | |
| | | | | | | | | | | | | | | 3,098,568 | |
| | | | | | | | | | | | | | | | |
| | | | |
| North Carolina: 1.72% | | | | | | | | | | | | | | | | |
North Carolina Eastern Municipal Power Agency (Utilities Revenue) | | | 1.09 | | | | 7-1-2016 | | | | 5,750,000 | | | | 5,778,405 | |
| | | | | | | | | | | | | | | | |
| | | | |
Total Municipal Obligations (Cost $31,031,753) | | | | | | | | | | | | | | | 31,059,075 | |
| | | | | | | | | | | | | | | | |
| | | | |
Non-Agency Mortgage-Backed Securities: 2.87% | | | | | | | | | | | | | | | | |
Bank of America Commercial Mortgage Trust Series 2007-1 Class A4 | | | 5.45 | | | | 1-15-2049 | | | | 1,175,805 | | | | 1,229,755 | |
Bear Stearns Commercial Mortgage Securities Incorporated Series 2005-T20 Class A4A ± | | | 5.26 | | | | 10-12-2042 | | | | 14,272 | | | | 14,257 | |
CCG Receivables Trust Class 2014-1 Class A2 144A | | | 1.06 | | | | 11-15-2021 | | | | 1,468,491 | | | | 1,464,896 | |
Dell Equipment Finance Trust 2015-1 Class A2 144A | | | 1.01 | | | | 7-24-2017 | | | | 2,000,000 | | | | 1,997,668 | |
JPMorgan Chase Commercial Mortgage Securities Trust Series 2005-LDP5 Class A4 ± | | | 5.41 | | | | 12-15-2044 | | | | 611,103 | | | | 610,382 | |
JPMorgan Chase Commercial Mortgage Securities Trust Series 2006-LDP6 Class A4 ± | | | 5.48 | | | | 4-15-2043 | | | | 1,326,188 | | | | 1,337,431 | |
JPMorgan Chase Commercial Mortgage Securities Trust Series 2007-LDPX Class A1A | | | 5.44 | | | | 1-15-2049 | | | | 1,033,285 | | | | 1,079,661 | |
JPMorgan Chase Commercial Mortgage Securities Trust Series 2012-C6 Class A2 | | | 2.21 | | | | 5-15-2045 | | | | 1,901,238 | | | | 1,920,425 | |
| | | | |
Total Non-Agency Mortgage-Backed Securities (Cost $9,724,933) | | | | | | | | | | | | | | | 9,654,475 | |
| | | | | | | | | | | | | | | | |
| | | | |
Yankee Corporate Bonds and Notes: 20.55% | | | | | | | | | | | | | | | | |
| | | | |
Consumer Staples: 2.45% | | | | | | | | | | | | | | | | |
| | | | |
| Food & Staples Retailing: 1.14% | | | | | | | | | | | | | | | | |
Wesfarmers Limited 144A | | | 2.98 | | | | 5-18-2016 | | | | 3,810,000 | | | | 3,860,029 | |
| | | | | | | | | | | | | | | | |
| | | | |
| Tobacco: 1.31% | | | | | | | | | | | | | | | | |
BAT International Finance plc 144A± | | | 0.80 | | | | 6-15-2018 | | | | 4,400,000 | | | | 4,398,720 | |
| | | | | | | | | | | | | | | | |
| | | | |
Energy: 1.48% | | | | | | | | | | | | | | | | |
| | | | |
| Oil, Gas & Consumable Fuels: 1.48% | | | | | | | | | | | | | | | | |
BP Capital Markets plc ± | | | 0.66 | | | | 2-10-2017 | | | | 1,250,000 | | | | 1,248,025 | |
BP Capital Markets plc | | | 3.13 | | | | 10-1-2015 | | | | 1,000,000 | | | | 1,002,112 | |
BP Capital Markets plc | | | 3.20 | | | | 3-11-2016 | | | | 1,701,000 | | | | 1,721,189 | |
The accompanying notes are an integral part of these financial statements.
| | | | | | |
| Portfolio of investments—August 31, 2015 | | Wells Fargo Advantage Conservative Income Fund | | | 13 | |
| | | | | | | | | | | | | | | | |
| Security name | | Interest rate | | | Maturity date | | | Principal | | | Value | |
| | | | | | | | | | | | | | | | |
| | | | |
| Oil, Gas & Consumable Fuels (continued) | | | | | | | | | | | | | | | | |
CNPC General Capital Limited 144A± | | | 1.21 | % | | | 5-14-2017 | | | $ | 1,000,000 | | | $ | 998,444 | |
| | | | |
| | | | | | | | | | | | | | | 4,969,770 | |
| | | | | | | | | | | | | | | | |
| | | | |
Financials: 15.19% | | | | | | | | | | | | | | | | |
| | | | |
| Banks: 11.73% | | | | | | | | | | | | | | | | |
ABN Amro Bank NV 144A± | | | 1.09 | | | | 10-28-2016 | | | | 2,000,000 | | | | 2,007,580 | |
ANZ New Zealand International Limited of London 144A | | | 1.85 | | | | 10-15-2015 | | | | 1,050,000 | | | | 1,051,856 | |
Australia & New Zealand Banking Group Limited 144A± | | | 0.73 | | | | 1-16-2018 | | | | 1,500,000 | | | | 1,498,100 | |
Banco Santander Chile 144A± | | | 1.19 | | | | 4-11-2017 | | | | 1,250,000 | | | | 1,240,175 | |
Bank of Montreal | | | 1.30 | | | | 7-15-2016 | | | | 3,000,000 | | | | 3,014,547 | |
Banque Federative du Credit Mutuel SA 144A± | | | 1.14 | | | | 1-20-2017 | | | | 1,000,000 | | | | 1,005,090 | |
BPCE SA | | | 1.70 | | | | 4-25-2016 | | | | 2,695,000 | | | | 2,705,780 | |
Export-Import Bank of Korea ± | | | 1.04 | | | | 1-14-2017 | | | | 1,400,000 | | | | 1,403,650 | |
Export-Import Bank of Korea | | | 1.25 | | | | 11-20-2015 | | | | 2,000,000 | | | | 2,001,580 | |
Export-Import Bank of Korea 144A | | | 5.38 | | | | 10-4-2016 | | | | 1,000,000 | | | | 1,044,716 | |
Industrial & Commercial Bank of China Limited ± | | | 1.50 | | | | 11-13-2017 | | | | 1,500,000 | | | | 1,506,189 | |
ING Bank NV 144A | | | 2.00 | | | | 9-25-2015 | | | | 4,840,000 | | | | 4,844,932 | |
Kookmin Bank 144A± | | | 1.17 | | | | 1-27-2017 | | | | 2,000,000 | | | | 2,008,782 | |
Kookmin Bank 144A± | | | 1.54 | | | | 10-11-2016 | | | | 500,000 | | | | 503,634 | |
Lloyds Bank plc ± | | | 1.10 | | | | 8-17-2018 | | | | 3,500,000 | | | | 3,508,341 | |
Macquarie Bank Limited 144A± | | | 1.07 | | | | 3-24-2017 | | | | 1,000,000 | | | | 1,001,486 | |
Mizuho Bank Limited 144A± | | | 0.92 | | | | 3-26-2018 | | | | 2,500,000 | | | | 2,504,970 | |
National Australia Bank Limited 144A± | | | 0.93 | | | | 7-23-2018 | | | | 1,750,000 | | | | 1,748,908 | |
National Australia Bank Limited | | | 1.30 | | | | 7-25-2016 | | | | 1,000,000 | | | | 1,004,951 | |
Sumitomo Mitsui Banking Corporation ± | | | 0.87 | | | | 1-16-2018 | | | | 1,500,000 | | | | 1,496,940 | |
Sumitomo Mitsui Trust Bank Limited 144A± | | | 1.06 | | | | 9-16-2016 | | | | 750,000 | | | | 752,451 | |
Suncorp-Metway Limited 144A | | | 1.70 | | | | 3-28-2017 | | | | 1,625,000 | | | | 1,632,691 | |
| | | | |
| | | | | | | | | | | | | | | 39,487,349 | |
| | | | | | | | | | | | | | | | |
| | | | |
| Consumer Finance: 0.91% | | | | | | | | | | | | | | | | |
Volkswagen International Finance NV 144A | | | 1.13 | | | | 11-18-2016 | | | | 1,000,000 | | | | 998,718 | |
Volkswagen International Finance NV 144A | | | 2.88 | | | | 4-1-2016 | | | | 2,032,000 | | | | 2,057,884 | |
| | | | |
| | | | | | | | | | | | | | | 3,056,602 | |
| | | | | | | | | | | | | | | | |
| | | | |
| Diversified Financial Services: 1.66% | | | | | | | | | | | | | | | | |
Abbey National Treasury Services plc ± | | | 0.80 | | | | 3-13-2017 | | | | 500,000 | | | | 499,457 | |
Abbey National Treasury Services plc | | | 4.00 | | | | 4-27-2016 | | | | 1,300,000 | | | | 1,326,420 | |
La Caisse Centrale Desjardins du Quebec 144A± | | | 0.96 | | | | 1-29-2018 | | | | 3,760,000 | | | | 3,774,326 | |
| | | | |
| | | | | | | | | | | | | | | 5,600,203 | |
| | | | | | | | | | | | | | | | |
| | | | |
| Insurance: 0.89% | | | | | | | | | | | | | | | | |
Manulife Financial Corporation | | | 3.40 | | | | 9-17-2015 | | | | 3,000,000 | | | | 3,003,264 | |
| | | | | | | | | | | | | | | | |
| | | | |
Information Technology: 0.68% | | | | | | | | | | | | | | | | |
| | | | |
| Internet Software & Services: 0.68% | | | | | | | | | | | | | | | | |
Alibaba Group Holding Limited 144A± | | | 0.85 | | | | 11-28-2017 | | | | 2,300,000 | | | | 2,288,298 | |
| | | | | | | | | | | | | | | | |
The accompanying notes are an integral part of these financial statements.
| | | | |
| 14 | | Wells Fargo Advantage Conservative Income Fund | | Portfolio of investments—August 31, 2015 |
| | | | | | | | | | | | | | | | |
| Security name | | Interest rate | | | Maturity date | | | Principal | | | Value | |
| | | | | | | | | | | | | | | | |
| | | | |
Telecommunication Services: 0.75% | | | | | | | | | | | | | | | | |
| | | | |
| Wireless Telecommunication Services: 0.75% | | | | | | | | | | | | | | | | |
America Movil SAB de CV ± | | | 1.29 | % | | | 9-12-2016 | | | $ | 2,500,000 | | | $ | 2,511,153 | |
| | | | | | | | | | | | | | | | |
| | | | |
Total Yankee Corporate Bonds and Notes (Cost $69,174,090) | | | | | | | | | | | | | | | 69,175,388 | |
| | | | | | | | | | | | | | | | |
| | | | |
Short-Term Investments: 20.55% | | | | | | | | | | | | | | | | |
| | | | |
| Certificates of Deposit: 0.59% | | | | | | | | | | | | | | | | |
Bank of Tokyo-Mitsubishi LLC | | | 0.66 | | | | 7-15-2016 | | | | 2,000,000 | | | | 1,999,406 | |
| | | | | | | | | | | | | | | | |
| | | | |
| Commercial Paper: 19.38% | | | | | | | | | | | | | | | | |
Atlantic Asset Securitization LLC (p)(z) | | | 0.24 | | | | 10-14-2015 | | | | 4,000,000 | | | | 3,998,695 | |
Barton Capital LLC (p)(z) | | | 0.11 | | | | 9-8-2015 | | | | 1,500,000 | | | | 1,499,963 | |
Cancara Asset Securitisation LLC (p)(z) | | | 0.23 | | | | 10-1-2015 | | | | 5,000,000 | | | | 4,998,997 | |
CNPC Finance Limited (z) | | | 0.14 | | | | 9-17-2015 | | | | 4,000,000 | | | | 3,999,730 | |
Coca-Cola Company (z) | | | 0.07 | | | | 9-8-2015 | | | | 1,500,000 | | | | 1,499,976 | |
Collateralized Commercial Paper Company LLC (z) | | | 0.20 | | | | 9-24-2015 | | | | 1,000,000 | | | | 999,869 | |
Collateralized Commercial Paper Company LLC (z) | | | 0.27 | | | | 10-13-2015 | | | | 4,400,000 | | | | 4,398,607 | |
Crown Point Capital Company (p)(z) | | | 0.25 | | | | 10-9-2015 | | | | 4,500,000 | | | | 4,498,762 | |
Institutional Secured Funding LLC (p)(z) | | | 0.14 | | | | 9-1-2015 | | | | 2,500,000 | | | | 2,499,990 | |
Institutional Secured Funding LLC (p)(z) | | | 0.17 | | | | 10-2-2015 | | | | 2,500,000 | | | | 2,499,620 | |
Liberty Street Funding LLC (p)(z) | | | 0.27 | | | | 10-13-2015 | | | | 7,000,000 | | | | 6,997,784 | |
LMA Americas LLC (p)(z) | | | 0.25 | | | | 10-9-2015 | | | | 3,000,000 | | | | 2,999,166 | |
Mountcliff Funding LLC (p)(z) | | | 0.24 | | | | 10-5-2015 | | | | 4,350,000 | | | | 4,348,972 | |
Prudential plc (z) | | | 0.15 | | | | 9-23-2015 | | | | 5,000,000 | | | | 4,999,508 | |
Ridgefield Funding Company LLC (p)(z) | | | 0.17 | | | | 9-2-2015 | | | | 5,500,000 | | | | 5,499,948 | |
Sumitomo Mitsui Trust NY (z) | | | 0.22 | | | | 10-13-2015 | | | | 4,000,000 | | | | 3,998,963 | |
Suncorp-Metway Limited (z) | | | 0.17 | | | | 10-6-2015 | | | | 2,000,000 | | | | 1,999,652 | |
Suncorp-Metway Limited (z) | | | 0.30 | | | | 1-5-2016 | | | | 3,500,000 | | | | 3,496,308 | |
| | | | |
| | | | | | | | | | | | | | | 65,234,510 | |
| | | | | | | | | | | | | | | | |
| | | | |
| | | Yield | | | | | | Shares | | | | |
| Investment Companies: 0.57% | | | | | | | | | | | | | | | | |
Wells Fargo Advantage Cash Investment Money Market Fund, Select Class (l)(u) | | | 0.15 | | | | | | | | 1,920,819 | | | | 1,920,819 | |
| | | | | | | | | | | | | | | | |
| | | | |
| | | | | | | | | Principal | | | | |
| U.S. Treasury Securities: 0.01% | | | | | | | | | | | | | | | | |
U.S. Treasury Bill (z)# | | | 0.01 | | | | 9-17-2015 | | | $ | 30,000 | | | | 30,000 | |
| | | | | | | | | | | | | | | | |
| | | | |
Total Short-Term Investments (Cost $69,203,972) | | | | | | | | | | | | | | | 69,184,735 | |
| | | | | | | | | | | | | | | | |
| | | | | | | | |
| Total investments in securities (Cost $332,258,626) * | | | 98.66 | % | | | 332,096,292 | |
Other assets and liabilities, net | | | 1.34 | | | | 4,512,201 | |
| | | | | | | | |
| Total net assets | | | 100.00 | % | | $ | 336,608,493 | |
| | | | | | | | |
The accompanying notes are an integral part of these financial statements.
| | | | | | |
| Portfolio of investments—August 31, 2015 | | Wells Fargo Advantage Conservative Income Fund | | | 15 | |
| 144A | The security may be resold in transactions exempt from registration, normally to qualified institutional buyers, pursuant to Rule 144A under the Securities Act of 1933. |
| ± | Variable rate investment. The rate shown is the rate in effect at period end. |
| (p) | Asset-backed commercial paper |
| (z) | Zero coupon security. The rate represents the current yield to maturity. |
| # | All or a portion of this security is segregated as collateral for investments in derivative instruments. |
| (l) | The security represents an affiliate of the Fund as defined in the Investment Company Act of 1940. |
| (u) | The rate represents the 7-day annualized yield at period end. |
| * | Cost for federal income tax purposes is $332,260,241 and unrealized gains (losses) consists of: |
| | | | |
Gross unrealized gains | | $ | 144,679 | |
Gross unrealized losses | | | (308,628 | ) |
| | | | |
Net unrealized losses | | $ | (163,949 | ) |
The accompanying notes are an integral part of these financial statements.
| | | | |
| 16 | | Wells Fargo Advantage Conservative Income Fund | | Statement of assets and liabilities—August 31, 2015 |
| | | | |
| | | | |
| |
Assets | | | | |
Investments | | | | |
In unaffiliated securities, at value (cost $330,337,807) | | $ | 330,175,473 | |
In affiliated securities, at value (cost $1,920,819) | | | 1,920,819 | |
| | | | |
Total investments, at value (cost $332,258,626) | | | 332,096,292 | |
Receivable for investments sold | | | 4,241,737 | |
Receivable for interest | | | 879,147 | |
Receivable for daily variation margin on open futures contracts | | | 4,375 | |
Prepaid expenses and other assets | | | 41,087 | |
| | | | |
Total assets | | | 337,262,638 | |
| | | | |
| |
Liabilities | | | | |
Dividends payable | | | 48,742 | |
Payable for Fund shares redeemed | | | 500,000 | |
Management fee payable | | | 39,083 | |
Administration fee payable | | | 22,823 | |
Accrued expenses and other liabilities | | | 43,497 | |
| | | | |
Total liabilities | | | 654,145 | |
| | | | |
Total net assets | | $ | 336,608,493 | |
| | | | |
| |
NET ASSETS CONSIST OF | | | | |
Paid-in capital | | $ | 336,829,356 | |
Undistributed net investment income | | | 6,466 | |
Accumulated net realized losses on investments | | | (89,290 | ) |
Net unrealized losses on investments | | | (138,039 | ) |
| | | | |
Total net assets | | $ | 336,608,493 | |
| | | | |
| |
COMPUTATION OF NET ASSET VALUE PER SHARE | | | | |
Net assets – Institutional Class | | $ | 336,608,493 | |
Shares outstanding – Institutional Class1 | | | 33,667,225 | |
Net asset value per share – Institutional Class | | | $10.00 | |
| 1 | The Fund has an unlimited number of authorized shares. |
The accompanying notes are an integral part of these financial statements.
| | | | | | |
| Statement of operations—year ended August 31, 2015 | | Wells Fargo Advantage Conservative Income Fund | | | 17 | |
| | | | |
| | | | |
| |
Investment income | | | | |
Interest (net of foreign interest withholding taxes of $2,299) | | $ | 1,781,534 | |
Income from affiliated securities | | | 1,392 | |
| | | | |
Total investment income | | | 1,782,926 | |
| | | | |
| |
Expenses | | | | |
Management fee | | | 598,278 | |
Administration fee | | | 191,449 | |
Custody and accounting fees | | | 20,395 | |
Professional fees | | | 39,237 | |
Registration fees | | | 28,854 | |
Shareholder report expenses | | | 17,688 | |
Trustees’ fees and expenses | | | 17,761 | |
Other fees and expenses | | | 6,029 | |
| | | | |
Total expenses | | | 919,691 | |
Less: Fee waivers and/or expense reimbursements | | | (273,552 | ) |
| | | | |
Net expenses | | | 646,139 | |
| | | | |
Net investment income | | | 1,136,787 | |
| | | | |
| |
REALIZED AND UNREALIZED GAINS (LOSSES) ON INVESTMENTS | | | | |
| |
Net realized losses on: | | | | |
Unaffiliated securities | | | (4,330 | ) |
Futures transactions | | | (87,876 | ) |
| | | | |
Net realized losses on investments | | | (92,206 | ) |
| | | | |
| |
Net change in unrealized gains (losses) on: | | | | |
Unaffiliated securities | | | (335,993 | ) |
Futures transactions | | | 27,605 | |
| | | | |
Net change in unrealized gains (losses) on investments | | | (308,388 | ) |
| | | | |
Net realized and unrealized gains (losses) on investments | | | (400,594 | ) |
| | | | |
Net increase in net assets resulting from operations | | $ | 736,193 | |
| | | | |
The accompanying notes are an integral part of these financial statements.
| | | | |
| 18 | | Wells Fargo Advantage Conservative Income Fund | | Statement of changes in net assets |
| | | | | | | | | | | | | | | | |
| | | Year ended August 31, 2015 | | | Year ended August 31, 2014 | |
| | | | |
Operations | | | | | | | | | | | | | | | | |
Net investment income | | | | | | $ | 1,136,787 | | | | | | | $ | 521,040 | |
Net realized gains (losses) on investments | | | | | | | (92,206 | ) | | | | | | | 36,110 | |
Net change in unrealized gains (losses) on investments | | | | | | | (308,388 | ) | | | | | | | 228,803 | |
| | | | |
Net increase in net assets resulting from operations | | | | | | | 736,193 | | | | | | | | 785,953 | |
| | | | |
| | | | |
Distributions to shareholders from | | | | | | | | | | | | | | | | |
Net investment income | | | | | | | | | | | | | | | | |
Institutional Class | | | | | | | (1,128,996 | ) | | | | | | | (522,365 | ) |
Net realized gains | | | | | | | | | | | | | | | | |
Institutional Class | | | | | | | (9,602 | ) | | | | | | | (10,290 | ) |
| | | | |
Total distributions to shareholders | | | | | | | (1,138,598 | ) | | | | | | | (532,655 | ) |
| | | | |
| | | | |
Capital share transactions | | | Shares | | | | | | | | Shares | | | | | |
Proceeds from shares sold | | | | | | | | | | | | | | | | |
Institutional Class | | | 27,133,297 | | | | 271,477,199 | | | | 17,611,286 | | | | 176,332,163 | |
Reinvestment of distributions | | | | | | | | | | | | | | | | |
Institutional Class | | | 73,619 | | | | 736,530 | | | | 44,616 | | | | 446,908 | |
Payment for shares redeemed | | | | | | | | | | | | | | | | |
Institutional Class | | | (7,856,856 | ) | | | (78,621,317 | ) | | | (8,344,325 | ) | | | (83,597,346 | ) |
| | | | |
Net increase in net assets resulting from capital share transactions | | | | | | | 193,592,412 | | | | | | | | 93,181,725 | |
| | | | |
Total increase in net assets | | | | | | | 193,190,007 | | | | | | | | 93,435,023 | |
| | | | |
| | | | |
Net assets | | | | | | | | | | | | | | | | |
Beginning of period | | | | | | | 143,418,486 | | | | | | | | 49,983,463 | |
| | | | |
End of period | | | | | | $ | 336,608,493 | | | | | | | $ | 143,418,486 | |
| | | | |
Undistributed (overdistributed) net investment income | | | | | | $ | 6,466 | | | | | | | $ | (1,325 | ) |
| | | | |
The accompanying notes are an integral part of these financial statements.
| | | | | | |
| Financial highlights | | Wells Fargo Advantage Conservative Income Fund | | | 19 | |
(For a share outstanding throughout each period)
| | | | | | | | | | | | |
| | | Year ended August 31 | |
| INSTITUTIONAL CLASS | | 2015 | | | 2014 | | | 20131 | |
Net asset value, beginning of period | | | $10.02 | | | | $9.99 | | | | $10.00 | |
Net investment income | | | 0.05 | | | | 0.04 | | | | 0.01 | |
Net realized and unrealized gains (losses) on investments | | | (0.02 | ) | | | 0.03 | | | | (0.01 | ) |
| | | | | | | | | | | | |
Total from investment operations | | | 0.03 | | | | 0.07 | | | | 0.00 | |
Distributions to shareholders from | | | | | | | | | | | | |
Net investment income | | | (0.05 | ) | | | (0.04 | ) | | | (0.01 | ) |
Net realized gains | | | (0.00 | )2 | | | (0.00 | )2 | | | 0.00 | |
| | | | | | | | | | | | |
Total distributions to shareholders | | | (0.05 | ) | | | (0.04 | ) | | | (0.01 | ) |
Net asset value, end of period | | | $10.00 | | | | $10.02 | | | | $9.99 | |
Total return3 | | | 0.28 | % | | | 0.74 | % | | | 0.01 | % |
Ratios to average net assets (annualized) | | | | | | | | | | | | |
Gross expenses | | | 0.38 | % | | | 0.43 | % | | | 0.74 | % |
Net expenses | | | 0.27 | % | | | 0.27 | % | | | 0.27 | % |
Net investment income | | | 0.48 | % | | | 0.44 | % | | | 0.44 | % |
Supplemental data | | | | | | | | | | | | |
Portfolio turnover rate | | | 80 | % | | | 55 | % | | | 10 | % |
Net assets, end of period (000s omitted) | | | $336,608 | | | | $143,418 | | | | $49,983 | |
| 1 | For the period from May 31, 2013 (commencement of class operations) to August 31, 2013 |
| 2 | Amount is less than $0.005. |
| 3 | Returns for periods of less than one year are not annualized. |
The accompanying notes are an integral part of these financial statements.
| | | | |
| 20 | | Wells Fargo Advantage Conservative Income Fund | | Notes to financial statements |
1. ORGANIZATION
Wells Fargo Funds Trust (the “Trust”), a Delaware statutory trust organized on March 10, 1999, is an open-end management investment company registered under the Investment Company Act of 1940, as amended (the “1940 Act”). As an investment company, the Trust follows the accounting and reporting guidance in Financial Accounting Standards Board (“FASB”) Accounting Standards Codification Topic 946, Financial Services – Investment Companies. These financial statements report on the Wells Fargo Advantage Conservative Income Fund (the “Fund”) which is a diversified series of the Trust.
2. SIGNIFICANT ACCOUNTING POLICIES
The following significant accounting policies, which are consistently followed in the preparation of the financial statements of the Fund, are in conformity with U.S. generally accepted accounting principles which require management to make estimates and assumptions that affect the reported amounts of assets and liabilities, disclosure of contingent assets and liabilities at the date of the financial statements, and the reported amounts of revenues and expenses during the reporting period. Actual results could differ from those estimates.
Securities valuation
All investments are valued each business day as of the close of regular trading on the New York Stock Exchange (generally 4 p.m. Eastern Time).
Debt securities are valued at the evaluated bid price provided by an independent pricing service or, if a reliable price is not available, the quoted bid price from an independent broker-dealer.
Futures that are listed on a foreign or domestic exchange or market are valued at the official closing price or, if none, the last sales price.
Investments in registered open-end investment companies are valued at net asset value.
Investments which are not valued using any of the methods discussed above are valued at their fair value, as determined in good faith by the Board of Trustees of the Fund. The Board of Trustees has established a Valuation Committee comprised of the Trustees and has delegated to it the authority to take any actions regarding the valuation of portfolio securities that the Valuation Committee deems necessary or appropriate, including determining the fair value of portfolio securities, unless the determination has been delegated to the Management Valuation Team of Wells Fargo Funds Management, LLC (“Funds Management”). The Board of Trustees retains the authority to make or ratify any valuation decisions or approve any changes to the Valuation Procedures as it deems appropriate. On a quarterly basis, the Board of Trustees receives reports on any valuation actions taken by the Valuation Committee or the Management Valuation Team which may include items for ratification.
Valuations of fair valued securities are compared to the next actual sales price when available, or other appropriate market values, to assess the continued appropriateness of the fair valuation methodologies used. These securities are fair valued on a day-to-day basis, taking into consideration changes to appropriate market information and any significant changes to the inputs considered in the valuation process until there is a readily available price provided on an exchange or by an independent pricing service. Valuations received from an independent pricing service or independent broker-dealer quotes are periodically validated by comparisons to most recent trades and valuations provided by other independent pricing services in addition to the review of prices by the manager and/or subadviser. Unobservable inputs used in determining fair valuations are identified based on the type of security, taking into consideration factors utilized by market participants in valuing the investment, knowledge about the issuer and the current market environment.
When-issued transactions
The Fund may purchase securities on a forward commitment or when-issued basis. The Fund records a when-issued transaction on the trade date and will segregate assets in an amount at least equal in value to the Fund’s commitment to purchase when-issued securities. Securities purchased on a when-issued basis are marked-to-market daily and the Fund begins earning interest on the settlement date. Losses may arise due to changes in the market value of the underlying securities or if the counterparty does not perform under the contract.
Futures contracts
The Fund is subject to interest rate risk in the normal course of pursuing its investment objectives. The Fund may buy and sell futures contracts in order to gain exposure to, or protect against, changes in security values and interest rates. The primary risks associated with the use of futures contracts are the imperfect correlation between changes in market values of securities held by the Fund and the prices of futures contracts, and the possibility of an illiquid market.
| | | | | | |
| Notes to financial statements | | Wells Fargo Advantage Conservative Income Fund | | | 21 | |
The aggregate principal amounts of the contracts are not recorded in the financial statements. Fluctuations in the value of the contracts are recorded in the Statement of Assets and Liabilities as an asset or liability and in the Statement of Operations as unrealized gains or losses until the contracts are closed, at which point they are recorded as net realized gains or losses on futures contracts. With futures contracts, there is minimal counterparty risk to the Fund since futures are exchange traded and the exchange’s clearinghouse, as counterparty to all exchange traded futures, guarantees the futures against default.
Security transactions and income recognition
Securities transactions are recorded on a trade date basis. Realized gains or losses are recorded on the basis of identified cost.
Interest income is accrued daily and bond discounts are accreted and premiums are amortized daily based on the effective interest method. To the extent debt obligations are placed on non-accrual status, any related interest income may be reduced by writing off interest receivables when the collection of all or a portion of interest has become doubtful based on consistently applied procedures. If the issuer subsequently resumes interest payments or when the collectability of interest is reasonably assured, the debt obligation is removed from non-accrual status.
Income from foreign securities is recorded net of foreign taxes withheld where recovery of such taxes is not assured.
Distributions to shareholders
Distributions to shareholders from net investment income are accrued daily and paid monthly. Distributions from net realized gains, if any, are recorded on the ex-dividend date. Such distributions are determined in conformity with federal income tax regulations, which may differ in amount or character from net investment income and realized gains recognized for purposes of U.S. generally accepted accounting principles.
Federal and other taxes
The Fund intends to qualify as a regulated investment company by distributing substantially all of its investment company taxable income and any net realized capital gains (after reduction for capital loss carryforwards) sufficient to relieve it from all, or substantially all, federal income taxes. Accordingly, no provision for federal income taxes was required.
The Fund’s income and federal excise tax returns and all financial records supporting those returns for the prior three fiscal years are subject to examination by the federal and Delaware revenue authorities. Management has analyzed the Fund’s tax positions taken on federal, state, and foreign tax returns for all open tax years and does not believe that there are any uncertain tax positions that require recognition of a tax liability.
Reclassifications are made to the Fund’s capital accounts for permanent tax differences to reflect income and gains available for distribution (or available capital loss carryforwards) under federal income tax regulations. U.S. generally accepted accounting principles require that certain components of net assets be adjusted to reflect permanent differences between financial and tax reporting. These reclassifications have no effect on net assets or net asset values per share. At August 31, 2015, as a result of permanent book-to-tax differences, the following reclassification adjustments were made on the Statement of Assets and Liabilities:
| | |
| Paid-in capital | | Accumulated net realized losses on investments |
| $(130) | | $130 |
As of August 31, 2015, the Fund had capital loss carryforwards which consist of $24,859 in short-term capital losses and $38,521 in long-term capital losses.
3. FAIR VALUATION MEASUREMENTS
Fair value measurements of investments are determined within a framework that has established a fair value hierarchy based upon the various data inputs utilized in determining the value of the Fund’s investments. The three-level hierarchy gives the highest priority to unadjusted quoted prices in active markets for identical assets or liabilities (Level 1) and the lowest priority to significant unobservable inputs (Level 3). The Fund’s investments are classified within the fair value hierarchy based on the lowest level of input that is significant to the fair value measurement. The inputs are summarized into three broad levels as follows:
| n | | Level 1 – quoted prices in active markets for identical securities |
| n | | Level 2 – other significant observable inputs (including quoted prices for similar securities, interest rates, prepayment speeds, credit risk, use of amortized cost, etc.) |
| n | | Level 3 – significant unobservable inputs (including the Fund’s own assumptions in determining the fair value of investments) |
| | | | |
| 22 | | Wells Fargo Advantage Conservative Income Fund | | Notes to financial statements |
The inputs or methodologies used for valuing investments in securities are not necessarily an indication of the risk associated with investing in those securities.
The following is a summary of the inputs used in valuing the Fund’s assets and liabilities as of August 31, 2015:
| | | | | | | | | | | | | | | | |
| | | Quoted prices (Level 1) | | | Other significant observable inputs (Level 2) | | | Significant unobservable inputs (Level 3) | | | Total | |
Assets | | | | | | | | | | | | | | | | |
Investments in: | | | | | | | | | | | | | | | | |
| | | | |
Asset-backed securities | | $ | 0 | | | $ | 73,858,119 | | | $ | 0 | | | $ | 73,858,119 | |
| | | | |
Corporate bonds and notes | | | 0 | | | | 79,164,500 | | | | 0 | | | | 79,164,500 | |
| | | | |
Municipal obligations | | | 0 | | | | 31,059,075 | | | | 0 | | | | 31,059,075 | |
| | | | |
Non-agency mortgage-backed securities | | | 0 | | | | 9,654,475 | | | | 0 | | | | 9,654,475 | |
| | | | |
Yankee corporate bonds and notes | | | 0 | | | | 69,175,388 | | | | 0 | | | | 69,175,388 | |
| | | | |
Short-term investments | | | | | | | | | | | | | | | | |
Certificates of deposit | | | 0 | | | | 1,999,406 | | | | 0 | | | | 1,999,406 | |
Commercial paper | | | 0 | | | | 65,234,510 | | | | 0 | | | | 65,234,510 | |
Investment companies | | | 1,920,819 | | | | 0 | | | | 0 | | | | 1,920,819 | |
U.S. Treasury securities | | | 30,000 | | | | 0 | | | | 0 | | | | 30,000 | |
| | $ | 1,950,819 | | | $ | 330,145,473 | | | $ | 0 | | | $ | 332,096,292 | |
| | | | |
Futures contracts | | | 4,375 | | | | 0 | | | | 0 | | | | 4,375 | |
Total assets | | $ | 1,955,194 | | | $ | 330,145,473 | | | $ | 0 | | | $ | 332,100,667 | |
Futures contracts are reported at their variation margin at measurement date, which represents the amount due to the Fund at that date. All other assets and liabilities are reported at their market value at measurement date.
The Fund recognizes transfers between levels within the fair value hierarchy at the end of the reporting period. At August 31, 2015, the Fund did not have any transfers into/out of Level 1, Level 2, or Level 3.
4. TRANSACTIONS WITH AFFILIATES
Management fee
Funds Management, an indirect wholly owned subsidiary of Wells Fargo & Company (“Wells Fargo”), is the manager of the Fund and provides advisory and fund-level administrative services under an investment management agreement. Under the investment management agreement, Funds Management is responsible for, among other services, implementing the investment objectives and strategies of the Fund, supervising the applicable subadviser, providing fund-level administrative services in connection with the Fund’s operations, and providing any other fund-level administrative services reasonably necessary for the operation of the Fund. As compensation for its services under the investment management agreement, Funds Management is entitled to receive an annual management fee starting at 0.25% and declining to 0.18% as the average daily net assets of the Fund increase.
Prior to July 1, 2015, Funds Management provided advisory services pursuant to an investment advisory agreement and was entitled to receive an annual fee which started at 0.20% and declined to 0.15% as the average daily net assets of the Fund increased. In addition, fund-level administrative services were provided by Funds Management under a separate administration agreement at an annual fee which started at 0.05% and declined to 0.03% as the average daily net assets of the Fund increased. For financial statement purposes, the advisory fee and fund-level administration fee for the year ended August 31, 2015 have been included in management fee on the Statement of Operations.
For the year ended August 31, 2015, the management fee was equivalent to an annual rate of 0.25% of the Fund’s average daily net assets.
Funds Management has retained the services of a subadviser to provide daily portfolio management to the Fund. The fee for subadvisory services is borne by Funds Management. Wells Capital Management Incorporated, an affiliate of Funds Management and an indirect wholly owned subsidiary of Wells Fargo, is the subadviser to the Fund and is entitled to receive a fee from Funds Management at an annual rate starting at 0.10% and declining to 0.05% as the average daily net assets of the Fund increase.
| | | | | | |
| Notes to financial statements | | Wells Fargo Advantage Conservative Income Fund | | | 23 | |
Administration fee
Under a class-level administration agreement, Funds Management provides class-level administrative services to the Fund, which includes paying fees and expenses for services provided by the transfer agent, sub-transfer agents, omnibus account servicers and record-keepers. As compensation for its services under the class-level administration agreement, Funds Management receives an annual fee of 0.08% which is calculated based on its average daily net assets.
Funds Management has contractually waived and/or reimbursed management and administration fees to the extent necessary to maintain certain net operating expense ratios for the Fund. Waiver of fees and/or reimbursement of expenses by Funds Management were made first from fund level expenses on a proportionate basis and then from class specific expenses. Funds Management has committed through December 31, 2015 to waive fees and/or reimburse expenses to the extent necessary to cap the Fund’s expenses at 0.27% for Institutional Class shares. After this time, the cap may be increased or the commitment to maintain the cap may be terminated only with the approval of the Board of Trustees.
5. INVESTMENT PORTFOLIO TRANSACTIONS
Purchases and sales of investments, excluding U.S. government obligations (if any) and short-term securities, for the year ended August 31, 2015 were $422,446,177 and $167,163,436, respectively.
6. DERIVATIVE TRANSACTIONS
During the year ended August 31, 2015, the Fund entered into futures contracts to speculate on interest rates and to help manage the duration of the portfolio.
At August 31, 2015, the Fund had short futures contracts outstanding as follows:
| | | | | | | | | | |
| Expiration date | | Counterparty | | Contracts | | Type | | Contract value at August 31, 2015 | | Unrealized gains |
| 12-31-2015 | | JPMorgan | | 40 Short | | 2-Year U.S. Treasury Notes | | $8,738,750 | | $24,295 |
The Fund had an average notional amount of $5,804,165 in short futures contracts during the year ended August 31, 2015.
On August 31, 2015, the cumulative unrealized gains on futures contracts in the amount of $24,295 are reflected in net unrealized losses on investments on the Statement of Assets and Liabilities. The receivable for daily variation margin on open futures contracts reflected in the Statement of Assets and Liabilities only represents the current day’s variation margin. The realized losses and change in unrealized gains (losses) on futures contracts are reflected in the Statement of Operations.
For certain types of derivative transactions, the Fund has entered into International Swaps and Derivatives Association, Inc. master agreements (“ISDA Master Agreements”) or similar agreements with approved counterparties. The ISDA Master Agreements or similar agreements may have requirements to deliver/deposit securities or cash to/with an exchange or broker-dealer as collateral and allows the Fund to offset, with each counterparty, certain derivative financial instrument’s assets and/or liabilities with collateral held or pledged. Collateral requirements differ by type of derivative. Collateral or margin requirements are set by the broker or exchange clearing house for exchange traded derivatives while collateral terms are contract specific for over-the-counter traded derivatives. Cash collateral that has been pledged to cover obligations of the Fund under ISDA Master Agreements or similar agreements, if any, will be reported separately in the Statement of Assets and Liabilities. Securities pledged as collateral, if any, for the same purpose are noted in the Portfolio of Investments. With respect to balance sheet offsetting, absent an event of default by the counterparty or a termination of the agreement, the reported amounts of financial assets and financial liabilities in the Statement of Assets and Liabilities are not offset across transactions between the Fund and the applicable counterparty. A reconciliation of the gross amounts on the Statement of Assets and Liabilities to the net amounts by derivative type, including any collateral exposure, is as follows:
| | | | | | | | | | | | | | | | |
| Derivative type | | Counterparty | | Gross amounts of assets in the Statement of Assets and Liabilities | | Amounts subject to netting agreements | | | Collateral received | | | Net amount of assets | |
Futures – variation margin | | JPMorgan | | $4,375 | | $ | 0 | | | $ | 0 | | | $ | 4,375 | |
| | | | |
| 24 | | Wells Fargo Advantage Conservative Income Fund | | Notes to financial statements |
7. BANK BORROWINGS
The Trust (excluding the money market funds and certain other funds in the Trust) and Wells Fargo Variable Trust are parties to a $150,000,000 revolving credit agreement, whereby the Fund is permitted to use bank borrowings for temporary or emergency purposes, such as to fund shareholder redemption requests. Interest under the credit agreement is charged to the Fund based on a borrowing rate equal to the higher of the Federal Funds rate in effect on that day plus 1.25% or the overnight LIBOR rate in effect on that day plus 1.25%. In addition, an annual commitment fee equal to 0.10% of the unused balance is allocated to each participating fund. For the year ended August 31, 2015, the Fund paid $220 in commitment fees.
For the year ended August 31, 2015, there were no borrowings by the Fund under the agreement.
8. DISTRIBUTIONS TO SHAREHOLDERS
The tax character of distributions paid was $1,138,598 and $532,655 of ordinary income for the years ended August 31, 2015 and August 31, 2014, respectively.
As of August 31, 2015, the components of distributable earnings on a tax basis were as follows:
| | | | |
Undistributed ordinary income | | Unrealized losses | | Capital loss carryforward |
| $55,208 | | $(163,949) | | $(63,380) |
9. INDEMNIFICATION
Under the Trust’s organizational documents, the officers and Trustees have been granted certain indemnification rights against certain liabilities that may arise out of performance of their duties to the Trust. Additionally, in the normal course of business, the Trust may enter into contracts with service providers that contain a variety of indemnification clauses. The Trust’s maximum exposure under these arrangements is dependent on future claims that may be made against the Fund and, therefore, cannot be estimated.
| | | | | | |
| Report of independent registered public accounting firm | | Wells Fargo Advantage Conservative Income Fund | | | 25 | |
BOARD OF TRUSTEES AND SHAREHOLDERS OF WELLS FARGO FUNDS TRUST:
We have audited the accompanying statement of assets and liabilities, including the portfolio of investments, of the Wells Fargo Advantage Conservative Income Fund (the “Fund”), one of the funds constituting the Wells Fargo Funds Trust, as of August 31, 2015, and the related statement of operations for the year then ended, the statements of changes in net assets for each of the years in the two-year period then ended, and the financial highlights for each of the years or periods in the three-year period then ended. These financial statements and financial highlights are the responsibility of the Fund’s management. Our responsibility is to express an opinion on these financial statements and financial highlights based on our audits.
We conducted our audits in accordance with the standards of the Public Company Accounting Oversight Board (United States). Those standards require that we plan and perform the audit to obtain reasonable assurance about whether the financial statements and financial highlights are free of material misstatement. An audit includes examining, on a test basis, evidence supporting the amounts and disclosures in the financial statements. Our procedures included confirmation of securities owned as of August 31, 2015, by correspondence with the custodian and brokers, or by other appropriate auditing procedures. An audit also includes assessing the accounting principles used and significant estimates made by management, as well as evaluating the overall financial statement presentation. We believe that our audits provide a reasonable basis for our opinion.
In our opinion, the financial statements and financial highlights referred to above present fairly, in all material respects, the financial position of the Wells Fargo Advantage Conservative Income Fund as of August 31, 2015, the results of its operations for the year then ended, the changes in its net assets for each of the years in the two-year period then ended, and the financial highlights for each of the years or periods in the three-year period then ended, in conformity with U.S. generally accepted accounting principles.

Boston, Massachusetts
October 26, 2015
| | | | |
| 26 | | Wells Fargo Advantage Conservative Income Fund | | Other information (unaudited) |
TAX INFORMATION
For the fiscal year ended August 31, 2015, $772,551 has been designated as interest-related dividends for nonresident alien shareholders pursuant to Section 871 of the Internal Revenue Code.
For the fiscal year ended August 31, 2015, $9,472 has been designated as short-term capital gain dividends for nonresident alien shareholders pursuant to Section 871 of the Internal Revenue Code.
PROXY VOTING INFORMATION
A description of the policies and procedures that the Fund uses to determine how to vote proxies relating to portfolio securities is available, upon request, by calling 1-800-222-8222, visiting our website at wellsfargoadvantagefunds.com, or visiting the SEC website at sec.gov. Information regarding how the Fund voted proxies relating to portfolio securities during the most recent 12-month period ended June 30 is available on the Fund’s website at wellsfargoadvantagefunds.com or by visiting the SEC website at sec.gov.
PORTFOLIO HOLDINGS INFORMATION
The complete portfolio holdings for the Fund are publicly available monthly on the Fund’s website (wellsfargoadvantagefunds.com), on a one-month delayed basis. In addition, top ten holdings information (excluding derivative positions) for the Fund is publicly available on the Fund’s website on a monthly, seven-day or more delayed basis. The Fund files its complete schedule of portfolio holdings with the SEC for the first and third quarters of each fiscal year on Form N-Q, which is available by visiting the SEC website at sec.gov. In addition, the Fund’s Form N-Q may be reviewed and copied at the SEC’s Public Reference Room in Washington, DC, and at regional offices in New York City, at 233 Broadway, and in Chicago, at 175 West Jackson Boulevard, Suite 900. Information about the Public Reference Room may be obtained by calling 1-800-SEC-0330.
| | | | | | |
| Other information (unaudited) | | Wells Fargo Advantage Conservative Income Fund | | | 27 | |
BOARD OF TRUSTEES AND OFFICERS
Each of the Trustees and Officers1 listed in the table below acts in identical capacities for each fund in the Wells Fargo Advantage family of funds, which consists of 133 mutual funds comprising the Wells Fargo Funds Trust, Wells Fargo Variable Trust, Wells Fargo Master Trust and four closed-end funds (collectively the “Fund Complex”). This table should be read in conjunction with the Prospectus and the Statement of Additional Information2. The mailing address of each Trustee and Officer is 525 Market Street, 12th Floor, San Francisco, CA 94105. Each Trustee and Officer serves an indefinite term, however, each Trustee serves such term until reaching the mandatory retirement age established by the Trustees.
Independent Trustees
| | | | | | |
Name and year of birth | | Position held and length of service* | | Principal occupations during past five years or longer | | Other public company or
investment company
directorships during
past 5 years |
William R. Ebsworth (Born 1957) | | Trustee, since 2015** | | Retired. From 1984 to 2013, equities analyst, portfolio manager, research director at Fidelity Management and Research Company and retired in 2013 as Chief Investment Officer of Fidelity Strategic Advisers, Inc. in Boston, Tokyo, and Hong Kong where he led a team of investment professionals managing client assets. Prior thereto, Board member of Hong Kong Securities Clearing Co., Hong Kong Options Clearing Corp., the Thailand International Fund, Ltd., Fidelity Investments Life Insurance Company, and Empire Fidelity Investments Life Insurance Company. Mr. Ebsworth is a CFA ® charterholder and an Adjunct Lecturer, Finance, at Babson College. | | Asset Allocation Trust |
Jane A. Freeman (Born 1953) | | Trustee, since 2015** | | Retired. From 2012 to 2014 and 1999 to 2008, Chief Financial Officer of Scientific Learning Corporation. From 2008 to 2012, Ms. Freeman provided consulting services related to strategic business projects. Prior to 1999, Portfolio Manager at Rockefeller & Co. and Scudder, Stevens & Clark. Board member of the Harding Loevner Funds from 1996 to 2014, serving as both Lead Independent Director and chair of the Audit Committee. Board member of the Russell Exchange Traded Funds Trust from 2011 to 2012 and the chair of the Audit Committee. Ms. Freeman is Chair of Taproot Foundation (non-profit organization), a Board Member of Ruth Bancroft Garden (non-profit organization) and an inactive chartered financial analyst. | | Asset Allocation Trust; Harding Loevner Funds; Russell Exchange Traded Funds Trust |
Peter G. Gordon (Born 1942) | | Trustee, since 1998; Chairman, since 2005 | | Co-Founder, Retired Chairman, President and CEO of Crystal Geyser Water Company. Trustee Emeritus, Colby College. | | Asset Allocation Trust |
Isaiah Harris, Jr. (Born 1952) | | Trustee, since 2009 | | Retired. Chairman of the Board of CIGNA Corporation since 2009, and Director since 2005. From 2003 to 2011, Director of Deluxe Corporation. Prior thereto, President and CEO of BellSouth Advertising and Publishing Corp. from 2005 to 2007, President and CEO of BellSouth Enterprises from 2004 to 2005 and President of BellSouth Consumer Services from 2000 to 2003. Emeritus member of the Iowa State University Foundation Board of Governors. Emeritus Member of the Advisory Board of Iowa State University School of Business. Advisory Board Member, Palm Harbor Academy (charter school). Mr. Harris is a certified public accountant. | | CIGNA Corporation; Asset Allocation Trust |
Judith M. Johnson (Born 1949) | | Trustee, since 2008; Audit Committee Chairman, since 2008 | | Retired. Prior thereto, Chief Executive Officer and Chief Investment Officer of Minneapolis Employees Retirement Fund from 1996 to 2008. Ms. Johnson is an attorney, certified public accountant and a certified managerial accountant. | | Asset Allocation Trust |
David F. Larcker (Born 1950) | | Trustee, since 2009 | | James Irvin Miller Professor of Accounting at the Graduate School of Business, Stanford University, Morgan Stanley Director of the Center for Leadership Development and Research and Senior Faculty of The Rock Center for Corporate Governance since 2006. From 2005 to 2008, Professor of Accounting at the Graduate School of Business, Stanford University. Prior thereto, Ernst & Young Professor of Accounting at The Wharton School, University of Pennsylvania from 1985 to 2005. | | Asset Allocation Trust |
| | | | |
| 28 | | Wells Fargo Advantage Conservative Income Fund | | Other information (unaudited) |
| | | | | | |
Name and year of birth | | Position held and length of service* | | Principal occupations during past five years or longer | | Other public company or
investment company
directorships during
past 5 years |
Olivia S. Mitchell (Born 1953) | | Trustee, since 2006 | | International Foundation of Employee Benefit Plans Professor, Wharton School of the University of Pennsylvania since 1993. Director of Wharton’s Pension Research Council and Boettner Center on Pensions & Retirement Research, and Research Associate at the National Bureau of Economic Research. Previously, Cornell University Professor from 1978 to 1993. | | Asset Allocation Trust |
Timothy J. Penny (Born 1951) | | Trustee, since 1996 | | President and Chief Executive Officer of Southern Minnesota Initiative Foundation, a non-profit organization, since 2007 and Senior Fellow at the Humphrey Institute Policy Forum at the University of Minnesota since 1995. Member of the Board of Trustees of NorthStar Education Finance, Inc., a non-profit organization, since 2007. | | Asset Allocation Trust |
Michael S. Scofield (Born 1943) | | Trustee, since 2010 | | Served on the Investment Company Institute’s Board of Governors and Executive Committee from 2008-2011 as well the Governing Council of the Independent Directors Council from 2006-2011 and the Independent Directors Council Executive Committee from 2008-2011. Chairman of the IDC from 2008-2010. Institutional Investor (Fund Directions) Trustee of Year in 2007. Trustee of the Evergreen Funds complex (and its predecessors) from 1984 to 2010. Chairman of the Evergreen Funds from 2000-2010. Former Trustee of the Mentor Funds. Retired Attorney, Law Offices of Michael S. Scofield. | | Asset Allocation Trust |
Donald C. Willeke (Born 1940) | | Trustee, since 1996 | | Principal of the law firm of Willeke & Daniels. General Counsel of the Minneapolis Employees Retirement Fund from 1984 until its consolidation into the Minnesota Public Employees Retirement Association on June 30, 2010. Director and Vice Chair of The Tree Trust (non-profit corporation). Director of the American Chestnut Foundation (non-profit corporation). | | Asset Allocation Trust |
| * | Length of service dates reflect the Trustee’s commencement of service with the Trust’s predecessor entities, where applicable. |
| ** | William R. Ebsworth and Jane A. Freeman each became a Trustee effective January 1, 2015. |
Officers
| | | | | | |
Name and year of birth | | Position held and length of service | | Principal occupations during past five years or longer | | |
Karla M. Rabusch (Born 1959) | | President, since 2003 | | Executive Vice President of Wells Fargo Bank, N.A. and President of Wells Fargo Funds Management, LLC since 2003. | | |
Nancy Wiser1 (Born 1967) | | Treasurer, since 2012 | | Executive Vice President of Wells Fargo Funds Management, LLC since 2011. Chief Operating Officer and Chief Compliance Officer at LightBox Capital Management LLC, from 2008 to 2011. | | |
C. David Messman (Born 1960) | | Secretary, since 2000; Chief Legal Officer, since 2003 | | Senior Vice President and Secretary of Wells Fargo Funds Management, LLC since 2001. Assistant General Counsel of Wells Fargo Bank, N.A. since 2013 and Vice President and Managing Counsel of Wells Fargo Bank N.A. from 1996 to 2013. | | |
Debra Ann Early (Born 1964) | | Chief Compliance Officer, since 2007 | | Executive Vice President of Wells Fargo Funds Management, LLC since 2014, Senior Vice President and Chief Compliance Officer from 2007 to 2014. | | |
David Berardi (Born 1975) | | Assistant Treasurer, since 2009 | | Vice President of Wells Fargo Funds Management, LLC since 2009. Vice President of Evergreen Investment Management Company, LLC from 2008 to 2010. Manager of Fund Reporting and Control for Evergreen Investment Management Company, LLC from 2004 to 2010. | | |
Jeremy DePalma1 (Born 1974) | | Assistant Treasurer, since 2009 | | Senior Vice President of Wells Fargo Funds Management, LLC since 2009. Senior Vice President of Evergreen Investment Management Company, LLC from 2008 to 2010 and head of the Fund Reporting and Control Team within Fund Administration from 2005 to 2010. | | |
| 1 | Nancy Wiser acts as Treasurer of 72 funds in the Fund Complex. Jeremy DePalma acts as Treasurer of 61 funds and Assistant Treasurer of 72 funds in the Fund Complex. |
| 2 | The Statement of Additional Information includes additional information about the Trustees and is available, without charge, upon request, by calling 1-800-222-8222 or by visiting the website at wellsfargoadvantagefunds.com. |
| | | | | | |
| Other information (unaudited) | | Wells Fargo Advantage Conservative Income Fund | | | 29 | |
BOARD CONSIDERATION OF INVESTMENT ADVISORY, INVESTMENT MANAGEMENT AND SUB-ADVISORY AGREEMENTS:
Under the Investment Company Act of 1940 (the “1940 Act”), the Board of Trustees (the “Board”) of Wells Fargo Funds Trust (the “Trust”) must determine annually whether to approve the continuation of the Trust’s investment advisory and sub-advisory agreements. In this regard, at an in-person meeting held on May 19-20, 2015 (the “Meeting”), the Board, all the members of which have no direct or indirect interest in the investment advisory and sub-advisory agreements and are not “interested persons” of the Trust, as defined in the 1940 Act (the “Independent Trustees”), reviewed and approved for Wells Fargo Advantage Conservative Income Fund (the “Fund”): (i) an investment advisory agreement (the “Advisory Agreement”) with Wells Fargo Funds Management, LLC (“Funds Management”); (ii) an investment management agreement (the “Management Agreement”) with Funds Management; and (iii) an investment sub-advisory agreement (the “Sub-Advisory Agreement”) with Wells Capital Management Incorporated (the “Sub-Adviser”), an affiliate of Funds Management. The Management Agreement combines the terms of the Advisory Agreement with the terms of the Fund’s Amended and Restated Administration Agreement (the “Administration Agreement”) applicable to Fund-level administrative services. The Advisory Agreement, the Management Agreement and the Sub-Advisory Agreement are collectively referred to as the “Advisory Agreements.”
At the Meeting, the Board considered the factors and reached the conclusions described below relating to the selection of Funds Management and the Sub-Adviser and the approval of the Advisory Agreements. Prior to the Meeting, including at an in-person meeting in March 2015, the Trustees conferred extensively among themselves and with representatives of Funds Management about these matters. Also, the Board has adopted a team-based approach, with each team consisting of a sub-set of Trustees, to assist the full Board in the discharge of its duties in reviewing performance and other matters throughout the year. The Independent Trustees were assisted in their evaluation of the Advisory Agreements by independent legal counsel, from whom they received separate legal advice and with whom they met separately.
In providing information to the Board, Funds Management and the Sub-Adviser were guided by a detailed set of requests for information submitted to them by independent legal counsel on behalf of the Independent Trustees at the start of the Board’s annual contract renewal process earlier in 2015. In considering and approving the Advisory Agreements, the Trustees considered the information they believed relevant, including but not limited to the information discussed below. The Board considered not only the specific information presented in connection with the Meeting, but also the knowledge gained over time through interaction with Funds Management and the Sub-Adviser about various topics. In this regard, the Board reviewed reports of Funds Management at each of its quarterly meetings, which included, among other things, portfolio reviews and performance reports. In addition, the Board and the teams mentioned above confer with portfolio managers at various times throughout the year. The Board did not identify any particular information or consideration that was all-important or controlling, and each individual Trustee may have attributed different weights to various factors.
After its deliberations, the Board unanimously approved the continuation of the Advisory Agreement for the period from June 1, 2015 through June 30, 2015, approved the Management Agreement for the period from July 1, 2015 through May 31, 2016, and approved the continuation of the Sub-Advisory Agreement for a one-year term through May 31, 2016. The Board also determined that the compensation payable to Funds Management and the Sub-Adviser under each of the Advisory Agreements was reasonable. The Board considered the approval of the Advisory Agreements for the Fund as part of its consideration of agreements for funds across the complex, but its approvals were made on a fund-by-fund basis. The following summarizes a number of important, but not necessarily all, factors considered by the Board in support of its approvals.
Nature, extent and quality of services
The Board received and considered various information regarding the nature, extent and quality of services provided to the Fund by Funds Management and the Sub-Adviser under the Advisory Agreements. This information included, among other things, a summary of the background and experience of senior management of Funds Management, and the qualifications, background, tenure and responsibilities of each of the portfolio managers primarily responsible for the day-to-day portfolio management of the Fund. The Board noted that the services to be provided to the Fund pursuant to the Management Agreement combined the advisory services previously provided to the Fund pursuant to the Fund’s Advisory Agreement with the Fund-level administrative services previously provided to the Fund pursuant to the Fund’s Administration Agreement. The Board received a representation from Funds Management that combining these services would not result in any change to the nature or level of services provided by Funds Management to the Fund.
The Board evaluated the ability of Funds Management and the Sub-Adviser to attract and retain qualified investment professionals, including research, advisory and supervisory personnel. The Board further considered the compliance programs and compliance records of Funds Management and the Sub-Adviser. In addition, the Board took into account the full range of services provided to the Fund by Funds Management and its affiliates.
| | | | |
| 30 | | Wells Fargo Advantage Conservative Income Fund | | Other information (unaudited) |
Fund performance and expenses
The Board considered the performance results for the Fund over various time periods ended March 31, 2015. The Board considered these results in comparison to the performance of funds in a universe that was determined by Lipper Inc. (“Lipper”) to be similar to the Fund (the “Universe”), and in comparison to the Fund’s benchmark index and to other comparative data. Lipper is an independent provider of investment company data. The Board received a description of the methodology used by Lipper to select the mutual funds in the performance Universe. The Board noted that the performance of the Fund (Institutional Class) was in range of the average performance of the Universe for the first quarter of 2015 and lower than the average performance of the Universe for the one-year period. The Board also noted that the performance of the Fund was higher than its benchmark, the Barclays U.S. Treasury Bills: 6-9 Months Index, for all periods under review.
The Board also received and considered information regarding the Fund’s net operating expense ratio and its various components, including actual management fees (which reflect fee waivers, if any, and include advisory, administration and transfer agent fees), custodian and other non-management fees, and Rule 12b-1 and non-Rule 12b-1 service fees. The Board considered this ratio in comparison to the median ratio of funds in a class-specific expense group that was determined by Lipper to be similar to the Fund (the “Group”). The Board received a description of the methodology used by Lipper to select the mutual funds in the expense Group and an explanation of how funds comprising expense groups and their expense ratios may vary from year-to-year. Based on the Lipper reports, the Board noted that the net operating expense ratio of the Fund was lower than the median net operating expense ratio of the expense Group.
The Board took into account the Fund performance and expense information provided to it among the factors considered in deciding to re-approve the Advisory Agreement and Sub-Advisory Agreement and approve the Management Agreement.
Investment advisory and sub-advisory fee rates
The Board reviewed and considered the contractual investment advisory fee rates that are payable by the Fund to Funds Management for investment advisory services (the “Advisory Agreement Rates”), both on a stand-alone basis and on a combined basis with the Fund’s fund-level and class-level contractual administration fee rates (the “Management Rates”). The Board noted that the Management Rates include transfer agency and sub-transfer agency costs. The Board also noted that the fee rate to be paid by the Fund under the Management Agreement will incorporate the advisory fee and Fund-level administration fee previously payable separately by the Fund under the Fund’s Advisory Agreement and Administration Agreement with Funds Management. The Board also reviewed and considered the contractual investment sub-advisory fee rates that are payable by Funds Management to the Sub-Adviser for investment sub-advisory services (the “Sub-Advisory Agreement Rates”).
Among other information reviewed by the Board was a comparison of the Management Rate of the Fund with those of other funds in the expense Group at a common asset level. The Board noted that the Management Rate of the Fund was lower than the average rate for the Fund’s expense Group.
The Board also received and considered information about the portion of the total advisory fee that was retained by Funds Management after payment of the fee to the Sub-Adviser for sub-advisory services. In assessing the reasonableness of this amount, the Board received and evaluated information about the nature and extent of responsibilities retained and risks assumed by Funds Management and not delegated to or assumed by the Sub-Adviser, and about Funds Management’s on-going oversight services. However, given the affiliation between Funds Management and the Sub-Adviser, the Board ascribed limited relevance to the allocation of the advisory fee between them.
The Board also received and considered information about the nature and extent of services offered and fee rates charged by Funds Management and the Sub-Adviser to other types of clients with investment strategies similar to those of the Fund. In this regard, the Board received information about the significantly greater scope of services, and compliance, reporting and other legal burdens and risks of managing mutual funds compared with those associated with managing assets of non-mutual fund clients such as collective funds or institutional separate accounts.
Based on its consideration of the factors and information it deemed relevant, including those described here, the Board determined that the compensation payable to Funds Management under the Management Agreement and Advisory Agreement and to the Sub-Adviser under the Sub-Advisory Agreement was reasonable, in light of the services covered by the Advisory Agreements.
Profitability
The Board received and considered information concerning the profitability of Funds Management, as well as the profitability of Wells Fargo as a whole, from providing services to the Fund and the fund family as a whole. The Board also
| | | | | | |
| Other information (unaudited) | | Wells Fargo Advantage Conservative Income Fund | | | 31 | |
received and considered information concerning the profitability of the Sub-Adviser from providing services to the fund family as a whole, noting that the Sub-Adviser’s profitability information with respect to providing services to the Fund was subsumed in the Wells Fargo profitability analysis.
Funds Management reported on the methodologies and estimates used in calculating profitability. Among other things, the Board noted that the levels of profitability reported on a fund-by-fund basis varied widely, depending on factors such as the size and type of fund. Based on its review, the Board did not deem the profits reported by Funds Management or Wells Fargo from its services to the Fund to be at a level that would prevent it from approving the continuation of the Advisory Agreements.
Economies of scale
With respect to possible economies of scale, the Board noted the existence of breakpoints in the Fund’s advisory and management fee structures, and the Fund’s administration fee structure, which operate generally to reduce the Fund’s expense ratios as the Fund grows in size. It considered that, for a small fund or a fund that shrinks in size, breakpoints conversely can result in higher fee levels. The Board also considered that fee waiver and expense reimbursement arrangements and competitive fee rates at the outset are means of sharing potential economies of scale with shareholders of the Fund and the fund family as a whole. The Board considered Funds Management’s view that any analyses of potential economies of scale in managing a particular fund are inherently limited in light of the joint and common costs and investments that Funds Management incurs across the fund family as a whole.
The Board concluded that the Fund’s fee and expense arrangements, including contractual breakpoints, constituted a reasonable approach to sharing potential economies of scale with the Fund and its shareholders.
Other benefits to Funds Management and the Sub-Adviser
The Board received and considered information regarding potential “fall-out” or ancillary benefits received by Funds Management and its affiliates, including the Sub-Adviser, as a result of their relationships with the Fund. Ancillary benefits could include, among others, benefits directly attributable to other relationships with the Fund and benefits potentially derived from an increase in Funds Management’s and the Sub-Adviser’s business as a result of their relationships with the Fund. The Board noted that various affiliates of Funds Management may receive distribution-related fees, shareholder servicing payments and sub-transfer agency fees in respect of shares sold or held through them and services provided.
The Board also reviewed information about soft dollar credits earned and utilized by the Sub-Adviser, fees earned by Funds Management and the Sub-Adviser from managing a private investment vehicle for the fund family’s securities lending collateral and commissions earned by an affiliated broker from portfolio transactions.
Based on its consideration of the factors and information it deemed relevant, including those described here, the Board did not find that any ancillary benefits received by Funds Management and its affiliates, including the Sub-Adviser, were unreasonable.
Conclusion
At the Meeting, after considering the above-described factors and based on its deliberations and its evaluation of the information described above, the Board unanimously approved the continuation of the Advisory Agreement for the period from June 1, 2015 through June 30, 2015, approved the Management Agreement for the period from July 1, 2015 through May 31, 2016, and approved the continuation of the Sub-Advisory Agreement for a one-year term through May 31, 2016. The Board also determined that the compensation payable to Funds Management and the Sub-Adviser under each of the Advisory Agreements was reasonable.
| | | | |
| 32 | | Wells Fargo Advantage Conservative Income Fund | | List of abbreviations |
The following is a list of common abbreviations for terms and entities that may have appeared in this report.
| ACA | — ACA Financial Guaranty Corporation |
| ADR | — American depositary receipt |
| ADS | — American depositary shares |
| AGC | — Assured Guaranty Corporation |
| AGM | — Assured Guaranty Municipal |
| Ambac | — Ambac Financial Group Incorporated |
| AMT | — Alternative minimum tax |
| BAN | — Bond anticipation notes |
| BHAC | — Berkshire Hathaway Assurance Corporation |
| CAB | — Capital appreciation bond |
| CCAB | — Convertible capital appreciation bond |
| CDA | — Community Development Authority |
| CDO | — Collateralized debt obligation |
| DRIVER | — Derivative inverse tax-exempt receipts |
| DW&P | — Department of Water & Power |
| DWR | — Department of Water Resources |
| ECFA | — Educational & Cultural Facilities Authority |
| EDA | — Economic Development Authority |
| EDFA | — Economic Development Finance Authority |
| ETF | — Exchange-traded fund |
| FDIC | — Federal Deposit Insurance Corporation |
| FFCB | — Federal Farm Credit Banks |
| FGIC | — Financial Guaranty Insurance Corporation |
| FHA | — Federal Housing Administration |
| FHLB | — Federal Home Loan Bank |
| FHLMC | — Federal Home Loan Mortgage Corporation |
| FICO | — The Financing Corporation |
| FNMA | — Federal National Mortgage Association |
| GDR | — Global depositary receipt |
| GNMA | — Government National Mortgage Association |
| HCFR | — Healthcare facilities revenue |
| HEFA | — Health & Educational Facilities Authority |
| HEFAR | — Higher education facilities authority revenue |
| HFA | — Housing Finance Authority |
| HFFA | — Health Facilities Financing Authority |
| HUD | — Department of Housing and Urban Development |
| IDA | — Industrial Development Authority |
| IDAG | — Industrial Development Agency |
| KRW | — Republic of Korea won |
| LIBOR | — London Interbank Offered Rate |
| LIFER | — Long Inverse Floating Exempt Receipts |
| LLC | — Limited liability company |
| LLLP | — Limited liability limited partnership |
| LLP | — Limited liability partnership |
| MBIA | — Municipal Bond Insurance Association |
| MFHR | — Multifamily housing revenue |
| MSTR | — Municipal securities trust receipts |
| MUD | — Municipal Utility District |
| National | — National Public Finance Guarantee Corporation |
| PCFA | — Pollution Control Financing Authority |
| PCL | — Public Company Limited |
| PCR | — Pollution control revenue |
| PFA | — Public Finance Authority |
| PFFA | — Public Facilities Financing Authority |
| PFOTER | — Puttable floating option tax-exempt receipts |
| plc | — Public limited company |
| PUTTER | — Puttable tax-exempt receipts |
| R&D | — Research & development |
| Radian | — Radian Asset Assurance |
| RAN | — Revenue anticipation notes |
| RDA | — Redevelopment Authority |
| RDFA | — Redevelopment Finance Authority |
| REIT | — Real estate investment trust |
| ROC | — Reset option certificates |
| SAVRS | — Select auction variable rate securities |
| SBA | — Small Business Authority |
| SDR | — Swedish depositary receipt |
| SFHR | — Single-family housing revenue |
| SFMR | — Single-family mortgage revenue |
| SPA | — Standby purchase agreement |
| SPDR | — Standard & Poor’s Depositary Receipts |
| SPEAR | — Short Puttable Exempt Adjustable Receipts |
| STRIPS | — Separate trading of registered interest and |
| TAN | — Tax anticipation notes |
| TIPS | — Treasury inflation-protected securities |
| TRAN | — Tax revenue anticipation notes |
| TTFA | — Transportation Trust Fund Authority |
| TVA | — Tennessee Valley Authority |


For more information
More information about Wells Fargo Advantage Funds is available free upon request. To obtain literature, please write, email, visit the Fund’s website, or call:
Wells Fargo Advantage Funds
P.O. Box 8266
Boston, MA 02266-8266
Email: wfaf@wellsfargo.com
Website: wellsfargoadvantagefunds.com
Individual investors: 1-800-222-8222
Retail investment professionals: 1-888-877-9275
Institutional investment professionals: 1-866-765-0778
This report and the financial statements contained herein are submitted for the general information of the shareholders of Wells Fargo Advantage Funds. If this report is used for promotional purposes, distribution of the report must be accompanied or preceded by a current prospectus. Before investing, please consider the investment objectives, risks, charges, and expenses of the investment. For a current prospectus and, if available, a summary prospectus, containing this information, call 1-800-222-8222 or visit the Fund’s website at wellsfargoadvantagefunds.com. Read the prospectus carefully before you invest or send money.
Wells Fargo Funds Management, LLC, a wholly owned subsidiary of Wells Fargo & Company, provides investment advisory and administrative services for Wells Fargo Advantage Funds. Other affiliates of Wells Fargo & Company provide subadvisory and other services for the Funds. The Funds are distributed by Wells Fargo Funds Distributor, LLC, Member FINRA, an affiliate of Wells Fargo & Company.
NOT FDIC INSURED ¡ NO BANK GUARANTEE ¡ MAY LOSE VALUE
© 2015 Wells Fargo Funds Management, LLC. All rights reserved.
| | |
 | | 236801 10-15 A265/AR265 08-15 |

Wells Fargo Advantage
Government Securities Fund

Annual Report
August 31, 2015

Reduce clutter. Save trees.
Sign up for electronic delivery of prospectuses and shareholder reports at wellsfargo.com/advantagedelivery
Contents
| * | A complete schedule of portfolio holdings as of the report date may be obtained, free of charge, by accessing the following website: https://www.wellsfargoadvantagefunds.com/assets/edocs/regulatory/holdings/government-securities-ann.pdf or by calling Wells Fargo Advantage Funds at 1-800-222-8222. This complete schedule, filed on Form N-CSR, is also available on the SEC’s website at sec.gov. |
The views expressed and any forward-looking statements are as of August 31, 2015, unless otherwise noted, and are those of the Fund managers and/or Wells Fargo Funds Management, LLC. Discussions of individual securities, or the markets generally, or any Wells Fargo Advantage Fund are not intended as individual recommendations. Future events or results may vary significantly from those expressed in any forward-looking statements; the views expressed are subject to change at any time in response to changing circumstances in the market. Wells Fargo Funds Management, LLC and the Fund disclaim any obligation to publicly update or revise any views expressed or forward-looking statements.
NOT FDIC INSURED ¡ NO BANK GUARANTEE ¡ MAY LOSE VALUE
| | | | |
| 2 | | Wells Fargo Advantage Government Securities Fund | | Letter to shareholders (unaudited) |

Karla M. Rabusch
President
Wells Fargo Advantage Funds
Major central banks continued to inject liquidity into global banks and markets through various accommodative monetary policies, including quantitative easing.
Dear Valued Shareholder:
We are pleased to offer you this annual report for the Wells Fargo Advantage Government Securities Fund for the 12-month period that ended August 31, 2015. The period was marked by low interest rates, low oil prices, and moderate U.S. economic growth. Short-term investment-grade bonds, as measured by the Barclays U.S. 1–3 Year Government/Credit Bond Index1, returned 0.81% during the period. Meanwhile, strong demand for high-quality, liquid assets kept returns on Treasury bills more modest; the Barclays 6-Month Treasury Bill Index2 returned 0.15% during the period.
Major central banks continued to provide stimulus.
Major central banks continued to inject liquidity into global banks and markets through various accommodative monetary policies, including quantitative easing. In the U.S., the Federal Reserve (Fed) kept its key interest rate near zero in order to support the economy and the financial system. However, it set expectations for it to begin normalizing monetary policy with higher target ranges for the federal funds rate.
Meanwhile, European markets continued to benefit from the European Central Bank’s (ECB’s) willingness to maintain low interest rates. In addition to its targeted longer-term refinancing operations that are designed to increase bank lending, the ECB expanded its quantitative easing program to include the purchase of eurozone government bonds. In Japan, the Bank of Japan maintained an aggressive monetary program aimed at combating deflation.
Economic growth was moderate, and oil prices plummeted.
U.S. economic growth advanced during the reporting period, the unemployment rate ticked lower to 5.1% as of August 2015, and inflation remained below the Fed’s longer-run objective of a 2% pace. The period was also marked by lower oil prices, which began the reporting period near $90 per barrel but declined to $46 per barrel at the end of August 2015. While lower oil prices benefited consumers of oil products, the lower prices pressured companies within the energy sector.
Bond yields rose but remained low by historical standards.
Short-term interest rates increased during the reporting period, with a flattening in the shape of the short-term yield curve. During this time frame, 1-year Treasury bills rose 29 basis points (bps; 100 bps equals 1.00%) to yield 0.38%, 2-year Treasury note yields rose 21 bps to yield 0.74%, and 3-year Treasury note yields rose only 8 bps to yield 1.05%. Meanwhile, ultra-short-term yields were little changed at ultralow levels, anchored by the easy monetary policy.
Since the end of the financial crisis, structural changes in the fixed-income markets have reduced trading liquidity (the degree to which assets can be bought or sold without affecting the price). New regulations and capital requirements have caused traditional liquidity suppliers (banks and broker/dealers) to be more risk-averse and hold less inventory. Meanwhile, corporate-debt issuance has
| 1 | The Barclays U.S. 1–3 Year Government/Credit Bond Index is the one- to three-year component of the Barclays U.S. Government/Credit Bond Index that includes securities in the Government and Credit Indexes. The Government Index includes Treasuries (that is, public obligations of the U.S. Treasury that have remaining maturities of more than one year) and agencies (that is, publicly issued debt of U.S. government agencies, quasi-federal corporations, and corporate or foreign debt guaranteed by the U.S. government). The Credit Index includes publicly issued U.S. corporate and foreign debentures and secured notes that meet specified maturity, liquidity, and quality requirements. You cannot invest directly in an index. |
| 2 | The Barclays 6-Month Treasury Bill Index tracks the performance and attributes of recently issued 6-month U.S. Treasury bills. The index follows Barclays’ monthly rebalancing conventions. You cannot invest directly in an index. |
| | | | | | |
| Letter to shareholders (unaudited) | | Wells Fargo Advantage Government Securities Fund | | | 3 | |
spiked as companies finance themselves at record-low yields, bond mutual funds hold larger amounts of this new debt supply, trading volumes are lower, and large-size trades are more difficult to execute. However, fixed-income markets appear to have functioned well over the past year with sufficient liquidity and muted volatility.
Don’t let short-term uncertainty derail long-term investment goals.
Periods of uncertainty can present challenges, but experience has taught us that maintaining long-term investment goals can be an effective way to plan for the future. To help you create a sound strategy based on your personal goals and risk tolerance, Wells Fargo Advantage Funds offers more than 100 mutual funds spanning a wide range of asset classes and investment styles. Although diversification cannot guarantee an investment profit or prevent losses, we believe it can be an effective way to manage investment risk and potentially smooth out overall portfolio performance. We encourage investors to know their investments and to understand that appropriate levels of risk-taking may unlock opportunities.
Thank you for choosing to invest in Wells Fargo Advantage Funds. We appreciate your confidence in us and remain committed to helping you meet your financial needs.
Sincerely,

Karla M. Rabusch
President
Wells Fargo Advantage Funds
Periods of uncertainty can present challenges, but experience has taught us that maintaining long-term investment goals can be an effective way to plan for the future.
Notice to shareholders
At a meeting held on August 11–12, 2015, the Board of Trustees of the Fund approved a change in the name of the Fund whereby the word “Advantage” will be removed from its name, effective December 15, 2015.
For current information about your fund investments, contact your investment professional, visit our website at wellsfargoadvantagefunds.com, or call us directly at 1-800-222-8222. We are available 24 hours a day, 7 days a week.
| | | | |
| 4 | | Wells Fargo Advantage Government Securities Fund | | Performance highlights (unaudited) |
Investment objective
The Fund seeks current income.
Manager
Wells Fargo Funds Management, LLC
Subadviser
Wells Capital Management Incorporated
Portfolio managers
Ashok Bhatia, CFA
Christopher Y. Kauffman, CFA
Jay Mueller, CFA
Average annual total returns1 (%) as of August 31, 2015
| | | | | | | | | | | | | | | | | | | | | | | | | | | | | | | | | | |
| | | | | Including sales charge | | | Excluding sales charge | | | Expense ratios2 (%) | |
| | | Inception date | | 1 year | | | 5 year | | | 10 year | | | 1 year | | | 5 year | | | 10 year | | | Gross | | | Net3 | |
| Class A (SGVDX) | | 8-31-1999 | | | (2.74 | ) | | | 1.21 | | | | 3.40 | | | | 1.84 | | | | 2.14 | | | | 3.88 | | | | 0.89 | | | | 0.86 | |
| Class B (WGSBX)* | | 7-18-2008 | | | (4.01 | ) | | | 0.98 | | | | 3.35 | | | | 0.99 | | | | 1.36 | | | | 3.35 | | | | 1.64 | | | | 1.61 | |
| Class C (WGSCX) | | 12-26-2002 | | | 0.08 | | | | 1.38 | | | | 3.10 | | | | 1.08 | | | | 1.38 | | | | 3.10 | | | | 1.64 | | | | 1.61 | |
| Administrator Class (WGSDX) | | 4-08-2005 | | | – | | | | – | | | | – | | | | 1.97 | | | | 2.34 | | | | 4.09 | | | | 0.83 | | | | 0.65 | |
| Institutional Class (SGVIX) | | 8-31-1999 | | | – | | | | – | | | | – | | | | 2.22 | | | | 2.52 | | | | 4.28 | | | | 0.56 | | | | 0.49 | |
| Investor Class (STVSX) | | 10-29-1986 | | | – | | | | – | | | | – | | | | 1.72 | | | | 2.09 | | | | 3.84 | | | | 0.92 | | | | 0.89 | |
| Barclays U.S. Aggregate ex Credit Index4 | | – | | | – | | | | – | | | | – | | | | 2.41 | | | | 2.59 | | | | 4.25 | | | | – | | | | – | |
| Barclays Intermediate Government Index5 | | – | | | – | | | | – | | | | – | | | | 1.89 | | | | 1.78 | | | | 3.70 | | | | – | | | | – | |
| * | | Class B shares are closed to investment, except in connection with the reinvestment of any distributions and permitted exchanges. |
Figures quoted represent past performance, which is no guarantee of future results, and do not reflect taxes that a shareholder may pay on fund distributions or the redemption of fund shares. Investment return and principal value of an investment will fluctuate so that an investor’s shares, when redeemed, may be worth more or less than their original cost. Performance shown without sales charges would be lower if sales charges were reflected. Current performance may be lower or higher than the performance data quoted, which assumes the reinvestment of dividends and capital gains. Current month-end performance is available on the Fund’s website, wellsfargoadvantagefunds.com.
Index returns do not include transaction costs associated with buying and selling securities, any mutual fund fees or expenses, or any taxes. It is not possible to invest directly in an index.
For Class A shares, the maximum front-end sales charge is 4.50%. For Class B shares, the maximum contingent deferred sales charge is 5.00%. For Class C shares, the maximum contingent deferred sales charge is 1.00%. Performance including a contingent deferred sales charge assumes the sales charge for the corresponding time period. Administrator Class, Institutional Class, and Investor Class shares are sold without a front-end sales charge or contingent deferred sales charge.
Bond values fluctuate in response to the financial condition of individual issuers, general market and economic conditions, and changes in interest rates. Changes in market conditions and government policies may lead to periods of heightened volatility in the bond market and reduced liquidity for certain bonds held by the Fund. In general, when interest rates rise, bond values fall and investors may lose principal value. Interest-rate changes and their impact on the Fund and its share price can be sudden and unpredictable. The use of derivatives may reduce returns and/or increase volatility. Securities issued by U.S. government agencies or government sponsored entities may not be guaranteed by the U.S. Treasury. Certain investment strategies tend to increase the total risk of an investment (relative to the broader market). The Fund is exposed to mortgage- and asset-backed securities risk. Consult the Fund’s prospectus for additional information on these and other risks. The U.S. government guarantee applies to certain underlying securities and not to shares of the Fund.
Please see footnotes on page 5.
| | | | | | |
| Performance highlights (unaudited) | | Wells Fargo Advantage Government Securities Fund | | | 5 | |
|
| Growth of $10,000 investment6 as of August 31, 2015 |
|
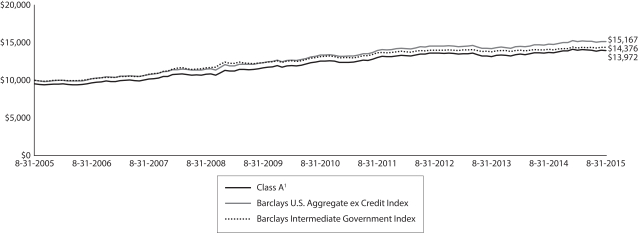 |
| 1 | Effective June 20, 2008, the Advisor Class was renamed Class A and modified to assume the features and attributes of Class A. Historical performance shown for Class A shares through June 19, 2008, includes Advisor Class expenses. Historical performance shown for Class B shares prior to their inception reflects the performance of Investor Class shares, adjusted to reflect the higher expenses applicable to Class B. Historical performance shown for Administrator Class shares prior to their inception reflects the performance of Institutional Class shares, adjusted to reflect the higher expenses applicable to Administrator Class shares. |
| 2 | Reflects the expense ratios as stated in the most recent prospectuses, which include the impact of 0.01% in acquired fund fees and expenses. The expense ratios shown are subject to change and may differ from the annualized expense ratios shown in the financial highlights of this report, which do not include acquired fund fees and expenses. |
| 3 | The manager has contractually committed through December 31, 2015, to waive fees and/or reimburse expenses to the extent necessary to cap the Fund’s Total Annual Fund Operating Expenses After Fee Waiver at 0.85% for Class A, 1.60% for Class B, 1.60% for Class C, 0.64% for Administrator Class, 0.48% for Institutional Class, and 0.88% for Investor Class. After this time, the cap may be increased or the commitment to maintain the cap may be terminated only with the approval of the Board of Trustees. Brokerage commissions, stamp duty fees, interest, taxes, acquired fund fees and expenses, and extraordinary expenses are excluded from the cap. Without this cap, the Fund’s returns would have been lower. |
| 4 | The Barclays U.S. Aggregate ex Credit Index is composed of the Barclays U.S. Government Index and the Barclays U.S. Mortgage-Backed Securities Index and it includes Treasury issues, agency issues, and mortgage-backed securities. You cannot invest directly in an index. |
| 5 | The Barclays Intermediate Government Index is an unmanaged index composed of U.S. government securities with maturities in the one to 10-year range, including securities issued by the U.S. Treasury and U.S. government agencies. You cannot invest directly in an index. |
| 6 | The chart compares the performance of Class A shares for the most recent 10 years with the performance of the Barclays Intermediate Government Index and the Barclays U.S. Aggregate ex Credit Index. The chart assumes a hypothetical investment of $10,000 in Class A shares and reflects all operating expenses and assumes the maximum initial sales charge of 4.50%. |
| 7 | The ten largest holdings, excluding cash and cash equivalents, are calculated based on the value of the investments divided by total net assets of the Fund. Holdings are subject to change and may have changed since the date specified. |
| 8 | Amounts are calculated based on the total long-term investments of the Fund. These amounts are subject to change and may have changed since the date specified. |
| | | | |
| 6 | | Wells Fargo Advantage Government Securities Fund | | Performance highlights (unaudited) |
MANAGER’S DISCUSSION
Fund highlights
| n | | The Fund underperformed its benchmarks, the Barclays U.S. Aggregate ex Credit Index and the Barclays Intermediate Government Index, for the 12-month period that ended August 31, 2015. |
| n | | The Fund’s overweight to nonagency commercial mortgage-backed securities (CMBS) detracted from performance due to wider spreads caused by increased CMBS supply as well as wider corporate credit spreads. |
| n | | The Fund’s overweight allocation to agency collateralized mortgage obligations and agency CMBS contributed to performance because those yield spreads narrowed. |
| | | | |
| Ten largest holdings7 (%) as of August 31, 2015 | |
U.S. Treasury Note, 0.10%, 1-31-2016 | | | 10.54 | |
U.S. Treasury Note, 0.25%, 12-31-2015 | | | 8.85 | |
U.S. Treasury Note, 0.38%, 2-15-2016 | | | 7.85 | |
U.S. Treasury Note, 0.38%, 11-15-2015 | | | 6.56 | |
FNMA, 4.50%, 9-14-2045 | | | 5.16 | |
FNMA, 4.00%, 9-14-2045 | | | 4.97 | |
U.S. Treasury Note, 1.38%, 2-28-2019 | | | 4.56 | |
FHLMC, 3.50%, 9-14-2045 | | | 4.54 | |
FNMA, 3.00%, 9-14-2045 | | | 4.10 | |
U.S. Treasury Note, 0.25%, 11-30-2015 | | | 3.52 | |
The economic climate remained benign.
The U.S. economy featured trend-like growth, a steadily improving labor market, and generally stable inflation over the past 12 months. Real gross domestic product growth averaged about 2.7% in the most recent four quarters as personal income gains supported consumption. In contrast, business investment softened, in part, due to weakness in the energy industry brought on by a collapse in global oil prices.
The labor market continued to tighten over the past 12 months, as evidenced by a full percentage point decline in the unemployment rate to 5.1%. Nonfarm payrolls expanded at an average pace of about 240,000 per month over the period. Following a persistent theme
of this expansion, some of the improvement in the unemployment rate can be attributed to a decline in the labor force participation rate, which fell to 62.6% at the end of the period versus 62.8% a year ago.
The inflationary environment was mixed over the past 12 months as the drop in oil prices pushed the year-over-year change in the headline Consumer Price Index (CPI) down to 0.2% compared with a 1.7% headline inflation rate a year ago. Excluding food and energy, however, the CPI rose 1.8%, which is in line with the average rate of core inflation recorded over the past five years.
Monetary policy transitioned from maximal accommodation to the beginning of a tightening cycle over the past 12 months. The Federal Open Market Committee (FOMC) completed its third round of asset purchases, also known as quantitative easing, in the fourth quarter of 2014, though the monetary authorities continue to reinvest the proceeds of maturing principal and interest payments from their existing portfolio. The FOMC’s overnight federal funds rate target remained unchanged throughout the period, with the federal funds rate held to a range of 0.00% to 0.25%. There is a good chance that an initial hike in the target range will occur before the end of 2015, to be followed by a very gradual normalization of monetary policy.
Please see footnotes on page 5.
| | | | | | |
| Performance highlights (unaudited) | | Wells Fargo Advantage Government Securities Fund | | | 7 | |
|
| Portfolio allocation8 as of August 31, 2015 |
|
 |
Sector allocations were overweight securitized investments.
We continued to find relative value among securitized bonds, particularly residential mortgage-backed securities (MBS) and CMBS. Within the MBS sector, the Fund was positioned with an emphasis on higher-coupon paper as a defensive strategy ahead of higher interest rates and an underweight to Ginnie Mae bonds due to their rich valuations. The Fund maintained an overweight to both agency and nonagency CMBS during the period. In lieu of holding cash (given its near-zero yield), we instead purchased U.S. Treasuries with final maturities less than one year because we believed they offered more income than cash without significant incremental interest-rate or credit risk.
We expect a gradual rise in short-term interest rates.
The relatively benign domestic economic conditions described above are likely to result in a gradual upward bias toward interest rates. We believe FOMC is likely to raise its target rate by 0.75% to 1.00% over the next 12 months, a result which is largely reflected in the current term structure of interest rates. Should market rates diverge from the policy path we think most likely, we will be prepared to modify our duration and yield-curve posture in response to the opportunities presented.
Please see footnotes on page 5.
| | | | |
| 8 | | Wells Fargo Advantage Government Securities Fund | | Fund expenses (unaudited) |
As a shareholder of the Fund, you incur two types of costs: (1) transaction costs, including sales charges (loads) on purchase payments and contingent deferred sales charges (if any) on redemptions and (2) ongoing costs, including management fees, distribution (12b-1) and/or shareholder servicing fees, and other Fund expenses. This example is intended to help you understand your ongoing costs (in dollars) of investing in the Fund and to compare these costs with the ongoing costs of investing in other mutual funds.
The example is based on an investment of $1,000 invested at the beginning of the six-month period and held for the entire period from March 1, 2015 to August 31, 2015.
Actual expenses
The “Actual” line of the table below provides information about actual account values and actual expenses. You may use the information in this line, together with the amount you invested, to estimate the expenses that you paid over the period. Simply divide your account value by $1,000 (for example, an $8,600 account value divided by $1,000 = 8.6), then multiply the result by the number in the “Actual” line under the heading entitled “Expenses paid during period” for your applicable class of shares to estimate the expenses you paid on your account during this period.
Hypothetical example for comparison purposes
The “Hypothetical” line of the table below provides information about hypothetical account values and hypothetical expenses based on the Fund’s actual expense ratio and an assumed rate of return of 5% per year before expenses, which is not the Fund’s actual return. The hypothetical account values and expenses may not be used to estimate the actual ending account balance or expenses you paid for the period. You may use this information to compare the ongoing costs of investing in the Fund and other funds. To do so, compare this 5% hypothetical example with the 5% hypothetical examples that appear in the shareholder reports of the other funds.
Please note that the expenses shown in the table are meant to highlight your ongoing costs only and do not reflect any transactional costs, such as sales charges (loads) and contingent deferred sales charges. Therefore, the “Hypothetical” line of the table is useful in comparing ongoing costs only and will not help you determine the relative total costs of owning different funds. In addition, if these transactional costs were included, your costs would have been higher.
| | | | | | | | | | | | | | | | |
| | | Beginning
account value
3-1-2015 | | | Ending
account value
8-31-2015 | | | Expenses
paid during
the period¹ | | | Net annualized
expense ratio | |
Class A | | | | | | | | | | | | | | | | |
Actual | | $ | 1,000.00 | | | $ | 996.87 | | | $ | 4.28 | | | | 0.85 | % |
Hypothetical (5% return before expenses) | | $ | 1,000.00 | | | $ | 1,020.92 | | | $ | 4.33 | | | | 0.85 | % |
Class B | | | | | | | | | | | | | | | | |
Actual | | $ | 1,000.00 | | | $ | 992.22 | | | $ | 8.03 | | | | 1.60 | % |
Hypothetical (5% return before expenses) | | $ | 1,000.00 | | | $ | 1,017.14 | | | $ | 8.13 | | �� | | 1.60 | % |
Class C | | | | | | | | | | | | | | | | |
Actual | | $ | 1,000.00 | | | $ | 993.11 | | | $ | 8.04 | | | | 1.60 | % |
Hypothetical (5% return before expenses) | | $ | 1,000.00 | | | $ | 1,017.14 | | | $ | 8.13 | | | | 1.60 | % |
Administrator Class | | | | | | | | | | | | | | | | |
Actual | | $ | 1,000.00 | | | $ | 997.03 | | | $ | 3.22 | | | | 0.64 | % |
Hypothetical (5% return before expenses) | | $ | 1,000.00 | | | $ | 1,021.98 | | | $ | 3.26 | | | | 0.64 | % |
Institutional Class | | | | | | | | | | | | | | | | |
Actual | | $ | 1,000.00 | | | $ | 998.72 | | | $ | 2.42 | | | | 0.48 | % |
Hypothetical (5% return before expenses) | | $ | 1,000.00 | | | $ | 1,022.79 | | | $ | 2.45 | | | | 0.48 | % |
Investor Class | | | | | | | | | | | | | | | | |
Actual | | $ | 1,000.00 | | | $ | 995.83 | | | $ | 4.43 | | | | 0.88 | % |
Hypothetical (5% return before expenses) | | $ | 1,000.00 | | | $ | 1,020.77 | | | $ | 4.48 | | | | 0.88 | % |
| 1 | Expenses paid is equal to the annualized expense ratio of each class multiplied by the average account value over the period, multiplied by the number of days in the most recent fiscal half-year divided by the number of days in the fiscal year (to reflect the one-half-year period). |
| | | | | | |
| Summary portfolio of investments—August 31, 2015 | | Wells Fargo Advantage Government Securities Fund | | | 9 | |
The Summary portfolio of investments shows the 50 largest portfolio holdings in unaffiliated issuers and any holdings exceeding 1% of the total net assets as of the report date. The remaining securities held are grouped as “Other securities” in each category.
| | | | | | | | | | | | | | | | | | | | |
| Security name | | Interest rate | | | Maturity date | | | Principal | | | Value | | | Percent of net assets | |
| | | | | | | | | | | | | | | | | | | | |
| | | | | |
Agency Securities: 66.21% | | | | | | | | | | | | | | | | | | | | |
FHLB | | | 5.63 | % | | | 3-14-2036 | | | $ | 6,150,000 | | | $ | 8,004,717 | | | | 0.64 | % |
FHLMC ¤ | | | 0.00 | | | | 11-20-2015 | | | | 14,000,000 | | | | 13,995,548 | | | | 1.13 | |
FHLMC %% | | | 3.50 | | | | 9-14-2045 | | | | 54,565,000 | | | | 56,424,472 | | | | 4.54 | |
FHLMC | | | 4.00 | | | | 6-1-2044 | | | | 10,836,264 | | | | 11,498,872 | | | | 0.93 | |
FHLMC | | | 5.50 | | | | 7-1-2035 | | | | 6,551,164 | | | | 7,331,479 | | | | 0.59 | |
FHLMC | | | 6.00 | | | | 5-25-2043 | | | | 6,335,211 | | | | 7,158,566 | | | | 0.58 | |
FHLMC | | | 0.24-10.50 | | | | 6-1-2016 to 5-25-2045 | | | | 102,531,506 | | | | 61,610,892 | | | | 4.93 | |
FNMA ¤ | | | 0.00 | | | | 11-25-2015 | | | | 40,000,000 | | | | 39,986,480 | | | | 3.22 | |
FNMA | | | 2.63 | | | | 9-6-2024 | | | | 16,000,000 | | | | 16,117,840 | | | | 1.30 | |
FNMA %% | | | 3.00 | | | | 9-17-2030 | | | | 18,235,000 | | | | 18,915,964 | | | | 1.52 | |
FNMA %% | | | 3.00 | | | | 9-14-2045 | | | | 50,715,000 | | | | 50,936,878 | | | | 4.10 | |
FNMA %% | | | 3.50 | | | | 9-17-2030 | | | | 23,385,000 | | | | 24,634,636 | | | | 1.98 | |
FNMA %% | | | 3.50 | | | | 9-14-2045 | | | | 34,805,000 | | | | 36,067,350 | | | | 2.90 | |
FNMA %% | | | 4.00 | | | | 9-14-2045 | | | | 58,150,000 | | | | 61,768,483 | | | | 4.97 | |
FNMA | | | 4.50 | | | | 1-1-2026 | | | | 8,705,800 | | | | 9,051,541 | | | | 0.73 | |
FNMA %% | | | 4.50 | | | | 9-14-2045 | | | | 59,157,000 | | | | 64,090,670 | | | | 5.16 | |
FNMA | | | 5.00 | | | | 8-1-2040 | | | | 20,600,847 | | | | 22,821,692 | | | | 1.84 | |
FNMA | | | 5.30 | | | | 4-1-2017 | | | | 6,196,583 | | | | 6,466,756 | | | | 0.52 | |
FNMA | | | 5.50 | | | | 8-1-2033 | | | | 6,832,846 | | | | 7,674,115 | | | | 0.62 | |
FNMA %% | | | 6.00 | | | | 9-14-2045 | | | | 15,585,000 | | | | 17,621,191 | | | | 1.42 | |
FNMA Series 2002-T19 Class A1 | | | 6.50 | | | | 7-25-2042 | | | | 5,853,686 | | | | 6,789,368 | | | | 0.55 | |
FNMA Series 2006-M2 Class A2F ± | | | 5.26 | | | | 5-25-2020 | | | | 5,717,033 | | | | 6,156,947 | | | | 0.50 | |
FNMA | | | 0.40-11.00 | | | | 10-1-2015 to 8-25-2047 | | | | 125,306,440 | | | | 135,686,218 | | | | 10.93 | |
GNMA | | | 3.00 | | | | 7-20-2045 | | | | 24,467,529 | | | | 24,827,343 | | | | 2.00 | |
GNMA %% | | | 3.50 | | | | 9-21-2045 | | | | 36,705,000 | | | | 38,217,646 | | | | 3.08 | |
GNMA | | | 4.00 | | | | 1-20-2045 | | | | 15,883,314 | | | | 16,862,400 | | | | 1.36 | |
GNMA | | | 5.00 | | | | 7-20-2040 | | | | 6,731,286 | | | | 7,481,390 | | | | 0.60 | |
GNMA Series 2006-32 Class C ± | | | 5.30 | | | | 11-16-2038 | | | | 6,692,871 | | | | 6,958,678 | | | | 0.56 | |
GNMA Series 2006-68 Class D ± | | | 5.31 | | | | 12-16-2037 | | | | 12,520,000 | | | | 13,532,202 | | | | 1.09 | |
GNMA | | | 0.02-10.00 | | | | 7-15-2016 to 5-20-2062 | | | | 66,177,762 | | | | 10,370,490 | | | | 0.81 | |
Other securities | | | | | | | | | | | | | | | 13,862,564 | | | | 1.11 | |
| | | | | |
Total Agency Securities (Cost $806,666,573) | | | | | | | | | | | | | | | 822,923,388 | | | | 66.21 | |
| | | | | | | | | | | | | | | | | | | | |
| | | | | |
Municipal Obligations: 0.61% | | | | | | | | | | | | | | | | | | | | |
| | | | | |
| Texas: 0.61% | | | | | | | | | | | | | | | | | | | | |
San Antonio TX Retama Development Corporation (Miscellaneous Revenue) | | | 10.00 | | | | 12-15-2020 | | | | 5,405,000 | | | | 7,557,271 | | | | 0.61 | |
| | | | | | | | | | | | | | | | | | | | |
| | | | | |
Total Municipal Obligations (Cost $6,570,827) | | | | | | | | | | | | | | | 7,557,271 | | | | 0.61 | |
| | | | | | | | | | | | | | | | | | | | |
| | | | | |
Non-Agency Mortgage-Backed Securities: 5.80% | | | | | | | | | | | | | | | | | | | | |
Citigroup Commercial Mortgage Trust Series 2006-C4 Class A3 ± | | | 5.97 | | | | 3-15-2049 | | | | 8,499,800 | | | | 8,610,739 | | | | 0.69 | |
Citigroup Commercial Mortgage Trust Series 2006-C5 Class A4 | | | 5.43 | | | | 10-15-2049 | | | | 11,280,000 | | | | 11,603,849 | | | | 0.93 | |
Citigroup Commercial Mortgage Trust Series 2015-GC27 Class A5 | | | 3.14 | | | | 2-10-2048 | | | | 6,130,000 | | | | 6,003,471 | | | | 0.48 | |
The accompanying notes are an integral part of these financial statements.
| | | | |
| 10 | | Wells Fargo Advantage Government Securities Fund | | Summary portfolio of investments—August 31, 2015 |
| | | | | | | | | | | | | | | | | | | | |
| Security name | | Interest rate | | | Maturity date | | | Principal | | | Value | | | Percent of net assets | |
| | | | | | | | | | | | | | | | | | | | |
| | | | | |
Non-Agency Mortgage-Backed Securities (continued) | | | | | | | | | | | | | | | | | | | | |
Morgan Stanley Bank of America Merrill Lynch Trust Series 2015-C23 Class A4 | | | 3.72 | % | | | 7-15-2050 | | | $ | 8,500,000 | | | $ | 8,694,412 | | | | 0.70 | % |
NCUA Guaranteed Notes Program Series 2010-C1 Class APT | | | 2.65 | | | | 10-29-2020 | | | | 6,222,604 | | | | 6,247,725 | | | | 0.50 | |
Other securities | | | | | | | | | | | | | | | 30,883,643 | | | | 2.50 | |
| | | | | |
Total Non-Agency Mortgage-Backed Securities (Cost $73,792,503) | | | | | | | | | | | | | | | 72,043,839 | | | | 5.80 | |
| | | | | | | | | | | | | | | | | | | | |
| | | | | |
U.S. Treasury Securities: 54.56% | | | | | | | | | | | | | | | | | | | | |
TIPS | | | 0.38 | | | | 7-15-2025 | | | | 39,364,067 | | | | 38,569,109 | | | | 3.10 | |
U.S. Treasury Bond | | | 2.75 | | | | 8-15-2042 | | | | 16,720,000 | | | | 16,039,881 | | | | 1.29 | |
U.S. Treasury Bond | | | 3.00 | | | | 11-15-2044 | | | | 5,965,000 | | | | 5,994,437 | | | | 0.48 | |
U.S. Treasury Bond | | | 3.00 | | | | 5-15-2045 | | | | 17,355,000 | | | | 17,477,925 | | | | 1.41 | |
U.S. Treasury Bond ## | | | 4.63 | | | | 2-15-2040 | | | | 20,150,000 | | | | 26,338,246 | | | | 2.12 | |
U.S. Treasury Bond | | | 7.25 | | | | 8-15-2022 | | | | 4,685,000 | | | | 6,321,944 | | | | 0.51 | |
U.S. Treasury Note ±## | | | 0.10 | | | | 1-31-2016 | | | | 130,990,000 | | | | 131,007,946 | | | | 10.54 | |
U.S. Treasury Note | | | 0.25 | | | | 9-30-2015 | | | | 8,900,000 | | | | 8,900,000 | | | | 0.72 | |
U.S. Treasury Note | | | 0.25 | | | | 11-30-2015 | | | | 43,700,000 | | | | 43,705,681 | | | | 3.52 | |
U.S. Treasury Note ## | | | 0.25 | | | | 12-31-2015 | | | | 110,000,000 | | | | 110,000,000 | | | | 8.85 | |
U.S. Treasury Note | | | 0.38 | | | | 11-15-2015 | | | | 81,495,000 | | | | 81,528,983 | | | | 6.56 | |
U.S. Treasury Note ## | | | 0.38 | | | | 2-15-2016 | | | | 97,455,000 | | | | 97,488,037 | | | | 7.85 | |
U.S. Treasury Note | | | 1.00 | | | | 8-31-2016 | | | | 12,240,000 | | | | 12,306,463 | | | | 0.99 | |
U.S. Treasury Note | | | 1.38 | | | | 2-28-2019 | | | | 56,455,000 | | | | 56,679,917 | | | | 4.56 | |
U.S. Treasury Note | | | 2.13 | | | | 6-30-2022 | | | | 15,105,000 | | | | 15,300,504 | | | | 1.23 | |
U.S. Treasury Note | | | 6.25 | | | | 8-15-2023 | | | | 7,915,000 | | | | 10,366,798 | | | | 0.83 | |
| | | | | |
Total U.S. Treasury Securities (Cost $671,412,253) | | | | | | | | | | | | | | | 678,025,871 | | | | 54.56 | |
| | | | | | | | | | | | | | | | | | | | |
| | | | | |
Yankee Corporate Bonds and Notes: 1.58% | | | | | | | | | | | | | | | | | | | | |
| | | | | |
Financials: 1.58% | | | | | | | | | | | | | | | | | | | | |
| | | | | |
| Banks: 1.58% | | | | | | | | | | | | | | | | | | | | |
Bank of Nova Scotia 144A | | | 1.65 | | | | 10-29-2015 | | | | 13,235,000 | | | | 13,257,102 | | | | 1.06 | |
Royal Bank of Canada Incorporated | | | 2.00 | | | | 10-1-2018 | | | | 6,370,000 | | | | 6,436,923 | | | | 0.52 | |
| | | | | |
Total Yankee Corporate Bonds and Notes (Cost $19,601,211) | | | | | | | | | | | | | | | 19,694,025 | | | | 1.58 | |
| | | | | | | | | | | | | | | | | | | | |
| | | | | |
Yankee Government Bonds: 0.87% | | | | | | | | | | | | | | | | | | | | |
Hashemite Kingdom of Jordan | | | 2.58 | | | | 6-30-2022 | | | | 10,630,000 | | | | 10,775,163 | | | | 0.87 | |
| | | | | | | | | | | | | | | | | | | | |
| | | | | |
Total Yankee Government Bonds (Cost $10,630,000) | | | | | | | | | | | | | | | 10,775,163 | | | | 0.87 | |
| | | | | | | | | | | | | | | | | | | | |
| | | | | |
| | | Yield | | | | | | Shares | | | | | | | |
| Short-Term Investments: 1.61% | | | | | | | | | | | | | | | | | | | | |
| | | | | |
| Investment Companies: 1.47% | | | | | | | | | | | | | | | | | | | | |
Wells Fargo Advantage Government Money Market Fund, Institutional Class ##(l)(u) | | | 0.01 | | | | | | | | 18,254,235 | | | | 18,254,235 | | | | 1.47 | |
| | | | | | | | | | | | | | | | | | | | |
The accompanying notes are an integral part of these financial statements.
| | | | | | |
| Summary portfolio of investments—August 31, 2015 | | Wells Fargo Advantage Government Securities Fund | | | 11 | |
| | | | | | | | | | | | | | | | | | | | |
| Security name | | Yield | | | Maturity date | | | Principal | | | Value | | | Percent of net assets | |
| | | | | | | | | | | | | | | | | | | | |
| | | | | |
| U.S. Treasury Securities: 0.14% | | | | | | | | | | | | | | | | | | | | |
U.S. Treasury Bill (z)# | | | 0.01 | % | | | 9-17-2015 | | | $ | 1,775,000 | | | $ | 1,774,998 | | | | 0.14 | % |
| | | | | | | | | | | | | | | | | | | | |
| | | | | |
Total Short-Term Investments (Cost $20,029,229) | | | | | | | | | | | | | | | 20,029,233 | | | | 1.61 | |
| | | | | | | | | | | | | | | | | | | | |
| | | | | |
| | | Interest rate | | | | | | | | | | | | | |
| TBA Sale Commitments: (0.29%) | | | | | | | | | | | | | | | | | | | | |
FNMA %% | | | 5.50 | | | | 9-14-2045 | | | | (3,250,000 | ) | | | (3,635,938 | ) | | | (0.29 | ) |
| | | | | | | | | | | | | | | | | | | | |
| | | | | |
Total TBA Sale Commitments (Proceeds $(3,640,000)) | | | | | | | | | | | | | | | (3,635,938 | ) | | | (0.29 | ) |
| | | | | | | | | | | | | | | | | | | | |
| | |
| Total investments in securities (excluding TBA sale commitments) (Cost $1,608,702,596) * | | | | 1,631,048,790 | | | | 131.24 | % |
Total TBA sale commitments | | | | | | | | | | | | | | | (3,635,938 | ) | | | (0.29 | ) |
Other assets and liabilities, net | | | | | | | | | | | | | | | (384,634,729 | ) | | | (30.95 | ) |
| | | | | | | | | | | | | | | | | | | | |
| Total net assets | | | | | | | | | | | | | | $ | 1,242,778,123 | | | | 100.00 | % |
| | | | | | | | | | | | | | | | | | | | |
| ¤ | The security is issued in zero coupon form with no periodic interest payments. |
| %% | Security issued on a when-issued basis |
| ± | Variable rate investment. The rate shown is the rate in effect at period end. |
| ## | All or a portion of this security has been segregated for when-issued securities. |
| 144A | The security may be resold in transactions exempt from registration, normally to qualified institutional buyers, pursuant to Rule 144A under the Securities Act of 1933. |
| (l) | The security represents an affiliate of the Fund as defined in the Investment Company Act of 1940. |
| (u) | The rate represents the 7-day annualized yield at period end. |
| (z) | Zero coupon security. The rate represents the current yield to maturity. |
| # | All or a portion of this security is segregated as collateral for investments in derivative instruments. |
| * | Cost for federal income tax purposes is $1,609,447,026 and unrealized gains (losses) consists of: |
| | | | |
Gross unrealized gains | | $ | 28,698,849 | |
Gross unrealized losses | | | (7,097,085 | ) |
| | | | |
Net unrealized gains | | $ | 21,601,764 | |
The accompanying notes are an integral part of these financial statements.
| | | | |
| 12 | | Wells Fargo Advantage Government Securities Fund | | Statement of assets and liabilities—August 31, 2015 |
| | | | |
| | | | |
| |
Assets | | | | |
Investments | | | | |
In unaffiliated securities, at value (cost $1,590,448,361) | | $ | 1,612,794,555 | |
In affiliated securities, at value (cost $18,254,235) | | | 18,254,235 | |
| | | | |
Total investments, at value (cost $1,608,702,596) | | | 1,631,048,790 | |
Cash | | | 280,344 | |
Receivable for investments sold | | | 3,646,455 | |
Principal paydown receivable | | | 30,883 | |
Receivable for Fund shares sold | | | 508,317 | |
Receivable for interest | | | 3,490,560 | |
Receivable for daily variation margin on open futures contracts | | | 17,219 | |
Prepaid expenses and other assets | | | 41,100 | |
| | | | |
Total assets | | | 1,639,063,668 | |
| | | | |
| |
Liabilities | | | | |
Dividends payable | | | 46,417 | |
Payable for investments purchased | | | 389,298,941 | |
Payable for Fund shares redeemed | | | 2,168,257 | |
Payable for daily variation margin on open futures contracts | | | 210,375 | |
Payable for interest on TBA sale commitments | | | 6,455 | |
TBA sale commitments, at value (proceeds $3,640,000) | | | 3,635,938 | |
Management fee payable | | | 393,626 | |
Distribution fees payable | | | 17,770 | |
Administration fees payable | | | 134,409 | |
Accrued expenses and other liabilities | | | 373,357 | |
| | | | |
Total liabilities | | | 396,285,545 | |
| | | | |
Total net assets | | $ | 1,242,778,123 | |
| | | | |
| |
NET ASSETS CONSIST OF | | | | |
Paid-in capital | | $ | 1,232,258,450 | |
Overdistributed net investment income | | | (12,581,307 | ) |
Accumulated net realized gains on investments | | | 2,398,681 | |
Net unrealized gains on investments | | | 20,702,299 | |
| | | | |
Total net assets | | $ | 1,242,778,123 | |
| | | | |
| |
COMPUTATION OF NET ASSET VALUE AND OFFERING PRICE PER SHARE | | | | |
Net assets – Class A | | $ | 232,545,098 | |
Shares outstanding – Class A1 | | | 20,732,992 | |
Net asset value per share – Class A | | | $11.22 | |
Maximum offering price per share – Class A2 | | | $11.75 | |
Net assets – Class B | | $ | 536,557 | |
Shares outstanding – Class B1 | | | 47,847 | |
Net asset value per share – Class B | | | $11.21 | |
Net assets – Class C | | $ | 26,980,533 | |
Shares outstanding – Class C1 | | | 2,405,830 | |
Net asset value per share – Class C | | | $11.21 | |
Net assets – Administrator Class | | $ | 216,427,836 | |
Shares outstanding – Administrator Class1 | | | 19,302,633 | |
Net asset value per share – Administrator Class | | | $11.21 | |
Net assets – Institutional Class | | $ | 468,858,862 | |
Shares outstanding – Institutional Class1 | | | 41,838,729 | |
Net asset value per share – Institutional Class | | | $11.21 | |
Net assets – Investor Class | | $ | 297,429,237 | |
Shares outstanding – Investor Class1 | | | 26,502,195 | |
Net asset value per share – Investor Class | | | $11.22 | |
| 1 | The Fund has an unlimited number of authorized shares. |
| 2 | Maximum offering price is computed as 100/95.50 of net asset value. On investments of $50,000 or more, the offering price is reduced. |
The accompanying notes are an integral part of these financial statements.
| | | | | | |
| Statement of operations—year ended August 31, 2015 | | Wells Fargo Advantage Government Securities Fund | | | 13 | |
| | | | |
| | | | |
| |
Investment income | | | | |
Interest | | $ | 18,556,788 | |
Income from affiliated securities | | | 1,319 | |
| | | | |
Total investment income | | | 18,558,107 | |
| | | | |
| |
Expenses | | | | |
Management fee | | | 5,444,088 | |
Administration fees | | | | |
Class A | | | 326,875 | |
Class B | | | 1,278 | |
Class C | | | 47,402 | |
Administrator Class | | | 198,059 | |
Institutional Class | | | 410,092 | |
Investor Class | | | 612,053 | |
Shareholder servicing fees | | | | |
Class A | | | 510,742 | |
Class B | | | 1,997 | |
Class C | | | 74,066 | |
Administrator Class | | | 480,331 | |
Investor Class | | | 803,763 | |
Distribution fees | | | | |
Class B | | | 5,990 | |
Class C | | | 222,197 | |
Custody and accounting fees | | | 83,732 | |
Professional fees | | | 76,968 | |
Registration fees | | | 55,947 | |
Shareholder report expenses | | | 90,247 | |
Trustees’ fees and expenses | | | 7,881 | |
Other fees and expenses | | | 40,916 | |
| | | | |
Total expenses | | | 9,494,624 | |
Less: Fee waivers and/or expense reimbursements | | | (708,485 | ) |
| | | | |
Net expenses | | | 8,786,139 | |
| | | | |
Net investment income | | | 9,771,968 | |
| | | | |
| |
REALIZED AND UNREALIZED GAINS (LOSSES) ON INVESTMENTS | | | | |
| |
Net realized gains on: | | | | |
Unaffiliated securities | | | 15,820,082 | |
Futures transactions | | | 7,340,069 | |
| | | | |
Net realized gains on investments | | | 23,160,151 | |
| | | | |
| |
Net change in unrealized gains (losses) on: | | | | |
Unaffiliated securities | | | (6,290,872 | ) |
Futures transactions | | | (2,117,120 | ) |
TBA sale commitments | | | 4,062 | |
| | | | |
Net change in unrealized gains (losses) on investments | | | (8,403,930 | ) |
| | | | |
Net realized and unrealized gains (losses) on investments | | | 14,756,221 | |
| | | | |
Net increase in net assets resulting from operations | | $ | 24,528,189 | |
| | | | |
The accompanying notes are an integral part of these financial statements.
| | | | |
| 14 | | Wells Fargo Advantage Government Securities Fund | | Statement of changes in net assets |
| | | | | | | | | | | | | | | | |
| | | Year ended
August 31, 2015 | | | Year ended
August 31, 2014 | |
| | | |
Operations | | | | | | | | | | | | |
Net investment income | | | | | | $ | 9,771,968 | | | | | | | $ | 9,641,392 | |
Net realized gains on investments | | | | | | | 23,160,151 | | | | | | | | 26,150,713 | |
Net change in unrealized gains (losses) on investments | | | | | | | (8,403,930 | ) | | | | | | | 23,009,547 | |
| | | | |
Net increase in net assets resulting from operations | | | | | | | 24,528,189 | | | | | | | | 58,801,652 | |
| | | | |
| | | |
Distributions to shareholders from | | | | | | | | | | | | |
Net investment income | | | | | | | | | | | | | | | | |
Class A | | | | | | | (1,703,954 | ) | | | | | | | (1,872,053 | ) |
Class B | | | | | | | (832 | ) | | | | | | | (4,542 | ) |
Class C | | | | | | | (28,250 | ) | | | | | | | (97,114 | ) |
Administrator Class | | | | | | | (2,081,044 | ) | | | | | | | (2,550,531 | ) |
Institutional Class | | | | | | | (6,227,671 | ) | | | | | | | (7,287,898 | ) |
Investor Class | | | | | | | (2,626,026 | ) | | | | | | | (3,734,536 | ) |
| | | | |
Total distributions to shareholders | | | | | | | (12,667,777 | ) | | | | | | | (15,546,674 | ) |
| | | | |
| | | | |
Capital share transactions | | | Shares | | | | | | | | Shares | | | | | |
Proceeds from shares sold | | | | | | | | | | | | | | | | |
Class A | | | 8,954,742 | | | | 101,054,999 | | | | 1,334,647 | | | | 14,597,639 | |
Class B | | | 1,366 | | | | 15,353 | | | | 3,268 | | | | 35,619 | |
Class C | | | 215,398 | | | | 2,419,561 | | | | 104,199 | | | | 1,140,397 | |
Administrator Class | | | 8,056,276 | | | | 90,448,540 | | | | 5,338,839 | | | | 58,457,305 | |
Institutional Class | | | 10,133,981 | | | | 113,615,861 | | | | 11,859,778 | | | | 129,354,060 | |
Investor Class | | | 4,347,873 | | | | 48,789,291 | | | | 3,439,701 | | | | 37,627,752 | |
| | | | |
| | | | | | | 356,343,605 | | | | | | | | 241,212,772 | |
| | | | |
Reinvestment of distributions | | | | | | | | | | | | | | | | |
Class A | | | 132,277 | | | | 1,487,481 | | | | 150,226 | | | | 1,639,169 | |
Class B | | | 55 | | | | 612 | | | | 350 | | | | 3,778 | |
Class C | | | 971 | | | | 10,885 | | | | 3,431 | | | | 37,019 | |
Administrator Class | | | 178,706 | | | | 2,007,738 | | | | 199,621 | | | | 2,179,413 | |
Institutional Class | | | 527,852 | | | | 5,927,967 | | | | 652,963 | | | | 7,128,143 | |
Investor Class | | | 227,765 | | | | 2,561,820 | | | | 333,416 | | | | 3,639,504 | |
| | | | |
| | | | | | | 11,996,503 | | | | | | | | 14,627,026 | |
| | | | |
Payment for shares redeemed | | | | | | | | | | | | | | | | |
Class A | | | (3,992,999 | ) | | | (44,888,826 | ) | | | (4,693,790 | ) | | | (51,288,609 | ) |
Class B | | | (57,706 | ) | | | (648,068 | ) | | | (109,977 | ) | | | (1,201,292 | ) |
Class C | | | (682,542 | ) | | | (7,665,778 | ) | | | (1,382,379 | ) | | | (15,072,513 | ) |
Administrator Class | | | (7,982,527 | ) | | | (89,380,947 | ) | | | (18,024,531 | ) | | | (196,102,002 | ) |
Institutional Class | | | (17,526,446 | ) | | | (196,591,403 | ) | | | (16,381,291 | ) | | | (177,928,722 | ) |
Investor Class | | | (8,619,296 | ) | | | (96,975,184 | ) | | | (13,804,746 | ) | | | (150,877,755 | ) |
| | | | |
| | | | | | | (436,150,206 | ) | | | | | | | (592,470,893 | ) |
| | | | |
Net decrease in net assets resulting from capital share transactions | | | | | | | (67,810,098 | ) | | | | | | | (336,631,095 | ) |
| | | | |
Total decrease in net assets | | | | | | | (55,949,686 | ) | | | | | | | (293,376,117 | ) |
| | | | |
| | |
Net assets | | | | | | | | |
Beginning of period | | | | | | | 1,298,727,809 | | | | | | | | 1,592,103,926 | |
| | | | |
End of period | | | | | | $ | 1,242,778,123 | | | | | | | $ | 1,298,727,809 | |
| | | | |
Overdistributed net investment income | | | | | | $ | (12,581,307 | ) | | | | | | $ | (10,750,170 | ) |
| | | | |
The accompanying notes are an integral part of these financial statements.
| | | | | | |
| Financial highlights | | Wells Fargo Advantage Government Securities Fund | | | 15 | |
(For a share outstanding throughout each period)
| | | | | | | | | | | | | | | | | | | | |
| | | Year ended August 31 | |
| CLASS A | | 2015 | | | 2014 | | | 2013 | | | 2012 | | | 2011 | |
Net asset value, beginning of period | | | $11.11 | | | | $10.77 | | | | $11.48 | | | | $11.23 | | | | $11.16 | |
Net investment income | | | 0.07 | 1 | | | 0.05 | | | | 0.07 | | | | 0.15 | | | | 0.25 | |
Net realized and unrealized gains (losses) on investments | | | 0.13 | | | | 0.40 | | | | (0.42 | ) | | | 0.33 | | | | 0.16 | |
| | | | | | | | | | | | | | | | | | | | |
Total from investment operations | | | 0.20 | | | | 0.45 | | | | (0.35 | ) | | | 0.48 | | | | 0.41 | |
Distributions to shareholders from | | | | | | | | | | | | | | | | | | | | |
Net investment income | | | (0.09 | ) | | | (0.11 | ) | | | (0.09 | ) | | | (0.17 | ) | | | (0.34 | ) |
Net realized gains | | | 0.00 | | | | 0.00 | | | | (0.27 | ) | | | (0.06 | ) | | | 0.00 | |
| | | | | | | | | | | | | | | | | | | | |
Total distributions to shareholders | | | (0.09 | ) | | | (0.11 | ) | | | (0.36 | ) | | | (0.23 | ) | | | (0.34 | ) |
Net asset value, end of period | | | $11.22 | | | | $11.11 | | | | $10.77 | | | | $11.48 | | | | $11.23 | |
Total return2 | | | 1.84 | % | | | 4.19 | % | | | (3.22 | )% | | | 4.35 | % | | | 3.75 | % |
Ratios to average net assets (annualized) | | | | | | | | | | | | | | | | | | | | |
Gross expenses | | | 0.87 | % | | | 0.88 | % | | | 0.85 | % | | | 0.86 | % | | | 0.85 | % |
Net expenses | | | 0.85 | % | | | 0.86 | % | | | 0.85 | % | | | 0.86 | % | | | 0.85 | % |
Net investment income | | | 0.59 | % | | | 0.56 | % | | | 0.67 | % | | | 1.35 | % | | | 2.31 | % |
Supplemental data | | | | | | | | | | | | | | | | | | | | |
Portfolio turnover rate | | | 349 | % | | | 349 | % | | | 341 | % | | | 327 | % | | | 268 | % |
Net assets, end of period (000s omitted) | | | $232,545 | | | | $173,772 | | | | $202,955 | | | | $258,329 | | | | $270,253 | |
| 1 | Calculated based upon average shares outstanding |
| 2 | Total return calculations do not include any sales charges. |
The accompanying notes are an integral part of these financial statements.
| | | | |
| 16 | | Wells Fargo Advantage Government Securities Fund | | Financial highlights |
(For a share outstanding throughout each period)
| | | | | | | | | | | | | | | | | | | | |
| | | Year ended August 31 | |
| CLASS B | | 2015 | | | 2014 | | | 2013 | | | 2012 | | | 2011 | |
Net asset value, beginning of period | | | $11.11 | | | | $10.77 | | | | $11.48 | | | | $11.23 | | | | $11.16 | |
Net investment income (loss) | | | (0.01 | )1 | | | (0.02 | )1 | | | (0.03 | ) | | | 0.08 | 1 | | | 0.15 | |
Net realized and unrealized gains (losses) on investments | | | 0.12 | | | | 0.39 | | | | (0.41 | ) | | | 0.31 | | | | 0.17 | |
| | | | | | | | | | | | | | | | | | | | |
Total from investment operations | | | 0.11 | | | | 0.37 | | | | (0.44 | ) | | | 0.39 | | | | 0.32 | |
Distributions to shareholders from | | | | | | | | | | | | | | | | | | | | |
Net investment income | | | (0.01 | ) | | | (0.03 | ) | | | (0.00 | )2 | | | (0.08 | ) | | | (0.25 | ) |
Net realized gains | | | 0.00 | | | | 0.00 | | | | (0.27 | ) | | | (0.06 | ) | | | 0.00 | |
| | | | | | | | | | | | | | | | | | | | |
Total distributions to shareholders | | | (0.01 | ) | | | (0.03 | ) | | | (0.27 | ) | | | (0.14 | ) | | | (0.25 | ) |
Net asset value, end of period | | | $11.21 | | | | $11.11 | | | | $10.77 | | | | $11.48 | | | | $11.23 | |
Total return3 | | | 0.99 | % | | | 3.42 | % | | | (3.94 | )% | | | 3.57 | % | | | 2.98 | % |
Ratios to average net assets (annualized) | | | | | | | | | | | | | | | | | | | | |
Gross expenses | | | 1.62 | % | | | 1.61 | % | | | 1.60 | % | | | 1.61 | % | | | 1.60 | % |
Net expenses | | | 1.60 | % | | | 1.60 | % | | | 1.60 | % | | | 1.61 | % | | | 1.60 | % |
Net investment income (loss) | | | (0.10 | )% | | | (0.18 | )% | | | (0.08 | )% | | | 0.68 | % | | | 1.55 | % |
Supplemental data | | | | | | | | | | | | | | | | | | | | |
Portfolio turnover rate | | | 349 | % | | | 349 | % | | | 341 | % | | | 327 | % | | | 268 | % |
Net assets, end of period (000s omitted) | | | $537 | | | | $1,157 | | | | $2,266 | | | | $4,727 | | | | $7,083 | |
| 1 | Calculated based upon average shares outstanding |
| 2 | Amount is less than $0.005. |
| 3 | Total return calculations do not include any sales charges. |
The accompanying notes are an integral part of these financial statements.
| | | | | | |
| Financial highlights | | Wells Fargo Advantage Government Securities Fund | | | 17 | |
(For a share outstanding throughout each period)
| | | | | | | | | | | | | | | | | | | | |
| | | Year ended August 31 | |
| CLASS C | | 2015 | | | 2014 | | | 2013 | | | 2012 | | | 2011 | |
Net asset value, beginning of period | | | $11.11 | | | | $10.77 | | | | $11.48 | | | | $11.23 | | | | $11.16 | |
Net investment income (loss) | | | (0.01 | )1 | | | (0.02 | )1 | | | (0.02 | ) | | | 0.07 | | | | 0.17 | |
Net realized and unrealized gains (losses) on investments | | | 0.12 | | | | 0.39 | | | | (0.42 | ) | | | 0.32 | | | | 0.15 | |
| | | | | | | | | | | | | | | | | | | | |
Total from investment operations | | | 0.11 | | | | 0.37 | | | | (0.44 | ) | | | 0.39 | | | | 0.32 | |
Distributions to shareholders from | | | | | | | | | | | | | | | | | | | | |
Net investment income | | | (0.01 | ) | | | (0.03 | ) | | | (0.00 | )2 | | | (0.08 | ) | | | (0.25 | ) |
Net realized gains | | | 0.00 | | | | 0.00 | | | | (0.27 | ) | | | (0.06 | ) | | | 0.00 | |
| | | | | | | | | | | | | | | | | | | | |
Total distributions to shareholders | | | (0.01 | ) | | | (0.03 | ) | | | (0.27 | ) | | | (0.14 | ) | | | (0.25 | ) |
Net asset value, end of period | | | $11.21 | | | | $11.11 | | | | $10.77 | | | | $11.48 | | | | $11.23 | |
Total return3 | | | 1.08 | % | | | 3.42 | % | | | (3.94 | )% | | | 3.57 | % | | | 2.98 | % |
Ratios to average net assets (annualized) | | | | | | | | | | | | | | | | | | | | |
Gross expenses | | | 1.62 | % | | | 1.63 | % | | | 1.60 | % | | | 1.61 | % | | | 1.60 | % |
Net expenses | | | 1.60 | % | | | 1.61 | % | | | 1.60 | % | | | 1.61 | % | | | 1.60 | % |
Net investment income (loss) | | | (0.13 | )% | | | (0.20 | )% | | | (0.08 | )% | | | 0.55 | % | | | 1.56 | % |
Supplemental data | | | | | | | | | | | | | | | | | | | | |
Portfolio turnover rate | | | 349 | % | | | 349 | % | | | 341 | % | | | 327 | % | | | 268 | % |
Net assets, end of period (000s omitted) | | | $26,981 | | | | $31,908 | | | | $44,647 | | | | $75,244 | | | | $58,576 | |
| 1 | Calculated based upon average shares outstanding |
| 2 | Amount is less than $0.005. |
| 3 | Total return calculations do not include any sales charges. |
The accompanying notes are an integral part of these financial statements.
| | | | |
| 18 | | Wells Fargo Advantage Government Securities Fund | | Financial highlights |
(For a share outstanding throughout each period)
| | | | | | | | | | | | | | | | | | | | |
| | | Year ended August 31 | |
| ADMINISTRATOR CLASS | | 2015 | | | 2014 | | | 2013 | | | 2012 | | | 2011 | |
Net asset value, beginning of period | | | $11.11 | | | | $10.76 | | | | $11.48 | | | | $11.23 | | | | $11.16 | |
Net investment income | | | 0.10 | | | | 0.06 | | | | 0.09 | | | | 0.17 | 1 | | | 0.27 | 1 |
Net realized and unrealized gains (losses) on investments | | | 0.12 | | | | 0.42 | | | | (0.43 | ) | | | 0.33 | | | | 0.16 | |
| | | | | | | | | | | | | | | | | | | | |
Total from investment operations | | | 0.22 | | | | 0.48 | | | | (0.34 | ) | | | 0.50 | | | | 0.43 | |
Distributions to shareholders from | | | | | | | | | | | | | | | | | | | | |
Net investment income | | | (0.12 | ) | | | (0.13 | ) | | | (0.11 | ) | | | (0.19 | ) | | | (0.36 | ) |
Net realized gains | | | 0.00 | | | | 0.00 | | | | (0.27 | ) | | | (0.06 | ) | | | 0.00 | |
| | | | | | | | | | | | | | | | | | | | |
Total distributions to shareholders | | | (0.12 | ) | | | (0.13 | ) | | | (0.38 | ) | | | (0.25 | ) | | | (0.36 | ) |
Net asset value, end of period | | | $11.21 | | | | $11.11 | | | | $10.76 | | | | $11.48 | | | | $11.23 | |
Total return | | | 1.97 | % | | | 4.51 | % | | | (3.10 | )% | | | 4.57 | % | | | 3.97 | % |
Ratios to average net assets (annualized) | | | | | | | | | | | | | | | | | | | | |
Gross expenses | | | 0.80 | % | | | 0.81 | % | | | 0.79 | % | | | 0.79 | % | | | 0.74 | % |
Net expenses | | | 0.64 | % | | | 0.64 | % | | | 0.64 | % | | | 0.64 | % | | | 0.64 | % |
Net investment income | | | 0.82 | % | | | 0.79 | % | | | 0.88 | % | | | 1.49 | % | | | 2.50 | % |
Supplemental data | | | | | | | | | | | | | | | | | | | | |
Portfolio turnover rate | | | 349 | % | | | 349 | % | | | 341 | % | | | 327 | % | | | 268 | % |
Net assets, end of period (000s omitted) | | | $216,428 | | | | $211,589 | | | | $339,446 | | | | $436,578 | | | | $276,334 | |
| 1 | Calculated based upon average shares outstanding |
The accompanying notes are an integral part of these financial statements.
| | | | | | |
| Financial highlights | | Wells Fargo Advantage Government Securities Fund | | | 19 | |
(For a share outstanding throughout each period)
| | | | | | | | | | | | | | | | | | | | |
| | | Year ended August 31 | |
| INSTITUTIONAL CLASS | | 2015 | | | 2014 | | | 2013 | | | 2012 | | | 2011 | |
Net asset value, beginning of period | | | $11.10 | | | | $10.76 | | | | $11.47 | | | | $11.22 | | | | $11.15 | |
Net investment income | | | 0.11 | 1 | | | 0.10 | | | | 0.11 | | | | 0.19 | 1 | | | 0.30 | |
Net realized and unrealized gains (losses) on investments | | | 0.14 | | | | 0.39 | | | | (0.42 | ) | | | 0.33 | | | | 0.15 | |
| | | | | | | | | | | | | | | | | | | | |
Total from investment operations | | | 0.25 | | | | 0.49 | | | | (0.31 | ) | | | 0.52 | | | | 0.45 | |
Distributions to shareholders from | | | | | | | | | | | | | | | | | | | | |
Net investment income | | | (0.14 | ) | | | (0.15 | ) | | | (0.13 | ) | | | (0.21 | ) | | | (0.38 | ) |
Net realized gains | | | 0.00 | | | | 0.00 | | | | (0.27 | ) | | | (0.06 | ) | | | 0.00 | |
| | | | | | | | | | | | | | | | | | | | |
Total distributions to shareholders | | | (0.14 | ) | | | (0.15 | ) | | | (0.40 | ) | | | (0.27 | ) | | | (0.38 | ) |
Net asset value, end of period | | | $11.21 | | | | $11.10 | | | | $10.76 | | | | $11.47 | | | | $11.22 | |
Total return | | | 2.22 | % | | | 4.59 | % | | | (2.86 | )% | | | 4.74 | % | | | 4.14 | % |
Ratios to average net assets (annualized) | | | | | | | | | | | | | | | | | | | | |
Gross expenses | | | 0.54 | % | | | 0.55 | % | | | 0.52 | % | | | 0.53 | % | | | 0.52 | % |
Net expenses | | | 0.48 | % | | | 0.48 | % | | | 0.48 | % | | | 0.48 | % | | | 0.48 | % |
Net investment income | | | 0.99 | % | | | 0.94 | % | | | 1.05 | % | | | 1.71 | % | | | 2.71 | % |
Supplemental data | | | | | | | | | | | | | | | | | | | | |
Portfolio turnover rate | | | 349 | % | | | 349 | % | | | 341 | % | | | 327 | % | | | 268 | % |
Net assets, end of period (000s omitted) | | | $468,859 | | | | $540,684 | | | | $565,573 | | | | $778,919 | | | | $718,411 | |
| 1 | Calculated based upon average shares outstanding |
The accompanying notes are an integral part of these financial statements.
| | | | |
| 20 | | Wells Fargo Advantage Government Securities Fund | | Financial highlights |
(For a share outstanding throughout each period)
| | | | | | | | | | | | | | | | | | | | |
| | | Year ended August 31 | |
| INVESTOR CLASS | | 2015 | | | 2014 | | | 2013 | | | 2012 | | | 2011 | |
Net asset value, beginning of period | | | $11.12 | | | | $10.77 | | | | $11.49 | | | | $11.24 | | | | $11.17 | |
Net investment income | | | 0.07 | 1 | | | 0.04 | | | | 0.07 | | | | 0.15 | 1 | | | 0.25 | 1 |
Net realized and unrealized gains (losses) on investments | | | 0.12 | | | | 0.42 | | | | (0.44 | ) | | | 0.33 | | | | 0.15 | |
| | | | | | | | | | | | | | | | | | | | |
Total from investment operations | | | 0.19 | | | | 0.46 | | | | (0.37 | ) | | | 0.48 | | | | 0.40 | |
Distributions to shareholders from | | | | | | | | | | | | | | | | | | | | |
Net investment income | | | (0.09 | ) | | | (0.11 | ) | | | (0.08 | ) | | | (0.17 | ) | | | (0.33 | ) |
Net realized gains | | | 0.00 | | | | 0.00 | | | | (0.27 | ) | | | (0.06 | ) | | | 0.00 | |
| | | | | | | | | | | | | | | | | | | | |
Total distributions to shareholders | | | (0.09 | ) | | | (0.11 | ) | | | (0.35 | ) | | | (0.23 | ) | | | (0.33 | ) |
Net asset value, end of period | | | $11.22 | | | | $11.12 | | | | $10.77 | | | | $11.49 | | | | $11.24 | |
Total return | | | 1.72 | % | | | 4.25 | % | | | (3.33 | )% | | | 4.31 | % | | | 3.72 | % |
Ratios to average net assets (annualized) | | | | | | | | | | | | | | | | | | | | |
Gross expenses | | | 0.90 | % | | | 0.90 | % | | | 0.87 | % | | | 0.89 | % | | | 0.88 | % |
Net expenses | | | 0.88 | % | | | 0.89 | % | | | 0.87 | % | | | 0.89 | % | | | 0.88 | % |
Net investment income | | | 0.59 | % | | | 0.53 | % | | | 0.65 | % | | | 1.33 | % | | | 2.25 | % |
Supplemental data | | | | | | | | | | | | | | | | | | | | |
Portfolio turnover rate | | | 349 | % | | | 349 | % | | | 341 | % | | | 327 | % | | | 268 | % |
Net assets, end of period (000s omitted) | | | $297,429 | | | | $339,618 | | | | $437,217 | | | | $640,561 | | | | $678,022 | |
| 1 | Calculated based upon average shares outstanding |
The accompanying notes are an integral part of these financial statements.
| | | | | | |
| Notes to financial statements | | Wells Fargo Advantage Government Securities Fund | | | 21 | |
1. ORGANIZATION
Wells Fargo Funds Trust (the “Trust”), a Delaware statutory trust organized on March 10, 1999, is an open-end management investment company registered under the Investment Company Act of 1940, as amended (the “1940 Act”). As an investment company, the Trust follows the accounting and reporting guidance in Financial Accounting Standards Board (“FASB”) Accounting Standards Codification Topic 946, Financial Services – Investment Companies. These financial statements report on the Wells Fargo Advantage Government Securities Fund (the “Fund”) which is a diversified series of the Trust.
2. SIGNIFICANT ACCOUNTING POLICIES
The following significant accounting policies, which are consistently followed in the preparation of the financial statements of the Fund, are in conformity with U.S. generally accepted accounting principles which require management to make estimates and assumptions that affect the reported amounts of assets and liabilities, disclosure of contingent assets and liabilities at the date of the financial statements, and the reported amounts of revenues and expenses during the reporting period. Actual results could differ from those estimates.
Securities valuation
All investments are valued each business day as of the close of regular trading on the New York Stock Exchange (generally 4 p.m. Eastern Time).
Debt securities are valued at the evaluated bid price provided by an independent pricing service or, if a reliable price is not available, the quoted bid price from an independent broker-dealer.
Futures that are listed on a foreign or domestic exchange or market are valued at the official closing price or, if none, the last sales price.
Investments in registered open-end investment companies are valued at net asset value.
Investments which are not valued using any of the methods discussed above are valued at their fair value, as determined in good faith by the Board of Trustees of the Fund. The Board of Trustees has established a Valuation Committee comprised of the Trustees and has delegated to it the authority to take any actions regarding the valuation of portfolio securities that the Valuation Committee deems necessary or appropriate, including determining the fair value of portfolio securities, unless the determination has been delegated to the Management Valuation Team of Wells Fargo Funds Management, LLC (“Funds Management”). The Board of Trustees retains the authority to make or ratify any valuation decisions or approve any changes to the Valuation Procedures as it deems appropriate. On a quarterly basis, the Board of Trustees receives reports on any valuation actions taken by the Valuation Committee or the Management Valuation Team which may include items for ratification.
Valuations of fair valued securities are compared to the next actual sales price when available, or other appropriate market values, to assess the continued appropriateness of the fair valuation methodologies used. These securities are fair valued on a day-to-day basis, taking into consideration changes to appropriate market information and any significant changes to the inputs considered in the valuation process until there is a readily available price provided on an exchange or by an independent pricing service. Valuations received from an independent pricing service or independent broker-dealer quotes are periodically validated by comparisons to most recent trades and valuations provided by other independent pricing services in addition to the review of prices by the adviser and/or subadviser. Unobservable inputs used in determining fair valuations are identified based on the type of security, taking into consideration factors utilized by market participants in valuing the investment, knowledge about the issuer and the current market environment.
When-issued transactions
The Fund may purchase securities on a forward commitment or when-issued basis. The Fund records a when-issued transaction on the trade date and will segregate assets in an amount at least equal in value to the Fund’s commitment to purchase when-issued securities. Securities purchased on a when-issued basis are marked-to-market daily and the Fund begins earning interest on the settlement date. Losses may arise due to changes in the market value of the underlying securities or if the counterparty does not perform under the contract.
Futures contracts
The Fund is subject to interest rate risk in the normal course of pursuing its investment objectives. The Fund may buy and sell futures contracts in order to gain exposure to, or protect against, changes in security values and interest rates. The primary risks associated with the use of futures contracts are the imperfect correlation between changes in market values of securities held by the Fund and the prices of futures contracts, and the possibility of an illiquid market.
| | | | |
| 22 | | Wells Fargo Advantage Government Securities Fund | | Notes to financial statements |
The aggregate principal amounts of the contracts are not recorded in the financial statements. Fluctuations in the value of the contracts are recorded in the Statement of Assets and Liabilities as an asset or liability and in the Statement of Operations as unrealized gains or losses until the contracts are closed, at which point they are recorded as net realized gains or losses on futures contracts. With futures contracts, there is minimal counterparty risk to the Fund since futures are exchange traded and the exchange’s clearinghouse, as counterparty to all exchange traded futures, guarantees the futures against default.
TBA sale commitments
The Fund may enter into To Be Announced (“TBA”) sale commitments to hedge its portfolio positions or to sell mortgage-backed securities it owns under delayed delivery arrangements. Proceeds of TBA sale commitments are not received until the contractual settlement date. During the time a TBA sale commitment is outstanding, equivalent deliverable securities or offsetting TBA purchase commitments, which are deliverable on or before the sale commitment date, are held as “cover” for the transaction. Unsettled TBA sale commitments are valued at the current market value of the underlying securities, according to the procedures described under “Securities valuation”. The contract is marked-to-market daily and the change in market value is recorded by the Fund as an unrealized gain or loss. If the TBA sale commitment is closed through the acquisition of an offsetting purchase commitment, the Fund realizes a gain or loss. If the Fund delivers securities under the commitment, the Fund realizes a gain or a loss from the sale of the securities based upon the unit price established at the date the commitment was entered into.
Inflation-indexed bonds and TIPS
The Fund may invest in inflation-indexed bonds, including Treasury inflation-protected securities (TIPS). Inflation-indexed bonds are fixed income securities whose principal value is periodically adjusted according to the rate of inflation. If the index measuring inflation falls, the principal value of inflation-indexed bonds (other than municipal inflation indexed bonds and certain corporate inflation-indexed bonds) will be adjusted downward, and consequently the interest payable on these securities (calculated with respect to a smaller principal amount) will be reduced. Repayment of the original bond principal upon maturity (as adjusted for inflation) is guaranteed in the case of U.S. Treasury inflation-indexed bonds. For bonds that do not provide a similar guarantee, the adjusted principal value of the bond repaid at maturity may be less than the original principal. The value of inflation-indexed bonds is expected to change in response to changes in real interest rates. Real interest rates are tied to the relationship between nominal interest rates and the rate of inflation. If nominal interest rates increase at a faster rate than inflation, real interest rates may rise, leading to a decrease in value of inflation-indexed bonds. Inflation-indexed bonds, including TIPS, decline in value when real interest rates rise. In certain interest rate environments, such as when real interest rates are rising faster than nominal interest rates, inflation-indexed bonds may experience greater losses than other fixed income securities with similar durations.
Security transactions and income recognition
Securities transactions are recorded on a trade date basis. Realized gains or losses are recorded on the basis of identified cost.
Interest income is accrued daily and bond discounts are accreted and premiums are amortized daily based on the effective interest method. To the extent debt obligations are placed on non-accrual status, any related interest income may be reduced by writing off interest receivables when the collection of all or a portion of interest has become doubtful based on consistently applied procedures. If the issuer subsequently resumes interest payments or when the collectability of interest is reasonably assured, the debt obligation is removed from non-accrual status.
Distributions to shareholders
Distributions to shareholders from net investment income are accrued daily and paid monthly. Distributions from net realized gains, if any, are recorded on the ex-dividend date. Such distributions are determined in conformity with federal income tax regulations, which may differ in amount or character from net investment income and realized gains recognized for purposes of U.S. generally accepted accounting principles.
Federal and other taxes
The Fund intends to continue to qualify as a regulated investment company by distributing substantially all of its investment company taxable income and any net realized capital gains (after reduction for capital loss carryforwards) sufficient to relieve it from all, or substantially all, federal income taxes. Accordingly, no provision for federal income taxes was required.
| | | | | | |
| Notes to financial statements | | Wells Fargo Advantage Government Securities Fund | | | 23 | |
The Fund’s income and federal excise tax returns and all financial records supporting those returns for the prior three fiscal years are subject to examination by the federal and Delaware revenue authorities. Management has analyzed the Fund’s tax positions taken on federal, state, and foreign tax returns for all open tax years and does not believe that there are any uncertain tax positions that require recognition of a tax liability.
Reclassifications are made to the Fund’s capital accounts for permanent tax differences to reflect income and gains available for distribution (or available capital loss carryforwards) under federal income tax regulations. U.S. generally accepted accounting principles require that certain components of net assets be adjusted to reflect permanent differences between financial and tax reporting. These reclassifications have no effect on net assets or net asset values per share. The primary permanent differences causing such reclassifications are due to certain distributions paid. At August 31, 2015, as a result of permanent book-to-tax differences, the following reclassification adjustments were made on the Statement of Assets and Liabilities:
| | |
Overdistributed net
investment income | | Accumulated net
realized gains
on investments |
| $1,064,672 | | $(1,064,672) |
As of August 31, 2015, the Fund had capital loss carryforwards available to offset future net realized capital gains in the amount of $1,568,458 expiring in 2017.
Class allocations
The separate classes of shares offered by the Fund differ principally in applicable sales charges, distribution, shareholder servicing, and administration fees. Class specific expenses are charged directly to that share class. Investment income, common expenses, and realized and unrealized gains (losses) on investments are allocated daily to each class of shares based on the relative proportion of net assets of each class.
3. FAIR VALUATION MEASUREMENTS
Fair value measurements of investments are determined within a framework that has established a fair value hierarchy based upon the various data inputs utilized in determining the value of the Fund’s investments. The three-level hierarchy gives the highest priority to unadjusted quoted prices in active markets for identical assets or liabilities (Level 1) and the lowest priority to significant unobservable inputs (Level 3). The Fund’s investments are classified within the fair value hierarchy based on the lowest level of input that is significant to the fair value measurement. The inputs are summarized into three broad levels as follows:
| n | | Level 1 – quoted prices in active markets for identical securities |
| n | | Level 2 – other significant observable inputs (including quoted prices for similar securities, interest rates, prepayment speeds, credit risk, use of amortized cost, etc.) |
| n | | Level 3 – significant unobservable inputs (including the Fund’s own assumptions in determining the fair value of investments) |
The inputs or methodologies used for valuing investments in securities are not necessarily an indication of the risk associated with investing in those securities.
| | | | |
| 24 | | Wells Fargo Advantage Government Securities Fund | | Notes to financial statements |
The following is a summary of the inputs used in valuing the Fund’s assets and liabilities as of August 31, 2015:
| | | | | | | | | | | | | | | | |
| | | Quoted prices
(Level 1) | | | Other significant
observable inputs
(Level 2) | | | Significant
unobservable inputs
(Level 3) | | | Total | |
Assets | | | | | | | | | | | | | | | | |
Investments in: | | | | | | | | | | | | | | | | |
| | | | |
Agency securities | | $ | 0 | | | $ | 822,918,553 | | | $ | 4,835 | | | $ | 822,923,388 | |
| | | | |
Municipal obligations | | | 0 | | | | 7,557,271 | | | | 0 | | | | 7,557,271 | |
| | | | |
Non-agency mortgage-backed securities | | | 0 | | | | 72,043,839 | | | | 0 | | | | 72,043,839 | |
| | | | |
U.S. Treasury securities | | | 678,025,871 | | | | 0 | | | | 0 | | | | 678,025,871 | |
| | | | |
Yankee corporate bonds and notes | | | 0 | | | | 19,694,025 | | | | 0 | | | | 19,694,025 | |
| | | | |
Yankee government bonds | | | 0 | | | | 10,775,163 | | | | 0 | | | | 10,775,163 | |
| | | | |
Short-term investments | | | | | | | | | | | | | | | | |
Investment companies | | | 18,254,235 | | | | 0 | | | | 0 | | | | 18,254,235 | |
U.S. Treasury securities | | | 1,774,998 | | | | 0 | | | | 0 | | | | 1,774,998 | |
| | | 698,055,104 | | | | 932,988,851 | | | | 4,835 | | | | 1,631,048,790 | |
Futures contracts | | | 17,219 | | | | 0 | | | | 0 | | | | 17,219 | |
Total assets | | $ | 698,072,323 | | | $ | 932,988,851 | | | $ | 4,835 | | | $ | 1,631,066,009 | |
Liabilities | | | | | | | | | | | | | | | | |
| | | | |
TBA sale commitments | | $ | 0 | | | $ | 3,635,938 | | | $ | 0 | | | $ | 3,635,938 | |
Futures contracts | | | 210,375 | | | | 0 | | | | 0 | | | | 210,375 | |
Total liabilities | | $ | 210,375 | | | $ | 3,635,938 | | | $ | 0 | | | $ | 3,846,313 | |
Futures contracts are reported at their variation margin at measurement date, which represents the amount due to/from the Fund at that date. All other assets and liabilities are reported at their market value at measurement date.
The Fund recognizes transfers between levels within the fair value hierarchy at the end of the reporting period. At August 31, 2015, the Fund did not have any transfers into/out of Level 1, Level 2, or Level 3.
4. TRANSACTIONS WITH AFFILIATES
Management fee
Funds Management, an indirect wholly owned subsidiary of Wells Fargo & Company (“Wells Fargo”), is the manager of the Fund and provides advisory and fund-level administrative services under an investment management agreement. Under the investment management agreement, Funds Management is responsible for, among other services, implementing the investment objectives and strategies of the Fund, supervising the applicable subadviser, providing fund-level administrative services in connection with the Fund’s operations, and providing any other fund-level administrative services reasonably necessary for the operation of the Fund. As compensation for its services under the investment management agreement, Funds Management is entitled to receive an annual management fee starting at 0.45% and declining to 0.33% as the average daily net assets of the Fund increase.
Prior to July 1, 2015, Funds Management provided advisory services pursuant to an investment advisory agreement and was entitled to receive an annual fee which started at 0.40% and declined to 0.30% as the average daily net assets of the Fund increased. In addition, fund-level administrative services were provided by Funds Management under a separate administration agreement at an annual fee which started at 0.05% and declined to 0.03% as the average daily net assets of the Fund increased. For financial statement purposes, the advisory fee and fund-level administration fee for the year ended August 31, 2015 have been included in management fee on the Statement of Operations.
For the year ended August 31, 2015, the management fee was equivalent to an annual rate of 0.43% of the Fund’s average daily net assets.
| | | | | | |
| Notes to financial statements | | Wells Fargo Advantage Government Securities Fund | | | 25 | |
Funds Management has retained the services of a subadviser to provide daily portfolio management to the Fund. The fee for subadvisory services is borne by Funds Management. Wells Capital Management Incorporated, an affiliate of Funds Management and an indirect wholly owned subsidiary of Wells Fargo, is the subadviser to the Fund and is entitled to receive a fee from Funds Management at an annual rate starting at 0.20% and declining to 0.10% as the average daily net assets of the Fund increase.
Administration fees
Under a class-level administration agreement, Funds Management provides class-level administrative services to the Fund, which includes paying fees and expenses for services provided by the transfer agent, sub-transfer agents, omnibus account servicers and record-keepers. As compensation for its services under the class-level administration agreement, Funds Management receives an annual fee which is calculated based on the average daily net assets of each class as follows:
| | | | |
| | | Class-level
administration fee | |
Class A, Class B, Class C | | | 0.16 | % |
Administrator Class | | | 0.10 | |
Institutional Class | | | 0.08 | |
Investor Class | | | 0.19 | |
Funds Management has contractually waived and/or reimbursed management and administration fees to the extent necessary to maintain certain net operating expense ratios for the Fund. Waiver of fees and/or reimbursement of expenses by Funds Management were made first from fund level expenses on a proportionate basis and then from class specific expenses. Funds Management has committed through December 31, 2015 to waive fees and/or reimburse expenses to the extent necessary to cap the Fund’s expenses at 0.85% for Class A shares, 1.60% for Class B shares, 1.60% for Class C shares, 0.64% for Administrator Class shares, 0.48% for Institutional Class shares, and 0.88% for Investor Class shares. After this time, the cap may be increased or the commitment to maintain the cap may be terminated only with the approval of the Board of Trustees.
Distribution fees
The Trust has adopted a distribution plan for Class B and Class C shares of the Fund pursuant to Rule 12b-1 under the 1940 Act. Distribution fees are charged to Class B and Class C shares and paid to Wells Fargo Funds Distributor, LLC (“Funds Distributor”), the principal underwriter, at an annual rate of 0.75% of the average daily net assets of Class B and Class C shares.
In addition, Funds Distributor is entitled to receive the front-end sales charge from the purchase of Class A shares and a contingent deferred sales charge on the redemption of certain Class A shares. Funds Distributor is also entitled to receive the contingent deferred sales charges from redemptions of Class B and Class C shares. For the year ended August 31, 2015, Funds Distributor received $4,015 from the sale of Class A shares and $20 and $105 in contingent deferred sales charges from redemptions of Class B and Class C shares, respectively.
Shareholder servicing fees
The Trust has entered into contracts with one or more shareholder servicing agents, whereby Class A, Class B, Class C, Administrator Class, and Investor Class of the Fund is charged a fee at an annual rate of 0.25% of the average daily net assets of each respective class.
A portion of these total shareholder servicing fees were paid to affiliates of Wells Fargo.
5. INVESTMENT PORTFOLIO TRANSACTIONS
Purchases and sales of investments, excluding short-term securities, for the year ended August 31, 2015 were as follows:
| | | | | | |
Purchases at cost | | Sales proceeds |
U.S.
government | | Non-U.S.
government | | U.S.
government | | Non-U.S.
government |
| $5,755,003,502 | | $50,061,331 | | $5,755,398,241 | | $10,000,500 |
| | | | |
| 26 | | Wells Fargo Advantage Government Securities Fund | | Notes to financial statements |
6. DERIVATIVE TRANSACTIONS
During the year ended August 31, 2015, the Fund entered into futures contracts to speculate on interest rates and to help manage the duration of the portfolio.
At August 31, 2015, the Fund had long and short futures contracts outstanding as follows:
| | | | | | | | | | | | | | |
| Expiration date | | Counterparty | | Contracts | | Type | | Contract
value at
August 31, 2015 | | | Unrealized
gains
(losses) | |
12-21-2015 | | JPMorgan | | 29 Short | | U.S. Treasury Bonds | | $ | (4,484,125 | ) | | $ | 35,289 | |
12-21-2015 | | JPMorgan | | 423 Long | | 10-Year U.S. Treasury Notes | | | 53,747,438 | | | | (671,655 | ) |
12-21-2015 | | JPMorgan | | 30 Long | | U.S. Treasury Bonds | | | 4,752,188 | | | | (24,367 | ) |
12-31-2015 | | JPMorgan | | 957 Long | | 5-Year U.S. Treasury Notes | | | 114,301,688 | | | | (913,959 | ) |
12-31-2015 | | JPMorgan | | 123 Long | | 2-Year U.S. Treasury Notes | | | 26,871,656 | | | | (73,265 | ) |
The Fund had an average notional amount of $ $193,265,208 and $7,588,023 in long futures contracts and short futures contracts, respectively, during the year ended August 31, 2015.
On August 31 2014, the cumulative unrealized losses on futures contracts in the amount of $1,647,957 are reflected in net unrealized gains on investments on the Statement of Assets and Liabilities. The receivable and payable for daily variation margin on open futures contracts reflected in the Statement of Assets and Liabilities only represents the current day’s variation margin. The realized gains and change in unrealized gains (losses) on futures contracts are reflected in the Statement of Operations.
For certain types of derivative transactions, the Fund has entered into International Swaps and Derivatives Association, Inc. master agreements (“ISDA Master Agreements”) or similar agreements with approved counterparties. The ISDA Master Agreements or similar agreements may have requirements to deliver/deposit securities or cash to/with an exchange or broker-dealer as collateral and allows the Fund to offset, with each counterparty, certain derivative financial instrument’s assets and/or liabilities with collateral held or pledged. Collateral requirements differ by type of derivative. Collateral or margin requirements are set by the broker or exchange clearing house for exchange traded derivatives while collateral terms are contract specific for over-the-counter traded derivatives. Cash collateral that has been pledged to cover obligations of the Fund under ISDA Master Agreements or similar agreements, if any, will be reported separately in the Statement of Assets and Liabilities. Securities pledged as collateral, if any, for the same purpose are noted in the Summary Portfolio of Investments. With respect to balance sheet offsetting, absent an event of default by the counterparty or a termination of the agreement, the reported amounts of financial assets and financial liabilities in the Statement of Assets and Liabilities are not offset across transactions between the Fund and the applicable counterparty. A reconciliation of the gross amounts on the Statement of Assets and Liabilities to the net amounts by derivative type, including any collateral exposure, is as follows:
| | | | | | | | | | | | | | | | |
| Derivative type | | Counterparty | | Gross amounts of assets in the
Statement of Assets and Liabilities | | Amounts
subject to
netting
agreements | | | Collateral
received | | | Net amount
of assets | |
Futures – variation margin | | JPMorgan | | $17,219 | | $ | (17,219 | ) | | $ | 0 | | | $ | 0 | |
| | | | | | | | | | | | | | | | |
| Derivative type | | Counterparty | | Gross amounts of liabilities in the
Statement of Assets and Liabilities | | Amounts
subject to
netting
agreements | | | Collateral
pledged1 | | | Net amount
of liabilities | |
Futures – variation margin | | JPMorgan | | $210,375 | | $ | (17,219 | ) | | $ | 193,156 | | | $ | 0 | |
| | 1 | Collateral pledged within this table is limited to the collateral for the net transaction with the counterparty. | |
7. BANK BORROWINGS
The Trust (excluding the money market funds and certain other funds in the Trust) and Wells Fargo Variable Trust are parties to a $150,000,000 revolving credit agreement whereby the Fund is permitted to use bank borrowings for temporary or emergency purposes, such as to fund shareholder redemption requests. Interest under the credit
| | | | | | |
| Notes to financial statements | | Wells Fargo Advantage Government Securities Fund | | | 27 | |
agreement is charged to the Fund based on a borrowing rate equal to the higher of the Federal Funds rate in effect on that day plus 1.25% or the overnight LIBOR rate in effect on that day plus 1.25%. In addition, an annual commitment fee equal to 0.10% of the unused balance is allocated to each participating fund. For the year ended August 31, 2015, the Fund paid $469 in commitment fees.
For the year ended August 31, 2015, there were no borrowings by the Fund under the agreement.
8. DISTRIBUTIONS TO SHAREHOLDERS
The tax character of distributions paid during the years ended August 31, 2015 and August 31, 2014 were as follows:
| | | | | | | | |
| | | Year ended August 31 | |
| | | 2015 | | | 2014 | |
Ordinary income | | $ | 11,607,144 | | | $ | 15,546,674 | |
Long-term capital gain | | | 1,060,633 | | | | 0 | |
As of August 31, 2015, the components of distributable earnings on a tax basis were as follows:
| | | | |
Undistributed
long-term
gain | | Unrealized gains | | Capital loss carryforward |
| $3,651,903 | | $8,507,399 | | $(1,568,458) |
9. INDEMNIFICATION
Under the Trust’s organizational documents, the officers and Trustees have been granted certain indemnification rights against certain liabilities that may arise out of performance of their duties to the Trust. Additionally, in the normal course of business, the Trust may enter into contracts with service providers that contain a variety of indemnification clauses. The Trust’s maximum exposure under these arrangements is dependent on future claims that may be made against the Fund and, therefore, cannot be estimated.
| | | | |
| 28 | | Wells Fargo Advantage Government Securities Fund | | Report of independent registered public accounting firm |
BOARD OF TRUSTEES AND SHAREHOLDERS OF WELLS FARGO FUNDS TRUST:
We have audited the accompanying statement of assets and liabilities, including the portfolio of investments and the summary portfolio of investments, of the Wells Fargo Advantage Government Securities Fund (the “Fund”), one of the funds constituting the Wells Fargo Funds Trust, as of August 31, 2015, and the related statement of operations for the year then ended, the statements of changes in net assets for each of the years in the two-year period then ended, and the financial highlights for each of the years in the five-year period then ended. These financial statements and financial highlights are the responsibility of the Fund’s management. Our responsibility is to express an opinion on these financial statements and financial highlights based on our audits.
We conducted our audits in accordance with the standards of the Public Company Accounting Oversight Board (United States). Those standards require that we plan and perform the audit to obtain reasonable assurance about whether the financial statements and financial highlights are free of material misstatement. An audit includes examining, on a test basis, evidence supporting the amounts and disclosures in the financial statements. Our procedures included confirmation of securities owned as of August 31, 2015, by correspondence with the custodian and brokers, or by other appropriate auditing procedures. An audit also includes assessing the accounting principles used and significant estimates made by management, as well as evaluating the overall financial statement presentation. We believe that our audits provide a reasonable basis for our opinion.
In our opinion, the financial statements and financial highlights referred to above present fairly, in all material respects, the financial position of the Wells Fargo Advantage Government Securities Fund as of August 31, 2015, the results of its operations for the year then ended, the changes in its net assets for each of the years in the two-year period then ended, and the financial highlights for each of the years in the five-year period then ended, in conformity with U.S. generally accepted accounting principles.

Boston, Massachusetts
October 26, 2015
| | | | | | |
| Other information (unaudited) | | Wells Fargo Advantage Government Securities Fund | | | 29 | |
TAX INFORMATION
Pursuant to Section 852 of the Internal Revenue Code, $1,060,633 was designated as long-term capital gain distributions for the fiscal year ended August 31, 2015.
For the fiscal year ended August 31, 2015, $11,376,285 has been designated as interest-related dividends for nonresident alien shareholders pursuant to Section 871 of the Internal Revenue Code.
For the fiscal year ended August 31, 2015, 26.05% of the ordinary income distributed was derived from interest on U.S. government securities.
PROXY VOTING INFORMATION
A description of the policies and procedures that the Fund uses to determine how to vote proxies relating to portfolio securities is available, upon request, by calling 1-800-222-8222, visiting our website at wellsfargoadvantagefunds.com, or visiting the SEC website at sec.gov. Information regarding how the Fund voted proxies relating to portfolio securities during the most recent 12-month period ended June 30 is available on the Fund’s website at wellsfargoadvantagefunds.com or by visiting the SEC website at sec.gov.
PORTFOLIO HOLDINGS INFORMATION
The complete portfolio holdings for the Fund are publicly available monthly on the Fund’s website (wellsfargoadvantagefunds.com), on a one-month delayed basis. In addition, top ten holdings information (excluding derivative positions) for the Fund is publicly available on the Fund’s website on a monthly, seven-day or more delayed basis. The Fund files its complete schedule of portfolio holdings with the SEC for the first and third quarters of each fiscal year on Form N-Q, which is available by visiting the SEC website at sec.gov. In addition, the Fund’s Form N-Q may be reviewed and copied at the SEC’s Public Reference Room in Washington, DC, and at regional offices in New York City, at 233 Broadway, and in Chicago, at 175 West Jackson Boulevard, Suite 900. Information about the Public Reference Room may be obtained by calling 1-800-SEC-0330.
| | | | |
| 30 | | Wells Fargo Advantage Government Securities Fund | | Other information (unaudited) |
BOARD OF TRUSTEES AND OFFICERS
Each of the Trustees and Officers1 listed in the table below acts in identical capacities for each fund in the Wells Fargo Advantage family of funds, which consists of 133 mutual funds comprising the Wells Fargo Funds Trust, Wells Fargo Variable Trust, Wells Fargo Master Trust and four closed-end funds (collectively the “Fund Complex”). This table should be read in conjunction with the Prospectus and the Statement of Additional Information2. The mailing address of each Trustee and Officer is 525 Market Street, 12th Floor, San Francisco, CA 94105. Each Trustee and Officer serves an indefinite term, however, each Trustee serves such term until reaching the mandatory retirement age established by the Trustees.
Independent Trustees
| | | | | | |
Name and
year of birth | | Position held and
length of service* | | Principal occupations during past five years or longer | | Other
public company or
investment company
directorships during
past 5 years |
William R. Ebsworth
(Born 1957) | | Trustee, since 2015** | | Retired. From 1984 to 2013, equities analyst, portfolio manager, research director at Fidelity Management and Research Company and retired in 2013 as Chief Investment Officer of Fidelity Strategic Advisers, Inc. in Boston, Tokyo, and Hong Kong where he led a team of investment professionals managing client assets. Prior thereto, Board member of Hong Kong Securities Clearing Co., Hong Kong Options Clearing Corp., the Thailand International Fund, Ltd., Fidelity Investments Life Insurance Company, and Empire Fidelity Investments Life Insurance Company. Mr. Ebsworth is a CFA ® charterholder and an Adjunct Lecturer, Finance, at Babson College. | | Asset Allocation Trust |
Jane A. Freeman
(Born 1953) | | Trustee, since 2015** | | Retired. From 2012 to 2014 and 1999 to 2008, Chief Financial Officer of Scientific Learning Corporation. From 2008 to 2012, Ms. Freeman provided consulting services related to strategic business projects. Prior to 1999, Portfolio Manager at Rockefeller & Co. and Scudder, Stevens & Clark. Board member of the Harding Loevner Funds from 1996 to 2014, serving as both Lead Independent Director and chair of the Audit Committee. Board member of the Russell Exchange Traded Funds Trust from 2011 to 2012 and the chair of the Audit Committee. Ms. Freeman is Chair of Taproot Foundation (non-profit organization), a Board Member of Ruth Bancroft Garden (non-profit organization) and an inactive chartered financial analyst. | | Asset Allocation Trust; Harding Loevner Funds; Russell Exchange Traded Funds Trust |
Peter G. Gordon
(Born 1942) | | Trustee, since 1998; Chairman, since 2005 | | Co-Founder, Retired Chairman, President and CEO of Crystal Geyser Water Company. Trustee Emeritus, Colby College. | | Asset Allocation Trust |
Isaiah Harris, Jr.
(Born 1952) | | Trustee, since 2009 | | Retired. Chairman of the Board of CIGNA Corporation since 2009, and Director since 2005. From 2003 to 2011, Director of Deluxe Corporation. Prior thereto, President and CEO of BellSouth Advertising and Publishing Corp. from 2005 to 2007, President and CEO of BellSouth Enterprises from 2004 to 2005 and President of BellSouth Consumer Services from 2000 to 2003. Emeritus member of the Iowa State University Foundation Board of Governors. Emeritus Member of the Advisory Board of Iowa State University School of Business. Advisory Board Member, Palm Harbor Academy (charter school). Mr. Harris is a certified public accountant. | | CIGNA Corporation; Asset Allocation Trust |
Judith M. Johnson
(Born 1949) | | Trustee, since 2008; Audit Committee
Chairman, since 2008 | | Retired. Prior thereto, Chief Executive Officer and Chief Investment Officer of Minneapolis Employees Retirement Fund from 1996 to 2008. Ms. Johnson is an attorney, certified public accountant and a certified managerial accountant. | | Asset Allocation Trust |
David F. Larcker
(Born 1950) | | Trustee, since 2009 | | James Irvin Miller Professor of Accounting at the Graduate School of Business, Stanford University, Morgan Stanley Director of the Center for Leadership Development and Research and Senior Faculty of The Rock Center for Corporate Governance since 2006. From 2005 to 2008, Professor of Accounting at the Graduate School of Business, Stanford University. Prior thereto, Ernst & Young Professor of Accounting at The Wharton School, University of Pennsylvania from 1985 to 2005. | | Asset Allocation Trust |
Olivia S. Mitchell
(Born 1953) | | Trustee, since 2006 | | International Foundation of Employee Benefit Plans Professor, Wharton School of the University of Pennsylvania since 1993. Director of Wharton’s Pension Research Council and Boettner Center on Pensions & Retirement Research, and Research Associate at the National Bureau of Economic Research. Previously, Cornell University Professor from 1978 to 1993. | | Asset Allocation Trust |
| | | | | | |
| Other information (unaudited) | | Wells Fargo Advantage Government Securities Fund | | | 31 | |
| | | | | | |
Name and
year of birth | | Position held and
length of service* | | Principal occupations during past five years or longer | | Other
public company or
investment company
directorships during
past 5 years |
Timothy J. Penny
(Born 1951) | | Trustee, since 1996 | | President and Chief Executive Officer of Southern Minnesota Initiative Foundation, a non-profit organization, since 2007 and Senior Fellow at the Humphrey Institute Policy Forum at the University of Minnesota since 1995. Member of the Board of Trustees of NorthStar Education Finance, Inc., a non-profit organization, since 2007. | | Asset Allocation Trust |
Michael S. Scofield
(Born 1943) | | Trustee, since 2010 | | Served on the Investment Company Institute’s Board of Governors and Executive Committee from 2008-2011 as well the Governing Council of the Independent Directors Council from 2006-2011 and the Independent Directors Council Executive Committee from 2008-2011. Chairman of the IDC from 2008-2010. Institutional Investor (Fund Directions) Trustee of Year in 2007. Trustee of the Evergreen Funds complex (and its predecessors) from 1984 to 2010. Chairman of the Evergreen Funds from 2000-2010. Former Trustee of the Mentor Funds. Retired Attorney, Law Offices of Michael S. Scofield. | | Asset Allocation Trust |
Donald C. Willeke
(Born 1940) | | Trustee, since 1996 | | Principal of the law firm of Willeke & Daniels. General Counsel of the Minneapolis Employees Retirement Fund from 1984 until its consolidation into the Minnesota Public Employees Retirement Association on June 30, 2010. Director and Vice Chair of The Tree Trust (non-profit corporation). Director of the American Chestnut Foundation (non-profit corporation). | | Asset Allocation Trust |
| * | Length of service dates reflect the Trustee’s commencement of service with the Trust’s predecessor entities, where applicable. |
| ** | William R. Ebsworth and Jane A. Freeman each became a Trustee effective January 1, 2015. |
Officers
| | | | | | |
Name and
year of birth | | Position held and
length of service | | Principal occupations during past five years or longer | | |
Karla M. Rabusch
(Born 1959) | | President, since 2003 | | Executive Vice President of Wells Fargo Bank, N.A. and President of Wells Fargo Funds Management, LLC since 2003. | | |
Nancy Wiser1
(Born 1967) | | Treasurer, since 2012 | | Executive Vice President of Wells Fargo Funds Management, LLC since 2011. Chief Operating Officer and Chief Compliance Officer at LightBox Capital Management LLC, from 2008 to 2011. | | |
C. David Messman
(Born 1960) | | Secretary, since 2000; Chief Legal Officer, since 2003 | | Senior Vice President and Secretary of Wells Fargo Funds Management, LLC since 2001. Assistant General Counsel of Wells Fargo Bank, N.A. since 2013 and Vice President and Managing Counsel of Wells Fargo Bank N.A. from 1996 to 2013. | | |
Debra Ann Early
(Born 1964) | | Chief Compliance Officer, since 2007 | | Executive Vice President of Wells Fargo Funds Management, LLC since 2014, Senior Vice President and Chief Compliance Officer from 2007 to 2014. | | |
David Berardi
(Born 1975) | | Assistant Treasurer, since 2009 | | Vice President of Wells Fargo Funds Management, LLC since 2009. Vice President of Evergreen Investment Management Company, LLC from 2008 to 2010. Manager of Fund Reporting and Control for Evergreen Investment Management Company, LLC from 2004 to 2010. | | |
Jeremy DePalma1
(Born 1974) | | Assistant Treasurer, since 2009 | | Senior Vice President of Wells Fargo Funds Management, LLC since 2009. Senior Vice President of Evergreen Investment Management Company, LLC from 2008 to 2010 and head of the Fund Reporting and Control Team within Fund Administration from 2005 to 2010. | | |
| 1 | Nancy Wiser acts as Treasurer of 72 funds in the Fund Complex. Jeremy DePalma acts as Treasurer of 61 funds and Assistant Treasurer of 72 funds in the Fund Complex. |
| 2 | The Statement of Additional Information includes additional information about the Trustees and is available, without charge, upon request, by calling 1-800-222-8222 or by visiting the website at wellsfargoadvantagefunds.com. |
| | | | |
| 32 | | Wells Fargo Advantage Government Securities Fund | | Other information (unaudited) |
BOARD CONSIDERATION OF INVESTMENT ADVISORY, INVESTMENT MANAGEMENT AND SUB-ADVISORY AGREEMENTS:
Under the Investment Company Act of 1940 (the “1940 Act”), the Board of Trustees (the “Board”) of Wells Fargo Funds Trust (the “Trust”) must determine annually whether to approve the continuation of the Trust’s investment advisory and sub-advisory agreements. In this regard, at an in-person meeting held on May 19-20, 2015 (the “Meeting”), the Board, all the members of which have no direct or indirect interest in the investment advisory and sub-advisory agreements and are not “interested persons” of the Trust, as defined in the 1940 Act (the “Independent Trustees”), reviewed and approved for Wells Fargo Advantage Government Securities Fund (the “Fund”): (i) an investment advisory agreement (the “Advisory Agreement”) with Wells Fargo Funds Management, LLC (“Funds Management”); (ii) an investment management agreement (the “Management Agreement”) with Funds Management; and (iii) an investment sub-advisory agreement (the “Sub-Advisory Agreement”) with Wells Capital Management Incorporated (the “Sub-Adviser”), an affiliate of Funds Management. The Management Agreement combines the terms of the Advisory Agreement with the terms of the Fund’s Amended and Restated Administration Agreement (the “Administration Agreement”) applicable to Fund-level administrative services. The Advisory Agreement, the Management Agreement and the Sub-Advisory Agreement are collectively referred to as the “Advisory Agreements.”
At the Meeting, the Board considered the factors and reached the conclusions described below relating to the selection of Funds Management and the Sub-Adviser and the approval of the Advisory Agreements. Prior to the Meeting, including at an in-person meeting in March 2015, the Trustees conferred extensively among themselves and with representatives of Funds Management about these matters. Also, the Board has adopted a team-based approach, with each team consisting of a sub-set of Trustees, to assist the full Board in the discharge of its duties in reviewing performance and other matters throughout the year. The Independent Trustees were assisted in their evaluation of the Advisory Agreements by independent legal counsel, from whom they received separate legal advice and with whom they met separately.
In providing information to the Board, Funds Management and the Sub-Adviser were guided by a detailed set of requests for information submitted to them by independent legal counsel on behalf of the Independent Trustees at the start of the Board’s annual contract renewal process earlier in 2015. In considering and approving the Advisory Agreements, the Trustees considered the information they believed relevant, including but not limited to the information discussed below. The Board considered not only the specific information presented in connection with the Meeting, but also the knowledge gained over time through interaction with Funds Management and the Sub-Adviser about various topics. In this regard, the Board reviewed reports of Funds Management at each of its quarterly meetings, which included, among other things, portfolio reviews and performance reports. In addition, the Board and the teams mentioned above confer with portfolio managers at various times throughout the year. The Board did not identify any particular information or consideration that was all-important or controlling, and each individual Trustee may have attributed different weights to various factors.
After its deliberations, the Board unanimously approved the continuation of the Advisory Agreement for the period from June 1, 2015 through June 30, 2015, approved the Management Agreement for the period from July 1, 2015 through May 31, 2016, and approved the continuation of the Sub-Advisory Agreement for a one-year term through May 31, 2016. The Board also determined that the compensation payable to Funds Management and the Sub-Adviser under each of the Advisory Agreements was reasonable. The Board considered the approval of the Advisory Agreements for the Fund as part of its consideration of agreements for funds across the complex, but its approvals were made on a fund-by-fund basis. The following summarizes a number of important, but not necessarily all, factors considered by the Board in support of its approvals.
Nature, extent and quality of services
The Board received and considered various information regarding the nature, extent and quality of services provided to the Fund by Funds Management and the Sub-Adviser under the Advisory Agreements. This information included, among other things, a summary of the background and experience of senior management of Funds Management, and the qualifications, background, tenure and responsibilities of each of the portfolio managers primarily responsible for the day-to-day portfolio management of the Fund. The Board noted that the services to be provided to the Fund pursuant to the Management Agreement combined the advisory services previously provided to the Fund pursuant to the Fund’s Advisory Agreement with the Fund-level administrative services previously provided to the Fund pursuant to the Fund’s Administration Agreement. The Board received a representation from Funds Management that combining these services would not result in any change to the nature or level of services provided by Funds Management to the Fund.
The Board evaluated the ability of Funds Management and the Sub-Adviser to attract and retain qualified investment professionals, including research, advisory and supervisory personnel. The Board further considered the compliance
| | | | | | |
| Other information (unaudited) | | Wells Fargo Advantage Government Securities Fund | | | 33 | |
programs and compliance records of Funds Management and the Sub-Adviser. In addition, the Board took into account the full range of services provided to the Fund by Funds Management and its affiliates.
Fund performance and expenses
The Board considered the performance results for the Fund over various time periods ended March 31, 2015. The Board considered these results in comparison to the performance of funds in a universe that was determined by Lipper Inc. (“Lipper”) to be similar to the Fund (the “Universe”), and in comparison to the Fund’s benchmark index and to other comparative data. Lipper is an independent provider of investment company data. The Board received a description of the methodology used by Lipper to select the mutual funds in the performance Universe. The Board noted that the performance of the Fund (Administrator Class) was higher than or equal to the average performance of the Universe for all periods under review. The Board also noted that the performance of the Fund was in range of its benchmark, the Barclays U.S. Aggregate ex Credit Index, for all periods under review.
The Board also received and considered information regarding the Fund’s net operating expense ratios and their various components, including actual management fees (which reflect fee waivers, if any, and include advisory, administration and transfer agent fees), custodian and other non-management fees, and Rule 12b-1 and non-Rule 12b-1 service fees. The Board considered these ratios in comparison to the median ratios of funds in class-specific expense groups that were determined by Lipper to be similar to the Fund (the “Groups”). The Board received a description of the methodology used by Lipper to select the mutual funds in the expense Groups and an explanation of how funds comprising expense groups and their expense ratios may vary from year-to-year. Based on the Lipper reports, the Board noted that the net operating expense ratios of the Fund were lower than the median net operating expense ratios of the expense Groups.
The Board took into account the Fund performance and expense information provided to it among the factors considered in deciding to re-approve the Advisory Agreement and Sub-Advisory Agreement and approve the Management Agreement.
Investment advisory and sub-advisory fee rates
The Board reviewed and considered the contractual investment advisory fee rates that are payable by the Fund to Funds Management for investment advisory services (the “Advisory Agreement Rates”), both on a stand-alone basis and on a combined basis with the Fund’s fund-level and class-level contractual administration fee rates (the “Management Rates”). The Board noted that the Management Rates include transfer agency and sub-transfer agency costs. The Board also noted that the fee rate to be paid by the Fund under the Management Agreement will incorporate the advisory fee and Fund-level administration fee previously payable separately by the Fund under the Fund’s Advisory Agreement and Administration Agreement with Funds Management. The Board also reviewed and considered the contractual investment sub-advisory fee rates that are payable by Funds Management to the Sub-Adviser for investment sub-advisory services (the “Sub-Advisory Agreement Rates”).
Among other information reviewed by the Board was a comparison of the Management Rates of the Fund with those of other funds in the expense Groups at a common asset level. The Board noted that the Management Rates of the Fund were lower than or equal to the average rates for the Fund’s expense Groups for all share classes.
The Board also received and considered information about the portion of the total advisory fee that was retained by Funds Management after payment of the fee to the Sub-Adviser for sub-advisory services. In assessing the reasonableness of this amount, the Board received and evaluated information about the nature and extent of responsibilities retained and risks assumed by Funds Management and not delegated to or assumed by the Sub-Adviser, and about Funds Management’s on-going oversight services. However, given the affiliation between Funds Management and the Sub-Adviser, the Board ascribed limited relevance to the allocation of the advisory fee between them.
The Board also received and considered information about the nature and extent of services offered and fee rates charged by Funds Management and the Sub-Adviser to other types of clients with investment strategies similar to those of the Fund. In this regard, the Board received information about the significantly greater scope of services, and compliance, reporting and other legal burdens and risks of managing mutual funds compared with those associated with managing assets of non-mutual fund clients such as collective funds or institutional separate accounts.
Based on its consideration of the factors and information it deemed relevant, including those described here, the Board determined that the compensation payable to Funds Management under the Management Agreement and Advisory Agreement and to the Sub-Adviser under the Sub-Advisory Agreement was reasonable, in light of the services covered by the Advisory Agreements.
| | | | |
| 34 | | Wells Fargo Advantage Government Securities Fund | | Other information (unaudited) |
Profitability
The Board received and considered information concerning the profitability of Funds Management, as well as the profitability of Wells Fargo as a whole, from providing services to the Fund and the fund family as a whole. The Board also received and considered information concerning the profitability of the Sub-Adviser from providing services to the fund family as a whole, noting that the Sub-Adviser’s profitability information with respect to providing services to the Fund was subsumed in the Wells Fargo profitability analysis.
Funds Management reported on the methodologies and estimates used in calculating profitability. Among other things, the Board noted that the levels of profitability reported on a fund-by-fund basis varied widely, depending on factors such as the size and type of fund. Based on its review, the Board did not deem the profits reported by Funds Management or Wells Fargo from its services to the Fund to be at a level that would prevent it from approving the continuation of the Advisory Agreements.
Economies of scale
With respect to possible economies of scale, the Board noted the existence of breakpoints in the Fund’s advisory and management fee structures, and the Fund’s administration fee structure, which operate generally to reduce the Fund’s expense ratios as the Fund grows in size. It considered that, for a small fund or a fund that shrinks in size, breakpoints conversely can result in higher fee levels. The Board also considered that fee waiver and expense reimbursement arrangements and competitive fee rates at the outset are means of sharing potential economies of scale with shareholders of the Fund and the fund family as a whole. The Board considered Funds Management’s view that any analyses of potential economies of scale in managing a particular fund are inherently limited in light of the joint and common costs and investments that Funds Management incurs across the fund family as a whole.
The Board concluded that the Fund’s fee and expense arrangements, including contractual breakpoints, constituted a reasonable approach to sharing potential economies of scale with the Fund and its shareholders.
Other benefits to Funds Management and the Sub-Adviser
The Board received and considered information regarding potential “fall-out” or ancillary benefits received by Funds Management and its affiliates, including the Sub-Adviser, as a result of their relationships with the Fund. Ancillary benefits could include, among others, benefits directly attributable to other relationships with the Fund and benefits potentially derived from an increase in Funds Management’s and the Sub-Adviser’s business as a result of their relationships with the Fund. The Board noted that various affiliates of Funds Management may receive distribution-related fees, shareholder servicing payments and sub-transfer agency fees in respect of shares sold or held through them and services provided.
The Board also reviewed information about soft dollar credits earned and utilized by the Sub-Adviser, fees earned by Funds Management and the Sub-Adviser from managing a private investment vehicle for the fund family’s securities lending collateral and commissions earned by an affiliated broker from portfolio transactions.
Based on its consideration of the factors and information it deemed relevant, including those described here, the Board did not find that any ancillary benefits received by Funds Management and its affiliates, including the Sub-Adviser, were unreasonable.
Conclusion
At the Meeting, after considering the above-described factors and based on its deliberations and its evaluation of the information described above, the Board unanimously approved the continuation of the Advisory Agreement for the period from June 1, 2015 through June 30, 2015, approved the Management Agreement for the period from July 1, 2015 through May 31, 2016, and approved the continuation of the Sub-Advisory Agreement for a one-year term through May 31, 2016. The Board also determined that the compensation payable to Funds Management and the Sub-Adviser under each of the Advisory Agreements was reasonable.
| | | | | | |
| List of abbreviations | | Wells Fargo Advantage Government Securities Fund | | | 35 | |
The following is a list of common abbreviations for terms and entities that may have appeared in this report.
| ACA | — ACA Financial Guaranty Corporation |
| ADR | — American depositary receipt |
| ADS | — American depositary shares |
| AGC | — Assured Guaranty Corporation |
| AGM | — Assured Guaranty Municipal |
| Ambac | — Ambac Financial Group Incorporated |
| AMT | — Alternative minimum tax |
| BAN | — Bond anticipation notes |
| BHAC | — Berkshire Hathaway Assurance Corporation |
| CAB | — Capital appreciation bond |
| CCAB | — Convertible capital appreciation bond |
| CDA | — Community Development Authority |
| CDO | — Collateralized debt obligation |
| DRIVER | — Derivative inverse tax-exempt receipts |
| DW&P | — Department of Water & Power |
| DWR | — Department of Water Resources |
| ECFA | — Educational & Cultural Facilities Authority |
| EDA | — Economic Development Authority |
| EDFA | — Economic Development Finance Authority |
| ETF | — Exchange-traded fund |
| FDIC | — Federal Deposit Insurance Corporation |
| FFCB | — Federal Farm Credit Banks |
| FGIC | — Financial Guaranty Insurance Corporation |
| FHA | — Federal Housing Administration |
| FHLB | — Federal Home Loan Bank |
| FHLMC | — Federal Home Loan Mortgage Corporation |
| FICO | — The Financing Corporation |
| FNMA | — Federal National Mortgage Association |
| GDR | — Global depositary receipt |
| GNMA | — Government National Mortgage Association |
| HCFR | — Healthcare facilities revenue |
| HEFA | — Health & Educational Facilities Authority |
| HEFAR | — Higher education facilities authority revenue |
| HFA | — Housing Finance Authority |
| HFFA | — Health Facilities Financing Authority |
| HUD | — Department of Housing and Urban Development |
| IDA | — Industrial Development Authority |
| IDAG | — Industrial Development Agency |
| KRW | — Republic of Korea won |
| LIBOR | — London Interbank Offered Rate |
| LIFER | — Long Inverse Floating Exempt Receipts |
| LLC | — Limited liability company |
| LLLP | — Limited liability limited partnership |
| LLP | — Limited liability partnership |
| MBIA | — Municipal Bond Insurance Association |
| MFHR | — Multifamily housing revenue |
| MSTR | — Municipal securities trust receipts |
| MUD | — Municipal Utility District |
| National | — National Public Finance Guarantee Corporation |
| PCFA | — Pollution Control Financing Authority |
| PCL | — Public Company Limited |
| PCR | — Pollution control revenue |
| PFA | — Public Finance Authority |
| PFFA | — Public Facilities Financing Authority |
| PFOTER | — Puttable floating option tax-exempt receipts |
| plc | — Public limited company |
| PUTTER | — Puttable tax-exempt receipts |
| R&D | — Research & development |
| Radian | — Radian Asset Assurance |
| RAN | — Revenue anticipation notes |
| RDA | — Redevelopment Authority |
| RDFA | — Redevelopment Finance Authority |
| REIT | — Real estate investment trust |
| ROC | — Reset option certificates |
| SAVRS | — Select auction variable rate securities |
| SBA | — Small Business Authority |
| SDR | — Swedish depositary receipt |
| SFHR | — Single-family housing revenue |
| SFMR | — Single-family mortgage revenue |
| SPA | — Standby purchase agreement |
| SPDR | — Standard & Poor’s Depositary Receipts |
| SPEAR | — Short Puttable Exempt Adjustable Receipts |
| STRIPS | — Separate trading of registered interest and |
| TAN | — Tax anticipation notes |
| TIPS | — Treasury inflation-protected securities |
| TRAN | — Tax revenue anticipation notes |
| TTFA | — Transportation Trust Fund Authority |
| TVA | — Tennessee Valley Authority |
This page is intentionally left blank.


For more information
More information about Wells Fargo Advantage Funds is available free upon request. To obtain literature, please write, email, visit the Fund’s website, or call:
Wells Fargo Advantage Funds
P.O. Box 8266
Boston, MA 02266-8266
Email: wfaf@wellsfargo.com
Website: wellsfargoadvantagefunds.com
Individual investors: 1-800-222-8222
Retail investment professionals: 1-888-877-9275
Institutional investment professionals: 1-866-765-0778
This report and the financial statements contained herein are submitted for the general information of the shareholders of Wells Fargo Advantage Funds. If this report is used for promotional purposes, distribution of the report must be accompanied or preceded by a current prospectus. Before investing, please consider the investment objectives, risks, charges, and expenses of the investment. For a current prospectus and, if available, a summary prospectus, containing this information, call 1-800-222-8222 or visit the Fund’s website at wellsfargoadvantagefunds.com. Read the prospectus carefully before you invest or send money.
Wells Fargo Funds Management, LLC, a wholly owned subsidiary of Wells Fargo & Company, provides investment advisory and administrative services for Wells Fargo Advantage Funds. Other affiliates of Wells Fargo & Company provide subadvisory and other services for the Funds. The Funds are distributed by Wells Fargo Funds Distributor, LLC, Member FINRA, an affiliate of Wells Fargo & Company.
NOT FDIC INSURED ¡ NO BANK GUARANTEE ¡ MAY LOSE VALUE
© 2015 Wells Fargo Funds Management, LLC. All rights reserved.
| | |
 | | 236802 10-15 A216/AR216 08-15 |

Wells Fargo Advantage High Income Fund

Annual Report
August 31, 2015

Reduce clutter. Save trees.
Sign up for electronic delivery of prospectuses and shareholder reports at wellsfargo.com/advantagedelivery
Contents
The views expressed and any forward-looking statements are as of August 31, 2015, unless otherwise noted, and are those of the Fund managers and/or Wells Fargo Funds Management, LLC. Discussions of individual securities, or the markets generally, or any Wells Fargo Advantage Fund are not intended as individual recommendations. Future events or results may vary significantly from those expressed in any forward-looking statements; the views expressed are subject to change at any time in response to changing circumstances in the market. Wells Fargo Funds Management, LLC and the Fund disclaim any obligation to publicly update or revise any views expressed or forward-looking statements.
NOT FDIC INSURED ¡ NO BANK GUARANTEE ¡ MAY LOSE VALUE
| | | | |
| 2 | | Wells Fargo Advantage High Income Fund | | Letter to shareholders (unaudited) |

Karla M. Rabusch
President
Wells Fargo Advantage Funds
Major central banks continued to inject liquidity into global banks and markets through various accommodative monetary policies, including quantitative easing.
Dear Valued Shareholder:
We are pleased to offer you this annual report for the Wells Fargo Advantage High Income Fund for the 12-month period that ended August 31, 2015. The period was marked by low interest rates, low oil prices, and moderate U.S. economic growth. Short-term investment-grade bonds, as measured by the Barclays U.S. 1-3 Year Government/Credit Bond Index,1 returned 0.81% during the period. Meanwhile, strong demand for high-quality, liquid assets kept returns on Treasury bills more modest; the Barclays 6-Month Treasury Bill Index2 returned 0.15% during the period.
Major central banks continued to provide stimulus.
Major central banks continued to inject liquidity into global banks and markets through various accommodative monetary policies, including quantitative easing. In the U.S., the Federal Reserve (Fed) kept its key interest rate near zero in order to support the economy and the financial system. However, it set expectations for it to begin normalizing monetary policy with higher target ranges for the federal funds rate.
Meanwhile, European markets continued to benefit from the European Central Bank’s (ECB’s) willingness to maintain low interest rates. In addition to its targeted longer-term refinancing operations that are designed to increase bank lending, the ECB expanded its quantitative easing program to include the purchase of eurozone government bonds. In Japan, the Bank of Japan maintained an aggressive monetary program aimed at combating deflation.
Economic growth was moderate, and oil prices plummeted.
U.S. economic growth advanced during the reporting period, the unemployment rate ticked lower to 5.1% as of August 2015, and inflation remained below the Fed’s longer-run objective of a 2% pace. The period was also marked by lower oil prices, which began the reporting period near $90 per barrel but declined to $46 per barrel at the end of August 2015. While lower oil prices benefited consumers of oil products, the lower prices pressured companies within the energy sector.
Bond yields rose but remained low by historical standards.
Short-term interest rates increased during the reporting period, with a flattening in the shape of the short-term yield curve. During this time frame, 1-year Treasury bills rose 29 basis points (bps; 100 bps equals 1.00%) to yield 0.38%, 2-year Treasury note yields rose 21 bps to yield 0.74%, and 3-year Treasury note yields rose only 8 bps to yield 1.05%. Meanwhile, ultra-short-term yields were little changed at ultralow levels, anchored by the easy monetary policy.
Since the end of the financial crisis, structural changes in the fixed-income markets have reduced trading liquidity (the degree to which assets can be bought or sold without affecting the price). New regulations and capital requirements have caused traditional liquidity suppliers (banks and broker/dealers) to be more risk-averse and hold less inventory. Meanwhile, corporate-debt issuance has spiked as companies finance themselves at record-low yields, bond mutual funds hold larger amounts of this new debt supply, trading volumes are lower, and large-size trades are more difficult to execute. However, fixed-income markets appear to have functioned well over the past year with sufficient liquidity and muted volatility.
| 1 | The Barclays U.S. 1–3 Year Government/Credit Bond Index is the one- to three-year component of the Barclays U.S. Government/Credit Bond Index that includes securities in the Government and Credit Indexes. The Government Index includes Treasuries (that is, public obligations of the U.S. Treasury that have remaining maturities of more than one year) and agencies (that is, publicly issued debt of U.S. government agencies, quasi-federal corporations, and corporate or foreign debt guaranteed by the U.S. government).The Credit Index includes publicly issued U.S. corporate and foreign debentures and secured notes that meet specified maturity, liquidity, and quality requirements. You cannot invest directly in an index. |
| 2 | The Barclays 6-Month Treasury Bill Index tracks the performance and attributes of recently issued 6-month U.S. Treasury bills. The index follows Barclays’ monthly rebalancing conventions. You cannot invest directly in an index. |
| | | | | | |
| Letter to shareholders (unaudited) | | Wells Fargo Advantage High Income Fund | | | 3 | |
Don’t let short-term uncertainty derail long-term investment goals.
Periods of uncertainty can present challenges, but experience has taught us that maintaining long-term investment goals can be an effective way to plan for the future. To help you create a sound strategy based on your personal goals and risk tolerance, Wells Fargo Advantage Funds offers more than 100 mutual funds spanning a wide range of asset classes and investment styles. Although diversification cannot guarantee an investment profit or prevent losses, we believe it can be an effective way to manage investment risk and potentially smooth out overall portfolio performance. We encourage investors to know their investments and to understand that appropriate levels of risk-taking may unlock opportunities.
Thank you for choosing to invest in Wells Fargo Advantage Funds. We appreciate your confidence in us and remain committed to helping you meet your financial needs.
Sincerely,

Karla M. Rabusch
President
Wells Fargo Advantage Funds
Periods of uncertainty can present challenges, but experience has taught us that maintaining long-term investment goals can be an effective way to plan for the future.
Notice to shareholders
At a meeting held on August 11–12, 2015, the Board of Trustees of the Fund approved a change in the name of the Fund whereby the word “Advantage” will be removed from its name, effective December 15, 2015.
For current information about your fund investments, contact your investment professional, visit our website at wellsfargoadvantagefunds.com, or call us directly at 1-800-222-8222. We are available 24 hours a day, 7 days a week.
| | | | |
| 4 | | Wells Fargo Advantage High Income Fund | | Performance highlights (unaudited) |
Investment objective
The Fund seeks total return, consisting of a high level of current income and capital appreciation.
Manager
Wells Fargo Funds Management, LLC
Subadviser
Wells Capital Management Incorporated
Portfolio managers
Kevin J. Maas, CFA
Thomas M. Price, CFA
Michael J. Schueller, CFA
Average annual total returns1 (%) as of August 31, 2015
| | | | | | | | | | | | | | | | | | | | | | | | | | | | | | | | | | |
| | | | | Including sales charge | | | Excluding sales charge | | | Expense ratios2 (%) | |
| | | Inception date | | 1 year | | | 5 year | | | 10 year | | | 1 year | | | 5 year | | | 10 year | | | Gross | | | Net3 | |
| Class A (SHBAX) | | 2-29-2000 | | | (9.27 | ) | | | 4.60 | | | | 5.26 | | | | (5.00 | ) | | | 5.57 | | | | 5.75 | | | | 1.01 | | | | 0.91 | |
| Class B (WFNBX)* | | 7-18-2008 | | | (10.71 | ) | | | 4.48 | | | | 5.20 | | | | (5.71 | ) | | | 4.81 | | | | 5.20 | | | | 1.76 | | | | 1.66 | |
| Class C (WFNCX) | | 7-18-2008 | | | (6.71 | ) | | | 4.78 | | | | 4.97 | | | | (5.71 | ) | | | 4.78 | | | | 4.97 | | | | 1.76 | | | | 1.66 | |
| Administrator Class (WFNDX) | | 7-30-2010 | | | – | | | | – | | | | – | | | | (4.81 | ) | | | 5.71 | | | | 5.88 | | | | 0.95 | | | | 0.81 | |
| Institutional Class (SHYYX) | | 7-31-2001 | | | – | | | | – | | | | – | | | | (4.52 | ) | | | 6.02 | | | | 6.20 | | | | 0.68 | | | | 0.51 | |
| Investor Class (STHYX) | | 12-28-1995 | | | – | | | | – | | | | – | | | | (4.99 | ) | | | 5.57 | | | | 5.74 | | | | 1.04 | | | | 0.94 | |
| Barclays U.S. Corporate High Yield Bond Index4 | | – | | | – | | | | – | | | | – | | | | (2.93 | ) | | | 7.34 | | | | 7.43 | | | | – | | | | – | |
| * | | Class B shares are closed to investment, except in connection with the reinvestment of any distributions and permitted exchanges. |
Figures quoted represent past performance, which is no guarantee of future results, and do not reflect taxes that a shareholder may pay on fund distributions or the redemption of fund shares. Investment return and principal value of an investment will fluctuate so that an investor’s shares, when redeemed, may be worth more or less than their original cost. Performance shown without sales charges would be lower if sales charges were reflected. Current performance may be lower or higher than the performance data quoted, which assumes the reinvestment of dividends and capital gains. Current month-end performance is available on the Fund’s website, wellsfargoadvantagefunds.com.
Index returns do not include transaction costs associated with buying and selling securities, any mutual fund fees or expenses, or any taxes. It is not possible to invest directly in an index.
For Class A shares, the maximum front-end sales charge is 4.50%. For Class B shares, the maximum contingent deferred sales charge is 5.00%. For Class C shares, the maximum contingent deferred sales charge is 1.00%. Performance including a contingent deferred sales charge assumes the sales charge for the corresponding time period. Administrator Class, Institutional Class, and Investor Class shares are sold without a front-end sales charge or contingent deferred sales charge.
Bond values fluctuate in response to the financial condition of individual issuers, general market and economic conditions, and changes in interest rates. Changes in market conditions and government policies may lead to periods of heightened volatility in the bond market and reduced liquidity for certain bonds held by the fund. In general, when interest rates rise, bond values fall and investors may lose principal value. Interest-rate changes and their impact on the Fund and its share price can be sudden and unpredictable. High-yield securities have a greater risk of default and tend to be more volatile than higher-rated debt securities. Loans are subject to risks similar to those associated with other below-investment-grade bond investments, such as credit risk (for example, risk of issuer default), below-investment-grade bond risk (for example, risk of greater volatility in value), and risk that the loan may become illiquid or difficult to price. The use of derivatives may reduce returns and/or increase volatility. Certain investment strategies tend to increase the total risk of an investment (relative to the broader market). The Fund is exposed to foreign investment risk. Consult the Fund’s prospectus for additional information on these and other risks.
Please see footnotes on page 5.
| | | | | | |
| Performance highlights (unaudited) | | Wells Fargo Advantage High Income Fund | | | 5 | |
|
| Growth of $10,000 investment5 as of August 31, 2015 |
|
 |
| 1 | Effective June 20, 2008, Advisor Class was renamed Class A and modified to assume the features and attributes of Class A. Historical performance shown for Class A shares through June 19, 2008, includes Advisor Class expenses. Historical performance shown for Class B and Class C shares prior to their inception reflects the performance of Investor Class shares, adjusted to reflect the higher expenses applicable to Class B and Class C shares. Historical performance shown for Administrator Class shares prior to their inception reflects the performance of Institutional Class shares, adjusted to reflect the higher expenses applicable to Administrator Class shares. |
| 2 | Reflects the expense ratios as stated in the most recent prospectuses, which include the impact of 0.01% in acquired fund fees and expenses. The expense ratios shown are subject to change and may differ from the annualized expense ratios shown in the financial highlights of this report, which do not include acquired fund fees and expenses. |
| 3 | The manager has contractually committed through December 31, 2015, to waive fees and/or reimburse expenses to the extent necessary to cap the Fund’s Total Annual Fund Operating Expenses After Fee Waiver at 0.93% for Class A, 1.68% for Class B, 1.68% for Class C, 0.80% for Administrator Class, 0.50% for Institutional Class, and 0.93% for Investor Class. Effective January 1, 2016, the manager has contractually committed through December 31, 2016, to waive fees and/or reimburse expenses to the extent necessary to cap the Fund’s Total Annual Fund Operating Expenses After Fee Waiver at 0.83% for Administrator Class and 0.53% for Institutional Class, respectively. After this time, the cap may be increased or the commitment to maintain the cap may be terminated only with the approval of the Board of Trustees. Brokerage commissions, stamp duty fees, interest, taxes, acquired fund fees and expenses, and extraordinary expenses are excluded from the cap. Without this cap, the Fund’s returns would have been lower. |
| 4 | The Barclays U.S. Corporate High Yield Bond Index is an unmanaged, U.S. dollar-denominated, nonconvertible, non-investment-grade debt index. The index consists of domestic and corporate bonds rated Ba and below with a minimum outstanding amount of $150 million. You cannot invest directly in an index. |
| 5 | The chart compares the performance of Class A shares for the most recent 10 years with the performance of the Barclays U.S. Corporate High Yield Bond Index. The chart assumes a hypothetical investment of $10,000 in Class A shares and reflects all operating expenses and assumes the maximum initial sales charge of 4.50%. |
| 6 | The ten largest holdings, excluding cash and cash equivalents, are calculated based on the value of the investments divided by total net assets of the Fund. Holdings are subject to change and may have changed since the date specified. |
| 7 | The credit quality distribution of portfolio holdings reflected in the chart is based on ratings from Standard & Poor’s, Moody’s Investors Service, and/or Fitch Ratings Ltd. Credit quality ratings apply to the underlying holdings of the Fund and not to the Fund itself. The percentages of the Fund’s portfolio with the ratings depicted in the chart are calculated based on the total market value of fixed income securities held by the Fund. If a security was rated by all three rating agencies, the middle rating was utilized. If rated by two of three rating agencies, the lower rating was utilized, and if rated by one of the rating agencies, that rating was utilized. Standard & Poor’s rates the creditworthiness of bonds, ranging from AAA (highest) to D (lowest). Ratings from A to CCC may be modified by the addition of a plus (+) or minus (-) sign to show relative standing within the rating categories. Standard & Poor’s rates the creditworthiness of short-term notes from SP-1 (highest) to SP-3 (lowest). Moody’s rates the creditworthiness of bonds, ranging from Aaa (highest) to C (lowest). Ratings Aa to B may be modified by the addition of a number 1 (highest) to 3 (lowest) to show relative standing within the ratings categories. Moody’s rates the creditworthiness of short-term U.S. tax-exempt municipal securities from MIG 1/VMIG 1 (highest) to SG (lowest). Fitch rates the creditworthiness of bonds, ranging from AAA (highest) to D (lowest). Credit quality distribution is subject to change and may have changed since the date specified. |
| | | | |
| 6 | | Wells Fargo Advantage High Income Fund | | Performance highlights (unaudited) |
MANAGER’S DISCUSSION
Fund highlights
| n | | The Fund underperformed its benchmark, the Barclays U.S. Corporate High Yield Bond Index, for the 12-month period that ended August 31, 2015. |
| n | | The Fund underperformed its benchmark because of its exposure to the energy sector. Other sectors that detracted included media/entertainment, technology, cable/satellite, and wireless. |
| n | | The Fund ended the period with a below-benchmark weighting in CCC-rated bonds, which proved beneficial because such bonds underperformed. |
Declining commodity prices drove weakness in the high-yield market, and the Fund’s energy exposure hampered its relative returns.
Despite modest growth in the U.S. economy and low default rates, the Barclays U.S. Corporate High Yield Bond Index lost 2.93% for the period due to weakness in commodity prices. For example, the high-yield energy sector lost 19.86% while the metals and mining sector lost 19.50%. Most other sectors posted slightly positive returns for the 12 months.
| | | | |
| Ten largest holdings6 (%) as of August 31, 2015 | |
Sprint Corporation, 7.88%, 9-15-2023 | | | 1.99 | |
Valeant Pharmaceuticals International Incorporated, 6.13%, 4-15-2025 | | | 1.71 | |
Tenet Healthcare Corporation, 6.75%, 6-15-2023 | | | 1.22 | |
American Axle Manufacturing Incorporated, 6.63%, 10-15-2022 | | | 1.21 | |
HCA Incorporated, 4.75%, 5-1-2023 | | | 1.20 | |
Clear Channel Worldwide Holdings Incorporated, 6.50, 11-15-2022 | | | 1.19 | |
Crown Castle Operating Company, 3.00%, 1-31-2021 | | | 1.16 | |
Kindred Healthcare Incorporated, 8.75%, 1-15-2023 | | | 1.06 | |
Sabine Pass Liquefaction LLC, 5.63%, 2-1-2021 | | | 1.05 | |
Casella Waste Systems Incorporated, 7.75%, 2-15-2019 | | | 1.00 | |
Entering the reporting period, we expected returns primarily would be driven by income because the average price on high-yield bonds was well above par (and not far from all-time highs), leaving minimal room for price appreciation, in our opinion, especially if U.S. Treasury rates rose. We did not expect significant depreciation because we believed that most companies were appropriately capitalized for prevailing economic conditions. Although oil prices had declined in July and August of 2014, they began the period in the $90–$110 range that had been in place since January 2013. We were not expecting the precipitous drop in oil that occurred in the fourth quarter of 2014 and drove meaningful bond price declines in the energy sector. The decline was driven by the combination of continued high oil supply and unexpectedly weak demand. The Fund entered the period with an overweight to the energy sector, but we reduced the position in the fourth quarter of 2014. By the end of the reporting period, the Fund had an underweight to energy.
The other sector that significantly underperformed was metals and mining, largely because of the secular decline in the coal industry. The Fund’s underweight allocation to metals and mining was its largest contributor relative to the benchmark.
Looking at other sectors, detractors included the Fund’s exposure to media/entertainment, technology, cable/satellite, and wireless. Sector contributors included health care, consumer products, and retailers.
|
| Credit quality7 as of August 31, 2015 |
|
 |
The Fund was positioned with an underweight to CCC-rated credits and below-benchmark interest-rate sensitivity.
In a period marked by moderate economic growth and modestly lower Treasury rates, higher-quality high-yield bonds outperformed. Although the Barclays U.S. Corporate High Yield Bond Index returned -2.93% for the 12-month period, higher-quality BB-rated credits returned 0.18%, medium-quality B-rated credits lost 3.20%, and lower-rated CCC-rated credits lost 8.73%.
Please see footnotes on page 5.
| | | | | | |
| Performance highlights (unaudited) | | Wells Fargo Advantage High Income Fund | | | 7 | |
Throughout the period, we remained disciplined in our security selection. Although credit fundamentals were solid and we expected default rates to remain below average during the period, we reduced the Fund’s exposure to CCC-rated bonds in 2015 because we did not believe the additional yield was fairly compensating investors for the incremental credit risk and the potential for price declines. CCC-rated bonds underperformed over the period, and this positioning benefited the Fund’s relative performance.
However, given that we expect the economy to grow modestly and the default rate to remain low outside the commodity sectors, we kept the Fund slightly overweight to B-rated securities in order to generate income for the portfolio. We also kept the Fund’s interest-rate sensitivity (duration) below that of the benchmark in an effort to protect against possibly higher interest rates. Although this positioning detracted during the reporting period, we remain comfortable with the Fund’s relatively shorter duration as we seek to protect against a possible increase in Treasury rates. We continued to hold approximately 6% of the portfolio in leveraged loans to generate income; the loan exposure also helped reduce the Fund’s duration. Finally, with lower secondary liquidity in the high-yield market due to regulations enacted after the financial crisis, we maintained a cash position slightly higher than we did historically.
Will the high-yield weakness continue?
After an extended period of strong returns after the financial crisis, the high-yield market weakened from June 2014 through the end of the reporting period. The commodity sectors were the primary drivers of the weakness, but many of the factors that contributed to high-yield strength are expected to continue: moderate economic growth, low default rates outside of the commodity sectors, corporate earnings growth, and generally prudent balance sheet management. However, easy monetary policy may have been the largest contributor to high-yield performance, and that will likely end; many investors expect the U.S. Federal Reserve (Fed) to begin raising short-term rates in late 2015. Our view is that any Fed moves will be gradual and dependent on economic and market conditions.
Volatility may continue in the commodity sectors due to concerns about China’s economic growth and OPEC decisions. However, outside of commodities, we believe that spreads (or the yield of high-yield bonds relative to comparable Treasuries) are wider than would be expected given the U.S. economic outlook and projected lower-than-average default rates. We therefore believe that high-yield bond spreads are likely to tighten over the next 12 months.
| | | | |
| 8 | | Wells Fargo Advantage High Income Fund | | Fund expenses (unaudited) |
As a shareholder of the Fund, you incur two types of costs: (1) transaction costs, including sales charges (loads) on purchase payments and contingent deferred sales charges (if any) on redemptions and (2) ongoing costs, including management fees, distribution (12b-1) and/or shareholder servicing fees, and other Fund expenses. This example is intended to help you understand your ongoing costs (in dollars) of investing in the Fund and to compare these costs with the ongoing costs of investing in other mutual funds.
The example is based on an investment of $1,000 invested at the beginning of the six-month period and held for the entire period from March 1, 2015 to August 31, 2015.
Actual expenses
The “Actual” line of the table below provides information about actual account values and actual expenses. You may use the information in this line, together with the amount you invested, to estimate the expenses that you paid over the period. Simply divide your account value by $1,000 (for example, an $8,600 account value divided by $1,000 = 8.6), then multiply the result by the number in the “Actual” line under the heading entitled “Expenses paid during period” for your applicable class of shares to estimate the expenses you paid on your account during this period.
Hypothetical example for comparison purposes
The “Hypothetical” line of the table below provides information about hypothetical account values and hypothetical expenses based on the Fund’s actual expense ratio and an assumed rate of return of 5% per year before expenses, which is not the Fund’s actual return. The hypothetical account values and expenses may not be used to estimate the actual ending account balance or expenses you paid for the period. You may use this information to compare the ongoing costs of investing in the Fund and other funds. To do so, compare this 5% hypothetical example with the 5% hypothetical examples that appear in the shareholder reports of the other funds.
Please note that the expenses shown in the table are meant to highlight your ongoing costs only and do not reflect any transactional costs, such as sales charges (loads) and contingent deferred sales charges. Therefore, the “Hypothetical” line of the table is useful in comparing ongoing costs only and will not help you determine the relative total costs of owning different funds. In addition, if these transactional costs were included, your costs would have been higher.
| | | | | | | | | | | | | | | | |
| | | Beginning
account value
3-1-2015 | | | Ending account value
8-31-2015 | | | Expenses
paid during
the period¹ | | | Net annualized
expense ratio | |
Class A | | | | | | | | | | | | | | | | |
Actual | | $ | 1,000.00 | | | $ | 969.62 | | | $ | 4.47 | | | | 0.90 | % |
Hypothetical (5% return before expenses) | | $ | 1,000.00 | | | $ | 1,020.67 | | | $ | 4.58 | | | | 0.90 | % |
Class B | | | | | | | | | | | | | | | | |
Actual | | $ | 1,000.00 | | | $ | 965.94 | | | $ | 8.18 | | | | 1.65 | % |
Hypothetical (5% return before expenses) | | $ | 1,000.00 | | | $ | 1,016.89 | | | $ | 8.39 | | | | 1.65 | % |
Class C | | | | | | | | | | | | | | | | |
Actual | | $ | 1,000.00 | | | $ | 965.96 | | | $ | 8.18 | | | | 1.65 | % |
Hypothetical (5% return before expenses) | | $ | 1,000.00 | | | $ | 1,016.89 | | | $ | 8.39 | | | | 1.65 | % |
Administrator Class | | | | | | | | | | | | | | | | |
Actual | | $ | 1,000.00 | | | $ | 970.65 | | | $ | 3.97 | | | | 0.80 | % |
Hypothetical (5% return before expenses) | | $ | 1,000.00 | | | $ | 1,021.17 | | | $ | 4.08 | | | | 0.80 | % |
Institutional Class | | | | | | | | | | | | | | | | |
Actual | | $ | 1,000.00 | | | $ | 972.12 | | | $ | 2.49 | | | | 0.50 | % |
Hypothetical (5% return before expenses) | | $ | 1,000.00 | | | $ | 1,022.68 | | | $ | 2.55 | | | | 0.50 | % |
Investor Class | | | | | | | | | | | | | | | | |
Actual | | $ | 1,000.00 | | | $ | 969.70 | | | $ | 4.62 | | | | 0.93 | % |
Hypothetical (5% return before expenses) | | $ | 1,000.00 | | | $ | 1,020.52 | | | $ | 4.74 | | | | 0.93 | % |
| 1 | Expenses paid is equal to the annualized expense ratio of each class multiplied by the average account value over the period, multiplied by the number of days in the most recent fiscal half-year divided by the number of days in the fiscal year (to reflect the one-half-year period). |
| | | | | | |
| Portfolio of investments—August 31, 2015 | | Wells Fargo Advantage High Income Fund | | | 9 | |
| | | | | | | | | | | | | | | | |
| Security name | | Interest rate | | | Maturity date | | | Principal | | | Value | |
| | | | |
Corporate Bonds and Notes: 74.27% | | | | | | | | | | | | | | | | |
| | | | |
Consumer Discretionary: 18.02% | | | | | | | | | | | | | | | | |
| | | | |
| Auto Components: 3.65% | | | | | | | | | | | | | | | | |
American Axle Manufacturing Incorporated | | | 6.63 | % | | | 10-15-2022 | | | $ | 5,000,000 | | | $ | 5,100,000 | |
Goodyear Tire & Rubber Company | | | 6.50 | | | | 3-1-2021 | | | | 4,000,000 | | | | 4,234,000 | |
Lear Corporation | | | 5.25 | | | | 1-15-2025 | | | | 2,500,000 | | | | 2,487,500 | |
ZF North America Capital Incorporated 144A | | | 4.00 | | | | 4-29-2020 | | | | 675,000 | | | | 674,899 | |
ZF North America Capital Incorporated 144A | | | 4.50 | | | | 4-29-2022 | | | | 3,000,000 | | | | 2,913,750 | |
| | | | |
| | | | | | | | | | | | | | | 15,410,149 | |
| | | | | | | | | | | | | | | | |
| | | | |
| Diversified Consumer Services: 0.92% | | | | | | | | | | | | | | | | |
Ashtead Capital Incorporated 144A | | | 5.63 | | | | 10-1-2024 | | | | 3,935,000 | | | | 3,907,967 | |
| | | | | | | | | | | | | | | | |
| | | | |
| Hotels, Restaurants & Leisure: 1.58% | | | | | | | | | | | | | | | | |
MGM Resorts International Company | | | 6.63 | | | | 12-15-2021 | | | | 2,000,000 | | | | 2,125,000 | |
MGM Resorts International Company | | | 8.63 | | | | 2-1-2019 | | | | 1,000,000 | | | | 1,117,200 | |
Tunica-Biloxi Gaming Authority 144A(i)(s) | | | 9.00 | | | | 11-15-2015 | | | | 6,260,000 | | | | 3,443,000 | |
| | | | |
| | | | | | | | | | | | | | | 6,685,200 | |
| | | | | | | | | | | | | | | | |
| | | | |
| Household Durables: 2.65% | | | | | | | | | | | | | | | | |
Beazer Homes USA Company | | | 7.25 | | | | 2-1-2023 | | | | 3,000,000 | | | | 2,872,500 | |
KB Home | | | 7.50 | | | | 9-15-2022 | | | | 3,000,000 | | | | 3,090,000 | |
Lennar Corporation | | | 4.75 | | | | 5-30-2025 | | | | 2,500,000 | | | | 2,425,000 | |
Standard Pacific Corporation | | | 8.38 | | | | 1-15-2021 | | | | 2,400,000 | | | | 2,820,000 | |
| | | | | | | | | | | | | | | 11,207,500 | |
| | | | | | | | | | | | | | | | |
| | | | |
| Media: 6.76% | | | | | | | | | | | | | | | | |
CCO Holdings LLC | | | 6.50 | | | | 4-30-2021 | | | | 3,000,000 | | | | 3,135,600 | |
CCO Holdings LLC | | | 6.63 | | | | 1-31-2022 | | | | 2,000,000 | | | | 2,105,000 | |
Clear Channel Communications Incorporated « | | | 10.00 | | | | 1-15-2018 | | | | 3,000,000 | | | | 2,178,750 | |
Clear Channel Communications Incorporated (PIK at 14.00%) ¥ | | | 14.00 | | | | 2-1-2021 | | | | 2,081,208 | | | | 1,181,086 | |
Clear Channel Worldwide Holdings Incorporated | | | 6.50 | | | | 11-15-2022 | | | | 5,000,000 | | | | 5,052,500 | |
Cumulus Media Holdings Incorporated « | | | 7.75 | | | | 5-1-2019 | | | | 2,400,000 | | | | 1,992,000 | |
DISH DBS Corporation | | | 5.88 | | | | 7-15-2022 | | | | 3,000,000 | | | | 2,836,890 | |
Gannett Company Incorporated 144A | | | 5.50 | | | | 9-15-2024 | | | | 885,000 | | | | 876,150 | |
iHeartCommunications Incorporated | | | 9.00 | | | | 3-1-2021 | | | | 2,000,000 | | | | 1,760,000 | |
Nielsen Finance LLC 144A | | | 5.00 | | | | 4-15-2022 | | | | 500,000 | | | | 493,121 | |
Sinclair Television Group Incorporated 144A | | | 5.63 | | | | 8-1-2024 | | | | 3,000,000 | | | | 2,853,750 | |
Sirius XM Radio Incorporated 144A | | | 5.75 | | | | 8-1-2021 | | | | 2,000,000 | | | | 2,070,000 | |
Sirius XM Radio Incorporated 144A | | | 6.00 | | | | 7-15-2024 | | | | 2,000,000 | | | | 2,060,000 | |
| | | | |
| | | | | | | | | | | | | | | 28,594,847 | |
| | | | | | | | | | | | | | | | |
| | | | |
| Specialty Retail: 2.22% | | | | | | | | | | | | | | | | |
L Brands Incorporated | | | 6.63 | | | | 4-1-2021 | | | | 2,000,000 | | | | 2,250,000 | |
Neiman Marcus Group Limited 144A | | | 8.00 | | | | 10-15-2021 | | | | 3,500,000 | | | | 3,696,875 | |
Outerwall Incorporated | | | 5.88 | | | | 6-15-2021 | | | | 1,000,000 | | | | 945,000 | |
Sally Beauty Holdings Incorporated | | | 5.75 | | | | 6-1-2022 | | | | 2,400,000 | | | | 2,496,000 | |
| | | | |
| | | | | | | | | | | | | | | 9,387,875 | |
| | | | | | | | | | | | | | | | |
The accompanying notes are an integral part of these financial statements.
| | | | |
| 10 | | Wells Fargo Advantage High Income Fund | | Portfolio of investments—August 31, 2015 |
| | | | | | | | | | | | | | | | |
| Security name | | Interest rate | | | Maturity date | | | Principal | | | Value | |
| | | | |
| Textiles, Apparel & Luxury Goods: 0.24% | | | | | | | | | | | | | | | | |
JC Penney Corporation Incorporated | | | 8.13 | % | | | 10-1-2019 | | | $ | 1,000,000 | | | $ | 1,015,000 | |
| | | | | | | | | | | | | | | | |
| | | | |
Consumer Staples: 3.39% | | | | | | | | | | | | | | | | |
| | | | |
| Food Products: 2.66% | | | | | | | | | | | | | | | | |
Dean Foods Company 144A | | | 6.50 | | | | 3-15-2023 | | | | 2,000,000 | | | | 2,020,000 | |
JBS USA LLC/JBS USA Finance Incorporated 144A | | | 5.88 | | | | 7-15-2024 | | | | 3,500,000 | | | | 3,486,875 | |
Post Holdings Incorporated 144A | | | 6.75 | | | | 12-1-2021 | | | | 3,000,000 | | | | 3,018,750 | |
TreeHouse Foods Incorporated | | | 4.88 | | | | 3-15-2022 | | | | 2,730,000 | | | | 2,709,525 | |
| | | | |
| | | | | | | | | | | | | | | 11,235,150 | |
| | | | | | | | | | | | | | | | |
| | | | |
| Household Products: 0.73% | | | | | | | | | | | | | | | | |
Spectrum Brands Incorporated 144A | | | 5.75 | | | | 7-15-2025 | | | | 3,000,000 | | | | 3,090,000 | |
| | | | | | | | | | | | | | | | |
| | | | |
Energy: 10.21% | | | | | | | | | | | | | | | | |
| | | | |
| Energy Equipment & Services: 2.11% | | | | | | | | | | | | | | | | |
EP Energy LLC & Everest Acquisition Finance Incorporated « | | | 6.38 | | | | 6-15-2023 | | | | 1,000,000 | | | | 850,000 | |
EP Energy LLC & Everest Acquisition Finance Incorporated | | | 9.38 | | | | 5-1-2020 | | | | 2,000,000 | | | | 1,937,000 | |
Gulfmark Offshore Incorporated « | | | 6.38 | | | | 3-15-2022 | | | | 2,000,000 | | | | 1,280,000 | |
Key Energy Services Incorporated | | | 6.75 | | | | 3-1-2021 | | | | 2,000,000 | | | | 840,000 | |
SESI LLC | | | 7.13 | | | | 12-15-2021 | | | | 4,000,000 | | | | 3,990,640 | |
| | | | |
| | | | | | | | | | | | | | | 8,897,640 | |
| | | | | | | | | | | | | | | | |
| | | | |
| Oil, Gas & Consumable Fuels: 8.10% | | | | | | | | | | | | | | | | |
California Resources Corporation « | | | 6.00 | | | | 11-15-2024 | | | | 2,000,000 | | | | 1,510,000 | |
Carrizo Oil & Gas Incorporated | | | 6.25 | | | | 4-15-2023 | | | | 2,000,000 | | | | 1,800,000 | |
Chesapeake Energy Corporation | | | 4.88 | | | | 4-15-2022 | | | | 2,000,000 | | | | 1,450,000 | |
Chesapeake Energy Corporation | | | 6.63 | | | | 11-15-2019 | | | | 3,100,000 | | | | 2,046,000 | |
Concho Resources Incorporated | | | 5.50 | | | | 4-1-2023 | | | | 2,000,000 | | | | 1,975,000 | |
Crestwood Midstream Partners LP | | | 6.13 | | | | 3-1-2022 | | | | 2,500,000 | | | | 2,275,000 | |
Energy XXI Gulf Coast Incorporated 144A | | | 11.00 | | | | 3-15-2020 | | | | 3,000,000 | | | | 1,845,000 | |
Halcon Resources Corporation | | | 8.88 | | | | 5-15-2021 | | | | 2,000,000 | | | | 720,000 | |
Midstates Petroleum Incorporated LLC | | | 10.75 | | | | 10-1-2020 | | | | 1,000,000 | | | | 290,000 | |
Newfield Exploration Company | | | 5.38 | | | | 1-1-2026 | | | | 2,065,000 | | | | 1,935,938 | |
Oasis Petroleum Incorporated | | | 6.88 | | | | 1-15-2023 | | | | 4,000,000 | | | | 3,200,000 | |
Penn Virginia Corporation | | | 8.50 | | | | 5-1-2020 | | | | 3,000,000 | | | | 780,000 | |
Sabine Pass Liquefaction LLC | | | 5.63 | | | | 2-1-2021 | | | | 4,500,000 | | | | 4,432,500 | |
Targa Resources Partners Incorporated | | | 6.88 | | | | 2-1-2021 | | | | 4,000,000 | | | | 4,000,000 | |
Tesoro Logistics LP Corporation | | | 6.13 | | | | 10-15-2021 | | | | 3,500,000 | | | | 3,508,750 | |
Transocean Incorporated « | | | 6.88 | | | | 12-15-2021 | | | | 2,000,000 | | | | 1,595,000 | |
Whiting Petroleum Corp Company | | | 6.25 | | | | 4-1-2023 | | | | 1,000,000 | | | | 902,500 | |
| | | | |
| | | | | | | | | | | | | | | 34,265,688 | |
| | | | | | | | | | | | | | | | |
| | | | |
Financials: 6.48% | | | | | | | | | | | | | | | | |
| | | | |
| Banks: 1.19% | | | | | | | | | | | | | | | | |
Bank of America Corporation ± | | | 6.10 | | | | 12-29-2049 | | | | 3,000,000 | | | | 2,928,750 | |
CIT Group Incorporated | | | 5.25 | | | | 3-15-2018 | | | | 2,000,000 | | | | 2,077,500 | |
| | | | |
| | | | | | | | | | | | | | | 5,006,250 | |
| | | | | | | | | | | | | | | | |
The accompanying notes are an integral part of these financial statements.
| | | | | | |
| Portfolio of investments—August 31, 2015 | | Wells Fargo Advantage High Income Fund | | | 11 | |
| | | | | | | | | | | | | | | | |
| Security name | | Interest rate | | | Maturity date | | | Principal | | | Value | |
| | | | |
| Capital Markets: 1.40% | | | | | | | | | | | | | | | | |
Goldman Sachs Group Incorporated ± | | | 5.38 | % | | | 12-29-2049 | | | $ | 3,000,000 | | | $ | 2,940,000 | |
Morgan Stanley ± | | | 5.55 | | | | 12-29-2049 | | | | 3,000,000 | | | | 2,996,250 | |
| | | | |
| | | | | | | | | | | | | | | 5,936,250 | |
| | | | | | | | | | | | | | | | |
| | | | |
| Consumer Finance: 1.56% | | | | | | | | | | | | | | | | |
Ally Financial Incorporated | | | 4.13 | | | | 2-13-2022 | | | | 2,000,000 | | | | 1,955,000 | |
Navient Corporation | | | 5.88 | | | | 10-25-2024 | | | | 3,000,000 | | | | 2,535,000 | |
SLM Corporation | | | 5.50 | | | | 1-25-2023 | | | | 2,500,000 | | | | 2,106,250 | |
| | | | |
| | | | | | | | | | | | | | | 6,596,250 | |
| | | | | | | | | | | | | | | | |
| | | | |
| Diversified Financial Services: 1.57% | | | | | | | | | | | | | | | | |
Alphabet Holdings Company Incorporated (PIK at 8.50%) ¥ | | | 7.75 | | | | 11-1-2017 | | | | 3,500,000 | | | | 3,491,250 | |
Argos Merger Incorporated 144A | | | 7.13 | | | | 3-15-2023 | | | | 3,000,000 | | | | 3,142,500 | |
| | | | |
| | | | | | | | | | | | | | | 6,633,750 | |
| | | | | | | | | | | | | | | | |
| | | | |
| Insurance: 0.76% | | | | | | | | | | | | | | | | |
Genworth Holdings Incorporated | | | 4.80 | | | | 2-15-2024 | | | | 4,000,000 | | | | 3,220,000 | |
| | | | | | | | | | | | | | | | |
| | | | |
Health Care: 8.99% | | | | | | | | | | | | | | | | |
| | | | |
| Health Care Equipment & Supplies: 0.47% | | | | | | | | | | | | | | | | |
DJO Finco Incorporated 144A | | | 8.13 | | | | 6-15-2021 | | | | 1,000,000 | | | | 1,034,500 | |
Universal Hospital Services Incorporated | | | 7.63 | | | | 8-15-2020 | | | | 1,000,000 | | | | 970,000 | |
| | | | |
| | | | | | | | | | | | | | | 2,004,500 | |
| | | | | | | | | | | | | | | | |
| | | | |
| Health Care Providers & Services: 7.66% | | | | | | | | | | | | | | | | |
Community Health Systems Incorporated | | | 8.00 | | | | 11-15-2019 | | | | 4,000,000 | | | | 4,180,000 | |
DaVita HealthCare Partners Incorporated | | | 5.00 | | | | 5-1-2025 | | | | 3,000,000 | | | | 2,940,000 | |
Hanger Orthopedic Group | | | 7.13 | | | | 11-15-2018 | | | | 4,000,000 | | | | 3,960,000 | |
HCA Incorporated | | | 4.75 | | | | 5-1-2023 | | | | 5,000,000 | | | | 5,068,700 | |
HealthSouth Corporation | | | 5.75 | | | | 11-1-2024 | | | | 3,000,000 | | | | 3,041,700 | |
Kindred Healthcare Incorporated 144A | | | 8.75 | | | | 1-15-2023 | | | | 4,000,000 | | | | 4,480,000 | |
Select Medical Corporation | | | 6.38 | | | | 6-1-2021 | | | | 3,500,000 | | | | 3,552,500 | |
Tenet Healthcare Corporation | | | 6.75 | | | | 6-15-2023 | | | | 5,000,000 | | | | 5,150,000 | |
| | | | |
| | | | | | | | | | | | | | | 32,372,900 | |
| | | | | | | | | | | | | | | | |
| | | | |
| Pharmaceuticals: 0.86% | | | | | | | | | | | | | | | | |
Endo Finance LLC 144A | | | 6.00 | | | | 7-15-2023 | | | | 3,500,000 | | | | 3,640,000 | |
| | | | | | | | | | | | | | | | |
| | | | |
Industrials: 10.28% | | | | | | | | | | | | | | | | |
| | | | |
| Aerospace & Defense: 1.83% | | | | | | | | | | | | | | | | |
DigitalGlobe Incorporated 144A | | | 5.25 | | | | 2-1-2021 | | | | 4,000,000 | | | | 3,840,000 | |
TransDigm Group Incorporated | | | 6.50 | | | | 7-15-2024 | | | | 4,000,000 | | | | 3,910,000 | |
| | | | |
| | | | | | | | | | | | | | | 7,750,000 | |
| | | | | | | | | | | | | | | | |
| | | | |
| Airlines: 0.67% | | | | | | | | | | | | | | | | |
United Continental Holdings Incorporated | | | 6.00 | | | | 12-1-2020 | | | | 2,700,000 | | | | 2,818,125 | |
| | | | | | | | | | | | | | | | |
The accompanying notes are an integral part of these financial statements.
| | | | |
| 12 | | Wells Fargo Advantage High Income Fund | | Portfolio of investments—August 31, 2015 |
| | | | | | | | | | | | | | | | |
| Security name | | Interest rate | | | Maturity date | | | Principal | | | Value | |
| | | | |
| Building Products: 0.71% | | | | | | | | | | | | | | | | |
USG Corporation 144A | | | 5.50 | % | | | 3-1-2025 | | | $ | 3,000,000 | | | $ | 2,985,000 | |
| | | | | | | | | | | | | | | | |
| | | | |
| Commercial Services & Supplies: 2.28% | | | | | | | | | | | | | | | | |
ADT Corporation « | | | 6.25 | | | | 10-15-2021 | | | | 2,500,000 | | | | 2,581,250 | |
Casella Waste Systems Incorporated | | | 7.75 | | | | 2-15-2019 | | | | 4,250,000 | | | | 4,239,375 | |
West Corporation 144A | | | 5.38 | | | | 7-15-2022 | | | | 3,000,000 | | | | 2,820,000 | |
| | | | |
| | | | | | | | | | | | | | | 9,640,625 | |
| | | | | | | | | | | | | | | | |
| | | | |
| Machinery: 2.35% | | | | | | | | | | | | | | | | |
Manitowoc Company Incorporated | | | 8.50 | | | | 11-1-2020 | | | | 4,000,000 | | | | 4,192,500 | |
Navistar International Corporation | | | 8.25 | | | | 11-1-2021 | | | | 4,000,000 | | | | 3,490,000 | |
Terex Corporation | | | 6.00 | | | | 5-15-2021 | | | | 2,250,000 | | | | 2,272,500 | |
| | | | |
| | | | | | | | | | | | | | | 9,955,000 | |
| | | | | | | | | | | | | | | | |
| | | | |
| Road & Rail: 0.90% | | | | | | | | | | | | | | | | |
The Hertz Corporation | | | 5.88 | | | | 10-15-2020 | | | | 2,750,000 | | | | 2,778,490 | |
The Hertz Corporation | | | 6.25 | | | | 10-15-2022 | | | | 1,000,000 | | | | 1,017,500 | |
| | | | |
| | | | | | | | | | | | | | | 3,795,990 | |
| | | | | | | | | | | | | | | | |
| | | | |
| Trading Companies & Distributors: 1.54% | | | | | | | | | | | | | | | | |
Aircastle Limited | | | 5.50 | | | | 2-15-2022 | | | | 2,500,000 | | | | 2,587,500 | |
United Rentals North America Incorporated | | | 5.75 | | | | 11-15-2024 | | | | 4,000,000 | | | | 3,940,000 | |
| | | | |
| | | | | | | | | | | | | | | 6,527,500 | |
| | | | | | | | | | | | | | | | |
| | | | |
Information Technology: 2.40% | | | | | | | | | | | | | | | | |
| | | | |
| Communications Equipment: 0.23% | | | | | | | | | | | | | | | | |
CommScope Technologies Finance LLC 144A | | | 6.00 | | | | 6-15-2025 | | | | 1,000,000 | | | | 972,500 | |
| | | | | | | | | | | | | | | | |
| | | | |
| Internet Software & Services: 0.11% | | | | | | | | | | | | | | | | |
Infor US Incorporated 144A | | | 6.50 | | | | 5-15-2022 | | | | 500,000 | | | | 468,750 | |
| | | | | | | | | | | | | | | | |
| | | | |
| IT Services: 2.06% | | | | | | | | | | | | | | | | |
First Data Corporation | | | 10.63 | | | | 6-15-2021 | | | | 1,950,000 | | | | 2,157,188 | |
First Data Corporation 144A | | | 8.75 | | | | 1-15-2022 | | | | 3,000,000 | | | | 3,157,500 | |
Neustar Incorporated « | | | 4.50 | | | | 1-15-2023 | | | | 4,000,000 | | | | 3,400,000 | |
| | | | |
| | | | | | | | | | | | | | | 8,714,688 | |
| | | | | | | | | | | | | | | | |
| | | | |
Materials: 5.32% | | | | | | | | | | | | | | | | |
| | | | |
| Chemicals: 1.85% | | | | | | | | | | | | | | | | |
Huntsman International LLC | | | 4.88 | | | | 11-15-2020 | | | | 4,000,000 | | | | 3,920,000 | |
Tronox Finance LLC | | | 6.38 | | | | 8-15-2020 | | | | 1,000,000 | | | | 820,000 | |
W.R. Grace & Company 144A | | | 5.63 | | | | 10-1-2024 | | | | 3,000,000 | | | | 3,093,750 | |
| | | | |
| | | | | | | | | | | | | | | 7,833,750 | |
| | | | | | | | | | | | | | | | |
| | | | |
| Containers & Packaging: 1.18% | | | | | | | | | | | | | | | | |
Crown Americas Capital Corporation lV | | | 4.50 | | | | 1-15-2023 | | | | 3,000,000 | | | | 2,936,250 | |
Owens-Brockway Glass Container Incorporated 144A | | | 5.88 | | | | 8-15-2023 | | | | 2,000,000 | | | | 2,035,000 | |
| | | | |
| | | | | | | | | | | | | | | 4,971,250 | |
| | | | | | | | | | | | | | | | |
The accompanying notes are an integral part of these financial statements.
| | | | | | |
| Portfolio of investments—August 31, 2015 | | Wells Fargo Advantage High Income Fund | | | 13 | |
| | | | | | | | | | | | | | | | |
| Security name | | Interest rate | | | Maturity date | | | Principal | | | Value | |
| | | | |
| Metals & Mining: 2.29% | | | | | | | | | | | | | | | | |
AK Steel Corporation | | | 7.63 | % | | | 5-15-2020 | | | $ | 1,000,000 | | | $ | 655,000 | |
AK Steel Corporation | | | 8.38 | | | | 4-1-2022 | | | | 2,840,000 | | | | 1,789,200 | |
Steel Dynamics Incorporated | | | 5.50 | | | | 10-1-2024 | | | | 4,250,000 | | | | 4,127,812 | |
United States Steel Corporation « | | | 6.88 | | | | 4-1-2021 | | | | 3,500,000 | | | | 3,115,000 | |
| | | | |
| | | | | | | | | | | | | | | 9,687,012 | |
| | | | | | | | | | | | | | | | |
| | | | |
Telecommunication Services: 6.13% | | | | | | | | | | | | | | | | |
| | | | |
| Diversified Telecommunication Services: 2.01% | | | | | | | | | | | | | | | | |
CenturyLink Incorporated | | | 5.63 | | | | 4-1-2020 | | | | 3,000,000 | | | | 2,996,250 | |
Cincinnati Bell Incorporated | | | 8.38 | | | | 10-15-2020 | | | | 3,000,000 | | | | 3,135,000 | |
Frontier Communications Corporation | | | 6.25 | | | | 9-15-2021 | | | | 2,615,000 | | | | 2,386,188 | |
| | | | |
| | | | | | | | | | | | | | | 8,517,438 | |
| | | | | | | | | | | | | | | | |
| | | | |
| Wireless Telecommunication Services: 4.12% | | | | | | | | | | | | | | | | |
Sprint Capital Corporation | | | 6.90 | | | | 5-1-2019 | | | | 3,000,000 | | | | 3,041,250 | |
Sprint Corporation | | | 7.88 | | | | 9-15-2023 | | | | 8,750,000 | | | | 8,410,938 | |
T-Mobile USA Incorporated | | | 6.25 | | | | 4-1-2021 | | | | 3,000,000 | | | | 3,098,400 | |
T-Mobile USA Incorporated | | | 6.38 | | | | 3-1-2025 | | | | 2,000,000 | | | | 2,040,000 | |
Windstream Services LLC | | | 7.75 | | | | 10-1-2021 | | | | 1,000,000 | | | | 815,010 | |
| | | | |
| | | | | | | | | | | | | | | 17,405,598 | |
| | | | | | | | | | | | | | | | |
| | | | |
Utilities: 3.05% | | | | | | | | | | | | | | | | |
| | | | |
| Independent Power & Renewable Electricity Producers: 3.05% | | | | | | | | | | | | | | | | |
Calpine Corporation | | | 5.38 | | | | 1-15-2023 | | | | 1,500,000 | | | | 1,447,050 | |
Dynergy Incorporated | | | 5.88 | | | | 6-1-2023 | | | | 3,000,000 | | | | 2,865,000 | |
NRG Energy Incorporated | | | 6.63 | | | | 3-15-2023 | | | | 3,500,000 | | | | 3,438,750 | |
TerraForm Power Operating LLC 144A | | | 5.88 | | | | 2-1-2023 | | | | 1,500,000 | | | | 1,425,000 | |
The AES Corporation | | | 5.50 | | | | 3-15-2024 | | | | 3,910,000 | | | | 3,734,050 | |
| | | | |
| | | | | | | | | | | | | | | 12,909,850 | |
| | | | | | | | | | | | | | | | |
| | | | |
Total Corporate Bonds and Notes (Cost $334,921,408) | | | | | | | | | | | | | | | 314,059,992 | |
| | | | | | | | | | | | | | | | |
| | | | |
Loans: 6.09% | | | | | | | | | | | | | | | | |
| | | | |
Consumer Discretionary: 0.91% | | | | | | | | | | | | | | | | |
| | | | |
| Hotels, Restaurants & Leisure: 0.91% | | | | | | | | | | | | | | | | |
Aramark Corporation ± | | | 3.25 | | | | 9-7-2019 | | | | 3,880,000 | | | | 3,864,480 | |
| | | | | | | | | | | | | | | | |
| | | | |
Financials: 1.87% | | | | | | | | | | | | | | | | |
| | | | |
| Diversified Financial Services: 0.71% | | | | | | | | | | | | | | | | |
Delos Finance SARL ± | | | 3.50 | | | | 3-6-2021 | | | | 3,000,000 | | | | 2,994,750 | |
| | | | | | | | | | | | | | | | |
| | | | |
| REITs: 1.16% | | | | | | | | | | | | | | | | |
Crown Castle Operating Company ± | | | 3.00 | | | | 1-31-2021 | | | | 4,925,000 | | | | 4,903,724 | |
| | | | | | | | | | | | | | | | |
| | | | |
Industrials: 0.82% | | | | | | | | | | | | | | | | |
| | | | |
| Commercial Services & Supplies: 0.82% | | | | | | | | | | | | | | | | |
ServiceMaster Company ± | | | 4.25 | | | | 7-1-2021 | | | | 3,473,750 | | | | 3,453,915 | |
| | | | | | | | | | | | | | | | |
The accompanying notes are an integral part of these financial statements.
| | | | |
| 14 | | Wells Fargo Advantage High Income Fund | | Portfolio of investments—August 31, 2015 |
| | | | | | | | | | | | | | | | |
| Security name | | Interest rate | | | Maturity date | | | Principal | | | Value | |
| | | | |
Information Technology: 1.57% | | | | | | | | | | | | | | | | |
| | | | |
| Internet Software & Services: 0.75% | | | | | | | | | | | | | | | | |
Zayo Group LLC ± | | | 3.75 | % | | | 5-6-2021 | | | $ | 3,201,404 | | | $ | 3,180,883 | |
| | | | | | | | | | | | | | | | |
| | | | |
| Semiconductors & Semiconductor Equipment: 0.82% | | | | | | | | | | | | | | | | |
Freescale Semiconductor Incorporated ± | | | 4.25 | | | | 3-1-2020 | | | | 3,447,500 | | | | 3,442,122 | |
| | | | | | | | | | | | | | | | |
| | | | |
Telecommunication Services: 0.92% | | | | | | | | | | | | | | | | |
| | | | |
| Wireless Telecommunication Services: 0.92% | | | | | | | | | | | | | | | | |
SBA Communications Corporation ± | | | 3.25 | | | | 3-24-2021 | | | | 3,960,000 | | | | 3,914,817 | |
| | | | | | | | | | | | | | | | |
| | | | |
Total Loans (Cost $25,886,846) | | | | | | | | | | | | | | | 25,754,691 | |
| | | | | | | | | | | | | | | | |
| | | | |
Municipal Obligations: 1.78% | | | | | | | | | | | | | | | | |
| | | | |
| Alabama: 0.42% | | | | | | | | | | | | | | | | |
Jefferson County AL Taxable Warrants Series D (GO Revenue) | | | 4.90 | | | | 4-1-2017 | | | | 1,750,000 | | | | 1,773,345 | |
| | | | | | | | | | | | | | | | |
| | | | |
| Florida: 0.72% | | | | | | | | | | | | | | | | |
Florida Development Financial Corporation Renaissance Charter School Project Series B (Education Revenue) | | | 7.50 | | | | 6-15-2018 | | | | 1,015,000 | | | | 1,017,091 | |
Florida Development Financial Corporation Renaissance Charter School Project Series B (Education Revenue) | | | 8.00 | | | | 12-15-2018 | | | | 1,965,000 | | | | 2,009,409 | |
| | | | |
| | | | | | | | | | | | | | | 3,026,500 | |
| | | | | | | | | | | | | | | | |
| | | | |
| Illinois: 0.64% | | | | | | | | | | | | | | | | |
Chicago IL Build America Bonds Direct Payment Project Series 2010B (GO Revenue) | | | 7.52 | | | | 1-1-2040 | | | | 2,855,000 | | | | 2,714,877 | |
| | | | | | | | | | | | | | | | |
| | | | |
Total Municipal Obligations (Cost $7,640,126) | | | | | | | | | | | | | | | 7,514,722 | |
| | | | | | | | | | | | | | | | |
| | | | |
Yankee Corporate Bonds and Notes: 12.11% | | | | | | | | | | | | | | | | |
| | | | |
Consumer Discretionary:2.56% | | | | | | | | | | | | | | | | |
| | | | |
| Automobiles: 0.70% | | | | | | | | | | | | | | | | |
Fiat Chrysler Automobiles | | | 5.25 | | | | 4-15-2023 | | | | 3,000,000 | | | | 2,966,250 | |
| | | | | | | | | | | | | | | | |
| | | | |
| Hotels, Restaurants & Leisure: 0.67% | | | | | | | | | | | | | | | | |
International Game Technology 144A | | | 6.50 | | | | 2-15-2025 | | | | 3,000,000 | | | | 2,842,500 | |
| | | | | | | | | | | | | | | | |
| | | | |
| Media: 1.19% | | | | | | | | | | | | | | | | |
Altice SA 144A | | | 7.75 | | | | 5-15-2022 | | | | 1,000,000 | | | �� | 975,000 | |
Quebecor Media Incorporated | | | 5.75 | | | | 1-15-2023 | | | | 4,000,000 | | | | 4,039,000 | |
| | | | |
| | | | | | | | | | | | | | | 5,014,000 | |
| | | | | | | | | | | | | | | | |
| | | | |
Financials: 2.67% | | | | | | | | | | | | | | | | |
| | | | |
| Banks: 0.95% | | | | | | | | | | | | | | | | |
Royal Bank of Scotland Group plc | | | 5.13 | | | | 5-28-2024 | | | | 4,000,000 | | | | 4,033,324 | |
| | | | | | | | | | | | | | | | |
The accompanying notes are an integral part of these financial statements.
| | | | | | |
| Portfolio of investments—August 31, 2015 | | Wells Fargo Advantage High Income Fund | | | 15 | |
| | | | | | | | | | | | | | | | |
| Security name | | Interest rate | | | Maturity date | | | Principal | | | Value | |
| | | | |
| Diversified Financial Services: 1.72% | | | | | | | | | | | | | | | | |
AerCap Ireland Capital Limited | | | 5.00 | % | | | 10-1-2021 | | | $ | 3,500,000 | | | $ | 3,622,500 | |
Schaeffler Finance BV 144A | | | 4.75 | | | | 5-15-2023 | | | | 2,670,000 | | | | 2,569,875 | |
Schaeffler Holding Finance BV 144A | | | 6.75 | | | | 11-15-2022 | | | | 1,000,000 | | | | 1,067,500 | |
| | | | |
| | | | | | | | | | | | | | | 7,259,875 | |
| | | | | | | | | | | | | | | | |
| | | | |
Health Care: 1.70% | | | | | | | | | | | | | | | | |
| | | | |
| Pharmaceuticals: 1.70% | | | | | | | | | | | | | | | | |
Valeant Pharmaceuticals International Incorporated 144A | | | 6.13 | | | | 4-15-2025 | | | | 7,000,000 | | | | 7,210,000 | |
| | | | | | | | | | | | | | | | |
| | | | |
Industrials: 0.36% | | | | | | | | | | | | | | | | |
| | | | |
| Aerospace & Defense: 0.36% | | | | | | | | | | | | | | | | |
Bombardier Incorporated 144A | | | 7.50 | | | | 3-15-2025 | | | | 2,000,000 | | | | 1,505,000 | |
| | | | | | | | | | | | | | | | |
| | | | |
Information Technology: 0.62% | | | | | | | | | | | | | | | | |
| | | | |
| Semiconductors & Semiconductor Equipment: 0.62% | | | | | | | | | | | | | | | | |
NXP Funding LLC 144A | | | 5.75 | | | | 2-15-2021 | | | | 2,500,000 | | | | 2,609,375 | |
| | | | | | | | | | | | | | | | |
| | | | |
Materials: 2.35% | | | | | | | | | | | | | | | | |
| | | | |
| Containers & Packaging: 0.91% | | | | | | | | | | | | | | | | |
Ardagh Holdings USA Incorporated 144A | | | 6.75 | | | | 1-31-2021 | | | | 3,750,000 | | | | 3,825,000 | |
| | | | | | | | | | | | | | | | |
| | | | |
| Metals & Mining: 0.47% | | | | | | | | | | | | | | | | |
ArcelorMittal SA | | | 7.00 | | | | 2-25-2022 | | | | 2,000,000 | | | | 1,995,000 | |
| | | | | | | | | | | | | | | | |
| | | | |
| Paper & Forest Products: 0.97% | | | | | | | | | | | | | | | | |
Sappi Papier Holding GmbH 144A | | | 6.63 | | | | 4-15-2021 | | | | 4,000,000 | | | | 4,100,000 | |
| | | | | | | | | | | | | | | | |
| | | | |
Telecommunication Services: 1.85% | | | | | | | | | | | | | | | | |
| | | | |
| Diversified Telecommunication Services: 1.85% | | | | | | | | | | | | | | | | |
Intelsat Luxembourg SA | | | 7.75 | | | | 6-1-2021 | | | | 5,000,000 | | | | 3,746,250 | |
Virgin Media Finance plc 144A | | | 5.75 | | | | 1-15-2025 | | | | 1,500,000 | | | | 1,506,563 | |
Virgin Media Finance plc 144A | | | 6.00 | | | | 10-15-2024 | | | | 500,000 | | | | 513,125 | |
Virgin Media Finance plc 144A | | | 6.38 | | | | 4-15-2023 | | | | 2,000,000 | | | | 2,078,740 | |
| | | | |
| | | | | | | | | | | | | | | 7,844,678 | |
| | | | | | | | | | | | | | | | |
| | | | |
Total Yankee Corporate Bonds and Notes (Cost $53,419,282) | | | | | | | | | | | | | | | 51,205,002 | |
| | | | | | | | | | | | | | | | |
| | | | |
| | | Yield | | | | | | Shares | | | | |
| | | | |
Short-Term Investments: 5.94% | | | | | | | | | | | | | | | | |
| | | | |
| Investment Companies: 5.75% | | | | | | | | | | | | | | | | |
Securities Lending Cash Investments, LLC (l)(r)(u) | | | 0.15 | | | | | | | | 15,766,988 | | | | 15,766,988 | |
Wells Fargo Advantage Cash Investment Money Market Fund, Select Class (l)(u) | | | 0.15 | | | | | | | | 8,550,902 | | | | 8,550,902 | |
| | | | |
| | | | | | | | | | | | | | | 24,317,890 | |
| | | | | | | | | | | | | | | | |
The accompanying notes are an integral part of these financial statements.
| | | | |
| 16 | | Wells Fargo Advantage High Income Fund | | Portfolio of investments—August 31, 2015 |
| | | | | | | | | | | | | | | | |
| Security name | | Yield | | | Maturity date | | | Principal | | | Value | |
| | | | |
| U.S. Treasury Securities: 0.19% | | | | | | | | | | | | | | | | |
U.S. Treasury Bill (z)# | | | 0.01 | % | | | 9-17-2015 | | | $ | 800,000 | | | $ | 799,999 | |
| | | | | | | | | | | | | | | | |
| | | | |
Total Short-Term Investments (Cost $25,117,888) | | | | | | | | | | | | | | | 25,117,889 | |
| | | | | | | | | | | | | | | | |
| | | | | | | | |
| Total investments in securities (Cost $446,985,550) * | | | 100.19 | % | | | 423,652,296 | |
Other assets and liabilities, net | | | (0.19 | ) | | | (794,695 | ) |
| | | | | | | | |
| Total net assets | | | 100.00 | % | | $ | 422,857,601 | |
| | | | | | | | |
| 144A | The security may be resold in transactions exempt from registration, normally to qualified institutional buyers, pursuant to Rule 144A under the Securities Act of 1933. |
| (i) | Illiquid security for which the designation as illiquid is unaudited. |
| (s) | The security is currently in default with regards to scheduled interest and/or principal payments. The Fund has stopped accruing interest on the security. |
| « | All or a portion of this security is on loan. |
| ¥ | A payment-in-kind (PIK) security is a security in which the issuer may make interest or dividend payments in cash or additional securities. These additional securities generally have the same terms as the original holdings. |
| ± | Variable rate investment. The rate shown is the rate in effect at period end. |
| (l) | The security represents an affiliate of the Fund as defined in the Investment Company Act of 1940. |
| (r) | The investment is a non-registered investment vehicle purchased with cash collateral received from securities on loan. |
| (u) | The rate represents the 7-day annualized yield at period end. |
| (z) | Zero coupon security. The rate represents the current yield to maturity. |
| # | All or a portion of this security is segregated as collateral for investments in derivative instruments. |
| * | Cost for federal income tax purposes is $447,000,740 and unrealized gains (losses) consists of: |
| | | | | | | | |
| | Gross unrealized gains | | $ | 4,062,202 | | | |
| | Gross unrealized losses | | | (27,410,646 | ) | | |
| | | | | | | | |
| | Net unrealized losses | | $ | (23,348,444 | ) | | |
The accompanying notes are an integral part of these financial statements.
| | | | | | |
| Statement of assets and liabilities—August 31, 2015 | | Wells Fargo Advantage High Income Fund | | | 17 | |
| | | | |
| | | | |
| |
Assets | | | | |
Investments | | | | |
In unaffiliated securities (including $15,394,388 of securities loaned), at value (cost $422,667,660) | | $ | 399,334,406 | |
In affiliated securities, at value (cost $24,317,890) | | | 24,317,890 | |
| | | | |
Total investments, at value (cost $446,985,550) | | | 423,652,296 | |
Receivable for investments sold | | | 13,506,688 | |
Receivable for Fund shares sold | | | 340,655 | |
Receivable for interest | | | 7,272,829 | |
Receivable for daily variation margin on open futures contracts | | | 26,500 | |
Receivable for securities lending income | | | 17,470 | |
Prepaid expenses and other assets | | | 43,246 | |
| | | | |
Total assets | | | 444,859,684 | |
| | | | |
| |
Liabilities | | | | |
Dividends payable | | | 442,671 | |
Payable for Fund shares redeemed | | | 5,410,495 | |
Payable upon receipt of securities loaned | | | 15,766,988 | |
Management fee payable | | | 154,520 | |
Distribution fees payable | | | 12,468 | |
Administration fees payable | | | 54,225 | |
Accrued expenses and other liabilities | | | 160,716 | |
| | | | |
Total liabilities | | | 22,002,083 | |
| | | | |
Total net assets | | $ | 422,857,601 | |
| | | | |
| |
NET ASSETS CONSIST OF | | | | |
Paid-in capital | | $ | 465,491,578 | |
Overdistributed net investment income | | | (45,674 | ) |
Accumulated net realized losses on investments | | | (19,458,365 | ) |
Net unrealized losses on investments | | | (23,129,938 | ) |
| | | | |
Total net assets | | $ | 422,857,601 | |
| | | | |
| |
COMPUTATION OF NET ASSET VALUE AND OFFERING PRICE PER SHARE | | | | |
Net assets – Class A | | $ | 55,873,438 | |
Shares outstanding – Class A1 | | | 8,446,516 | |
Net asset value per share – Class A | | | $6.61 | |
Maximum offering price per share – Class A2 | | | $6.92 | |
Net assets – Class B | | $ | 194,427 | |
Shares outstanding – Class B1 | | | 29,398 | |
Net asset value per share – Class B | | | $6.61 | |
Net assets – Class C | | $ | 18,967,542 | |
Shares outstanding – Class C1 | | | 2,867,809 | |
Net asset value per share – Class C | | | $6.61 | |
Net assets – Administrator Class | | $ | 70,841,420 | |
Shares outstanding – Administrator Class1 | | | 10,601,126 | |
Net asset value per share – Administrator Class | | | $6.68 | |
Net assets – Institutional Class | | $ | 92,215,763 | |
Shares outstanding – Institutional Class1 | | | 13,812,268 | |
Net asset value per share – Institutional Class | | | $6.68 | |
Net assets – Investor Class | | $ | 184,765,011 | |
Shares outstanding – Investor Class1 | | | 27,814,122 | |
Net asset value per share – Investor Class | | | $6.64 | |
| 1 | The Fund has an unlimited number of authorized shares. |
| 2 | Maximum offering price is computed as 100/95.50 of net asset value. On investments of $50,000 or more, the offering price is reduced. |
The accompanying notes are an integral part of these financial statements.
| | | | |
| 18 | | Wells Fargo Advantage High Income Fund | | Statement of operations—year ended August 31, 2015 |
| | | | |
| | | | |
| |
Investment income | | | | |
Interest | | $ | 31,012,731 | |
Securities lending income, net | | | 183,063 | |
Income from affiliated securities | | | 28,780 | |
| | | | |
Total investment income | | | 31,224,574 | |
| | | | |
| |
Expenses | | | | |
Management fee | | | 2,894,278 | |
Administration fees | | | | |
Class A | | | 109,726 | |
Class B | | | 494 | |
Class C | | | 36,095 | |
Administrator Class | | | 83,449 | |
Institutional Class | | | 100,139 | |
Investor Class | | | 432,870 | |
Shareholder servicing fees | | | | |
Class A | | | 171,447 | |
Class B | | | 772 | |
Class C | | | 56,398 | |
Administrator Class | | | 177,012 | |
Investor Class | | | 568,737 | |
Distribution fees | | | | |
Class B | | | 2,317 | |
Class C | | | 169,194 | |
Custody and accounting fees | | | 35,357 | |
Professional fees | | | 58,939 | |
Registration fees | | | 86,854 | |
Shareholder report expenses | | | 90,807 | |
Trustees’ fees and expenses | | | 9,642 | |
Other fees and expenses | | | 13,123 | |
| | | | |
Total expenses | | | 5,097,650 | |
Less: Fee waivers and/or expense reimbursements | | | (690,872 | ) |
| | | | |
Net expenses | | | 4,406,778 | |
| | | | |
Net investment income | | | 26,817,796 | |
| | | | |
| |
REALIZED AND UNREALIZED GAINS (LOSSES) ON INVESTMENTS | | | | |
| |
Net realized losses on: | | | | |
Unaffiliated securities | | | (18,466,872 | ) |
Futures transactions | | | (1,085,805 | ) |
| | | | |
Net realized losses on investments | | | (19,552,677 | ) |
| | | | |
| |
Net change in unrealized gains (losses) on: | | | | |
Unaffiliated securities | | | (33,933,888 | ) |
Futures transactions | | | 298,971 | |
| | | | |
Net change in unrealized gains (losses) on investments | | | (33,634,917 | ) |
| | | | |
Net realized and unrealized gains (losses) on investments | | | (53,187,594 | ) |
| | | | |
Net decrease in net assets resulting from operations | | $ | (26,369,798 | ) |
| | | | |
The accompanying notes are an integral part of these financial statements.
| | | | | | |
| Statement of changes in net assets | | Wells Fargo Advantage High Income Fund | | | 19 | |
| | | | | | | | | | | | | | | | |
| | | Year ended
August 31, 2015 | | | Year ended
August 31, 2014 | |
| | | | |
Operations | | | | | | | | | | | | | | | | |
Net investment income | | | | | | $ | 26,817,796 | | | | | | | $ | 36,580,956 | |
Net realized gains (losses) on investments | | | | | | | (19,552,677 | ) | | | | | | | 8,047,490 | |
Net change in unrealized gains (losses) on investments | | | | | | | (33,634,917 | ) | | | | | | | 13,478,951 | |
| | | | |
Net increase (decrease) in net assets resulting from operations | | | | | | | (26,369,798 | ) | | | | | | | 58,107,397 | |
| | | | |
| | | | |
Distributions to shareholders from | | | | | | | | | | | | | | | | |
Net investment income | | | | | | | | | | | | | | | | |
Class A | | | | | | | (3,438,812 | ) | | | | | | | (4,988,884 | ) |
Class B | | | | | | | (13,181 | ) | | | | | | | (35,240 | ) |
Class C | | | | | | | (964,110 | ) | | | | | | | (1,345,745 | ) |
Administrator Class | | | | | | | (4,275,963 | ) | | | | | | | (3,773,802 | ) |
Institutional Class | | | | | | | (6,767,866 | ) | | | | | | | (9,751,084 | ) |
Investor Class | | | | | | | (11,357,864 | ) | | | | | | | (16,603,815 | ) |
Net realized gains | | | | | | | | | | | | | | | | |
Class A | | | | | | | (969,256 | ) | | | | | | | (3,842,804 | ) |
Class B | | | | | | | (4,641 | ) | | | | | | | (38,215 | ) |
Class C | | | | | | | (329,907 | ) | | | | | | | (1,274,798 | ) |
Administrator Class | | | | | | | (1,216,589 | ) | | | | | | | (2,836,913 | ) |
Institutional Class | | | | | | | (1,577,413 | ) | | | | | | | (8,563,107 | ) |
Investor Class | | | | | | | (3,110,108 | ) | | | | | | | (13,040,948 | ) |
| | | | |
Total distributions to shareholders | | | | | | | (34,025,710 | ) | | | | | | | (66,095,355 | ) |
| | | | |
| | | | |
Capital share transactions | | | Shares | | | | | | | | Shares | | | | | |
Proceeds from shares sold | | | | | | | | | | | | | | | | |
Class A | | | 2,385,439 | | | | 16,516,128 | | | | 3,794,924 | | | | 28,252,612 | |
Class B | | | 215 | | | | 1,490 | | | | 16,194 | | | | 121,959 | |
Class C | | | 142,066 | | | | 992,784 | | | | 485,547 | | | | 3,643,236 | |
Administrator Class | | | 2,599,187 | | | | 18,252,362 | | | | 8,278,192 | | | | 62,362,797 | |
Institutional Class | | | 9,831,357 | | | | 68,763,262 | | | | 2,525,658 | | | | 19,041,640 | |
Investor Class | | | 11,226,065 | | | | 78,579,771 | | | | 14,510,420 | | | | 108,878,323 | |
| | | | |
| | | | | | | 183,105,797 | | | | | | | | 222,300,567 | |
| | | | |
Reinvestment of distributions | | | | | | | | | | | | | | | | |
Class A | | | 617,709 | | | | 4,276,903 | | | | 1,143,459 | | | | 8,497,069 | |
Class B | | | 2,193 | | | | 15,217 | | | | 9,113 | | | | 67,675 | |
Class C | | | 178,104 | | | | 1,232,399 | | | | 337,949 | | | | 2,509,671 | |
Administrator Class | | | 778,068 | | | | 5,443,239 | | | | 829,521 | | | | 6,226,308 | |
Institutional Class | | | 454,543 | | | | 3,178,002 | | | | 683,853 | | | | 5,128,743 | |
Investor Class | | | 1,849,895 | | | | 12,873,589 | | | | 3,599,102 | | | | 26,847,596 | |
| | | | |
| | | | | | | 27,019,349 | | | | | | | | 49,277,062 | |
| | | | |
Payment for shares redeemed | | | | | | | | | | | | | | | | |
Class A | | | (5,407,997 | ) | | | (37,617,999 | ) | | | (7,335,423 | ) | | | (54,765,677 | ) |
Class B | | | (44,840 | ) | | | (316,746 | ) | | | (93,091 | ) | | | (696,788 | ) |
Class C | | | (1,200,156 | ) | | | (8,371,010 | ) | | | (1,278,499 | ) | | | (9,551,308 | ) |
Administrator Class | | | (6,146,825 | ) | | | (43,257,396 | ) | | | (4,267,272 | ) | | | (32,180,199 | ) |
Institutional Class | | | (12,944,454 | ) | | | (89,504,800 | ) | | | (15,484,067 | ) | | | (116,484,382 | ) |
Investor Class | | | (24,564,932 | ) | | | (172,729,048 | ) | | | (20,541,049 | ) | | | (153,671,049 | ) |
| | | | |
| | | | | | | (351,796,999 | ) | | | | | | | (367,349,403 | ) |
| | | | |
Net decrease in net assets resulting from capital share transactions | | | | | | | (141,671,853 | ) | | | | | | | (95,771,774 | ) |
| | | | |
Total decrease in net assets | | | | | | | (202,067,361 | ) | | | | | | | (103,759,732 | ) |
| | | | |
| | | | |
Net assets | | | | | | | | | | | | | | | | |
Beginning of period | | | | | | | 624,924,962 | | | | | | | | 728,684,694 | |
| | | | |
End of period | | | | | | $ | 422,857,601 | | | | | | | $ | 624,924,962 | |
| | | | |
Overdistributed net investment income | | | | | | $ | (45,674 | ) | | | | | | $ | (46,842 | ) |
| | | | |
The accompanying notes are an integral part of these financial statements.
| | | | |
| 20 | | Wells Fargo Advantage High Income Fund | | Financial highlights |
(For a share outstanding throughout each period)
| | | | | | | | | | | | | | | | | | | | |
| | | Year ended August 31 | |
| CLASS A | | 2015 | | | 2014 | | | 2013 | | | 2012 | | | 2011 | |
Net asset value, beginning of period | | | $7.42 | | | | $7.50 | | | | $7.63 | | | | $7.17 | | | | $7.14 | |
Net investment income | | | 0.35 | 1 | | | 0.39 | 1 | | | 0.43 | | | | 0.46 | | | | 0.50 | |
Net realized and unrealized gains (losses) on investments | | | (0.71 | ) | | | 0.23 | | | | (0.10 | ) | | | 0.47 | | | | 0.03 | |
| | | | | | | | | | | | | | | | | | | | |
Total from investment operations | | | (0.36 | ) | | | 0.62 | | | | 0.33 | | | | 0.93 | | | | 0.53 | |
Distributions to shareholders from | | | | | | | | | | | | | | | | | | | | |
Net investment income | | | (0.35 | ) | | | (0.39 | ) | | | (0.42 | ) | | | (0.47 | ) | | | (0.50 | ) |
Net realized gains | | | (0.10 | ) | | | (0.31 | ) | | | (0.04 | ) | | | 0.00 | | | | 0.00 | |
| | | | | | | | | | | | | | | | | | | | |
Total distributions to shareholders | | | (0.45 | ) | | | (0.70 | ) | | | (0.46 | ) | | | (0.47 | ) | | | (0.50 | ) |
Net asset value, end of period | | | $6.61 | | | | $7.42 | | | | $7.50 | | | | $7.63 | | | | $7.17 | |
Total return2 | | | (5.00 | )% | | | 8.60 | % | | | 4.42 | % | | | 13.30 | % | | | 7.41 | % |
Ratios to average net assets (annualized) | | | | | | | | | | | | | | | | | | | | |
Gross expenses | | | 1.01 | % | | | 1.01 | % | | | 0.99 | % | | | 1.00 | % | | | 1.01 | % |
Net expenses | | | 0.90 | % | | | 0.90 | % | | | 0.90 | % | | | 0.90 | % | | | 0.90 | % |
Net investment income | | | 5.01 | % | | | 5.22 | % | | | 5.52 | % | | | 6.30 | % | | | 6.77 | % |
Supplemental data | | | | | | | | | | | | | | | | | | | | |
Portfolio turnover rate | | | 51 | % | | | 46 | % | | | 60 | % | | | 22 | % | | | 78 | % |
Net assets, end of period (000s omitted) | | | $55,873 | | | | $80,478 | | | | $99,410 | | | | $123,727 | | | | $102,361 | |
| 1 | Calculated based upon average shares outstanding |
| 2 | Total return calculations do not include any sales charges. |
The accompanying notes are an integral part of these financial statements.
| | | | | | |
| Financial highlights | | Wells Fargo Advantage High Income Fund | | | 21 | |
(For a share outstanding throughout each period)
| | | | | | | | | | | | | | | | | | | | |
| | | Year ended August 31 | |
| CLASS B | | 2015 | | | 2014 | | | 2013 | | | 2012 | | | 2011 | |
Net asset value, beginning of period | | | $7.42 | | | | $7.50 | | | | $7.63 | | | | $7.17 | | | | $7.13 | |
Net investment income | | | 0.30 | 1 | | | 0.34 | 1 | | | 0.37 | 1 | | | 0.41 | 1 | | | 0.45 | |
Net realized and unrealized gains (losses) on investments | | | (0.71 | ) | | | 0.22 | | | | (0.09 | ) | | | 0.46 | | | | 0.04 | |
| | | | | | | | | | | | | | | | | | | | |
Total from investment operations | | | (0.41 | ) | | | 0.56 | | | | 0.28 | | | | 0.87 | | | | 0.49 | |
Distributions to shareholders from | | | | | | | | | | | | | | | | | | | | |
Net investment income | | | (0.30 | ) | | | (0.33 | ) | | | (0.37 | ) | | | (0.41 | ) | | | (0.45 | ) |
Net realized gains | | | (0.10 | ) | | | (0.31 | ) | | | (0.04 | ) | | | 0.00 | | | | 0.00 | |
| | | | | | | | | | | | | | | | | | | | |
Total distributions to shareholders | | | (0.40 | ) | | | (0.64 | ) | | | (0.41 | ) | | | (0.41 | ) | | | (0.45 | ) |
Net asset value, end of period | | | $6.61 | | | | $7.42 | | | | $7.50 | | | | $7.63 | | | | $7.17 | |
Total return2 | | | (5.71 | )% | | | 7.79 | % | | | 3.64 | % | | | 12.46 | % | | | 6.76 | % |
Ratios to average net assets (annualized) | | | | | | | | | | | | | | | | | | | | |
Gross expenses | | | 1.76 | % | | | 1.76 | % | | | 1.74 | % | | | 1.75 | % | | | 1.76 | % |
Net expenses | | | 1.65 | % | | | 1.65 | % | | | 1.65 | % | | | 1.65 | % | | | 1.65 | % |
Net investment income | | | 4.27 | % | | | 4.51 | % | | | 4.77 | % | | | 5.59 | % | | | 6.04 | % |
Supplemental data | | | | | | | | | | | | | | | | | | | | |
Portfolio turnover rate | | | 51 | % | | | 46 | % | | | 60 | % | | | 22 | % | | | 78 | % |
Net assets, end of period (000s omitted) | | | $194 | | | | $533 | | | | $1,047 | | | | $1,470 | | | | $2,452 | |
| 1 | Calculated based upon average shares outstanding |
| 2 | Total return calculations do not include any sales charges. |
The accompanying notes are an integral part of these financial statements.
| | | | |
| 22 | | Wells Fargo Advantage High Income Fund | | Financial highlights |
(For a share outstanding throughout each period)
| | | | | | | | | | | | | | | | | | | | |
| | | Year ended August 31 | |
| CLASS C | | 2015 | | | 2014 | | | 2013 | | | 2012 | | | 2011 | |
Net asset value, beginning of period | | | $7.42 | | | | $7.50 | | | | $7.63 | | | | $7.17 | | | | $7.14 | |
Net investment income | | | 0.30 | 1 | | | 0.32 | | | | 0.37 | | | | 0.41 | | | | 0.45 | |
Net realized and unrealized gains (losses) on investments | | | (0.71 | ) | | | 0.24 | | | | (0.09 | ) | | | 0.46 | | | | 0.03 | |
| | | | | | | | | | | | | | | | | | | | |
Total from investment operations | | | (0.41 | ) | | | 0.56 | | | | 0.28 | | | | 0.87 | | | | 0.48 | |
Distributions to shareholders from | | | | | | | | | | | | | | | | | | | | |
Net investment income | | | (0.30 | ) | | | (0.33 | ) | | | (0.37 | ) | | | (0.41 | ) | | | (0.45 | ) |
Net realized gains | | | (0.10 | ) | | | (0.31 | ) | | | (0.04 | ) | | | 0.00 | | | | 0.00 | |
| | | | | | | | | | | | | | | | | | | | |
Total distributions to shareholders | | | (0.40 | ) | | | (0.64 | ) | | | (0.41 | ) | | | (0.41 | ) | | | (0.45 | ) |
Net asset value, end of period | | | $6.61 | | | | $7.42 | | | | $7.50 | | | | $7.63 | | | | $7.17 | |
Total return2 | | | (5.71 | )% | | | 7.80 | % | | | 3.65 | % | | | 12.47 | % | | | 6.62 | % |
Ratios to average net assets (annualized) | | | | | | | | | | | | | | | | | | | | |
Gross expenses | | | 1.76 | % | | | 1.76 | % | | | 1.74 | % | | | 1.75 | % | | | 1.76 | % |
Net expenses | | | 1.65 | % | | | 1.65 | % | | | 1.65 | % | | | 1.65 | % | | | 1.65 | % |
Net investment income | | | 4.27 | % | | | 4.48 | % | | | 4.76 | % | | | 5.56 | % | | | 6.01 | % |
Supplemental data | | | | | | | | | | | | | | | | | | | | |
Portfolio turnover rate | | | 51 | % | | | 46 | % | | | 60 | % | | | 22 | % | | | 78 | % |
Net assets, end of period (000s omitted) | | | $18,968 | | | | $27,791 | | | | $31,534 | | | | $32,089 | | | | $30,645 | |
| 1 | Calculated based upon average shares outstanding |
| 2 | Total return calculations do not include any sales charges. |
The accompanying notes are an integral part of these financial statements.
| | | | | | |
| Financial highlights | | Wells Fargo Advantage High Income Fund | | | 23 | |
(For a share outstanding throughout each period)
| | | | | | | | | | | | | | | | | | | | |
| | | Year ended August 31 | |
| ADMINISTRATOR CLASS | | 2015 | | | 2014 | | | 2013 | | | 2012 | | | 2011 | |
Net asset value, beginning of period | | | $7.49 | | | | $7.58 | | | | $7.70 | | | | $7.24 | | | | $7.20 | |
Net investment income | | | 0.36 | | | | 0.40 | | | | 0.44 | | | | 0.48 | | | | 0.51 | |
Net realized and unrealized gains (losses) on investments | | | (0.71 | ) | | | 0.22 | | | | (0.08 | ) | | | 0.46 | | | | 0.04 | |
| | | | | | | | | | | | | | | | | | | | |
Total from investment operations | | | (0.35 | ) | | | 0.62 | | | | 0.36 | | | | 0.94 | | | | 0.55 | |
Distributions to shareholders from | | | | | | | | | | | | | | | | | | | | |
Net investment income | | | (0.36 | ) | | | (0.40 | ) | | | (0.44 | ) | | | (0.48 | ) | | | (0.51 | ) |
Net realized gains | | | (0.10 | ) | | | (0.31 | ) | | | (0.04 | ) | | | 0.00 | | | | 0.00 | |
| | | | | | | | | | | | | | | | | | | | |
Total distributions to shareholders | | | (0.46 | ) | | | (0.71 | ) | | | (0.48 | ) | | | (0.48 | ) | | | (0.51 | ) |
Net asset value, end of period | | | $6.68 | | | | $7.49 | | | | $7.58 | | | | $7.70 | | | | $7.24 | |
Total return | | | (4.81 | )% | | | 8.53 | % | | | 4.68 | % | | | 13.36 | % | | | 7.66 | % |
Ratios to average net assets (annualized) | | | | | | | | | | | | | | | | | | | | |
Gross expenses | | | 0.92 | % | | | 0.94 | % | | | 0.91 | % | | | 0.90 | % | | | 0.92 | % |
Net expenses | | | 0.80 | % | | | 0.80 | % | | | 0.80 | % | | | 0.80 | % | | | 0.79 | % |
Net investment income | | | 5.12 | % | | | 5.31 | % | | | 5.57 | % | | | 6.37 | % | | | 6.73 | % |
Supplemental data | | | | | | | | | | | | | | | | | | | | |
Portfolio turnover rate | | | 51 | % | | | 46 | % | | | 60 | % | | | 22 | % | | | 78 | % |
Net assets, end of period (000s omitted) | | | $70,841 | | | | $100,159 | | | | $64,626 | | | | $33,395 | | | | $14,654 | |
The accompanying notes are an integral part of these financial statements.
| | | | |
| 24 | | Wells Fargo Advantage High Income Fund | | Financial highlights |
(For a share outstanding throughout each period)
| | | | | | | | | | | | | | | | | | | | |
| | | Year ended August 31 | |
| INSTITUTIONAL CLASS | | 2015 | | | 2014 | | | 2013 | | | 2012 | | | 2011 | |
Net asset value, beginning of period | | | $7.49 | | | | $7.57 | | | | $7.70 | | | | $7.24 | | | | $7.20 | |
Net investment income | | | 0.38 | | | | 0.43 | | | | 0.46 | | | | 0.50 | | | | 0.54 | |
Net realized and unrealized gains (losses) on investments | | | (0.71 | ) | | | 0.22 | | | | (0.09 | ) | | | 0.46 | | | | 0.04 | |
| | | | | | | | | | | | | | | | | | | | |
Total from investment operations | | | (0.33 | ) | | | 0.65 | | | | 0.37 | | | | 0.96 | | | | 0.58 | |
Distributions to shareholders from | | | | | | | | | | | | | | | | | | | | |
Net investment income | | | (0.38 | ) | | | (0.42 | ) | | | (0.46 | ) | | | (0.50 | ) | | | (0.54 | ) |
Net realized gains | | | (0.10 | ) | | | (0.31 | ) | | | (0.04 | ) | | | 0.00 | | | | 0.00 | |
| | | | | | | | | | | | | | | | | | | | |
Total distributions to shareholders | | | (0.48 | ) | | | (0.73 | ) | | | (0.50 | ) | | | (0.50 | ) | | | (0.54 | ) |
Net asset value, end of period | | | $6.68 | | | | $7.49 | | | | $7.57 | | | | $7.70 | | | | $7.24 | |
Total return | | | (4.52 | )% | | | 9.01 | % | | | 4.85 | % | | | 13.69 | % | | | 7.98 | % |
Ratios to average net assets (annualized) | | | | | | | | | | | | | | | | | | | | |
Gross expenses | | | 0.68 | % | | | 0.68 | % | | | 0.66 | % | | | 0.67 | % | | | 0.68 | % |
Net expenses | | | 0.50 | % | | | 0.50 | % | | | 0.50 | % | | | 0.50 | % | | | 0.50 | % |
Net investment income | | | 5.41 | % | | | 5.65 | % | | | 5.92 | % | | | 6.69 | % | | | 7.15 | % |
Supplemental data | | | | | | | | | | | | | | | | | | | | |
Portfolio turnover rate | | | 51 | % | | | 46 | % | | | 60 | % | | | 22 | % | | | 78 | % |
Net assets, end of period (000s omitted) | | | $92,216 | | | | $123,288 | | | | $217,648 | | | | $302,894 | | | | $238,490 | |
The accompanying notes are an integral part of these financial statements.
| | | | | | |
| Financial highlights | | Wells Fargo Advantage High Income Fund | | | 25 | |
(For a share outstanding throughout each period)
| | | | | | | | | | | | | | | | | | | | |
| | | Year ended August 31 | |
| INVESTOR CLASS | | 2015 | | | 2014 | | | 2013 | | | 2012 | | | 2011 | |
Net asset value, beginning of period | | | $7.45 | | | | $7.53 | | | | $7.66 | | | | $7.20 | | | | $7.16 | |
Net investment income | | | 0.35 | | | | 0.39 | | | | 0.42 | | | | 0.47 | | | | 0.50 | |
Net realized and unrealized gains (losses) on investments | | | (0.71 | ) | | | 0.23 | | | | (0.09 | ) | | | 0.46 | | | | 0.04 | |
| | | | | | | | | | | | | | | | | | | | |
Total from investment operations | | | (0.36 | ) | | | 0.62 | | | | 0.33 | | | | 0.93 | | | | 0.54 | |
Distributions to shareholders from | | | | | | | | | | | | | | | | | | | | |
Net investment income | | | (0.35 | ) | | | (0.39 | ) | | | (0.42 | ) | | | (0.47 | ) | | | (0.50 | ) |
Net realized gains | | | (0.10 | ) | | | (0.31 | ) | | | (0.04 | ) | | | 0.00 | | | | 0.00 | |
| | | | | | | | | | | | | | | | | | | | |
Total distributions to shareholders | | | (0.45 | ) | | | (0.70 | ) | | | (0.46 | ) | | | (0.47 | ) | | | (0.50 | ) |
Net asset value, end of period | | | $6.64 | | | | $7.45 | | | | $7.53 | | | | $7.66 | | | | $7.20 | |
Total return | | | (4.99 | )% | | | 8.56 | % | | | 4.40 | % | | | 13.24 | % | | | 7.53 | % |
Ratios to average net assets (annualized) | | | | | | | | | | | | | | | | | | | | |
Gross expenses | | | 1.04 | % | | | 1.03 | % | | | 1.01 | % | | | 1.03 | % | | | 1.04 | % |
Net expenses | | | 0.93 | % | | | 0.93 | % | | | 0.93 | % | | | 0.93 | % | | | 0.93 | % |
Net investment income | | | 4.99 | % | | | 5.19 | % | | | 5.48 | % | | | 6.27 | % | | | 6.73 | % |
Supplemental data | | | | | | | | | | | | | | | | | | | | |
Portfolio turnover rate | | | 51 | % | | | 46 | % | | | 60 | % | | | 22 | % | | | 78 | % |
Net assets, end of period (000s omitted) | | | $184,765 | | | | $292,677 | | | | $314,420 | | | | $343,752 | | | | $278,024 | |
The accompanying notes are an integral part of these financial statements.
| | | | |
| 26 | | Wells Fargo Advantage High Income Fund | | Notes to financial statements |
1. ORGANIZATION
Wells Fargo Funds Trust (the “Trust”), a Delaware statutory trust organized on March 10, 1999, is an open-end management investment company registered under the Investment Company Act of 1940, as amended (the “1940 Act”). As an investment company, the Trust follows the accounting and reporting guidance in Financial Accounting Standards Board (“FASB”) Accounting Standards Codification Topic 946, Financial Services – Investment Companies. These financial statements report on the Wells Fargo Advantage High Income Fund (the “Fund”) which is a diversified series of the Trust.
2. SIGNIFICANT ACCOUNTING POLICIES
The following significant accounting policies, which are consistently followed in the preparation of the financial statements of the Fund, are in conformity with U.S. generally accepted accounting principles which require management to make estimates and assumptions that affect the reported amounts of assets and liabilities, disclosure of contingent assets and liabilities at the date of the financial statements, and the reported amounts of revenues and expenses during the reporting period. Actual results could differ from those estimates.
Securities valuation
All investments are valued each business day as of the close of regular trading on the New York Stock Exchange (generally 4 p.m. Eastern Time).
Debt securities are valued at the evaluated bid price provided by an independent pricing service or, if a reliable price is not available, the quoted bid price from an independent broker-dealer.
Futures that are listed on a foreign or domestic exchange or market are valued at the official closing price or, if none, the last sales price.
Investments in registered open-end investment companies are valued at net asset value. Interests in non-registered investment vehicles that are redeemable at net asset value are fair valued at net asset value when available.
Investments which are not valued using any of the methods discussed above are valued at their fair value, as determined in good faith by the Board of Trustees of the Fund. The Board of Trustees has established a Valuation Committee comprised of the Trustees and has delegated to it the authority to take any actions regarding the valuation of portfolio securities that the Valuation Committee deems necessary or appropriate, including determining the fair value of portfolio securities, unless the determination has been delegated to the Management Valuation Team of Wells Fargo Funds Management, LLC (“Funds Management”). The Board of Trustees retains the authority to make or ratify any valuation decisions or approve any changes to the Valuation Procedures as it deems appropriate. On a quarterly basis, the Board of Trustees receives reports on any valuation actions taken by the Valuation Committee or the Management Valuation Team which may include items for ratification.
Valuations of fair valued securities are compared to the next actual sales price when available, or other appropriate market values, to assess the continued appropriateness of the fair valuation methodologies used. These securities are fair valued on a day-to-day basis, taking into consideration changes to appropriate market information and any significant changes to the inputs considered in the valuation process until there is a readily available price provided on an exchange or by an independent pricing service. Valuations received from an independent pricing service or independent broker-dealer quotes are periodically validated by comparisons to most recent trades and valuations provided by other independent pricing services in addition to the review of prices by the manager and/or subadviser. Unobservable inputs used in determining fair valuations are identified based on the type of security, taking into consideration factors utilized by market participants in valuing the investment, knowledge about the issuer and the current market environment.
Security loans
The Fund may lend its securities from time to time in order to earn additional income in the form of fees or interest on securities received as collateral or the investment of any cash received as collateral. The Fund continues to receive interest or dividends on the securities loaned. The Fund receives collateral in the form of cash or securities with a value at least equal to the value of the securities on loan. The value of the loaned securities is determined at the close of each business day and any additional required collateral is delivered to the Fund on the next business day. In a securities lending transaction, the net asset value of the Fund will be affected by an increase or decrease in the value of the securities loaned and by an increase or decrease in the value of the instrument in which collateral is invested. The amount of securities lending activity undertaken by the Fund fluctuates from time to time. In the event of default or bankruptcy by the borrower, the Fund may be prevented from recovering the loaned securities or gaining access to the collateral or may experience delays or costs in doing so. In addition, the investment of any cash collateral received may lose all or part of its value. The Fund has the right under the lending agreement to recover the securities from the borrower on demand.
| | | | | | |
| Notes to financial statements | | Wells Fargo Advantage High Income Fund | | | 27 | |
The Fund lends its securities through an unaffiliated securities lending agent. Cash collateral received in connection with its securities lending transactions is invested in Securities Lending Cash Investments, LLC (the “Securities Lending Fund”). The Securities Lending Fund is exempt from registration under Section 3(c)(7) of the 1940 Act and is managed by Funds Management and is subadvised by Wells Capital Management Incorporated (“WellsCap”). Funds Management receives an advisory fee starting at 0.05% and declining to 0.01% as the average daily net assets of the Securities Lending Fund increase. All of the fees received by Funds Management are paid to WellsCap for its services as subadviser. The Securities Lending Fund seeks to provide a positive return compared to the daily Fed Funds Open rate by investing in high-quality, U.S. dollar-denominated short-term money market instruments. Securities Lending Fund investments are fair valued based upon the amortized cost valuation technique. Income earned from investment in the Securities Lending Fund is included in securities lending income on the Statement of Operations.
When-issued transactions
The Fund may purchase securities on a forward commitment or when-issued basis. The Fund records a when-issued transaction on the trade date and will segregate assets in an amount at least equal in value to the Fund’s commitment to purchase when-issued securities. Securities purchased on a when-issued basis are marked-to-market daily and the Fund begins earning interest on the settlement date. Losses may arise due to changes in the market value of the underlying securities or if the counterparty does not perform under the contract.
Loans
The Fund may invest in direct debt instruments which are interests in amounts owed to lenders by corporate or other borrowers. The loans pay interest at rates which are periodically reset by reference to a base lending rate plus a spread. Investments in loans may be in the form of participations in loans or assignments of all or a portion of loans from third parties. When the Fund purchases participations, it generally has no rights to enforce compliance with terms of the loan agreement with the borrower. As a result, the Fund assumes the credit risk of both the borrower and the lender that is selling the participation. When the Fund purchases assignments from lenders, it acquires direct rights against the borrower on the loan and may enforce compliance by the borrower with the terms of the loan agreement. Loans may include fully funded term loans or unfunded loan commitments, which are contractual obligations for future funding.
Futures contracts
The Fund is subject to interest rate risk in the normal course of pursuing its investment objectives. The Fund may buy and sell futures contracts in order to gain exposure to, or protect against, changes in security values and interest rates. The primary risks associated with the use of futures contracts are the imperfect correlation between changes in market values of securities held by the Fund and the prices of futures contracts, and the possibility of an illiquid market.
The aggregate principal amounts of the contracts are not recorded in the financial statements. Fluctuations in the value of the contracts are recorded in the Statement of Assets and Liabilities as an asset or liability and in the Statement of Operations as unrealized gains or losses until the contracts are closed, at which point they are recorded as net realized gains or losses on futures contracts. With futures contracts, there is minimal counterparty risk to the Fund since futures are exchange traded and the exchange’s clearinghouse, as counterparty to all exchange traded futures, guarantees the futures against default.
Security transactions and income recognition
Securities transactions are recorded on a trade date basis. Realized gains or losses are recorded on the basis of identified cost.
Interest income is accrued daily and bond discounts are accreted and premiums are amortized daily based on the effective interest method. To the extent debt obligations are placed on non-accrual status, any related interest income may be reduced by writing off interest receivables when the collection of all or a portion of interest has become doubtful based on consistently applied procedures. If the issuer subsequently resumes interest payments or when the collectability of interest is reasonably assured, the debt obligation is removed from non-accrual status.
Distributions to shareholders
Distributions to shareholders from net investment income are accrued daily and paid monthly. Distributions from net realized gains, if any, are recorded on the ex-dividend date. Such distributions are determined in conformity with federal income tax regulations, which may differ in amount or character from net investment income and realized gains recognized for purposes of U.S. generally accepted accounting principles.
Federal and other taxes
The Fund intends to continue to qualify as a regulated investment company by distributing substantially all of its investment company taxable income and any net realized capital gains (after reduction for capital loss carryforwards) sufficient to relieve it from all, or substantially all, federal income taxes. Accordingly, no provision for federal income taxes was required.
| | | | |
| 28 | | Wells Fargo Advantage High Income Fund | | Notes to financial statements |
The Fund’s income and federal excise tax returns and all financial records supporting those returns for the prior three fiscal years are subject to examination by the federal and Delaware revenue authorities. Management has analyzed the Fund’s tax positions taken on federal, state, and foreign tax returns for all open tax years and does not believe that there are any uncertain tax positions that require recognition of a tax liability.
Reclassifications are made to the Fund’s capital accounts for permanent tax differences to reflect income and gains available for distribution (or available capital loss carryforwards) under federal income tax regulations. U.S. generally accepted accounting principles require that certain components of net assets be adjusted to reflect permanent differences between financial and tax reporting. These reclassifications have no effect on net assets or net asset values per share. At August 31, 2015, as a result of permanent book-to-tax differences, the following reclassification adjustments were made on the Statement of Assets and Liabilities:
| | |
Overdistributed net investment income | | Accumulated net realized losses on investments |
| $1,168 | | $(1,168) |
As of August 31, 2015, the Fund had capital loss carryforwards which consist of $112,566 in short-term capital losses and $3,953,475 in long-term capital losses.
As of August 31, 2015, the Fund had current year deferred post-October capital losses consisting of $5,971,737 in short-term losses and $9,202,081 in long-term losses which will be recognized on the first day of the following fiscal year.
Class allocations
The separate classes of shares offered by the Fund differ principally in applicable sales charges, distribution, shareholder servicing, and administration fees. Class specific expenses are charged directly to that share class. Investment income, common expenses, and realized and unrealized gains (losses) on investments are allocated daily to each class of shares based on the relative proportion of net assets of each class.
3. FAIR VALUATION MEASUREMENTS
Fair value measurements of investments are determined within a framework that has established a fair value hierarchy based upon the various data inputs utilized in determining the value of the Fund’s investments. The three-level hierarchy gives the highest priority to unadjusted quoted prices in active markets for identical assets or liabilities (Level 1) and the lowest priority to significant unobservable inputs (Level 3). The Fund’s investments are classified within the fair value hierarchy based on the lowest level of input that is significant to the fair value measurement. The inputs are summarized into three broad levels as follows:
| n | | Level 1 – quoted prices in active markets for identical securities |
| n | | Level 2 – other significant observable inputs (including quoted prices for similar securities, interest rates, prepayment speeds, credit risk, use of amortized cost, etc.) |
| n | | Level 3 – significant unobservable inputs (including the Fund’s own assumptions in determining the fair value of investments) |
The inputs or methodologies used for valuing investments in securities are not necessarily an indication of the risk associated with investing in those securities.
| | | | | | |
| Notes to financial statements | | Wells Fargo Advantage High Income Fund | | | 29 | |
The following is a summary of the inputs used in valuing the Fund’s assets and liabilities as of August 31, 2015:
| | | | | | | | | | | | | | | | |
| | | Quoted prices (Level 1) | | | Other significant
observable inputs (Level 2) | | | Significant
unobservable inputs (Level 3) | | | Total | |
Assets | | | | | | | | | | | | | | | | |
Investments in: | | | | | | | | | | | | | | | | |
| | | | |
Corporate bonds and notes | | $ | 0 | | | $ | 314,059,992 | | | $ | 0 | | | $ | 314,059,992 | |
| | | | |
Loans | | | 0 | | | | 25,754,691 | | | | 0 | | | | 25,754,691 | |
| | | | |
Municipal obligations | | | 0 | | | | 7,514,722 | | | | 0 | | | | 7,514,722 | |
| | | | |
Yankee corporate bonds and notes | | | 0 | | | | 51,205,002 | | | | 0 | | | | 51,205,002 | |
| | | | |
Short-term investments | | | | | | | | | | | | | | | | |
Investment companies | | | 8,550,902 | | | | 15,766,988 | | | | 0 | | | | 24,317,890 | |
U.S. Treasury securities | | | 799,999 | | | | 0 | | | | 0 | | | | 799,999 | |
| | | | |
| | | 9,350,901 | | | | 414,301,395 | | | | 0 | | | | 423,652,296 | |
Futures contracts | | | 26,500 | | | | 0 | | | | 0 | | | | 26,500 | |
Total assets | | $ | 9,377,401 | | | $ | 414,301,395 | | | $ | 0 | | | $ | 423,678,796 | |
Futures contracts are reported at their variation margin at measurement date, which represents the amount due to the Fund at that date. All other assets and liabilities are reported at their market value at measurement date.
The Fund recognizes transfers between levels within the fair value hierarchy at the end of the reporting period. At August 31, 2015, the Fund did not have any transfers into/out of Level 1, Level 2, or Level 3.
4. TRANSACTIONS WITH AFFILIATES
Management fee
Funds Management, an indirect wholly owned subsidiary of Wells Fargo & Company (“Wells Fargo”), is the manager of the Fund and provides advisory and fund-level administrative services under an investment management agreement. Under the investment management agreement, Funds Management is responsible for, among other services, implementing the investment objectives and strategies of the Fund, supervising the applicable subadviser, providing fund-level administrative services in connection with the Fund’s operations, and providing any other fund-level administrative services reasonably necessary for the operation of the Fund. As compensation for its services under the investment management agreement, Funds Management is entitled to receive an annual management fee starting at 0.55% and declining to 0.43% as the average daily net assets of the Fund increase.
Prior to July 1, 2015, Funds Management provided advisory services pursuant to an investment advisory agreement and was entitled to receive an annual fee which started at 0.50% and declined to 0.40% as the average daily net assets of the Fund increased. In addition, fund-level administrative services were provided by Funds Management under a separate administration agreement at an annual fee which started at 0.05% and declined to 0.03% as the average daily net assets of the Fund increased. For financial statement purposes, the advisory fee and fund-level administration fee for the year ended August 31, 2015 have been included in management fee on the Statement of Operations.
For the year ended August 31, 2015, the management fee was equivalent to an annual rate of 0.55% of the Fund’s average daily net assets.
Funds Management has retained the services of a subadviser to provide daily portfolio management to the Fund. The fee for subadvisory services is borne by Funds Management. WellsCap, an affiliate of Funds Management and an indirect wholly owned subsidiary of Wells Fargo, is the subadviser to the Fund and is entitled to receive a fee from Funds Management at an annual rate starting at 0.35% and declining to 0.20% as the average daily net assets of the Fund increase.
Administration fees
Under a class-level administration agreement, Funds Management provides class-level administrative services to the Fund, which includes paying fees and expenses for services provided by the transfer agent, sub-transfer agents, omnibus
| | | | |
| 30 | | Wells Fargo Advantage High Income Fund | | Notes to financial statements |
account servicers and record-keepers. As compensation for its services under the class-level administration agreement, Funds Management receives an annual fee which is calculated based on the average daily net assets of each class as follows:
| | | | |
| | | Class-level
administration fee | |
Class A, Class B, Class C | | | 0.16 | % |
Administrator Class | | | 0.10 | |
Institutional Class | | | 0.08 | |
Investor Class | | | 0.19 | |
Funds Management has contractually waived and/or reimbursed management and administration fees to the extent necessary to maintain certain net operating expense ratios for the Fund. Waiver of fees and/or reimbursement of expenses by Funds Management were made first from fund level expenses on a proportionate basis and then from class specific expenses. Funds Management has committed through December 31, 2015 to waive fees and/or reimburse expenses to the extent necessary to cap the Fund’s expenses at 0.90% for Class A shares, 1.65% for Class B shares, 1.65% for Class C shares, 0.80% for Administrator Class shares, 0.50% for Institutional Class shares, and 0.93% for Investor Class shares. Effective January 1, 2016, the manager has contractually committed through December 31, 2016, to waive fees and/or reimburse expenses to the extent necessary to cap the Fund’s Total Annual Fund Operating Expenses After Fee Waiver at 0.93 for Class A, 1.68% for Class B, 1.68% for Class C, 0.83% for Administrator Class and 0.53% for Institutional Class, respectively. After this time, the cap may be increased or the commitment to maintain the cap may be terminated only with the approval of the Board of Trustees.
Distribution fees
The Trust has adopted a distribution plan for Class B and Class C shares of the Fund pursuant to Rule 12b-1 under the 1940 Act. Distribution fees are charged to Class B and Class C shares and paid to Wells Fargo Funds Distributor, LLC (“Funds Distributor”), the principal underwriter, at an annual rate of 0.75% of the average daily net assets of Class B and Class C shares.
In addition, Funds Distributor is entitled to receive the front-end sales charge from the purchase of Class A shares and a contingent deferred sales charge on the redemption of certain Class A shares. Funds Distributor is also entitled to receive the contingent deferred sales charges from redemptions of Class B and Class C shares. For the year ended August 31, 2015, Funds Distributor received $3,170 from the sale of Class A shares.
Shareholder servicing fees
The Trust has entered into contracts with one or more shareholder servicing agents, whereby Class A, Class B, Class C, Administrator Class, and Investor Class of the Fund is charged a fee at an annual rate of 0.25% of the average daily net assets of each respective class.
A portion of these total shareholder servicing fees were paid to affiliates of Wells Fargo.
5. INVESTMENT PORTFOLIO TRANSACTIONS
Purchases and sales of investments, excluding U.S. government obligations (if any) and short-term securities, for the year ended August 31, 2015 were $249,692,454 and $357,804,385, respectively.
6. DERIVATIVE TRANSACTIONS
During the year ended August 31, 2015, the Fund entered into futures contracts to speculate on interest rates and to help manage the duration of the portfolio.
At August 31, 2015, the Fund had short futures contracts outstanding as follows:
| | | | | | | | | | | | | | | | |
| Expiration date | | Counterparty | | Contracts | | Type | | | Contract
value at
August 31, 2015 | | | Unrealized
gains | |
12-31-2015 | | JPMorgan | | 212 Short | | | 5-Year U.S. Treasury Notes | | | $ | 25,320,750 | | | $ | 203,316 | |
The Fund had an average notional amount of $34,323,727 in short futures contracts during the year ended August 31, 2015.
On August 31, 2015, the cumulative unrealized gains on futures contracts in the amount of $203,316 are reflected in net unrealized losses on investments on the Statement of Assets and Liabilities. The receivable for daily variation margin on open futures contracts reflected in the Statement of Assets and Liabilities only represents the current day’s variation margin. The realized losses and change in unrealized gains (losses) on futures contracts are reflected in the Statement of Operations.
| | | | | | |
| Notes to financial statements | | Wells Fargo Advantage High Income Fund | | | 31 | |
For certain types of derivative transactions, the Fund has entered into International Swaps and Derivatives Association, Inc. master agreements (“ISDA Master Agreements”) or similar agreements with approved counterparties. The ISDA Master Agreements or similar agreements may have requirements to deliver/deposit securities or cash to/with an exchange or broker-dealer as collateral and allows the Fund to offset, with each counterparty, certain derivative financial instrument’s assets and/or liabilities with collateral held or pledged. Collateral requirements differ by type of derivative. Collateral or margin requirements are set by the broker or exchange clearing house for exchange traded derivatives while collateral terms are contract specific for over-the-counter traded derivatives. Cash collateral that has been pledged to cover obligations of the Fund under ISDA Master Agreements or similar agreements, if any, will be reported separately in the Statement of Assets and Liabilities. Securities pledged as collateral, if any, for the same purpose are noted in the Portfolio of Investments. With respect to balance sheet offsetting, absent an event of default by the counterparty or a termination of the agreement, the reported amounts of financial assets and financial liabilities in the Statement of Assets and Liabilities are not offset across transactions between the Fund and the applicable counterparty. A reconciliation of the gross amounts on the Statement of Assets and Liabilities to the net amounts by derivative type, including any collateral exposure, is as follows:
| | | | | | | | | | | | | | | | |
| Derivative type | | Counterparty | | Gross amounts
of assets in the
Statement of
Assets and
Liabilities | | Amounts
subject to
netting
agreements | | | Collateral
received | | | Net amount
of assets | |
Futures – variation margin | | JPMorgan | | $26,500 | | $ | 0 | | | $ | 0 | | | $ | 26,500 | |
7. BANK BORROWINGS
The Trust (excluding the money market funds and certain other funds in the Trust) and Wells Fargo Variable Trust are parties to a $150,000,000 revolving credit agreement, whereby the Fund is permitted to use bank borrowings for temporary or emergency purposes, such as to fund shareholder redemption requests. Interest under the credit agreement is charged to the Fund based on a borrowing rate equal to the higher of the Federal Funds rate in effect on that day plus 1.25% or the overnight LIBOR rate in effect on that day plus 1.25%. In addition, an annual commitment fee equal to 0.10% of the unused balance is allocated to each participating fund. For the year ended August 31, 2015, the Fund paid $1,037 in commitment fees.
For the year ended August 31, 2015, there were no borrowings by the Fund under the agreement.
8. DISTRIBUTIONS TO SHAREHOLDERS
The tax character of distributions paid during the years ended August 31, 2015 and August 31, 2014 were as follows:
| | | | | | | | |
| | | Year ended August 31 | |
| | | 2015 | | | 2014 | |
Ordinary income | | $ | 26,817,971 | | | $ | 37,069,679 | |
Long-term capital gain | | | 7,207,739 | | | | 29,025,676 | |
As of August 31, 2015, the components of distributable earnings on a tax basis were as follows:
| | | | | | |
Undistributed ordinary income | | Unrealized losses | | Post-October capital losses deferred | | Capital loss carryforward |
| $396,997 | | $(23,348,444) | | $(15,173,818) | | $(4,066,041) |
9. INDEMNIFICATION
Under the Trust’s organizational documents, the officers and Trustees have been granted certain indemnification rights against certain liabilities that may arise out of performance of their duties to the Trust. Additionally, in the normal course of business, the Trust may enter into contracts with service providers that contain a variety of indemnification clauses. The Trust’s maximum exposure under these arrangements is dependent on future claims that may be made against the Fund and, therefore, cannot be estimated.
| | | | |
| 32 | | Wells Fargo Advantage High Income Fund | | Report of independent registered public accounting firm |
BOARD OF TRUSTEES AND SHAREHOLDERS OF WELLS FARGO FUNDS TRUST:
We have audited the accompanying statement of assets and liabilities, including the portfolio of investments, of the Wells Fargo Advantage High Income Fund (the “Fund”), one of the funds constituting the Wells Fargo Funds Trust, as of August 31, 2015, and the related statement of operations for the year then ended, the statements of changes in net assets for each of the years in the two-year period then ended, and the financial highlights for each of the years in the five-year period then ended. These financial statements and financial highlights are the responsibility of the Fund’s management. Our responsibility is to express an opinion on these financial statements and financial highlights based on our audits.
We conducted our audits in accordance with the standards of the Public Company Accounting Oversight Board (United States). Those standards require that we plan and perform the audit to obtain reasonable assurance about whether the financial statements and financial highlights are free of material misstatement. An audit includes examining, on a test basis, evidence supporting the amounts and disclosures in the financial statements. Our procedures included confirmation of securities owned as of August 31, 2015, by correspondence with the custodian and brokers, or by other appropriate auditing procedures. An audit also includes assessing the accounting principles used and significant estimates made by management, as well as evaluating the overall financial statement presentation. We believe that our audits provide a reasonable basis for our opinion.
In our opinion, the financial statements and financial highlights referred to above present fairly, in all material respects, the financial position of the Wells Fargo Advantage High Income Fund as of August 31, 2015, the results of its operations for the year then ended, the changes in its net assets for each of the years in the two-year period then ended, and the financial highlights for each of the years in the five-year period then ended, in conformity with U.S. generally accepted accounting principles.

Boston, Massachusetts
October 26, 2015
| | | | | | |
| Other information (unaudited) | | Wells Fargo Advantage High Income Fund | | | 33 | |
TAX INFORMATION
Pursuant to Section 852 of the Internal Revenue Code, $7,207,739 was designated as long-term capital gain distributions for the fiscal year ended August 31, 2015.
For the fiscal year ended August 31, 2015, $22,502,793 has been designated as interest-related dividends for nonresident alien shareholders pursuant to Section 871 of the Internal Revenue Code.
PROXY VOTING INFORMATION
A description of the policies and procedures that the Fund uses to determine how to vote proxies relating to portfolio securities is available, upon request, by calling 1-800-222-8222, visiting our website at wellsfargoadvantagefunds.com, or visiting the SEC website at sec.gov. Information regarding how the Fund voted proxies relating to portfolio securities during the most recent 12-month period ended June 30 is available on the Fund’s website at wellsfargoadvantagefunds.com or by visiting the SEC website at sec.gov.
PORTFOLIO HOLDINGS INFORMATION
The complete portfolio holdings for the Fund are publicly available monthly on the Fund’s website (wellsfargoadvantagefunds.com), on a one-month delayed basis. In addition, top ten holdings information (excluding derivative positions) for the Fund is publicly available on the Fund’s website on a monthly, seven-day or more delayed basis. The Fund files its complete schedule of portfolio holdings with the SEC for the first and third quarters of each fiscal year on Form N-Q, which is available by visiting the SEC website at sec.gov. In addition, the Fund’s Form N-Q may be reviewed and copied at the SEC’s Public Reference Room in Washington, DC, and at regional offices in New York City, at 233 Broadway, and in Chicago, at 175 West Jackson Boulevard, Suite 900. Information about the Public Reference Room may be obtained by calling 1-800-SEC-0330.
| | | | |
| 34 | | Wells Fargo Advantage High Income Fund | | Other information (unaudited) |
BOARD OF TRUSTEES AND OFFICERS
Each of the Trustees and Officers1 listed in the table below acts in identical capacities for each fund in the Wells Fargo Advantage family of funds, which consists of 133 mutual funds comprising the Wells Fargo Funds Trust, Wells Fargo Variable Trust, Wells Fargo Master Trust and four closed-end funds (collectively the “Fund Complex”). This table should be read in conjunction with the Prospectus and the Statement of Additional Information2. The mailing address of each Trustee and Officer is 525 Market Street, 12th Floor, San Francisco, CA 94105. Each Trustee and Officer serves an indefinite term, however, each Trustee serves such term until reaching the mandatory retirement age established by the Trustees.
Independent Trustees
| | | | | | |
Name and year of birth | | Position held and length of service* | | Principal occupations during past five years or longer | | Other
public company or
investment company
directorships during
past 5 years |
| William R. Ebsworth (Born 1957) | | Trustee, since 2015** | | Retired. From 1984 to 2013, equities analyst, portfolio manager, research director at Fidelity Management and Research Company and retired in 2013 as Chief Investment Officer of Fidelity Strategic Advisers, Inc. in Boston, Tokyo, and Hong Kong where he led a team of investment professionals managing client assets. Prior thereto, Board member of Hong Kong Securities Clearing Co., Hong Kong Options Clearing Corp., the Thailand International Fund, Ltd., Fidelity Investments Life Insurance Company, and Empire Fidelity Investments Life Insurance Company. Mr. Ebsworth is a CFA® charterholder and an Adjunct Lecturer, Finance, at Babson College. | | Asset Allocation Trust |
Jane A. Freeman (Born 1953) | | Trustee, since 2015** | | Retired. From 2012 to 2014 and 1999 to 2008, Chief Financial Officer of Scientific Learning Corporation. From 2008 to 2012, Ms. Freeman provided consulting services related to strategic business projects. Prior to 1999, Portfolio Manager at Rockefeller & Co. and Scudder, Stevens & Clark. Board member of the Harding Loevner Funds from 1996 to 2014, serving as both Lead Independent Director and chair of the Audit Committee. Board member of the Russell Exchange Traded Funds Trust from 2011 to 2012 and the chair of the Audit Committee. Ms. Freeman is Chair of Taproot Foundation (non-profit organization), a Board Member of Ruth Bancroft Garden (non-profit organization) and an inactive chartered financial analyst. | | Asset Allocation Trust; Harding Loevner Funds; Russell Exchange Traded Funds Trust |
Peter G. Gordon (Born 1942) | | Trustee, since 1998; Chairman, since 2005 | | Co-Founder, Retired Chairman, President and CEO of Crystal Geyser Water Company. Trustee Emeritus, Colby College. | | Asset Allocation Trust |
Isaiah Harris, Jr. (Born 1952) | | Trustee, since 2009 | | Retired. Chairman of the Board of CIGNA Corporation since 2009, and Director since 2005. From 2003 to 2011, Director of Deluxe Corporation. Prior thereto, President and CEO of BellSouth Advertising and Publishing Corp. from 2005 to 2007, President and CEO of BellSouth Enterprises from 2004 to 2005 and President of BellSouth Consumer Services from 2000 to 2003. Emeritus member of the Iowa State University Foundation Board of Governors. Emeritus Member of the Advisory Board of Iowa State University School of Business. Advisory Board Member, Palm Harbor Academy (charter school). Mr. Harris is a certified public accountant. | | CIGNA Corporation; Asset Allocation Trust |
Judith M. Johnson (Born 1949) | | Trustee, since 2008; Audit Committee Chairman, since 2008 | | Retired. Prior thereto, Chief Executive Officer and Chief Investment Officer of Minneapolis Employees Retirement Fund from 1996 to 2008. Ms. Johnson is an attorney, certified public accountant and a certified managerial accountant. | | Asset Allocation Trust |
David F. Larcker (Born 1950) | | Trustee, since 2009 | | James Irvin Miller Professor of Accounting at the Graduate School of Business, Stanford University, Morgan Stanley Director of the Center for Leadership Development and Research and Senior Faculty of The Rock Center for Corporate Governance since 2006. From 2005 to 2008, Professor of Accounting at the Graduate School of Business, Stanford University. Prior thereto, Ernst & Young Professor of Accounting at The Wharton School, University of Pennsylvania from 1985 to 2005. | | Asset Allocation Trust |
Olivia S. Mitchell (Born 1953) | | Trustee, since 2006 | | International Foundation of Employee Benefit Plans Professor, Wharton School of the University of Pennsylvania since 1993. Director of Wharton’s Pension Research Council and Boettner Center on Pensions & Retirement Research, and Research Associate at the National Bureau of Economic Research. Previously, Cornell University Professor from 1978 to 1993. | | Asset Allocation Trust |
| | | | | | |
| Other information (unaudited) | | Wells Fargo Advantage High Income Fund | | | 35 | |
| | | | | | |
Name and year of birth | | Position held and length of service* | | Principal occupations during past five years or longer | | Other
public company or
investment company
directorships during
past 5 years |
Timothy J. Penny (Born 1951) | | Trustee, since 1996 | | President and Chief Executive Officer of Southern Minnesota Initiative Foundation, a non-profit organization, since 2007 and Senior Fellow at the Humphrey Institute Policy Forum at the University of Minnesota since 1995. Member of the Board of Trustees of NorthStar Education Finance, Inc., a non-profit organization, since 2007. | | Asset Allocation Trust |
Michael S. Scofield (Born 1943) | | Trustee, since 2010 | | Served on the Investment Company Institute’s Board of Governors and Executive Committee from 2008-2011 as well the Governing Council of the Independent Directors Council from 2006-2011 and the Independent Directors Council Executive Committee from 2008-2011. Chairman of the IDC from 2008-2010. Institutional Investor (Fund Directions) Trustee of Year in 2007. Trustee of the Evergreen Funds complex (and its predecessors) from 1984 to 2010. Chairman of the Evergreen Funds from 2000-2010. Former Trustee of the Mentor Funds. Retired Attorney, Law Offices of Michael S. Scofield. | | Asset Allocation Trust |
Donald C. Willeke (Born 1940) | | Trustee, since 1996 | | Principal of the law firm of Willeke & Daniels. General Counsel of the Minneapolis Employees Retirement Fund from 1984 until its consolidation into the Minnesota Public Employees Retirement Association on June 30, 2010. Director and Vice Chair of The Tree Trust (non-profit corporation). Director of the American Chestnut Foundation (non-profit corporation). | | Asset Allocation Trust |
| * | Length of service dates reflect the Trustee’s commencement of service with the Trust’s predecessor entities, where applicable. |
| ** | William R. Ebsworth and Jane A. Freeman each became a Trustee effective January 1, 2015. |
Officers
| | | | | | |
Name and year of birth | | Position held and
length of service | | Principal occupations during past five years or longer |
Karla M. Rabusch (Born 1959) | | President, since 2003 | | Executive Vice President of Wells Fargo Bank, N.A. and President of Wells Fargo Funds Management, LLC since 2003. | | |
Nancy Wiser1 (Born 1967) | | Treasurer, since 2012 | | Executive Vice President of Wells Fargo Funds Management, LLC since 2011. Chief Operating Officer and Chief Compliance Officer at LightBox Capital Management LLC, from 2008 to 2011. | | |
C. David Messman (Born 1960) | | Secretary, since 2000; Chief Legal Officer, since 2003 | | Senior Vice President and Secretary of Wells Fargo Funds Management, LLC since 2001. Assistant General Counsel of Wells Fargo Bank, N.A. since 2013 and Vice President and Managing Counsel of Wells Fargo Bank N.A. from 1996 to 2013. | | |
Debra Ann Early (Born 1964) | | Chief Compliance Officer, since 2007 | | Executive Vice President of Wells Fargo Funds Management, LLC since 2014, Senior Vice President and Chief Compliance Officer from 2007 to 2014. | | |
David Berardi (Born 1975) | | Assistant Treasurer, since 2009 | | Vice President of Wells Fargo Funds Management, LLC since 2009. Vice President of Evergreen Investment Management Company, LLC from 2008 to 2010. Manager of Fund Reporting and Control for Evergreen Investment Management Company, LLC from 2004 to 2010. | | |
Jeremy DePalma1 (Born 1974) | | Assistant Treasurer, since 2009 | | Senior Vice President of Wells Fargo Funds Management, LLC since 2009. Senior Vice President of Evergreen Investment Management Company, LLC from 2008 to 2010 and head of the Fund Reporting and Control Team within Fund Administration from 2005 to 2010. | | |
| 1 | Nancy Wiser acts as Treasurer of 72 funds in the Fund Complex. Jeremy DePalma acts as Treasurer of 61 funds and Assistant Treasurer of 72 funds in the Fund Complex. |
| 2 | The Statement of Additional Information includes additional information about the Trustees and is available, without charge, upon request, by calling 1-800-222-8222 or by visiting the website at wellsfargoadvantagefunds.com. |
| | | | |
| 36 | | Wells Fargo Advantage High Income Fund | | Other information (unaudited) |
BOARD CONSIDERATION OF INVESTMENT ADVISORY, INVESTMENT MANAGEMENT AND SUB-ADVISORY AGREEMENTS:
Under the Investment Company Act of 1940 (the “1940 Act”), the Board of Trustees (the “Board”) of Wells Fargo Funds Trust (the “Trust”) must determine annually whether to approve the continuation of the Trust’s investment advisory and sub-advisory agreements. In this regard, at an in-person meeting held on May 19-20, 2015 (the “Meeting”), the Board, all the members of which have no direct or indirect interest in the investment advisory and sub-advisory agreements and are not “interested persons” of the Trust, as defined in the 1940 Act (the “Independent Trustees”), reviewed and approved for Wells Fargo Advantage High Income Fund (the “Fund”): (i) an investment advisory agreement (the “Advisory Agreement”) with Wells Fargo Funds Management, LLC (“Funds Management”); (ii) an investment management agreement (the “Management Agreement”) with Funds Management; and (iii) an investment sub-advisory agreement (the “Sub-Advisory Agreement”) with Wells Capital Management Incorporated (the “Sub-Adviser”), an affiliate of Funds Management. The Management Agreement combines the terms of the Advisory Agreement with the terms of the Fund’s Amended and Restated Administration Agreement (the “Administration Agreement”) applicable to Fund-level administrative services. The Advisory Agreement, the Management Agreement and the Sub-Advisory Agreement are collectively referred to as the “Advisory Agreements.”
At the Meeting, the Board considered the factors and reached the conclusions described below relating to the selection of Funds Management and the Sub-Adviser and the approval of the Advisory Agreements. Prior to the Meeting, including at an in-person meeting in March 2015, the Trustees conferred extensively among themselves and with representatives of Funds Management about these matters. Also, the Board has adopted a team-based approach, with each team consisting of a sub-set of Trustees, to assist the full Board in the discharge of its duties in reviewing performance and other matters throughout the year. The Independent Trustees were assisted in their evaluation of the Advisory Agreements by independent legal counsel, from whom they received separate legal advice and with whom they met separately.
In providing information to the Board, Funds Management and the Sub-Adviser were guided by a detailed set of requests for information submitted to them by independent legal counsel on behalf of the Independent Trustees at the start of the Board’s annual contract renewal process earlier in 2015. In considering and approving the Advisory Agreements, the Trustees considered the information they believed relevant, including but not limited to the information discussed below. The Board considered not only the specific information presented in connection with the Meeting, but also the knowledge gained over time through interaction with Funds Management and the Sub-Adviser about various topics. In this regard, the Board reviewed reports of Funds Management at each of its quarterly meetings, which included, among other things, portfolio reviews and performance reports. In addition, the Board and the teams mentioned above confer with portfolio managers at various times throughout the year. The Board did not identify any particular information or consideration that was all-important or controlling, and each individual Trustee may have attributed different weights to various factors.
After its deliberations, the Board unanimously approved the continuation of the Advisory Agreement for the period from June 1, 2015 through June 30, 2015, approved the Management Agreement for the period from July 1, 2015 through May 31, 2016, and approved the continuation of the Sub-Advisory Agreement for a one-year term through May 31, 2016. The Board also determined that the compensation payable to Funds Management and the Sub-Adviser under each of the Advisory Agreements was reasonable. The Board considered the approval of the Advisory Agreements for the Fund as part of its consideration of agreements for funds across the complex, but its approvals were made on a fund-by-fund basis. The following summarizes a number of important, but not necessarily all, factors considered by the Board in support of its approvals.
Nature, extent and quality of services
The Board received and considered various information regarding the nature, extent and quality of services provided to the Fund by Funds Management and the Sub-Adviser under the Advisory Agreements. This information included, among other things, a summary of the background and experience of senior management of Funds Management, and the qualifications, background, tenure and responsibilities of each of the portfolio managers primarily responsible for the day-to-day portfolio management of the Fund. The Board noted that the services to be provided to the Fund pursuant to the Management Agreement combined the advisory services previously provided to the Fund pursuant to the Fund’s Advisory Agreement with the Fund-level administrative services previously provided to the Fund pursuant to the Fund’s Administration Agreement. The Board received a representation from Funds Management that combining these services would not result in any change to the nature or level of services provided by Funds Management to the Fund.
The Board evaluated the ability of Funds Management and the Sub-Adviser to attract and retain qualified investment professionals, including research, advisory and supervisory personnel. The Board further considered the compliance
| | | | | | |
| Other information (unaudited) | | Wells Fargo Advantage High Income Fund | | | 37 | |
programs and compliance records of Funds Management and the Sub-Adviser. In addition, the Board took into account the full range of services provided to the Fund by Funds Management and its affiliates.
Fund performance and expenses
The Board considered the performance results for the Fund over various time periods ended March 31, 2015. The Board considered these results in comparison to the performance of funds in a universe that was determined by Lipper Inc. (“Lipper”) to be similar to the Fund (the “Universe”), and in comparison to the Fund’s benchmark index and to other comparative data. Lipper is an independent provider of investment company data. The Board received a description of the methodology used by Lipper to select the mutual funds in the performance Universe. The Board noted that the performance of the Fund (Class A) was lower than the average performance of the Universe for all periods under review. The Board also noted that the performance of the Fund was lower than its benchmark, the Barclays U.S. Corporate High Yield Index, for all periods under review.
The Board received information concerning, and discussed factors contributing to, the underperformance of the Fund relative to the Universe and benchmark for the periods noted above. The Board took note of the explanations for the relative underperformance in these periods, including with respect to the investment process generally and investment decisions and market factors that affected the Fund’s performance.
The Board also received and considered information regarding the Fund’s net operating expense ratios and their various components, including actual management fees (which reflect fee waivers, if any, and include advisory, administration and transfer agent fees), custodian and other non-management fees, and Rule 12b-1 and non-Rule 12b-1 service fees. The Board considered these ratios in comparison to the median ratios of funds in class-specific expense groups that were determined by Lipper to be similar to the Fund (the “Groups”). The Board received a description of the methodology used by Lipper to select the mutual funds in the expense Groups and an explanation of how funds comprising expense groups and their expense ratios may vary from year-to-year. Based on the Lipper reports, the Board noted that the net operating expense ratios of the Fund were lower than or in range of the median net operating expense ratios of the expense Groups. The Board discussed and accepted Funds Management’s proposal to convert the Investor Class shares into Class A shares. The Board also discussed with Funds Management proposed net operating expense ratio cap increases for Class A, Class B, Class C, Institutional Class, and Administrator Class. The Board accepted Funds Management’s net operating expense ratio cap increase proposals for Class A, Class B, and Class C, as initially proposed to the Board, and, after further discussions, operating expense ratio cap increases for the Institutional Class and Administrator Class, that were lower than those initially proposed to the Board. In accepting such proposed new net operating expense ratio caps, the Board noted that the Fund’s new net operating expense ratios would still be lower than or in range of the median net operating expense ratios of the expense Groups.
The Board took into account the Fund performance and expense information provided to it among the factors considered in deciding to re-approve the Advisory Agreement and Sub-Advisory Agreement and approve the Management Agreement.
Investment advisory and sub-advisory fee rates
The Board reviewed and considered the contractual investment advisory fee rates that are payable by the Fund to Funds Management for investment advisory services (the “Advisory Agreement Rates”), both on a stand-alone basis and on a combined basis with the Fund’s fund-level and class-level contractual administration fee rates (the “Management Rates”). The Board noted that the Management Rates include transfer agency and sub-transfer agency costs. The Board also noted that the fee rate to be paid by the Fund under the Management Agreement will incorporate the advisory fee and Fund-level administration fee previously payable separately by the Fund under the Fund’s Advisory Agreement and Administration Agreement with Funds Management. The Board also reviewed and considered the contractual investment sub-advisory fee rates that are payable by Funds Management to the Sub-Adviser for investment sub-advisory services (the “Sub-Advisory Agreement Rates”).
Among other information reviewed by the Board was a comparison of the Management Rates of the Fund with those of other funds in the expense Groups at a common asset level. The Board noted that the Management Rates of the Fund were lower than the average rates for the Fund’s expense Groups for all share classes.
The Board also received and considered information about the portion of the total advisory fee that was retained by Funds Management after payment of the fee to the Sub-Adviser for sub-advisory services. In assessing the reasonableness of this amount, the Board received and evaluated information about the nature and extent of responsibilities retained and risks assumed by Funds Management and not delegated to or assumed by the Sub-Adviser, and about Funds Management’s on-going oversight services. However, given the affiliation between Funds Management and the Sub-Adviser, the Board ascribed limited relevance to the allocation of the advisory fee between them.
| | | | |
| 38 | | Wells Fargo Advantage High Income Fund | | Other information (unaudited) |
The Board also received and considered information about the nature and extent of services offered and fee rates charged by Funds Management and the Sub-Adviser to other types of clients with investment strategies similar to those of the Fund. In this regard, the Board received information about the significantly greater scope of services, and compliance, reporting and other legal burdens and risks of managing mutual funds compared with those associated with managing assets of non-mutual fund clients such as collective funds or institutional separate accounts.
Based on its consideration of the factors and information it deemed relevant, including those described here, the Board determined that the compensation payable to Funds Management under the Management Agreement and Advisory Agreement and to the Sub-Adviser under the Sub-Advisory Agreement was reasonable, in light of the services covered by the Advisory Agreements.
Profitability
The Board received and considered information concerning the profitability of Funds Management, as well as the profitability of Wells Fargo as a whole, from providing services to the Fund and the fund family as a whole. The Board also received and considered information concerning the profitability of the Sub-Adviser from providing services to the fund family as a whole, noting that the Sub-Adviser’s profitability information with respect to providing services to the Fund was subsumed in the Wells Fargo profitability analysis.
Funds Management reported on the methodologies and estimates used in calculating profitability. Among other things, the Board noted that the levels of profitability reported on a fund-by-fund basis varied widely, depending on factors such as the size and type of fund. Based on its review, the Board did not deem the profits reported by Funds Management or Wells Fargo from its services to the Fund to be at a level that would prevent it from approving the continuation of the Advisory Agreements.
Economies of scale
With respect to possible economies of scale, the Board noted the existence of breakpoints in the Fund’s advisory and management fee structures, and the Fund’s administration fee structure, which operate generally to reduce the Fund’s expense ratios as the Fund grows in size. It considered that, for a small fund or a fund that shrinks in size, breakpoints conversely can result in higher fee levels. The Board also considered that fee waiver and expense reimbursement arrangements and competitive fee rates at the outset are means of sharing potential economies of scale with shareholders of the Fund and the fund family as a whole. The Board considered Funds Management’s view that any analyses of potential economies of scale in managing a particular fund are inherently limited in light of the joint and common costs and investments that Funds Management incurs across the fund family as a whole.
The Board concluded that the Fund’s fee and expense arrangements, including contractual breakpoints, constituted a reasonable approach to sharing potential economies of scale with the Fund and its shareholders.
Other benefits to Funds Management and the Sub-Adviser
The Board received and considered information regarding potential “fall-out” or ancillary benefits received by Funds Management and its affiliates, including the Sub-Adviser, as a result of their relationships with the Fund. Ancillary benefits could include, among others, benefits directly attributable to other relationships with the Fund and benefits potentially derived from an increase in Funds Management’s and the Sub-Adviser’s business as a result of their relationships with the Fund. The Board noted that various affiliates of Funds Management may receive distribution-related fees, shareholder servicing payments and sub-transfer agency fees in respect of shares sold or held through them and services provided.
The Board also reviewed information about soft dollar credits earned and utilized by the Sub-Adviser, fees earned by Funds Management and the Sub-Adviser from managing a private investment vehicle for the fund family’s securities lending collateral and commissions earned by an affiliated broker from portfolio transactions.
Based on its consideration of the factors and information it deemed relevant, including those described here, the Board did not find that any ancillary benefits received by Funds Management and its affiliates, including the Sub-Adviser, were unreasonable.
Conclusion
At the Meeting, after considering the above-described factors and based on its deliberations and its evaluation of the information described above, the Board unanimously approved the continuation of the Advisory Agreement for the period from June 1, 2015 through June 30, 2015, approved the Management Agreement for the period from July 1, 2015 through May 31, 2016, and approved the continuation of the Sub-Advisory Agreement for a one-year term through May 31, 2016. The Board also determined that the compensation payable to Funds Management and the Sub-Adviser under each of the Advisory Agreements was reasonable.
| | | | | | |
| List of abbreviations | | Wells Fargo Advantage High Income Fund | | | 39 | |
The following is a list of common abbreviations for terms and entities that may have appeared in this report.
| ACA | — ACA Financial Guaranty Corporation |
| ADR | — American depositary receipt |
| ADS | — American depositary shares |
| AGC | — Assured Guaranty Corporation |
| AGM | — Assured Guaranty Municipal |
| Ambac | — Ambac Financial Group Incorporated |
| AMT | — Alternative minimum tax |
| BAN | — Bond anticipation notes |
| BHAC | — Berkshire Hathaway Assurance Corporation |
| CAB | — Capital appreciation bond |
| CCAB | — Convertible capital appreciation bond |
| CDA | — Community Development Authority |
| CDO | — Collateralized debt obligation |
| DRIVER | — Derivative inverse tax-exempt receipts |
| DW&P | — Department of Water & Power |
| DWR | — Department of Water Resources |
| ECFA | — Educational & Cultural Facilities Authority |
| EDA | — Economic Development Authority |
| EDFA | — Economic Development Finance Authority |
| ETF | — Exchange-traded fund |
| FDIC | — Federal Deposit Insurance Corporation |
| FFCB | — Federal Farm Credit Banks |
| FGIC | — Financial Guaranty Insurance Corporation |
| FHA | — Federal Housing Administration |
| FHLB | — Federal Home Loan Bank |
| FHLMC | — Federal Home Loan Mortgage Corporation |
| FICO | — The Financing Corporation |
| FNMA | — Federal National Mortgage Association |
| GDR | — Global depositary receipt |
| GNMA | — Government National Mortgage Association |
| HCFR | — Healthcare facilities revenue |
| HEFA | — Health & Educational Facilities Authority |
| HEFAR | — Higher education facilities authority revenue |
| HFA | — Housing Finance Authority |
| HFFA | — Health Facilities Financing Authority |
| HUD | — Department of Housing and Urban Development |
| IDA | — Industrial Development Authority |
| IDAG | — Industrial Development Agency |
| KRW | — Republic of Korea won |
| LIBOR | — London Interbank Offered Rate |
| LIFER | — Long Inverse Floating Exempt Receipts |
| LLC | — Limited liability company |
| LLLP | — Limited liability limited partnership |
| LLP | — Limited liability partnership |
| MBIA | — Municipal Bond Insurance Association |
| MFHR | — Multifamily housing revenue |
| MSTR | — Municipal securities trust receipts |
| MUD | — Municipal Utility District |
| National | — National Public Finance Guarantee Corporation |
| PCFA | — Pollution Control Financing Authority |
| PCL | — Public Company Limited |
| PCR | — Pollution control revenue |
| PFA | — Public Finance Authority |
| PFFA | — Public Facilities Financing Authority |
| PFOTER | — Puttable floating option tax-exempt receipts |
| plc | — Public limited company |
| PUTTER | — Puttable tax-exempt receipts |
| R&D | — Research & development |
| Radian | — Radian Asset Assurance |
| RAN | — Revenue anticipation notes |
| RDA | — Redevelopment Authority |
| RDFA | — Redevelopment Finance Authority |
| REIT | — Real estate investment trust |
| ROC | — Reset option certificates |
| SAVRS | — Select auction variable rate securities |
| SBA | — Small Business Authority |
| SDR | — Swedish depositary receipt |
| SFHR | — Single-family housing revenue |
| SFMR | — Single-family mortgage revenue |
| SPA | — Standby purchase agreement |
| SPDR | — Standard & Poor’s Depositary Receipts |
| SPEAR | — Short Puttable Exempt Adjustable Receipts |
| STRIPS | — Separate trading of registered interest and |
| TAN | — Tax anticipation notes |
| TIPS | — Treasury inflation-protected securities |
| TRAN | — Tax revenue anticipation notes |
| TTFA | — Transportation Trust Fund Authority |
| TVA | — Tennessee Valley Authority |
This page is intentionally left blank.


For more information
More information about Wells Fargo Advantage Funds is available free upon request. To obtain literature, please write, email, visit the Fund’s website, or call:
Wells Fargo Advantage Funds
P.O. Box 8266
Boston, MA 02266-8266
Email: wfaf@wellsfargo.com
Website: wellsfargoadvantagefunds.com
Individual investors: 1-800-222-8222
Retail investment professionals: 1-888-877-9275
Institutional investment professionals: 1-866-765-0778
This report and the financial statements contained herein are submitted for the general information of the shareholders of Wells Fargo Advantage Funds. If this report is used for promotional purposes, distribution of the report must be accompanied or preceded by a current prospectus. Before investing, please consider the investment objectives, risks, charges, and expenses of the investment. For a current prospectus and, if available, a summary prospectus, containing this information, call 1-800-222-8222 or visit the Fund’s website at wellsfargoadvantagefunds.com. Read the prospectus carefully before you invest or send money.
Wells Fargo Funds Management, LLC, a wholly owned subsidiary of Wells Fargo & Company, provides investment advisory and administrative services for Wells Fargo Advantage Funds. Other affiliates of Wells Fargo & Company provide subadvisory and other services for the Funds. The Funds are distributed by Wells Fargo Funds Distributor, LLC, Member FINRA, an affiliate of Wells Fargo & Company.
NOT FDIC INSURED ¡ NO BANK GUARANTEE ¡ MAY LOSE VALUE
© 2015 Wells Fargo Funds Management, LLC. All rights reserved.
| | |
 | | 236803 10-15 A217/AR217 08-15 |

Wells Fargo Advantage High Yield Bond Fund

Annual Report
August 31, 2015

Reduce clutter. Save trees.
Sign up for electronic delivery of prospectuses and shareholder reports at wellsfargo.com/advantagedelivery
Contents
The views expressed and any forward-looking statements are as of August 31, 2015, unless otherwise noted, and are those of the Fund managers and/or Wells Fargo Funds Management, LLC. Discussions of individual securities, or the markets generally, or any Wells Fargo Advantage Fund are not intended as individual recommendations. Future events or results may vary significantly from those expressed in any forward-looking statements; the views expressed are subject to change at any time in response to changing circumstances in the market. Wells Fargo Funds Management, LLC and the Fund disclaim any obligation to publicly update or revise any views expressed or forward-looking statements.
NOT FDIC INSURED ¡ NO BANK GUARANTEE ¡ MAY LOSE VALUE
| | | | |
| 2 | | Wells Fargo Advantage High Yield Bond Fund | | Letter to shareholders (unaudited) |

Karla M. Rabusch
President
Wells Fargo Advantage Funds
Major central banks continued to inject liquidity into global banks and markets through various accommodative monetary policies, including quantitative easing.
Dear Valued Shareholder:
We are pleased to offer you this annual report for the Wells Fargo Advantage High Yield Bond Fund for the 12-month period that ended August 31, 2015. The period was marked by low interest rates, low oil prices, and moderate U.S. economic growth. Short-term investment-grade bonds, as measured by the Barclays U.S. 1–3 Year Government/Credit Bond Index,1 returned 0.81% during the period. Meanwhile, strong demand for high-quality, liquid assets kept returns on Treasury bills more modest; the Barclays 6-Month Treasury Bill Index2 returned 0.15% during the period.
Major central banks continued to provide stimulus.
Major central banks continued to inject liquidity into global banks and markets through various accommodative monetary policies, including quantitative easing. In the U.S., the Federal Reserve (Fed) kept its key interest rate near zero in order to support the economy and the financial system. However, it set expectations for it to begin normalizing monetary policy with higher target ranges for the federal funds rate.
Meanwhile, European markets continued to benefit from the European Central Bank’s (ECB’s) willingness to maintain low interest rates. In addition to its targeted longer-term refinancing operations that are designed to increase bank lending, the ECB expanded its quantitative easing program to include the purchase of eurozone government bonds. In Japan, the Bank of Japan maintained an aggressive monetary program aimed at combating deflation.
Economic growth was moderate, and oil prices plummeted.
U.S. economic growth advanced during the reporting period, the unemployment rate ticked lower to 5.1% as of August 2015, and inflation remained below the Fed’s longer-run objective of a 2% pace. The period was also marked by lower oil prices, which began the reporting period near $90 per barrel but declined to $46 per barrel at the end of August 2015. While lower oil prices benefited consumers of oil products, the lower prices pressured companies within the energy sector.
Bond yields rose but remained low by historical standards.
Short-term interest rates increased during the reporting period, with a flattening in the shape of the short-term yield curve. During this time frame, 1-year Treasury bills rose 29 basis points (bps; 100 bps equals 1.00%) to yield 0.38%, 2-year Treasury note yields rose 21 bps to yield 0.74%, and 3-year Treasury note yields rose only 8 bps to yield 1.05%. Meanwhile, ultra-short-term yields were little changed at ultralow levels, anchored by the easy monetary policy.
Since the end of the financial crisis, structural changes in the fixed-income markets have reduced trading liquidity (the degree to which assets can be bought or sold without affecting the price). New regulations and capital requirements have caused traditional liquidity suppliers (banks and broker/dealers) to be more risk-averse and hold less inventory. Meanwhile, corporate-debt issuance has spiked as companies finance themselves at record-low yields, bond mutual funds hold larger amounts of
| 1 | The Barclays U.S. 1–3 Year Government/Credit Bond Index is the one- to three-year component of the Barclays U.S. Government/Credit Bond Index that includes securities in the Government and Credit Indexes. The Government Index includes Treasuries (that is, public obligations of the U.S. Treasury that have remaining maturities of more than one year) and agencies (that is, publicly issued debt of U.S. government agencies, quasi-federal corporations, and corporate or foreign debt guaranteed by the U.S. government). The Credit Index includes publicly issued U.S. corporate and foreign debentures and secured notes that meet specified maturity, liquidity, and quality requirements. You cannot invest directly in an index. |
| 2 | The Barclays 6-Month Treasury Bill Index tracks the performance and attributes of recently issued 6-month U.S. Treasury bills. The index follows Barclays’ monthly rebalancing conventions. You cannot invest directly in an index. |
| | | | | | |
| Letter to shareholders (unaudited) | | Wells Fargo Advantage High Yield Bond Fund | | | 3 | |
this new debt supply, trading volumes are lower, and large-size trades are more difficult to execute. However, fixed-income markets appear to have functioned well over the past year with sufficient liquidity and muted volatility.
Don’t let short-term uncertainty derail long-term investment goals.
Periods of uncertainty can present challenges, but experience has taught us that maintaining long-term investment goals can be an effective way to plan for the future. To help you create a sound strategy based on your personal goals and risk tolerance, Wells Fargo Advantage Funds offers more than 100 mutual funds spanning a wide range of asset classes and investment styles. Although diversification cannot guarantee an investment profit or prevent losses, we believe it can be an effective way to manage investment risk and potentially smooth out overall portfolio performance. We encourage investors to know their investments and to understand that appropriate levels of risk-taking may unlock opportunities.
Thank you for choosing to invest in Wells Fargo Advantage Funds. We appreciate your confidence in us and remain committed to helping you meet your financial needs.
Sincerely,

Karla M. Rabusch
President
Wells Fargo Advantage Funds
Periods of uncertainty can present challenges, but experience has taught us that maintaining long-term investment goals can be an effective way to plan for the future.
Notice to shareholders
At a meeting held on August 11–12, 2015, the Board of Trustees of the Fund approved a change in the name of the Fund whereby the word “Advantage” will be removed from its name, effective December 15, 2015.
For current information about your fund investments, contact your investment professional, visit our website at wellsfargoadvantagefunds.com, or call us directly at 1-800-222-8222. We are available 24 hours a day, 7 days a week.
| | | | |
| 4 | | Wells Fargo Advantage High Yield Bond Fund | | Performance highlights (unaudited) |
Investment objective
The Fund seeks total return, consisting of a high level of current income and capital appreciation.
Manager
Wells Fargo Funds Management, LLC
Subadviser
Wells Capital Management Incorporated
Portfolio manager
Margaret D. Patel
Average annual total returns1 (%) as of August 31, 2015
| | | | | | | | | | | | | | | | | | | | | | | | | | | | | | | | | | |
| | | | | Including sales charge | | | Excluding sales charge | | | Expense ratios2 (%) | |
| | | Inception date | | 1 year | | | 5 year | | | 10 year | | | 1 year | | | 5 year | | | 10 year | | | Gross | | | Net3 | |
| Class A (EKHAX) | | 1-20-1998 | | | (6.27 | ) | | | 5.15 | | | | 5.67 | | | | (1.79 | ) | | | 6.10 | | | | 6.16 | | | | 1.03 | | | | 1.03 | |
| Class B (EKHBX)* | | 9-11-1935 | | | (7.52 | ) | | | 4.98 | | | | 5.61 | | | | (2.81 | ) | | | 5.31 | | | | 5.61 | | | | 1.78 | | | | 1.78 | |
| Class C (EKHCX) | | 1-21-1998 | | | (3.52 | ) | | | 5.31 | | | | 5.37 | | | | (2.52 | ) | | | 5.31 | | | | 5.37 | | | | 1.78 | | | | 1.78 | |
| Administrator Class (EKHYX) | | 4-14-1998 | | | – | | | | – | | | | – | | | | (1.86 | ) | | | 6.33 | | | | 6.41 | | | | 0.97 | | | | 0.80 | |
| Institutional Class (EKHIX) | | 10-31-2014 | | | – | | | | – | | | | – | | | | (1.49 | ) | | | 6.41 | | | | 6.45 | | | | 0.70 | | | | 0.70 | |
| BofA Merrill Lynch U.S. High Yield Master II Constrained Index4 | | – | | | – | | | | – | | | | – | | | | (3.08 | ) | | | 7.10 | | | | 7.32 | | | | – | | | | – | |
| * | | Class B shares are closed to investment, except in connection with the reinvestment of any distributions and permitted exchanges. |
Figures quoted represent past performance, which is no guarantee of future results, and do not reflect taxes that a shareholder may pay on fund distributions or the redemption of fund shares. Investment return and principal value of an investment will fluctuate so that an investor’s shares, when redeemed, may be worth more or less than their original cost. Performance shown without sales charges would be lower if sales charges were reflected. Current performance may be lower or higher than the performance data quoted, which assumes the reinvestment of dividends and capital gains. Current month-end performance is available on the Fund’s website, wellsfargoadvantagefunds.com.
Index returns do not include transaction costs associated with buying and selling securities, any mutual fund fees or expenses, or any taxes. It is not possible to invest directly in an index.
For Class A shares, the maximum front-end sales charge is 4.50%. For Class B shares, the maximum contingent deferred sales charge is 5.00%. For Class C shares, the maximum contingent deferred sales charge is 1.00%. Performance including a contingent deferred sales charge assumes the sales charge for the corresponding time period. Administrator Class and Institutional Class shares are sold without a front-end sales charge or contingent deferred sales charge.
Bond values fluctuate in response to the financial condition of individual issuers, general market and economic conditions, and changes in interest rates. Changes in market conditions and government policies may lead to periods of heightened volatility in the bond market and reduced liquidity for certain bonds held by the Fund. In general, when interest rates rise, bond values fall and investors may lose principal value. Interest-rate changes and their impact on the Fund and its share price can be sudden and unpredictable. The use of derivatives may reduce returns and/or increase volatility. High-yield securities have a greater risk of default and tend to be more volatile than higher-rated debt securities. Loans are subject to risks similar to those associated with other below investment-grade bond investments, such as credit risk (for example, risk of issuer default), below investment-grade bond risk (for example, risk of greater volatility in value), and risk that the loan may become illiquid or difficult to price. Certain investment strategies tend to increase the total risk of an investment (relative to the broader market). The Fund is exposed to foreign investment risk. Consult the Fund’s prospectus for additional information on these and other risks.
Please see footnotes on page 5.
| | | | | | |
| Performance highlights (unaudited) | | Wells Fargo Advantage High Yield Bond Fund | | | 5 | |
|
| Growth of $10,000 investment5 as of August 31, 2015 |
|
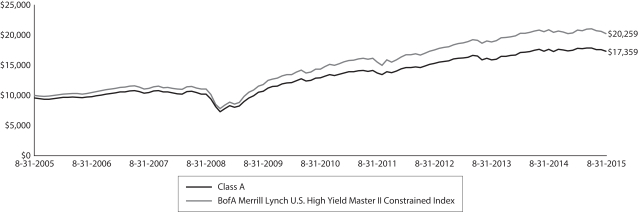 |
| 1 | Historical performance shown for the Institutional Class shares prior to their inception reflects the performance of the Administration Class shares, and is not adjusted to reflect the Institutional Class expenses. If these expenses had been included, returns for the Institutional Class would be higher. Historical performance shown for all classes of the Fund prior to July 12, 2010 is based on the performance of the Fund’s predecessor, Evergreen High Income Fund. |
| 2 | Reflects the expense ratios as stated in the most recent prospectuses. The expense ratios shown are subject to change and may differ from the annualized expense ratios shown in the financial highlights of this report. |
| 3 | The manager has contractually committed through December 31, 2015, to waive fees and/or reimburse expenses to the extent necessary to cap the Fund’s Total Annual Fund Operating Expenses After Fee Waiver at the amounts shown. After this time, the cap may be increased or the commitment to maintain the cap may be terminated only with the approval of the Board of Trustees. Brokerage commissions, stamp duty fees, interest, taxes, acquired fund fees and expenses, and extraordinary expenses are excluded from the cap. Without this cap, the Fund’s returns would have been lower. |
| 4 | The BofA Merrill Lynch U.S. High Yield Master II Constrained Index is a market value-weighted index of all domestic and yankee high-yield bonds, including deferred interest bonds and payment-in kind securities. Issues included in the index have maturities of one year or more and have a credit rating lower than BBB–/Baa3, but are not in default. The BofA Merrill Lynch U.S. High Yield Master II Constrained Index limits any individual issuer to a maximum of 2% benchmark exposure. You cannot invest directly in an index. |
| 5 | The chart compares the performance of Class A shares for the most recent 10 years with the performance of the BofA Merrill Lynch U.S. High Yield Master II Constrained Index. The chart assumes a hypothetical investment of $10,000 in Class A shares and reflects all operating expenses and assumes the maximum initial sales charge of 4.50%. |
| 6 | The ten largest holdings, excluding cash and cash equivalents, are calculated based on the value of the investments divided by total net assets of the Fund. Holdings are subject to change and may have changed since the date specified. |
| 7 | The credit quality distribution of portfolio holdings reflected in the chart is based on ratings from Standard & Poor’s, Moody’s Investors Service, and/or Fitch Ratings Ltd. Credit quality ratings apply to the underlying holdings of the Fund and not to the Fund itself. The percentages of the Fund’s portfolio with the ratings depicted in the chart are calculated based on the total market value of fixed income securities held by the Fund. If a security was rated by all three rating agencies, the middle rating was utilized. If rated by two of three rating agencies, the lower rating was utilized, and if rated by one of the rating agencies, that rating was utilized. Standard & Poor’s rates the creditworthiness of bonds, ranging from AAA (highest) to D (lowest). Ratings from A to CCC may be modified by the addition of a plus (+) or minus (-) sign to show relative standing within the rating categories. Standard & Poor’s rates the creditworthiness of short-term notes from SP-1 (highest) to SP-3 (lowest). Moody’s rates the creditworthiness of bonds, ranging from Aaa (highest) to C (lowest). Ratings Aa to B may be modified by the addition of a number 1 (highest) to 3 (lowest) to show relative standing within the ratings categories. Moody’s rates the creditworthiness of short-term U.S. tax-exempt municipal securities from MIG 1/VMIG 1 (highest) to SG (lowest). Fitch rates the creditworthiness of bonds, ranging from AAA (highest) to D (lowest). Credit quality distribution is subject to change and may have changed since the date specified. |
| | | | |
| 6 | | Wells Fargo Advantage High Yield Bond Fund | | Performance highlights (unaudited) |
MANAGER’S DISCUSSION
Fund highlights
| n | | The Fund outperformed its benchmark, the BofA Merrill Lynch U.S. High Yield Master II Constrained Index, for the 12-month period that ended August 31, 2015. |
| n | | The Fund’s overweight to better-quality, BB-rated high-yield bonds contributed to performance over the fiscal year. Although the portfolio’s bonds posted price declines that more than offset their earned income, the aggregate decline was less than that of the index. |
| n | | The Fund’s substantial underweight to the energy and metals and mining sectors versus the index contributed to the Fund’s outperformance. Detractors included some of the Fund’s holdings in commodity-related industries, as well as its minimal holdings in the energy sector. |
The performance of U.S. Treasuries and high-yield bonds diverged as investors worried about sluggish economic growth.
Intermediate U.S. Treasury yields fluctuated in a relatively narrow range over the reporting period, beginning the fiscal year at a 2.35% yield to maturity and ending the year at a modestly lower 2.22%. Many investors worried that interest rates would rise over the fiscal year as the U.S. Federal Reserve (Fed) began to gradually raise short-term interest rates and several analysts hoped that higher economic activity would cause inflation to increase. However, neither event occurred. Once again, instead of rising as many participants had feared, rates declined modestly over the past 12 months. The continued sluggish pace of economic growth, and especially the lack of acceleration in economic growth, contributed to market uncertainty. As a result, despite continued low defaults, the yield on high-yield bonds increased notably relative to comparable maturity Treasuries. The yield advantage increased from 400 basis points (bps; 100 bps equals 1.00%) at the beginning of the fiscal year to 576 bps at fiscal year-end.
| | | | |
| Ten largest holdings6 (%) as of August 31, 2015 | |
CommScope Incorporated, 5.50%, 6-15-2024 | | | 3.81 | |
Tronox Finance LLC, 6.38%, 8-15-2020 | | | 3.28 | |
Olin Corporation, 5.50%, 8-15-2022 | | | 3.04 | |
Constellation Brands Incorporated, 4.75%, 11-15-2024 | | | 2.70 | |
Clean Harbors Incorporated, 5.13%, 6-1-2021 | | | 2.59 | |
HCA Incorporated, 5.38%, 2-1-2025 | | | 2.54 | |
Horizon Pharma plc, 6.63%, 5-1-2023 | | | 2.46 | |
Penske Auto Group Incorporated, 5.75%, 10-1-2022 | | | 2.46 | |
Endo Limited, 6.00%, 2-1-2025 | | | 2.37 | |
Lear Corporation, 4.75%, 1-15-2023 | | | 2.29 | |
Lower-rated high-yield bonds lagged the performance of higher-quality BB-rated bonds, which had less price depreciation than that of lower-rated issues. In particular, during the high-yield bond market decline that occurred in the last few months of the fiscal year, price declines were most pronounced in lower-rated issues—those rated CCC- or below. Also, the energy sector came under extreme price pressure as prices of oil and gas declined. Concerns intensified about the economic viability of many companies that had issued high-yield bonds but possessed relatively high-cost oil and gas exploration acreage. Energy service companies also came under severe pressure as orders dropped and the prices for their services fell. The metals and mining industry further experienced price declines as reduced demand from
primarily emerging markets economies saddled that industry with overcapacity and plummeting prices. The expectation that high-yield bond defaults would rise over the next year further supported an increase in lower-quality bond yields.
The Fund benefited from a relatively high-quality portfolio and favorable sector positioning.
The Fund’s above-benchmark allocation to holdings in better-quality BB-rated bonds, as well as a lack of exposure to lower-quality CCC-rated issues, aided its performance relative to the benchmark. Holdings in industries such as consumer staples, consumer discretionary, health care, and utilities outperformed the index because companies whose revenues were concentrated in consumer products, or whose revenues were largely concentrated in the U.S., had solid financial results. The bonds of Constellation Brands, Incorporated, a producer of alcoholic beverages, were notable contributors. Several of the Fund’s health care bonds performed particularly well, including those of specialty pharmaceutical company Endo Limited and dialysis service provider DaVita HealthCare Partners Incorporated. The Fund’s modest allocation (about 9% of total assets) to stocks also provided modest positive relative performance compared with the total return for the high-yield market as a whole.
Please see footnotes on page 5.
| | | | | | |
| Performance highlights (unaudited) | | Wells Fargo Advantage High Yield Bond Fund | | | 7 | |
The Fund’s modest exposure to the energy sector further helped relative performance because this industry was the worst-performing industry in the entire high-yield market. However, individual energy holdings detracted because virtually every issue in the energy space underperformed the benchmark.
Other detractors included the bonds of Bristow Group Incorporated, a provider of helicopter services to the energy sector. In addition, several of the Fund’s issues in the materials sector underperformed the market, reflecting low demand from many emerging economies and subsequent price pressure on the companies’ products. Bonds of Tronox Finance LLC (a producer of Tio2 chemicals) and Rayonier Advanced Materials Incorporated, a producer of specialty cellulose products, also detracted from performance.
|
| Credit quality7 as of August 31, 2015 |
|
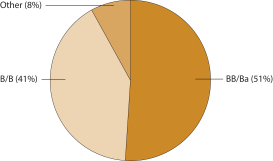 |
The Fund is positioned to reflect our forecast of continued slow economic growth and a continued moderate default rate.
The portfolio is overweight BB-rated and better-quality B-rated issues, with continued avoidance of CCC-rated and distressed holdings, which we feel do not represent good relative risk/reward characteristics. In addition, the portfolio is concentrated in companies whose operations are primarily in the U.S., with minimal exposure to the energy sector or to companies whose products and services are dependent on emerging markets economies, many of which appear to be nearing recession.
All of the Fund’s bond holdings are in companies with public equity outstanding, which we think provides a more flexible capital structure and more transparent reporting of financial results. We continue to hold a modest amount (about 9%) of total assets in stocks, believing that this exposure offers fixed-income investors the potential for capital appreciation.
We believe that the recent increase in the yields on high-yield bonds, despite falling Treasury yields, means that the high-yield market has become relatively more attractive to yield-oriented investors, especially because we expect high-yield fundamentals to remain solid. Outside of very low-quality, speculative issues and the challenges in the energy sector, we believe the default rate should continue near its current historically low 2% level. With the economy growing, albeit slowly, and the Fed conscious of its role in maintaining liquidity to the financial markets, we expect the high-yield market to stabilize at a yield advantage to Treasuries that is moderately above its long-term average.
Please see footnotes on page 5.
| | | | |
| 8 | | Wells Fargo Advantage High Yield Bond Fund | | Fund expenses (unaudited) |
As a shareholder of the Fund, you incur two types of costs: (1) transaction costs, including sales charges (loads) on purchase payments and contingent deferred sales charges (if any) on redemptions and (2) ongoing costs, including management fees, distribution (12b-1) and/or shareholder servicing fees, and other Fund expenses. This example is intended to help you understand your ongoing costs (in dollars) of investing in the Fund and to compare these costs with the ongoing costs of investing in other mutual funds.
The example is based on an investment of $1,000 invested at the beginning of the six-month period and held for the entire period from March 1, 2015 to August 31, 2015.
Actual expenses
The “Actual” line of the table below provides information about actual account values and actual expenses. You may use the information in this line, together with the amount you invested, to estimate the expenses that you paid over the period. Simply divide your account value by $1,000 (for example, an $8,600 account value divided by $1,000 = 8.6), then multiply the result by the number in the “Actual” line under the heading entitled “Expenses paid during period” for your applicable class of shares to estimate the expenses you paid on your account during this period.
Hypothetical example for comparison purposes
The “Hypothetical” line of the table below provides information about hypothetical account values and hypothetical expenses based on the Fund’s actual expense ratio and an assumed rate of return of 5% per year before expenses, which is not the Fund’s actual return. The hypothetical account values and expenses may not be used to estimate the actual ending account balance or expenses you paid for the period. You may use this information to compare the ongoing costs of investing in the Fund and other funds. To do so, compare this 5% hypothetical example with the 5% hypothetical
examples that appear in the shareholder reports of the other funds.
Please note that the expenses shown in the table are meant to highlight your ongoing costs only and do not reflect any transactional costs, such as sales charges (loads) and contingent deferred sales charges. Therefore, the “Hypothetical” line of the table is useful in comparing ongoing costs only and will not help you determine the relative total costs of owning different funds. In addition, if these transactional costs were included, your costs would have been higher.
| | | | | | | | | | | | | | | | |
| | | Beginning
account value
3-1-2015 | | | Ending
account value
8-31-2015 | | | Expenses
paid during
the period¹ | | | Net annualized
expense ratio | |
Class A | | | | | | | | | | | | | | | | |
Actual | | $ | 1,000.00 | | | $ | 973.90 | | | $ | 5.12 | | | | 1.03 | % |
Hypothetical (5% return before expenses) | | $ | 1,000.00 | | | $ | 1,020.01 | | | $ | 5.24 | | | | 1.03 | % |
Class B | | | | | | | | | | | | | | | | |
Actual | | $ | 1,000.00 | | | $ | 970.22 | | | $ | 8.84 | | | | 1.78 | % |
Hypothetical (5% return before expenses) | | $ | 1,000.00 | | | $ | 1,016.23 | | | $ | 9.05 | | | | 1.78 | % |
Class C | | | | | | | | | | | | | | | | |
Actual | | $ | 1,000.00 | | | $ | 970.23 | | | $ | 8.84 | | | | 1.78 | % |
Hypothetical (5% return before expenses) | | $ | 1,000.00 | | | $ | 1,016.23 | | | $ | 9.05 | | | | 1.78 | % |
Administrator Class | | | | | | | | | | | | | | | | |
Actual | | $ | 1,000.00 | | | $ | 975.04 | | | $ | 3.98 | | | | 0.80 | % |
Hypothetical (5% return before expenses) | | $ | 1,000.00 | | | $ | 1,021.17 | | | $ | 4.08 | | | | 0.80 | % |
Institutional Class | | | | | | | | | | | | | | | | |
Actual | | $ | 1,000.00 | | | $ | 975.67 | | | $ | 3.49 | | | | 0.70 | % |
Hypothetical (5% return before expenses) | | $ | 1,000.00 | | | $ | 1,021.68 | | | $ | 3.57 | | | | 0.70 | % |
| 1 | Expenses paid is equal to the annualized expense ratio of each class multiplied by the average account value over the period, multiplied by the number of days in the most recent fiscal half-year divided by the number of days in the fiscal year (to reflect the one-half-year period). |
| | | | | | |
| Portfolio of investments—August 31, 2015 | | Wells Fargo Advantage High Yield Bond Fund | | | 9 | |
| | | | | | | | | | | | |
| Security name | | | | | | Shares | | | Value | |
| | | | | | | | | | | | |
| | | | |
Common Stocks: 8.08% | | | | | | | | | | | | |
| | | | |
Consumer Discretionary: 0.62% | | | | | | | | | | | | |
| | | | |
| Auto Components: 0.18% | | | | | | | | | | | | |
Gentex Corporation | | | | | | | 30,000 | | | $ | 465,000 | |
| | | | | | | | | | | | |
| | | | |
| Household Durables: 0.40% | | | | | | | | | | | | |
Harman International Industries Incorporated | | | | | | | 6,000 | | | | 586,440 | |
Leggett & Platt Incorporated | | | | | | | 10,000 | | | | 444,200 | |
| | | | |
| | | | | | | | | | | 1,030,640 | |
| | | | | | | | | | | | |
| | | | |
| Specialty Retail: 0.04% | | | | | | | | | | | | |
The Home Depot Incorporated | | | | | | | 1,000 | | | | 116,460 | |
| | | | | | | | | | | | |
| | | | |
Consumer Staples: 0.77% | | | | | | | | | | | | |
| | | | |
| Food Products: 0.40% | | | | | | | | | | | | |
ConAgra Foods Incorporated | | | | | | | 25,000 | | | | 1,042,000 | |
| | | | | | | | | | | | |
| | | | |
| Personal Products: 0.37% | | | | | | | | | | | | |
The Estee Lauder Companies Incorporated Class A | | | | | | | 12,000 | | | | 957,240 | |
| | | | | | | | | | | | |
| | | | |
Energy: 0.29% | | | | | | | | | | | | |
| | | | |
| Oil, Gas & Consumable Fuels: 0.29% | | | | | | | | | | | | |
Columbia Pipeline Group | | | | | | | 30,000 | | | | 760,800 | |
| | | | | | | | | | | | |
| | | | |
Financials: 0.38% | | | | | | | | | | | | |
| | | | |
| Real Estate Management & Development: 0.25% | | | | | | | | | | | | |
CBRE Group Incorporated Class A † | | | | | | | 20,000 | | | | 640,400 | |
| | | | | | | | | | | | |
| | | | |
| REITs: 0.13% | | | | | | | | | | | | |
Saul Centers Incorporated | | | | | | | 7,000 | | | | 345,380 | |
| | | | | | | | | | | | |
| | | | |
Health Care: 1.60% | | | | | | | | | | | | |
| | | | |
| Biotechnology: 0.19% | | | | | | | | | | | | |
Baxalta Incorporated | | | | | | | 4,000 | | | | 140,600 | |
Celgene Corporation † | | | | | | | 3,000 | | | | 354,240 | |
| | | | |
| | | | | | | | | | | 494,840 | |
| | | | | | | | | | | | |
| | | | |
| Health Care Equipment & Supplies: 0.50% | | | | | | | | | | | | |
C.R. Bard Incorporated | | | | | | | 4,000 | | | | 775,160 | |
Medtronic plc | | | | | | | 5,000 | | | | 361,450 | |
West Pharmaceutical Services Incorporated | | | | | | | 3,000 | | | | 167,550 | |
| | | | |
| | | | | | | | | | | 1,304,160 | |
| | | | | | | | | | | | |
| | | | |
| Life Sciences Tools & Services: 0.43% | | | | | | | | | | | | |
Quintiles Transnational Holdings Incorporated † | | | | | | | 15,000 | | | | 1,117,650 | |
| | | | | | | | | | | | |
| | | | |
| Pharmaceuticals: 0.48% | | | | | | | | | | | | |
Eli Lilly & Company | | | | | | | 1,000 | | | | 82,350 | |
Endo International plc † | | | | | | | 1,000 | | | | 77,000 | |
The accompanying notes are an integral part of these financial statements.
| | | | |
| 10 | | Wells Fargo Advantage High Yield Bond Fund | | Portfolio of investments—August 31, 2015 |
| | | | | | | | | | | | | | | | |
| Security name | | | | | | | | Shares | | | Value | |
| | | | | | | | | | | | | | | | |
| | | | |
| Pharmaceuticals (continued) | | | | | | | | | | | | | | | | |
Mallinckrodt plc † | | | | | | | | | | | 1,000 | | | $ | 86,240 | |
Mylan NV † | | | | | | | | | | | 20,000 | | | | 991,800 | |
| | | | |
| | | | | | | | | | | | | | | 1,237,390 | |
| | | | | | | | | | | | | | | | |
| | | | |
Industrials: 0.25% | | | | | | | | | | | | | | | | |
| | | | |
| Machinery: 0.25% | | | | | | | | | | | | | | | | |
John Bean Technologies Corporation | | | | | | | | | | | 20,000 | | | | 662,400 | |
| | | | | | | | | | | | | | | | |
| | | | |
Information Technology: 1.51% | | | | | | | | | | | | | | | | |
| | | | |
| Communications Equipment: 0.12% | | | | | | | | | | | | | | | | |
Palo Alto Networks Incorporated † | | | | | | | | | | | 2,000 | | | | 328,440 | |
| | | | | | | | | | | | | | | | |
| | | | |
| Electronic Equipment, Instruments & Components: 0.35% | | | | | | | | | | | | | | | | |
Amphenol Corporation Class A | | | | | | | | | | | 10,000 | | | | 523,600 | |
FEI Company | | | | | | | | | | | 5,000 | | | | 377,400 | |
| | | | |
| | | | | | | | | | | | | | | 901,000 | |
| | | | | | | | | | | | | | | | |
| | | | |
| Internet Software & Services: 0.25% | | | | | | | | | | | | | | | | |
Akamai Technologies Incorporated † | | | | | | | | | | | 9,000 | | | | 641,790 | |
| | | | | | | | | | | | | | | | |
| | | | |
| IT Services: 0.33% | | | | | | | | | | | | | | | | |
Automatic Data Processing Incorporated | | | | | | | | | | | 11,000 | | | | 850,520 | |
| | | | | | | | | | | | | | | | |
| | | | |
| Software: 0.46% | | | | | | | | | | | | | | | | |
FireEye Incorporated † | | | | | | | | | | | 7,000 | | | | 264,460 | |
Splunk Incorporated † | | | | | | | | | | | 15,000 | | | | 929,550 | |
| | | | |
| | | | | | | | | | | | | | | 1,194,010 | |
| | | | | | | | | | | | | | | | |
| | | | |
Utilities: 2.66% | | | | | | | | | | | | | | | | |
| | | | |
| Electric Utilities: 0.19% | | | | | | | | | | | | | | | | |
NextEra Energy Incorporated | | | | | | | | | | | 5,000 | | | | 492,050 | |
| | | | | | | | | | | | | | | | |
| | | | |
| Gas Utilities: 0.11% | | | | | | | | | | | | | | | | |
Atmos Energy Corporation | | | | | | | | | | | 5,000 | | | | 273,950 | |
| | | | | | | | | | | | | | | | |
| | | | |
| Multi-Utilities: 2.36% | | | | | | | | | | | | | | | | |
CMS Energy Corporation | | | | | | | | | | | 28,000 | | | | 917,840 | |
Dominion Resources Incorporated | | | | | | | | | | | 12,000 | | | | 837,000 | |
DTE Energy Company | | | | | | | | | | | 20,000 | | | | 1,561,200 | |
NiSource Incorporated | | | | | | | | | | | 10,000 | | | | 167,900 | |
Sempra Energy | | | | | | | | | | | 28,000 | | | | 2,655,800 | |
| | | | |
| | | | | | | | | | | | | | | 6,139,740 | |
| | | | | | | | | | | | | | | | |
| | | |
Total Common Stocks (Cost $21,893,064) | | | | | | | | | | | | 20,995,860 | |
| | | | | | | | | | | | | | | | |
| | | | |
| | | Interest rate | | | Maturity date | | | Principal | | | | |
| Corporate Bonds and Notes: 85.17% | | | | | | | | | | | | | | | | |
| | | | |
Consumer Discretionary: 12.52% | | | | | | | | | | | | | | | | |
| | | | |
| Auto Components: 3.93% | | | | | | | | | | | | | | | | |
American Axle Manufacturing Incorporated | | | 6.63 | % | | | 10-15-2022 | | | $ | 2,250,000 | | | | 2,295,000 | |
Dana Holding Corporation | | | 5.50 | | | | 12-15-2024 | | | | 2,000,000 | | | | 1,965,000 | |
The accompanying notes are an integral part of these financial statements.
| | | | | | |
| Portfolio of investments—August 31, 2015 | | Wells Fargo Advantage High Yield Bond Fund | | | 11 | |
| | | | | | | | | | | | | | | | |
| Security name | | Interest rate | | | Maturity date | | | Principal | | | Value | |
| | | | | | | | | | | | | | | | |
| | | | |
| Auto Components (continued) | | | | | | | | | | | | | | | | |
Lear Corporation | | | 4.75 | % | | | 1-15-2023 | | | $ | 6,000,000 | | | $ | 5,955,000 | |
| | | | |
| | | | | | | | | | | | | | | 10,215,000 | |
| | | | | | | | | | | | | | | | |
| | | | |
| Diversified Consumer Services: 0.65% | | | | | | | | | | | | | | | | |
Avis Budget Car Rental LLC / Avis Budget Finance Incorporated 144A | | | 5.25 | | | | 3-15-2025 | | | | 1,775,000 | | | | 1,681,813 | |
| | | | | | | | | | | | | | | | |
| | | | |
| Hotels, Restaurants & Leisure: 1.18% | | | | | | | | | | | | | | | | |
Speedway Motorsports Incorporated | | | 5.13 | | | | 2-1-2023 | | | | 3,115,000 | | | | 3,083,850 | |
| | | | | | | | | | | | | | | | |
| | | | |
| Media: 2.40% | | | | | | | | | | | | | | | | |
DISH DBS Corporation | | | 5.00 | | | | 3-15-2023 | | | | 5,500,000 | | | | 4,867,500 | |
DISH DBS Corporation | | | 5.88 | | | | 11-15-2024 | | | | 1,500,000 | | | | 1,366,875 | |
| | | | |
| | | | | | | | | | | | | | | 6,234,375 | |
| | | | | | | | | | | | | | | | |
| | | | |
| Specialty Retail: 4.36% | | | | | | | | | | | | | | | | |
Group 1 Automotive Incorporated | | | 5.00 | | | | 6-1-2022 | | | | 5,000,000 | | | | 4,962,500 | |
Penske Auto Group Incorporated | | | 5.75 | | | | 10-1-2022 | | | | 6,200,000 | | | | 6,386,000 | |
| | | | |
| | | | | | | | | | | | | | | 11,348,500 | |
| | | | | | | | | | | | | | | | |
| | | | |
Consumer Staples: 2.70% | | | | | | | | | | | | | | | | |
| | | | |
| Beverages: 2.70% | | | | | | | | | | | | | | | | |
Constellation Brands Incorporated | | | 4.75 | | | | 11-15-2024 | | | | 6,876,000 | | | | 7,030,710 | |
| | | | | | | | | | | | | | | | |
| | | | |
Energy: 2.55% | | | | | | | | | | | | | | | | |
| | | | |
| Energy Equipment & Services: 2.03% | | | | | | | | | | | | | | | | |
Bristow Group Incorporated | | | 6.25 | | | | 10-15-2022 | | | | 5,990,000 | | | | 5,271,200 | |
| | | | | | | | | | | | | | | | |
| | | | |
| Oil, Gas & Consumable Fuels: 0.52% | | | | | | | | | | | | | | | | |
NGL Energy Partners LP | | | 5.13 | | | | 7-15-2019 | | | | 1,460,000 | | | | 1,350,500 | |
| | | | | | | | | | | | | | | | |
| | | | |
Financials: 5.53% | | | | | | | | | | | | | | | | |
| | | | |
| REITs: 5.53% | | | | | | | | | | | | | | | | |
Crown Castle International Corporation | | | 4.88 | | | | 4-15-2022 | | | | 1,000,000 | | | | 1,026,250 | |
Crown Castle International Corporation | | | 5.25 | | | | 1-15-2023 | | | | 4,000,000 | | | | 4,185,000 | |
Iron Mountain Incorporated | | | 5.75 | | | | 8-15-2024 | | | | 5,000,000 | | | | 5,018,750 | |
Sabra Health Care Incorporated | | | 5.38 | | | | 6-1-2023 | | | | 4,000,000 | | | | 4,140,000 | |
| | | | |
| | | | | | | | | | | | | | | 14,370,000 | |
| | | | | | | | | | | | | | | | |
| | | | |
Health Care: 16.39% | | | | | | | | | | | | | | | | |
| | | | |
| Biotechnology: 1.14% | | | | | | | | | | | | | | | | |
AMAG Pharmaceuticals Incorporated 144A | | | 7.88 | | | | 9-1-2023 | | | | 2,900,000 | | | | 2,969,310 | |
| | | | | | | | | | | | | | | | |
| | | | |
| Health Care Equipment & Supplies: 0.60% | | | | | | | | | | | | | | | | |
Halyard Health Incorporated 144A | | | 6.25 | | | | 10-15-2022 | | | | 1,000,000 | | | | 1,034,375 | |
Hologic Incorporated 144A | | | 5.25 | | | | 7-15-2022 | | | | 500,000 | | | | 511,875 | |
| | | | |
| | | | | | | | | | | | | | | 1,546,250 | |
| | | | | | | | | | | | | | | | |
The accompanying notes are an integral part of these financial statements.
| | | | |
| 12 | | Wells Fargo Advantage High Yield Bond Fund | | Portfolio of investments—August 31, 2015 |
| | | | | | | | | | | | | | | | |
| Security name | | Interest rate | | | Maturity date | | | Principal | | | Value | |
| | | | | | | | | | | | | | | | |
| | | | |
| Health Care Providers & Services: 8.84% | | | | | | | | | | | | | | | | |
DaVita HealthCare Partners Incorporated | | | 5.13 | % | | | 7-15-2024 | | | $ | 2,000,000 | | | $ | 1,991,250 | |
DaVita HealthCare Partners Incorporated | | | 5.75 | | | | 8-15-2022 | | | | 4,265,000 | | | | 4,537,960 | |
Fresenius Medical Care Holdings Incorporated 144A | | | 5.88 | | | | 1-31-2022 | | | | 4,529,000 | | | | 4,891,320 | |
HCA Incorporated | | | 5.38 | | | | 2-1-2025 | | | | 6,500,000 | | | | 6,597,500 | |
HealthSouth Corporation | | | 5.13 | | | | 3-15-2023 | | | | 5,000,000 | | | | 4,950,000 | |
| | | | |
| | | | | | | | | | | | | | | 22,968,030 | |
| | | | | | | | | | | | | | | | |
| | | | |
| Life Sciences Tools & Services: 0.98% | | | | | | | | | | | | | | | | |
Quintiles Transnational Corporation 144A | | | 4.88 | | | | 5-15-2023 | | | | 2,500,000 | | | | 2,550,000 | |
| | | | | | | | | | | | | | | | |
| | | | |
| Pharmaceuticals: 4.83% | | | | | | | | | | | | | | | | |
Endo Limited 144A | | | 6.00 | | | | 2-1-2025 | | | | 6,000,000 | | | | 6,165,000 | |
Horizon Pharma plc 144A | | | 6.63 | | | | 5-1-2023 | | | | 6,200,000 | | | | 6,401,500 | |
| | | | |
| | | | | | | | | | | | | | | 12,566,500 | |
| | | | | | | | | | | | | | | | |
| | | | |
Industrials: 12.58% | | | | | | | | | | | | | | | | |
| | | | |
| Aerospace & Defense: 3.39% | | | | | | | | | | | | | | | | |
Moog Incorporated 144A | | | 5.25 | | | | 12-1-2022 | | | | 5,000,000 | | | | 5,050,000 | |
Orbital ATK Incorporated | | | 5.25 | | | | 10-1-2021 | | | | 3,675,000 | | | | 3,748,500 | |
| | | | |
| | | | | | | | | | | | | | | 8,798,500 | |
| | | | | | | | | | | | | | | | |
| | | | |
| Building Products: 1.61% | | | | | | | | | | | | | | | | |
Dycom Investments Incorporated | | | 7.13 | | | | 1-15-2021 | | | | 4,000,000 | | | | 4,170,000 | |
| | | | | | | | | | | | | | | | |
| | | | |
| Commercial Services & Supplies: 2.59% | | | | | | | | | | | | | | | | |
Clean Harbors Incorporated | | | 5.13 | | | | 6-1-2021 | | | | 6,663,000 | | | | 6,728,964 | |
| | | | | | | | | | | | | | | | |
| | | | |
| Electrical Equipment: 2.08% | | | | | | | | | | | | | | | | |
Belden Incorporated 144A | | | 5.50 | | | | 9-1-2022 | | | | 5,500,000 | | | | 5,417,500 | |
| | | | | | | | | | | | | | | | |
| | | | |
| Machinery: 1.15% | | | | | | | | | | | | | | | | |
Oshkosh Corporation | | | 5.38 | | | | 3-1-2025 | | | | 3,000,000 | | | | 3,000,000 | |
| | | | | | | | | | | | | | | | |
| | | | |
| Road & Rail: 1.76% | | | | | | | | | | | | | | | | |
The Hertz Corporation | | | 6.25 | | | | 10-15-2022 | | | | 4,500,000 | | | | 4,578,750 | |
| | | | | | | | | | | | | | | | |
| | | | |
Information Technology: 9.49% | | | | | | | | | | | | | | | | |
| | | | |
| Communications Equipment: 3.81% | | | | | | | | | | | | | | | | |
CommScope Incorporated 144A | | | 5.50 | | | | 6-15-2024 | | | | 10,200,000 | | | | 9,906,750 | |
| | | | | | | | | | | | | | | | |
| | | | |
| Electronic Equipment, Instruments & Components: 0.56% | | | | | | | | | | | | | | | | |
Anixter International Incorporated | | | 5.13 | | | | 10-1-2021 | | | | 1,000,000 | | | | 997,500 | |
Belden Incorporated 144A | | | 5.25 | | | | 7-15-2024 | | | | 485,000 | | | | 459,538 | |
| | | | |
| | | | | | | | | | | | | | | 1,457,038 | |
| | | | | | | | | | | | | | | | |
| | | | |
| IT Services: 2.07% | | | | | | | | | | | | | | | | |
Neustar Incorporated « | | | 4.50 | | | | 1-15-2023 | | | | 6,350,000 | | | | 5,397,500 | |
| | | | | | | | | | | | | | | | |
The accompanying notes are an integral part of these financial statements.
| | | | | | |
| Portfolio of investments—August 31, 2015 | | Wells Fargo Advantage High Yield Bond Fund | | | 13 | |
| | | | | | | | | | | | | | | | |
| Security name | | Interest rate | | | Maturity date | | | Principal | | | Value | |
| | | | | | | | | | | | | | | | |
| | | | |
| Semiconductors & Semiconductor Equipment: 3.05% | | | | | | | | | | | | | | | | |
Micron Technology Incorporated 144A | | | 5.25 | % | | | 8-1-2023 | | | $ | 3,600,000 | | | $ | 3,366,000 | |
Micron Technology Incorporated | | | 5.50 | | | | 2-1-2025 | | | | 4,900,000 | | | | 4,557,000 | |
| | | | |
| | | | | | | | | | | | | | | 7,923,000 | |
| | | | | | | | | | | | | | | | |
| | | | |
Materials: 17.80% | | | | | | | | | | | | | | | | |
| | | | |
| Chemicals: 12.55% | | | | | | | | | | | | | | | | |
A. Schulman Incorporated 144A | | | 6.88 | | | | 6-1-2023 | | | | 3,200,000 | | | | 3,184,000 | |
Celanese U.S. Holdings LLC | | | 4.63 | | | | 11-15-2022 | | | | 4,729,000 | | | | 4,604,864 | |
Huntsman International LLC | | | 4.88 | | | | 11-15-2020 | | | | 1,000,000 | | | | 980,000 | |
Kraton Polymers LLC | | | 6.75 | | | | 3-1-2019 | | | | 2,105,000 | | | | 2,115,525 | |
Olin Corporation | | | 5.50 | | | | 8-15-2022 | | | | 7,750,000 | | | | 7,905,000 | |
Rayonier Advanced Materials Incorporated 144A | | | 5.50 | | | | 6-1-2024 | | | | 7,775,000 | | | | 5,306,438 | |
Tronox Finance LLC | | | 6.38 | | | | 8-15-2020 | | | | 10,400,000 | | | | 8,528,000 | |
| | | | |
| | | | | | | | | | | | | | | 32,623,827 | |
| | | | | | | | | | | | | | | | |
| | | | |
| Containers & Packaging: 3.28% | | | | | | | | | | | | | | | | |
Ball Corporation | | | 4.00 | | | | 11-15-2023 | | | | 1,500,000 | | | | 1,413,750 | |
Ball Corporation | | | 5.00 | | | | 3-15-2022 | | | | 5,500,000 | | | | 5,582,500 | |
Sealed Air Corporation 144A | | | 5.25 | | | | 4-1-2023 | | | | 1,500,000 | | | | 1,533,750 | |
| | | | |
| | | | | | | | | | | | | | | 8,530,000 | |
| | | | | | | | | | | | | | | | |
| | | | |
| Metals & Mining: 0.16% | | | | | | | | | | | | | | | | |
Commercial Metals Company | | | 4.88 | | | | 5-15-2023 | | | | 150,000 | | | | 132,750 | |
Steel Dynamics Incorporated | | | 5.50 | | | | 10-1-2024 | | | | 300,000 | | | | 291,375 | |
| | | | |
| | | | | | | | | | | | | | | 424,125 | |
| | | | | | | | | | | | | | | | |
| | | | |
| Paper & Forest Products: 1.81% | | | | | | | | | | | | | | | | |
P.H. Glatfelter Company | | | 5.38 | | | | 10-15-2020 | | | | 4,630,000 | | | | 4,687,875 | |
| | | | | | | | | | | | | | | | |
| | | | |
Utilities: 5.61% | | | | | | | | | | | | | | | | |
| | | | |
| Electric Utilities: 1.73% | | | | | | | | | | | | | | | | |
DPL Incorporated | | | 7.25 | | | | 10-15-2021 | | | | 4,375,000 | | | | 4,511,719 | |
| | | | | | | | | | | | | | | | |
| | | | |
| Independent Power & Renewable Electricity Producers: 3.88% | | | | | | | | | | | | | | | | |
Calpine Corporation 144A | | | 5.88 | | | | 1-15-2024 | | | | 2,576,000 | | | | 2,704,800 | |
Calpine Corporation 144A | | | 6.00 | | | | 1-15-2022 | | | | 1,625,000 | | | | 1,728,594 | |
NRG Energy Incorporated | | | 6.63 | | | | 3-15-2023 | | | | 5,743,000 | | | | 5,642,495 | |
| | | | |
| | | | | | | | | | | | | | | 10,075,889 | |
| | | | | | | | | | | | | | | | |
| | | | |
Total Corporate Bonds and Notes (Cost $229,708,515) | | | | | | | | | | | | | | | 221,417,475 | |
| | | | | | | | | | | | | | | | |
| | | | |
Yankee Corporate Bonds and Notes: 4.27% | | | | | | | | | | | | | | | | |
| | | | |
Health Care: 1.71% | | | | | | | | | | | | | | | | |
| | | | |
| Pharmaceuticals: 1.71% | | | | | | | | | | | | | | | | |
Mallinckrodt plc 144A | | | 5.50 | | | | 4-15-2025 | | | | 4,500,000 | | | | 4,460,625 | |
| | | | | | | | | | | | | | | | |
The accompanying notes are an integral part of these financial statements.
| | | | |
| 14 | | Wells Fargo Advantage High Yield Bond Fund | | Portfolio of investments—August 31, 2015 |
| | | | | | | | | | | | | | | | |
| Security name | | Interest rate | | | Maturity date | | | Principal | | | Value | |
| | | | | | | | | | | | | | | | |
| | | | |
Industrials: 2.32% | | | | | | | | | | | | | | | | |
| | | | |
| Electrical Equipment: 2.32% | | | | | | | | | | | | | | | | |
Sensata Technologies BV 144A | | | 4.88 | % | | | 10-15-2023 | | | $ | 3,000,000 | | | $ | 2,947,500 | |
Sensata Technologies BV 144A | | | 5.63 | | | | 11-1-2024 | | | | 3,000,000 | | | | 3,075,000 | |
| | | | |
| | | | | | | | | | | | | | | 6,022,500 | |
| | | | | | | | | | | | | | | | |
| | | | |
Information Technology: 0.24% | | | | | | | | | | | | | | | | |
| | | | |
| Technology Hardware, Storage & Peripherals: 0.24% | | | | | | | | | | | | | | | | |
Seagate HDD (Cayman) | | | 4.75 | | | | 6-1-2023 | | | | 640,000 | | | | 620,358 | |
| | | | | | | | | | | | | | | | |
| | | | |
Total Yankee Corporate Bonds and Notes (Cost $11,253,212) | | | | | | | | | | | | | | | 11,103,483 | |
| | | | | | | | | | | | | | | | |
| | | Yield | | | | | | Shares | | | | |
| | | | |
Short-Term Investments: 2.08% | | | | | | | | | | | | | | | | |
| | | | |
| Investment Companies: 2.08% | | | | | | | | | | | | | | | | |
Securities Lending Cash Investments, LLC (l)(r)(u) | | | 0.15 | | | | | | | | 2,329,763 | | | | 2,329,763 | |
Wells Fargo Advantage Cash Investment Money Market Fund, Select Class (l)(u) | | | 0.15 | | | | | | | | 3,067,086 | | | | 3,067,086 | |
| | | | |
Total Short-Term Investments (Cost $5,396,849) | | | | | | | | | | | | | | | 5,396,849 | |
| | | | | | | | | | | | | | | | |
| | | | | | | | |
| Total investments in securities (Cost $268,251,640) * | | | 99.60 | % | | | 258,913,667 | |
Other assets and liabilities, net | | | 0.40 | | | | 1,041,242 | |
| | | | | | | | |
| Total net assets | | | 100.00 | % | | $ | 259,954,909 | |
| | | | | | | | |
| † | Non-income-earning security |
| 144A | The security may be resold in transactions exempt from registration, normally to qualified institutional buyers, pursuant to Rule 144A under the Securities Act of 1933. |
| « | All or a portion of this security is on loan. |
| (l) | The security represents an affiliate of the Fund as defined in the Investment Company Act of 1940. |
| (r) | The investment is a non-registered investment vehicle purchased with cash collateral received from securities on loan. |
| (u) | The rate represents the 7-day annualized yield at period end. |
| * | Cost for federal income tax purposes is $268,175,047 and unrealized gains (losses) consists of: |
| | | | |
Gross unrealized gains | | $ | 1,838,749 | |
Gross unrealized losses | | | (11,100,129 | ) |
| | | | |
Net unrealized losses | | $ | (9,261,380 | ) |
The accompanying notes are an integral part of these financial statements.
| | | | | | |
| Statement of assets and liabilities—August 31, 2015 | | Wells Fargo Advantage High Yield Bond Fund | | | 15 | |
| | | | |
| | | | |
| |
Assets | | | | |
Investments | | | | |
In unaffiliated securities (including $2,252,762 of securities loaned), at value (cost $262,854,791) | | $ | 253,516,818 | |
In affiliated securities, at value (cost $5,396,849) | | | 5,396,849 | |
| | | | |
Total investments, at value (cost $268,251,640) | | | 258,913,667 | |
Foreign currency, at value (cost $45) | | | 39 | |
Receivable for investments sold | | | 1,200,278 | |
Receivable for Fund shares sold | | | 23,199 | |
Receivable for dividends and interest | | | 3,402,482 | |
Receivable for securities lending income | | | 6,262 | |
Prepaid expenses and other assets | | | 138,798 | |
| | | | |
Total assets | | | 263,684,725 | |
| | | | |
| |
Liabilities | | | | |
Dividends payable | | | 82,340 | |
Payable for investments purchased | | | 348,739 | |
Payable for Fund shares redeemed | | | 586,749 | |
Payable upon receipt of securities loaned | | | 2,329,763 | |
Management fee payable | | | 116,949 | |
Distribution fees payable | | | 40,962 | |
Administration fees payable | | | 34,932 | |
Accrued expenses and other liabilities | | | 189,382 | |
| | | | |
Total liabilities | | | 3,729,816 | |
| | | | |
Total net assets | | $ | 259,954,909 | |
| | | | |
| |
NET ASSETS CONSIST OF | | | | |
Paid-in capital | | $ | 323,594,871 | |
Overdistributed net investment income | | | (119,927 | ) |
Accumulated net realized losses on investments | | | (54,182,056 | ) |
Net unrealized losses on investments | | | (9,337,979 | ) |
| | | | |
Total net assets | | $ | 259,954,909 | |
| | | | |
| |
COMPUTATION OF NET ASSET VALUE AND OFFERING PRICE PER SHARE | | | | |
Net assets – Class A | | $ | 179,357,056 | |
Shares outstanding – Class A1 | | | 56,777,714 | |
Net asset value per share – Class A | | | $3.16 | |
Maximum offering price per share – Class A2 | | | $3.31 | |
Net assets – Class B | | $ | 1,868,362 | |
Shares outstanding – Class B1 | | | 591,238 | |
Net asset value per share – Class B | | | $3.16 | |
Net assets – Class C | | $ | 60,753,360 | |
Shares outstanding – Class C1 | | | 19,229,282 | |
Net asset value per share – Class C | | | $3.16 | |
Net assets – Administrator Class | | $ | 13,129,161 | |
Shares outstanding – Administrator Class1 | | | 4,150,322 | |
Net asset value per share – Administrator Class | | | $3.16 | |
Net assets – Institutional Class | | $ | 4,846,970 | |
Shares outstanding – Institutional Class1 | | | 1,531,175 | |
Net asset value per share – Institutional Class | | | $3.17 | |
| 1 | The Fund has an unlimited number of authorized shares. |
| 2 | Maximum offering price is computed as 100/95.50 of net asset value. On investments of $50,000 or more, the offering price is reduced. |
The accompanying notes are an integral part of these financial statements.
| | | | |
| 16 | | Wells Fargo Advantage High Yield Bond Fund | | Statement of operations—year ended August 31, 2015 |
| | | | |
| | | | |
| |
Investment income | | | | |
Interest | | $ | 13,985,799 | |
Dividends (net of foreign withholding taxes of $1,993) | | | 530,937 | |
Securities lending income, net | | | 85,118 | |
Income from affiliated securities | | | 2,574 | |
| | | | |
Total investment income | | | 14,604,428 | |
| | | | |
| |
Expenses | | | | |
Management fee | | | 1,584,806 | |
Administration fees | | | | |
Class A | | | 317,856 | |
Class B | | | 4,553 | |
Class C | | | 106,852 | |
Administrator Class | | | 18,653 | |
Institutional Class | | | 964 | 1 |
Shareholder servicing fees | | | | |
Class A | | | 496,652 | |
Class B | | | 7,114 | |
Class C | | | 166,955 | |
Administrator Class | | | 46,633 | |
Distribution fees | | | | |
Class B | | | 21,342 | |
Class C | | | 500,867 | |
Custody and accounting fees | | | 23,677 | |
Professional fees | | | 68,432 | |
Registration fees | | | 53,566 | |
Shareholder report expenses | | | 55,448 | |
Trustees’ fees and expenses | | | 10,090 | |
Other fees and expenses | | | 13,894 | |
| | | | |
Total expenses | | | 3,498,354 | |
Less: Fee waivers and/or expense reimbursements | | | (55,325 | ) |
| | | | |
Net expenses | | | 3,443,029 | |
| | | | |
Net investment income | | | 11,161,399 | |
| | | | |
| |
REALIZED AND UNREALIZED GAINS (LOSSES) ON INVESTMENTS | | | | |
| |
Net realized gains (losses) on: | | | | |
Unaffiliated securities | | | 2,699,618 | |
Futures transactions | | | (288,529 | ) |
| | | | |
Net realized gains on investments | | | 2,411,089 | |
| | | | |
| |
Net change in unrealized gains (losses) on: | | | | |
Unaffiliated securities | | | (19,793,858 | ) |
Futures transactions | | | 214,228 | |
| | | | |
Net change in unrealized gains (losses) on investments | | | (19,579,630 | ) |
| | | | |
Net realized and unrealized gains (losses) on investments | | | (17,168,541 | ) |
| | | | |
Net decrease in net assets resulting from operations | | $ | (6,007,142 | ) |
| | | | |
| 1 | For the period from October 31, 2014 (commencement of class operations) to August 31, 2015 |
The accompanying notes are an integral part of these financial statements.
| | | | | | |
| Statement of changes in net assets | | Wells Fargo Advantage High Yield Bond Fund | | | 17 | |
| | | | | | | | | | | | | | | | |
| | | Year ended
August 31, 2015 | | | Year ended
August 31, 2014 | |
| | | | |
Operations | | | | | | | | | | | | | | | | |
Net investment income | | | | | | $ | 11,161,399 | | | | | | | $ | 13,443,918 | |
Net realized gains on investments | | | | | | | 2,411,089 | | | | | | | | 5,377,718 | |
Net change in unrealized gains (losses) on investments | | | | | | | (19,579,630 | ) | | | | | | | 15,459,995 | |
| | | | |
Net increase (decrease) in net assets resulting from operations | | | | | | | (6,007,142 | ) | | | | | | | 34,281,631 | |
| | | | |
| | | | |
Distributions to shareholders from | | | | | | | | | | | | | | | | |
Net investment income | | | | | | | | | | | | | | | | |
Class A | | | | | | | (8,019,970 | ) | | | | | | | (9,459,253 | ) |
Class B | | | | | | | (93,822 | ) | | | | | | | (189,519 | ) |
Class C | | | | | | | (2,197,041 | ) | | | | | | | (2,766,449 | ) |
Administrator Class | | | | | | | (796,962 | ) | | | | | | | (967,151 | ) |
Institutional Class | | | | | | | (52,204 | )1 | | | | | | | N/A | |
| | | | |
Total distributions to shareholders | | | | | | | (11,159,999 | ) | | | | | | | (13,382,372 | ) |
| | | | |
| | | | |
Capital share transactions | | | Shares | | | | | | | | Shares | | | | | |
Proceeds from shares sold | | | | | | | | | | | | | | | | |
Class A | | | 11,660,936 | | | | 38,274,681 | | | | 4,174,488 | | | | 13,529,333 | |
Class B | | | 52,608 | | | | 173,419 | | | | 17,151 | | | | 56,831 | |
Class C | | | 780,954 | | | | 2,557,227 | | | | 821,870 | | | | 2,678,022 | |
Administrator Class | | | 1,586,653 | | | | 5,225,031 | | | | 2,812,042 | | | | 9,171,050 | |
Institutional Class | | | 1,709,640 | 1 | | | 5,538,268 | 1 | | | N/A | | | | N/A | |
| | | | |
| | | | | | | 51,768,626 | | | | | | | | 25,435,236 | |
| | | | |
Reinvestment of distributions | | | | | | | | | | | | | | | | |
Class A | | | 2,163,645 | | | | 7,069,289 | | | | 2,511,673 | | | | 8,240,513 | |
Class B | | | 25,351 | | | | 82,962 | | | | 51,262 | | | | 167,850 | |
Class C | | | 619,791 | | | | 2,025,306 | | | | 770,176 | | | | 2,526,354 | |
Administrator Class | | | 223,657 | | | | 732,250 | | | | 262,316 | | | | 862,288 | |
Institutional Class | | | 6,536 | 1 | | | 20,901 | 1 | | | N/A | | | | N/A | |
| | | | |
| | | | | | | 9,930,708 | | | | | | | | 11,797,005 | |
| | | | |
Payment for shares redeemed | | | | | | | | | | | | | | | | |
Class A | | | (19,652,201 | ) | | | (64,201,730 | ) | | | (15,822,235 | ) | | | (51,599,260 | ) |
Class B | | | (670,606 | ) | | | (2,199,762 | ) | | | (1,002,877 | ) | | | (3,278,584 | ) |
Class C | | | (3,849,430 | ) | | | (12,539,667 | ) | | | (6,460,879 | ) | | | (21,047,143 | ) |
Administrator Class | | | (3,665,523 | ) | | | (11,914,124 | ) | | | (3,853,847 | ) | | | (12,658,859 | ) |
Institutional Class | | | (185,001 | )1 | | | (603,958 | )1 | | | N/A | | | | N/A | |
| | | | |
| | | | | | | (91,459,241 | ) | | | | | | | (88,583,846 | ) |
| | | | |
Net decrease in net assets resulting from capital share transactions | | | | | | | (29,759,907 | ) | | | | | | | (51,351,605 | ) |
| | | | |
Total decrease in net assets | | | | | | | (46,927,048 | ) | | | | | | | (30,452,346 | ) |
| | | | |
| | | | |
Net assets | | | | | | | | | | | | | | | | |
Beginning of period | | | | | | | 306,881,957 | | | | | | | | 337,334,303 | |
| | | | |
End of period | | | | | | $ | 259,954,909 | | | | | | | $ | 306,881,957 | |
| | | | |
Overdistributed net investment income | | | | | | $ | (119,927 | ) | | | | | | $ | (163,588 | ) |
| | | | |
| 1 | For the period from October 31, 2014 (commencement of class operations) to August 31, 2015 |
The accompanying notes are an integral part of these financial statements.
| | | | |
| 18 | | Wells Fargo Advantage High Yield Bond Fund | | Financial highlights |
(For a share outstanding throughout each period)
| | | | | | | | | | | | | | | | | | | | |
| | | Year ended August 31 | |
| CLASS A | | 2015 | | | 2014 | | | 2013 | | | 2012 | | | 2011 | |
Net asset value, beginning of period | | | $3.35 | | | | $3.15 | | | | $3.18 | | | | $3.03 | | | | $3.05 | |
Net investment income | | | 0.13 | | | | 0.14 | | | | 0.15 | | | | 0.20 | | | | 0.21 | |
Net realized and unrealized gains (losses) on investments | | | (0.19 | ) | | | 0.20 | | | | (0.03 | ) | | | 0.15 | | | | (0.02 | ) |
| | | | | | | | | | | | | | | | | | | | |
Total from investment operations | | | (0.06 | ) | | | 0.34 | | | | 0.12 | | | | 0.35 | | | | 0.19 | |
Distributions to shareholders from | | | | | | | | | | | | | | | | | | | | |
Net investment income | | | (0.13 | ) | | | (0.14 | ) | | | (0.15 | ) | | | (0.20 | ) | | | (0.21 | ) |
Net asset value, end of period | | | $3.16 | | | | $3.35 | | | | $3.15 | | | | $3.18 | | | | $3.03 | |
Total return1 | | | (1.79 | )% | | | 11.02 | % | | | 3.78 | % | | | 12.00 | % | | | 6.07 | % |
Ratios to average net assets (annualized) | | | | | | | | | | | | | | | | | | | | |
Gross expenses | | | 1.04 | % | | | 1.03 | % | | | 1.04 | % | | | 1.02 | % | | | 1.02 | % |
Net expenses | | | 1.03 | % | | | 1.03 | % | | | 1.03 | % | | | 1.02 | % | | | 1.02 | % |
Net investment income | | | 4.04 | % | | | 4.35 | % | | | 4.65 | % | | | 6.52 | % | | | 6.60 | % |
Supplemental data | | | | | | | | | | | | | | | | | | | | |
Portfolio turnover rate | | | 55 | % | | | 40 | % | | | 95 | % | | | 37 | % | | | 70 | % |
Net assets, end of period (000s omitted) | | | $179,357 | | | | $210,005 | | | | $225,743 | | | | $261,938 | | | | $240,653 | |
| 1 | Total return calculations do not include any sales charges. |
The accompanying notes are an integral part of these financial statements.
| | | | | | |
| Financial highlights | | Wells Fargo Advantage High Yield Bond Fund | | | 19 | |
(For a share outstanding throughout each period)
| | | | | | | | | | | | | | | | | | | | |
| | | Year ended August 31 | |
| CLASS B | | 2015 | | | 2014 | | | 2013 | | | 2012 | | | 2011 | |
Net asset value, beginning of period | | | $3.36 | | | | $3.15 | | | | $3.18 | | | | $3.03 | | | | $3.05 | |
Net investment income | | | 0.11 | 1 | | | 0.12 | | | | 0.13 | | | | 0.18 | 1 | | | 0.18 | 1 |
Net realized and unrealized gains (losses) on investments | | | (0.20 | ) | | | 0.21 | | | | (0.03 | ) | | | 0.15 | | | | (0.02 | ) |
| | | | | | | | | | | | | | | | | | | | |
Total from investment operations | | | (0.09 | ) | | | 0.33 | | | | 0.10 | | | | 0.33 | | | | 0.16 | |
Distributions to shareholders from | | | | | | | | | | | | | | | | | | | | |
Net investment income | | | (0.11 | ) | | | (0.12 | ) | | | (0.13 | ) | | | (0.18 | ) | | | (0.18 | ) |
Net asset value, end of period | | | $3.16 | | | | $3.36 | | | | $3.15 | | | | $3.18 | | | | $3.03 | |
Total return2 | | | (2.81 | )% | | | 10.53 | % | | | 3.01 | % | | | 11.17 | % | | | 5.28 | % |
Ratios to average net assets (annualized) | | | | | | | | | | | | | | | | | | | | |
Gross expenses | | | 1.79 | % | | | 1.78 | % | | | 1.78 | % | | | 1.77 | % | | | 1.78 | % |
Net expenses | | | 1.78 | % | | | 1.78 | % | | | 1.78 | % | | | 1.77 | % | | | 1.77 | % |
Net investment income | | | 3.30 | % | | | 3.63 | % | | | 3.93 | % | | | 5.80 | % | | | 5.85 | % |
Supplemental data | | | | | | | | | | | | | | | | | | | | |
Portfolio turnover rate | | | 55 | % | | | 40 | % | | | 95 | % | | | 37 | % | | | 70 | % |
Net assets, end of period (000s omitted) | | | $1,868 | | | | $3,972 | | | | $6,667 | | | | $13,247 | | | | $21,656 | |
| 1 | Calculated based upon average shares outstanding |
| 2 | Total return calculations do not include any sales charges. |
The accompanying notes are an integral part of these financial statements.
| | | | |
| 20 | | Wells Fargo Advantage High Yield Bond Fund | | Financial highlights |
(For a share outstanding throughout each period)
| | | | | | | | | | | | | | | | | | | | |
| | | Year ended August 31 | |
| CLASS C | | 2015 | | | 2014 | | | 2013 | | | 2012 | | | 2011 | |
Net asset value, beginning of period | | | $3.35 | | | | $3.15 | | | | $3.18 | | | | $3.03 | | | | $3.05 | |
Net investment income | | | 0.11 | | | | 0.12 | | | | 0.13 | | | | 0.18 | | | | 0.18 | |
Net realized and unrealized gains (losses) on investments | | | (0.19 | ) | | | 0.20 | | | | (0.03 | ) | | | 0.15 | | | | (0.02 | ) |
| | | | | | | | | | | | | | | | | | | | |
Total from investment operations | | | (0.08 | ) | | | 0.32 | | | | 0.10 | | | | 0.33 | | | | 0.16 | |
Distributions to shareholders from | | | | | | | | | | | | | | | | | | | | |
Net investment income | | | (0.11 | ) | | | (0.12 | ) | | | (0.13 | ) | | | (0.18 | ) | | | (0.18 | ) |
Net asset value, end of period | | | $3.16 | | | | $3.35 | | | | $3.15 | | | | $3.18 | | | | $3.03 | |
Total return1 | | | (2.52 | )% | | | 10.20 | % | | | 3.01 | % | | | 11.17 | % | | | 5.28 | % |
Ratios to average net assets (annualized) | | | | | | | | | | | | | | | | | | | | |
Gross expenses | | | 1.79 | % | | | 1.78 | % | | | 1.79 | % | | | 1.77 | % | | | 1.77 | % |
Net expenses | | | 1.78 | % | | | 1.78 | % | | | 1.78 | % | | | 1.77 | % | | | 1.77 | % |
Net investment income | | | 3.29 | % | | | 3.60 | % | | | 3.90 | % | | | 5.78 | % | | | 5.85 | % |
Supplemental data | | | | | | | | | | | | | | | | | | | | |
Portfolio turnover rate | | | 55 | % | | | 40 | % | | | 95 | % | | | 37 | % | | | 70 | % |
Net assets, end of period (000s omitted) | | | $60,753 | | | | $72,728 | | | | $83,548 | | | | $99,633 | | | | $95,999 | |
| 1 | Total return calculations do not include any sales charges. |
The accompanying notes are an integral part of these financial statements.
| | | | | | |
| Financial highlights | | Wells Fargo Advantage High Yield Bond Fund | | | 21 | |
(For a share outstanding throughout each period)
| | | | | | | | | | | | | | | | | | | | |
| | | Year ended August 31 | |
| ADMINISTRATOR CLASS | | 2015 | | | 2014 | | | 2013 | | | 2012 | | | 2011 | |
Net asset value, beginning of period | | | $3.36 | | | | $3.15 | | | | $3.18 | | | | $3.03 | | | | $3.05 | |
Net investment income | | | 0.14 | | | | 0.15 | | | | 0.16 | | | | 0.21 | | | | 0.22 | |
Net realized and unrealized gains (losses) on investments | | | (0.20 | ) | | | 0.21 | | | | (0.03 | ) | | | 0.15 | | | | (0.03 | ) |
| | | | | | | | | | | | | | | | | | | | |
Total from investment operations | | | (0.06 | ) | | | 0.36 | | | | 0.13 | | | | 0.36 | | | | 0.19 | |
Distributions to shareholders from | | | | | | | | | | | | | | | | | | | | |
Net investment income | | | (0.14 | ) | | | (0.15 | ) | | | (0.16 | ) | | | (0.21 | ) | | | (0.21 | ) |
Net asset value, end of period | | | $3.16 | | | | $3.36 | | | | $3.15 | | | | $3.18 | | | | $3.03 | |
Total return | | | (1.86 | )% | | | 11.61 | % | | | 4.02 | % | | | 12.25 | % | | | 6.30 | % |
Ratios to average net assets (annualized) | | | | | | | | | | | | | | | | | | | | |
Gross expenses | | | 0.98 | % | | | 0.96 | % | | | 0.96 | % | | | 0.95 | % | | | 0.95 | % |
Net expenses | | | 0.80 | % | | | 0.80 | % | | | 0.80 | % | | | 0.80 | % | | | 0.80 | % |
Net investment income | | | 4.27 | % | | | 4.57 | % | | | 4.91 | % | | | 6.73 | % | | | 6.79 | % |
Supplemental data | | | | | | | | | | | | | | | | | | | | |
Portfolio turnover rate | | | 55 | % | | | 40 | % | | | 95 | % | | | 37 | % | | | 70 | % |
Net assets, end of period (000s omitted) | | | $13,129 | | | | $20,177 | | | | $21,376 | | | | $37,469 | | | | $26,234 | |
The accompanying notes are an integral part of these financial statements.
| | | | |
| 22 | | Wells Fargo Advantage High Yield Bond Fund | | Financial highlights |
(For a share outstanding throughout each period)
| | | | |
| INSTITUTIONAL CLASS | | Year ended
August 31, 20151 | |
Net asset value, beginning of period | | | $3.33 | |
Net investment income | | | 0.12 | |
Net realized and unrealized gains (losses) on investments | | | (0.16 | ) |
| | | | |
Total from investment operations | | | (0.04 | ) |
Distributions to shareholders from | | | | |
Net investment income | | | (0.12 | ) |
Net asset value, end of period | | | $3.17 | |
Total return2 | | | (1.31 | )% |
Ratios to average net assets (annualized) | | | | |
Gross expenses | | | 0.71 | % |
Net expenses | | | 0.70 | % |
Net investment income | | | 4.33 | % |
Supplemental data | | | | |
Portfolio turnover rate | | | 55 | % |
Net assets, end of period (000s omitted) | | | $4,847 | |
| 1 | For the period from October 31, 2014 (commencement of class operations) to August 31, 2015 |
| 2 | Returns for periods of less than one year are not annualized. |
The accompanying notes are an integral part of these financial statements.
| | | | | | |
| Notes to financial statements | | Wells Fargo Advantage High Yield Bond Fund | | | 23 | |
1. ORGANIZATION
Wells Fargo Funds Trust (the “Trust”), a Delaware statutory trust organized on March 10, 1999, is an open-end management investment company registered under the Investment Company Act of 1940, as amended (the “1940 Act”). As an investment company, the Trust follows the accounting and reporting guidance in Financial Accounting Standards Board (“FASB”) Accounting Standards Codification Topic 946, Financial Services – Investment Companies. These financial statements report on the Wells Fargo Advantage High Yield Bond Fund (the “Fund”) which is a diversified series of the Trust.
2. SIGNIFICANT ACCOUNTING POLICIES
The following significant accounting policies, which are consistently followed in the preparation of the financial statements of the Fund, are in conformity with U.S. generally accepted accounting principles which require management to make estimates and assumptions that affect the reported amounts of assets and liabilities, disclosure of contingent assets and liabilities at the date of the financial statements, and the reported amounts of revenues and expenses during the reporting period. Actual results could differ from those estimates.
Securities valuation
All investments are valued each business day as of the close of regular trading on the New York Stock Exchange (generally 4 p.m. Eastern Time).
Debt securities are valued at the evaluated bid price provided by an independent pricing service or, if a reliable price is not available, the quoted bid price from an independent broker-dealer.
Equity securities and futures that are listed on a foreign or domestic exchange or market are valued at the official closing price or, if none, the last sales price. If no sale occurs on the primary exchange or market that day, the prior day’s price will be deemed “stale” and a fair value price will be determined in accordance with the Fund’s Valuation Procedures.
Equity securities that are not listed on a foreign or domestic exchange or market, but have a public trading market, are valued at the quoted bid price from an independent broker-dealer that the Management Valuation Team of Wells Fargo Funds Management, LLC (“Funds Management”) has determined is an acceptable source.
Investments in registered open-end investment companies are valued at net asset value. Interests in non-registered investment vehicles that are redeemable at net asset value are fair valued at net asset value when available.
Investments which are not valued using any of the methods discussed above are valued at their fair value, as determined in good faith by the Board of Trustees of the Fund. The Board of Trustees has established a Valuation Committee comprised of the Trustees and has delegated to it the authority to take any actions regarding the valuation of portfolio securities that the Valuation Committee deems necessary or appropriate, including determining the fair value of portfolio securities, unless the determination has been delegated to the Management Valuation Team. The Board of Trustees retains the authority to make or ratify any valuation decisions or approve any changes to the Valuation Procedures as it deems appropriate. On a quarterly basis, the Board of Trustees receives reports on any valuation actions taken by the Valuation Committee or the Management Valuation Team which may include items for ratification.
Valuations of fair valued securities are compared to the next actual sales price when available, or other appropriate market values, to assess the continued appropriateness of the fair valuation methodologies used. These securities are fair valued on a day-to-day basis, taking into consideration changes to appropriate market information and any significant changes to the inputs considered in the valuation process until there is a readily available price provided on an exchange or by an independent pricing service. Valuations received from an independent pricing service or independent broker-dealer quotes are periodically validated by comparisons to most recent trades and valuations provided by other independent pricing services in addition to the review of prices by the manager and/or subadviser. Unobservable inputs used in determining fair valuations are identified based on the type of security, taking into consideration factors utilized by market participants in valuing the investment, knowledge about the issuer and the current market environment.
Foreign currency translation
The accounting records of the Fund are maintained in U.S. dollars. The values of other assets and liabilities denominated in foreign currencies are translated into U.S. dollars at rates provided by an independent foreign currency pricing source at a time each business day specified by the Management Valuation Team. Purchases and sales of securities, and income and expenses are converted at the rate of exchange on the respective dates of such transactions. Net realized foreign exchange gains or losses arise from sales of foreign currencies, currency gains or losses realized between the trade and settlement dates on securities transactions, and the difference between the amounts of dividends, interest and foreign withholding taxes recorded and the U.S. dollar equivalent of the amounts actually paid or received. Net unrealized
| | | | |
| 24 | | Wells Fargo Advantage High Yield Bond Fund | | Notes to financial statements |
foreign exchange gains and losses arise from changes in the fair value of assets and liabilities other than investments in securities resulting from changes in exchange rates. The changes in net assets arising from changes in exchange rates and the changes in net assets resulting from changes in market prices of securities are not separately presented. Such changes are included in net realized and unrealized gains or losses from investments.
Security loans
The Fund may lend its securities from time to time in order to earn additional income in the form of fees or interest on securities received as collateral or the investment of any cash received as collateral. The Fund continues to receive interest or dividends on the securities loaned. The Fund receives collateral in the form of cash or securities with a value at least equal to the value of the securities on loan. The value of the loaned securities is determined at the close of each business day and any additional required collateral is delivered to the Fund on the next business day. In a securities lending transaction, the net asset value of the Fund will be affected by an increase or decrease in the value of the securities loaned and by an increase or decrease in the value of the instrument in which collateral is invested. The amount of securities lending activity undertaken by the Fund fluctuates from time to time. In the event of default or bankruptcy by the borrower, the Fund may be prevented from recovering the loaned securities or gaining access to the collateral or may experience delays or costs in doing so. In addition, the investment of any cash collateral received may lose all or part of its value. The Fund has the right under the lending agreement to recover the securities from the borrower on demand.
The Fund lends its securities through an unaffiliated securities lending agent. Cash collateral received in connection with its securities lending transactions is invested in Securities Lending Cash Investments, LLC (the “Securities Lending Fund”). The Securities Lending Fund is exempt from registration under Section 3(c)(7) of the 1940 Act and is managed by Funds Management and is subadvised by Wells Capital Management Incorporated (“WellsCap”). Funds Management receives an advisory fee starting at 0.05% and declining to 0.01% as the average daily net assets of the Securities Lending Fund increase. All of the fees received by Funds Management are paid to WellsCap for its services as subadviser. The Securities Lending Fund seeks to provide a positive return compared to the daily Fed Funds Open rate by investing in high-quality, U.S. dollar-denominated short-term money market instruments. Securities Lending Fund investments are fair valued based upon the amortized cost valuation technique. Income earned from investment in the Securities Lending Fund is included in securities lending income on the Statement of Operations.
When-issued transactions
The Fund may purchase securities on a forward commitment or when-issued basis. The Fund records a when-issued transaction on the trade date and will segregate assets in an amount at least equal in value to the Fund’s commitment to purchase when-issued securities. Securities purchased on a when-issued basis are marked-to-market daily and the Fund begins earning interest on the settlement date. Losses may arise due to changes in the market value of the underlying securities or if the counterparty does not perform under the contract.
Futures contracts
The Fund is subject to interest rate risk in the normal course of pursuing its investment objectives. The Fund may buy and sell futures contracts in order to gain exposure to, or protect against, changes in security values and interest rates. The primary risks associated with the use of futures contracts are the imperfect correlation between changes in market values of securities held by the Fund and the prices of futures contracts, and the possibility of an illiquid market.
The aggregate principal amounts of the contracts are not recorded in the financial statements. Fluctuations in the value of the contracts are recorded in the Statement of Assets and Liabilities as an asset or liability and in the Statement of Operations as unrealized gains or losses until the contracts are closed, at which point they are recorded as net realized gains or losses on futures contracts. With futures contracts, there is minimal counterparty risk to the Fund since futures are exchange traded and the exchange’s clearinghouse, as counterparty to all exchange traded futures, guarantees the futures against default.
Security transactions and income recognition
Securities transactions are recorded on a trade date basis. Realized gains or losses are recorded on the basis of identified cost.
Interest income is accrued daily and bond discounts are accreted and premiums are amortized daily based on the effective interest method. To the extent debt obligations are placed on non-accrual status, any related interest income may be reduced by writing off interest receivables when the collection of all or a portion of interest has become doubtful based on consistently applied procedures. If the issuer subsequently resumes interest payments or when the collectability of interest is reasonably assured, the debt obligation is removed from non-accrual status.
| | | | | | |
| Notes to financial statements | | Wells Fargo Advantage High Yield Bond Fund | | | 25 | |
Dividend income is recognized on the ex-dividend date. Dividend income is recorded net of foreign taxes withheld where recovery of such taxes is not assured.
Distributions to shareholders
Distributions to shareholders from net investment income are accrued daily and paid monthly. Distributions from net realized gains, if any, are recorded on the ex-dividend date. Such distributions are determined in conformity with federal income tax regulations, which may differ in amount or character from net investment income and realized gains recognized for purposes of U.S. generally accepted accounting principles.
Federal and other taxes
The Fund intends to continue to qualify as a regulated investment company by distributing substantially all of its investment company taxable income and any net realized capital gains (after reduction for capital loss carryforwards) sufficient to relieve it from all, or substantially all, federal income taxes. Accordingly, no provision for federal income taxes was required.
The Fund’s income and federal excise tax returns and all financial records supporting those returns for the prior three fiscal years are subject to examination by the federal and Delaware revenue authorities. Management has analyzed the Fund’s tax positions taken on federal, state, and foreign tax returns for all open tax years and does not believe that there are any uncertain tax positions that require recognition of a tax liability.
Reclassifications are made to the Fund’s capital accounts for permanent tax differences to reflect income and gains available for distribution (or available capital loss carryforwards) under federal income tax regulations. U.S. generally accepted accounting principles require that certain components of net assets be adjusted to reflect permanent differences between financial and tax reporting. These reclassifications have no effect on net assets or net asset values per share. At August 31, 2015, as a result of permanent book-to-tax differences, the following reclassification adjustments were made on the Statement of Assets and Liabilities:
| | | | |
| Paid-in capital | | Overdistributed net
investment income | | Accumulated net
realized losses
on investments |
| $(60,861) | | $42,261 | | $18,600 |
As of August 31, 2015, the Fund had capital loss carryforwards available to offset future net realized capital gains in the amount of $53,607,343 with $16,356,651 expiring in 2016; and $37,250,692 expiring in 2017.
As of August 31, 2015, the Fund had current year deferred post-October capital losses consisting of $651,306 in short-term losses which will be recognized on the first day of the following fiscal year.
Class allocations
The separate classes of shares offered by the Fund differ principally in applicable sales charges, distribution, shareholder servicing, and administration fees. Class specific expenses are charged directly to that share class. Investment income, common expenses, and realized and unrealized gains (losses) on investments are allocated daily to each class of shares based on the relative proportion of net assets of each class.
3. FAIR VALUATION MEASUREMENTS
Fair value measurements of investments are determined within a framework that has established a fair value hierarchy based upon the various data inputs utilized in determining the value of the Fund’s investments. The three-level hierarchy gives the highest priority to unadjusted quoted prices in active markets for identical assets or liabilities (Level 1) and the lowest priority to significant unobservable inputs (Level 3). The Fund’s investments are classified within the fair value hierarchy based on the lowest level of input that is significant to the fair value measurement. The inputs are summarized into three broad levels as follows:
| n | | Level 1 – quoted prices in active markets for identical securities |
| n | | Level 2 – other significant observable inputs (including quoted prices for similar securities, interest rates, prepayment speeds, credit risk, use of amortized cost, etc.) |
| n | | Level 3 – significant unobservable inputs (including the Fund’s own assumptions in determining the fair value of investments) |
| | | | |
| 26 | | Wells Fargo Advantage High Yield Bond Fund | | Notes to financial statements |
The inputs or methodologies used for valuing investments in securities are not necessarily an indication of the risk associated with investing in those securities.
The following is a summary of the inputs used in valuing the Fund’s assets and liabilities as of August 31, 2015:
| | | | | | | | | | | | | | | | |
| | | Quoted prices
(Level 1) | | | Other significant
observable inputs
(Level 2) | | | Significant
unobservable inputs
(Level 3) | | | Total | |
Assets | | | | | | | | | | | | | | | | |
Investments in : | | | | | | | | | | | | | | | | |
| | | | |
Common stocks | | | | | | | | | | | | | | | | |
Consumer discretionary | | $ | 1,612,100 | | | $ | 0 | | | $ | 0 | | | $ | 1,612,100 | |
Consumer staples | | | 1,999,240 | | | | 0 | | | | 0 | | | | 1,999,240 | |
Energy | | | 760,800 | | | | 0 | | | | 0 | | | | 760,800 | |
Financials | | | 985,780 | | | | 0 | | | | 0 | | | | 985,780 | |
Health care | | | 4,154,040 | | | | 0 | | | | 0 | | | | 4,154,040 | |
Industrials | | | 662,400 | | | | 0 | | | | 0 | | | | 662,400 | |
Information technology | | | 3,915,760 | | | | 0 | | | | 0 | | | | 3,915,760 | |
Utilities | | | 6,905,740 | | | | 0 | | | | 0 | | | | 6,905,740 | |
| | | | |
Corporate bonds and notes | | | 0 | | | | 221,417,475 | | | | 0 | | | | 221,417,475 | |
| | | | |
Yankee corporate bonds and notes | | | 0 | | | | 11,103,483 | | | | 0 | | | | 11,103,483 | |
| | | | |
Short-term investments | | | | | | | | | | | | | | | | |
Investment companies | | | 3,067,086 | | | | 2,329,763 | | | | 0 | | | | 5,396,849 | |
Total assets | | $ | 24,062,946 | | | $ | 234,850,721 | | | $ | 0 | | | $ | 258,913,667 | |
The Fund recognizes transfers between levels within the fair value hierarchy at the end of the reporting period. At August 31, 2015, the Fund did not have any transfers into/out of Level 1, Level 2, or Level 3.
4. TRANSACTIONS WITH AFFILIATES
Management fee
Funds Management, an indirect wholly owned subsidiary of Wells Fargo & Company (“Wells Fargo”), is the manager of the Fund and provides advisory and fund-level administrative services under an investment management agreement. Under the investment management agreement, Funds Management is responsible for, among other services, implementing the investment objectives and strategies of the Fund, supervising the applicable subadviser, providing fund-level administrative services in connection with the Fund’s operations, and providing any other fund-level administrative services reasonably necessary for the operation of the Fund. As compensation for its services under the investment management agreement, Funds Management is entitled to receive an annual management fee starting at 0.55% and declining to 0.43% as the average daily net assets of the Fund increase.
Prior to July 1, 2015, Funds Management provided advisory services pursuant to an investment advisory agreement and was entitled to receive an annual fee which started at 0.50% and declined to 0.40% as the average daily net assets of the Fund increased. In addition, fund-level administrative services were provided by Funds Management under a separate administration agreement at an annual fee which started at 0.05% and declined to 0.03% as the average daily net assets of the Fund increased. For financial statement purposes, the advisory fee and fund-level administration fee for the year ended August 31, 2015 have been included in management fee on the Statement of Operations.
For the year ended August 31, 2015, the management fee was equivalent to an annual rate of 0.55% of the Fund’s average daily net assets.
Funds Management has retained the services of a subadviser to provide daily portfolio management to the Fund. The fee for subadvisory services is borne by Funds Management. WellsCap, an affiliate of Funds Management and an indirect wholly owned subsidiary of Wells Fargo, is the subadviser to the Fund and is entitled to receive a fee from Funds Management at an annual rate starting at 0.35% and declining to 0.20% as the average daily net assets of the Fund increase.
| | | | | | |
| Notes to financial statements | | Wells Fargo Advantage High Yield Bond Fund | | | 27 | |
Administration fees
Under a class-level administration agreement, Funds Management provides class-level administrative services to the Fund, which includes paying fees and expenses for services provided by the transfer agent, sub-transfer agents, omnibus account servicers and record-keepers. As compensation for its services under the class-level administration agreement, Funds Management receives an annual fee which is calculated based on the average daily net assets of each class as follows:
| | | | |
| | | Class-level
administration fee | |
Class A, Class B, Class C | | | 0.16 | % |
Administrator Class | | | 0.10 | |
Institutional Class | | | 0.08 | |
Funds Management has contractually waived and/or reimbursed management and administration fees to the extent necessary to maintain certain net operating expense ratios for the Fund. Waiver of fees and/or reimbursement of expenses by Funds Management were made first from fund level expenses on a proportionate basis and then from class specific expenses. Funds Management has committed through December 31, 2015 to waive fees and/or reimburse expenses to the extent necessary to cap the Fund’s expenses at 1.03% for Class A shares, 1.78% for Class B shares, 1.78% for Class C shares, 0.80% for Administrator Class shares and 0.70% for Institutional Class shares. After this time, the cap may be increased or the commitment to maintain the cap may be terminated only with the approval of the Board of Trustees.
Distribution fees
The Trust has adopted a distribution plan for Class B and Class C shares of the Fund pursuant to Rule 12b-1 under the 1940 Act. Distribution fees are charged to Class B and Class C shares and paid to Wells Fargo Funds Distributor, LLC (“Funds Distributor”), the principal underwriter, at an annual rate of 0.75% of the average daily net assets of Class B and Class C shares.
In addition, Funds Distributor is entitled to receive the front-end sales charge from the purchase of Class A shares and a contingent deferred sales charge on the redemption of certain Class A shares. Funds Distributor is also entitled to receive the contingent deferred sales charges from redemptions of Class B and Class C shares. For the year ended August 31, 2015, Funds Distributor received $4,217 from the sale of Class A shares.
Shareholder servicing fees
The Trust has entered into contracts with one or more shareholder servicing agents, whereby Class A, Class B, Class C and Administrator Class of the Fund is charged a fee at an annual rate of 0.25% of the average daily net assets of each respective class.
A portion of these total shareholder servicing fees were paid to affiliates of Wells Fargo.
5. INVESTMENT PORTFOLIO TRANSACTIONS
Purchases and sales of investments, excluding U.S. government obligations (if any) and short-term securities, for the year ended August 31, 2015 were $154,987,430 and $178,868,582, respectively.
6. DERIVATIVE TRANSACTIONS
During the year ended August 31, 2015, the Fund entered into futures contracts to speculate on interest rates and to help manage the duration of the portfolio.
As of August 31, 2015, the Fund did not have any open futures contracts. The Fund had an average notional amount of $1,515,190 in short futures contracts during the year ended August 31, 2015.
The realized losses and change in unrealized gains (losses) on futures contracts are reflected in the Statement of Operations.
7. BANK BORROWINGS
The Trust (excluding the money market funds and certain other funds in the Trust) and Wells Fargo Variable Trust are parties to a $150,000,000 revolving credit agreement, whereby the Fund is permitted to use bank borrowings for temporary or emergency purposes, such as to fund shareholder redemption requests. Interest under the credit agreement is charged to the Fund based on a borrowing rate equal to the higher of the Federal Funds rate in effect on
| | | | |
| 28 | | Wells Fargo Advantage High Yield Bond Fund | | Notes to financial statements |
that day plus 1.25% or the overnight LIBOR rate in effect on that day plus 1.25%. In addition, an annual commitment fee equal to 0.10% of the unused balance is allocated to each participating fund. For the year ended August 31, 2015, the Fund paid $545 in commitment fees.
For the year ended August 31, 2015, there were no borrowings by the Fund under the agreement.
8. DISTRIBUTIONS TO SHAREHOLDERS
The tax character of distributions paid was $11,159,999 and $13,382,372 of ordinary income for the years ended August 31, 2015 and August 31, 2014, respectively.
As of August 31, 2015, the components of distributable earnings on a tax basis were as follows:
| | | | |
Unrealized
losses | | Post-October
capital losses
deferred | | Capital loss
carryforward |
| $(9,261,387) | | $(651,306) | | $(53,607,343) |
9. INDEMNIFICATION
Under the Trust’s organizational documents, the officers and Trustees have been granted certain indemnification rights against certain liabilities that may arise out of performance of their duties to the Trust. Additionally, in the normal course of business, the Trust may enter into contracts with service providers that contain a variety of indemnification clauses. The Trust’s maximum exposure under these arrangements is dependent on future claims that may be made against the Fund and, therefore, cannot be estimated.
| | | | | | |
| Report of independent registered public accounting firm | | Wells Fargo Advantage High Yield Bond Fund | | | 29 | |
BOARD OF TRUSTEES AND SHAREHOLDERS OF WELLS FARGO FUNDS TRUST:
We have audited the accompanying statement of assets and liabilities, including the portfolio of investments, of the Wells Fargo Advantage High Yield Bond Fund (the “Fund”), one of the funds constituting the Wells Fargo Funds Trust, as of August 31, 2015, and the related statement of operations for the year then ended, the statements of changes in net assets for each of the years in the two-year period then ended, and the financial highlights for each of the years or periods in the five-year period then ended. These financial statements and financial highlights are the responsibility of the Fund’s management. Our responsibility is to express an opinion on these financial statements and financial highlights based on our audits.
We conducted our audits in accordance with the standards of the Public Company Accounting Oversight Board (United States). Those standards require that we plan and perform the audit to obtain reasonable assurance about whether the financial statements and financial highlights are free of material misstatement. An audit includes examining, on a test basis, evidence supporting the amounts and disclosures in the financial statements. Our procedures included confirmation of securities owned as of August 31, 2015, by correspondence with the custodian and brokers, or by other appropriate auditing procedures. An audit also includes assessing the accounting principles used and significant estimates made by management, as well as evaluating the overall financial statement presentation. We believe that our audits provide a reasonable basis for our opinion.
In our opinion, the financial statements and financial highlights referred to above present fairly, in all material respects, the financial position of the Wells Fargo Advantage High Yield Bond Fund as of August 31, 2015, the results of its operations for the year then ended, the changes in its net assets for each of the years in the two-year period then ended, and the financial highlights for each of the years or periods in the five-year period then ended, in conformity with U.S. generally accepted accounting principles.

Boston, Massachusetts
October 26, 2015
| | | | |
| 30 | | Wells Fargo Advantage High Yield Bond Fund | | Other information (unaudited) |
TAX INFORMATION
For corporate shareholders, pursuant to Section 854 of the Internal Revenue Code, 3.40% of ordinary income dividends qualify for the corporate dividends-received deduction for the fiscal year ended August 31, 2015.
Pursuant to Section 854 of the Internal Revenue Code, $414,632 of income dividends paid during the fiscal year ended August 31, 2015 has been designated as qualified dividend income (QDI).
For the fiscal year ended August 31, 2015, $9,999,236 has been designated as interest-related dividends for nonresident alien shareholders pursuant to Section 871 of the Internal Revenue Code.
PROXY VOTING INFORMATION
A description of the policies and procedures that the Fund uses to determine how to vote proxies relating to portfolio securities is available, upon request, by calling 1-800-222-8222, visiting our website at wellsfargoadvantagefunds.com, or visiting the SEC website at sec.gov. Information regarding how the Fund voted proxies relating to portfolio securities during the most recent 12-month period ended June 30 is available on the Fund’s website at wellsfargoadvantagefunds.com or by visiting the SEC website at sec.gov.
PORTFOLIO HOLDINGS INFORMATION
The complete portfolio holdings for the Fund are publicly available monthly on the Fund’s website (wellsfargoadvantagefunds.com), on a one-month delayed basis. In addition, top ten holdings information (excluding derivative positions) for the Fund is publicly available on the Fund’s website on a monthly, seven-day or more delayed basis. The Fund files its complete schedule of portfolio holdings with the SEC for the first and third quarters of each fiscal year on Form N-Q, which is available by visiting the SEC website at sec.gov. In addition, the Fund’s Form N-Q may be reviewed and copied at the SEC’s Public Reference Room in Washington, DC, and at regional offices in New York City, at 233 Broadway, and in Chicago, at 175 West Jackson Boulevard, Suite 900. Information about the Public Reference Room may be obtained by calling 1-800-SEC-0330.
| | | | | | |
| Other information (unaudited) | | Wells Fargo Advantage High Yield Bond Fund | | | 31 | |
BOARD OF TRUSTEES AND OFFICERS
Each of the Trustees and Officers1 listed in the table below acts in identical capacities for each fund in the Wells Fargo Advantage family of funds, which consists of 133 mutual funds comprising the Wells Fargo Funds Trust, Wells Fargo Variable Trust, Wells Fargo Master Trust and four closed-end funds (collectively the “Fund Complex”). This table should be read in conjunction with the Prospectus and the Statement of Additional Information2. The mailing address of each Trustee and Officer is 525 Market Street, 12th Floor, San Francisco, CA 94105. Each Trustee and Officer serves an indefinite term, however, each Trustee serves such term until reaching the mandatory retirement age established by the Trustees.
Independent Trustees
| | | | | | |
Name and
year of birth | | Position held and
length of service* | | Principal occupations during past five years or longer | | Other public company or
investment company
directorships during
past 5 years |
| William R. Ebsworth (Born 1957) | | Trustee, since 2015** | | Retired. From 1984 to 2013, equities analyst, portfolio manager, research director at Fidelity Management and Research Company and retired in 2013 as Chief Investment Officer of Fidelity Strategic Advisers, Inc. in Boston, Tokyo, and Hong Kong where he led a team of investment professionals managing client assets. Prior thereto, Board member of Hong Kong Securities Clearing Co., Hong Kong Options Clearing Corp., the Thailand International Fund, Ltd., Fidelity Investments Life Insurance Company, and Empire Fidelity Investments Life Insurance Company. Mr. Ebsworth is a CFA® charterholder and an Adjunct Lecturer, Finance, at Babson College. | | Asset Allocation Trust |
| Jane A. Freeman (Born 1953) | | Trustee, since 2015** | | Retired. From 2012 to 2014 and 1999 to 2008, Chief Financial Officer of Scientific Learning Corporation. From 2008 to 2012, Ms. Freeman provided consulting services related to strategic business projects. Prior to 1999, Portfolio Manager at Rockefeller & Co. and Scudder, Stevens & Clark. Board member of the Harding Loevner Funds from 1996 to 2014, serving as both Lead Independent Director and chair of the Audit Committee. Board member of the Russell Exchange Traded Funds Trust from 2011 to 2012 and the chair of the Audit Committee. Ms. Freeman is Chair of Taproot Foundation (non-profit organization), a Board Member of Ruth Bancroft Garden (non-profit organization) and an inactive chartered financial analyst. | | Asset Allocation Trust; Harding Loevner Funds; Russell Exchange Traded Funds Trust |
| Peter G. Gordon (Born 1942) | | Trustee, since 1998; Chairman, since 2005 | | Co-Founder, Retired Chairman, President and CEO of Crystal Geyser Water Company. Trustee Emeritus, Colby College. | | Asset Allocation Trust |
| Isaiah Harris, Jr. (Born 1952) | | Trustee, since 2009 | | Retired. Chairman of the Board of CIGNA Corporation since 2009, and Director since 2005. From 2003 to 2011, Director of Deluxe Corporation. Prior thereto, President and CEO of BellSouth Advertising and Publishing Corp. from 2005 to 2007, President and CEO of BellSouth Enterprises from 2004 to 2005 and President of BellSouth Consumer Services from 2000 to 2003. Emeritus member of the Iowa State University Foundation Board of Governors. Emeritus Member of the Advisory Board of Iowa State University School of Business. Advisory Board Member, Palm Harbor Academy (charter school). Mr. Harris is a certified public accountant. | | CIGNA Corporation; Asset Allocation Trust |
| Judith M. Johnson (Born 1949) | | Trustee, since 2008; Audit Committee Chairman, since 2008 | | Retired. Prior thereto, Chief Executive Officer and Chief Investment Officer of Minneapolis Employees Retirement Fund from 1996 to 2008. Ms. Johnson is an attorney, certified public accountant and a certified managerial accountant. | | Asset Allocation Trust |
| David F. Larcker (Born 1950) | | Trustee, since 2009 | | James Irvin Miller Professor of Accounting at the Graduate School of Business, Stanford University, Morgan Stanley Director of the Center for Leadership Development and Research and Senior Faculty of The Rock Center for Corporate Governance since 2006. From 2005 to 2008, Professor of Accounting at the Graduate School of Business, Stanford University. Prior thereto, Ernst & Young Professor of Accounting at The Wharton School, University of Pennsylvania from 1985 to 2005. | | Asset Allocation Trust |
| Olivia S. Mitchell (Born 1953) | | Trustee, since 2006 | | International Foundation of Employee Benefit Plans Professor, Wharton School of the University of Pennsylvania since 1993. Director of Wharton’s Pension Research Council and Boettner Center on Pensions & Retirement Research, and Research Associate at the National Bureau of Economic Research. Previously, Cornell University Professor from 1978 to 1993. | | Asset Allocation Trust |
| | | | |
| 32 | | Wells Fargo Advantage High Yield Bond Fund | | Other information (unaudited) |
| | | | | | |
Name and
year of birth | | Position held and
length of service* | | Principal occupations during past five years or longer | | Other public company or
investment company
directorships during
past 5 years |
| Timothy J. Penny (Born 1951) | | Trustee, since 1996 | | President and Chief Executive Officer of Southern Minnesota Initiative Foundation, a non-profit organization, since 2007 and Senior Fellow at the Humphrey Institute Policy Forum at the University of Minnesota since 1995. Member of the Board of Trustees of NorthStar Education Finance, Inc., a non-profit organization, since 2007. | | Asset Allocation Trust |
| Michael S. Scofield (Born 1943) | | Trustee, since 2010 | | Served on the Investment Company Institute’s Board of Governors and Executive Committee from 2008-2011 as well the Governing Council of the Independent Directors Council from 2006-2011 and the Independent Directors Council Executive Committee from 2008-2011. Chairman of the IDC from 2008-2010. Institutional Investor (Fund Directions) Trustee of Year in 2007. Trustee of the Evergreen Funds complex (and its predecessors) from 1984 to 2010. Chairman of the Evergreen Funds from 2000-2010. Former Trustee of the Mentor Funds. Retired Attorney, Law Offices of Michael S. Scofield. | | Asset Allocation Trust |
| Donald C. Willeke (Born 1940) | | Trustee, since 1996 | | Principal of the law firm of Willeke & Daniels. General Counsel of the Minneapolis Employees Retirement Fund from 1984 until its consolidation into the Minnesota Public Employees Retirement Association on June 30, 2010. Director and Vice Chair of The Tree Trust (non-profit corporation). Director of the American Chestnut Foundation (non-profit corporation). | | Asset Allocation Trust |
| * | Length of service dates reflect the Trustee’s commencement of service with the Trust’s predecessor entities, where applicable. |
| ** | William R. Ebsworth and Jane A. Freeman each became a Trustee effective January 1, 2015. |
Officers
| | | | | | |
Name and
year of birth | | Position held and
length of service | | Principal occupations during past five years or longer | | |
Karla M. Rabusch (Born 1959) | | President, since 2003 | | Executive Vice President of Wells Fargo Bank, N.A. and President of Wells Fargo Funds Management, LLC since 2003. | | |
Nancy Wiser1 (Born 1967) | | Treasurer, since 2012 | | Executive Vice President of Wells Fargo Funds Management, LLC since 2011. Chief Operating Officer and Chief Compliance Officer at LightBox Capital Management LLC, from 2008 to 2011. | | |
C. David Messman (Born 1960) | | Secretary, since 2000; Chief Legal Officer, since 2003 | | Senior Vice President and Secretary of Wells Fargo Funds Management, LLC since 2001. Assistant General Counsel of Wells Fargo Bank, N.A. since 2013 and Vice President and Managing Counsel of Wells Fargo Bank N.A. from 1996 to 2013. | | |
Debra Ann Early (Born 1964) | | Chief Compliance Officer, since 2007 | | Executive Vice President of Wells Fargo Funds Management, LLC since 2014, Senior Vice President and Chief Compliance Officer from 2007 to 2014. | | |
David Berardi (Born 1975) | | Assistant Treasurer, since 2009 | | Vice President of Wells Fargo Funds Management, LLC since 2009. Vice President of Evergreen Investment Management Company, LLC from 2008 to 2010. Manager of Fund Reporting and Control for Evergreen Investment Management Company, LLC from 2004 to 2010. | | |
Jeremy DePalma1 (Born 1974) | | Assistant Treasurer, since 2009 | | Senior Vice President of Wells Fargo Funds Management, LLC since 2009. Senior Vice President of Evergreen Investment Management Company, LLC from 2008 to 2010 and head of the Fund Reporting and Control Team within Fund Administration from 2005 to 2010. | | |
| 1 | Nancy Wiser acts as Treasurer of 72 funds in the Fund Complex. Jeremy DePalma acts as Treasurer of 61 funds and Assistant Treasurer of 72 funds in the Fund Complex. |
| 2 | The Statement of Additional Information includes additional information about the Trustees and is available, without charge, upon request, by calling 1-800-222-8222 or by visiting the website at wellsfargoadvantagefunds.com. |
| | | | | | |
| Other information (unaudited) | | Wells Fargo Advantage High Yield Bond Fund | | | 33 | |
BOARD CONSIDERATION OF INVESTMENT ADVISORY, INVESTMENT MANAGEMENT AND SUB-ADVISORY AGREEMENTS:
Under the Investment Company Act of 1940 (the “1940 Act”), the Board of Trustees (the “Board”) of Wells Fargo Funds Trust (the “Trust”) must determine annually whether to approve the continuation of the Trust’s investment advisory and sub-advisory agreements. In this regard, at an in-person meeting held on May 19-20, 2015 (the “Meeting”), the Board, all the members of which have no direct or indirect interest in the investment advisory and sub-advisory agreements and are not “interested persons” of the Trust, as defined in the 1940 Act (the “Independent Trustees”), reviewed and approved for Wells Fargo Advantage High Yield Bond Fund (the “Fund”): (i) an investment advisory agreement (the “Advisory Agreement”) with Wells Fargo Funds Management, LLC (“Funds Management”); (ii) an investment management agreement (the “Management Agreement”) with Funds Management; and (iii) an investment sub-advisory agreement (the “Sub-Advisory Agreement”) with Wells Capital Management Incorporated (the “Sub-Adviser”), an affiliate of Funds Management. The Management Agreement combines the terms of the Advisory Agreement with the terms of the Fund’s Amended and Restated Administration Agreement (the “Administration Agreement”) applicable to Fund-level administrative services. The Advisory Agreement, the Management Agreement and the Sub-Advisory Agreement are collectively referred to as the “Advisory Agreements.”
At the Meeting, the Board considered the factors and reached the conclusions described below relating to the selection of Funds Management and the Sub-Adviser and the approval of the Advisory Agreements. Prior to the Meeting, including at an in-person meeting in March 2015, the Trustees conferred extensively among themselves and with representatives of Funds Management about these matters. Also, the Board has adopted a team-based approach, with each team consisting of a sub-set of Trustees, to assist the full Board in the discharge of its duties in reviewing performance and other matters throughout the year. The Independent Trustees were assisted in their evaluation of the Advisory Agreements by independent legal counsel, from whom they received separate legal advice and with whom they met separately.
In providing information to the Board, Funds Management and the Sub-Adviser were guided by a detailed set of requests for information submitted to them by independent legal counsel on behalf of the Independent Trustees at the start of the Board’s annual contract renewal process earlier in 2015. In considering and approving the Advisory Agreements, the Trustees considered the information they believed relevant, including but not limited to the information discussed below. The Board considered not only the specific information presented in connection with the Meeting, but also the knowledge gained over time through interaction with Funds Management and the Sub-Adviser about various topics. In this regard, the Board reviewed reports of Funds Management at each of its quarterly meetings, which included, among other things, portfolio reviews and performance reports. In addition, the Board and the teams mentioned above confer with portfolio managers at various times throughout the year. The Board did not identify any particular information or consideration that was all-important or controlling, and each individual Trustee may have attributed different weights to various factors.
After its deliberations, the Board unanimously approved the continuation of the Advisory Agreement for the period from June 1, 2015 through June 30, 2015, approved the Management Agreement for the period from July 1, 2015 through May 31, 2016, and approved the continuation of the Sub-Advisory Agreement for a one-year term through May 31, 2016. The Board also determined that the compensation payable to Funds Management and the Sub-Adviser under each of the Advisory Agreements was reasonable. The Board considered the approval of the Advisory Agreements for the Fund as part of its consideration of agreements for funds across the complex, but its approvals were made on a fund-by-fund basis. The following summarizes a number of important, but not necessarily all, factors considered by the Board in support of its approvals.
Nature, extent and quality of services
The Board received and considered various information regarding the nature, extent and quality of services provided to the Fund by Funds Management and the Sub-Adviser under the Advisory Agreements. This information included, among other things, a summary of the background and experience of senior management of Funds Management, and the qualifications, background, tenure and responsibilities of each of the portfolio managers primarily responsible for the day-to-day portfolio management of the Fund. The Board noted that the services to be provided to the Fund pursuant to the Management Agreement combined the advisory services previously provided to the Fund pursuant to the Fund’s Advisory Agreement with the Fund-level administrative services previously provided to the Fund pursuant to the Fund’s Administration Agreement. The Board received a representation from Funds Management that combining these services would not result in any change to the nature or level of services provided by Funds Management to the Fund.
The Board evaluated the ability of Funds Management and the Sub-Adviser to attract and retain qualified investment professionals, including research, advisory and supervisory personnel. The Board further considered the compliance
| | | | |
| 34 | | Wells Fargo Advantage High Yield Bond Fund | | Other information (unaudited) |
programs and compliance records of Funds Management and the Sub-Adviser. In addition, the Board took into account the full range of services provided to the Fund by Funds Management and its affiliates.
Fund performance and expenses
The Board considered the performance results for the Fund over various time periods ended March 31, 2015. The Board considered these results in comparison to the performance of funds in a universe that was determined by Lipper Inc. (“Lipper”) to be similar to the Fund (the “Universe”), and in comparison to the Fund’s benchmark index and to other comparative data. Lipper is an independent provider of investment company data. The Board received a description of the methodology used by Lipper to select the mutual funds in the performance Universe. The Board noted that the performance of the Fund (Administrator Class) was higher than the average performance of the Universe for all periods under review. The Board also noted that the performance of the Fund was higher than its benchmark, the BofAML US High Yield Master II Constrained Index, for the one-year period under review and lower than its benchmark for all other periods under review.
The Board also received and considered information regarding the Fund’s net operating expense ratios and their various components, including actual management fees (which reflect fee waivers, if any, and include advisory, administration and transfer agent fees), custodian and other non-management fees, and Rule 12b-1 and non-Rule 12b-1 service fees. The Board considered these ratios in comparison to the median ratios of funds in class-specific expense groups that were determined by Lipper to be similar to the Fund (the “Groups”). The Board received a description of the methodology used by Lipper to select the mutual funds in the expense Groups and an explanation of how funds comprising expense groups and their expense ratios may vary from year-to-year. Based on the Lipper reports, the Board noted that the net operating expense ratios of the Fund were lower than the median net operating expense ratios of the expense Groups.
The Board took into account the Fund performance and expense information provided to it among the factors considered in deciding to re-approve the Advisory Agreement and Sub-Advisory Agreement and approve the Management Agreement.
Investment advisory and sub-advisory fee rates
The Board reviewed and considered the contractual investment advisory fee rates that are payable by the Fund to Funds Management for investment advisory services (the “Advisory Agreement Rates”), both on a stand-alone basis and on a combined basis with the Fund’s fund-level and class-level contractual administration fee rates (the “Management Rates”). The Board noted that the Management Rates include transfer agency and sub-transfer agency costs. The Board also noted that the fee rate to be paid by the Fund under the Management Agreement will incorporate the advisory fee and Fund-level administration fee previously payable separately by the Fund under the Fund’s Advisory Agreement and Administration Agreement with Funds Management. The Board also reviewed and considered the contractual investment sub-advisory fee rates that are payable by Funds Management to the Sub-Adviser for investment sub-advisory services (the “Sub-Advisory Agreement Rates”).
Among other information reviewed by the Board was a comparison of the Management Rates of the Fund with those of other funds in the expense Groups at a common asset level. The Board noted that the Management Rates of the Fund were lower than the average rates for the Fund’s expense Groups for all share classes.
The Board also received and considered information about the portion of the total advisory fee that was retained by Funds Management after payment of the fee to the Sub-Adviser for sub-advisory services. In assessing the reasonableness of this amount, the Board received and evaluated information about the nature and extent of responsibilities retained and risks assumed by Funds Management and not delegated to or assumed by the Sub-Adviser, and about Funds Management’s on-going oversight services. However, given the affiliation between Funds Management and the Sub-Adviser, the Board ascribed limited relevance to the allocation of the advisory fee between them.
The Board also received and considered information about the nature and extent of services offered and fee rates charged by Funds Management and the Sub-Adviser to other types of clients with investment strategies similar to those of the Fund. In this regard, the Board received information about the significantly greater scope of services, and compliance, reporting and other legal burdens and risks of managing mutual funds compared with those associated with managing assets of non-mutual fund clients such as collective funds or institutional separate accounts.
Based on its consideration of the factors and information it deemed relevant, including those described here, the Board determined that the compensation payable to Funds Management under the Management Agreement and Advisory Agreement and to the Sub-Adviser under the Sub-Advisory Agreement was reasonable, in light of the services covered by the Advisory Agreements.
| | | | | | |
| Other information (unaudited) | | Wells Fargo Advantage High Yield Bond Fund | | | 35 | |
Profitability
The Board received and considered information concerning the profitability of Funds Management, as well as the profitability of Wells Fargo as a whole, from providing services to the Fund and the fund family as a whole. The Board also received and considered information concerning the profitability of the Sub-Adviser from providing services to the fund family as a whole, noting that the Sub-Adviser’s profitability information with respect to providing services to the Fund was subsumed in the Wells Fargo profitability analysis.
Funds Management reported on the methodologies and estimates used in calculating profitability. Among other things, the Board noted that the levels of profitability reported on a fund-by-fund basis varied widely, depending on factors such as the size and type of fund. Based on its review, the Board did not deem the profits reported by Funds Management or Wells Fargo from its services to the Fund to be at a level that would prevent it from approving the continuation of the Advisory Agreements.
Economies of scale
With respect to possible economies of scale, the Board noted the existence of breakpoints in the Fund’s advisory and management fee structures, and the Fund’s administration fee structure, which operate generally to reduce the Fund’s expense ratios as the Fund grows in size. It considered that, for a small fund or a fund that shrinks in size, breakpoints conversely can result in higher fee levels. The Board also considered that fee waiver and expense reimbursement arrangements and competitive fee rates at the outset are means of sharing potential economies of scale with shareholders of the Fund and the fund family as a whole. The Board considered Funds Management’s view that any analyses of potential economies of scale in managing a particular fund are inherently limited in light of the joint and common costs and investments that Funds Management incurs across the fund family as a whole.
The Board concluded that the Fund’s fee and expense arrangements, including contractual breakpoints, constituted a reasonable approach to sharing potential economies of scale with the Fund and its shareholders.
Other benefits to Funds Management and the Sub-Adviser
The Board received and considered information regarding potential “fall-out” or ancillary benefits received by Funds Management and its affiliates, including the Sub-Adviser, as a result of their relationships with the Fund. Ancillary benefits could include, among others, benefits directly attributable to other relationships with the Fund and benefits potentially derived from an increase in Funds Management’s and the Sub-Adviser’s business as a result of their relationships with the Fund. The Board noted that various affiliates of Funds Management may receive distribution-related fees, shareholder servicing payments and sub-transfer agency fees in respect of shares sold or held through them and services provided.
The Board also reviewed information about soft dollar credits earned and utilized by the Sub-Adviser, fees earned by Funds Management and the Sub-Adviser from managing a private investment vehicle for the fund family’s securities lending collateral and commissions earned by an affiliated broker from portfolio transactions.
Based on its consideration of the factors and information it deemed relevant, including those described here, the Board did not find that any ancillary benefits received by Funds Management and its affiliates, including the Sub-Adviser, were unreasonable.
Conclusion
At the Meeting, after considering the above-described factors and based on its deliberations and its evaluation of the information described above, the Board unanimously approved the continuation of the Advisory Agreement for the period from June 1, 2015 through June 30, 2015, approved the Management Agreement for the period from July 1, 2015 through May 31, 2016, and approved the continuation of the Sub-Advisory Agreement for a one-year term through May 31, 2016. The Board also determined that the compensation payable to Funds Management and the Sub-Adviser under each of the Advisory Agreements was reasonable.
| | | | |
| 36 | | Wells Fargo Advantage High Yield Bond Fund | | List of abbreviations |
The following is a list of common abbreviations for terms and entities that may have appeared in this report.
| ACA | — ACA Financial Guaranty Corporation |
| ADR | — American depositary receipt |
| ADS | — American depositary shares |
| AGC | — Assured Guaranty Corporation |
| AGM | — Assured Guaranty Municipal |
| Ambac | — Ambac Financial Group Incorporated |
| AMT | — Alternative minimum tax |
| BAN | — Bond anticipation notes |
| BHAC | — Berkshire Hathaway Assurance Corporation |
| CAB | — Capital appreciation bond |
| CCAB | — Convertible capital appreciation bond |
| CDA | — Community Development Authority |
| CDO | — Collateralized debt obligation |
| DRIVER | — Derivative inverse tax-exempt receipts |
| DW&P | — Department of Water & Power |
| DWR | — Department of Water Resources |
| ECFA | — Educational & Cultural Facilities Authority |
| EDA | — Economic Development Authority |
| EDFA | — Economic Development Finance Authority |
| ETF | — Exchange-traded fund |
| FDIC | — Federal Deposit Insurance Corporation |
| FFCB | — Federal Farm Credit Banks |
| FGIC | — Financial Guaranty Insurance Corporation |
| FHA | — Federal Housing Administration |
| FHLB | — Federal Home Loan Bank |
| FHLMC | — Federal Home Loan Mortgage Corporation |
| FICO | — The Financing Corporation |
| FNMA | — Federal National Mortgage Association |
| GDR | — Global depositary receipt |
| GNMA | — Government National Mortgage Association |
| HCFR | — Healthcare facilities revenue |
| HEFA | — Health & Educational Facilities Authority |
| HEFAR | — Higher education facilities authority revenue |
| HFA | — Housing Finance Authority |
| HFFA | — Health Facilities Financing Authority |
| HUD | — Department of Housing and Urban Development |
| IDA | — Industrial Development Authority |
| IDAG | — Industrial Development Agency |
| KRW | — Republic of Korea won |
| LIBOR | — London Interbank Offered Rate |
| LIFER | — Long Inverse Floating Exempt Receipts |
| LLC | — Limited liability company |
| LLLP | — Limited liability limited partnership |
| LLP | — Limited liability partnership |
| MBIA | — Municipal Bond Insurance Association |
| MFHR | — Multifamily housing revenue |
| MSTR | — Municipal securities trust receipts |
| MUD | — Municipal Utility District |
| National | — National Public Finance Guarantee Corporation |
| PCFA | — Pollution Control Financing Authority |
| PCL | — Public Company Limited |
| PCR | — Pollution control revenue |
| PFA | — Public Finance Authority |
| PFFA | — Public Facilities Financing Authority |
| PFOTER | — Puttable floating option tax-exempt receipts |
| plc | — Public limited company |
| PUTTER | — Puttable tax-exempt receipts |
| R&D | — Research & development |
| Radian | — Radian Asset Assurance |
| RAN | — Revenue anticipation notes |
| RDA | — Redevelopment Authority |
| RDFA | — Redevelopment Finance Authority |
| REIT | — Real estate investment trust |
| ROC | — Reset option certificates |
| SAVRS | — Select auction variable rate securities |
| SBA | — Small Business Authority |
| SDR | — Swedish depositary receipt |
| SFHR | — Single-family housing revenue |
| SFMR | — Single-family mortgage revenue |
| SPA | — Standby purchase agreement |
| SPDR | — Standard & Poor’s Depositary Receipts |
| SPEAR | — Short Puttable Exempt Adjustable Receipts |
| STRIPS | — Separate trading of registered interest and |
| TAN | — Tax anticipation notes |
| TIPS | — Treasury inflation-protected securities |
| TRAN | — Tax revenue anticipation notes |
| TTFA | — Transportation Trust Fund Authority |
| TVA | — Tennessee Valley Authority |


For more information
More information about Wells Fargo Advantage Funds is available free upon request. To obtain literature, please write, email, visit the Fund’s website, or call:
Wells Fargo Advantage Funds
P.O. Box 8266
Boston, MA 02266-8266
Email: wfaf@wellsfargo.com
Website: wellsfargoadvantagefunds.com
Individual investors: 1-800-222-8222
Retail investment professionals: 1-888-877-9275
Institutional investment professionals: 1-866-765-0778
This report and the financial statements contained herein are submitted for the general information of the shareholders of Wells Fargo Advantage Funds. If this report is used for promotional purposes, distribution of the report must be accompanied or preceded by a current prospectus. Before investing, please consider the investment objectives, risks, charges, and expenses of the investment. For a current prospectus and, if available, a summary prospectus, containing this information, call 1-800-222-8222 or visit the Fund’s website at wellsfargoadvantagefunds.com. Read the prospectus carefully before you invest or send money.
Wells Fargo Funds Management, LLC, a wholly owned subsidiary of Wells Fargo & Company, provides investment advisory and administrative services for Wells Fargo Advantage Funds. Other affiliates of Wells Fargo & Company provide subadvisory and other services for the Funds. The Funds are distributed by Wells Fargo Funds Distributor, LLC, Member FINRA, an affiliate of Wells Fargo & Company.
NOT FDIC INSURED ¡ NO BANK GUARANTEE ¡ MAY LOSE VALUE
© 2015 Wells Fargo Funds Management, LLC. All rights reserved.
| | |
 | | 236804 10-15 A218/AR218 08-15 |

Wells Fargo Advantage Income Plus Fund

Annual Report
August 31, 2015

Reduce clutter. Save trees.
Sign up for electronic delivery of prospectuses and shareholder reports at wellsfargo.com/advantagedelivery
Contents
The views expressed and any forward-looking statements are as of August 31, 2015, unless otherwise noted, and are those of the Fund managers and/or Wells Fargo Funds Management, LLC. Discussions of individual securities, or the markets generally, or any Wells Fargo Advantage Fund are not intended as individual recommendations. Future events or results may vary significantly from those expressed in any forward-looking statements; the views expressed are subject to change at any time in response to changing circumstances in the market. Wells Fargo Funds Management, LLC and the Fund disclaim any obligation to publicly update or revise any views expressed or forward-looking statements.
NOT FDIC INSURED ¡ NO BANK GUARANTEE ¡ MAY LOSE VALUE
| | | | |
| 2 | | Wells Fargo Advantage Income Plus Fund | | Letter to shareholders (unaudited) |

Karla M. Rabusch
President
Wells Fargo Advantage Funds
Major central banks continued to inject liquidity into global banks and markets through various accommodative monetary policies, including quantitative easing.
Dear Valued Shareholder:
We are pleased to offer you this annual report for the Wells Fargo Advantage Income Plus Fund for the 12-month period that ended August 31, 2015. The period was marked by low interest rates, low oil prices, and moderate U.S. economic growth. Short-term investment-grade bonds, as measured by the Barclays U.S. 1–3 Year Government/Credit Bond Index1 returned 0.81% during the period. Meanwhile, strong demand for high-quality, liquid assets kept returns on Treasury bills more modest; the Barclays 6-Month Treasury Bill Index2 returned 0.15% during the period.
Major central banks continued to provide stimulus.
Major central banks continued to inject liquidity into global banks and markets through various accommodative monetary policies, including quantitative easing. In the U.S., the Federal Reserve (Fed) kept its key interest rate near zero in order to support the economy and the financial system. However, it set expectations for it to begin normalizing monetary policy with higher target ranges for the federal funds rate.
Meanwhile, European markets continued to benefit from the European Central Bank’s (ECB’s) willingness to maintain low interest rates. In addition to its targeted longer-term refinancing operations that are designed to increase bank lending, the ECB expanded its quantitative easing program to include the purchase of eurozone government bonds. In Japan, the Bank of Japan maintained an aggressive monetary program aimed at combating deflation.
Economic growth was moderate, and oil prices plummeted.
U.S. economic growth advanced during the reporting period, the unemployment rate ticked lower to 5.1% as of August 2015, and inflation remained below the Fed’s longer-run objective of a 2% pace. The period was also marked by lower oil prices, which began the reporting period near $90 per barrel but declined to $46 per barrel at the end of August 2015. While lower oil prices benefited consumers of oil products, the lower prices pressured companies within the energy sector.
Bond yields rose but remained low by historical standards.
Short-term interest rates increased during the reporting period, with a flattening in the shape of the short-term yield curve. During this time frame, 1-year Treasury bills rose 29 basis points (bps; 100 bps equals 1.00%) to yield 0.38%, 2-year Treasury note yields rose 21 bps to yield 0.74%, and 3-year Treasury note yields rose only 8 bps to yield 1.05%. Meanwhile, ultra-short-term yields were little changed at ultralow levels, anchored by the easy monetary policy.
Since the end of the financial crisis, structural changes in the fixed-income markets have reduced trading liquidity (the degree to which assets can be bought or sold without affecting the price). New regulations and capital requirements have caused traditional liquidity suppliers (banks and broker/dealers) to be more risk-averse and hold less inventory. Meanwhile, corporate-debt issuance has spiked as companies finance themselves at record-low yields, bond mutual funds
| 1 | The Barclays U.S. 1–3 Year Government/Credit Bond Index is the one- to three-year component of the Barclays U.S. Government/Credit Bond Index that includes securities in the Government and Credit Indexes. The Government Index includes Treasuries (that is, public obligations of the U.S. Treasury that have remaining maturities of more than one year) and agencies (that is, publicly issued debt of U.S. government agencies, quasi-federal corporations, and corporate or foreign debt guaranteed by the U.S. government). The Credit Index includes publicly issued U.S. corporate and foreign debentures and secured notes that meet specified maturity, liquidity, and quality requirements. You cannot invest directly in an index. |
| 2 | The Barclays 6-Month Treasury Bill Index tracks the performance and attributes of recently issued 6-month U.S. Treasury bills. The index follows Barclays’ monthly rebalancing conventions. You cannot invest directly in an index. |
| | | | | | |
| Letter to shareholders (unaudited) | | Wells Fargo Advantage Income Plus Fund | | | 3 | |
hold larger amounts of this new debt supply, trading volumes are lower, and large-size trades are more difficult to execute. However, fixed-income markets appear to have functioned well over the past year with sufficient liquidity and muted volatility.
Don’t let short-term uncertainty derail long-term investment goals.
Periods of uncertainty can present challenges, but experience has taught us that maintaining long-term investment goals can be an effective way to plan for the future. To help you create a sound strategy based on your personal goals and risk tolerance, Wells Fargo Advantage Funds offers more than 100 mutual funds spanning a wide range of asset classes and investment styles. Although diversification cannot guarantee an investment profit or prevent losses, we believe it can be an effective way to manage investment risk and potentially smooth out overall portfolio performance. We encourage investors to know their investments and to understand that appropriate levels of risk-taking may unlock opportunities.
Thank you for choosing to invest in Wells Fargo Advantage Funds. We appreciate your confidence in us and remain committed to helping you meet your financial needs.
Sincerely,

Karla M. Rabusch
President
Wells Fargo Advantage Funds
Periods of uncertainty can present challenges, but experience has taught us that maintaining long-term investment goals can be an effective way to plan for the future.
Notice to shareholders
At a meeting held on August 11–12, 2015, the Board of Trustees of the Fund approved a change in the name of the Fund whereby the word “Advantage” will be removed from its name, effective December 15, 2015.
For current information about your fund investments, contact your investment professional, visit our website at wellsfargoadvantagefunds.com, or call us directly at 1-800-222-8222. We are available 24 hours a day, 7 days a week.
| | | | |
| 4 | | Wells Fargo Advantage Income Plus Fund | | Performance highlights (unaudited) |
Investment objective
The Fund seeks total return, consisting of current income and capital appreciation.
Manager
Wells Fargo Funds Management, LLC
Subadviser
Wells Capital Management Incorporated
Portfolio managers
Ashok Bhatia, CFA
Christopher Y. Kauffman, CFA
Thomas M. Price, CFA
Janet Rilling CFA, CPA
Noah Wise, CFA
Average annual total returns1 (%) as of August 31, 2015
| | | | | | | | | | | | | | | | | | | | | | | | | | | | | | | | | | |
| | | | | Including sales charge | | | Excluding sales charge | | | Expense ratios2 (%) | �� |
| | | Inception date | | 1 year | | | 5 year | | | 10 year | | | 1 year | | | 5 year | | | 10 year | | | Gross | | | Net3 | |
| Class A (STYAX) | | 7-13-1998 | | | (3.53 | ) | | | 2.56 | | | | 4.65 | | | | 1.04 | | | | 3.51 | | | | 5.14 | | | | 0.94 | | | | 0.85 | |
| Class B (STYBX)* | | 7-13-1998 | | | (4.61 | ) | | | 2.40 | | | | 4.59 | | | | 0.39 | | | | 2.76 | | | | 4.59 | | | | 1.69 | | | | 1.60 | |
| Class C (WFIPX) | | 7-13-1998 | | | (0.65 | ) | | | 2.74 | | | | 4.36 | | | | 0.35 | | | | 2.74 | | | | 4.36 | | | | 1.69 | | | | 1.60 | |
| Administrator Class (WIPDX) | | 7-30-2010 | | | – | | | | – | | | | – | | | | 1.15 | | | | 3.64 | | | | 5.20 | | | | 0.88 | | | | 0.73 | |
| Institutional Class (WIPIX) | | 7-18-2008 | | | – | | | | – | | | | – | | | | 1.37 | | | | 3.84 | | | | 5.37 | | | | 0.61 | | | | 0.59 | |
| Investor Class (WIPNX) | | 7-18-2008 | | | – | | | | – | | | | – | | | | 1.10 | | | | 3.50 | | | | 5.13 | | | | 0.97 | | | | 0.86 | |
| Barclays U.S. Universal Bond Index4 | | – | | | – | | | | – | | | | – | | | | 1.13 | | | | 3.34 | | | | 4.66 | | | | – | | | | – | |
| * | | Class B shares are closed to investment, except in connection with the reinvestment of any distributions and permitted exchanges. |
Figures quoted represent past performance, which is no guarantee of future results, and do not reflect taxes that a shareholder may pay on fund distributions or the redemption of fund shares. Investment return and principal value of an investment will fluctuate so that an investor’s shares, when redeemed, may be worth more or less than their original cost. Performance shown without sales charges would be lower if sales charges were reflected. Current performance may be lower or higher than the performance data quoted, which assumes the reinvestment of dividends and capital gains. Current month-end performance is available on the Fund’s website, wellsfargoadvantagefunds.com.
Index returns do not include transaction costs associated with buying and selling securities, any mutual fund fees or expenses, or any taxes. It is not possible to invest directly in an index.
For Class A shares, the maximum front-end sales charge is 4.50%. For Class B shares, the maximum contingent deferred sales charge is 5.00%. For Class C shares, the maximum contingent deferred sales charge is 1.00%. Performance including a contingent deferred sales charge assumes the sales charge for the corresponding time period. Administrator Class, Institutional Class, and Investor Class shares are sold without a front-end sales charge or contingent deferred sales charge.
Bond values fluctuate in response to the financial condition of individual issuers, general market and economic conditions, and changes in interest rates. Changes in market conditions and government policies may lead to periods of heightened volatility in the bond market and reduced liquidity for certain bonds held by the Fund. In general, when interest rates rise, bond values fall and investors may lose principal value. Interest-rate changes and their impact on the Fund and its share price can be sudden and unpredictable. Loans are subject to risks similar to those associated with other below-investment-grade bond investments, such as credit risk (for example, risk of issuer default), below-investment-grade bond risk (for example, risk of greater volatility in value), and risk that the loan may become illiquid or difficult to price. The use of derivatives may reduce returns and/or increase volatility. Certain investment strategies tend to increase the total risk of an investment (relative to the broader market). The Fund is exposed to foreign investment risk, high-yield securities risk, and mortgage and asset-backed securities risk. Consult the Fund’s prospectus for additional information on these and other risks.
Please see footnotes on page 5.
| | | | | | |
| Performance highlights (unaudited) | | Wells Fargo Advantage Income Plus Fund | | | 5 | |
|
| Growth of $10,000 investment5 as of August 31, 2015 |
|

|
| 1 | Historical performance shown for Administrator Class shares prior to their inception reflects the performance of Institutional Class shares and has been adjusted to include the higher expenses applicable to Administrator Class shares. Historical performance shown for Institutional Class shares prior to their inception reflects the performance of Class A shares and includes the higher expenses applicable to Class A shares. Historical performance shown for Investor Class shares prior to their inception reflects the performance of Class A shares and has been adjusted to include the higher expenses applicable to Investor Class shares. If these expenses had not been included, returns would have been higher. |
| 2 | Reflects the expense ratios as stated in the most recent prospectuses, which include the impact of 0.01% in acquired fund fees and expenses. The expense ratios shown are subject to change and may differ from the annualized expense ratios shown in the financial highlights of this report, which do not include acquired fund fees and expenses. |
| 3 | The manager has contractually committed through December 31, 2015, to waive fees and/or reimburse expenses to the extent necessary to cap the Fund’s Total Annual Fund Operating Expenses After Fee Waiver at 0.84% for Class A, 1.59% for Class B, 1.59% for Class C, 0.72% for Administrator Class, 0.58% for Institutional Class, and 0.85% for Investor Class. After this time, the cap may be increased or the commitment to maintain the cap may be terminated only with the approval of the Board of Trustees. Brokerage commissions, stamp duty fees, interest, taxes, acquired fund fees and expenses, and extraordinary expenses are excluded from the cap. Without this cap, the Fund’s returns would have been lower. |
| 4 | The Barclays U.S. Universal Bond Index is an unmanaged market value-weighted performance benchmark for the U.S. dollar-denominated bond market, which includes investment-grade, high yield, and emerging market debt securities with maturities of one year or more. You cannot invest directly in an index. |
| 5 | The chart compares the performance of Class A shares for the most recent 10 years with the performance of the Barclays U.S. Universal Bond Index. The chart assumes a hypothetical investment of $10,000 in Class A shares and reflects all operating expenses and assumes the maximum initial sales charge of 4.50%. |
| 6 | The ten largest holdings, excluding cash and cash equivalents, are calculated based on the value of the investments divided by total net assets of the Fund. Holdings are subject to change and may have changed since the date specified. |
| 7 | Amounts are calculated based on the total long-term investments of the Fund. These amounts are subject to change and may have changed since the date specified. |
| | | | |
| 6 | | Wells Fargo Advantage Income Plus Fund | | Performance highlights (unaudited) |
MANAGER’S DISCUSSION
Fund highlights
| n | | The Fund underperformed its benchmark, the Barclays U.S. Universal Bond Index, for the 12-month period that ended August 31, 2015. |
| n | | The Fund was overweight high yield credit which hurt performance, especially the underperforming industrials sector. An underweight to U.S. Treasuries was also a detractor during the period. |
| n | | Positive yield spread from mortgage-related securities (relative to U.S. Treasuries) contributed to performance given the Funds’ overweight during the period, as did an underweight to sovereign securities. |
| | | | |
| Ten largest holdings6 (%) as of August 31, 2015 | |
U.S. Treasury Note, 2.25%, 7-31-2018 | | | 3.33 | |
FNMA, 4.50%, 9-14-2045 | | | 3.13 | |
FNMA, 3.00%, 9-14-2045 | | | 2.98 | |
GNMA, 3.50%, 9-21-2045 | | | 2.92 | |
FNMA, 4.00%, 9-14-2045 | | | 2.54 | |
U.S. Treasury Note, 1.00%, 8-31-2016 | | | 2.50 | |
FHLMC, 3.50%, 9-14-2045 | | | 2.38 | |
U.S. Treasury Note, 0.25%, 12-15-2015 | | | 2.08 | |
U.S. Treasury Note, 1.00%, 5-31-2018 | | | 1.89 | |
FNMA, 3.50%, 9-14-2045 | | | 1.85 | |
The economic climate remained benign.
The U.S. economy featured trend-like growth, a steadily improving labor market, and generally stable inflation over the past 12 months. Real gross domestic product growth averaged about 2.7% in the most recent four quarters, as personal income gains supported consumption. In contrast, business investment softened, in part due to weakness in the energy industry brought on by a collapse in global oil prices.
The labor market continued to tighten over the past 12 months, as evidenced by a full percentage point decline in the unemployment rate to 5.1%. Nonfarm payrolls expanded at an average pace of about 240,000 per month over the period. Following a
persistent theme of this economic expansion, some of the improvement in the unemployment rate can be attributed to a decline in the labor force participation rate, which fell to 62.6% at the end of the period versus 62.8% a year ago.
The inflationary environment was mixed over the past 12 months, as the drop in oil prices pushed the year-over-year change in headline inflation down to 0.2% compared with a 1.7% headline inflation rate a year ago. Excluding food and energy, however, inflation rose 1.8%, which is basically in line with the average rate of core inflation over the past five years.
During the reporting period, the Federal Reserve’s (the Fed’s) monetary policy transitioned from maximum accommodation to the possible beginning of a tightening cycle. The Federal Open Market Committee (FOMC)—the Fed’s policymaking committee—completed its third round of asset purchases in the fourth quarter of 2014, though the Fed continued to reinvest the proceeds of maturing principal and interest payments from its existing portfolio. The Fed’s overnight rate targets remained unchanged throughout the period, with the key federal funds rate held to a range of 0.00% to 0.25%. There is a possibility that an initial hike in the target range will occur before the end of 2015, to be followed by a gradual normalization of monetary policy (as opposed to the loose monetary policy of recent years).
Please see footnotes on page 5.
| | | | | | |
| Performance highlights (unaudited) | | Wells Fargo Advantage Income Plus Fund | | | 7 | |
|
| Portfolio allocation7 as of August 31, 2015 |
|
 |
The Fund remained overweight corporate securities and securitized debt.
During the period, the Fund maintained an overweight to investment-grade corporate and securitized debt and an underweight to U.S. Treasuries and agency debentures. We maintained the Fund’s duration and yield-curve positioning close to those of the Fund’s benchmark.
During the reporting period, a wider spread (or yield differential) for high-grade, high-yield credit, and commercial mortgage-backed securities relative to comparable Treasuries detracted from performance versus the benchmark. However, a positive spread for mortgage-related securities and corporate bonds contributed to performance during the period. An underweight to government securities also contributed, as did security selection in several sectors, including financials and holdings in agency mortgage-backed securities.
We expect a gradual rise in short-term interest rates.
In this environment of trend-like growth, stable core inflation, and still-accommodative monetary policy, we believe that the spread sectors—corporate credit, structured product, and select high-yield sectors—represent good value, particularly now that spreads have widened. In our view, the spread widening reflected concerns about supply and global macroeconomic uncertainty rather than deterioration in domestic fundamentals. That said, corporate credit metrics weakened in certain industries, such as mineral extraction and energy, over the period, and a management focus on rewarding shareholders has often resulted in additional leverage.
The relatively benign domestic economic conditions described above are likely to result in a gradual upward bias for interest rates. We believe FOMC is likely to raise its target rates by 0.75% to 1.00% over the next 12 months, a result which is largely reflected in the current yield curve. Should market rates diverge from the Fed’s policy path, we remain prepared to modify the Fund’s duration and yield-curve posture in order to take advantage of any opportunities.
Please see footnotes on page 5.
| | | | |
| 8 | | Wells Fargo Advantage Income Plus Fund | | Fund expenses (unaudited) |
As a shareholder of the Fund, you incur two types of costs: (1) transaction costs, including sales charges (loads) on purchase payments and contingent deferred sales charges (if any) on redemptions and (2) ongoing costs, including management fees, distribution (12b-1) and/or shareholder servicing fees, and other Fund expenses. This example is intended to help you understand your ongoing costs (in dollars) of investing in the Fund and to compare these costs with the ongoing costs of investing in other mutual funds.
The example is based on an investment of $1,000 invested at the beginning of the six-month period and held for the entire period from March 1, 2015 to August 31, 2015.
Actual expenses
The “Actual” line of the table below provides information about actual account values and actual expenses. You may use the information in this line, together with the amount you invested, to estimate the expenses that you paid over the period. Simply divide your account value by $1,000 (for example, an $8,600 account value divided by $1,000 = 8.6), then multiply the result by the number in the “Actual” line under the heading entitled “Expenses paid during period” for your applicable class of shares to estimate the expenses you paid on your account during this period.
Hypothetical example for comparison purposes
The “Hypothetical” line of the table below provides information about hypothetical account values and hypothetical expenses based on the Fund’s actual expense ratio and an assumed rate of return of 5% per year before expenses, which is not the Fund’s actual return. The hypothetical account values and expenses may not be used to estimate the actual ending account balance or expenses you paid for the period. You may use this information to compare the ongoing costs of investing in the Fund and other funds. To do so, compare this 5% hypothetical example with the 5% hypothetical examples that appear in the shareholder reports of the other funds.
Please note that the expenses shown in the table are meant to highlight your ongoing costs only and do not reflect any transactional costs, such as sales charges (loads) and contingent deferred sales charges. Therefore, the “Hypothetical” line of the table is useful in comparing ongoing costs only and will not help you determine the relative total costs of owning different funds. In addition, if these transactional costs were included, your costs would have been higher.
| | | | | | | | | | | | | | | | |
| | | Beginning
account value
3-1-2015 | | | Ending
account value
8-31-2015 | | | Expenses
paid during
the period¹ | | | Net annualized
expense ratio | |
Class A | | | | | | | | | | | | | | | | |
Actual | | $ | 1,000.00 | | | $ | 987.26 | | | $ | 4.21 | | | | 0.84 | % |
Hypothetical (5% return before expenses) | | $ | 1,000.00 | | | $ | 1,020.97 | | | $ | 4.28 | | | | 0.84 | % |
Class B | | | | | | | | | | | | | | | | |
Actual | | $ | 1,000.00 | | | $ | 984.01 | | | $ | 7.95 | | | | 1.59 | % |
Hypothetical (5% return before expenses) | | $ | 1,000.00 | | | $ | 1,017.19 | | | $ | 8.08 | | | | 1.59 | % |
Class C | | | | | | | | | | | | | | | | |
Actual | | $ | 1,000.00 | | | $ | 983.43 | | | $ | 7.95 | | | | 1.59 | % |
Hypothetical (5% return before expenses) | | $ | 1,000.00 | | | $ | 1,017.19 | | | $ | 8.08 | | | | 1.59 | % |
Administrator Class | | | | | | | | | | | | | | | | |
Actual | | $ | 1,000.00 | | | $ | 987.79 | | | $ | 3.61 | | | | 0.72 | % |
Hypothetical (5% return before expenses) | | $ | 1,000.00 | | | $ | 1,021.58 | | | $ | 3.67 | | | | 0.72 | % |
Institutional Class | | | | | | | | | | | | | | | | |
Actual | | $ | 1,000.00 | | | $ | 988.54 | | | $ | 2.91 | | | | 0.58 | % |
Hypothetical (5% return before expenses) | | $ | 1,000.00 | | | $ | 1,022.28 | | | $ | 2.96 | | | | 0.58 | % |
Investor Class | | | | | | | | | | | | | | | | |
Actual | | $ | 1,000.00 | | | $ | 987.16 | | | $ | 4.26 | | | | 0.85 | % |
Hypothetical (5% return before expenses) | | $ | 1,000.00 | | | $ | 1,020.92 | | | $ | 4.33 | | | | 0.85 | % |
| 1 | Expenses paid is equal to the annualized expense ratio of each class multiplied by the average account value over the period, multiplied by the number of days in the most recent fiscal half-year divided by the number of days in the fiscal year (to reflect the one-half-year period). |
| | | | | | |
| Portfolio of investments—August 31, 2015 | | Wells Fargo Advantage Income Plus Fund | | | 9 | |
| | | | | | | | | | | | | | | | |
| Security name | | Interest rate | | | Maturity date | | | Principal | | | Value | |
| | | | |
Agency Securities: 29.75% | | | | | | | | | | | | | | | | |
FHLB Series VN-2015 Class A | | | 5.46 | % | | | 11-27-2015 | | | $ | 621,813 | | | $ | 629,129 | |
FHLMC ± | | | 1.90 | | | | 1-1-2036 | | | | 69,505 | | | | 73,423 | |
FHLMC %% | | | 3.50 | | | | 9-14-2045 | | | | 12,585,000 | | | | 13,013,873 | |
FHLMC | | | 4.00 | | | | 6-1-2044 | | | | 5,758,048 | | | | 6,110,137 | |
FHLMC | | | 5.00 | | | | 6-1-2036 | | | | 566,997 | | | | 625,662 | |
FHLMC | | | 5.00 | | | | 8-1-2040 | | | | 581,241 | | | | 641,335 | |
FHLMC | | | 5.50 | | | | 10-1-2017 | | | | 171,357 | | | | 176,118 | |
FHLMC | | | 5.50 | | | | 8-1-2038 | | | | 125,961 | | | | 140,189 | |
FHLMC | | | 5.50 | | | | 12-1-2038 | | | | 1,113,364 | | | | 1,238,371 | |
FHLMC | | | 5.50 | | | | 6-1-2040 | | | | 1,655,134 | | | | 1,844,459 | |
FHLMC | | | 7.50 | | | | 5-1-2038 | | | | 3,867 | | | | 4,028 | |
FHLMC | | | 8.00 | | | | 2-1-2030 | | | | 417 | | | | 520 | |
FHLMC Series 2013-K28 Class B ±144A | | | 3.61 | | | | 6-25-2046 | | | | 1,970,000 | | | | 1,944,686 | |
FHLMC Series 2013-K30 Class B ±144A | | | 3.67 | | | | 6-25-2045 | | | | 2,515,000 | | | | 2,523,506 | |
FHLMC Series 2013-K32 Class B ±144A | | | 3.65 | | | | 10-25-2046 | | | | 1,875,000 | | | | 1,881,244 | |
FHLMC Series 2015-SC01 Class 1A | | | 3.50 | | | | 5-25-2045 | | | | 2,182,831 | | | | 2,207,015 | |
FHLMC Series 2640 Class G | | | 4.50 | | | | 7-15-2018 | | | | 623,501 | | | | 644,763 | |
FHLMC Series 3774 Class AB | | | 3.50 | | | | 12-15-2020 | | | | 396,335 | | | | 413,615 | |
FHLMC Series K020 Class X1 ±(c) | | | 1.59 | | | | 5-25-2022 | | | | 14,254,458 | | | | 1,123,294 | |
FHLMC Series T-42 Class A5 | | | 7.50 | | | | 2-25-2042 | | | | 2,245,491 | | | | 2,670,873 | |
FHLMC Series T-57 Class 2A1 ± | | | 3.26 | | | | 7-25-2043 | | | | 68,023 | | | | 71,760 | |
FHLMC Series T-59 Class 2A1 ± | | | 2.92 | | | | 10-25-2043 | | | | 325,749 | | | | 336,957 | |
FNMA ± | | | 2.32 | | | | 8-1-2036 | | | | 113,335 | | | | 120,881 | |
FNMA ± | | | 2.36 | | | | 9-1-2036 | | | | 52,027 | | | | 55,355 | |
FNMA ± | | | 2.40 | | | | 1-1-2036 | | | | 226,525 | | | | 241,939 | |
FNMA | | | 2.75 | | | | 10-1-2022 | | | | 2,250,000 | | | | 2,303,610 | |
FNMA %% | | | 3.00 | | | | 9-17-2030 | | | | 3,355,000 | | | | 3,480,288 | |
FNMA %% | | | 3.00 | | | | 9-14-2045 | | | | 16,180,000 | | | | 16,250,788 | |
FNMA | | | 3.27 | | | | 7-1-2022 | | | | 1,282,596 | | | | 1,356,189 | |
FNMA %% | | | 3.50 | | | | 9-17-2030 | | | | 6,615,000 | | | | 6,968,489 | |
FNMA %% | | | 3.50 | | | | 9-14-2045 | | | | 9,725,000 | | | | 10,077,718 | |
FNMA | | | 3.95 | | | | 9-1-2021 | | | | 430,057 | | | | 468,952 | |
FNMA | | | 4.00 | | | | 9-1-2024 | | | | 216,044 | | | | 226,265 | |
FNMA %% | | | 4.00 | | | | 9-14-2045 | | | | 13,030,000 | | | | 13,840,814 | |
FNMA | | | 4.26 | | | | 4-1-2021 | | | | 2,822,052 | | | | 3,120,576 | |
FNMA | | | 4.39 | | | | 1-1-2020 | | | | 1,548,569 | | | | 1,701,025 | |
FNMA | | | 4.50 | | | | 1-1-2026 | | | | 2,575,931 | | | | 2,678,231 | |
FNMA %% | | | 4.50 | | | | 9-14-2045 | | | | 15,790,000 | | | | 17,106,880 | |
FNMA | | | 5.00 | | | | 1-1-2024 | | | | 238,094 | | | | 257,313 | |
FNMA | | | 5.00 | | | | 2-1-2036 | | | | 57,601 | | | | 63,519 | |
FNMA | | | 5.00 | | | | 6-1-2040 | | | | 201,776 | | | | 223,528 | |
FNMA | | | 5.00 | | | | 8-1-2040 | | | | 3,687,876 | | | | 4,085,442 | |
FNMA | | | 5.50 | | | | 11-1-2023 | | | | 122,110 | | | | 134,120 | |
FNMA | | | 5.50 | | | | 8-1-2034 | | | | 200,407 | | | | 225,904 | |
FNMA | | | 5.50 | | | | 2-1-2035 | | | | 60,232 | | | | 67,827 | |
FNMA | | | 5.50 | | | | 8-1-2038 | | | | 226,524 | | | | 253,030 | |
FNMA | | | 5.50 | | | | 8-1-2038 | | | | 678,476 | | | | 766,433 | |
FNMA | | | 6.00 | | | | 10-1-2037 | | | | 1,074,297 | | | | 1,216,913 | |
FNMA | | | 6.00 | | | | 11-1-2037 | | | | 80,713 | | | | 91,082 | |
FNMA %% | | | 6.00 | | | | 9-14-2045 | | | | 795,000 | | | | 898,867 | |
FNMA | | | 6.50 | | | | 7-1-2036 | | | | 44,284 | | | | 50,827 | |
FNMA | | | 6.50 | | | | 7-1-2036 | | | | 20,027 | | | | 23,978 | |
The accompanying notes are an integral part of these financial statements.
| | | | |
| 10 | | Wells Fargo Advantage Income Plus Fund | | Portfolio of investments—August 31, 2015 |
| | | | | | | | | | | | | | | | |
| Security name | | Interest rate | | | Maturity date | | | Principal | | | Value | |
| | | | |
Agency Securities (continued) | | | | | | | | | | | | | | | | |
FNMA | | | 6.50 | % | | | 11-1-2036 | | | $ | 13,888 | | | $ | 16,516 | |
FNMA | | | 6.50 | | | | 7-1-2037 | | | | 1,608,241 | | | | 1,919,732 | |
FNMA | | | 7.00 | | | | 12-1-2022 | | | | 389,933 | | | | 421,737 | |
FNMA | | | 7.00 | | | | 7-1-2036 | | | | 27,649 | | | | 30,642 | |
FNMA | | | 7.00 | | | | 11-1-2037 | | | | 15,554 | | | | 17,441 | |
FNMA | | | 7.50 | | | | 5-1-2038 | | | | 2,044 | | | | 2,081 | |
FNMA Series 2002-T12 Class A3 | | | 7.50 | | | | 5-25-2042 | | | | 8,957 | | | | 10,994 | |
FNMA Series 2003-W08 Class 4A ± | | | 3.17 | | | | 11-25-2042 | | | | 238,436 | | | | 249,659 | |
FNMA Series 2003-W14 Class 2A ± | | | 2.29 | | | | 6-25-2045 | | | | 184,343 | | | | 190,831 | |
FNMA Series 2003-W14 Class 2A ± | | | 3.57 | | | | 1-25-2043 | | | | 414,992 | | | | 422,138 | |
FNMA Series 2004-W11 Class 1A3 | | | 7.00 | | | | 5-25-2044 | | | | 1,856,888 | | | | 2,191,815 | |
FNMA Series 2004-W15 Class 1A3 | | | 7.00 | | | | 8-25-2044 | | | | 1,156,586 | | | | 1,336,948 | |
GNMA | | | 3.00 | | | | 7-20-2045 | | | | 6,030,834 | | | | 6,119,523 | |
GNMA %% | | | 3.50 | | | | 9-21-2045 | | | | 15,320,000 | | | | 15,951,351 | |
GNMA | | | 4.00 | | | | 1-20-2045 | | | | 3,776,963 | | | | 4,009,784 | |
GNMA | | | 5.00 | | | | 7-20-2040 | | | | 1,494,434 | | | | 1,660,967 | |
GNMA | | | 7.50 | | | | 12-15-2029 | | | | 786 | | | | 897 | |
GNMA Series 2008-22 Class XM ±(c) | | | 0.74 | | | | 2-16-2050 | | | | 2,563,406 | | | | 81,034 | |
GNMA Series 2008-86 Class D | | | 5.46 | | | | 6-16-2040 | | | | 1,044,219 | | | | 1,081,054 | |
| | | | |
Total Agency Securities (Cost $158,779,981) | | | | | | | | | | | | | | | 162,386,884 | |
| | | | | | | | | | | | | | | | |
| | | | |
Asset-Backed Securities: 1.10% | | | | | | | | | | | | | | | | |
CVS Pass-Through Trust First Lien | | | 6.04 | | | | 12-10-2028 | | | | 1,416,973 | | | | 1,603,959 | |
GE Equipment Transportation LLC Series 2015-1 Class A2 | | | 0.89 | | | | 11-24-2017 | | | | 840,000 | | | | 840,515 | |
GMF Floorplan Owner Revolving Trust Series 2015-1 Class A1 144A | | | 1.65 | | | | 5-15-2020 | | | | 1,600,000 | | | | 1,589,813 | |
Volkswagen Auto Lease Trust Series 2015-A Class A2A | | | 0.87 | | | | 6-20-2017 | | | | 1,993,980 | | | | 1,993,790 | |
| | | | |
Total Asset-Backed Securities (Cost $5,841,633) | | | | | | | | | | | | | | | 6,028,077 | |
| | | | | | | | | | | | | | | | |
| | | | |
Corporate Bonds and Notes: 28.37% | | | | | | | | | | | | | | | | |
| | | | |
Consumer Discretionary: 3.67% | | | | | | | | | | | | | | | | |
| | | | |
| Auto Components: 0.72% | | | | | | | | | | | | | | | | |
Delphi Corporation | | | 5.00 | | | | 2-15-2023 | | | | 2,190,000 | | | | 2,277,600 | |
Lear Corporation | | | 5.38 | | | | 3-15-2024 | | | | 1,320,000 | | | | 1,339,800 | |
ZF North America Capital Incorporated 144A | | | 4.00 | | | | 4-29-2020 | | | | 325,000 | | | | 324,951 | |
| | | | |
| | | | | | | | | | | | | | | 3,942,351 | |
| | | | | | | | | | | | | | | | |
| | | | |
| Automobiles: 0.38% | | | | | | | | | | | | | | | | |
Ford Motor Company | | | 7.45 | | | | 7-16-2031 | | | | 1,645,000 | | | | 2,069,014 | |
| | | | | | | | | | | | | | | | |
| | | | |
| Diversified Consumer Services: 0.47% | | | | | | | | | | | | | | | | |
Ashtead Capital Incorporated 144A | | | 5.63 | | | | 10-1-2024 | | | | 795,000 | | | | 789,538 | |
Service Corporation International | | | 8.00 | | | | 11-15-2021 | | | | 1,500,000 | | | | 1,747,500 | |
| | | | |
| | | | | | | | | | | | | | | 2,537,038 | |
| | | | | | | | | | | | | | | | |
| | | | |
| Hotels, Restaurants & Leisure: 0.05% | | | | | | | | | | | | | | | | |
Agua Caliente Band of Cahuilla Indians 144A | | | 6.44 | | | | 10-1-2016 | | | | 298,000 | | | | 290,374 | |
| | | | | | | | | | | | | | | | |
| | | | |
| Household Durables: 0.30% | | | | | | | | | | | | | | | | |
Lennar Corporation | | | 4.75 | | | | 11-15-2022 | | | | 845,000 | | | | 840,775 | |
Toll Brothers Finance Corporation | | | 4.38 | | | | 4-15-2023 | | | | 810,000 | | | | 795,825 | |
| | | | |
| | | | | | | | | | | | | | | 1,636,600 | |
| | | | | | | | | | | | | | | | |
The accompanying notes are an integral part of these financial statements.
| | | | | | |
| Portfolio of investments—August 31, 2015 | | Wells Fargo Advantage Income Plus Fund | | | 11 | |
| | | | | | | | | | | | | | | | |
| Security name | | Interest rate | | | Maturity date | | | Principal | | | Value | |
| | | | |
| Internet & Catalog Retail: 0.17% | | | | | | | | | | | | | | | | |
Amazon.com Incorporated | | | 4.95 | % | | | 12-5-2044 | | | $ | 955,000 | | | $ | 952,796 | |
| | | | | | | | | | | | | | | | |
| | | | |
| Media: 1.05% | | | | | | | | | | | | | | | | |
CCO Holdings LLC | | | 6.63 | | | | 1-31-2022 | | | | 1,300,000 | | | | 1,368,250 | |
CCO Safari II LLC 144A | | | 6.48 | | | | 10-23-2045 | | | | 655,000 | | | | 664,309 | |
DISH DBS Corporation | | | 5.13 | | | | 5-1-2020 | | | | 965,000 | | | | 945,700 | |
Gannett Company Incorporated 144A | | | 5.50 | | | | 9-15-2024 | | | | 1,405,000 | | | | 1,390,950 | |
Sirius XM Radio Incorporated 144A | | | 6.00 | | | | 7-15-2024 | | | | 1,320,000 | | | | 1,359,600 | |
| | | | |
| | | | | | | | | | | | | | | 5,728,809 | |
| | | | | | | | | | | | | | | | |
| | | | |
| Specialty Retail: 0.47% | | | | | | | | | | | | | | | | |
L Brands Incorporated | | | 6.63 | | | | 4-1-2021 | | | | 1,020,000 | | | | 1,147,500 | |
Sally Beauty Holdings Incorporated | | | 5.75 | | | | 6-1-2022 | | | | 1,360,000 | | | | 1,414,400 | |
| | | | |
| | | | | | | | | | | | | | | 2,561,900 | |
| | | | | | | | | | | | | | | | |
| | | | |
| Textiles, Apparel & Luxury Goods: 0.06% | | | | | | | | | | | | | | | | |
Levi Strauss & Company | | | 5.00 | | | | 5-1-2025 | | | | 325,000 | | | | 318,094 | |
| | | | | | | | | | | | | | | | |
| | | | |
Consumer Staples: 0.51% | | | | | | | | | | | | | | | | |
| | | | |
| Beverages: 0.26% | | | | | | | | | | | | | | | | |
Constellation Brands Incorporated | | | 4.25 | | | | 5-1-2023 | | | | 1,385,000 | | | | 1,393,310 | |
| | | | | | | | | | | | | | | | |
| | | | |
| Food Products: 0.25% | | | | | | | | | | | | | | | | |
The JM Smucker Company 144A | | | 4.38 | | | | 3-15-2045 | | | | 1,485,000 | | | | 1,367,617 | |
| | | | | | | | | | | | | | | | |
| | | | |
Energy: 3.46% | | | | | | | | | | | | | | | | |
| | | | |
| Energy Equipment & Services: 0.26% | | | | | | | | | | | | | | | | |
SESI LLC | | | 7.13 | | | | 12-15-2021 | | | | 1,410,000 | | | | 1,406,701 | |
| | | | | | | | | | | | | | | | |
| | | | |
| Oil, Gas & Consumable Fuels: 3.20% | | | | | | | | | | | | | | | | |
Anadarko Petroleum Corporation | | | 4.50 | | | | 7-15-2044 | | | | 1,310,000 | | | | 1,186,307 | |
Concho Resources Incorporated | | | 5.50 | | | | 4-1-2023 | | | | 820,000 | | | | 809,750 | |
Continental Resources Incorporated | | | 4.50 | | | | 4-15-2023 | | | | 1,300,000 | | | | 1,170,160 | |
Energy Transfer Equity LP | | | 7.50 | | | | 10-15-2020 | | | | 1,200,000 | | | | 1,282,500 | |
Energy Transfer Partners LP | | | 6.13 | | | | 12-15-2045 | | | | 1,585,000 | | | | 1,519,652 | |
Enterprise Products Operating LLC | | | 5.10 | | | | 2-15-2045 | | | | 1,135,000 | | | | 1,046,831 | |
Kinder Morgan Energy Partners LP | | | 5.55 | | | | 6-1-2045 | | | | 1,305,000 | | | | 1,121,790 | |
Marathon Petroleum Corporation | | | 4.75 | | | | 9-15-2044 | | | | 630,000 | | | | 553,706 | |
Newfield Exploration Company | | | 5.38 | | | | 1-1-2026 | | | | 280,000 | | | | 262,500 | |
Newfield Exploration Company | | | 5.63 | | | | 7-1-2024 | | | | 325,000 | | | | 316,063 | |
Occidental Petroleum Corporation | | | 4.63 | | | | 6-15-2045 | | | | 1,175,000 | | | | 1,163,896 | |
Range Resources Corporation 144A | | | 4.88 | | | | 5-15-2025 | | | | 645,000 | | | | 583,725 | |
Sabine Pass Liquefaction LLC | | | 5.63 | | | | 4-15-2023 | | | | 1,300,000 | | | | 1,262,625 | |
Targa Resources Partners LP | | | 4.25 | | | | 11-15-2023 | | | | 715,000 | | | | 625,625 | |
TC Pipelines LP | | | 4.38 | | | | 3-13-2025 | | | | 1,880,000 | | | | 1,793,832 | |
Tesoro Logistics LP Corporation | | | 6.13 | | | | 10-15-2021 | | | | 980,000 | | | | 982,450 | |
Whiting Petroleum Corporation | | | 5.75 | | | | 3-15-2021 | | | | 650,000 | | | | 581,750 | |
Williams Partners LP | | | 4.88 | | | | 3-15-2024 | | | | 1,285,000 | | | | 1,198,185 | |
| | | | |
| | | | | | | | | | | | | | | 17,461,347 | |
| | | | | | | | | | | | | | | | |
The accompanying notes are an integral part of these financial statements.
| | | | |
| 12 | | Wells Fargo Advantage Income Plus Fund | | Portfolio of investments—August 31, 2015 |
| | | | | | | | | | | | | | | | |
| Security name | | Interest rate | | | Maturity date | | | Principal | | | Value | |
| | | | |
Financials: 10.09% | | | | | | | | | | | | | | | | |
| | | | |
| Banks: 3.15% | | | | | | | | | | | | | | | | |
Australia and New Zealand Banking Group Limited 144A | | | 2.40 | % | | | 11-23-2016 | | | $ | 3,320,000 | | | $ | 3,375,969 | |
Bank of America Corporation | | | 3.95 | | | | 4-21-2025 | | | | 1,950,000 | | | | 1,885,506 | |
Bank of America Corporation ± | | | 6.10 | | | | 12-29-2049 | | | | 1,290,000 | | | | 1,259,363 | |
Bank of America Corporation | | | 7.63 | | | | 6-1-2019 | | | | 2,480,000 | | | | 2,927,417 | |
CBA Capital Trust II ±144A | | | 6.02 | | | | 3-29-2049 | | | | 1,300,000 | | | | 1,313,000 | |
CIT Group Incorporated | | | 5.38 | | | | 5-15-2020 | | | | 1,650,000 | | | | 1,724,250 | |
Fifth Third Bank | | | 2.15 | | | | 8-20-2018 | | | | 1,885,000 | | | | 1,888,749 | |
JPMorgan Chase & Company Series Q ± | | | 5.15 | | | | 12-29-2049 | | | | 1,620,000 | | | | 1,530,900 | |
JPMorgan Chase & Company Series Z ± | | | 5.30 | | | | 12-29-2049 | | | | 1,300,000 | | | | 1,281,313 | |
| | | | |
| | | | | | | | | | | | | | | 17,186,467 | |
| | | | | | | | | | | | | | | | |
| | | | |
| Capital Markets: 1.41% | | | | | | | | | | | | | | | | |
Blackstone Holdings Finance Company LLC 144A | | | 5.88 | | | | 3-15-2021 | | | | 1,110,000 | | | | 1,263,756 | |
Goldman Sachs Group Incorporated | | | 3.75 | | | | 5-22-2025 | | | | 1,635,000 | | | | 1,626,693 | |
Goldman Sachs Group Incorporated | | | 5.15 | | | | 5-22-2045 | | | | 1,305,000 | | | | 1,285,695 | |
Goldman Sachs Group Incorporated ± | | | 5.38 | | | | 12-29-2049 | | | | 1,295,000 | | | | 1,269,100 | |
Legg Mason Incorporated | | | 5.63 | | | | 1-15-2044 | | | | 965,000 | | | | 998,702 | |
Morgan Stanley | | | 4.35 | | | | 9-8-2026 | | | | 1,260,000 | | | | 1,257,043 | |
| | | | |
| | | | | | | | | | | | | | | 7,700,989 | |
| | | | | | | | | | | | | | | | |
| | | | |
| Consumer Finance: 0.75% | | | | | | | | | | | | | | | | |
Ally Financial Incorporated | | | 5.13 | | | | 9-30-2024 | | | | 850,000 | | | | 858,500 | |
ERAC USA Finance LLC 144A | | | 4.50 | | | | 2-15-2045 | | | | 1,950,000 | | | | 1,782,864 | |
Navient Corporation | | | 8.00 | | | | 3-25-2020 | | | | 1,425,000 | | | | 1,440,105 | |
| | | | |
| | | | | | | | | | | | | | | 4,081,469 | |
| | | | | | | | | | | | | | | | |
| | | | |
| Diversified Financial Services: 1.11% | | | | | | | | | | | | | | | | |
General Electric Capital Corporation ± | | | 6.38 | | | | 11-15-2067 | | | | 2,200,000 | | | | 2,348,500 | |
JBS USA LLC / JBS USA Finance Incorporated 144A | | | 5.75 | | | | 6-15-2025 | | | | 1,310,000 | | | | 1,270,700 | |
McGraw Hill Financial Incorporated 144A | | | 4.00 | | | | 6-15-2025 | | | | 2,530,000 | | | | 2,446,287 | |
| | | | |
| | | | | | | | | | | | | | | 6,065,487 | |
| | | | | | | | | | | | | | | | |
| | | | |
| Insurance: 3.26% | | | | | | | | | | | | | | | | |
Endurance Specialty Holdings Limited | | | 7.00 | | | | 7-15-2034 | | | | 1,520,000 | | | | 1,809,852 | |
Genworth Holdings Incorporated | | | 4.80 | | | | 2-15-2024 | | | | 390,000 | | | | 313,950 | |
Genworth Holdings Incorporated | | | 7.63 | | | | 9-24-2021 | | | | 330,000 | | | | 338,250 | |
National Life Insurance Company of Vermont 144A | | | 10.50 | | | | 9-15-2039 | | | | 1,315,000 | | | | 2,020,008 | |
Platinum Underwriters Finance Incorporated Series B | | | 7.50 | | | | 6-1-2017 | | | | 1,730,000 | | | | 1,879,519 | |
Progressive Corporation ± | | | 6.70 | | | | 6-15-2067 | | | | 2,050,000 | | | | 2,080,750 | |
Protective Life Corporation | | | 8.45 | | | | 10-15-2039 | | | | 1,855,000 | | | | 2,524,030 | |
Prudential Financial Incorporated ± | | | 8.88 | | | | 6-15-2068 | | | | 1,645,000 | | | | 1,897,179 | |
RenaissanceRe Finance Incorporated | | | 3.70 | | | | 4-1-2025 | | | | 1,290,000 | | | | 1,248,668 | |
Transatlantic Holdings Incorporated | | | 8.00 | | | | 11-30-2039 | | | | 1,300,000 | | | | 1,721,424 | |
ZFS Finance (USA) Trust II ±144A | | | 6.45 | | | | 12-15-2065 | | | | 1,920,000 | | | | 1,948,800 | |
| | | | |
| | | | | | | | | | | | | | | 17,782,430 | |
| | | | | | | | | | | | | | | | |
| | | | |
| Real Estate Management & Development: 0.17% | | | | | | | | | | | | | | | | |
CBRE Services Incorporated | | | 5.00 | | | | 3-15-2023 | | | | 940,000 | | | | 948,297 | |
| | | | | | | | | | | | | | | | |
The accompanying notes are an integral part of these financial statements.
| | | | | | |
| Portfolio of investments—August 31, 2015 | | Wells Fargo Advantage Income Plus Fund | | | 13 | |
| | | | | | | | | | | | | | | | |
| Security name | | Interest rate | | | Maturity date | | | Principal | | | Value | |
| | | | |
| REITs: 0.24% | | | | | | | | | | | | | | | | |
Crown Castle International Corporation | | | 5.25 | % | | | 1-15-2023 | | | $ | 1,250,000 | | | $ | 1,307,813 | |
| | | | | | | | | | | | | | | | |
| | | | |
Health Care: 1.53% | | | | | | | | | | | | | | | | |
| | | | |
| Health Care Equipment & Supplies: 0.34% | | | | | | | | | | | | | | | | |
Medtronic Incorporated 144A | | | 4.63 | | | | 3-15-2045 | | | | 1,825,000 | | | | 1,859,312 | |
| | | | | | | | | | | | | | | | |
| | | | |
| Health Care Providers & Services: 1.19% | | | | | | | | | | | | | | | | |
DaVita HealthCare Partners Incorporated | | | 5.00 | | | | 5-1-2025 | | | | 1,620,000 | | | | 1,587,600 | |
HCA Incorporated | | | 6.50 | | | | 2-15-2020 | | | | 1,450,000 | | | | 1,602,250 | |
HealthSouth Corporation | | | 5.75 | | | | 11-1-2024 | | | | 980,000 | | | | 993,622 | |
Tenet Healthcare Corporation | | | 6.00 | | | | 10-1-2020 | | | | 1,540,000 | | | | 1,647,800 | |
UnitedHealth Group Incorporated | | | 4.63 | | | | 7-15-2035 | | | | 660,000 | | | | 688,409 | |
| | | | |
| | | | | | | | | | | | | | | 6,519,681 | |
| | | | | | | | | | | | | | | | |
| | | | |
Industrials: 1.66% | | | | | | | | | | | | | | | | |
| | | | |
| Aerospace & Defense: 0.11% | | | | | | | | | | | | | | | | |
DigitalGlobe Incorporated 144A | | | 5.25 | | | | 2-1-2021 | | | | 635,000 | | | | 609,600 | |
| | | | | | | | | | | | | | | | |
| | | | |
| Airlines: 0.41% | | | | | | | | | | | | | | | | |
American Airlines Incorporated | | | 3.70 | | | | 11-1-2024 | | | | 2,280,000 | | | | 2,240,100 | |
| | | | | | | | | | | | | | | | |
| | | | |
| Commercial Services & Supplies: 0.12% | | | | | | | | | | | | | | | | |
The ADT Corporation | | | 3.50 | | | | 7-15-2022 | | | | 730,000 | | | | 653,569 | |
| | | | | | | | | | | | | | | | |
| | | | |
| Professional Services: 0.37% | | | | | | | | | | | | | | | | |
Verisk Analytics Incorporated | | | 5.80 | | | | 5-1-2021 | | | | 1,810,000 | | | | 2,020,356 | |
| | | | | | | | | | | | | | | | |
| | | | |
| Trading Companies & Distributors: 0.52% | | | | | | | | | | | | | | | | |
International Lease Finance Corporation | | | 8.25 | | | | 12-15-2020 | | | | 1,190,000 | | | | 1,410,150 | |
United Rentals North America Incorporated | | | 5.75 | | | | 11-15-2024 | | | | 1,460,000 | | | | 1,438,100 | |
| | | | |
| | | | | | | | | | | | | | | 2,848,250 | |
| | | | | | | | | | | | | | | | |
| | | | |
| Transportation Infrastructure: 0.13% | | | | | | | | | | | | | | | | |
Burlington Northern Santa Fe LLC | | | 4.70 | | | | 9-1-2045 | | | | 680,000 | | | | 678,582 | |
| | | | | | | | | | | | | | | | |
| | | | |
Information Technology: 2.20% | | | | | | | | | | | | | | | | |
| | | | |
| Communications Equipment: 0.25% | | | | | | | | | | | | | | | | |
Motorola Solutions Incorporated | | | 4.00 | | | | 9-1-2024 | | | | 1,465,000 | | | | 1,346,518 | |
| | | | | | | | | | | | | | | | |
| | | | |
| Electronic Equipment, Instruments & Components: 1.09% | | | | | | | | | | | | | | | | |
Arrow Electronics Incorporated | | | 4.00 | | | | 4-1-2025 | | | | 2,410,000 | | | | 2,354,435 | |
Corning Incorporated | | | 7.25 | | | | 8-15-2036 | | | | 1,417,000 | | | | 1,726,467 | |
Flextronics International Limited 144A | | | 4.75 | | | | 6-15-2025 | | | | 1,960,000 | | | | 1,896,124 | |
| | | | |
| | | | | | | | | | | | | | | 5,977,026 | |
| | | | | | | | | | | | | | | | |
| | | | |
| Semiconductors & Semiconductor Equipment: 0.25% | | | | | | | | | | | | | | | | |
Micron Technology Incorporated | | | 5.88 | | | | 2-15-2022 | | | | 1,385,000 | | | | 1,364,225 | |
| | | | | | | | | | | | | | | | |
| | | | |
| Software: 0.49% | | | | | | | | | | | | | | | | |
Activision Blizzard Incorporated 144A | | | 5.63 | | | | 9-15-2021 | | | | 1,370,000 | | | | 1,440,213 | |
Autodesk Incorporated | | | 4.38 | | | | 6-15-2025 | | | | 1,210,000 | | | | 1,210,495 | |
| | | | |
| | | | | | | | | | | | | | | 2,650,708 | |
| | | | | | | | | | | | | | | | |
The accompanying notes are an integral part of these financial statements.
| | | | |
| 14 | | Wells Fargo Advantage Income Plus Fund | | Portfolio of investments—August 31, 2015 |
| | | | | | | | | | | | | | | | |
| Security name | | Interest rate | | | Maturity date | | | Principal | | | Value | |
| | | | |
| Technology Hardware, Storage & Peripherals: 0.12% | | | | | | | | | | | | | | | | |
Dell Incorporated | | | 5.88 | % | | | 6-15-2019 | | | $ | 650,000 | | | $ | 674,310 | |
| | | | | | | | | | | | | | | | |
| | | | |
Materials: 2.14% | | | | | | | | | | | | | | | | |
| | | | |
| Chemicals: 1.19% | | | | | | | | | | | | | | | | |
Ashland Incorporated | | | 4.75 | | | | 8-15-2022 | | | | 1,470,000 | | | | 1,458,975 | |
Rockwood Specialties Group Incorporated | | | 4.63 | | | | 10-15-2020 | | | | 2,155,000 | | | | 2,230,425 | |
RPM International Incorporated | | | 5.25 | | | | 6-1-2045 | | | | 1,305,000 | | | | 1,258,169 | |
W.R. Grace & Company 144A | | | 5.63 | | | | 10-1-2024 | | | | 1,520,000 | | | | 1,567,500 | |
| | | | |
| | | | | | | | | | | | | | | 6,515,069 | |
| | | | | | | | | | | | | | | | |
| | | | |
| Construction Materials: 0.21% | | | | | | | | | | | | | | | | |
Vulcan Materials Company | | | 4.50 | | | | 4-1-2025 | | | | 1,155,000 | | | | 1,134,788 | |
| | | | | | | | | | | | | | | | |
| | | | |
| Containers & Packaging: 0.24% | | | | | | | | | | | | | | | | |
Crown Americas Capital Corporation IV | | | 4.50 | | | | 1-15-2023 | | | | 1,310,000 | | | | 1,282,163 | |
| | | | | | | | | | | | | | | | |
| | | | |
| Metals & Mining: 0.39% | | | | | | | | | | | | | | | | |
Alcoa Incorporated | | | 5.13 | | | | 10-1-2024 | | | | 650,000 | | | | 637,000 | |
Steel Dynamics Incorporated | | | 6.38 | | | | 8-15-2022 | | | | 1,465,000 | | | | 1,512,613 | |
| | | | |
| | | | | | | | | | | | | | | 2,149,613 | |
| | | | | | | | | | | | | | | | |
| | | | |
| Paper & Forest Products: 0.11% | | | | | | | | | | | | | | | | |
International Paper Company | | | 7.30 | | | | 11-15-2039 | | | | 500,000 | | | | 599,508 | |
| | | | | | | | | | | | | | | | |
| | | | |
Telecommunication Services: 2.47% | | | | | | | | | | | | | | | | |
| | | | |
| Diversified Telecommunication Services: 1.24% | | | | | | | | | | | | | | | | |
AT&T Incorporated | | | 4.75 | | | | 5-15-2046 | | | | 1,890,000 | | | | 1,723,247 | |
CenturyLink Incorporated | | | 5.63 | | | | 4-1-2020 | | | | 1,375,000 | | | | 1,373,281 | |
Frontier Communications Corporation | | | 6.25 | | | | 9-15-2021 | | | | 575,000 | | | | 524,688 | |
Verizon Communications Incorporated | | | 6.55 | | | | 9-15-2043 | | | | 2,670,000 | | | | 3,152,640 | |
| | | | |
| | | | | | | | | | | | | | | 6,773,856 | |
| | | | | | | | | | | | | | | | |
| | | | |
| Wireless Telecommunication Services: 1.23% | | | | | | | | | | | | | | | | |
Crown Castle Towers LLC 144A | | | 3.22 | | | | 5-15-2042 | | | | 2,600,000 | | | | 2,549,456 | |
SBA Tower Trust 144A | | | 3.72 | | | | 4-15-2048 | | | | 1,820,000 | | | | 1,845,207 | |
Sprint Corporation | | | 7.88 | | | | 9-15-2023 | | | | 860,000 | | | | 826,675 | |
T-Mobile USA Incorporated | | | 6.63 | | | | 4-1-2023 | | | | 1,435,000 | | | | 1,496,705 | |
| | | | |
| | | | | | | | | | | | | | | 6,718,043 | |
| | | | | | | | | | | | | | | | |
| | | | |
Utilities: 0.64% | | | | | | | | | | | | | | | | |
| | | | |
| Independent Power & Renewable Electricity Producers: 0.64% | | | | | | | | | | | | | | | | |
Calpine Corporation 144A | | | 5.88 | | | | 1-15-2024 | | | | 1,275,000 | | | | 1,338,750 | |
Harper Lake Solar Funding Corporation 144A | | | 7.65 | | | | 12-31-2018 | | | | 1,110,914 | | | | 1,183,123 | |
The AES Corporation | | | 5.50 | | | | 3-15-2024 | | | | 1,010,000 | | | | 964,550 | |
| | | | |
| | | | | | | | | | | | | | | 3,486,423 | |
| | | | | | | | | | | | | | | | |
| | | | |
Total Corporate Bonds and Notes (Cost $155,050,218) | | | | | | | | | | | | | | | 154,840,603 | |
| | | | | | | | | | | | | | | | |
The accompanying notes are an integral part of these financial statements.
| | | | | | |
| Portfolio of investments—August 31, 2015 | | Wells Fargo Advantage Income Plus Fund | | | 15 | |
| | | | | | | | | | | | | | | | |
| Security name | | Interest rate | | | Maturity date | | | Principal | | | Value | |
| | | | |
Municipal Obligations: 3.29% | | | | | | | | | | | | | | | | |
| | | | |
| California: 0.69% | | | | | | | | | | | | | | | | |
California Build America Bonds Stem Cell Research and Cures Series A (GO Revenue) | | | 4.99 | % | | | 4-1-2039 | | | $ | 1,505,000 | | | $ | 1,548,194 | |
San Jose CA Series B (Airport Revenue, AGM Insured) | | | 6.60 | | | | 3-1-2041 | | | | 2,000,000 | | | | 2,238,760 | |
| | | | |
| | | | | | | | | | | | | | | 3,786,954 | |
| | | | | | | | | | | | | | | | |
| | | | |
| Illinois: 0.63% | | | | | | | | | | | | | | | | |
Chicago IL Series B (GO Revenue) | | | 6.31 | | | | 1-1-2044 | | | | 675,000 | | | | 578,333 | |
Chicago IL Series B (GO Revenue) | | | 7.38 | | | | 1-1-2033 | | | | 1,125,000 | | | | 1,093,253 | |
Cook County IL Series B (GO Revenue) | | | 6.36 | | | | 11-15-2033 | | | | 1,745,000 | | | | 1,754,039 | |
| | | | |
| | | | | | | | | | | | | | | 3,425,625 | |
| | | | | | | | | | | | | | | | |
| | | | |
| Michigan: 0.40% | | | | | | | | | | | | | | | | |
Michigan Finance Authority Local Government Loan Program Project Series E (Miscellaneous Revenue) | | | 7.19 | | | | 11-1-2022 | | | | 1,915,000 | | | | 2,190,588 | |
| | | | | | | | | | | | | | | | |
| | | | |
| New Jersey: 0.69% | | | | | | | | | | | | | | | | |
New Jersey EDA Series B (Lease Revenue, AGM Insured) ¤ | | | 0.00 | | | | 2-15-2019 | | | | 4,250,000 | | | | 3,765,968 | |
| | | | | | | | | | | | | | | | |
| | | | |
| Puerto Rico: 0.37% | | | | | | | | | | | | | | | | |
Puerto Rico Government Development Bank Series 1985 (Miscellaneous Revenue, National Insured) | | | 4.75 | | | | 12-1-2015 | | | | 2,005,000 | | | | 2,011,637 | |
| | | | | | | | | | | | | | | | |
| | | | |
| Texas: 0.35% | | | | | | | | | | | | | | | | |
North Texas Tollway Authority Build America Bonds Sub Lien Series B-2 (Transportation Revenue) | | | 8.91 | | | | 2-1-2030 | | | | 1,595,000 | | | | 1,900,092 | |
| | | | | | | | | | | | | | | | |
| | | | |
| Washington: 0.16% | | | | | | | | | | | | | | | | |
Metropolitan Washington DC Airports Authority Dulles Toll Road Revenue Build America Bonds (Transportation Revenue) | | | 7.46 | | | | 10-1-2046 | | | | 695,000 | | | | 895,709 | |
| | | | | | | | | | | | | | | | |
| | | | |
Total Municipal Obligations (Cost $17,691,093) | | | | | | | | | | | | | | | 17,976,573 | |
| | | | | | | | | | | | | | | | |
| | | | |
Non-Agency Mortgage-Backed Securities: 3.22% | | | | | | | | | | | | | | | | |
Banc of America Commercial Mortgage Securities Incorporated Series 2007-1 Class AMFX ± | | | 5.48 | | | | 1-15-2049 | | | | 2,535,000 | | | | 2,629,827 | |
Bear Stearns Commercial Mortgage Securities Incorporated Series 2005-T20 Class A4A ± | | | 5.26 | | | | 10-12-2042 | | | | 38,472 | | | | 38,431 | |
Citigroup Commercial Mortgage Trust Series 2015-GC27 Class A5 | | | 3.14 | | | | 2-10-2048 | | | | 2,315,000 | | | | 2,267,216 | |
Commercial Mortgage Trust Pass-Through Certificate Series 2014-CR20 Class 4 | | | 3.59 | | | | 11-10-2047 | | | | 3,033,000 | | | | 3,098,762 | |
Commercial Mortgage Trust Pass-Through Certificate Series 2014-LC17 Class A5 | | | 3.92 | | | | 10-10-2047 | | | | 1,270,000 | | | | 1,330,848 | |
Credit Suisse First Boston Commercial Mortgage Trust Series 1998-C2 Class AX ±(c) | | | 0.42 | | | | 11-15-2030 | | | | 258,949 | | | | 665 | |
Financial Asset Securitization Incorporated Series 1997-NAM2 Class B2 (s) | | | 7.88 | | | | 7-25-2027 | | | | 45,624 | | | | 42,408 | |
GAHR Commercial Mortgage Trust Series 2015-NRF Class AFX 144A | | | 3.23 | | | | 12-15-2019 | | | | 1,600,000 | | | | 1,629,936 | |
JPMorgan Chase Commercial Mortgage Trust Series 2007-LDPX Class AM ± | | | 5.46 | | | | 1-15-2049 | | | | 1,980,000 | | | | 2,033,015 | |
Lehman Brothers UBS Commercial Mortgage Trust Series 2006-C1 Class A4 | | | 5.16 | | | | 2-15-2031 | | | | 1,415,835 | | | | 1,419,245 | |
Mach One Trust Commercial Mortgage Backed Series 2004-1 Class X ±144A(c)(i) | | | 0.55 | | | | 5-28-2040 | | | | 322,165 | | | | 3,191 | |
Morgan Stanley Bank of America Merrill Lynch Trust Series 2015-C23 Class A4 | | | 3.72 | | | | 7-15-2050 | | | | 3,000,000 | | | | 3,068,616 | |
Morgan Stanley Capital I Series 2004-RR2 Class X ±144A(c) | | | 0.29 | | | | 10-28-2033 | | | | 158,504 | | | | 1,126 | |
| | | | |
Total Non-Agency Mortgage-Backed Securities (Cost $17,975,619) | | | | | | | | | | | | | | | 17,563,286 | |
| | | | | | | | | | | | | | | | |
The accompanying notes are an integral part of these financial statements.
| | | | |
| 16 | | Wells Fargo Advantage Income Plus Fund | | Portfolio of investments—August 31, 2015 |
| | | | | | | | | | | | | | | | |
| Security name | | Interest rate | | | Maturity date | | | Principal | | | Value | |
| | | | |
U.S. Treasury Securities: 20.87% | | | | | | | | | | | | | | | | |
TIPS | | | 0.38 | % | | | 7-15-2025 | | | $ | 2,520,782 | | | $ | 2,475,683 | |
U.S. Treasury Bond | | | 2.50 | | | | 2-15-2045 | | | | 2,675,000 | | | | 2,422,616 | |
U.S. Treasury Bond | | | 2.75 | | | | 11-15-2042 | | | | 3,280,000 | | | | 3,141,797 | |
U.S. Treasury Bond | | | 2.88 | | | | 5-15-2043 | | | | 5,370,000 | | | | 5,268,335 | |
U.S. Treasury Bond | | | 4.50 | | | | 2-15-2036 | | | | 6,605,000 | | | | 8,504,882 | |
U.S. Treasury Note | | | 0.25 | | | | 12-15-2015 | | | | 11,350,000 | | | | 11,351,771 | |
U.S. Treasury Note | | | 0.25 | | | | 5-15-2016 | | | | 2,975,000 | | | | 2,972,367 | |
U.S. Treasury Note | | | 0.38 | | | | 11-15-2015 | | | | 5,820,000 | | | | 5,822,427 | |
U.S. Treasury Note | | | 0.38 | | | | 3-15-2016 | | | | 2,250,000 | | | | 2,250,673 | |
U.S. Treasury Note | | | 1.00 | | | | 8-31-2016 | | | | 13,565,000 | | | | 13,638,658 | |
U.S. Treasury Note | | | 1.00 | | | | 3-15-2018 | | | | 9,655,000 | | | | 9,665,186 | |
U.S. Treasury Note | | | 1.00 | | | | 5-31-2018 | | | | 10,335,000 | | | | 10,326,660 | |
U.S. Treasury Note | | | 1.38 | | | | 7-31-2018 | | | | 4,290,000 | | | | 4,327,036 | |
U.S. Treasury Note | | | 1.38 | | | | 4-30-2020 | | | | 2,540,000 | | | | 2,524,191 | |
U.S. Treasury Note | | | 1.63 | | | | 7-31-2020 | | | | 2,005,000 | | | | 2,011,683 | |
U.S. Treasury Note | | | 2.13 | | | | 6-30-2022 | | | | 3,740,000 | | | | 3,788,407 | |
U.S. Treasury Note | | | 2.13 | | | | 5-15-2025 | | | | 5,250,000 | | | | 5,202,971 | |
U.S. Treasury Note | | | 2.25 | | | | 7-31-2018 | | | | 17,585,000 | | | | 18,178,951 | |
| | | | |
Total U.S. Treasury Securities (Cost $112,607,068) | | | | | | | | | | | | | | | 113,874,294 | |
| | | | | | | | | | | | | | | | |
| | | | |
Yankee Corporate Bonds and Notes: 6.67% | | | | | | | | | | | | | | | | |
| | | | |
Consumer Discretionary: 0.46% | | | | | | | | | | | | | | | | |
| | | | |
| Automobiles: 0.18% | | | | | | | | | | | | | | | | |
Fiat Chrysler Automobiles | | | 5.25 | | | | 4-15-2023 | | | | 980,000 | | | | 968,975 | |
| | | | | | | | | | | | | | | | |
| | | | |
| Media: 0.28% | | | | | | | | | | | | | | | | |
Myriad International Holdings BV 144A | | | 6.38 | | | | 7-28-2017 | | | | 1,445,000 | | | | 1,532,316 | |
| | | | | | | | | | | | | | | | |
| | | | |
Consumer Staples: 0.14% | | | | | | | | | | | | | | | | |
| | | | |
| Food Products: 0.14% | | | | | | | | | | | | | | | | |
BRF SA 144A | | | 3.95 | | | | 5-22-2023 | | | | 795,000 | | | | 749,288 | |
| | | | | | | | | | | | | | | | |
| | | | |
Energy: 1.02% | | | | | | | | | | | | | | | | |
| | | | |
| Energy Equipment & Services: 0.72% | | | | | | | | | | | | | | | | |
Ensco plc | | | 4.70 | | | | 3-15-2021 | | | | 2,605,000 | | | | 2,385,203 | |
Ensco plc « | | | 5.20 | | | | 3-15-2025 | | | | 650,000 | | | | 580,857 | |
Noble Holding International Limited | | | 6.95 | | | | 4-1-2045 | | | | 1,190,000 | | | | 963,052 | |
| | | | |
| | | | | | | | | | | | | | | 3,929,112 | |
| | | | | | | | | | | | | | | | |
| | | | |
| Oil, Gas & Consumable Fuels: 0.30% | | | | | | | | | | | | | | | | |
Ecopetrol SA | | | 4.13 | | | | 1-16-2025 | | | | 1,860,000 | | | | 1,639,032 | |
| | | | | | | | | | | | | | | | |
| | | | |
Financials: 2.71% | | | | | | | | | | | | | | | | |
| | | | |
| Banks: 2.03% | | | | | | | | | | | | | | | | |
BBVA Bancomer SA 144A | | | 4.50 | | | | 3-10-2016 | | | | 1,720,000 | | | | 1,742,360 | |
BPCE SA 144A | | | 5.15 | | | | 7-21-2024 | | | | 2,005,000 | | | | 2,032,068 | |
Credit Agricole SA 144A | | | 4.38 | | | | 3-17-2025 | | | | 1,820,000 | | | | 1,767,140 | |
HSBC Holdings plc ± | | | 6.38 | | | | 12-29-2049 | | | | 1,290,000 | | | | 1,281,938 | |
The accompanying notes are an integral part of these financial statements.
| | | | | | |
| Portfolio of investments—August 31, 2015 | | Wells Fargo Advantage Income Plus Fund | | | 17 | |
| | | | | | | | | | | | | | | | |
| Security name | | Interest rate | | | Maturity date | | | Principal | | | Value | |
| | | | |
| Banks (continued) | | | | | | | | | | | | | | | | |
Nordea Bank AB ±144A | | | 5.50 | % | | | 12-31-2049 | | | $ | 1,800,000 | | | $ | 1,782,000 | |
Rabobank Nederland | | | 4.38 | | | | 8-4-2025 | | | | 1,160,000 | | | | 1,163,178 | |
Royal Bank of Scotland Group plc | | | 5.13 | | | | 5-28-2024 | | | | 1,295,000 | | | | 1,305,789 | |
| | | | |
| | | | | | | | | | | | | | | 11,074,473 | |
| | | | | | | | | | | | | | | | |
| | | | |
| Capital Markets: 0.48% | | | | | | | | | | | | | | | | |
Macquarie Group Limited 144A | | | 6.00 | | | | 1-14-2020 | | | | 2,365,000 | | | | 2,647,329 | |
| | | | | | | | | | | | | | | | |
| | | | |
| Diversified Financial Services: 0.20% | | | | | | | | | | | | | | | | |
Schaeffler Finance BV 144A | | | 4.75 | | | | 5-15-2023 | | | | 1,120,000 | | | | 1,078,000 | |
| | | | | | | | | | | | | | | | |
| | | | |
Health Care: 0.13% | | | | | | | | | | | | | | | | |
| | | | |
| Pharmaceuticals: 0.13% | | | | | | | | | | | | | | | | |
Valeant Pharmaceuticals International Incorporated 144A | | | 7.50 | | | | 7-15-2021 | | | | 650,000 | | | | 697,938 | |
| | | | | | | | | | | | | | | | |
| | | | |
Information Technology: 0.33% | | | | | | | | | | | | | | | | |
| | | | |
| Technology Hardware, Storage & Peripherals: 0.33% | | | | | | | | | | | | | | | | |
Seagate Technology HDD Holdings | | | 4.75 | | | | 1-1-2025 | | | | 1,915,000 | | | | 1,819,754 | |
| | | | | | | | | | | | | | | | |
| | | | |
Materials: 0.61% | | | | | | | | | | | | | | | | |
| | | | |
| Chemicals: 0.31% | | | | | | | | | | | | | | | | |
Agrium Incorporated | | | 4.13 | | | | 3-15-2035 | | | | 1,955,000 | | | | 1,706,952 | |
| | | | | | | | | | | | | | | | |
| | | | |
| Metals & Mining: 0.30% | | | | | | | | | | | | | | | | |
ArcelorMittal SA | | | 6.13 | | | | 6-1-2018 | | | | 1,565,000 | | | | 1,627,600 | |
| | | | | | | | | | | | | | | | |
| | | | |
Telecommunication Services: 0.55% | | | | | | | | | | | | | | | | |
| | | | |
| Diversified Telecommunication Services: 0.15% | | | | | | | | | | | | | | | | |
Virgin Media Finance plc 144A | | | 6.38 | | | | 4-15-2023 | | | | 815,000 | | | | 847,087 | |
| | | | | | | | | | | | | | | | |
| | | | |
| Wireless Telecommunication Services: 0.40% | | | | | | | | | | | | | | | | |
Globo Communicacoes Participacoes SA 144A | | | 4.88 | | | | 4-11-2022 | | | | 2,145,000 | | | | 2,171,813 | |
| | | | | | | | | | | | | | | | |
| | | | |
Utilities: 0.72% | | | | | | | | | | | | | | | | |
| | | | |
| Electric Utilities: 0.72% | | | | | | | | | | | | | | | | |
Comision Federal de Electricidad 144A | | | 6.13 | | | | 6-16-2045 | | | | 1,030,000 | | | | 1,027,425 | |
Western Power Distributions Holdings Limited 144A | | | 7.38 | | | | 12-15-2028 | | | | 2,265,000 | | | | 2,887,141 | |
| | | | |
| | | | | | | | | | | | | | | 3,914,566 | |
| | | | | | | | | | | | | | | | |
| | | | |
Total Yankee Corporate Bonds and Notes (Cost $36,507,067) | | | | | | | | | | | | | | | 36,404,235 | |
| | | | | | | | | | | | | | | | |
| | | | |
| | | Yield | | | | | | Shares | | | | |
| Short-Term Investments: 24.41% | | | | | | | | | | | | | | | | |
| | | | |
| Investment Companies: 24.26% | | | | | | | | | | | | | | | | |
Securities Lending Cash Investments, LLC (l)(r)(u) | | | 0.15 | | | | | | | | 578,250 | | | | 578,250 | |
Wells Fargo Advantage Cash Investment Money Market Fund, Select Class (l)(u)## | | | 0.15 | | | | | | | | 131,791,787 | | | | 131,791,787 | |
| | | | |
| | | | | | | | | | | | | | | 132,370,037 | |
| | | | | | | | | | | | | | | | |
The accompanying notes are an integral part of these financial statements.
| | | | |
| 18 | | Wells Fargo Advantage Income Plus Fund | | Portfolio of investments—August 31, 2015 |
| | | | | | | | | | | | | | | | |
| Security name | | Yield | | | Maturity date | | | Principal | | | Value | |
| | | | |
| U.S. Treasury Securities: 0.15% | | | | | | | | | | | | | | | | |
U.S. Treasury Bill (z)# | | | 0.01 | % | | | 9-17-2015 | | | $ | 825,000 | | | $ | 824,999 | |
| | | | | | | | | | | | | | | | |
| | | | |
Total Short-Term Investments (Cost $133,195,034) | | | | | | | | | | | | | | | 133,195,036 | |
| | | | | | | | | | | | | | | | |
| | | | | | | | |
| Total investments in securities (Cost $637,647,713) * | | | 117.68 | % | | | 642,268,988 | |
Other assets and liabilities, net | | | (17.68 | ) | | | (96,494,018 | ) |
| | | | | | | | |
| Total net assets | | | 100.00 | % | | $ | 545,774,970 | |
| | | | | | | | |
| ± | Variable rate investment. The rate shown is the rate in effect at period end. |
| %% | The security is issued on a when-issued basis. |
| 144A | The security may be resold in transactions exempt from registration, normally to qualified institutional buyers, pursuant to Rule 144A under the Securities Act of 1933. |
| (c) | Investment in an interest-only security entitles holders to receive only the interest payments on the underlying mortgages. The principal amount shown is the notional amount of the underlying mortgages. The rate represents the coupon rate. |
| ¤ | The security is issued in zero coupon form with no periodic interest payments. |
| (s) | The security is currently in default with regards to scheduled interest and/or principal payments. The Fund has stopped accruing interest on the security. |
| (i) | Illiquid security for which the designation as illiquid is unaudited. |
| « | All or a portion of this security is on loan. |
| (l) | The security represents an affiliate of the Fund as defined in the Investment Company Act of 1940. |
| (r) | The investment is a non-registered investment vehicle purchased with cash collateral received from securities on loan. |
| (u) | The rate represents the 7-day annualized yield at period end. |
| ## | All or a portion of this security is segregated for when-issued securities. |
| (z) | Zero coupon security. The rate represents the current yield to maturity. |
| # | All or a portion of this security is segregated as collateral for investments in derivative instruments. |
| * | Cost for federal income tax purposes is $637,877,660 and unrealized gains (losses) consists of: |
| | | | |
Gross unrealized gains | | $ | 10,543,571 | |
Gross unrealized losses | | | (6,152,243 | ) |
| | | | |
Net unrealized gains | | $ | 4,391,328 | |
The accompanying notes are an integral part of these financial statements.
| | | | | | |
| Statement of assets and liabilities—August 31, 2015 | | Wells Fargo Advantage Income Plus Fund | | | 19 | |
| | | | |
| | | | |
| |
Assets | | | | |
Investments | | | | |
In unaffiliated securities (including $566,826 of securities loaned), at value (cost $505,277,676) | | $ | 509,898,951 | |
In affiliated securities, at value (cost $132,370,037) | | | 132,370,037 | |
| | | | |
Total investments, at value (cost $637,647,713) | | | 642,268,988 | |
Principal paydown receivable | | | 2,322 | |
Receivable for Fund shares sold | | | 851,766 | |
Receivable for interest | | | 3,919,650 | |
Receivable for daily variation margin on open futures contracts | | | 22,500 | |
Receivable for securities lending income | | | 409 | |
Prepaid expenses and other assets | | | 196,001 | |
| | | | |
Total assets | | | 647,261,636 | |
| | | | |
| |
Liabilities | | | | |
Payable for investments purchased | | | 99,968,840 | |
Payable for Fund shares redeemed | | | 360,943 | |
Payable upon receipt of securities loaned | | | 578,250 | |
Payable for daily variation margin on open futures contracts | | | 118,469 | |
Management fee payable | | | 173,561 | |
Distribution fees payable | | | 13,371 | |
Administration fees payable | | | 70,731 | |
Accrued expenses and other liabilities | | | 202,501 | |
| | | | |
Total liabilities | | | 101,486,666 | |
| | | | |
Total net assets | | $ | 545,774,970 | |
| | | | |
| |
NET ASSETS CONSIST OF | | | | |
Paid-in capital | | $ | 552,437,582 | |
Undistributed net investment income | | | 164,350 | |
Accumulated net realized losses on investments | | | (11,081,175 | ) |
Net unrealized gains on investments | | | 4,254,213 | |
| | | | |
Total net assets | | $ | 545,774,970 | |
| | | | |
| |
COMPUTATION OF NET ASSET VALUE AND OFFERING PRICE PER SHARE | | | | |
Net assets – Class A | | $ | 223,755,362 | |
Shares outstanding – Class A1 | | | 18,426,088 | |
Net asset value per share – Class A | | | $12.14 | |
Maximum offering price per share – Class A2 | | | $12.71 | |
Net assets – Class B | | $ | 389,136 | |
Shares outstanding – Class B1 | | | 31,956 | |
Net asset value per share – Class B | | | $12.18 | |
Net assets – Class C | | $ | 20,380,781 | |
Shares outstanding – Class C1 | | | 1,678,673 | |
Net asset value per share – Class C | | | $12.14 | |
Net assets – Administrator Class | | $ | 85,430,516 | |
Shares outstanding – Administrator Class1 | | | 7,046,292 | |
Net asset value per share – Administrator Class | | | $12.12 | |
Net assets – Institutional Class | | $ | 54,418,994 | |
Shares outstanding – Institutional Class1 | | | 4,477,331 | |
Net asset value per share – Institutional Class | | | $12.15 | |
Net assets – Investor Class | | $ | 161,400,181 | |
Shares outstanding – Investor Class1 | | | 13,291,717 | |
Net asset value per share – Investor Class | | | $12.14 | |
| 1 | The Fund has an unlimited number of authorized shares. |
| 2 | Maximum offering price is computed as 100/95.50 of net asset value. On investments of $50,000 or more, the offering price is reduced. |
The accompanying notes are an integral part of these financial statements.
| | | | |
| 20 | | Wells Fargo Advantage Income Plus Fund | | Statement of operations—year ended August 31, 2015 |
| | | | |
| | | | |
| |
Investment income | | | | |
Interest | | $ | 13,303,048 | |
Income from affiliated securities | | | 134,306 | |
Securities lending income, net | | | 7,945 | |
| | | | |
Total investment income | | | 13,445,299 | |
| | | | |
| |
Expenses | | | | |
Management fee | | | 2,376,744 | |
Administration fees | | | | |
Class A | | | 298,991 | |
Class B | | | 928 | |
Class C | | | 35,438 | |
Administrator Class | | | 98,055 | |
Institutional Class | | | 44,913 | |
Investor Class | | | 316,044 | |
Shareholder servicing fees | | | | |
Class A | | | 467,173 | |
Class B | | | 1,449 | |
Class C | | | 55,371 | |
Administrator Class | | | 245,137 | |
Investor Class | | | 406,929 | |
Distribution fees | | | | |
Class B | | | 4,348 | |
Class C | | | 166,113 | |
Custody and accounting fees | | | 38,914 | |
Professional fees | | | 64,384 | |
Registration fees | | | 80,298 | |
Shareholder report expenses | | | 66,099 | |
Trustees’ fees and expenses | | | 10,811 | |
Other fees and expenses | | | 16,088 | |
| | | | |
Total expenses | | | 4,794,227 | |
Less: Fee waivers and/or expense reimbursements | | | (418,274 | ) |
| | | | |
Net expenses | | | 4,375,953 | |
| | | | |
Net investment income | | | 9,069,346 | |
| | | | |
| |
REALIZED AND UNREALIZED GAINS (LOSSES) ON INVESTMENTS | | | | |
| |
Net realized gains on: | | | | |
Unaffiliated securities | | | 6,445,411 | |
Futures transactions | | | 1,675,910 | |
| | | | |
Net realized gains on investments | | | 8,121,321 | |
| | | | |
| |
Net change in unrealized gains (losses) on: | | | | |
Unaffiliated securities | | | (11,228,514 | ) |
Futures transactions | | | (420,063 | ) |
| | | | |
Net change in unrealized gains (losses) on investments | | | (11,648,577 | ) |
| | | | |
Net realized and unrealized gains (losses) on investments | | | (3,527,256 | ) |
| | | | |
Net increase in net assets resulting from operations | | $ | 5,542,090 | |
| | | | |
The accompanying notes are an integral part of these financial statements.
| | | | | | |
| Statement of changes in net assets | | Wells Fargo Advantage Income Plus Fund | | | 21 | |
| | | | | | | | | | | | | | | | |
| | | Year ended
August 31, 2015 | | | Year ended
August 31, 2014 | |
| | | | |
Operations | | | | | | | | | | | | | | | | |
Net investment income | | | | | | $ | 9,069,346 | | | | | | | $ | 9,774,480 | |
Net realized gains on investments | | | | | | | 8,121,321 | | | | | | | | 10,554,149 | |
Net change in unrealized gains (losses) on investments | | | | | | | (11,648,577 | ) | | | | | | | 11,729,731 | |
| | | | |
Net increase in net assets resulting from operations | | | | | | | 5,542,090 | | | | | | | | 32,058,360 | |
| | | | |
| | | | |
Distributions to shareholders from | | | | | | | | | | | | | | | | |
Net investment income | | | | | | | | | | | | | | | | |
Class A | | | | | | | (3,199,153 | ) | | | | | | | (2,785,204 | ) |
Class B | | | | | | | (5,109 | ) | | | | | | | (13,132 | ) |
Class C | | | | | | | (204,128 | ) | | | | | | | (338,257 | ) |
Administrator Class | | | | | | | (1,758,958 | ) | | | | | | | (2,257,480 | ) |
Institutional Class | | | | | | | (1,097,205 | ) | | | | | | | (736,477 | ) |
Investor Class | | | | | | | (2,779,423 | ) | | | | | | | (3,450,416 | ) |
Net realized gains | | | | | | | | | | | | | | | | |
Class A | | | | | | | (280,520 | ) | | | | | | | 0 | |
Class B | | | | | | | (1,076 | ) | | | | | | | 0 | |
Class C | | | | | | | (36,727 | ) | | | | | | | 0 | |
Administrator Class | | | | | | | (161,370 | ) | | | | | | | 0 | |
Institutional Class | | | | | | | (105,379 | ) | | | | | | | 0 | |
Investor Class | | | | | | | (272,008 | ) | | | | | | | 0 | |
| | | | |
Total distributions to shareholders | | | | | | | (9,901,056 | ) | | | | | | | (9,580,966 | ) |
| | | | |
| | | | |
Capital share transactions | | | Shares | | | | | | | | Shares | | | | | |
Proceeds from shares sold | | | | | | | | | | | | | | | | |
Class A | | | 11,032,995 | | | | 135,376,151 | | | | 1,160,901 | | | | 13,868,244 | |
Class B | | | 3,027 | | | | 37,063 | | | | 1,314 | | | | 15,572 | |
Class C | | | 178,733 | | | | 2,193,314 | | | | 121,464 | | | | 1,456,327 | |
Administrator Class | | | 3,503,950 | | | | 43,239,853 | | | | 1,398,185 | | | | 16,701,941 | |
Institutional Class | | | 2,939,036 | | | | 35,874,535 | | | | 492,530 | | | | 5,877,370 | |
Investor Class | | | 1,859,847 | | | | 22,905,250 | | | | 1,209,453 | | | | 14,530,064 | |
| | | | |
| | | | | | | 239,626,166 | | | | | | | | 52,449,518 | |
| | | | |
Reinvestment of distributions | | | | | | | | | | | | | | | | |
Class A | | | 261,460 | | | | 3,206,823 | | | | 200,967 | | | | 2,404,891 | |
Class B | | | 467 | | | | 5,740 | | | | 1,010 | | | | 12,092 | |
Class C | | | 14,426 | | | | 176,818 | | | | 21,094 | | | | 252,249 | |
Administrator Class | | | 156,012 | | | | 1,910,601 | | | | 186,098 | | | | 2,223,323 | |
Institutional Class | | | 91,910 | | | | 1,128,770 | | | | 55,722 | | | | 667,499 | |
Investor Class | | | 231,754 | | | | 2,842,217 | | | | 264,594 | | | | 3,166,726 | |
| | | | |
| | | | | | | 9,270,969 | | | | | | | | 8,726,780 | |
| | | | |
Payment for shares redeemed | | | | | | | | | | | | | | | | |
Class A | | | (3,464,196 | ) | | | (42,471,695 | ) | | | (3,358,614 | ) | | | (40,016,695 | ) |
Class B | | | (32,941 | ) | | | (404,956 | ) | | | (77,587 | ) | | | (923,855 | ) |
Class C | | | (494,066 | ) | | | (6,052,812 | ) | | | (710,658 | ) | | | (8,466,146 | ) |
Administrator Class | | | (4,935,292 | ) | | | (60,666,579 | ) | | | (2,289,649 | ) | | | (27,320,284 | ) |
Institutional Class | | | (1,202,777 | ) | | | (14,829,017 | ) | | | (574,594 | ) | | | (6,862,926 | ) |
Investor Class | | | (2,576,230 | ) | | | (31,581,304 | ) | | | (2,494,085 | ) | | | (29,776,812 | ) |
| | | | |
| | | | | | | (156,006,363 | ) | | | | | | | (113,366,718 | ) |
| | | | |
Net increase (decrease) in net assets resulting from capital share transactions | | | | | | | 92,890,772 | | | | | | | | (52,190,420 | ) |
| | | | |
Total increase (decrease) in net assets | | | | | | | 88,531,806 | | | | | | | | (29,713,026 | ) |
| | | | |
| | | | |
Net assets | | | | | | | | | | | | | | | | |
Beginning of period | | | | | | | 457,243,164 | | | | | | | | 486,956,190 | |
| | | | |
End of period | | | | | | $ | 545,774,970 | | | | | | | $ | 457,243,164 | |
| | | | |
Undistributed net investment income | | | | | | $ | 164,350 | | | | | | | $ | 138,830 | |
| | | | |
The accompanying notes are an integral part of these financial statements.
| | | | |
| 22 | | Wells Fargo Advantage Income Plus Fund | | Financial highlights |
(For a share outstanding throughout each period)
| | | | | | | | | | | | | | | | | | | | |
| | | Year ended August 31 | |
| CLASS A | | 2015 | | | 2014 | | | 2013 | | | 2012 | | | 2011 | |
Net asset value, beginning of period | | | $12.24 | | | | $11.66 | | | | $12.57 | | | | $12.04 | | | | $12.00 | |
Net investment income | | | 0.21 | 1 | | | 0.26 | | | | 0.25 | | | | 0.30 | | | | 0.37 | 1 |
Net realized and unrealized gains (losses) on investments | | | (0.08 | ) | | | 0.57 | | | | (0.51 | ) | | | 0.55 | | | | 0.18 | |
| | | | | | | | | | | | | | | | | | | | |
Total from investment operations | | | 0.13 | | | | 0.83 | | | | (0.26 | ) | | | 0.85 | | | | 0.55 | |
Distributions to shareholders from | | | | | | | | | | | | | | | | | | | | |
Net investment income | | | (0.21 | ) | | | (0.25 | ) | | | (0.25 | ) | | | (0.29 | ) | | | (0.42 | ) |
Net realized gains | | | (0.02 | ) | | | 0.00 | | | | (0.40 | ) | | | (0.03 | ) | | | (0.09 | ) |
| | | | | | | | | | | | | | | | | | | | |
Total distributions to shareholders | | | (0.23 | ) | | | (0.25 | ) | | | (0.65 | ) | | | (0.32 | ) | | | (0.51 | ) |
Net asset value, end of period | | | $12.14 | | | | $12.24 | | | | $11.66 | | | | $12.57 | | | | $12.04 | |
Total return2 | | | 1.04 | % | | | 7.16 | % | | | (2.25 | )% | | | 7.19 | % | | | 4.76 | % |
Ratios to average net assets (annualized) | | | | | | | | | | | | | | | | | | | | |
Gross expenses | | | 0.91 | % | | | 0.93 | % | | | 0.91 | % | | | 0.89 | % | | | 0.88 | % |
Net expenses | | | 0.84 | % | | | 0.85 | % | | | 0.87 | % | | | 0.88 | % | | | 0.88 | % |
Net investment income | | | 1.69 | % | | | 2.10 | % | | | 2.00 | % | | | 2.42 | % | | | 3.17 | % |
Supplemental data | | | | | | | | | | | | | | | | | | | | |
Portfolio turnover rate | | | 322 | % | | | 267 | % | | | 256 | % | | | 256 | % | | | 215 | % |
Net assets, end of period (000s omitted) | | | $223,755 | | | | $129,646 | | | | $146,836 | | | | $172,577 | | | | $163,499 | |
| 1 | Calculated based upon average shares outstanding |
| 2 | Total return calculations do not include any sales charges. |
The accompanying notes are an integral part of these financial statements.
| | | | | | |
| Financial highlights | | Wells Fargo Advantage Income Plus Fund | | | 23 | |
(For a share outstanding throughout each period)
| | | | | | | | | | | | | | | | | | | | |
| | | Year ended August 31 | |
| CLASS B | | 2015 | | | 2014 | | | 2013 | | | 2012 | | | 2011 | |
Net asset value, beginning of period | | | $12.26 | | | | $11.68 | | | | $12.59 | | | | $12.05 | | | | $12.01 | |
Net investment income | | | 0.12 | 1 | | | 0.16 | 1 | | | 0.15 | 1 | | | 0.21 | 1 | | | 0.29 | 1 |
Net realized and unrealized gains (losses) on investments | | | (0.07 | ) | | | 0.57 | | | | (0.51 | ) | | | 0.56 | | | | 0.17 | |
| | | | | | | | | | | | | | | | | | | | |
Total from investment operations | | | 0.05 | | | | 0.73 | | | | (0.36 | ) | | | 0.77 | | | | 0.46 | |
Distributions to shareholders from | | | | | | | | | | | | | | | | | | | | |
Net investment income | | | (0.11 | ) | | | (0.15 | ) | | | (0.15 | ) | | | (0.20 | ) | | | (0.33 | ) |
Net realized gains | | | (0.02 | ) | | | 0.00 | | | | (0.40 | ) | | | (0.03 | ) | | | (0.09 | ) |
| | | | | | | | | | | | | | | | | | | | |
Total distributions to shareholders | | | (0.13 | ) | | | (0.15 | ) | | | (0.55 | ) | | | (0.23 | ) | | | (0.42 | ) |
Net asset value, end of period | | | $12.18 | | | | $12.26 | | | | $11.68 | | | | $12.59 | | | | $12.05 | |
Total return2 | | | 0.39 | % | | | 6.30 | % | | | (3.00 | )% | | | 6.45 | % | | | 3.97 | % |
Ratios to average net assets (annualized) | | | | | | | | | | | | | | | | | | | | |
Gross expenses | | | 1.66 | % | | | 1.68 | % | | | 1.66 | % | | | 1.63 | % | | | 1.63 | % |
Net expenses | | | 1.59 | % | | | 1.60 | % | | | 1.62 | % | | | 1.62 | % | | | 1.63 | % |
Net investment income | | | 0.95 | % | | | 1.35 | % | | | 1.24 | % | | | 1.71 | % | | | 2.40 | % |
Supplemental data | | | | | | | | | | | | | | | | | | | | |
Portfolio turnover rate | | | 322 | % | | | 267 | % | | | 256 | % | | | 256 | % | | | 215 | % |
Net assets, end of period (000s omitted) | | | $389 | | | | $753 | | | | $1,597 | | | | $2,823 | | | | $4,054 | |
| 1 | Calculated based upon average shares outstanding |
| 2 | Total return calculations do not include any sales charges. |
The accompanying notes are an integral part of these financial statements.
| | | | |
| 24 | | Wells Fargo Advantage Income Plus Fund | | Financial highlights |
(For a share outstanding throughout each period)
| | | | | | | | | | | | | | | | | | | | |
| | | Year ended August 31 | |
| CLASS C | | 2015 | | | 2014 | | | 2013 | | | 2012 | | | 2011 | |
Net asset value, beginning of period | | | $12.23 | | | | $11.65 | | | | $12.56 | | | | $12.03 | | | | $12.00 | |
Net investment income | | | 0.12 | 1 | | | 0.16 | | | | 0.15 | | | | 0.21 | | | | 0.29 | 1 |
Net realized and unrealized gains (losses) on investments | | | (0.08 | ) | | | 0.58 | | | | (0.51 | ) | | | 0.55 | | | | 0.16 | |
| | | | | | | | | | | | | | | | | | | | |
Total from investment operations | | | 0.04 | | | | 0.74 | | | | (0.36 | ) | | | 0.76 | | | | 0.45 | |
Distributions to shareholders from | | | | | | | | | | | | | | | | | | | | |
Net investment income | | | (0.11 | ) | | | (0.16 | ) | | | (0.15 | ) | | | (0.20 | ) | | | (0.33 | ) |
Net realized gains | | | (0.02 | ) | | | 0.00 | | | | (0.40 | ) | | | (0.03 | ) | | | (0.09 | ) |
| | | | | | | | | | | | | | | | | | | | |
Total distributions to shareholders | | | (0.13 | ) | | | (0.16 | ) | | | (0.55 | ) | | | (0.23 | ) | | | (0.42 | ) |
Net asset value, end of period | | | $12.14 | | | | $12.23 | | | | $11.65 | | | | $12.56 | | | | $12.03 | |
Total return2 | | | 0.35 | % | | | 6.35 | % | | | (3.00 | )% | | | 6.40 | % | | | 3.92 | % |
Ratios to average net assets (annualized) | | | | | | | | | | | | | | | | | | | | |
Gross expenses | | | 1.66 | % | | | 1.68 | % | | | 1.66 | % | | | 1.64 | % | | | 1.63 | % |
Net expenses | | | 1.59 | % | | | 1.60 | % | | | 1.62 | % | | | 1.63 | % | | | 1.63 | % |
Net investment income | | | 0.95 | % | | | 1.35 | % | | | 1.24 | % | | | 1.65 | % | | | 2.41 | % |
Supplemental data | | | | | | | | | | | | | | | | | | | | |
Portfolio turnover rate | | | 322 | % | | | 267 | % | | | 256 | % | | | 256 | % | | | 215 | % |
Net assets, end of period (000s omitted) | | | $20,381 | | | | $24,212 | | | | $29,692 | | | | $41,259 | | | | $30,364 | |
| 1 | Calculated based upon average shares outstanding |
| 2 | Total return calculations do not include any sales charges. |
The accompanying notes are an integral part of these financial statements.
| | | | | | |
| Financial highlights | | Wells Fargo Advantage Income Plus Fund | | | 25 | |
(For a share outstanding throughout each period)
| | | | | | | | | | | | | | | | | | | | |
| | | Year ended August 31 | |
| ADMINISTRATOR CLASS | | 2015 | | | 2014 | | | 2013 | | | 2012 | | | 2011 | |
Net asset value, beginning of period | | | $12.22 | | | | $11.64 | | | | $12.55 | | | | $12.02 | | | | $12.00 | |
Net investment income | | | 0.22 | | | | 0.27 | 1 | | | 0.26 | 1 | | | 0.33 | | | | 0.39 | 1 |
Net realized and unrealized gains (losses) on investments | | | (0.08 | ) | | | 0.57 | | | | (0.51 | ) | | | 0.54 | | | | 0.16 | |
| | | | | | | | | | | | | | | | | | | | |
Total from investment operations | | | 0.14 | | | | 0.84 | | | | (0.25 | ) | | | 0.87 | | | | 0.55 | |
Distributions to shareholders from | | | | | | | | | | | | | | | | | | | | |
Net investment income | | | (0.22 | ) | | | (0.26 | ) | | | (0.26 | ) | | | (0.31 | ) | | | (0.44 | ) |
Net realized gains | | | (0.02 | ) | | | 0.00 | | | | (0.40 | ) | | | (0.03 | ) | | | (0.09 | ) |
| | | | | | | | | | | | | | | | | | | | |
Total distributions to shareholders | | | (0.24 | ) | | | (0.26 | ) | | | (0.66 | ) | | | (0.34 | ) | | | (0.53 | ) |
Net asset value, end of period | | | $12.12 | | | | $12.22 | | | | $11.64 | | | | $12.55 | | | | $12.02 | |
Total return | | | 1.15 | % | | | 7.31 | % | | | (2.11 | )% | | | 7.37 | % | | | 4.82 | % |
Ratios to average net assets (annualized) | | | | | | | | | | | | | | | | | | | | |
Gross expenses | | | 0.85 | % | | | 0.87 | % | | | 0.85 | % | | | 0.83 | % | | | 0.82 | % |
Net expenses | | | 0.72 | % | | | 0.72 | % | | | 0.72 | % | | | 0.73 | % | | | 0.75 | % |
Net investment income | | | 1.82 | % | | | 2.24 | % | | | 2.14 | % | | | 2.53 | % | | | 3.29 | % |
Supplemental data | | | | | | | | | | | | | | | | | | | | |
Portfolio turnover rate | | | 322 | % | | | 267 | % | | | 256 | % | | | 256 | % | | | 215 | % |
Net assets, end of period (000s omitted) | | | $85,431 | | | | $101,653 | | | | $105,094 | | | | $162,067 | | | | $90,063 | |
| 1 | Calculated based upon average shares outstanding |
The accompanying notes are an integral part of these financial statements.
| | | | |
| 26 | | Wells Fargo Advantage Income Plus Fund | | Financial highlights |
(For a share outstanding throughout each period)
| | | | | | | | | | | | | | | | | | | | |
| | | Year ended August 31 | |
| INSTITUTIONAL CLASS | | 2015 | | | 2014 | | | 2013 | | | 2012 | | | 2011 | |
Net asset value, beginning of period | | | $12.24 | | | | $11.67 | | | | $12.57 | | | | $12.03 | | | | $12.00 | |
Net investment income | | | 0.24 | 1 | | | 0.28 | | | | 0.27 | 1 | | | 0.34 | | | | 0.41 | 1 |
Net realized and unrealized gains (losses) on investments | | | (0.07 | ) | | | 0.57 | | | | (0.49 | ) | | | 0.56 | | | | 0.17 | |
| | | | | | | | | | | | | | | | | | | | |
Total from investment operations | | | 0.17 | | | | 0.85 | | | | (0.22 | ) | | | 0.90 | | | | 0.58 | |
Distributions to shareholders from | | | | | | | | | | | | | | | | | | | | |
Net investment income | | | (0.24 | ) | | | (0.28 | ) | | | (0.28 | ) | | | (0.33 | ) | | | (0.46 | ) |
Net realized gains | | | (0.02 | ) | | | 0.00 | | | | (0.40 | ) | | | (0.03 | ) | | | (0.09 | ) |
| | | | | | | | | | | | | | | | | | | | |
Total distributions to shareholders | | | (0.26 | ) | | | (0.28 | ) | | | (0.68 | ) | | | (0.36 | ) | | | (0.55 | ) |
Net asset value, end of period | | | $12.15 | | | | $12.24 | | | | $11.67 | | | | $12.57 | | | | $12.03 | |
Total return | | | 1.37 | % | | | 7.36 | % | | | (1.89 | )% | | | 7.62 | % | | | 5.04 | % |
Ratios to average net assets (annualized) | | | | | | | | | | | | | | | | | | | | |
Gross expenses | | | 0.58 | % | | | 0.60 | % | | | 0.56 | % | | | 0.56 | % | | | 0.55 | % |
Net expenses | | | 0.58 | % | | | 0.58 | % | | | 0.56 | % | | | 0.56 | % | | | 0.55 | % |
Net investment income | | | 1.95 | % | | | 2.38 | % | | | 2.26 | % | | | 2.74 | % | | | 3.53 | % |
Supplemental data | | | | | | | | | | | | | | | | | | | | |
Portfolio turnover rate | | | 322 | % | | | 267 | % | | | 256 | % | | | 256 | % | | | 215 | % |
Net assets, end of period (000s omitted) | | | $54,419 | | | | $32,438 | | | | $31,221 | | | | $161,191 | | | | $161,276 | |
| 1 | Calculated based upon average shares outstanding |
The accompanying notes are an integral part of these financial statements.
| | | | | | |
| Financial highlights | | Wells Fargo Advantage Income Plus Fund | | | 27 | |
(For a share outstanding throughout each period)
| | | | | | | | | | | | | | | | | | | | |
| | | Year ended August 31 | |
| INVESTOR CLASS | | 2015 | | | 2014 | | | 2013 | | | 2012 | | | 2011 | |
Net asset value, beginning of period | | | $12.23 | | | | $11.66 | | | | $12.57 | | | | $12.03 | | | | $12.00 | |
Net investment income | | | 0.21 | | | | 0.25 | | | | 0.24 | | | | 0.30 | | | | 0.37 | 1 |
Net realized and unrealized gains (losses) on investments | | | (0.08 | ) | | | 0.57 | | | | (0.51 | ) | | | 0.56 | | | | 0.17 | |
| | | | | | | | | | | | | | | | | | | | |
Total from investment operations | | | 0.13 | | | | 0.82 | | | | (0.27 | ) | | | 0.86 | | | | 0.54 | |
Distributions to shareholders from | | | | | | | | | | | | | | | | | | | | |
Net investment income | | | (0.20 | ) | | | (0.25 | ) | | | (0.24 | ) | | | (0.29 | ) | | | (0.42 | ) |
Net realized gains | | | (0.02 | ) | | | 0.00 | | | | (0.40 | ) | | | (0.03 | ) | | | (0.09 | ) |
| | | | | | | | | | | | | | | | | | | | |
Total distributions to shareholders | | | (0.22 | ) | | | (0.25 | ) | | | (0.64 | ) | | | (0.32 | ) | | | (0.51 | ) |
Net asset value, end of period | | | $12.14 | | | | $12.23 | | | | $11.66 | | | | $12.57 | | | | $12.03 | |
Total return | | | 1.10 | % | | | 7.06 | % | | | (2.26 | )% | | | 7.25 | % | | | 4.67 | % |
Ratios to average net assets (annualized) | | | | | | | | | | | | | | | | | | | | |
Gross expenses | | | 0.93 | % | | | 0.95 | % | | | 0.93 | % | | | 0.91 | % | | | 0.90 | % |
Net expenses | | | 0.85 | % | | | 0.86 | % | | | 0.89 | % | | | 0.90 | % | | | 0.90 | % |
Net investment income | | | 1.69 | % | | | 2.10 | % | | | 1.98 | % | | | 2.40 | % | | | 3.14 | % |
Supplemental data | | | | | | | | | | | | | | | | | | | | |
Portfolio turnover rate | | | 322 | % | | | 267 | % | | | 256 | % | | | 256 | % | | | 215 | % |
Net assets, end of period (000s omitted) | | | $161,400 | | | | $168,541 | | | | $172,516 | | | | $195,346 | | | | $189,051 | |
| 1 | Calculated based upon average shares outstanding |
The accompanying notes are an integral part of these financial statements.
| | | | |
| 28 | | Wells Fargo Advantage Income Plus Fund | | Notes to financial statements |
1. ORGANIZATION
Wells Fargo Funds Trust (the “Trust”), a Delaware statutory trust organized on March 10, 1999, is an open-end management investment company registered under the Investment Company Act of 1940, as amended (the “1940 Act”). As an investment company, the Trust follows the accounting and reporting guidance in Financial Accounting Standards Board (“FASB”) Accounting Standards Codification Topic 946, Financial Services – Investment Companies. These financial statements report on the Wells Fargo Advantage Income Plus Fund (the “Fund”) which is a diversified series of the Trust.
2. SIGNIFICANT ACCOUNTING POLICIES
The following significant accounting policies, which are consistently followed in the preparation of the financial statements of the Fund, are in conformity with U.S. generally accepted accounting principles which require management to make estimates and assumptions that affect the reported amounts of assets and liabilities, disclosure of contingent assets and liabilities at the date of the financial statements, and the reported amounts of revenues and expenses during the reporting period. Actual results could differ from those estimates.
Securities valuation
All investments are valued each business day as of the close of regular trading on the New York Stock Exchange (generally 4 p.m. Eastern Time).
Debt securities are valued at the evaluated bid price provided by an independent pricing service or, if a reliable price is not available, the quoted bid price from an independent broker-dealer.
Futures that are listed on a foreign or domestic exchange or market are valued at the official closing price or, if none, the last sales price.
Investments in registered open-end investment companies are valued at net asset value. Interests in non-registered investment vehicles that are redeemable at net asset value are fair valued at net asset value when available.
Investments which are not valued using any of the methods discussed above are valued at their fair value, as determined in good faith by the Board of Trustees of the Fund. The Board of Trustees has established a Valuation Committee comprised of the Trustees and has delegated to it the authority to take any actions regarding the valuation of portfolio securities that the Valuation Committee deems necessary or appropriate, including determining the fair value of portfolio securities, unless the determination has been delegated to the Management Valuation Team of Wells Fargo Funds Management, LLC (“Funds Management”). The Board of Trustees retains the authority to make or ratify any valuation decisions or approve any changes to the Valuation Procedures as it deems appropriate. On a quarterly basis, the Board of Trustees receives reports on any valuation actions taken by the Valuation Committee or the Management Valuation Team which may include items for ratification.
Valuations of fair valued securities are compared to the next actual sales price when available, or other appropriate market values, to assess the continued appropriateness of the fair valuation methodologies used. These securities are fair valued on a day-to-day basis, taking into consideration changes to appropriate market information and any significant changes to the inputs considered in the valuation process until there is a readily available price provided on an exchange or by an independent pricing service. Valuations received from an independent pricing service or independent broker-dealer quotes are periodically validated by comparisons to most recent trades and valuations provided by other independent pricing services in addition to the review of prices by the manager and/or subadviser. Unobservable inputs used in determining fair valuations are identified based on the type of security, taking into consideration factors utilized by market participants in valuing the investment, knowledge about the issuer and the current market environment.
Security loans
The Fund may lend its securities from time to time in order to earn additional income in the form of fees or interest on securities received as collateral or the investment of any cash received as collateral. The Fund continues to receive interest or dividends on the securities loaned. The Fund receives collateral in the form of cash or securities with a value at least equal to the value of the securities on loan. The value of the loaned securities is determined at the close of each business day and any additional required collateral is delivered to the Fund on the next business day. In a securities lending transaction, the net asset value of the Fund will be affected by an increase or decrease in the value of the securities loaned and by an increase or decrease in the value of the instrument in which collateral is invested. The amount of securities lending activity undertaken by the Fund fluctuates from time to time. In the event of default or bankruptcy by the borrower, the Fund may be prevented from recovering the loaned securities or gaining access to the collateral or may experience delays or costs in doing so. In addition, the investment of any cash collateral received may lose all or part of its value. The Fund has the right under the lending agreement to recover the securities from the borrower on demand.
| | | | | | |
| Notes to financial statements | | Wells Fargo Advantage Income Plus Fund | | | 29 | |
The Fund lends its securities through an unaffiliated securities lending agent. Cash collateral received in connection with its securities lending transactions is invested in Securities Lending Cash Investments, LLC (the “Securities Lending Fund”). The Securities Lending Fund is exempt from registration under Section 3(c)(7) of the 1940 Act and is managed by Funds Management and is subadvised by Wells Capital Management Incorporated (“WellsCap”). Funds Management receives an advisory fee starting at 0.05% and declining to 0.01% as the average daily net assets of the Securities Lending Fund increase. All of the fees received by Funds Management are paid to WellsCap for its services as subadviser. The Securities Lending Fund seeks to provide a positive return compared to the daily Fed Funds Open rate by investing in high-quality, U.S. dollar-denominated short-term money market instruments. Securities Lending Fund investments are fair valued based upon the amortized cost valuation technique. Income earned from investment in the Securities Lending Fund is included in securities lending income on the Statement of Operations.
When-issued transactions
The Fund may purchase securities on a forward commitment or when-issued basis. The Fund records a when-issued transaction on the trade date and will segregate assets in an amount at least equal in value to the Fund’s commitment to purchase when-issued securities. Securities purchased on a when-issued basis are marked-to-market daily and the Fund begins earning interest on the settlement date. Losses may arise due to changes in the market value of the underlying securities or if the counterparty does not perform under the contract.
Futures contracts
The Fund is subject to interest rate risk in the normal course of pursuing its investment objectives. The Fund may buy and sell futures contracts in order to gain exposure to, or protect against, changes in security values and interest rates. The primary risks associated with the use of futures contracts are the imperfect correlation between changes in market values of securities held by the Fund and the prices of futures contracts, and the possibility of an illiquid market.
The aggregate principal amounts of the contracts are not recorded in the financial statements. Fluctuations in the value of the contracts are recorded in the Statement of Assets and Liabilities as an asset or liability and in the Statement of Operations as unrealized gains or losses until the contracts are closed, at which point they are recorded as net realized gains or losses on futures contracts. With futures contracts, there is minimal counterparty risk to the Fund since futures are exchange traded and the exchange’s clearinghouse, as counterparty to all exchange traded futures, guarantees the futures against default.
Security transactions and income recognition
Securities transactions are recorded on a trade date basis. Realized gains or losses are recorded on the basis of identified cost.
Interest income is accrued daily and bond discounts are accreted and premiums are amortized daily based on the effective interest method. To the extent debt obligations are placed on non-accrual status, any related interest income may be reduced by writing off interest receivables when the collection of all or a portion of interest has become doubtful based on consistently applied procedures. If the issuer subsequently resumes interest payments or when the collectability of interest is reasonably assured, the debt obligation is removed from non-accrual status.
Distributions to shareholders
Distributions to shareholders from net investment income are paid monthly. Distributions from net realized gains, if any, are recorded on the ex-dividend date. Such distributions are determined in conformity with federal income tax regulations, which may differ in amount or character from net investment income and realized gains recognized for purposes of U.S. generally accepted accounting principles.
Federal and other taxes
The Fund intends to continue to qualify as a regulated investment company by distributing substantially all of its investment company taxable income and any net realized capital gains (after reduction for capital loss carryforwards) sufficient to relieve it from all, or substantially all, federal income taxes. Accordingly, no provision for federal income taxes was required.
The Fund’s income and federal excise tax returns and all financial records supporting those returns for the prior three fiscal years are subject to examination by the federal and Delaware revenue authorities. Management has analyzed the Fund’s tax positions taken on federal, state, and foreign tax returns for all open tax years and does not believe that there are any uncertain tax positions that require recognition of a tax liability.
Reclassifications are made to the Fund’s capital accounts for permanent tax differences to reflect income and gains available for distribution (or available capital loss carryforwards) under federal income tax regulations. U.S. generally
| | | | |
| 30 | | Wells Fargo Advantage Income Plus Fund | | Notes to financial statements |
accepted accounting principles require that certain components of net assets be adjusted to reflect permanent differences between financial and tax reporting. These reclassifications have no effect on net assets or net asset values per share. The primary permanent differences causing such reclassifications are due to expiration of capital loss carryforwards. At August 31, 2015, as a result of permanent book-to-tax differences, the following reclassification adjustments were made on the Statement of Assets and Liabilities:
| | | | |
| Paid-in capital | | Undistributed net
investment income | | Accumulated net
realized losses
on investments |
| $(8,177,207) | | $150 | | $8,177,057 |
As of August 31, 2015, the Fund had capital loss carryforwards available to offset future net realized capital gains in the amount of $12,603,110 with $6,301,555 expiring in 2016 and $6,301,555 expiring in 2017.
Class allocations
The separate classes of shares offered by the Fund differ principally in applicable sales charges, distribution, shareholder servicing, and administration fees. Class specific expenses are charged directly to that share class. Investment income, common expenses, and realized and unrealized gains (losses) on investments are allocated daily to each class of shares based on the relative proportion of net assets of each class.
3. FAIR VALUATION MEASUREMENTS
Fair value measurements of investments are determined within a framework that has established a fair value hierarchy based upon the various data inputs utilized in determining the value of the Fund’s investments. The three-level hierarchy gives the highest priority to unadjusted quoted prices in active markets for identical assets or liabilities (Level 1) and the lowest priority to significant unobservable inputs (Level 3). The Fund’s investments are classified within the fair value hierarchy based on the lowest level of input that is significant to the fair value measurement. The inputs are summarized into three broad levels as follows:
| n | | Level 1 – quoted prices in active markets for identical securities |
| n | | Level 2 – other significant observable inputs (including quoted prices for similar securities, interest rates, prepayment speeds, credit risk, use of amortized cost, etc.) |
| n | | Level 3 – significant unobservable inputs (including the Fund’s own assumptions in determining the fair value of investments) |
The inputs or methodologies used for valuing investments in securities are not necessarily an indication of the risk associated with investing in those securities.
| | | | | | |
| Notes to financial statements | | Wells Fargo Advantage Income Plus Fund | | | 31 | |
The following is a summary of the inputs used in valuing the Fund’s assets and liabilities as of August 31, 2015:
| | | | | | | | | | | | | | | | |
| | | Quoted prices
(Level 1) | | | Other significant
observable inputs
(Level 2) | | | Significant
unobservable inputs
(Level 3) | | | Total | |
Assets | | | | | | | | | | | | | | | | |
Investments in: | | | | | | | | | | | | | | | | |
| | | | |
Agency securities | | $ | 0 | | | $ | 162,386,884 | | | $ | 0 | | | $ | 162,386,884 | |
| | | | |
Asset-backed securities | | | 0 | | | | 6,028,077 | | | | 0 | | | | 6,028,077 | |
| | | | |
Corporate bonds and notes | | | 0 | | | | 154,840,603 | | | | 0 | | | | 154,840,603 | |
| | | | |
Municipal obligations | | | 0 | | | | 17,976,573 | | | | 0 | | | | 17,976,573 | |
| | | | |
Non-agency mortgage backed securities | | | 0 | | | | 17,563,286 | | | | 0 | | | | 17,563,286 | |
| | | | |
U.S. Treasury securities | | | 113,874,294 | | | | 0 | | | | 0 | | | | 113,874,294 | |
| | | | |
Yankee corporate bonds and notes | | | 0 | | | | 36,404,235 | | | | 0 | | | | 36,404,235 | |
| | | | |
Short-term investments | | | | | | | | | | | | | | | | |
Investment companies | | | 131,791,787 | | | | 578,250 | | | | 0 | | | | 132,370,037 | |
U.S. Treasury securities | | | 824,999 | | | | 0 | | | | 0 | | | | 824,999 | |
| | | 246,491,080 | | | | 395,777,908 | | | | 0 | | | | 642,268,988 | |
| | | | |
Futures contracts | | | 22,500 | | | | 0 | | | | 0 | | | | 22,500 | |
Total assets | | $ | 246,513,580 | | | $ | 395,777,908 | | | $ | 0 | | | $ | 642,291,488 | |
Liabilities | | | | | | | | | | | | | | | | |
| | | | |
Futures contracts | | $ | 118,469 | | | $ | 0 | | | $ | 0 | | | $ | 118,469 | |
Total liabilities | | $ | 118,469 | | | $ | 0 | | | $ | 0 | | | $ | 118,469 | |
Futures contracts are reported at their variation margin at measurement date, which represents the amount due to/from the Fund at that date. All other assets and liabilities are reported at their market value at measurement date.
The Fund recognizes transfers between levels within the fair value hierarchy at the end of the reporting period. At August 31, 2015, the Fund did not have any transfers into/out of Level 1, Level 2, or Level 3.
4. TRANSACTIONS WITH AFFILIATES
Management fee
Funds Management, an indirect wholly owned subsidiary of Wells Fargo & Company (“Wells Fargo”), is the manager of the Fund and provides advisory and fund-level administrative services under an investment management agreement. Under the investment management agreement, Funds Management is responsible for, among other services, implementing the investment objectives and strategies of the Fund, supervising the applicable subadviser, providing fund-level administrative services in connection with the Fund’s operations, and providing any other fund-level administrative services reasonably necessary for the operation of the Fund. As compensation for its services under the investment management agreement, Funds Management is entitled to receive an annual management fee starting at 0.45% and declining to 0.33% as the average daily net assets of the Fund increase.
Prior to July 1, 2015, Funds Management provided advisory services pursuant to an investment advisory agreement and was entitled to receive an annual fee which started at 0.40% and declined to 0.30% as the average daily net assets of the Fund increased. In addition, prior to July 1, 2015, fund-level administrative services were provided by Funds Management under a separate administration agreement at an annual fee which started at 0.05% and declined to 0.03% as the average daily net assets of the Fund increased. For financial statement purposes, the advisory fee and fund-level administration fee for the year ended August 31, 2015 have been included in management fee on the Statement of Operations.
For the year ended August 31, 2015, the management fee was equivalent to an annual rate of 0.45% of the Fund’s average daily net assets.
Funds Management has retained the services of a subadviser to provide daily portfolio management to the Fund. The fee for subadvisory services is borne by Funds Management. WellsCap, an affiliate of Funds Management and an indirect
| | | | |
| 32 | | Wells Fargo Advantage Income Plus Fund | | Notes to financial statements |
wholly owned subsidiary of Wells Fargo, is the subadviser to the Fund and is entitled to receive a fee from Funds Management at an annual rate starting at 0.20% and declining to 0.10% as the average daily net assets of the Fund increase.
Administration fees
Under a class-level administration agreement, Funds Management provides class-level administrative services to the Fund, which includes paying fees and expenses for services provided by the transfer agent, sub-transfer agents, omnibus account servicers and record-keepers. As compensation for its services under the class-level administration agreement, Funds Management receives an annual fee which is calculated based on the average daily net assets of each class as follows:
| | | | |
| | | Class-level
administration fee | |
Class A, Class B, Class C | | | 0.16 | % |
Administrator Class | | | 0.10 | |
Institutional Class | | | 0.08 | |
Investor Class | | | 0.19 | |
Funds Management has contractually waived and/or reimbursed management and administration fees to the extent necessary to maintain certain net operating expense ratios for the Fund. Waiver of fees and/or reimbursement of expenses by Funds Management were made first from fund level expenses on a proportionate basis and then from class specific expenses. Funds Management has committed through December 31, 2015 to waive fees and/or reimburse expenses to the extent necessary to cap the Fund’s expenses at 0.84% for Class A shares, 1.59% for Class B shares, 1.59% for Class C shares, 0.72% for Administrator Class shares, 0.58% for Institutional Class shares, and 0.85% for Investor Class shares. After this time, the cap may be increased or the commitment to maintain the cap may be terminated only with the approval of the Board of Trustees.
Distribution fees
The Trust has adopted a distribution plan for Class B and Class C shares of the Fund pursuant to Rule 12b-1 under the 1940 Act. Distribution fees are charged to Class B and Class C shares and paid to Wells Fargo Funds Distributor, LLC (“Funds Distributor”), the principal underwriter, at an annual rate of 0.75% of the average daily net assets of Class B and Class C shares.
In addition, Funds Distributor is entitled to receive the front-end sales charge from the purchase of Class A shares and a contingent deferred sales charge on the redemption of certain Class A shares. Funds Distributor is also entitled to receive the contingent deferred sales charges from redemptions of Class B and Class C shares. For the year ended August 31, 2015, Funds Distributor received $2,865 from the sale of Class A shares and $76 and $55 in contingent deferred sales charges from redemptions of Class B and Class C shares, respectively.
Shareholder servicing fees
The Trust has entered into contracts with one or more shareholder servicing agents, whereby Class A, Class B, Class C, Administrator Class, and Investor Class of the Fund is charged a fee at an annual rate of 0.25% of the average daily net assets of each respective class.
A portion of these total shareholder servicing fees were paid to affiliates of Wells Fargo.
5. INVESTMENT PORTFOLIO TRANSACTIONS
Purchases and sales of investments, excluding short-term securities, for the year ended August 31, 2015 were as follows:
| | | | | | |
Purchases at cost | | Sales proceeds |
U.S.
government | | Non-U.S.
government | | U.S.
government | | Non-U.S.
government |
| $1,451,254,279 | | $229,105,077 | | $1,455,793,110 | | $150,761,168 |
6. DERIVATIVE TRANSACTIONS
During the year ended August 31, 2015, the Fund entered into futures contracts to speculate on interest rates and to help manage the duration of the portfolio.
| | | | | | |
| Notes to financial statements | | Wells Fargo Advantage Income Plus Fund | | | 33 | |
At August 31, 2015, the Fund had long and short futures contracts outstanding as follows:
| | | | | | | | | | | | | | |
| Expiration date | | Counterparty | | Contracts | | Type | | Contract
value at
August 31, 2015 | | | Unrealized
gains
(losses) | |
12-21-2015 | | JPMorgan | | 68 Long | | U.S. Treasury Bonds | | $ | 10,771,625 | | | $ | (58,240 | ) |
12-21-2015 | | JPMorgan | | 9 Short | | U.S. Treasury Bonds | | | 1,391,625 | | | | 43,225 | |
12-21-2015 | | JPMorgan | | 122 Short | | 10-Year U.S. Treasury Notes | | | 15,501,625 | | | | 194,206 | |
12-31-2015 | | JPMorgan | | 441 Long | | 5-Year U.S. Treasury Notes | | | 52,671,938 | | | | (421,166 | ) |
12-31-2015 | | JPMorgan | | 210 Long | | 2-Year U.S. Treasury Notes | | | 45,878,438 | | | | (125,087 | ) |
The Fund had an average notional amount of $102,121,653 and $8,437,987 in long and short futures contracts, respectively, during the year ended August 31, 2015.
On August 31, 2015, the cumulative unrealized losses on futures contracts in the amount of $367,062 are reflected in net unrealized gains on investments on the Statement of Assets and Liabilities. The receivable and payable for daily variation margin on open futures contracts reflected in the Statement of Assets and Liabilities only represents the current day’s variation margin. The realized gains and change in unrealized gains (losses) on futures contracts are reflected in the Statement of Operations.
For certain types of derivative transactions, the Fund has entered into International Swaps and Derivatives Association, Inc. master agreements (“ISDA Master Agreements”) or similar agreements with approved counterparties. The ISDA Master Agreements or similar agreements may have requirements to deliver/deposit securities or cash to/with an exchange or broker-dealer as collateral and allows the Fund to offset, with each counterparty, certain derivative financial instrument’s assets and/or liabilities with collateral held or pledged. Collateral requirements differ by type of derivative. Collateral or margin requirements are set by the broker or exchange clearing house for exchange traded derivatives while collateral terms are contract specific for over-the-counter traded derivatives. Cash collateral that has been pledged to cover obligations of the Fund under ISDA Master Agreements or similar agreements, if any, will be reported separately in the Statement of Assets and Liabilities. Securities pledged as collateral, if any, for the same purpose are noted in the Portfolio of Investments. With respect to balance sheet offsetting, absent an event of default by the counterparty or a termination of the agreement, the reported amounts of financial assets and financial liabilities in the Statement of Assets and Liabilities are not offset across transactions between the Fund and the applicable counterparty. A reconciliation of the gross amounts on the Statement of Assets and Liabilities to the net amounts by derivative type, including any collateral exposure, is as follows:
| | | | | | | | | | | | | | | | | | |
| Derivative type | | Counterparty | | Gross amounts
of assets in the
Statement of
Assets and
Liabilities | | | Amounts
subject to
netting
agreements | | | Collateral
received | | | Net amount
of assets | |
Futures – variation margin | | JPMorgan | | $ | 22,500 | | | $ | (22,500 | ) | | $ | 0 | | | $ | 0 | |
| | | | | | | | | | | | | | | | | | |
| Derivative type | | Counterparty | | Gross amounts
of liabilities in the
Statement of
Assets and
Liabilities | | | Amounts
subject to
netting
agreements | | | Collateral
pledged1 | | | Net amount
of liabilities | |
Futures – variation margin | | JPMorgan | | $ | 118,469 | | | $ | (22,500 | ) | | $ | (95,969 | ) | | $ | 0 | |
| 1 | Collateral pledged within this table is limited to the collateral for the net transaction with the counterparty. |
7. BANK BORROWINGS
The Trust (excluding the money market funds and certain other funds in the Trust) and Wells Fargo Variable Trust are parties to a $150,000,000 revolving credit agreement, whereby the Fund is permitted to use bank borrowings for temporary or emergency purposes, such as to fund shareholder redemption requests. Interest under the credit agreement is charged to the Fund based on a borrowing rate equal to the higher of the Federal Funds rate in effect on that day plus 1.25% or the overnight LIBOR rate in effect on that day plus 1.25%. In addition, an annual commitment fee equal to 0.10% of the unused balance is allocated to each participating fund. For the year ended August 31, 2015, the Fund paid $561 in commitment fees.
For the year ended August 31, 2015, there were no borrowings by the Fund under the agreement.
| | | | |
| 34 | | Wells Fargo Advantage Income Plus Fund | | Notes to financial statements |
8. DISTRIBUTIONS TO SHAREHOLDERS
The tax character of distributions paid during the years ended August 31, 2015 and August 31, 2014 were as follows:
| | | | | | | | |
| | | Year ended August 31, | |
| | | 2015 | | | 2014 | |
Ordinary income | | $ | 9,043,976 | | | $ | 9,580,966 | |
Long-term capital gain | | | 857,080 | | | | 0 | |
As of August 31, 2015, the components of distributable earnings on a tax basis were as follows:
| | | | | | |
Undistributed
ordinary
income | | Undistributed
long-term
gain | | Unrealized
gains | | Capital loss
carryforward |
| $274,815 | | $1,559,175 | | $4,127,175 | | $(12,603,110) |
9. INDEMNIFICATION
Under the Trust’s organizational documents, the officers and Trustees have been granted certain indemnification rights against certain liabilities that may arise out of performance of their duties to the Trust. Additionally, in the normal course of business, the Trust may enter into contracts with service providers that contain a variety of indemnification clauses. The Trust’s maximum exposure under these arrangements is dependent on future claims that may be made against the Fund and, therefore, cannot be estimated.
10. SUBSEQUENT DISTRIBUTIONS
On September 24, 2015, the Fund declared distributions from net investment income to shareholders of record on September 23, 2015. The per share amounts payable on September 25, 2015 were as follows:
| | | | |
| | | Net investment income | |
Class A | | | $0.01595 | |
Class B | | | 0.00969 | |
Class C | | | 0.00984 | |
Administrator Class | | | 0.01688 | |
Institutional Class | | | 0.01806 | |
Investor Class | | | 0.01588 | |
On October 21, 2015, the Fund declared distributions from net investment income to shareholders of record on October 20, 2015. The per share amounts payable on October 22, 2015 were as follows:
| | | | |
| | | Net investment income | |
Class A | | | $0.02464 | |
Class B | | | 0.01627 | |
Class C | | | 0.01686 | |
Administrator Class | | | 0.02604 | |
Institutional Class | | | 0.02790 | |
Investor Class | | | 0.02490 | |
These distributions are not reflected in the accompanying financial statements. The final determination of the source of all distributions is subject to change and made after the Fund’s tax year-end.
| | | | | | |
| Report of independent registered public accounting firm | | Wells Fargo Advantage Income Plus Fund | | | 35 | |
BOARD OF TRUSTEES AND SHAREHOLDERS OF WELLS FARGO FUNDS TRUST:
We have audited the accompanying statement of assets and liabilities, including the portfolio of investments, of the Wells Fargo Advantage Income Plus Fund (the “Fund”), one of the funds constituting the Wells Fargo Funds Trust, as of August 31, 2015, and the related statement of operations for the year then ended, the statements of changes in net assets for each of the years in the two-year period then ended, and the financial highlights for each of the years in the five-year period then ended. These financial statements and financial highlights are the responsibility of the Fund’s management. Our responsibility is to express an opinion on these financial statements and financial highlights based on our audits.
We conducted our audits in accordance with the standards of the Public Company Accounting Oversight Board (United States). Those standards require that we plan and perform the audit to obtain reasonable assurance about whether the financial statements and financial highlights are free of material misstatement. An audit includes examining, on a test basis, evidence supporting the amounts and disclosures in the financial statements. Our procedures included confirmation of securities owned as of August 31, 2015, by correspondence with the custodian and brokers, or by other appropriate auditing procedures. An audit also includes assessing the accounting principles used and significant estimates made by management, as well as evaluating the overall financial statement presentation. We believe that our audits provide a reasonable basis for our opinion.
In our opinion, the financial statements and financial highlights referred to above present fairly, in all material respects, the financial position of the Wells Fargo Advantage Income Plus Fund as of August 31, 2015, the results of its operations for the year then ended, the changes in its net assets for each of the years in the two-year period then ended, and the financial highlights for each of the years in the five-year period then ended, in conformity with U.S. generally accepted accounting principles.

Boston, Massachusetts
October 26, 2015
| | | | |
| 36 | | Wells Fargo Advantage Income Plus Fund | | Other information (unaudited) |
TAX INFORMATION
Pursuant to Section 852 of the Internal Revenue Code, $857,080 was designated as long-term capital gain distributions for the fiscal year ended August 31, 2015.
For the fiscal year ended August 31, 2015, $7,513,446 has been designated as interest-related dividends for nonresident alien shareholders pursuant to Section 871 of the Internal Revenue Code.
For the fiscal year ended August 31, 2015, 11.27% of the ordinary income distributed was derived from interest on U.S. government securities.
PROXY VOTING INFORMATION
A description of the policies and procedures that the Fund uses to determine how to vote proxies relating to portfolio securities is available, upon request, by calling 1-800-222-8222, visiting our website at wellsfargoadvantagefunds.com, or visiting the SEC website at sec.gov. Information regarding how the Fund voted proxies relating to portfolio securities during the most recent 12-month period ended June 30 is available on the Fund’s website at wellsfargoadvantagefunds.com or by visiting the SEC website at sec.gov.
PORTFOLIO HOLDINGS INFORMATION
The complete portfolio holdings for the Fund are publicly available monthly on the Fund’s website (wellsfargoadvantagefunds.com), on a one-month delayed basis. In addition, top ten holdings information (excluding derivative positions) for the Fund is publicly available on the Fund’s website on a monthly, seven-day or more delayed basis. The Fund files its complete schedule of portfolio holdings with the SEC for the first and third quarters of each fiscal year on Form N-Q, which is available by visiting the SEC website at sec.gov. In addition, the Fund’s Form N-Q may be reviewed and copied at the SEC’s Public Reference Room in Washington, DC, and at regional offices in New York City, at 233 Broadway, and in Chicago, at 175 West Jackson Boulevard, Suite 900. Information about the Public Reference Room may be obtained by calling 1-800-SEC-0330.
| | | | | | |
| Other information (unaudited) | | Wells Fargo Advantage Income Plus Fund | | | 37 | |
BOARD OF TRUSTEES AND OFFICERS
Each of the Trustees and Officers1 listed in the table below acts in identical capacities for each fund in the Wells Fargo Advantage family of funds, which consists of 133 mutual funds comprising the Wells Fargo Funds Trust, Wells Fargo Variable Trust, Wells Fargo Master Trust and four closed-end funds (collectively the “Fund Complex”). This table should be read in conjunction with the Prospectus and the Statement of Additional Information2. The mailing address of each Trustee and Officer is 525 Market Street, 12th Floor, San Francisco, CA 94105. Each Trustee and Officer serves an indefinite term, however, each Trustee serves such term until reaching the mandatory retirement age established by the Trustees.
Independent Trustees
| | | | | | |
Name and year of birth | | Position held and length of service* | | Principal occupations during past five years or longer | | Other
public company or
investment company
directorships during
past 5 years |
William R. Ebsworth (Born 1957) | | Trustee, since 2015** | | Retired. From 1984 to 2013, equities analyst, portfolio manager, research director at Fidelity Management and Research Company and retired in 2013 as Chief Investment Officer of Fidelity Strategic Advisers, Inc. in Boston, Tokyo, and Hong Kong where he led a team of investment professionals managing client assets. Prior thereto, Board member of Hong Kong Securities Clearing Co., Hong Kong Options Clearing Corp., the Thailand International Fund, Ltd., Fidelity Investments Life Insurance Company, and Empire Fidelity Investments Life Insurance Company. Mr. Ebsworth is a CFA ® charterholder and an Adjunct Lecturer, Finance, at Babson College. | | Asset Allocation Trust |
Jane A. Freeman (Born 1953) | | Trustee, since 2015** | | Retired. From 2012 to 2014 and 1999 to 2008, Chief Financial Officer of Scientific Learning Corporation. From 2008 to 2012, Ms. Freeman provided consulting services related to strategic business projects. Prior to 1999, Portfolio Manager at Rockefeller & Co. and Scudder, Stevens & Clark. Board member of the Harding Loevner Funds from 1996 to 2014, serving as both Lead Independent Director and chair of the Audit Committee. Board member of the Russell Exchange Traded Funds Trust from 2011 to 2012 and the chair of the Audit Committee. Ms. Freeman is Chair of Taproot Foundation (non-profit organization), a Board Member of Ruth Bancroft Garden (non-profit organization) and an inactive chartered financial analyst. | | Asset Allocation Trust; Harding Loevner Funds; Russell Exchange Traded Funds Trust |
Peter G. Gordon (Born 1942) | | Trustee, since 1998; Chairman, since 2005 | | Co-Founder, Retired Chairman, President and CEO of Crystal Geyser Water Company. Trustee Emeritus, Colby College. | | Asset Allocation Trust |
Isaiah Harris, Jr. (Born 1952) | | Trustee, since 2009 | | Retired. Chairman of the Board of CIGNA Corporation since 2009, and Director since 2005. From 2003 to 2011, Director of Deluxe Corporation. Prior thereto, President and CEO of BellSouth Advertising and Publishing Corp. from 2005 to 2007, President and CEO of BellSouth Enterprises from 2004 to 2005 and President of BellSouth Consumer Services from 2000 to 2003. Emeritus member of the Iowa State University Foundation Board of Governors. Emeritus Member of the Advisory Board of Iowa State University School of Business. Advisory Board Member, Palm Harbor Academy (charter school). Mr. Harris is a certified public accountant. | | CIGNA Corporation; Asset Allocation Trust |
Judith M. Johnson (Born 1949) | | Trustee, since 2008; Audit Committee Chairman, since 2008 | | Retired. Prior thereto, Chief Executive Officer and Chief Investment Officer of Minneapolis Employees Retirement Fund from 1996 to 2008. Ms. Johnson is an attorney, certified public accountant and a certified managerial accountant. | | Asset Allocation Trust |
David F. Larcker (Born 1950) | | Trustee, since 2009 | | James Irvin Miller Professor of Accounting at the Graduate School of Business, Stanford University, Morgan Stanley Director of the Center for Leadership Development and Research and Senior Faculty of The Rock Center for Corporate Governance since 2006. From 2005 to 2008, Professor of Accounting at the Graduate School of Business, Stanford University. Prior thereto, Ernst & Young Professor of Accounting at The Wharton School, University of Pennsylvania from 1985 to 2005. | | Asset Allocation Trust |
Olivia S. Mitchell (Born 1953) | | Trustee, since 2006 | | International Foundation of Employee Benefit Plans Professor, Wharton School of the University of Pennsylvania since 1993. Director of Wharton’s Pension Research Council and Boettner Center on Pensions & Retirement Research, and Research Associate at the National Bureau of Economic Research. Previously, Cornell University Professor from 1978 to 1993. | | Asset Allocation Trust |
| | | | |
| 38 | | Wells Fargo Advantage Income Plus Fund | | Other information (unaudited) |
| | | | | | |
Name and year of birth | | Position held and length of service* | | Principal occupations during past five years or longer | | Other
public company or
investment company
directorships during
past 5 years |
Timothy J. Penny (Born 1951) | | Trustee, since 1996 | | President and Chief Executive Officer of Southern Minnesota Initiative Foundation, a non-profit organization, since 2007 and Senior Fellow at the Humphrey Institute Policy Forum at the University of Minnesota since 1995. Member of the Board of Trustees of NorthStar Education Finance, Inc., a non-profit organization, since 2007. | | Asset Allocation Trust |
Michael S. Scofield (Born 1943) | | Trustee, since 2010 | | Served on the Investment Company Institute’s Board of Governors and Executive Committee from 2008-2011 as well the Governing Council of the Independent Directors Council from 2006-2011 and the Independent Directors Council Executive Committee from 2008-2011. Chairman of the IDC from 2008-2010. Institutional Investor (Fund Directions) Trustee of Year in 2007. Trustee of the Evergreen Funds complex (and its predecessors) from 1984 to 2010. Chairman of the Evergreen Funds from 2000-2010. Former Trustee of the Mentor Funds. Retired Attorney, Law Offices of Michael S. Scofield. | | Asset Allocation Trust |
Donald C. Willeke (Born 1940) | | Trustee, since 1996 | | Principal of the law firm of Willeke & Daniels. General Counsel of the Minneapolis Employees Retirement Fund from 1984 until its consolidation into the Minnesota Public Employees Retirement Association on June 30, 2010. Director and Vice Chair of The Tree Trust (non-profit corporation). Director of the American Chestnut Foundation (non-profit corporation). | | Asset Allocation Trust |
| * | Length of service dates reflect the Trustee’s commencement of service with the Trust’s predecessor entities, where applicable. |
| ** | William R. Ebsworth and Jane A. Freeman each became a Trustee effective January 1, 2015. |
Officers
| | | | | | |
Name and year of birth | | Position held and length of service | | Principal occupations during past five years or longer | | |
Karla M. Rabusch (Born 1959) | | President, since 2003 | | Executive Vice President of Wells Fargo Bank, N.A. and President of Wells Fargo Funds Management, LLC since 2003. | | |
Nancy Wiser1 (Born 1967) | | Treasurer, since 2012 | | Executive Vice President of Wells Fargo Funds Management, LLC since 2011. Chief Operating Officer and Chief Compliance Officer at LightBox Capital Management LLC, from 2008 to 2011. | | |
C. David Messman (Born 1960) | | Secretary, since 2000; Chief Legal Officer, since 2003 | | Senior Vice President and Secretary of Wells Fargo Funds Management, LLC since 2001. Assistant General Counsel of Wells Fargo Bank, N.A. since 2013 and Vice President and Managing Counsel of Wells Fargo Bank N.A. from 1996 to 2013. | | |
Debra Ann Early (Born 1964) | | Chief Compliance Officer, since 2007 | | Executive Vice President of Wells Fargo Funds Management, LLC since 2014, Senior Vice President and Chief Compliance Officer from 2007 to 2014. | | |
David Berardi (Born 1975) | | Assistant Treasurer, since 2009 | | Vice President of Wells Fargo Funds Management, LLC since 2009. Vice President of Evergreen Investment Management Company, LLC from 2008 to 2010. Manager of Fund Reporting and Control for Evergreen Investment Management Company, LLC from 2004 to 2010. | | |
Jeremy DePalma1 (Born 1974) | | Assistant Treasurer, since 2009 | | Senior Vice President of Wells Fargo Funds Management, LLC since 2009. Senior Vice President of Evergreen Investment Management Company, LLC from 2008 to 2010 and head of the Fund Reporting and Control Team within Fund Administration from 2005 to 2010. | | |
| 1 | Nancy Wiser acts as Treasurer of 72 funds in the Fund Complex. Jeremy DePalma acts as Treasurer of 61 funds and Assistant Treasurer of 72 funds in the Fund Complex. |
| 2 | The Statement of Additional Information includes additional information about the Trustees and is available, without charge, upon request, by calling 1-800-222-8222 or by visiting the website at wellsfargoadvantagefunds.com. |
| | | | | | |
| Other information (unaudited) | | Wells Fargo Advantage Income Plus Fund | | | 39 | |
BOARD CONSIDERATION OF INVESTMENT ADVISORY, INVESTMENT MANAGEMENT AND SUB-ADVISORY AGREEMENTS:
Under the Investment Company Act of 1940 (the “1940 Act”), the Board of Trustees (the “Board”) of Wells Fargo Funds Trust (the “Trust”) must determine annually whether to approve the continuation of the Trust’s investment advisory and sub-advisory agreements. In this regard, at an in-person meeting held on May 19-20, 2015 (the “Meeting”), the Board, all the members of which have no direct or indirect interest in the investment advisory and sub-advisory agreements and are not “interested persons” of the Trust, as defined in the 1940 Act (the “Independent Trustees”), reviewed and approved for Wells Fargo Advantage Income Plus Fund (the “Fund”): (i) an investment advisory agreement (the “Advisory Agreement”) with Wells Fargo Funds Management, LLC (“Funds Management”); (ii) an investment management agreement (the “Management Agreement”) with Funds Management; and (iii) an investment sub-advisory agreement (the “Sub-Advisory Agreement”) with Wells Capital Management Incorporated (the “Sub-Adviser”), an affiliate of Funds Management. The Management Agreement combines the terms of the Advisory Agreement with the terms of the Fund’s Amended and Restated Administration Agreement (the “Administration Agreement”) applicable to Fund-level administrative services. The Advisory Agreement, the Management Agreement and the Sub-Advisory Agreement are collectively referred to as the “Advisory Agreements.”
At the Meeting, the Board considered the factors and reached the conclusions described below relating to the selection of Funds Management and the Sub-Adviser and the approval of the Advisory Agreements. Prior to the Meeting, including at an in-person meeting in March 2015, the Trustees conferred extensively among themselves and with representatives of Funds Management about these matters. Also, the Board has adopted a team-based approach, with each team consisting of a sub-set of Trustees, to assist the full Board in the discharge of its duties in reviewing performance and other matters throughout the year. The Independent Trustees were assisted in their evaluation of the Advisory Agreements by independent legal counsel, from whom they received separate legal advice and with whom they met separately.
In providing information to the Board, Funds Management and the Sub-Adviser were guided by a detailed set of requests for information submitted to them by independent legal counsel on behalf of the Independent Trustees at the start of the Board’s annual contract renewal process earlier in 2015. In considering and approving the Advisory Agreements, the Trustees considered the information they believed relevant, including but not limited to the information discussed below. The Board considered not only the specific information presented in connection with the Meeting, but also the knowledge gained over time through interaction with Funds Management and the Sub-Adviser about various topics. In this regard, the Board reviewed reports of Funds Management at each of its quarterly meetings, which included, among other things, portfolio reviews and performance reports. In addition, the Board and the teams mentioned above confer with portfolio managers at various times throughout the year. The Board did not identify any particular information or consideration that was all-important or controlling, and each individual Trustee may have attributed different weights to various factors.
After its deliberations, the Board unanimously approved the continuation of the Advisory Agreement for the period from June 1, 2015 through June 30, 2015, approved the Management Agreement for the period from July 1, 2015 through May 31, 2016, and approved the continuation of the Sub-Advisory Agreement for a one-year term through May 31, 2016. The Board also determined that the compensation payable to Funds Management and the Sub-Adviser under each of the Advisory Agreements was reasonable. The Board considered the approval of the Advisory Agreements for the Fund as part of its consideration of agreements for funds across the complex, but its approvals were made on a fund-by-fund basis. The following summarizes a number of important, but not necessarily all, factors considered by the Board in support of its approvals.
Nature, extent and quality of services
The Board received and considered various information regarding the nature, extent and quality of services provided to the Fund by Funds Management and the Sub-Adviser under the Advisory Agreements. This information included, among other things, a summary of the background and experience of senior management of Funds Management, and the qualifications, background, tenure and responsibilities of each of the portfolio managers primarily responsible for the day-to-day portfolio management of the Fund. The Board noted that the services to be provided to the Fund pursuant to the Management Agreement combined the advisory services previously provided to the Fund pursuant to the Fund’s Advisory Agreement with the Fund-level administrative services previously provided to the Fund pursuant to the Fund’s Administration Agreement. The Board received a representation from Funds Management that combining these services would not result in any change to the nature or level of services provided by Funds Management to the Fund.
The Board evaluated the ability of Funds Management and the Sub-Adviser to attract and retain qualified investment professionals, including research, advisory and supervisory personnel. The Board further considered the compliance
| | | | |
| 40 | | Wells Fargo Advantage Income Plus Fund | | Other information (unaudited) |
programs and compliance records of Funds Management and the Sub-Adviser. In addition, the Board took into account the full range of services provided to the Fund by Funds Management and its affiliates.
Fund performance and expenses
The Board considered the performance results for the Fund over various time periods ended March 31, 2015. The Board considered these results in comparison to the performance of funds in a universe that was determined by Lipper Inc. (“Lipper”) to be similar to the Fund (the “Universe”), and in comparison to the Fund’s benchmark index and to other comparative data. Lipper is an independent provider of investment company data. The Board received a description of the methodology used by Lipper to select the mutual funds in the performance Universe. The Board noted that the performance of the Fund (Class A) was higher than or in range of the average performance of the Universe for all periods under review. The Board also noted that the performance of the Fund was higher than its benchmark, the Barclays U.S. Universal Bond Index, for all periods under review.
The Board also received and considered information regarding the Fund’s net operating expense ratios and their various components, including actual management fees (which reflect fee waivers, if any, and include advisory, administration and transfer agent fees), custodian and other non-management fees, and Rule 12b-1 and non-Rule 12b-1 service fees. The Board considered these ratios in comparison to the median ratios of funds in class-specific expense groups that were determined by Lipper to be similar to the Fund (the “Groups”). The Board received a description of the methodology used by Lipper to select the mutual funds in the expense Groups and an explanation of how funds comprising expense groups and their expense ratios may vary from year-to-year. Based on the Lipper reports, the Board noted that the net operating expense ratios of the Fund were lower than the median net operating expense ratios of the expense Groups. The Board discussed and accepted Funds Management’s proposal to convert the Investor Class shares into Class A shares.
The Board took into account the Fund performance and expense information provided to it among the factors considered in deciding to re-approve the Advisory Agreement and Sub-Advisory Agreement and approve the Management Agreement.
Investment advisory and sub-advisory fee rates
The Board reviewed and considered the contractual investment advisory fee rates that are payable by the Fund to Funds Management for investment advisory services (the “Advisory Agreement Rates”), both on a stand-alone basis and on a combined basis with the Fund’s fund-level and class-level contractual administration fee rates (the “Management Rates”). The Board noted that the Management Rates include transfer agency and sub-transfer agency costs. The Board also noted that the fee rate to be paid by the Fund under the Management Agreement will incorporate the advisory fee and Fund-level administration fee previously payable separately by the Fund under the Fund’s Advisory Agreement and Administration Agreement with Funds Management. The Board also reviewed and considered the contractual investment sub-advisory fee rates that are payable by Funds Management to the Sub-Adviser for investment sub-advisory services (the “Sub-Advisory Agreement Rates”).
Among other information reviewed by the Board was a comparison of the Management Rates of the Fund with those of other funds in the expense Groups at a common asset level. The Board noted that the Management Rates of the Fund were lower than or in range of the average rates for the Fund’s expense Groups for all share classes.
The Board also received and considered information about the portion of the total advisory fee that was retained by Funds Management after payment of the fee to the Sub-Adviser for sub-advisory services. In assessing the reasonableness of this amount, the Board received and evaluated information about the nature and extent of responsibilities retained and risks assumed by Funds Management and not delegated to or assumed by the Sub-Adviser, and about Funds Management’s on-going oversight services. However, given the affiliation between Funds Management and the Sub-Adviser, the Board ascribed limited relevance to the allocation of the advisory fee between them.
The Board also received and considered information about the nature and extent of services offered and fee rates charged by Funds Management and the Sub-Adviser to other types of clients with investment strategies similar to those of the Fund. In this regard, the Board received information about the significantly greater scope of services, and compliance, reporting and other legal burdens and risks of managing mutual funds compared with those associated with managing assets of non-mutual fund clients such as collective funds or institutional separate accounts.
Based on its consideration of the factors and information it deemed relevant, including those described here, the Board determined that the compensation payable to Funds Management under the Management Agreement and Advisory Agreement and to the Sub-Adviser under the Sub-Advisory Agreement was reasonable, in light of the services covered by the Advisory Agreements.
| | | | | | |
| Other information (unaudited) | | Wells Fargo Advantage Income Plus Fund | | | 41 | |
Profitability
The Board received and considered information concerning the profitability of Funds Management, as well as the profitability of Wells Fargo as a whole, from providing services to the Fund and the fund family as a whole. The Board also received and considered information concerning the profitability of the Sub-Adviser from providing services to the fund family as a whole, noting that the Sub-Adviser’s profitability information with respect to providing services to the Fund was subsumed in the Wells Fargo profitability analysis.
Funds Management reported on the methodologies and estimates used in calculating profitability. Among other things, the Board noted that the levels of profitability reported on a fund-by-fund basis varied widely, depending on factors such as the size and type of fund. Based on its review, the Board did not deem the profits reported by Funds Management or Wells Fargo from its services to the Fund to be at a level that would prevent it from approving the continuation of the Advisory Agreements.
Economies of scale
With respect to possible economies of scale, the Board noted the existence of breakpoints in the Fund’s advisory and management fee structures, and the Fund’s administration fee structure, which operate generally to reduce the Fund’s expense ratios as the Fund grows in size. It considered that, for a small fund or a fund that shrinks in size, breakpoints conversely can result in higher fee levels. The Board also considered that fee waiver and expense reimbursement arrangements and competitive fee rates at the outset are means of sharing potential economies of scale with shareholders of the Fund and the fund family as a whole. The Board considered Funds Management’s view that any analyses of potential economies of scale in managing a particular fund are inherently limited in light of the joint and common costs and investments that Funds Management incurs across the fund family as a whole.
The Board concluded that the Fund’s fee and expense arrangements, including contractual breakpoints, constituted a reasonable approach to sharing potential economies of scale with the Fund and its shareholders.
Other benefits to Funds Management and the Sub-Adviser
The Board received and considered information regarding potential “fall-out” or ancillary benefits received by Funds Management and its affiliates, including the Sub-Adviser, as a result of their relationships with the Fund. Ancillary benefits could include, among others, benefits directly attributable to other relationships with the Fund and benefits potentially derived from an increase in Funds Management’s and the Sub-Adviser’s business as a result of their relationships with the Fund. The Board noted that various affiliates of Funds Management may receive distribution-related fees, shareholder servicing payments and sub-transfer agency fees in respect of shares sold or held through them and services provided.
The Board also reviewed information about soft dollar credits earned and utilized by the Sub-Adviser, fees earned by Funds Management and the Sub-Adviser from managing a private investment vehicle for the fund family’s securities lending collateral and commissions earned by an affiliated broker from portfolio transactions.
Based on its consideration of the factors and information it deemed relevant, including those described here, the Board did not find that any ancillary benefits received by Funds Management and its affiliates, including the Sub-Adviser, were unreasonable.
Conclusion
At the Meeting, after considering the above-described factors and based on its deliberations and its evaluation of the information described above, the Board unanimously approved the continuation of the Advisory Agreement for the period from June 1, 2015 through June 30, 2015, approved the Management Agreement for the period from July 1, 2015 through May 31, 2016, and approved the continuation of the Sub-Advisory Agreement for a one-year term through May 31, 2016. The Board also determined that the compensation payable to Funds Management and the Sub-Adviser under each of the Advisory Agreements was reasonable.
| | | | |
| 42 | | Wells Fargo Advantage Income Plus Fund | | List of abbreviations |
The following is a list of common abbreviations for terms and entities that may have appeared in this report.
| ACA | — ACA Financial Guaranty Corporation |
| ADR | — American depositary receipt |
| ADS | — American depositary shares |
| AGC | — Assured Guaranty Corporation |
| AGM | — Assured Guaranty Municipal |
| Ambac | — Ambac Financial Group Incorporated |
| AMT | — Alternative minimum tax |
| BAN | — Bond anticipation notes |
| BHAC | — Berkshire Hathaway Assurance Corporation |
| CAB | — Capital appreciation bond |
| CCAB | — Convertible capital appreciation bond |
| CDA | — Community Development Authority |
| CDO | — Collateralized debt obligation |
| DRIVER | — Derivative inverse tax-exempt receipts |
| DW&P | — Department of Water & Power |
| DWR | — Department of Water Resources |
| ECFA | — Educational & Cultural Facilities Authority |
| EDA | — Economic Development Authority |
| EDFA | — Economic Development Finance Authority |
| ETF | — Exchange-traded fund |
| FDIC | — Federal Deposit Insurance Corporation |
| FFCB | — Federal Farm Credit Banks |
| FGIC | — Financial Guaranty Insurance Corporation |
| FHA | — Federal Housing Administration |
| FHLB | — Federal Home Loan Bank |
| FHLMC | — Federal Home Loan Mortgage Corporation |
| FICO | — The Financing Corporation |
| FNMA | — Federal National Mortgage Association |
| GDR | — Global depositary receipt |
| GNMA | — Government National Mortgage Association |
| HCFR | — Healthcare facilities revenue |
| HEFA | — Health & Educational Facilities Authority |
| HEFAR | — Higher education facilities authority revenue |
| HFA | — Housing Finance Authority |
| HFFA | — Health Facilities Financing Authority |
| HUD | — Department of Housing and Urban Development |
| IDA | — Industrial Development Authority |
| IDAG | — Industrial Development Agency |
| KRW | — Republic of Korea won |
| LIBOR | — London Interbank Offered Rate |
| LIFER | — Long Inverse Floating Exempt Receipts |
| LLC | — Limited liability company |
| LLLP | — Limited liability limited partnership |
| LLP | — Limited liability partnership |
| MBIA | — Municipal Bond Insurance Association |
| MFHR | — Multifamily housing revenue |
| MSTR | — Municipal securities trust receipts |
| MUD | — Municipal Utility District |
| National | — National Public Finance Guarantee Corporation |
| PCFA | — Pollution Control Financing Authority |
| PCL | — Public Company Limited |
| PCR | — Pollution control revenue |
| PFA | — Public Finance Authority |
| PFFA | — Public Facilities Financing Authority |
| PFOTER | — Puttable floating option tax-exempt receipts |
| plc | — Public limited company |
| PUTTER | — Puttable tax-exempt receipts |
| R&D | — Research & development |
| Radian | — Radian Asset Assurance |
| RAN | — Revenue anticipation notes |
| RDA | — Redevelopment Authority |
| RDFA | — Redevelopment Finance Authority |
| REIT | — Real estate investment trust |
| ROC | — Reset option certificates |
| SAVRS | — Select auction variable rate securities |
| SBA | — Small Business Authority |
| SDR | — Swedish depositary receipt |
| SFHR | — Single-family housing revenue |
| SFMR | — Single-family mortgage revenue |
| SPA | — Standby purchase agreement |
| SPDR | — Standard & Poor’s Depositary Receipts |
| SPEAR | — Short Puttable Exempt Adjustable Receipts |
| STRIPS | — Separate trading of registered interest and |
| TAN | — Tax anticipation notes |
| TIPS | — Treasury inflation-protected securities |
| TRAN | — Tax revenue anticipation notes |
| TTFA | — Transportation Trust Fund Authority |
| TVA | — Tennessee Valley Authority |
This page is intentionally left blank.
This page is intentionally left blank.


For more information
More information about Wells Fargo Advantage Funds is available free upon request. To obtain literature, please write, email, visit the Fund’s website, or call:
Wells Fargo Advantage Funds
P.O. Box 8266
Boston, MA 02266-8266
Email: wfaf@wellsfargo.com
Website: wellsfargoadvantagefunds.com
Individual investors: 1-800-222-8222
Retail investment professionals: 1-888-877-9275
Institutional investment professionals: 1-866-765-0778
This report and the financial statements contained herein are submitted for the general information of the shareholders of Wells Fargo Advantage Funds. If this report is used for promotional purposes, distribution of the report must be accompanied or preceded by a current prospectus. Before investing, please consider the investment objectives, risks, charges, and expenses of the investment. For a current prospectus and, if available, a summary prospectus, containing this information, call 1-800-222-8222 or visit the Fund’s website at wellsfargoadvantagefunds.com. Read the prospectus carefully before you invest or send money.
Wells Fargo Funds Management, LLC, a wholly owned subsidiary of Wells Fargo & Company, provides investment advisory and administrative services for Wells Fargo Advantage Funds. Other affiliates of Wells Fargo & Company provide subadvisory and other services for the Funds. The Funds are distributed by Wells Fargo Funds Distributor, LLC, Member FINRA, an affiliate of Wells Fargo & Company.
NOT FDIC INSURED ¡ NO BANK GUARANTEE ¡ MAY LOSE VALUE
© 2015 Wells Fargo Funds Management, LLC. All rights reserved.
| | |
 | | 236805 10-15 A219/AR219 08-15 |

Wells Fargo Advantage
Short Duration Government Bond Fund

Annual Report
August 31, 2015

Reduce clutter. Save trees.
Sign up for electronic delivery of prospectuses and shareholder reports at wellsfargo.com/advantagedelivery
Contents
The views expressed and any forward-looking statements are as of August 31, 2015, unless otherwise noted, and are those of the Fund managers and/or Wells Fargo Funds Management, LLC. Discussions of individual securities, or the markets generally, or any Wells Fargo Advantage Fund are not intended as individual recommendations. Future events or results may vary significantly from those expressed in any forward-looking statements; the views expressed are subject to change at any time in response to changing circumstances in the market. Wells Fargo Funds Management, LLC and the Fund disclaim any obligation to publicly update or revise any views expressed or forward-looking statements.
NOT FDIC INSURED ¡ NO BANK GUARANTEE ¡ MAY LOSE VALUE
| | | | |
| 2 | | Wells Fargo Advantage Short Duration Government Bond Fund | | Letter to shareholders (unaudited) |

Karla M. Rabusch
President
Wells Fargo Advantage Funds
Major central banks continued to inject liquidity into global banks and markets through various accommodative monetary policies, including quantitative easing.
Dear Valued Shareholder:
We are pleased to offer you this annual report for the Wells Fargo Advantage Short Duration Government Bond Fund for the 12-month period that ended August 31, 2015. The period was marked by low interest rates, low oil prices, and moderate U.S. economic growth. Short-term investment-grade bonds, as measured by the Barclays U.S. 1–3 Year Government/Credit Bond Index,1 returned 0.81% during the period. Meanwhile, strong demand for high-quality, liquid assets kept returns on Treasury bills more modest; the Barclays 6-Month Treasury Bill Index2 returned 0.15% during the period.
Major central banks continued to provide stimulus.
Major central banks continued to inject liquidity into global banks and markets through various accommodative monetary policies, including quantitative easing. In the U.S., the Federal Reserve (Fed) kept its key interest rate near zero in order to support the economy and the financial system. However, it set expectations for it to begin normalizing monetary policy with higher target ranges for the federal funds rate.
Meanwhile, European markets continued to benefit from the European Central Bank’s (ECB’s) willingness to maintain low interest rates. In addition to its targeted longer-term refinancing operations that are designed to increase bank lending, the ECB expanded its quantitative easing program to include the purchase of eurozone government bonds. In Japan, the Bank of Japan maintained an aggressive monetary program aimed at combating deflation.
Economic growth was moderate, and oil prices plummeted.
U.S. economic growth advanced during the reporting period, the unemployment rate ticked lower to 5.1% as of August 2015, and inflation remained below the Fed’s longer-run objective of a 2% pace. The period was also marked by lower oil prices, which began the reporting period near $90 per barrel but declined to $46 per barrel at the end of August 2015. While lower oil prices benefited consumers of oil products, the lower prices pressured companies within the energy sector.
Bond yields rose but remained low by historical standards.
Short-term interest rates increased during the reporting period, with a flattening in the shape of the short-term yield curve. During this time frame, 1-year Treasury bills rose 29 basis points (bps; 100 bps equals 1.00%) to yield 0.38%, 2-year Treasury note yields rose 21 bps to yield 0.74%, and 3-year Treasury note yields rose only 8 bps to yield 1.05%. Meanwhile, ultra-short-term yields were little changed at ultralow levels, anchored by the easy monetary policy.
Since the end of the financial crisis, structural changes in the fixed-income markets have reduced trading liquidity (the degree to which assets can be bought or sold without affecting the price). New regulations and capital requirements have caused traditional liquidity suppliers (banks and broker/dealers) to be more risk-averse and hold less inventory. Meanwhile, corporate-debt issuance has spiked as companies finance themselves at record-low yields, bond mutual funds hold larger amounts of this new debt supply, trading volumes are lower, and large-size trades are more difficult to execute. However, fixed-income markets appear to have functioned well over the past year with sufficient liquidity and muted volatility.
| 1 | The Barclays U.S. 1–3 Year Government/Credit Bond Index is the one- to three-year component of the Barclays U.S. Government/Credit Bond Index that includes securities in the Government and Credit Indexes. The Government Index includes Treasuries (that is, public obligations of the U.S. Treasury that have remaining maturities of more than one year) and agencies (that is, publicly issued debt of U.S. government agencies, quasi-federal corporations, and corporate or foreign debt guaranteed by the U.S. government). The Credit Index includes publicly issued U.S. corporate and foreign debentures and secured notes that meet specified maturity, liquidity, and quality requirements. You cannot invest directly in an index. |
| 2 | The Barclays 6-Month Treasury Bill Index tracks the performance and attributes of recently issued 6-month U.S. Treasury bills. The index follows Barclays’ monthly rebalancing conventions. You cannot invest directly in an index. |
| | | | | | |
| Letter to shareholders (unaudited) | | Wells Fargo Advantage Short Duration Government Bond Fund | | | 3 | |
Don’t let short-term uncertainty derail long-term investment goals.
Periods of uncertainty can present challenges, but experience has taught us that maintaining long-term investment goals can be an effective way to plan for the future. To help you create a sound strategy based on your personal goals and risk tolerance, Wells Fargo Advantage Funds offers more than 100 mutual funds spanning a wide range of asset classes and investment styles. Although diversification cannot guarantee an investment profit or prevent losses, we believe it can be an effective way to manage investment risk and potentially smooth out overall portfolio performance. We encourage investors to know their investments and to understand that appropriate levels of risk-taking may unlock opportunities.
Thank you for choosing to invest in Wells Fargo Advantage Funds. We appreciate your confidence in us and remain committed to helping you meet your financial needs.
Sincerely,

Karla M. Rabusch
President
Wells Fargo Advantage Funds
Periods of uncertainty can present challenges, but experience has taught us that maintaining long-term investment goals can be an effective way to plan for the future.
Notice to shareholders
At a meeting held on August 11–12, 2015, the Board of Trustees of the Fund approved a change in the name of the Fund whereby the word “Advantage” will be removed from its name, effective December 15, 2015.
For current information about your fund investments, contact your investment professional, visit our website at wellsfargoadvantagefunds.com, or call us directly at 1-800-222-8222. We are available 24 hours a day, 7 days a week.
| | | | |
| 4 | | Wells Fargo Advantage Short Duration Government Bond Fund | | Performance highlights (unaudited) |
Investment objective
The Fund seeks to provide current income consistent with capital preservation.
Manager
Wells Fargo Funds Management, LLC
Subadviser
Wells Capital Management Incorporated
Portfolio managers
Troy Ludgood
Thomas O’Connor, CFA
Average annual total returns1 (%) as of August 31, 2015
| | | | | | | | | | | | | | | | | | | | | | | | | | | | | | | | | | |
| | | | | Including sales charge | | | Excluding sales charge | | | Expense ratios2 (%) | |
| | | Inception date | | 1 year | | | 5 year | | | 10 year | | | 1 year | | | 5 year | | | 10 year | | | Gross | | | Net3 | |
| Class A (MSDAX) | | 3-11-1996 | | | (1.46 | ) | | | 0.59 | | | | 2.65 | | | | 0.55 | | | | 0.99 | | | | 2.86 | | | | 0.79 | | | | 0.78 | |
| Class B (MSDBX)* | | 5-31-2002 | | | (3.30 | ) | | | 0.40 | | | | 2.55 | | | | (0.30 | ) | | | 0.40 | | | | 2.55 | | | | 1.54 | | | | 1.53 | |
| Class C (MSDCX) | | 5-31-2002 | | | (1.30 | ) | | | 0.24 | | | | 2.08 | | | | (0.30 | ) | | | 0.24 | | | | 2.08 | | | | 1.54 | | | | 1.53 | |
| Class R6 (MSDRX) | | 11-30-2012 | | | – | | | | – | | | | – | | | | 0.96 | | | | 1.45 | | | | 3.30 | | | | 0.42 | | | | 0.37 | |
| Administrator Class (MNSGX) | | 12-18-1992 | | | – | | | | – | | | | – | | | | 0.63 | | | | 1.20 | | | | 3.08 | | | | 0.73 | | | | 0.60 | |
| Institutional Class (WSGIX) | | 4-8-2005 | | | – | | | | – | | | | – | | | | 0.81 | | | | 1.38 | | | | 3.27 | | | | 0.46 | | | | 0.42 | |
Barclays 1–3 Year Government Index4 | | – | | | – | | | | – | | | | – | | | | 0.84 | | | | 0.77 | | | | 2.57 | | | | – | | | | – | |
| * | | Class B shares are closed to investment, except in connection with the reinvestment of any distributions and permitted exchanges. |
Figures quoted represent past performance, which is no guarantee of future results, and do not reflect taxes that a shareholder may pay on fund distributions or the redemption of fund shares. Investment return and principal value of an investment will fluctuate so that an investor’s shares, when redeemed, may be worth more or less than their original cost. Performance shown without sales charges would be lower if sales charges were reflected. Current performance may be lower or higher than the performance data quoted, which assumes the reinvestment of dividends and capital gains. Current month-end performance is available on the Fund’s website, wellsfargoadvantagefunds.com.
Index returns do not include transaction costs associated with buying and selling securities, any mutual fund fees or expenses, or any taxes. It is not possible to invest directly in an index.
For Class A shares, the maximum front-end sales charge is 2.00%. For Class B shares, the maximum contingent deferred sales charge is 3.00%. For Class C shares, the maximum contingent deferred sales charge is 1.00%. Performance including a contingent deferred sales charge assumes the sales charge for the corresponding time period. Class R6, Administrator Class, and Institutional Class shares are sold without a front-end sales charge or contingent deferred sales charge.
Bond values fluctuate in response to the financial condition of individual issuers, general market and economic conditions, and changes in interest rates. Changes in market conditions and government policies may lead to periods of heightened volatility in the bond market and reduced liquidity for certain bonds held by the Fund. In general, when interest rates rise, bond values fall and investors may lose principal value. Interest-rate changes and their impact on the fund and its share price can be sudden and unpredictable. Securities issued by U.S. government agencies or government sponsored entities may not be guaranteed by the U.S. Treasury. Certain investment strategies tend to increase the total risk of an investment (relative to the broader market). The Fund is exposed to mortgage- and asset-backed securities risk. Consult the Fund’s prospectus for additional information on these and other risks. The U.S. government guarantee applies to certain underlying securities and not to shares of the Fund.
Please see footnotes on page 5.
| | | | | | |
| Performance highlights (unaudited) | | Wells Fargo Advantage Short Duration Government Bond Fund | | | 5 | |
|
| Growth of $10,000 investment5 as of August 31, 2015 |
|

|
| 1 | Historical performance shown for Class R6 shares prior to their inception reflects the performance of Institutional Class shares and includes the higher expenses applicable to Institutional Class shares. If these expenses had not been included, returns would be higher. |
| 2 | Reflects the expense ratios as stated in the most recent prospectuses. The expense ratios shown are subject to change and may differ from the annualized expense ratios shown in the financial highlights of this report. |
| 3 | The manager has contractually committed through December 31, 2015, to waive fees and/or reimburse expenses to the extent necessary to cap the Fund’s Total Annual Fund Operating Expenses After Fee Waiver at the amounts shown. After this time, the cap may be increased or the commitment to maintain the cap may be terminated only with the approval of the Board of Trustees. Brokerage commissions, stamp duty fees, interest, taxes, acquired fund fees and expenses, and extraordinary expenses are excluded from the cap. Without this cap, the Fund’s returns would have been lower. |
| 4 | The Barclays 1–3 Year Government Index is composed of all publicly issued, nonconvertible domestic debt of the U.S. government and its agencies. The index also includes corporate debt guaranteed by the U.S. government. Only notes and bonds with a minimum maturity of one year up to a maximum maturity of 2.9 years are included. You cannot invest directly in an index. |
| 5 | The chart compares the performance of Class A shares for the most recent 10 years with the performance of the Barclays 1–3 Year Government Index. The chart assumes a hypothetical investment of $10,000 in Class A shares and reflects all operating expenses and assumes the maximum initial sales charge of 2.00%. |
| 6 | The ten largest holdings, excluding cash and cash equivalents, are calculated based on the value of the investments divided by total net assets of the Fund. Holdings are subject to change and may have changed since the date specified. |
| 7 | Amounts are calculated based on the total long-term investments of the Fund. These amounts are subject to change and may have changed since the date specified. |
| | | | |
| 6 | | Wells Fargo Advantage Short Duration Government Bond Fund | | Performance highlights (unaudited) |
MANAGER’S DISCUSSION
Fund highlights
| n | | The Fund underperformed its benchmark, the Barclays 1–3 Year Government Index, for the 12-month period that ended August 31, 2015. |
| n | | The Fund’s mortgage holdings benefited less from declining rates than mortgages within the index, which detracted from performance. |
| n | | The Fund has out-of-benchmark allocations to agency MBS, asset-backed securities (ABS), and commercial mortgage-backed securities (CMBS). These sector allocations also contributed to results. |
U.S. economic growth remained moderate.
The past 12 months have been volatile for the fixed-income markets as the timing of the U.S. Federal Reserve’s (Fed’s) first rate hike in nearly 10 years has been at the forefront of investors’ minds. A crash in global commodities, including oil, which began last summer, signaled a slowdown in global growth that is now starting to take hold. China has emerged as the focal point of a global economic turmoil following the collapse of its stock market and the devaluation of its currency. Despite international concerns and headwinds, U.S. economic growth has remained moderate with the unemployment rate falling to 5.1%, placing pressure on the Fed to hike the federal funds rate by year-end.
After a volatile start for the reporting period, the markets settled down and came to grips with the end of quantitative easing (QE) by the Fed, as QE officially ended in October 2014. Markets seemed to take the well-anticipated move in stride as the European Central Bank (ECB) started to telegraph its own QE program that was announced in January and implemented in March 2015. The commodity sell-off that began last summer accelerated into year-end with follow-on impacts across risk assets, most notably in high-yield, energy, and emerging markets. By the end of 2014, two-year Treasury yields surged to 0.74% as market participants started to price in the possibility of a Fed rate hike.
2015 began with market participants digesting the implications of European QE and the rise of Syriza in Greek elections. U.S. 10-year yields fell to the reporting period’s low at 1.64% in the wake of a global bond rally that left many wondering if there would be a shortage of bonds for the ECB to buy. Geopolitical tensions were ever-present throughout most of this past year with headline risk being transferred from the Iran nuclear deal, to Greece defiance and fear of a euro exit, to a collapse of the China stock market and a hard landing of its economy. U.S. economic data has been generally moderate, with notable bright spots in employment and housing.
| | | | |
| Ten largest holdings6 (%) as of August 31, 2015 | |
U.S. Treasury Note, 1.00%, 8-15-2018 | | | 9.08 | |
U.S. Treasury Note, 0.50%, 8-31-2016 | | | 7.50 | |
FHLMC, 4.50%, 8-1-2020 | | | 6.84 | |
U.S. Treasury Note, 0.63%, 8-31-2017 | | | 3.94 | |
FHLMC Series 4483 Class PA, 2.50%, 6-15-2045 | | | 2.60 | |
U.S. Treasury Note, 0.38%, 10-31-2016 | | | 2.19 | |
FNMA Series 2015-53 Class MA, 2.50%, 6-25-2045 | | | 1.98 | |
FNMA, 4.50%, 5-1-2020 | | | 1.79 | |
U.S. Treasury Note, 0.63%, 5-31-2017 | | | 1.71 | |
FNMA, 4.50%, 1-1-2020 | | | 1.55 | |
We focused on security selection.
Market volatility resulting from uncertainty around the timing of the first Fed rate hike created an attractive opportunity to employ our bottom-up security selection process. Our positioning and active relative-value management within mortgage pass-throughs and CMOs through the period contributed to our performance. Consistent with our bottom-up process, we maintained a neutral duration to the benchmark throughout the period. However, our yield curve positioning favored the five-year area. We believe we are well positioned should volatility increase further and stand ready to take advantage of relative-value trading opportunities as they arise.
We continued to hold out-of-benchmark positions in MBS, ABS, and CMBS, while maintaining underweight allocations to both agency debt and U.S. Treasuries. In agency MBS, security selection in specified pools, CMOs, and hybrid ARMs were the top contributors to performance. Over the year, we increased our exposure to agency MBS as valuations became more attractive. Within the sector, we increased exposure to specified pools, CMOs, and hybrid ARMs.
Please see footnotes on page 5.
| | | | | | |
| Performance highlights (unaudited) | | Wells Fargo Advantage Short Duration Government Bond Fund | | | 7 | |
Security selection and sector allocations to structured product sectors (ABS and CMBS) contributed to performance during the period. We decreased our exposure to credit-card ABS during the period while adding exposure to nonprime auto ABS. Within the student loan subsector, we reduced our positioning in Federal Family Education Loan Program student loans while slightly increasing our positioning in private student loans. In CMBS, we reduced our exposure, mainly in 2014 and 2015 vintage last cash flow bonds. Within our mortgage holdings, the bonds we held were less sensitive to declining interest rates than the index holdings, which held back their price performance and detracted from results.
|
| Portfolio allocation7 as of August 31, 2015 |
|
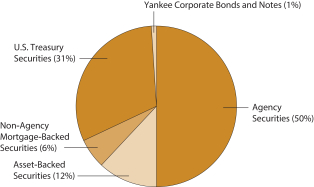 |
The Fed is poised to raise rates gradually.
In light of the more difficult backdrop of a global economic slowdown, despite modest growth in the U.S., all eyes will be watching to see if the Fed raises rates before year end. An increase still appears likely and would be driven by incoming data and forward-looking projections. Policymakers will likely communicate that the path of subsequent increases will be gradual, in order to cushion impacts to foreign markets. Increased volatility around any Fed move will create opportunities.
Please see footnotes on page 5.
| | | | |
| 8 | | Wells Fargo Advantage Short Duration Government Bond Fund | | Fund expenses (unaudited) |
As a shareholder of the Fund, you incur two types of costs: (1) transaction costs, including sales charges (loads) on purchase payments and contingent deferred sales charges (if any) on redemptions and (2) ongoing costs, including management fees, distribution (12b-1) and/or shareholder servicing fees, and other Fund expenses. This example is intended to help you understand your ongoing costs (in dollars) of investing in the Fund and to compare these costs with the ongoing costs of investing in other mutual funds.
The example is based on an investment of $1,000 invested at the beginning of the six-month period and held for the entire period from March 1, 2015 to August 31, 2015.
Actual expenses
The “Actual” line of the table below provides information about actual account values and actual expenses. You may use the information in this line, together with the amount you invested, to estimate the expenses that you paid over the period. Simply divide your account value by $1,000 (for example, an $8,600 account value divided by $1,000 = 8.6), then multiply the result by the number in the “Actual” line under the heading entitled “Expenses paid during period” for your applicable class of shares to estimate the expenses you paid on your account during this period.
Hypothetical example for comparison purposes
The “Hypothetical” line of the table below provides information about hypothetical account values and hypothetical expenses based on the Fund’s actual expense ratio and an assumed rate of return of 5% per year before expenses, which is not the Fund’s actual return. The hypothetical account values and expenses may not be used to estimate the actual ending account balance or expenses you paid for the period. You may use this information to compare the ongoing costs of investing in the Fund and other funds. To do so, compare this 5% hypothetical example with the 5% hypothetical examples that appear in the shareholder reports of the other funds.
Please note that the expenses shown in the table are meant to highlight your ongoing costs only and do not reflect any transactional costs, such as sales charges (loads) and contingent deferred sales charges. Therefore, the “Hypothetical” line of the table is useful in comparing ongoing costs only and will not help you determine the relative total costs of owning different funds. In addition, if these transactional costs were included, your costs would have been higher.
| | | | | | | | | | | | | | | | |
| | | Beginning account value 3-1-2015 | | | Ending account value 8-31-2015 | | | Expenses paid during the period1 | | | Net annualized expense ratio | |
Class A | | | | | | | | | | | | | | | | |
Actual | | $ | 1,000.00 | | | $ | 1,001.28 | | | $ | 3.93 | | | | 0.78 | % |
Hypothetical (5% return before expenses) | | $ | 1,000.00 | | | $ | 1,021.27 | | | $ | 3.97 | | | | 0.78 | % |
Class B | | | | | | | | | | | | | | | | |
Actual | | $ | 1,000.00 | | | $ | 996.51 | | | $ | 7.70 | | | | 1.53 | % |
Hypothetical (5% return before expenses) | | $ | 1,000.00 | | | $ | 1,017.49 | | | $ | 7.78 | | | | 1.53 | % |
Class C | | | | | | | | | | | | | | | | |
Actual | | $ | 1,000.00 | | | $ | 996.52 | | | $ | 7.70 | | | | 1.53 | % |
Hypothetical (5% return before expenses) | | $ | 1,000.00 | | | $ | 1,017.49 | | | $ | 7.78 | | | | 1.53 | % |
Class R6 | | | | | | | | | | | | | | | | |
Actual | | $ | 1,000.00 | | | $ | 1,003.36 | | | $ | 1.87 | | | | 0.37 | % |
Hypothetical (5% return before expenses) | | $ | 1,000.00 | | | $ | 1,023.34 | | | $ | 1.89 | | | | 0.37 | % |
Administrator Class | | | | | | | | | | | | | | | | |
Actual | | $ | 1,000.00 | | | $ | 1,001.19 | | | $ | 3.03 | | | | 0.60 | % |
Hypothetical (5% return before expenses) | | $ | 1,000.00 | | | $ | 1,022.18 | | | $ | 3.06 | | | | 0.60 | % |
Institutional Class | | | | | | | | | | | | | | | | |
Actual | | $ | 1,000.00 | | | $ | 1,002.10 | | | $ | 2.12 | | | | 0.42 | % |
Hypothetical (5% return before expenses) | | $ | 1,000.00 | | | $ | 1,023.09 | | | $ | 2.14 | | | | 0.42 | % |
| 1 | Expenses paid is equal to the annualized expense ratio of each class multiplied by the average account value over the period, multiplied by the number of days in the most recent fiscal half-year divided by the number of days in the fiscal year (to reflect the one-half-year period). |
| | | | | | |
| Portfolio of investments—August 31, 2015 | | Wells Fargo Advantage Short Duration Government Bond Fund | | | 9 | |
| | | | | | | | | | | | | | | | |
| Security name | | Interest rate | | | Maturity date | | | Principal | | | Value | |
| | | | | | | | | | | | | | | | |
| | | | |
Agency Securities: 49.21% | | | | | | | | | | | | | | | | |
FHLMC ± | | | 2.31 | % | | | 8-1-2044 | | | $ | 7,947,294 | | | $ | 8,117,692 | |
FHLMC ± | | | 2.95 | | | | 5-1-2044 | | | | 1,534,549 | | | | 1,593,456 | |
FHLMC ± | | | 2.97 | | | | 9-1-2045 | | | | 3,288,665 | | | | 3,382,200 | |
FHLMC ±%% | | | 2.99 | | | | 9-1-2045 | | | | 2,085,235 | | | | 2,144,645 | |
FHLMC (a)%% | | | 3.01 | | | | 9-1-2045 | | | | 3,257,000 | | | | 3,337,621 | |
FHLMC ± | | | 3.03 | | | | 12-1-2043 | | | | 4,668,655 | | | | 4,849,139 | |
FHLMC ± | | | 3.12 | | | | 8-1-2041 | | | | 4,428,606 | | | | 4,656,120 | |
FHLMC ± | | | 3.15 | | | | 7-1-2042 | | | | 2,819,797 | | | | 2,919,469 | |
FHLMC ± | | | 3.70 | | | | 10-1-2041 | | | | 3,666,435 | | | | 3,877,316 | |
FHLMC | | | 4.00 | | | | 6-1-2025 | | | | 2,766,526 | | | | 2,960,161 | |
FHLMC | | | 4.00 | | | | 2-1-2026 | | | | 3,783,569 | | | | 4,051,043 | |
FHLMC | | | 4.00 | | | | 10-1-2026 | | | | 1,678,091 | | | | 1,790,257 | |
FHLMC | | | 4.00 | | | | 6-1-2031 | | | | 3,502,620 | | | | 3,742,159 | |
FHLMC | | | 4.00 | | | | 4-1-2032 | | | | 1,378,671 | | | | 1,462,973 | |
FHLMC | | | 4.50 | | | | 8-1-2018 | | | | 3,990,309 | | | | 4,147,232 | |
FHLMC | | | 4.50 | | | | 10-1-2018 | | | | 2,133,322 | | | | 2,217,217 | |
FHLMC | | | 4.50 | | | | 8-1-2020 | | | | 70,451,466 | | | | 73,222,036 | |
FHLMC | | | 4.50 | | | | 8-1-2026 | | | | 5,611,704 | | | | 6,031,620 | |
FHLMC | | | 4.50 | | | | 4-1-2031 | | | | 2,499,502 | | | | 2,726,732 | |
FHLMC | | | 5.50 | | | | 5-1-2041 | | | | 534,354 | | | | 611,213 | |
FHLMC | | | 5.50 | | | | 5-1-2041 | | | | 321,376 | | | | 367,607 | |
FHLMC ± | | | 5.90 | | | | 7-1-2038 | | | | 4,085,874 | | | | 4,356,885 | |
FHLMC | | | 6.00 | | | | 5-15-2039 | | | | 3,357,540 | | | | 3,834,163 | |
FHLMC | | | 7.00 | | | | 3-25-2044 | | | | 1,948,971 | | | | 2,289,917 | |
FHLMC Series 2638 Class MJ | | | 5.00 | | | | 7-15-2033 | | | | 3,322,905 | | | | 3,686,617 | |
FHLMC Series 2744 Class JH | | | 5.00 | | | | 2-15-2034 | | | | 2,594,400 | | | | 2,872,785 | |
FHLMC Series 2762 Class LY | | | 5.00 | | | | 3-15-2034 | | | | 1,475,474 | | | | 1,619,632 | |
FHLMC Series 3574 Class D | | | 5.00 | | | | 9-15-2039 | | | | 1,702,630 | | | | 1,876,996 | |
FHLMC Series 4227 Class AB | | | 3.50 | | | | 10-15-2037 | | | | 7,056,194 | | | | 7,423,292 | |
FHLMC Series 4382 Class AB | | | 3.00 | | | | 7-15-2040 | | | | 7,394,672 | | | | 7,622,243 | |
FHLMC Series 4483 Class PA | | | 2.50 | | | | 6-15-2045 | | | | 27,352,887 | | | | 27,858,122 | |
FNMA ± | | | 2.14 | | | | 6-1-2043 | | | | 5,042,121 | | | | 5,135,449 | |
FNMA ± | | | 2.19 | | | | 9-1-2043 | | | | 11,818,049 | | | | 12,038,681 | |
FNMA ± | | | 2.29 | | | | 5-1-2042 | | | | 3,965,512 | | | | 4,089,412 | |
FNMA ± | | | 2.31 | | | | 8-1-2043 | | | | 5,544,653 | | | | 5,663,521 | |
FNMA ± | | | 2.33 | | | | 10-1-2043 | | | | 2,925,700 | | | | 2,990,438 | |
FNMA ± | | | 2.34 | | | | 5-1-2042 | | | | 5,770,973 | | | | 5,956,301 | |
FNMA ± | | | 2.47 | | | | 10-1-2043 | | | | 4,215,855 | | | | 4,320,991 | |
FNMA ± | | | 2.63 | | | | 4-1-2045 | | | | 7,674,120 | | | | 7,864,079 | |
FNMA ± | | | 2.66 | | | | 11-1-2044 | | | | 7,292,410 | | | | 7,495,771 | |
FNMA %% | | | 2.77 | | | | 9-1-2045 | | | | 7,795,000 | | | | 8,020,629 | |
FNMA ± | | | 2.79 | | | | 5-1-2044 | | | | 3,728,221 | | | | 3,839,790 | |
FNMA (a)%% | | | 2.97 | | | | 9-1-2045 | | | | 3,257,000 | | | | 3,332,614 | |
FNMA ± | | | 3.24 | | | | 12-1-2043 | | | | 2,239,185 | | | | 2,334,357 | |
FNMA | | | 3.50 | | | | 12-1-2029 | | | | 2,593,715 | | | | 2,734,898 | |
FNMA | | | 3.50 | | | | 2-1-2030 | | | | 2,722,815 | | | | 2,888,286 | |
FNMA | | | 3.50 | | | | 5-1-2030 | | | | 2,954,020 | | | | 3,125,504 | |
FNMA | | | 3.50 | | | | 8-1-2030 | | | | 5,084,000 | | | | 5,406,798 | |
FNMA ± | | | 3.52 | | | | 3-1-2041 | | | | 1,044,485 | | | | 1,093,519 | |
The accompanying notes are an integral part of these financial statements.
| | | | |
| 10 | | Wells Fargo Advantage Short Duration Government Bond Fund | | Portfolio of investments—August 31, 2015 |
| | | | | | | | | | | | | | | | |
| Security name | | Interest rate | | | Maturity date | | | Principal | | | Value | |
| | | | | | | | | | | | | | | | |
| | | | |
Agency Securities (continued) | | | | | | | | | | | | | | | | |
FNMA ± | | | 3.54 | % | | | 12-1-2041 | | | $ | 4,696,435 | | | $ | 4,974,865 | |
FNMA | | | 4.00 | | | | 3-1-2026 | | | | 3,042,137 | | | | 3,257,253 | |
FNMA | | | 4.00 | | | | 5-1-2026 | | | | 948,000 | | | | 1,018,510 | |
FNMA | | | 4.00 | | | | 5-1-2027 | | | | 2,437,695 | | | | 2,595,618 | |
FNMA | | | 4.00 | | | | 4-1-2032 | | | | 1,249,714 | | | | 1,349,812 | |
FNMA | | | 4.00 | | | | 8-1-2032 | | | | 1,316,159 | | | | 1,420,760 | |
FNMA | | | 4.00 | | | | 3-1-2033 | | | | 7,004,757 | | | | 7,496,358 | |
FNMA | | | 4.50 | | | | 1-1-2020 | | | | 13,418,069 | | | | 13,935,888 | |
FNMA | | | 4.50 | | | | 1-1-2020 | | | | 10,354,988 | | | | 10,754,157 | |
FNMA | | | 4.50 | | | | 1-1-2020 | | | | 15,938,663 | | | | 16,553,375 | |
FNMA | | | 4.50 | | | | 1-1-2020 | | | | 14,622,565 | | | | 15,185,579 | |
FNMA | | | 4.50 | | | | 5-1-2020 | | | | 18,507,527 | | | | 19,222,281 | |
FNMA | | | 4.50 | | | | 10-1-2020 | | | | 5,027,768 | | | | 5,222,023 | |
FNMA | | | 4.50 | | | | 6-1-2025 | | | | 2,210,782 | | | | 2,374,973 | |
FNMA | | | 4.50 | | | | 2-1-2026 | | | | 607,552 | | | | 653,336 | |
FNMA | | | 4.50 | | | | 10-1-2026 | | | | 7,589,540 | | | | 8,171,760 | |
FNMA | | | 5.00 | | | | 2-1-2023 | | | | 4,274,177 | | | | 4,577,868 | |
FNMA | | | 5.00 | | | | 5-1-2023 | | | | 837,831 | | | | 907,144 | |
FNMA | | | 5.00 | | | | 8-1-2030 | | | | 1,025,285 | | | | 1,129,865 | |
FNMA | | | 5.50 | | | | 6-1-2040 | | | | 96,929 | | | | 110,991 | |
FNMA | | | 5.50 | | | | 7-1-2040 | | | | 321,619 | | | | 368,666 | |
FNMA | | | 5.50 | | | | 5-1-2041 | | | | 185,784 | | | | 212,240 | |
FNMA | | | 5.50 | | | | 7-1-2041 | | | | 192,883 | | | | 220,939 | |
FNMA | | | 5.50 | | | | 8-1-2041 | | | | 2,212,050 | | | | 2,533,009 | |
FNMA | | | 6.00 | | | | 3-25-2035 | | | | 887,912 | | | | 938,996 | |
FNMA Grantor Trust Series 2000-T6 Class A1 | | | 7.50 | | | | 6-25-2030 | | | | 573,319 | | | | 658,282 | |
FNMA Series 1999-T2 Class A1 ± | | | 7.50 | | | | 1-19-2039 | | | | 366,033 | | | | 402,175 | |
FNMA Series 2001-W03 Class A ± | | | 6.85 | | | | 9-25-2041 | | | | 565,666 | | | | 643,149 | |
FNMA Series 2002-90 Class A1 | | | 6.50 | | | | 6-25-2042 | | | | 24,518 | | | | 27,989 | |
FNMA Series 2002-W6 Class 2A1 ± | | | 6.36 | | | | 6-25-2042 | | | | 10,429 | | | | 11,968 | |
FNMA Series 2003-63 Class GB | | | 4.00 | | | | 7-25-2033 | | | | 3,625,759 | | | | 3,850,549 | |
FNMA Series 2003-W1 Class 2A ± | | | 6.44 | | | | 12-25-2042 | | | | 272,083 | | | | 316,373 | |
FNMA Series 2004-W9 Class 2A3 | | | 7.50 | | | | 2-25-2044 | | | | 721,671 | | | | 825,588 | |
FNMA Series 2010-71 Class HJ | | | 5.50 | | | | 7-25-2040 | | | | 1,393,747 | | | | 1,585,728 | |
FNMA Series 2010-98 Class EA | | | 4.00 | | | | 9-25-2030 | | | | 2,244,758 | | | | 2,401,266 | |
FNMA Series 2011-46 Class BA | | | 4.00 | | | | 4-25-2037 | | | | 8,679,316 | | | | 9,049,680 | |
FNMA Series 2011-M2 Class A1 | | | 2.02 | | | | 4-25-2021 | | | | 2,556,683 | | | | 2,589,843 | |
FNMA Series 2012-28 Class PT | | | 4.00 | | | | 3-25-2042 | | | | 1,129,464 | | | | 1,196,761 | |
FNMA Series 2012-65 Class HJ | | | 5.00 | | | | 7-25-2040 | | | | 8,191,882 | | | | 9,096,209 | |
FNMA Series 2013-103 Class H | | | 4.50 | | | | 3-25-2038 | | | | 5,886,415 | | | | 6,408,834 | |
FNMA Series 2015-53 Class MA | | | 2.50 | | | | 6-25-2045 | | | | 20,755,354 | | | | 21,201,989 | |
FNMA Series 2015-69 Class MC | | | 2.50 | | | | 9-25-2045 | | | | 11,448,000 | | | | 11,627,047 | |
FNMA Series 2015-M10 Class FA ± | | | 0.45 | | | | 3-25-2019 | | | | 6,612,590 | | | | 6,600,608 | |
FNMA Series 2015-M4 Class FA ± | | | 0.41 | | | | 9-25-2018 | | | | 10,639,527 | | | | 10,646,198 | |
FNMA Series 2015-M8 Class FA ± | | | 0.37 | | | | 11-25-2018 | | | | 6,723,684 | | | | 6,716,261 | |
GNMA ± | | | 2.50 | | | | 6-20-2045 | | | | 622,619 | | | | 636,218 | |
GNMA | | | 4.50 | | | | 8-20-2045 | | | | 9,228,000 | | | | 9,927,695 | |
GNMA ## | | | 5.50 | | | | 3-15-2033 | | | | 1,351,405 | | | | 1,553,115 | |
GNMA Series 2001-53 Class PB | | | 6.50 | | | | 11-20-2031 | | | | 3,336,000 | | | | 3,859,672 | |
| | | | |
Total Agency Securities (Cost $528,248,081) | | | | | | | | | | | | | | | 526,999,061 | |
| | | | | | | | | | | | | | | | |
The accompanying notes are an integral part of these financial statements.
| | | | | | |
| Portfolio of investments—August 31, 2015 | | Wells Fargo Advantage Short Duration Government Bond Fund | | | 11 | |
| | | | | | | | | | | | | | | | |
| Security name | | Interest rate | | | Maturity date | | | Principal | | | Value | |
| | | | | | | | | | | | | | | | |
| | | | |
Asset-Backed Securities: 11.66% | | | | | | | | | | | | | | | | |
Ally Master Owner Trust Series 2015-2 Class A1 ± | | | 0.77 | % | | | 1-15-2021 | | | $ | 3,676,000 | | | $ | 3,674,710 | |
Avis Budget Rental Car Funding LLC Series 2012-3A Class A 144A | | | 2.10 | | | | 3-20-2019 | | | | 8,126,000 | | | | 8,158,634 | |
California Republic Auto Receivables Trust Series 2013-2 Class A2 | | | 1.23 | | | | 3-15-2019 | | | | 3,118,695 | | | | 3,116,833 | |
California Republic Auto Receivables Trust Series 2014-1 Class A4 | | | 1.48 | | | | 8-15-2019 | | | | 3,136,000 | | | | 3,147,415 | |
California Republic Auto Receivables Trust Series 2014-2 Class A3 | | | 0.91 | | | | 8-15-2018 | | | | 3,253,000 | | | | 3,254,145 | |
California Republic Auto Receivables Trust Series 2014-2 Class A4 | | | 1.57 | | | | 12-16-2019 | | | | 3,579,000 | | | | 3,593,960 | |
California Republic Auto Receivables Trust Series 2014-3 Class A4 | | | 1.79 | | | | 3-16-2020 | | | | 3,179,000 | | | | 3,204,572 | |
California Republic Auto Receivables Trust Series 2015-1 Class A4 | | | 1.82 | | | | 9-15-2020 | | | | 3,620,000 | | | | 3,650,687 | |
Capital Auto Receivables Asset Trust Series 2014-1 Class A3 | | | 1.32 | | | | 6-20-2018 | | | | 6,380,000 | | | | 6,386,182 | |
Capital Auto Receivables Asset Trust Series 2014-2 Class A4 | | | 1.62 | | | | 10-22-2018 | | | | 3,186,000 | | | | 3,199,693 | |
Capital Auto Receivables Asset Trust Series 2014-3 Class A4 | | | 1.83 | | | | 4-22-2019 | | | | 3,144,000 | | | | 3,154,363 | |
Capital Auto Receivables Asset Trust Series 2015-1 Class A4 | | | 1.86 | | | | 10-21-2019 | | | | 2,433,000 | | | | 2,429,112 | |
Capital Auto Receivables Asset Trust Series 2015-2 Class A2 | | | 1.39 | | | | 9-20-2018 | | | | 7,230,000 | | | | 7,198,246 | |
Capital Auto Receivables Asset Trust Series 2015-2 Class A3 | | | 1.73 | | | | 9-20-2019 | | | | 2,230,000 | | | | 2,225,698 | |
Capital Auto Receivables Asset Trust Series 2015-3 Class A3 | | | 1.94 | | | | 1-21-2020 | | | | 11,350,000 | | | | 11,355,970 | |
Navient Student Loan Trust Series 2014-CTA Class A 144A± | | | 0.90 | | | | 9-16-2024 | | | | 11,632,388 | | | | 11,545,273 | |
Nelnet Student Loan Trust Series 2004-4 Class A5 ± | | | 0.46 | | | | 1-25-2037 | | | | 3,836,279 | | | | 3,734,852 | |
SLC Student Loan Trust Series 2007-2 Class A2 ± | | | 0.72 | | | | 5-15-2028 | | | | 872,882 | | | | 862,157 | |
SLC Student Loan Trust Series 2010-1 Class A ± | | | 1.20 | | | | 11-25-2042 | | | | 1,737,101 | | | | 1,738,683 | |
SLM Student Loan Trust Series 2002-6 Class A4 ± | | | 0.47 | | | | 3-15-2019 | | | | 310,379 | | | | 310,093 | |
SLM Student Loan Trust Series 2005-6 Class A5 ± | | | 1.50 | | | | 7-27-2026 | | | | 2,450,950 | | | | 2,457,023 | |
SLM Student Loan Trust Series 2005-6 Class A5A ± | | | 0.41 | | | | 7-27-2026 | | | | 1,918,700 | | | | 1,893,558 | |
SLM Student Loan Trust Series 2010-1 Class A ± | | | 0.60 | | | | 3-25-2025 | | | | 3,968,286 | | | | 3,912,298 | |
SLM Student Loan Trust Series 2010-A Class 1A 144A± | | | 3.20 | | | | 5-16-2044 | | | | 2,239,176 | | | | 2,309,762 | |
SLM Student Loan Trust Series 2010-A Class 2A 144A± | | | 3.45 | | | | 5-16-2044 | | | | 4,496,174 | | | | 4,678,121 | |
SLM Student Loan Trust Series 2011-C Class A2A 144A± | | | 3.45 | | | | 10-17-2044 | | | | 1,882,000 | | | | 1,999,158 | |
SLM Student Loan Trust Series 2012-B Class A2 144A | | | 3.48 | | | | 10-15-2030 | | | | 3,197,000 | | | | 3,286,906 | |
SLM Student Loan Trust Series 2013-A Class A1 144A± | | | 0.80 | | | | 8-15-2022 | | | | 2,813,187 | | | | 2,801,706 | |
SLM Student Loan Trust Series 2014-A Class A2B 144A± | | | 1.34 | | | | 1-15-2026 | | | | 3,457,000 | | | | 3,454,169 | |
SMB Private Education Loan Trust Series 2015-A Class A1 144A± | | | 0.80 | | | | 7-17-2023 | | | | 12,219,502 | | | | 12,106,655 | |
| | | | |
Total Asset-Backed Securities (Cost $125,378,017) | | | | | | | | | | | | | | | 124,840,634 | |
| | | | | | | | | | | | | | | | |
| | | | |
Non-Agency Mortgage-Backed Securities: 5.79% | | | | | | | | | | | | | | | | |
Commercial Mortgage Trust Series 2012-LC4 Class A2 | | | 2.26 | | | | 12-10-2044 | | | | 4,632,182 | | | | 4,679,713 | |
Commercial Mortgage Trust Series 2012-LC4 Class A3 | | | 3.07 | | | | 12-10-2044 | | | | 6,335,000 | | | | 6,566,715 | |
Commercial Mortgage Trust Series 2013-CR6 Class A1 | | | 0.72 | | | | 3-10-2046 | | | | 2,320,564 | | | | 2,302,918 | |
DBUBS Mortgage Trust Series 2011-LC2A Class A1 144A | | | 3.53 | | | | 7-10-2044 | | | | 762,216 | | | | 795,126 | |
GS Mortgage Securities Trust Series 2010-C1 Class A1 144A | | | 3.68 | | | | 8-10-2043 | | | | 1,237,663 | | | | 1,278,208 | |
GS Mortgage Securities Trust Series 2010-C2 Class A1 144A | | | 3.85 | | | | 12-10-2043 | | | | 2,766,562 | | | | 2,836,329 | |
GS Mortgage Securities Trust Series 2011-GC3 Class A2 144A | | | 3.65 | | | | 3-10-2044 | | | | 3,913,591 | | | | 3,927,543 | |
GS Mortgage Securities Trust Series 2012-GCJ7 Class AAB | | | 2.94 | | | | 5-10-2045 | | | | 2,579,000 | | | | 2,651,627 | |
JPMorgan Chase Commercial Mortgage Securities Corporation Series 2010-C1 Class A2 144A | | | 4.61 | | | | 6-15-2043 | | | | 2,478,000 | | | | 2,597,018 | |
JPMorgan Chase Commercial Mortgage Securities Corporation Series 2010-C2 Class A2 144A | | | 3.62 | | | | 11-15-2043 | | | | 2,259,000 | | | | 2,334,082 | |
JPMorgan Chase Commercial Mortgage Securities Corporation Series 2010-CNTR Class A1 144A | | | 3.30 | | | | 8-5-2032 | | | | 1,496,614 | | | | 1,538,106 | |
JPMorgan Chase Commercial Mortgage Securities Corporation Series 2011-C3 Class A2 144A | | | 3.67 | | | | 2-15-2046 | | | | 4,540,533 | | | | 4,611,524 | |
JPMorgan Chase Commercial Mortgage Securities Corporation Series 2011-C5 Class A2 | | | 3.15 | | | | 8-15-2046 | | | | 751,395 | | | | 763,565 | |
The accompanying notes are an integral part of these financial statements.
| | | | |
| 12 | | Wells Fargo Advantage Short Duration Government Bond Fund | | Portfolio of investments—August 31, 2015 |
| | | | | | | | | | | | | | | | |
| Security name | | Interest rate | | | Maturity date | | | Principal | | | Value | |
| | | | | | | | | | | | | | | | |
| | | | |
Non-Agency Mortgage-Backed Securities (continued) | | | | | | | | | | | | | | | | |
JPMorgan Chase Commercial Mortgage Securities Corporation Series 2012-CBX Class A3 | | | 3.14 | % | | | 6-15-2045 | | | $ | 4,793,684 | | | $ | 4,897,937 | |
JPMorgan Chase Commercial Mortgage Securities Corporation Series 2012-LC9 Class A2 | | | 1.68 | | | | 12-15-2047 | | | | 3,876,000 | | | | 3,880,279 | |
JPMorgan Chase Commercial Mortgage Securities Corporation Series 2014-C18 Class A1 | | | 1.25 | | | | 2-15-2047 | | | | 1,623,444 | | | | 1,619,541 | |
JPMorgan Chase Commercial Mortgage Securities Trust Series 2015-IVR2 Class A2 144A± | | | 2.77 | | | | 1-25-2045 | | | | 5,989,575 | | | | 6,041,319 | |
JPMorgan Mortgage Trust Series 2015-1 Class 1A2 144A± | | | 2.69 | | | | 12-25-2044 | | | | 3,744,715 | | | | 3,796,273 | |
Morgan Stanley Capital I Trust Series 2011-C2 Class A3 144A | | | 4.21 | | | | 6-15-2044 | | | | 705,000 | | | | 749,801 | |
Morgan Stanley Dean Witter Capital I Series 2011-C3 Class A2 | | | 3.22 | | | | 7-15-2049 | | | | 4,127,539 | | | | 4,194,404 | |
| | | | |
Total Non-Agency Mortgage-Backed Securities (Cost $63,131,003) | | | | | | | | | | | | | | | 62,062,028 | |
| | | | | | | | | | | | | | | | |
| | | | |
U.S. Treasury Securities: 31.04% | | | | | | | | | | | | | | | | |
U.S. Treasury Note | | | 0.38 | | | | 10-31-2016 | | | | 23,514,000 | | | | 23,480,328 | |
U.S. Treasury Note | | | 0.50 | | | | 8-31-2016 | | | | 80,290,000 | | | | 80,338,094 | |
U.S. Treasury Note | | | 0.50 | | | | 4-30-2017 | | | | 9,452,000 | | | | 9,427,387 | |
U.S. Treasury Note | | | 0.63 | | | | 5-31-2017 | | | | 18,361,000 | | | | 18,339,720 | |
U.S. Treasury Note | | | 0.63 | | | | 6-30-2017 | | | | 16,290,000 | | | | 16,267,732 | |
U.S. Treasury Note ## | | | 0.63 | | | | 7-31-2017 | | | | 8,931,000 | | | | 8,916,576 | |
U.S. Treasury Note | | | 0.63 | | | | 8-31-2017 | | | | 42,343,000 | | | | 42,244,298 | |
U.S. Treasury Note | | | 0.88 | | | | 7-15-2017 | | | | 10,983,000 | | | | 11,012,885 | |
U.S. Treasury Note | | | 0.88 | | | | 1-15-2018 | | | | 11,788,000 | | | | 11,776,943 | |
U.S. Treasury Note | | | 0.88 | | | | 7-15-2018 | | | | 13,423,000 | | | | 13,356,583 | |
U.S. Treasury Note | | | 1.00 | | | | 8-15-2018 | | | | 97,369,000 | | | | 97,204,154 | |
| | | | |
Total U.S. Treasury Securities (Cost $332,560,516) | | | | | | | | | | | | | | | 332,364,700 | |
| | | | | | | | | | | | | | | | |
| | | | |
Yankee Corporate Bonds and Notes: 1.30% | | | | | | | | | | | | | | | | |
| | | | |
Financials: 1.30% | | | | | | | | | | | | | | | | |
| | | | |
| Banks: 1.30% | | | | | | | | | | | | | | | | |
Royal Bank of Canada Incorporated | | | 2.00 | | | | 10-1-2018 | | | | 13,745,000 | | | | 13,889,405 | |
| | | | | | | | | | | | | | | | |
| | | | |
Total Yankee Corporate Bonds and Notes (Cost $13,882,862) | | | | | | | | | | | | | | | 13,889,405 | |
| | | | | | | | | | | | | | | | |
| | | | |
| | | Yield | | | | | | Shares | | | | |
| Short-Term Investments: 1.43% | | | | | | | | | | | | | | | | |
| | | | |
| Investment Companies: 1.43% | | | | | | | | | | | | | | | | |
Wells Fargo Advantage Government Money Market Fund, Institutional Class ##(l)(u) | | | 0.01 | | | | | | | | 15,356,055 | | | | 15,356,055 | |
| | | | | | | | | | | | | | | | |
| | | | |
Total Short-Term Investments (Cost $15,356,055) | | | | | | | | | | | | | | | 15,356,055 | |
| | | | | | | | | | | | | | | | |
| | | | | | | | |
| Total investments in securities (Cost $1,078,556,534) * | | | 100.43 | % | | | 1,075,511,883 | |
Other assets and liabilities, net | | | (0.43 | ) | | | (4,615,390 | ) |
| | | | | | | | |
| Total net assets | | | 100.00 | % | | $ | 1,070,896,493 | |
| | | | | | | | |
The accompanying notes are an integral part of these financial statements.
| | | | | | |
| Portfolio of investments—August 31, 2015 | | Wells Fargo Advantage Short Duration Government Bond Fund | | | 13 | |
| ± | Variable rate investment. The rate shown is the rate in effect at period end. |
| %% | The security is issued on a when-issued basis. |
| (a) | The security is fair valued in accordance with procedures approved by the Board of Trustees. |
| 144A | The security may be resold in transactions exempt from registration, normally to qualified institutional buyers, pursuant to Rule 144A under the Securities Act of 1933. |
| ## | All or a portion of this security is segregated for when-issued securities. |
| (l) | The security represents an affiliate of the Fund as defined in the Investment Company Act of 1940. |
| (u) | The rate represents the 7-day annualized yield at period end. |
| * | Cost for federal income tax purposes is $1,078,752,666 and unrealized gains (losses) consists of: |
| | | | |
Gross unrealized gains | | $ | 987,296 | |
Gross unrealized losses | | | (4,228,079 | ) |
| | | | |
Net unrealized losses | | $ | (3,240,783 | ) |
The accompanying notes are an integral part of these financial statements.
| | | | |
| 14 | | Wells Fargo Advantage Short Duration Government Bond Fund | | Statement of assets and liabilities—August 31, 2015 |
| | | | |
| | | | |
| |
Assets | | | | |
Investments | | | | |
In unaffiliated securities, at value (cost $1,063,200,479) | | $ | 1,060,155,828 | |
In affiliated securities, at value (cost $15,356,055) | | | 15,356,055 | |
| | | | |
Total investments, at value (cost $1,078,556,534) | | | 1,075,511,883 | |
Receivable for investments sold | | | 79,694,294 | |
Principal paydown receivable | | | 1,091,457 | |
Receivable for Fund shares sold | | | 11,634,017 | |
Receivable for interest | | | 2,120,048 | |
Prepaid expenses and other assets | | | 10,902 | |
| | | | |
Total assets | | | 1,170,062,601 | |
| | | | |
| |
Liabilities | | | | |
Dividends payable | | | 77,328 | |
Payable for investments purchased | | | 96,023,094 | |
Payable for Fund shares redeemed | | | 2,549,597 | |
Management fee payable | | | 273,427 | |
Distribution fees payable | | | 20,477 | |
Administration fees payable | | | 71,932 | |
Accrued expenses and other liabilities | | | 150,253 | |
| | | | |
Total liabilities | | | 99,166,108 | |
| | | | |
Total net assets | | $ | 1,070,896,493 | |
| | | | |
| |
NET ASSETS CONSIST OF | | | | |
Paid-in capital | | $ | 1,115,292,800 | |
Undistributed net investment income | | | 606,284 | |
Accumulated net realized losses on investments | | | (41,957,940 | ) |
Net unrealized losses on investments | | | (3,044,651 | ) |
| | | | |
Total net assets | | $ | 1,070,896,493 | |
| | | | |
| |
COMPUTATION OF NET ASSET VALUE AND OFFERING PRICE PER SHARE | | | | |
Net assets – Class A | | $ | 62,503,800 | |
Shares outstanding – Class A1 | | | 6,239,616 | |
Net asset value per share – Class A | | | $10.02 | |
Maximum offering price per share – Class A2 | | | $10.22 | |
Net assets – Class B | | $ | 99,454 | |
Shares outstanding – Class B1 | | | 9,922 | |
Net asset value per share – Class B | | | $10.02 | |
Net assets – Class C | | $ | 31,910,201 | |
Shares outstanding – Class C1 | | | 3,180,543 | |
Net asset value per share – Class C | | | $10.03 | |
Net assets – Class R6 | | $ | 231,878,114 | |
Shares outstanding – Class R61 | | | 23,074,629 | |
Net asset value per share – Class R6 | | | $10.05 | |
Net assets – Administrator Class | | $ | 156,669,449 | |
Shares outstanding – Administrator Class1 | | | 15,615,313 | |
Net asset value per share – Administrator Class | | | $10.03 | |
Net assets – Institutional Class | | $ | 587,835,475 | |
Shares outstanding – Institutional Class1 | | | 58,601,165 | |
Net asset value per share – Institutional Class | | | $10.03 | |
| 1 | The Fund has an unlimited number of authorized shares. |
| 2 | Maximum offering price is computed as 100/98 of net asset value. On investments of $50,000 or more, the offering price is reduced. |
The accompanying notes are an integral part of these financial statements.
| | | | | | |
| Statement of operations—year ended August 31, 2015 | | Wells Fargo Advantage Short Duration Government Bond Fund | | | 15 | |
| | | | |
| | | | |
| |
Investment income | | | | |
Interest | | $ | 16,383,237 | |
Income from affiliated securities | | | 4,362 | |
| | | | |
Total investment income | | | 16,387,599 | |
| | | | |
| |
Expenses | | | | |
Management fee | | | 4,254,892 | |
Administration fees | | | | |
Class A | | | 141,147 | |
Class B | | | 275 | |
Class C | | | 59,033 | |
Class R6 | | | 22,728 | |
Administrator Class | | | 179,475 | |
Institutional Class | | | 681,574 | |
Shareholder servicing fees | | | | |
Class A | | | 220,542 | |
Class B | | | 430 | |
Class C | | | 92,239 | |
Administrator Class | | | 447,598 | |
Distribution fees | | | | |
Class B | | | 1,290 | |
Class C | | | 276,718 | |
Custody and accounting fees | | | 71,509 | |
Professional fees | | | 52,620 | |
Registration fees | | | 86,971 | |
Shareholder report expenses | | | 63,915 | |
Trustees’ fees and expenses | | | 9,642 | |
Other fees and expenses | | | 32,184 | |
| | | | |
Total expenses | | | 6,694,782 | |
Less: Fee waivers and/or expense reimbursements | | | (505,102 | ) |
| | | | |
Net expenses | | | 6,189,680 | |
| | | | |
Net investment income | | | 10,197,919 | |
| | | | |
| |
REALIZED AND UNREALIZED GAINS (LOSSES) ON INVESTMENTS | | | | |
Net realized gains on investments | | | 3,936,012 | |
Net change in unrealized gains (losses) on investments | | | (4,300,460 | ) |
| | | | |
Net realized and unrealized gains (losses) on investments | | | (364,448 | ) |
| | | | |
Net increase in net assets resulting from operations | | $ | 9,833,471 | |
| | | | |
The accompanying notes are an integral part of these financial statements.
| | | | |
| 16 | | Wells Fargo Advantage Short Duration Government Bond Fund | | Statement of changes in net assets |
| | | | | | | | | | | | | | | | |
| | | Year ended August 31, 2015 | | | Year ended August 31, 2014 | |
| | | | |
Operations | | | | | | | | | | | | | | | | |
Net investment income | | | | | | $ | 10,197,919 | | | | | | | $ | 8,479,376 | |
Net realized gains (losses) on investments | | | | | | | 3,936,012 | | | | | | | | (4,014,003 | ) |
Net change in unrealized gains (losses) on investments | | | | | | | (4,300,460 | ) | | | | | | | 13,243,893 | |
| | | | |
Net increase in net assets resulting from operations | | | | | | | 9,833,471 | | | | | | | | 17,709,266 | |
| | | | |
| | | | |
Distributions to shareholders from | | | | | | | | | | | | | | | | |
Net investment income | | | | | | | | | | | | | | | | |
Class A | | | | | | | (994,941 | ) | | | | | | | (1,294,991 | ) |
Class B | | | | | | | (619 | ) | | | | | | | (2,258 | ) |
Class C | | | | | | | (143,212 | ) | | | | | | | (209,312 | ) |
Class R6 | | | | | | | (1,252,381 | ) | | | | | | | (380,974 | ) |
Administrator Class | | | | | | | (2,366,248 | ) | | | | | | | (2,670,961 | ) |
Institutional Class | | | | | | | (12,686,313 | ) | | | | | | | (13,956,138 | ) |
| | | | |
Total distributions to shareholders | | | | | | | (17,443,714 | ) | | | | | | | (18,514,634 | ) |
| | | | |
| | | | |
Capital share transactions | | | Shares | | | | | | | | Shares | | | | | |
Proceeds from shares sold | | | | | | | | | | | | | | | | |
Class A | | | 893,467 | | | | 8,994,855 | | | | 2,050,091 | | | | 20,702,596 | |
Class B | | | 4,666 | | | | 47,051 | | | | 6,231 | | | | 62,998 | |
Class C | | | 250,331 | | | | 2,525,080 | | | | 299,780 | | | | 3,033,330 | |
Class R6 | | | 20,670,721 | | | | 208,583,613 | | | | 6,291,982 | | | | 63,793,536 | |
Administrator Class | | | 3,720,185 | | | | 37,515,205 | | | | 3,637,751 | | | | 36,805,716 | |
Institutional Class | | | 23,657,641 | | | | 238,649,165 | | | | 33,734,906 | | | | 341,098,630 | |
| | | | |
| | | | | | | 496,314,969 | | | | | | | | 465,496,806 | |
| | | | |
Reinvestment of distributions | | | | | | | | | | | | | | | | |
Class A | | | 90,064 | | | | 907,044 | | | | 118,250 | | | | 1,194,227 | |
Class B | | | 54 | | | | 540 | | | | 198 | | | | 1,999 | |
Class C | | | 12,948 | | | | 130,546 | | | | 19,110 | | | | 193,392 | |
Class R6 | | | 124,189 | | | | 1,252,381 | | | | 37,650 | | | | 380,974 | |
Administrator Class | | | 223,156 | | | | 2,250,925 | | | | 243,609 | | | | 2,464,121 | |
Institutional Class | | | 1,154,458 | | | | 11,642,358 | | | | 1,258,055 | | | | 12,725,255 | |
| | | | |
| | | | | | | 16,183,794 | | | | | | | | 16,959,968 | |
| | | | |
Payment for shares redeemed | | | | | | | | | | | | | | | | |
Class A | | | (5,356,128 | ) | | | (53,879,586 | ) | | | (4,076,175 | ) | | | (41,155,799 | ) |
Class B | | | (17,358 | ) | | | (175,084 | ) | | | (68,648 | ) | | | (693,890 | ) |
Class C | | | (1,481,247 | ) | | | (14,946,317 | ) | | | (2,166,936 | ) | | | (21,918,485 | ) |
Class R6 | | | (2,510,257 | ) | | | (25,335,737 | ) | | | (1,834,211 | ) | | | (18,570,451 | ) |
Administrator Class | | | (7,286,511 | ) | | | (73,464,583 | ) | | | (8,159,129 | ) | | | (82,511,132 | ) |
Institutional Class | | | (55,650,292 | ) | | | (560,857,859 | ) | | | (49,642,019 | ) | | | (501,916,330 | ) |
| | | | |
| | | | | | | (728,659,166 | ) | | | | | | | (666,766,087 | ) |
| | | | |
Net decrease in net assets resulting from capital share transactions | | | | | | | (216,160,403 | ) | | | | | | | (184,309,313 | ) |
| | | | |
Total decrease in net assets | | | | | | | (223,770,646 | ) | | | | | | | (185,114,681 | ) |
| | | | |
| | | | |
Net assets | | | | | | | | | | | | | | | | |
Beginning of period | | | | | | | 1,294,667,139 | | | | | | | | 1,479,781,820 | |
| | | | |
End of period | | | | | | $ | 1,070,896,493 | | | | | | | $ | 1,294,667,139 | |
| | | | |
Undistributed net investment income | | | | | | $ | 606,284 | | | | | | | $ | 606,284 | |
| | | | |
The accompanying notes are an integral part of these financial statements.
| | | | | | |
| Financial highlights | | Wells Fargo Advantage Short Duration Government Bond Fund | | | 17 | |
(For a share outstanding throughout each period)
| | | | | | | | | | | | | | | | | | | | |
| | | Year ended August 31 | |
| CLASS A | | 2015 | | | 2014 | | | 2013 | | | 2012 | | | 2011 | |
Net asset value, beginning of period | | | $10.08 | | | | $10.09 | | | | $10.35 | | | | $10.36 | | | | $10.47 | |
Net investment income | | | 0.04 | | | | 0.03 | | | | 0.08 | 1 | | | 0.10 | | | | 0.16 | |
Net realized and unrealized gains (losses) on investments | | | 0.02 | | | | 0.07 | | | | (0.14 | ) | | | 0.09 | | | | 0.07 | |
| | | | | | | | | | | | | | | | | | | | |
Total from investment operations | | | 0.06 | | | | 0.10 | | | | (0.06 | ) | | | 0.19 | | | | 0.23 | |
Distributions to shareholders from | | | | | | | | | | | | | | | | | | | | |
Net investment income | | | (0.12 | ) | | | (0.11 | ) | | | (0.20 | ) | | | (0.20 | ) | | | (0.25 | ) |
Net realized gains | | | 0.00 | | | | 0.00 | | | | 0.00 | | | | 0.00 | | | | (0.09 | ) |
| | | | | | | | | | | | | | | | | | | | |
Total distributions to shareholders | | | (0.12 | ) | | | (0.11 | ) | | | (0.20 | ) | | | (0.20 | ) | | | (0.34 | ) |
Net asset value, end of period | | | $10.02 | | | | $10.08 | | | | $10.09 | | | | $10.35 | | | | $10.36 | |
Total return2 | | | 0.55 | % | | | 1.03 | % | | | (0.63 | )% | | | 1.86 | % | | | 2.17 | % |
Ratios to average net assets (annualized) | | | | | | | | | | | | | | | | | | | | |
Gross expenses | | | 0.78 | % | | | 0.80 | % | | | 0.82 | % | | | 0.86 | % | | | 0.87 | % |
Net expenses | | | 0.78 | % | | | 0.78 | % | | | 0.79 | % | | | 0.83 | % | | | 0.83 | % |
Net investment income | | | 0.55 | % | | | 0.38 | % | | | 0.80 | % | | | 0.98 | % | | | 1.60 | % |
Supplemental data | | | | | | | | | | | | | | | | | | | | |
Portfolio turnover rate | | | 500 | % | | | 408 | % | | | 324 | % | | | 399 | % | | | 485 | % |
Net assets, end of period (000s omitted) | | | $62,504 | | | | $107,005 | | | | $126,316 | | | | $167,266 | | | | $162,719 | |
| 1 | Calculated based upon average shares outstanding |
| 2 | Total return calculations do not include any sales charges. |
The accompanying notes are an integral part of these financial statements.
| | | | |
| 18 | | Wells Fargo Advantage Short Duration Government Bond Fund | | Financial highlights |
(For a share outstanding throughout each period)
| | | | | | | | | | | | | | | | | | | | |
| | | Year ended August 31 | |
| CLASS B | | 2015 | | | 2014 | | | 2013 | | | 2012 | | | 2011 | |
Net asset value, beginning of period | | | $10.09 | | | | $10.10 | | | | $10.36 | | | | $10.36 | | | | $10.48 | |
Net investment income (loss) | | | (0.02 | )1 | | | (0.04 | )1 | | | 0.01 | 1 | | | 0.03 | 1 | | | 0.09 | |
Net realized and unrealized gains (losses) on investments | | | (0.01 | ) | | | 0.07 | | | | (0.15 | ) | | | 0.10 | | | | 0.05 | |
| | | | | | | | | | | | | | | | | | | | |
Total from investment operations | | | (0.03 | ) | | | 0.03 | | | | (0.14 | ) | | | 0.13 | | | | 0.14 | |
Distributions to shareholders from | | | | | | | | | | | | | | | | | | | | |
Net investment income | | | (0.04 | ) | | | (0.04 | ) | | | (0.12 | ) | | | (0.13 | ) | | | (0.17 | ) |
Net realized gains | | | 0.00 | | | | 0.00 | | | | 0.00 | | | | 0.00 | | | | (0.09 | ) |
| | | | | | | | | | | | | | | | | | | | |
Total distributions to shareholders | | | (0.04 | ) | | | (0.04 | ) | | | (0.12 | ) | | | (0.13 | ) | | | (0.26 | ) |
Net asset value, end of period | | | $10.02 | | | | $10.09 | | | | $10.10 | | | | $10.36 | | | | $10.36 | |
Total return2 | | | (0.30 | )% | | | 0.28 | % | | | (1.37 | )% | | | 1.22 | % | | | 1.32 | % |
Ratios to average net assets (annualized) | | | | | | | | | | | | | | | | | | | | |
Gross expenses | | | 1.53 | % | | | 1.56 | % | | | 1.58 | % | | | 1.60 | % | | | 1.62 | % |
Net expenses | | | 1.53 | % | | | 1.53 | % | | | 1.54 | % | | | 1.57 | % | | | 1.58 | % |
Net investment income (loss) | | | (0.19 | )% | | | (0.37 | )% | | | 0.06 | % | | | 0.25 | % | | | 0.85 | % |
Supplemental data | | | | | | | | | | | | | | | | | | | | |
Portfolio turnover rate | | | 500 | % | | | 408 | % | | | 324 | % | | | 399 | % | | | 485 | % |
Net assets, end of period (000s omitted) | | | $99 | | | | $228 | | | | $856 | | | | $1,115 | | | | $1,543 | |
| 1 | Calculated based upon average shares outstanding |
| 2 | Total return calculations do not include any sales charges. |
The accompanying notes are an integral part of these financial statements.
| | | | | | |
| Financial highlights | | Wells Fargo Advantage Short Duration Government Bond Fund | | | 19 | |
(For a share outstanding throughout each period)
| | | | | | | | | | | | | | | | | | | | |
| | | Year ended August 31 | |
| CLASS C | | 2015 | | | 2014 | | | 2013 | | | 2012 | | | 2011 | |
Net asset value, beginning of period | | | $10.10 | | | | $10.11 | | | | $10.37 | | | | $10.37 | | | | $10.48 | |
Net investment income (loss) | | | (0.03 | ) | | | (0.05 | ) | | | 0.01 | 1 | | | 0.03 | | | | 0.08 | |
Net realized and unrealized gains (losses) on investments | | | 0.00 | 2 | | | 0.08 | | | | (0.15 | ) | | | 0.09 | | | | 0.07 | |
| | | | | | | | | | | | | | | | | | | | |
Total from investment operations | | | (0.03 | ) | | | 0.03 | | | | (0.14 | ) | | | 0.12 | | | | 0.15 | |
Distributions to shareholders from | | | | | | | | | | | | | | | | | | | | |
Net investment income | | | (0.04 | ) | | | (0.04 | ) | | | (0.12 | ) | | | (0.12 | ) | | | (0.17 | ) |
Net realized gains | | | 0.00 | | | | 0.00 | | | | 0.00 | | | | 0.00 | | | | (0.09 | ) |
| | | | | | | | | | | | | | | | | | | | |
Total distributions to shareholders | | | (0.04 | ) | | | (0.04 | ) | | | (0.12 | ) | | | (0.12 | ) | | | (0.26 | ) |
Net asset value, end of period | | | $10.03 | | | | $10.10 | | | | $10.11 | | | | $10.37 | | | | $10.37 | |
Total return3 | | | (0.30 | )% | | | 0.28 | % | | | (1.37 | )% | | | 1.20 | % | | | 1.41 | % |
Ratios to average net assets (annualized) | | | | | | | | | | | | | | | | | | | | |
Gross expenses | | | 1.53 | % | | | 1.55 | % | | | 1.57 | % | | | 1.61 | % | | | 1.62 | % |
Net expenses | | | 1.53 | % | | | 1.53 | % | | | 1.54 | % | | | 1.58 | % | | | 1.58 | % |
Net investment income (loss) | | | (0.20 | )% | | | (0.37 | )% | | | 0.05 | % | | | 0.23 | % | | | 0.85 | % |
Supplemental data | | | | | | | | | | | | | | | | | | | | |
Portfolio turnover rate | | | 500 | % | | | 408 | % | | | 324 | % | | | 399 | % | | | 485 | % |
Net assets, end of period (000s omitted) | | | $31,910 | | | | $44,423 | | | | $63,126 | | | | $78,385 | | | | $69,077 | |
| 1 | Calculated based upon average shares outstanding |
| 2 | Amount is less than $0.005. |
| 3 | Total return calculations do not include any sales charges. |
The accompanying notes are an integral part of these financial statements.
| | | | |
| 20 | | Wells Fargo Advantage Short Duration Government Bond Fund | | Financial highlights |
(For a share outstanding throughout each period)
| | | | | | | | | | | | |
| | | Year ended August 31 | |
| CLASS R6 | | 2015 | | | 2014 | | | 20131 | |
Net asset value, beginning of period | | | $10.11 | | | | $10.13 | | | | $10.33 | |
Net investment income | | | 0.09 | 2 | | | 0.08 | 2 | | | 0.13 | 2 |
Net realized and unrealized gains (losses) on investments | | | 0.01 | | | | 0.05 | | | | (0.15 | ) |
| | | | | | | | | | | | |
Total from investment operations | | | 0.10 | | | | 0.13 | | | | (0.02 | ) |
Distributions to shareholders from | | | | | | | | | | | | |
Net investment income | | | (0.16 | ) | | | (0.15 | ) | | | (0.18 | ) |
Net asset value, end of period | | | $10.05 | | | | $10.11 | | | | $10.13 | |
Total return3 | | | 0.96 | % | | | 1.35 | % | | | (0.17 | )% |
Ratios to average net assets (annualized) | | | | | | | | | | | | |
Gross expenses | | | 0.40 | % | | | 0.41 | % | | | 0.43 | % |
Net expenses | | | 0.37 | % | | | 0.37 | % | | | 0.37 | % |
Net investment income | | | 0.88 | % | | | 0.76 | % | | | 0.81 | % |
Supplemental data | | | | | | | | | | | | |
Portfolio turnover rate | | | 500 | % | | | 408 | % | | | 324 | % |
Net assets, end of period (000s omitted) | | | $231,878 | | | | $48,446 | | | | $2,983 | |
| 1 | For the period from November 30, 2012 (commencement of class operations) to August 31, 2013 |
| 2 | Calculated based upon average shares outstanding |
| 3 | Returns for periods of less than one year are not annualized. |
The accompanying notes are an integral part of these financial statements.
| | | | | | |
| Financial highlights | | Wells Fargo Advantage Short Duration Government Bond Fund | | | 21 | |
(For a share outstanding throughout each period)
| | | | | | | | | | | | | | | | | | | | |
| | | Year ended August 31 | |
| ADMINISTRATOR CLASS | | 2015 | | | 2014 | | | 2013 | | | 2012 | | | 2011 | |
Net asset value, beginning of period | | | $10.10 | | | | $10.11 | | | | $10.36 | | | | $10.37 | | | | $10.48 | |
Net investment income | | | 0.06 | | | | 0.06 | 1 | | | 0.10 | 1 | | | 0.13 | | | | 0.17 | |
Net realized and unrealized gains (losses) on investments | | | 0.00 | 2 | | | 0.06 | | | | (0.13 | ) | | | 0.09 | | | | 0.08 | |
| | | | | | | | | | | | | | | | | | | | |
Total from investment operations | | | 0.06 | | | | 0.12 | | | | (0.03 | ) | | | 0.22 | | | | 0.25 | |
Distributions to shareholders from | | | | | | | | | | | | | | | | | | | | |
Net investment income | | | (0.13 | ) | | | (0.13 | ) | | | (0.22 | ) | | | (0.23 | ) | | | (0.27 | ) |
Net realized gains | | | 0.00 | | | | 0.00 | | | | 0.00 | | | | 0.00 | | | | (0.09 | ) |
| | | | | | | | | | | | | | | | | | | | |
Total distributions to shareholders | | | (0.13 | ) | | | (0.13 | ) | | | (0.22 | ) | | | (0.23 | ) | | | (0.36 | ) |
Net asset value, end of period | | | $10.03 | | | | $10.10 | | | | $10.11 | | | | $10.36 | | | | $10.37 | |
Total return | | | 0.63 | % | | | 1.21 | % | | | (0.34 | )% | | | 2.10 | % | | | 2.41 | % |
Ratios to average net assets (annualized) | | | | | | | | | | | | | | | | | | | | |
Gross expenses | | | 0.72 | % | | | 0.74 | % | | | 0.76 | % | | | 0.80 | % | | | 0.80 | % |
Net expenses | | | 0.60 | % | | | 0.60 | % | | | 0.60 | % | | | 0.60 | % | | | 0.60 | % |
Net investment income | | | 0.73 | % | | | 0.56 | % | | | 0.99 | % | | | 1.20 | % | | | 1.84 | % |
Supplemental data | | | | | | | | | | | | | | | | | | | | |
Portfolio turnover rate | | | 500 | % | | | 408 | % | | | 324 | % | | | 399 | % | | | 485 | % |
Net assets, end of period (000s omitted) | | | $156,669 | | | | $191,469 | | | | $234,808 | | | | $285,637 | | | | $247,357 | |
| 1 | Calculated based upon average shares outstanding |
| 2 | Amount is less than $0.005. |
The accompanying notes are an integral part of these financial statements.
| | | | |
| 22 | | Wells Fargo Advantage Short Duration Government Bond Fund | | Financial highlights |
(For a share outstanding throughout each period)
| | | | | | | | | | | | | | | | | | | | |
| | | Year ended August 31 | |
| INSTITUTIONAL CLASS | | 2015 | | | 2014 | | | 2013 | | | 2012 | | | 2011 | |
Net asset value, beginning of period | | | $10.10 | | | | $10.10 | | | | $10.36 | | | | $10.37 | | | | $10.48 | |
Net investment income | | | 0.09 | 1 | | | 0.07 | | | | 0.12 | | | | 0.15 | | | | 0.21 | |
Net realized and unrealized gains (losses) on investments | | | (0.01 | ) | | | 0.08 | | | | (0.15 | ) | | | 0.09 | | | | 0.06 | |
| | | | | | | | | | | | | | | | | | | | |
Total from investment operations | | | 0.08 | | | | 0.15 | | | | (0.03 | ) | | | 0.24 | | | | 0.27 | |
Distributions to shareholders from | | | | | | | | | | | | | | | | | | | | |
Net investment income | | | (0.15 | ) | | | (0.15 | ) | | | (0.23 | ) | | | (0.25 | ) | | | (0.29 | ) |
Net realized gains | | | 0.00 | | | | 0.00 | | | | 0.00 | | | | 0.00 | | | | (0.09 | ) |
| | | | | | | | | | | | | | | | | | | | |
Total distributions to shareholders | | | (0.15 | ) | | | (0.15 | ) | | | (0.23 | ) | | | (0.25 | ) | | | (0.38 | ) |
Net asset value, end of period | | | $10.03 | | | | $10.10 | | | | $10.10 | | | | $10.36 | | | | $10.37 | |
Total return | | | 0.81 | % | | | 1.50 | % | | | (0.26 | )% | | | 2.28 | % | | | 2.59 | % |
Ratios to average net assets (annualized) | | | | | | | | | | | | | | | | | | | | |
Gross expenses | | | 0.45 | % | | | 0.47 | % | | | 0.49 | % | | | 0.53 | % | | | 0.54 | % |
Net expenses | | | 0.42 | % | | | 0.42 | % | | | 0.42 | % | | | 0.42 | % | | | 0.42 | % |
Net investment income | | | 0.92 | % | | | 0.74 | % | | | 1.16 | % | | | 1.39 | % | | | 1.97 | % |
Supplemental data | | | | | | | | | | | | | | | | | | | | |
Portfolio turnover rate | | | 500 | % | | | 408 | % | | | 324 | % | | | 399 | % | | | 485 | % |
Net assets, end of period (000s omitted) | | | $587,835 | | | | $903,096 | | | | $1,051,693 | | | | $1,157,125 | | | | $862,174 | |
| 1 | Calculated based upon average shares outstanding |
The accompanying notes are an integral part of these financial statements.
| | | | | | |
| Notes to financial statements | | Wells Fargo Advantage Short Duration Government Bond Fund | | | 23 | |
1. ORGANIZATION
Wells Fargo Funds Trust (the “Trust”), a Delaware statutory trust organized on March 10, 1999, is an open-end management investment company registered under the Investment Company Act of 1940, as amended (the “1940 Act”). As an investment company, the Trust follows the accounting and reporting guidance in Financial Accounting Standards Board (“FASB”) Accounting Standards Codification Topic 946, Financial Services – Investment Companies. These financial statements report on the Wells Fargo Advantage Short Duration Government Bond Fund (the “Fund”) which is a diversified series of the Trust.
2. SIGNIFICANT ACCOUNTING POLICIES
The following significant accounting policies, which are consistently followed in the preparation of the financial statements of the Fund, are in conformity with U.S. generally accepted accounting principles which require management to make estimates and assumptions that affect the reported amounts of assets and liabilities, disclosure of contingent assets and liabilities at the date of the financial statements, and the reported amounts of revenues and expenses during the reporting period. Actual results could differ from those estimates.
Securities valuation
All investments are valued each business day as of the close of regular trading on the New York Stock Exchange (generally 4 p.m. Eastern Time).
Debt securities are valued at the evaluated bid price provided by an independent pricing service or, if a reliable price is not available, the quoted bid price from an independent broker-dealer.
Investments in registered open-end investment companies are valued at net asset value.
Investments which are not valued using any of the methods discussed above are valued at their fair value, as determined in good faith by the Board of Trustees of the Fund. The Board of Trustees has established a Valuation Committee comprised of the Trustees and has delegated to it the authority to take any actions regarding the valuation of portfolio securities that the Valuation Committee deems necessary or appropriate, including determining the fair value of portfolio securities, unless the determination has been delegated to the Management Valuation Team of Wells Fargo Funds Management, LLC (“Funds Management”). The Board of Trustees retains the authority to make or ratify any valuation decisions or approve any changes to the Valuation Procedures as it deems appropriate. On a quarterly basis, the Board of Trustees receives reports on any valuation actions taken by the Valuation Committee or the Management Valuation Team which may include items for ratification.
Valuations of fair valued securities are compared to the next actual sales price when available, or other appropriate market values, to assess the continued appropriateness of the fair valuation methodologies used. These securities are fair valued on a day-to-day basis, taking into consideration changes to appropriate market information and any significant changes to the inputs considered in the valuation process until there is a readily available price provided on an exchange or by an independent pricing service. Valuations received from an independent pricing service or independent broker-dealer quotes are periodically validated by comparisons to most recent trades and valuations provided by other independent pricing services in addition to the review of prices by the manager and/or subadviser. Unobservable inputs used in determining fair valuations are identified based on the type of security, taking into consideration factors utilized by market participants in valuing the investment, knowledge about the issuer and the current market environment.
When-issued transactions
The Fund may purchase securities on a forward commitment or when-issued basis. The Fund records a when-issued transaction on the trade date and will segregate assets in an amount at least equal in value to the Fund’s commitment to purchase when-issued securities. Securities purchased on a when-issued basis are marked-to-market daily and the Fund begins earning interest on the settlement date. Losses may arise due to changes in the market value of the underlying securities or if the counterparty does not perform under the contract.
Security transactions and income recognition
Securities transactions are recorded on a trade date basis. Realized gains or losses are recorded on the basis of identified cost.
Interest income is accrued daily and bond discounts are accreted and premiums are amortized daily based on the effective interest method. To the extent debt obligations are placed on non-accrual status, any related interest income may be reduced by writing off interest receivables when the collection of all or a portion of interest has become doubtful based on consistently applied procedures. If the issuer subsequently resumes interest payments or when the collectability of interest is reasonably assured, the debt obligation is removed from non-accrual status.
| | | | |
| 24 | | Wells Fargo Advantage Short Duration Government Bond Fund | | Notes to financial statements |
Distributions to shareholders
Distributions to shareholders from net investment income are accrued daily and paid monthly. Distributions from net realized gains, if any, are recorded on the ex-dividend date. Such distributions are determined in conformity with federal income tax regulations, which may differ in amount or character from net investment income and realized gains recognized for purposes of U.S. generally accepted accounting principles.
Federal and other taxes
The Fund intends to continue to qualify as a regulated investment company by distributing substantially all of its investment company taxable income and any net realized capital gains (after reduction for capital loss carryforwards) sufficient to relieve it from all, or substantially all, federal income taxes. Accordingly, no provision for federal income taxes was required.
The Fund’s income and federal excise tax returns and all financial records supporting those returns for the prior three fiscal years are subject to examination by the federal and Delaware revenue authorities. Management has analyzed the Fund’s tax positions taken on federal, state, and foreign tax returns for all open tax years and does not believe that there are any uncertain tax positions that require recognition of a tax liability.
Reclassifications are made to the Fund’s capital accounts for permanent tax differences to reflect income and gains available for distribution (or available capital loss carryforwards) under federal income tax regulations. U.S. generally accepted accounting principles require that certain components of net assets be adjusted to reflect permanent differences between financial and tax reporting. These reclassifications have no effect on net assets or net asset values per share. The primary permanent differences causing such reclassifications are due to bond premiums and paydown losses. At August 31, 2015, as a result of permanent book-to-tax differences, the following reclassification adjustments were made on the Statement of Assets and Liabilities:
| | |
Undistributed net
investment income | | Accumulated net
realized losses
on investments |
| $7,245,795 | | $(7,245,795) |
As of August 31, 2015, the Fund had capital loss carryforwards which consist of $24,698,768 in short-term capital losses and $13,704,689 in long-term capital losses.
As of August 31, 2015, the Fund had current year deferred post-October capital losses consisting of $2,886,253 in short-term losses and $472,095 in long-term losses which will be recognized on the first day of the following fiscal year.
Class allocations
The separate classes of shares offered by the Fund differ principally in applicable sales charges, distribution, shareholder servicing, and administration fees. Class specific expenses are charged directly to that share class. Investment income, common expenses, and realized and unrealized gains (losses) on investments are allocated daily to each class of shares based on the relative proportion of net assets of each class.
3. FAIR VALUATION MEASUREMENTS
Fair value measurements of investments are determined within a framework that has established a fair value hierarchy based upon the various data inputs utilized in determining the value of the Fund’s investments. The three-level hierarchy gives the highest priority to unadjusted quoted prices in active markets for identical assets or liabilities (Level 1) and the lowest priority to significant unobservable inputs (Level 3). The Fund’s investments are classified within the fair value hierarchy based on the lowest level of input that is significant to the fair value measurement. The inputs are summarized into three broad levels as follows:
| n | | Level 1 – quoted prices in active markets for identical securities |
| n | | Level 2 – other significant observable inputs (including quoted prices for similar securities, interest rates, prepayment speeds, credit risk, use of amortized cost, etc.) |
| n | | Level 3 – significant unobservable inputs (including the Fund’s own assumptions in determining the fair value of investments) |
The inputs or methodologies used for valuing investments in securities are not necessarily an indication of the risk associated with investing in those securities.
| | | | | | |
| Notes to financial statements | | Wells Fargo Advantage Short Duration Government Bond Fund | | | 25 | |
The following is a summary of the inputs used in valuing the Fund’s assets and liabilities as of August 31, 2015:
| | | | | | | | | | | | | | | | |
| | | Quoted prices
(Level 1) | | | Other significant
observable inputs
(Level 2) | | | Significant
unobservable inputs
(Level 3) | | | Total | |
Assets | | | | | | | | | | | | | | | | |
Investments in : | | | | | | | | | | | | | | | | |
| | | | |
Agency securities | | $ | 0 | | | $ | 526,999,061 | | | $ | 0 | | | $ | 526,999,061 | |
| | | | |
Asset-backed securities | | | 0 | | | | 124,840,634 | | | | 0 | | | | 124,840,634 | |
| | | | |
Non-agency mortgage-backed securities | | | 0 | | | | 62,062,028 | | | | 0 | | | | 62,062,028 | |
| | | | |
U.S. Treasury securities | | | 332,364,700 | | | | 0 | | | | 0 | | | | 332,364,700 | |
| | | | |
Yankee corporate bonds and notes | | | 0 | | | | 13,889,405 | | | | 0 | | | | 13,889,405 | |
| | | | |
Short-term investments | | | | | | | | | | | | | | | | |
Investment companies | | | 15,356,055 | | | | 0 | | | | 0 | | | | 15,356,055 | |
Total assets | | $ | 347,720,755 | | | $ | 727,791,128 | | | $ | 0 | | | $ | 1,075,511,883 | |
The Fund recognizes transfers between levels within the fair value hierarchy at the end of the reporting period. At August 31, 2015, the Fund did not have any transfers into/out of Level 1, Level 2, or Level 3.
4. TRANSACTIONS WITH AFFILIATES
Management fee
Funds Management, an indirect wholly owned subsidiary of Wells Fargo & Company (“Wells Fargo”), is the manager of the Fund and provides advisory and fund-level administrative services under an investment management agreement. Under the investment management agreement, Funds Management is responsible for, among other services, implementing the investment objectives and strategies of the Fund, supervising the applicable subadviser, providing fund-level administrative services in connection with the Fund’s operations, and providing any other fund-level administrative services reasonably necessary for the operation of the Fund. As compensation for its services under the investment management agreement, Funds Management is entitled to receive an annual management fee starting at 0.35% and declining to 0.255% as the average daily net assets of the Fund increase.
Prior to July 1, 2015, Funds Management provided advisory services pursuant to an investment advisory agreement and was entitled to receive an annual fee which started at 0.30% and declined to 0.225% as the average daily net assets of the Fund increased. In addition, fund-level administrative services were provided by Funds Management under a separate administration agreement at an annual fee which started at 0.05% and declined to 0.03% as the average daily net assets of the Fund increased. For financial statement purposes, the advisory fee and fund-level administration fee for the year ended August 31, 2015 have been included in management fee on the Statement of Operations.
For the year ended August 31, 2015, the management fee was equivalent to an annual rate of 0.35% of the Fund’s average daily net assets.
Funds Management has retained the services of a subadviser to provide daily portfolio management to the Fund. The fee for subadvisory services is borne by Funds Management. Wells Capital Management Incorporated, an affiliate of Funds Management and an indirect wholly owned subsidiary of Wells Fargo, is the subadviser to the Fund and is entitled to receive a fee from Funds Management at an annual rate starting at 0.15% and declining to 0.05% as the average daily net assets of the Fund increase.
Administration fees
Under a class-level administration agreement, Funds Management provides class-level administrative services to the Fund, which includes paying fees and expenses for services provided by the transfer agent, sub-transfer agents, omnibus account
| | | | |
| 26 | | Wells Fargo Advantage Short Duration Government Bond Fund | | Notes to financial statements |
servicers and record-keepers. As compensation for its services under the class-level administration agreement, Funds Management receives an annual fee which is calculated based on the average daily net assets of each class as follows:
| | | | |
| | | Class-level
administration fee | |
Class A, Class B, Class C | | | 0.16 | % |
Class R6 | | | 0.03 | |
Administrator Class | | | 0.10 | |
Institutional Class | | | 0.08 | |
Funds Management has contractually waived and/or reimbursed management and administration fees to the extent necessary to maintain certain net operating expense ratios for the Fund. Waiver of fees and/or reimbursement of expenses by Funds Management were made first from fund level expenses on a proportionate basis and then from class specific expenses. Funds Management has committed through December 31, 2015 to waive fees and/or reimburse expenses to the extent necessary to cap the Fund’s expenses at 0.78% for Class A shares, 1.53% for Class B shares, 1.53% for Class C shares, 0.37% for Class R6 shares, 0.60% for Administrator Class shares, and 0.42% for Institutional Class shares. After this time, the cap may be increased or the commitment to maintain the cap may be terminated only with the approval of the Board of Trustees.
Distribution fees
The Trust has adopted a distribution plan for Class B and Class C shares of the Fund pursuant to Rule 12b-1 under the 1940 Act. Distribution fees are charged to Class B and Class C shares and paid to Wells Fargo Funds Distributor, LLC (“Funds Distributor”), the principal underwriter, at an annual rate of 0.75% of the average daily net assets of Class B and Class C shares.
In addition, Funds Distributor is entitled to receive the front-end sales charge from the purchase of Class A shares and a contingent deferred sales charge on the redemption of certain Class A shares. Funds Distributor is also entitled to receive the contingent deferred sales charges from redemptions of Class B and Class C shares. For the year ended August 31, 2015, Funds Distributor received $1,415 from the sale of Class A shares and $19 in contingent deferred sales charges from redemptions of Class C shares.
Shareholder servicing fees
The Trust has entered into contracts with one or more shareholder servicing agents, whereby Class A, Class B, Class C, and Administrator Class of the Fund is charged a fee at an annual rate of 0.25% of the average daily net assets of each respective class.
A portion of these total shareholder servicing fees were paid to affiliates of Wells Fargo.
5. INVESTMENT PORTFOLIO TRANSACTIONS
Purchases and sales of investments, excluding short-term securities, for the year ended August 31, 2015 were as follows:
| | | | | | |
Purchases at cost | | Sales proceeds |
U.S.
government | | Non-U.S.
government | | U.S.
government | | Non-U.S.
government |
| $5,892,253,918 | | $274,977,505 | | $5,985,849,393 | | $267,936,776 |
6. BANK BORROWINGS
The Trust (excluding the money market funds and certain other funds in the Trust) and Wells Fargo Variable Trust are parties to a $150,000,000 revolving credit agreement, whereby the Fund is permitted to use bank borrowings for temporary or emergency purposes, such as to fund shareholder redemption requests. Interest under the credit agreement is charged to the Fund based on a borrowing rate equal to the higher of the Federal Funds rate in effect on that day plus 1.25% or the overnight LIBOR rate in effect on that day plus 1.25%. In addition, an annual commitment fee equal to 0.10% of the unused balance is allocated to each participating fund. For the year ended August 31, 2015, the Fund paid $1,399 in commitment fees.
For the year ended August 31, 2015, there were no borrowings by the Fund under the agreement.
| | | | | | |
| Notes to financial statements | | Wells Fargo Advantage Short Duration Government Bond Fund | | | 27 | |
7. DISTRIBUTIONS TO SHAREHOLDERS
The tax character of distributions paid was $17,443,714 and $18,514,634 of ordinary income for the years ended August 31, 2015 and August 31, 2014, respectively.
As of August 31, 2015, the components of distributable earnings on a tax basis were as follows:
| | | | | | |
Undistributed ordinary income | | Unrealized losses | | Post-October capital losses deferred | | Capital loss carryforward |
| $683,609 | | $(3,240,783) | | $(3,358,348) | | $(38,403,457) |
8. INDEMNIFICATION
Under the Trust’s organizational documents, the officers and Trustees have been granted certain indemnification rights against certain liabilities that may arise out of performance of their duties to the Trust. Additionally, in the normal course of business, the Trust may enter into contracts with service providers that contain a variety of indemnification clauses. The Trust’s maximum exposure under these arrangements is dependent on future claims that may be made against the Fund and, therefore, cannot be estimated.
| | | | |
| 28 | | Wells Fargo Advantage Short Duration Government Bond Fund | | Report of independent registered public accounting firm |
BOARD OF TRUSTEES AND SHAREHOLDERS OF WELLS FARGO FUNDS TRUST:
We have audited the accompanying statement of assets and liabilities, including the portfolio of investments, of the Wells Fargo Advantage Short Duration Government Bond Fund (the “Fund”), one of the funds constituting the Wells Fargo Funds Trust, as of August 31, 2015, and the related statement of operations for the year then ended, the statements of changes in net assets for each of the years in the two-year period then ended, and the financial highlights for each of the years or periods in the five-year period then ended. These financial statements and financial highlights are the responsibility of the Fund’s management. Our responsibility is to express an opinion on these financial statements and financial highlights based on our audits.
We conducted our audits in accordance with the standards of the Public Company Accounting Oversight Board (United States). Those standards require that we plan and perform the audit to obtain reasonable assurance about whether the financial statements and financial highlights are free of material misstatement. An audit includes examining, on a test basis, evidence supporting the amounts and disclosures in the financial statements. Our procedures included confirmation of securities owned as of August 31, 2015, by correspondence with the custodian and brokers, or by other appropriate auditing procedures. An audit also includes assessing the accounting principles used and significant estimates made by management, as well as evaluating the overall financial statement presentation. We believe that our audits provide a reasonable basis for our opinion.
In our opinion, the financial statements and financial highlights referred to above present fairly, in all material respects, the financial position of the Wells Fargo Advantage Short Duration Government Bond Fund as of August 31, 2015, the results of its operations for the year then ended, the changes in its net assets for each of the years in the two-year period then ended, and the financial highlights for each of the years or periods in the five-year period then ended, in conformity with U.S. generally accepted accounting principles.

Boston, Massachusetts
October 26, 2015
| | | | | | |
| Other information (unaudited) | | Wells Fargo Advantage Short Duration Government Bond Fund | | | 29 | |
TAX INFORMATION
For the fiscal year ended August 31, 2015, $17,464,077 has been designated as interest-related dividends for nonresident alien shareholders pursuant to Section 871 of the Internal Revenue Code.
For the fiscal year ended August 31, 2015, 13.50% of the dividends distributed was derived from interest on U.S. government securities.
PROXY VOTING INFORMATION
A description of the policies and procedures that the Fund uses to determine how to vote proxies relating to portfolio securities is available, upon request, by calling 1-800-222-8222, visiting our website at wellsfargoadvantagefunds.com, or visiting the SEC website at sec.gov. Information regarding how the Fund voted proxies relating to portfolio securities during the most recent 12-month period ended June 30 is available on the Fund’s website at wellsfargoadvantagefunds.com or by visiting the SEC website at sec.gov.
PORTFOLIO HOLDINGS INFORMATION
The complete portfolio holdings for the Fund are publicly available monthly on the Fund’s website (wellsfargoadvantagefunds.com), on a one-month delayed basis. In addition, top ten holdings information (excluding derivative positions) for the Fund is publicly available on the Fund’s website on a monthly, seven-day or more delayed basis. The Fund files its complete schedule of portfolio holdings with the SEC for the first and third quarters of each fiscal year on Form N-Q, which is available by visiting the SEC website at sec.gov. In addition, the Fund’s Form N-Q may be reviewed and copied at the SEC’s Public Reference Room in Washington, DC, and at regional offices in New York City, at 233 Broadway, and in Chicago, at 175 West Jackson Boulevard, Suite 900. Information about the Public Reference Room may be obtained by calling 1-800-SEC-0330.
| | | | |
| 30 | | Wells Fargo Advantage Short Duration Government Bond Fund | | Other information (unaudited) |
BOARD OF TRUSTEES AND OFFICERS
Each of the Trustees and Officers1 listed in the table below acts in identical capacities for each fund in the Wells Fargo Advantage family of funds, which consists of 133 mutual funds comprising the Wells Fargo Funds Trust, Wells Fargo Variable Trust, Wells Fargo Master Trust and four closed-end funds (collectively the “Fund Complex”). This table should be read in conjunction with the Prospectus and the Statement of Additional Information2. The mailing address of each Trustee and Officer is 525 Market Street, 12th Floor, San Francisco, CA 94105. Each Trustee and Officer serves an indefinite term, however, each Trustee serves such term until reaching the mandatory retirement age established by the Trustees.
Independent Trustees
| | | | | | |
Name and year of birth | | Position held and length of service* | | Principal occupations during past five years or longer | | Other public company or
investment company
directorships during past 5 years |
William R. Ebsworth (Born 1957) | | Trustee, since 2015** | | Retired. From 1984 to 2013, equities analyst, portfolio manager, research director at Fidelity Management and Research Company and retired in 2013 as Chief Investment Officer of Fidelity Strategic Advisers, Inc. in Boston, Tokyo, and Hong Kong where he led a team of investment professionals managing client assets. Prior thereto, Board member of Hong Kong Securities Clearing Co., Hong Kong Options Clearing Corp., the Thailand International Fund, Ltd., Fidelity Investments Life Insurance Company, and Empire Fidelity Investments Life Insurance Company. Mr. Ebsworth is a CFA ® charterholder and an Adjunct Lecturer, Finance, at Babson College. | | Asset Allocation Trust |
Jane A. Freeman (Born 1953) | | Trustee, since 2015** | | Retired. From 2012 to 2014 and 1999 to 2008, Chief Financial Officer of Scientific Learning Corporation. From 2008 to 2012, Ms. Freeman provided consulting services related to strategic business projects. Prior to 1999, Portfolio Manager at Rockefeller & Co. and Scudder, Stevens & Clark. Board member of the Harding Loevner Funds from 1996 to 2014, serving as both Lead Independent Director and chair of the Audit Committee. Board member of the Russell Exchange Traded Funds Trust from 2011 to 2012 and the chair of the Audit Committee. Ms. Freeman is Chair of Taproot Foundation (non-profit organization) (non-profit organization), a Board Member of Ruth Bancroft Garden (non-profit organization) and an inactive chartered financial analyst. | | Asset Allocation Trust; Harding Loevner Funds; Russell Exchange Traded Funds Trust |
Peter G. Gordon (Born 1942) | | Trustee, since 1998; Chairman, since 2005 | | Co-Founder, Retired Chairman, President and CEO of Crystal Geyser Water Company. Trustee Emeritus, Colby College. | | Asset Allocation Trust |
Isaiah Harris, Jr. (Born 1952) | | Trustee, since 2009 | | Retired. Chairman of the Board of CIGNA Corporation since 2009, and Director since 2005. From 2003 to 2011, Director of Deluxe Corporation. Prior thereto, President and CEO of BellSouth Advertising and Publishing Corp. from 2005 to 2007, President and CEO of BellSouth Enterprises from 2004 to 2005 and President of BellSouth Consumer Services from 2000 to 2003. Emeritus member of the Iowa State University Foundation Board of Governors. Emeritus Member of the Advisory Board of Iowa State University School of Business. Advisory Board Member, Palm Harbor Academy (charter school). Mr. Harris is a certified public accountant. | | CIGNA Corporation; Asset Allocation Trust |
Judith M. Johnson (Born 1949) | | Trustee, since 2008; Audit Committee Chairman, since 2008 | | Retired. Prior thereto, Chief Executive Officer and Chief Investment Officer of Minneapolis Employees Retirement Fund from 1996 to 2008. Ms. Johnson is an attorney, certified public accountant and a certified managerial accountant. | | Asset Allocation Trust |
David F. Larcker (Born 1950) | | Trustee, since 2009 | | James Irvin Miller Professor of Accounting at the Graduate School of Business, Stanford University, Morgan Stanley Director of the Center for Leadership Development and Research and Senior Faculty of The Rock Center for Corporate Governance since 2006. From 2005 to 2008, Professor of Accounting at the Graduate School of Business, Stanford University. Prior thereto, Ernst & Young Professor of Accounting at The Wharton School, University of Pennsylvania from 1985 to 2005. | | Asset Allocation Trust |
Olivia S. Mitchell (Born 1953) | | Trustee, since 2006 | | International Foundation of Employee Benefit Plans Professor, Wharton School of the University of Pennsylvania since 1993. Director of Wharton’s Pension Research Council and Boettner Center on Pensions & Retirement Research, and Research Associate at the National Bureau of Economic Research. Previously, Cornell University Professor from 1978 to 1993. | | Asset Allocation Trust |
| | | | | | |
| Other information (unaudited) | | Wells Fargo Advantage Short Duration Government Bond Fund | | | 31 | |
| | | | | | |
Name and year of birth | | Position held and length of service* | | Principal occupations during past five years or longer | | Other public company or
investment company
directorships during past 5 years |
Timothy J. Penny (Born 1951) | | Trustee, since 1996 | | President and Chief Executive Officer of Southern Minnesota Initiative Foundation, a non-profit organization, since 2007 and Senior Fellow at the Humphrey Institute Policy Forum at the University of Minnesota since 1995. Member of the Board of Trustees of NorthStar Education Finance, Inc., a non-profit organization, since 2007. | | Asset Allocation Trust |
Michael S. Scofield (Born 1943) | | Trustee, since 2010 | | Served on the Investment Company Institute’s Board of Governors and Executive Committee from 2008-2011 as well the Governing Council of the Independent Directors Council from 2006-2011 and the Independent Directors Council Executive Committee from 2008-2011. Chairman of the IDC from 2008-2010. Institutional Investor (Fund Directions) Trustee of Year in 2007. Trustee of the Evergreen Funds complex (and its predecessors) from 1984 to 2010. Chairman of the Evergreen Funds from 2000-2010. Former Trustee of the Mentor Funds. Retired Attorney, Law Offices of Michael S. Scofield. | | Asset Allocation Trust |
Donald C. Willeke (Born 1940) | | Trustee, since 1996 | | Principal of the law firm of Willeke & Daniels. General Counsel of the Minneapolis Employees Retirement Fund from 1984 until its consolidation into the Minnesota Public Employees Retirement Association on June 30, 2010. Director and Vice Chair of The Tree Trust (non-profit corporation). Director of the American Chestnut Foundation (non-profit corporation). | | Asset Allocation Trust |
| * | Length of service dates reflect the Trustee’s commencement of service with the Trust’s predecessor entities, where applicable. |
| ** | William R. Ebsworth and Jane A. Freeman each became a Trustee effective January 1, 2015. |
Officers
| | | | | | |
Name and year of birth | | Position held and length of service | | Principal occupations during past five years or longer | | |
Karla M. Rabusch (Born 1959) | | President, since 2003 | | Executive Vice President of Wells Fargo Bank, N.A. and President of Wells Fargo Funds Management, LLC since 2003. | | |
Nancy Wiser1 (Born 1967) | | Treasurer, since 2012 | | Executive Vice President of Wells Fargo Funds Management, LLC since 2011. Chief Operating Officer and Chief Compliance Officer at LightBox Capital Management LLC, from 2008 to 2011. | | |
C. David Messman (Born 1960) | | Secretary, since 2000; Chief Legal Officer, since 2003 | | Senior Vice President and Secretary of Wells Fargo Funds Management, LLC since 2001. Assistant General Counsel of Wells Fargo Bank, N.A. since 2013 and Vice President and Managing Counsel of Wells Fargo Bank N.A. from 1996 to 2013. | | |
Debra Ann Early (Born 1964) | | Chief Compliance Officer, since 2007 | | Executive Vice President of Wells Fargo Funds Management, LLC since 2014, Senior Vice President and Chief Compliance Officer from 2007 to 2014. | | |
David Berardi (Born 1975) | | Assistant Treasurer, since 2009 | | Vice President of Wells Fargo Funds Management, LLC since 2009. Vice President of Evergreen Investment Management Company, LLC from 2008 to 2010. Manager of Fund Reporting and Control for Evergreen Investment Management Company, LLC from 2004 to 2010. | | |
Jeremy DePalma1 (Born 1974) | | Assistant Treasurer, since 2009 | | Senior Vice President of Wells Fargo Funds Management, LLC since 2009. Senior Vice President of Evergreen Investment Management Company, LLC from 2008 to 2010 and head of the Fund Reporting and Control Team within Fund Administration from 2005 to 2010. | | |
| 1 | Nancy Wiser acts as Treasurer of 72 funds in the Fund Complex. Jeremy DePalma acts as Treasurer of 61 funds and Assistant Treasurer of 72 funds in the Fund Complex. |
| 2 | The Statement of Additional Information includes additional information about the Trustees and is available, without charge, upon request, by calling
1-800-222-8222 or by visiting the website at wellsfargoadvantagefunds.com. |
| | | | |
| 32 | | Wells Fargo Advantage Short Duration Government Bond Fund | | Other information (unaudited) |
BOARD CONSIDERATION OF INVESTMENT ADVISORY, INVESTMENT MANAGEMENT AND SUB-ADVISORY AGREEMENTS:
Under the Investment Company Act of 1940 (the “1940 Act”), the Board of Trustees (the “Board”) of Wells Fargo Funds Trust (the “Trust”) must determine annually whether to approve the continuation of the Trust’s investment advisory and sub-advisory agreements. In this regard, at an in-person meeting held on May 19-20, 2015 (the “Meeting”), the Board, all the members of which have no direct or indirect interest in the investment advisory and sub-advisory agreements and are not “interested persons” of the Trust, as defined in the 1940 Act (the “Independent Trustees”), reviewed and approved for Wells Fargo Advantage Short Duration Government Bond Fund (the “Fund”): (i) an investment advisory agreement (the “Advisory Agreement”) with Wells Fargo Funds Management, LLC (“Funds Management”); (ii) an investment management agreement (the “Management Agreement”) with Funds Management; and (iii) an investment sub-advisory agreement (the “Sub-Advisory Agreement”) with Wells Capital Management Incorporated (the “Sub-Adviser”), an affiliate of Funds Management. The Management Agreement combines the terms of the Advisory Agreement with the terms of the Fund’s Amended and Restated Administration Agreement (the “Administration Agreement”) applicable to Fund-level administrative services. The Advisory Agreement, the Management Agreement and the Sub-Advisory Agreement are collectively referred to as the “Advisory Agreements.”
At the Meeting, the Board considered the factors and reached the conclusions described below relating to the selection of Funds Management and the Sub-Adviser and the approval of the Advisory Agreements. Prior to the Meeting, including at an in-person meeting in March 2015, the Trustees conferred extensively among themselves and with representatives of Funds Management about these matters. Also, the Board has adopted a team-based approach, with each team consisting of a sub-set of Trustees, to assist the full Board in the discharge of its duties in reviewing performance and other matters throughout the year. The Independent Trustees were assisted in their evaluation of the Advisory Agreements by independent legal counsel, from whom they received separate legal advice and with whom they met separately.
In providing information to the Board, Funds Management and the Sub-Adviser were guided by a detailed set of requests for information submitted to them by independent legal counsel on behalf of the Independent Trustees at the start of the Board’s annual contract renewal process earlier in 2015. In considering and approving the Advisory Agreements, the Trustees considered the information they believed relevant, including but not limited to the information discussed below. The Board considered not only the specific information presented in connection with the Meeting, but also the knowledge gained over time through interaction with Funds Management and the Sub-Adviser about various topics. In this regard, the Board reviewed reports of Funds Management at each of its quarterly meetings, which included, among other things, portfolio reviews and performance reports. In addition, the Board and the teams mentioned above confer with portfolio managers at various times throughout the year. The Board did not identify any particular information or consideration that was all-important or controlling, and each individual Trustee may have attributed different weights to various factors.
After its deliberations, the Board unanimously approved the continuation of the Advisory Agreement for the period from June 1, 2015 through June 30, 2015, approved the Management Agreement for the period from July 1, 2015 through May 31, 2016, and approved the continuation of the Sub-Advisory Agreement for a one-year term through May 31, 2016. The Board also determined that the compensation payable to Funds Management and the Sub-Adviser under each of the Advisory Agreements was reasonable. The Board considered the approval of the Advisory Agreements for the Fund as part of its consideration of agreements for funds across the complex, but its approvals were made on a fund-by-fund basis. The following summarizes a number of important, but not necessarily all, factors considered by the Board in support of its approvals.
Nature, extent and quality of services
The Board received and considered various information regarding the nature, extent and quality of services provided to the Fund by Funds Management and the Sub-Adviser under the Advisory Agreements. This information included, among other things, a summary of the background and experience of senior management of Funds Management, and the qualifications, background, tenure and responsibilities of each of the portfolio managers primarily responsible for the day-to-day portfolio management of the Fund. The Board noted that the services to be provided to the Fund pursuant to the Management Agreement combined the advisory services previously provided to the Fund pursuant to the Fund’s Advisory Agreement with the Fund-level administrative services previously provided to the Fund pursuant to the Fund’s Administration Agreement. The Board received a representation from Funds Management that combining these services would not result in any change to the nature or level of services provided by Funds Management to the Fund.
The Board evaluated the ability of Funds Management and the Sub-Adviser to attract and retain qualified investment professionals, including research, advisory and supervisory personnel. The Board further considered the compliance programs and compliance records of Funds Management and the Sub-Adviser. In addition, the Board took into account the full range of services provided to the Fund by Funds Management and its affiliates.
| | | | | | |
| Other information (unaudited) | | Wells Fargo Advantage Short Duration Government Bond Fund | | | 33 | |
Fund performance and expenses
The Board considered the performance results for the Fund over various time periods ended March 31, 2015. The Board considered these results in comparison to the performance of funds in a universe that was determined by Lipper Inc. (“Lipper”) to be similar to the Fund (the “Universe”), and in comparison to the Fund’s benchmark index and to other comparative data. Lipper is an independent provider of investment company data. The Board received a description of the methodology used by Lipper to select the mutual funds in the performance Universe. The Board noted that the performance of the Fund (Administrator Class) was higher than the average performance of the Universe for all periods under review. The Board also noted that the performance of the Fund was higher than its benchmark, the Barclays 1-3 Year Government Index, for all periods under review.
The Board also received and considered information regarding the Fund’s net operating expense ratios and their various components, including actual management fees (which reflect fee waivers, if any, and include advisory, administration and transfer agent fees), custodian and other non-management fees, and Rule 12b-1 and non-Rule 12b-1 service fees. The Board considered these ratios in comparison to the median ratios of funds in class-specific expense groups that were determined by Lipper to be similar to the Fund (the “Groups”). The Board received a description of the methodology used by Lipper to select the mutual funds in the expense Groups and an explanation of how funds comprising expense groups and their expense ratios may vary from year-to-year. Based on the Lipper reports, the Board noted that the net operating expense ratios of the Fund were lower than the median net operating expense ratios of the expense Groups.
The Board took into account the Fund performance and expense information provided to it among the factors considered in deciding to re-approve the Advisory Agreement and Sub-Advisory Agreement and approve the Management Agreement.
Investment advisory and sub-advisory fee rates
The Board reviewed and considered the contractual investment advisory fee rates that are payable by the Fund to Funds Management for investment advisory services (the “Advisory Agreement Rates”), both on a stand-alone basis and on a combined basis with the Fund’s fund-level and class-level contractual administration fee rates (the “Management Rates”). The Board noted that the Management Rates include transfer agency and sub-transfer agency costs. The Board also noted that the fee rate to be paid by the Fund under the Management Agreement will incorporate the advisory fee and Fund-level administration fee previously payable separately by the Fund under the Fund’s Advisory Agreement and Administration Agreement with Funds Management. The Board also reviewed and considered the contractual investment sub-advisory fee rates that are payable by Funds Management to the Sub-Adviser for investment sub-advisory services (the “Sub-Advisory Agreement Rates”).
Among other information reviewed by the Board was a comparison of the Management Rates of the Fund with those of other funds in the expense Groups at a common asset level. The Board noted that the Management Rates of the Fund were lower than the average rates for the Fund’s expense Groups for all share classes.
The Board also received and considered information about the portion of the total advisory fee that was retained by Funds Management after payment of the fee to the Sub-Adviser for sub-advisory services. In assessing the reasonableness of this amount, the Board received and evaluated information about the nature and extent of responsibilities retained and risks assumed by Funds Management and not delegated to or assumed by the Sub-Adviser, and about Funds Management’s on-going oversight services. However, given the affiliation between Funds Management and the Sub-Adviser, the Board ascribed limited relevance to the allocation of the advisory fee between them.
The Board also received and considered information about the nature and extent of services offered and fee rates charged by Funds Management and the Sub-Adviser to other types of clients with investment strategies similar to those of the Fund. In this regard, the Board received information about the significantly greater scope of services, and compliance, reporting and other legal burdens and risks of managing mutual funds compared with those associated with managing assets of non-mutual fund clients such as collective funds or institutional separate accounts.
Based on its consideration of the factors and information it deemed relevant, including those described here, the Board determined that the compensation payable to Funds Management under the Management Agreement and Advisory Agreement and to the Sub-Adviser under the Sub-Advisory Agreement was reasonable, in light of the services covered by the Advisory Agreements.
Profitability
The Board received and considered information concerning the profitability of Funds Management, as well as the profitability of Wells Fargo as a whole, from providing services to the Fund and the fund family as a whole. The Board also
| | | | |
| 34 | | Wells Fargo Advantage Short Duration Government Bond Fund | | Other information (unaudited) |
received and considered information concerning the profitability of the Sub-Adviser from providing services to the fund family as a whole, noting that the Sub-Adviser’s profitability information with respect to providing services to the Fund was subsumed in the Wells Fargo profitability analysis.
Funds Management reported on the methodologies and estimates used in calculating profitability. Among other things, the Board noted that the levels of profitability reported on a fund-by-fund basis varied widely, depending on factors such as the size and type of fund. Based on its review, the Board did not deem the profits reported by Funds Management or Wells Fargo from its services to the Fund to be at a level that would prevent it from approving the continuation of the Advisory Agreements.
Economies of scale
With respect to possible economies of scale, the Board noted the existence of breakpoints in the Fund’s advisory and management fee structures, and the Fund’s administration fee structure, which operate generally to reduce the Fund’s expense ratios as the Fund grows in size. It considered that, for a small fund or a fund that shrinks in size, breakpoints conversely can result in higher fee levels. The Board also considered that fee waiver and expense reimbursement arrangements and competitive fee rates at the outset are means of sharing potential economies of scale with shareholders of the Fund and the fund family as a whole. The Board considered Funds Management’s view that any analyses of potential economies of scale in managing a particular fund are inherently limited in light of the joint and common costs and investments that Funds Management incurs across the fund family as a whole.
The Board concluded that the Fund’s fee and expense arrangements, including contractual breakpoints, constituted a reasonable approach to sharing potential economies of scale with the Fund and its shareholders.
Other benefits to Funds Management and the Sub-Adviser
The Board received and considered information regarding potential “fall-out” or ancillary benefits received by Funds Management and its affiliates, including the Sub-Adviser, as a result of their relationships with the Fund. Ancillary benefits could include, among others, benefits directly attributable to other relationships with the Fund and benefits potentially derived from an increase in Funds Management’s and the Sub-Adviser’s business as a result of their relationships with the Fund. The Board noted that various affiliates of Funds Management may receive distribution-related fees, shareholder servicing payments and sub-transfer agency fees in respect of shares sold or held through them and services provided.
The Board also reviewed information about soft dollar credits earned and utilized by the Sub-Adviser, fees earned by Funds Management and the Sub-Adviser from managing a private investment vehicle for the fund family’s securities lending collateral and commissions earned by an affiliated broker from portfolio transactions.
Based on its consideration of the factors and information it deemed relevant, including those described here, the Board did not find that any ancillary benefits received by Funds Management and its affiliates, including the Sub-Adviser, were unreasonable.
Conclusion
At the Meeting, after considering the above-described factors and based on its deliberations and its evaluation of the information described above, the Board unanimously approved the continuation of the Advisory Agreement for the period from June 1, 2015 through June 30, 2015, approved the Management Agreement for the period from July 1, 2015 through May 31, 2016, and approved the continuation of the Sub-Advisory Agreement for a one-year term through May 31, 2016. The Board also determined that the compensation payable to Funds Management and the Sub-Adviser under each of the Advisory Agreements was reasonable.
| | | | | | |
List of abbreviations | | Wells Fargo Advantage Short Duration Government Bond Fund | | | 35 | |
The following is a list of common abbreviations for terms and entities that may have appeared in this report.
| ACA | — ACA Financial Guaranty Corporation |
| ADR | — American depositary receipt |
| ADS | — American depositary shares |
| AGC | — Assured Guaranty Corporation |
| AGM | — Assured Guaranty Municipal |
| Ambac | — Ambac Financial Group Incorporated |
| AMT | — Alternative minimum tax |
| BAN | — Bond anticipation notes |
| BHAC | — Berkshire Hathaway Assurance Corporation |
| CAB | — Capital appreciation bond |
| CCAB | — Convertible capital appreciation bond |
| CDA | — Community Development Authority |
| CDO | — Collateralized debt obligation |
| DRIVER | — Derivative inverse tax-exempt receipts |
| DW&P | — Department of Water & Power |
| DWR | — Department of Water Resources |
| ECFA | — Educational & Cultural Facilities Authority |
| EDA | — Economic Development Authority |
| EDFA | — Economic Development Finance Authority |
| ETF | — Exchange-traded fund |
| FDIC | — Federal Deposit Insurance Corporation |
| FFCB | — Federal Farm Credit Banks |
| FGIC | — Financial Guaranty Insurance Corporation |
| FHA | — Federal Housing Administration |
| FHLB | — Federal Home Loan Bank |
| FHLMC | — Federal Home Loan Mortgage Corporation |
| FICO | — The Financing Corporation |
| FNMA | — Federal National Mortgage Association |
| GDR | — Global depositary receipt |
| GNMA | — Government National Mortgage Association |
| HCFR | — Healthcare facilities revenue |
| HEFA | — Health & Educational Facilities Authority |
| HEFAR | — Higher education facilities authority revenue |
| HFA | — Housing Finance Authority |
| HFFA | — Health Facilities Financing Authority |
| HUD | — Department of Housing and Urban Development |
| IDA | — Industrial Development Authority |
| IDAG | — Industrial Development Agency |
| KRW | — Republic of Korea won |
| LIBOR | — London Interbank Offered Rate |
| LIFER | — Long Inverse Floating Exempt Receipts |
| LLC | — Limited liability company |
| LLLP | — Limited liability limited partnership |
| LLP | — Limited liability partnership |
| MBIA | — Municipal Bond Insurance Association |
| MFHR | — Multifamily housing revenue |
| MSTR | — Municipal securities trust receipts |
| MUD | — Municipal Utility District |
| National | — National Public Finance Guarantee Corporation |
| PCFA | — Pollution Control Financing Authority |
| PCL | — Public Company Limited |
| PCR | — Pollution control revenue |
| PFA | — Public Finance Authority |
| PFFA | — Public Facilities Financing Authority |
| PFOTER | — Puttable floating option tax-exempt receipts |
| plc | — Public limited company |
| PUTTER | — Puttable tax-exempt receipts |
| R&D | — Research & development |
| Radian | — Radian Asset Assurance |
| RAN | — Revenue anticipation notes |
| RDA | — Redevelopment Authority |
| RDFA | — Redevelopment Finance Authority |
| REIT | — Real estate investment trust |
| ROC | — Reset option certificates |
| SAVRS | — Select auction variable rate securities |
| SBA | — Small Business Authority |
| SDR | — Swedish depositary receipt |
| SFHR | — Single-family housing revenue |
| SFMR | — Single-family mortgage revenue |
| SPA | — Standby purchase agreement |
| SPDR | — Standard & Poor’s Depositary Receipts |
| SPEAR | — Short Puttable Exempt Adjustable Receipts |
| STRIPS | — Separate trading of registered interest and |
| TAN | — Tax anticipation notes |
| TIPS | — Treasury inflation-protected securities |
| TRAN | — Tax revenue anticipation notes |
| TTFA | — Transportation Trust Fund Authority |
| TVA | — Tennessee Valley Authority |
This page is intentionally left blank.


For more information
More information about Wells Fargo Advantage Funds is available free upon request. To obtain literature, please write, email, visit the Fund’s website, or call:
Wells Fargo Advantage Funds
P.O. Box 8266
Boston, MA 02266-8266
Email: wfaf@wellsfargo.com
Website: wellsfargoadvantagefunds.com
Individual investors: 1-800-222-8222
Retail investment professionals: 1-888-877-9275
Institutional investment professionals: 1-866-765-0778
This report and the financial statements contained herein are submitted for the general information of the shareholders of Wells Fargo Advantage Funds. If this report is used for promotional purposes, distribution of the report must be accompanied or preceded by a current prospectus. Before investing, please consider the investment objectives, risks, charges, and expenses of the investment. For a current prospectus and, if available, a summary prospectus, containing this information, call 1-800-222-8222 or visit the Fund’s website at wellsfargoadvantagefunds.com. Read the prospectus carefully before you invest or send money.
Wells Fargo Funds Management, LLC, a wholly owned subsidiary of Wells Fargo & Company, provides investment advisory and administrative services for Wells Fargo Advantage Funds. Other affiliates of Wells Fargo & Company provide subadvisory and other services for the Funds. The Funds are distributed by Wells Fargo Funds Distributor, LLC, Member FINRA, an affiliate of Wells Fargo & Company.
NOT FDIC INSURED ¡ NO BANK GUARANTEE ¡ MAY LOSE VALUE
© 2015 Wells Fargo Funds Management, LLC. All rights reserved.
| | |
 | | 236806 10-15 A220/AR220 08-15 |

Wells Fargo Advantage Short-Term Bond Fund

Annual Report
August 31, 2015

Reduce clutter. Save trees.
Sign up for electronic delivery of prospectuses and shareholder reports at wellsfargo.com/advantagedelivery
Contents
The views expressed and any forward-looking statements are as of August 31, 2015, unless otherwise noted, and are those of the Fund managers and/or Wells Fargo Funds Management, LLC. Discussions of individual securities, or the markets generally, or any Wells Fargo Advantage Fund are not intended as individual recommendations. Future events or results may vary significantly from those expressed in any forward-looking statements; the views expressed are subject to change at any time in response to changing circumstances in the market. Wells Fargo Funds Management, LLC and the Fund disclaim any obligation to publicly update or revise any views expressed or forward-looking statements.
NOT FDIC INSURED ¡ NO BANK GUARANTEE ¡ MAY LOSE VALUE
| | | | |
| 2 | | Wells Fargo Advantage Short-Term Bond Fund | | Letter to shareholders (unaudited) |

Karla M. Rabusch
President
Wells Fargo Advantage Funds
Major central banks continued to inject liquidity into global banks and markets through various accommodative monetary policies, including quantitative easing.
Dear Valued Shareholder:
We are pleased to offer you this annual report for the Wells Fargo Advantage Short-Term Bond Fund for the 12-month period that ended August 31, 2015. The period was marked by low interest rates, low oil prices, and moderate U.S. economic growth. Short-term investment-grade bonds, as measured by the Barclays U.S. 1–3 Year Government/Credit Bond Index,1 returned 0.81% during the period. Meanwhile, strong demand for high-quality, liquid assets kept returns on Treasury bills more modest; the Barclays 6-Month Treasury Bill Index2 returned 0.15% during the period.
Major central banks continued to provide stimulus.
Major central banks continued to inject liquidity into global banks and markets through various accommodative monetary policies, including quantitative easing. In the U.S., the Federal Reserve (Fed) kept its key interest rate near zero in order to support the economy and the financial system. However, it set expectations for it to begin normalizing monetary policy with higher target ranges for the federal funds rate.
Meanwhile, European markets continued to benefit from the European Central Bank’s (ECB’s) willingness to maintain low interest rates. In addition to its targeted longer-term refinancing operations that are designed to increase bank lending, the ECB expanded its quantitative easing program to include the purchase of eurozone government bonds. In Japan, the Bank of Japan maintained an aggressive monetary program aimed at combating deflation.
Economic growth was moderate, and oil prices plummeted.
U.S. economic growth advanced during the reporting period, the unemployment rate ticked lower to 5.1% as of August 2015, and inflation remained below the Fed’s longer-run objective of a 2% pace. The period was also marked by lower oil prices, which began the reporting period near $90 per barrel but declined to $46 per barrel at the end of August 2015. While lower oil prices benefited consumers of oil products, the lower prices pressured companies within the energy sector.
Bond yields rose but remained low by historical standards.
Short-term interest rates increased during the reporting period, with a flattening in the shape of the short-term yield curve. During this time frame, 1-year Treasury bills rose 29 basis points (bps; 100 bps equals 1.00%) to yield 0.38%, 2-year Treasury note yields rose 21 bps to yield 0.74%, and 3-year Treasury note yields rose only 8 bps to yield 1.05%. Meanwhile, ultra-short-term yields were little changed at ultralow levels, anchored by the easy monetary policy.
Since the end of the financial crisis, structural changes in the fixed-income markets have reduced trading liquidity (the degree to which assets can be bought or sold without affecting the price). New regulations and capital requirements have caused traditional liquidity suppliers (banks and broker/dealers) to be more risk-averse and hold less inventory. Meanwhile, corporate-debt issuance has spiked as companies finance themselves at record-low yields, bond mutual funds hold larger amounts of this new debt supply, trading volumes are lower, and large-size trades are more
| 1 | The Barclays U.S. 1–3 Year Government/Credit Bond Index is the one- to three-year component of the Barclays U.S. Government/Credit Bond Index that includes securities in the Government and Credit Indexes. The Government Index includes Treasuries (that is, public obligations of the U.S. Treasury that have remaining maturities of more than one year) and agencies (that is, publicly issued debt of U.S. government agencies, quasi-federal corporations, and corporate or foreign debt guaranteed by the U.S. government).The Credit Index includes publicly issued U.S. corporate and foreign debentures and secured notes that meet specified maturity, liquidity, and quality requirements. You cannot invest directly in an index. |
| 2 | The Barclays 6-Month Treasury Bill Index tracks the performance and attributes of recently issued 6-month U.S. Treasury bills. The index follows Barclays’ monthly rebalancing conventions. You cannot invest directly in an index. |
| | | | | | |
| Letter to shareholders (unaudited) | | Wells Fargo Advantage Short-Term Bond Fund | | | 3 | |
difficult to execute. However, fixed-income markets appear to have functioned well over the past year with sufficient liquidity and muted volatility.
Don’t let short-term uncertainty derail long-term investment goals.
Periods of uncertainty can present challenges, but experience has taught us that maintaining long-term investment goals can be an effective way to plan for the future. To help you create a sound strategy based on your personal goals and risk tolerance, Wells Fargo Advantage Funds offers more than 100 mutual funds spanning a wide range of asset classes and investment styles. Although diversification cannot guarantee an investment profit or prevent losses, we believe it can be an effective way to manage investment risk and potentially smooth out overall portfolio performance. We encourage investors to know their investments and to understand that appropriate levels of risk-taking may unlock opportunities.
Thank you for choosing to invest in Wells Fargo Advantage Funds. We appreciate your confidence in us and remain committed to helping you meet your financial needs.
Sincerely,

Karla M. Rabusch
President
Wells Fargo Advantage Funds
Periods of uncertainty can present challenges, but experience has taught us that maintaining long-term investment goals can be an effective way to plan for the future.
Notice to shareholders
At a meeting held on August 11–12, 2015, the Board of Trustees of the Fund approved a change in the name of the Fund whereby the word “Advantage” will be removed from its name, effective December 15, 2015.
For current information about your fund investments, contact your investment professional, visit our website at wellsfargoadvantagefunds.com, or call us directly at 1-800-222-8222. We are available 24 hours a day, 7 days a week.
| | | | |
| 4 | | Wells Fargo Advantage Short-Term Bond Fund | | Performance highlights (unaudited) |
Investment objective
The Fund seeks current income consistent with capital preservation.
Manager
Wells Fargo Funds Management, LLC
Subadviser
Wells Capital Management Incorporated
Portfolio managers
Christopher Y. Kauffman, CFA
Jay N. Mueller, CFA
Noah Wise, CFA
Average annual total returns1 (%) as of August 31, 2015
| | | | | | | | | | | | | | | | | | | | | | | | | | | | | | | | | | |
| | | | | Including sales charge | | | Excluding sales charge | | | Expense ratios2 (%) | |
| | | Inception date | | 1 year | | | 5 year | | | 10 year | | | 1 year | | | 5 year | | | 10 year | | | Gross | | | Net3 | |
| Class A (SSTVX) | | 8-31-1999 | | | (1.35 | ) | | | 1.12 | | | | 2.78 | | | | 0.66 | | | | 1.53 | | | | 2.98 | | | | 0.81 | | | | 0.73 | |
| Class C (WFSHX) | | 3-31-2008 | | | (1.09 | ) | | | 0.75 | | | | 2.20 | | | | (0.09 | ) | | | 0.75 | | | | 2.20 | | | | 1.56 | | | | 1.48 | |
| Institutional Class (SSHIX) | | 8-31-1999 | | | – | | | | – | | | | – | | | | 0.82 | | | | 1.82 | | | | 3.31 | | | | 0.48 | | | | 0.48 | |
| Investor Class (SSTBX) | | 8-31-1987 | | | – | | | | – | | | | – | | | | 0.54 | | | | 1.49 | | | | 2.94 | | | | 0.84 | | | | 0.74 | |
Barclays U.S. 1-3 Year Government
/Credit Bond Index4 | | – | | | – | | | | – | | | | – | | | | 0.81 | | | | 1.03 | | | | 2.79 | | | | – | | | | – | |
Figures quoted represent past performance, which is no guarantee of future results, and do not reflect taxes that a shareholder may pay on fund distributions or the redemption of fund shares. Investment return and principal value of an investment will fluctuate so that an investor’s shares, when redeemed, may be worth more or less than their original cost. Performance shown without sales charges would be lower if sales charges were reflected. Current performance may be lower or higher than the performance data quoted, which assumes the reinvestment of dividends and capital gains. Current month-end performance is available on the Fund’s website, wellsfargoadvantagefunds.com.
Index returns do not include transaction costs associated with buying and selling securities, any mutual fund fees or expenses, or any taxes. It is not possible to invest directly in an index.
For Class A shares, the maximum front-end sales charge is 2.00%. For Class C shares, the maximum contingent deferred sales charge is 1.00%. Performance including a contingent deferred sales charge assumes the sales charge for the corresponding time period. Institutional Class and Investor Class shares are sold without a front-end sales charge or contingent deferred sales charge.
Bond values fluctuate in response to the financial condition of individual issuers, general market and economic conditions, and changes in interest rates. Changes in market conditions and government policies may lead to periods of heightened volatility in the bond market and reduced liquidity for certain bonds held by the Fund. In general, when interest rates rise, bond values fall and investors may lose principal value. Interest-rate changes and their impact on the Fund and its share price can be sudden and unpredictable. Loans are subject to risks similar to those associated with other below-investment-grade bond investments, such as credit risk (for example, risk of issuer default), below-investment-grade bond risk (for example, risk of greater volatility in value), and risk that the loan may become illiquid or difficult to price. The use of derivatives may reduce returns and/or increase volatility. Certain investment strategies tend to increase the total risk of an investment (relative to the broader market). The Fund is exposed to foreign investment risk, high-yield securities risk, and mortgage- and asset-backed securities risk. Consult the Fund’s prospectus for additional information on these and other risks.
Please see footnotes on page 5.
| | | | | | |
| Performance highlights (unaudited) | | Wells Fargo Advantage Short-Term Bond Fund | | | 5 | |
|
| Growth of $10,000 investment5 as of August 31, 2015 |
|
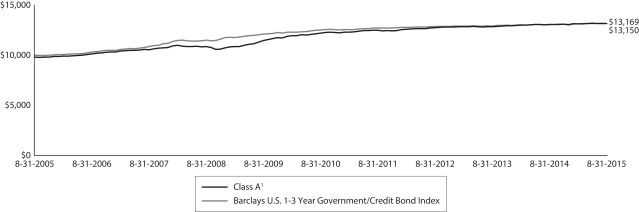 |
| 1 | Effective June 20, 2008, Advisor Class was renamed Class A and modified to assume the features and attributes of Class A. Historical performance shown for Class A shares through June 19, 2008, includes Advisor Class expenses. Historical performance shown for Class C shares prior to their inception reflects the performance of Investor Class shares, adjusted to include the higher expenses applicable to Class C shares. |
| 2 | Reflects the expense ratios as stated in the most recent prospectuses, which include the impact of 0.01% in acquired fund fees and expenses. The expense ratios shown are subject to change and may differ from the annualized expense ratios shown in the financial highlights of this report, which do not include acquired fund fees and expenses. |
| 3 | The manager has contractually committed through December 31, 2015, to waive fees and/or reimburse expenses to the extent necessary to cap the Fund’s Total Annual Fund Operating Expenses After Fee Waiver at 0.72% for Class A, 1.47% for Class C, 0.48% for Institutional Class, and 0.73% for Investor Class. After this time, the cap may be increased or the commitment to maintain the cap may be terminated only with the approval of the Board of Trustees. Brokerage commissions, stamp duty fees, interest, taxes, acquired fund fees and expenses, and extraordinary expenses are excluded from the cap. Without this cap, the Fund’s returns would have been lower. |
| 4 | The Barclays U.S. 1-3 Year Government/Credit Bond Index is the one- to three-year component of the Barclays U.S. Government/Credit Bond Index that includes securities in the Government and Credit Indexes. The Government Index includes Treasuries (that is, public obligations of the U.S. Treasury that have remaining maturities of more than one year) and agencies (that is, publicly issued debt of U.S. government agencies, quasi-federal corporations, and corporate or foreign debt guaranteed by the U.S. government). The Credit Index includes publicly issued U.S. corporate and foreign debentures and secured notes that meet specified maturity, liquidity, and quality requirements. You cannot invest directly in an index. |
| 5 | The chart compares the performance of Class A shares for the most recent 10 years with the performance of the Barclays 1-3 Year Government/Credit Index. The chart assumes a hypothetical investment of $10,000 in Class A shares and reflects all operating expenses and assumes the maximum initial sales charge of 2.00%. |
| 6 | The ten largest holdings, excluding cash and cash equivalents, are calculated based on the value of the investments divided by total net assets of the Fund. Holdings are subject to change and may have changed since the date specified. |
| 7 | Amounts are calculated based on the total long-term investments of the Fund. These amounts are subject to change and may have changed since the date specified. |
| | | | |
| 6 | | Wells Fargo Advantage Short-Term Bond Fund | | Performance highlights (unaudited) |
MANAGER’S DISCUSSION
Fund highlights
| n | | The Fund underperformed its benchmark, the Barclays U.S. 1–3 Year Government/Credit Bond Index, for the 12-month period that ended August 31, 2015. |
| n | | The Fund’s overweight to corporate debt had a mixed impact on performance as the higher income generated by this sector was largely offset by spread widening. |
| n | | The Fund’s holdings in asset-backed securities (ABS) generated positive excess returns, while mortgage-backed securities (MBS) turned in an uneven performance, with agency-guaranteed residential MBS outperforming Treasuries while commercial MBS generally lagged. |
The economic climate remained benign.
The U.S. economy featured trend-like growth, a steadily improving labor market, and generally stable inflation over the past 12 months. Real gross domestic product growth averaged about 2.7% in the most recent four quarters as personal income gains supported consumption. In contrast, business investment softened, in part, due to weakness in the energy industry brought on by a collapse in global oil prices.
The labor market continued to tighten over the past 12 months, as evidenced by a full percentage point decline in the unemployment rate to 5.1%. Nonfarm payrolls expanded at an average pace of about 240,000 per month over the period. Following a persistent theme of this expansion, some of the improvement in the unemployment rate can be attributed to a decline in the labor force participation rate, which fell to 62.6% at the end of the period versus 62.8% a year ago.
The inflationary environment was mixed over the past 12 months as the drop in oil prices pushed the year-over-year change in the headline Consumer Price Index (CPI) down to 0.2% compared with a 1.7% headline inflation rate a year ago. Excluding food and energy, however, the CPI rose 1.8%, which is basically in line with the average rate of core inflation recorded over the past five years.
Monetary policy transitioned from maximal accommodation toward the beginning of a tightening cycle over the past 12 months. The Federal Open Market Committee (FOMC) completed its third round of asset purchases, also known as quantitative easing, in the fourth quarter of 2014, though the monetary authorities continue to reinvest the proceeds of maturing principal and interest payments from their existing portfolio. The FOMC’s overnight rate targets remained unchanged throughout the period, with the federal funds rate held to a range of 0.00% to 0.25%. The FOMC has said an initial hike to the federal funds target rate may be appropriate before the end of 2015, to be followed by a very gradual normalization of monetary policy.
| | | | |
| Ten largest holdings6 (%) as of August 31, 2015 | |
Mercedes-Benz Auto Receivables Series 2015-1
Class A2A, 0.82%, 6-15-2018 | | | 1.21 | |
Verizon Communications Incorporated,
1.35%, 6-9-2017 | | | 1.05 | |
DIRECTV Holdings LLC, 2.40%, 3-15-2017 | | | 0.90 | |
Chase Issuance Trust Series 2012-A9 Class A9,
0.35%, 10-16-2017 | | | 0.89 | |
JPMorgan Chase Commercial Mortgage Securities Corporation Series 2014-INN Class A, 1.12%,
6-15-2029 | | | 0.81 | |
World Omni Automobile Lease Series 2015-A
Class A2A, 1.06%, 5-15-2018 | | | 0.74 | |
U.S. Treasury Note, 1.38%, 2-28-2019 | | | 0.74 | |
Port Arthur TX Navigation District Motiva Enterprises Project, 0.30%, 11-1-2040 | | | 0.73 | |
CNH Equipment Trust Series 2015-C Class A2A,
1.10%, 12-17-2018 | | | 0.71 | |
Nissan Auto Lease Trust Series 2014-B Class A2A, 0.73%, 4-17-2017 | | | 0.68 | |
The Fund remained overweight corporate notes and securitized debt.
During the period, the Fund maintained an overweight to short-term corporate notes and securitized debt while being underweight U.S. Treasuries and agency debentures. About half of Fund assets were invested in corporate debt securities, while the other primary sector commitment was to securitized debt: MBS pass-throughs, ABS, and collateralized mortgage obligations. We maintained the Fund’s duration near 1.85 years.
Please see footnotes on page 5.
| | | | | | |
| Performance highlights (unaudited) | | Wells Fargo Advantage Short-Term Bond Fund | | | 7 | |
In this environment of trend-like growth, stable core inflation, and still accommodative monetary policy, we believe that the spread sectors, including both corporate credit and structured product, represented good value, particularly with spreads having widened in recent months. In our view, the spread widening has been more a function of supply concerns and global macro uncertainty than deterioration in domestic fundamentals. That said, corporate credit metrics have weakened in certain industries such as mineral extraction and energy, and management focus on rewarding shareholders has resulted in additional leverage in several industries.
|
| Portfolio allocation7 as of August 31, 2015 |
|
 |
We expect a gradual rise in short-term interest rates.
The relatively benign domestic economic conditions described above are likely to result in a gradual upward bias toward interest rates. We believe the FOMC is likely to raise the federal funds target rate by 0.75% to 1.00% over the next 12 months, a result which is largely reflected in the current term structure of interest rates. Should market rates diverge from the policy path we think most likely, we will be prepared to modify our duration and yield-curve posture in response to the opportunities presented.
Please see footnotes on page 5.
| | | | |
| 8 | | Wells Fargo Advantage Short-Term Bond Fund | | Fund expenses (unaudited) |
As a shareholder of the Fund, you incur two types of costs: (1) transaction costs, including sales charges (loads) on purchase payments and contingent deferred sales charges (if any) on redemptions and (2) ongoing costs, including management fees, distribution (12b-1) and/or shareholder servicing fees, and other Fund expenses. This example is intended to help you understand your ongoing costs (in dollars) of investing in the Fund and to compare these costs with the ongoing costs of investing in other mutual funds.
The example is based on an investment of $1,000 invested at the beginning of the six-month period and held for the entire period from March 1, 2015 to August 31, 2015.
Actual expenses
The “Actual” line of the table below provides information about actual account values and actual expenses. You may use the information in this line, together with the amount you invested, to estimate the expenses that you paid over the period. Simply divide your account value by $1,000 (for example, an $8,600 account value divided by $1,000 = 8.6), then multiply the result by the number in the “Actual” line under the heading entitled “Expenses paid during period” for your applicable class of shares to estimate the expenses you paid on your account during this period.
Hypothetical example for comparison purposes
The “Hypothetical” line of the table below provides information about hypothetical account values and hypothetical expenses based on the Fund’s actual expense ratio and an assumed rate of return of 5% per year before expenses, which is not the Fund’s actual return. The hypothetical account values and expenses may not be used to estimate the actual ending account balance or expenses you paid for the period. You may use this information to compare the ongoing costs of investing in the Fund and other funds. To do so, compare this 5% hypothetical example with the 5% hypothetical examples that appear in the shareholder reports of the other funds.
Please note that the expenses shown in the table are meant to highlight your ongoing costs only and do not reflect any transactional costs, such as sales charges (loads) and contingent deferred sales charges. Therefore, the “Hypothetical” line of the table is useful in comparing ongoing costs only and will not help you determine the relative total costs of owning different funds. In addition, if these transactional costs were included, your costs would have been higher.
| | | | | | | | | | | | | | | | |
| | | Beginning account value 3-1-2015 | | | Ending account value 8-31-2015 | | | Expenses paid during the period¹ | | | Net annualized expense ratio | |
Class A | | | | | | | | | | | | | | | | |
Actual | | $ | 1,000.00 | | | $ | 1,002.87 | | | $ | 3.63 | | | | 0.72 | % |
Hypothetical (5% return before expenses) | | $ | 1,000.00 | | | $ | 1,021.58 | | | $ | 3.67 | | | | 0.72 | % |
Class C | | | | | | | | | | | | | | | | |
Actual | | $ | 1,000.00 | | | $ | 999.08 | | | $ | 7.41 | | | | 1.47 | % |
Hypothetical (5% return before expenses) | | $ | 1,000.00 | | | $ | 1,017.80 | | | $ | 7.48 | | | | 1.47 | % |
Institutional Class | | | | | | | | | | | | | | | | |
Actual | | $ | 1,000.00 | | | $ | 1,004.15 | | | $ | 2.37 | | | | 0.47 | % |
Hypothetical (5% return before expenses) | | $ | 1,000.00 | | | $ | 1,022.84 | | | $ | 2.40 | | | | 0.47 | % |
Investor Class | | | | | | | | | | | | | | | | |
Actual | | $ | 1,000.00 | | | $ | 1,001.67 | | | $ | 3.68 | | | | 0.73 | % |
Hypothetical (5% return before expenses) | | $ | 1,000.00 | | | $ | 1,021.53 | | | $ | 3.72 | | | | 0.73 | % |
| 1 | Expenses paid is equal to the annualized expense ratio of each class multiplied by the average account value over the period, multiplied by the number of days in the most recent fiscal half-year divided by the number of days in the fiscal year (to reflect the one-half-year period). |
| | | | | | |
| Portfolio of investments—August 31, 2015 | | Wells Fargo Advantage Short-Term Bond Fund | | | 9 | |
| | | | | | | | | | | | | | | | | | |
| Security name | | | | Interest rate | | | Maturity date | | | Principal | | | Value | |
| | | | | |
Agency Securities: 11.80% | | | | | | | | | | | | | | | | | | |
FDIC Series 2010-R1 Class A 144A | | | | | 2.18 | % | | | 5-25-2050 | | | $ | 2,142,734 | | | $ | 2,159,098 | |
FDIC Series 2013-R1 Class A 144A | | | | | 1.15 | | | | 3-25-2033 | | | | 1,504,578 | | | | 1,487,239 | |
FHLMC ± | | | | | 2.41 | | | | 9-1-2031 | | | | 6,907 | | | | 7,058 | |
FHLMC ± | | | | | 2.50 | | | | 4-1-2032 | | | | 57,160 | | | | 60,439 | |
FHLMC ± | | | | | 2.65 | | | | 7-1-2029 | | | | 3,673 | | | | 3,831 | |
FHLMC ± | | | | | 2.90 | | | | 5-1-2026 | | | | 94,252 | | | | 99,119 | |
FHLMC | | | | | 3.00 | | | | 2-15-2024 | | | | 1,011,265 | | | | 1,039,022 | |
FHLMC | | | | | 3.50 | | | | 6-15-2038 | | | | 1,128,391 | | | | 1,180,655 | |
FHLMC | | | | | 4.50 | | | | 5-15-2018 | | | | 149,758 | | | | 155,848 | |
FHLMC | | | | | 5.00 | | | | 10-15-2032 | | | | 266,851 | | | | 272,616 | |
FHLMC | | | | | 6.00 | | | | 10-1-2021 | | | | 469,117 | | | | 512,155 | |
FHLMC | | | | | 8.50 | | | | 9-1-2017 | | | | 39,937 | | | | 40,785 | |
FHLMC | | | | | 9.00 | | | | 8-1-2018 | | | | 39,695 | | | | 41,237 | |
FHLMC | | | | | 9.00 | | | | 6-1-2019 | | | | 43,038 | | | | 45,550 | |
FHLMC | | | | | 9.00 | | | | 10-1-2019 | | | | 133,531 | | | | 144,740 | |
FHLMC | | | | | 9.50 | | | | 12-1-2022 | | | | 89,990 | | | | 96,765 | |
FHLMC | | | | | 10.50 | | | | 1-1-2016 | | | | 165 | | | | 166 | |
FHLMC | | | | | 10.50 | | | | 11-1-2017 | | | | 408 | | | | 434 | |
FHLMC | | | | | 10.50 | | | | 8-1-2018 | | | | 38,583 | | | | 40,747 | |
FHLMC | | | | | 10.50 | | | | 2-1-2019 | | | | 887 | | | | 974 | |
FHLMC | | | | | 10.50 | | | | 4-1-2019 | | | | 377 | | | | 403 | |
FHLMC | | | | | 10.50 | | | | 5-1-2019 | | | | 377 | | | | 414 | |
FHLMC | | | | | 10.50 | | | | 6-1-2019 | | | | 2,122 | | | | 2,329 | |
FHLMC | | | | | 10.50 | | | | 7-1-2019 | | | | 892 | | | | 974 | |
FHLMC Series 2597 Series AE | | | | | 5.50 | | | | 4-15-2033 | | | | 249,437 | | | | 274,861 | |
FHLMC Series 2631 Class LC | | | | | 4.50 | | | | 6-15-2018 | | | | 331,234 | | | | 344,703 | |
FHLMC Series 2642 Class AR | | | | | 4.50 | | | | 7-15-2023 | | | | 395,856 | | | | 425,361 | |
FHLMC Series 2656 Class BG | | | | | 5.00 | | | | 10-15-2032 | | | | 1,186,564 | | | | 1,235,856 | |
FHLMC Series 2958 Class QD | | | | | 4.50 | | | | 4-15-2020 | | | | 1,167,330 | | | | 1,209,291 | |
FHLMC Series 3266 Class D | | | | | 5.00 | | | | 1-15-2022 | | | | 1,274,478 | | | | 1,332,968 | |
FHLMC Series 3609 Class LA | | | | | 4.00 | | | | 12-15-2024 | | | | 482,248 | | | | 500,591 | |
FHLMC Series 3656 Class BH | | | | | 3.00 | | | | 12-15-2019 | | | | 1,113,044 | | | | 1,120,693 | |
FHLMC Series 3778 Class BM | | | | | 3.50 | | | | 8-15-2028 | | | | 458,126 | | | | 469,869 | |
FHLMC Series 3794 Class LK | | | | | 3.00 | | | | 2-15-2024 | | | | 1,593,479 | | | | 1,622,461 | |
FHLMC Series 3855 Class HL | | | | | 3.50 | | | | 2-15-2026 | | | | 387,887 | | | | 402,516 | |
FHLMC Series 3920 Class AB | | | | | 3.00 | | | | 9-15-2025 | | | | 1,057,654 | | | | 1,084,910 | |
FHLMC Series T-42 Class A6 | | | | | 9.50 | | | | 2-25-2042 | | | | 477,216 | | | | 591,280 | |
FHLMC Series T-57 Class 2A1 ± | | | | | 3.26 | | | | 7-25-2043 | | | | 49,317 | | | | 52,026 | |
FHLMC Series T-59 Class 2A1 ± | | | | | 2.92 | | | | 10-25-2043 | | | | 1,280,981 | | | | 1,325,055 | |
FNMA ± | | | | | 1.45 | | | | 8-1-2034 | | | | 703,669 | | | | 716,975 | |
FNMA ± | | | | | 2.33 | | | | 11-1-2031 | | | | 66,489 | | | | 69,841 | |
FNMA ± | | | | | 2.54 | | | | 10-1-2036 | | | | 3,388,500 | | | | 3,608,121 | |
FNMA ± | | | | | 2.64 | | | | 7-1-2036 | | | | 2,155,676 | | | | 2,303,621 | |
FNMA | | | | | 2.73 | | | | 10-1-2017 | | | | 2,996,982 | | | | 3,078,700 | |
FNMA | | | | | 2.93 | | | | 12-1-2017 | | | | 2,335,559 | | | | 2,411,432 | |
FNMA | | | | | 3.34 | | | | 4-1-2016 | | | | 948,771 | | | | 953,218 | |
FNMA | | | | | 3.34 | | | | 9-1-2017 | | | | 1,391,742 | | | | 1,446,763 | |
FNMA | | | | | 3.50 | | | | 10-1-2023 | | | | 1,373,322 | | | | 1,449,795 | |
FNMA | | | | | 3.50 | | | | 11-1-2023 | | | | 826,658 | | | | 872,697 | |
FNMA | | | | | 3.69 | | | | 6-1-2017 | | | | 3,324,021 | | | | 3,476,462 | |
The accompanying notes are an integral part of these financial statements.
| | | | |
| 10 | | Wells Fargo Advantage Short-Term Bond Fund | | Portfolio of investments—August 31, 2015 |
| | | | | | | | | | | | | | | | | | |
| Security name | | | | Interest rate | | | Maturity date | | | Principal | | | Value | |
| | | | | |
Agency Securities (continued) | | | | | | | | | | | | | | | | | | |
FNMA | | | | | 3.74 | % | | | 5-1-2018 | | | $ | 2,233,156 | | | $ | 2,365,664 | |
FNMA | | | | | 4.00 | | | | 6-25-2026 | | | | 1,266,046 | | | | 1,348,638 | |
FNMA | | | | | 4.00 | | | | 8-25-2037 | | | | 1,069,548 | | | | 1,097,864 | |
FNMA | | | | | 5.00 | | | | 3-25-2034 | | | | 57,761 | | | | 57,828 | |
FNMA | | | | | 5.09 | | | | 2-1-2016 | | | | 845,176 | | | | 844,936 | |
FNMA | | | | | 5.39 | | | | 1-1-2018 | | | | 951,359 | | | | 992,756 | |
FNMA | | | | | 5.50 | | | | 8-25-2034 | | | | 1,943,655 | | | | 2,039,584 | |
FNMA | | | | | 6.00 | | | | 4-1-2021 | | | | 570,046 | | | | 597,876 | |
FNMA | | | | | 6.00 | | | | 3-1-2033 | | | | 764,216 | | | | 873,789 | |
FNMA | | | | | 6.28 | | | | 11-1-2018 | | | | 535,136 | | | | 547,244 | |
FNMA | | | | | 6.50 | | | | 8-1-2031 | | | | 429,121 | | | | 503,818 | |
FNMA | | | | | 7.60 | | | | 8-1-2018 | | | | 196,710 | | | | 196,604 | |
FNMA | | | | | 8.00 | | | | 4-1-2017 | | | | 58,751 | | | | 60,625 | |
FNMA | | | | | 8.00 | | | | 9-1-2019 | | | | 30,707 | | | | 32,496 | |
FNMA | | | | | 8.00 | | | | 9-1-2023 | | | | 6,631 | | | | 7,054 | |
FNMA | | | | | 8.33 | | | | 7-15-2020 | | | | 22,960 | | | | 25,279 | |
FNMA | | | | | 8.50 | | | | 7-1-2018 | | | | 29,015 | | | | 30,659 | |
FNMA | | | | | 8.50 | | | | 2-1-2023 | | | | 27,717 | | | | 28,069 | |
FNMA | | | | | 9.00 | | | | 2-15-2020 | | | | 1,013 | | | | 1,163 | |
FNMA | | | | | 9.00 | | | | 11-1-2024 | | | | 89,540 | | | | 100,812 | |
FNMA | | | | | 11.00 | | | | 10-15-2020 | | | | 7,233 | | | | 7,410 | |
FNMA Grantor Trust Series 2002-T12 Class A4 | | | | | 9.50 | | | | 5-25-2042 | | | | 755,859 | | | | 941,915 | |
FNMA Series 1989-29 Class Z | | | | | 10.00 | | | | 6-25-2019 | | | | 72,380 | | | | 80,203 | |
FNMA Series 1989-63 Class Z | | | | | 9.40 | | | | 10-25-2019 | | | | 30,599 | | | | 32,968 | |
FNMA Series 2002-T1 Class A4 | | | | | 9.50 | | | | 11-25-2031 | | | | 63,772 | | | | 77,401 | |
FNMA Series 2003-15 Class CB | | | | | 5.00 | | | | 3-25-2018 | | | | 667,484 | | | | 691,084 | |
FNMA Series 2003-41 Class PE | | | | | 5.50 | | | | 5-25-2023 | | | | 1,090,208 | | | | 1,176,411 | |
FNMA Series 2003-W11 Class A1 ± | | | | | 3.46 | | | | 6-25-2033 | | | | 16,748 | | | | 17,548 | |
FNMA Series 2003-W6 Class 6A ± | | | | | 3.13 | | | | 8-25-2042 | | | | 1,218,543 | | | | 1,313,188 | |
FNMA Series 2003-W6 Class PT4 ± | | | | | 8.67 | | | | 10-25-2042 | | | | 103,762 | | | | 126,863 | |
FNMA Series 2004-32 Class AY | | | | | 4.00 | | | | 5-25-2019 | | | | 301,167 | | | | 311,378 | |
FNMA Series 2004-90 Class XY | | | | | 4.00 | | | | 9-25-2034 | | | | 735,546 | | | | 762,350 | |
FNMA Series 2006-48 Class TD | | | | | 5.50 | | | | 12-25-2034 | | | | 93,311 | | | | 93,632 | |
FNMA Series 2008-53 Class CA | | | | | 5.00 | | | | 7-25-2023 | | | | 848,783 | | | | 886,619 | |
FNMA Series 2009-M01 Class A2 | | | | | 4.29 | | | | 7-25-2019 | | | | 1,334,742 | | | | 1,445,791 | |
FNMA Series 2011-133 Class A | | | | | 3.50 | | | | 6-25-2029 | | | | 1,544,676 | | | | 1,603,652 | |
FNMA Series 2011-17 Class ED | | | | | 3.50 | | | | 7-25-2025 | | | | 384,620 | | | | 398,712 | |
FNMA Series 2011-39 Class CA | | | | | 3.00 | | | | 5-25-2024 | | | | 415,137 | | | | 425,295 | |
FNMA Series 2011-66 Class BE | | | | | 3.00 | | | | 3-25-2025 | | | | 852,700 | | | | 873,169 | |
FNMA Series 2011-71 Class DJ | | | | | 3.00 | | | | 3-25-2025 | | | | 1,675,168 | | | | 1,714,684 | |
FNMA Series G95-2 Class IO ±(c) | | | | | 10.00 | | | | 5-25-2020 | | | | 88,712 | | | | 4,876 | |
GNMA | | | | | 4.00 | | | | 8-16-2023 | | | | 516,761 | | | | 539,741 | |
GNMA | | | | | 4.50 | | | | 4-20-2035 | | | | 523,963 | | | | 552,896 | |
GNMA | | | | | 8.00 | | | | 12-15-2023 | | | | 31,082 | | | | 36,136 | |
GNMA | | | | | 9.00 | | | | 11-15-2017 | | | | 15,895 | | | | 16,495 | |
GNMA | | | | | 9.00 | | | | 11-15-2024 | | | | 21,088 | | | | 23,906 | |
GNMA | | | | | 10.00 | | | | 2-20-2018 | | | | 5,496 | | | | 5,735 | |
GNMA Series 2008-36 Class AN | | | | | 4.25 | | | | 10-16-2022 | | | | 431,838 | | | | 440,173 | |
GNMA Series 2008-36 Class NA | | | | | 4.25 | | | | 10-16-2022 | | | | 908,794 | | | | 926,071 | |
GNMA Series 2010-6 Class EA | | | | | 4.00 | | | | 9-16-2023 | | | | 592,498 | | | | 612,530 | |
The accompanying notes are an integral part of these financial statements.
| | | | | | |
| Portfolio of investments—August 31, 2015 | | Wells Fargo Advantage Short-Term Bond Fund | | | 11 | |
| | | | | | | | | | | | | | | | | | |
| Security name | | | | Interest rate | | | Maturity date | | | Principal | | | Value | |
| | | | | |
Agency Securities (continued) | | | | | | | | | | | | | | | | | | |
GNMA Series 2010-89 Class DG | | | | | 3.00 | % | | | 12-20-2035 | | | $ | 777,480 | | | $ | 783,903 | |
GNMA Series 2011-82 Class HT | | | | | 2.00 | | | | 7-16-2036 | | | | 261,521 | | | | 263,749 | |
GNMA Series 2012-19 Class A | | | | | 1.83 | | | | 3-16-2039 | | | | 4,095,874 | | | | 4,116,693 | |
| | | | | |
Total Agency Securities (Cost $72,068,506) | | | | | | | | | | | | | | | | | 72,828,599 | |
| | | | | | | | | | | | | | | | | | |
| | | | | |
Asset-Backed Securities: 10.45% | | | | | | | | | | | | | | | | | | |
Ally Auto Receivables Trust Series 2015-1 Class A2 | | | | | 0.92 | | | | 2-15-2018 | | | | 4,000,000 | | | | 4,000,604 | |
ASG Resecuritization Trust Series 2009-4 Class A60 144A | | | | | 6.00 | | | | 6-28-2037 | | | | 172,700 | | | | 173,808 | |
Carmax Auto Owner Trust Series 2015-3 Class A2A | | | | | 1.10 | | | | 11-15-2018 | | | | 3,000,000 | | | | 3,001,917 | |
Chase Issuance Trust Series 2012-A9 Class A9 ± | | | | | 0.35 | | | | 10-16-2017 | | | | 5,500,000 | | | | 5,500,000 | |
Citibank Credit Card Issuance Trust Series 2012-A1 Class A1 | | | | | 0.55 | | | | 10-10-2017 | | | | 3,000,000 | | | | 3,000,030 | |
Delta Air Lines Incorporated 2012-1 Series A Pass-Through Trust | | | | | 4.75 | | | | 11-7-2021 | | | | 2,495,131 | | | | 2,594,936 | |
Ford Credit Auto Lease Trust Series 2014-B Class A2A | | | | | 0.51 | | | | 3-15-2017 | | | | 2,359,280 | | | | 2,357,886 | |
GE Equipment Transportation LLC Series 2015-1 Class A2 | | | | | 0.89 | | | | 11-24-2017 | | | | 1,430,000 | | | | 1,430,877 | |
GM Financial Automobile Leasing Trust Series 2015-2 Class A2A | | | | | 1.18 | | | | 4-20-2018 | | | | 4,050,000 | | | | 4,057,173 | |
GMF Floorplan Owner Revolving Trust Series 2015-1
Class A1 144A | | | | | 1.65 | | | | 5-15-2020 | | | | 2,050,000 | | | | 2,036,948 | |
Home Equity Asset Trust Series 2003-6 Class M1 ± | | | | | 1.25 | | | | 2-25-2034 | | | | 1,408,946 | | | | 1,331,059 | |
Honda Auto Receivables Owner Trust Series 2014-3 Class A2 | | | | | 0.48 | | | | 12-15-2016 | | | | 1,439,284 | | | | 1,438,435 | |
Honda Auto Receivables Owner Trust Series 2015-3 Class A2 | | | | | 0.92 | | | | 11-20-2017 | | | | 3,280,000 | | | | 3,280,292 | |
Hyundai Auto Lease Securitization Trust Series 2014-A
Class A2 144A | | | | | 0.52 | | | | 7-15-2016 | | | | 170,051 | | | | 170,037 | |
Hyundai Auto Lease Securitization Trust Series 2015-B
Class A2A 144A | | | | | 0.95 | | | | 12-15-2017 | | | | 3,300,000 | | | | 3,302,729 | |
Hyundai Auto Receivables Trust Series 2013-B Class A3 | | | | | 0.71 | | | | 9-15-2017 | | | | 1,925,602 | | | | 1,925,910 | |
Leaf II Receivables Funding LLC Series 2015-1 Class A2 144A | | | | | 1.13 | | | | 3-15-2017 | | | | 1,400,000 | | | | 1,397,217 | |
Mercedes-Benz Auto Lease Trust Series 2014-A Class A2A | | | | | 0.48 | | | | 6-15-2016 | | | | 498,572 | | | | 498,557 | |
Mercedes-Benz Auto Receivables Series 2015-1 Class A2A | | | | | 0.82 | | | | 6-15-2018 | | | | 7,500,000 | | | | 7,481,453 | |
Nissan Auto Lease Trust Series 2014-B Class A2A | | | | | 0.73 | | | | 4-17-2017 | | | | 4,213,687 | | | | 4,213,611 | |
Susquehanna Auto Receivables Trust Series 2014-1A
Class A2 144A | | | | | 0.58 | | | | 10-17-2016 | | | | 639,696 | | | | 639,384 | |
US Airway 2010-1 Series B Pass-Through Trust | | | | | 8.50 | | | | 10-22-2018 | | | | 1,099,772 | | | | 1,176,756 | |
Volkswagen Auto Lease Trust Series 2015-A Class A2A | | | | | 0.87 | | | | 6-20-2017 | | | | 3,374,427 | | | | 3,374,106 | |
Volvo Financial Equipment LLC Series 2014-1A Class A2 144A | | | | | 0.54 | | | | 11-15-2016 | | | | 1,565,313 | | | | 1,564,845 | |
World Omni Automobile Lease Series 2015-A Class A2A | | | | | 1.06 | | | | 5-15-2018 | | | | 4,600,000 | | | | 4,598,542 | |
| |
Total Asset-Backed Securities (Cost $64,768,112) | | | | 64,547,112 | |
| | | | | |
| | | | | |
Corporate Bonds and Notes: 35.31% | | | | | | | | | | | | | | | | | | |
| | | | | |
Consumer Discretionary: 2.70% | | | | | | | | | | | | | | | | | | |
| | | | | |
| Automobiles: 0.48% | | | | | | | | | | | | | | | | | | |
Ford Motor Company | | | | | 6.50 | | | | 8-1-2018 | | | | 2,667,000 | | | | 2,971,374 | |
| | | | | | | | | | | | | | | | | | |
| | | | | |
| Media: 1.70% | | | | | | | | | | | | | | | | | | |
CCO Safari II LLC 144A | | | | | 3.58 | | | | 7-23-2020 | | | | 3,000,000 | | | | 2,990,640 | |
Cox Communications Incorporated | | | | | 5.50 | | | | 10-1-2015 | | | | 2,000,000 | | | | 2,007,528 | |
DIRECTV Holdings LLC | | | | | 2.40 | | | | 3-15-2017 | | | | 5,495,000 | | | | 5,530,981 | |
| |
| | | | 10,529,149 | |
| | | | | |
| | | | | |
| Specialty Retail: 0.52% | | | | | | | | | | | | | | | | | | |
International Game Technology | | | | | 7.50 | | | | 6-15-2019 | | | | 3,000,000 | | | | 3,210,000 | |
| | | | | |
The accompanying notes are an integral part of these financial statements.
| | | | |
| 12 | | Wells Fargo Advantage Short-Term Bond Fund | | Portfolio of investments—August 31, 2015 |
| | | | | | | | | | | | | | | | | | |
| Security name | | | | Interest rate | | | Maturity date | | | Principal | | | Value | |
| | | | | |
Consumer Staples: 1.31% | | | | | | | | | | | | | | | | | | |
| | | | | |
| Beverages: 0.17% | | | | | | | | | | | | | | | | | | |
Constellation Brands Incorporated | | | | | 7.25 | % | | | 9-1-2016 | | | $ | 1,000,000 | | | $ | 1,047,500 | |
| | | | | |
| | | | | |
| Food Products: 1.14% | | | | | | | | | | | | | | | | | | |
J.M. Smucker Company 144A | | | | | 1.75 | | | | 3-15-2018 | | | | 3,000,000 | | | | 2,995,929 | |
Kraft Heinz Foods Company 144A | | | | | 2.00 | | | | 7-2-2018 | | | | 2,000,000 | | | | 1,997,342 | |
Tyson Foods Incorporated | | | | | 6.60 | | | | 4-1-2016 | | | | 1,995,000 | | | | 2,057,434 | |
| |
| | | | 7,050,705 | |
| | | | | |
| | | | | |
Energy: 3.38% | | | | | | | | | | | | | | | | | | |
| | | | | |
| Energy Equipment & Services: 1.02% | | | | | | | | | | | | | | | | | | |
SESI LLC | | | | | 6.38 | | | | 5-1-2019 | | | | 3,000,000 | | | | 2,985,000 | |
Spectra Energy Capital Company | | | | | 6.20 | | | | 4-15-2018 | | | | 3,000,000 | | | | 3,281,499 | |
| |
| | | | 6,266,499 | |
| | | | | |
| | | | | |
| Oil, Gas & Consumable Fuels: 2.36% | | | | | | | | | | | | | | | | | | |
Boardwalk Pipelines LLC | | | | | 5.88 | | | | 11-15-2016 | | | | 1,000,000 | | | | 1,035,107 | |
DCP Midstream Operating Company | | | | | 2.50 | | | | 12-1-2017 | | | | 3,000,000 | | | | 2,834,481 | |
Enterprise Products Operating LLC | | | | | 5.25 | | | | 1-31-2020 | | | | 2,010,000 | | | | 2,207,472 | |
Kinder Morgan Incorporated | | | | | 3.05 | | | | 12-1-2019 | | | | 3,500,000 | | | | 3,442,086 | |
Pioneer Natural Resources Company | | | | | 5.88 | | | | 7-15-2016 | | | | 2,940,000 | | | | 3,048,677 | |
Weatherford Bermuda Company | | | | | 5.50 | | | | 2-15-2016 | | | | 2,000,000 | | | | 2,014,144 | |
| |
| | | | 14,581,967 | |
| | | | | |
| | | | | |
Financials: 16.15% | | | | | | | | | | | | | | | | | | |
| | | | | |
| Banks: 4.36% | | | | | | | | | | | | | | | | | | |
Associated Banc Corporation | | | | | 5.13 | | | | 3-28-2016 | | | | 2,000,000 | | | | 2,041,426 | |
Australia and New Zealand Banking Group Limited 144A | | | | | 2.40 | | | | 11-23-2016 | | | | 3,000,000 | | | | 3,050,574 | |
Bank of America Corporation | | | | | 6.50 | | | | 8-1-2016 | | | | 3,000,000 | | | | 3,140,997 | |
Citigroup Incorporated | | | | | 5.38 | | | | 8-9-2020 | | | | 2,000,000 | | | | 2,231,040 | |
JPMorgan Chase & Company | | | | | 2.25 | | | | 1-23-2020 | | | | 1,500,000 | | | | 1,480,451 | |
Merrill Lynch & Company Incorporated | | | | | 5.30 | | | | 9-30-2015 | | | | 1,400,000 | | | | 1,404,556 | |
PNC Bank NA | | | | | 1.50 | | | | 2-23-2018 | | | | 3,000,000 | | | | 2,975,547 | |
Santander Holdings USA | | | | | 4.63 | | | | 4-19-2016 | | | | 2,000,000 | | | | 2,043,712 | |
UBS AG | | | | | 5.88 | | | | 7-15-2016 | | | | 3,000,000 | | | | 3,109,458 | |
Union Bank NA | | | | | 5.95 | | | | 5-11-2016 | | | | 3,325,000 | | | | 3,430,137 | |
US Bancorp NA | | | | | 3.44 | | | | 2-1-2016 | | | | 2,000,000 | | | | 2,018,204 | |
| |
| | | | 26,926,102 | |
| | | | | |
| | | | | |
| Capital Markets: 2.27% | | | | | | | | | | | | | | | | | | |
Ameriprise Financial Incorporated | | | | | 5.65 | | | | 11-15-2015 | | | | 2,000,000 | | | | 2,020,308 | |
Bear Stearns Companies LLC | | | | | 5.55 | | | | 1-22-2017 | | | | 3,875,000 | | | | 4,076,089 | |
Goldman Sachs Group Incorporated | | | | | 6.15 | | | | 4-1-2018 | | | | 2,965,000 | | | | 3,267,406 | |
Lazard Group LLC | | | | | 6.85 | | | | 6-15-2017 | | | | 538,000 | | | | 582,317 | |
Morgan Stanley | | | | | 1.88 | | | | 1-5-2018 | | | | 2,045,000 | | | | 2,044,941 | |
Morgan Stanley | | | | | 2.20 | | | | 12-7-2018 | | | | 2,000,000 | | | | 2,008,184 | |
| |
| | | | 13,999,245 | |
| | | | | |
The accompanying notes are an integral part of these financial statements.
| | | | | | |
| Portfolio of investments—August 31, 2015 | | Wells Fargo Advantage Short-Term Bond Fund | | | 13 | |
| | | | | | | | | | | | | | | | | | |
| Security name | | | | Interest rate | | | Maturity date | | | Principal | | | Value | |
| | | | | |
| Consumer Finance: 3.56% | | | | | | | | | | | | | | | | | | |
Daimler Finance NA LLC 144A | | | | | 1.65 | % | | | 3-2-2018 | | | $ | 3,000,000 | | | $ | 2,978,997 | |
Discover Financial Services Company | | | | | 6.45 | | | | 6-12-2017 | | | | 3,000,000 | | | | 3,244,713 | |
Ford Motor Credit Company | | | | | 5.63 | | | | 9-15-2015 | | | | 1,000,000 | | | | 1,001,569 | |
General Motors Financial Company | | | | | 3.15 | | | | 1-15-2020 | | | | 3,000,000 | | | | 2,962,137 | |
Harley-Davidson Financial Services Incorporated 144A | | | | | 2.70 | | | | 3-15-2017 | | | | 3,000,000 | | | | 3,060,690 | |
Murray Street Investment Trust I | | | | | 4.65 | | | | 3-9-2017 | | | | 4,000,000 | | | | 4,167,076 | |
Navient Corporation | | | | | 3.88 | | | | 9-10-2015 | | | | 1,500,000 | | | | 1,492,500 | |
Toll Brothers Finance Corporation | | | | | 8.91 | | | | 10-15-2017 | | | | 2,710,000 | | | | 3,055,525 | |
| |
| | | | 21,963,207 | |
| | | | | |
| | | | | |
| Diversified Financial Services: 1.92% | | | | | | | | | | | | | | | | | | |
McGraw Hill Financial Incorporated 144A | | | | | 2.50 | | | | 8-15-2018 | | | | 550,000 | | | | 552,853 | |
McGraw Hill Financial Incorporated | | | | | 5.90 | | | | 11-15-2017 | | | | 3,500,000 | | | | 3,792,670 | |
Moody’s Corporation | | | | | 2.75 | | | | 7-15-2019 | | | | 3,000,000 | | | | 3,036,252 | |
Raymond James Financial Incorporated | | | | | 4.25 | | | | 4-15-2016 | | | | 2,000,000 | | | | 2,039,056 | |
Toll Road Investors Partnership II LP 144A¤ | | | | | 0.00 | | | | 2-15-2016 | | | | 2,500,000 | | | | 2,450,855 | |
| |
| | | | 11,871,686 | |
| | | | | |
| | | | | |
| Insurance: 2.92% | | | | | | | | | | | | | | | | | | |
Genworth Financial Incorporated | | | | | 8.63 | | | | 12-15-2016 | | | | 2,000,000 | | | | 2,112,500 | |
Lincoln National Corporation | | | | | 8.75 | | | | 7-1-2019 | | | | 2,426,000 | | | | 2,970,693 | |
MetLife Insurance Company 144A | | | | | 7.70 | | | | 11-1-2015 | | | | 3,000,000 | | | | 3,030,525 | |
Platinum Underwriters Finance Incorporated Series B | | | | | 7.50 | | | | 6-1-2017 | | | | 3,070,000 | | | | 3,335,331 | |
Reliance Standard 144A | | | | | 2.38 | | | | 5-4-2020 | | | | 2,000,000 | | | | 1,972,164 | |
Symetra Financial Corporation 144A | | | | | 6.13 | | | | 4-1-2016 | | | | 3,000,000 | | | | 3,075,204 | |
Unum Group 144A | | | | | 6.85 | | | | 11-15-2015 | | | | 1,533,000 | | | | 1,550,824 | |
| |
| | | | 18,047,241 | |
| | | | | |
| | | | | |
| REITs: 1.12% | | | | | | | | | | | | | | | | | | |
American Tower Corporation | | | | | 4.50 | | | | 1-15-2018 | | | | 2,700,000 | | | | 2,833,007 | |
ARC Properties Operating Partnership LP | | | | | 2.00 | | | | 2-6-2017 | | | | 1,085,000 | | | | 1,059,231 | |
Realty Income Corporation | | | | | 2.00 | | | | 1-31-2018 | | | | 3,000,000 | | | | 3,018,876 | |
| | | | | |
| | | | | | | | | | | | | | | | | 6,911,114 | |
| | | | | | | | | | | | | | | | | | |
| | | | | |
Health Care: 1.66% | | | | | | | | | | | | | | | | | | |
| | | | | |
| Biotechnology: 1.00% | | | | | | | | | | | | | | | | | | |
Biogen Idec Incorporated | | | | | 6.88 | | | | 3-1-2018 | | | | 3,262,000 | | | | 3,655,707 | |
Celgene Corporation | | | | | 2.13 | | | | 8-15-2018 | | | | 2,500,000 | | | | 2,500,438 | |
| | | | | |
| | | | | | | | | | | | | | | | | 6,156,145 | |
| | | | | | | | | | | | | | | | | | |
| | | | | |
| Health Care Equipment & Supplies: 0.22% | | | | | | | | | | | | | | | | | | |
Zimmer Holdings Incorporated | | | | | 1.45 | | | | 4-1-2017 | | | | 1,370,000 | | | | 1,365,995 | |
| | | | | | | | | | | | | | | | | | |
| | | | | |
| Health Care Providers & Services: 0.44% | | | | | | | | | | | | | | | | | | |
UnitedHealth Group Incorporated | | | | | 1.45 | | | | 7-17-2017 | | | | 1,375,000 | | | | 1,376,048 | |
UnitedHealth Group Incorporated | | | | | 1.90 | | | | 7-16-2018 | | | | 1,375,000 | | | | 1,378,560 | |
| | | | | |
| | | | | | | | | | | | | | | | | 2,754,608 | |
| | | | | | | | | | | | | | | | | | |
The accompanying notes are an integral part of these financial statements.
| | | | |
| 14 | | Wells Fargo Advantage Short-Term Bond Fund | | Portfolio of investments—August 31, 2015 |
| | | | | | | | | | | | | | | | | | |
| Security name | | | | Interest rate | | | Maturity date | | | Principal | | | Value | |
| | | | | |
Industrials: 2.54% | | | | | | | | | | | | | | | | | | |
| | | | | |
| Aerospace & Defense: 0.52% | | | | | | | | | | | | | | | | | | |
L-3 Communications Corporation | | | | | 5.20 | % | | | 10-15-2019 | | | $ | 3,000,000 | | | $ | 3,210,849 | |
| | | | | | | | | | | | | | | | | | |
| | | | | |
| Building Products: 0.02% | | | | | | | | | | | | | | | | | | |
Owens Corning Incorporated | | | | | 6.50 | | | | 12-1-2016 | | | | 148,000 | | | | 156,276 | |
| | | | | | | | | | | | | | | | | | |
| | | | | |
| Commercial Services & Supplies: 0.37% | | | | | | | | | | | | | | | | | | |
Boardwalk Pipelines LLC | | | | | 5.20 | | | | 6-1-2018 | | | | 2,179,000 | | | | 2,258,799 | |
| | | | | | | | | | | | | | | | | | |
| | | | | |
| Machinery: 1.03% | | | | | | | | | | | | | | | | | | |
CNH Capital LLC | | | | | 3.25 | | | | 2-1-2017 | | | | 1,760,000 | | | | 1,749,000 | |
CNH Capital LLC | | | | | 3.88 | | | | 11-1-2015 | | | | 1,145,000 | | | | 1,145,000 | |
SPX Corporation | | | | | 6.88 | | | | 9-1-2017 | | | | 3,250,000 | | | | 3,461,250 | |
| | | | | |
| | | | | | | | | | | | | | | | | 6,355,250 | |
| | | | | | | | | | | | | | | | | | |
| | | | | |
| Road & Rail: 0.60% | | | | | | | | | | | | | | | | | | |
JB Hunt Transportation Services Company | | | | | 3.38 | | | | 9-15-2015 | | | | 3,700,000 | | | | 3,703,563 | |
| | | | | | | | | | | | | | | | | | |
| | | | | |
Information Technology: 1.80% | | | | | | | | | | | | | | | | | | |
| | | | | |
| IT Services: 0.44% | | | | | | | | | | | | | | | | | | |
The Western Union Company | | | | | 2.38 | | | | 12-10-2015 | | | | 2,700,000 | | | | 2,708,718 | |
| | | | | | | | | | | | | | | | | | |
| | | | | |
| Semiconductors & Semiconductor Equipment: 0.55% | | | | | | | | | | | | | | | | | | |
KLA-Tencor Corporation | | | | | 2.38 | | | | 11-1-2017 | | | | 1,365,000 | | | | 1,373,810 | |
KLA-Tencor Corporation | | | | | 3.38 | | | | 11-1-2019 | | | | 2,000,000 | | | | 2,042,596 | |
| | | | | |
| | | | | | | | | | | | | | | | | 3,416,406 | |
| | | | | | | | | | | | | | | | | | |
| | | | | |
| Software: 0.81% | | | | | | | | | | | | | | | | | | |
CA Incorporated | | | | | 3.60 | | | | 8-1-2020 | | | | 2,000,000 | | | | 2,004,548 | |
Fidelity National Information Services Incorporated | | | | | 2.00 | | | | 4-15-2018 | | | | 2,000,000 | | | | 1,964,990 | |
Symantec Corporation | | | | | 2.75 | | | | 9-15-2015 | | | | 1,000,000 | | | | 1,000,389 | |
| | | | | |
| | | | | | | | | | | | | | | | | 4,969,927 | |
| | | | | | | | | | | | | | | | | | |
| | | | | |
Materials: 1.02% | | | | | | | | | | | | | | | | | | |
| | | | | |
| Construction Materials: 0.53% | | | | | | | | | | | | | | | | | | |
Martin Marietta Material ± | | | | | 1.38 | | | | 6-30-2017 | | | | 3,310,000 | | | | 3,287,859 | |
| | | | | | | | | | | | | | | | | | |
| | | | | |
| Metals & Mining: 0.49% | | | | | | | | | | | | | | | | | | |
Glencore Funding LLC 144A | | | | | 1.70 | | | | 5-27-2016 | | | | 3,000,000 | | | | 2,991,849 | |
| | | | | | | | | | | | | | | | | | |
| | | | | |
Telecommunication Services: 2.16% | | | | | | | | | | | | | | | | | | |
| | | | | |
| Diversified Telecommunication Services: 2.16% | | | | | | | | | | | | | | | | | | |
AT&T Incorporated | | | | | 2.45 | | | | 6-30-2020 | | | | 1,000,000 | | | | 990,562 | |
Clearwire Communications LLC 144A | | | | | 14.75 | | | | 12-1-2016 | | | | 2,710,000 | | | | 3,089,400 | |
Crown Castle Towers LLC 144A | | | | | 5.50 | | | | 1-15-2037 | | | | 2,695,000 | | | | 2,770,948 | |
Verizon Communications Incorporated | | | | | 1.35 | | | | 6-9-2017 | | | | 6,479,000 | | | | 6,457,850 | |
| | | | | |
| | | | | | | | | | | | | | | | | 13,308,760 | |
| | | | | | | | | | | | | | | | | | |
The accompanying notes are an integral part of these financial statements.
| | | | | | |
| Portfolio of investments—August 31, 2015 | | Wells Fargo Advantage Short-Term Bond Fund | | | 15 | |
| | | | | | | | | | | | | | | | | | |
| Security name | | | | Interest rate | | | Maturity date | | | Principal | | | Value | |
| | | | | |
Utilities: 2.59% | | | | | | | | | | | | | | | | | | |
| | | | | |
| Electric Utilities: 2.59% | | | | | | | | | | | | | | | | | | |
Dayton Power & Light Company | | | | | 1.88 | % | | | 9-15-2016 | | | $ | 4,000,000 | | | $ | 4,006,572 | |
FPL Group Capital Incorporated | | | | | 2.60 | | | | 9-1-2015 | | | | 3,000,000 | | | | 3,000,000 | |
Monongahela Power Company 144A | | | | | 5.70 | | | | 3-15-2017 | | | | 3,000,000 | | | | 3,173,643 | |
NextEra Energy Capital Holdings Incorporated | | | | | 2.06 | | | | 9-1-2017 | | | | 2,725,000 | | | | 2,732,739 | |
Progress Energy Incorporated | | | | | 5.63 | | | | 1-15-2016 | | | | 3,000,000 | | | | 3,051,627 | |
| | | | | |
| | | | | | | | | | | | | | | | | 15,964,581 | |
| | | | | | | | | | | | | | | | | | |
| | | | | |
Total Corporate Bonds and Notes (Cost $218,840,093) | | | | | | | | | | | | | | | | | 217,985,374 | |
| | | | | | | | | | | | | | | | | | |
| | | | | |
Municipal Obligations: 4.08% | | | | | | | | | | | | | | | | | | |
| | | | | |
| California: 1.03% | | | | | | | | | | | | | | | | | | |
California Public Works Board Lease Series E (Miscellaneous Revenue) | | | | | 3.68 | | | | 12-1-2015 | | | | 2,960,000 | | | | 2,979,743 | |
San Bernardino County CA Financing Authority (Miscellaneous Revenue, National Insured) ¤ | | | | | 0.00 | | | | 8-1-2017 | | | | 3,500,000 | | | | 3,366,265 | |
| | | | | |
| | | | | | | | | | | | | | | | | 6,346,008 | |
| | | | | | | | | | | | | | | | | | |
| | | | | |
| Florida: 0.23% | | | | | | | | | | | | | | | | | | |
Village Center Florida Community Development District Utility (Water & Sewer Revenue) 144A | | | | | 1.60 | | | | 10-1-2016 | | | | 1,445,000 | | | | 1,443,179 | |
| | | | | | | | | | | | | | | | | | |
| | | | | |
| Illinois: 0.30% | | | | | | | | | | | | | | | | | | |
Chicago IL (Tax Revenue) | | | | | 6.30 | | | | 12-1-2021 | | | | 1,800,000 | | | | 1,865,538 | |
| | | | | | | | | | | | | | | | | | |
| | | | | |
| Michigan: 0.32% | | | | | | | | | | | | | | | | | | |
Michigan Finance Authority Series D5 (Water & Sewer Revenue) | | | | | 2.85 | | | | 7-1-2019 | | | | 2,000,000 | | | | 1,973,460 | |
| | | | | | | | | | | | | | | | | | |
| | | | | |
| New Jersey: 0.95% | | | | | | | | | | | | | | | | | | |
New Jersey EDA Series B (Miscellaneous Revenue, AGM Insured) ¤ | | | | | 0.00 | | | | 2-15-2018 | | | | 3,000,000 | | | | 2,785,440 | |
New Jersey EDA Series B (Lease Revenue, AGM Insured) ¤ | | | | | 0.00 | | | | 2-15-2019 | | | | 3,500,000 | | | | 3,101,385 | |
| | | | | |
| | | | | | | | | | | | | | | | | 5,886,825 | |
| | | | | | | | | | | | | | | | | | |
| | | | | |
| Oregon: 0.52% | | | | | | | | | | | | | | | | | | |
Portland OR Taxable Pension (GO Revenue) ±(m)(n) | | | | | 0.23 | | | | 6-1-2019 | | | | 3,350,000 | | | | 3,203,438 | |
| | | | | | | | | | | | | | | | | | |
| | | | | |
| Texas: 0.73% | | | | | | | | | | | | | | | | | | |
Port Arthur TX Navigation District Motiva Enterprises Project (Industrial Development Revenue) ø | | | | | 0.30 | | | | 11-1-2040 | | | | 4,500,000 | | | | 4,500,000 | |
| | | | | | | | | | | | | | | | | | |
| |
Total Municipal Obligations (Cost $25,250,303) | | | | 25,218,448 | |
| | | | | | | | | | | | | | | | | | |
| | | | | |
Non-Agency Mortgage-Backed Securities: 10.17% | | | | | | | | | | | | | | | | | | |
Bank of America Mortgage Securities Series 2002-K Class 3A1 ± | | | | | 2.63 | | | | 10-20-2032 | | | | 20,318 | | | | 20,462 | |
Bear Stearns Commercial Mortgage Securities Incorporated Series 2005-T20 Class A4A ± | | | | | 5.26 | | | | 10-12-2042 | | | | 28,621 | | | | 28,591 | |
CNH Equipment Trust Series 2014-A Class A2 | | | | | 0.49 | | | | 6-15-2017 | | | | 641,722 | | | | 641,396 | |
CNH Equipment Trust Series 2015-C Class A2A | | | | | 1.10 | | | | 12-17-2018 | | | | 4,400,000 | | | | 4,402,028 | |
The accompanying notes are an integral part of these financial statements.
| | | | |
| 16 | | Wells Fargo Advantage Short-Term Bond Fund | | Portfolio of investments—August 31, 2015 |
| | | | | | | | | | | | | | | | | | |
| Security name | | | | Interest rate | | | Maturity date | | | Principal | | | Value | |
| | | | | |
Non-Agency Mortgage-Backed Securities (continued) | | | | | | | | | | | | | | | | | | |
Commercial Mortgage Trust Series 2010-C1 Class A1 144A | | | | | 3.16 | % | | | 7-10-2046 | | | $ | 689,097 | | | $ | 688,735 | |
Commercial Mortgage Trust Series 2012-CR2 Class A1 | | | | | 0.82 | | | | 8-15-2045 | | | | 1,200,712 | | | | 1,197,242 | |
Commercial Mortgage Trust Series 2013-FL3 Class B 144A± | | | | | 2.35 | | | | 10-13-2028 | | | | 3,000,000 | | | | 2,988,885 | |
Commercial Mortgage Trust Series 2014-BBG Class A 144A± | | | | | 1.00 | | | | 3-15-2029 | | | | 2,100,000 | | | | 2,088,200 | |
ContiMortgage Home Equity Trust Series 1996-2 ±(c)(i) | | | | | 6.97 | | | | 7-15-2027 | | | | 820,871 | | | | 17,073 | |
Countrywide Home Loans Mortgage Pass-Through Trust Series 2001-HYB1 Class 2A1 ± | | | | | 2.00 | | | | 6-19-2031 | | | | 305,637 | | | | 276,286 | |
Credit Suisse Mortgage Capital Certificates Series 2006-C5 Class A3 | | | | | 5.31 | | | | 12-15-2039 | | | | 1,178,141 | | | | 1,209,548 | |
Drexel Burnham Lambert CMO Trust Series T Class 4 | | | | | 8.45 | | | | 9-20-2019 | | | | 48,083 | | | | 50,377 | |
EquiFirst Mortgage Loan Trust Series 2003-2 Class 3A3 ± | | | | | 1.32 | | | | 9-25-2033 | | | | 531,499 | | | | 508,881 | |
Equity Mortgage Trust Series 2014-INNS Class A 144A± | | | | | 1.04 | | | | 5-8-2031 | | | | 3,059,884 | | | | 3,038,192 | |
FedEx Corporation 1998 Series 981C Pass-Through Certificates | | | | | 7.02 | | | | 1-15-2016 | | | | 605,317 | | | | 620,450 | |
Golden National Mortgage Asset-Backed Certificates Series 1998-GN1 Class M2 (i)(s) | | | �� | | 8.02 | | | | 2-25-2027 | | | | 34,322 | | | | 34,294 | |
Greenwich Capital Commercial Funding Corporation Series 2007-GG9 Class A4 | | | | | 5.44 | | | | 3-10-2039 | | | | 2,651,572 | | | | 2,766,900 | |
GS Mortgage Securities Trust Series 2014-GSFL Class A 144A± | | | | | 1.20 | | | | 7-15-2031 | | | | 2,459,841 | | | | 2,452,555 | |
GSMPS Mortgage Loan Trust Series 1998-1 Class A 144A± | | | | | 8.00 | | | | 9-19-2027 | | | | 290,404 | | | | 296,332 | |
GSMPS Mortgage Loan Trust Series 2006-RP2 Class 1AF1 144A± | | | | | 0.60 | | | | 4-25-2036 | | | | 1,102,666 | | | | 921,729 | |
JPMorgan Chase Commercial Mortgage Securities Corporation Series 2006-CB16 Class A4 | | | | | 5.55 | | | | 5-12-2045 | | | | 969,954 | | | | 986,393 | |
JPMorgan Chase Commercial Mortgage Securities Corporation Series 2007-CB18 Class A4 | | | | | 5.44 | | | | 6-12-2047 | | | | 2,645,145 | | | | 2,752,892 | |
JPMorgan Chase Commercial Mortgage Securities Corporation Series 2014-INN Class A 144A± | | | | | 1.12 | | | | 6-15-2029 | | | | 5,000,000 | | | | 4,986,235 | |
JPMorgan Chase Commercial Mortgage Securities Corporation Series 2014-PHH Class A 144A± | | | | | 1.39 | | | | 8-15-2027 | | | | 3,000,000 | | | | 3,005,979 | |
JPMorgan Chase Commercial Mortgage Securities Corporation Series 2015-CSMO Class A 144A± | | | | | 1.44 | | | | 1-15-2032 | | | | 3,300,000 | | | | 3,288,599 | |
JPMorgan Chase Commercial Mortgage Securities Corporation Series 2015-FL7 Class A 144A± | | | | | 1.44 | | | | 5-15-2028 | | | | 2,446,867 | | | | 2,446,571 | |
JPMorgan Chase Commercial Mortgage Securities Trust Series 2005-LDP5 Class A4 ± | | | | | 5.41 | | | | 12-15-2044 | | | | 1,072,983 | | | | 1,071,717 | |
JPMorgan Chase Commercial Mortgage Trust Series 2007-LDPX Class AM ± | | | | | 5.46 | | | | 1-15-2049 | | | | 3,300,000 | | | | 3,388,358 | |
Lehman Brothers UBS Commercial Mortgage Trust Series 2007-C6 Class A4 ± | | | | | 5.86 | | | | 7-15-2040 | | | | 2,754,891 | | | | 2,872,103 | |
Macquarie Equipment Funding Trust Series 2014-A Class A2 144A | | | | | 0.80 | | | | 11-21-2016 | | | | 2,997,694 | | | | 2,998,714 | |
Master Mortgages Trust Series 2002-3 Class 4A1 ± | | | | | 2.63 | | | | 10-25-2032 | | | | 9,166 | | | | 9,159 | |
Morgan Stanley Capital I Series 2006-HQ8 Class A4 ± | | | | | 5.58 | | | | 3-12-2044 | | | | 1,657,420 | | | | 1,660,396 | |
Morgan Stanley Capital I Series 2007-IQ Class A4 | | | | | 5.81 | | | | 12-12-2049 | | | | 2,528,722 | | | | 2,693,674 | |
NCUA Guaranteed Notes Program Series 2010-C1 Class A2 | | | | | 2.90 | | | | 10-29-2020 | | | | 913,625 | | | | 919,904 | |
NCUA Guaranteed Notes Program Series 2010-C1 Class APT | | | | | 2.65 | | | | 10-29-2020 | | | | 1,757,193 | | | | 1,764,287 | |
Nomura Asset Acceptance Corporation Series 2005-AR1 Class 1A1 ± | | | | | 2.48 | | | | 2-25-2035 | | | | 501,874 | | | | 500,655 | |
SBA Tower Trust Series 2014-1A Class C 144A | | | | | 2.90 | | | | 10-15-2044 | | | | 3,000,000 | | | | 2,984,232 | |
Structured Mortgage Asset Residential Trust Series 1992-5B Class BO ¤(i) | | | | | 0.00 | | | | 6-25-2023 | | | | 6,734 | | | | 6,565 | |
Wilshire Funding Corporation Series 1996-3 Class M2 ± | | | | | 7.15 | | | | 8-25-2032 | | | | 86,024 | | | | 84,311 | |
Wilshire Funding Corporation Series 1996-3 Class M3 ± | | | | | 7.15 | | | | 8-25-2032 | | | | 87,621 | | | | 84,419 | |
Wilshire Funding Corporation Series 1998-2 Class M1 ± | | | | | 2.00 | | | | 12-28-2037 | | | | 29,932 | | | | 29,325 | |
| |
Total Non-Agency Mortgage-Backed Securities (Cost $63,350,532) | | | | 62,782,644 | |
| | | | | |
The accompanying notes are an integral part of these financial statements.
| | | | | | |
| Portfolio of investments—August 31, 2015 | | Wells Fargo Advantage Short-Term Bond Fund | | | 17 | |
| | | | | | | | | | | | | | | | | | |
| Security name | | | | Dividend yield | | | | | | Shares | | | Value | |
| | | | | |
Preferred Stocks: 0.24% | | | | | | | | | | | | | | | | | | |
| | | | | |
Financials: 0.24% | | | | | | | | | | | | | | | | | | |
| | | | | |
| Banks: 0.24% | | | | | | | | | | | | | | | | | | |
Huntington Bancshares ±(a)(i) | | | | | 3.92 | % | | | | | | | 80,000 | | | $ | 1,503,402 | |
| | | | | |
| |
Total Preferred Stocks (Cost $1,958,484) | | | | 1,503,402 | |
| | | | | |
| | | | | |
| | | | | Interest rate | | | Maturity date | | | Principal | | | | |
| | | | | |
U.S. Treasury Securities: 1.22% | | | | | | | | | | | | | | | | | | |
U.S. Treasury Note | | | | | 1.38 | | | | 2-28-2019 | | | $ | 4,530,000 | | | | 4,548,048 | |
U.S. Treasury Note | | | | | 1.38 | | | | 4-30-2020 | | | | 2,985,000 | | | | 2,966,421 | |
| |
Total U.S. Treasury Securities (Cost $7,469,714) | | | | 7,514,469 | |
| | | | | |
| | | | | |
Yankee Corporate Bonds and Notes: 14.91% | | | | | | | | | | | | | | | | | | |
| | | | | |
Consumer Discretionary: 1.08% | | | | | | | | | | | | | | | | | | |
| | | | | |
| Media: 0.50% | | | | | | | | | | | | | | | | | | |
British Sky Broadcasting Group plc 144A | | | | | 6.10 | | | | 2-15-2018 | | | | 2,838,000 | | | | 3,096,400 | |
| | | | | |
| | | | | |
| Specialty Retail: 0.58% | | | | | | | | | | | | | | | | | | |
Seagate HDD Cayman Company | | | | | 3.75 | | | | 11-15-2018 | | | | 3,500,000 | | | | 3,597,990 | |
| | | | | |
| | | | | |
Consumer Staples: 0.57% | | | | | | | | | | | | | | | | | | |
| | | | | |
| Food & Staples Retailing: 0.57% | | | | | | | | | | | | | | | | | | |
Tesco plc 144A | | | | | 2.70 | | | | 1-5-2017 | | | | 3,470,000 | | | | 3,492,312 | |
| | | | | |
| | | | | |
Energy: 2.29% | | | | | | | | | | | | | | | | | | |
| | | | | |
| Energy Equipment & Services: 0.45% | | | | | | | | | | | | | | | | | | |
Noble Corporation | | | | | 4.00 | | | | 3-16-2018 | | | | 2,800,000 | | | | 2,764,888 | |
| | | | | |
| | | | | |
| Oil, Gas & Consumable Fuels: 1.84% | | | | | | | | | | | | | | | | | | |
Ecopetrol SA | | | | | 4.25 | | | | 9-18-2018 | | | | 3,000,000 | | | | 3,084,150 | |
Korea National Oil Corporation 144A | | | | | 2.75 | | | | 1-23-2019 | | | | 3,000,000 | | | | 3,041,154 | |
Petrobras Global Finance Company | | | | | 3.25 | | | | 3-17-2017 | | | | 2,065,000 | | | | 1,978,477 | |
Transocean Incorporated | | | | | 5.55 | | | | 12-15-2016 | | | | 3,235,000 | | | | 3,243,896 | |
| |
| | | | 11,347,677 | |
| | | | | |
| | | | | |
Financials: 9.18% | | | | | | | | | | | | | | | | | | |
| | | | | |
| Banks: 5.99% | | | | | | | | | | | | | | | | | | |
Abbey National Treasury Services plc | | | | | 2.38 | | | | 3-16-2020 | | | | 3,000,000 | | | | 2,986,392 | |
Bank of Nova Scotia 144A | | | | | 1.65 | | | | 10-29-2015 | | | | 3,430,000 | | | | 3,435,728 | |
Banque Federative du Credit Mutuel SA 144A | | | | | 1.70 | | | | 1-20-2017 | | | | 2,850,000 | | | | 2,859,773 | |
BPCE SA | | | | | 1.61 | | | | 7-25-2017 | | | | 3,000,000 | | | | 3,008,472 | |
Canadian Imperial Bank 144A | | | | | 2.75 | | | | 1-27-2016 | | | | 3,000,000 | | | | 3,025,947 | |
Corporacion Andina De Fomento | | | | | 3.75 | | | | 1-15-2016 | | | | 3,385,000 | | | | 3,418,725 | |
Experian Finance plc 144A | | | | | 2.38 | | | | 6-15-2017 | | | | 3,800,000 | | | | 3,822,355 | |
HBOS plc 144A | | | | | 6.75 | | | | 5-21-2018 | | | | 2,000,000 | | | | 2,206,678 | |
ING Bank NV 144A | | | | | 1.80 | | | | 3-16-2018 | | | | 3,000,000 | | | | 2,991,978 | |
Lloyds Bank plc | | | | | 2.00 | | | | 8-17-2018 | | | | 1,000,000 | | | | 999,343 | |
The accompanying notes are an integral part of these financial statements.
| | | | |
| 18 | | Wells Fargo Advantage Short-Term Bond Fund | | Portfolio of investments—August 31, 2015 |
| | | | | | | | | | | | | | | | | | |
| Security name | | | | Interest rate | | | Maturity date | | | Principal | | | Value | |
| | | | | |
| Banks (continued) | | | | | | | | | | | | | | | | | | |
Macquarie Bank Limited 144A« | | | | | 2.85 | % | | | 7-29-2020 | | | $ | 3,000,000 | | | $ | 3,022,815 | |
Swedbank Hypotek 144A | | | | | 2.13 | | | | 8-31-2016 | | | | 3,000,000 | | | | 3,037,257 | |
Westpac Banking Corporation 144A | | | | | 5.30 | | | | 10-15-2015 | | | | 2,150,000 | | | | 2,162,242 | |
| | | | | |
| | | | | | | | | | | | | | | | | 36,977,705 | |
| | | | | | | | | | | | | | | | | | |
| | | | | |
| Diversified Financial Services: 0.75% | | | | | | | | | | | | | | | | | | |
Credit Suisse New York | | | | | 6.00 | | | | 2-15-2018 | | | | 1,500,000 | | | | 1,632,300 | |
Shell International Finance BV | | | | | 2.13 | | | | 5-11-2020 | | | | 3,000,000 | | | | 2,978,715 | |
| | | | | |
| | | | | | | | | | | | | | | | | 4,611,015 | |
| | | | | | | | | | | | | | | | | | |
| | | | | |
| Insurance: 1.46% | | | | | | | | | | | | | | | | | | |
Allied World Assurance Company | | | | | 7.50 | | | | 8-1-2016 | | | | 3,000,000 | | | | 3,159,921 | |
Endurance Specialty Holdings Limited | | | | | 6.15 | | | | 10-15-2015 | | | | 2,850,000 | | | | 2,866,781 | |
QBE Insurance Group Limited 144A | | | | | 2.40 | | | | 5-1-2018 | | | | 2,985,000 | | | | 3,004,883 | |
| | | | | |
| | | | | | | | | | | | | | | | | 9,031,585 | |
| | | | | | | | | | | | | | | | | | |
| | | | | |
| Real Estate Management & Development: 0.98% | | | | | | | | | | | | | | | | | | |
Deutsche Annington Finance BV 144A | | | | | 3.20 | | | | 10-2-2017 | | | | 4,000,000 | | | | 4,064,148 | |
Korea Land & Housing Corporation 144A | | | | | 1.88 | | | | 8-2-2017 | | | | 2,000,000 | | | | 2,004,408 | |
| | | | | |
| | | | | | | | | | | | | | | | | 6,068,556 | |
| | | | | | | | | | | | | | | | | | |
| | | | | |
Health Care: 0.48% | | | | | | | | | | | | | | | | | | |
| | | | | |
| Pharmaceuticals: 0.48% | | | | | | | | | | | | | | | | | | |
Perrigo Company plc | | | | | 1.30 | | | | 11-8-2016 | | | | 3,000,000 | | | | 2,981,754 | |
| | | | | | | | | | | | | | | | | | |
| | | | | |
Information Technology: 0.48% | | | | | | | | | | | | | | | | | | |
| | | | | |
| Semiconductors & Semiconductor Equipment: 0.48% | | | | | | | | | | | | | | | | | | |
TSMC Global Limited 144A | | | | | 1.63 | | | | 4-3-2018 | | | | 3,035,000 | | | | 2,988,971 | |
| | | | | | | | | | | | | | | | | | |
| | | | | |
Telecommunication Services: 0.33% | | | | | | | | | | | | | | | | | | |
| | | | | |
| Wireless Telecommunication Services: 0.33% | | | | | | | | | | | | | | | | | | |
Telefonica Moviles Chile SA 144A | | | | | 2.88 | | | | 11-9-2015 | | | | 2,000,000 | | | | 2,004,638 | |
| | | | | | | | | | | | | | | | | | |
| | | | | |
Utilities: 0.50% | | | | | | | | | | | | | | | | | | |
| | | | | |
| Multi-Utilities: 0.50% | | | | | | | | | | | | | | | | | | |
Korea Western Power Company 144A | | | | | 3.13 | | | | 5-10-2017 | | | | 3,000,000 | | | | 3,066,930 | |
| | | | | | | | | | | | | | | | | | |
| | | |
Total Yankee Corporate Bonds and Notes (Cost $92,110,089) | | | | | | | | | | | | 92,030,421 | |
| | | | | | | | | | | | | | | | | | |
| | | | | |
| | | | | Yield | | | | | | Shares | | | | |
| Short-Term Investments: 11.79% | | | | | | | | | | | | | | | | | | |
| | | | | |
| Investment Companies: 11.69% | | | | | | | | | | | | | | | | | | |
Securities Lending Cash Investments, LLC (l)(r)(u) | | | | | 0.15 | | | | | | | | 2,921,975 | | | | 2,921,975 | |
Wells Fargo Advantage Cash Investment Money Market Fund, Select Class (l)(u) | | | | | 0.15 | | | | | | | | 69,257,438 | | | | 69,257,438 | |
| | | | | |
| | | | | | | | | | | | | | | | | 72,179,413 | |
| | | | | | | | | | | | | | | | | | |
The accompanying notes are an integral part of these financial statements.
| | | | | | |
| Portfolio of investments—August 31, 2015 | | Wells Fargo Advantage Short-Term Bond Fund | | | 19 | |
| | | | | | | | | | | | | | | | | | |
| Security name | | | | Interest rate | | | Maturity date | | | Principal | | | Value | |
| U.S. Treasury Securities: 0.10% | | | | | | | | | | | | | | | | | | |
U.S. Treasury Bill #(z) | | | | | 0.03 | % | | | 9-17-2015 | | | $ | 625,000 | | | $ | 624,999 | |
| | | | | | | | | | | | | | | | | | |
| | | | | |
Total Short-Term Investments (Cost $72,804,403) | | | | | | | | | | | | | | | | | 72,804,412 | |
| | | | | | | | | | | | | | | | | | |
| | | | | | | | |
| Total investments in securities (Cost $618,620,236) * | | | 99.97 | % | | | 617,214,881 | |
Other assets and liabilities, net | | | 0.03 | | | | 204,608 | |
| | | | | | | | |
| Total net assets | | | 100.00 | % | | $ | 617,419,489 | |
| | | | | | | | |
| 144A | The security may be resold in transactions exempt from registration, normally to qualified institutional buyers, pursuant to Rule 144A under the Securities Act of 1933. |
| ± | Variable rate investment. The rate shown is the rate in effect at period end. |
| (c) | Investment in an interest-only security entitles holders to receive only the interest payments on the underlying mortgages. The principal amount shown is the notional amount of the underlying mortgages. The rate represents the coupon rate. |
| ¤ | The security is issued in zero coupon form with no periodic interest payments. |
| (m) | The security is an auction-rate security which has an interest rate that resets at predetermined short-term intervals through a Dutch auction. The rate shown is the rate in effect at period end. |
| (n) | The auction to set the interest rate on the security failed at period end due to insufficient investor interest. A failed auction does not itself cause a default. |
| ø | Variable rate demand notes are subject to a demand feature which reduces the effective maturity. The maturity date shown represents the final maturity date of the security. The interest rate is determined and reset by the issuer daily, weekly, or monthly depending upon the terms of the security. The rate shown is the rate in effect at period end. |
| (i) | Illiquid security for which the designation as illiquid is unaudited. |
| (s) | The security is currently in default with regards to scheduled interest and/or principal payments. The Fund has stopped accruing interest on the security. |
| (a) | The security is fair valued in accordance with procedures approved by the Board of Trustees. |
| « | All or a portion of this security is on loan. |
| (l) | The security represents an affiliate of the Fund as defined in the Investment Company Act of 1940. |
| (r) | The investment is a non-registered investment vehicle purchased with cash collateral received from securities on loan. |
| (u) | The rate represents the 7-day annualized yield at period end. |
| # | All or a portion of this security is segregated as collateral for investments in derivative instruments. |
| (z) | Zero coupon security. The rate represents the current yield to maturity. |
| * | Cost for federal income tax purposes is $618,620,236 and unrealized gains (losses) consists of: |
| | | | |
Gross unrealized gains | | $ | 2,172,898 | |
Gross unrealized losses | | | (3,578,253 | ) |
| | | | |
Net unrealized losses | | $ | (1,405,355 | ) |
The accompanying notes are an integral part of these financial statements.
| | | | |
| 20 | | Wells Fargo Advantage Short-Term Bond Fund | | Statement of assets and liabilities —August 31, 2015 |
| | | | |
| | | | |
| |
Assets | | | | |
Investments | | | | |
In unaffiliated securities (including $2,860,108 of securities loaned), at value (cost $546,440,823) | | $ | 545,035,468 | |
In affiliated securities, at value (cost $72,179,413) | | | 72,179,413 | |
| | | | |
Total investments, at value (cost $618,620,236) | | | 617,214,881 | |
Cash | | | 22,772 | |
Receivable for investments sold | | | 1,985,420 | |
Principal paydown receivable | | | 11,665 | |
Receivable for Fund shares sold | | | 672,742 | |
Receivable for interest | | | 3,840,802 | |
Receivable for securities lending income | | | 1,334 | |
Receivable for daily variation margin on open futures contracts | | | 23,250 | |
Prepaid expenses and other assets | | | 47,316 | |
| | | | |
Total assets | | | 623,820,182 | |
| | | | |
| |
Liabilities | | | | |
Dividends payable | | | 149,183 | |
Payable for investments purchased | | | 2,238,207 | |
Payable for Fund shares redeemed | | | 613,146 | |
Payable upon receipt of securities loaned | | | 2,921,975 | |
Payable for daily variation margin on open futures contracts | | | 112,472 | |
Management fee payable | | | 160,131 | |
Distribution fee payable | | | 7,505 | |
Administration fees payable | | | 69,185 | |
Accrued expenses and other liabilities | | | 128,889 | |
| | | | |
Total liabilities | | | 6,400,693 | |
| | | | |
Total net assets | | $ | 617,419,489 | |
| | | | |
| |
NET ASSETS CONSIST OF | | | | |
Paid-in capital | | $ | 616,745,319 | |
Undistributed net investment income | | | 43,132 | |
Accumulated net realized gains on investments | | | 2,460,648 | |
Net unrealized losses on investments | | | (1,829,610 | ) |
| | | | |
Total net assets | | $ | 617,419,489 | |
| | | | |
| |
COMPUTATION OF NET ASSET VALUE AND OFFERING PRICE PER SHARE | | | | |
Net assets – Class A | | $ | 65,454,334 | |
Shares outstanding – Class A1 | | | 7,463,506 | |
Net asset value per share – Class A | | | $8.77 | |
Maximum offering price per share – Class A2 | | | $8.95 | |
Net assets – Class C | | $ | 11,508,498 | |
Shares outstanding – Class C1 | | | 1,313,898 | |
Net asset value per share – Class C | | | $8.76 | |
Net assets – Institutional Class | | $ | 306,832,279 | |
Shares outstanding – Institutional Class1 | | | 34,977,735 | |
Net asset value per share – Institutional Class | | | $8.77 | |
Net assets – Investor Class | | $ | 233,624,378 | |
Shares outstanding – Investor Class1 | | | 26,654,285 | |
Net asset value per share – Investor Class | | | $8.76 | |
| 1 | The Fund has an unlimited number of authorized shares. |
| 2 | Maximum offering price is computed as 100/98 of net asset value. On investments of $50,000 or more, the offering price is reduced. |
The accompanying notes are an integral part of these financial statements.
| | | | | | |
| Statement of operations —year ended August 31, 2015 | | Wells Fargo Advantage Short-Term Bond Fund | | | 21 | |
| | | | |
| | | | |
| |
Investment income | | | | |
Interest (net of foreign interest withholding taxes of $1,572) | | $ | 10,841,682 | |
Dividends | | | 58,964 | |
Income from affiliated securities | | | 54,542 | |
Securities lending income, net | | | 1,468 | |
| | | | |
Total investment income | | | 10,956,656 | |
| | | | |
| |
Expenses | | | | |
Management fee | | | 2,215,503 | |
Administration fees | | | | |
Class A | | | 98,472 | |
Class C | | | 21,200 | |
Institutional Class | | | 255,953 | |
Investor Class | | | 452,703 | |
Shareholder servicing fees | | | | |
Class A | | | 153,863 | |
Class C | | | 33,125 | |
Investor Class | | | 594,379 | |
Distribution fee | | | | |
Class C | | | 99,376 | |
Custody and accounting fees | | | 41,548 | |
Professional fees | | | 52,372 | |
Registration fees | | | 61,137 | |
Shareholder report expenses | | | 44,070 | |
Trustees’ fees and expenses | | | 9,642 | |
Other fees and expenses | | | 13,170 | |
| | | | |
Total expenses | | | 4,146,513 | |
Less: Fee waivers and/or expense reimbursements | | | (227,890 | ) |
| | | | |
Net expenses | | | 3,918,623 | |
| | | | |
Net investment income | | | 7,038,033 | |
| | | | |
| |
REALIZED AND UNREALIZED GAINS (LOSSES) ON INVESTMENTS | | | | |
| |
Net realized gains on: | | | | |
Unaffiliated securities | | | 638,758 | |
Futures transactions | | | 1,937,754 | |
| | | | |
Net realized gains on investments | | | 2,576,512 | |
| | | | |
| |
Net change in unrealized gains (losses) on: | | | | |
Unaffiliated securities | | | (4,358,266 | ) |
Futures transactions | | | (536,619 | ) |
| | | | |
Net change in unrealized gains (losses) on investments | | | (4,894,885 | ) |
| | | | |
Net realized and unrealized gains (losses) on investments | | | (2,318,373 | ) |
| | | | |
Net increase in net assets resulting from operations | | $ | 4,719,660 | |
| | | | |
The accompanying notes are an integral part of these financial statements.
| | | | |
| 22 | | Wells Fargo Advantage Short-Term Bond Fund | | Statement of changes in net assets |
| | | | | | | | | | | | | | | | |
| | | Year ended
August 31, 2015 | | | Year ended
August 31, 2014 | |
| | | |
Operations | | | | | | | | | | | | |
Net investment income | | | | | | $ | 7,038,033 | | | | | | | $ | 8,049,360 | |
Net realized gains on investments | | | | | | | 2,576,512 | | | | | | | | 1,660,981 | |
Net change in unrealized gains (losses) on investments | | | | | | | (4,894,885 | ) | | | | | | | 2,395,846 | |
| | | | |
Net increase in net assets resulting from operations | | | | | | | 4,719,660 | | | | | | | | 12,106,187 | |
| | | | |
| | | |
Distributions to shareholders from | | | | | | | | | | | | |
Net investment income | | | | | | | | | | | | | | | | |
Class A | | | | | | | (611,894 | ) | | | | | | | (785,936 | ) |
Class C | | | | | | | (32,258 | ) | | | | | | | (61,579 | ) |
Institutional Class | | | | | | | (4,040,692 | ) | | | | | | | (4,551,352 | ) |
Investor Class | | | | | | | (2,344,424 | ) | | | | | | | (2,784,889 | ) |
Net realized gains | | | | | | | | | | | | | | | | |
Class A | | | | | | | (151,151 | ) | | | | | | | 0 | |
Class C | | | | | | | (33,347 | ) | | | | | | | 0 | |
Institutional Class | | | | | | | (806,358 | ) | | | | | | | 0 | |
Investor Class | | | | | | | (572,046 | ) | | | | | | | 0 | |
| | | | |
Total distributions to shareholders | | | | | | | (8,592,170 | ) | | | | | | | (8,183,756 | ) |
| | | | |
| | | | |
Capital share transactions | | | Shares | | | | | | | | Shares | | | | | |
Proceeds from shares sold | | | | | | | | | | | | | | | | |
Class A | | | 4,914,966 | | | | 43,266,990 | | | | 4,711,737 | | | | 41,479,785 | |
Class C | | | 335,725 | | | | 2,949,884 | | | | 485,053 | | | | 4,264,729 | |
Institutional Class | | | 20,218,812 | | | | 177,920,421 | | | | 22,820,784 | | | | 201,021,960 | |
Investor Class | | | 4,502,556 | | | | 39,601,187 | | | | 5,760,381 | | | | 50,701,458 | |
| | | | |
| | | | | | | 263,738,482 | | | | | | | | 297,467,932 | |
| | | | |
Reinvestment of distributions | | | | | | | | | | | | | | | | |
Class A | | | 75,345 | | | | 662,376 | | | | 76,536 | | | | 674,307 | |
Class C | | | 5,808 | | | | 50,955 | | | | 5,618 | | | | 49,419 | |
Institutional Class | | | 327,146 | | | | 2,877,470 | | | | 303,096 | | | | 2,671,966 | |
Investor Class | | | 313,223 | | | | 2,752,124 | | | | 295,606 | | | | 2,603,622 | |
| | | | |
| | | | | | | 6,342,925 | | | | | | | | 5,999,314 | |
| | | | |
Payment for shares redeemed | | | | | | | | | | | | | | | | |
Class A | | | (4,323,667 | ) | | | (38,041,780 | ) | | | (5,499,067 | ) | | | (48,464,493 | ) |
Class C | | | (713,141 | ) | | | (6,266,736 | ) | | | (710,751 | ) | | | (6,249,544 | ) |
Institutional Class | | | (23,028,729 | ) | | | (202,625,671 | ) | | | (16,348,750 | ) | | | (144,017,590 | ) |
Investor Class | | | (6,220,552 | ) | | | (54,684,744 | ) | | | (6,315,079 | ) | | | (55,569,852 | ) |
| | | | |
| | | | | | | (301,618,931 | ) | | | | | | | (254,301,479 | ) |
| | | | |
Net increase (decrease) in net assets resulting from capital share transactions | | | | | | | (31,537,524 | ) | | | | | | | 49,165,767 | |
| | | | |
Total increase (decrease) in net assets | | | | | | | (35,410,034 | ) | | | | | | | 53,088,198 | |
| | | | |
| | | |
Net assets | | | | | | | | | | | | |
Beginning of period | | | | | | | 652,829,523 | | | | | | | | 599,741,325 | |
| | | | |
End of period | | | | | | $ | 617,419,489 | | | | | | | $ | 652,829,523 | |
| | | | |
Undistributed net investment income | | | | | | $ | 43,132 | | | | | | | $ | 34,367 | |
| | | | |
The accompanying notes are an integral part of these financial statements.
| | | | | | |
| Financial highlights | | Wells Fargo Advantage Short-Term Bond Fund | | | 23 | |
(For a share outstanding throughout each period)
| | | | | | | | | | | | | | | | | | | | |
| | | Year ended August 31 | |
| CLASS A | | 2015 | | | 2014 | | | 2013 | | | 2012 | | | 2011 | |
Net asset value, beginning of period | | | $8.82 | | | | $8.77 | | | | $8.81 | | | | $8.76 | | | | $8.73 | |
Net investment income | | | 0.09 | | | | 0.10 | | | | 0.10 | | | | 0.14 | | | | 0.16 | |
Net realized and unrealized gains (losses) on investments | | | (0.03 | ) | | | 0.05 | | | | (0.04 | ) | | | 0.05 | | | | 0.04 | |
| | | | | | | | | | | | | | | | | | | | |
Total from investment operations | | | 0.06 | | | | 0.15 | | | | 0.06 | | | | 0.19 | | | | 0.20 | |
Distributions to shareholders from | | | | | | | | | | | | | | | | | | | | |
Net investment income | | | (0.09 | ) | | | (0.10 | ) | | | (0.10 | ) | | | (0.14 | ) | | | (0.17 | ) |
Net realized gains | | | (0.02 | ) | | | 0.00 | | | | 0.00 | | | | 0.00 | | | | 0.00 | |
| | | | | | | | | | | | | | | | | | | | |
Total distributions to shareholders | | | (0.11 | ) | | | (0.10 | ) | | | (0.10 | ) | | | (0.14 | ) | | | (0.17 | ) |
Net asset value, end of period | | | $8.77 | | | | $8.82 | | | | $8.77 | | | | $8.81 | | | | $8.76 | |
Total return1 | | | 0.66 | % | | | 1.72 | % | | | 0.72 | % | | | 2.22 | % | | | 2.33 | % |
Ratios to average net assets (annualized) | | | | | | | | | | | | | | | | | | | | |
Gross expenses | | | 0.80 | % | | | 0.82 | % | | | 0.87 | % | | | 0.90 | % | | | 0.89 | % |
Net expenses | | | 0.74 | % | | | 0.78 | % | | | 0.80 | % | | | 0.80 | % | | | 0.80 | % |
Net investment income | | | 1.00 | % | | | 1.12 | % | | | 1.17 | % | | | 1.63 | % | | | 1.84 | % |
Supplemental data | | | | | | | | | | | | | | | | | | | | |
Portfolio turnover rate | | | 57 | % | | | 70 | % | | | 75 | % | | | 44 | % | | | 51 | % |
Net assets, end of period (000s omitted) | | | $65,454 | | | | $59,962 | | | | $65,812 | | | | $69,247 | | | | $56,555 | |
| 1 | Total return calculations do not include any sales charges. |
The accompanying notes are an integral part of these financial statements.
| | | | |
| 24 | | Wells Fargo Advantage Short-Term Bond Fund | | Financial highlights |
(For a share outstanding throughout each period)
| | | | | | | | | | | | | | | | | | | | |
| | | Year ended August 31 | |
| CLASS C | | 2015 | | | 2014 | | | 2013 | | | 2012 | | | 2011 | |
Net asset value, beginning of period | | | $8.81 | | | | $8.76 | | | | $8.80 | | | | $8.75 | | | | $8.73 | |
Net investment income | | | 0.02 | | | | 0.03 | | | | 0.04 | | | | 0.08 | | | | 0.10 | |
Net realized and unrealized gains (losses) on investments | | | (0.03 | ) | | | 0.05 | | | | (0.04 | ) | | | 0.05 | | | | 0.03 | |
| | | | | | | | | | | | | | | | | | | | |
Total from investment operations | | | (0.01 | ) | | | 0.08 | | | | 0.00 | | | | 0.13 | | | | 0.13 | |
Distributions to shareholders from | | | | | | | | | | | | | | | | | | | | |
Net investment income | | | (0.02 | ) | | | (0.03 | ) | | | (0.04 | ) | | | (0.08 | ) | | | (0.11 | ) |
Net realized gains | | | (0.02 | ) | | | 0.00 | | | | 0.00 | | | | 0.00 | | | | 0.00 | |
| | | | | | | | | | | | | | | | | | | | |
Total distributions to shareholders | | | (0.04 | ) | | | (0.03 | ) | | | (0.04 | ) | | | (0.08 | ) | | | (0.11 | ) |
Net asset value, end of period | | | $8.76 | | | | $8.81 | | | | $8.76 | | | | $8.80 | | | | $8.75 | |
Total return1 | | | (0.09 | )% | | | 0.97 | % | | | (0.03 | )% | | | 1.46 | % | | | 1.45 | % |
Ratios to average net assets (annualized) | | | | | | | | | | | | | | | | | | | | |
Gross expenses | | | 1.55 | % | | | 1.57 | % | | | 1.62 | % | | | 1.65 | % | | | 1.65 | % |
Net expenses | | | 1.49 | % | | | 1.53 | % | | | 1.55 | % | | | 1.55 | % | | | 1.55 | % |
Net investment income | | | 0.25 | % | | | 0.37 | % | | | 0.42 | % | | | 0.89 | % | | | 1.10 | % |
Supplemental data | | | | | | | | | | | | | | | | | | | | |
Portfolio turnover rate | | | 57 | % | | | 70 | % | | | 75 | % | | | 44 | % | | | 51 | % |
Net assets, end of period (000s omitted) | | | $11,508 | | | | $14,852 | | | | $16,686 | | | | $18,501 | | | | $19,510 | |
| 1 | Total return calculations do not include any sales charges. |
The accompanying notes are an integral part of these financial statements.
| | | | | | |
| Financial highlights | | Wells Fargo Advantage Short-Term Bond Fund | | | 25 | |
(For a share outstanding throughout each period)
| | | | | | | | | | | | | | | | | | | | |
| | | Year ended August 31 | |
| INSTITUTIONAL CLASS | | 2015 | | | 2014 | | | 2013 | | | 2012 | | | 2011 | |
Net asset value, beginning of period | | | $8.83 | | | | $8.77 | | | | $8.81 | | | | $8.77 | | | | $8.74 | |
Net investment income | | | 0.11 | | | | 0.12 | | | | 0.13 | | | | 0.17 | | | | 0.19 | |
Net realized and unrealized gains (losses) on investments | | | (0.04 | ) | | | 0.07 | | | | (0.04 | ) | | | 0.04 | | | | 0.04 | |
| | | | | | | | | | | | | | | | | | | | |
Total from investment operations | | | 0.07 | | | | 0.19 | | | | 0.09 | | | | 0.21 | | | | 0.23 | |
Distributions to shareholders from | | | | | | | | | | | | | | | | | | | | |
Net investment income | | | (0.11 | ) | | | (0.13 | ) | | | (0.13 | ) | | | (0.17 | ) | | | (0.20 | ) |
Net realized gains | | | (0.02 | ) | | | 0.00 | | | | 0.00 | | | | 0.00 | | | | 0.00 | |
| | | | | | | | | | | | | | | | | | | | |
Total distributions to shareholders | | | (0.13 | ) | | | (0.13 | ) | | | (0.13 | ) | | | (0.17 | ) | | | (0.20 | ) |
Net asset value, end of period | | | $8.77 | | | | $8.83 | | | | $8.77 | | | | $8.81 | | | | $8.77 | |
Total return | | | 0.82 | % | | | 2.15 | % | | | 1.04 | % | | | 2.43 | % | | | 2.66 | % |
Ratios to average net assets (annualized) | | | | | | | | | | | | | | | | | | | | |
Gross expenses | | | 0.47 | % | | | 0.49 | % | | | 0.53 | % | | | 0.57 | % | | | 0.56 | % |
Net expenses | | | 0.47 | % | | | 0.47 | % | | | 0.48 | % | | | 0.48 | % | | | 0.48 | % |
Net investment income | | | 1.26 | % | | | 1.42 | % | | | 1.47 | % | | | 1.95 | % | | | 2.17 | % |
Supplemental data | | | | | | | | | | | | | | | | | | | | |
Portfolio turnover rate | | | 57 | % | | | 70 | % | | | 75 | % | | | 44 | % | | | 51 | % |
Net assets, end of period (000s omitted) | | | $306,832 | | | | $330,613 | | | | $269,123 | | | | $282,512 | | | | $327,124 | |
The accompanying notes are an integral part of these financial statements.
| | | | |
| 26 | | Wells Fargo Advantage Short-Term Bond Fund | | Financial highlights |
(For a share outstanding throughout each period)
| | | | | | | | | | | | | | | | | | | | |
| | | Year ended August 31 | |
| INVESTOR CLASS | | 2015 | | | 2014 | | | 2013 | | | 2012 | | | 2011 | |
Net asset value, beginning of period | | | $8.82 | | | | $8.76 | | | | $8.80 | | | | $8.76 | | | | $8.73 | |
Net investment income | | | 0.09 | | | | 0.09 | | | | 0.10 | | | | 0.14 | | | | 0.16 | |
Net realized and unrealized gains (losses) on investments | | | (0.04 | ) | | | 0.07 | | | | (0.04 | ) | | | 0.04 | | | | 0.04 | |
| | | | | | | | | | | | | | | | | | | | |
Total from investment operations | | | 0.05 | | | | 0.16 | | | | 0.06 | | | | 0.18 | | | | 0.20 | |
Distributions to shareholders from | | | | | | | | | | | | | | | | | | | | |
Net investment income | | | (0.09 | ) | | | (0.10 | ) | | | (0.10 | ) | | | (0.14 | ) | | | (0.17 | ) |
Net realized gains | | | (0.02 | ) | | | 0.00 | | | | 0.00 | | | | 0.00 | | | | 0.00 | |
| | | | | | | | | | | | | | | | | | | | |
Total distributions to shareholders | | | (0.11 | ) | | | (0.10 | ) | | | (0.10 | ) | | | (0.14 | ) | | | (0.17 | ) |
Net asset value, end of period | | | $8.76 | | | | $8.82 | | | | $8.76 | | | | $8.80 | | | | $8.76 | |
Total return | | | 0.54 | % | | | 1.83 | % | | | 0.70 | % | | | 2.08 | % | | | 2.30 | % |
Ratios to average net assets (annualized) | | | | | | | | | | | | | | | | | | | | |
Gross expenses | | | 0.82 | % | | | 0.85 | % | | | 0.90 | % | | | 0.93 | % | | | 0.92 | % |
Net expenses | | | 0.75 | % | | | 0.79 | % | | | 0.82 | % | | | 0.83 | % | | | 0.83 | % |
Net investment income | | | 0.99 | % | | | 1.10 | % | | | 1.15 | % | | | 1.61 | % | | | 1.82 | % |
Supplemental data | | | | | | | | | | | | | | | | | | | | |
Portfolio turnover rate | | | 57 | % | | | 70 | % | | | 75 | % | | | 44 | % | | | 51 | % |
Net assets, end of period (000s omitted) | | | $233,624 | | | | $247,403 | | | | $248,120 | | | | $248,254 | | | | $248,514 | |
The accompanying notes are an integral part of these financial statements.
| | | | | | |
| Notes to financial statements | | Wells Fargo Advantage Short-Term Bond Fund | | | 27 | |
1. ORGANIZATION
Wells Fargo Funds Trust (the “Trust”), a Delaware statutory trust organized on March 10, 1999, is an open-end management investment company registered under the Investment Company Act of 1940, as amended (the “1940 Act”). As an investment company, the Trust follows the accounting and reporting guidance in Financial Accounting Standards Board (“FASB”) Accounting Standards Codification Topic 946, Financial Services – Investment Companies. These financial statements report on the Wells Fargo Advantage Short-Term Bond Fund (the “Fund”) which is a diversified series of the Trust.
2. SIGNIFICANT ACCOUNTING POLICIES
The following significant accounting policies, which are consistently followed in the preparation of the financial statements of the Fund, are in conformity with U.S. generally accepted accounting principles which require management to make estimates and assumptions that affect the reported amounts of assets and liabilities, disclosure of contingent assets and liabilities at the date of the financial statements, and the reported amounts of revenues and expenses during the reporting period. Actual results could differ from those estimates.
Securities valuation
All investments are valued each business day as of the close of regular trading on the New York Stock Exchange (generally 4 p.m. Eastern Time).
Debt securities are valued at the evaluated bid price provided by an independent pricing service or, if a reliable price is not available, the quoted bid price from an independent broker-dealer.
Equity securities and futures that are listed on a foreign or domestic exchange or market are valued at the official closing price or, if none, the last sales price. If no sale occurs on the primary exchange or market that day, the prior day’s price will be deemed “stale” and a fair value price will be determined in accordance with the Fund’s Valuation Procedures.
Equity securities that are not listed on a foreign or domestic exchange or market, but have a public trading market, are valued at the quoted bid price from an independent broker-dealer that the Management Valuation Team of Wells Fargo Funds Management, LLC (“Funds Management”) has determined is an acceptable source.
Investments in registered open-end investment companies are valued at net asset value. Interests in non-registered investment vehicles that are redeemable at net asset value are fair valued at net asset value when available.
Investments which are not valued using any of the methods discussed above are valued at their fair value, as determined in good faith by the Board of Trustees of the Fund. The Board of Trustees has established a Valuation Committee comprised of the Trustees and has delegated to it the authority to take any actions regarding the valuation of portfolio securities that the Valuation Committee deems necessary or appropriate, including determining the fair value of portfolio securities, unless the determination has been delegated to the Management Valuation Team. The Board of Trustees retains the authority to make or ratify any valuation decisions or approve any changes to the Valuation Procedures as it deems appropriate. On a quarterly basis, the Board of Trustees receives reports on any valuation actions taken by the Valuation Committee or the Management Valuation Team which may include items for ratification.
Valuations of fair valued securities are compared to the next actual sales price when available, or other appropriate market values, to assess the continued appropriateness of the fair valuation methodologies used. These securities are fair valued on a day-to-day basis, taking into consideration changes to appropriate market information and any significant changes to the inputs considered in the valuation process until there is a readily available price provided on an exchange or by an independent pricing service. Valuations received from an independent pricing service or independent broker-dealer quotes are periodically validated by comparisons to most recent trades and valuations provided by other independent pricing services in addition to the review of prices by the manager and/or subadviser. Unobservable inputs used in determining fair valuations are identified based on the type of security, taking into consideration factors utilized by market participants in valuing the investment, knowledge about the issuer and the current market environment.
Security loans
The Fund may lend its securities from time to time in order to earn additional income in the form of fees or interest on securities received as collateral or the investment of any cash received as collateral. The Fund continues to receive interest or dividends on the securities loaned. The Fund receives collateral in the form of cash or securities with a value at least equal to the value of the securities on loan. The value of the loaned securities is determined at the close of each business day and any additional required collateral is delivered to the Fund on the next business day. In a securities lending transaction, the net asset value of the Fund will be affected by an increase or decrease in the value of the
| | | | |
| 28 | | Wells Fargo Advantage Short-Term Bond Fund | | Notes to financial statements |
securities loaned and by an increase or decrease in the value of the instrument in which collateral is invested. The amount of securities lending activity undertaken by the Fund fluctuates from time to time. In the event of default or bankruptcy by the borrower, the Fund may be prevented from recovering the loaned securities or gaining access to the collateral or may experience delays or costs in doing so. In addition, the investment of any cash collateral received may lose all or part of its value. The Fund has the right under the lending agreement to recover the securities from the borrower on demand.
The Fund lends its securities through an unaffiliated securities lending agent. Cash collateral received in connection with its securities lending transactions is invested in Securities Lending Cash Investments, LLC (the “Securities Lending Fund”). The Securities Lending Fund is exempt from registration under Section 3(c)(7) of the 1940 Act and is managed by Funds Management and is subadvised by Wells Capital Management Incorporated (“WellsCap”). Funds Management receives an advisory fee starting at 0.05% and declining to 0.01% as the average daily net assets of the Securities Lending Fund increase. All of the fees received by Funds Management are paid to WellsCap for its services as subadviser. The Securities Lending Fund seeks to provide a positive return compared to the daily Fed Funds Open rate by investing in high-quality, U.S. dollar-denominated short-term money market instruments. Securities Lending Fund investments are fair valued based upon the amortized cost valuation technique. Income earned from investment in the Securities Lending Fund is included in securities lending income on the Statement of Operations.
When-issued transactions
The Fund may purchase securities on a forward commitment or when-issued basis. The Fund records a when-issued transaction on the trade date and will segregate assets in an amount at least equal in value to the Fund’s commitment to purchase when-issued securities. Securities purchased on a when-issued basis are marked-to-market daily and the Fund begins earning interest on the settlement date. Losses may arise due to changes in the market value of the underlying securities or if the counterparty does not perform under the contract.
Futures contracts
The Fund is subject to interest rate risk in the normal course of pursuing its investment objectives. The Fund may buy and sell futures contracts in order to gain exposure to, or protect against, changes in security values and interest rates. The primary risks associated with the use of futures contracts are the imperfect correlation between changes in market values of securities held by the Fund and the prices of futures contracts, and the possibility of an illiquid market.
The aggregate principal amounts of the contracts are not recorded in the financial statements. Fluctuations in the value of the contracts are recorded in the Statement of Assets and Liabilities as an asset or liability and in the Statement of Operations as unrealized gains or losses until the contracts are closed, at which point they are recorded as net realized gains or losses on futures contracts. With futures contracts, there is minimal counterparty risk to the Fund since futures are exchange traded and the exchange’s clearinghouse, as counterparty to all exchange traded futures, guarantees the futures against default.
Security transactions and income recognition
Securities transactions are recorded on a trade date basis. Realized gains or losses are recorded on the basis of identified cost.
Interest income is accrued daily and bond discounts are accreted and premiums are amortized daily based on the effective interest method. To the extent debt obligations are placed on non-accrual status, any related interest income may be reduced by writing off interest receivables when the collection of all or a portion of interest has become doubtful based on consistently applied procedures. If the issuer subsequently resumes interest payments or when the collectability of interest is reasonably assured, the debt obligation is removed from non-accrual status.
Dividend income is recognized on the ex-dividend date.
Income is recorded net of taxes withheld where recovery of such taxes is not assured.
Distributions to shareholders
Distributions to shareholders from net investment income are accrued daily and paid monthly. Distributions from net realized gains, if any, are recorded on the ex-dividend date. Such distributions are determined in conformity with federal income tax regulations, which may differ in amount or character from net investment income and realized gains recognized for purposes of U.S. generally accepted accounting principles.
Federal and other taxes
The Fund intends to continue to qualify as a regulated investment company by distributing substantially all of its investment company taxable income and any net realized capital gains (after reduction for capital loss carryforwards) sufficient to relieve it from all, or substantially all, federal income taxes. Accordingly, no provision for federal income taxes was required.
| | | | | | |
| Notes to financial statements | | Wells Fargo Advantage Short-Term Bond Fund | | | 29 | |
The Fund’s income and federal excise tax returns and all financial records supporting those returns for the prior three fiscal years are subject to examination by the federal and Delaware revenue authorities. Management has analyzed the Fund’s tax positions taken on federal, state, and foreign tax returns for all open tax years and does not believe that there are any uncertain tax positions that require recognition of a tax liability.
Class allocations
The separate classes of shares offered by the Fund differ principally in applicable sales charges, distribution, shareholder servicing, and administration fees. Class specific expenses are charged directly to that share class. Investment income, common expenses, and realized and unrealized gains (losses) on investments are allocated daily to each class of shares based on the relative proportion of net assets of each class.
3. FAIR VALUATION MEASUREMENTS
Fair value measurements of investments are determined within a framework that has established a fair value hierarchy based upon the various data inputs utilized in determining the value of the Fund’s investments. The three-level hierarchy gives the highest priority to unadjusted quoted prices in active markets for identical assets or liabilities (Level 1) and the lowest priority to significant unobservable inputs (Level 3). The Fund’s investments are classified within the fair value hierarchy based on the lowest level of input that is significant to the fair value measurement. The inputs are summarized into three broad levels as follows:
| n | | Level 1 – quoted prices in active markets for identical securities |
| n | | Level 2 – other significant observable inputs (including quoted prices for similar securities, interest rates, prepayment speeds, credit risk, use of amortized cost, etc.) |
| n | | Level 3 – significant unobservable inputs (including the Fund’s own assumptions in determining the fair value of investments) |
The inputs or methodologies used for valuing investments in securities are not necessarily an indication of the risk associated with investing in those securities.
The following is a summary of the inputs used in valuing the Fund’s assets and liabilities as of August 31, 2015:
| | | | | | | | | | | | | | | | |
| | | Quoted prices
(Level 1) | | | Other significant
observable inputs
(Level 2) | | | Significant
unobservable inputs
(Level 3) | | | Total | |
Assets | | | | | | | | | | | | | | | | |
Investments in : | | | | | | | | | | | | | | | | |
| | | | |
Agency securities | | $ | 0 | | | $ | 72,828,599 | | | $ | 0 | | | $ | 72,828,599 | |
| | | | |
Asset-backed securities | | | 0 | | | | 64,547,112 | | | | 0 | | | | 64,547,112 | |
| | | | |
Corporate bonds and notes | | | 0 | | | | 217,985,374 | | | | 0 | | | | 217,985,374 | |
| | | | |
Municipal obligations | | | 0 | | | | 25,218,448 | | | | 0 | | | | 25,218,448 | |
| | | | |
Non-agency mortgage backed securities | | | 0 | | | | 62,782,644 | | | | 0 | | | | 62,782,644 | |
| | | | |
Preferred stocks | | | | | | | | | | | | | | | | |
Financials | | | 0 | | | | 0 | | | | 1,503,402 | | | | 1,503,402 | |
| | | | |
U.S. Treasury securities | | | 7,514,469 | | | | 0 | | | | 0 | | | | 7,514,469 | |
| | | | |
Yankee corporate bonds and notes | | | 0 | | | | 92,030,421 | | | | 0 | | | | 92,030,421 | |
| | | | |
Short-term investments | | | | | | | | | | | | | | | | |
Investment companies | | | 69,257,438 | | | | 2,921,975 | | | | 0 | | | | 72,179,413 | |
U.S. Treasury securities | | | 624,999 | | | | 0 | | | | 0 | | | | 624,999 | |
| | | 77,396,906 | | | | 538,314,573 | | | | 1,503,402 | | | | 617,214,881 | |
Futures contracts | | | 23,250 | | | | 0 | | | | 0 | | | | 23,250 | |
Total assets | | $ | 77,420,156 | | | $ | 538,314,573 | | | $ | 1,503,402 | | | $ | 617,238,131 | |
Liabilities | | | | | | | | | | | | | | | | |
| | | | |
Futures contracts | | $ | 112,472 | | | $ | 0 | | | $ | 0 | | | $ | 112,472 | |
Total liabilities | | $ | 112,472 | | | $ | 0 | | | $ | 0 | | | $ | 112,472 | |
| | | | |
| 30 | | Wells Fargo Advantage Short-Term Bond Fund | | Notes to financial statements |
Futures contracts are reported at their variation margin at measurement date, which represents the amount due to/from the Fund at that date. All other assets and liabilities are reported at their market value at measurement date.
The Fund recognizes transfers between levels within the fair value hierarchy at the end of the reporting period. At August 31, 2015, the Fund did not have any transfers into/out of Level 1, Level 2, or Level 3.
4. TRANSACTIONS WITH AFFILIATES
Management fee
Funds Management, an indirect wholly owned subsidiary of Wells Fargo & Company (“Wells Fargo”), is the manager of the Fund and provides advisory and fund-level administrative services under an investment management agreement. Under the investment management agreement, Funds Management is responsible for, among other services, implementing the investment objectives and strategies of the Fund, supervising the applicable subadviser providing fund-level administrative services in connection with the Fund’s operations, and providing any other fund-level administrative services reasonably necessary for the operation of the Fund. As compensation for its services under the investment management agreement, Funds Management is entitled to receive an annual management fee starting at 0.35% and declining to 0.255% as the average daily net assets of the Fund increase.
Prior to July 1, 2015, Funds Management provided advisory services pursuant to an investment advisory agreement and was entitled to receive an annual fee which started at 0.30% and declined to 0.225% as the average daily net assets of the Fund increased. In addition, fund-level administrative services were provided by Funds Management under a separate administration agreement at an annual fee which started at 0.05% and declined to 0.03% as the average daily net assets of the Fund increased. For financial statement purposes, the advisory fee and fund-level administration fee for the year ended August 31, 2015 have been included in management fee on the Statement of Operations.
For the year ended August 31, 2015, the management fee was equivalent to an annual rate of 0.35% of the Fund’s average daily net assets.
Funds Management has retained the services of a subadviser to provide daily portfolio management to the Fund. The fee for subadvisory services is borne by Funds Management. WellsCap, an affiliate of Funds Management and an indirect wholly owned subsidiary of Wells Fargo, is the subadviser to the Fund and is entitled to receive a fee from Funds Management at an annual rate starting at 0.15% and declining to 0.05% as the average daily net assets of the Fund increase.
Administration fees
Under a class-level administration agreement, Funds Management provides class-level administrative services to the Fund, which includes paying fees and expenses for services provided by the transfer agent, sub-transfer agents, omnibus account servicers and record-keepers. As compensation for its services under the class-level administration agreement, Funds Management receives an annual fee which is calculated based on the average daily net assets of each class as follows:
| | | | |
| | | Class-level administration fee | |
Class A, Class C | | | 0.16 | % |
Institutional Class | | | 0.08 | |
Investor Class | | | 0.19 | |
Funds Management has contractually waived and/or reimbursed management and administration fees to the extent necessary to maintain certain net operating expense ratios for the Fund. Waiver of fees and/or reimbursement of expenses by Funds Management were made first from fund level expenses on a proportionate basis and then from class specific expenses. Funds Management has committed through December 31, 2015 to waive fees and/or reimburse expenses to the extent necessary to cap the Fund’s expenses at 0.72% for Class A shares, 1.47% for Class C shares, 0.48% for Institutional shares, and 0.73% for Investor shares. After this time, the cap may be increased or the commitment to maintain the cap may be terminated only with the approval of the Board of Trustees. Prior to
January 1, 2015, the Fund’s expenses were capped at 0.77% for Class A shares, 1.52% for Class C shares, and 0.78% for Investor Class shares.
Distribution fee
The Trust has adopted a distribution plan for Class C shares of the Fund pursuant to Rule 12b-1 under the 1940 Act. A distribution fee is charged to Class C shares and paid to Wells Fargo Funds Distributor, LLC, the principal underwriter, at an annual rate of 0.75% of the average daily net assets of Class C shares.
| | | | | | |
| Notes to financial statements | | Wells Fargo Advantage Short-Term Bond Fund | | | 31 | |
In addition, Funds Distributor is entitled to receive the front-end sales charge from the purchase of Class A shares and a contingent deferred sales charge on the redemption of certain Class A shares. Funds Distributor is also entitled to receive the contingent deferred sales charges from redemptions of Class C shares. For the year ended August 31, 2015, Funds Distributor received $1,438 from the sale of Class A shares.
Shareholder servicing fees
The Trust has entered into contracts with one or more shareholder servicing agents, whereby Class A, Class C, and Investor Class of the Fund is charged a fee at an annual rate of 0.25% of the average daily net assets of each respective class.
A portion of these total shareholder servicing fees were paid to affiliates of Wells Fargo.
5. INVESTMENT PORTFOLIO TRANSACTIONS
Purchases and sales of investments, excluding short-term securities, for the year ended August 31, 2015 were as follows:
| | | | | | |
Purchases at cost | | Sales proceeds |
U.S.
government | | Non-U.S.
government | | U.S.
government | | Non-U.S.
government |
| $18,742,450 | | $397,619,709 | | $1,614,215 | | $336,256,645 |
6. DERIVATIVE TRANSACTIONS
During the year ended August 31, 2015, the Fund entered into futures contracts to speculate on interest rates and to help manage the duration of the portfolio.
At August 31, 2015, the Fund had long and short futures contracts outstanding as follows:
| | | | | | | | | | | | | | | | |
| Expiration date | | Counterparty | | Contracts | | Type | | | Contract
value at
August 31, 2015 | | | Unrealized
gains
(losses) | |
| 12-31-2015 | | JPMorgan | | 1075 Long | | | 2-Year U.S. Treasury Notes | | | $ | 234,853,906 | | | $ | (602,636 | ) |
| 12-31-2015 | | JPMorgan | | 186 Short | | | 5-Year U.S. Treasury Notes | | | | 22,215,375 | | | | 178,381 | |
The Fund had an average notional amount of $188,768,717 and $11,329,049 in long and short futures contracts, respectively, during the year ended August 31, 2015.
On August 31, 2015, the cumulative unrealized losses on futures contracts in the amount of $424,255 are reflected in net unrealized losses on investments on the Statement of Assets and Liabilities. The receivable and payable for daily variation margin on open futures contracts reflected in the Statement of Assets and Liabilities only represents the current day’s variation margin. The realized gains and change in unrealized gains (losses) on futures contracts are reflected in the Statement of Operations.
For certain types of derivative transactions, the Fund has entered into International Swaps and Derivatives Association, Inc. master agreements (“ISDA Master Agreements”) or similar agreements with approved counterparties. The ISDA Master Agreements or similar agreements may have requirements to deliver/deposit securities or cash to/with an exchange or broker-dealer as collateral and allows the Fund to offset, with each counterparty, certain derivative financial instrument’s assets and/or liabilities with collateral held or pledged. Collateral requirements differ by type of derivative. Collateral or margin requirements are set by the broker or exchange clearing house for exchange traded derivatives while collateral terms are contract specific for over-the-counter traded derivatives. Cash collateral that has been pledged to cover obligations of the Fund under ISDA Master Agreements or similar agreements, if any, will be reported separately in the Statement of Assets and Liabilities. Securities pledged as collateral, if any, for the same purpose are noted in the Portfolio of Investments. With respect to balance sheet offsetting, absent an event of default by the counterparty or a termination of the agreement, the reported amounts of financial assets and financial liabilities in the Statement of Assets
| | | | |
| 32 | | Wells Fargo Advantage Short-Term Bond Fund | | Notes to financial statements |
and Liabilities are not offset across transactions between the Fund and the applicable counterparty. A reconciliation of the gross amounts on the Statement of Assets and Liabilities to the net amounts by derivative type, including any collateral exposure, is as follows:
| | | | | | | | | | | | | | | | |
| Derivative type | | Counterparty | | Gross amounts
of assets in the
Statement of
Assets and
Liabilities | | Amounts
subject to
netting
agreements | | | Collateral
received | | | Net
amount
of assets | |
Futures – variation margin | | JPMorgan | | $23,250 | | $ | (23,250 | ) | | $ | 0 | | | $ | 0 | |
| | | | | | | | | | | | | | | | |
| Derivative type | | Counterparty | | Gross amounts
of liabilities in the
Statement of
Assets and
Liabilities | | Amounts
subject to
netting
agreements | | | Collateral
pledged1 | | | Net
amount
of liabilities | |
Futures – variation margin | | JPMorgan | | $112,472 | | $ | (23,250 | ) | | $ | (89,222 | ) | | $ | 0 | |
| | 1 | Collateral pledged within this table is limited to the collateral for the net transaction with the counterparty. | |
7. BANK BORROWINGS
The Trust (excluding the money market funds and certain other funds in the Trust) and Wells Fargo Variable Trust are parties to a $150,000,000 revolving credit agreement whereby the Fund is permitted to use bank borrowings for temporary or emergency purposes, such as to fund shareholder redemption requests. Interest under the credit agreement is charged to the Fund based on a borrowing rate equal to the higher of the Federal Funds rate in effect on that day plus 1.25% or the overnight LIBOR rate in effect on that day plus 1.25%. In addition, an annual commitment fee equal to 0.10% of the unused balance is allocated to each participating fund. For the year ended August 31, 2015, the Fund paid $704 in commitment fees.
For the year ended August 31, 2015, there were no borrowings by the Fund under the agreement.
8. DISTRIBUTIONS TO SHAREHOLDERS
The tax character of distributions paid during the years ended August 31, 2015 and August 31, 2014 were as follows:
| | | | | | | | |
| | | Year ended August 31 | |
| | | 2015 | | | 2014 | |
Ordinary income | | $ | 8,008,998 | | | $ | 8,183,756 | |
Long-term capital gain | | | 583,172 | | | | 0 | |
As of August 31, 2015, the components of distributable earnings on a tax basis were as follows:
| | | | |
Undistributed
ordinary
income | | Undistributed
long-term
gain | | Unrealized
losses |
$1,003,944 | | $1,307,846 | | $(1,488,437) |
9. INDEMNIFICATION
Under the Trust’s organizational documents, the officers and Trustees have been granted certain indemnification rights against certain liabilities that may arise out of performance of their duties to the Trust. Additionally, in the normal course of business, the Trust may enter into contracts with service providers that contain a variety of indemnification clauses. The Trust’s maximum exposure under these arrangements is dependent on future claims that may be made against the Fund and, therefore, cannot be estimated.
| | | | | | |
| Report of independent registered public accounting firm | | Wells Fargo Advantage Short-Term Bond Fund | | | 33 | |
BOARD OF TRUSTEES AND SHAREHOLDERS OF WELLS FARGO FUNDS TRUST:
We have audited the accompanying statement of assets and liabilities, including the portfolio of investments, of the Wells Fargo Advantage Short-Term Bond Fund (the “Fund”), one of the funds constituting the Wells Fargo Funds Trust, as of August 31, 2015, and the related statement of operations for the year then ended, the statements of changes in net assets for each of the years in the two-year period then ended, and the financial highlights for each of the years in the five-year period then ended. These financial statements and financial highlights are the responsibility of the Fund’s management. Our responsibility is to express an opinion on these financial statements and financial highlights based on our audits.
We conducted our audits in accordance with the standards of the Public Company Accounting Oversight Board (United States). Those standards require that we plan and perform the audit to obtain reasonable assurance about whether the financial statements and financial highlights are free of material misstatement. An audit includes examining, on a test basis, evidence supporting the amounts and disclosures in the financial statements. Our procedures included confirmation of securities owned as of August 31, 2015, by correspondence with the custodian and brokers, or by other appropriate auditing procedures. An audit also includes assessing the accounting principles used and significant estimates made by management, as well as evaluating the overall financial statement presentation. We believe that our audits provide a reasonable basis for our opinion.
In our opinion, the financial statements and financial highlights referred to above present fairly, in all material respects, the financial position of the Wells Fargo Advantage Short-Term Bond Fund as of August 31, 2015, the results of its operations for the year then ended, the changes in its net assets for each of the years in the two-year period then ended, and the financial highlights for each of the years in the five-year period then ended, in conformity with U.S. generally accepted accounting principles.

Boston, Massachusetts
October 26, 2015
| | | | |
| 34 | | Wells Fargo Advantage Short-Term Bond Fund | | Other information (unaudited) |
TAX INFORMATION
Pursuant to Section 852 of the Internal Revenue Code, $583,172 was designated as long-term capital gain distributions for the fiscal year ended August 31, 2015.
For the fiscal year ended August 31, 2015, $5,516,548 has been designated as interest-related dividends for nonresident alien shareholders pursuant to Section 871 of the Internal Revenue Code.
For the fiscal year ended August 31, 2015, $979,729 has been designated as short-term capital gain dividends for nonresident alien shareholders pursuant to Section 871 of the Internal Revenue Code.
PROXY VOTING INFORMATION
A description of the policies and procedures that the Fund uses to determine how to vote proxies relating to portfolio securities is available, upon request, by calling 1-800-222-8222, visiting our website at wellsfargoadvantagefunds.com, or visiting the SEC website at sec.gov. Information regarding how the Fund voted proxies relating to portfolio securities during the most recent 12-month period ended June 30 is available on the Fund’s website at wellsfargoadvantagefunds.com or by visiting the SEC website at sec.gov.
PORTFOLIO HOLDINGS INFORMATION
The complete portfolio holdings for the Fund are publicly available monthly on the Fund’s website (wellsfargoadvantagefunds.com), on a one-month delayed basis. In addition, top ten holdings information (excluding derivative positions) for the Fund is publicly available on the Fund’s website on a monthly, seven-day or more delayed basis. The Fund files its complete schedule of portfolio holdings with the SEC for the first and third quarters of each fiscal year on Form N-Q, which is available by visiting the SEC website at sec.gov. In addition, the Fund’s Form N-Q may be reviewed and copied at the SEC’s Public Reference Room in Washington, DC, and at regional offices in New York City, at 233 Broadway, and in Chicago, at 175 West Jackson Boulevard, Suite 900. Information about the Public Reference Room may be obtained by calling 1-800-SEC-0330.
| | | | | | |
| Other information (unaudited) | | Wells Fargo Advantage Short-Term Bond Fund | | | 35 | |
BOARD OF TRUSTEES AND OFFICERS
Each of the Trustees and Officers1 listed in the table below acts in identical capacities for each fund in the Wells Fargo Advantage family of funds, which consists of 133 mutual funds comprising the Wells Fargo Funds Trust, Wells Fargo Variable Trust, Wells Fargo Master Trust and four closed-end funds (collectively the “Fund Complex”). This table should be read in conjunction with the Prospectus and the Statement of Additional Information2. The mailing address of each Trustee and Officer is 525 Market Street, 12th Floor, San Francisco, CA 94105. Each Trustee and Officer serves an indefinite term, however, each Trustee serves such term until reaching the mandatory retirement age established by the Trustees.
Independent Trustees
| | | | | | |
Name and year of birth | | Position held and length of service* | | Principal occupations during past five years or longer | | Other public company or
investment company
directorships during
past 5 years |
| William R. Ebsworth (Born 1957) | | Trustee, since 2015** | | Retired. From 1984 to 2013, equities analyst, portfolio manager, research director at Fidelity Management and Research Company and retired in 2013 as Chief Investment Officer of Fidelity Strategic Advisers, Inc. in Boston, Tokyo, and Hong Kong where he led a team of investment professionals managing client assets. Prior thereto, Board member of Hong Kong Securities Clearing Co., Hong Kong Options Clearing Corp., the Thailand International Fund, Ltd., Fidelity Investments Life Insurance Company, and Empire Fidelity Investments Life Insurance Company. Mr. Ebsworth is a CFA ® charterholder and an Adjunct Lecturer, Finance, at Babson College. | | Asset Allocation Trust |
| Jane A. Freeman (Born 1953) | | Trustee, since 2015** | | Retired. From 2012 to 2014 and 1999 to 2008, Chief Financial Officer of Scientific Learning Corporation. From 2008 to 2012, Ms. Freeman provided consulting services related to strategic business projects. Prior to 1999, Portfolio Manager at Rockefeller & Co. and Scudder, Stevens & Clark. Board member of the Harding Loevner Funds from 1996 to 2014, serving as both Lead Independent Director and chair of the Audit Committee. Board member of the Russell Exchange Traded Funds Trust from 2011 to 2012 and the chair of the Audit Committee. Ms. Freeman is Chair of Taproot Foundation (non-profit organization), a Board Member of Ruth Bancroft Garden (non-profit organization) and an inactive chartered financial analyst. | | Asset Allocation Trust; Harding Loevner Funds; Russell Exchange Traded Funds Trust |
| Peter G. Gordon (Born 1942) | | Trustee, since 1998; Chairman, since 2005 | | Co-Founder, Retired Chairman, President and CEO of Crystal Geyser Water Company. Trustee Emeritus, Colby College. | | Asset Allocation Trust |
| Isaiah Harris, Jr. (Born 1952) | | Trustee, since 2009 | | Retired. Chairman of the Board of CIGNA Corporation since 2009, and Director since 2005. From 2003 to 2011, Director of Deluxe Corporation. Prior thereto, President and CEO of BellSouth Advertising and Publishing Corp. from 2005 to 2007, President and CEO of BellSouth Enterprises from 2004 to 2005 and President of BellSouth Consumer Services from 2000 to 2003. Emeritus member of the Iowa State University Foundation Board of Governors. Emeritus Member of the Advisory Board of Iowa State University School of Business (charter school). Advisory Board Member, Palm Harbor Academy. Mr. Harris is a certified public accountant. | | CIGNA Corporation; Asset Allocation Trust |
| Judith M. Johnson (Born 1949) | | Trustee, since 2008;
Audit Committee
Chairman, since 2008 | | Retired. Prior thereto, Chief Executive Officer and Chief Investment Officer of Minneapolis Employees Retirement Fund from 1996 to 2008. Ms. Johnson is an attorney, certified public accountant and a certified managerial accountant. | | Asset Allocation Trust |
| David F. Larcker (Born 1950) | | Trustee, since 2009 | | James Irvin Miller Professor of Accounting at the Graduate School of Business, Stanford University, Morgan Stanley Director of the Center for Leadership Development and Research and Senior Faculty of The Rock Center for Corporate Governance since 2006. From 2005 to 2008, Professor of Accounting at the Graduate School of Business, Stanford University. Prior thereto, Ernst & Young Professor of Accounting at The Wharton School, University of Pennsylvania from 1985 to 2005. | | Asset Allocation Trust |
| | | | |
| 36 | | Wells Fargo Advantage Short-Term Bond Fund | | Other information (unaudited) |
| | | | | | |
Name and year of birth | | Position held and length of service* | | Principal occupations during past five years or longer | | Other public company or
investment company
directorships during
past 5 years |
| Olivia S. Mitchell (Born 1953) | | Trustee, since 2006 | | International Foundation of Employee Benefit Plans Professor, Wharton School of the University of Pennsylvania since 1993. Director of Wharton’s Pension Research Council and Boettner Center on Pensions & Retirement Research, and Research Associate at the National Bureau of Economic Research. Previously, Cornell University Professor from 1978 to 1993. | | Asset Allocation Trust |
| Timothy J. Penny (Born 1951) | | Trustee, since 1996 | | President and Chief Executive Officer of Southern Minnesota Initiative Foundation, a non-profit organization, since 2007 and Senior Fellow at the Humphrey Institute Policy Forum at the University of Minnesota since 1995. Member of the Board of Trustees of NorthStar Education Finance, Inc., a non-profit organization, since 2007. | | Asset Allocation Trust |
| Michael S. Scofield (Born 1943) | | Trustee, since 2010 | | Served on the Investment Company Institute’s Board of Governors and Executive Committee from 2008-2011 as well the Governing Council of the Independent Directors Council from 2006-2011 and the Independent Directors Council Executive Committee from 2008-2011. Chairman of the IDC from 2008-2010. Institutional Investor (Fund Directions) Trustee of Year in 2007. Trustee of the Evergreen Funds complex (and its predecessors) from 1984 to 2010. Chairman of the Evergreen Funds from 2000-2010. Former Trustee of the Mentor Funds. Retired Attorney, Law Offices of Michael S. Scofield. | | Asset Allocation Trust |
| Donald C. Willeke (Born 1940) | | Trustee, since 1996 | | Principal of the law firm of Willeke & Daniels. General Counsel of the Minneapolis Employees Retirement Fund from 1984 until its consolidation into the Minnesota Public Employees Retirement Association on June 30, 2010. Director and Vice Chair of The Tree Trust (non-profit corporation). Director of the American Chestnut Foundation (non-profit corporation). | | Asset Allocation Trust |
| * | Length of service dates reflect the Trustee’s commencement of service with the Trust’s predecessor entities, where applicable. |
| ** | William R. Ebsworth and Jane A. Freeman each became a Trustee effective January 1, 2015. |
Officers
| | | | | | |
Name and year of birth | | Position held and length of service | | Principal occupations during past five years or longer | | |
| Karla M. Rabusch (Born 1959) | | President, since 2003 | | Executive Vice President of Wells Fargo Bank, N.A. and President of Wells Fargo Funds Management, L LC since 2003. | | |
Nancy Wiser1 (Born 1967) | | Treasurer, since 2012 | | Executive Vice President of Wells Fargo Funds Management, LLC since 2011. Chief Operating Officer and Chief Compliance Officer at LightBox Capital Management LLC, from 2008 to 2011. | | |
C. David Messman (Born 1960) | | Secretary, since 2000; Chief Legal Officer, since 2003 | | Senior Vice President and Secretary of Wells Fargo Funds Management, LLC since 2001. Assistant General Counsel of Wells Fargo Bank, N.A. since 2013 and Vice President and Managing Counsel of Wells Fargo Bank N.A. from 1996 to 2013. | | |
Debra Ann Early (Born 1964) | | Chief Compliance Officer, since 2007 | | Executive Vice President of Wells Fargo Funds Management, LLC since 2014, Senior Vice President and Chief Compliance Officer from 2007 to 2014. | | |
David Berardi (Born 1975) | | Assistant Treasurer, since 2009 | | Vice President of Wells Fargo Funds Management, LLC since 2009. Vice President of Evergreen Investment Management Company, LLC from 2008 to 2010. Manager of Fund Reporting and Control for Evergreen Investment Management Company, LLC from 2004 to 2010. | | |
Jeremy DePalma1 (Born 1974) | | Assistant Treasurer, since 2009 | | Senior Vice President of Wells Fargo Funds Management, LLC since 2009. Senior Vice President of Evergreen Investment Management Company, LLC from 2008 to 2010 and head of the Fund Reporting and Control Team within Fund Administration from 2005 to 2010. | | |
| 1 | Nancy Wiser acts as Treasurer of 72 funds in the Fund Complex. Jeremy DePalma acts as Treasurer of 61 funds and Assistant Treasurer of 72 funds in the Fund Complex. |
| 2 | The Statement of Additional Information includes additional information about the Trustees and is available, without charge, upon request, by calling 1-800-222-8222 or by visiting the website at wellsfargoadvantagefunds.com. |
| | | | | | |
| Other information (unaudited) | | Wells Fargo Advantage Short-Term Bond Fund | | | 37 | |
BOARD CONSIDERATION OF INVESTMENT ADVISORY, INVESTMENT MANAGEMENT AND SUB-ADVISORY AGREEMENTS:
Under the Investment Company Act of 1940 (the “1940 Act”), the Board of Trustees (the “Board”) of Wells Fargo Funds Trust (the “Trust”) must determine annually whether to approve the continuation of the Trust’s investment advisory and sub-advisory agreements. In this regard, at an in-person meeting held on May 19-20, 2015 (the “Meeting”), the Board, all the members of which have no direct or indirect interest in the investment advisory and sub-advisory agreements and are not “interested persons” of the Trust, as defined in the 1940 Act (the “Independent Trustees”), reviewed and approved for Wells Fargo Advantage Short-Term Bond Fund (the “Fund”): (i) an investment advisory agreement (the “Advisory Agreement”) with Wells Fargo Funds Management, LLC (“Funds Management”); (ii) an investment management agreement (the “Management Agreement”) with Funds Management; and (iii) an investment sub-advisory agreement (the “Sub-Advisory Agreement”) with Wells Capital Management Incorporated (the “Sub-Adviser”), an affiliate of Funds Management. The Management Agreement combines the terms of the Advisory Agreement with the terms of the Fund’s Amended and Restated Administration Agreement (the “Administration Agreement”) applicable to Fund-level administrative services. The Advisory Agreement, the Management Agreement and the Sub-Advisory Agreement are collectively referred to as the “Advisory Agreements.”
At the Meeting, the Board considered the factors and reached the conclusions described below relating to the selection of Funds Management and the Sub-Adviser and the approval of the Advisory Agreements. Prior to the Meeting, including at an in-person meeting in March 2015, the Trustees conferred extensively among themselves and with representatives of Funds Management about these matters. Also, the Board has adopted a team-based approach, with each team consisting of a sub-set of Trustees, to assist the full Board in the discharge of its duties in reviewing performance and other matters throughout the year. The Independent Trustees were assisted in their evaluation of the Advisory Agreements by independent legal counsel, from whom they received separate legal advice and with whom they met separately.
In providing information to the Board, Funds Management and the Sub-Adviser were guided by a detailed set of requests for information submitted to them by independent legal counsel on behalf of the Independent Trustees at the start of the Board’s annual contract renewal process earlier in 2015. In considering and approving the Advisory Agreements, the Trustees considered the information they believed relevant, including but not limited to the information discussed below. The Board considered not only the specific information presented in connection with the Meeting, but also the knowledge gained over time through interaction with Funds Management and the Sub-Adviser about various topics. In this regard, the Board reviewed reports of Funds Management at each of its quarterly meetings, which included, among other things, portfolio reviews and performance reports. In addition, the Board and the teams mentioned above confer with portfolio managers at various times throughout the year. The Board did not identify any particular information or consideration that was all-important or controlling, and each individual Trustee may have attributed different weights to various factors.
After its deliberations, the Board unanimously approved the continuation of the Advisory Agreement for the period from June 1, 2015 through June 30, 2015, approved the Management Agreement for the period from July 1, 2015 through May 31, 2016, and approved the continuation of the Sub-Advisory Agreement for a one-year term through May 31, 2016. The Board also determined that the compensation payable to Funds Management and the Sub-Adviser under each of the Advisory Agreements was reasonable. The Board considered the approval of the Advisory Agreements for the Fund as part of its consideration of agreements for funds across the complex, but its approvals were made on a fund-by-fund basis. The following summarizes a number of important, but not necessarily all, factors considered by the Board in support of its approvals.
Nature, extent and quality of services
The Board received and considered various information regarding the nature, extent and quality of services provided to the Fund by Funds Management and the Sub-Adviser under the Advisory Agreements. This information included, among other things, a summary of the background and experience of senior management of Funds Management, and the qualifications, background, tenure and responsibilities of each of the portfolio managers primarily responsible for the day-to-day portfolio management of the Fund. The Board noted that the services to be provided to the Fund pursuant to the Management Agreement combined the advisory services previously provided to the Fund pursuant to the Fund’s Advisory Agreement with the Fund-level administrative services previously provided to the Fund pursuant to the Fund’s Administration Agreement. The Board received a representation from Funds Management that combining these services would not result in any change to the nature or level of services provided by Funds Management to the Fund.
| | | | |
| 38 | | Wells Fargo Advantage Short-Term Bond Fund | | Other information (unaudited) |
The Board evaluated the ability of Funds Management and the Sub-Adviser to attract and retain qualified investment professionals, including research, advisory and supervisory personnel. The Board further considered the compliance programs and compliance records of Funds Management and the Sub-Adviser. In addition, the Board took into account the full range of services provided to the Fund by Funds Management and its affiliates.
Fund performance and expenses
The Board considered the performance results for the Fund over various time periods ended March 31, 2015. The Board considered these results in comparison to the performance of funds in a universe that was determined by Lipper Inc. (“Lipper”) to be similar to the Fund (the “Universe”), and in comparison to the Fund’s benchmark index and to other comparative data. Lipper is an independent provider of investment company data. The Board received a description of the methodology used by Lipper to select the mutual funds in the performance Universe. The Board noted that the performance of the Fund (Class A) was higher than or in range of the average performance of the Universe for all periods under review. The Board also noted that the performance of the Fund was higher than its benchmark, the Barclays 1-3 Year Government/Credit Index, for all periods under review.
The Board also received and considered information regarding the Fund’s net operating expense ratios and their various components, including actual management fees (which reflect fee waivers, if any, and include advisory, administration and transfer agent fees), custodian and other non-management fees, and Rule 12b-1 and non-Rule 12b-1 service fees. The Board considered these ratios in comparison to the median ratios of funds in class-specific expense groups that were determined by Lipper to be similar to the Fund (the “Groups”). The Board received a description of the methodology used by Lipper to select the mutual funds in the expense Groups and an explanation of how funds comprising expense groups and their expense ratios may vary from year-to-year. Based on the Lipper reports, the Board noted that the net operating expense ratios of the Fund were lower than or in range of the median net operating expense ratios of the expense Groups for all share classes except the Investor Class. The Board discussed and accepted Funds Management’s proposal to convert the Investor Class shares into Class A shares.
The Board took into account the Fund performance and expense information provided to it among the factors considered in deciding to re-approve the Advisory Agreement and Sub-Advisory Agreement and approve the Management Agreement.
Investment advisory and sub-advisory fee rates
The Board reviewed and considered the contractual investment advisory fee rates that are payable by the Fund to Funds Management for investment advisory services (the “Advisory Agreement Rates”), both on a stand-alone basis and on a combined basis with the Fund’s fund-level and class-level contractual administration fee rates (the “Management Rates”). The Board noted that the Management Rates include transfer agency and sub-transfer agency costs. The Board also noted that the fee rate to be paid by the Fund under the Management Agreement will incorporate the advisory fee and Fund-level administration fee previously payable separately by the Fund under the Fund’s Advisory Agreement and Administration Agreement with Funds Management. The Board also reviewed and considered the contractual investment sub-advisory fee rates that are payable by Funds Management to the Sub-Adviser for investment sub-advisory services (the “Sub-Advisory Agreement Rates”).
Among other information reviewed by the Board was a comparison of the Management Rates of the Fund with those of other funds in the expense Groups at a common asset level. The Board noted that the Management Rates of the Fund were lower than or in range of the average rates for the Fund’s expense Groups for all share classes.
The Board also received and considered information about the portion of the total advisory fee that was retained by Funds Management after payment of the fee to the Sub-Adviser for sub-advisory services. In assessing the reasonableness of this amount, the Board received and evaluated information about the nature and extent of responsibilities retained and risks assumed by Funds Management and not delegated to or assumed by the Sub-Adviser, and about Funds Management’s on-going oversight services. However, given the affiliation between Funds Management and the Sub-Adviser, the Board ascribed limited relevance to the allocation of the advisory fee between them.
The Board also received and considered information about the nature and extent of services offered and fee rates charged by Funds Management and the Sub-Adviser to other types of clients with investment strategies similar to those of the Fund. In this regard, the Board received information about the significantly greater scope of services, and compliance, reporting and other legal burdens and risks of managing mutual funds compared with those associated with managing assets of non-mutual fund clients such as collective funds or institutional separate accounts.
| | | | | | |
| Other information (unaudited) | | Wells Fargo Advantage Short-Term Bond Fund | | | 39 | |
Based on its consideration of the factors and information it deemed relevant, including those described here, the Board determined that the compensation payable to Funds Management under the Management Agreement and Advisory Agreement and to the Sub-Adviser under the Sub-Advisory Agreement was reasonable, in light of the services covered by the Advisory Agreements.
Profitability
The Board received and considered information concerning the profitability of Funds Management, as well as the profitability of Wells Fargo as a whole, from providing services to the Fund and the fund family as a whole. The Board also received and considered information concerning the profitability of the Sub-Adviser from providing services to the fund family as a whole, noting that the Sub-Adviser’s profitability information with respect to providing services to the Fund was subsumed in the Wells Fargo profitability analysis.
Funds Management reported on the methodologies and estimates used in calculating profitability. Among other things, the Board noted that the levels of profitability reported on a fund-by-fund basis varied widely, depending on factors such as the size and type of fund. Based on its review, the Board did not deem the profits reported by Funds Management or Wells Fargo from its services to the Fund to be at a level that would prevent it from approving the continuation of the Advisory Agreements.
Economies of scale
With respect to possible economies of scale, the Board noted the existence of breakpoints in the Fund’s advisory and management fee structures, and the Fund’s administration fee structure, which operate generally to reduce the Fund’s expense ratios as the Fund grows in size. It considered that, for a small fund or a fund that shrinks in size, breakpoints conversely can result in higher fee levels. The Board also considered that fee waiver and expense reimbursement arrangements and competitive fee rates at the outset are means of sharing potential economies of scale with shareholders of the Fund and the fund family as a whole. The Board considered Funds Management’s view that any analyses of potential economies of scale in managing a particular fund are inherently limited in light of the joint and common costs and investments that Funds Management incurs across the fund family as a whole.
The Board concluded that the Fund’s fee and expense arrangements, including contractual breakpoints, constituted a reasonable approach to sharing potential economies of scale with the Fund and its shareholders.
Other benefits to Funds Management and the Sub-Adviser
The Board received and considered information regarding potential “fall-out” or ancillary benefits received by Funds Management and its affiliates, including the Sub-Adviser, as a result of their relationships with the Fund. Ancillary benefits could include, among others, benefits directly attributable to other relationships with the Fund and benefits potentially derived from an increase in Funds Management’s and the Sub-Adviser’s business as a result of their relationships with the Fund. The Board noted that various affiliates of Funds Management may receive distribution-related fees, shareholder servicing payments and sub-transfer agency fees in respect of shares sold or held through them and services provided.
The Board also reviewed information about soft dollar credits earned and utilized by the Sub-Adviser, fees earned by Funds Management and the Sub-Adviser from managing a private investment vehicle for the fund family’s securities lending collateral and commissions earned by an affiliated broker from portfolio transactions.
Based on its consideration of the factors and information it deemed relevant, including those described here, the Board did not find that any ancillary benefits received by Funds Management and its affiliates, including the Sub-Adviser, were unreasonable.
Conclusion
At the Meeting, after considering the above-described factors and based on its deliberations and its evaluation of the information described above, the Board unanimously approved the continuation of the Advisory Agreement for the period from June 1, 2015 through June 30, 2015, approved the Management Agreement for the period from July 1, 2015 through May 31, 2016, and approved the continuation of the Sub-Advisory Agreement for a one-year term through May 31, 2016. The Board also determined that the compensation payable to Funds Management and the Sub-Adviser under each of the Advisory Agreements was reasonable.
| | | | |
| 40 | | Wells Fargo Advantage Short-Term Bond Fund | | List of abbreviations |
The following is a list of common abbreviations for terms and entities that may have appeared in this report.
| ACA | — ACA Financial Guaranty Corporation |
| ADR | — American depositary receipt |
| ADS | — American depositary shares |
| AGC | — Assured Guaranty Corporation |
| AGM | — Assured Guaranty Municipal |
| Ambac | — Ambac Financial Group Incorporated |
| AMT | — Alternative minimum tax |
| BAN | — Bond anticipation notes |
| BHAC | — Berkshire Hathaway Assurance Corporation |
| CAB | — Capital appreciation bond |
| CCAB | — Convertible capital appreciation bond |
| CDA | — Community Development Authority |
| CDO | — Collateralized debt obligation |
| DRIVER | — Derivative inverse tax-exempt receipts |
| DW&P | — Department of Water & Power |
| DWR | — Department of Water Resources |
| ECFA | — Educational & Cultural Facilities Authority |
| EDA | — Economic Development Authority |
| EDFA | — Economic Development Finance Authority |
| ETF | — Exchange-traded fund |
| FDIC | — Federal Deposit Insurance Corporation |
| FFCB | — Federal Farm Credit Banks |
| FGIC | — Financial Guaranty Insurance Corporation |
| FHA | — Federal Housing Administration |
| FHLB | — Federal Home Loan Bank |
| FHLMC | — Federal Home Loan Mortgage Corporation |
| FICO | — The Financing Corporation |
| FNMA | — Federal National Mortgage Association |
| GDR | — Global depositary receipt |
| GNMA | — Government National Mortgage Association |
| HCFR | — Healthcare facilities revenue |
| HEFA | — Health & Educational Facilities Authority |
| HEFAR | — Higher education facilities authority revenue |
| HFA | — Housing Finance Authority |
| HFFA | — Health Facilities Financing Authority |
| HUD | — Department of Housing and Urban Development |
| IDA | — Industrial Development Authority |
| IDAG | — Industrial Development Agency |
| KRW | — Republic of Korea won |
| LIBOR | — London Interbank Offered Rate |
| LIFER | — Long Inverse Floating Exempt Receipts |
| LLC | — Limited liability company |
| LLLP | — Limited liability limited partnership |
| LLP | — Limited liability partnership |
| MBIA | — Municipal Bond Insurance Association |
| MFHR | — Multifamily housing revenue |
| MSTR | — Municipal securities trust receipts |
| MUD | — Municipal Utility District |
| National | — National Public Finance Guarantee Corporation |
| PCFA | — Pollution Control Financing Authority |
| PCL | — Public Company Limited |
| PCR | — Pollution control revenue |
| PFA | — Public Finance Authority |
| PFFA | — Public Facilities Financing Authority |
| PFOTER | — Puttable floating option tax-exempt receipts |
| plc | — Public limited company |
| PUTTER | — Puttable tax-exempt receipts |
| R&D | — Research & development |
| Radian | — Radian Asset Assurance |
| RAN | — Revenue anticipation notes |
| RDA | — Redevelopment Authority |
| RDFA | — Redevelopment Finance Authority |
| REIT | — Real estate investment trust |
| ROC | — Reset option certificates |
| SAVRS | — Select auction variable rate securities |
| SBA | — Small Business Authority |
| SDR | — Swedish depositary receipt |
| SFHR | — Single-family housing revenue |
| SFMR | — Single-family mortgage revenue |
| SPA | — Standby purchase agreement |
| SPDR | — Standard & Poor’s Depositary Receipts |
| SPEAR | — Short Puttable Exempt Adjustable Receipts |
| STRIPS | — Separate trading of registered interest and |
| TAN | — Tax anticipation notes |
| TIPS | — Treasury inflation-protected securities |
| TRAN | — Tax revenue anticipation notes |
| TTFA | — Transportation Trust Fund Authority |
| TVA | — Tennessee Valley Authority |


For more information
More information about Wells Fargo Advantage Funds is available free upon request. To obtain literature, please write, email, visit the Fund’s website, or call:
Wells Fargo Advantage Funds
P.O. Box 8266
Boston, MA 02266-8266
Email: wfaf@wellsfargo.com
Website: wellsfargoadvantagefunds.com
Individual investors: 1-800-222-8222
Retail investment professionals: 1-888-877-9275
Institutional investment professionals: 1-866-765-0778
This report and the financial statements contained herein are submitted for the general information of the shareholders of Wells Fargo Advantage Funds. If this report is used for promotional purposes, distribution of the report must be accompanied or preceded by a current prospectus. Before investing, please consider the investment objectives, risks, charges, and expenses of the investment. For a current prospectus and, if available, a summary prospectus, containing this information, call 1-800-222-8222 or visit the Fund’s website at wellsfargoadvantagefunds.com. Read the prospectus carefully before you invest or send money.
Wells Fargo Funds Management, LLC, a wholly owned subsidiary of Wells Fargo & Company, provides investment advisory and administrative services for Wells Fargo Advantage Funds. Other affiliates of Wells Fargo & Company provide subadvisory and other services for the Funds. The Funds are distributed by Wells Fargo Funds Distributor, LLC, Member FINRA, an affiliate of Wells Fargo & Company.
NOT FDIC INSURED ¡ NO BANK GUARANTEE ¡ MAY LOSE VALUE
© 2015 Wells Fargo Funds Management, LLC. All rights reserved.
| | |
 | | 236807 10-15 A221/AR221 08-15 |

Wells Fargo Advantage
Short-Term High Yield Bond Fund

Annual Report
August 31, 2015

Reduce clutter. Save trees.
Sign up for electronic delivery of prospectuses and shareholder reports at wellsfargo.com/advantagedelivery
Contents
The views expressed and any forward-looking statements are as of August 31, 2015, unless otherwise noted, and are those of the Fund managers and/or Wells Fargo Funds Management, LLC. Discussions of individual securities, or the markets generally, or any Wells Fargo Advantage Fund are not intended as individual recommendations. Future events or results may vary significantly from those expressed in any forward-looking statements; the views expressed are subject to change at any time in response to changing circumstances in the market. Wells Fargo Funds Management, LLC and the Fund disclaim any obligation to publicly update or revise any views expressed or forward-looking statements.
NOT FDIC INSURED ¡ NO BANK GUARANTEE ¡ MAY LOSE VALUE
| | | | |
| 2 | | Wells Fargo Advantage Short-Term High Yield Bond Fund | | Letter to shareholders (unaudited) |

Karla M. Rabusch
President
Wells Fargo Advantage Funds
Major central banks continued to inject liquidity into global banks and markets through various accommodative monetary policies, including quantitative easing.
Dear Valued Shareholder:
We are pleased to offer you this annual report for the Wells Fargo Advantage Short-Term High Yield Bond Fund for the 12-month period that ended August 31, 2015. The period was marked by low interest rates, low oil prices, and moderate U.S. economic growth. Short-term investment-grade bonds, as measured by the Barclays U.S. 1-3 Year Government/Credit Bond Index,1 returned 0.81% during the period. Meanwhile, strong demand for high-quality, liquid assets kept returns on Treasury bills more modest; the Barclays 6-Month Treasury Bill Index2 returned 0.15% during the period.
Major central banks continued to provide stimulus.
Major central banks continued to inject liquidity into global banks and markets through various accommodative monetary policies, including quantitative easing. In the U.S., the Federal Reserve (Fed) kept its key interest rate near zero in order to support the economy and the financial system. However, it set expectations for it to begin normalizing monetary policy with higher target ranges for the federal funds rate.
Meanwhile, European markets continued to benefit from the European Central Bank’s (ECB’s) willingness to maintain low interest rates. In addition to its targeted longer-term refinancing operations that are designed to increase bank lending, the ECB expanded its quantitative easing program to include the purchase of eurozone government bonds. In Japan, the Bank of Japan maintained an aggressive monetary program aimed at combating deflation.
Economic growth was moderate, and oil prices plummeted.
U.S. economic growth advanced during the reporting period, the unemployment rate ticked lower to 5.1% as of August 2015, and inflation remained below the Fed’s longer-run objective of a 2% pace. The period was also marked by lower oil prices, which began the reporting period near $90 per barrel but declined to $46 per barrel at the end of August 2015. While lower oil prices benefited consumers of oil products, the lower prices pressured companies within the energy sector.
Bond yields rose but remained low by historical standards.
Short-term interest rates increased during the reporting period, with a flattening in the shape of the short-term yield curve. During this time frame, 1-year Treasury bills rose 29 basis points (bps; 100 bps equals 1.00%) to yield 0.38%, 2-year Treasury note yields rose 21 bps to yield 0.74%, and 3-year Treasury note yields rose only 8 bps to yield 1.05%. Meanwhile, ultra-short-term yields were little changed at ultralow levels, anchored by the easy monetary policy.
Since the end of the financial crisis, structural changes in the fixed-income markets have reduced trading liquidity (the degree to which assets can be bought or sold without affecting the price). New regulations and capital requirements have caused traditional liquidity suppliers (banks and broker/dealers) to be more risk-averse and hold less inventory. Meanwhile, corporate-debt issuance has
| 1 | The Barclays U.S. 1–3 Year Government/Credit Bond Index is the one- to three-year component of the Barclays U.S. Government/Credit Bond Index that includes securities in the Government and Credit Indexes. The Government Index includes Treasuries (that is, public obligations of the U.S. Treasury that have remaining maturities of more than one year) and agencies (that is, publicly issued debt of U.S. government agencies, quasi-federal corporations, and corporate or foreign debt guaranteed by the U.S. government).The Credit Index includes publicly issued U.S. corporate and foreign debentures and secured notes that meet specified maturity, liquidity, and quality requirements. You cannot invest directly in an index. |
| 2 | The Barclays 6-Month Treasury Bill Index tracks the performance and attributes of recently issued 6-month U.S. Treasury bills. The index follows Barclays’ monthly rebalancing conventions. You cannot invest directly in an index. |
| | | | | | |
| Letter to shareholders (unaudited) | | Wells Fargo Advantage Short-Term High Yield Bond Fund | | | 3 | |
spiked as companies finance themselves at record-low yields, bond mutual funds hold larger amounts of this new debt supply, trading volumes are lower, and large-size trades are more difficult to execute. However, fixed-income markets appear to have functioned well over the past year with sufficient liquidity and muted volatility.
Don’t let short-term uncertainty derail long-term investment goals.
Periods of uncertainty can present challenges, but experience has taught us that maintaining long-term investment goals can be an effective way to plan for the future. To help you create a sound strategy based on your personal goals and risk tolerance, Wells Fargo Advantage Funds offers more than 100 mutual funds spanning a wide range of asset classes and investment styles. Although diversification cannot guarantee an investment profit or prevent losses, we believe it can be an effective way to manage investment risk and potentially smooth out overall portfolio performance. We encourage investors to know their investments and to understand that appropriate levels of risk-taking may unlock opportunities.
Thank you for choosing to invest in Wells Fargo Advantage Funds. We appreciate your confidence in us and remain committed to helping you meet your financial needs.
Sincerely,

Karla M. Rabusch
President
Wells Fargo Advantage Funds
Periods of uncertainty can present challenges, but experience has taught us that maintaining long-term investment goals can be an effective way to plan for the future.
Notice to shareholders
At a meeting held on August 11–12, 2015, the Board of Trustees of the Fund approved a change in the name of the Fund whereby the word “Advantage” will be removed from its name, effective December 15, 2015.
For current information about your fund investments, contact your investment professional, visit our website at wellsfargoadvantagefunds.com, or call us directly at 1-800-222-8222. We are available 24 hours a day, 7 days a week.
| | | | |
| 4 | | Wells Fargo Advantage Short-Term High Yield Bond Fund | | Performance highlights (unaudited) |
Investment objective
The Fund seeks total return, consisting of a high level of current income and capital appreciation.
Manager
Wells Fargo Funds Management, LLC
Subadviser
Wells Capital Management Incorporated
Portfolio managers
Kevin J. Maas, CFA
Thomas M. Price, CFA
Michael J. Schueller, CFA
Average annual total returns1 (%) as of August 31, 2015
| | | | | | | | | | | | | | | | | | | | | | | | | | | | | | | | | | |
| | | | | Including sales charge | | | Excluding sales charge | | | Expense ratios2 (%) | |
| | | Inception date | | 1 year | | | 5 year | | | 10 year | | | 1 year | | | 5 year | | | 10 year | | | Gross | | | Net3 | |
| Class A (SSTHX) | | 2-29-2000 | | | (1.58 | ) | | | 3.13 | | | | 3.87 | | | | 1.46 | | | | 3.77 | | | | 4.19 | | | | 0.92 | | | | 0.83 | |
| Class C (WFHYX) | | 3-31-2008 | | | (0.30 | ) | | | 2.99 | | | | 3.42 | | | | 0.70 | | | | 2.99 | | | | 3.42 | | | | 1.67 | | | | 1.58 | |
| Administrator Class (WDHYX) | | 7-30-2010 | | | – | | | | – | | | | – | | | | 1.62 | | | | 3.93 | | | | 4.27 | | | | 0.86 | | | | 0.67 | |
| Institutional Class (STYIX) | | 11-30-2012 | | | – | | | | – | | | | – | | | | 1.90 | | | | 3.99 | | | | 4.29 | | | | 0.59 | | | | 0.52 | |
| Investor Class (STHBX) | | 6-30-1997 | | | – | | | | – | | | | – | | | | 1.43 | | | | 3.73 | | | | 4.17 | | | | 0.95 | | | | 0.86 | |
| BofA Merrill Lynch High Yield U.S. Corporates, Cash Pay, BB Rated, 1-5 Year Index4 | | – | | | – | | | | – | | | | – | | | | 1.45 | | | | 6.33 | | | | 6.77 | | | | – | | | | – | |
| Short-Term High Yield Bond Index III5 | | – | | | – | | | | – | | | | – | | | | (0.24 | ) | | | 6.23 | | | | 6.80 | | | | – | | | | – | |
| BofA Merrill Lynch High Yield U.S. Corporates, Cash Pay, B Rated, 1-5 Year Index6 | | – | | | – | | | | – | | | | – | | | | (4.12 | ) | | | 5.99 | | | | 6.76 | | | | – | | | | – | |
Figures quoted represent past performance, which is no guarantee of future results, and do not reflect taxes that a shareholder may pay on fund distributions or the redemption of fund shares. Investment return and principal value of an investment will fluctuate so that an investor’s shares, when redeemed, may be worth more or less than their original cost. Performance shown without sales charges would be lower if sales charges were reflected. Current performance may be lower or higher than the performance data quoted, which assumes the reinvestment of dividends and capital gains. Current month-end performance is available on the Fund’s website, wellsfargoadvantagefunds.com.
Index returns do not include transaction costs associated with buying and selling securities, any mutual fund fees or expenses, or any taxes. It is not possible to invest directly in an index.
For Class A shares, the maximum front-end sales charge is 3.00%. For Class C shares, the maximum contingent deferred sales charge is 1.00%. Performance including a contingent deferred sales charge assumes the sales charge for the corresponding time period. Administrator Class, Institutional Class, and Investor Class shares are sold without a front-end sales charge or contingent deferred sales charge.
Bond values fluctuate in response to the financial condition of individual issuers, general market and economic conditions, and changes in interest rates. Changes in market conditions and government policies may lead to periods of heightened volatility in the bond market and reduced liquidity for certain bonds held by the fund. In general, when interest rates rise, bond values fall and investors may lose principal value. Interest-rate changes and their impact on the fund and its share price can be sudden and unpredictable. High-yield securities have a greater risk of default and tend to be more volatile than higher-rated debt securities. Loans are subject to risks similar to those associated with other below-investment-grade bond investments, such as credit risk (for example, risk of issuer default), below-investment-grade bond risk (for example, risk of greater volatility in value), and risk that the loan may become illiquid or difficult to price. The use of derivatives may reduce returns and/or increase volatility. Certain investment strategies tend to increase the total risk of an investment (relative to the broader market). The Fund is exposed to foreign investment risk. Consult the Fund’s prospectus for additional information on these and other risks.
Please see footnotes on page 5.
| | | | | | |
| Performance highlights (unaudited) | | Wells Fargo Advantage Short-Term High Yield Bond Fund | | | 5 | |
|
| Growth of $10,000 investment7 as of August 31, 2015 |
|
 |
| 1 | Effective June 20, 2008, Advisor Class was renamed Class A and modified to assume the features and attributes of Class A. Historical performance shown for Class A shares through June 19, 2008, includes Advisor Class expenses. Historical performance shown for Class C shares prior to their inception reflects the performance of Investor Class shares, adjusted to include the higher expenses applicable to Class C shares. Historical performance shown for Administrator Class shares prior to their inception reflects the performance of Class A shares and includes the higher expenses applicable to Class A shares. If these expenses had not been included, returns would be higher. Historical performance shown for Institutional Class shares prior to their inception reflects the performance of Administrator Class shares and includes the higher expenses applicable to Administrator Class shares. If these expenses had not been included, returns would be higher. |
| 2 | Reflects the expense ratios as stated in the most recent prospectuses, which include the impact of 0.02% in acquired fund fees and expenses. The expense ratios shown are subject to change and may differ from the annualized expense ratios shown in the financial highlights of this report, which do not include acquired fund fees and expenses. |
| 3 | The manager has contractually committed through December 31, 2015, to waive fees and/or reimburse expenses to the extent necessary to cap the Fund’s Total Annual Fund Operating Expenses After Fee Waiver at 0.81% for Class A, 1.56% for Class C, 0.65% for Administrator Class, 0.50% for Institutional Class, and 0.84% for Investor Class. After this time, the cap may be increased or the commitment to maintain the cap may be terminated only with the approval of the Board of Trustees. Brokerage commissions, stamp duty fees, interest, taxes, acquired fund fees and expenses, and extraordinary expenses are excluded from the cap. Without this cap, the Fund’s returns would have been lower. |
| 4 | The BofA Merrill Lynch High Yield U.S. Corporates, Cash Pay, BB Rated, 1-5 Year Index is an unmanaged index that generally tracks the performance of BB rated U.S. dollar-denominated corporate bonds publicly issued in the U.S. domestic market with maturities of one to five years. You cannot invest directly in an index. |
| 5 | Source: Wells Fargo Funds Management, LLC. The Short-Term High Yield Bond Index III is comprised of 70% of BofA Merrill Lynch High Yield U.S. Corporates, Cash Pay, BB Rated, 1-5 Year Index and 30% of BofA Merrill Lynch High Yield U.S. Corporates, Cash Pay, B Rated, 1-5 Year Index. The BofA Merrill Lynch High Yield U.S. Corporates, Cash Pay, BB Rated, 1-5 Year Index is an unmanaged index that generally tracks the performance of BB rated U.S. dollar-denominated corporate bonds publicly issued in the U.S. domestic market with maturities of one to five years. The BofA Merrill Lynch High Yield U.S. Corporates, Cash Pay, B Rated, 1-5 Year Index is an unmanaged index that generally tracks the performance of B rated U.S. dollar-denominated corporate bonds publicly issued in the U.S. domestic market with maturities of one to five years. You cannot invest directly in an index. |
| 6 | The BofA Merrill Lynch High Yield U.S. Corporates, Cash Pay, B Rated, 1-5 Year Index is an unmanaged index that generally tracks the performance of B rated U.S. dollar-denominated corporate bonds publicly issued in the U.S. domestic market with maturities of one to five years. You cannot invest directly in an index. |
| 7 | The chart compares the performance of Class A shares for the most recent 10 years with the performance of the BofA Merrill Lynch High Yield U.S. Corporates, Cash Pay, BB Rated, 1-5 Year Index, the Short-Term High Yield Bond Index III, and the BofA Merrill Lynch High Yield U.S. Corporates, Cash Pay, B Rated, 1-5 Year Index. The chart assumes a hypothetical investment of $10,000 in Class A shares and reflects all operating expenses and assumes the maximum initial sales charge of 3.00%. |
| 8 | The ten largest holdings, excluding cash and cash equivalents, are calculated based on the value of the investments divided by total net assets of the Fund. Holdings are subject to change and may have changed since the date specified. |
| 9 | The credit quality distribution of portfolio holdings reflected in the chart is based on ratings from Standard & Poor’s, Moody’s Investors Service, and/or Fitch Ratings Ltd. Credit quality ratings apply to the underlying holdings of the Fund and not to the Fund itself. The percentages of the Fund’s portfolio with the ratings depicted in the chart are calculated based on the total market value of fixed income securities held by the Fund. If a security was rated by all three rating agencies, the middle rating was utilized. If rated by two of three rating agencies, the lower rating was utilized, and if rated by one of the rating agencies, that rating was utilized. Standard & Poor’s rates the creditworthiness of bonds, ranging from AAA (highest) to D (lowest). Ratings from A to CCC may be modified by the addition of a plus (+) or minus (-) sign to show relative standing within the rating categories. Standard & Poor’s rates the creditworthiness of short-term notes from SP-1 (highest) to SP-3 (lowest). Moody’s rates the creditworthiness of bonds, ranging from Aaa (highest) to C (lowest). Ratings Aa to B may be modified by the addition of a number 1 (highest) to 3 (lowest) to show relative standing within the ratings categories. Moody’s rates the creditworthiness of short-term U.S. tax-exempt municipal securities from MIG 1/VMIG 1 (highest) to SG (lowest). Fitch rates the creditworthiness of bonds, ranging from AAA (highest) to D (lowest). Credit quality distribution is subject to change and may have changed since the date specified. |
| 10 | The option-adjusted spread measures the yield difference between an income-paying security and a comparable maturity U.S. Treasury, with an adjustment to account for an embedded option on the security. |
| | | | |
| 6 | | Wells Fargo Advantage Short-Term High Yield Bond Fund | | Performance highlights (unaudited) |
MANAGER’S DISCUSSION
Fund highlights
| n | | The Fund (Class A, excluding sales charges) outperformed the BofA Merrill Lynch High Yield U.S. Corporates, Cash Pay, BB Rated, 1-5 Year Index and the Short-Term High Yield Bond Index III for the 12-month period that ended August 31, 2015. |
| n | | The Fund modestly outperformed the BofA Merrill Lynch High Yield U.S. Corporates, Cash Pay, BB Rated, 1-5 Year Index because the benefits of conservative credit selection offset weakness in the Fund’s energy holdings early in the period. The Fund outperformed the Short-Term High Yield Bond Index III due to the index having 30% in B-rated bonds, which underperformed the Fund’s more conservative portfolio. |
| n | | We continue to believe that we are in a period of modest economic growth and decent credit fundamentals. As part of that scenario, we expect to continue to see a below-average default rate, excluding the commodity sectors. Given our objective of delivering a lower-volatility offering in the high-yield space, we intend to continue with our conservative credit selection. |
The Fund’s investments in relatively higher-rated, short-term high-yield securities allowed it to outperform during a weak period for the high-yield market.
The U.S. economy continued to grow modestly during the 12-month period. Despite moderate economic growth and an accommodative U.S. Federal Reserve (Fed), the high-yield market was weak because of unfavorable performance by commodity-related credits and lower-rated bonds.
Our expectation as we entered the period was that returns would be primarily driven by income, because the average price on high-yield bonds was well above par (and not far from all-time highs), leaving minimal room for appreciation, in our opinion, especially if U.S. Treasury yields increased. We did not expect significant depreciation because we believed that most companies were appropriately capitalized for the economic conditions.
| | | | |
| Ten largest holdings8 (%) as of August 31, 2015 | |
CIT Group Incorporated, 4.25%, 8-15-2017 | | | 1.54 | |
United Rentals North America Incorporated, 7.38%, 5-15-2020 | | | 1.47 | |
Ineos US Finance LLC, 3.75%, 12-15-2020 | | | 1.39 | |
CCO Holdings LLC, 7.38%, 6-1-2020 | | | 1.37 | |
Valeant Pharmaceuticals International Incorporated, 3.50%, 2-13-2019 | | | 1.37 | |
Sally Holdings Incorporated, 6.88%, 11-15-2019 | | | 1.30 | |
Case New Holland Industrial Incorporated, 7.88%, 12-1-2017 | | | 1.22 | |
NRG Energy Incorporated, 7.63%, 1-15-2018 | | | 1.19 | |
TransDigm Incorporated, 3.75%, 2-28-2020 | | | 1.17 | |
Zayo Group LLC, 3.75%, 5-6-2021 | | | 1.14 | |
Although our view on the overall economy was accurate, we did not expect the precipitous drop in oil prices in late 2014. The Fund’s exposure to energy credits detracted, and the energy sector was the only negative contributor to returns during the period. We cut the Fund’s energy exposure from 12.5% to 6.4% during the period by selling the riskier holdings. We believe our focus on higher-rated, short-term high-yield securities allowed the Fund to generate a positive return despite the negative returns for the overall high-yield market.
During the reporting period, we gained confidence that the slow-growth recovery would continue. Slow growth, in our view, is more than sufficient to support the credit prospects of higher-quality, short-term high-yield securities.
Please see footnotes on page 5.
| | | | | | |
| Performance highlights (unaudited) | | Wells Fargo Advantage Short-Term High Yield Bond Fund | | | 7 | |
| | |
| Credit quality9 as of August 31, 2015 |
|
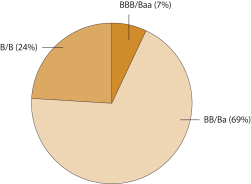 |
We continued to adhere to the Fund’s basic portfolio strategy.
The Fund’s investments fit into three principal categories. The first category is composed of short maturity bonds that we expect to be repaid on the maturity date. The second category is made up of bonds with high coupons that we expect to be refinanced on a call date. These two categories comprised less than 70% of the portfolio during the period. The third category consists of floating-rate securities, primarily leveraged loans, which ranged from 30% to 37%. Yields on the Fund’s fixed-rate and floating-rate holdings were approximately similar over the period.
Conservative credit selection will continue to drive our selection process, and we monitor market conditions to determine the Fund’s floating-rate exposure. If the Fed begins to tighten monetary policy as expected in 2015, we will monitor demand for floating-rate investments and may increase the Fund’s exposure provided the yields are appropriate for the greater spread risk (or the price sensitivity to a change in its option-adjusted spread10). We intend to continue evaluating relative-value opportunities for the Fund in the upcoming period, but we do not expect significant changes to overall portfolio positioning.
Please see footnotes on page 5.
| | | | |
| 8 | | Wells Fargo Advantage Short-Term High Yield Bond Fund | | Fund expenses (unaudited) |
As a shareholder of the Fund, you incur two types of costs: (1) transaction costs, including sales charges (loads) on purchase payments and contingent deferred sales charges (if any) on redemptions and (2) ongoing costs, including management fees, distribution (12b-1) and/or shareholder servicing fees, and other Fund expenses. This example is intended to help you understand your ongoing costs (in dollars) of investing in the Fund and to compare these costs with the ongoing costs of investing in other mutual funds.
The example is based on an investment of $1,000 invested at the beginning of the six-month period and held for the entire period from March 1, 2015 to August 31, 2015.
Actual expenses
The “Actual” line of the table below provides information about actual account values and actual expenses. You may use the information in this line, together with the amount you invested, to estimate the expenses that you paid over the period. Simply divide your account value by $1,000 (for example, an $8,600 account value divided by $1,000 = 8.6), then multiply the result by the number in the “Actual” line under the heading entitled “Expenses paid during period” for your applicable class of shares to estimate the expenses you paid on your account during this period.
Hypothetical example for comparison purposes
The “Hypothetical” line of the table below provides information about hypothetical account values and hypothetical expenses based on the Fund’s actual expense ratio and an assumed rate of return of 5% per year before expenses, which is not the Fund’s actual return. The hypothetical account values and expenses may not be used to estimate the actual ending account balance or expenses you paid for the period. You may use this information to compare the ongoing costs of investing in the Fund and other funds. To do so, compare this 5% hypothetical example with the 5% hypothetical examples that appear in the shareholder reports of the other funds.
Please note that the expenses shown in the table are meant to highlight your ongoing costs only and do not reflect any transactional costs, such as sales charges (loads) and contingent deferred sales charges. Therefore, the “Hypothetical” line of the table is useful in comparing ongoing costs only and will not help you determine the relative total costs of owning different funds. In addition, if these transactional costs were included, your costs would have been higher.
| | | | | | | | | | | | | | | | |
| | | Beginning
account value
3-1-2015 | | | Ending
account value
8-31-2015 | | | Expenses
paid during
the period¹ | | | Net annualized
expense ratio | |
Class A | | | | | | | | | | | | | | | | |
Actual | | $ | 1,000.00 | | | $ | 1,005.84 | | | $ | 4.10 | | | | 0.81 | % |
Hypothetical (5% return before expenses) | | $ | 1,000.00 | | | $ | 1,021.12 | | | $ | 4.13 | | | | 0.81 | % |
Class C | | | | | | | | | | | | | | | | |
Actual | | $ | 1,000.00 | | | $ | 1,002.06 | | | $ | 7.87 | | | | 1.56 | % |
Hypothetical (5% return before expenses) | | $ | 1,000.00 | | | $ | 1,017.34 | | | $ | 7.93 | | | | 1.56 | % |
Administrator Class | | | | | | | | | | | | | | | | |
Actual | | $ | 1,000.00 | | | $ | 1,006.66 | | | $ | 3.29 | | | | 0.65 | % |
Hypothetical (5% return before expenses) | | $ | 1,000.00 | | | $ | 1,021.93 | | | $ | 3.31 | | | | 0.65 | % |
Institutional Class | | | | | | | | | | | | | | | | |
Actual | | $ | 1,000.00 | | | $ | 1,007.41 | | | $ | 2.53 | | | | 0.50 | % |
Hypothetical (5% return before expenses) | | $ | 1,000.00 | | | $ | 1,022.68 | | | $ | 2.55 | | | | 0.50 | % |
Investor Class | | | | | | | | | | | | | | | | |
Actual | | $ | 1,000.00 | | | $ | 1,005.69 | | | $ | 4.25 | | | | 0.84 | % |
Hypothetical (5% return before expenses) | | $ | 1,000.00 | | | $ | 1,020.97 | | | $ | 4.28 | | | | 0.84 | % |
| 1 | Expenses paid is equal to the annualized expense ratio of each class multiplied by the average account value over the period, multiplied by the number of days in the most recent fiscal half-year divided by the number of days in the fiscal year (to reflect the one-half-year period). |
| | | | | | |
| Portfolio of investments—August 31, 2015 | | Wells Fargo Advantage Short-Term High Yield Bond Fund | | | 9 | |
| | | | | | | | | | | | | | | | |
| Security name | | Interest rate | | | Maturity date | | | Principal | | | Value | |
| | | | |
Corporate Bonds and Notes: 55.00% | | | | | | | | | | | | | | | | |
| | | | |
Consumer Discretionary: 19.69% | | | | | | | | | | | | | | | | |
| | | | |
| Airlines: 0.72% | | | | | | | | | | | | | | | | |
US Airways Group Incorporated | | | 6.13 | % | | | 6-1-2018 | | | $ | 10,000,000 | | | $ | 10,375,000 | |
| | | | | | | | | | | | | | | | |
| | | | |
| Auto Components: 2.69% | | | | | | | | | | | | | | | | |
American Axle & Manufacturing Incorporated | | | 6.25 | | | | 3-15-2021 | | | | 13,000,000 | | | | 13,260,000 | |
Goodyear Tire & Rubber Company | | | 8.25 | | | | 8-15-2020 | | | | 14,590,000 | | | | 15,210,075 | |
Tenneco Incorporated | | | 6.88 | | | | 12-15-2020 | | | | 9,650,000 | | | | 10,060,125 | |
| | | | |
| | | | | | | | | | | | | | | 38,530,200 | |
| | | | | | | | | | | | | | | | |
| | | | |
| Diversified Consumer Services: 3.10% | | | | | | | | | | | | | | | | |
Avis Budget Car Rental LLC ± | | | 3.03 | | | | 12-1-2017 | | | | 11,611,000 | | | | 11,552,945 | |
Avis Budget Car Rental LLC | | | 4.88 | | | | 11-15-2017 | | | | 8,120,000 | | | | 8,272,250 | |
Hertz Corporation | | | 6.75 | | | | 4-15-2019 | | | | 2,800,000 | | | | 2,863,000 | |
Hertz Corporation | | | 7.50 | | | | 10-15-2018 | | | | 5,870,000 | | | | 5,994,738 | |
Service Corporation International | | | 7.00 | | | | 6-15-2017 | | | | 14,676,000 | | | | 15,776,700 | |
| | | | |
| | | | | | | | | | | | | | | 44,459,633 | |
| | | | | | | | | | | | | | | | |
| | | | |
| Hotels, Restaurants & Leisure: 1.42% | | | | | | | | | | | | | | | | |
Hilton Worldwide Finance LLC | | | 5.63 | | | | 10-15-2021 | | | | 8,450,000 | | | | 8,809,125 | |
MGM Resorts International | | | 7.50 | | | | 6-1-2016 | | | | 5,265,000 | | | | 5,449,275 | |
MGM Resorts International | | | 7.63 | | | | 1-15-2017 | | | | 5,735,000 | | | | 6,036,088 | |
| | | | |
| | | | | | | | | | | | | | | 20,294,488 | |
| | | | | | | | | | | | | | | | |
| | | | |
| Household Durables: 3.99% | | | | | | | | | | | | | | | | |
Beazer Homes USA Company | | | 6.63 | | | | 4-15-2018 | | | | 13,090,000 | | | | 13,482,700 | |
DR Horton Incorporated | | | 3.63 | | | | 2-15-2018 | | | | 3,930,000 | | | | 3,988,950 | |
DR Horton Incorporated | | | 4.75 | | | | 5-15-2017 | | | | 6,050,000 | | | | 6,246,625 | |
Jarden Corporation | | | 7.50 | | | | 5-1-2017 | | | | 13,115,000 | | | | 14,098,625 | |
Lennar Corporation | | | 4.13 | | | | 12-1-2018 | | | | 12,870,000 | | | | 13,095,225 | |
Lennar Corporation | | | 4.75 | | | | 12-15-2017 | | | | 600,000 | | | | 622,500 | |
Pulte Group Incorporated | | | 7.63 | | | | 10-15-2017 | | | | 5,185,000 | | | | 5,703,500 | |
| | | | |
| | | | | | | | | | | | | | | 57,238,125 | |
| | | | | | | | | | | | | | | | |
| | | | |
| Media: 4.26% | | | | | | | | | | | | | | | | |
CCO Holdings LLC | | | 7.38 | | | | 6-1-2020 | | | | 18,865,000 | | | | 19,666,763 | |
CSC Holdings LLC | | | 7.63 | | | | 7-15-2018 | | | | 8,050,000 | | | | 8,814,750 | |
DISH DBS Corporation | | | 4.25 | | | | 4-1-2018 | | | | 14,670,000 | | | | 14,625,843 | |
Gannett Company Incorporated | | | 5.13 | | | | 10-15-2019 | | | | 9,910,000 | | | | 10,232,075 | |
Nexstar Broadcasting Group Incorporated | | | 6.88 | | | | 11-15-2020 | | | | 3,170,000 | | | | 3,328,500 | |
Starz LLC/Starz Finance Corporation | | | 5.00 | | | | 9-15-2019 | | | | 4,310,000 | | | | 4,320,775 | |
| | | | |
| | | | | | | | | | | | | | | 60,988,706 | |
| | | | | | | | | | | | | | | | |
| | | | |
| Specialty Retail: 3.14% | | | | | | | | | | | | | | | | |
Best Buy Company Incorporated | | | 5.00 | | | | 8-1-2018 | | | | 8,880,000 | | | | 9,392,376 | |
L Brands Incorporated | | | 8.50 | | | | 6-15-2019 | | | | 2,700,000 | | | | 3,179,250 | |
Limited Brands Incorporated | | | 6.90 | | | | 7-15-2017 | | | | 12,815,000 | | | | 13,904,275 | |
Sally Holdings Incorporated | | | 6.88 | | | | 11-15-2019 | | | | 17,825,000 | | | | 18,582,563 | |
| | | | |
| | | | | | | | | | | | | | | 45,058,464 | |
| | | | | | | | | | | | | | | | |
The accompanying notes are an integral part of these financial statements.
| | | | |
| 10 | | Wells Fargo Advantage Short-Term High Yield Bond Fund | | Portfolio of investments—August 31, 2015 |
| | | | | | | | | | | | | | | | |
| Security name | | Interest rate | | | Maturity date | | | Principal | | | Value | |
| | | | |
| Textiles, Apparel & Luxury Goods: 0.37% | | | | | | | | | | | | | | | | |
HanesBrands Incorporated | | | 6.38 | % | | | 12-15-2020 | | | $ | 5,035,000 | | | $ | 5,242,694 | |
| | | | | | | | | | | | | | | | |
| | | | |
Consumer Staples: 1.00% | | | | | | | | | | | | | | | | |
| | | | |
| Household Products: 1.00% | | | | | | | | | | | | | | | | |
Spectrum Brands Incorporated | | | 6.38 | | | | 11-15-2020 | | | | 13,495,000 | | | | 14,287,831 | |
| | | | | | | | | | | | | | | | |
| | | | |
Energy: 5.65% | | | | | | | | | | | | | | | | |
| | | | |
| Energy Equipment & Services: 2.41% | | | | | | | | | | | | | | | | |
Exterran Holdings Incorporated | | | 7.25 | | | | 12-1-2018 | | | | 7,840,000 | | | | 7,683,200 | |
SESI LLC | | | 6.38 | | | | 5-1-2019 | | | | 16,400,000 | | | | 16,318,000 | |
Targa Resources Partners 144A | | | 5.00 | | | | 1-15-2018 | | | | 10,655,000 | | | | 10,548,450 | |
| | | | |
| | | | | | | | | | | | | | | 34,549,650 | |
| | | | | | | | | | | | | | | | |
| | | | |
| Oil, Gas & Consumable Fuels: 3.24% | | | | | | | | | | | | | | | | |
Kinder Morgan Finance Company LLC 144A | | | 6.00 | | | | 1-15-2018 | | | | 9,000,000 | | | | 9,623,277 | |
Kinder Morgan Incorporated | | | 7.00 | | | | 6-15-2017 | | | | 5,300,000 | | | | 5,694,278 | |
Sabine Pass LNG LP | | | 7.50 | | | | 11-30-2016 | | | | 8,430,000 | | | | 8,682,900 | |
Tesoro Corporation | | | 4.25 | | | | 10-1-2017 | | | | 4,000,000 | | | | 4,090,000 | |
Tesoro Logistics LP | | | 5.88 | | | | 10-1-2020 | | | | 3,615,000 | | | | 3,624,038 | |
WPX Energy Incorporated | | | 5.25 | | | | 1-15-2017 | | | | 14,965,000 | | | | 14,703,113 | |
| | | | |
| | | | | | | | | | | | | | | 46,417,606 | |
| | | | | | | | | | | | | | | | |
| | | | |
Financials: 7.00% | | | | | | | | | | | | | | | | |
| | | | |
| Banks: 1.55% | | | | | | | | | | | | | | | | |
CIT Group Incorporated | | | 4.25 | | | | 8-15-2017 | | | | 21,755,000 | | | | 22,081,325 | |
CIT Group Incorporated | | | 5.00 | | | | 5-15-2017 | | | | 135,000 | | | | 138,881 | |
| | | | |
| | | | | | | | | | | | | | | 22,220,206 | |
| | | | | | | | | | | | | | | | |
| | | | |
| Consumer Finance: 3.41% | | | | | | | | | | | | | | | | |
Ally Financial Incorporated ± | | | 2.97 | | | | 7-18-2016 | | | | 4,560,000 | | | | 4,590,242 | |
Ally Financial Incorporated | | | 5.50 | | | | 2-15-2017 | | | | 9,500,000 | | | | 9,810,650 | |
Ally Financial Incorporated | | | 6.25 | | | | 12-1-2017 | | | | 1,915,000 | | | | 2,039,475 | |
General Motors Financial Company Incorporated | | | 3.25 | | | | 5-15-2018 | | | | 11,880,000 | | | | 11,946,421 | |
Navient Corporation | | | 6.00 | | | | 1-25-2017 | | | | 8,000,000 | | | | 8,130,000 | |
SLM Corporation | | | 4.63 | | | | 9-25-2017 | | | | 870,000 | | | | 863,475 | |
Toll Brothers Finance Corporation | | | 4.00 | | | | 12-31-2018 | | | | 2,650,000 | | | | 2,703,000 | |
Toll Brothers Finance Corporation | | | 8.91 | | | | 10-15-2017 | | | | 7,750,000 | | | | 8,738,125 | |
| | | | |
| | | | | | | | | | | | | | | 48,821,388 | |
| | | | | | | | | | | | | | | | |
| | | | |
| Insurance: 0.61% | | | | | | | | | | | | | | | | |
Genworth Financial Incorporated | | | 8.63 | | | | 12-15-2016 | | | | 8,350,000 | | | | 8,819,688 | |
| | | | | | | | | | | | | | | | |
| | | | |
| REITs: 1.43% | | | | | | | | | | | | | | | | |
ARC Properties Operating Partnership LP | | | 2.00 | | | | 2-6-2017 | | | | 7,670,000 | | | | 7,487,838 | |
Iron Mountain Incorporated | | | 7.75 | | | | 10-1-2019 | | | | 12,520,000 | | | | 13,020,800 | |
| | | | |
| | | | | | | | | | | | | | | 20,508,638 | |
| | | | | | | | | | | | | | | | |
The accompanying notes are an integral part of these financial statements.
| | | | | | |
| Portfolio of investments—August 31, 2015 | | Wells Fargo Advantage Short-Term High Yield Bond Fund | | | 11 | |
| | | | | | | | | | | | | | | | |
| Security name | | Interest rate | | | Maturity date | | | Principal | | | Value | |
| | | | |
Health Care: 3.08% | | | | | | | | | | | | | | | | |
| | | | |
| Health Care Providers & Services: 2.36% | | | | | | | | | | | | | | | | |
Fresenius Medical Care Holdings Incorporated | | | 6.88 | % | | | 7-15-2017 | | | $ | 12,834,000 | | | $ | 13,892,805 | |
HCA Incorporated | | | 8.00 | | | | 10-1-2018 | | | | 6,610,000 | | | | 7,584,975 | |
Tenet Healthcare Corporation | | | 6.25 | | | | 11-1-2018 | | | | 11,125,000 | | | | 12,056,719 | |
Universal Health Services Incorporated | | | 7.13 | | | | 6-30-2016 | | | | 300,000 | | | | 312,375 | |
| | | | |
| | | | | | | | | | | | | | | 33,846,874 | |
| | | | | | | | | | | | | | | | |
| | | | |
| Pharmaceuticals: 0.72% | | | | | | | | | | | | | | | | |
Endo Finance LLC/Endo Finco Incorporated 144A | | | 7.25 | | | | 12-15-2020 | | | | 9,867,000 | | | | 10,286,348 | |
| | | | | | | | | | | | | | | | |
| | | | |
Industrials: 7.24% | | | | | | | | | | | | | | | | |
| | | | |
| Aerospace & Defense: 0.03% | | | | | | | | | | | | | | | | |
Huntington Ingalls Industries Incorporated | | | 7.13 | | | | 3-15-2021 | | | | 365,000 | | | | 386,444 | |
| | | | | | | | | | | | | | | | |
| | | | |
| Airlines: 0.74% | | | | | | | | | | | | | | | | |
United Continental Holdings Incorporated | | | 6.38 | | | | 6-1-2018 | | | | 10,125,000 | | | | 10,593,281 | |
| | | | | | | | | | | | | | | | |
| | | | |
| Building Products: 0.24% | | | | | | | | | | | | | | | | |
Masco Corporation | | | 5.85 | | | | 3-15-2017 | | | | 508,000 | | | | 536,321 | |
USG Corporation | | | 9.75 | | | | 1-15-2018 | | | | 2,570,000 | | | | 2,897,675 | |
| | | | |
| | | | | | | | | | | | | | | 3,433,996 | |
| | | | | | | | | | | | | | | | |
| | | | |
| Commercial Services & Supplies: 1.09% | | | | | | | | | | | | | | | | |
ADT Corporation | | | 2.25 | | | | 7-15-2017 | | | | 13,255,000 | | | | 13,238,431 | |
Mobile Mini Incorporated | | | 7.88 | | | | 12-1-2020 | | | | 470,000 | | | | 489,975 | |
RR Donnelley & Sons Company | | | 7.25 | | | | 5-15-2018 | | | | 1,705,000 | | | | 1,812,790 | |
| | | | |
| | | | | | | | | | | | | | | 15,541,196 | |
| | | | | | | | | | | | | | | | |
| | | | |
| Machinery: 2.54% | | | | | | | | | | | | | | | | |
Case New Holland Industrial Incorporated | | | 7.88 | | | | 12-1-2017 | | | | 16,095,000 | | | | 17,442,956 | |
Manitowoc Company Incorporated | | | 8.50 | | | | 11-1-2020 | | | | 6,140,000 | | | | 6,435,488 | |
SPX Corporation | | | 6.88 | | | | 9-1-2017 | | | | 11,805,000 | | | | 12,572,325 | |
| | | | |
| | | | | | | | | | | | | | | 36,450,769 | |
| | | | | | | | | | | | | | | | |
| | | | |
| Trading Companies & Distributors: 2.60% | | | | | | | | | | | | | | | | |
Aircastle Limited | | | 4.63 | | | | 12-15-2018 | | | | 13,060,000 | | | | 13,419,150 | |
International Lease Finance Corporation | | | 5.75 | | | | 5-15-2016 | | | | 2,750,000 | | | | 2,801,563 | |
United Rentals North America Incorporated | | | 7.38 | | | | 5-15-2020 | | | | 19,870,000 | | | | 21,087,038 | |
| | | | |
| | | | | | | | | | | | | | | 37,307,751 | |
| | | | | | | | | | | | | | | | |
| | | | |
Information Technology: 2.19% | | | | | | | | | | | | | | | | |
| | | | |
| Communications Equipment: 0.39% | | | | | | | | | | | | | | | | |
ViaSat Incorporated | | | 6.88 | | | | 6-15-2020 | | | | 5,260,000 | | | | 5,523,000 | |
| | | | | | | | | | | | | | | | |
| | | | |
| Electronic Equipment, Instruments & Components: 0.60% | | | | | | | | | | | | | | | | |
Jabil Circuit Incorporated | | | 7.75 | | | | 7-15-2016 | | | | 8,300,000 | | | | 8,632,000 | |
| | | | | | | | | | | | | | | | |
The accompanying notes are an integral part of these financial statements.
| | | | |
| 12 | | Wells Fargo Advantage Short-Term High Yield Bond Fund | | Portfolio of investments—August 31, 2015 |
| | | | | | | | | | | | | | | | |
| Security name | | Interest rate | | | Maturity date | | | Principal | | | Value | |
| | | | |
| Internet Software & Services: 0.96% | | | | | | | | | | | | | | | | |
IAC/InterActiveCorp | | | 4.88 | % | | | 11-30-2018 | | | $ | 13,400,000 | | | $ | 13,768,500 | |
| | | | | | | | | | | | | | | | |
| | | | |
| Technology Hardware, Storage & Peripherals: 0.24% | | | | | | | | | | | | | | | | |
Dell Incorporated | | | 5.88 | | | | 6-15-2019 | | | | 3,280,000 | | | | 3,402,672 | |
| | | | | | | | | | | | | | | | |
| | | | |
Materials: 4.22% | | | | | | | | | | | | | | | | |
| | | | |
| Chemicals: 0.33% | | | | | | | | | | | | | | | | |
PolyOne Corporation | | | 7.38 | | | | 9-15-2020 | | | | 4,480,000 | | | | 4,654,720 | |
| | | | | | | | | | | | | | | | |
| | | | |
| Construction Materials: 0.10% | | | | | | | | | | | | | | | | |
Vulcan Materials Company | | | 7.00 | | | | 6-15-2018 | | | | 1,265,000 | | | | 1,427,869 | |
| | | | | | | | | | | | | | | | |
| | | | |
| Containers & Packaging: 1.50% | | | | | | | | | | | | | | | | |
Crown Americas LLC | | | 6.25 | | | | 2-1-2021 | | | | 3,025,000 | | | | 3,149,781 | |
Greif Incorporated | | | 6.75 | | | | 2-1-2017 | | | | 4,470,000 | | | | 4,648,800 | |
Owens Brockway Glass Container Incorporated | | | 7.38 | | | | 5-15-2016 | | | | 3,280,000 | | | | 3,398,900 | |
Owens-Illinois Incorporated | | | 7.80 | | | | 5-15-2018 | | | | 9,305,000 | | | | 10,282,025 | |
| | | | |
| | | | | | | | | | | | | | | 21,479,506 | |
| | | | | | | | | | | | | | | | |
| | | | |
| Metals & Mining: 2.29% | | | | | | | | | | | | | | | | |
Commercial Metals Company | | | 7.35 | | | | 8-15-2018 | | | | 13,150,000 | | | | 14,004,750 | |
Steel Dynamics Incorporated | | | 6.13 | | | | 8-15-2019 | | | | 9,690,000 | | | | 10,041,263 | |
Sunchoke Energy Incorporated | | | 7.63 | | | | 8-1-2019 | | | | 1,831,000 | | | | 1,867,620 | |
US Steel Corporation | | | 7.00 | | | | 2-1-2018 | | | | 6,923,000 | | | | 6,957,615 | |
| | | | |
| | | | | | | | | | | | | | | 32,871,248 | |
| | | | | | | | | | | | | | | | |
| | | | |
Telecommunication Services: 3.09% | | | | | | | | | | | | | | | | |
| | | | |
| Diversified Telecommunication Services: 1.41% | | | | | | | | | | | | | | | | |
CenturyLink Incorporated | | | 6.00 | | | | 4-1-2017 | | | | 10,390,000 | | | | 10,935,475 | |
Frontier Communications Corporation | | | 8.13 | | | | 10-1-2018 | | | | 8,540,000 | | | | 9,223,200 | |
| | | | |
| | | | | | | | | | | | | | | 20,158,675 | |
| | | | | | | | | | | | | | | | |
| | | | |
| Wireless Telecommunication Services: 1.68% | | | | | | | | | | | | | | | | |
Sprint Nextel Corporation | | | 6.00 | | | | 12-1-2016 | | | | 14,260,000 | | | | 14,580,850 | |
T-Mobile USA Incorporated | | | 6.46 | | | | 4-28-2019 | | | | 9,270,000 | | | | 9,536,513 | |
| | | | |
| | | | | | | | | | | | | | | 24,117,363 | |
| | | | | | | | | | | | | | | | |
| | | | |
Utilities: 1.84% | | | | | | | | | | | | | | | | |
| | | | |
| Gas Utilities: 0.65% | | | | | | | | | | | | | | | | |
AmeriGas Partners LP | | | 6.25 | | | | 8-20-2019 | | | | 9,085,000 | | | | 9,289,413 | |
| | | | | | | | | | | | | | | | |
| | | | |
| Independent Power & Renewable Electricity Producers: 1.19% | | | | | | | | | | | | | | | | |
NRG Energy Incorporated | | | 7.63 | | | | 1-15-2018 | | | | 16,230,000 | | | | 17,122,640 | |
| | | | | | | | | | | | | | | | |
| | | | |
Total Corporate Bonds and Notes (Cost $797,162,923) | | | | | | | | | | | | | | | 788,106,582 | |
| | | | | | | | | | | | | | | | |
The accompanying notes are an integral part of these financial statements.
| | | | | | |
| Portfolio of investments—August 31, 2015 | | Wells Fargo Advantage Short-Term High Yield Bond Fund | | | 13 | |
| | | | | | | | | | | | | | | | |
| Security name | | Interest rate | | | Maturity date | | | Principal | | | Value | |
| | | | |
Loans: 31.25% | | | | | | | | | | | | | | | | |
| | | | |
Consumer Discretionary: 6.79% | | | | | | | | | | | | | | | | |
| | | | |
| Auto Components: 0.49% | | | | | | | | | | | | | | | | |
Allison Transmission Incorporated ± | | | 2.95 | % | | | 8-7-2017 | | | $ | 930,761 | | | $ | 928,285 | |
Allison Transmission Incorporated ± | | | 3.50 | | | | 8-23-2019 | | | | 6,166,853 | | | | 6,150,018 | |
| | | | |
| | | | | | | | | | | | | | | 7,078,303 | |
| | | | | | | | | | | | | | | | |
| | | | |
| Automobiles: 1.40% | | | | | | | | | | | | | | | | |
Chrysler Group LLC ± | | | 3.50 | | | | 5-24-2017 | | | | 7,709,018 | | | | 7,692,983 | |
The Hertz Corporation ± | | | 3.00 | | | | 3-11-2018 | | | | 10,046,062 | | | | 9,945,601 | |
The Hertz Corporation ± | | | 3.75 | | | | 3-11-2018 | | | | 2,487,245 | | | | 2,473,267 | |
| | | | |
| | | | | | | | | | | | | | | 20,111,851 | |
| | | | | | | | | | | | | | | | |
| | | | |
| Hotels, Restaurants & Leisure: 1.07% | | | | | | | | | | | | | | | | |
Aramark Corporation ± | | | 3.25 | | | | 9-7-2019 | | | | 14,137,750 | | | | 14,081,199 | |
Aramark Corporation ± | | | 3.69 | | | | 7-26-2016 | | | | 253,281 | | | | 251,065 | |
Cinemark USA Incorporated ± | | | 3.20 | | | | 5-6-2022 | | | | 975,000 | | | | 976,521 | |
| | | | |
| | | | | | | | | | | | | | | 15,308,785 | |
| | | | | | | | | | | | | | | | |
| | | | |
| Household Durables: 0.91% | | | | | | | | | | | | | | | | |
Serta Simmons Holdings LLC ± | | | 4.25 | | | | 10-1-2019 | | | | 1,771,260 | | | | 1,770,941 | |
Tempur-Pedic International Incorporated ± | | | 3.50 | | | | 3-18-2020 | | | | 11,210,644 | | | | 11,193,716 | |
| | | | |
| | | | | | | | | | | | | | | 12,964,657 | |
| | | | | | | | | | | | | | | | |
| | | | |
| Media: 1.95% | | | | | | | | | | | | | | | | |
Cequel Communications LLC ± | | | 3.50 | | | | 2-14-2019 | | | | 13,032,985 | | | | 12,959,739 | |
Virgin Media Investment Holdings Limited ± | | | 3.50 | | | | 6-30-2023 | | | | 15,187,695 | | | | 15,003,316 | |
| | | | |
| | | | | | | | | | | | | | | 27,963,055 | |
| | | | | | | | | | | | | | | | |
| | | | |
| Specialty Retail: 0.97% | | | | | | | | | | | | | | | | |
Michaels Stores Incorporated ± | | | 3.75 | | | | 1-28-2020 | | | | 13,889,670 | | | | 13,835,917 | |
| | | | | | | | | | | | | | | | |
| | | | |
Consumer Staples: 1.79% | | | | | | | | | | | | | | | | |
| | | | |
| Food Products: 1.79% | | | | | | | | | | | | | | | | |
NBTY Incorporated ± | | | 3.50 | | | | 10-1-2017 | | | | 8,552,889 | | | | 8,506,533 | |
Pinnacle Foods Finance LLC ± | | | 3.00 | | | | 4-29-2020 | | | | 10,066,631 | | | | 10,002,506 | |
Reynolds Group Holdings Incorporated ± | | | 4.50 | | | | 12-1-2018 | | | | 7,118,478 | | | | 7,112,285 | |
| | | | |
| | | | | | | | | | | | | | | 25,621,324 | |
| | | | | | | | | | | | | | | | |
| | | | |
Energy: 0.44% | | | | | | | | | | | | | | | | |
| | | | |
| Oil, Gas & Consumable Fuels: 0.44% | | | | | | | | | | | | | | | | |
EFS Cogen Holdings I LLC ± | | | 3.75 | | | | 12-17-2020 | | | | 6,418,125 | | | | 6,398,100 | |
| | | | | | | | | | | | | | | | |
| | | | |
Financials: 1.29% | | | | | | | | | | | | | | | | |
| | | | |
| Diversified Financial Services: 0.69% | | | | | | | | | | | | | | | | |
Delos Finance SARL ± | | | 3.50 | | | | 3-6-2021 | | | | 9,865,000 | | | | 9,847,736 | |
| | | | | | | | | | | | | | | | |
| | | | |
| REITs: 0.60% | | | | | | | | | | | | | | | | |
Crown Castle Operating Company ± | | | 3.00 | | | | 1-31-2021 | | | | 8,684,787 | | | | 8,647,269 | |
| | | | | | | | | | | | | | | | |
The accompanying notes are an integral part of these financial statements.
| | | | |
| 14 | | Wells Fargo Advantage Short-Term High Yield Bond Fund | | Portfolio of investments—August 31, 2015 |
| | | | | | | | | | | | | | | | |
| Security name | | Interest rate | | | Maturity date | | | Principal | | | Value | |
| | | | |
Health Care: 5.24% | | | | | | | | | | | | | | | | |
| | | | |
| Health Care Providers & Services: 3.87% | | | | | | | | | | | | | | | | |
Community Health Systems Incorporated ± | | | 4.00 | % | | | 1-27-2021 | | | $ | 4,414,520 | | | $ | 4,422,554 | |
Community Health Systems Incorporated ± | | | 3.75 | | | | 12-31-2019 | | | | 2,399,230 | | | | 2,394,744 | |
Community Health Systems Incorporated ± | | | 3.57 | | | | 12-31-2018 | | | | 10,044,647 | | | | 10,032,091 | |
HCA Incorporated ± | | | 2.95 | | | | 3-31-2017 | | | | 8,842,500 | | | | 8,821,543 | |
Iasis Healthcare LLC ± | | | 4.50 | | | | 5-3-2018 | | | | 15,173,494 | | | | 15,176,225 | |
Lifepoint Hospitals Incorporated ± | | | 2.70 | | | | 7-24-2017 | | | | 4,793,654 | | | | 4,790,682 | |
Select Medical Corporation ± | | | 3.04 | | | | 12-20-2016 | | | | 915,973 | | | | 914,828 | |
Select Medical Corporation ± | | | 3.75 | | | | 6-1-2018 | | | | 8,984,238 | | | | 8,955,040 | |
| | | | |
| | | | | | | | | | | | | | | 55,507,707 | |
| | | | | | | | | | | | | | | | |
| | | | |
| Pharmaceuticals: 1.37% | | | | | | | | | | | | | | | | |
Valeant Pharmaceuticals International Incorporated ± | | | 3.50 | | | | 2-13-2019 | | | | 19,677,867 | | | | 19,606,043 | |
| | | | | | | | | | | | | | | | |
| | | | |
Industrials: 5.05% | | | | | | | | | | | | | | | | |
| | | | |
| Aerospace & Defense: 1.22% | | | | | | | | | | | | | | | | |
TransDigm Incorporated ± | | | 3.50 | | | | 5-14-2022 | | | | 772,524 | | | | 763,030 | |
TransDigm Incorporated ± | | | 3.75 | | | | 2-28-2020 | | | | 16,920,425 | | | | 16,736,162 | |
| | | | |
| | | | | | | | | | | | | | | 17,499,192 | |
| | | | | | | | | | | | | | | | |
| | | | |
| Airlines: 0.77% | | | | | | | | | | | | | | | | |
Delta Air Lines Incorporated ±< | | | 0.00 | | | | 8-12-2022 | | | | 11,130,000 | | | | 11,088,263 | |
| | | | | | | | | | | | | | | | |
| | | | |
| Commercial Services & Supplies: 2.16% | | | | | | | | | | | | | | | | |
KAR Auction Services Incorporated ± | | | 3.50 | | | | 3-7-2021 | | | | 10,605,583 | | | | 10,592,220 | |
Novelis Incorporated ± | | | 4.00 | | | | 6-2-2022 | | | | 13,162,377 | | | | 13,004,034 | |
Sensata Technologies BV ± | | | 3.00 | | | | 10-14-2021 | | | | 3,824,705 | | | | 3,812,160 | |
ServiceMaster Company ± | | | 4.25 | | | | 7-1-2021 | | | | 3,498,744 | | | | 3,478,766 | |
| | | | |
| | | | | | | | | | | | | | | 30,887,180 | |
| | | | | | | | | | | | | | | | |
| | | | |
| Communications Equipment: 0.78% | | | | | | | | | | | | | | | | |
DigitalGlobe Incorporated ± | | | 3.75 | | | | 1-31-2020 | | | | 11,268,199 | | | | 11,207,125 | |
| | | | | | | | | | | | | | | | |
| | | | |
| Machinery: 0.12% | | | | | | | | | | | | | | | | |
The Manitowoc Company Incorporated ± | | | 3.25 | | | | 1-3-2021 | | | | 1,685,000 | | | | 1,663,938 | |
| | | | | | | | | | | | | | | | |
| | | | |
Information Technology: 3.12% | | | | | | | | | | | | | | | | |
| | | | |
| Internet Software & Services: 1.99% | | | | | | | | | | | | | | | | |
Activision Blizzard Incorporated ± | | | 3.25 | | | | 10-12-2020 | | | | 12,091,250 | | | | 12,096,328 | |
Zayo Group LLC ± | | | 3.75 | | | | 5-6-2021 | | | | 16,479,994 | | | | 16,374,358 | |
| | | | |
| | | | | | | | | | | | | | | 28,470,686 | |
| | | | | | | | | | | | | | | | |
| | | | |
| Technology Hardware, Storage & Peripherals: 1.13% | | | | | | | | | | | | | | | | |
CDW LLC ± | | | 3.25 | | | | 4-29-2020 | | | | 16,376,281 | | | | 16,235,609 | |
| | | | | | | | | | | | | | | | |
| | | | |
Materials: 3.24% | | | | | | | | | | | | | | | | |
| | | | |
| Chemicals: 2.16% | | | | | | | | | | | | | | | | |
Huntsman International LLC ± | | | 3.75 | | | | 10-1-2021 | | | | 11,064,400 | | | | 11,050,570 | |
Ineos US Finance LLC ± | | | 3.75 | | | | 12-15-2020 | | | | 20,049,951 | | | | 19,862,083 | |
| | | | |
| | | | | | | | | | | | | | | 30,912,653 | |
| | | | | | | | | | | | | | | | |
The accompanying notes are an integral part of these financial statements.
| | | | | | |
| Portfolio of investments—August 31, 2015 | | Wells Fargo Advantage Short-Term High Yield Bond Fund | | | 15 | |
| | | | | | | | | | | | | | | | |
| Security name | | Interest rate | | | Maturity date | | | Principal | | | Value | |
| | | | |
| Containers & Packaging: 1.08% | | | | | | | | | | | | | | | | |
Berry Plastics Group Incorporated ± | | | 3.50 | % | | | 2-8-2020 | | | $ | 15,755,559 | | | $ | 15,508,354 | |
| | | | | | | | | | | | | | | | |
| | | | |
Telecommunication Services: 4.29% | | | | | | | | | | | | | | | | |
| | | | |
| Diversified Telecommunication Services: 2.98% | | | | | | | | | | | | | | | | |
Intelsat Jackson Holdings SA ± | | | 3.75 | | | | 6-30-2019 | | | | 14,548,512 | | | | 14,275,727 | |
Level 3 Financing Incorporated ± | | | 3.50 | | | | 5-31-2022 | | | | 7,610,000 | | | | 7,533,900 | |
Level 3 Financing Incorporated ± | | | 4.00 | | | | 1-15-2020 | | | | 8,300,000 | | | | 8,292,198 | |
West Corporation ± | | | 3.25 | | | | 6-30-2018 | | | | 12,772,955 | | | | 12,638,839 | |
| | | | |
| | | | | | | | | | | | | | | 42,740,664 | |
| | | | | | | | | | | | | | | | |
| | | | |
| Wireless Telecommunication Services: 1.31% | | | | | | | | | | | | | | | | |
SBA Communications Corporation ± | | | 3.25 | | | | 3-24-2021 | | | | 13,597,749 | | | | 13,442,599 | |
SunGard Data Systems Incorporated ± | | | 4.00 | | | | 3-8-2020 | | | | 5,317,693 | | | | 5,306,047 | |
| | | | |
| | | | | | | | | | | | | | | 18,748,646 | |
| | | | | | | | | | | | | | | | |
| | | | |
Total Loans (Cost $450,918,647) | | | | | | | | | | | | | | | 447,853,057 | |
| | | | | | | | | | | | | | | | |
| | | | |
Municipal Obligations: 1.06% | | | | | | | | | | | | | | | | |
| | | | |
| Alabama: 0.27% | | | | | | | | | | | | | | | | |
Jefferson County AL Taxable Warrants Series B (GO Revenue) | | | 4.90 | | | | 4-1-2017 | | | | 2,815,000 | | | | 2,852,552 | |
Jefferson County AL Taxable Warrants Series D (GO Revenue) | | | 4.90 | | | | 4-1-2017 | | | | 1,025,000 | | | | 1,038,674 | |
| | | | |
| | | | | | | | | | | | | | | 3,891,226 | |
| | | | | | | | | | | | | | | | |
| | | | |
| California: 0.12% | | | | | | | | | | | | | | | | |
Oakland CA Redevelopment Agency Refunding Bond Subordinated Housing Series A (Tax Revenue, Ambac Insured) | | | 5.38 | | | | 9-1-2016 | | | | 1,755,000 | | | | 1,767,443 | |
| | | | | | | | | | | | | | | | |
| | | | |
| Illinois: 0.35% | | | | | | | | | | | | | | | | |
Chicago IL Board of Education Series G (GO Revenue) ± | | | 4.02 | | | | 3-1-2032 | | | | 5,000,000 | | | | 4,947,350 | |
| | | | | | | | | | | | | | | | |
| | | | |
| Texas: 0.32% | | | | | | | | | | | | | | | | |
Dallas-Fort Worth TX International Airport Facilities Improvement Corporation (Industrial Development Revenue) | | | 7.00 | | | | 1-1-2016 | | | | 4,485,000 | | | | 4,547,925 | |
| | | | | | | | | | | | | | | | |
| | | | |
Total Municipal Obligations (Cost $15,193,357) | | | | | | | | | | | | | | | 15,153,944 | |
| | | | | | | | | | | | | | | | |
| | | | |
Non-Agency Mortgage-Backed Securities: 0.00% | | | | | | | | | | | | | | | | |
Salomon Brothers Mortgage Securities VII Series 1994-5 Class B2 ±(i) | | | 2.76 | | | | 4-25-2024 | | | | 39,596 | | | | 33,756 | |
| | | | | | | | | | | | | | | | |
| | | | |
Total Non-Agency Mortgage-Backed Securities (Cost $39,213) | | | | | | | | | | | | | | | 33,756 | |
| | | | | | | | | | | | | | | | |
| | | | |
Yankee Corporate Bonds and Notes: 7.56% | | | | | | | | | | | | | | | | |
| | | | |
Consumer Discretionary: 2.70% | | | | | | | | | | | | | | | | |
| | | | |
| Auto Components: 0.82% | | | | | | | | | | | | | | | | |
Schaeffler Holding Finance B.V. 144A | | | 6.25 | | | | 11-15-2019 | | | | 11,130,000 | | | | 11,714,325 | |
| | | | | | | | | | | | | | | | |
| | | | |
| Automobiles: 0.93% | | | | | | | | | | | | | | | | |
Jaguar Land Rover Automotive plc 144A | | | 4.13 | | | | 12-15-2018 | | | | 13,235,000 | | | | 13,334,263 | |
| | | | | | | | | | | | | | | | |
| | | | |
| Diversified Consumer Services: 0.34% | | | | | | | | | | | | | | | | |
AerCap Ireland Capital Limited | �� | | 2.75 | | | | 5-15-2017 | | | | 4,955,000 | | | | 4,905,450 | |
| | | | | | | | | | | | | | | | |
The accompanying notes are an integral part of these financial statements.
| | | | |
| 16 | | Wells Fargo Advantage Short-Term High Yield Bond Fund | | Portfolio of investments—August 31, 2015 |
| | | | | | | | | | | | | | | | |
| Security name | | Interest rate | | | Maturity date | | | Principal | | | Value | |
| | | | |
| Media: 0.61% | | | | | | | | | | | | | | | | |
Numericable Group SA 144A | | | 4.88 | % | | | 5-15-2019 | | | $ | 8,745,000 | | | $ | 8,810,588 | |
| | | | | | | | | | | | | | | | |
| | | | |
Financials: 0.52% | | | | | | | | | | | | | | | | |
| | | | |
| Banks: 0.52% | | | | | | | | | | | | | | | | |
Royal Bank of Scotland Group plc | | | 4.70 | | | | 7-3-2018 | | | | 7,240,000 | | | | 7,470,449 | |
| | | | | | | | | | | | | | | | |
| | | | |
Health Care: 1.01% | | | | | | | | | | | | | | | | |
| | | | |
| Pharmaceuticals: 1.01% | | | | | | | | | | | | | | | | |
Mallinckrodt International Finance SA | | | 3.50 | | | | 4-15-2018 | | | | 14,520,000 | | | | 14,520,000 | |
| | | | | | | | | | | | | | | | |
| | | | |
Information Technology: 1.58% | | | | | | | | | | | | | | | | |
| | | | |
| Communications Equipment: 0.63% | | | | | | | | | | | | | | | | |
Nokia Corporation | | | 5.38 | | | | 5-15-2019 | | | | 8,425,000 | | | | 8,951,563 | |
| | | | | | | | | | | | | | | | |
| | | | |
| Electronic Equipment, Instruments & Components: 0.95% | | | | | | | | | | | | | | | | |
NXP BV/NXP Funding LLC 144A | | | 3.50 | | | | 9-15-2016 | | | | 13,600,000 | | | | 13,668,000 | |
| | | | | | | | | | | | | | | | |
| | | | |
Materials: 1.60% | | | | | | | | | | | | | | | | |
| | | | |
| Metals & Mining: 1.02% | | | | | | | | | | | | | | | | |
ArcelorMittal SA | | | 6.13 | | | | 6-1-2018 | | | | 14,000,000 | | | | 14,560,000 | |
| | | | | | | | | | | | | | | | |
| | | | |
| Paper & Forest Products: 0.58% | | | | | | | | | | | | | | | | |
Sappi Papier Holding GmbH 144A | | | 6.63 | | | | 4-15-2021 | | | | 8,165,000 | | | | 8,369,125 | |
| | | | | | | | | | | | | | | | |
| | | | |
Telecommunication Services: 0.15% | | | | | | | | | | | | | | | | |
| | | | |
| Diversified Telecommunication Services: 0.15% | | | | | | | | | | | | | | | | |
Intelsat Jackson Holdings SA | | | 7.25 | | | | 4-1-2019 | | | | 2,140,000 | | | | 2,097,200 | |
| | | | | | | | | | | | | | | | |
| | | | |
Total Yankee Corporate Bonds and Notes (Cost $109,808,917) | | | | | | | | | | | | | | | 108,400,963 | |
| | | | | | | | | | | | | | | | |
| | | | |
| | | Yield | | | | | | Shares | | | | |
| Short-Term Investments: 4.93% | | | | | | | | | | | | | | | | |
| | | | |
| Investment Companies: 4.93% | | | | | | | | | | | | | | | | |
Wells Fargo Advantage Cash Investment Money Market Fund, Select Class (l)(u)## | | | 0.15 | | | | | | | | 70,743,835 | | | | 70,743,835 | |
| | | | | | | | | | | | | | | | |
| | | | |
Total Short-Term Investments (Cost $70,743,835) | | | | | | | | | | | | | | | 70,743,835 | |
| | | | | | | | | | | | | | | | |
| | | | | | | | |
| Total investments in securities (Cost $1,443,866,892)* | | | 99.80 | % | | | 1,430,292,137 | |
Other assets and liabilities, net | | | 0.20 | | | | 2,801,447 | |
| | | | | | | | |
| Total net assets | | | 100.00 | % | | $ | 1,433,093,584 | |
| | | | | | | | |
| ± | Variable rate investment. The rate shown is the rate in effect at period end. |
| 144A | The security may be resold in transactions exempt from registration, normally to qualified institutional buyers, pursuant to Rule 144A under the Securities Act of 1933. |
| < | All or a portion of the position represents an unfunded loan commitment. |
| (i) | Illiquid security for which the designation as illiquid is unaudited. |
| (l) | The security represents an affiliate of the Fund as defined in the Investment Company Act of 1940. |
| (u) | The rate represents the 7-day annualized yield at period end. |
| ## | All or a portion of this security is segregated for unfunded loans. |
| * | Cost for federal income tax purposes is $1,443,870,201 and unrealized gains (losses) consists of: |
| | | | |
Gross unrealized gains | | $ | 3,079,424 | |
Gross unrealized losses | | | (16,657,488 | ) |
| | | | |
Net unrealized losses | | $ | (13,578,064 | ) |
The accompanying notes are an integral part of these financial statements.
| | | | | | |
| Statement of assets and liabilities—August 31, 2015 | | Wells Fargo Advantage Short-Term High Yield Bond Fund | | | 17 | |
| | | | |
| | | | |
| |
Assets | | | | |
Investments | | | | |
In unaffiliated securities, at value (cost $1,373,123,057) | | $ | 1,359,548,302 | |
In affiliated securities, at value (cost $70,743,835) | | | 70,743,835 | |
| | | | |
Total investments, at value (cost $1,443,866,892) | | | 1,430,292,137 | |
Receivable for investments sold | | | 4,281,055 | |
Receivable for Fund shares sold | | | 3,834,536 | |
Receivable for interest | | | 15,196,763 | |
Receivable for securities lending income | | | 71 | |
Prepaid expenses and other assets | | | 60,722 | |
| | | | |
Total assets | | | 1,453,665,284 | |
| | | | |
| |
Liabilities | | | | |
Dividends payable | | | 540,890 | |
Payable for investments purchased | | | 14,074,997 | |
Payable for Fund shares redeemed | | | 5,021,736 | |
Management fee payable | | | 436,729 | |
Distribution fee payable | | | 79,398 | |
Administration fees payable | | | 142,437 | |
Accrued expenses and other liabilities | | | 275,513 | |
| | | | |
Total liabilities | | | 20,571,700 | |
| | | | |
Total net assets | | $ | 1,433,093,584 | |
| | | | |
| |
NET ASSETS CONSIST OF | | | | |
Paid-in capital | | $ | 1,463,621,404 | |
Accumulated net realized losses on investments | | | (16,953,065 | ) |
Net unrealized losses on investments | | | (13,574,755 | ) |
| | | | |
Total net assets | | $ | 1,433,093,584 | |
| | | | |
| |
COMPUTATION OF NET ASSET VALUE AND OFFERING PRICE PER SHARE | | | | |
Net assets – Class A | | $ | 203,856,155 | |
Shares outstanding – Class A1 | | | 25,258,667 | |
Net asset value per share – Class A | | | $8.07 | |
Maximum offering price per share – Class A2 | | | $8.32 | |
Net assets – Class C | | $ | 123,520,671 | |
Shares outstanding – Class C1 | | | 15,304,648 | |
Net asset value per share – Class C | | | $8.07 | |
Net assets – Administrator Class | | $ | 328,934,264 | |
Shares outstanding – Administrator Class1 | | | 40,770,792 | |
Net asset value per share – Administrator Class | | | $8.07 | |
Net assets – Institutional Class | | $ | 608,704,021 | |
Shares outstanding – Institutional Class1 | | | 75,549,060 | |
Net asset value per share – Institutional Class | | | $8.06 | |
Net assets – Investor Class | | $ | 168,078,473 | |
Shares outstanding – Investor Class1 | | | 20,824,543 | |
Net asset value per share – Investor Class | | | $8.07 | |
| 1 | The Fund has an unlimited number of authorized shares. |
| 2 | Maximum offering price is computed as 100/97 of net asset value. On investments of $50,000 or more, the offering price is reduced. |
The accompanying notes are an integral part of these financial statements.
| | | | |
| 18 | | Wells Fargo Advantage Short-Term High Yield Bond Fund | | Statement of operations—year ended August 31, 2015 |
| | | | |
| | | | |
| |
Investment income | | | | |
Interest | | $ | 59,462,737 | |
Income from affiliated securities | | | 70,518 | |
Securities lending income, net | | | 51,743 | |
| | | | |
Total investment income | | | 59,584,998 | |
| | | | |
| |
Expenses | | | | |
Management fee | | | 7,221,133 | |
Administration fees | | | | |
Class A | | | 362,069 | |
Class C | | | 207,078 | |
Administrator Class | | | 394,500 | |
Institutional Class | | | 466,774 | |
Investor Class | | | 357,024 | |
Shareholder servicing fees | | | | |
Class A | | | 565,733 | |
Class C | | | 323,559 | |
Administrator Class | | | 982,452 | |
Investor Class | | | 468,606 | |
Distribution fee | | | | |
Class C | | | 970,678 | |
Custody and accounting fees | | | 82,966 | |
Professional fees | | | 58,207 | |
Registration fees | | | 136,784 | |
Shareholder report expenses | | | 126,115 | |
Trustees’ fees and expenses | | | 10,549 | |
Other fees and expenses | | | 48,615 | |
| | | | |
Total expenses | | | 12,782,842 | |
Less: Fee waivers and/or expense reimbursements | | | (1,870,850 | ) |
| | | | |
Net expenses | | | 10,911,992 | |
| | | | |
Net investment income | | | 48,673,006 | |
| | | | |
| |
REALIZED AND UNREALIZED GAINS (LOSSES) ON INVESTMENTS | | | | |
Net realized losses on investments | | | (16,191,024 | ) |
Net change in unrealized gains (losses) on investments | | | (11,157,694 | ) |
| | | | |
Net realized and unrealized gains (losses) on investments | | | (27,348,718 | ) |
| | | | |
Net increase in net assets resulting from operations | | $ | 21,324,288 | |
| | | | |
The accompanying notes are an integral part of these financial statements.
| | | | | | |
| Statement of changes in net assets | | Wells Fargo Advantage Short-Term High Yield Bond Fund | | | 19 | |
| | | | | | | | | | | | | | | | |
| | | Year ended
August 31, 2015 | | | Year ended
August 31, 2014 | |
| | | |
Operations | | | | | | | | | | | | |
Net investment income | | | | | | $ | 48,673,006 | | | | | | | $ | 54,855,027 | |
Net realized losses on investments | | | | | | | (16,191,024 | ) | | | | | | | (1,133,585 | ) |
Net change in unrealized gains (losses) on investments | | | | | | | (11,157,694 | ) | | | | | | | (62,645 | ) |
| | | | |
Net increase in net assets resulting from operations | | | | | | | 21,324,288 | | | | | | | | 53,658,797 | |
| | | | |
| | | |
Distributions to shareholders from | | | | | | | | | | | | |
Net investment income | | | | | | | | | | | | | | | | |
Class A | | | | | | | (6,933,480 | ) | | | | | | | (9,990,440 | ) |
Class C | | | | | | | (2,986,338 | ) | | | | | | | (3,525,479 | ) |
Administrator Class | | | | | | | (12,745,406 | ) | | | | | | | (18,901,024 | ) |
Institutional Class | | | | | | | (19,514,685 | ) | | | | | | | (13,627,741 | ) |
Investor Class | | | | | | | (5,702,061 | ) | | | | | | | (8,293,472 | ) |
Net realized gains | | | | | | | | | | | | | | | | |
Class A | | | | | | | 0 | | | | | | | | (679,349 | ) |
Class C | | | | | | | 0 | | | | | | | | (311,057 | ) |
Administrator Class | | | | | | | 0 | | | | | | | | (1,207,759 | ) |
Institutional Class | | | | | | | 0 | | | | | | | | (665,596 | ) |
Investor Class | | | | | | | 0 | | | | | | | | (604,264 | ) |
| | | | |
Total distributions to shareholders | | | | | | | (47,881,970 | ) | | | | | | | (57,806,181 | ) |
| | | | |
| | | | |
Capital share transactions | | | Shares | | | | | | | | Shares | | | | | |
Proceeds from shares sold | | | | | | | | | | | | | | | | |
Class A | | | 6,389,757 | | | | 51,850,164 | | | | 15,249,110 | | | | 125,909,022 | |
Class C | | | 2,902,472 | | | | 23,560,523 | | | | 5,706,301 | | | | 47,093,148 | |
Administrator Class | | | 15,702,034 | | | | 127,280,452 | | | | 44,029,190 | | | | 363,558,568 | |
Institutional Class | | | 42,733,442 | | | | 346,627,984 | | | | 64,080,938 | | | | 527,975,480 | |
Investor Class | | | 9,357,563 | | | | 75,960,409 | | | | 18,738,706 | | | | 154,708,427 | |
| | | | |
| | | | | | | 625,279,532 | | | | | | | | 1,219,244,645 | |
| | | | |
Reinvestment of distributions | | | | | | | | | | | | | | | | |
Class A | | | 813,304 | | | | 6,601,461 | | | | 1,244,498 | | | | 10,266,433 | |
Class C | | | 352,560 | | | | 2,861,800 | | | | 444,388 | | | | 3,665,809 | |
Administrator Class | | | 1,415,868 | | | | 11,486,162 | | | | 2,075,373 | | | | 17,116,408 | |
Institutional Class | | | 1,608,395 | | | | 13,032,069 | | | | 970,793 | | | | 7,988,302 | |
Investor Class | | | 677,127 | | | | 5,496,288 | | | | 994,682 | | | | 8,205,806 | |
| | | | |
| | | | | | | 39,477,780 | | | | | | | | 47,242,758 | |
| | | | |
Payment for shares redeemed | | | | | | | | | | | | | | | | |
Class A | | | (15,664,276 | ) | | | (126,984,161 | ) | | | (17,587,268 | ) | | | (144,910,840 | ) |
Class C | | | (5,447,783 | ) | | | (44,184,843 | ) | | | (4,904,512 | ) | | | (40,456,301 | ) |
Administrator Class | | | (38,462,893 | ) | | | (311,878,917 | ) | | | (51,142,790 | ) | | | (422,085,077 | ) |
Institutional Class | | | (34,879,242 | ) | | | (281,848,045 | ) | | | (24,797,924 | ) | | | (204,250,615 | ) |
Investor Class | | | (16,991,722 | ) | | | (137,734,753 | ) | | | (23,422,680 | ) | | | (193,143,088 | ) |
| | | | |
| | | | | | | (902,630,719 | ) | | | | | | | (1,004,845,921 | ) |
| | | | |
Net increase (decrease) in net assets resulting from capital share transactions | | | | | | | (237,873,407 | ) | | | | | | | 261,641,482 | |
| | | | |
Total increase (decrease) in net assets | | | | | | | (264,431,089 | ) | | | | | | | 257,494,098 | |
| | | | |
| | |
Net assets | | | | | | | | |
Beginning of period | | | | | | | 1,697,524,673 | | | | | | | | 1,440,030,575 | |
| | | | |
End of period | | | | | | $ | 1,433,093,584 | | | | | | | $ | 1,697,524,673 | |
| | | | |
Undistributed (overdistributed) net investment income | | | | | | $ | 0 | | | | | | | $ | (791,036 | ) |
| | | | |
The accompanying notes are an integral part of these financial statements.
| | | | |
| 20 | | Wells Fargo Advantage Short-Term High Yield Bond Fund | | Financial highlights |
(For a share outstanding throughout each period)
| | | | | | | | | | | | | | | | | | | | |
| | | Year ended August 31 | |
| CLASS A | | 2015 | | | 2014 | | | 2013 | | | 2012 | | | 2011 | |
Net asset value, beginning of period | | | $8.20 | | | | $8.21 | | | | $8.26 | | | | $8.04 | | | | $8.18 | |
Net investment income | | | 0.25 | | | | 0.27 | | | | 0.31 | | | | 0.36 | | | | 0.40 | |
Net realized and unrealized gains (losses) on investments | | | (0.13 | ) | | | 0.01 | | | | (0.05 | ) | | | 0.26 | | | | (0.14 | ) |
| | | | | | | | | | | | | | | | | | | | |
Total from investment operations | | | 0.12 | | | | 0.28 | | | | 0.26 | | | | 0.62 | | | | 0.26 | |
Distributions to shareholders from | | | | | | | | | | | | | | | | | | | | |
Net investment income | | | (0.25 | ) | | | (0.27 | ) | | | (0.31 | ) | | | (0.36 | ) | | | (0.40 | ) |
Net realized gains | | | 0.00 | | | | (0.02 | ) | | | (0.00 | )1 | | | (0.04 | ) | | | 0.00 | |
| | | | | | | | | | | | | | | | | | | | |
Total distributions to shareholders | | | (0.25 | ) | | | (0.29 | ) | | | (0.31 | ) | | | (0.40 | ) | | | (0.40 | ) |
Net asset value, end of period | | | $8.07 | | | | $8.20 | | | | $8.21 | | | | $8.26 | | | | $8.04 | |
Total return2 | | | 1.46 | % | | | 3.40 | % | | | 3.17 | % | | | 7.81 | % | | | 3.10 | % |
Ratios to average net assets (annualized) | | | | | | | | | | | | | | | | | | | | |
Gross expenses | | | 0.92 | % | | | 0.91 | % | | | 0.94 | % | | | 0.99 | % | | | 1.00 | % |
Net expenses | | | 0.81 | % | | | 0.81 | % | | | 0.81 | % | | | 0.81 | % | | | 0.81 | % |
Net investment income | | | 3.11 | % | | | 3.27 | % | | | 3.73 | % | | | 4.33 | % | | | 4.77 | % |
Supplemental data | | | | | | | | | | | | | | | | | | | | |
Portfolio turnover rate | | | 40 | % | | | 28 | % | | | 33 | % | | | 28 | % | | | 36 | % |
Net assets, end of period (000s omitted) | | | $203,856 | | | | $276,436 | | | | $285,726 | | | | $261,173 | | | | $201,523 | |
| 1 | Amount is less than $0.005. |
| 2 | Total return calculations do not include any sales charges. |
The accompanying notes are an integral part of these financial statements.
| | | | | | |
| Financial highlights | | Wells Fargo Advantage Short-Term High Yield Bond Fund | | | 21 | |
(For a share outstanding throughout each period)
| | | | | | | | | | | | | | | | | | | | |
| | | Year ended August 31 | |
| CLASS C | | 2015 | | | 2014 | | | 2013 | | | 2012 | | | 2011 | |
Net asset value, beginning of period | | | $8.20 | | | | $8.21 | | | | $8.26 | | | | $8.04 | | | | $8.18 | |
Net investment income | | | 0.19 | | | | 0.21 | | | | 0.25 | | | | 0.29 | 1 | | | 0.33 | |
Net realized and unrealized gains (losses) on investments | | | (0.13 | ) | | | 0.01 | | | | (0.06 | ) | | | 0.26 | | | | (0.14 | ) |
| | | | | | | | | | | | | | | | | | | | |
Total from investment operations | | | 0.06 | | | | 0.22 | | | | 0.19 | | | | 0.55 | | | | 0.19 | |
Distributions to shareholders from | | | | | | | | | | | | | | | | | | | | |
Net investment income | | | (0.19 | ) | | | (0.21 | ) | | | (0.24 | ) | | | (0.29 | ) | | | (0.33 | ) |
Net realized gains | | | 0.00 | | | | (0.02 | ) | | | (0.00 | )2 | | | (0.04 | ) | | | 0.00 | |
| | | | | | | | | | | | | | | | | | | | |
Total distributions to shareholders | | | (0.19 | ) | | | (0.23 | ) | | | (0.24 | ) | | | (0.33 | ) | | | (0.33 | ) |
Net asset value, end of period | | | $8.07 | | | | $8.20 | | | | $8.21 | | | | $8.26 | | | | $8.04 | |
Total return3 | | | 0.70 | % | | | 2.62 | % | | | 2.40 | % | | | 7.00 | % | | | 2.33 | % |
Ratios to average net assets (annualized) | | | | | | | | | | | | | | | | | | | | |
Gross expenses | | | 1.67 | % | | | 1.66 | % | | | 1.69 | % | | | 1.73 | % | | | 1.75 | % |
Net expenses | | | 1.56 | % | | | 1.56 | % | | | 1.56 | % | | | 1.56 | % | | | 1.56 | % |
Net investment income | | | 2.36 | % | | | 2.52 | % | | | 2.98 | % | | | 3.58 | % | | | 3.97 | % |
Supplemental data | | | | | | | | | | | | | | | | | | | | |
Portfolio turnover rate | | | 40 | % | | | 28 | % | | | 33 | % | | | 28 | % | | | 36 | % |
Net assets, end of period (000s omitted) | | | $123,521 | | | | $143,444 | | | | $133,379 | | | | $102,780 | | | | $71,831 | |
| 1 | Calculated based upon average shares outstanding |
| 2 | Amount is less than $0.005. |
| 3 | Total return calculations do not include any sales charges. |
The accompanying notes are an integral part of these financial statements.
| | | | |
| 22 | | Wells Fargo Advantage Short-Term High Yield Bond Fund | | Financial highlights |
(For a share outstanding throughout each period)
| | | | | | | | | | | | | | | | | | | | |
| | | Year ended August 31 | |
| ADMINISTRATOR CLASS | | 2015 | | | 2014 | | | 2013 | | | 2012 | | | 2011 | |
Net asset value, beginning of period | | | $8.20 | | | | $8.20 | | | | $8.26 | | | | $8.03 | | | | $8.18 | |
Net investment income | | | 0.26 | | | | 0.28 | | | | 0.32 | | | | 0.37 | | | | 0.41 | |
Net realized and unrealized gains (losses) on investments | | | (0.13 | ) | | | 0.02 | | | | (0.06 | ) | | | 0.27 | | | | (0.15 | ) |
| | | | | | | | | | | | | | | | | | | | |
Total from investment operations | | | 0.13 | | | | 0.30 | | | | 0.26 | | | | 0.64 | | | | 0.26 | |
Distributions to shareholders from | | | | | | | | | | | | | | | | | | | | |
Net investment income | | | (0.26 | ) | | | (0.28 | ) | | | (0.32 | ) | | | (0.37 | ) | | | (0.41 | ) |
Net realized gains | | | 0.00 | | | | (0.02 | ) | | | (0.00 | )1 | | | (0.04 | ) | | | 0.00 | |
| | | | | | | | | | | | | | | | | | | | |
Total distributions to shareholders | | | (0.26 | ) | | | (0.30 | ) | | | (0.32 | ) | | | (0.41 | ) | | | (0.41 | ) |
Net asset value, end of period | | | $8.07 | | | | $8.20 | | | | $8.20 | | | | $8.26 | | | | $8.03 | |
Total return | | | 1.62 | % | | | 3.69 | % | | | 3.21 | % | | | 8.12 | % | | | 3.15 | % |
Ratios to average net assets (annualized) | | | | | | | | | | | | | | | | | | | | |
Gross expenses | | | 0.85 | % | | | 0.84 | % | | | 0.87 | % | | | 0.92 | % | | | 0.94 | % |
Net expenses | | | 0.65 | % | | | 0.65 | % | | | 0.65 | % | | | 0.65 | % | | | 0.65 | % |
Net investment income | | | 3.28 | % | | | 3.44 | % | | | 3.89 | % | | | 4.48 | % | | | 4.87 | % |
Supplemental data | | | | | | | | | | | | | | | | | | | | |
Portfolio turnover rate | | | 40 | % | | | 28 | % | | | 33 | % | | | 28 | % | | | 36 | % |
Net assets, end of period (000s omitted) | | | $328,934 | | | | $509,059 | | | | $550,981 | | | | $459,746 | | | | $249,301 | |
| 1 | Amount is less than $0.005. |
The accompanying notes are an integral part of these financial statements.
| | | | | | |
| Financial highlights | | Wells Fargo Advantage Short-Term High Yield Bond Fund | | | 23 | |
(For a share outstanding throughout each period)
| | | | | | | | | | | | |
| | | Year ended August 31 | |
| INSTITUTIONAL CLASS | | 2015 | | | 2014 | | | 20131 | |
Net asset value, beginning of period | | | $8.18 | | | | $8.19 | | | | $8.28 | |
Net investment income | | | 0.28 | | | | 0.29 | | | | 0.25 | |
Net realized and unrealized gains (losses) on investments | | | (0.13 | ) | | | 0.01 | | | | (0.09 | ) |
| | | | | | | | | | | | |
Total from investment operations | | | 0.15 | | | | 0.30 | | | | 0.16 | |
Distributions to shareholders from | | | | | | | | | | | | |
Net investment income | | | (0.27 | ) | | | (0.29 | ) | | | (0.25 | ) |
Net realized gains | | | 0.00 | | | | (0.02 | ) | | | (0.00 | )2 |
| | | | | | | | | | | | |
Total distributions to shareholders | | | (0.27 | ) | | | (0.31 | ) | | | (0.25 | ) |
Net asset value, end of period | | | $8.06 | | | | $8.18 | | | | $8.19 | |
Total return3 | | | 1.90 | % | | | 3.72 | % | | | 1.92 | % |
Ratios to average net assets (annualized) | | | | | | | | | | | | |
Gross expenses | | | 0.59 | % | | | 0.58 | % | | | 0.60 | % |
Net expenses | | | 0.50 | % | | | 0.50 | % | | | 0.50 | % |
Net investment income | | | 3.40 | % | | | 3.58 | % | | | 4.05 | % |
Supplemental data | | | | | | | | | | | | |
Portfolio turnover rate | | | 40 | % | | | 28 | % | | | 33 | % |
Net assets, end of period (000s omitted) | | | $608,704 | | | | $540,824 | | | | $211,642 | |
| 1 | For the period from November 30, 2012 (commencement of class operations) to August 31, 2013 |
| 2 | Amount is less than $0.005. |
| 3 | Returns for periods of less than one year are not annualized. |
The accompanying notes are an integral part of these financial statements.
| | | | |
| 24 | | Wells Fargo Advantage Short-Term High Yield Bond Fund | | Financial highlights |
(For a share outstanding throughout each period)
| | | | | | | | | | | | | | | | | | | | |
| | | Year ended August 31 | |
| INVESTOR CLASS | | 2015 | | | 2014 | | | 2013 | | | 2012 | | | 2011 | |
Net asset value, beginning of period | | | $8.20 | | | | $8.21 | | | | $8.26 | | | | $8.03 | | | | $8.18 | |
Net investment income | | | 0.25 | | | | 0.27 | | | | 0.31 | | | | 0.35 | 1 | | | 0.39 | |
Net realized and unrealized gains (losses) on investments | | | (0.14 | ) | | | 0.00 | 2 | | | (0.06 | ) | | | 0.27 | | | | (0.15 | ) |
| | | | | | | | | | | | | | | | | | | | |
Total from investment operations | | | 0.11 | | | | 0.27 | | | | 0.25 | | | | 0.62 | | | | 0.24 | |
Distributions to shareholders from | | | | | | | | | | | | | | | | | | | | |
Net investment income | | | (0.24 | ) | | | (0.26 | ) | | | (0.30 | ) | | | (0.35 | ) | | | (0.39 | ) |
Net realized gains | | | 0.00 | | | | (0.02 | ) | | | (0.00 | )2 | | | (0.04 | ) | | | 0.00 | |
| | | | | | | | | | | | | | | | | | | | |
Total distributions to shareholders | | | (0.24 | ) | | | (0.28 | ) | | | (0.30 | ) | | | (0.39 | ) | | | (0.39 | ) |
Net asset value, end of period | | | $8.07 | | | | $8.20 | | | | $8.21 | | | | $8.26 | | | | $8.03 | |
Total return | | | 1.43 | % | | | 3.36 | % | | | 3.13 | % | | | 7.91 | % | | | 2.95 | % |
Ratios to average net assets (annualized) | | | | | | | | | | | | | | | | | | | | |
Gross expenses | | | 0.94 | % | | | 0.94 | % | | | 0.97 | % | | | 1.01 | % | | | 1.03 | % |
Net expenses | | | 0.84 | % | | | 0.84 | % | | | 0.84 | % | | | 0.84 | % | | | 0.84 | % |
Net investment income | | | 3.08 | % | | | 3.24 | % | | | 3.70 | % | | | 4.30 | % | | | 4.76 | % |
Supplemental data | | | | | | | | | | | | | | | | | | | | |
Portfolio turnover rate | | | 40 | % | | | 28 | % | | | 33 | % | | | 28 | % | | | 36 | % |
Net assets, end of period (000s omitted) | | | $168,078 | | | | $227,763 | | | | $258,302 | | | | $232,175 | | | | $170,952 | |
| 1 | Calculated based upon average shares outstanding |
| 2 | Amount is less than $0.005. |
The accompanying notes are an integral part of these financial statements.
| | | | | | |
| Notes to financial statements | | Wells Fargo Advantage Short-Term High Yield Bond Fund | | | 25 | |
1. ORGANIZATION
Wells Fargo Funds Trust (the “Trust”), a Delaware statutory trust organized on March 10, 1999, is an open-end management investment company registered under the Investment Company Act of 1940, as amended (the “1940 Act”). As an investment company, the Trust follows the accounting and reporting guidance in Financial Accounting Standards Board (“FASB”) Accounting Standards Codification Topic 946, Financial Services – Investment Companies. These financial statements report on the Wells Fargo Advantage Short-Term High Yield Bond Fund (the “Fund”) which is a diversified series of the Trust.
2. SIGNIFICANT ACCOUNTING POLICIES
The following significant accounting policies, which are consistently followed in the preparation of the financial statements of the Fund, are in conformity with U.S. generally accepted accounting principles which require management to make estimates and assumptions that affect the reported amounts of assets and liabilities, disclosure of contingent assets and liabilities at the date of the financial statements, and the reported amounts of revenues and expenses during the reporting period. Actual results could differ from those estimates.
Securities valuation
All investments are valued each business day as of the close of regular trading on the New York Stock Exchange (generally 4 p.m. Eastern Time).
Debt securities are valued at the evaluated bid price provided by an independent pricing service or, if a reliable price is not available, the quoted bid price from an independent broker-dealer.
Investments in registered open-end investment companies are valued at net asset value. Interests in non-registered investment vehicles that are redeemable at net asset value are fair valued at net asset value when available.
Investments which are not valued using any of the methods discussed above are valued at their fair value, as determined in good faith by the Board of Trustees of the Fund. The Board of Trustees has established a Valuation Committee comprised of the Trustees and has delegated to it the authority to take any actions regarding the valuation of portfolio securities that the Valuation Committee deems necessary or appropriate, including determining the fair value of portfolio securities, unless the determination has been delegated to the Management Valuation Team of Wells Fargo Funds Management, LLC (“Funds Management”). The Board of Trustees retains the authority to make or ratify any valuation decisions or approve any changes to the Valuation Procedures as it deems appropriate. On a quarterly basis, the Board of Trustees receives reports on any valuation actions taken by the Valuation Committee or the Management Valuation Team which may include items for ratification.
Valuations of fair valued securities are compared to the next actual sales price when available, or other appropriate market values, to assess the continued appropriateness of the fair valuation methodologies used. These securities are fair valued on a day-to-day basis, taking into consideration changes to appropriate market information and any significant changes to the inputs considered in the valuation process until there is a readily available price provided on an exchange or by an independent pricing service. Valuations received from an independent pricing service or independent broker-dealer quotes are periodically validated by comparisons to most recent trades and valuations provided by other independent pricing services in addition to the review of prices by the manager and/or subadviser. Unobservable inputs used in determining fair valuations are identified based on the type of security, taking into consideration factors utilized by market participants in valuing the investment, knowledge about the issuer and the current market environment.
Security loans
The Fund may lend its securities from time to time in order to earn additional income in the form of fees or interest on securities received as collateral or the investment of any cash received as collateral. The Fund continues to receive interest or dividends on the securities loaned. The Fund receives collateral in the form of cash or securities with a value at least equal to the value of the securities on loan. The value of the loaned securities is determined at the close of each business day and any additional required collateral is delivered to the Fund on the next business day. In a securities lending transaction, the net asset value of the Fund will be affected by an increase or decrease in the value of the securities loaned and by an increase or decrease in the value of the instrument in which collateral is invested. The amount of securities lending activity undertaken by the Fund fluctuates from time to time. In the event of default or bankruptcy by the borrower, the Fund may be prevented from recovering the loaned securities or gaining access to the collateral or may experience delays or costs in doing so. In addition, the investment of any cash collateral received may lose all or part of its value. The Fund has the right under the lending agreement to recover the securities from the borrower on demand.
| | | | |
| 26 | | Wells Fargo Advantage Short-Term High Yield Bond Fund | | Notes to financial statements |
The Fund lends its securities through an unaffiliated securities lending agent. Cash collateral received in connection with its securities lending transactions is invested in Securities Lending Cash Investments, LLC (the “Securities Lending Fund”). The Securities Lending Fund is exempt from registration under Section 3(c)(7) of the 1940 Act and is managed by Funds Management and is subadvised by Wells Capital Management Incorporated (“WellsCap”). Funds Management receives an advisory fee starting at 0.05% and declining to 0.01% as the average daily net assets of the Securities Lending Fund increase. All of the fees received by Funds Management are paid to WellsCap for its services as subadviser. The Securities Lending Fund seeks to provide a positive return compared to the daily Fed Funds Open rate by investing in high-quality, U.S. dollar-denominated short-term money market instruments. Securities Lending Fund investments are fair valued based upon the amortized cost valuation technique. Income earned from investment in the Securities Lending Fund is included in securities lending income on the Statement of Operations.
When-issued transactions
The Fund may purchase securities on a forward commitment or when-issued basis. The Fund records a when-issued transaction on the trade date and will segregate assets in an amount at least equal in value to the Fund’s commitment to purchase when-issued securities. Securities purchased on a when-issued basis are marked-to-market daily and the Fund begins earning interest on the settlement date. Losses may arise due to changes in the market value of the underlying securities or if the counterparty does not perform under the contract.
Loans
The Fund may invest in direct debt instruments which are interests in amounts owed to lenders by corporate or other borrowers. The loans pay interest at rates which are periodically reset by reference to a base lending rate plus a spread. Investments in loans may be in the form of participations in loans or assignments of all or a portion of loans from third parties. When the Fund purchases participations, it generally has no rights to enforce compliance with terms of the loan agreement with the borrower. As a result, the Fund assumes the credit risk of both the borrower and the lender that is selling the participation. When the Fund purchases assignments from lenders, it acquires direct rights against the borrower on the loan and may enforce compliance by the borrower with the terms of the loan agreement. Loans may include fully funded term loans or unfunded loan commitments, which are contractual obligations for future funding.
Security transactions and income recognition
Securities transactions are recorded on a trade date basis. Realized gains or losses are recorded on the basis of identified cost.
Interest income is accrued daily and bond discounts are accreted and premiums are amortized daily based on the effective interest method. To the extent debt obligations are placed on non-accrual status, any related interest income may be reduced by writing off interest receivables when the collection of all or a portion of interest has become doubtful based on consistently applied procedures. If the issuer subsequently resumes interest payments or when the collectability of interest is reasonably assured, the debt obligation is removed from non-accrual status.
Distributions to shareholders
Distributions to shareholders from net investment income are accrued daily and paid monthly. Distributions from net realized gains, if any, are recorded on the ex-dividend date. Such distributions are determined in conformity with federal income tax regulations, which may differ in amount or character from net investment income and realized gains recognized for purposes of U.S. generally accepted accounting principles.
Federal and other taxes
The Fund intends to continue to qualify as a regulated investment company by distributing substantially all of its investment company taxable income and any net realized capital gains (after reduction for capital loss carryforwards) sufficient to relieve it from all, or substantially all, federal income taxes. Accordingly, no provision for federal income taxes was required.
The Fund’s income and federal excise tax returns and all financial records supporting those returns for the prior three fiscal years are subject to examination by the federal and Delaware revenue authorities. Management has analyzed the Fund’s tax positions taken on federal, state, and foreign tax returns for all open tax years and does not believe that there are any uncertain tax positions that require recognition of a tax liability.
As of August 31, 2015, the Fund had capital loss carryforwards which consist of $1,166,087 in short-term capital losses and $1,031,107 in long-term capital losses.
As of August 31, 2015, the Fund had current year deferred post-October capital losses consisting of $6,730,571 in short-term losses and $8,021,991 in long-term losses which will be recognized on the first day of the following fiscal year.
| | | | | | |
| Notes to financial statements | | Wells Fargo Advantage Short-Term High Yield Bond Fund | | | 27 | |
Class allocations
The separate classes of shares offered by the Fund differ principally in applicable sales charges, distribution, shareholder servicing, and administration fees. Class specific expenses are charged directly to that share class. Investment income, common expenses, and realized and unrealized gains (losses) on investments are allocated daily to each class of shares based on the relative proportion of net assets of each class.
3. FAIR VALUATION MEASUREMENTS
Fair value measurements of investments are determined within a framework that has established a fair value hierarchy based upon the various data inputs utilized in determining the value of the Fund’s investments. The three-level hierarchy gives the highest priority to unadjusted quoted prices in active markets for identical assets or liabilities (Level 1) and the lowest priority to significant unobservable inputs (Level 3). The Fund’s investments are classified within the fair value hierarchy based on the lowest level of input that is significant to the fair value measurement. The inputs are summarized into three broad levels as follows:
| n | | Level 1 – quoted prices in active markets for identical securities |
| n | | Level 2 – other significant observable inputs (including quoted prices for similar securities, interest rates, prepayment speeds, credit risk, use of amortized cost, etc.) |
| n | | Level 3 – significant unobservable inputs (including the Fund’s own assumptions in determining the fair value of investments) |
The inputs or methodologies used for valuing investments in securities are not necessarily an indication of the risk associated with investing in those securities.
The following is a summary of the inputs used in valuing the Fund’s assets and liabilities as of August 31, 2015:
| | | | | | | | | | | | | | | | |
| | | Quoted prices
(Level 1) | | | Other significant
observable inputs
(Level 2) | | | Significant
unobservable inputs
(Level 3) | | | Total | |
Assets | | | | | | | | | | | | | | | | |
Investments in: | | | | | | | | | | | | | | | | |
| | | | |
Corporate bonds and notes | | $ | 0 | | | $ | 788,106,582 | | | $ | 0 | | | $ | 788,106,582 | |
| | | | |
Loans | | | 0 | | | | 445,938,054 | | | | 1,915,003 | | | | 447,853,057 | |
| | | | |
Municipal obligations | | | 0 | | | | 15,153,944 | | | | 0 | | | | 15,153,944 | |
| | | | |
Non-agency mortgage-backed securities | | | 0 | | | | 33,756 | | | | 0 | | | | 33,756 | |
| | | | |
Yankee corporate bonds and notes | | | 0 | | | | 108,400,963 | | | | 0 | | | | 108,400,963 | |
| | | | |
Short-term investments | | | | | | | | | | | | | | | | |
Investment companies | | | 70,743,835 | | | | 0 | | | | 0 | | | | 70,743,835 | |
Total assets | | $ | 70,743,835 | | | $ | 1,357,633,299 | | | $ | 1,915,003 | | | $ | 1,430,292,137 | |
The Fund recognizes transfers between levels within the fair value hierarchy at the end of the reporting period. At August 31, 2015, the Fund did not have any transfers into/out of Level 1, Level 2, or Level 3.
4. TRANSACTIONS WITH AFFILIATES
Management fee
Funds Management, an indirect wholly owned subsidiary of Wells Fargo & Company (“Wells Fargo”), is the manager of the Fund and provides advisory and fund-level administrative services under an investment management agreement. Under the investment management agreement, Funds Management is responsible for, among other services, implementing the investment objectives and strategies of the Fund, supervising the applicable subadviser, providing fund-level administrative services in connection with the Fund’s operations, and providing any other fund-level administrative services reasonably necessary for the operation of the Fund. As compensation for its services under the investment management agreement, Funds Management is entitled to receive an annual management fee starting at 0.50% and declining to 0.38% as the average daily net assets of the Fund increase.
Prior to July 1, 2015, Funds Management provided advisory services pursuant to an investment advisory agreement and was entitled to receive an annual fee which started at 0.45% and declined to 0.35% as the average daily net assets of the
| | | | |
| 28 | | Wells Fargo Advantage Short-Term High Yield Bond Fund | | Notes to financial statements |
Fund increased. In addition, fund-level administrative services were provided by Funds Management under a separate administration agreement at an annual fee which started at 0.05% and declined to 0.03% as the average daily net assets of the Fund increased. For financial statement purposes, the advisory fee and fund-level administration fee for the year ended August 31, 2015 have been included in management fee on the Statement of Operations.
For the year ended August 31, 2015, the management fee was equivalent to an annual rate of 0.47% of the Fund’s average daily net assets.
Funds Management has retained the services of a subadviser to provide daily portfolio management to the Fund. The fee for subadvisory services is borne by Funds Management. WellsCap, an affiliate of Funds Management and an indirect wholly owned subsidiary of Wells Fargo, is the subadviser to the Fund and is entitled to receive a fee from Funds Management at an annual rate starting at 0.35% and declining to 0.20% as the average daily net assets of the Fund increase.
Administration fees
Under a class-level administration agreement, Funds Management provides class-level administrative services to the Fund, which includes paying fees and expenses for services provided by the transfer agent, sub-transfer agents, omnibus account servicers and record-keepers. As compensation for its services under the class-level administration agreement, Funds Management receives an annual fee which is calculated based on the average daily net assets of each class as follows:
| | | | |
| | | Class-level
administration fee | |
Class A, Class C | | | 0.16 | % |
Administrator Class | | | 0.10 | |
Institutional Class | | | 0.08 | |
Investor Class | | | 0.19 | |
Funds Management has contractually waived and/or reimbursed management and administration fees to the extent necessary to maintain certain net operating expense ratios for the Fund. Waiver of fees and/or reimbursement of expenses by Funds Management were made first from fund level expenses on a proportionate basis and then from class specific expenses. Funds Management has committed through December 31, 2015 to waive fees and/or reimburse expenses to the extent necessary to cap the Fund’s expenses at 0.81% for Class A shares, 1.56% for Class C shares, 0.65% for Administrator Class shares, 0.50% for Institutional Class shares, and 0.84% for Investor Class shares. After this time, the cap may be increased or the commitment to maintain the cap may be terminated only with the approval of the Board of Trustees.
Distribution fee
The Trust has adopted a distribution plan for Class C shares of the Fund pursuant to Rule 12b-1 under the 1940 Act. A distribution fee is charged to Class C shares and paid to Wells Fargo Funds Distributor, LLC (“Funds Distributor”), the principal underwriter, at an annual rate of 0.75% of the average daily net assets of Class C shares.
In addition, Funds Distributor is entitled to receive the front-end sales charge from the purchase of Class A shares and a contingent deferred sales charge on the redemption of certain Class A shares. Funds Distributor is also entitled to receive the contingent deferred sales charges from redemptions of Class C shares. For the year ended August 31, 2015, Funds Distributor received $5,848 from the sale of Class A shares and $249 in contingent deferred sales charges from redemptions of Class C shares.
Shareholder servicing fees
The Trust has entered into contracts with one or more shareholder servicing agents, whereby Class A, Class C, Administrator Class, and Investor Class of the Fund is charged a fee at an annual rate of 0.25% of the average daily net assets of each respective class.
A portion of these total shareholder servicing fees were paid to affiliates of Wells Fargo.
5. INVESTMENT PORTFOLIO TRANSACTIONS
Purchases and sales of investments, excluding U.S. government obligations (if any) and short-term securities, for the year ended August 31, 2015 were $585,800,336 and $607,493,838, respectively.
| | | | | | |
| Notes to financial statements | | Wells Fargo Advantage Short-Term High Yield Bond Fund | | | 29 | |
As of August 31, 2015, the Fund had unfunded term loan commitments of $11,143,913.
6. BANK BORROWINGS
The Trust (excluding the money market funds and certain other funds in the Trust) and Wells Fargo Variable Trust are parties to a $150,000,000 revolving credit agreement, whereby the Fund is permitted to use bank borrowings for temporary or emergency purposes, such as to fund shareholder redemption requests. Interest under the credit agreement is charged to the Fund based on a borrowing rate equal to the higher of the Federal Funds rate in effect on that day plus 1.25% or the overnight LIBOR rate in effect on that day plus 1.25%. In addition, an annual commitment fee equal to 0.10% of the unused balance is allocated to each participating fund. For the year ended August 31, 2015, the Fund paid $2,894 in commitment fees.
For the year ended August 31, 2015, there were no borrowings by the Fund under the agreement.
7. DISTRIBUTIONS TO SHAREHOLDERS
The tax character of distributions paid during the years ended August 31, 2015 and August 31, 2014 were as follows:
| | | | | | | | |
| | | Year ended August 31 | |
| | | 2015 | | | 2014 | |
Ordinary income | | $ | 47,881,970 | | | $ | 55,020,724 | |
Long-term capital gain | | | 0 | | | | 2,785,457 | |
As of August 31, 2015, the components of distributable earnings on a tax basis were as follows:
| | | | | | |
Undistributed
ordinary
income | | Unrealized losses | | Post-October
capital losses
deferred | | Capital loss
carryforward |
| $540,890 | | $(13,578,064) | | $(14,752,562) | | $(2,197,194) |
8. INDEMNIFICATION
Under the Trust’s organizational documents, the officers and Trustees have been granted certain indemnification rights against certain liabilities that may arise out of performance of their duties to the Trust. Additionally, in the normal course of business, the Trust may enter into contracts with service providers that contain a variety of indemnification clauses. The Trust’s maximum exposure under these arrangements is dependent on future claims that may be made against the Fund and, therefore, cannot be estimated.
| | | | |
| 30 | | Wells Fargo Advantage Short-Term High Yield Bond Fund | | Report of independent registered public accounting firm |
BOARD OF TRUSTEES AND SHAREHOLDERS OF WELLS FARGO FUNDS TRUST:
We have audited the accompanying statement of assets and liabilities, including the portfolio of investments, of the Wells Fargo Advantage Short-Term High Yield Bond Fund (the “Fund”), one of the funds constituting the Wells Fargo Funds Trust, as of August 31, 2015, and the related statement of operations for the year then ended, the statements of changes in net assets for each of the years in the two-year period then ended, and the financial highlights for each of the years or periods in the five-year period then ended. These financial statements and financial highlights are the responsibility of the Fund’s management. Our responsibility is to express an opinion on these financial statements and financial highlights based on our audits.
We conducted our audits in accordance with the standards of the Public Company Accounting Oversight Board (United States). Those standards require that we plan and perform the audit to obtain reasonable assurance about whether the financial statements and financial highlights are free of material misstatement. An audit includes examining, on a test basis, evidence supporting the amounts and disclosures in the financial statements. Our procedures included confirmation of securities owned as of August 31, 2015, by correspondence with the custodian and brokers, or by other appropriate auditing procedures. An audit also includes assessing the accounting principles used and significant estimates made by management, as well as evaluating the overall financial statement presentation. We believe that our audits provide a reasonable basis for our opinion.
In our opinion, the financial statements and financial highlights referred to above present fairly, in all material respects, the financial position of the Wells Fargo Advantage Short-Term High Yield Bond Fund as of August 31, 2015, the results of its operations for the year then ended, the changes in its net assets for each of the years in the two-year period then ended, and the financial highlights for each of the years or periods in the five-year period then ended, in conformity with U.S. generally accepted accounting principles.

Boston, Massachusetts
October 26, 2015
| | | | | | |
| Other information (unaudited) | | Wells Fargo Advantage Short-Term High Yield Bond Fund | | | 31 | |
TAX INFORMATION
For the fiscal year ended August 31, 2015, $30,949,686 has been designated as interest-related dividends for nonresident alien shareholders pursuant to Section 871 of the Internal Revenue Code.
PROXY VOTING INFORMATION
A description of the policies and procedures that the Fund uses to determine how to vote proxies relating to portfolio securities is available, upon request, by calling 1-800-222-8222, visiting our website at wellsfargoadvantagefunds.com, or visiting the SEC website at sec.gov. Information regarding how the Fund voted proxies relating to portfolio securities during the most recent 12-month period ended June 30 is available on the Fund’s website at wellsfargoadvantagefunds.com or by visiting the SEC website at sec.gov.
PORTFOLIO HOLDINGS INFORMATION
The complete portfolio holdings for the Fund are publicly available monthly on the Fund’s website (wellsfargoadvantagefunds.com), on a one-month delayed basis. In addition, top ten holdings information (excluding derivative positions) for the Fund is publicly available on the Fund’s website on a monthly, seven-day or more delayed basis. The Fund files its complete schedule of portfolio holdings with the SEC for the first and third quarters of each fiscal year on Form N-Q, which is available by visiting the SEC website at sec.gov. In addition, the Fund’s Form N-Q may be reviewed and copied at the SEC’s Public Reference Room in Washington, DC, and at regional offices in New York City, at 233 Broadway, and in Chicago, at 175 West Jackson Boulevard, Suite 900. Information about the Public Reference Room may be obtained by calling 1-800-SEC-0330.
| | | | |
| 32 | | Wells Fargo Advantage Short-Term High Yield Bond Fund | | Other information (unaudited) |
BOARD OF TRUSTEES AND OFFICERS
Each of the Trustees and Officers1 listed in the table below acts in identical capacities for each fund in the Wells Fargo Advantage family of funds, which consists of 133 mutual funds comprising the Wells Fargo Funds Trust, Wells Fargo Variable Trust, Wells Fargo Master Trust and four closed-end funds (collectively the “Fund Complex”). This table should be read in conjunction with the Prospectus and the Statement of Additional Information2. The mailing address of each Trustee and Officer is 525 Market Street, 12th Floor, San Francisco, CA 94105. Each Trustee and Officer serves an indefinite term, however, each Trustee serves such term until reaching the mandatory retirement age established by the Trustees.
Independent Trustees
| | | | | | |
Name and year of birth | | Position held and length of service* | | Principal occupations during past five years or longer | | Other public company or
investment company
directorships during
past 5 years |
William R. Ebsworth (Born 1957) | | Trustee, since 2015** | | Retired. From 1984 to 2013, equities analyst, portfolio manager, research director at Fidelity Management and Research Company and retired in 2013 as Chief Investment Officer of Fidelity Strategic Advisers, Inc. in Boston, Tokyo, and Hong Kong where he led a team of investment professionals managing client assets. Prior thereto, Board member of Hong Kong Securities Clearing Co., Hong Kong Options Clearing Corp., the Thailand International Fund, Ltd., Fidelity Investments Life Insurance Company, and Empire Fidelity Investments Life Insurance Company. Mr. Ebsworth is a CFA ® charterholder and an Adjunct Lecturer, Finance, at Babson College. | | Asset Allocation Trust |
Jane A. Freeman (Born 1953) | | Trustee, since 2015** | | Retired. From 2012 to 2014 and 1999 to 2008, Chief Financial Officer of Scientific Learning Corporation. From 2008 to 2012, Ms. Freeman provided consulting services related to strategic business projects. Prior to 1999, Portfolio Manager at Rockefeller & Co. and Scudder, Stevens & Clark. Board member of the Harding Loevner Funds from 1996 to 2014, serving as both Lead Independent Director and chair of the Audit Committee. Board member of the Russell Exchange Traded Funds Trust from 2011 to 2012 and the chair of the Audit Committee. Ms. Freeman is Chair of Taproot Foundation (non-profit organization), a Board Member of Ruth Bancroft Garden (non-profit organization) and an inactive chartered financial analyst. | | Asset Allocation Trust; Harding Loevner Funds; Russell Exchange Traded Funds Trust |
Peter G. Gordon (Born 1942) | | Trustee, since 1998; Chairman, since 2005 | | Co-Founder, Retired Chairman, President and CEO of Crystal Geyser Water Company. Trustee Emeritus, Colby College. | | Asset Allocation Trust |
Isaiah Harris, Jr. (Born 1952) | | Trustee, since 2009 | | Retired. Chairman of the Board of CIGNA Corporation since 2009, and Director since 2005. From 2003 to 2011, Director of Deluxe Corporation. Prior thereto, President and CEO of BellSouth Advertising and Publishing Corp. from 2005 to 2007, President and CEO of BellSouth Enterprises from 2004 to 2005 and President of BellSouth Consumer Services from 2000 to 2003. Emeritus member of the Iowa State University Foundation Board of Governors. Emeritus Member of the Advisory Board of Iowa State University School of Business. Advisory Board Member, Palm Harbor Academy (charter school). Mr. Harris is a certified public accountant. | | CIGNA Corporation; Asset Allocation Trust |
Judith M. Johnson (Born 1949) | | Trustee, since 2008; Audit Committee Chairman, since 2008 | | Retired. Prior thereto, Chief Executive Officer and Chief Investment Officer of Minneapolis Employees Retirement Fund from 1996 to 2008. Ms. Johnson is an attorney, certified public accountant and a certified managerial accountant. | | Asset Allocation Trust |
David F. Larcker (Born 1950) | | Trustee, since 2009 | | James Irvin Miller Professor of Accounting at the Graduate School of Business, Stanford University, Morgan Stanley Director of the Center for Leadership Development and Research and Senior Faculty of The Rock Center for Corporate Governance since 2006. From 2005 to 2008, Professor of Accounting at the Graduate School of Business, Stanford University. Prior thereto, Ernst & Young Professor of Accounting at The Wharton School, University of Pennsylvania from 1985 to 2005. | | Asset Allocation Trust |
Olivia S. Mitchell (Born 1953) | | Trustee, since 2006 | | International Foundation of Employee Benefit Plans Professor, Wharton School of the University of Pennsylvania since 1993. Director of Wharton’s Pension Research Council and Boettner Center on Pensions & Retirement Research, and Research Associate at the National Bureau of Economic Research. Previously, Cornell University Professor from 1978 to 1993. | | Asset Allocation Trust |
| | | | | | |
| Other information (unaudited) | | Wells Fargo Advantage Short-Term High Yield Bond Fund | | | 33 | |
| | | | | | |
Name and year of birth | | Position held and length of service* | | Principal occupations during past five years or longer | | Other public company or
investment company
directorships during
past 5 years |
Timothy J. Penny (Born 1951) | | Trustee, since 1996 | | President and Chief Executive Officer of Southern Minnesota Initiative Foundation, a non-profit organization, since 2007 and Senior Fellow at the Humphrey Institute Policy Forum at the University of Minnesota since 1995. Member of the Board of Trustees of NorthStar Education Finance, Inc., a non-profit organization, since 2007. | | Asset Allocation Trust |
Michael S. Scofield (Born 1943) | | Trustee, since 2010 | | Served on the Investment Company Institute’s Board of Governors and Executive Committee from 2008-2011 as well the Governing Council of the Independent Directors Council from 2006-2011 and the Independent Directors Council Executive Committee from 2008-2011. Chairman of the IDC from 2008-2010. Institutional Investor (Fund Directions) Trustee of Year in 2007. Trustee of the Evergreen Funds complex (and its predecessors) from 1984 to 2010. Chairman of the Evergreen Funds from 2000-2010. Former Trustee of the Mentor Funds. Retired Attorney, Law Offices of Michael S. Scofield. | | Asset Allocation Trust |
Donald C. Willeke (Born 1940) | | Trustee, since 1996 | | Principal of the law firm of Willeke & Daniels. General Counsel of the Minneapolis Employees Retirement Fund from 1984 until its consolidation into the Minnesota Public Employees Retirement Association on June 30, 2010. Director and Vice Chair of The Tree Trust (non-profit corporation). Director of the American Chestnut Foundation (non-profit corporation). | | Asset Allocation Trust |
| * | Length of service dates reflect the Trustee’s commencement of service with the Trust’s predecessor entities, where applicable. |
| ** | William R. Ebsworth and Jane A. Freeman each became a Trustee effective January 1, 2015. |
Officers
| | | | | | |
Name and year of birth | | Position held and length of service | | Principal occupations during past five years or longer | | |
Karla M. Rabusch (Born 1959) | | President, since 2003 | | Executive Vice President of Wells Fargo Bank, N.A. and President of Wells Fargo Funds Management, LLC since 2003. | | |
Nancy Wiser1 (Born 1967) | | Treasurer, since 2012 | | Executive Vice President of Wells Fargo Funds Management, LLC since 2011. Chief Operating Officer and Chief Compliance Officer at LightBox Capital Management LLC, from 2008 to 2011. | | |
C. David Messman (Born 1960) | | Secretary, since 2000; Chief Legal Officer, since 2003 | | Senior Vice President and Secretary of Wells Fargo Funds Management, LLC since 2001. Assistant General Counsel of Wells Fargo Bank, N.A. since 2013 and Vice President and Managing Counsel of Wells Fargo Bank N.A. from 1996 to 2013. | | |
Debra Ann Early (Born 1964) | | Chief Compliance Officer, since 2007 | | Executive Vice President of Wells Fargo Funds Management, LLC since 2014, Senior Vice President and Chief Compliance Officer from 2007 to 2014. | | |
David Berardi (Born 1975) | | Assistant Treasurer, since 2009 | | Vice President of Wells Fargo Funds Management, LLC since 2009. Vice President of Evergreen Investment Management Company, LLC from 2008 to 2010. Manager of Fund Reporting and Control for Evergreen Investment Management Company, LLC from 2004 to 2010. | | |
Jeremy DePalma1 (Born 1974) | | Assistant Treasurer, since 2009 | | Senior Vice President of Wells Fargo Funds Management, LLC since 2009. Senior Vice President of Evergreen Investment Management Company, LLC from 2008 to 2010 and head of the Fund Reporting and Control Team within Fund Administration from 2005 to 2010. | | |
| 1 | Nancy Wiser acts as Treasurer of 72 funds in the Fund Complex. Jeremy DePalma acts as Treasurer of 61 funds and Assistant Treasurer of 72 funds in the Fund Complex. |
| 2 | The Statement of Additional Information includes additional information about the Trustees and is available, without charge, upon request, by calling 1-800-222-8222 or by visiting the website at wellsfargoadvantagefunds.com. |
| | | | |
| 34 | | Wells Fargo Advantage Short-Term High Yield Bond Fund | | Other information (unaudited) |
BOARD CONSIDERATION OF INVESTMENT ADVISORY, INVESTMENT MANAGEMENT AND SUB-ADVISORY AGREEMENTS:
Under the Investment Company Act of 1940 (the “1940 Act”), the Board of Trustees (the “Board”) of Wells Fargo Funds Trust (the “Trust”) must determine annually whether to approve the continuation of the Trust’s investment advisory and sub-advisory agreements. In this regard, at an in-person meeting held on May 19-20, 2015 (the “Meeting”), the Board, all the members of which have no direct or indirect interest in the investment advisory and sub-advisory agreements and are not “interested persons” of the Trust, as defined in the 1940 Act (the “Independent Trustees”), reviewed and approved for Wells Fargo Advantage Short-Term High Yield Bond Fund (the “Fund”): (i) an investment advisory agreement (the “Advisory Agreement”) with Wells Fargo Funds Management, LLC (“Funds Management”); (ii) an investment management agreement (the “Management Agreement”) with Funds Management; and (iii) an investment sub-advisory agreement (the “Sub-Advisory Agreement”) with Wells Capital Management Incorporated (the “Sub-Adviser”), an affiliate of Funds Management. The Management Agreement combines the terms of the Advisory Agreement with the terms of the Fund’s Amended and Restated Administration Agreement (the “Administration Agreement”) applicable to Fund-level administrative services. The Advisory Agreement, the Management Agreement and the Sub-Advisory Agreement are collectively referred to as the “Advisory Agreements.”
At the Meeting, the Board considered the factors and reached the conclusions described below relating to the selection of Funds Management and the Sub-Adviser and the approval of the Advisory Agreements. Prior to the Meeting, including at an in-person meeting in March 2015, the Trustees conferred extensively among themselves and with representatives of Funds Management about these matters. Also, the Board has adopted a team-based approach, with each team consisting of a sub-set of Trustees, to assist the full Board in the discharge of its duties in reviewing performance and other matters throughout the year. The Independent Trustees were assisted in their evaluation of the Advisory Agreements by independent legal counsel, from whom they received separate legal advice and with whom they met separately.
In providing information to the Board, Funds Management and the Sub-Adviser were guided by a detailed set of requests for information submitted to them by independent legal counsel on behalf of the Independent Trustees at the start of the Board’s annual contract renewal process earlier in 2015. In considering and approving the Advisory Agreements, the Trustees considered the information they believed relevant, including but not limited to the information discussed below. The Board considered not only the specific information presented in connection with the Meeting, but also the knowledge gained over time through interaction with Funds Management and the Sub-Adviser about various topics. In this regard, the Board reviewed reports of Funds Management at each of its quarterly meetings, which included, among other things, portfolio reviews and performance reports. In addition, the Board and the teams mentioned above confer with portfolio managers at various times throughout the year. The Board did not identify any particular information or consideration that was all-important or controlling, and each individual Trustee may have attributed different weights to various factors.
After its deliberations, the Board unanimously approved the continuation of the Advisory Agreement for the period from June 1, 2015 through June 30, 2015, approved the Management Agreement for the period from July 1, 2015 through May 31, 2016, and approved the continuation of the Sub-Advisory Agreement for a one-year term through May 31, 2016. The Board also determined that the compensation payable to Funds Management and the Sub-Adviser under each of the Advisory Agreements was reasonable. The Board considered the approval of the Advisory Agreements for the Fund as part of its consideration of agreements for funds across the complex, but its approvals were made on a fund-by-fund basis. The following summarizes a number of important, but not necessarily all, factors considered by the Board in support of its approvals.
Nature, extent and quality of services
The Board received and considered various information regarding the nature, extent and quality of services provided to the Fund by Funds Management and the Sub-Adviser under the Advisory Agreements. This information included, among other things, a summary of the background and experience of senior management of Funds Management, and the qualifications, background, tenure and responsibilities of each of the portfolio managers primarily responsible for the day-to-day portfolio management of the Fund. The Board noted that the services to be provided to the Fund pursuant to the Management Agreement combined the advisory services previously provided to the Fund pursuant to the Fund’s Advisory Agreement with the Fund-level administrative services previously provided to the Fund pursuant to the Fund’s Administration Agreement. The Board received a representation from Funds Management that combining these services would not result in any change to the nature or level of services provided by Funds Management to the Fund.
The Board evaluated the ability of Funds Management and the Sub-Adviser to attract and retain qualified investment professionals, including research, advisory and supervisory personnel. The Board further considered the compliance
| | | | | | |
| Other information (unaudited) | | Wells Fargo Advantage Short-Term High Yield Bond Fund | | | 35 | |
programs and compliance records of Funds Management and the Sub-Adviser. In addition, the Board took into account the full range of services provided to the Fund by Funds Management and its affiliates.
Fund performance and expenses
The Board considered the performance results for the Fund over various time periods ended March 31, 2015. The Board considered these results in comparison to the performance of funds in a universe that was determined by Lipper Inc. (“Lipper”) to be similar to the Fund (the “Universe”), and in comparison to the Fund’s benchmark index and to other comparative data. Lipper is an independent provider of investment company data. The Board received a description of the methodology used by Lipper to select the mutual funds in the performance Universe. The Board noted that the performance of the Fund (Class A) was lower than the average performance of the Universe for all periods under review except the one-year period. The Board also noted that the performance of the Fund was lower than its benchmark, the BofAML High Yield U.S. Corp Cash Pay BB 1-5 Yrs, for all periods under review except the first quarter of 2015.
The Board received information concerning, and discussed factors contributing to, the underperformance of the Fund relative to the Universe and benchmark for the periods noted above. The Board took note of the explanations for the relative underperformance in these periods, including with respect to market factors that affected the Fund’s performance and the composition of the funds in the Universe, and of recent improved performance.
The Board also received and considered information regarding the Fund’s net operating expense ratios and their various components, including actual management fees (which reflect fee waivers, if any, and include advisory, administration and transfer agent fees), custodian and other non-management fees, and Rule 12b-1 and non-Rule 12b-1 service fees. The Board considered these ratios in comparison to the median ratios of funds in class-specific expense groups that were determined by Lipper to be similar to the Fund (the “Groups”). The Board received a description of the methodology used by Lipper to select the mutual funds in the expense Groups and an explanation of how funds comprising expense groups and their expense ratios may vary from year-to-year. Based on the Lipper reports, the Board noted that the net operating expense ratios of the Fund were lower than the median net operating expense ratios of the expense Groups. The Board discussed and accepted Funds Management’s proposal to convert the Investor Class shares into Class A shares.
The Board took into account the Fund performance and expense information provided to it among the factors considered in deciding to re-approve the Advisory Agreement and Sub-Advisory Agreement and approve the Management Agreement.
Investment advisory and sub-advisory fee rates
The Board reviewed and considered the contractual investment advisory fee rates that are payable by the Fund to Funds Management for investment advisory services (the “Advisory Agreement Rates”), both on a stand-alone basis and on a combined basis with the Fund’s fund-level and class-level contractual administration fee rates (the “Management Rates”). The Board noted that the Management Rates include transfer agency and sub-transfer agency costs. The Board also noted that the fee rate to be paid by the Fund under the Management Agreement will incorporate the advisory fee and Fund-level administration fee previously payable separately by the Fund under the Fund’s Advisory Agreement and Administration Agreement with Funds Management. The Board also reviewed and considered the contractual investment sub-advisory fee rates that are payable by Funds Management to the Sub-Adviser for investment sub-advisory services (the “Sub-Advisory Agreement Rates”).
Among other information reviewed by the Board was a comparison of the Management Rates of the Fund with those of other funds in the expense Groups at a common asset level. The Board noted that the Management Rates of the Fund were lower than the Fund’s expense Groups for all share classes.
The Board also received and considered information about the portion of the total advisory fee that was retained by Funds Management after payment of the fee to the Sub-Adviser for sub-advisory services. In assessing the reasonableness of this amount, the Board received and evaluated information about the nature and extent of responsibilities retained and risks assumed by Funds Management and not delegated to or assumed by the Sub-Adviser, and about Funds Management’s on-going oversight services. However, given the affiliation between Funds Management and the Sub-Adviser, the Board ascribed limited relevance to the allocation of the advisory fee between them.
The Board also received and considered information about the nature and extent of services offered and fee rates charged by Funds Management and the Sub-Adviser to other types of clients with investment strategies similar to those of the Fund. In this regard, the Board received information about the significantly greater scope of services, and compliance, reporting and other legal burdens and risks of managing mutual funds compared with those associated with managing assets of non-mutual fund clients such as collective funds or institutional separate accounts.
| | | | |
| 36 | | Wells Fargo Advantage Short-Term High Yield Bond Fund | | Other information (unaudited) |
Based on its consideration of the factors and information it deemed relevant, including those described here, the Board determined that the compensation payable to Funds Management under the Management Agreement and Advisory Agreement and to the Sub-Adviser under the Sub-Advisory Agreement was reasonable, in light of the services covered by the Advisory Agreements.
Profitability
The Board received and considered information concerning the profitability of Funds Management, as well as the profitability of Wells Fargo as a whole, from providing services to the Fund and the fund family as a whole. The Board also received and considered information concerning the profitability of the Sub-Adviser from providing services to the fund family as a whole, noting that the Sub-Adviser’s profitability information with respect to providing services to the Fund was subsumed in the Wells Fargo profitability analysis.
Funds Management reported on the methodologies and estimates used in calculating profitability. Among other things, the Board noted that the levels of profitability reported on a fund-by-fund basis varied widely, depending on factors such as the size and type of fund. Based on its review, the Board did not deem the profits reported by Funds Management or Wells Fargo from its services to the Fund to be at a level that would prevent it from approving the continuation of the Advisory Agreements.
Economies of scale
With respect to possible economies of scale, the Board noted the existence of breakpoints in the Fund’s advisory and management fee structures, and the Fund’s administration fee structure, which operate generally to reduce the Fund’s expense ratios as the Fund grows in size. It considered that, for a small fund or a fund that shrinks in size, breakpoints conversely can result in higher fee levels. The Board also considered that fee waiver and expense reimbursement arrangements and competitive fee rates at the outset are means of sharing potential economies of scale with shareholders of the Fund and the fund family as a whole. The Board considered Funds Management’s view that any analyses of potential economies of scale in managing a particular fund are inherently limited in light of the joint and common costs and investments that Funds Management incurs across the fund family as a whole.
The Board concluded that the Fund’s fee and expense arrangements, including contractual breakpoints, constituted a reasonable approach to sharing potential economies of scale with the Fund and its shareholders.
Other benefits to Funds Management and the Sub-Adviser
The Board received and considered information regarding potential “fall-out” or ancillary benefits received by Funds Management and its affiliates, including the Sub-Adviser, as a result of their relationships with the Fund. Ancillary benefits could include, among others, benefits directly attributable to other relationships with the Fund and benefits potentially derived from an increase in Funds Management’s and the Sub-Adviser’s business as a result of their relationships with the Fund. The Board noted that various affiliates of Funds Management may receive distribution-related fees, shareholder servicing payments and sub-transfer agency fees in respect of shares sold or held through them and services provided.
The Board also reviewed information about soft dollar credits earned and utilized by the Sub-Adviser, fees earned by Funds Management and the Sub-Adviser from managing a private investment vehicle for the fund family’s securities lending collateral and commissions earned by an affiliated broker from portfolio transactions.
Based on its consideration of the factors and information it deemed relevant, including those described here, the Board did not find that any ancillary benefits received by Funds Management and its affiliates, including the Sub-Adviser, were unreasonable.
Conclusion
At the Meeting, after considering the above-described factors and based on its deliberations and its evaluation of the information described above, the Board unanimously approved the continuation of the Advisory Agreement for the period from June 1, 2015 through June 30, 2015, approved the Management Agreement for the period from July 1, 2015 through May 31, 2016, and approved the continuation of the Sub-Advisory Agreement for a one-year term through May 31, 2016. The Board also determined that the compensation payable to Funds Management and the Sub-Adviser under each of the Advisory Agreements was reasonable.
| | | | | | |
| List of abbreviations | | Wells Fargo Advantage Short-Term High Yield Bond Fund | | | 37 | |
The following is a list of common abbreviations for terms and entities that may have appeared in this report.
| ACA | — ACA Financial Guaranty Corporation |
| ADR | — American depositary receipt |
| ADS | — American depositary shares |
| AGC | — Assured Guaranty Corporation |
| AGM | — Assured Guaranty Municipal |
| Ambac | — Ambac Financial Group Incorporated |
| AMT | — Alternative minimum tax |
| BAN | — Bond anticipation notes |
| BHAC | — Berkshire Hathaway Assurance Corporation |
| CAB | — Capital appreciation bond |
| CCAB | — Convertible capital appreciation bond |
| CDA | — Community Development Authority |
| CDO | — Collateralized debt obligation |
| DRIVER | — Derivative inverse tax-exempt receipts |
| DW&P | — Department of Water & Power |
| DWR | — Department of Water Resources |
| ECFA | — Educational & Cultural Facilities Authority |
| EDA | — Economic Development Authority |
| EDFA | — Economic Development Finance Authority |
| ETF | — Exchange-traded fund |
| FDIC | — Federal Deposit Insurance Corporation |
| FFCB | — Federal Farm Credit Banks |
| FGIC | — Financial Guaranty Insurance Corporation |
| FHA | — Federal Housing Administration |
| FHLB | — Federal Home Loan Bank |
| FHLMC | — Federal Home Loan Mortgage Corporation |
| FICO | — The Financing Corporation |
| FNMA | — Federal National Mortgage Association |
| GDR | — Global depositary receipt |
| GNMA | — Government National Mortgage Association |
| HCFR | — Healthcare facilities revenue |
| HEFA | — Health & Educational Facilities Authority |
| HEFAR | — Higher education facilities authority revenue |
| HFA | — Housing Finance Authority |
| HFFA | — Health Facilities Financing Authority |
| HUD | — Department of Housing and Urban Development |
| IDA | — Industrial Development Authority |
| IDAG | — Industrial Development Agency |
| KRW | — Republic of Korea won |
| LIBOR | — London Interbank Offered Rate |
| LIFER | — Long Inverse Floating Exempt Receipts |
| LLC | — Limited liability company |
| LLLP | — Limited liability limited partnership |
| LLP | — Limited liability partnership |
| MBIA | — Municipal Bond Insurance Association |
| MFHR | — Multifamily housing revenue |
| MSTR | — Municipal securities trust receipts |
| MUD | — Municipal Utility District |
| National | — National Public Finance Guarantee Corporation |
| PCFA | — Pollution Control Financing Authority |
| PCL | — Public Company Limited |
| PCR | — Pollution control revenue |
| PFA | — Public Finance Authority |
| PFFA | — Public Facilities Financing Authority |
| PFOTER | — Puttable floating option tax-exempt receipts |
| plc | — Public limited company |
| PUTTER | — Puttable tax-exempt receipts |
| R&D | — Research & development |
| Radian | — Radian Asset Assurance |
| RAN | — Revenue anticipation notes |
| RDA | — Redevelopment Authority |
| RDFA | — Redevelopment Finance Authority |
| REIT | — Real estate investment trust |
| ROC | — Reset option certificates |
| SAVRS | — Select auction variable rate securities |
| SBA | — Small Business Authority |
| SDR | — Swedish depositary receipt |
| SFHR | — Single-family housing revenue |
| SFMR | — Single-family mortgage revenue |
| SPA | — Standby purchase agreement |
| SPDR | — Standard & Poor’s Depositary Receipts |
| SPEAR | — Short Puttable Exempt Adjustable Receipts |
| STRIPS | — Separate trading of registered interest and |
| TAN | — Tax anticipation notes |
| TIPS | — Treasury inflation-protected securities |
| TRAN | — Tax revenue anticipation notes |
| TTFA | — Transportation Trust Fund Authority |
| TVA | — Tennessee Valley Authority |
This page is intentionally left blank.
This page is intentionally left blank.
This page is intentionally left blank.


For more information
More information about Wells Fargo Advantage Funds is available free upon request. To obtain literature, please write, email, visit the Fund’s website, or call:
Wells Fargo Advantage Funds
P.O. Box 8266
Boston, MA 02266-8266
Email: wfaf@wellsfargo.com
Website: wellsfargoadvantagefunds.com
Individual investors: 1-800-222-8222
Retail investment professionals: 1-888-877-9275
Institutional investment professionals: 1-866-765-0778
This report and the financial statements contained herein are submitted for the general information of the shareholders of Wells Fargo Advantage Funds. If this report is used for promotional purposes, distribution of the report must be accompanied or preceded by a current prospectus. Before investing, please consider the investment objectives, risks, charges, and expenses of the investment. For a current prospectus and, if available, a summary prospectus, containing this information, call 1-800-222-8222 or visit the Fund’s website at wellsfargoadvantagefunds.com. Read the prospectus carefully before you invest or send money.
Wells Fargo Funds Management, LLC, a wholly owned subsidiary of Wells Fargo & Company, provides investment advisory and administrative services for Wells Fargo Advantage Funds. Other affiliates of Wells Fargo & Company provide subadvisory and other services for the Funds. The Funds are distributed by Wells Fargo Funds Distributor, LLC, Member FINRA, an affiliate of Wells Fargo & Company.
NOT FDIC INSURED ¡ NO BANK GUARANTEE ¡ MAY LOSE VALUE
© 2015 Wells Fargo Funds Management, LLC. All rights reserved.
| | |
 | | 236808 10-15 A222/AR222 08-15 |

Wells Fargo Advantage
Ultra Short-Term Income Fund

Annual Report
August 31, 2015

Reduce clutter. Save trees.
Sign up for electronic delivery of prospectuses and shareholder reports at wellsfargo.com/advantagedelivery
Contents
The views expressed and any forward-looking statements are as of August 31, 2015, unless otherwise noted, and are those of the Fund managers and/or Wells Fargo Funds Management, LLC. Discussions of individual securities, or the markets generally, or any Wells Fargo Advantage Fund are not intended as individual recommendations. Future events or results may vary significantly from those expressed in any forward-looking statements; the views expressed are subject to change at any time in response to changing circumstances in the market. Wells Fargo Funds Management, LLC and the Fund disclaim any obligation to publicly update or revise any views expressed or forward-looking statements.
NOT FDIC INSURED ¡ NO BANK GUARANTEE ¡ MAY LOSE VALUE
| | | | |
| 2 | | Wells Fargo Advantage Ultra Short-Term Income Fund | | Letter to shareholders (unaudited) |

Karla M. Rabusch
President
Wells Fargo Advantage Funds
Major central banks continued to inject liquidity into global banks and markets through various accommodative monetary policies, including quantitative easing.
Dear Valued Shareholder:
We are pleased to offer you this annual report for the Wells Fargo Advantage Ultra Short-Term Income Fund for the 12-month period that ended August 31, 2015. The period was marked by low interest rates, low oil prices, and moderate U.S. economic growth. Short-term investment-grade bonds, as measured by the Barclays U.S. 1–3 Year Government/Credit Bond Index,1 returned 0.81% during the period. Meanwhile, strong demand for high-quality, liquid assets kept returns on Treasury bills more modest; the Barclays 6-Month Treasury Bill Index2 returned 0.15% during the period.
Major central banks continued to provide stimulus.
Major central banks continued to inject liquidity into global banks and markets through various accommodative monetary policies, including quantitative easing. In the U.S., the Federal Reserve (Fed) kept its key interest rate near zero in order to support the economy and the financial system. However, it set expectations for it to begin normalizing monetary policy with higher target ranges for the federal funds rate.
Meanwhile, European markets continued to benefit from the European Central Bank’s (ECB’s) willingness to maintain low interest rates. In addition to its targeted longer-term refinancing operations that are designed to increase bank lending, the ECB expanded its quantitative easing program to include the purchase of eurozone government bonds. In Japan, the Bank of Japan maintained an aggressive monetary program aimed at combating deflation.
Economic growth was moderate, and oil prices plummeted.
U.S. economic growth advanced during the reporting period, the unemployment rate ticked lower to 5.1% as of August 2015, and inflation remained below the Fed’s longer-run objective of a 2% pace. The period was also marked by lower oil prices, which began the reporting period near $90 per barrel but declined to $46 per barrel at the end of August 2015. While lower oil prices benefited consumers of oil products, the lower prices pressured companies within the energy sector.
Bond yields rose but remained low by historical standards.
Short-term interest rates increased during the reporting period, with a flattening in the shape of the short-term yield curve. During this time frame, 1-year Treasury bills rose 29 basis points (bps; 100 bps equals 1.00%) to yield 0.38%, 2-year Treasury note yields rose 21 bps to yield 0.74%, and 3-year Treasury note yields rose only 8 bps to yield 1.05%. Meanwhile, ultra-short-term yields were little changed at ultralow levels, anchored by the easy monetary policy.
Since the end of the financial crisis, structural changes in the fixed-income markets have reduced trading liquidity (the degree to which assets can be bought or sold without affecting the price). New regulations and capital requirements have caused traditional liquidity suppliers (banks and broker/dealers) to be more risk-averse and hold less inventory. Meanwhile, corporate-debt issuance has spiked as
| 1 | The Barclays U.S. 1–3 Year Government/Credit Bond Index is the one- to three-year component of the Barclays U.S. Government/Credit Bond Index that includes securities in the Government and Credit Indexes. The Government Index includes Treasuries (that is, public obligations of the U.S. Treasury that have remaining maturities of more than one year) and agencies (that is, publicly issued debt of U.S. government agencies, quasi-federal corporations, and corporate or foreign debt guaranteed by the U.S. government). The Credit Index includes publicly issued U.S. corporate and foreign debentures and secured notes that meet specified maturity, liquidity, and quality requirements. You cannot invest directly in an index. |
| 2 | The Barclays 6-Month Treasury Bill Index tracks the performance and attributes of recently issued 6-month U.S. Treasury bills. The index follows Barclays’ monthly rebalancing conventions. You cannot invest directly in an index. |
| | | | | | |
| Letter to shareholders (unaudited) | | Wells Fargo Advantage Ultra Short-Term Income Fund | | | 3 | |
companies finance themselves at record-low yields, bond mutual funds hold larger amounts of this new debt supply, trading volumes are lower, and large-size trades are more difficult to execute. However, fixed-income markets appear to have functioned well over the past year with sufficient liquidity and muted volatility.
Don’t let short-term uncertainty derail long-term investment goals.
Periods of uncertainty can present challenges, but experience has taught us that maintaining long-term investment goals can be an effective way to plan for the future. To help you create a sound strategy based on your personal goals and risk tolerance, Wells Fargo Advantage Funds offers more than 100 mutual funds spanning a wide range of asset classes and investment styles. Although diversification cannot guarantee an investment profit or prevent losses, we believe it can be an effective way to manage investment risk and potentially smooth out overall portfolio performance. We encourage investors to know their investments and to understand that appropriate levels of risk-taking may unlock opportunities.
Thank you for choosing to invest in Wells Fargo Advantage Funds. We appreciate your confidence in us and remain committed to helping you meet your financial needs.
Sincerely,

Karla M. Rabusch
President
Wells Fargo Advantage Funds
Periods of uncertainty can present challenges, but experience has taught us that maintaining long-term investment goals can be an effective way to plan for the future.
Notice to shareholders
At a meeting held on August 11–12, 2015, the Board of Trustees of the Fund approved a change in the name of the Fund whereby the word “Advantage” will be removed from its name, effective December 15, 2015.
For current information about your fund investments, contact your investment professional, visit our website at wellsfargoadvantagefunds.com, or call us directly at 1-800-222-8222. We are available 24 hours a day, 7 days a week.
| | | | |
| 4 | | Wells Fargo Advantage Ultra Short-Term Income Fund | | Performance highlights (unaudited) |
Investment objective
The Fund seeks current income consistent with capital preservation.
Manager
Wells Fargo Funds Management, LLC
Subadviser
Wells Capital Management Incorporated
Portfolio managers
Christopher Y. Kauffman, CFA
Jay N. Mueller, CFA
Thomas M. Price, CFA
Noah Wise, CFA
Average annual total returns1 (%) as of August 31, 2015
| | | | | | | | | | | | | | | | | | | | | | | | | | | | | | | | | | |
| | | | | Including sales charge | | | Excluding sales charge | | | Expense ratios2 (%) | |
| | | Inception date | | 1 year | | | 5 year | | | 10 year | | | 1 year | | | 5 year | | | 10 year | | | Gross | | | Net3 | |
| Class A (SADAX) | | 8-31-1999 | | | (2.07 | ) | | | 0.40 | | | | 1.50 | | | | (0.07 | ) | | | 0.80 | | | | 1.71 | | | | 0.78 | | | | 0.71 | |
| Class C (WUSTX) | | 7-18-2008 | | | (1.81 | ) | | | 0.05 | | | | 0.95 | | | | (0.81 | ) | | | 0.05 | | | | 0.95 | | | | 1.53 | | | | 1.46 | |
| Administrator Class (WUSDX) | | 4-8-2005 | | | – | | | | – | | | | – | | | | (0.04 | ) | | | 0.95 | | | | 1.86 | | | | 0.72 | | | | 0.56 | |
| Institutional Class (SADIX) | | 8-31-1999 | | | – | | | | – | | | | – | | | | 0.16 | | | | 1.16 | | | | 2.07 | | | | 0.45 | | | | 0.36 | |
| Investor Class (STADX) | | 11-25-1998 | | | – | | | | – | | | | – | | | | (0.10 | ) | | | 0.77 | | | | 1.67 | | | | 0.81 | | | | 0.74 | |
Barclays Short-Term Government/ Corporate Index4 | | – | | | – | | | | – | | | | – | | | | 0.81 | | | | 1.03 | | | | 2.79 | | | | – | | | | – | |
| Barclays Short Treasury Index 9-12 Month5 | | – | | | – | | | | – | | | | – | | | | 0.20 | | | | 0.30 | | | | 1.85 | | | | – | | | | – | |
| Barclays 1-3 Year Government/Credit Index6 | | – | | | – | | | | – | | | | – | | | | 0.22 | | | | 0.30 | | | | 1.84 | | | | – | | | | – | |
Figures quoted represent past performance, which is no guarantee of future results, and do not reflect taxes that a shareholder may pay on fund distributions or the redemption of fund shares. Investment return and principal value of an investment will fluctuate so that an investor’s shares, when redeemed, may be worth more or less than their original cost. Performance shown without sales charges would be lower if sales charges were reflected. Current performance may be lower or higher than the performance data quoted, which assumes the reinvestment of dividends and capital gains. Current month-end performance is available on the Fund’s website, wellsfargoadvantagefunds.com.
Index returns do not include transaction costs associated with buying and selling securities, any mutual fund fees or expenses, or any taxes. It is not possible to invest directly in an index.
For Class A shares, the maximum front-end sales charge is 2.00%. For Class C shares, the maximum contingent deferred sales charge is 1.00%. Performance including a contingent deferred sales charge assumes the sales charge for the corresponding time period. Administrator Class, Institutional Class, and Investor Class shares are sold without a front-end sales charge or contingent deferred sales charge.
Bond values fluctuate in response to the financial condition of individual issuers, general market and economic conditions, and changes in interest rates. Changes in market conditions and government policies may lead to periods of heightened volatility in the bond market and reduced liquidity for certain bonds held by the Fund. In general, when interest rates rise, bond values fall and investors may lose principal value. Interest-rate changes and their impact on the Fund and its share price can be sudden and unpredictable. Loans are subject to risks similar to those associated with other below-investment-grade bond investments, such as credit risk (for example, risk of issuer default), below-investment-grade bond risk (for example, risk of greater volatility in value), and risk that the loan may become illiquid or difficult to price. The use of derivatives may reduce returns and/or increase volatility. Certain investment strategies tend to increase the total risk of an investment (relative to the broader market). The Fund is exposed to foreign investment risk, high-yield securities risk, and mortgage- and asset-backed securities risk. Consult the Fund’s prospectus for additional information on these and other risks.
Please see footnotes on page 5.
| | | | | | |
| Performance highlights (unaudited) | | Wells Fargo Advantage Ultra Short-Term Income Fund | | | 5 | |
|
| Growth of $10,000 investment7 as of August 31, 2015 |
|
 |
| 1 | Effective June 20, 2008, Advisor Class was renamed Class A and modified to assume the features and attributes of Class A. Historical performance shown for Class A shares through June 19, 2008, includes Advisor Class expenses. Historical performance shown for Class C shares prior to their inception reflects the performance of Investor Class shares, adjusted to include the higher expenses applicable to Class C shares. Historical performance shown for Administrator Class shares prior to their inception reflects the performance of Institutional Class shares, adjusted to include the higher expenses applicable to Administrator Class shares. |
| 2 | Reflects the expense ratios as stated in the most recent prospectuses, which include the impact of 0.01% in acquired fund fees and expenses. The expense ratios shown are subject to change and may differ from the annualized expense ratios shown in the financial highlights of this report, which do not include acquired fund fees and expenses. |
| 3 | The manager has contractually committed through December 31, 2015, to waive fees and/or reimburse expenses to the extent necessary to cap the Fund’s Total Annual Fund Operating Expenses After Fee Waiver at 0.70% for Class A, 1.45% for Class C, 0.55% for Administrator Class, 0.35% for Institutional Class, and 0.73% for Investor Class. After this time, the cap may be increased or the commitment to maintain the cap may be terminated only with the approval of the Board of Trustees. Brokerage commissions, stamp duty fees, interest, taxes, acquired fund fees and expenses, and extraordinary expenses are excluded from the cap. Without this cap, the Fund’s returns would have been lower. |
| 4 | The Barclays Short-Term Government/Corporate Index contains securities that have fallen out of the Barclays U.S. Government/Credit Index because of the standard minimum one-year to maturity constraint. Securities in the Barclays Short-Term Government/Corporate Index must have a maturity from one up to (but not including) 12 months. You cannot invest directly in an index. |
| 5 | The Barclays Short Treasury Index 9-12 Month is an unmnaged index that includes aged U.S. Treasury bills, notes and bonds with a remaining maturity from nine up to (but not including) 12 months. It excludes zero-coupon STRIPS. You cannot invest directly in an index. |
| 6 | The Barclays 1-3 Year Government/Credit Bond Index is the one- to three-year component of the Barclays 1-3 Year Government/Credit Bond Index that includes securities in the Government and Credit Indexes. The Government Index includes Treasuries (that is, public obligations of the U.S. Treasury that have remaining maturities of more than one year) and agencies (that is, publicly issued debt of U.S. government agencies, quasi-federal corporations, and corporate or foreign debt guaranteed by the U.S. government). The Credit Index includes publicly issued U.S. corporate and foreign debentures and secured notes that meet specified maturity, liquidity, and quality requirements. You cannot invest directly in an index. |
| 7 | The chart compares the performance of Class A shares for the most recent 10 years with the performance of the Barclays Short-Term U.S. Government/Corporate Index, the Barclays 9-12 Month U.S. Short-Term Treasury Index, and the Barclays 1-3 Year U.S. Government/Credit Bond Index. The chart assumes a hypothetical investment of $10,000 in Class A shares and reflects all operating expenses and assumes the maximum initial sales charge of 2.00%. |
| 8 | The ten largest holdings, excluding cash and cash equivalents, are calculated based on the value of the investments divided by total net assets of the Fund. Holdings are subject to change and may have changed since the date specified. |
| 9 | Amounts are calculated based on the total long-term investments of the Fund. These amounts are subject to change and may have changed since the date specified. |
| | | | |
| 6 | | Wells Fargo Advantage Ultra Short-Term Income Fund | | Performance highlights (unaudited) |
MANAGER’S DISCUSSION
Fund highlights
| n | | The Fund underperformed its benchmarks, the Barclays Short-Term U.S. Government/Corporate Index, the Barclays 9–12 Month U.S. Short-Term Treasury Index, and the Barclays U.S. 1–3 Year Government/Credit Bond Index, for the 12-month period that ended August 31, 2015. |
| n | | The Fund’s overweight in corporate debt had a mixed impact on relative performance during the period because wider credit spreads detracted from results more than the higher income from this sector contributed to results. The Fund’s holdings in asset-backed securities (ABS) generated positive relative returns. Meanwhile, mortgage-backed securities (MBS) results were mixed: Agency MBS outperformed, while commercial MBS lagged. |
| | | | |
| Ten largest holdings8 (%) as of August 31, 2015 | |
FNMA, 3.50%, 9-17-2030 | | | 1.12 | |
Mercedes-Benz Auto Receivables Series 2015-1 Class A2A, 0.82%, 6-15-2018 | | | 1.02 | |
JPMorgan Chase Commercial Mortgage Securities Corporation Series 2014-INN Class A, 1.12%, 6-15-2029 | | | 0.93 | |
DIRECTV Holdings LLC, 2.40%, 3-15-2017 | | | 0.91 | |
Verizon Communications Incorporated, 1.35%, 6-9-2017 | | | 0.90 | |
Chase Issuance Trust Series 2012-A9 Class A9, 0.35%, 10-16-2017 | | | 0.90 | |
Nissan Auto Lease Trust Series 2014-B Class A2A, 0.73%, 4-17-2017 | | | 0.82 | |
Providence Health & Services Company, 1.08%, 10-1-2016 | | | 0.75 | |
Port Arthur TX Navigation District Motiva Enterprises LLC Series B, 0.30%, 12-1-2039 | | | 0.75 | |
CNH Equipment Trust Series 2015-C Class A2A, 1.10%, 12-17-2018 | | | 0.72 | |
The economic climate remained benign.
The U.S. economy featured trend-like growth, a steadily improving labor market, and generally stable inflation over the past 12 months. Real gross domestic product growth averaged about 2.7% in the most recent four quarters as personal income gains supported consumption. In contrast, business investment softened, in part, due to weakness in the energy industry brought on by a collapse in global oil prices.
The labor market continued to tighten over the past 12 months, as evidenced by a full percentage point decline in the unemployment rate to 5.1%. Nonfarm payrolls expanded at an average pace of about 240,000 per month over the period. Following a persistent theme of this expansion, some of the improvement in the unemployment rate can be attributed to a decline in the labor force participation rate, which fell to 62.6% at the end of the period versus 62.8% a year ago.
The inflationary environment was mixed over the past 12 months as the drop in oil prices pushed the year-over-year change in the headline Consumer Price Index (CPI)
down to 0.2% compared with a 1.7% headline inflation rate a year ago. Excluding food and energy, however, the CPI rose 1.8%, which is basically in line with the average rate of core inflation recorded over the past five years.
Monetary policy transitioned from maximal accommodation to the beginning of a tightening cycle over the past 12 months. The Federal Open Market Committee (FOMC) completed its third round of asset purchases, which is popularly known as quantitative easing, in the fourth quarter of 2014, though the monetary authorities continue to reinvest the proceeds of maturing principal and interest payments from their existing portfolio. The FOMC’s overnight federal funds rate target remained unchanged throughout the period, with the federal funds rate held to a range of 0.00% to 0.25%. The FOMC has said an initial hike to the federal funds target rate may be appropriate before the end of 2015, to be followed by a very gradual normalization of monetary policy.”
Please see footnotes on page 5.
| | | | | | |
| Performance highlights (unaudited) | | Wells Fargo Advantage Ultra Short-Term Income Fund | | | 7 | |
|
| Portfolio allocation9 as of August 31, 2015 |
|
 |
The Fund remained overweight corporate notes and securitized debt.
During the period, the Fund maintained an overweight to short-term corporate notes and securitized debt while being underweight U.S. Treasuries and agency debentures. About half of Fund assets were invested in corporate debt securities, while the other primary sector commitment was to securitized debt: MBS pass-throughs, ABS, and collateralized mortgage obligations. We maintained the Fund’s duration near six months.
In this environment of trend-like growth, stable core inflation, and still accommodative monetary policy, we believe that the spread sectors, including both corporate credit and structured product, represented good value,
particularly with spreads having widened in recent months. In our view, the spread widening has been more a function of supply concerns and global macro uncertainty than deterioration in domestic fundamentals. That said, corporate credit metrics have weakened in certain industries such as mineral extraction and energy, and management focus on rewarding shareholders has resulted in additional leverage in several industries.
We expect a gradual rise in short-term interest rates.
The relatively benign domestic economic conditions described above are likely to result in a gradual upward bias toward interest rates. The FOMC is likely to raise its target rate by 0.75% to 1.00% over the next 12 months, a result which is largely reflected in the current term structure of interest rates. Should market rates diverge from the policy path we think most likely, we will be prepared to modify our duration and yield-curve posture in response to the opportunities presented.
Please see footnotes on page 5.
| | | | |
| 8 | | Wells Fargo Advantage Ultra Short-Term Income Fund | | Fund expenses (unaudited) |
As a shareholder of the Fund, you incur two types of costs: (1) transaction costs, including sales charges (loads) on purchase payments and contingent deferred sales charges (if any) on redemptions and (2) ongoing costs, including management fees, distribution (12b-1) and/or shareholder servicing fees, and other Fund expenses. This example is intended to help you understand your ongoing costs (in dollars) of investing in the Fund and to compare these costs with the ongoing costs of investing in other mutual funds.
The example is based on an investment of $1,000 invested at the beginning of the six-month period and held for the entire period from March 1, 2015 to August 31, 2015.
Actual expenses
The “Actual” line of the table below provides information about actual account values and actual expenses. You may use the information in this line, together with the amount you invested, to estimate the expenses that you paid over the period. Simply divide your account value by $1,000 (for example, an $8,600 account value divided by $1,000 = 8.6), then multiply the result by the number in the “Actual” line under the heading entitled “Expenses paid during period” for your applicable class of shares to estimate the expenses you paid on your account during this period.
Hypothetical example for comparison purposes
The “Hypothetical” line of the table below provides information about hypothetical account values and hypothetical expenses based on the Fund’s actual expense ratio and an assumed rate of return of 5% per year before expenses, which is not the Fund’s actual return. The hypothetical account values and expenses may not be used to estimate the actual ending account balance or expenses you paid for the period. You may use this information to compare the ongoing costs of investing in the Fund and other funds. To do so, compare this 5% hypothetical example with the 5% hypothetical examples that appear in the shareholder reports of the other funds.
Please note that the expenses shown in the table are meant to highlight your ongoing costs only and do not reflect any transactional costs, such as sales charges (loads) and contingent deferred sales charges. Therefore, the “Hypothetical” line of the table is useful in comparing ongoing costs only and will not help you determine the relative total costs of owning different funds. In addition, if these transactional costs were included, your costs would have been higher.
| | | | | | | | | | | | | | | | |
| | | Beginning
account value
3-1-2015 | | | Ending
account value
8-31-2015 | | | Expenses
paid during
the period1 | | | Net annualized
expense ratio | |
Class A | | | | | | | | | | | | | | | | |
Actual | | $ | 1,000.00 | | | $ | 1,000.29 | | | $ | 3.53 | | | | 0.70 | % |
Hypothetical (5% return before expenses) | | $ | 1,000.00 | | | $ | 1,021.68 | | | $ | 3.57 | | | | 0.70 | % |
Class C | | | | | | | | | | | | | | | | |
Actual | | $ | 1,000.00 | | | $ | 996.52 | | | $ | 7.30 | | | | 1.45 | % |
Hypothetical (5% return before expenses) | | $ | 1,000.00 | | | $ | 1,017.90 | | | $ | 7.38 | | | | 1.45 | % |
Administrator Class | | | | | | | | | | | | | | | | |
Actual | | $ | 1,000.00 | | | $ | 999.85 | | | $ | 2.77 | | | | 0.55 | % |
Hypothetical (5% return before expenses) | | $ | 1,000.00 | | | $ | 1,022.43 | | | $ | 2.80 | | | | 0.55 | % |
Institutional Class | | | | | | | | | | | | | | | | |
Actual | | $ | 1,000.00 | | | $ | 1,000.87 | | | $ | 1.77 | | | | 0.35 | % |
Hypothetical (5% return before expenses) | | $ | 1,000.00 | | | $ | 1,023.44 | | | $ | 1.79 | | | | 0.35 | % |
Investor Class | | | | | | | | | | | | | | | | |
Actual | | $ | 1,000.00 | | | $ | 1,000.14 | | | $ | 3.68 | | | | 0.73 | % |
Hypothetical (5% return before expenses) | | $ | 1,000.00 | | | $ | 1,021.53 | | | $ | 3.72 | | | | 0.73 | % |
| 1 | Expenses paid is equal to the annualized expense ratio of each class multiplied by the average account value over the period, multiplied by the number of days in the most recent fiscal half-year divided by the number of days in the fiscal year (to reflect the one-half-year period). |
| | | | | | |
| Portfolio of investments—August 31, 2015 | | Wells Fargo Advantage Ultra Short-Term Income Fund | | | 9 | |
| | | | | | | | | | | | | | | | |
| Security name | | Interest rate | | | Maturity date | | | Principal | | | Value | |
| | | | | | | | | | | | | | | | |
| | | | |
Agency Securities: 12.85% | | | | | | | | | | | | | | | | |
FDIC Series 2013-R1 Class A 144A | | | 1.15 | % | | | 3-25-2033 | | | $ | 3,310,072 | | | $ | 3,271,925 | |
FHLMC ± | | | 2.45 | | | | 3-1-2035 | | | | 1,453,464 | | | | 1,551,010 | |
FHLMC ± | | | 2.49 | | | | 11-1-2035 | | | | 5,827,973 | | | | 6,207,043 | |
FHLMC ± | | | 2.50 | | | | 4-1-2032 | | | | 135,755 | | | | 143,542 | |
FHLMC ± | | | 2.50 | | | | 6-1-2032 | | | | 6,368 | | | | 6,709 | |
FHLMC ± | | | 2.56 | | | | 10-1-2031 | | | | 75,588 | | | | 76,165 | |
FHLMC ± | | | 2.58 | | | | 1-1-2029 | | | | 73,809 | | | | 74,487 | |
FHLMC ± | | | 2.65 | | | | 7-1-2029 | | | | 3,673 | | | | 3,831 | |
FHLMC ± | | | 3.03 | | | | 10-1-2038 | | | | 2,060,650 | | | | 2,201,519 | |
FHLMC | | | 4.50 | | | | 2-1-2020 | | | | 1,676,591 | | | | 1,752,759 | |
FHLMC | | | 4.50 | | | | 8-1-2020 | | | | 942,540 | | | | 985,360 | |
FHLMC | | | 4.50 | | | | 1-1-2022 | | | | 749,975 | | | | 780,903 | |
FHLMC | | | 5.00 | | | | 12-1-2019 | | | | 1,937,141 | | | | 2,048,211 | |
FHLMC | | | 5.50 | | | | 8-1-2018 | | | | 455,971 | | | | 477,880 | |
FHLMC | | | 6.00 | | | | 4-1-2016 | | | | 34,811 | | | | 35,178 | |
FHLMC | | | 6.00 | | | | 5-1-2017 | | | | 209,659 | | | | 214,918 | |
FHLMC | | | 6.00 | | | | 1-1-2024 | | | | 1,781,879 | | | | 1,942,209 | |
FHLMC | | | 7.00 | | | | 6-1-2031 | | | | 409,954 | | | | 472,973 | |
FHLMC | | | 9.00 | | | | 11-1-2016 | | | | 29,634 | | | | 29,959 | |
FHLMC | | | 9.00 | | | | 12-1-2016 | | | | 110,081 | | | | 112,661 | |
FHLMC | | | 9.00 | | | | 8-1-2018 | | | | 44,084 | | | | 45,797 | |
FHLMC | | | 9.00 | | | | 10-1-2019 | | | | 39,126 | | | | 42,410 | |
FHLMC | | | 9.50 | | | | 12-1-2016 | | | | 14,728 | | | | 14,871 | |
FHLMC | | | 9.50 | | | | 5-1-2020 | | | | 4,930 | | | | 4,978 | |
FHLMC | | | 9.50 | | | | 9-1-2020 | | | | 88,576 | | | | 96,960 | |
FHLMC | | | 9.50 | | | | 12-1-2022 | | | | 153,879 | | | | 165,465 | |
FHLMC | | | 10.00 | | | | 11-17-2021 | | | | 24,260 | | | | 24,884 | |
FHLMC | | | 10.50 | | | | 5-1-2020 | | | | 103,459 | | | | 114,916 | |
FHLMC Series 2495 Class UJ | | | 3.50 | | | | 7-15-2032 | | | | 33,133 | | | | 33,799 | |
FHLMC Series 2530 Class BH | | | 5.00 | | | | 11-15-2017 | | | | 1,001,094 | | | | 1,033,977 | |
FHLMC Series 2617 Class GR | | | 4.50 | | | | 5-15-2018 | | | | 348,413 | | | | 360,091 | |
FHLMC Series 2684 Class PE | | | 5.00 | | | | 1-15-2033 | | | | 34,174 | | | | 34,795 | |
FHLMC Series 2690 Class TG | | | 4.50 | | | | 4-15-2032 | | | | 210,352 | | | | 214,137 | |
FHLMC Series 2704 Class BH | | | 4.50 | | | | 11-15-2023 | | | | 1,102,232 | | | | 1,180,616 | |
FHLMC Series 2707 Class QE | | | 4.50 | | | | 11-15-2018 | | | | 729,817 | | | | 760,791 | |
FHLMC Series 2727 Class PE | | | 4.50 | | | | 7-15-2032 | | | | 158,990 | | | | 159,309 | |
FHLMC Series 2843 Class BC | | | 5.00 | | | | 8-15-2019 | | | | 900,372 | | | | 941,867 | |
FHLMC Series 2849 Class B | | | 5.00 | | | | 8-15-2019 | | | | 1,589,410 | | | | 1,662,412 | |
FHLMC Series 2855 Class WN | | | 4.00 | | | | 9-15-2019 | | | | 350,101 | | | | 362,476 | |
FHLMC Series 2864 Class NB | | | 5.50 | | | | 7-15-2033 | | | | 1,538,686 | | | | 1,624,096 | |
FHLMC Series 2881 Class AE | | | 5.00 | | | | 8-15-2034 | | | | 749,360 | | | | 798,985 | |
FHLMC Series 2896 Class CB | | | 4.50 | | | | 11-15-2019 | | | | 1,307,599 | | | | 1,362,100 | |
FHLMC Series 2907 Class HE | | | 5.00 | | | | 5-15-2033 | | | | 1,105,867 | | | | 1,113,805 | |
FHLMC Series 2953 Class LD | | | 5.00 | | | | 12-15-2034 | | | | 506,281 | | | | 534,026 | |
FHLMC Series 2963 Class BP | | | 5.00 | | | | 9-15-2034 | | | | 206,842 | | | | 209,968 | |
FHLMC Series 3166 Class AC | | | 5.00 | | | | 6-15-2021 | | | | 10,518,979 | | | | 11,197,558 | |
FHLMC Series 3266 Class D | | | 5.00 | | | | 1-15-2022 | | | | 2,840,264 | | | | 2,970,615 | |
FHLMC Series 3501 Class AC | | | 4.00 | | | | 8-15-2023 | | | | 886,470 | | | | 906,442 | |
FHLMC Series 3538 Class DE | | | 3.50 | | | | 7-15-2023 | | | | 619,893 | | | | 626,509 | |
FHLMC Series 3574 Class EA | | | 3.00 | | | | 9-15-2021 | | | | 393,912 | | | | 402,122 | |
The accompanying notes are an integral part of these financial statements.
| | | | |
| 10 | | Wells Fargo Advantage Ultra Short-Term Income Fund | | Portfolio of investments—August 31, 2015 |
| | | | | | | | | | | | | | | | |
| Security name | | Interest rate | | | Maturity date | | | Principal | | | Value | |
| | | | | | | | | | | | | | | | |
| | | | |
Agency Securities (continued) | | | | | | | | | | | | | | | | |
FHLMC Series 3589 Class CA | | | 4.00 | % | | | 10-15-2021 | | | $ | 496,806 | | | $ | 506,391 | |
FHLMC Series 3609 Class LA | | | 4.00 | | | | 12-15-2024 | | | | 749,792 | | | | 778,313 | |
FHLMC Series 3619 Class EB | | | 3.50 | | | | 5-15-2024 | | | | 175,210 | | | | 180,515 | |
FHLMC Series 3649 Class DG | | | 4.00 | | | | 4-15-2028 | | | | 1,950,878 | | | | 1,972,319 | |
FHLMC Series 3656 Class EC | | | 3.50 | | | | 5-15-2024 | | | | 227,661 | | | | 228,856 | |
FHLMC Series 3660 Class HE | | | 3.50 | | | | 10-15-2023 | | | | 80,167 | | | | 80,369 | |
FHLMC Series 3689 Class BD | | | 2.00 | | | | 7-15-2020 | | | | 155,837 | | | | 155,946 | |
FHLMC Series 3706 Class AB | | | 3.50 | | | | 7-15-2020 | | | | 1,207,977 | | | | 1,228,440 | |
FHLMC Series 3728 Class EA | | | 3.50 | | | | 9-15-2020 | | | | 1,120,881 | | | | 1,130,538 | |
FHLMC Series 3728 Class EH | | | 3.00 | | | | 9-15-2020 | | | | 838,565 | | | | 845,334 | |
FHLMC Series 3772 Class HC | | | 3.00 | | | | 10-15-2018 | | | | 939,786 | | | | 961,866 | |
FHLMC Series 3780 Class DG | | | 3.00 | | | | 10-15-2027 | | | | 747,390 | | | | 756,832 | |
FHLMC Series 3780 Class GX | | | 3.50 | | | | 9-15-2028 | | | | 3,945,209 | | | | 4,070,821 | |
FHLMC Series 3784 Class DA | | | 4.00 | | | | 7-15-2025 | | | | 331,958 | | | | 342,415 | |
FHLMC Series 3786 Class EY | | | 4.50 | | | | 1-15-2032 | | | | 188,066 | | | | 191,510 | |
FHLMC Series 3821 Class LA | | | 3.50 | | | | 4-15-2025 | | | | 736,804 | | | | 765,246 | |
FHLMC Series 3829 Class CA | | | 4.00 | | | | 8-15-2024 | | | | 1,255,388 | | | | 1,266,713 | |
FHLMC Series 3834 Class EA | | | 3.50 | | | | 6-15-2029 | | | | 818,156 | | | | 850,977 | |
FHLMC Series 3842 Class CJ | | | 2.00 | | | | 9-15-2018 | | | | 306,219 | | | | 309,201 | |
FHLMC Series 3878 Class JA | | | 3.50 | | | | 1-15-2025 | | | | 490,227 | | | | 503,196 | |
FHLMC Series 3888 Class JP | | | 4.00 | | | | 2-15-2037 | | | | 149,126 | | | | 151,376 | |
FHLMC Series 3898 Class NE | | | 4.00 | | | | 7-15-2040 | | | | 946,117 | | | | 979,422 | |
FHLMC Series 3952 Class MK | | | 3.00 | | | | 11-15-2021 | | | | 359,180 | | | | 359,898 | |
FHLMC Series K003 Class A3 | | | 4.32 | | | | 12-25-2015 | | | | 1,139,413 | | | | 1,145,164 | |
FHLMC Series K003 Class AAB | | | 4.77 | | | | 5-25-2018 | | | | 916,705 | | | | 960,079 | |
FHLMC Series T-42 Class A6 | | | 9.50 | | | | 2-25-2042 | | | | 917,724 | | | | 1,137,077 | |
FNMA ± | | | 1.77 | | | | 10-1-2031 | | | | 144,975 | | | | 149,174 | |
FNMA ± | | | 1.85 | | | | 9-1-2037 | | | | 897,391 | | | | 940,293 | |
FNMA | | | 1.89 | | | | 2-1-2017 | | | | 2,000,000 | | | | 2,032,643 | |
FNMA ± | | | 2.11 | | | | 1-1-2023 | | | | 17,679 | | | | 17,760 | |
FNMA ± | | | 2.16 | | | | 12-1-2034 | | | | 1,291,618 | | | | 1,367,707 | |
FNMA ± | | | 2.31 | | | | 11-1-2031 | | | | 95,564 | | | | 100,381 | |
FNMA ± | | | 2.36 | | | | 5-1-2032 | | | | 43,665 | | | | 46,238 | |
FNMA ± | | | 2.37 | | | | 4-1-2038 | | | | 4,081,710 | | | | 4,337,621 | |
FNMA ± | | | 2.40 | | | | 11-1-2032 | | | | 1,347,641 | | | | 1,435,739 | |
FNMA ± | | | 2.40 | | | | 8-1-2045 | | | | 1,431,049 | | | | 1,518,739 | |
FNMA ± | | | 2.43 | | | | 12-1-2040 | | | | 439,862 | | | | 467,323 | |
FNMA ± | | | 2.47 | | | | 6-1-2032 | | | | 141,545 | | | | 148,989 | |
FNMA ± | | | 2.47 | | | | 6-1-2034 | | | | 1,773,997 | | | | 1,862,277 | |
FNMA ± | | | 2.49 | | | | 2-1-2033 | | | | 464,108 | | | | 489,822 | |
FNMA ± | | | 2.49 | | | | 5-1-2036 | | | | 1,473,249 | | | | 1,573,404 | |
FNMA ± | | | 2.52 | | | | 11-1-2034 | | | | 2,276,337 | | | | 2,437,795 | |
FNMA ± | | | 2.53 | | | | 5-1-2036 | | | | 1,670,295 | | | | 1,770,776 | |
FNMA | | | 2.71 | | | | 9-1-2017 | | | | 3,555,442 | | | | 3,645,755 | |
FNMA | | | 2.99 | | | | 7-1-2016 | | | | 3,895,998 | | | | 3,924,558 | |
FNMA | | | 3.00 | | | | 1-1-2021 | | | | 765,154 | | | | 796,528 | |
FNMA | | | 3.18 | | | | 12-1-2017 | | | | 4,328,541 | | | | 4,366,882 | |
FNMA | | | 3.21 | | | | 2-1-2016 | | | | 462,592 | | | | 462,503 | |
FNMA ± | | | 3.36 | | | | 4-1-2033 | | | | 5,284 | | | | 5,503 | |
FNMA ± | | | 3.45 | | | | 7-1-2033 | | | | 63,606 | | | | 64,659 | |
The accompanying notes are an integral part of these financial statements.
| | | | | | |
| Portfolio of investments—August 31, 2015 | | Wells Fargo Advantage Ultra Short-Term Income Fund | | | 11 | |
| | | | | | | | | | | | | | | | |
| Security name | | Interest rate | | | Maturity date | | | Principal | | | Value | |
| | | | | | | | | | | | | | | | |
| | | | |
Agency Securities (continued) | | | | | | | | | | | | | | | | |
FNMA | | | 3.50 | % | | | 9-1-2018 | | | $ | 687,917 | | | $ | 724,946 | |
FNMA %% | | | 3.50 | | | | 9-17-2030 | | | | 17,000,000 | | | | 17,908,438 | |
FNMA | | | 3.77 | | | | 1-1-2018 | | | | 1,168,324 | | | | 1,166,517 | |
FNMA | | | 4.22 | | | | 5-1-2016 | | | | 2,222,408 | | | | 2,241,453 | |
FNMA | | | 4.29 | | | | 5-1-2016 | | | | 762,863 | | | | 769,535 | |
FNMA | | | 4.50 | | | | 6-1-2019 | | | | 204,654 | | | | 213,588 | |
FNMA | | | 5.09 | | | | 12-1-2016 | | | | 964,043 | | | | 1,004,551 | |
FNMA | | | 5.17 | | | | 2-1-2016 | | | | 2,269,995 | | | | 2,276,058 | |
FNMA | | | 5.23 | | | | 7-1-2018 | | | | 1,270,085 | | | | 1,320,624 | |
FNMA | | | 5.27 | | | | 12-1-2016 | | | | 935,824 | | | | 972,634 | |
FNMA | | | 5.39 | | | | 1-1-2018 | | | | 1,160,885 | | | | 1,211,399 | |
FNMA | | | 5.40 | | | | 12-1-2016 | | | | 959,425 | | | | 1,001,953 | |
FNMA | | | 5.52 | | | | 5-1-2017 | | | | 1,417,206 | | | | 1,508,562 | |
FNMA | | | 5.85 | | | | 5-1-2016 | | | | 4,000,000 | | | | 4,045,461 | |
FNMA | | | 6.00 | | | | 4-1-2021 | | | | 1,058,656 | | | | 1,110,342 | |
FNMA | | | 6.50 | | | | 8-1-2031 | | | | 690,405 | | | | 810,583 | |
FNMA | | | 6.74 | | | | 12-1-2015 | | | | 1,184,773 | | | | 1,194,534 | |
FNMA | | | 8.33 | | | | 7-15-2020 | | | | 31,966 | | | | 35,195 | |
FNMA | | | 8.50 | | | | 7-1-2017 | | | | 107,856 | | | | 112,268 | |
FNMA | | | 9.00 | | | | 12-1-2016 | | | | 81,209 | | | | 83,772 | |
FNMA | | | 9.00 | | | | 2-15-2020 | | | | 114,862 | | | | 131,778 | |
FNMA | | | 9.00 | | | | 10-15-2021 | | | | 55,300 | | | | 62,256 | |
FNMA | | | 9.00 | | | | 6-1-2024 | | | | 83,470 | | | | 91,020 | |
FNMA | | | 9.50 | | | | 12-1-2020 | | | | 76,842 | | | | 83,965 | |
FNMA | | | 9.50 | | | | 3-1-2021 | | | | 16,390 | | | | 16,829 | |
FNMA | | | 10.00 | | | | 3-20-2018 | | | | 20,382 | | | | 20,968 | |
FNMA | | | 10.25 | | | | 9-1-2021 | | | | 65,246 | | | | 72,860 | |
FNMA | | | 10.50 | | | | 8-1-2020 | | | | 4,275 | | | | 4,698 | |
FNMA | | | 10.50 | | | | 4-1-2022 | | | | 47,873 | | | | 50,535 | |
FNMA Series 1988-4 Class Z | | | 9.25 | | | | 3-25-2018 | | | | 28,895 | | | | 30,448 | |
FNMA Series 1988-9 Class Z | | | 9.45 | | | | 4-25-2018 | | | | 17,854 | | | | 18,775 | |
FNMA Series 1989-30 Class Z | | | 9.50 | | | | 6-25-2019 | | | | 84,986 | | | | 92,358 | |
FNMA Series 1989-49 Class E | | | 9.30 | | | | 8-25-2019 | | | | 9,554 | | | | 10,145 | |
FNMA Series 1990-111 Class Z | | | 8.75 | | | | 9-25-2020 | | | | 21,370 | | | | 22,720 | |
FNMA Series 1990-119 Class J | | | 9.00 | | | | 10-25-2020 | | | | 60,237 | | | | 67,130 | |
FNMA Series 1990-124 Class Z | | | 9.00 | | | | 10-25-2020 | | | | 27,283 | | | | 30,451 | |
FNMA Series 1990-21 Class Z | | | 9.00 | | | | 3-25-2020 | | | | 113,506 | | | | 126,063 | |
FNMA Series 1990-27 Class Z | | | 9.00 | | | | 3-25-2020 | | | | 70,026 | | | | 78,549 | |
FNMA Series 1990-30 Class D | | | 9.75 | | | | 3-25-2020 | | | | 22,865 | | | | 25,866 | |
FNMA Series 1990-77 Class D | | | 9.00 | | | | 6-25-2020 | | | | 35,024 | | | | 39,144 | |
FNMA Series 1991-132 Class Z | | | 8.00 | | | | 10-25-2021 | | | | 138,549 | | | | 156,258 | |
FNMA Series 1992-71 Class X | | | 8.25 | | | | 5-25-2022 | | | | 59,736 | | | | 68,759 | |
FNMA Series 2000-T6 Class A2 | | | 9.50 | | | | 6-25-2030 | | | | 540,927 | | | | 646,758 | |
FNMA Series 2001-T10 Class A3 | | | 9.50 | | | | 12-25-2041 | | | | 1,124,546 | | | | 1,294,667 | |
FNMA Series 2001-T12 Class A3 | | | 9.50 | | | | 8-25-2041 | | | | 955,112 | | | | 1,111,385 | |
FNMA Series 2002-94 Class BK | | | 5.50 | | | | 1-25-2018 | | | | 712,364 | | | | 729,526 | |
FNMA Series 2002-T1 Class A4 | | | 9.50 | | | | 11-25-2031 | | | | 1,189,708 | | | | 1,443,960 | |
FNMA Series 2002-W4 Class A6 ± | | | 3.38 | | | | 5-25-2042 | | | | 1,121,897 | | | | 1,176,517 | |
FNMA Series 2003-125 Class AY | | | 4.00 | | | | 12-25-2018 | | | | 1,698,294 | | | | 1,751,717 | |
The accompanying notes are an integral part of these financial statements.
| | | | |
| 12 | | Wells Fargo Advantage Ultra Short-Term Income Fund | | Portfolio of investments—August 31, 2015 |
| | | | | | | | | | | | | | | | |
| Security name | | Interest rate | | | Maturity date | | | Principal | | | Value | |
| | | | | | | | | | | | | | | | |
| | | | |
Agency Securities (continued) | | | | | | | | | | | | | | | | |
FNMA Series 2003-129 Class AP | | | 4.00 | % | | | 1-25-2019 | | | $ | 367,784 | | | $ | 373,697 | |
FNMA Series 2003-15 Class CN | | | 5.00 | | | | 3-25-2018 | | | | 291,775 | | | | 302,614 | |
FNMA Series 2003-35 Class BC | | | 5.00 | | | | 5-25-2018 | | | | 561,440 | | | | 581,403 | |
FNMA Series 2003-35 Class ME | | | 5.00 | | | | 5-25-2018 | | | | 293,988 | | | | 305,438 | |
FNMA Series 2003-92 Class PE | | | 4.50 | | | | 9-25-2018 | | | | 768,481 | | | | 799,149 | |
FNMA Series 2003-W11 Class A1 ± | | | 3.46 | | | | 6-25-2033 | | | | 43,181 | | | | 45,243 | |
FNMA Series 2003-W3 Class 1A4 ± | | | 3.46 | | | | 8-25-2042 | | | | 51,805 | | | | 54,719 | |
FNMA Series 2004-10 Class FA ± | | | 0.55 | | | | 2-25-2034 | | | | 1,556,833 | | | | 1,561,681 | |
FNMA Series 2004-17 Class HJ | | | 4.75 | | | | 4-25-2019 | | | | 1,676,251 | | | | 1,775,145 | |
FNMA Series 2004-32 Class AY | | | 4.00 | | | | 5-25-2019 | | | | 127,996 | | | | 132,335 | |
FNMA Series 2004-92 Class QY | | | 4.50 | | | | 8-25-2034 | | | | 720,040 | | | | 749,444 | |
FNMA Series 2006-74 Class DP | | | 5.50 | | | | 3-25-2035 | | | | 3,996 | | | | 3,996 | |
FNMA Series 2006-M3 Class B | | | 5.10 | | | | 8-25-2016 | | | | 1,055,342 | | | | 1,092,938 | |
FNMA Series 2007-2 Class FA ± | | | 0.40 | | | | 2-25-2037 | | | | 29,169 | | | | 29,175 | |
FNMA Series 2007-36 Class AB | | | 5.00 | | | | 11-25-2021 | | | | 649,750 | | | | 660,622 | |
FNMA Series 2007-W2 Class 1A1 ± | | | 0.52 | | | | 3-25-2037 | | | | 1,053,214 | | | | 1,054,312 | |
FNMA Series 2008-36 Class AB | | | 4.50 | | | | 10-25-2022 | | | | 239,887 | | | | 241,157 | |
FNMA Series 2008-76 Class GF ± | | | 0.85 | | | | 9-25-2023 | | | | 713,965 | | | | 718,166 | |
FNMA Series 2008-81 Class LK | | | 5.00 | | | | 9-25-2023 | | | | 406,548 | | | | 424,181 | |
FNMA Series 2009-76 Class HA | | | 4.00 | | | | 1-25-2019 | | | | 355,502 | | | | 362,650 | |
FNMA Series 2010-153 Class AB | | | 2.00 | | | | 11-25-2018 | | | | 1,084,926 | | | | 1,097,678 | |
FNMA Series 2010-153 Class BG | | | 2.50 | | | | 11-25-2018 | | | | 838,158 | | | | 850,781 | |
FNMA Series 2010-25 Class ND | | | 3.50 | | | | 3-25-2025 | | | | 441,673 | | | | 455,839 | |
FNMA Series 2010-39 Class PD | | | 3.00 | | | | 6-25-2038 | | | | 369,799 | | | | 375,026 | |
FNMA Series 2010-39 Class VY | | | 4.50 | | | | 3-25-2025 | | | | 2,570,000 | | | | 2,637,473 | |
FNMA Series 2010-57 Class DQ | | | 3.00 | | | | 6-25-2025 | | | | 751,976 | | | | 777,547 | |
FNMA Series 2010-70 Class CT | | | 4.00 | | | | 11-25-2027 | | | | 37,929 | | | | 37,922 | |
FNMA Series 2010-9 Class MB | | | 5.00 | | | | 5-25-2032 | | | | 890,434 | | | | 904,063 | |
FNMA Series 2011-111 Class MA | | | 4.00 | | | | 7-25-2038 | | | | 235,794 | | | | 236,929 | |
FNMA Series 2011-115 Class DP | | | 3.50 | | | | 4-25-2034 | | | | 111,733 | | | | 111,960 | |
FNMA Series 2011-122 Class A | | | 3.00 | | | | 12-25-2025 | | | | 526,100 | | | | 543,059 | |
FNMA Series 2011-129 Class LG | | | 3.00 | | | | 3-25-2037 | | | | 787,938 | | | | 807,720 | |
FNMA Series 2011-33 Class GA | | | 3.50 | | | | 10-25-2028 | | | | 1,353,120 | | | | 1,388,121 | |
FNMA Series 2011-35 Class PA | | | 4.00 | | | | 2-25-2039 | | | | 994,949 | | | | 1,016,327 | |
FNMA Series 2011-39 Class DA | | | 3.50 | | | | 7-25-2024 | | | | 477,609 | | | | 483,756 | |
FNMA Series 2011-40 Class CA | | | 3.50 | | | | 12-25-2028 | | | | 3,661,839 | | | | 3,761,445 | |
FNMA Series 2011-42 Class A | | | 3.00 | | | | 2-25-2024 | | | | 5,266,091 | | | | 5,425,986 | |
FNMA Series 2011-56 Class AC | | | 2.00 | | | | 7-25-2018 | | | | 278,576 | | | | 281,440 | |
FNMA Series 2011-61 Class VA | | | 5.00 | | | | 4-25-2040 | | | | 1,590,847 | | | | 1,608,338 | |
FNMA Series 2011-99 Class AB | | | 4.00 | | | | 12-25-2038 | | | | 325,175 | | | | 332,312 | |
FNMA Series 2012-94 Class E | | | 3.00 | | | | 6-25-2022 | | | | 164,608 | | | | 169,359 | |
FNMA Series 2013-M12 Class A | | | 1.53 | | | | 10-25-2017 | | | | 1,799,023 | | | | 1,811,355 | |
FNMA Series 2014-M3 Class ASQ2 | | | 0.56 | | | | 3-25-2016 | | | | 3,130,089 | | | | 3,128,887 | |
FNMA Series G-22 Class ZT | | | 8.00 | | | | 12-25-2016 | | | | 92,289 | | | | 94,642 | |
GNMA | | | 7.00 | | | | 6-15-2033 | | | | 583,797 | | | | 716,588 | |
GNMA | | | 9.00 | | | | 11-15-2017 | | | | 27,850 | | | | 28,902 | |
GNMA | | | 9.50 | | | | 11-15-2017 | | | | 8,662 | | | | 8,703 | |
GNMA | | | 10.00 | | | | 10-20-2017 | | | | 19,116 | | | | 19,210 | |
GNMA Series 2004-11 Class QE | | | 5.00 | | | | 12-16-2032 | | | | 689,708 | | | | 705,646 | |
GNMA Series 2008-36 Class GA | | | 4.25 | | | | 10-16-2022 | | | | 2,010,948 | | | | 2,049,763 | |
The accompanying notes are an integral part of these financial statements.
| | | | | | |
| Portfolio of investments—August 31, 2015 | | Wells Fargo Advantage Ultra Short-Term Income Fund | | | 13 | |
| | | | | | | | | | | | | | | | |
| Security name | | Interest rate | | | Maturity date | | | Principal | | | Value | |
| | | | | | | | | | | | | | | | |
| | | | |
Agency Securities (continued) | | | | | | | | | | | | | | | | |
GNMA Series 2009-122 Class AC | | | 4.00 | % | | | 3-16-2023 | | | $ | 636,624 | | | $ | 655,212 | |
GNMA Series 2009-35 Class PA | | | 5.00 | | | | 11-16-2032 | | | | 277,107 | | | | 281,377 | |
GNMA Series 2009-74 Class BP | | | 3.50 | | | | 1-20-2037 | | | | 287,189 | | | | 289,812 | |
GNMA Series 2009-93 Class UW | | | 5.00 | | | | 10-20-2020 | | | | 1,606,386 | | | | 1,630,167 | |
GNMA Series 2010-133 Class QK | | | 3.50 | | | | 9-16-2034 | | | | 565,403 | | | | 572,698 | |
GNMA Series 2010-167 Class KW | | | 5.00 | | | | 9-20-2036 | | | | 43,001 | | | | 43,263 | |
GNMA Series 2010-27 Class AK | | | 4.00 | | | | 2-16-2023 | | | | 1,419,739 | | | | 1,456,117 | |
GNMA Series 2010-29 Class PL | | | 3.00 | | | | 8-20-2036 | | | | 48,033 | | | | 48,018 | |
GNMA Series 2010-43 Class JA | | | 3.00 | | | | 9-20-2037 | | | | 544,378 | | | | 552,493 | |
GNMA Series 2010-69 Class DQ | | | 2.75 | | | | 4-20-2040 | | | | 190,131 | | | | 192,447 | |
GNMA Series 2010-7 Class CK | | | 3.50 | | | | 1-16-2034 | | | | 255,953 | | | | 257,289 | |
GNMA Series 2010-87 Class ME | | | 2.00 | | | | 3-20-2036 | | | | 322,947 | | | | 323,344 | |
GNMA Series 2011-29 Class AG | | | 3.00 | | | | 8-16-2037 | | | | 210,279 | | | | 212,827 | |
| | | | |
Total Agency Securities (Cost $205,298,477) | | | | | | | | | | | | | | | 206,030,326 | |
| | | | | | | | | | | | | | | | |
| | | | |
Asset-Backed Securities: 13.44% | | | | | | | | | | | | | | | | |
Ally Auto Receivables Trust Series 2015-1 Class A2 | | | 0.92 | | | | 2-15-2018 | | | | 10,000,000 | | | | 10,001,510 | |
Carmax Auto Owner Trust Series 2015-3 Class A2A | | | 1.10 | | | | 11-15-2018 | | | | 7,500,000 | | | | 7,504,793 | |
Chase Issuance Trust Series 2012-A9 Class A9 ± | | | 0.35 | | | | 10-16-2017 | | | | 14,350,000 | | | | 14,350,000 | |
Citibank Credit Card Issuance Trust Series 2006-A3 Class A3 | | | 5.30 | | | | 3-15-2018 | | | | 10,423,000 | | | | 10,676,268 | |
Citibank Credit Card Issuance Trust Series 2012-A1 Class A1 | | | 0.55 | | | | 10-10-2017 | | | | 10,000,000 | | | | 10,000,100 | |
Countrywide Asset-Backed Certificates Series 2004-AB2 Class A3 ± | | | 1.02 | | | | 5-25-2036 | | | | 126,489 | | | | 126,362 | |
Dell Equipment Finance Trust Series 2014-1 Class A2 144A | | | 0.64 | | | | 7-22-2016 | | | | 2,194,930 | | | | 2,193,130 | |
Delta Air Lines Incorporated 2009-1 Series B Pass Through Trust | | | 9.75 | | | | 6-17-2018 | | | | 7,561,648 | | | | 8,109,867 | |
Ford Credit Auto Lease Trust Series 2014-A Class A2A | | | 0.50 | | | | 10-15-2016 | | | | 1,309,600 | | | | 1,309,485 | |
Ford Credit Auto Lease Trust Series 2014-B Class A2A | | | 0.51 | | | | 3-15-2017 | | | | 7,343,260 | | | | 7,338,920 | |
GE Equipment Transportation LLC Series 2015-1 Class A2 | | | 0.89 | | | | 11-24-2017 | | | | 3,995,000 | | | | 3,997,449 | |
GM Financial Automobile Leasing Trust Series 2015-2 Class A2A | | | 1.18 | | | | 4-20-2018 | | | | 11,500,000 | | | | 11,520,367 | |
Honda Auto Receivables Owner Trust Series 2013-2 Class A3 | | | 0.53 | | | | 2-16-2017 | | | | 1,604,220 | | | | 1,603,231 | |
Honda Auto Receivables Owner Trust Series 2013-3 Class A3 | | | 0.77 | | | | 5-15-2017 | | | | 914,439 | | | | 914,742 | |
Honda Auto Receivables Owner Trust Series 2013-4 Class A3 | | | 0.69 | | | | 9-18-2017 | | | | 8,370,845 | | | | 8,364,558 | |
Honda Auto Receivables Owner Trust Series 2014-3 Class A2 | | | 0.48 | | | | 12-15-2016 | | | | 4,317,852 | | | | 4,315,305 | |
Honda Auto Receivables Owner Trust Series 2015-3 Class A2 | | | 0.92 | | | | 11-20-2017 | | | | 8,720,000 | | | | 8,720,776 | |
Hyundai Auto Lease Securitization Trust Series 2014-A Class A2 144A | | | 0.52 | | | | 7-15-2016 | | | | 449,692 | | | | 449,652 | |
Hyundai Auto Lease Securitization Trust Series 2014-B Class A2 144A | | | 0.61 | | | | 2-15-2017 | | | | 6,431,024 | | | | 6,428,484 | |
Hyundai Auto Lease Securitization Trust Series 2015-B Class A2A 144A | | | 0.95 | | | | 12-15-2017 | | | | 9,400,000 | | | | 9,407,774 | |
Hyundai Auto Receivables Trust Series 2013-B Class A3 | | | 0.71 | | | | 9-15-2017 | | | | 5,776,807 | | | | 5,777,731 | |
Leaf II Receivables Funding LLC Series 2015-1 Class A2 144A | | | 1.13 | | | | 3-15-2017 | | | | 3,600,000 | | | | 3,592,843 | |
Mercedes-Benz Auto Lease Trust Series 2013-B Class A4 | | | 0.76 | | | | 7-15-2019 | | | | 2,350,000 | | | | 2,350,531 | |
Mercedes-Benz Auto Lease Trust Series 2014-A Class A2A | | | 0.48 | | | | 6-15-2016 | | | | 1,390,394 | | | | 1,390,351 | |
Mercedes-Benz Auto Receivables Series 2015-1 Class A2A | | | 0.82 | | | | 6-15-2018 | | | | 16,400,000 | | | | 16,359,443 | |
Nissan Auto Lease Trust Series 2014-A Class A4 | | | 1.04 | | | | 10-15-2019 | | | | 1,593,000 | | | | 1,593,648 | |
Nissan Auto Lease Trust Series 2014-B Class A2A | | | 0.73 | | | | 4-17-2017 | | | | 13,099,634 | | | | 13,099,398 | |
Porsche Innovative Lease Owner Trust Series 2015-1 Class A2 144A | | | 0.79 | | | | 11-21-2017 | | | | 9,500,000 | | | | 9,500,523 | |
Susquehanna Auto Receivables Trust Series 2014-1A Class A2 144A | | | 0.58 | | | | 10-17-2016 | | | | 1,839,127 | | | | 1,838,229 | |
United Airlines Incorporated 2009-2A Series A-2 Pass Through Trust | | | 9.75 | | | | 7-15-2018 | | | | 1,873,256 | | | | 2,013,750 | |
Volkswagen Auto Lease Trust Series 2015-A Class A2A | | | 0.87 | | | | 6-20-2017 | | | | 9,298,847 | | | | 9,297,963 | |
Volvo Financial Equipment LLC Series 2014-1A Class A2 144A | | | 0.54 | | | | 11-15-2016 | | | | 2,447,580 | | | | 2,446,848 | |
Volvo Financial Equipment LLC Series 2015-1A Class A2 144A | | | 0.95 | | | | 11-15-2017 | | | | 7,500,000 | | | | 7,504,485 | |
World Omni Automobile Lease Series 2015-A Class A2A | | | 1.06 | | | | 5-15-2018 | | | | 11,400,000 | | | | 11,396,377 | |
| | | | |
Total Asset-Backed Securities (Cost $215,911,428) | | | | | | | | | | | | | | | 215,494,893 | |
| | | | | | | | | | | | | | | | |
The accompanying notes are an integral part of these financial statements.
| | | | |
| 14 | | Wells Fargo Advantage Ultra Short-Term Income Fund | | Portfolio of investments—August 31, 2015 |
| | | | | | | | | | | | | | | | |
| Security name | | Interest rate | | | Maturity date | | | Principal | | | Value | |
| | | | | | | | | | | | | | | | |
| | | | |
Corporate Bonds and Notes: 38.25% | | | | | | | | | | | | | | | | |
| | | | |
Consumer Discretionary: 2.96% | | | | | | | | | | | | | | | | |
| | | | |
| Media: 2.96% | | | | | | | | | | | | | | | | |
21st Century Fox America Incorporated | | | 7.60 | % | | | 10-11-2015 | | | $ | 5,618,000 | | | $ | 5,656,113 | |
21st Century Fox America Incorporated | | | 8.00 | | | | 10-17-2016 | | | | 827,000 | | | | 888,028 | |
Cox Communications Incorporated | | | 5.50 | | | | 10-1-2015 | | | | 9,000,000 | | | | 9,033,876 | |
DIRECTV Holdings LLC | | | 2.40 | | | | 3-15-2017 | | | | 14,563,000 | | | | 14,658,359 | |
Omnicom Group Incorporated | | | 5.90 | | | | 4-15-2016 | | | | 7,000,000 | | | | 7,190,708 | |
Thomson Reuters Corporation | | | 1.65 | | | | 9-29-2017 | | | | 10,000,000 | | | | 9,984,210 | |
| | | | |
| | | | | | | | | | | | | | | 47,411,294 | |
| | | | | | | | | | | | | | | | |
| | | | |
Consumer Staples: 3.11% | | | | | | | | | | | | | | | | |
| | | | |
| Beverages: 0.56% | | | | | | | | | | | | | | | | |
Constellation Brands Incorporated | | | 7.25 | | | | 9-1-2016 | | | | 8,600,000 | | | | 9,008,500 | |
| | | | | | | | | | | | | | | | |
| | | | |
| Food & Staples Retailing: 0.50% | | | | | | | | | | | | | | | | |
CVS Health Corporation | | | 1.90 | | | | 7-20-2018 | | | | 8,000,000 | | | | 8,023,256 | |
| | | | | | | | | | | | | | | | |
| | | | |
| Food Products: 1.10% | | | | | | | | | | | | | | | | |
Kraft Heinz Foods Company 144A | | | 1.60 | | | | 6-30-2017 | | | | 7,000,000 | | | | 6,993,777 | |
Kraft Heinz Foods Company 144A | | | 2.00 | | | | 7-2-2018 | | | | 3,000,000 | | | | 2,996,013 | |
Tyson Foods Incorporated | | | 6.60 | | | | 4-1-2016 | | | | 7,446,000 | | | | 7,679,023 | |
| | | | |
| | | | | | | | | | | | | | | 17,668,813 | |
| | | | | | | | | | | | | | | | |
| | | | |
| Tobacco: 0.95% | | | | | | | | | | | | | | | | |
Reynolds American Incorporated | | | 2.30 | | | | 6-12-2018 | | | | 5,000,000 | | | | 5,030,370 | |
Reynolds American Incorporated 144A | | | 3.50 | | | | 8-4-2016 | | | | 10,000,000 | | | | 10,181,500 | |
| | | | |
| | | | | | | | | | | | | | | 15,211,870 | |
| | | | | | | | | | | | | | | | |
| | | | |
Energy: 4.83% | | | | | | | | | | | | | | | | |
| | | | |
| Energy Equipment & Services: 0.34% | | | | | | | | | | | | | | | | |
Texas Eastern Transmission LP 144A | | | 6.00 | | | | 9-15-2017 | | | | 5,000,000 | | | | 5,399,150 | |
| | | | | | | | | | | | | | | | |
| | | | |
| Oil, Gas & Consumable Fuels: 4.49% | | | | | | | | | | | | | | | | |
Anadarko Petroleum Corporation | | | 6.38 | | | | 9-15-2017 | | | | 9,700,000 | | | | 10,494,731 | |
Boardwalk Pipelines LLC | | | 5.88 | | | | 11-15-2016 | | | | 9,000,000 | | | | 9,315,963 | |
DCP Midstream Operating Company | | | 2.50 | | | | 12-1-2017 | | | | 7,628,000 | | | | 7,207,140 | |
Energy Transfer Partners LP | | | 2.50 | | | | 6-15-2018 | | | | 5,000,000 | | | | 4,965,000 | |
Kinder Morgan Incorporated | | | 7.00 | | | | 6-15-2017 | | | | 4,574,000 | | | | 4,914,269 | |
Marathon Petroleum Corporation | | | 3.50 | | | | 3-1-2016 | | | | 9,029,000 | | | | 9,138,576 | |
Nabors Industries Incorporated | | | 2.35 | | | | 9-15-2016 | | | | 10,000,000 | | | | 9,930,200 | |
ONEOK Partners LP | | | 3.25 | | | | 2-1-2016 | | | | 10,000,000 | | | | 10,051,370 | |
Southwestern Energy Company | | | 3.30 | | | | 1-23-2018 | | | | 2,000,000 | | | | 1,993,892 | |
Williams Partners LP | | | 7.25 | | | | 2-1-2017 | | | | 3,700,000 | | | | 3,955,215 | |
| | | | |
| | | | | | | | | | | | | | | 71,966,356 | |
| | | | | | | | | | | | | | | | |
The accompanying notes are an integral part of these financial statements.
| | | | | | |
| Portfolio of investments—August 31, 2015 | | Wells Fargo Advantage Ultra Short-Term Income Fund | | | 15 | |
| | | | | | | | | | | | | | | | |
| Security name | | Interest rate | | | Maturity date | | | Principal | | | Value | |
| | | | | | | | | | | | | | | | |
| | | | |
Financials: 13.14% | | | | | | | | | | | | | | | | |
| | | | |
| Banks: 2.50% | | | | | | | | | | | | | | | | |
Associated Banc Corporation | | | 5.13 | % | | | 3-28-2016 | | | $ | 3,500,000 | | | $ | 3,572,496 | |
Bank of America Corporation | | | 1.70 | | | | 8-25-2017 | | | | 4,000,000 | | | | 3,993,124 | |
Bank of America Corporation | | | 6.05 | | | | 5-16-2016 | | | | 8,000,000 | | | | 8,254,456 | |
Discover Bank | | | 2.60 | | | | 11-13-2018 | | | | 5,000,000 | | | | 5,005,705 | |
Merrill Lynch & Company Incorporated | | | 5.30 | | | | 9-30-2015 | | | | 1,600,000 | | | | 1,605,206 | |
PNC Funding Corporation | | | 5.25 | | | | 11-15-2015 | | | | 9,221,000 | | | | 9,301,444 | |
UBS AG | | | 5.88 | | | | 7-15-2016 | | | | 8,000,000 | | | | 8,291,888 | |
| | | | |
| | | | | | | | | | | | | | | 40,024,319 | |
| | | | | | | | | | | | | | | | |
| | | | |
| Capital Markets: 2.44% | | | | | | | | | | | | | | | | |
Bear Stearns Companies LLC | | | 5.55 | | | | 1-22-2017 | | | | 10,785,000 | | | | 11,344,677 | |
Goldman Sachs Group Incorporated | | | 5.63 | | | | 1-15-2017 | | | | 6,261,000 | | | | 6,574,025 | |
Goldman Sachs Group Incorporated | | | 6.15 | | | | 4-1-2018 | | | | 5,085,000 | | | | 5,603,629 | |
Morgan Stanley | | | 1.75 | | | | 2-25-2016 | | | | 5,500,000 | | | | 5,523,441 | |
Morgan Stanley | | | 1.88 | | | | 1-5-2018 | | | | 6,060,000 | | | | 6,059,824 | |
Morgan Stanley | | | 2.20 | | | | 12-7-2018 | | | | 4,000,000 | | | | 4,016,368 | |
| | | | |
| | | | | | | | | | | | | | | 39,121,964 | |
| | | | | | | | | | | | | | | | |
| | | | |
| Consumer Finance: 4.64% | | | | | | | | | | | | | | | | |
AIG Global Funding 144A | | | 1.65 | | | | 12-15-2017 | | | | 4,000,000 | | | | 3,994,028 | |
American Express | | | 1.80 | | | | 7-31-2018 | | | | 8,000,000 | | | | 7,971,448 | |
Capital One Financial Corporation | | | 1.00 | | | | 11-6-2015 | | | | 2,315,000 | | | | 2,315,877 | |
Daimler Finance North America LLC 144A | | | 1.60 | | | | 8-3-2017 | | | | 5,000,000 | | | | 4,990,315 | |
Discover Financial Services Company | | | 6.45 | | | | 6-12-2017 | | | | 570,000 | | | | 616,495 | |
ERAC USA Finance LLC 144A | | | 1.40 | | | | 4-15-2016 | | | | 1,024,000 | | | | 1,024,885 | |
ERAC USA Finance LLC 144A | | | 2.75 | | | | 3-15-2017 | | | | 750,000 | | | | 764,141 | |
ERAC USA Finance LLC 144A | | | 5.90 | | | | 11-15-2015 | | | | 1,020,000 | | | | 1,030,161 | |
Ford Motor Credit Company LLC | | | 2.24 | | | | 6-15-2018 | | | | 3,000,000 | | | | 2,984,364 | |
Ford Motor Credit Company LLC | | | 6.63 | | | | 8-15-2017 | | | | 5,180,000 | | | | 5,601,642 | |
Harley-Davidson Financial Services Incorporated 144A | | | 1.15 | | | | 9-15-2015 | | | | 2,500,000 | | | | 2,500,595 | |
Harley-Davidson Financial Services Incorporated 144A | | | 2.70 | | | | 3-15-2017 | | | | 6,000,000 | | | | 6,121,380 | |
Harley-Davidson Financial Services Incorporated 144A | | | 3.88 | | | | 3-15-2016 | | | | 1,500,000 | | | | 1,523,726 | |
General Motors Financial Company | | | 2.40 | | | | 4-10-2018 | | | | 10,000,000 | | | | 9,880,940 | |
HSBC Finance Corporation | | | 5.50 | | | | 1-19-2016 | | | | 2,665,000 | | | | 2,711,960 | |
Hyundai Capital America Company 144A | | | 3.75 | | | | 4-6-2016 | | | | 7,331,000 | | | | 7,443,370 | |
Navient Corporation | | | 3.88 | | | | 9-10-2015 | | | | 3,500,000 | | | | 3,482,500 | |
Toll Brothers Finance Corporation | | | 8.91 | | | | 10-15-2017 | | | | 8,405,000 | | | | 9,476,638 | |
| | | | |
| | | | | | | | | | | | | | | 74,434,465 | |
| | | | | | | | | | | | | | | | |
| | | | |
| Diversified Financial Services: 1.05% | | | | | | | | | | | | | | | | |
McGraw Hill Financial Incorporated 144A | | | 2.50 | | | | 8-15-2018 | | | | 1,450,000 | | | | 1,457,523 | |
McGraw Hill Financial Incorporated | | | 5.90 | | | | 11-15-2017 | | | | 8,692,000 | | | | 9,418,825 | |
Toll Road Investors Partnership II LP 144A¤ | | | 0.00 | | | | 2-15-2016 | | | | 6,000,000 | | | | 5,882,052 | |
| | | | |
| | | | | | | | | | | | | | | 16,758,400 | |
| | | | | | | | | | | | | | | | |
The accompanying notes are an integral part of these financial statements.
| | | | |
| 16 | | Wells Fargo Advantage Ultra Short-Term Income Fund | | Portfolio of investments—August 31, 2015 |
| | | | | | | | | | | | | | | | |
| Security name | | Interest rate | | | Maturity date | | | Principal | | | Value | |
| | | | | | | | | | | | | | | | |
| | | | |
| Insurance: 1.90% | | | | | | | | | | | | | | | | |
MetLife Insurance Company 144A | | | 7.70 | % | | | 11-1-2015 | | | $ | 8,500,000 | | | $ | 8,586,488 | |
Platinum Underwriters Finance Incorporated Series B | | | 7.50 | | | | 6-1-2017 | | | | 8,075,000 | | | | 8,772,898 | |
Symetra Financial Corporation 144A | | | 6.13 | | | | 4-1-2016 | | | | 9,100,000 | | | | 9,328,119 | |
Unum Group 144A | | | 6.85 | | | | 11-15-2015 | | | | 3,799,000 | | | | 3,843,171 | |
| | | | |
| | | | | | | | | | | | | | | 30,530,676 | |
| | | | | | | | | | | | | | | | |
| | | | |
| REITs: 0.61% | | | | | | | | | | | | | | | | |
ARC Properties Operating Partnership LP | | | 2.00 | | | | 2-6-2017 | | | | 2,915,000 | | | | 2,845,769 | |
Health Care REIT Incorporated | | | 6.20 | | | | 6-1-2016 | | | | 3,000,000 | | | | 3,103,842 | |
Realty Income Corporation | | | 5.50 | | | | 11-15-2015 | | | | 3,833,000 | | | | 3,865,868 | |
| | | | |
| | | | | | | | | | | | | | | 9,815,479 | |
| | | | | | | | | | | | | | | | |
| | | | |
Health Care: 3.02% | | | | | | | | | | | | | | | | |
| | | | |
| Biotechnology: 1.28% | | | | | | | | | | | | | | | | |
Baxalta Incorporated 144A | | | 2.00 | | | | 6-22-2018 | | | | 3,000,000 | | | | 2,985,126 | |
Biogen Idec Incorporated | | | 6.88 | | | | 3-1-2018 | | | | 8,975,000 | | | | 10,058,238 | |
Celgene Corporation | | | 2.13 | | | | 8-15-2018 | | | | 7,500,000 | | | | 7,501,313 | |
| | | | |
| | | | | | | | | | | | | | | 20,544,677 | |
| | | | | | | | | | | | | | | | |
| | | | |
| Health Care Equipment & Supplies: 0.23% | | | | | | | | | | | | | | | | |
Zimmer Holdings Incorporated | | | 1.45 | | | | 4-1-2017 | | | | 3,630,000 | | | | 3,619,390 | |
| | | | | | | | | | | | | | | | |
| | | | |
| Health Care Providers & Services: 1.20% | | | | | | | | | | | | | | | | |
Providence Health & Services Company ± | | | 1.08 | | | | 10-1-2016 | | | | 12,000,000 | | | | 12,038,184 | |
UnitedHealth Group Incorporated | | | 1.45 | | | | 7-17-2017 | | | | 3,625,000 | | | | 3,627,762 | |
UnitedHealth Group Incorporated | | | 1.90 | | | | 7-16-2018 | | | | 3,625,000 | | | | 3,634,385 | |
| | | | |
| | | | | | | | | | | | | | | 19,300,331 | |
| | | | | | | | | | | | | | | | |
| | | | |
| Life Sciences Tools & Services: 0.31% | | | | | | | | | | | | | | | | |
Thermo Fisher Scientific Incorporated | | | 1.30 | | | | 2-1-2017 | | | | 5,000,000 | | | | 4,971,930 | |
| | | | | | | | | | | | | | | | |
| | | | |
Industrials: 1.77% | | | | | | | | | | | | | | | | |
| | | | |
| Aerospace & Defense: 0.58% | | | | | | | | | | | | | | | | |
L-3 Communications Corporation | | | 3.95 | | | | 11-15-2016 | | | | 9,000,000 | | | | 9,232,110 | |
| | | | | | | | | | | | | | | | |
| | | | |
| Commercial Services & Supplies: 0.17% | | | | | | | | | | | | | | | | |
Penske Truck Leasing Company LP 144A | | | 2.50 | | | | 3-15-2016 | | | | 2,720,000 | | | | 2,738,999 | |
| | | | | | | | | | | | | | | | |
| | | | |
| Machinery: 0.58% | | | | | | | | | | | | | | | | |
CNH Capital LLC | | | 3.25 | | | | 2-1-2017 | | | | 5,240,000 | | | | 5,207,250 | |
CNH Capital LLC | | | 3.88 | | | | 11-1-2015 | | | | 4,105,000 | | | | 4,105,000 | |
| | | | |
| | | | | | | | | | | | | | | 9,312,250 | |
| | | | | | | | | | | | | | | | |
| | | | |
| Trading Companies & Distributors: 0.44% | | | | | | | | | | | | | | | | |
International Lease Finance Corporation | | | 8.63 | | | | 9-15-2015 | | | | 7,000,000 | | | | 7,008,925 | |
| | | | | | | | | | | | | | | | |
| | | | |
Information Technology: 1.50% | | | | | | | | | | | | | | | | |
| | | | |
| Communications Equipment: 0.50% | | | | | | | | | | | | | | | | |
Cisco Systems Incorporated | | | 1.65 | | | | 6-15-2018 | | | | 8,000,000 | | | | 7,996,080 | |
| | | | | | | | | | | | | | | | |
The accompanying notes are an integral part of these financial statements.
| | | | | | |
| Portfolio of investments—August 31, 2015 | | Wells Fargo Advantage Ultra Short-Term Income Fund | | | 17 | |
| | | | | | | | | | | | | | | | |
| Security name | | Interest rate | | | Maturity date | | | Principal | | | Value | |
| | | | | | | | | | | | | | | | |
| | | | |
| IT Services: 0.37% | | | | | | | | | | | | | | | | |
Fidelity National Information Services Incorporated | | | 1.45 | % | | | 6-5-2017 | | | $ | 3,000,000 | | | $ | 2,963,307 | |
Xerox Corporation | | | 6.40 | | | | 3-15-2016 | | | | 2,950,000 | | | | 3,035,037 | |
| | | | |
| | | | | | | | | | | | | | | 5,998,344 | |
| | | | | | | | | | | | | | | | |
| | | | |
| Semiconductors & Semiconductor Equipment: 0.63% | | | | | | | | | | | | | | | | |
KLA-Tencor Corporation | | | 2.38 | | | | 11-1-2017 | | | | 10,000,000 | | | | 10,064,540 | |
| | | | | | | | | | | | | | | | |
| | | | |
Materials: 1.58% | | | | | | | | | | | | | | | | |
| | | | |
| Chemicals: 0.61% | | | | | | | | | | | | | | | | |
Eastman Chemical Company | | | 3.00 | | | | 12-15-2015 | | | | 9,760,000 | | | | 9,816,549 | |
| | | | | | | | | | | | | | | | |
| | | | |
| Construction Materials: 0.60% | | | | | | | | | | | | | | | | |
Martin Marietta Material ± | | | 1.38 | | | | 6-30-2017 | | | | 9,690,000 | | | | 9,625,184 | |
| | | | | | | | | | | | | | | | |
| | | | |
| Metals & Mining: 0.37% | | | | | | | | | | | | | | | | |
Glencore Funding LLC 144A | | | 1.70 | | | | 5-27-2016 | | | | 3,000,000 | | | | 2,991,849 | |
Glencore Funding LLC 144A | | | 2.13 | | | | 4-16-2018 | | | | 3,000,000 | | | | 2,853,906 | |
| | | | |
| | | | | | | | | | | | | | | 5,845,755 | |
| | | | | | | | | | | | | | | | |
| | | | |
Telecommunication Services: 2.19% | | | | | | | | | | | | | | | | |
| | | | |
| Diversified Telecommunication Services: 2.19% | | | | | | | | | | | | | | | | |
CenturyLink Incorporated | | | 5.15 | | | | 6-15-2017 | | | | 1,500,000 | | | | 1,548,750 | |
CenturyLink Incorporated | | | 6.00 | | | | 4-1-2017 | | | | 1,000,000 | | | | 1,052,500 | |
Clearwire Communications LLC 144A | | | 14.75 | | | | 12-1-2016 | | | | 7,290,000 | | | | 8,310,600 | |
Crown Castle Towers LLC 144A | | | 5.50 | | | | 1-15-2037 | | | | 7,305,000 | | | | 7,510,862 | |
Verizon Communications Incorporated | | | 0.70 | | | | 11-2-2015 | | | | 2,325,000 | | | | 2,324,891 | |
Verizon Communications Incorporated | | | 1.35 | | | | 6-9-2017 | | | | 14,450,000 | | | | 14,402,835 | |
| | | | |
| | | | | | | | | | | | | | | 35,150,438 | |
| | | | | | | | | | | | | | | | |
| | | | |
Utilities: 4.15% | | | | | | | | | | | | | | | | |
| | | | |
| Electric Utilities: 2.86% | | | | | | | | | | | | | | | | |
Dayton Power & Light Company | | | 1.88 | | | | 9-15-2016 | | | | 9,000,000 | | | | 9,014,787 | |
Eversource Energy | | | 1.60 | | | | 1-15-2018 | | | | 5,000,000 | | | | 5,017,485 | |
Exelon Corporation | | | 1.55 | | | | 6-9-2017 | | | | 10,000,000 | | | | 9,975,300 | |
LG&E & KU Energy LLC | | | 2.13 | | | | 11-15-2015 | | | | 7,635,000 | | | | 7,654,920 | |
NextEra Energy Capital Holdings Incorporated | | | 2.06 | | | | 9-1-2017 | | | | 7,275,000 | | | | 7,295,661 | |
NextEra Energy Capital Holdings Incorporated | | | 1.34 | | | | 9-1-2015 | | | | 7,000,000 | | | | 7,000,000 | |
| | | | |
| | | | | | | | | | | | | | | 45,958,153 | |
| | | | | | | | | | | | | | | | |
| | | | |
| Gas Utilities: 0.79% | | | | | | | | | | | | | | | | |
CenterPoint Energy Resource Corporation | | | 6.15 | | | | 5-1-2016 | | | | 3,000,000 | | | | 3,096,576 | |
Questar Corporation | | | 2.75 | | | | 2-1-2016 | | | | 9,500,000 | | | | 9,577,321 | |
| | | | |
| | | | | | | | | | | | | | | 12,673,897 | |
| | | | | | | | | | | | | | | | |
| | | | |
| Multi-Utilities: 0.50% | | | | | | | | | | | | | | | | |
WEC Energy Group Incorporated | | | 1.65 | | | | 6-15-2018 | | | | 8,000,000 | | | | 7,985,176 | |
| | | | | | | | | | | | | | | | |
| | | | |
Total Corporate Bonds and Notes (Cost $615,526,279) | | | | | | | | | | | | | | | 613,217,270 | |
| | | | | | | | | | | | | | | | |
The accompanying notes are an integral part of these financial statements.
| | | | |
| 18 | | Wells Fargo Advantage Ultra Short-Term Income Fund | | Portfolio of investments—August 31, 2015 |
| | | | | | | | | | | | | | | | |
| Security name | | Interest rate | | | Maturity date | | | Principal | | | Value | |
| | | | | | | | | | | | | | | | |
| | | | |
Municipal Obligations: 3.46% | | | | | | | | | | | | | | | | |
| | | | |
| California: 0.31% | | | | | | | | | | | | | | | | |
California Public Works Board Lease Series E (Miscellaneous Revenue) | | | 3.68 | % | | | 12-1-2015 | | | $ | 5,000,000 | | | $ | 5,033,350 | |
| | | | | | | | | | | | | | | | |
| | | | |
| Connecticut: 0.38% | | | | | | | | | | | | | | | | |
Connecticut Series A (GO Revenue) | | | 5.46 | | | | 3-1-2019 | | | | 5,675,000 | | | | 6,026,339 | |
| | | | | | | | | | | | | | | | |
| | | | |
| Florida: 0.36% | | | | | | | | | | | | | | | | |
Village Center Florida Community Development District (Miscellaneous Revenue) 144A | | | 1.30 | | | | 11-1-2015 | | | | 2,750,000 | | | | 2,749,423 | |
Village Center Florida Community Development District (Miscellaneous Revenue) 144A | | | 1.60 | | | | 11-1-2016 | | | | 2,000,000 | | | | 1,997,360 | |
Village Center Florida Community Development District Little Sumter Service Area System Series B (Water & Sewer Revenue) 144A | | | 1.30 | | | | 10-1-2015 | | | | 1,000,000 | | | | 999,870 | |
| | | | |
| | | | | | | | | | | | | | | 5,746,653 | |
| | | | | | | | | | | | | | | | |
| | | | |
| New Jersey: 1.41% | | | | | | | | | | | | | | | | |
Atlantic City NJ (GO Revenue, AGM Insured) | | | 3.30 | | | | 12-15-2016 | | | | 1,600,000 | | | | 1,625,216 | |
New Jersey EDA School Facilities Series QQ (Education Revenue) | | | 1.80 | | | | 6-15-2017 | | | | 10,000,000 | | | | 9,930,500 | |
New Jersey EDA Series B (Miscellaneous Revenue, AGM Insured) ¤ | | | 0.00 | | | | 2-15-2018 | | | | 10,000,000 | | | | 9,284,800 | |
New Jersey Turnpike Authority Series B (Transportation Revenue, Ambac Insured) | | | 4.25 | | | | 1-1-2016 | | | | 1,725,000 | | | | 1,745,579 | |
| | | | |
| | | | | | | | | | | | | | | 22,586,095 | |
| | | | | | | | | | | | | | | | |
| | | | |
| South Carolina: 0.16% | | | | | | | | | | | | | | | | |
South Carolina Jobs EDA Waste Management South Carolina Incorporated Project (Resource Recovery Revenue) | | | 1.88 | | | | 11-1-2016 | | | | 2,500,000 | | | | 2,528,600 | |
| | | | | | | | | | | | | | | | |
| | | | |
| Texas: 0.84% | | | | | | | | | | | | | | | | |
Port Arthur TX Navigation District Motiva Enterprises LLC Series B (Resource Recovery Revenue) ø | | | 0.30 | | | | 12-1-2039 | | | | 12,000,000 | | | | 12,000,000 | |
Port Arthur TX Navigation District Motiva Enterprises Project (Industrial Development Revenue) ø | | | 0.30 | | | | 11-1-2040 | | | | 1,500,000 | | | | 1,500,000 | |
| | | | |
| | | | | | | | | | | | | | | 13,500,000 | |
| | | | | | | | | | | | | | | | |
| | | | |
Total Municipal Obligations (Cost $55,589,823) | | | | | | | | | | | | | | | 55,421,037 | |
| | | | | | | | | | | | | | | | |
| | | | |
Non-Agency Mortgage-Backed Securities: 11.37% | | | | | | | | | | | | | | | | |
Bank of America Commercial Mortgage Trust Series 2006-6 Class A4 | | | 5.36 | | | | 10-10-2045 | | | | 3,500,000 | | | | 3,570,378 | |
Bank of America Commercial Mortgage Trust Series 2007-3 Class A1A ± | | | 5.74 | | | | 6-10-2049 | | | | 916,274 | | | | 968,072 | |
Bank of America Mortgage Securities Series 2002-K Class 3A1 ± | | | 2.63 | | | | 10-20-2032 | | | | 2,258 | | | | 2,274 | |
Bear Stearns Commercial Mortgage Securities Incorporated Series 2005-PW10 Class A4 ± | | | 5.41 | | | | 12-11-2040 | | | | 3,083,392 | | | | 3,086,753 | |
Bear Stearns Commercial Mortgage Securities Incorporated Series 2007-PWR15 Class A4 | | | 5.33 | | | | 2-11-2044 | | | | 2,252,150 | | | | 2,354,427 | |
CFCRE Commercial Mortgage Trust Series 2015-RUM Class A 144A± | | | 1.90 | | | | 7-15-2030 | | | | 3,000,000 | | | | 3,001,104 | |
CNH Equipment Trust Series 2014-A Class A2 | | | 0.49 | | | | 6-15-2017 | | | | 2,475,215 | | | | 2,473,955 | |
CNH Equipment Trust Series 2015-C Class A2A | | | 1.10 | | | | 12-17-2018 | | | | 11,600,000 | | | | 11,605,348 | |
Collateralized Mortgage Obligation Trust Series 66 Class Z | | | 8.00 | | | | 9-20-2021 | | | | 55,012 | | | | 59,673 | |
Commercial Mortgage Trust Series 2010-C1 Class A1 144A | | | 3.16 | | | | 7-10-2046 | | | | 2,378,060 | | | | 2,376,809 | |
Commercial Mortgage Trust Series 2013-FL3 Class B 144A± | | | 2.35 | | | | 10-13-2028 | | | | 9,100,000 | | | | 9,066,285 | |
Commercial Mortgage Trust Series 2014-BBG Class A 144A± | | | 1.00 | | | | 3-15-2029 | | | | 5,400,000 | | | | 5,369,657 | |
The accompanying notes are an integral part of these financial statements.
| | | | | | |
| Portfolio of investments—August 31, 2015 | | Wells Fargo Advantage Ultra Short-Term Income Fund | | | 19 | |
| | | | | | | | | | | | | | | | |
| Security name | | Interest rate | | | Maturity date | | | Principal | | | Value | |
| | | | | | | | | | | | | | | | |
| | | | |
Non-Agency Mortgage-Backed Securities (continued) | | | | | | | | | | | | | | | | |
Countrywide Home Loans Mortgage Pass-Through Trust Series 2001-HYB1 Class 1A1 ± | | | 2.16 | % | | | 6-19-2031 | | | $ | 572,590 | | | $ | 545,865 | |
Countrywide Home Loans Mortgage Pass-Through Trust Series 2001-HYB1 Class 2A1 ± | | | 2.00 | | | | 6-19-2031 | | | | 260,940 | | | | 235,881 | |
Credit Suisse First Boston Mortgage Securities Corporation Series 2006-C4 Class A3 | | | 5.47 | | | | 9-15-2039 | | | | 5,190,122 | | | | 5,319,024 | |
Credit Suisse Mortgage Capital Certificates Series 2006-C5 Class A3 | | | 5.31 | | | | 12-15-2039 | | | | 8,722,199 | | | | 8,954,716 | |
DLJ Mortgage Acceptance Corporation Series 1990-2 Class A ±(i) | | | 3.43 | | | | 1-25-2022 | | | | 68,185 | | | | 69,225 | |
DLJ Mortgage Acceptance Corporation Series 1991-3
Class A1 ±(i) | | | 1.99 | | | | 1-25-2021 | | | | 16,454 | | | | 16,573 | |
EquiFirst Mortgage Loan Trust Series 2003-2 Class 3A3 ± | | | 1.32 | | | | 9-25-2033 | | | | 613,640 | | | | 587,526 | |
Equity Mortgage Trust Series 2014-INNS Class A 144A± | | | 1.04 | | | | 5-8-2031 | | | | 8,414,680 | | | | 8,355,029 | |
FedEx Corporation 1998 Series 981C Pass-Through Certificates | | | 7.02 | | | | 1-15-2016 | | | | 1,699,742 | | | | 1,742,236 | |
GE Commercial Mortgage Corporation Series 2007-C1 Class A4 | | | 5.54 | | | | 12-10-2049 | | | | 3,566,000 | | | | 3,695,492 | |
GE Equipment Transportation LLC Series 2014-1 Class A2 | | | 0.55 | | | | 12-23-2016 | | | | 3,984,404 | | | | 3,982,706 | |
GS Mortgage Securities Trust Series 2014-GSFL Class A 144A± | | | 1.20 | | | | 7-15-2031 | | | | 8,199,470 | | | | 8,175,183 | |
GSMPS Mortgage Loan Trust Series 1998-1 Class A 144A± | | | 8.00 | | | | 9-19-2027 | | | | 66,793 | | | | 68,156 | |
Housing Securities Incorporated Series 1992-8 Class E ± | | | 3.61 | | | | 6-25-2024 | | | | 104,858 | | | | 104,923 | |
JPMorgan Chase Commercial Mortgage Securities Corporation Series 2006-CB14 Class A4 ± | | | 5.48 | | | | 12-12-2044 | | | | 83,472 | | | | 83,910 | |
JPMorgan Chase Commercial Mortgage Securities Corporation Series 2006-CB17 Class A4 | | | 5.43 | | | | 12-12-2043 | | | | 943,370 | | | | 972,242 | |
JPMorgan Chase Commercial Mortgage Securities Corporation Series 2006-LDP7 Class A4 ± | | | 6.09 | | | | 4-15-2045 | | | | 1,786,698 | | | | 1,816,788 | |
JPMorgan Chase Commercial Mortgage Securities Corporation Series 2007-LD12 Class A4 ± | | | 5.88 | | | | 2-15-2051 | | | | 145,000 | | | | 152,615 | |
JPMorgan Chase Commercial Mortgage Securities Corporation Series 2014-INN Class A 144A± | | | 1.12 | | | | 6-15-2029 | | | | 15,000,000 | | | | 14,958,705 | |
JPMorgan Chase Commercial Mortgage Securities Corporation Series 2014-PHH Class A 144A± | | | 1.39 | | | | 8-15-2027 | | | | 10,000,000 | | | | 10,019,930 | |
JPMorgan Chase Commercial Mortgage Securities Corporation Series 2015-CSMO Class A 144A± | | | 1.45 | | | | 1-15-2032 | | | | 8,700,000 | | | | 8,669,942 | |
JPMorgan Chase Commercial Mortgage Securities Corporation Series 2015-FL7 Class A 144A± | | | 1.44 | | | | 5-15-2028 | | | | 8,971,847 | | | | 8,970,762 | |
JPMorgan Chase Commercial Mortgage Securities Trust Series 2005-LDP5 Class A4 ± | | | 5.41 | | | | 12-15-2044 | | | | 1,808,438 | | | | 1,806,304 | |
JPMorgan Chase Commercial Mortgage Securities Trust Series 2006-LDP6 Class A4 ± | | | 5.48 | | | | 4-15-2043 | | | | 1,311,812 | | | | 1,322,933 | |
Lehman Brothers UBS Commercial Mortgage Trust Series 2007-C2 Class A3 | | | 5.43 | | | | 2-15-2040 | | | | 2,898,939 | | | | 3,030,649 | |
Lehman Brothers UBS Commercial Mortgage Trust Series 2007-C6 Class A4 ± | | | 5.86 | | | | 7-15-2040 | | | | 6,607,803 | | | | 6,888,945 | |
Macquarie Equipment Funding Trust Series 2014-A Class A2 144A | | | 0.80 | | | | 11-21-2016 | | | | 9,492,699 | | | | 9,495,926 | |
Master Mortgages Trust Series 2002-3 Class 4A1 ± | | | 2.63 | | | | 10-25-2032 | | | | 18,332 | | | | 18,317 | |
Morgan Stanley Capital I Series 2006-HQ8 Class A4 ± | | | 5.58 | | | | 3-12-2044 | | | | 1,104,947 | | | | 1,106,930 | |
Morgan Stanley Capital I Series 2007-IQ Class A4 | | | 5.81 | | | | 12-12-2049 | | | | 7,291,695 | | | | 7,767,339 | |
Morgan Stanley Mortgage Trust Series 35 Class 2 ±(i)(w) | | | 15,269.38 | | | | 4-20-2021 | | | | 4 | | | | 262 | |
NCUA Guaranteed Notes Program Series 2010-C1 Class A2 | | | 2.90 | | | | 10-29-2020 | | | | 3,250,678 | | | | 3,273,017 | |
NCUA Guaranteed Notes Program Series 2010-C1 Class APT | | | 2.65 | | | | 10-29-2020 | | | | 4,093,818 | | | | 4,110,345 | |
NCUA Guaranteed Notes Program Series 2010-R1 Class 2A | | | 1.84 | | | | 10-7-2020 | | | | 146,573 | | | | 146,934 | |
Prudential Home Mortgage Securities Series 1988-1 Class A ± | | | 2.48 | | | | 4-25-2018 | | | | 9,296 | | | | 9,373 | |
Resecuritization Mortgage Trust Series 1998-B Class A 144A± | | | 0.45 | | | | 4-26-2021 | | | | 8,361 | | | | 7,986 | |
Salomon Brothers Mortgage Securities VII Series 1990-2 Class A ± | | | 2.52 | | | | 11-25-2020 | | | | 327,807 | | | | 332,968 | |
SCG Trust Series 2013-SRP1 Class A 144A± | | | 1.59 | | | | 11-15-2026 | | | | 7,500,000 | | | | 7,459,448 | |
Structured Asset Mortgage Investments Incorporated Series 2001-4 Class A2 ± | | | 9.31 | | | | 10-25-2024 | | | | 74,972 | | | | 77,256 | |
The accompanying notes are an integral part of these financial statements.
| | | | |
| 20 | | Wells Fargo Advantage Ultra Short-Term Income Fund | | Portfolio of investments—August 31, 2015 |
| | | | | | | | | | | | | | | | |
| Security name | | Interest rate | | | Maturity date | | | Principal | | | Value | |
| | | | | | | | | | | | | | | | |
| | | | |
Non-Agency Mortgage-Backed Securities (continued) | | | | | | | | | | | | | | | | |
Structured Asset Securities Corporation Series 1998-2 Class A ± | | | 0.72 | % | | | 2-25-2028 | | | $ | 362,176 | | | $ | 356,924 | |
UBS Barclays Commercial Mortgage Trust Series 2012-C2 Class A1 | | | 1.01 | | | | 5-10-2063 | | | | 2,747,846 | | | | 2,747,277 | |
Wilshire Funding Corporation Series 1996-3 Class M2 ± | | | 7.15 | | | | 8-25-2032 | | | | 142,187 | | | | 139,354 | |
Wilshire Funding Corporation Series 1996-3 Class M3 ± | | | 7.15 | | | | 8-25-2032 | | | | 127,677 | | | | 123,011 | |
Wilshire Funding Corporation Series 1998-2 Class M1 ± | | | 2.00 | | | | 12-28-2037 | | | | 571,690 | | | | 560,100 | |
| | | | |
Total Non-Agency Mortgage-Backed Securities (Cost $182,923,788) | | | | | | | | | | | | | | | 182,213,762 | |
| | | | | | | | | | | | | | | | |
| | | | |
Yankee Corporate Bonds and Notes: 11.03% | | | | | | | | | | | | | | | | |
| | | | |
Consumer Discretionary: 0.16% | | | | | | | | | | | | | | | | |
| | | | |
| Diversified Financial Services: 0.16% | | | | | | | | | | | | | | | | |
AerCap Ireland Capital Limited | | | 2.75 | | | | 5-15-2017 | | | | 2,600,000 | | | | 2,574,000 | |
| | | | | | | | | | | | | | | | |
| | | | |
Consumer Staples: 1.46% | | | | | | | | | | | | | | | | |
| | | | |
| Food & Staples Retailing: 0.64% | | | | | | | | | | | | | | | | |
Tesco plc 144A | | | 2.70 | | | | 1-5-2017 | | | | 10,100,000 | | | | 10,164,943 | |
| | | | | | | | | | | | | | | | |
| | | | |
| Tobacco: 0.82% | | | | | | | | | | | | | | | | |
British American Tobacco International Finance plc 144A | | | 1.85 | | | | 6-15-2018 | | | | 5,700,000 | | | | 5,695,583 | |
Imperial Tobacco Finance plc 144A | | | 2.05 | | | | 7-20-2018 | | | | 7,500,000 | | | | 7,464,885 | |
| | | | |
| | | | | | | | | | | | | | | 13,160,468 | |
| | | | | | | | | | | | | | | | |
| | | | |
Energy: 0.87% | | | | | | | | | | | | | | | | |
| | | | |
| Oil, Gas & Consumable Fuels: 0.87% | | | | | | | | | | | | | | | | |
Petrobras Global Finance Company | | | 3.25 | | | | 3-17-2017 | | | | 5,435,000 | | | | 5,207,274 | |
Transocean Incorporated | | | 5.55 | | | | 12-15-2016 | | | | 8,765,000 | | | | 8,789,104 | |
| | | | |
| | | | | | | | | | | | | | | 13,996,378 | |
| | | | | | | | | | | | | | | | |
| | | | |
Financials: 6.81% | | | | | | | | | | | | | | | | |
| | | | |
| Banks: 4.68% | | | | | | | | | | | | | | | | |
ABN AMRO Bank NV 144A | | | 1.38 | | | | 1-22-2016 | | | | 9,815,000 | | | | 9,832,127 | |
Banque Federative du Credit Mutuel SA 144A | | | 1.70 | | | | 1-20-2017 | | | | 8,150,000 | | | | 8,177,946 | |
BPCE SA | | | 1.61 | | | | 7-25-2017 | | | | 10,000,000 | | | | 10,028,240 | |
Corporacion Andina De Fomento | | | 3.75 | | | | 1-15-2016 | | | | 2,360,000 | | | | 2,383,513 | |
Experian Finance plc 144A | | | 2.38 | | | | 6-15-2017 | | | | 11,500,000 | | | | 11,567,655 | |
ING Bank NV 144A | | | 1.38 | | | | 3-7-2016 | | | | 8,000,000 | | | | 8,019,520 | |
Lloyds Bank plc | | | 2.00 | | | | 8-17-2018 | | | | 8,000,000 | | | | 7,994,744 | |
Royal Bank of Scotland plc | | | 3.95 | | | | 9-21-2015 | | | | 3,000,000 | | | | 3,005,010 | |
Shinhan Bank 144A± | | | 0.93 | | | | 4-8-2017 | | | | 5,000,000 | | | | 4,995,560 | |
Sumitomo Mitsui Banking Corporation | | | 1.35 | | | | 7-11-2017 | | | | 5,000,000 | | | | 4,973,325 | |
Westpac Banking Corporation 144A | | | 5.30 | | | | 10-15-2015 | | | | 4,040,000 | | | | 4,063,004 | |
| | | | |
| | | | | | | | | | | | | | | 75,040,644 | |
| | | | | | | | | | | | | | | | |
| | | | |
| Diversified Financial Services: 0.51% | | | | | | | | | | | | | | | | |
Credit Suisse New York | | | 6.00 | | | | 2-15-2018 | | | | 7,500,000 | | | | 8,161,500 | |
| | | | | | | | | | | | | | | | |
The accompanying notes are an integral part of these financial statements.
| | | | | | |
| Portfolio of investments—August 31, 2015 | | Wells Fargo Advantage Ultra Short-Term Income Fund | | | 21 | |
| | | | | | | | | | | | | | | | |
| Security name | | Interest rate | | | Maturity date | | | Principal | | | Value | |
| | | | | | | | | | | | | | | | |
| | | | |
| Insurance: 1.05% | | | | | | | | | | | | | | | | |
Allied World Assurance Company | | | 7.50 | % | | | 8-1-2016 | | | $ | 9,252,000 | | | $ | 9,745,196 | |
Endurance Specialty Holdings Limited | | | 6.15 | | | | 10-15-2015 | | | | 7,130,000 | | | | 7,171,981 | |
| | | | |
| | | | | | | | | | | | | | | 16,917,177 | |
| | | | | | | | | | | | | | | | |
| | | | |
| Real Estate Management & Development: 0.25% | | | | | | | | | | | | | | | | |
Korea Land & Housing Corporation 144A | | | 1.88 | | | | 8-2-2017 | | | | 4,000,000 | | | | 4,008,816 | |
| | | | | | | | | | | | | | | | |
| | | | |
| Thrifts & Mortgage Finance: 0.32% | | | | | | | | | | | | | | | | |
Korea Development Bank | | | 3.25 | | | | 9-20-2016 | | | | 5,000,000 | | | | 5,102,970 | |
| | | | | | | | | | | | | | | | |
| | | | |
Health Care: 0.65% | | | | | | | | | | | | | | | | |
| | | | |
| Pharmaceuticals: 0.65% | | | | | | | | | | | | | | | | |
Perrigo Company plc | | | 1.30 | | | | 11-8-2016 | | | | 10,550,000 | | | | 10,485,835 | |
| | | | | | | | | | | | | | | | |
| | | | |
Industrials: 0.13% | | | | | | | | | | | | | | | | |
| | | | |
| Electrical Equipment: 0.13% | | | | | | | | | | | | | | | | |
Siemens Financieringsmaatschappij NV | | | 5.63 | | | | 3-16-2016 | | | | 2,000,000 | | | | 2,051,660 | |
| | | | | | | | | | | | | | | | |
| | | | |
Information Technology: 0.21% | | | | | | | | | | | | | | | | |
| | | | |
| Semiconductors & Semiconductor Equipment: 0.21% | | | | | | | | | | | | | | | | |
TSMC Global Limited 144A | | | 0.95 | | | | 4-3-2016 | | | | 3,385,000 | | | | 3,375,583 | |
| | | | | | | | | | | | | | | | |
| | | | |
Telecommunication Services: 0.74% | | | | | | | | | | | | | | | | |
| | | | |
| Diversified Telecommunication Services: 0.49% | | | | | | | | | | | | | | | | |
Telefonica Emisiones SAU | | | 6.42 | | | | 6-20-2016 | | | | 7,500,000 | | | | 7,790,205 | |
| | | | | | | | | | | | | | | | |
| | | | |
| Wireless Telecommunication Services: 0.25% | | | | | | | | | | | | | | | | |
America Movil SAB de CV ± | | | 1.29 | | | | 9-12-2016 | | | | 4,000,000 | | | | 4,017,844 | |
| | | | | | | | | | | | | | | | |
| | | | |
Total Yankee Corporate Bonds and Notes (Cost $177,460,406) | | | | | | | | | | | | | | | 176,848,023 | |
| | | | | | | | | | | | | | | | |
| | | | |
| | | Yield | | | | | | Shares | | | | |
| Short-Term Investments: 10.37% | | | | | | | | | | | | | | | | |
| | | | |
| Investment Companies: 10.25% | | | | | | | | | | | | | | | | |
Wells Fargo Advantage Cash Investment Money Market Fund, Select Class (l)(u)## | | | 0.15 | | | | | | | | 164,351,553 | | | | 164,351,553 | |
| | | | | | | | | | | | | | | | |
| | | | |
| | | | | | | | | Principal | | | | |
| U.S. Treasury Securities: 0.12% | | | | | | | | | | | | | | | | |
U.S. Treasury Bill (z)# | | | 0.01 | | | | 9-17-2015 | | | $ | 1,950,000 | | | | 1,949,998 | |
| | | | | | | | | | | | | | | | |
| | | | |
Total Short-Term Investments (Cost $166,301,547) | | | | | | | | | | | | | | | 166,301,551 | |
| | | | | | | | | | | | | | | | |
| | | | | | | | |
| Total investments in securities (Cost $1,619,011,748) * | | | 100.77 | % | | | 1,615,526,862 | |
Other assets and liabilities, net | | | (0.77 | ) | | | (12,423,355 | ) |
| | | | | | | | |
| Total net assets | | | 100.00 | % | | $ | 1,603,103,507 | |
| | | | | | | | |
The accompanying notes are an integral part of these financial statements.
| | | | |
| 22 | | Wells Fargo Advantage Ultra Short-Term Income Fund | | Portfolio of investments—August 31, 2015 |
| 144A | The security may be resold in transactions exempt from registration, normally to qualified institutional buyers, pursuant to Rule 144A under the Securities Act of 1933. |
| ± | Variable rate investment. The rate shown is the rate in effect at period end. |
| %% | The security is issued on a when-issued basis. |
| ¤ | The security is issued in zero coupon form with no periodic interest payments. |
| ø | Variable rate demand notes are subject to a demand feature which reduces the effective maturity. The maturity date shown represents the final maturity date of the security. The interest rate is determined and reset by the issuer daily, weekly, or monthly depending upon the terms of the security. The rate shown is the rate in effect at period end. |
| (i) | Illiquid security for which the designation as illiquid is unaudited. |
| (w) | The security is a structured note which generates income based on a coupon formula (-1,500 * 1 month LIBOR + 15,573.5%) and the prepayment behavior of the underlying collateral. The coupon is subject to a mandatory cap of 15,573.5% and a mandatory floor of 11%. |
| (l) | The security represents an affiliate of the Fund as defined in the Investment Company Act of 1940. |
| (u) | The rate represents the 7-day annualized yield at period end. |
| ## | All or a portion of this security is segregated for when-issued securities. |
| (z) | Zero coupon security. The rate represents the current yield to maturity. |
| # | All or a portion of this security is segregated as collateral for investments in derivative instruments. |
| * | Cost for federal income tax purposes is $1,619,011,748 and unrealized gains (losses) consists of: |
| | | | |
Gross unrealized gains | | $ | 4,082,576 | |
Gross unrealized losses | | | (7,567,462 | ) |
| | | | |
Net unrealized losses | | $ | (3,484,886 | ) |
The accompanying notes are an integral part of these financial statements.
| | | | | | |
| Statement of assets and liabilities—August 31, 2015 | | Wells Fargo Advantage Ultra Short-Term Income Fund | | | 23 | |
| | | | |
| | | | |
| |
Assets | | | | |
Investments | | | | |
In unaffiliated securities, at value (cost $1,454,660,195) | | $ | 1,451,175,309 | |
In affiliated securities, at value (cost $164,351,553) | | | 164,351,553 | |
| | | | |
Total investments, at value (cost $1,619,011,748) | | | 1,615,526,862 | |
Principal paydown receivable | | | 111,524 | |
Receivable for Fund shares sold | | | 2,298,136 | |
Receivable for interest | | | 9,827,444 | |
Receivable for daily variation margin on open futures contracts | | | 229,718 | |
Prepaid expenses and other assets | | | 143,438 | |
| | | | |
Total assets | | | 1,628,137,122 | |
| | | | |
| |
Liabilities | | | | |
Dividends payable | | | 648,647 | |
Payable for investments purchased | | | 18,060,956 | |
Payable for Fund shares redeemed | | | 5,624,360 | |
Due to custodian bank | | | 7,880 | |
Management fee payable | | | 347,126 | |
Distribution fee payable | | | 4,838 | |
Administration fees payable | | | 147,359 | |
Accrued expenses and other liabilities | | | 192,449 | |
| | | | |
Total liabilities | | | 25,033,615 | |
| | | | |
Total net assets | | $ | 1,603,103,507 | |
| | | | |
| |
NET ASSETS CONSIST OF | | | | |
Paid-in capital | | $ | 1,695,045,421 | |
Overdistributed net investment income | | | (648,647 | ) |
Accumulated net realized losses on investments | | | (89,010,572 | ) |
Net unrealized losses on investments | | | (2,282,695 | ) |
| | | | |
Total net assets | | $ | 1,603,103,507 | |
| | | | |
| |
COMPUTATION OF NET ASSET VALUE AND OFFERING PRICE PER SHARE1 | | | | |
Net assets – Class A | | $ | 151,561,282 | |
Shares outstanding – Class A1 | | | 17,924,049 | |
Net asset value per share – Class A | | | $8.46 | |
Maximum offering price per share – Class A2 | | | $8.63 | |
Net assets – Class C | | $ | 7,642,010 | |
Shares outstanding – Class C1 | | | 904,842 | |
Net asset value per share – Class C | | | $8.45 | |
Net assets – Administrator Class | | $ | 44,681,503 | |
Shares outstanding – Administrator Class1 | | | 5,305,038 | |
Net asset value per share – Administrator Class | | | $8.42 | |
Net assets – Institutional Class | | $ | 1,137,807,595 | |
Shares outstanding – Institutional Class1 | | | 134,619,661 | |
Net asset value per share – Institutional Class | | | $8.45 | |
Net assets – Investor Class | | $ | 261,411,117 | |
Shares outstanding – Investor Class1 | | | 30,904,245 | |
Net asset value per share – Investor Class | | | $8.46 | |
| 1 | The Fund has an unlimited number of authorized shares. |
| 2 | Maximum offering price is computed as 100/98 of net asset value. On investments of $50,000 or more, the offering price is reduced. |
The accompanying notes are an integral part of these financial statements.
| | | | |
| 24 | | Wells Fargo Advantage Ultra Short-Term Income Fund | | Statement of operations —year ended August 31, 2015 |
| | | | |
| | | | |
| |
Investment income | | | | |
Interest | | $ | 23,748,816 | |
Income from affiliated securities | | | 147,021 | |
Securities lending income, net | | | 852 | |
| | | | |
Total investment income | | | 23,896,689 | |
| | | | |
| |
Expenses | | | | |
Management fee | | | 6,025,414 | |
Administration fees | | | | |
Class A | | | 281,934 | |
Class C | | | 13,034 | |
Administrator Class | | | 64,722 | |
Institutional Class | | | 994,127 | |
Investor Class | | | 542,499 | |
Shareholder servicing fees | | | | |
Class A | | | 440,522 | |
Class C | | | 20,366 | |
Administrator Class | | | 160,731 | |
Investor Class | | | 712,761 | |
Distribution fee | | | | |
Class C | | | 61,098 | |
Custody and accounting fees | | | 102,676 | |
Professional fees | | | 72,422 | |
Registration fees | | | 87,538 | |
Shareholder report expenses | | | 79,006 | |
Trustees’ fees and expenses | | | 9,642 | |
Other fees and expenses | | | 26,896 | |
| | | | |
Total expenses | | | 9,695,388 | |
Less: Fee waivers and/or expense reimbursements | | | (1,554,203 | ) |
| | | | |
Net expenses | | | 8,141,185 | |
| | | | |
Net investment income | | | 15,755,504 | |
| | | | |
| |
REALIZED AND UNREALIZED GAINS (LOSSES) ON INVESTMENTS | | | | |
| |
Net realized losses | | | | |
Unaffiliated securities | | | (380,370 | ) |
Futures transactions | | | (7,843,902 | ) |
| | | | |
Net realized losses on investments | | | (8,224,272 | ) |
| | | | |
| |
Net change in unrealized gains (losses) on: | | | | |
Unaffiliated securities | | | (8,009,349 | ) |
Futures transactions | | | 1,753,036 | |
| | | | |
Net change in unrealized gains (losses) on investments | | | (6,256,313 | ) |
| | | | |
Net realized and unrealized gains (losses) on investments | | | (14,480,585 | ) |
| | | | |
Net increase in net assets resulting from operations | | $ | 1,274,919 | |
| | | | |
The accompanying notes are an integral part of these financial statements.
| | | | | | |
| Statement of changes in net assets | | Wells Fargo Advantage Ultra Short-Term Income Fund | | | 25 | |
| | | | | | | | | | | | | | | | |
| | | Year ended
August 31, 2015 | | | Year ended
August 31, 2014 | |
| | | |
Operations | | | | | | | | | | | | |
Net investment income | | | | | | $ | 15,755,504 | | | | | | | $ | 16,905,144 | |
Net realized losses on investments | | | | | | | (8,224,272 | ) | | | | | | | (3,098,045 | ) |
Net change in unrealized gains (losses) on investments | | | | | | | (6,256,313 | ) | | | | | | | 4,121,513 | |
| | | | |
Net increase in net assets resulting from operations | | | | | | | 1,274,919 | | | | | | | | 17,928,612 | |
| | | | |
| | | |
Distributions to shareholders from | | | | | | | | | | | | |
Net investment income | | | | | | | | | | | | | | | | |
Class A | | | | | | | (1,171,060 | ) | | | | | | | (1,311,025 | ) |
Class C | | | | | | | (706 | ) | | | | | | | (4,885 | ) |
Administrator Class | | | | | | | (517,254 | ) | | | | | | | (1,089,252 | ) |
Institutional Class | | | | | | | (12,114,320 | ) | | | | | | | (12,933,549 | ) |
Investor Class | | | | | | | (1,827,644 | ) | | | | | | | (2,280,773 | ) |
Tax basis return of capital | | | | | | | | | | | | | | | | |
Class A | | | | | | | (158,830 | ) | | | | | | | 0 | |
Class C | | | | | | | (96 | ) | | | | | | | 0 | |
Administrator Class | | | | | | | (70,154 | ) | | | | | | | 0 | |
Institutional Class | | | | | | | (1,643,052 | ) | | | | | | | 0 | |
Investor Class | | | | | | | (247,882 | ) | | | | | | | 0 | |
| | | | |
Total distributions to shareholders | | | | | | | (17,750,998 | ) | | | | | | | (17,619,484 | ) |
| | | | |
| | | | |
Capital share transactions | | | Shares | | | | | | | | Shares | | | | | |
Proceeds from shares sold | | | | | | | | | | | | | | | | |
Class A | | | 16,734,640 | | | | 142,192,104 | | | | 19,620,269 | | | | 167,527,734 | |
Class C | | | 246,952 | | | | 2,095,919 | | | | 160,363 | | | | 1,367,745 | |
Administrator Class | | | 2,828,325 | | | | 23,960,440 | | | | 13,855,490 | | | | 117,870,044 | |
Institutional Class | | | 146,858,524 | | | | 1,247,347,113 | | | | 200,951,647 | | | | 1,715,174,083 | |
Investor Class | | | 4,953,813 | | | | 42,107,482 | | | | 9,811,002 | | | | 83,805,971 | |
| | | | |
| | | | | | | 1,457,703,058 | | | | | | | | 2,085,745,577 | |
| | | | |
Reinvestment of distributions | | | | | | | | | | | | | | | | |
Class A | | | 152,627 | | | | 1,295,814 | | | | 148,168 | | | | 1,264,904 | |
Class C | | | 90 | | | | 764 | | | | 549 | | | | 4,687 | |
Administrator Class | | | 53,897 | | | | 455,869 | | | | 67,702 | | | | 575,851 | |
Institutional Class | | | 615,519 | | | | 5,223,336 | | | | 590,277 | | | | 5,037,910 | |
Investor Class | | | 235,018 | | | | 1,995,430 | | | | 256,307 | | | | 2,188,945 | |
| | | | |
| | | | | | | 8,971,213 | | | | | | | | 9,072,297 | |
| | | | |
Payment for shares redeemed | | | | | | | | | | | | | | | | |
Class A | | | (21,989,454 | ) | | | (186,752,566 | ) | | | (15,311,490 | ) | | | (130,736,274 | ) |
Class C | | | (407,520 | ) | | | (3,458,657 | ) | | | (487,060 | ) | | | (4,154,932 | ) |
Administrator Class | | | (11,680,543 | ) | | | (98,990,356 | ) | | | (16,944,553 | ) | | | (144,114,902 | ) |
Institutional Class | | | (179,151,799 | ) | | | (1,521,293,663 | ) | | | (152,147,868 | ) | | | (1,298,604,917 | ) |
Investor Class | | | (10,954,296 | ) | | | (93,074,087 | ) | | | (12,513,153 | ) | | | (106,880,999 | ) |
| | | | |
| | | | | | | (1,903,569,329 | ) | | | | | | | (1,684,492,024 | ) |
| | | | |
Net increase (decrease) in net assets resulting from capital share transactions | | | | | | | (436,895,058 | ) | | | | | | | 410,325,850 | |
| | | | |
Total increase (decrease) in net assets | | | | | | | (453,371,137 | ) | | | | | | | 410,634,978 | |
| | | | |
| | |
Net assets | | | | | | | | |
Beginning of period | | | | | | | 2,056,474,644 | | | | | | | | 1,645,839,666 | |
| | | | |
End of period | | | | | | $ | 1,603,103,507 | | | | | | | $ | 2,056,474,644 | |
| | | | |
Overdistributed net investment income | | | | | | $ | (648,647 | ) | | | | | | $ | (773,167 | ) |
| | | | |
The accompanying notes are an integral part of these financial statements.
| | | | |
| 26 | | Wells Fargo Advantage Ultra Short-Term Income Fund | | Financial highlights |
(For a share outstanding throughout each period)
| | | | | | | | | | | | | | | | | | | | |
| | | Year ended August 31 | |
| CLASS A | | 2015 | | | 2014 | | | 2013 | | | 2012 | | | 2011 | |
Net asset value, beginning of period | | | $8.53 | | | | $8.53 | | | | $8.55 | | | | $8.52 | | | | $8.52 | |
Net investment income | | | 0.05 | | | | 0.06 | | | | 0.06 | | | | 0.10 | | | | 0.10 | |
Net realized and unrealized gains (losses) on investments | | | (0.06 | ) | | | 0.00 | | | | (0.02 | ) | | | 0.03 | | | | 0.02 | |
| | | | | | | | | | | | | | | | | | | | |
Total from investment operations | | | (0.01 | ) | | | 0.06 | | | | 0.04 | | | | 0.13 | | | | 0.12 | |
Distributions to shareholders from | | | | | | | | | | | | | | | | | | | | |
Net investment income | | | (0.05 | ) | | | (0.06 | ) | | | (0.06 | ) | | | (0.10 | ) | | | (0.12 | ) |
Tax basis return of capital | | | (0.01 | ) | | | 0.00 | | | | 0.00 | | | | 0.00 | | | | 0.00 | |
| | | | | | | | | | | | | | | | | | | | |
Total from investment operations | | | (0.06 | ) | | | (0.06 | ) | | | (0.06 | ) | | | (0.10 | ) | | | (0.12 | ) |
Net asset value, end of period | | | $8.46 | | | | $8.53 | | | | $8.53 | | | | $8.55 | | | | $8.52 | |
Total return1 | | | (0.07 | )% | | | 0.74 | % | | | 0.52 | % | | | 1.47 | % | | | 1.37 | % |
Ratios to average net assets (annualized) | | | | | | | | | | | | | | | | | | | | |
Gross expenses | | | 0.77 | % | | | 0.78 | % | | | 0.83 | % | | | 0.88 | % | | | 0.87 | % |
Net expenses | | | 0.70 | % | | | 0.70 | % | | | 0.70 | % | | | 0.70 | % | | | 0.70 | % |
Net investment income | | | 0.64 | % | | | 0.70 | % | | | 0.72 | % | | | 1.11 | % | | | 1.17 | % |
Supplemental data | | | | | | | | | | | | | | | | | | | | |
Portfolio turnover rate | | | 70 | % | | | 47 | % | | | 56 | % | | | 61 | % | | | 60 | % |
Net assets, end of period (000s omitted) | | | $151,561 | | | | $196,459 | | | | $158,363 | | | | $146,400 | | | | $160,768 | |
| 1 | Total return calculations do not include any sales charges. |
The accompanying notes are an integral part of these financial statements.
| | | | | | |
| Financial highlights | | Wells Fargo Advantage Ultra Short-Term Income Fund | | | 27 | |
(For a share outstanding throughout each period)
| | | | | | | | | | | | | | | | | | | | |
| | | Year ended August 31 | |
| CLASS C | | 2015 | | | 2014 | | | 2013 | | | 2012 | | | 2011 | |
Net asset value, beginning of period | | | $8.52 | | | | $8.52 | | | | $8.55 | | | | $8.52 | | | | $8.52 | |
Net investment income (loss) | | | (0.01 | ) | | | (0.01 | ) | | | (0.00 | )1 | | | 0.03 | | | | 0.04 | |
Net realized and unrealized gains (losses) on investments | | | (0.06 | ) | | | 0.01 | | | | (0.03 | ) | | | 0.03 | | | | 0.01 | |
| | | | | | | | | | | | | | | | | | | | |
Total from investment operations | | | (0.07 | ) | | | 0.00 | | | | (0.03 | ) | | | 0.06 | | | | 0.05 | |
Distributions to shareholders from | | | | | | | | | | | | | | | | | | | | |
Net investment income | | | (0.00 | )1 | | | (0.00 | )1 | | | (0.00 | )1 | | | (0.03 | ) | | | (0.05 | ) |
Tax basis return of capital | | | (0.00 | )1 | | | 0.00 | | | | 0.00 | | | | 0.00 | | | | 0.00 | |
| | | | | | | | | | | | | | | | | | | | |
Total distributions to shareholders | | | (0.00 | )1 | | | (0.00 | )1 | | | (0.00 | )1 | | | (0.03 | ) | | | (0.05 | ) |
Net asset value, end of period | | | $8.45 | | | | $8.52 | | | | $8.52 | | | | $8.55 | | | | $8.52 | |
Total return2 | | | (0.81 | )% | | | 0.05 | % | | | (0.31 | )% | | | 0.71 | % | | | 0.61 | % |
Ratios to average net assets (annualized) | | | | | | | | | | | | | | | | | | | | |
Gross expenses | | | 1.52 | % | | | 1.53 | % | | | 1.59 | % | | | 1.63 | % | | | 1.62 | % |
Net expenses | | | 1.45 | % | | | 1.45 | % | | | 1.45 | % | | | 1.45 | % | | | 1.45 | % |
Net investment income (loss) | | | (0.10 | )% | | | (0.05 | )% | | | (0.02 | )% | | | 0.37 | % | | | 0.43 | % |
Supplemental data | | | | | | | | | | | | | | | | | | | | |
Portfolio turnover rate | | | 70 | % | | | 47 | % | | | 56 | % | | | 61 | % | | | 60 | % |
Net assets, end of period (000s omitted) | | | $7,642 | | | | $9,078 | | | | $11,859 | | | | $14,951 | | | | $19,117 | |
| 1 | Amount is less than $0.005. |
| 2 | Total return calculations do not include any sales charges. |
The accompanying notes are an integral part of these financial statements.
| | | | |
| 28 | | Wells Fargo Advantage Ultra Short-Term Income Fund | | Financial highlights |
(For a share outstanding throughout each period)
| | | | | | | | | | | | | | | | | | | | |
| | | Year ended August 31 | |
| ADMINISTRATOR CLASS | | 2015 | | | 2014 | | | 2013 | | | 2012 | | | 2011 | |
Net asset value, beginning of period | | | $8.50 | | | | $8.50 | | | | $8.52 | | | | $8.48 | | | | $8.48 | |
Net investment income | | | 0.07 | 1 | | | 0.07 | | | | 0.07 | | | | 0.11 | | | | 0.11 | |
Net realized and unrealized gains (losses) on investments | | | (0.07 | ) | | | 0.01 | | | | (0.01 | ) | | | 0.04 | | | | 0.02 | |
| | | | | | | | | | | | | | | | | | | | |
Total from investment operations | | | 0.00 | | | | 0.08 | | | | 0.06 | | | | 0.15 | | | | 0.13 | |
Distributions to shareholders from | | | | | | | | | | | | | | | | | | | | |
Net investment income | | | (0.07 | ) | | | (0.08 | ) | | | (0.08 | ) | | | (0.11 | ) | | | (0.13 | ) |
Tax basis return of capital | | | (0.01 | ) | | | 0.00 | | | | 0.00 | | | | 0.00 | | | | 0.00 | |
| | | | | | | | | | | | | | | | | | | | |
Total distributions to shareholders | | | (0.08 | ) | | | (0.08 | ) | | | (0.08 | ) | | | (0.11 | ) | | | (0.13 | ) |
Net asset value, end of period | | | $8.42 | | | | $8.50 | | | | $8.50 | | | | $8.52 | | | | $8.48 | |
Total return | | | (0.04 | )% | | | 0.89 | % | | | 0.67 | % | | | 1.74 | % | | | 1.52 | % |
Ratios to average net assets (annualized) | | | | | | | | | | | | | | | | | | | | |
Gross expenses | | | 0.71 | % | | | 0.72 | % | | | 0.77 | % | | | 0.82 | % | | | 0.79 | % |
Net expenses | | | 0.55 | % | | | 0.55 | % | | | 0.55 | % | | | 0.55 | % | | | 0.55 | % |
Net investment income | | | 0.81 | % | | | 0.84 | % | | | 0.87 | % | | | 1.26 | % | | | 1.33 | % |
Supplemental data | | | | | | | | | | | | | | | | | | | | |
Portfolio turnover rate | | | 70 | % | | | 47 | % | | | 56 | % | | | 61 | % | | | 60 | % |
Net assets, end of period (000s omitted) | | | $44,682 | | | | $119,884 | | | | $145,498 | | | | $103,810 | | | | $107,449 | |
| 1 | Calculated based upon average shares outstanding |
The accompanying notes are an integral part of these financial statements.
| | | | | | |
| Financial highlights | | Wells Fargo Advantage Ultra Short-Term Income Fund | | | 29 | |
(For a share outstanding throughout each period)
| | | | | | | | | | | | | | | | | | | | |
| | | Year ended August 31 | |
| INSTITUTIONAL CLASS | | 2015 | | | 2014 | | | 2013 | | | 2012 | | | 2011 | |
Net asset value, beginning of period | | | $8.53 | | | | $8.52 | | | | $8.55 | | | | $8.51 | | | | $8.51 | |
Net investment income | | | 0.08 | | | | 0.09 | | | | 0.09 | | | | 0.13 | | | | 0.13 | |
Net realized and unrealized gains (losses) on investments | | | (0.07 | ) | | | 0.01 | | | | (0.03 | ) | | | 0.04 | | | | 0.02 | |
| | | | | | | | | | | | | | | | | | | | |
Total from investment operations | | | 0.01 | | | | 0.10 | | | | 0.06 | | | | 0.17 | | | | 0.15 | |
Distributions to shareholders from | | | | | | | | | | | | | | | | | | | | |
Net investment income | | | (0.08 | ) | | | (0.09 | ) | | | (0.09 | ) | | | (0.13 | ) | | | (0.15 | ) |
Tax basis return of capital | | | (0.01 | ) | | | 0.00 | | | | 0.00 | | | | 0.00 | | | | 0.00 | |
| | | | | | | | | | | | | | | | | | | | |
Total distributions to shareholders | | | (0.09 | ) | | | (0.09 | ) | | | (0.09 | ) | | | (0.13 | ) | | | (0.15 | ) |
Net asset value, end of period | | | $8.45 | | | | $8.53 | | | | $8.52 | | | | $8.55 | | | | $8.51 | |
Total return | | | 0.16 | % | | | 1.21 | % | | | 0.75 | % | | | 1.94 | % | | | 1.72 | % |
Ratios to average net assets (annualized) | | | | | | | | | | | | | | | | | | | | |
Gross expenses | | | 0.44 | % | | | 0.45 | % | | | 0.50 | % | | | 0.55 | % | | | 0.54 | % |
Net expenses | | | 0.35 | % | | | 0.35 | % | | | 0.35 | % | | | 0.35 | % | | | 0.35 | % |
Net investment income | | | 0.99 | % | | | 1.05 | % | | | 1.07 | % | | | 1.46 | % | | | 1.50 | % |
Supplemental data | | | | | | | | | | | | | | | | | | | | |
Portfolio turnover rate | | | 70 | % | | | 47 | % | | | 56 | % | | | 61 | % | | | 60 | % |
Net assets, end of period (000s omitted) | | | $1,137,808 | | | | $1,418,101 | | | | $996,437 | | | | $588,228 | | | | $596,838 | |
The accompanying notes are an integral part of these financial statements.
| | | | |
| 30 | | Wells Fargo Advantage Ultra Short-Term Income Fund | | Financial highlights |
(For a share outstanding throughout each period)
| | | | | | | | | | | | | | | | | | | | |
| | | Year ended August 31 | |
| INVESTOR CLASS | | 2015 | | | 2014 | | | 2013 | | | 2012 | | | 2011 | |
Net asset value, beginning of period | | | $8.53 | | | | $8.53 | | | | $8.56 | | | | $8.52 | | | | $8.52 | |
Net investment income | | | 0.05 | | | | 0.06 | | | | 0.06 | | | | 0.09 | | | | 0.10 | |
Net realized and unrealized gains (losses) on investments | | | (0.06 | ) | | | 0.00 | | | | (0.03 | ) | | | 0.04 | | | | 0.01 | |
| | | | | | | | | | | | | | | | | | | | |
Total from investment operations | | | (0.01 | ) | | | 0.06 | | | | 0.03 | | | | 0.13 | | | | 0.11 | |
Distributions to shareholders from | | | | | | | | | | | | | | | | | | | | |
Net investment income | | | (0.05 | ) | | | (0.06 | ) | | | (0.06 | ) | | | (0.09 | ) | | | (0.11 | ) |
Tax basis return of capital | | | (0.01 | ) | | | 0.00 | | | | 0.00 | | | | 0.00 | | | | 0.00 | |
| | | | | | | | | | | | | | | | | | | | |
Total distributions to shareholders | | | (0.06 | ) | | | (0.06 | ) | | | (0.06 | ) | | | (0.09 | ) | | | (0.11 | ) |
Net asset value, end of period | | | $8.46 | | | | $8.53 | | | | $8.53 | | | | $8.56 | | | | $8.52 | |
Total return | | | (0.10 | )% | | | 0.71 | % | | | 0.37 | % | | | 1.56 | % | | | 1.34 | % |
Ratios to average net assets (annualized) | | | | | | | | | | | | | | | | | | | | |
Gross expenses | | | 0.80 | % | | | 0.81 | % | | | 0.87 | % | | | 0.91 | % | | | 0.90 | % |
Net expenses | | | 0.73 | % | | | 0.73 | % | | | 0.73 | % | | | 0.73 | % | | | 0.73 | % |
Net investment income | | | 0.62 | % | | | 0.67 | % | | | 0.69 | % | | | 1.08 | % | | | 1.15 | % |
Supplemental data | | | | | | | | | | | | | | | | | | | | |
Portfolio turnover rate | | | 70 | % | | | 47 | % | | | 56 | % | | | 61 | % | | | 60 | % |
Net assets, end of period (000s omitted) | | | $261,411 | | | | $312,953 | | | | $333,684 | | | | $351,969 | | | | $384,998 | |
The accompanying notes are an integral part of these financial statements.
| | | | | | |
| Notes to financial statements | | Wells Fargo Advantage Ultra Short-Term Income Fund | | | 31 | |
1. ORGANIZATION
Wells Fargo Funds Trust (the “Trust”), a Delaware statutory trust organized on March 10, 1999, is an open-end management investment company registered under the Investment Company Act of 1940, as amended (the “1940 Act”). As an investment company, the Trust follows the accounting and reporting guidance in Financial Accounting Standards Board (“FASB”) Accounting Standards Codification Topic 946, Financial Services – Investment Companies. These financial statements report on the Wells Fargo Advantage Ultra Short-Term Income Fund (the “Fund”) which is a diversified series of the Trust.
2. SIGNIFICANT ACCOUNTING POLICIES
The following significant accounting policies, which are consistently followed in the preparation of the financial statements of the Fund, are in conformity with U.S. generally accepted accounting principles which require management to make estimates and assumptions that affect the reported amounts of assets and liabilities, disclosure of contingent assets and liabilities at the date of the financial statements, and the reported amounts of revenues and expenses during the reporting period. Actual results could differ from those estimates.
Securities valuation
All investments are valued each business day as of the close of regular trading on the New York Stock Exchange (generally 4 p.m. Eastern Time).
Debt securities are valued at the evaluated bid price provided by an independent pricing service or, if a reliable price is not available, the quoted bid price from an independent broker-dealer.
Futures that are listed on a foreign or domestic exchange or market are valued at the official closing price or, if none, the last sales price.
Investments in registered open-end investment companies are valued at net asset value. Interests in non-registered investment vehicles that are redeemable at net asset value are fair valued at net asset value when available.
Investments which are not valued using any of the methods discussed above are valued at their fair value, as determined in good faith by the Board of Trustees of the Fund. The Board of Trustees has established a Valuation Committee comprised of the Trustees and has delegated to it the authority to take any actions regarding the valuation of portfolio securities that the Valuation Committee deems necessary or appropriate, including determining the fair value of portfolio securities, unless the determination has been delegated to the Management Valuation Team of Wells Fargo Funds Management, LLC (“Funds Management”). The Board of Trustees retains the authority to make or ratify any valuation decisions or approve any changes to the Valuation Procedures as it deems appropriate. On a quarterly basis, the Board of Trustees receives reports on any valuation actions taken by the Valuation Committee or the Management Valuation Team which may include items for ratification.
Valuations of fair valued securities are compared to the next actual sales price when available, or other appropriate market values, to assess the continued appropriateness of the fair valuation methodologies used. These securities are fair valued on a day-to-day basis, taking into consideration changes to appropriate market information and any significant changes to the inputs considered in the valuation process until there is a readily available price provided on an exchange or by an independent pricing service. Valuations received from an independent pricing service or independent broker-dealer quotes are periodically validated by comparisons to most recent trades and valuations provided by other independent pricing services in addition to the review of prices by the manager and/or subadviser. Unobservable inputs used in determining fair valuations are identified based on the type of security, taking into consideration factors utilized by market participants in valuing the investment, knowledge about the issuer and the current market environment.
Security loans
The Fund may lend its securities from time to time in order to earn additional income in the form of fees or interest on securities received as collateral or the investment of any cash received as collateral. The Fund continues to receive interest or dividends on the securities loaned. The Fund receives collateral in the form of cash or securities with a value at least equal to the value of the securities on loan. The value of the loaned securities is determined at the close of each business day and any additional required collateral is delivered to the Fund on the next business day. In a securities lending transaction, the net asset value of the Fund will be affected by an increase or decrease in the value of the securities loaned and by an increase or decrease in the value of the instrument in which collateral is invested. The amount of securities lending activity undertaken by the Fund fluctuates from time to time. In the event of default or bankruptcy by the borrower, the Fund may be prevented from recovering the loaned securities or gaining access to the collateral or
| | | | |
| 32 | | Wells Fargo Advantage Ultra Short-Term Income Fund | | Notes to financial statements |
may experience delays or costs in doing so. In addition, the investment of any cash collateral received may lose all or part of its value. The Fund has the right under the lending agreement to recover the securities from the borrower on demand.
The Fund lends its securities through an unaffiliated securities lending agent. Cash collateral received in connection with its securities lending transactions is invested in Securities Lending Cash Investments, LLC (the “Securities Lending Fund”). The Securities Lending Fund is exempt from registration under Section 3(c)(7) of the 1940 Act and is managed by Funds Management and is subadvised by Wells Capital Management Incorporated (“WellsCap”). Funds Management receives an advisory fee starting at 0.05% and declining to 0.01% as the average daily net assets of the Securities Lending Fund increase. All of the fees received by Funds Management are paid to WellsCap for its services as subadviser. The Securities Lending Fund seeks to provide a positive return compared to the daily Fed Funds Open rate by investing in high-quality, U.S. dollar-denominated short-term money market instruments. Securities Lending Fund investments are fair valued based upon the amortized cost valuation technique. Income earned from investment in the Securities Lending Fund is included in securities lending income on the Statement of Operations.
When-issued transactions
The Fund may purchase securities on a forward commitment or when-issued basis. The Fund records a when-issued transaction on the trade date and will segregate assets in an amount at least equal in value to the Fund’s commitment to purchase when-issued securities. Securities purchased on a when-issued basis are marked-to-market daily and the Fund begins earning interest on the settlement date. Losses may arise due to changes in the market value of the underlying securities or if the counterparty does not perform under the contract.
Futures contracts
The Fund is subject to interest rate risk in the normal course of pursuing its investment objectives. The Fund may buy and sell futures contracts in order to gain exposure to, or protect against, changes in security values and interest rates. The primary risks associated with the use of futures contracts are the imperfect correlation between changes in market values of securities held by the Fund and the prices of futures contracts, and the possibility of an illiquid market.
The aggregate principal amounts of the contracts are not recorded in the financial statements. Fluctuations in the value of the contracts are recorded in the Statement of Assets and Liabilities as an asset or liability and in the Statement of Operations as unrealized gains or losses until the contracts are closed, at which point they are recorded as net realized gains or losses on futures contracts. With futures contracts, there is minimal counterparty risk to the Fund since futures are exchange traded and the exchange’s clearinghouse, as counterparty to all exchange traded futures, guarantees the futures against default.
Security transactions and income recognition
Securities transactions are recorded on a trade date basis. Realized gains or losses are recorded on the basis of identified cost.
Interest income is accrued daily and bond discounts are accreted and premiums are amortized daily based on the effective interest method. To the extent debt obligations are placed on non-accrual status, any related interest income may be reduced by writing off interest receivables when the collection of all or a portion of interest has become doubtful based on consistently applied procedures. If the issuer subsequently resumes interest payments or when the collectability of interest is reasonably assured, the debt obligation is removed from non-accrual status.
Distributions to shareholders
Distributions to shareholders from net investment income are accrued daily and paid monthly. Distributions from net realized gains, if any, are recorded on the ex-dividend date. Such distributions are determined in conformity with federal income tax regulations, which may differ in amount or character from net investment income and realized gains recognized for purposes of U.S. generally accepted accounting principles.
Federal and other taxes
The Fund intends to continue to qualify as a regulated investment company by distributing substantially all of its investment company taxable income and any net realized capital gains (after reduction for capital loss carryforwards) sufficient to relieve it from all, or substantially all, federal income taxes. Accordingly, no provision for federal income taxes was required.
The Fund’s income and federal excise tax returns and all financial records supporting those returns for the prior three fiscal years are subject to examination by the federal and Delaware revenue authorities. Management has analyzed the Fund’s tax positions taken on federal, state, and foreign tax returns for all open tax years and does not believe that there are any uncertain tax positions that require recognition of a tax liability.
| | | | | | |
| Notes to financial statements | | Wells Fargo Advantage Ultra Short-Term Income Fund | | | 33 | |
Reclassifications are made to the Fund’s capital accounts for permanent tax differences to reflect income and gains available for distribution (or available capital loss carryforwards) under federal income tax regulations. U.S. generally accepted accounting principles require that certain components of net assets be adjusted to reflect permanent differences between financial and tax reporting. These reclassifications have no effect on net assets or net asset values per share. The primary permanent difference causing such reclassifications is due to expiration of capital loss carryforwards. At August 31, 2015, as a result of permanent book-to-tax differences, the following reclassification adjustments were made on the Statement of Assets and Liabilities:
| | |
| Paid-in capital | | Accumulated net
realized losses
on investments |
| $(2,154,408) | | $2,154,408 |
As of August 31, 2015, capital loss carryforwards available to offset future net realized capital gains were as follows through the indicated expiration dates:
| | | | | | | | | | |
| | | | | | | | | No expiration |
| 2016 | | 2017 | | 2018 | | 2019 | | Short-term | | Long-term |
| $8,848,032 | | $35,029,445 | | $7,738,751 | | $7,448,920 | | $1,790,107 | | $21,927,737 |
As of August 31, 2015, the Fund had current year deferred post-October capital losses consisting of $2,136,415 in short-term losses and $2,888,974 in long-term losses which will be recognized on the first day of the following fiscal year.
Class allocations
The separate classes of shares offered by the Fund differ principally in applicable sales charges, distribution, shareholder servicing, and administration fees. Class specific expenses are charged directly to that share class. Investment income, common expenses, and realized and unrealized gains (losses) on investments are allocated daily to each class of shares based on the relative proportion of net assets of each class.
3. FAIR VALUATION MEASUREMENTS
Fair value measurements of investments are determined within a framework that has established a fair value hierarchy based upon the various data inputs utilized in determining the value of the Fund’s investments. The three-level hierarchy gives the highest priority to unadjusted quoted prices in active markets for identical assets or liabilities (Level 1) and the lowest priority to significant unobservable inputs (Level 3). The Fund’s investments are classified within the fair value hierarchy based on the lowest level of input that is significant to the fair value measurement. The inputs are summarized into three broad levels as follows:
| n | | Level 1 – quoted prices in active markets for identical securities |
| n | | Level 2 – other significant observable inputs (including quoted prices for similar securities, interest rates, prepayment speeds, credit risk, use of amortized cost, etc.) |
| n | | Level 3 – significant unobservable inputs (including the Fund’s own assumptions in determining the fair value of investments) |
The inputs or methodologies used for valuing investments in securities are not necessarily an indication of the risk associated with investing in those securities.
| | | | |
| 34 | | Wells Fargo Advantage Ultra Short-Term Income Fund | | Notes to financial statements |
The following is a summary of the inputs used in valuing the Fund’s assets and liabilities as of August 31, 2015:
| | | | | | | | | | | | | | | | |
| | | Quoted prices
(Level 1) | | | Other significant
observable inputs
(Level 2) | | | Significant
unobservable inputs
(Level 3) | | | Total | |
Assets | | | | | | | | | | | | | | | | |
Investments in: | | | | | | | | | | | | | | | | |
| | | | |
Agency securities | | $ | 0 | | | $ | 206,030,326 | | | $ | 0 | | | $ | 206,030,326 | |
| | | | |
Asset-backed securities | | | 0 | | | | 215,494,893 | | | | 0 | | | | 215,494,893 | |
| | | | |
Corporate bonds and notes | | | 0 | | | | 613,217,270 | | | | 0 | | | | 613,217,270 | |
| | | | |
Municipal obligations | | | 0 | | | | 55,421,037 | | | | 0 | | | | 55,421,037 | |
| | | | |
Non-agency mortgage-backed securities | | | 0 | | | | 182,213,762 | | | | 0 | | | | 182,213,762 | |
| | | | |
Yankee corporate bonds and notes | | | 0 | | | | 176,848,023 | | | | 0 | | | | 176,848,023 | |
| | | | |
Short-term investments | | | | | | | | | | | | | | | | |
Investment companies | | | 164,351,553 | | | | 0 | | | | 0 | | | | 164,351,553 | |
U.S. Treasury securities | | | 1,949,998 | | | | 0 | | | | 0 | | | | 1,949,998 | |
| | | 166,301,551 | | | | 1,449,225,311 | | | | 0 | | | | 1,615,526,862 | |
Futures contracts | | | 229,718 | | | | 0 | | | | 0 | | | | 229,718 | |
Total assets | | $ | 166,531,269 | | | $ | 1,449,225,311 | | | $ | 0 | | | $ | 1,615,756,580 | |
Futures contracts are reported at their variation margin at measurement date, which represents the amount due to the Fund at that date. All other assets and liabilities are reported at their market value at measurement date.
The Fund recognizes transfers between levels within the fair value hierarchy at the end of the reporting period. At August 31, 2015, the Fund did not have any transfers into/out of Level 1, Level 2, or Level 3.
4. TRANSACTIONS WITH AFFILIATES
Management fee
Funds Management, an indirect wholly owned subsidiary of Wells Fargo & Company (“Wells Fargo”), is the manager of the Fund and provides advisory and fund-level administrative services under an investment management agreement. Under the investment management agreement, Funds Management is responsible for, among other services, implementing the investment objectives and strategies of the Fund, supervising the applicable subadviser, providing fund-level administrative services in connection with the Fund’s operations, and providing any other fund-level administrative services reasonably necessary for the operation of the Fund. As compensation for its services under the investment management agreement, Funds Management is entitled to receive an annual management fee starting at 0.35% and declining to 0.255% as the average daily net assets of the Fund increase.
Prior to July 1, 2015, Funds Management provided advisory services pursuant to an investment advisory agreement and was entitled to receive an annual fee which started at 0.30% and declined to 0.225% as the average daily net assets of the Fund increased. In addition, fund-level administrative services were provided by Funds Management under a separate administration agreement at an annual fee which started at 0.05% and declined to 0.03% as the average daily net assets of the Fund increased. For financial statement purposes, the advisory fee and fund-level administration fee for the year ended August 31, 2015 have been included in management fee on the Statement of Operations.
For the year ended August 31, 2015, the management fee was equivalent to an annual rate of 0.34% of the Fund’s average daily net assets.
Funds Management has retained the services of a subadviser to provide daily portfolio management to the Fund. The fee for subadvisory services is borne by Funds Management. WellsCap, an affiliate of Funds Management and an indirect wholly owned subsidiary of Wells Fargo, is the subadviser to the Fund and is entitled to receive a fee from Funds Management at an annual rate starting at 0.15% and declining to 0.05% as the average daily net assets of the Fund increase.
| | | | | | |
| Notes to financial statements | | Wells Fargo Advantage Ultra Short-Term Income Fund | | | 35 | |
Administration fees
Under a class-level administration agreement, Funds Management provides class-level administrative services to the Fund, which includes paying fees and expenses for services provided by the transfer agent, sub-transfer agents, omnibus account servicers and record-keepers. As compensation for its services under the class-level administration agreement, Funds Management receives an annual fee which is calculated based on the average daily net assets of each class as follows:
| | | | |
| | | Class-level
administration fee | |
Class A, Class C | | | 0.16 | % |
Administrator Class | | | 0.10 | |
Institutional Class | | | 0.08 | |
Investor Class | | | 0.19 | |
Funds Management has contractually waived and/or reimbursed management and administration fees to the extent necessary to maintain certain net operating expense ratios for the Fund. Waiver of fees and/or reimbursement of expenses by Funds Management were made first from fund level expenses on a proportionate basis and then from class specific expenses. Funds Management has committed through December 31, 2015 to waive fees and/or reimburse expenses to the extent necessary to cap the Fund’s expenses at 0.70% for Class A shares, 1.45% for Class C shares, 0.55% for Class Administrator Class shares, 0.35% for Class Institutional Class shares, and 0.73% for Investor Class shares. After this time, the cap may be increased or the commitment to maintain the cap may be terminated only with the approval of the Board of Trustees.
Distribution fee
The Trust has adopted a distribution plan for Class C shares of the Fund pursuant to Rule 12b-1 under the 1940 Act. A distribution fee is charged to Class C shares and paid to Wells Fargo Funds Distributor, LLC (“Funds Distributor”), the principal underwriter, at an annual rate of 0.75% of the average daily net assets of Class C shares.
In addition, Funds Distributor is entitled to receive the front-end sales charge from the purchase of Class A shares and a contingent deferred sales charge on the redemption of certain Class A shares. Funds Distributor is also entitled to receive the contingent deferred sales charges from redemptions of Class C shares. For the year ended August 31, 2015, Funds Distributor received $1,581 from the sale of Class A shares.
Shareholder servicing fees
The Trust has entered into contracts with one or more shareholder servicing agents, whereby Class A, Class C, Administrator Class, and Investor Class of the Fund is charged a fee at an annual rate of 0.25% of the average daily net assets of each respective class.
A portion of these total shareholder servicing fees were paid to affiliates of Wells Fargo.
5. INVESTMENT PORTFOLIO TRANSACTIONS
Purchases and sales of investments, excluding short-term securities, for the year ended August 31, 2015 were as follows:
| | | | | | |
Purchases at cost | | Sales proceeds |
U.S.
government | | Non-U.S.
government | | U.S.
government | | Non-U.S.
government |
| $257,941,664 | | $944,864,955 | | $226,682,632 | | $927,952,363 |
6. DERIVATIVE TRANSACTIONS
During the year ended August 31, 2015, the Fund entered into futures contracts to speculate on interest rates and to help manage the duration of the portfolio.
At August 31, 2015, the Fund had short futures contracts outstanding as follows:
| | | | | | | | | | | | | | | | | | |
| Expiration date | | Counterparty | | Contracts | | | Type | | | Contract value at August 31, 2015 | | | Unrealized
gains | |
| 12-31-2015 | | JPMorgan | | | 1,979 Short | | | | 2-Year U.S. Treasury Notes | | | $ | 432,349,656 | | | $ | 1,202,191 | |
| | | | |
| 36 | | Wells Fargo Advantage Ultra Short-Term Income Fund | | Notes to financial statements |
The Fund had an average notional amount of $3,563,078 in long and $538,772,020 in short futures contracts during the year ended August 31, 2015.
On August 31, 2015, the cumulative unrealized gains on futures contracts in the amount of $1,202,191 are reflected in net unrealized losses on investments on the Statement of Assets and Liabilities. The receivable for daily variation margin on open futures contracts reflected in the Statement of Assets and Liabilities only represents the current day’s variation margin. The realized losses and change in unrealized gains (losses) on futures contracts are reflected in the Statement of Operations.
For certain types of derivative transactions, the Fund has entered into International Swaps and Derivatives Association, Inc. master agreements (“ISDA Master Agreements”) or similar agreements with approved counterparties. The ISDA Master Agreements or similar agreements may have requirements to deliver/deposit securities or cash to/with an exchange or broker-dealer as collateral and allows the Fund to offset, with each counterparty, certain derivative financial instrument’s assets and/or liabilities with collateral held or pledged. Collateral requirements differ by type of derivative. Collateral or margin requirements are set by the broker or exchange clearing house for exchange traded derivatives while collateral terms are contract specific for over-the-counter traded derivatives. Cash collateral that has been pledged to cover obligations of the Fund under ISDA Master Agreements or similar agreements, if any, will be reported separately in the Statement of Assets and Liabilities. Securities pledged as collateral, if any, for the same purpose are noted in the Portfolio of Investments. With respect to balance sheet offsetting, absent an event of default by the counterparty or a termination of the agreement, the reported amounts of financial assets and financial liabilities in the Statement of Assets and Liabilities are not offset across transactions between the Fund and the applicable counterparty. A reconciliation of the gross amounts on the Statement of Assets and Liabilities to the net amounts by derivative type, including any collateral exposure, is as follows:
| | | | | | | | | | | | | | | | |
| Derivative type | | Counterparty | | Gross amounts of assets in the Statement of
Assets and
Liabilities | | Amounts
subject to
netting
agreements | | | Collateral
received | | | Net amount of assets | |
Futures – variation margin | | JPMorgan | | $229,718 | | $ | 0 | | | $ | 0 | | | $ | 229,718 | |
7. BANK BORROWINGS
The Trust (excluding the money market funds and certain other funds in the Trust) and Wells Fargo Variable Trust are parties to a $150,000,000 revolving credit agreement, whereby the Fund is permitted to use bank borrowings for temporary or emergency purposes, such as to fund shareholder redemption requests. Interest under the credit agreement is charged to the Fund based on a borrowing rate equal to the higher of the Federal Funds rate in effect on that day plus 1.25% or the overnight LIBOR rate in effect on that day plus 1.25%. In addition, an annual commitment fee equal to 0.10% of the unused balance is allocated to each participating fund. For the year ended August 31, 2015, the Fund paid $ 2,024 in commitment fees.
For the year ended August 31, 2015, there were no borrowings by the Fund under the agreement.
8. DISTRIBUTIONS TO SHAREHOLDERS
The tax character of distributions paid during the years ended August 31, 2015 and August 31, 2014, were as follows:
| | | | | | | | |
| | | Year ended August 31 | |
| | | 2015 | | | 2014 | |
Ordinary income | | $ | 15,630,984 | | | $ | 17,619,484 | |
Tax basis return of capital | | | 2,120,014 | | | | 0 | |
As of August 31, 2015, the components of distributable earnings on a tax basis were as follows:
| | | | |
Unrealized losses | | Post-October
capital losses deferred | | Capital loss carryforward |
| $(3,484,886) | | $(5,025,389) | | $(82,782,992) |
| | | | | | |
| Notes to financial statements | | Wells Fargo Advantage Ultra Short-Term Income Fund | | | 37 | |
9. INDEMNIFICATION
Under the Trust’s organizational documents, the officers and Trustees have been granted certain indemnification rights against certain liabilities that may arise out of performance of their duties to the Trust. Additionally, in the normal course of business, the Trust may enter into contracts with service providers that contain a variety of indemnification clauses. The Trust’s maximum exposure under these arrangements is dependent on future claims that may be made against the Fund and, therefore, cannot be estimated.
| | | | |
| 38 | | Wells Fargo Advantage Ultra Short-Term Income Fund | | Report of independent registered public accounting firm |
BOARD OF TRUSTEES AND SHAREHOLDERS OF WELLS FARGO FUNDS TRUST:
We have audited the accompanying statement of assets and liabilities, including the portfolio of investments, of the Wells Fargo Advantage Ultra Short-Term Income Fund (the “Fund”), one of the funds constituting the Wells Fargo Funds Trust, as of August 31, 2015, and the related statement of operations for the year then ended, the statements of changes in net assets for each of the years in the two-year period then ended, and the financial highlights for each of the years in the five-year period then ended. These financial statements and financial highlights are the responsibility of the Fund’s management. Our responsibility is to express an opinion on these financial statements and financial highlights based on our audits.
We conducted our audits in accordance with the standards of the Public Company Accounting Oversight Board (United States). Those standards require that we plan and perform the audit to obtain reasonable assurance about whether the financial statements and financial highlights are free of material misstatement. An audit includes examining, on a test basis, evidence supporting the amounts and disclosures in the financial statements. Our procedures included confirmation of securities owned as of August 31, 2015, by correspondence with the custodian and brokers, or by other appropriate auditing procedures. An audit also includes assessing the accounting principles used and significant estimates made by management, as well as evaluating the overall financial statement presentation. We believe that our audits provide a reasonable basis for our opinion.
In our opinion, the financial statements and financial highlights referred to above present fairly, in all material respects, the financial position of the Wells Fargo Advantage Ultra Short-Term Income Fund as of August 31, 2015, the results of its operations for the year then ended, the changes in its net assets for each of the years in the two-year period then ended, and the financial highlights for each of the years in the five-year period then ended, in conformity with U.S. generally accepted accounting principles.

Boston, Massachusetts
October 26, 2015
| | | | | | |
| Other information (unaudited) | | Wells Fargo Advantage Ultra Short-Term Income Fund | | | 39 | |
TAX INFORMATION
For the fiscal year ended August 31, 2015, $13,418,963 has been designated as interest-related dividends for nonresident alien shareholders pursuant to Section 871 of the Internal Revenue Code.
PROXY VOTING INFORMATION
A description of the policies and procedures that the Fund uses to determine how to vote proxies relating to portfolio securities is available, upon request, by calling 1-800-222-8222, visiting our website at wellsfargoadvantagefunds.com, or visiting the SEC website at sec.gov. Information regarding how the Fund voted proxies relating to portfolio securities during the most recent 12-month period ended June 30 is available on the Fund’s website at wellsfargoadvantagefunds.com or by visiting the SEC website at sec.gov.
PORTFOLIO HOLDINGS INFORMATION
The complete portfolio holdings for the Fund are publicly available monthly on the Fund’s website (wellsfargoadvantagefunds.com), on a one-month delayed basis. In addition, top ten holdings information (excluding derivative positions) for the Fund is publicly available on the Fund’s website on a monthly, seven-day or more delayed basis. The Fund files its complete schedule of portfolio holdings with the SEC for the first and third quarters of each fiscal year on Form N-Q, which is available by visiting the SEC website at sec.gov. In addition, the Fund’s Form N-Q may be reviewed and copied at the SEC’s Public Reference Room in Washington, DC, and at regional offices in New York City, at 233 Broadway, and in Chicago, at 175 West Jackson Boulevard, Suite 900. Information about the Public Reference Room may be obtained by calling 1-800-SEC-0330.
| | | | |
| 40 | | Wells Fargo Advantage Ultra Short-Term Income Fund | | Other information (unaudited) |
BOARD OF TRUSTEES AND OFFICERS
Each of the Trustees and Officers1 listed in the table below acts in identical capacities for each fund in the Wells Fargo Advantage family of funds, which consists of 133 mutual funds comprising the Wells Fargo Funds Trust, Wells Fargo Variable Trust, Wells Fargo Master Trust and four closed-end funds (collectively the “Fund Complex”). This table should be read in conjunction with the Prospectus and the Statement of Additional Information2. The mailing address of each Trustee and Officer is 525 Market Street, 12th Floor, San Francisco, CA 94105. Each Trustee and Officer serves an indefinite term, however, each Trustee serves such term until reaching the mandatory retirement age established by the Trustees.
Independent Trustees
| | | | | | |
Name and
year of birth | | Position held and
length of service* | | Principal occupations during past five years or longer | | Other
public company or
investment company
directorships during
past 5 years |
William R. Ebsworth
(Born 1957) | | Trustee, since 2015** | | Retired. From 1984 to 2013, equities analyst, portfolio manager, research director at Fidelity Management and Research Company and retired in 2013 as Chief Investment Officer of Fidelity Strategic Advisers, Inc. in Boston, Tokyo, and Hong Kong where he led a team of investment professionals managing client assets. Prior thereto, Board member of Hong Kong Securities Clearing Co., Hong Kong Options Clearing Corp., the Thailand International Fund, Ltd., Fidelity Investments Life Insurance Company, and Empire Fidelity Investments Life Insurance Company.
Mr. Ebsworth is a CFA ® charterholder and an Adjunct Lecturer, Finance, at Babson College. | | Asset Allocation Trust |
Jane A. Freeman
(Born 1953) | | Trustee, since 2015** | | Retired. From 2012 to 2014 and 1999 to 2008, Chief Financial Officer of Scientific Learning Corporation. From 2008 to 2012, Ms. Freeman provided consulting services related to strategic business projects. Prior to 1999, Portfolio Manager at Rockefeller & Co. and Scudder, Stevens & Clark. Board member of the Harding Loevner Funds from 1996 to 2014, serving as both Lead Independent Director and chair of the Audit Committee. Board member of the Russell Exchange Traded Funds Trust from 2011 to 2012 and the chair of the Audit Committee. Ms. Freeman is Chair of Taproot Foundation (non-profit organization) (non-profit organization), a Board Member of Ruth Bancroft Garden (non-profit organization) and an inactive chartered financial analyst. | | Asset Allocation Trust; Harding Loevner Funds; Russell Exchange Traded Funds Trust |
Peter G. Gordon
(Born 1942) | | Trustee, since 1998; Chairman, since 2005 | | Co-Founder, Retired Chairman, President and CEO of Crystal Geyser Water Company. Trustee Emeritus, Colby College. | | Asset Allocation Trust |
Isaiah Harris, Jr.
(Born 1952) | | Trustee, since 2009 | | Retired. Chairman of the Board of CIGNA Corporation since 2009, and Director since 2005. From 2003 to 2011, Director of Deluxe Corporation. Prior thereto, President and CEO of BellSouth Advertising and Publishing Corp. from 2005 to 2007, President and CEO of BellSouth Enterprises from 2004 to 2005 and President of BellSouth Consumer Services from 2000 to 2003. Emeritus member of the Iowa State University Foundation Board of Governors. Emeritus Member of the Advisory Board of Iowa State University School of Business. Advisory Board Member, Palm Harbor Academy (charter school). Mr. Harris is a certified public accountant. | | CIGNA Corporation; Asset Allocation Trust |
Judith M. Johnson
(Born 1949) | | Trustee, since 2008; Audit Committee Chairman, since 2008 | | Retired. Prior thereto, Chief Executive Officer and Chief Investment Officer of Minneapolis Employees Retirement Fund from 1996 to 2008.
Ms. Johnson is an attorney, certified public accountant and a certified managerial accountant. | | Asset Allocation Trust |
David F. Larcker
(Born 1950) | | Trustee, since 2009 | | James Irvin Miller Professor of Accounting at the Graduate School of Business, Stanford University, Morgan Stanley Director of the Center for Leadership Development and Research and Senior Faculty of The Rock Center for Corporate Governance since 2006. From 2005 to 2008, Professor of Accounting at the Graduate School of Business, Stanford University. Prior thereto, Ernst & Young Professor of Accounting at The Wharton School, University of Pennsylvania from 1985 to 2005. | | Asset Allocation Trust |
| Olivia S. Mitchell (Born 1953) | | Trustee, since 2006 | | International Foundation of Employee Benefit Plans Professor, Wharton School of the University of Pennsylvania since 1993. Director of Wharton’s Pension Research Council and Boettner Center on Pensions & Retirement Research, and Research Associate at the National Bureau of Economic Research. Previously, Cornell University Professor from 1978 to 1993. | | Asset Allocation Trust |
| | | | | | |
| Other information (unaudited) | | Wells Fargo Advantage Ultra Short-Term Income Fund | | | 41 | |
| | | | | | |
Name and
year of birth | | Position held and
length of service* | | Principal occupations during past five years or longer | | Other
public company or
investment company
directorships during
past 5 years |
| Timothy J. Penny (Born 1951) | | Trustee, since 1996 | | President and Chief Executive Officer of Southern Minnesota Initiative Foundation, a non-profit organization, since 2007 and Senior Fellow at the Humphrey Institute Policy Forum at the University of Minnesota since 1995. Member of the Board of Trustees of NorthStar Education Finance, Inc., a non-profit organization, since 2007. | | Asset Allocation Trust |
| Michael S. Scofield (Born 1943) | | Trustee, since 2010 | | Served on the Investment Company Institute’s Board of Governors and Executive Committee from 2008-2011 as well the Governing Council of the Independent Directors Council from 2006-2011 and the Independent Directors Council Executive Committee from 2008-2011. Chairman of the IDC from 2008-2010. Institutional Investor (Fund Directions) Trustee of Year in 2007. Trustee of the Evergreen Funds complex (and its predecessors) from 1984 to 2010. Chairman of the Evergreen Funds from 2000-2010. Former Trustee of the Mentor Funds. Retired Attorney, Law Offices of Michael S. Scofield. | | Asset Allocation Trust |
| Donald C. Willeke (Born 1940) | | Trustee, since 1996 | | Principal of the law firm of Willeke & Daniels. General Counsel of the Minneapolis Employees Retirement Fund from 1984 until its consolidation into the Minnesota Public Employees Retirement Association on June 30, 2010. Director and Vice Chair of The Tree Trust (non-profit corporation). Director of the American Chestnut Foundation (non-profit corporation). | | Asset Allocation Trust |
| * | Length of service dates reflect the Trustee’s commencement of service with the Trust’s predecessor entities, where applicable. |
| ** | William R. Ebsworth and Jane A. Freeman each became a Trustee effective January 1, 2015. |
Officers
| | | | | | |
Name and year of birth | | Position held and length of service | | Principal occupations during past five years or longer | | |
Karla M. Rabusch
(Born 1959) | | President, since 2003 | | Executive Vice President of Wells Fargo Bank, N.A. and President of Wells Fargo Funds Management, LLC since 2003. | | |
Nancy Wiser1
(Born 1967) | | Treasurer, since 2012 | | Executive Vice President of Wells Fargo Funds Management, LLC since 2011. Chief Operating Officer and Chief Compliance Officer at LightBox Capital Management LLC, from 2008 to 2011. | | |
C. David Messman
(Born 1960) | | Secretary, since 2000; Chief Legal Officer, since 2003 | | Senior Vice President and Secretary of Wells Fargo Funds Management, LLC since 2001. Assistant General Counsel of Wells Fargo Bank, N.A. since 2013 and Vice President and Managing Counsel of Wells Fargo Bank N.A. from 1996 to 2013. | | |
Debra Ann Early
(Born 1964) | | Chief Compliance Officer, since 2007 | | Executive Vice President of Wells Fargo Funds Management, LLC since 2014, Senior Vice President and Chief Compliance Officer from 2007 to 2014. | | |
David Berardi
(Born 1975) | | Assistant Treasurer, since 2009 | | Vice President of Wells Fargo Funds Management, LLC since 2009. Vice President of Evergreen Investment Management Company, LLC from 2008 to 2010. Manager of Fund Reporting and Control for Evergreen Investment Management Company, LLC from 2004 to 2010. | | |
Jeremy DePalma1
(Born 1974) | | Assistant Treasurer, since 2009 | | Senior Vice President of Wells Fargo Funds Management, LLC since 2009. Senior Vice President of Evergreen Investment Management Company, LLC from 2008 to 2010 and head of the Fund Reporting and Control Team within Fund Administration from 2005 to 2010. | | |
| 1 | Nancy Wiser acts as Treasurer of 72 funds in the Fund Complex. Jeremy DePalma acts as Treasurer of 61 funds and Assistant Treasurer of 72 funds in the Fund Complex. |
| 2 | The Statement of Additional Information includes additional information about the Trustees and is available, without charge, upon request, by calling 1-800-222-8222 or by visiting the website at wellsfargoadvantagefunds.com. |
| | | | |
| 42 | | Wells Fargo Advantage Ultra Short-Term Income Fund | | Other information (unaudited) |
BOARD CONSIDERATION OF INVESTMENT ADVISORY, INVESTMENT MANAGEMENT AND SUB-ADVISORY AGREEMENTS:
Under the Investment Company Act of 1940 (the “1940 Act”), the Board of Trustees (the “Board”) of Wells Fargo Funds Trust (the “Trust”) must determine annually whether to approve the continuation of the Trust’s investment advisory and sub-advisory agreements. In this regard, at an in-person meeting held on May 19-20, 2015 (the “Meeting”), the Board, all the members of which have no direct or indirect interest in the investment advisory and sub-advisory agreements and are not “interested persons” of the Trust, as defined in the 1940 Act (the “Independent Trustees”), reviewed and approved for Wells Fargo Advantage Ultra Short Term Income Fund (the “Fund”): (i) an investment advisory agreement (the “Advisory Agreement”) with Wells Fargo Funds Management, LLC (“Funds Management”); (ii) an investment management agreement (the “Management Agreement”) with Funds Management; and (iii) an investment sub-advisory agreement (the “Sub-Advisory Agreement”) with Wells Capital Management Incorporated (the “Sub-Adviser”), an affiliate of Funds Management. The Management Agreement combines the terms of the Advisory Agreement with the terms of the Fund’s Amended and Restated Administration Agreement (the “Administration Agreement”) applicable to Fund-level administrative services. The Advisory Agreement, the Management Agreement and the Sub-Advisory Agreement are collectively referred to as the “Advisory Agreements.”
At the Meeting, the Board considered the factors and reached the conclusions described below relating to the selection of Funds Management and the Sub-Adviser and the approval of the Advisory Agreements. Prior to the Meeting, including at an in-person meeting in March 2015, the Trustees conferred extensively among themselves and with representatives of Funds Management about these matters. Also, the Board has adopted a team-based approach, with each team consisting of a sub-set of Trustees, to assist the full Board in the discharge of its duties in reviewing performance and other matters throughout the year. The Independent Trustees were assisted in their evaluation of the Advisory Agreements by independent legal counsel, from whom they received separate legal advice and with whom they met separately.
In providing information to the Board, Funds Management and the Sub-Adviser were guided by a detailed set of requests for information submitted to them by independent legal counsel on behalf of the Independent Trustees at the start of the Board’s annual contract renewal process earlier in 2015. In considering and approving the Advisory Agreements, the Trustees considered the information they believed relevant, including but not limited to the information discussed below. The Board considered not only the specific information presented in connection with the Meeting, but also the knowledge gained over time through interaction with Funds Management and the Sub-Adviser about various topics. In this regard, the Board reviewed reports of Funds Management at each of its quarterly meetings, which included, among other things, portfolio reviews and performance reports. In addition, the Board and the teams mentioned above confer with portfolio managers at various times throughout the year. The Board did not identify any particular information or consideration that was all-important or controlling, and each individual Trustee may have attributed different weights to various factors.
After its deliberations, the Board unanimously approved the continuation of the Advisory Agreement for the period from June 1, 2015 through June 30, 2015, approved the Management Agreement for the period from July 1, 2015 through May 31, 2016, and approved the continuation of the Sub-Advisory Agreement for a one-year term through May 31, 2016. The Board also determined that the compensation payable to Funds Management and the Sub-Adviser under each of the Advisory Agreements was reasonable. The Board considered the approval of the Advisory Agreements for the Fund as part of its consideration of agreements for funds across the complex, but its approvals were made on a fund-by-fund basis. The following summarizes a number of important, but not necessarily all, factors considered by the Board in support of its approvals.
Nature, extent and quality of services
The Board received and considered various information regarding the nature, extent and quality of services provided to the Fund by Funds Management and the Sub-Adviser under the Advisory Agreements. This information included, among other things, a summary of the background and experience of senior management of Funds Management, and the qualifications, background, tenure and responsibilities of each of the portfolio managers primarily responsible for the day-to-day portfolio management of the Fund. The Board noted that the services to be provided to the Fund pursuant to the Management Agreement combined the advisory services previously provided to the Fund pursuant to the Fund’s Advisory Agreement with the Fund-level administrative services previously provided to the Fund pursuant to the Fund’s Administration Agreement. The Board received a representation from Funds Management that combining these services would not result in any change to the nature or level of services provided by Funds Management to the Fund.
The Board evaluated the ability of Funds Management and the Sub-Adviser to attract and retain qualified investment professionals, including research, advisory and supervisory personnel. The Board further considered the compliance
| | | | | | |
| Other information (unaudited) | | Wells Fargo Advantage Ultra Short-Term Income Fund | | | 43 | |
programs and compliance records of Funds Management and the Sub-Adviser. In addition, the Board took into account the full range of services provided to the Fund by Funds Management and its affiliates.
Fund performance and expenses
The Board considered the performance results for the Fund over various time periods ended March 31, 2015. The Board considered these results in comparison to the performance of funds in a universe that was determined by Lipper Inc. (“Lipper”) to be similar to the Fund (the “Universe”), and in comparison to the Fund’s benchmark index and to other comparative data. Lipper is an independent provider of investment company data. The Board received a description of the methodology used by Lipper to select the mutual funds in the performance Universe. The Board noted that the performance of the Fund (Administrator Class) was higher than or in range of the average performance of the Universe for all periods under review except the one-year period. The Board also noted that the performance of the Fund was higher than or equal to its benchmark, the Barclays Short-Term Government/Corporate Index, for all periods under review.
The Board also received and considered information regarding the Fund’s net operating expense ratios and their various components, including actual management fees (which reflect fee waivers, if any, and include advisory, administration and transfer agent fees), custodian and other non-management fees, and Rule 12b-1 and non-Rule 12b-1 service fees. The Board considered these ratios in comparison to the median ratios of funds in class-specific expense groups that were determined by Lipper to be similar to the Fund (the “Groups”). The Board received a description of the methodology used by Lipper to select the mutual funds in the expense Groups and an explanation of how funds comprising expense groups and their expense ratios may vary from year-to-year. Based on the Lipper reports, the Board noted that the net operating expense ratios of the Fund were lower than, equal to or in range of the median net operating expense ratios of the expense Groups.
The Board took into account the Fund performance and expense information provided to it among the factors considered in deciding to re-approve the Advisory Agreement and Sub-Advisory Agreement and approve the Management Agreement.
Investment advisory and sub-advisory fee rates
The Board reviewed and considered the contractual investment advisory fee rates that are payable by the Fund to Funds Management for investment advisory services (the “Advisory Agreement Rates”), both on a stand-alone basis and on a combined basis with the Fund’s fund-level and class-level contractual administration fee rates (the “Management Rates”). The Board noted that the Management Rates include transfer agency and sub-transfer agency costs. The Board also noted that the fee rate to be paid by the Fund under the Management Agreement will incorporate the advisory fee and Fund-level administration fee previously payable separately by the Fund under the Fund’s Advisory Agreement and Administration Agreement with Funds Management. The Board also reviewed and considered the contractual investment sub-advisory fee rates that are payable by Funds Management to the Sub-Adviser for investment sub-advisory services (the “Sub-Advisory Agreement Rates”).
Among other information reviewed by the Board was a comparison of the Management Rates of the Fund with those of other funds in the expense Groups at a common asset level. The Board noted that the Management Rates of the Fund were in range of the average rates for the Fund’s expense Groups for all share classes.
The Board also received and considered information about the portion of the total advisory fee that was retained by Funds Management after payment of the fee to the Sub-Adviser for sub-advisory services. In assessing the reasonableness of this amount, the Board received and evaluated information about the nature and extent of responsibilities retained and risks assumed by Funds Management and not delegated to or assumed by the Sub-Adviser, and about Funds Management’s on-going oversight services. However, given the affiliation between Funds Management and the Sub-Adviser, the Board ascribed limited relevance to the allocation of the advisory fee between them.
The Board also received and considered information about the nature and extent of services offered and fee rates charged by Funds Management and the Sub-Adviser to other types of clients with investment strategies similar to those of the Fund. In this regard, the Board received information about the significantly greater scope of services, and compliance, reporting and other legal burdens and risks of managing mutual funds compared with those associated with managing assets of non-mutual fund clients such as collective funds or institutional separate accounts.
Based on its consideration of the factors and information it deemed relevant, including those described here, the Board determined that the compensation payable to Funds Management under the Management Agreement and Advisory Agreement and to the Sub-Adviser under the Sub-Advisory Agreement was reasonable, in light of the services covered by the Advisory Agreements.
| | | | |
| 44 | | Wells Fargo Advantage Ultra Short-Term Income Fund | | Other information (unaudited) |
Profitability
The Board received and considered information concerning the profitability of Funds Management, as well as the profitability of Wells Fargo as a whole, from providing services to the Fund and the fund family as a whole. The Board also received and considered information concerning the profitability of the Sub-Adviser from providing services to the fund family as a whole, noting that the Sub-Adviser’s profitability information with respect to providing services to the Fund was subsumed in the Wells Fargo profitability analysis.
Funds Management reported on the methodologies and estimates used in calculating profitability. Among other things, the Board noted that the levels of profitability reported on a fund-by-fund basis varied widely, depending on factors such as the size and type of fund. Based on its review, the Board did not deem the profits reported by Funds Management or Wells Fargo from its services to the Fund to be at a level that would prevent it from approving the continuation of the Advisory Agreements.
Economies of scale
With respect to possible economies of scale, the Board noted the existence of breakpoints in the Fund’s advisory and management fee structures, and the Fund’s administration fee structure, which operate generally to reduce the Fund’s expense ratios as the Fund grows in size. It considered that, for a small fund or a fund that shrinks in size, breakpoints conversely can result in higher fee levels. The Board also considered that fee waiver and expense reimbursement arrangements and competitive fee rates at the outset are means of sharing potential economies of scale with shareholders of the Fund and the fund family as a whole. The Board considered Funds Management’s view that any analyses of potential economies of scale in managing a particular fund are inherently limited in light of the joint and common costs and investments that Funds Management incurs across the fund family as a whole.
The Board concluded that the Fund’s fee and expense arrangements, including contractual breakpoints, constituted a reasonable approach to sharing potential economies of scale with the Fund and its shareholders.
Other benefits to Funds Management and the Sub-Adviser
The Board received and considered information regarding potential “fall-out” or ancillary benefits received by Funds Management and its affiliates, including the Sub-Adviser, as a result of their relationships with the Fund. Ancillary benefits could include, among others, benefits directly attributable to other relationships with the Fund and benefits potentially derived from an increase in Funds Management’s and the Sub-Adviser’s business as a result of their relationships with the Fund. The Board noted that various affiliates of Funds Management may receive distribution-related fees, shareholder servicing payments and sub-transfer agency fees in respect of shares sold or held through them and services provided.
The Board also reviewed information about soft dollar credits earned and utilized by the Sub-Adviser, fees earned by Funds Management and the Sub-Adviser from managing a private investment vehicle for the fund family’s securities lending collateral and commissions earned by an affiliated broker from portfolio transactions.
Based on its consideration of the factors and information it deemed relevant, including those described here, the Board did not find that any ancillary benefits received by Funds Management and its affiliates, including the Sub-Adviser, were unreasonable.
Conclusion
At the Meeting, after considering the above-described factors and based on its deliberations and its evaluation of the information described above, the Board unanimously approved the continuation of the Advisory Agreement for the period from June 1, 2015 through June 30, 2015, approved the Management Agreement for the period from July 1, 2015 through May 31, 2016, and approved the continuation of the Sub-Advisory Agreement for a one-year term through May 31, 2016. The Board also determined that the compensation payable to Funds Management and the Sub-Adviser under each of the Advisory Agreements was reasonable.
| | | | | | |
| List of abbreviations | | Wells Fargo Advantage Ultra Short-Term Income Fund | | | 45 | |
The following is a list of common abbreviations for terms and entities that may have appeared in this report.
| ACA | — ACA Financial Guaranty Corporation |
| ADR | — American depositary receipt |
| ADS | — American depositary shares |
| AGC | — Assured Guaranty Corporation |
| AGM | — Assured Guaranty Municipal |
| Ambac | — Ambac Financial Group Incorporated |
| AMT | — Alternative minimum tax |
| BAN | — Bond anticipation notes |
| BHAC | — Berkshire Hathaway Assurance Corporation |
| CAB | — Capital appreciation bond |
| CCAB | — Convertible capital appreciation bond |
| CDA | — Community Development Authority |
| CDO | — Collateralized debt obligation |
| DRIVER | — Derivative inverse tax-exempt receipts |
| DW&P | — Department of Water & Power |
| DWR | — Department of Water Resources |
| ECFA | — Educational & Cultural Facilities Authority |
| EDA | — Economic Development Authority |
| EDFA | — Economic Development Finance Authority |
| ETF | — Exchange-traded fund |
| FDIC | — Federal Deposit Insurance Corporation |
| FFCB | — Federal Farm Credit Banks |
| FGIC | — Financial Guaranty Insurance Corporation |
| FHA | — Federal Housing Administration |
| FHLB | — Federal Home Loan Bank |
| FHLMC | — Federal Home Loan Mortgage Corporation |
| FICO | — The Financing Corporation |
| FNMA | — Federal National Mortgage Association |
| GDR | — Global depositary receipt |
| GNMA | — Government National Mortgage Association |
| HCFR | — Healthcare facilities revenue |
| HEFA | — Health & Educational Facilities Authority |
| HEFAR | — Higher education facilities authority revenue |
| HFA | — Housing Finance Authority |
| HFFA | — Health Facilities Financing Authority |
| HUD | — Department of Housing and Urban Development |
| IDA | — Industrial Development Authority |
| IDAG | — Industrial Development Agency |
| KRW | — Republic of Korea won |
| LIBOR | — London Interbank Offered Rate |
| LIFER | — Long Inverse Floating Exempt Receipts |
| LLC | — Limited liability company |
| LLLP | — Limited liability limited partnership |
| LLP | — Limited liability partnership |
| MBIA | — Municipal Bond Insurance Association |
| MFHR | — Multifamily housing revenue |
| MSTR | — Municipal securities trust receipts |
| MUD | — Municipal Utility District |
| National | — National Public Finance Guarantee Corporation |
| PCFA | — Pollution Control Financing Authority |
| PCL | — Public Company Limited |
| PCR | — Pollution control revenue |
| PFA | — Public Finance Authority |
| PFFA | — Public Facilities Financing Authority |
| PFOTER | — Puttable floating option tax-exempt receipts |
| plc | — Public limited company |
| PUTTER | — Puttable tax-exempt receipts |
| R&D | — Research & development |
| Radian | — Radian Asset Assurance |
| RAN | — Revenue anticipation notes |
| RDA | — Redevelopment Authority |
| RDFA | — Redevelopment Finance Authority |
| REIT | — Real estate investment trust |
| ROC | — Reset option certificates |
| SAVRS | — Select auction variable rate securities |
| SBA | — Small Business Authority |
| SDR | — Swedish depositary receipt |
| SFHR | — Single-family housing revenue |
| SFMR | — Single-family mortgage revenue |
| SPA | — Standby purchase agreement |
| SPDR | — Standard & Poor’s Depositary Receipts |
| SPEAR | — Short Puttable Exempt Adjustable Receipts |
| STRIPS | — Separate trading of registered interest and |
| TAN | — Tax anticipation notes |
| TIPS | — Treasury inflation-protected securities |
| TRAN | — Tax revenue anticipation notes |
| TTFA | — Transportation Trust Fund Authority |
| TVA | — Tennessee Valley Authority |
This page is intentionally left blank.
This page is intentionally left blank.
This page is intentionally left blank.


For more information
More information about Wells Fargo Advantage Funds is available free upon request. To obtain literature, please write, email, visit the Fund’s website, or call:
Wells Fargo Advantage Funds
P.O. Box 8266
Boston, MA 02266-8266
Email: wfaf@wellsfargo.com
Website: wellsfargoadvantagefunds.com
Individual investors: 1-800-222-8222
Retail investment professionals: 1-888-877-9275
Institutional investment professionals: 1-866-765-0778
This report and the financial statements contained herein are submitted for the general information of the shareholders of Wells Fargo Advantage Funds. If this report is used for promotional purposes, distribution of the report must be accompanied or preceded by a current prospectus. Before investing, please consider the investment objectives, risks, charges, and expenses of the investment. For a current prospectus and, if available, a summary prospectus, containing this information, call 1-800-222-8222 or visit the Fund’s website at wellsfargoadvantagefunds.com. Read the prospectus carefully before you invest or send money.
Wells Fargo Funds Management, LLC, a wholly owned subsidiary of Wells Fargo & Company, provides investment advisory and administrative services for Wells Fargo Advantage Funds. Other affiliates of Wells Fargo & Company provide subadvisory and other services for the Funds. The Funds are distributed by Wells Fargo Funds Distributor, LLC, Member FINRA, an affiliate of Wells Fargo & Company.
NOT FDIC INSURED ¡ NO BANK GUARANTEE ¡ MAY LOSE VALUE
© 2015 Wells Fargo Funds Management, LLC. All rights reserved.
| | |
 | | 236809 10-15 A223/AR223 08-15 |
ITEM 2. CODE OF ETHICS
(a) As of the end of the period covered by the report, Wells Fargo Funds Trust has adopted a code of ethics that applies to its President and Treasurer. A copy of the code of ethics is filed as an exhibit to this Form N-CSR.
(c) During the period covered by this report, there were no amendments to the provisions of the code of ethics adopted in Item 2(a) above.
(d) During the period covered by this report, there were no implicit or explicit waivers to the provisions of the code of ethics adopted in Item 2(a) above.
ITEM 3. AUDIT COMMITTEE FINANCIAL EXPERT
The Board of Trustees of Wells Fargo Funds Trust has determined that Judith Johnson is an audit committee financial expert, as defined in Item 3 of Form N-CSR. Mrs. Johnson is independent for purposes of Item 3 of Form N-CSR.
ITEM 4. PRINCIPAL ACCOUNTANT FEES AND SERVICES
(a), (b), (c), (d) The following table presents aggregate fees billed in each of the last two fiscal years for services rendered to the Registrant by the Registrant’s principal accountant. These fees were billed to the registrant and were approved by the Registrant’s audit committee.
| | | | | | | | |
| | | Fiscal
year ended
August 31, 2015 | | | Fiscal
year ended
August 31, 2014 | |
Audit fees | | $ | 428,240 | | | $ | 428,240 | |
Audit-related fees | | | — | | | | — | |
Tax fees (1) | | | 41,050 | | | | 48,000 | |
All other fees | | | — | | | | — | |
| | | | | | | | |
| | $ | 469,290 | | | $ | 476,240 | |
| | | | | | | | |
| (1) | Tax fees consist of fees for tax compliance, tax advice, tax planning and excise tax. |
(e) The Chairman of the Audit Committees is authorized to pre-approve: (1) audit services for the mutual funds of Wells Fargo Funds Trust; (2) non-audit tax or compliance consulting or training services provided to the Funds by the independent auditors (“Auditors”) if the fees for any particular engagement are not anticipated to exceed $50,000; and (3) non-audit tax or compliance consulting or training services provided by the Auditors to a Fund’s investment adviser and its controlling entities (where pre-approval is required because the engagement relates directly to the operations and financial reporting of the Fund) if the fee to the Auditors for any particular engagement is not anticipated to exceed $50,000. For any such pre-approval sought from the Chairman, Management shall prepare a brief description of the proposed services. If the Chairman approves of such service, he or she shall sign the statement prepared by Management. Such written statement shall be presented to the full Committees at their next regularly scheduled meetings.
(f) Not applicable
(g) Not applicable
(h) Not applicable
ITEM 5. AUDIT COMMITTEE OF LISTED REGISTRANTS
Not applicable.
ITEM 6. INVESTMENTS
Wells Fargo Advantage Adjustable Rate Government Fund and Wells Fargo Advantage Government Securities Fund included a Summary Portfolio of Investments under Item 1. A Portfolio of Investments for each of Wells Fargo Advantage Adjustable Rate Government Fund and Wells Fargo Advantage Government Securities Fund is filed under this Item.
| | | | | | |
| Portfolio of investments—August 31, 2015 | | Wells Fargo Advantage Adjustable Rate Government Fund | | | 1 | �� |
| | | | | | | | | | | | | | | | |
| Security name | | Interest rate | | | Maturity date | | | Principal | | | Value | |
| | | | | | | | | | | | | | | | |
| | | | |
Agency Securities: 93.87% | | | | | | | | | | | | | | | | |
FDIC Series 2010-S2 Class 3A 144A± | | | 0.90 | % | | | 12-29-2045 | | | $ | 1,262,221 | | | $ | 1,265,279 | |
Federal Agricultural Mortgage Corporation Series 2000-A Class A ± | | | 38.26 | | | | 12-15-2039 | | | | 142,871 | | | | 143,578 | |
FHLMC ± | | | 0.93 | | | | 4-1-2030 | | | | 127,319 | | | | 129,240 | |
FHLMC ± | | | 1.47 | | | | 3-15-2024 | | | | 910,858 | | | | 916,915 | |
FHLMC ± | | | 1.79 | | | | 2-1-2037 | | | | 16,184 | | | | 16,994 | |
FHLMC ± | | | 1.88 | | | | 12-1-2017 | | | | 8,049 | | | | 8,130 | |
FHLMC ± | | | 1.88 | | | | 5-1-2018 | | | | 689 | | | | 691 | |
FHLMC ± | | | 1.88 | | | | 6-1-2018 | | | | 7,614 | | | | 7,671 | |
FHLMC ± | | | 1.88 | | | | 9-1-2018 | | | | 1,275 | | | | 1,299 | |
FHLMC ± | | | 1.88 | | | | 5-1-2019 | | | | 5,829 | | | | 5,840 | |
FHLMC ± | | | 1.93 | | | | 9-1-2016 | | | | 1,877 | | | | 1,905 | |
FHLMC ± | | | 1.93 | | | | 11-1-2016 | | | | 39,338 | | | | 39,799 | |
FHLMC ± | | | 1.93 | | | | 7-1-2018 | | | | 1,647 | | | | 1,703 | |
FHLMC ± | | | 1.93 | | | | 1-1-2019 | | | | 5,765 | | | | 5,821 | |
FHLMC ± | | | 1.93 | | | | 2-1-2019 | | | | 10,076 | | | | 10,145 | |
FHLMC ± | | | 1.93 | | | | 2-1-2035 | | | | 387,434 | | | | 405,221 | |
FHLMC ± | | | 1.94 | | | | 1-1-2030 | | | | 6,646 | | | | 6,841 | |
FHLMC ± | | | 1.94 | | | | 1-1-2030 | | | | 8,084 | | | | 8,185 | |
FHLMC ± | | | 1.94 | | | | 7-1-2030 | | | | 185,261 | | | | 193,350 | |
FHLMC ± | | | 1.94 | | | | 2-1-2037 | | | | 600,028 | | | | 626,038 | |
FHLMC ± | | | 2.02 | | | | 7-1-2034 | | | | 11,303,596 | | | | 11,963,007 | |
FHLMC ± | | | 2.04 | | | | 5-1-2028 | | | | 309,534 | | | | 325,117 | |
FHLMC ± | | | 2.07 | | | | 1-1-2037 | | | | 2,986,013 | | | | 3,146,086 | |
FHLMC ± | | | 2.07 | | | | 6-1-2037 | | | | 1,218,968 | | | | 1,286,279 | |
FHLMC ± | | | 2.09 | | | | 10-1-2030 | | | | 14,954 | | | | 15,601 | |
FHLMC ± | | | 2.11 | | | | 6-1-2024 | | | | 10,166 | | | | 10,211 | |
FHLMC ± | | | 2.11 | | | | 6-1-2020 | | | | 83,060 | | | | 85,489 | |
FHLMC ± | | | 2.11 | | | | 11-1-2034 | | | | 888,800 | | | | 943,213 | |
FHLMC ± | | | 2.12 | | | | 3-1-2018 | | | | 9,529 | | | | 9,753 | |
FHLMC ± | | | 2.12 | | | | 5-1-2035 | | �� | | 1,081,844 | | | | 1,150,961 | |
FHLMC ± | | | 2.13 | | | | 1-1-2023 | | | | 48,586 | | | | 51,804 | |
FHLMC ± | | | 2.14 | | | | 6-1-2020 | | | | 1,660 | | | | 1,667 | |
FHLMC ± | | | 2.14 | | | | 5-1-2020 | | | | 713 | | | | 716 | |
FHLMC ± | | | 2.17 | | | | 3-1-2025 | | | | 117,645 | | | | 123,752 | |
FHLMC ± | | | 2.18 | | | | 8-1-2018 | | | | 2,051 | | | | 2,091 | |
FHLMC ± | | | 2.19 | | | | 5-1-2020 | | | | 529 | | | | 543 | |
FHLMC ± | | | 2.21 | | | | 6-1-2035 | | | | 3,891,658 | | | | 4,117,570 | |
FHLMC ± | | | 2.22 | | | | 8-1-2035 | | | | 400,935 | | | | 414,798 | |
FHLMC ± | | | 2.23 | | | | 11-1-2030 | | | | 813,356 | | | | 835,324 | |
FHLMC ± | | | 2.24 | | | | 7-1-2030 | | | | 22,333 | | | | 22,585 | |
FHLMC ± | | | 2.25 | | | | 1-1-2030 | | | | 25,686 | | | | 26,822 | |
FHLMC ± | | | 2.25 | | | | 1-1-2035 | | | | 575,765 | | | | 612,122 | |
FHLMC ± | | | 2.25 | | | | 8-1-2036 | | | | 3,922,757 | | | | 4,161,995 | |
FHLMC ± | | | 2.27 | | | | 12-1-2035 | | | | 916,828 | | | | 971,056 | |
FHLMC ± | | | 2.27 | | | | 12-1-2036 | | | | 1,011,015 | | | | 1,079,331 | |
FHLMC ± | | | 2.27 | | | | 8-1-2033 | | | | 2,466,809 | | | | 2,618,816 | |
FHLMC ± | | | 2.28 | | | | 1-1-2024 | | | | 9,604 | | | | 9,645 | |
FHLMC ± | | | 2.28 | | | | 11-1-2035 | | | | 683,182 | | | | 728,513 | |
FHLMC ± | | | 2.29 | | | | 10-1-2037 | | | | 1,750,356 | | | | 1,857,441 | |
FHLMC ± | | | 2.30 | | | | 8-1-2034 | | | | 1,738,614 | | | | 1,844,866 | |
| | | | |
| 2 | | Wells Fargo Advantage Adjustable Rate Government Fund | | Portfolio of investments—August 31, 2015 |
| | | | | | | | | | | | | | | | |
| Security name | | Interest rate | | | Maturity date | | | Principal | | | Value | |
| | | | |
| Agency Securities (continued) | | | | | | | | | | | | |
FHLMC ± | | | 2.31 | % | | | 7-1-2017 | | | $ | 14,500 | | | $ | 14,567 | |
FHLMC ± | | | 2.31 | | | | 1-1-2022 | | | | 20,045 | | | | 20,601 | |
FHLMC ± | | | 2.31 | | | | 7-1-2024 | | | | 46,850 | | | | 47,093 | |
FHLMC ± | | | 2.31 | | | | 6-1-2036 | | | | 3,907,587 | | | | 4,163,903 | |
FHLMC ± | | | 2.33 | | | | 10-1-2018 | | | | 12,333 | | | | 12,400 | |
FHLMC ± | | | 2.34 | | | | 6-1-2036 | | | | 1,499,600 | | | | 1,598,785 | |
FHLMC ± | | | 2.34 | | | | 12-1-2033 | | | | 1,311,936 | | | | 1,400,381 | |
FHLMC ± | | | 2.34 | | | | 10-1-2033 | | | | 1,319,607 | | | | 1,408,382 | |
FHLMC ± | | | 2.34 | | | | 10-1-2033 | | | | 2,494,940 | | | | 2,657,279 | |
FHLMC ± | | | 2.34 | | | | 10-1-2033 | | | | 582,932 | | | | 619,940 | |
FHLMC ± | | | 2.35 | | | | 10-1-2035 | | | | 3,402,845 | | | | 3,624,730 | |
FHLMC ± | | | 2.35 | | | | 6-1-2033 | | | | 657,827 | | | | 694,384 | |
FHLMC ± | | | 2.35 | | | | 2-1-2034 | | | | 1,287,652 | | | | 1,371,478 | |
FHLMC ± | | | 2.35 | | | | 1-1-2033 | | | | 1,110,526 | | | | 1,182,684 | |
FHLMC ± | | | 2.36 | | | | 2-1-2034 | | | | 1,145,980 | | | | 1,221,181 | |
FHLMC ± | | | 2.36 | | | | 12-1-2034 | | | | 841,641 | | | | 897,416 | |
FHLMC ± | | | 2.36 | | | | 5-1-2037 | | | | 3,920,628 | | | | 4,204,136 | |
FHLMC ± | | | 2.37 | | | | 8-1-2036 | | | | 4,091,276 | | | | 4,357,824 | |
FHLMC ± | | | 2.37 | | | | 12-1-2035 | | | | 4,049,042 | | | | 4,323,780 | |
FHLMC ± | | | 2.37 | | | | 1-1-2036 | | | | 2,843,416 | | | | 3,035,380 | |
FHLMC ± | | | 2.37 | | | | 12-1-2017 | | | | 1,655 | | | | 1,660 | |
FHLMC ± | | | 2.38 | | | | 10-1-2034 | | | | 2,997,381 | | | | 3,199,866 | |
FHLMC ± | | | 2.38 | | | | 4-1-2035 | | | | 560,578 | | | | 601,291 | |
FHLMC ± | | | 2.38 | | | | 1-1-2037 | | | | 397,457 | | | | 424,874 | |
FHLMC ± | | | 2.38 | | | | 5-1-2034 | | | | 156,097 | | | | 166,287 | |
FHLMC ± | | | 2.38 | | | | 2-1-2036 | | | | 2,145,622 | | | | 2,293,976 | |
FHLMC ± | | | 2.38 | | | | 7-1-2019 | | | | 1,453 | | | | 1,460 | |
FHLMC ± | | | 2.38 | | | | 4-1-2036 | | | | 1,013,307 | | | | 1,082,143 | |
FHLMC ± | | | 2.39 | | | | 9-1-2033 | | | | 426,419 | | | | 454,027 | |
FHLMC ± | | | 2.39 | | | | 7-1-2034 | | | | 257,775 | | | | 274,689 | |
FHLMC ± | | | 2.39 | | | | 9-1-2034 | | | | 5,750,029 | | | | 6,124,814 | |
FHLMC ± | | | 2.39 | | | | 12-1-2035 | | | | 3,458,840 | | | | 3,684,239 | |
FHLMC ± | | | 2.39 | | | | 4-1-2035 | | | | 3,999,727 | | | | 4,284,419 | |
FHLMC ± | | | 2.40 | | | | 7-1-2036 | | | | 686,752 | | | | 726,331 | |
FHLMC ± | | | 2.40 | | | | 1-1-2037 | | | | 2,222,751 | | | | 2,368,845 | |
FHLMC ± | | | 2.40 | | | | 11-1-2022 | | | | 304,642 | | | | 319,660 | |
FHLMC ± | | | 2.40 | | | | 5-1-2025 | | | | 98,425 | | | | 100,579 | |
FHLMC ± | | | 2.40 | | | | 4-1-2023 | | | | 385,429 | | | | 392,633 | |
FHLMC ± | | | 2.40 | | | | 11-1-2035 | | | | 1,952,431 | | | | 2,086,146 | |
FHLMC ± | | | 2.41 | | | | 1-1-2035 | | | | 612,828 | | | | 654,593 | |
FHLMC ± | | | 2.41 | | | | 3-1-2037 | | | | 2,637,198 | | | | 2,812,473 | |
FHLMC ± | | | 2.41 | | | | 5-1-2039 | | | | 2,506,012 | | | | 2,688,420 | |
FHLMC ± | | | 2.41 | | | | 11-1-2036 | | | | 1,887,342 | | | | 2,011,534 | |
FHLMC ± | | | 2.41 | | | | 1-1-2034 | | | | 1,354,322 | | | | 1,440,815 | |
FHLMC ± | | | 2.41 | | | | 2-1-2036 | | | | 2,206,127 | | | | 2,353,185 | |
FHLMC ± | | | 2.42 | | | | 4-1-2034 | | | | 4,451,160 | | | | 4,742,912 | |
FHLMC ± | | | 2.42 | | | | 2-1-2037 | | | | 723,943 | | | | 773,906 | |
FHLMC ± | | | 2.42 | | | | 2-1-2034 | | | | 993,410 | | | | 1,059,064 | |
FHLMC ± | | | 2.42 | | | | 3-1-2027 | | | | 154,155 | | | | 158,279 | |
FHLMC ± | | | 2.42 | | | | 4-1-2035 | | | | 4,821,070 | | | | 5,141,019 | |
| | | | | | |
| Portfolio of investments—August 31, 2015 | | Wells Fargo Advantage Adjustable Rate Government Fund | | | 3 | |
| | | | | | | | | | | | | | | | |
| Security name | | Interest rate | | | Maturity date | | | Principal | | | Value | |
| | | | |
Agency Securities (continued) | | | | | | | | | | | | | | | | |
FHLMC ± | | | 2.42 | % | | | 10-1-2036 | | | $ | 903,918 | | | $ | 965,518 | |
FHLMC ± | | | 2.42 | | | | 5-1-2037 | | | | 456,164 | | | | 486,502 | |
FHLMC ± | | | 2.42 | | | | 2-1-2034 | | | | 3,064,208 | | | | 3,281,174 | |
FHLMC ± | | | 2.42 | | | | 6-1-2026 | | | | 1,464,184 | | | | 1,542,009 | |
FHLMC ± | | | 2.42 | | | | 2-1-2035 | | | | 2,529,872 | | | | 2,704,018 | |
FHLMC ± | | | 2.42 | | | | 6-1-2035 | | | | 3,450,924 | | | | 3,675,596 | |
FHLMC ± | | | 2.43 | | | | 9-1-2035 | | | | 7,203,669 | | | | 7,663,631 | |
FHLMC ± | | | 2.43 | | | | 12-1-2032 | | | | 4,154,664 | | | | 4,414,780 | |
FHLMC ± | | | 2.43 | | | | 2-1-2036 | | | | 1,390,259 | | | | 1,481,555 | |
FHLMC ± | | | 2.43 | | | | 11-1-2036 | | | | 1,971,064 | | | | 2,100,792 | |
FHLMC ± | | | 2.43 | | | | 2-1-2036 | | | | 2,200,241 | | | | 2,341,508 | |
FHLMC ± | | | 2.43 | | | | 9-1-2038 | | | | 1,437,784 | | | | 1,534,651 | |
FHLMC ± | | | 2.44 | | | | 8-1-2035 | | | | 936,068 | | | | 996,862 | |
FHLMC ± | | | 2.44 | | | | 6-1-2036 | | | | 4,287,972 | | | | 4,575,974 | |
FHLMC ± | | | 2.44 | | | | 2-1-2036 | | | | 1,431,225 | | | | 1,523,447 | |
FHLMC ± | | | 2.44 | | | | 5-1-2038 | | | | 2,153,810 | | | | 2,294,764 | |
FHLMC ± | | | 2.44 | | | | 5-1-2038 | | | | 2,706,750 | | | | 2,878,288 | |
FHLMC ± | | | 2.44 | | | | 4-1-2036 | | | | 3,364,026 | | | | 3,593,205 | |
FHLMC ± | | | 2.44 | | | | 4-1-2037 | | | | 1,073,257 | | | | 1,144,698 | |
FHLMC ± | | | 2.44 | | | | 3-1-2034 | | | | 1,072,730 | | | | 1,141,490 | |
FHLMC ± | | | 2.44 | | | | 8-1-2035 | | | | 4,092,566 | | | | 4,359,593 | |
FHLMC ± | | | 2.44 | | | | 9-1-2035 | | | | 2,747,908 | | | | 2,925,391 | |
FHLMC ± | | | 2.45 | | | | 11-1-2029 | | | | 246,863 | | | | 256,484 | |
FHLMC ± | | | 2.45 | | | | 7-1-2031 | | | | 2,467,083 | | | | 2,600,061 | |
FHLMC ± | | | 2.45 | | | | 9-1-2036 | | | | 1,127,365 | | | | 1,202,225 | |
FHLMC ± | | | 2.45 | | | | 11-1-2027 | | | | 856,801 | | | | 910,891 | |
FHLMC ± | | | 2.45 | | | | 10-1-2036 | | | | 1,049,990 | | | | 1,117,177 | |
FHLMC ± | | | 2.45 | | | | 6-1-2037 | | | | 7,455,243 | | | | 7,949,431 | |
FHLMC ± | | | 2.45 | | | | 10-1-2035 | | | | 2,490,481 | | | | 2,647,387 | |
FHLMC ± | | | 2.45 | | | | 2-1-2035 | | | | 5,740,780 | | | | 6,126,882 | |
FHLMC ± | | | 2.45 | | | | 4-1-2038 | | | | 7,392,534 | | | | 7,884,172 | |
FHLMC ± | | | 2.45 | | | | 10-1-2034 | | | | 1,897,561 | | | | 2,021,986 | |
FHLMC ± | | | 2.46 | | | | 2-1-2036 | | | | 1,114,711 | | | | 1,187,444 | |
FHLMC ± | | | 2.46 | | | | 3-1-2034 | | | | 1,195,924 | | | | 1,276,578 | |
FHLMC ± | | | 2.46 | | | | 6-1-2019 | | | | 56,491 | | | | 57,268 | |
FHLMC ± | | | 2.46 | | | | 6-1-2037 | | | | 7,446,519 | | | | 7,957,377 | |
FHLMC ± | | | 2.46 | | | | 5-1-2034 | | | | 2,508,504 | | | | 2,656,365 | |
FHLMC ± | | | 2.46 | | | | 3-1-2037 | | | | 726,854 | | | | 776,199 | |
FHLMC ± | | | 2.47 | | | | 8-1-2035 | | | | 4,861,046 | | | | 5,178,462 | |
FHLMC ± | | | 2.47 | | | | 8-1-2027 | | | | 8,635 | | | | 8,784 | |
FHLMC ± | | | 2.47 | | | | 4-1-2037 | | | | 3,968,601 | | | | 4,241,630 | |
FHLMC ± | | | 2.47 | | | | 4-1-2035 | | | | 2,161,900 | | | | 2,327,602 | |
FHLMC ± | | | 2.47 | | | | 4-1-2038 | | | | 2,367,212 | | | | 2,521,103 | |
FHLMC ± | | | 2.47 | | | | 8-1-2033 | | | | 547,966 | | | | 583,625 | |
FHLMC ± | | | 2.48 | | | | 10-1-2033 | | | | 63,891 | | | | 64,611 | |
FHLMC ± | | | 2.48 | | | | 4-1-2034 | | | | 1,165,112 | | | | 1,244,405 | |
FHLMC ± | | | 2.48 | | | | 9-1-2030 | | | | 461,188 | | | | 483,535 | |
FHLMC ± | | | 2.48 | | | | 10-1-2036 | | | | 1,397,435 | | | | 1,492,835 | |
FHLMC ± | | | 2.48 | | | | 6-1-2035 | | | | 2,218,615 | | | | 2,367,537 | |
FHLMC ± | | | 2.48 | | | | 1-1-2038 | | | | 7,756,443 | | | | 8,315,691 | |
| | | | |
| 4 | | Wells Fargo Advantage Adjustable Rate Government Fund | | Portfolio of investments—August 31, 2015 |
| | | | | | | | | | | | | | | | |
| Security name | | Interest rate | | | Maturity date | | | Principal | | | Value | |
| | | | |
Agency Securities (continued) | | | | | | | | | | | | | | | | |
FHLMC ± | | | 2.48 | % | | | 5-1-2032 | | | $ | 73,578 | | | $ | 77,228 | |
FHLMC ± | | | 2.48 | | | | 5-1-2034 | | | | 2,976,452 | | | | 3,181,830 | |
FHLMC ± | | | 2.48 | | | | 1-1-2037 | | | | 4,326,222 | | | | 4,611,526 | |
FHLMC ± | | | 2.48 | | | | 5-1-2033 | | | | 268,767 | | | | 285,639 | |
FHLMC ± | | | 2.48 | | | | 4-1-2034 | | | | 918,034 | | | | 979,458 | |
FHLMC ± | | | 2.48 | | | | 5-1-2023 | | | | 78,753 | | | | 80,053 | |
FHLMC ± | | | 2.48 | | | | 2-1-2035 | | | | 1,620,677 | | | | 1,735,572 | |
FHLMC ± | | | 2.49 | | | | 1-1-2019 | | | | 439 | | | | 440 | |
FHLMC ± | | | 2.49 | | | | 11-1-2029 | | | | 184,626 | | | | 189,581 | |
FHLMC ± | | | 2.49 | | | | 11-1-2035 | | | | 2,000,774 | | | | 2,130,911 | |
FHLMC ± | | | 2.49 | | | | 7-1-2031 | | | | 378,016 | | | | 400,915 | |
FHLMC ± | | | 2.49 | | | | 4-1-2037 | | | | 1,060,889 | | | | 1,131,882 | |
FHLMC ± | | | 2.49 | | | | 9-1-2033 | | | | 972,502 | | | | 1,039,182 | |
FHLMC ± | | | 2.49 | | | | 1-1-2036 | | | | 1,115,863 | | | | 1,190,132 | |
FHLMC ± | | | 2.50 | | | | 10-1-2033 | | | | 2,956,215 | | | | 3,140,537 | |
FHLMC ± | | | 2.50 | | | | 5-1-2037 | | | | 504,181 | | | | 539,862 | |
FHLMC ± | | | 2.50 | | | | 3-1-2036 | | | | 1,402,324 | | | | 1,492,955 | |
FHLMC ± | | | 2.50 | | | | 6-1-2028 | | | | 186,106 | | | | 193,281 | |
FHLMC ± | | | 2.50 | | | | 6-1-2033 | | | | 1,875,740 | | | | 2,000,652 | |
FHLMC ± | | | 2.50 | | | | 5-1-2034 | | | | 666,796 | | | | 709,547 | |
FHLMC ± | | | 2.50 | | | | 7-1-2035 | | | | 3,830,123 | | | | 4,088,181 | |
FHLMC ± | | | 2.50 | | | | 5-1-2035 | | | | 4,015,217 | | | | 4,283,646 | |
FHLMC ± | | | 2.51 | | | | 12-1-2034 | | | | 5,601,651 | | | | 5,992,920 | |
FHLMC ± | | | 2.51 | | | | 1-1-2028 | | | | 25,613 | | | | 26,969 | |
FHLMC ± | | | 2.51 | | | | 9-1-2029 | | | | 1,096,500 | | | | 1,171,653 | |
FHLMC ± | | | 2.51 | | | | 4-1-2037 | | | | 816,444 | | | | 878,991 | |
FHLMC ± | | | 2.51 | | | | 2-1-2031 | | | | 1,106,469 | | | | 1,171,946 | |
FHLMC ± | | | 2.52 | | | | 9-1-2033 | | | | 1,471,922 | | | | 1,569,902 | |
FHLMC ± | | | 2.52 | | | | 9-1-2032 | | | | 2,837,559 | | | | 3,001,342 | |
FHLMC ± | | | 2.52 | | | | 6-1-2035 | | | | 2,571,039 | | | | 2,747,858 | |
FHLMC ± | | | 2.53 | | | | 4-1-2034 | | | | 5,252,394 | | | | 5,619,538 | |
FHLMC ± | | | 2.53 | | | | 4-1-2034 | | | | 948,814 | | | | 1,013,438 | |
FHLMC ± | | | 2.53 | | | | 6-1-2035 | | | | 3,157,889 | | | | 3,356,699 | |
FHLMC ± | | | 2.53 | | | | 6-1-2035 | | | | 855,618 | | | | 917,183 | |
FHLMC ± | | | 2.53 | | | | 3-1-2032 | | | | 1,184,483 | | | | 1,271,855 | |
FHLMC ± | | | 2.54 | | | | 9-1-2030 | | | | 10,080,026 | | | | 10,693,719 | |
FHLMC ± | | | 2.54 | | | | 4-1-2035 | | | | 1,509,352 | | | | 1,613,859 | |
FHLMC ± | | | 2.54 | | | | 1-1-2037 | | | | 1,665,638 | | | | 1,783,345 | |
FHLMC ± | | | 2.54 | | | | 1-1-2028 | | | | 5,384 | | | | 5,720 | |
FHLMC ± | | | 2.55 | | | | 5-1-2035 | | | | 661,758 | | | | 706,251 | |
FHLMC ± | | | 2.55 | | | | 12-1-2032 | | | | 888,174 | | | | 947,410 | |
FHLMC ± | | | 2.55 | | | | 4-1-2037 | | | | 2,055,143 | | | | 2,214,232 | |
FHLMC ± | | | 2.55 | | | | 12-1-2018 | | | | 16,991 | | | | 17,282 | |
FHLMC ± | | | 2.55 | | | | 6-1-2035 | | | | 660,223 | | | | 697,837 | |
FHLMC ± | | | 2.56 | | | | 6-1-2019 | | | | 82,206 | | | | 84,469 | |
FHLMC ± | | | 2.56 | | | | 2-1-2036 | | | | 223,928 | | | | 238,093 | |
FHLMC ± | | | 2.57 | | | | 7-1-2027 | | | | 806,816 | | | | 836,589 | |
FHLMC ± | | | 2.57 | | | | 2-1-2029 | | | | 250,230 | | | | 259,951 | |
FHLMC ± | | | 2.57 | | | | 10-1-2030 | | | | 2,642,054 | | | | 2,811,993 | |
FHLMC ± | | | 2.57 | | | | 9-1-2031 | | | | 80,548 | | | | 82,179 | |
| | | | | | |
| Portfolio of investments—August 31, 2015 | | Wells Fargo Advantage Adjustable Rate Government Fund | | | 5 | |
| | | | | | | | | | | | | | | | |
| Security name | | Interest rate | | | Maturity date | | | Principal | | | Value | |
| | | | |
Agency Securities (continued) | | | | | | | | | | | | | | | | |
FHLMC ± | | | 2.58 | % | | | 7-1-2034 | | | $ | 1,035,934 | | | $ | 1,101,329 | |
FHLMC ± | | | 2.58 | | | | 9-1-2038 | | | | 1,229,284 | | | | 1,315,348 | |
FHLMC ± | | | 2.58 | | | | 10-1-2029 | | | | 131,052 | | | | 135,119 | |
FHLMC ± | | | 2.60 | | | | 11-1-2032 | | | | 133,541 | | | | 137,293 | |
FHLMC ± | | | 2.60 | | | | 7-1-2036 | | | | 1,172,963 | | | | 1,256,824 | |
FHLMC ± | | | 2.60 | | | | 7-1-2038 | | | | 2,709,822 | | | | 2,901,508 | |
FHLMC ± | | | 2.60 | | | | 7-1-2037 | | | | 1,000,509 | | | | 1,062,866 | |
FHLMC ± | | | 2.61 | | | | 4-1-2038 | | | | 2,924,968 | | | | 3,143,581 | |
FHLMC ± | | | 2.61 | | | | 8-1-2029 | | | | 138,705 | | | | 142,089 | |
FHLMC ± | | | 2.61 | | | | 12-1-2018 | | | | 21,421 | | | | 21,616 | |
FHLMC ± | | | 2.63 | | | | 11-1-2018 | | | | 6,995 | | | | 7,016 | |
FHLMC ± | | | 2.65 | | | | 7-1-2029 | | | | 84,586 | | | | 88,651 | |
FHLMC ± | | | 2.65 | | | | 6-1-2030 | | | | 133,820 | | | | 137,449 | |
FHLMC ± | | | 2.65 | | | | 3-1-2025 | | | | 1,897,037 | | | | 1,971,675 | |
FHLMC ± | | | 2.66 | | | | 6-1-2029 | | | | 796,667 | | | | 839,639 | |
FHLMC ± | | | 2.67 | | | | 4-1-2029 | | | | 152,786 | | | | 156,340 | |
FHLMC ± | | | 2.67 | | | | 9-1-2029 | | | | 158,946 | | | | 163,361 | |
FHLMC ± | | | 2.68 | | | | 6-1-2025 | | | | 85,955 | | | | 87,660 | |
FHLMC ± | | | 2.68 | | | | 10-1-2024 | | | | 191,407 | | | | 202,146 | |
FHLMC ± | | | 2.68 | | | | 5-1-2036 | | | | 4,680,260 | | | | 5,020,770 | |
FHLMC ± | | | 2.69 | | | | 11-1-2029 | | | | 1,281,697 | | | | 1,369,314 | |
FHLMC ± | | | 2.69 | | | | 6-1-2030 | | | | 460,304 | | | | 482,802 | |
FHLMC ± | | | 2.70 | | | | 2-1-2024 | | | | 28,463 | | | | 28,679 | |
FHLMC ± | | | 2.71 | | | | 2-1-2036 | | | | 5,009,906 | | | | 5,385,657 | |
FHLMC ± | | | 2.72 | | | | 11-1-2029 | | | | 138,241 | | | | 144,043 | |
FHLMC ± | | | 2.72 | | | | 7-1-2034 | | | | 2,465,956 | | | | 2,631,400 | |
FHLMC ± | | | 2.73 | | | | 10-1-2025 | | | | 115,398 | | | | 118,479 | |
FHLMC ± | | | 2.73 | | | | 10-1-2025 | | | | 40,225 | | | | 40,536 | |
FHLMC ± | | | 2.73 | | | | 2-1-2030 | | | | 61,064 | | | | 62,052 | |
FHLMC ± | | | 2.73 | | | | 6-1-2030 | | | | 126,283 | | | | 129,868 | |
FHLMC ± | | | 2.73 | | | | 4-1-2020 | | | | 5,030 | | | | 5,067 | |
FHLMC ± | | | 2.73 | | | | 5-1-2028 | | | | 405,913 | | | | 424,725 | |
FHLMC ± | | | 2.75 | | | | 8-1-2030 | | | | 5,602,947 | | | | 5,991,240 | |
FHLMC ± | | | 2.75 | | | | 11-1-2026 | | | | 318,306 | | | | 331,596 | |
FHLMC ± | | | 2.77 | | | | 4-1-2019 | | | | 5,831 | | | | 5,896 | |
FHLMC ± | | | 2.78 | | | | 6-1-2022 | | | | 252 | | | | 254 | |
FHLMC ± | | | 2.78 | | | | 2-1-2018 | | | | 2,783 | | | | 2,818 | |
FHLMC ± | | | 2.80 | | | | 9-1-2030 | | | | 169,955 | | | | 174,691 | |
FHLMC ± | | | 2.85 | | | | 6-1-2032 | | | | 246,859 | | | | 253,961 | |
FHLMC ± | | | 2.88 | | | | 8-1-2019 | | | | 16,339 | | | | 16,448 | |
FHLMC ± | | | 2.90 | | | | 8-1-2029 | | | | 126,997 | | | | 132,271 | |
FHLMC ± | | | 2.92 | | | | 4-1-2032 | | | | 116,567 | | | | 119,863 | |
FHLMC ± | | | 2.94 | | | | 7-1-2018 | | | | 22,778 | | | | 23,018 | |
FHLMC ± | | | 2.99 | | | | 12-1-2025 | | | | 251,410 | | | | 261,166 | |
FHLMC ± | | | 3.06 | | | | 6-1-2021 | | | | 113,238 | | | | 116,059 | |
FHLMC ± | | | 3.06 | | | | 2-1-2027 | | | | 175,237 | | | | 177,475 | |
FHLMC ± | | | 3.26 | | | | 5-1-2031 | | | | 173,124 | | | | 182,907 | |
FHLMC ± | | | 3.27 | | | | 7-1-2028 | | | | 90,779 | | | | 91,684 | |
FHLMC ± | | | 3.38 | | | | 5-1-2032 | | | | 266,573 | | | | 277,133 | |
FHLMC ± | | | 3.48 | | | | 6-1-2035 | | | | 1,729,917 | | | | 1,833,039 | |
| | | | |
| 6 | | Wells Fargo Advantage Adjustable Rate Government Fund | | Portfolio of investments—August 31, 2015 |
| | | | | | | | | | | | | | | | |
| Security name | | Interest rate | | | Maturity date | | | Principal | | | Value | |
| | | | |
Agency Securities (continued) | | | | | | | | | | | | | | | | |
FHLMC ± | | | 3.49 | % | | | 12-1-2025 | | | $ | 711,548 | | | $ | 752,969 | |
FHLMC ± | | | 3.64 | | | | 11-1-2026 | | | | 156,000 | | | | 162,695 | |
FHLMC ± | | | 3.70 | | | | 8-1-2029 | | | | 10,939 | | | | 11,010 | |
FHLMC ± | | | 3.85 | | | | 4-1-2023 | | | | 144,902 | | | | 147,708 | |
FHLMC | | | 4.00 | | | | 12-15-2023 | | | | 130,048 | | | | 134,153 | |
FHLMC ± | | | 4.39 | | | | 2-1-2021 | | | | 33,489 | | | | 33,782 | |
FHLMC ± | | | 4.72 | | | | 8-1-2027 | | | | 76,088 | | | | 76,966 | |
FHLMC | | | 5.00 | | | | 10-1-2022 | | | | 25,820 | | | | 27,762 | |
FHLMC ± | | | 5.50 | | | | 8-1-2024 | | | | 520,532 | | | | 551,526 | |
FHLMC | | | 6.50 | | | | 4-1-2018 | | | | 57,268 | | | | 65,424 | |
FHLMC | | | 7.00 | | | | 9-1-2035 | | | | 70,415 | | | | 72,957 | |
FHLMC | | | 7.50 | | | | 1-1-2016 | | | | 206 | | | | 206 | |
FHLMC | | | 8.50 | | | | 5-1-2020 | | | | 55,130 | | | | 57,546 | |
FHLMC Series 0020 Class F ± | | | 1.20 | | | | 7-1-2029 | | | | 23,398 | | | | 23,447 | |
FHLMC Series 1671 Class QA ± | | | 1.61 | | | | 2-15-2024 | | | | 590,190 | | | | 607,738 | |
FHLMC Series 1686 Class FE ± | | | 1.76 | | | | 2-15-2024 | | | | 40,303 | | | | 41,355 | |
FHLMC Series 1730 Class FA ± | | | 1.72 | | | | 5-15-2024 | | | | 256,286 | | | | 249,477 | |
FHLMC Series 2315 Class FW ± | | | 0.75 | | | | 4-15-2027 | | | | 153,509 | | | | 155,621 | |
FHLMC Series 2391 Class EF ± | | | 0.70 | | | | 6-15-2031 | | | | 131,410 | | | | 133,104 | |
FHLMC Series 2454 Class SL ±(c) | | | 7.80 | | | | 3-15-2032 | | | | 281,216 | | | | 73,930 | |
FHLMC Series 2461 Class FI ± | | | 0.70 | | | | 4-15-2028 | | | | 193,695 | | | | 196,197 | |
FHLMC Series 2464 Class FE ± | | | 1.20 | | | | 3-15-2032 | | | | 183,289 | | | | 189,059 | |
FHLMC Series 2466 Class FV ± | | | 0.75 | | | | 3-15-2032 | | | | 339,215 | | | | 344,860 | |
FHLMC Series 2538 Class F ± | | | 0.80 | | | | 12-15-2032 | | | | 783,266 | | | | 794,758 | |
FHLMC Series 3001 Class EA ± | | | 0.55 | | | | 3-15-2035 | | | | 285,049 | | | | 285,817 | |
FHLMC Series 3335 Class FT ± | | | 0.35 | | | | 8-15-2019 | | | | 456,133 | | | | 455,878 | |
FHLMC Series 3436 Class A ± | | | 2.28 | | | | 11-15-2036 | | | | 602,431 | | | | 637,893 | |
FHLMC Series T-15 Class A6 ± | | | 0.59 | | | | 11-25-2028 | | | | 759,619 | | | | 754,687 | |
FHLMC Series T-16 Class A ± | | | 0.55 | | | | 6-25-2029 | | | | 1,928,262 | | | | 1,905,824 | |
FHLMC Series T-20 Class A7 ± | | | 0.50 | | | | 12-25-2029 | | | | 3,346,976 | | | | 3,297,739 | |
FHLMC Series T-21 Class A ± | | | 0.56 | | | | 10-25-2029 | | | | 1,765,698 | | | | 1,749,023 | |
FHLMC Series T-23 Class A ± | | | 0.48 | | | | 5-25-2030 | | | | 2,256,733 | | | | 2,230,223 | |
FHLMC Series T-27 Class A ± | | | 0.50 | | | | 10-25-2030 | | | | 1,453,321 | | | | 1,437,223 | |
FHLMC Series T-30 Class A7 ± | | | 0.44 | | | | 12-25-2030 | | | | 1,511,100 | | | | 1,458,464 | |
FHLMC Series T-35 Class A ± | | | 0.48 | | | | 9-25-2031 | | | | 4,278,934 | | | | 4,227,689 | |
FHLMC Series T-36 Class A ± | | | 0.50 | | | | 1-25-2032 | | | | 523,178 | | | | 519,575 | |
FHLMC Series T-48 Class 2A ± | | | 3.30 | | | | 7-25-2033 | | | | 3,058,432 | | | | 3,275,257 | |
FHLMC Series T-54 Class 4A ± | | | 3.08 | | | | 2-25-2043 | | | | 2,208,102 | | | | 2,369,022 | |
FHLMC Series T-55 Class 1A1 | | | 6.50 | | | | 3-25-2043 | | | | 94,845 | | | | 105,471 | |
FHLMC Series T-56 Class 3AF ± | | | 1.20 | | | | 5-25-2043 | | | | 1,391,617 | | | | 1,427,462 | |
FHLMC Series T-62 Class 1A1 ± | | | 1.37 | | | | 10-25-2044 | | | | 5,775,941 | | | | 5,907,026 | |
FHLMC Series T-63 Class 1A1 ± | | | 1.37 | | | | 2-25-2045 | | | | 5,179,421 | | | | 5,309,342 | |
FHLMC Series T-66 Class 2A1 ± | | | 2.86 | | | | 1-25-2036 | | | | 3,452,788 | | | | 3,607,801 | |
FHLMC Series T-67 Class 1A1C ± | | | 2.91 | | | | 3-25-2036 | | | | 11,682,136 | | | | 12,327,387 | |
FHLMC Series T-67 Class 2A1C ± | | | 2.88 | | | | 3-25-2036 | | | | 7,259,215 | | | | 7,562,207 | |
FHLMC Series T-75 Class A1 ± | | | 0.24 | | | | 12-25-2036 | | | | 3,494,988 | | | | 3,477,912 | |
FNMA ± | | | 1.38 | | | | 12-1-2020 | | | | 23,874 | | | | 23,934 | |
FNMA ± | | | 1.38 | | | | 1-1-2021 | | | | 2,896 | | | | 2,981 | |
FNMA ± | | | 1.38 | | | | 1-1-2021 | | | | 3,338 | | | | 3,431 | |
FNMA ± | | | 1.38 | | | | 6-1-2021 | | | | 49,465 | | | | 51,756 | |
| | | | | | |
| Portfolio of investments—August 31, 2015 | | Wells Fargo Advantage Adjustable Rate Government Fund | | | 7 | |
| | | | | | | | | | | | | | | | |
| Security name | | Interest rate | | | Maturity date | | | Principal | | | Value | |
| | | | |
Agency Securities (continued) | | | | | | | | | | | | | | | | |
FNMA ± | | | 1.52 | % | | | 8-1-2032 | | | $ | 258,868 | | | $ | 259,754 | |
FNMA ± | | | 1.57 | | | | 12-1-2030 | | | | 150,280 | | | | 152,993 | |
FNMA ± | | | 1.58 | | | | 9-1-2032 | | | | 62,517 | | | | 62,609 | |
FNMA ± | | | 1.63 | | | | 12-1-2016 | | | | 587 | | | | 588 | |
FNMA ± | | | 1.69 | | | | 8-1-2030 | | | | 2,213,082 | | | | 2,291,220 | |
FNMA ± | | | 1.71 | | | | 8-1-2033 | | | | 306,599 | | | | 320,284 | |
FNMA ± | | | 1.73 | | | | 1-1-2017 | | | | 699 | | | | 699 | |
FNMA ± | | | 1.74 | | | | 1-1-2032 | | | | 404,361 | | | | 421,573 | |
FNMA ± | | | 1.75 | | | | 8-1-2033 | | | | 3,909 | | | | 4,001 | |
FNMA ± | | | 1.75 | | | | 8-1-2033 | | | | 1,688,076 | | | | 1,760,181 | |
FNMA ± | | | 1.75 | | | | 7-1-2017 | | | | 722 | | | | 724 | |
FNMA ± | | | 1.75 | | | | 12-1-2031 | | | | 24,620 | | | | 24,639 | |
FNMA ± | | | 1.77 | | | | 5-1-2029 | | | | 425,501 | | | | 446,542 | |
FNMA ± | | | 1.79 | | | | 12-1-2031 | | | | 365,813 | | | | 382,610 | |
FNMA ± | | | 1.81 | | | | 12-1-2031 | | | | 150,700 | | | | 154,160 | |
FNMA ± | | | 1.82 | | | | 3-1-2030 | | | | 22,295 | | | | 22,409 | |
FNMA ± | | | 1.83 | | | | 10-1-2037 | | | | 1,730,427 | | | | 1,820,671 | |
FNMA ± | | | 1.83 | | | | 3-1-2034 | | | | 499,678 | | | | 531,491 | |
FNMA ± | | | 1.87 | | | | 5-1-2018 | | | | 4,930 | | | | 4,948 | |
FNMA ± | | | 1.87 | | | | 1-1-2032 | | | | 33,055 | | | | 33,211 | |
FNMA ± | | | 1.87 | | | | 1-1-2035 | | | | 124,318 | | | | 130,904 | |
FNMA ± | | | 1.87 | | | | 9-1-2031 | | | | 237,763 | | | | 246,353 | |
FNMA ± | | | 1.88 | | | | 7-1-2017 | | | | 1,332 | | | | 1,341 | |
FNMA ± | | | 1.88 | | | | 8-1-2017 | | | | 729 | | | | 738 | |
FNMA ± | | | 1.88 | | | | 7-1-2020 | | | | 10,906 | | | | 11,299 | |
FNMA ± | | | 1.88 | | | | 3-1-2021 | | | | 963 | | | | 981 | |
FNMA ± | | | 1.88 | | | | 3-1-2030 | | | | 21,803 | | | | 21,884 | |
FNMA ± | | | 1.88 | | | | 8-1-2031 | | | | 151,706 | | | | 155,733 | |
FNMA ± | | | 1.92 | | | | 8-1-2031 | | | | 136,136 | | | | 139,842 | |
FNMA ± | | | 1.92 | | | | 1-1-2035 | | | | 3,741,234 | | | | 3,922,064 | |
FNMA ± | | | 1.92 | | | | 4-1-2033 | | | | 523,511 | | | | 551,767 | |
FNMA ± | | | 1.92 | | | | 11-1-2024 | | | | 8,857 | | | | 9,084 | |
FNMA ± | | | 1.92 | | | | 12-1-2022 | | | | 12,791 | | | | 12,910 | |
FNMA ± | | | 1.93 | | | | 4-1-2021 | | | | 60,159 | | | | 63,116 | |
FNMA ± | | | 1.93 | | | | 10-1-2017 | | | | 27,078 | | | | 28,124 | |
FNMA ± | | | 1.93 | | | | 1-1-2018 | | | | 39,543 | | | | 39,516 | |
FNMA ± | | | 1.93 | | | | 11-1-2023 | | | | 38,711 | | | | 39,654 | |
FNMA ± | | | 1.93 | | | | 1-1-2035 | | | | 1,372,888 | | | | 1,435,037 | |
FNMA ± | | | 1.93 | | | | 4-1-2019 | | | | 3,571 | | | | 3,611 | |
FNMA ± | | | 1.94 | | | | 2-1-2033 | | | | 252,110 | | | | 262,865 | |
FNMA ± | | | 1.94 | | | | 3-1-2033 | | | | 228,009 | | | | 237,971 | |
FNMA ± | | | 1.94 | | | | 4-1-2042 | | | | 3,664,703 | | | | 3,868,160 | |
FNMA ± | | | 1.94 | | | | 10-1-2044 | | | | 1,553,769 | | | | 1,643,096 | |
FNMA ± | | | 1.95 | | | | 6-1-2031 | | | | 312,149 | | | | 322,941 | |
FNMA ± | | | 1.96 | | | | 3-1-2034 | | | | 641,198 | | | | 675,178 | |
FNMA ± | | | 1.96 | | | | 4-1-2038 | | | | 1,223,188 | | | | 1,296,687 | |
FNMA ± | | | 1.97 | | | | 12-1-2017 | | | | 49,237 | | | | 49,945 | |
FNMA ± | | | 2.00 | | | | 1-1-2022 | | | | 10,906 | | | | 10,944 | |
FNMA ± | | | 2.01 | | | | 8-1-2032 | | | | 157,434 | | | | 161,774 | |
FNMA ± | | | 2.01 | | | | 2-1-2033 | | | | 666,129 | | | | 703,588 | |
| | | | |
| 8 | | Wells Fargo Advantage Adjustable Rate Government Fund | | Portfolio of investments—August 31, 2015 |
| | | | | | | | | | | | | | | | |
| Security name | | Interest rate | | | Maturity date | | | Principal | | | Value | |
| | | | |
Agency Securities (continued) | | | | | | | | | | | | | | | | |
FNMA ± | | | 2.02 | % | | | 4-1-2018 | | | $ | 3,070 | | | $ | 3,113 | |
FNMA ± | | | 2.02 | | | | 6-1-2035 | | | | 1,087,451 | | | | 1,140,440 | |
FNMA ± | | | 2.04 | | | | 10-1-2035 | | | | 8,199,443 | | | | 8,605,789 | |
FNMA ± | | | 2.07 | | | | 12-1-2035 | | | | 6,196,903 | | | | 6,486,289 | |
FNMA ± | | | 2.07 | | | | 11-1-2034 | | | | 1,042,152 | | | | 1,096,272 | |
FNMA ± | | | 2.08 | | | | 9-1-2035 | | | | 3,530,415 | | | | 3,748,302 | |
FNMA ± | | | 2.08 | | | | 1-1-2038 | | | | 467,138 | | | | 477,458 | |
FNMA ± | | | 2.08 | | | | 7-1-2038 | | | | 1,231,407 | | | | 1,295,907 | |
FNMA ± | | | 2.09 | | | | 7-1-2018 | | | | 983 | | | | 991 | |
FNMA ± | | | 2.10 | | | | 1-1-2036 | | | | 4,592,626 | | | | 4,825,518 | |
FNMA ± | | | 2.11 | | | | 11-1-2035 | | | | 1,792,172 | | | | 1,881,243 | |
FNMA ± | | | 2.11 | | | | 11-1-2035 | | | | 66,899 | | | | 70,285 | |
FNMA ± | | | 2.12 | | | | 10-1-2024 | | | | 54,275 | | | | 54,595 | |
FNMA ± | | | 2.12 | | | | 12-1-2024 | | | | 82,990 | | | | 83,556 | |
FNMA ± | | | 2.12 | | | | 1-1-2034 | | | | 3,183,678 | | | | 3,380,406 | |
FNMA ± | | | 2.13 | | | | 2-1-2018 | | | | 5,424 | | | | 5,524 | |
FNMA ± | | | 2.13 | | | | 10-1-2018 | | | | 71,070 | | | | 73,599 | |
FNMA ± | | | 2.13 | | | | 5-1-2019 | | | | 172 | | | | 172 | |
FNMA ± | | | 2.13 | | | | 2-1-2020 | �� | | | 8,474 | | | | 8,516 | |
FNMA ± | | | 2.13 | | | | 6-1-2019 | | | | 498 | | | | 499 | |
FNMA ± | | | 2.13 | | | | 8-1-2031 | | | | 70,867 | | | | 74,301 | |
FNMA ± | | | 2.13 | | | | 7-1-2032 | | | | 208,508 | | | | 213,563 | |
FNMA ± | | | 2.14 | | | | 6-1-2032 | | | | 70,665 | | | | 71,195 | |
FNMA ± | | | 2.14 | | | | 1-1-2035 | | | | 697,759 | | | | 734,456 | |
FNMA ± | | | 2.16 | | | | 10-1-2035 | | | | 815,040 | | | | 856,932 | |
FNMA ± | | | 2.16 | | | | 11-1-2017 | | | | 68,748 | | | | 69,888 | |
FNMA ± | | | 2.17 | | | | 12-1-2033 | | | | 2,325,300 | | | | 2,484,097 | |
FNMA ± | | | 2.18 | | | | 12-1-2023 | | | | 10,446 | | | | 10,502 | |
FNMA ± | | | 2.19 | | | | 11-1-2035 | | | | 2,228,159 | | | | 2,344,893 | |
FNMA ± | | | 2.20 | | | | 11-1-2017 | | | | 24,519 | | | | 24,661 | |
FNMA ± | | | 2.20 | | | | 11-1-2027 | | | | 55,013 | | | | 55,897 | |
FNMA ± | | | 2.21 | | | | 4-1-2018 | | | | 238,150 | | | | 247,390 | |
FNMA ± | | | 2.21 | | | | 1-1-2036 | | | | 493,787 | | | | 526,748 | |
FNMA ± | | | 2.22 | | | | 7-1-2018 | | | | 235,311 | | | | 244,536 | |
FNMA ± | | | 2.22 | | | | 4-1-2024 | | | | 3,648,147 | | | | 3,716,266 | |
FNMA ± | | | 2.22 | | | | 1-1-2035 | | | | 3,053,942 | | | | 3,253,957 | |
FNMA ± | | | 2.22 | | | | 7-1-2035 | | | | 2,101,106 | | | | 2,207,174 | |
FNMA ± | | | 2.22 | | | | 7-1-2035 | | | | 1,679,376 | | | | 1,766,380 | |
FNMA ± | | | 2.24 | | | | 11-1-2035 | | | | 1,322,811 | | | | 1,408,153 | |
FNMA ± | | | 2.24 | | | | 1-1-2040 | | | | 614,669 | | | | 653,755 | |
FNMA ± | | | 2.24 | | | | 12-1-2032 | | | | 1,067,422 | | | | 1,126,653 | |
FNMA ± | | | 2.24 | | | | 8-1-2035 | | | | 484,183 | | | | 505,109 | |
FNMA ± | | | 2.25 | | | | 6-1-2034 | | | | 887,548 | | | | 942,649 | |
FNMA ± | | | 2.25 | | | | 1-1-2037 | | | | 3,341,199 | | | | 3,556,030 | |
FNMA ± | | | 2.25 | | | | 5-1-2017 | | | | 28,040 | | | | 28,108 | |
FNMA ± | | | 2.25 | | | | 1-1-2018 | | | | 319,496 | | | | 332,427 | |
FNMA ± | | | 2.25 | | | | 1-1-2019 | | | | 74,340 | | | | 75,375 | |
FNMA ± | | | 2.25 | | | | 1-1-2027 | | | | 41,499 | | | | 41,861 | |
FNMA ± | | | 2.26 | | | | 10-1-2035 | | | | 424,669 | | | | 457,933 | |
FNMA ± | | | 2.26 | | | | 5-1-2033 | | | | 5,435,597 | | | | 5,801,498 | |
| | | | | | |
| Portfolio of investments—August 31, 2015 | | Wells Fargo Advantage Adjustable Rate Government Fund | | | 9 | |
| | | | | | | | | | | | | | | | |
| Security name | | Interest rate | | | Maturity date | | | Principal | | | Value | |
| | | | |
Agency Securities (continued) | | | | | | | | | | | | | | | | |
FNMA ± | | | 2.26 | % | | | 9-1-2036 | | | $ | 1,270,015 | | | $ | 1,352,601 | |
FNMA ± | | | 2.26 | | | | 2-1-2036 | | | | 5,635,587 | | | | 6,002,542 | |
FNMA ± | | | 2.27 | | | | 5-1-2034 | | | | 1,038,824 | | | | 1,104,185 | |
FNMA ± | | | 2.27 | | | | 6-1-2035 | | | | 2,842,175 | | | | 3,013,140 | |
FNMA ± | | | 2.27 | | | | 1-1-2037 | | | | 4,243,656 | | | | 4,496,860 | |
FNMA ± | | | 2.28 | | | | 5-1-2018 | | | | 38,058 | | | | 38,679 | |
FNMA ± | | | 2.28 | | | | 12-1-2033 | | | | 1,638,629 | | | | 1,757,529 | |
FNMA ± | | | 2.28 | | | | 11-1-2038 | | | | 1,480,249 | | | | 1,574,242 | |
FNMA ± | | | 2.28 | | | | 1-1-2036 | | | | 453,682 | | | | 476,262 | |
FNMA ± | | | 2.28 | | | | 12-1-2039 | | | | 305,559 | | | | 318,899 | |
FNMA ± | | | 2.28 | | | | 4-1-2030 | | | | 118,247 | | | | 121,360 | |
FNMA ± | | | 2.29 | | | | 8-1-2036 | | | | 4,262,146 | | | | 4,511,502 | |
FNMA ± | | | 2.29 | | | | 4-1-2037 | | | | 3,871,800 | | | | 4,124,713 | |
FNMA ± | | | 2.29 | | | | 9-1-2032 | | | | 6,940,067 | | | | 7,377,965 | |
FNMA ± | | | 2.29 | | | | 9-1-2034 | | | | 1,919,501 | | | | 2,042,309 | |
FNMA ± | | | 2.29 | | | | 4-1-2035 | | | | 3,876,760 | | | | 4,152,684 | |
FNMA ± | | | 2.30 | | | | 9-1-2038 | | | | 1,679,614 | | | | 1,785,449 | |
FNMA ± | | | 2.30 | | | | 12-1-2034 | | | | 1,754,395 | | | | 1,879,515 | |
FNMA ± | | | 2.30 | | | | 12-1-2024 | | | | 33,816 | | | | 34,006 | |
FNMA ± | | | 2.30 | | | | 6-1-2032 | | | | 44,343 | | | | 44,601 | |
FNMA ± | | | 2.30 | | | | 6-1-2032 | | | | 80,052 | | | | 81,229 | |
FNMA ± | | | 2.30 | | | | 1-1-2035 | | | | 474,281 | | | | 504,436 | |
FNMA ± | | | 2.30 | | | | 1-1-2035 | | | | 1,593,012 | | | | 1,713,596 | |
FNMA ± | | | 2.30 | | | | 7-1-2036 | | | | 3,937,819 | | | | 4,190,280 | |
FNMA ± | | | 2.31 | | | | 8-1-2025 | | | | 45,157 | | | | 46,359 | |
FNMA ± | | | 2.32 | | | | 10-1-2033 | | | | 714,085 | | | | 759,370 | |
FNMA ± | | | 2.32 | | | | 5-1-2018 | | | | 393 | | | | 382 | |
FNMA ± | | | 2.32 | | | | 4-1-2033 | | | | 1,158,217 | | | | 1,236,799 | |
FNMA ± | | | 2.32 | | | | 2-1-2035 | | | | 429,254 | | | | 458,097 | |
FNMA ± | | | 2.32 | | | | 10-1-2025 | | | | 148,018 | | | | 153,270 | |
FNMA ± | | | 2.33 | | | | 4-1-2040 | | | | 309,792 | | | | 330,972 | |
FNMA ± | | | 2.33 | | | | 11-1-2038 | | | | 1,288,013 | | | | 1,375,474 | |
FNMA ± | | | 2.33 | | | | 10-1-2024 | | | | 326,773 | | | | 340,906 | |
FNMA ± | | | 2.33 | | | | 9-1-2035 | | | | 2,788,333 | | | | 2,963,592 | |
FNMA ± | | | 2.34 | | | | 7-1-2029 | | | | 744,787 | | | | 792,273 | |
FNMA ± | | | 2.34 | | | | 4-1-2034 | | | | 1,435,498 | | | | 1,524,322 | |
FNMA ± | | | 2.34 | | | | 9-1-2036 | | | | 1,650,448 | | | | 1,771,001 | |
FNMA ± | | | 2.34 | | | | 9-1-2039 | | | | 4,668,708 | | | | 4,969,169 | |
FNMA ± | | | 2.35 | | | | 8-1-2031 | | | | 128,511 | | | | 131,657 | |
FNMA ± | | | 2.35 | | | | 2-1-2033 | | | | 307,962 | | | | 316,720 | |
FNMA ± | | | 2.35 | | | | 10-1-2034 | | | | 486,385 | | | | 518,069 | |
FNMA ± | | | 2.35 | | | | 12-1-2037 | | | | 906,033 | | | | 966,577 | |
FNMA ± | | | 2.35 | | | | 5-1-2038 | | | | 5,120,569 | | | | 5,451,035 | |
FNMA ± | | | 2.35 | | | | 6-1-2026 | | | | 85,907 | | | | 88,872 | |
FNMA ± | | | 2.35 | | | | 1-1-2033 | | | | 4,317,063 | | | | 4,596,845 | |
FNMA ± | | | 2.35 | | | | 9-1-2033 | | | | 59,611 | | | | 60,080 | |
FNMA ± | | | 2.35 | | | | 5-1-2036 | | | | 2,708,851 | | | | 2,871,720 | |
FNMA ± | | | 2.35 | | | | 7-1-2038 | | | | 6,606,841 | | | | 7,050,988 | |
FNMA ± | | | 2.35 | | | | 5-1-2039 | | | | 4,337,524 | | | | 4,602,411 | |
FNMA ± | | | 2.36 | | | | 7-1-2025 | | | | 5,069 | | | | 5,340 | |
| | | | |
| 10 | | Wells Fargo Advantage Adjustable Rate Government Fund | | Portfolio of investments—August 31, 2015 |
| | | | | | | | | | | | | | | | |
| Security name | | Interest rate | | | Maturity date | | | Principal | | | Value | |
| | | | |
Agency Securities (continued) | | | | | | | | | | | | | | | | |
FNMA ± | | | 2.36 | % | | | 5-1-2033 | | | $ | 585,676 | | | $ | 616,011 | |
FNMA ± | | | 2.36 | | | | 7-1-2035 | | | | 1,278,641 | | | | 1,359,526 | |
FNMA ± | | | 2.36 | | | | 12-1-2035 | | | | 737,953 | | | | 786,190 | |
FNMA ± | | | 2.36 | | | | 12-1-2032 | | | | 1,197,511 | | | | 1,277,458 | |
FNMA ± | | | 2.36 | | | | 9-1-2037 | | | | 1,576,924 | | | | 1,681,285 | |
FNMA ± | | | 2.36 | | | | 5-1-2034 | | | | 986,259 | | | | 1,044,211 | |
FNMA ± | | | 2.37 | | | | 12-1-2025 | | | | 21,974 | | | | 22,290 | |
FNMA ± | | | 2.37 | | | | 8-1-2026 | | | | 98,149 | | | | 101,345 | |
FNMA ± | | | 2.37 | | | | 5-1-2032 | | | | 197,445 | | | | 201,475 | |
FNMA ± | | | 2.37 | | | | 3-1-2031 | | | | 40,694 | | | | 40,931 | |
FNMA ± | | | 2.37 | | | | 3-1-2037 | | | | 807,227 | | | | 858,836 | |
FNMA ± | | | 2.37 | | | | 9-1-2035 | | | | 7,635,779 | | | | 8,127,562 | |
FNMA ± | | | 2.37 | | | | 5-1-2033 | | | | 993,240 | | | | 1,062,411 | |
FNMA ± | | | 2.37 | | | | 12-1-2034 | | | | 1,950,565 | | | | 2,086,225 | |
FNMA ± | | | 2.37 | | | | 6-1-2027 | | | | 1,468 | | | | 1,515 | |
FNMA ± | | | 2.38 | | | | 5-1-2033 | | | | 1,209,195 | | | | 1,278,849 | |
FNMA ± | | | 2.38 | | | | 4-1-2034 | | | | 858,530 | | | | 914,419 | |
FNMA ± | | | 2.38 | | | | 5-1-2035 | | | | 1,790,659 | | | | 1,906,891 | |
FNMA ± | | | 2.38 | | | | 6-1-2041 | | | | 1,087,353 | | | | 1,159,277 | |
FNMA ± | | | 2.38 | | | | 8-1-2017 | | | | 267,322 | | | | 267,138 | |
FNMA ± | | | 2.38 | | | | 5-1-2035 | | | | 2,537,919 | | | | 2,706,356 | |
FNMA ± | | | 2.38 | | | | 12-1-2036 | | | | 963,323 | | | | 1,026,956 | |
FNMA ± | | | 2.38 | | | | 12-1-2040 | | | | 616,523 | | | | 656,873 | |
FNMA ± | | | 2.38 | | | | 1-1-2038 | | | | 7,005,939 | | | | 7,499,881 | |
FNMA ± | | | 2.38 | | | | 7-1-2038 | | | | 2,751,878 | | | | 2,931,660 | |
FNMA ± | | | 2.38 | | | | 1-1-2027 | | | | 783,004 | | | | 811,257 | |
FNMA ± | | | 2.38 | | | | 2-1-2038 | | | | 1,283,953 | | | | 1,363,702 | |
FNMA ± | | | 2.38 | | | | 2-1-2035 | | | | 4,411,569 | | | | 4,693,538 | |
FNMA ± | | | 2.38 | | | | 6-1-2036 | | | | 2,758,783 | | | | 2,934,699 | |
FNMA ± | | | 2.38 | | | | 1-1-2037 | | | | 4,478,708 | | | | 4,784,164 | |
FNMA ± | | | 2.39 | | | | 10-1-2035 | | | | 3,196,977 | | | | 3,398,369 | |
FNMA ± | | | 2.39 | | | | 4-1-2033 | | | | 1,165,514 | | | | 1,245,446 | |
FNMA ± | | | 2.39 | | | | 2-1-2034 | | | | 3,164,895 | | | | 3,375,438 | |
FNMA ± | | | 2.39 | | | | 10-1-2036 | | | | 1,447,213 | | | | 1,539,075 | |
FNMA ± | | | 2.39 | | | | 2-1-2036 | | | | 1,206,682 | | | | 1,282,151 | |
FNMA ± | | | 2.39 | | | | 4-1-2038 | | | | 1,930,127 | | | | 2,052,401 | |
FNMA ± | | | 2.39 | | | | 2-1-2045 | | | | 3,770,458 | | | | 4,019,988 | |
FNMA ± | | | 2.39 | | | | 3-1-2033 | | | | 514,531 | | | | 538,296 | |
FNMA ± | | | 2.40 | | | | 12-1-2037 | | | | 4,538,897 | | | | 4,843,337 | |
FNMA ± | | | 2.40 | | | | 8-1-2039 | | | | 5,163,696 | | | | 5,499,079 | |
FNMA ± | | | 2.40 | | | | 9-1-2039 | | | | 7,463,271 | | | | 7,955,220 | |
FNMA ± | | | 2.40 | | | | 12-1-2040 | | | | 2,312,498 | | | | 2,460,671 | |
FNMA ± | | | 2.40 | | | | 12-1-2044 | | | | 6,021,083 | | | | 6,400,645 | |
FNMA ± | | | 2.40 | | | | 7-1-2039 | | | | 5,157,361 | | | | 5,491,980 | |
FNMA ± | | | 2.40 | | | | 4-1-2035 | | | | 2,691,284 | | | | 2,877,708 | |
FNMA ± | | | 2.40 | | | | 8-1-2037 | | | | 5,138,720 | | | | 5,488,507 | |
FNMA ± | | | 2.40 | | | | 5-1-2033 | | | | 3,769,370 | | | | 4,031,422 | |
FNMA ± | | | 2.40 | | | | 7-1-2024 | | | | 14,415 | | | | 14,491 | |
FNMA ± | | | 2.40 | | | | 1-1-2037 | | | | 8,598,833 | | | | 9,160,417 | |
FNMA ± | | | 2.40 | | | | 2-1-2037 | | | | 4,088,874 | | | | 4,376,559 | |
| | | | | | |
| Portfolio of investments—August 31, 2015 | | Wells Fargo Advantage Adjustable Rate Government Fund | | | 11 | |
| | | | | | | | | | | | | | | | |
| Security name | | Interest rate | | | Maturity date | | | Principal | | | Value | |
| | | | |
Agency Securities (continued) | | | | | | | | | | | | | | | | |
FNMA ± | | | 2.40 | % | | | 10-1-2035 | | | $ | 1,687,422 | | | $ | 1,805,140 | |
FNMA ± | | | 2.40 | | | | 11-1-2035 | | | | 2,272,385 | | | | 2,420,721 | |
FNMA ± | | | 2.40 | | | | 9-1-2036 | | | | 1,010,296 | | | | 1,076,998 | |
FNMA ± | | | 2.40 | | | | 12-1-2040 | | | | 5,574,437 | | | | 5,930,876 | |
FNMA ± | | | 2.41 | | | | 11-1-2022 | | | | 63,587 | | | | 63,932 | |
FNMA ± | | | 2.41 | | | | 9-1-2034 | | | | 5,140,779 | | | | 5,473,147 | |
FNMA ± | | | 2.41 | | | | 2-1-2036 | | | | 11,516,300 | | | | 12,322,460 | |
FNMA ± | | | 2.41 | | | | 1-1-2036 | | | | 1,447,751 | | | | 1,541,465 | |
FNMA ± | | | 2.41 | | | | 7-1-2035 | | | | 3,615,530 | | | | 3,845,288 | |
FNMA ± | | | 2.41 | | | | 9-1-2030 | | | | 1,024,135 | | | | 1,045,630 | |
FNMA ± | | | 2.41 | | | | 7-1-2040 | | | | 3,633,035 | | | | 3,865,216 | |
FNMA ± | | | 2.41 | | | | 7-1-2036 | | | | 5,141,918 | | | | 5,472,014 | |
FNMA ± | | | 2.41 | | | | 2-1-2038 | | | | 2,794,149 | | | | 2,985,801 | |
FNMA ± | | | 2.42 | | | | 3-1-2038 | | | | 3,092,977 | | | | 3,305,025 | |
FNMA ± | | | 2.42 | | | | 12-1-2040 | | | | 1,753,683 | | | | 1,867,540 | |
FNMA ± | | | 2.42 | | | | 3-1-2035 | | | | 1,364,669 | | | | 1,457,830 | |
FNMA ± | | | 2.42 | | | | 6-1-2036 | | | | 4,955,851 | | | | 5,289,080 | |
FNMA ± | | | 2.42 | | | | 5-1-2036 | | | | 4,956,754 | | | | 5,293,469 | |
FNMA ± | | | 2.42 | | | | 12-1-2040 | | | | 9,041,046 | | | | 9,609,314 | |
FNMA ± | | | 2.42 | | | | 10-1-2034 | | | | 746,349 | | | | 806,765 | |
FNMA ± | | | 2.42 | | | | 6-1-2035 | | | | 572,306 | | | | 609,151 | |
FNMA ± | | | 2.42 | | | | 5-1-2036 | | | | 3,093,425 | | | | 3,303,659 | |
FNMA ± | | | 2.42 | | | | 1-1-2035 | | | | 6,088,020 | | | | 6,462,571 | |
FNMA ± | | | 2.42 | | | | 10-1-2036 | | | | 5,033,738 | | | | 5,363,529 | |
FNMA ± | | | 2.43 | | | | 12-1-2033 | | | | 2,111,877 | | | | 2,253,433 | |
FNMA ± | | | 2.43 | | | | 4-1-2024 | | | | 23,700 | | | | 24,660 | |
FNMA ± | | | 2.43 | | | | 8-1-2026 | | | | 732,469 | | | | 781,907 | |
FNMA ± | | | 2.43 | | | | 1-1-2038 | | | | 1,518,075 | | | | 1,622,765 | |
FNMA ± | | | 2.43 | | | | 12-1-2035 | | | | 5,438,788 | | | | 5,792,671 | |
FNMA ± | | | 2.44 | | | | 10-1-2029 | | | | 125,823 | | | | 128,827 | |
FNMA ± | | | 2.44 | | | | 8-1-2035 | | | | 1,319,402 | | | | 1,398,736 | |
FNMA ± | | | 2.44 | | | | 4-1-2033 | | | | 998,572 | | | | 1,063,883 | |
FNMA ± | | | 2.44 | | | | 8-1-2035 | | | | 3,365,989 | | | | 3,579,959 | |
FNMA ± | | | 2.44 | | | | 5-1-2037 | | | | 2,365,308 | | | | 2,523,926 | |
FNMA ± | | | 2.44 | | | | 9-1-2035 | | | | 1,325,436 | | | | 1,409,335 | |
FNMA ± | | | 2.44 | | | | 7-1-2040 | | | | 3,620,496 | | | | 3,878,864 | |
FNMA ± | | | 2.44 | | | | 5-1-2025 | | | | 47,491 | | | | 47,957 | |
FNMA ± | | | 2.44 | | | | 8-1-2033 | | | | 1,756,168 | | | | 1,863,438 | |
FNMA ± | | | 2.44 | | | | 6-1-2027 | | | | 107,563 | | | | 110,277 | |
FNMA ± | | | 2.44 | | | | 9-1-2036 | | | | 837,111 | | | | 890,304 | |
FNMA ± | | | 2.44 | | | | 11-1-2037 | | | | 1,384,749 | | | | 1,474,977 | |
FNMA ± | | | 2.45 | | | | 6-1-2032 | | | | 43,311 | | | | 43,651 | |
FNMA ± | | | 2.45 | | | | 6-1-2033 | | | | 953,807 | | | | 1,011,413 | |
FNMA ± | | | 2.45 | | | | 12-1-2046 | | | | 1,380,348 | | | | 1,469,647 | |
FNMA ± | | | 2.45 | | | | 3-1-2035 | | | | 4,671,973 | | | | 4,973,932 | |
FNMA ± | | | 2.45 | | | | 4-1-2035 | | | | 2,053,741 | | | | 2,194,584 | |
FNMA ± | | | 2.45 | | | | 7-1-2037 | | | | 918,147 | | | | 981,788 | |
FNMA ± | | | 2.45 | | | | 11-1-2020 | | | | 867,717 | | | | 867,146 | |
FNMA ± | | | 2.45 | | | | 1-1-2037 | | | | 2,179,186 | | | | 2,320,833 | |
FNMA ± | | | 2.45 | | | | 8-1-2035 | | | | 3,541,912 | | | | 3,763,509 | |
| | | | |
| 12 | | Wells Fargo Advantage Adjustable Rate Government Fund | | Portfolio of investments—August 31, 2015 |
| | | | | | | | | | | | | | | | |
| Security name | | Interest rate | | | Maturity date | | | Principal | | | Value | |
| | | | |
Agency Securities (continued) | | | | | | | | | | | | | | | | |
FNMA ± | | | 2.45 | % | | | 6-1-2017 | | | $ | 11,187 | | | $ | 11,231 | |
FNMA ± | | | 2.45 | | | | 4-1-2020 | | | | 4,764 | | | | 4,780 | |
FNMA ± | | | 2.45 | | | | 3-1-2033 | | | | 6,887 | | | | 6,941 | |
FNMA ± | | | 2.45 | | | | 5-1-2033 | | | | 352,102 | | | | 374,260 | |
FNMA ± | | | 2.45 | | | | 1-1-2033 | | | | 2,128,309 | | | | 2,275,257 | |
FNMA ± | | | 2.45 | | | | 1-1-2028 | | | | 8,284 | | | | 8,333 | |
FNMA ± | | | 2.45 | | | | 7-1-2035 | | | | 1,214,907 | | | | 1,291,704 | |
FNMA ± | | | 2.46 | | | | 12-1-2030 | | | | 80,935 | | | | 83,178 | |
FNMA ± | | | 2.46 | | | | 4-1-2033 | | | | 547,297 | | | | 577,029 | |
FNMA ± | | | 2.46 | | | | 6-1-2033 | | | | 326,625 | | | | 340,309 | |
FNMA ± | | | 2.46 | | | | 12-1-2040 | | | | 4,952,802 | | | | 5,280,030 | |
FNMA ± | | | 2.46 | | | | 1-1-2035 | | | | 934,285 | | | | 993,604 | |
FNMA ± | | | 2.46 | | | | 7-1-2033 | | | | 156,493 | | | | 166,504 | |
FNMA ± | | | 2.46 | | | | 6-1-2035 | | | | 1,515,402 | | | | 1,609,584 | |
FNMA ± | | | 2.46 | | | | 7-1-2035 | | | | 2,003,787 | | | | 2,133,643 | |
FNMA ± | | | 2.46 | | | | 12-1-2028 | | | | 42,547 | | | | 43,432 | |
FNMA ± | | | 2.46 | | | | 5-1-2034 | | | | 926,468 | | | | 986,081 | |
FNMA ± | | | 2.46 | | | | 12-1-2040 | | | | 2,966,573 | | | | 3,155,449 | |
FNMA ± | | | 2.46 | | | | 12-1-2034 | | | | 1,285,006 | | | | 1,371,909 | |
FNMA ± | | | 2.46 | | | | 6-1-2035 | | | | 453,033 | | | | 482,109 | |
FNMA ± | | | 2.46 | | | | 12-1-2040 | | | | 5,875,677 | | | | 6,222,103 | |
FNMA ± | | | 2.47 | | | | 4-1-2024 | | | | 67,249 | | | | 67,929 | |
FNMA ± | | | 2.47 | | | | 4-1-2030 | | | | 18,057 | | | | 18,167 | |
FNMA ± | | | 2.47 | | | | 4-1-2033 | | | | 1,681,859 | | | | 1,800,793 | |
FNMA ± | | | 2.47 | | | | 4-1-2030 | | | | 17,189 | | | | 18,064 | |
FNMA ± | | | 2.47 | | | | 7-1-2035 | | | | 793,147 | | | | 847,528 | |
FNMA ± | | | 2.47 | | | | 7-1-2035 | | | | 2,232,853 | | | | 2,384,418 | |
FNMA ± | | | 2.48 | | | | 1-1-2031 | | | | 638,124 | | | | 678,235 | |
FNMA ± | | | 2.48 | | | | 9-1-2033 | | | | 61,828 | | | | 62,309 | |
FNMA ± | | | 2.48 | | | | 2-1-2038 | | | | 6,399,072 | | | | 6,820,687 | |
FNMA ± | | | 2.48 | | | | 6-1-2036 | | | | 774,183 | | | | 823,005 | |
FNMA ± | | | 2.48 | | | | 9-1-2019 | | | | 50,767 | | | | 51,277 | |
FNMA ± | | | 2.48 | | | | 1-1-2037 | | | | 1,719,097 | | | | 1,836,911 | |
FNMA ± | | | 2.48 | | | | 9-1-2022 | | | | 342,464 | | | | 358,068 | |
FNMA ± | | | 2.49 | | | | 7-1-2028 | | | | 237 | | | | 253 | |
FNMA ± | | | 2.49 | | | | 10-1-2036 | | | | 1,262,130 | | | | 1,346,253 | |
FNMA ± | | | 2.49 | | | | 5-1-2028 | | | | 63,481 | | | | 64,209 | |
FNMA ± | | | 2.49 | | | | 1-1-2036 | | | | 129,870 | | | | 135,460 | |
FNMA ± | | | 2.50 | | | | 1-1-2033 | | | | 104,308 | | | | 106,771 | |
FNMA ± | | | 2.50 | | | | 7-1-2027 | | | | 29,357 | | | | 29,592 | |
FNMA ± | | | 2.50 | | | | 3-1-2037 | | | | 5,355,053 | | | | 5,743,458 | |
FNMA ± | | | 2.50 | | | | 5-1-2017 | | | | 29,065 | | | | 29,683 | |
FNMA ± | | | 2.50 | | | | 7-1-2017 | | | | 32,031 | | | | 32,108 | |
FNMA ± | | | 2.50 | | | | 8-1-2017 | | | | 19,830 | | | | 20,076 | |
FNMA ± | | | 2.50 | | | | 2-1-2019 | | | | 1,571 | | | | 1,581 | |
FNMA ± | | | 2.50 | | | | 11-1-2024 | | | | 156,976 | | | | 163,923 | |
FNMA ± | | | 2.50 | | | | 6-1-2025 | | | | 8,662 | | | | 8,719 | |
FNMA ± | | | 2.50 | | | | 4-1-2036 | | | | 4,961,826 | | | | 5,311,974 | |
FNMA ± | | | 2.51 | | | | 9-1-2028 | | | | 108,052 | | | | 110,893 | |
FNMA ± | | | 2.51 | | | | 5-1-2035 | | | | 673,899 | | | | 716,473 | |
| | | | | | |
| Portfolio of investments—August 31, 2015 | | Wells Fargo Advantage Adjustable Rate Government Fund | | | 13 | |
| | | | | | | | | | | | | | | | |
| Security name | | Interest rate | | | Maturity date | | | Principal | | | Value | |
| | | | |
Agency Securities (continued) | | | | | | | | | | | | | | | | |
FNMA ± | | | 2.51 | % | | | 10-1-2027 | | | $ | 904,734 | | | $ | 958,095 | |
FNMA ± | | | 2.52 | | | | 7-1-2020 | | | | 100,461 | | | | 102,482 | |
FNMA ± | | | 2.52 | | | | 9-1-2030 | | | | 971,611 | | | | 1,045,538 | |
FNMA ± | | | 2.52 | | | | 1-1-2029 | | | | 625,681 | | | | 652,517 | |
FNMA ± | | | 2.52 | | | | 11-1-2034 | | | | 192,765 | | | | 206,437 | |
FNMA ± | | | 2.52 | | | | 7-1-2017 | | | | 72,151 | | | | 72,104 | |
FNMA ± | | | 2.53 | | | | 6-1-2024 | | | | 53,011 | | | | 53,822 | |
FNMA ± | | | 2.53 | | | | 9-1-2026 | | | | 104,457 | | | | 107,733 | |
FNMA ± | | | 2.53 | | | | 9-1-2032 | | | | 73,618 | | | | 75,550 | |
FNMA ± | | | 2.53 | | | | 10-1-2034 | | | | 1,343,256 | | | | 1,431,447 | |
FNMA ± | | | 2.53 | | | | 9-1-2037 | | | | 1,036,038 | | | | 1,106,759 | |
FNMA ± | | | 2.53 | | | | 7-1-2027 | | | | 302,593 | | | | 315,079 | |
FNMA ± | | | 2.53 | | | | 4-1-2036 | | | | 1,547,992 | | | | 1,656,153 | |
FNMA ± | | | 2.54 | | | | 2-1-2035 | | | | 1,618,541 | | | | 1,735,624 | |
FNMA ± | | | 2.54 | | | | 4-1-2038 | | | | 1,131,443 | | | | 1,208,339 | |
FNMA ± | | | 2.54 | | | | 10-1-2024 | | | | 7,933 | | | | 8,246 | |
FNMA ± | | | 2.54 | | | | 9-1-2035 | | | | 876,232 | | | | 933,757 | |
FNMA ± | | | 2.54 | | | | 6-1-2037 | | | | 1,460,554 | | | | 1,570,663 | |
FNMA ± | | | 2.54 | | | | 9-1-2030 | | | | 180,712 | | | | 185,864 | |
FNMA ± | | | 2.54 | | | | 5-1-2036 | | | | 682,193 | | | | 732,024 | |
FNMA ± | | | 2.54 | | | | 7-1-2030 | | | | 1,146,451 | | | | 1,222,888 | |
FNMA ± | | | 2.54 | | | | 10-1-2017 | | | | 1,643 | | | | 1,650 | |
FNMA ± | | | 2.54 | | | | 8-1-2040 | | | | 1,031,571 | | | | 1,106,734 | |
FNMA ± | | | 2.54 | | | | 4-1-2018 | | | | 315,452 | | | | 325,326 | |
FNMA ± | | | 2.54 | | | | 7-1-2036 | | | | 3,652,249 | | | | 3,944,956 | |
FNMA ± | | | 2.55 | | | | 5-1-2033 | | | | 1,144,802 | | | | 1,217,804 | |
FNMA ± | | | 2.55 | | | | 7-1-2033 | | | | 1,316,395 | | | | 1,410,533 | |
FNMA ± | | | 2.55 | | | | 5-1-2034 | | | | 2,134,470 | | | | 2,291,120 | |
FNMA ± | | | 2.55 | | | | 9-1-2033 | | | | 1,162,300 | | | | 1,233,839 | |
FNMA ± | | | 2.55 | | | | 1-1-2032 | | | | 115,445 | | | | 119,120 | |
FNMA ± | | | 2.56 | | | | 5-1-2035 | | | | 2,112,165 | | | | 2,261,750 | |
FNMA ± | | | 2.56 | | | | 1-1-2026 | | | | 345,365 | | | | 361,154 | |
FNMA ± | | | 2.57 | | | | 7-1-2028 | | | | 1,184,123 | | | | 1,241,538 | |
FNMA ± | | | 2.57 | | | | 4-1-2028 | | | | 312,734 | | | | 325,770 | |
FNMA ± | | | 2.58 | | | | 3-1-2033 | | | | 1,855,737 | | | | 1,981,115 | |
FNMA ± | | | 2.58 | | | | 8-1-2035 | | | | 1,689,990 | | | | 1,812,133 | |
FNMA ± | | | 2.58 | | | | 9-1-2033 | | | | 849,446 | | | | 912,470 | |
FNMA ± | | | 2.58 | | | | 8-1-2036 | | | | 531,007 | | | | 567,106 | |
FNMA ± | | | 2.59 | | | | 12-1-2030 | | | | 861,718 | | | | 912,342 | |
FNMA ± | | | 2.60 | | | | 5-1-2028 | | | | 192,631 | | | | 205,124 | |
FNMA ± | | | 2.60 | | | | 6-1-2030 | | | | 179,499 | | | | 184,715 | |
FNMA ± | | | 2.60 | | | | 5-1-2027 | | | | 93,235 | | | | 97,283 | |
FNMA ± | | | 2.60 | | | | 6-1-2032 | | | | 124,478 | | | | 128,529 | |
FNMA ± | | | 2.60 | | | | 6-1-2027 | | | | 90,577 | | | | 92,359 | |
FNMA ± | | | 2.61 | | | | 9-1-2019 | | | | 5,181 | | | | 5,221 | |
FNMA ± | | | 2.61 | | | | 6-1-2040 | | | | 1,120,559 | | | | 1,183,678 | |
FNMA ± | | | 2.63 | | | | 6-1-2018 | | | | 12,146 | | | | 12,181 | |
FNMA ± | | | 2.63 | | | | 5-1-2037 | | | | 2,822,236 | | | | 3,020,044 | |
FNMA ± | | | 2.63 | | | | 1-1-2021 | | | | 378,744 | | | | 396,658 | |
FNMA ± | | | 2.63 | | | | 3-1-2035 | | | | 3,709,825 | | | | 3,984,159 | |
| | | | |
| 14 | | Wells Fargo Advantage Adjustable Rate Government Fund | | Portfolio of investments—August 31, 2015 |
| | | | | | | | | | | | | | | | |
| Security name | | Interest rate | | | Maturity date | | | Principal | | | Value | |
| | | | |
Agency Securities (continued) | | | | | | | | | | | | | | | | |
FNMA ± | | | 2.63 | % | | | 4-1-2036 | | | $ | 4,994,955 | | | $ | 5,354,035 | |
FNMA ± | | | 2.64 | | | | 11-1-2024 | | | | 83,411 | | | | 84,341 | |
FNMA ± | | | 2.64 | | | | 7-1-2037 | | | | 2,839,362 | | | | 3,048,505 | |
FNMA ± | | | 2.65 | | | | 8-1-2035 | | | | 3,558,988 | | | | 3,802,069 | |
FNMA ± | | | 2.66 | | | | 12-1-2021 | | | | 59,256 | | | | 60,754 | |
FNMA ± | | | 2.66 | | | | 9-1-2030 | | | | 760,585 | | | | 814,127 | |
FNMA ± | | | 2.66 | | | | 8-1-2034 | | | | 3,407,342 | | | | 3,645,617 | |
FNMA ± | | | 2.67 | | | | 7-1-2037 | | | | 851,525 | | | | 903,258 | |
FNMA ± | | | 2.67 | | | | 9-1-2035 | | | | 121,928 | | | | 130,439 | |
FNMA ± | | | 2.68 | | | | 10-1-2018 | | | | 167,795 | | | | 175,123 | |
FNMA ± | | | 2.68 | | | | 5-1-2035 | | | | 3,273,335 | | | | 3,521,554 | |
FNMA ± | | | 2.68 | | | | 1-1-2025 | | | | 63,793 | | | | 64,856 | |
FNMA ± | | | 2.69 | | | | 8-1-2036 | | | | 3,916,808 | | | | 4,196,653 | |
FNMA ± | | | 2.70 | | | | 9-1-2030 | | | | 709,808 | | | | 756,387 | |
FNMA ± | | | 2.71 | | | | 10-1-2029 | | | | 546,533 | | | | 574,149 | |
FNMA ± | | | 2.71 | | | | 3-1-2034 | | | | 1,268,548 | | | | 1,358,598 | |
FNMA ± | | | 2.72 | | | | 9-1-2021 | | | | 84,246 | | | | 85,495 | |
FNMA ± | | | 2.72 | | | | 10-1-2025 | | | | 10,652 | | | | 10,883 | |
FNMA ± | | | 2.72 | | | | 2-1-2028 | | | | 45,347 | | | | 45,748 | |
FNMA ± | | | 2.72 | | | | 3-1-2032 | | | | 135,592 | | | | 139,374 | |
FNMA ± | | | 2.74 | | | | 10-1-2018 | | | | 90,881 | | | | 90,889 | |
FNMA ± | | | 2.75 | | | | 9-1-2017 | | | | 237,777 | | | | 239,954 | |
FNMA ± | | | 2.75 | | | | 6-1-2016 | | | | 15,965 | | | | 16,102 | |
FNMA ± | | | 2.75 | | | | 7-1-2016 | | | | 4,971 | | | | 4,992 | |
FNMA ± | | | 2.75 | | | | 6-1-2018 | | | | 1,204 | | | | 1,216 | |
FNMA ± | | | 2.75 | | | | 8-1-2018 | | | | 51,134 | | | | 52,080 | |
FNMA ± | | | 2.75 | | | | 3-1-2027 | | | | 111,559 | | | | 116,276 | |
FNMA ± | | | 2.75 | | | | 12-1-2028 | | | | 98,044 | | | | 101,218 | |
FNMA ± | | | 2.75 | | | | 1-1-2029 | | | | 13,394 | | | | 13,845 | |
FNMA ± | | | 2.75 | | | | 5-1-2035 | | | | 2,241,452 | | | | 2,412,907 | |
FNMA ± | | | 2.76 | | | | 5-1-2018 | | | | 258,519 | | | | 258,234 | |
FNMA ± | | | 2.76 | | | | 7-1-2039 | | | | 2,719,832 | | | | 2,967,133 | |
FNMA ± | | | 2.76 | | | | 3-1-2035 | | | | 3,790,913 | | | | 4,080,174 | |
FNMA ± | | | 2.77 | | | | 10-1-2025 | | | | 8,574 | | | | 8,618 | |
FNMA ± | | | 2.77 | | | | 11-1-2024 | | | | 43,393 | | | | 43,679 | |
FNMA ± | | | 2.78 | | | | 7-1-2020 | | | | 1,411,291 | | | | 1,410,755 | |
FNMA ± | | | 2.80 | | | | 4-1-2020 | | | | 1,837,060 | | | | 1,865,989 | |
FNMA ± | | | 2.81 | | | | 1-1-2019 | | | | 2,480 | | | | 2,485 | |
FNMA ± | | | 2.85 | | | | 7-1-2028 | | | | 340,926 | | | | 355,379 | |
FNMA ± | | | 2.85 | | | | 4-1-2026 | | | | 8,243 | | | | 8,314 | |
FNMA ± | | | 2.85 | | | | 7-1-2019 | | | | 1,961 | | | | 1,993 | |
FNMA ± | | | 2.86 | | | | 11-1-2035 | | | | 11,809,341 | | | | 12,709,958 | |
FNMA ± | | | 2.86 | | | | 11-1-2034 | | | | 4,629,003 | | | | 4,989,804 | |
FNMA ± | | | 2.86 | | | | 7-1-2033 | | | | 40,034 | | | | 40,419 | |
FNMA ± | | | 2.86 | | | | 10-1-2028 | | | | 227,405 | | | | 236,662 | |
FNMA ± | | | 2.88 | | | | 3-1-2019 | | | | 384,621 | | | | 405,997 | |
FNMA ± | | | 2.89 | | | | 5-1-2017 | | | | 30,238 | | | | 30,888 | |
FNMA ± | | | 2.92 | | | | 2-1-2029 | | | | 94,008 | | | | 96,491 | |
FNMA ± | | | 2.93 | | | | 4-1-2040 | | | | 2,511,743 | | | | 2,717,358 | |
FNMA ± | | | 2.94 | | | | 1-1-2029 | | | | 19,026 | | | | 19,950 | |
| | | | | | |
| Portfolio of investments—August 31, 2015 | | Wells Fargo Advantage Adjustable Rate Government Fund | | | 15 | |
| | | | | | | | | | | | | | | | |
| Security name | | Interest rate | | | Maturity date | | | Principal | | | Value | |
| | | | |
Agency Securities (continued) | | | | | | | | | | | | | | | | |
FNMA ± | | | 2.94 | % | | | 9-1-2032 | | | $ | 1,714,339 | | | $ | 1,872,718 | |
FNMA ± | | | 2.95 | | | | 8-1-2029 | | | | 523,669 | | | | 552,425 | |
FNMA ± | | | 2.98 | | | | 11-1-2028 | | | | 109,655 | | | | 112,841 | |
FNMA ± | | | 2.99 | | | | 4-1-2033 | | | | 483,714 | | | | 511,653 | |
FNMA ± | | | 3.02 | | | | 1-1-2031 | | | | 76,478 | | | | 77,455 | |
FNMA ± | | | 3.05 | | | | 7-1-2033 | | | | 1,406 | | | | 1,424 | |
FNMA ± | | | 3.07 | | | | 8-1-2030 | | | | 236,360 | | | | 242,709 | |
FNMA ± | | | 3.09 | | | | 8-1-2031 | | | | 67,332 | | | | 68,046 | |
FNMA ± | | | 3.10 | | | | 4-1-2024 | | | | 341,907 | | | | 365,525 | |
FNMA ± | | | 3.11 | | | | 3-1-2030 | | | | 149,418 | | | | 153,621 | |
FNMA ± | | | 3.15 | | | | 10-1-2024 | | | | 46,910 | | | | 47,181 | |
FNMA ± | | | 3.17 | | | | 1-1-2033 | | | | 69,259 | | | | 70,514 | |
FNMA ± | | | 3.22 | | | | 4-1-2034 | | | | 2,615,876 | | | | 2,821,429 | |
FNMA ± | | | 3.25 | | | | 9-1-2017 | | | | 1,395 | | | | 1,402 | |
FNMA ± | | | 3.29 | | | | 9-1-2033 | | | | 42,898 | | | | 43,161 | |
FNMA ± | | | 3.30 | | | | 2-1-2029 | | | | 1,883,455 | | | | 2,024,922 | |
FNMA ± | | | 3.31 | | | | 10-1-2018 | | | | 22 | | | | 22 | |
FNMA ± | | | 3.45 | | | | 11-1-2031 | | | | 43,231 | | | | 43,557 | |
FNMA ± | | | 3.47 | | | | 6-1-2024 | | | | 28,442 | | | | 28,675 | |
FNMA ± | | | 3.47 | | | | 11-1-2029 | | | | 9,666 | | | | 9,735 | |
FNMA ± | | | 3.47 | | | | 7-1-2028 | | | | 54,472 | | | | 56,333 | |
FNMA ± | | | 3.53 | | | | 10-1-2034 | | | | 231,063 | | | | 241,755 | |
FNMA ± | | | 3.56 | | | | 5-1-2033 | | | | 1,500,023 | | | | 1,620,400 | |
FNMA ± | | | 3.58 | | | | 10-1-2017 | | | | 416,233 | | | | 424,440 | |
FNMA ± | | | 3.63 | | | | 7-1-2021 | | | | 130,143 | | | | 134,239 | |
FNMA ± | | | 3.67 | | | | 5-1-2017 | | | | 490 | | | | 493 | |
FNMA ± | | | 3.67 | | | | 7-1-2017 | | | | 16,420 | | | | 16,959 | |
FNMA ± | | | 3.69 | | | | 9-1-2031 | | | | 318,359 | | | | 335,402 | |
FNMA ± | | | 3.78 | | | | 9-1-2028 | | | | 3,327 | | | | 3,457 | |
FNMA ± | | | 3.79 | | | | 4-1-2033 | | | | 207,562 | | | | 214,917 | |
FNMA ± | | | 3.85 | | | | 12-1-2032 | | | | 168,170 | | | | 174,423 | |
FNMA ± | | | 3.92 | | | | 2-1-2033 | | | | 96,957 | | | | 98,518 | |
FNMA ± | | | 3.95 | | | | 9-1-2023 | | | | 5,197 | | | | 5,245 | |
FNMA ± | | | 4.01 | | | | 4-1-2032 | | | | 246,302 | | | | 249,441 | |
FNMA ± | | | 4.03 | | | | 5-1-2034 | | | | 366,436 | | | | 388,264 | |
FNMA ± | | | 4.11 | | | | 9-1-2017 | | | | 826 | | | | 833 | |
FNMA ± | | | 4.18 | | | | 6-1-2019 | | | | 3,327 | | | | 3,368 | |
FNMA ± | | | 4.20 | | | | 11-1-2031 | | | | 134,747 | | | | 138,180 | |
FNMA ± | | | 4.20 | | | | 11-1-2031 | | | | 20,477 | | | | 20,583 | |
FNMA ± | | | 4.30 | | | | 1-1-2018 | | | | 637 | | | | 643 | |
FNMA ± | | | 4.31 | | | | 11-1-2019 | | | | 307 | | | | 309 | |
FNMA ± | | | 4.33 | | | | 12-1-2036 | | | | 231,094 | | | | 246,059 | |
FNMA ± | | | 4.47 | | | | 6-1-2034 | | | | 298,865 | | | | 318,034 | |
FNMA ± | | | 4.63 | | | | 2-1-2019 | | | | 324,676 | | | | 336,230 | |
FNMA ± | | | 4.65 | | | | 1-1-2019 | | | | 365,173 | | | | 377,288 | |
FNMA ± | | | 4.66 | | | | 6-1-2028 | | | | 62,260 | | | | 64,280 | |
FNMA ± | | | 4.71 | | | | 4-1-2018 | | | | 121,650 | | | | 122,892 | |
FNMA ± | | | 5.00 | | | | 6-1-2028 | | | | 23,553 | | | | 23,760 | |
FNMA ± | | | 5.08 | | | | 5-1-2025 | | | | 80 | | | | 81 | |
FNMA ± | | | 5.25 | | | | 10-1-2021 | | | | 11,366 | | | | 11,417 | |
| | | | |
| 16 | | Wells Fargo Advantage Adjustable Rate Government Fund | | Portfolio of investments—August 31, 2015 |
| | | | | | | | | | | | | | | | |
| Security name | | Interest rate | | | Maturity date | | | Principal | | | Value | |
| | | | |
Agency Securities (continued) | | | | | | | | | | | | | | | | |
FNMA | | | 5.50 | % | | | 9-1-2019 | | | $ | 99,863 | | | $ | 103,376 | |
FNMA ± | | | 5.70 | | | | 1-1-2019 | | | | 61,122 | | | | 64,033 | |
FNMA ± | | | 6.00 | | | | 1-1-2020 | | | | 8,571 | | | | 8,690 | |
FNMA ± | | | 6.19 | | | | 9-1-2017 | | | | 57 | | | | 57 | |
FNMA ± | | | 6.45 | | | | 2-1-2034 | | | | 68,141 | | | | 68,302 | |
FNMA | | | 6.50 | | | | 8-1-2028 | | | | 65,937 | | | | 68,788 | |
FNMA | | | 6.50 | | | | 5-1-2031 | | | | 193,598 | | | | 222,203 | |
FNMA | | | 7.00 | | | | 11-1-2017 | | | | 7,766 | | | | 7,965 | |
FNMA | | | 7.06 | | | | 11-1-2024 | | | | 43,830 | | | | 45,607 | |
FNMA | | | 7.06 | | | | 12-1-2024 | | | | 32,098 | | | | 32,764 | |
FNMA | | | 7.06 | | | | 3-1-2025 | | | | 60,085 | | | | 63,059 | |
FNMA | | | 7.06 | | | | 3-1-2025 | | | | 9,362 | | | | 9,488 | |
FNMA | | | 7.06 | | | | 4-1-2025 | | | | 21,937 | | | | 22,235 | |
FNMA | | | 7.06 | | | | 1-1-2027 | | | | 56,453 | | | | 58,454 | |
FNMA | | | 7.50 | | | | 2-1-2016 | | | | 15,133 | | | | 15,190 | |
FNMA | | | 7.50 | | | | 1-1-2031 | | | | 129,426 | | | | 146,856 | |
FNMA | | | 7.50 | | | | 1-1-2033 | | | | 305,624 | | | | 350,029 | |
FNMA | | | 7.50 | | | | 5-1-2033 | | | | 206,263 | | | | 235,892 | |
FNMA | | | 7.50 | | | | 5-1-2033 | | | | 202,300 | | | | 227,659 | |
FNMA | | | 7.50 | | | | 6-1-2033 | | | | 129,685 | | | | 141,444 | |
FNMA | | | 7.50 | | | | 7-1-2033 | | | | 150,087 | | | | 173,233 | |
FNMA | | | 7.50 | | | | 8-1-2033 | | | | 111,836 | | | | 124,980 | |
FNMA | | | 8.00 | | | | 12-1-2026 | | | | 110,176 | | | | 125,369 | |
FNMA | | | 8.00 | | | | 2-1-2030 | | | | 215 | | | | 220 | |
FNMA | | | 8.00 | | | | 3-1-2030 | | | | 344 | | | | 388 | |
FNMA | | | 8.00 | | | | 7-1-2031 | | | | 40,280 | | | | 41,571 | |
FNMA | | | 8.00 | | | | 5-1-2033 | | | | 240,169 | | | | 277,973 | |
FNMA | | | 8.50 | | | | 10-1-2026 | | | | 12,431 | | | | 14,102 | |
FNMA | | | 8.50 | | | | 2-1-2027 | | | | 12,915 | | | | 13,185 | |
FNMA | | | 8.50 | | | | 6-1-2030 | | | | 57,801 | | | | 60,530 | |
FNMA | | | 8.51 | | | | 8-15-2024 | | | | 67,778 | | | | 76,619 | |
FNMA | | | 9.00 | | | | 7-1-2030 | | | | 9,047 | | | | 9,180 | |
FNMA | | | 9.50 | | | | 8-1-2021 | | | | 18,616 | | | | 19,124 | |
FNMA | | | 9.50 | | | | 12-1-2024 | | | | 15,597 | | | | 16,038 | |
FNMA | | | 10.00 | | | | 1-20-2021 | | | | 18,806 | | | | 19,323 | |
FNMA | | | 11.00 | | | | 1-1-2018 | | | | 5,239 | | | | 5,477 | |
FNMA Series 1989-74 Class J | | | 9.80 | | | | 10-25-2019 | | | | 16,792 | | | | 18,685 | |
FNMA Series 1989-96 Class H | | | 9.00 | | | | 12-25-2019 | | | | 7,721 | | | | 8,413 | |
FNMA Series 1992-39 Class FA ± | | | 1.93 | | | | 3-25-2022 | | | | 192,479 | | | | 197,126 | |
FNMA Series 1992-45 Class F ± | | | 1.93 | | | | 4-25-2022 | | | | 34,930 | | | | 34,547 | |
FNMA Series 1992-87 Class Z | | | 8.00 | | | | 5-25-2022 | | | | 22,156 | | | | 24,665 | |
FNMA Series 1993-113 Class FA ± | | | 1.53 | | | | 7-25-2023 | | | | 136,677 | | | | 138,323 | |
FNMA Series 1993-247 Class FM ± | | | 1.86 | | | | 12-25-2023 | | | | 584,229 | | | | 600,382 | |
FNMA Series 1994-14 Class F ± | | | 2.26 | | | | 10-25-2023 | | | | 293,610 | | | | 304,649 | |
FNMA Series 1998-T2 Class A5 ± | | | 4.38 | | | | 1-25-2032 | | | | 448,627 | | | | 456,114 | |
FNMA Series 2001-50 Class BA | | | 7.00 | | | | 10-25-2041 | | | | 250,092 | | | | 289,102 | |
FNMA Series 2001-63 Class FD ± | | | 0.80 | | | | 12-18-2031 | | | | 162,838 | | | | 165,395 | |
FNMA Series 2001-81 Class F ± | | | 0.75 | | | | 1-25-2032 | | | | 109,072 | | | | 110,713 | |
FNMA Series 2001-T08 Class A1 | | | 7.50 | | | | 7-25-2041 | | | | 186,431 | | | | 220,962 | |
FNMA Series 2001-T10 Class A2 | | | 7.50 | | | | 12-25-2041 | | | | 4,086,953 | | | | 4,970,438 | |
| | | | | | |
| Portfolio of investments—August 31, 2015 | | Wells Fargo Advantage Adjustable Rate Government Fund | | | 17 | |
| | | | | | | | | | | | | | | | |
| Security name | | Interest rate | | | Maturity date | | | Principal | | | Value | |
| | | | |
Agency Securities (continued) | | | | | | | | | | | | | | | | |
FNMA Series 2001-T12 Class A2 | | | 7.50 | % | | | 8-25-2041 | | | $ | 301,585 | | | $ | 352,334 | |
FNMA Series 2001-T12 Class A4 ± | | | 3.47 | | | | 8-25-2041 | | | | 7,175,168 | | | | 7,426,787 | |
FNMA Series 2001-W03 Class A ± | | | 6.85 | | | | 9-25-2041 | | | | 835,974 | | | | 950,482 | |
FNMA Series 2001-W1 Class AV1 ± | | | 0.44 | | | | 8-25-2031 | | | | 99,966 | | | | 97,056 | |
FNMA Series 2002-05 Class FD ± | | | 1.10 | | | | 2-25-2032 | | | | 313,600 | | | | 321,599 | |
FNMA Series 2002-33 Class A4 ± | | | 4.67 | | | | 11-25-2030 | | | | 180,316 | | | | 187,677 | |
FNMA Series 2002-59 Class F ± | | | 0.60 | | | | 9-25-2032 | | | | 651,184 | | | | 657,744 | |
FNMA Series 2002-66 Class A3 ± | | | 3.19 | | | | 4-25-2042 | | | | 10,703,098 | | | | 11,342,287 | |
FNMA Series 2002-T12 Class A3 | | | 7.50 | | | | 5-25-2042 | | | | 1,755,534 | | | | 2,154,790 | |
FNMA Series 2002-T12 Class A5 ± | | | 3.58 | | | | 10-25-2041 | | | | 2,631,305 | | | | 2,761,781 | |
FNMA Series 2002-T18 Class A5 ± | | | 3.68 | | | | 5-25-2042 | | | | 4,333,033 | | | | 4,545,343 | |
FNMA Series 2002-T19 Class A4 ± | | | 3.33 | | | | 3-25-2042 | | | | 255,466 | | | | 271,397 | |
FNMA Series 2002-W1 Class 3A ± | | | 3.09 | | | | 4-25-2042 | | | | 1,679,488 | | | | 1,736,047 | |
FNMA Series 2002-W4 Class A6 ± | | | 3.38 | | | | 5-25-2042 | | | | 2,769,139 | | | | 2,903,957 | |
FNMA Series 2003-07 Class A2 ± | | | 2.54 | | | | 5-25-2042 | | | | 1,212,758 | | | | 1,236,064 | |
FNMA Series 2003-17 Class FN ± | | | 0.50 | | | | 3-25-2018 | | | | 393,895 | | | | 394,843 | |
FNMA Series 2003-63 Class A8 ± | | | 2.70 | | | | 1-25-2043 | | | | 1,699,696 | | | | 1,759,789 | |
FNMA Series 2003-W02 Class 1A3 | | | 7.50 | | | | 7-25-2042 | | | | 517,248 | | | | 611,954 | |
FNMA Series 2003-W04 Class 5A ± | | | 2.99 | | | | 10-25-2042 | | | | 1,482,334 | | | | 1,571,626 | |
FNMA Series 2003-W08 Class 4A ± | | | 3.17 | | | | 11-25-2042 | | | | 2,037,153 | | | | 2,133,044 | |
FNMA Series 2003-W10 Class 2A ± | | | 3.09 | | | | 6-25-2043 | | | | 3,858,354 | | | | 4,044,512 | |
FNMA Series 2003-W18 Class 2A ± | | | 3.46 | | | | 6-25-2043 | | | | 13,876,110 | | | | 14,905,107 | |
FNMA Series 2003-W9 Class A ± | | | 0.44 | | | | 6-25-2033 | | | | 3,203,355 | | | | 3,106,729 | |
FNMA Series 2004-31 Class FG ± | | | 0.60 | | | | 8-25-2033 | | | | 610,511 | | | | 612,255 | |
FNMA Series 2004-38 Class FT ± | | | 0.63 | | | | 10-25-2033 | | | | 392,898 | | | | 395,119 | |
FNMA Series 2004-T3 Class 1A3 | | | 7.00 | | | | 2-25-2044 | | | | 702,562 | | | | 805,803 | |
FNMA Series 2004-T3 Class 2A ± | | | 3.24 | | | | 8-25-2043 | | | | 2,346,207 | | | | 2,493,777 | |
FNMA Series 2004-T9 Class A1 ± | | | 0.45 | | | | 4-25-2035 | | | | 462,969 | | | | 461,703 | |
FNMA Series 2004-W02 Class 5A | | | 7.50 | | | | 3-25-2044 | | | | 225,185 | | | | 258,668 | |
FNMA Series 2004-W1 Class 2A2 | | | 7.00 | | | | 12-25-2033 | | | | 406,509 | | | | 475,795 | |
FNMA Series 2004-W1 Class 3A ± | | | 3.45 | | | | 1-25-2043 | | | | 120,936 | | | | 130,523 | |
FNMA Series 2004-W12 Class 2A ± | | | 3.43 | | | | 6-25-2044 | | | | 7,168,626 | | | | 7,593,633 | |
FNMA Series 2004-W15 Class 3A ± | | | 2.69 | | | | 6-25-2044 | | | | 9,233,840 | | | | 10,001,310 | |
FNMA Series 2005-57 Class EG ± | | | 0.50 | | | | 3-25-2035 | | | | 759,839 | | | | 760,774 | |
FNMA Series 2005-W3 Class 3A ± | | | 2.71 | | | | 4-25-2045 | | | | 1,878,960 | | | | 2,011,940 | |
FNMA Series 2006-15 Class FW ± | | | 0.50 | | | | 1-25-2036 | | | | 522,841 | | | | 525,492 | |
FNMA Series 2006-W1 Class 3A ± | | | 2.18 | | | | 10-25-2045 | | | | 9,783,242 | | | | 10,418,429 | |
FNMA Series 2007-95 Class A2 ± | | | 0.45 | | | | 8-27-2036 | | | | 889,100 | | | | 885,740 | |
FNMA Series G92-20 Class FB ± | | | 1.93 | | | | 4-25-2022 | | | | 72,262 | | | | 72,042 | |
FNMA Series G93-1 Class K | | | 6.68 | | | | 1-25-2023 | | | | 564,601 | | | | 621,258 | |
FNMA Series G93-19 Class FD ± | | | 1.53 | | | | 4-25-2023 | | | | 492,872 | | | | 498,913 | |
GNMA ± | | | 2.07 | | | | 8-20-2062 | | | | 7,473,014 | | | | 7,878,844 | |
GNMA ± | | | 2.09 | | | | 9-20-2062 | | | | 2,355,626 | | | | 2,488,530 | |
GNMA | | | 6.45 | | | | 4-20-2025 | | | | 59,464 | | | | 67,805 | |
GNMA | | | 6.45 | | | | 5-20-2025 | | | | 23,262 | | | | 23,916 | |
GNMA | | | 6.45 | | | | 9-20-2025 | | | | 45,761 | | | | 53,992 | |
GNMA | | | 6.50 | | | | 6-20-2034 | | | | 81,508 | | | | 84,258 | |
GNMA | | | 6.50 | | | | 8-20-2034 | | | | 787,844 | | | | 903,900 | |
GNMA | | | 6.50 | | | | 8-20-2034 | | | | 115,356 | | | | 121,454 | |
GNMA | | | 6.75 | | | | 2-15-2029 | | | | 116,965 | | | | 133,643 | |
| | | | |
| 18 | | Wells Fargo Advantage Adjustable Rate Government Fund | | Portfolio of investments—August 31, 2015 |
| | | | | | | | | | | | | | | | |
| Security name | | Interest rate | | | Maturity date | | | Principal | | | Value | |
| | | | |
Agency Securities (continued) | | | | | | | | | | | | | | | | |
GNMA | | | 7.00 | % | | | 7-20-2034 | | | $ | 62,935 | | | $ | 64,604 | |
GNMA | | | 7.25 | | | | 7-15-2017 | | | | 3,306 | | | | 3,316 | |
GNMA | | | 7.25 | | | | 8-15-2017 | | | | 14,556 | | | | 14,710 | |
GNMA | | | 7.25 | | | | 8-15-2017 | | | | 9,436 | | | | 9,535 | |
GNMA | | | 7.25 | | | | 9-15-2017 | | | | 11,597 | | | | 11,731 | |
GNMA | | | 7.25 | | | | 10-15-2017 | | | | 21,644 | | | | 22,356 | |
GNMA | | | 7.25 | | | | 10-15-2017 | | | | 9,215 | | | | 9,313 | |
GNMA | | | 7.25 | | | | 11-15-2017 | | | | 11,096 | | | | 11,222 | |
GNMA | | | 7.25 | | | | 1-15-2018 | | | | 3,895 | | | | 3,907 | |
GNMA | | | 7.25 | | | | 1-15-2018 | | | | 6,764 | | | | 6,787 | |
GNMA | | | 7.25 | | | | 2-15-2018 | | | | 13,143 | | | | 13,302 | |
GNMA | | | 7.25 | | | | 5-15-2018 | | | | 7,364 | | | | 7,389 | |
GNMA | | | 9.00 | | | | 5-15-2016 | | | | 2,129 | | | | 2,138 | |
GNMA | | | 9.00 | | | | 8-15-2016 | | | | 3,383 | | | | 3,397 | |
GNMA | | | 9.00 | | | | 11-15-2016 | | | | 882 | | | | 892 | |
GNMA | | | 9.00 | | | | 12-15-2016 | | | | 94 | | | | 94 | |
GNMA | | | 9.00 | | | | 2-15-2017 | | | | 2,215 | | | | 2,239 | |
GNMA | | | 9.00 | | | | 5-15-2017 | | | | 411 | | | | 413 | |
GNMA | | | 9.00 | | | | 7-15-2017 | | | | 4,861 | | | | 4,883 | |
GNMA | | | 9.00 | | | | 3-15-2020 | | | | 3,039 | | | | 3,097 | |
GNMA | | | 9.00 | | | | 8-15-2021 | | | | 523 | | | | 525 | |
GNMA | | | 9.00 | | | | 8-20-2024 | | | | 333 | | | | 366 | |
GNMA | | | 9.00 | | | | 9-20-2024 | | | | 1,256 | | | | 1,314 | |
GNMA | | | 9.00 | | | | 10-20-2024 | | | | 3,870 | | | | 3,933 | |
GNMA | | | 9.00 | | | | 11-20-2024 | | | | 170 | | | | 171 | |
GNMA | | | 9.00 | | | | 1-20-2025 | | | | 6,733 | | | | 7,739 | |
GNMA | | | 9.00 | | | | 2-20-2025 | | | | 21,970 | | | | 25,213 | |
GNMA Series 2011-H12 Class FA ± | | | 0.68 | | | | 2-20-2061 | | | | 3,011,020 | | | | 3,014,898 | |
GNMA Series 2011-H17 Class FA ± | | | 0.72 | | | | 6-20-2061 | | | | 1,572,970 | | | | 1,576,405 | |
| | | | |
Total Agency Securities (Cost $1,208,326,955) | | | | | | | | | | | | | | | 1,229,610,808 | |
| | | | | | | | | | | | | | | | |
| | | | |
Non-Agency Mortgage-Backed Securities: 0.47% | | | | | | | | | | | | | | | | |
NCUA Guaranteed Notes Program Series 2010-C1 Class A2 | | | 2.90 | | | | 10-29-2020 | | | | 6,121,289 | | | | 6,163,354 | |
| | | | | | | | | | | | | | | | |
| | | | |
Total Non-Agency Mortgage-Backed Securities (Cost $6,164,966) | | | | | | | | | | | | | | | 6,163,354 | |
| | | | | | | | | | | | | | | | |
| | | | |
| | | Yield | | | | | | Shares | | | | |
| Short-Term Investments: 5.18% | | | | | | | | | | | | | | | | |
| | | | |
| Investment Companies: 5.11% | | | | | | | | | | | | | | | | |
Wells Fargo Advantage Government Money Market Fund, Institutional Class (l)(u) | | | 0.01 | | | | | | | | 66,990,777 | | | | 66,990,777 | |
| | | | | | | | | | | | | | | | |
| | | | |
| | | | | | | | | Principal | | | | |
| U.S. Treasury Securities: 0.07% | | | | | | | | | | | | | | | | |
U.S. Treasury Bill #(z) | | | 0.01 | | | | 9-17-2015 | | | $ | 900,000 | | | | 899,999 | |
| | | | | | | | | | | | | | | | |
| | | | |
Total Short-Term Investments (Cost $67,890,774) | | | | | | | | | | | | | | | 67,890,776 | |
| | | | | | | | | | | | | | | | |
| | | | | | | | |
| Total investments in securities (Cost $1,282,382,695) * | | | 99.52 | % | | | 1,303,664,938 | |
Other assets and liabilities, net | | | 0.48 | | | | 6,269,362 | |
| | | | | | | | |
| Total net assets | | | 100.00 | % | | $ | 1,309,934,300 | |
| | | | | | | | |
| | | | | | |
| Portfolio of investments—August 31, 2015 | | Wells Fargo Advantage Adjustable Rate Government Fund | | | 19 | |
| 144A | The security may be resold in transactions exempt from registration, normally to qualified institutional buyers, pursuant to Rule 144A under the Securities Act of 1933. |
| ± | Variable rate investment. The rate shown is the rate in effect at period end. |
| (c) | Investment in an interest-only security entitles holders to receive only the interest payments on the underlying mortgages. The principal amount shown is the notional amount of the underlying mortgages. The rate represents the coupon rate. |
| (l) | The security represents an affiliate of the Fund as defined in the Investment Company Act of 1940. |
| (u) | The rate represents the 7-day annualized yield at period end. |
| # | All or a portion of this security is segregated as collateral for investments in derivative instruments. |
| (z) | Zero coupon security. The rate represents the current yield to maturity. |
| * | Cost for federal income tax purposes is $1,283,147,636 and unrealized gains (losses) consists of: |
| | | | |
Gross unrealized gains | | $ | 22,123,207 | |
Gross unrealized losses | | | (1,605,905 | ) |
| | | | |
Net unrealized gains | | $ | 20,517,302 | |
| | | | | | |
| Portfolio of investments—August 31, 2015 | | Wells Fargo Advantage Government Securities Fund | | | 1 | |
| | | | | | | | | | | | | | | | |
| Security name | | Interest rate | | | Maturity date | | | Principal | | | Value | |
| | | | | | | | | | | | | | | | |
| | | | |
Agency Securities: 66.21% | | | | | | | | | | | | | | | | |
FDIC Series 2010-S1 Class 1A 144A± | | | 0.75 | % | | | 2-25-2048 | | | $ | 4,570,349 | | | $ | 4,571,715 | |
FDIC Series 2013-R1 Class A 144A | | | 1.15 | | | | 3-25-2033 | | | | 4,814,651 | | | | 4,759,164 | |
FHLB | | | 5.63 | | | | 3-14-2036 | | | | 6,150,000 | | | | 8,004,717 | |
FHLMC ¤ | | | 0.00 | | | | 11-20-2015 | | | | 14,000,000 | | | | 13,995,548 | |
FHLMC ± | | | 1.38 | | | | 12-15-2036 | | | | 820,780 | | | | 849,548 | |
FHLMC ± | | | 2.33 | | | | 10-1-2026 | | | | 212,031 | | | | 221,372 | |
FHLMC ± | | | 2.41 | | | | 9-1-2031 | | | | 9,209 | | | | 9,411 | |
FHLMC ± | | | 2.41 | | | | 9-1-2031 | | | | 54,471 | | | | 54,921 | |
FHLMC ± | | | 2.50 | | | | 6-1-2032 | | | | 82,440 | | | | 86,860 | |
FHLMC ± | | | 2.53 | | | | 1-1-2038 | | | | 1,096,105 | | | | 1,183,708 | |
FHLMC ± | | | 2.65 | | | | 7-1-2029 | | | | 151,633 | | | | 158,192 | |
FHLMC ± | | | 2.90 | | | | 5-1-2026 | | | | 107,588 | | | | 113,143 | |
FHLMC ± | | | 3.07 | | | | 7-1-2032 | | | | 1,316,137 | | | | 1,300,022 | |
FHLMC %% | | | 3.50 | | | | 9-14-2045 | | | | 54,565,000 | | | | 56,424,472 | |
FHLMC | | | 4.00 | | | | 6-1-2044 | | | | 10,836,264 | | | | 11,498,872 | |
FHLMC | | | 4.50 | | | | 3-1-2042 | | | | 947,734 | | | | 1,029,689 | |
FHLMC | | | 5.00 | | | | 5-1-2018 | | | | 170,059 | | | | 177,213 | |
FHLMC | | | 5.00 | | | | 4-1-2019 | | | | 176,380 | | | | 183,799 | |
FHLMC | | | 5.00 | | | | 4-1-2019 | | | | 161,509 | | | | 168,303 | |
FHLMC | | | 5.00 | | | | 6-1-2019 | | | | 268,763 | | | | 284,438 | |
FHLMC | | | 5.00 | | | | 8-1-2019 | | | | 966,860 | | | | 1,023,195 | |
FHLMC | | | 5.00 | | | | 10-1-2019 | | | | 372,178 | | | | 388,802 | |
FHLMC | | | 5.00 | | | | 2-1-2020 | | | | 1,021,786 | | | | 1,070,827 | |
FHLMC | | | 5.00 | | | | 8-1-2040 | | | | 2,715,886 | | | | 2,996,682 | |
FHLMC | | | 5.50 | | | | 7-1-2035 | | | | 6,551,164 | | | | 7,331,479 | |
FHLMC | | | 5.50 | | | | 12-1-2038 | | | | 4,456,485 | | | | 4,956,852 | |
FHLMC | | | 6.00 | | | | 1-1-2024 | | | | 2,645,801 | | | | 2,883,866 | |
FHLMC | | | 6.00 | | | | 10-1-2032 | | | | 59,908 | | | | 68,359 | |
FHLMC | | | 6.00 | | | | 5-25-2043 | | | | 6,335,211 | | | | 7,158,566 | |
FHLMC ± | | | 6.38 | | | | 1-1-2026 | | | | 75,392 | | | | 77,254 | |
FHLMC | | | 6.50 | | | | 4-1-2018 | | | | 13,431 | | | | 13,810 | |
FHLMC | | | 6.50 | | | | 4-1-2021 | | | | 23,943 | | | | 24,947 | |
FHLMC | | | 6.50 | | | | 4-1-2022 | | | | 107,431 | | | | 122,731 | |
FHLMC | | | 6.50 | | | | 9-1-2028 | | | | 32,838 | | | | 37,515 | |
FHLMC | | | 6.50 | | | | 9-1-2028 | | | | 22,629 | | | | 25,852 | |
FHLMC | | | 6.50 | | | | 7-1-2031 | | | | 5 | | | | 6 | |
FHLMC | | | 6.50 | | | | 8-1-2037 | | | | 213,461 | | | | 230,522 | |
FHLMC | | | 7.00 | | | | 12-1-2023 | | | | 5,400 | | | | 6,139 | |
FHLMC | | | 7.00 | | | | 5-1-2024 | | | | 10,647 | | | | 10,855 | |
FHLMC | | | 7.00 | | | | 12-1-2026 | | | | 4,126 | | | | 4,423 | |
FHLMC | | | 7.00 | | | | 12-1-2026 | | | | 833 | | | | 935 | |
FHLMC | | | 7.00 | | | | 4-1-2029 | | | | 2,928 | | | | 3,479 | |
FHLMC | | | 7.00 | | | | 4-1-2029 | | | | 1,625 | | | | 1,630 | |
FHLMC | | | 7.00 | | | | 5-1-2029 | | | | 19,936 | | | | 23,081 | |
FHLMC | | | 7.00 | | | | 4-1-2032 | | | | 183,460 | | | | 220,490 | |
FHLMC | | | 7.50 | | | | 11-1-2031 | | | | 287,541 | | | | 344,775 | |
FHLMC | | | 7.50 | | | | 4-1-2032 | | | | 240,277 | | | | 284,868 | |
FHLMC | | | 8.00 | | | | 2-1-2017 | | | | 4,609 | | | | 4,741 | |
FHLMC | | | 8.00 | | | | 8-1-2023 | | | | 24,803 | �� | | | 27,045 | |
FHLMC | | | 8.00 | | | | 6-1-2024 | | | | 7,860 | | | | 8,960 | |
| | | | |
| 2 | | Wells Fargo Advantage Government Securities Fund | | Portfolio of investments—August 31, 2015 |
| | | | | | | | | | | | | | | | |
| Security name | | Interest rate | | | Maturity date | | | Principal | | | Value | |
| | | | | | | | | | | | | | | | |
| | | | |
Agency Securities (continued) | | | | | | | | | | | | | | | | |
FHLMC | | | 8.00 | % | | | 6-1-2024 | | | $ | 3,724 | | | $ | 3,843 | |
FHLMC | | | 8.00 | | | | 6-1-2024 | | | | 10,319 | | | | 11,474 | |
FHLMC | | | 8.00 | | | | 8-1-2026 | | | | 24,537 | | | | 29,956 | |
FHLMC | | | 8.00 | | | | 11-1-2026 | | | | 25,818 | | | | 31,017 | |
FHLMC | | | 8.00 | | | | 11-1-2028 | | | | 18,379 | | | | 21,343 | |
FHLMC | | | 8.50 | | | | 7-1-2022 | | | | 4,695 | | | | 5,224 | |
FHLMC | | | 8.50 | | | | 12-1-2025 | | | | 16,308 | | | | 18,886 | |
FHLMC | | | 8.50 | | | | 5-1-2026 | | | | 2,565 | | | | 2,906 | |
FHLMC | | | 8.50 | | | | 8-1-2026 | | | | 6,344 | | | | 6,541 | |
FHLMC | | | 8.50 | | | | 8-1-2026 | | | | 24,718 | | | | 24,826 | |
FHLMC | | | 9.00 | | | | 6-1-2016 | | | | 606 | | | | 610 | |
FHLMC | | | 9.00 | | | | 1-1-2017 | | | | 3,241 | | | | 3,271 | |
FHLMC | | | 9.00 | | | | 4-1-2017 | | | | 4,704 | | | | 4,753 | |
FHLMC | | | 9.00 | | | | 11-1-2018 | | | | 16,118 | | | | 16,276 | |
FHLMC | | | 9.00 | | | | 8-1-2019 | | | | 366 | | | | 385 | |
FHLMC | | | 9.00 | | | | 8-1-2019 | | | | 71 | | | | 72 | |
FHLMC | | | 9.00 | | | | 12-1-2019 | | | | 171 | | | | 185 | |
FHLMC | | | 9.00 | | | | 1-1-2020 | | | | 18 | | | | 18 | |
FHLMC | | | 9.00 | | | | 2-1-2020 | | | | 123 | | | | 134 | |
FHLMC | | | 9.00 | | | | 3-1-2020 | | | | 1,747 | | | | 1,775 | |
FHLMC | | | 9.00 | | | | 3-1-2020 | | | | 241 | | | | 249 | |
FHLMC | | | 9.00 | | | | 9-1-2020 | | | | 685 | | | | 711 | |
FHLMC | | | 9.00 | | | | 9-1-2020 | | | | 183 | | | | 199 | |
FHLMC | | | 9.00 | | | | 12-1-2020 | | | | 28 | | | | 28 | |
FHLMC | | | 9.00 | | | | 3-1-2021 | | | | 3,796 | | | | 4,133 | |
FHLMC | | | 9.00 | | | | 4-1-2021 | | | | 28,742 | | | | 29,111 | |
FHLMC | | | 9.00 | | | | 4-1-2021 | | | | 3,261 | | | | 3,370 | |
FHLMC | | | 9.00 | | | | 4-1-2021 | | | | 203 | | | | 225 | |
FHLMC | | | 9.00 | | | | 7-1-2021 | | | | 4,282 | | | | 4,302 | |
FHLMC | | | 9.00 | | | | 7-1-2021 | | | | 3,793 | | | | 3,927 | |
FHLMC | | | 9.00 | | | | 8-1-2021 | | | | 516 | | | | 580 | |
FHLMC | | | 9.00 | | | | 7-1-2022 | | | | 561 | | | | 570 | |
FHLMC | | | 9.00 | | | | 9-1-2024 | | | | 1,425 | | | | 1,578 | |
FHLMC | | | 9.50 | | | | 9-1-2016 | | | | 10 | | | | 10 | |
FHLMC | | | 9.50 | | | | 10-1-2016 | | | | 82 | | | | 84 | |
FHLMC | | | 9.50 | | | | 8-1-2018 | | | | 26 | | | | 26 | |
FHLMC | | | 9.50 | | | | 8-1-2019 | | | | 117 | | | | 127 | |
FHLMC | | | 9.50 | | | | 2-1-2020 | | | | 6 | | | | 6 | |
FHLMC | | | 9.50 | | | | 6-1-2020 | | | | 59 | | | | 65 | |
FHLMC | | | 9.50 | | | | 8-1-2020 | | | | 268 | | | | 296 | |
FHLMC | | | 9.50 | | | | 9-1-2020 | | | | 18 | | | | 18 | |
FHLMC | | | 9.50 | | | | 9-1-2020 | | | | 3,136 | | | | 3,353 | |
FHLMC | | | 9.50 | | | | 9-1-2020 | | | | 43 | | | | 47 | |
FHLMC | | | 9.50 | | | | 10-1-2020 | | | | 32 | | | | 34 | |
FHLMC | | | 9.50 | | | | 10-1-2020 | | | | 65 | | | | 72 | |
FHLMC | | | 9.50 | | | | 11-1-2020 | | | | 77 | | | | 85 | |
FHLMC | | | 9.50 | | | | 5-1-2021 | | | | 223 | | | | 249 | |
FHLMC | | | 9.50 | | | | 9-17-2022 | | | | 450,217 | | | | 476,894 | |
FHLMC | | | 9.50 | | | | 4-1-2025 | | | | 55,380 | | | | 63,703 | |
FHLMC | | | 10.00 | | | | 8-1-2017 | | | | 7 | | | | 7 | |
| | | | | | |
| Portfolio of investments—August 31, 2015 | | Wells Fargo Advantage Government Securities Fund | | | 3 | |
| | | | | | | | | | | | | | | | |
| Security name | | Interest rate | | | Maturity date | | | Principal | | | Value | |
| | | | | | | | | | | | | | | | |
| | | | |
Agency Securities (continued) | | | | | | | | | | | | | | | | |
FHLMC | | | 10.00 | % | | | 1-1-2019 | | | $ | 7 | | | $ | 8 | |
FHLMC | | | 10.00 | | | | 12-1-2019 | | | | 230 | | | | 253 | |
FHLMC | | | 10.00 | | | | 3-1-2020 | | | | 10 | | | | 10 | |
FHLMC | | | 10.00 | | | | 6-1-2020 | | | | 26 | | | | 29 | |
FHLMC | | | 10.00 | | | | 7-1-2020 | | | | 10 | | | | 10 | |
FHLMC | | | 10.00 | | | | 8-1-2020 | | | | 35 | | | | 38 | |
FHLMC | | | 10.00 | | | | 10-1-2021 | | | | 49,466 | | | | 54,049 | |
FHLMC | | | 10.00 | | | | 8-17-2022 | | | | 183,928 | | | | 198,591 | |
FHLMC | | | 10.00 | | | | 2-17-2025 | | | | 520,864 | | | | 593,115 | |
FHLMC | | | 10.50 | | | | 2-1-2019 | | | | 19 | | | | 19 | |
FHLMC | | | 10.50 | | | | 5-1-2019 | | | | 77 | | | | 78 | |
FHLMC | | | 10.50 | | | | 6-1-2019 | | | | 8 | | | | 9 | |
FHLMC | | | 10.50 | | | | 8-1-2019 | | | | 13,476 | | | | 14,627 | |
FHLMC | | | 10.50 | | | | 12-1-2019 | | | | 16,538 | | | | 16,765 | |
FHLMC | | | 10.50 | | | | 5-1-2020 | | | | 29,132 | | | | 32,086 | |
FHLMC | | | 10.50 | | | | 5-1-2020 | | | | 4,174 | | | | 4,238 | |
FHLMC | | | 10.50 | | | | 8-1-2020 | | | | 12,454 | | | | 12,579 | |
FHLMC | | | 10.50 | | | | 8-1-2020 | | | | 29,102 | | | | 30,329 | |
FHLMC Series 16 Class D | | | 10.00 | | | | 10-15-2019 | | | | 7,826 | | | | 8,158 | |
FHLMC Series 2015-SC01 Class 1A | | | 3.50 | | | | 5-25-2045 | | | | 5,665,440 | | | | 5,728,207 | |
FHLMC Series 2758 Class FH ± | | | 0.55 | | | | 3-15-2019 | | | | 2,132,363 | | | | 2,137,801 | |
FHLMC Series 2882 Class TF ± | | | 0.45 | | | | 10-15-2034 | | | | 1,830,519 | | | | 1,835,607 | |
FHLMC Series 3221 Class VA | | | 5.00 | | | | 9-15-2017 | | | | 1,543,612 | | | | 1,551,951 | |
FHLMC Series 3706 Class C | | | 2.00 | | | | 8-15-2020 | | | | 4,177,716 | | | | 4,232,506 | |
FHLMC Series 3767 Class PD | | | 4.00 | | | | 7-15-2040 | | | | 290,412 | | | | 302,090 | |
FHLMC Series 3948 Class DA | | | 3.00 | | | | 12-15-2024 | | | | 852,619 | | | | 884,193 | |
FHLMC Series K020 Class X1 ±(c) | | | 1.59 | | | | 5-25-2022 | | | | 47,442,428 | | | | 3,738,606 | |
FHLMC Series T-15 Class A6 ± | | | 0.59 | | | | 11-25-2028 | | | | 217,631 | | | | 216,218 | |
FHLMC Series T-23 Class A ± | | | 0.48 | | | | 5-25-2030 | | | | 934,746 | | | | 923,765 | |
FHLMC Series T-35 Class A ± | | | 0.48 | | | | 9-25-2031 | | | | 979,487 | | | | 967,757 | |
FHLMC Series T-42 Class A6 | | | 9.50 | | | | 2-25-2042 | | | | 1,180,380 | | | | 1,462,513 | |
FHLMC Series T-55 Class 2A1 ± | | | 2.84 | | | | 3-25-2043 | | | | 662,914 | | | | 668,301 | |
FHLMC Series T-57 Class 1A1 | | | 6.50 | | | | 7-25-2043 | | | | 1,525,949 | | | | 1,782,262 | |
FHLMC Series T-57 Class 2A1 ± | | | 3.26 | | | | 7-25-2043 | | | | 3,016,023 | | | | 3,181,720 | |
FHLMC Series T-67 Class 1A1C ± | | | 2.91 | | | | 3-25-2036 | | | | 1,552,430 | | | | 1,638,177 | |
FHLMC Series T-67 Class 2A1C ± | | | 2.88 | | | | 3-25-2036 | | | | 2,814,755 | | | | 2,932,240 | |
FHLMC Series T-75 Class A1 ± | | | 0.24 | | | | 12-25-2036 | | | | 5,025,728 | | | | 5,001,173 | |
FNMA ¤ | | | 0.00 | | | | 11-25-2015 | | | | 40,000,000 | | | | 39,986,480 | |
FNMA ± | | | 0.45 | | | | 6-27-2036 | | | | 489,872 | | | | 489,419 | |
FNMA ± | | | 1.85 | | | | 1-1-2043 | | | | 1,867,237 | | | | 1,917,370 | |
FNMA ± | | | 2.12 | | | | 5-1-2036 | | | | 2,901,403 | | | | 3,052,976 | |
FNMA ± | | | 2.13 | | | | 12-1-2035 | | | | 1,601,995 | | | | 1,694,900 | |
FNMA ± | | | 2.13 | | | | 5-1-2036 | | | | 2,312,298 | | | | 2,455,846 | |
FNMA ± | | | 2.27 | | | | 4-1-2032 | | | | 120,210 | | | | 122,642 | |
FNMA ± | | | 2.32 | | | | 8-1-2036 | | | | 2,963,088 | | | | 3,160,368 | |
FNMA ± | | | 2.33 | | | | 11-1-2031 | | | | 199,466 | | | | 209,522 | |
FNMA ± | | | 2.34 | | | | 5-1-2023 | | | | 955,074 | | | | 972,747 | |
FNMA ± | | | 2.36 | | | | 9-1-2036 | | | | 1,417,139 | | | | 1,507,808 | |
FNMA ± | | | 2.38 | | | | 9-1-2031 | | | | 75,059 | | | | 79,333 | |
FNMA ± | | | 2.40 | | | | 12-1-2034 | | | | 1,733,668 | | | | 1,847,365 | |
| | | | |
| 4 | | Wells Fargo Advantage Government Securities Fund | | Portfolio of investments—August 31, 2015 |
| | | | | | | | | | | | | | | | |
| Security name | | Interest rate | | | Maturity date | | | Principal | | | Value | |
| | | | | | | | | | | | | | | | |
| | | | |
Agency Securities (continued) | | | | | | | | | | | | | | | | |
FNMA ± | | | 2.43 | % | | | 12-1-2040 | | | $ | 83,783 | | | $ | 89,014 | |
FNMA ± | | | 2.47 | | | | 6-1-2032 | | | | 168,506 | | | | 177,367 | |
FNMA ± | | | 2.50 | | | | 9-1-2031 | | | | 448,267 | | | | 470,231 | |
FNMA | | | 2.50 | | | | 4-25-2039 | | | | 295,241 | | | | 296,905 | |
FNMA ± | | | 2.55 | | | | 6-1-2034 | | | | 777,120 | | | | 822,551 | |
FNMA ± | | | 2.60 | | | | 9-1-2027 | | | | 549,766 | | | | 586,596 | |
FNMA ± | | | 2.60 | | | | 10-1-2027 | | | | 237,767 | | | | 248,707 | |
FNMA | | | 2.63 | | | | 9-6-2024 | | | | 16,000,000 | | | | 16,117,840 | |
FNMA ± | | | 2.84 | | | | 1-1-2033 | | | | 45,293 | | | | 45,532 | |
FNMA ± | | | 2.96 | | | | 7-1-2026 | | | | 420,549 | | | | 447,007 | |
FNMA | | | 3.00 | | | | 4-1-2022 | | | | 1,070,659 | | | | 1,115,624 | |
FNMA %% | | | 3.00 | | | | 9-17-2030 | | | | 18,235,000 | | | | 18,915,964 | |
FNMA %% | | | 3.00 | | | | 9-14-2045 | | | | 50,715,000 | | | | 50,936,878 | |
FNMA ± | | | 3.01 | | | | 5-1-2036 | | | | 1,192,993 | | | | 1,270,984 | |
FNMA ± | | | 3.14 | | | | 2-1-2027 | | | | 626,474 | | | | 634,916 | |
FNMA ± | | | 3.46 | | | | 4-1-2033 | | | | 79,255 | | | | 82,549 | |
FNMA %% | | | 3.50 | | | | 9-17-2030 | | | | 23,385,000 | | | | 24,634,636 | |
FNMA %% | | | 3.50 | | | | 9-14-2045 | | | | 34,805,000 | | | | 36,067,350 | |
FNMA ± | | | 3.78 | | | | 9-1-2028 | | | | 196,665 | | | | 204,321 | |
FNMA | | | 4.00 | | | | 5-1-2021 | | | | 1,000,907 | | | | 1,048,051 | |
FNMA %% | | | 4.00 | | | | 9-14-2045 | | | | 58,150,000 | | | | 61,768,483 | |
FNMA ± | | | 4.11 | | | | 7-1-2033 | | | | 158,521 | | | | 163,354 | |
FNMA | | | 4.50 | | | | 12-1-2018 | | | | 712,800 | | | | 740,583 | |
FNMA | | | 4.50 | | | | 1-1-2026 | | | | 8,705,800 | | | | 9,051,541 | |
FNMA %% | | | 4.50 | | | | 9-14-2045 | | | | 59,157,000 | | | | 64,090,670 | |
FNMA | | | 4.68 | | | | 2-1-2020 | | | | 3,222,659 | | | | 3,579,947 | |
FNMA | | | 4.79 | | | | 5-1-2019 | | | | 2,135,656 | | | | 2,354,608 | |
FNMA | | | 5.00 | | | | 12-1-2018 | | | | 533,158 | | | | 554,907 | |
FNMA | | | 5.00 | | | | 6-1-2019 | | | | 465,878 | | | | 484,882 | |
FNMA | | | 5.00 | | | | 6-1-2023 | | | | 1,250,520 | | | | 1,350,876 | |
FNMA | | | 5.00 | | | | 3-1-2034 | | | | 1,044,652 | | | | 1,157,060 | |
FNMA | | | 5.00 | | | | 8-1-2040 | | | | 20,600,847 | | | | 22,821,692 | |
FNMA | | | 5.22 | | | | 10-1-2015 | | | | 3,136,384 | | | | 3,140,404 | |
FNMA | | | 5.30 | | | | 4-1-2017 | | | | 6,196,583 | | | | 6,466,756 | |
FNMA | | | 5.38 | | | | 5-1-2017 | | | | 700,028 | | | | 733,708 | |
FNMA | | | 5.39 | | | | 1-1-2024 | | | | 2,416,940 | | | | 2,745,081 | |
FNMA | | | 5.50 | | | | 6-1-2016 | | | | 43,985 | | | | 44,493 | |
FNMA | | | 5.50 | | | | 11-1-2023 | | | | 180,821 | | | | 198,605 | |
FNMA | | | 5.50 | | | | 1-1-2025 | | | | 149,760 | | | | 160,810 | |
FNMA | | | 5.50 | | | | 1-1-2025 | | | | 661,756 | | | | 714,303 | |
FNMA | | | 5.50 | | | | 8-1-2033 | | | | 6,832,846 | | | | 7,674,115 | |
FNMA | | | 5.50 | | | | 9-1-2033 | | | | 3,596,486 | | | | 4,056,114 | |
FNMA | | | 5.50 | | | | 9-1-2033 | | | | 1,618,626 | | | | 1,824,002 | |
FNMA | | | 5.50 | | | | 8-1-2035 | | | | 1,126,282 | | | | 1,260,548 | |
FNMA | | | 5.50 | | | | 1-1-2037 | | | | 1,317,244 | | | | 1,477,734 | |
FNMA %% | | | 5.50 | | | | 4-1-2040 | | | | 3,248,744 | | | | 3,648,214 | |
FNMA | | | 5.55 | | | | 5-1-2016 | | | | 2,674,876 | | | | 2,750,884 | |
FNMA | | | 5.55 | | | | 9-1-2019 | | | | 983,857 | | | | 1,022,187 | |
FNMA | | | 5.61 | | | | 2-1-2021 | | | | 2,356,167 | | | | 2,572,876 | |
FNMA | | | 5.63 | | | | 2-1-2018 | | | | 1,059,799 | | | | 1,158,091 | |
| | | | | | |
| Portfolio of investments—August 31, 2015 | | Wells Fargo Advantage Government Securities Fund | | | 5 | |
| | | | | | | | | | | | | | | | |
| Security name | | Interest rate | | | Maturity date | | | Principal | | | Value | |
| | | | | | | | | | | | | | | | |
| | | | |
Agency Securities (continued) | | | | | | | | | | | | | | | | |
FNMA | | | 5.67 | % | | | 11-1-2021 | | | $ | 5,408,112 | | | $ | 5,777,922 | |
FNMA | | | 5.70 | | | | 3-1-2016 | | | | 910,821 | | | | 928,576 | |
FNMA | | | 5.75 | | | | 5-1-2021 | | | | 3,427,271 | | | | 3,862,272 | |
FNMA | | | 5.79 | | | | 10-1-2017 | | | | 1,051,487 | | | | 1,138,024 | |
FNMA | | | 5.95 | | | | 6-1-2024 | | | | 1,734,919 | | | | 2,028,360 | |
FNMA | | | 6.00 | | | | 5-1-2016 | | | | 12,229 | | | | 12,330 | |
FNMA | | | 6.00 | | | | 3-1-2024 | | | | 138,629 | | | | 156,558 | |
FNMA | | | 6.00 | | | | 2-1-2035 | | | | 2,000,358 | | | | 2,229,014 | |
FNMA | | | 6.00 | | | | 11-1-2037 | | | | 1,041,774 | | | | 1,175,607 | |
FNMA %% | | | 6.00 | | | | 9-14-2045 | | | | 15,585,000 | | | | 17,621,191 | |
FNMA | | | 6.08 | | | | 1-1-2019 | | | | 563,313 | | | | 582,790 | |
FNMA | | | 6.50 | | | | 6-1-2017 | | | | 48,966 | | | | 50,088 | |
FNMA | | | 6.50 | | | | 1-1-2024 | | | | 43,202 | | | | 49,586 | |
FNMA | | | 6.50 | | | | 3-1-2028 | | | | 36,886 | | | | 40,744 | |
FNMA | | | 6.50 | | | | 12-1-2029 | | | | 423,917 | | | | 486,553 | |
FNMA | | | 6.50 | | | | 11-1-2031 | | | | 102,376 | | | | 118,688 | |
FNMA | | | 6.50 | | | | 7-1-2036 | | | | 674,287 | | | | 773,917 | |
FNMA | | | 6.50 | | | | 7-1-2036 | | | | 557,461 | | | | 667,451 | |
FNMA | | | 6.50 | | | | 7-25-2042 | | | | 2,183,325 | | | | 2,467,955 | |
FNMA | | | 6.63 | | | | 11-15-2030 | | | | 4,150,000 | | | | 5,926,532 | |
FNMA | | | 6.65 | | | | 5-1-2016 | | | | 1,362,137 | | | | 1,410,251 | |
FNMA | | | 7.00 | | | | 11-1-2026 | | | | 13,106 | | | | 15,124 | |
FNMA | | | 7.00 | | | | 9-1-2031 | | | | 5,629 | | | | 5,645 | |
FNMA | | | 7.00 | | | | 1-1-2032 | | | | 6,603 | | | | 7,553 | |
FNMA | | | 7.00 | | | | 2-1-2032 | | | | 8,062 | | | | 8,330 | |
FNMA | | | 7.00 | | | | 2-1-2032 | | | | 139,859 | | | | 168,706 | |
FNMA | | | 7.00 | | | | 10-1-2032 | | | | 325,158 | | | | 384,199 | |
FNMA | | | 7.00 | | | | 2-1-2034 | | | | 3,210 | | | | 3,725 | |
FNMA | | | 7.00 | | | | 4-1-2034 | | | | 265,212 | | | | 310,832 | |
FNMA | | | 7.00 | | | | 1-1-2036 | | | | 6,781 | | | | 7,356 | |
FNMA | | | 7.00 | | | | 9-1-2036 | | | | 154,151 | | | | 164,533 | |
FNMA | | | 7.50 | | | | 9-1-2031 | | | | 135,250 | | | | 167,982 | |
FNMA | | | 7.50 | | | | 11-25-2031 | | | | 686,780 | | | | 797,954 | |
FNMA | | | 7.50 | | | | 2-1-2032 | | | | 50,013 | | | | 60,520 | |
FNMA | | | 7.50 | | | | 10-1-2037 | | | | 1,758,625 | | | | 2,037,355 | |
FNMA | | | 8.00 | | | | 5-1-2027 | | | | 54,183 | | | | 57,118 | |
FNMA | | | 8.00 | | | | 10-1-2027 | | | | 9,810 | | | | 9,943 | |
FNMA | | | 8.00 | | | | 6-1-2028 | | | | 7,990 | | | | 9,125 | |
FNMA | | | 8.00 | | | | 2-1-2030 | | | | 163,785 | | | | 188,301 | |
FNMA | | | 8.00 | | | | 7-1-2031 | | | | 1,835,646 | | | | 2,247,741 | |
FNMA | | | 8.50 | | | | 5-1-2017 | | | | 116,659 | | | | 121,250 | |
FNMA | | | 8.50 | | | | 5-1-2017 | | | | 1,528 | | | | 1,591 | |
FNMA | | | 8.50 | | | | 8-1-2024 | | | | 32,783 | | | | 36,830 | |
FNMA | | | 8.50 | | | | 5-1-2026 | | | | 188,609 | | | | 213,362 | |
FNMA | | | 8.50 | | | | 7-1-2026 | | | | 30,825 | | | | 33,011 | |
FNMA | | | 8.50 | | | | 8-1-2026 | | | | 15,602 | | | | 15,950 | |
FNMA | | | 8.50 | | | | 9-1-2026 | | | | 161 | | | | 162 | |
FNMA | | | 8.50 | | | | 10-1-2026 | | | | 33,880 | | | | 34,486 | |
FNMA | | | 8.50 | | | | 10-1-2026 | | | | 357 | | | | 375 | |
FNMA | | | 8.50 | | | | 10-1-2026 | | | | 8,261 | | | | 8,294 | |
| | | | |
| 6 | | Wells Fargo Advantage Government Securities Fund | | Portfolio of investments—August 31, 2015 |
| | | | | | | | | | | | | | | | |
| Security name | | Interest rate | | | Maturity date | | | Principal | | | Value | |
| | | | | | | | | | | | | | | | |
| | | | |
Agency Securities (continued) | | | | | | | | | | | | | | | | |
FNMA | | | 8.50 | % | | | 11-1-2026 | | | $ | 33,885 | | | $ | 34,985 | |
FNMA | | | 8.50 | | | | 11-1-2026 | | | | 10,827 | | | | 11,512 | |
FNMA | | | 8.50 | | | | 12-1-2026 | | | | 211,103 | | | | 244,540 | |
FNMA | | | 8.50 | | | | 12-1-2026 | | | | 21,509 | | | | 24,659 | |
FNMA | | | 8.50 | | | | 12-1-2026 | | | | 320 | | | | 321 | |
FNMA | | | 8.50 | | | | 2-1-2027 | | | | 8,512 | | | | 8,588 | |
FNMA | | | 8.50 | | | | 2-1-2027 | | | | 392 | | | | 451 | |
FNMA | | | 8.50 | | | | 3-1-2027 | | | | 2,855 | | | | 2,866 | |
FNMA | | | 8.50 | | | | 3-1-2027 | | | | 1,253 | | | | 1,440 | |
FNMA | | | 8.50 | | | | 6-1-2027 | | | | 191,166 | | | | 210,981 | |
FNMA | | | 8.50 | | | | 7-1-2029 | | | | 931 | | | | 935 | |
FNMA | | | 9.00 | | | | 3-1-2021 | | | | 27,168 | | | | 28,382 | |
FNMA | | | 9.00 | | | | 6-1-2021 | | | | 187 | | | | 207 | |
FNMA | | | 9.00 | | | | 7-1-2021 | | | | 44,390 | | | | 48,752 | |
FNMA | | | 9.00 | | | | 8-1-2021 | | | | 247 | | | | 276 | |
FNMA | | | 9.00 | | | | 10-1-2021 | | | | 14,536 | | | | 14,646 | |
FNMA | | | 9.00 | | | | 1-1-2025 | | | | 2,765 | | | | 2,822 | |
FNMA | | | 9.00 | | | | 1-1-2025 | | | | 22,345 | | | | 25,512 | |
FNMA | | | 9.00 | | | | 2-1-2025 | | | | 8,072 | | | | 8,106 | |
FNMA | | | 9.00 | | | | 3-1-2025 | | | | 218 | | | | 218 | |
FNMA | | | 9.00 | | | | 3-1-2025 | | | | 2,430 | | | | 2,443 | |
FNMA | | | 9.00 | | | | 3-1-2025 | | | | 1,465 | | | | 1,472 | |
FNMA | | | 9.00 | | | | 4-1-2025 | | | | 3,167 | | | | 3,180 | |
FNMA | | | 9.00 | | | | 7-1-2028 | | | | 36,664 | | | | 38,883 | |
FNMA | | | 9.50 | | | | 11-1-2020 | | | | 179 | | | | 199 | |
FNMA | | | 9.50 | | | | 12-15-2020 | | | | 49,793 | | | | 55,473 | |
FNMA | | | 9.50 | | | | 1-1-2021 | | | | 24,770 | | | | 26,039 | |
FNMA | | | 9.50 | | | | 6-1-2022 | | | | 3,323 | | | | 3,375 | |
FNMA | | | 9.50 | | | | 7-1-2028 | | | | 59,261 | | | | 62,674 | |
FNMA | | | 10.00 | | | | 12-1-2020 | | | | 71,639 | | | | 79,528 | |
FNMA | | | 11.00 | | | | 2-1-2019 | | | | 7,067 | | | | 7,150 | |
FNMA | | | 11.00 | | | | 10-15-2020 | | | | 1,124 | | | | 1,151 | |
FNMA Series 161 Class 2 (c) | | | 8.50 | | | | 7-25-2022 | | | | 58,028 | | | | 13,455 | |
FNMA Series 1988-2 Class Z | | | 10.10 | | | | 2-25-2018 | | | | 268 | | | | 270 | |
FNMA Series 1988-7 Class Z | | | 9.25 | | | | 4-25-2018 | | | | 16,476 | | | | 17,561 | |
FNMA Series 1989-10 Class Z | | | 9.50 | | | | 3-25-2019 | | | | 126,087 | | | | 137,324 | |
FNMA Series 1989-100 Class Z | | | 8.75 | | | | 12-25-2019 | | | | 70,611 | | | | 77,068 | |
FNMA Series 1989-12 Class Y | | | 10.00 | | | | 3-25-2019 | | | | 149,631 | | | | 163,378 | |
FNMA Series 1989-22 Class G | | | 10.00 | | | | 5-25-2019 | | | | 145,622 | | | | 160,802 | |
FNMA Series 1989-63 Class Z | | | 9.40 | | | | 10-25-2019 | | | | 14,279 | | | | 15,385 | |
FNMA Series 1989-98 Class E | | | 9.20 | | | | 12-25-2019 | | | | 45,056 | | | | 48,695 | |
FNMA Series 1990-144 Class W | | | 9.50 | | | | 12-25-2020 | | | | 95,564 | | | | 107,101 | |
FNMA Series 1990-75 Class Z | | | 9.50 | | | | 7-25-2020 | | | | 120,137 | | | | 134,276 | |
FNMA Series 1990-84 Class Y | | | 9.00 | | | | 7-25-2020 | | | | 23,495 | | | | 25,832 | |
FNMA Series 1990-96 Class Z | | | 9.67 | | | | 8-25-2020 | | | | 162,662 | | | | 182,822 | |
FNMA Series 1991-5 Class Z | | | 8.75 | | | | 1-25-2021 | | | | 36,493 | | | | 39,943 | |
FNMA Series 1991-85 Class Z | | | 8.00 | | | | 6-25-2021 | | | | 79,249 | | | | 85,177 | |
FNMA Series 1992-45 Class Z | | | 8.00 | | | | 4-25-2022 | | | | 127,851 | | | | 145,323 | |
FNMA Series 1999-W6 Class A ± | | | 9.09 | | | | 9-25-2028 | | | | 13,600 | | | | 14,143 | |
FNMA Series 2000-T6 Class A2 | | | 9.50 | | | | 6-25-2030 | | | | 1,126,280 | | | | 1,346,635 | |
| | | | | | |
| Portfolio of investments—August 31, 2015 | | Wells Fargo Advantage Government Securities Fund | | | 7 | |
| | | | | | | | | | | | | | | | |
| Security name | | Interest rate | | | Maturity date | | | Principal | | | Value | |
| | | | | | | | | | | | | | | | |
| | | | |
Agency Securities (continued) | | | | | | | | | | | | | | | | |
FNMA Series 2001-T10 Class A3 | | | 9.50 | % | | | 12-25-2041 | | | $ | 1,712,137 | | | $ | 1,971,149 | |
FNMA Series 2001-T12 Class A3 | | | 9.50 | | | | 8-25-2041 | | | | 434,561 | | | | 505,663 | |
FNMA Series 2002-T12 Class A5 ± | | | 3.58 | | | | 10-25-2041 | | | | 1,483,955 | | | | 1,557,539 | |
FNMA Series 2002-T19 Class A1 | | | 6.50 | | | | 7-25-2042 | | | | 5,853,686 | | | | 6,789,368 | |
FNMA Series 2002-T5 Class A1 ± | | | 0.44 | | | | 5-25-2032 | | | | 352,981 | | | | 348,018 | |
FNMA Series 2002-W4 Class A4 | | | 6.25 | | | | 5-25-2042 | | | | 952,509 | | | | 1,051,947 | |
FNMA Series 2003-T2 Class A1 ± | | | 0.48 | | | | 3-25-2033 | | | | 410,829 | | | | 399,254 | |
FNMA Series 2003-W1 Class 1A1 ± | | | 5.77 | | | | 12-25-2042 | | | | 897,512 | | | | 1,021,299 | |
FNMA Series 2003-W11 Class A1 ± | | | 3.46 | | | | 6-25-2033 | | | | 121,934 | | | | 127,757 | |
FNMA Series 2003-W3 Class 1A4 ± | | | 3.46 | | | | 8-25-2042 | | | | 3,702,796 | | | | 3,911,067 | |
FNMA Series 2003-W5 Class A ± | | | 0.42 | | | | 4-25-2033 | | | | 589,133 | | | | 567,023 | |
FNMA Series 2003-W6 Class 6A ± | | | 3.13 | | | | 8-25-2042 | | | | 2,603,262 | | | | 2,805,460 | |
FNMA Series 2003-W6 Class PT4 ± | | | 8.67 | | | | 10-25-2042 | | | | 2,280,108 | | | | 2,787,754 | |
FNMA Series 2003-W8 Class PT1 ± | | | 9.65 | | | | 12-25-2042 | | | | 913,960 | | | | 1,051,735 | |
FNMA Series 2003-W9 Class A ± | | | 0.44 | | | | 6-25-2033 | | | | 142,704 | | | | 138,399 | |
FNMA Series 2004-79 Class FA ± | | | 0.49 | | | | 8-25-2032 | | | | 1,195,026 | | | | 1,197,161 | |
FNMA Series 2004-T1 Class 1A2 | | | 6.50 | | | | 1-25-2044 | | | | 876,993 | | | | 988,389 | |
FNMA Series 2004-W1 Class 2A2 | | | 7.00 | | | | 12-25-2033 | | | | 1,986,362 | | | | 2,324,924 | |
FNMA Series 2004-W15 Class 1A3 | | | 7.00 | | | | 8-25-2044 | | | | 1,469,405 | | | | 1,698,548 | |
FNMA Series 2005-71 Class DB | | | 4.50 | | | | 8-25-2025 | | | | 1,558,605 | | | | 1,662,634 | |
FNMA Series 2006-M2 Class A2F ± | | | 5.26 | | | | 5-25-2020 | | | | 5,717,033 | | | | 6,156,947 | |
FNMA Series 2007-2 Class FA ± | | | 0.40 | | | | 2-25-2037 | | | | 50,674 | | | | 50,683 | |
FNMA Series 2007-W10 Class 2A ± | | | 6.32 | | | | 8-25-2047 | | | | 852,765 | | | | 966,175 | |
FNMA Series 2009-3 Class HL | | | 5.00 | | | | 2-25-2039 | | | | 473,843 | | | | 485,512 | |
FNMA Series 2011-15 Class HI (c) | | | 5.50 | | | | 3-25-2026 | | | | 2,512,977 | | | | 221,126 | |
FNMA Series 2011-42 Class A | | | 3.00 | | | | 2-25-2024 | | | | 1,023,991 | | | | 1,055,083 | |
FNMA Series 265 Class 2 | | | 9.00 | | | | 3-25-2024 | | | | 159,054 | | | | 183,753 | |
FNMA Series G-8 Class E | | | 9.00 | | | | 4-25-2021 | | | | 126,439 | | | | 140,235 | |
FNMA Series G92-30 Class Z | | | 7.00 | | | | 6-25-2022 | | | | 203,503 | | | | 219,442 | |
FNMA Series G93-39 Class ZQ | | | 6.50 | | | | 12-25-2023 | | | | 2,388,129 | | | | 2,636,040 | |
GNMA ± | | | 3.00 | | | | 8-20-2020 | | | | 167,893 | | | | 172,611 | |
GNMA ± | | | 3.00 | | | | 11-20-2020 | | | | 116,911 | | | | 121,708 | |
GNMA | | | 3.00 | | | | 7-20-2045 | | | | 24,467,529 | | | | 24,827,343 | |
GNMA %% | | | 3.50 | | | | 9-21-2045 | | | | 36,705,000 | | | | 38,217,646 | |
GNMA | | | 4.00 | | | | 1-20-2045 | | | | 15,883,314 | | | | 16,862,400 | |
GNMA | | | 5.00 | | | | 7-20-2040 | | | | 6,731,286 | | | | 7,481,390 | |
GNMA | | | 6.00 | | | | 8-20-2034 | | | | 293,845 | | | | 329,554 | |
GNMA | | | 6.50 | | | | 12-15-2025 | | | | 40,944 | | | | 46,782 | |
GNMA | | | 6.50 | | | | 5-15-2029 | | | | 1,976 | | | | 2,257 | |
GNMA | | | 6.50 | | | | 5-15-2031 | | | | 2,539 | | | | 2,901 | |
GNMA | | | 6.50 | | | | 9-20-2033 | | | | 88,044 | | | | 106,278 | |
GNMA | | | 7.00 | | | | 12-15-2022 | | | | 45,082 | | | | 49,107 | |
GNMA | | | 7.00 | | | | 5-15-2026 | | | | 4,743 | | | | 5,264 | |
GNMA | | | 7.00 | | | | 3-15-2028 | | | | 68,833 | | | | 76,312 | |
GNMA | | | 7.00 | | | | 1-15-2031 | | | | 469 | | | | 483 | |
GNMA | | | 7.00 | | | | 4-15-2031 | | | | 1,227 | | | | 1,266 | |
GNMA | | | 7.00 | | | | 8-15-2031 | | | | 21,736 | | | | 23,015 | |
GNMA | | | 7.00 | | | | 3-15-2032 | | | | 16,193 | | | | 16,666 | |
GNMA | | | 7.34 | | | | 10-20-2021 | | | | 54,514 | | | | 56,407 | |
GNMA | | | 7.34 | | | | 12-20-2021 | | | | 19,397 | | | | 19,464 | |
| | | | |
| 8 | | Wells Fargo Advantage Government Securities Fund | | Portfolio of investments—August 31, 2015 |
| | | | | | | | | | | | | | | | |
| Security name | | Interest rate | | | Maturity date | | | Principal | | | Value | |
| | | | | | | | | | | | | | | | |
| | | | |
Agency Securities (continued) | | | | | | | | | | | | | | | | |
GNMA | | | 7.34 | % | | | 2-20-2022 | | | $ | 15,859 | | | $ | 15,914 | |
GNMA | | | 7.34 | | | | 9-20-2022 | | | | 35,684 | | | | 36,967 | |
GNMA | | | 8.00 | | | | 6-15-2023 | | | | 5,364 | | | | 5,930 | |
GNMA | | | 8.00 | | | | 12-15-2023 | | | | 404,636 | | | | 470,439 | |
GNMA | | | 8.00 | | | | 2-15-2024 | | | | 1,171 | | | | 1,317 | |
GNMA | | | 8.00 | | | | 9-15-2024 | | | | 4,582 | | | | 4,783 | |
GNMA | | | 8.00 | | | | 6-15-2025 | | | | 89 | | | | 89 | |
GNMA | | | 8.35 | | | | 4-15-2020 | | | | 252,279 | | | | 274,965 | |
GNMA | | | 8.40 | | | | 5-15-2020 | | | | 162,592 | | | | 178,177 | |
GNMA | | | 8.50 | | | | 7-15-2016 | | | | 304 | | | | 305 | |
GNMA | | | 9.00 | | | | 12-15-2016 | | | | 1,896 | | | | 1,904 | |
GNMA | | | 9.50 | | | | 10-20-2019 | | | | 56,885 | | | | 60,687 | |
GNMA | | | 10.00 | | | | 12-15-2018 | | | | 5,979 | | | | 6,012 | |
GNMA Series 2002-53 Class IO ±(c) | | | 0.60 | | | | 4-16-2042 | | | | 465,318 | | | | 5 | |
GNMA Series 2005-23 Class IO ±(c) | | | 0.14 | | | | 6-17-2045 | | | | 8,254,790 | | | | 25,895 | |
GNMA Series 2006-32 Class C ± | | | 5.30 | | | | 11-16-2038 | | | | 6,692,871 | | | | 6,958,678 | |
GNMA Series 2006-32 Class XM ±(c) | | | 0.02 | | | | 11-16-2045 | | | | 13,472,078 | | | | 14,792 | |
GNMA Series 2006-68 Class D ± | | | 5.31 | | | | 12-16-2037 | | | | 12,520,000 | | | | 13,532,202 | |
GNMA Series 2007-35 Class NF ± | | | 0.30 | | | | 10-16-2035 | | | | 2,825,788 | | | | 2,825,228 | |
GNMA Series 2007-69 Class D ± | | | 5.25 | | | | 6-16-2041 | | | | 959,554 | | | | 1,032,564 | |
GNMA Series 2008-22 Class XM ±(c) | | | 0.74 | | | | 2-16-2050 | | | | 35,071,839 | | | | 1,108,691 | |
GNMA Series 2012-12 Class HD | | | 2.00 | | | | 5-20-2062 | | | | 3,236,729 | | | | 3,275,751 | |
SBA (c)(a)(i) | | | 1.30 | | | | 2-15-2018 | | | | 147,716 | | | | 1,988 | |
SBA Series 1992-6 Class A (c)(a)(i) | | | 2.09 | | | | 10-15-2017 | | | | 141,606 | | | | 2,847 | |
TVA | | | 5.38 | | | | 4-1-2056 | | | | 3,670,000 | | | | 4,526,850 | |
| | | | |
Total Agency Securities (Cost $806,666,573) | | | | | | | | | | | | | | | 822,923,388 | |
| | | | | | | | | | | | | | | | |
| | | | |
Municipal Obligations: 0.61% | | | | | | | | | | | | | | | | |
| | | | |
| Texas: 0.61% | | | | | | | | | | | | | | | | |
San Antonio TX Retama Development Corporation (Miscellaneous Revenue) | | | 10.00 | | | | 12-15-2020 | | | | 5,405,000 | | | | 7,557,271 | |
| | | | | | | | | | | | | | | | |
| | | | |
Total Municipal Obligations (Cost $6,570,827) | | | | | | | | | | | | | | | 7,557,271 | |
| | | | | | | | | | | | | | | | |
| | | | |
Non-Agency Mortgage-Backed Securities: 5.80% | | | | | | | | | | | | | | | | |
CGBAM Commercial Mortgage Trust Series 2015-SMRT Class A 144A | | | 2.81 | | | | 4-10-2028 | | | | 5,000,000 | | | | 5,073,015 | |
Citigroup Commercial Mortgage Trust Series 2006-C4 Class A3 ± | | | 5.97 | | | | 3-15-2049 | | | | 8,499,800 | | | | 8,610,739 | |
Citigroup Commercial Mortgage Trust Series 2006-C5 Class A4 | | | 5.43 | | | | 10-15-2049 | | | | 11,280,000 | | | | 11,603,849 | |
Citigroup Commercial Mortgage Trust Series 2015-GC27 Class A5 | | | 3.14 | | | | 2-10-2048 | | | | 6,130,000 | | | | 6,003,471 | |
GAHR Commercial Mortgage Trust Series 2015-NRF Class AFX 144A | | | 3.23 | | | | 12-15-2019 | | | | 4,195,000 | | | | 4,273,488 | |
GS Mortgage Securities Trust Series 2013-G1 Class A2 144A± | | | 3.56 | | | | 4-10-2031 | | | | 5,349,842 | | | | 5,334,959 | |
JPMBB Commercial Mortgage Securities Series 2015-C28 Class A4 | | | 3.23 | | | | 10-15-2048 | | | | 6,200,000 | | | | 6,078,802 | |
Lehman Brothers UBS Commercial Mortgage Trust Series 2006-C1 Class A4 | | | 5.16 | | | | 2-15-2031 | | | | 5,257,961 | | | | 5,270,622 | |
Morgan Stanley Bank of America Merrill Lynch Trust Series 2015-C23 Class A4 | | | 3.72 | | | | 7-15-2050 | | | | 8,500,000 | | | | 8,694,412 | |
Morgan Stanley Capital I Series 2006-HQ8 Class A4 ± | | | 5.58 | | | | 3-12-2044 | | | | 1,350,798 | | | | 1,353,222 | |
NCUA Guaranteed Notes Program Series 2010-C1 Class APT | | | 2.65 | | | | 10-29-2020 | | | | 6,222,604 | | | | 6,247,725 | |
NCUA Guaranteed Notes Program Series 2011-R4 Class 1A ± | | | 0.57 | | | | 3-6-2020 | | | | 2,143,699 | | | | 2,147,452 | |
NCUA Guaranteed Notes Program Series 2011-R6 Class 1A ± | | | 0.57 | | | | 5-7-2020 | | | | 413,107 | | | | 413,187 | |
Vendee Mortgage Trust Series 1995-1 Class 4 ± | | | 8.76 | | | | 2-15-2025 | | | | 337,186 | | | | 383,943 | |
Vendee Mortgage Trust Series 1995-2C Class 3A | | | 8.79 | | | | 6-15-2025 | | | | 451,952 | | | | 554,953 | |
| | | | |
Total Non-Agency Mortgage-Backed Securities (Cost $73,792,503) | | | | | | | | | | | | | | | 72,043,839 | |
| | | | | | | | | | | | | | | | |
| | | | | | |
| Portfolio of investments—August 31, 2015 | | Wells Fargo Advantage Government Securities Fund | | | 9 | |
| | | | | | | | | | | | | | | | |
| Security name | | Interest rate | | | Maturity date | | | Principal | | | Value | |
| | | | | | | | | | | | | | | | |
| | | | |
U.S. Treasury Securities: 54.56% | | | | | | | | | | | | | | | | |
TIPS | | | 0.38 | % | | | 7-15-2025 | | | $ | 39,364,067 | | | $ | 38,569,109 | |
U.S. Treasury Bond | | | 2.75 | | | | 8-15-2042 | | | | 16,720,000 | | | | 16,039,881 | |
U.S. Treasury Bond | | | 3.00 | | | | 11-15-2044 | | | | 5,965,000 | | | | 5,994,437 | |
U.S. Treasury Bond | | | 3.00 | | | | 5-15-2045 | | | | 17,355,000 | | | | 17,477,925 | |
U.S. Treasury Bond ## | | | 4.63 | | | | 2-15-2040 | | | | 20,150,000 | | | | 26,338,246 | |
U.S. Treasury Bond | | | 7.25 | | | | 8-15-2022 | | | | 4,685,000 | | | | 6,321,944 | |
U.S. Treasury Note ±## | | | 0.10 | | | | 1-31-2016 | | | | 130,990,000 | | | | 131,007,946 | |
U.S. Treasury Note | | | 0.25 | | | | 9-30-2015 | | | | 8,900,000 | | | | 8,900,000 | |
U.S. Treasury Note | | | 0.25 | | | | 11-30-2015 | | | | 43,700,000 | | | | 43,705,681 | |
U.S. Treasury Note ## | | | 0.25 | | | | 12-31-2015 | | | | 110,000,000 | | | | 110,000,000 | |
U.S. Treasury Note | | | 0.38 | | | | 11-15-2015 | | | | 81,495,000 | | | | 81,528,983 | |
U.S. Treasury Note ## | | | 0.38 | | | | 2-15-2016 | | | | 97,455,000 | | | | 97,488,037 | |
U.S. Treasury Note | | | 1.00 | | | | 8-31-2016 | | | | 12,240,000 | | | | 12,306,463 | |
U.S. Treasury Note | | | 1.38 | | | | 2-28-2019 | | | | 56,455,000 | | | | 56,679,917 | |
U.S. Treasury Note | | | 2.13 | | | | 6-30-2022 | | | | 15,105,000 | | | | 15,300,504 | |
U.S. Treasury Note | | | 6.25 | | | | 8-15-2023 | | | | 7,915,000 | | | | 10,366,798 | |
| | | | |
Total U.S. Treasury Securities (Cost $671,412,253) | | | | | | | | | | | | | | | 678,025,871 | |
| | | | | | | | | | | | | | | | |
| | | | |
Yankee Corporate Bonds and Notes: 1.58% | | | | | | | | | | | | | | | | |
| | | | |
Financials: 1.58% | | | | | | | | | | | | | | | | |
| | | | |
| Banks: 1.58% | | | | | | | | | | | | | | | | |
Bank of Nova Scotia 144A | | | 1.65 | | | | 10-29-2015 | | | | 13,235,000 | | | | 13,257,102 | |
Royal Bank of Canada Incorporated | | | 2.00 | | | | 10-1-2018 | | | | 6,370,000 | | | | 6,436,923 | |
| | | | |
| | | | | | | | | | | | | | | 19,694,025 | |
| | | | | | | | | | | | | | | | |
| | | | |
Total Yankee Corporate Bonds and Notes (Cost $19,601,211) | | | | | | | | | | | | | | | 19,694,025 | |
| | | | | | | | | | | | | | | | |
| | | | |
Yankee Government Bonds: 0.87% | | | | | | | | | | | | | | | | |
Hashemite Kingdom of Jordan | | | 2.58 | | | | 6-30-2022 | | | | 10,630,000 | | | | 10,775,163 | |
| | | | | | | | | | | | | | | | |
| | | | |
Total Yankee Government Bonds (Cost $10,630,000) | | | | | | | | | | | | | | | 10,775,163 | |
| | | | | | | | | | | | | | | | |
| | | | |
| | | Yield | | | | | | Shares | | | | |
| Short-Term Investments: 1.61% | | | | | | | | | | | | | | | | |
| | | | |
| Investment Companies: 1.47% | | | | | | | | | | | | | | | | |
Wells Fargo Advantage Government Money Market Fund, Institutional Class ##(l)(u) | | | 0.01 | | | | | | | | 18,254,235 | | | | 18,254,235 | |
| | | | | | | | | | | | | | | | |
| | | | |
| | | | | | | | | Principal | | | | |
| U.S. Treasury Securities: 0.14% | | | | | | | | | | | | | | | | |
U.S. Treasury Bill (z)# | | | 0.01 | | | | 9-17-2015 | | | $ | 1,775,000 | | | | 1,774,998 | |
| | | | | | | | | | | | | | | | |
| | | | |
Total Short-Term Investments (Cost $20,029,229) | | | | | | | | | | | | | | | 20,029,233 | |
| | | | | | | | | | | | | | | | |
| | | | |
| 10 | | Wells Fargo Advantage Government Securities Fund | | Portfolio of investments—August 31, 2015 |
| | | | | | | | | | | | | | | | |
| Security name | | Interest rate | | | Maturity date | | | Principal | | | Value | |
| | | | | | | | | | | | | | | | |
| | | | |
TBA Sale Commitments: (0.29%) | | | | | | | | | | | | | | | | |
FNMA %% | | | 5.50 | % | | | 9-14-2045 | | | $ | (3,250,000 | ) | | $ | (3,635,938 | ) |
| | | | | | | | | | | | | | | | |
| | | | |
Total TBA Sale Commitments (Proceeds $(3,640,000)) | | | | | | | | | | | | | | | (3,635,938 | ) |
| | | | | | | | | | | | | | | | |
| | | | | | | | |
| Total investments in securities (excluding TBA sale commitments) (Cost $1,608,702,596) * | | | 131.24 | % | | | 1,631,048,790 | |
Total TBA sale commitments | | | (0.29 | ) | | | (3,635,938 | ) |
Other assets and liabilities, net | | | (30.95 | ) | | | (384,634,729 | ) |
| | | | | | | | |
| Total net assets | | | 100.00 | % | | $ | 1,242,778,123 | |
| | | | | | | | |
| 144A | The security may be resold in transactions exempt from registration, normally to qualified institutional buyers, pursuant to Rule 144A under the Securities Act of 1933. |
| ± | Variable rate investment. The rate shown is the rate in effect at period end. |
| ¤ | The security is issued in zero coupon form with no periodic interest payments. |
| %% | The security is issued on a when-issued basis. |
| (c) | Investment in an interest-only security entitles holders to receive only the interest payments on the underlying mortgages. The principal amount shown is the notional amount of the underlying mortgages. The rate represents the coupon rate. |
| (a) | The security is fair valued in accordance with procedures approved by the Board of Trustees. |
| (i) | Illiquid security for which the designation as illiquid is unaudited. |
| ## | All or a portion of this security is segregated for when-issued securities. |
| (l) | The security represents an affiliate of the Fund as defined in the Investment Company Act of 1940. |
| (u) | The rate represents the 7-day annualized yield at period end. |
| (z) | Zero coupon security. The rate represents the current yield to maturity. |
| # | All or a portion of this security is segregated as collateral for investments in derivative instruments. |
| * | Cost for federal income tax purposes is $1,609,447,026 and unrealized gains (losses) consists of: |
| | | | |
Gross unrealized gains | | $ | 28,698,849 | |
Gross unrealized losses | | | (7,097,085 | ) |
| | | | |
Net unrealized gains | | $ | 21,601,764 | |
Report of Independent Registered Public Accounting Firm
The Board of Trustees and Shareholders of
Wells Fargo Funds Trust:
We have audited the financial statements of the Wells Fargo Advantage Adjustable Rate Government Fund and the Wells Fargo Advantage Government Securities Fund (the “Funds”), each a series of the Wells Fargo Funds Trust, as of August 31, 2015, and for each of the years presented and have issued our unqualified reports thereon dated October 26, 2015 (which reports and financial statements are included in Item 1 of this Certified Shareholder Report on Form N-CSR). We conducted our audits in accordance with the standards of the Public Company Accounting Oversight Board (United States). Our audits included an audit of the Funds’ portfolios of investments (the “Portfolios”) as of August 31, 2015 appearing in Item 6 of this Form N-CSR. These Portfolios are the responsibility of management. Our responsibility is to express an opinion on these Portfolios based on our audits.
In our opinion, the Portfolios referred to above, when read in conjunction with the financial statements of the Funds, present fairly, in all material respects, the information set forth therein.

Boston, Massachusetts
October 26, 2015
ITEM 7. DISCLOSURE OF PROXY VOTING POLICIES AND PROCEDURES FOR CLOSED-END MANAGEMENT INVESTMENT COMPANIES
Not applicable.
ITEM 8. PORTFOLIO MANAGERS OF CLOSED-END MANAGEMENT INVESTMENT COMPANIES
Not applicable.
ITEM 9. PURCHASES OF EQUITY SECURITIES BY CLOSED-END MANAGEMENT INVESTMENT COMPANY AND AFFILIATED PURCHASERS
Not applicable.
ITEM 10. SUBMISSION OF MATTERS TO A VOTE OF SECURITY HOLDERS
There have been no material changes to the procedures by which shareholders may recommend nominees to the registrant’s Board of Trustees that have been implemented since the registrant’s last provided disclosure in response to the requirements of this Item.
ITEM 11. CONTROLS AND PROCEDURES
(a) The President and Treasurer have concluded that the Wells Fargo Funds Trust (the “Trust”) disclosure controls and procedures (as defined in Rule 30a-3(c) under the Investment Company Act of 1940) provide reasonable assurances that material information relating to the Trust is made known to them by the appropriate persons based on their evaluation of these controls and procedures as of a date within 90 days of the filing of this report.
(b) There were no significant changes in the Trust’s internal controls over financial reporting (as defined in Rule 30a-3(d) under the Investment Company Act of 1940) that occurred during the second fiscal quarter of the period covered by this report that materially affected, or is reasonably likely to materially affect, the registrant’s internal control over financial reporting.
ITEM 12. EXHIBITS
(a)(1) Code of Ethics pursuant to Item 2 of Form N-CSR is filed and attached hereto as Exhibit COE.
(a)(2) Certification pursuant to Rule 30a-2(a) under the Investment Company Act of 1940 (17 CFR 270.30a-2(a)) is filed and attached hereto as Exhibit 99.CERT.
(a)(3) Not applicable.
(b) Certification pursuant to Rule 30a-2(b) under the Investment Company Act of 1940 (17 CFR 270.30a-2(b)) is filed and attached hereto as Exhibit 99.906CERT.
SIGNATURES
Pursuant to the requirements of the Securities Exchange Act of 1934 and the Investment Company Act of 1940, the registrant has duly caused this report to be signed on its behalf by the undersigned, thereunto duly authorized.
| | |
| Wells Fargo Funds Trust |
| |
| By: | | |
| | /s/ Karla M. Rabusch |
| |
| | Karla M. Rabusch |
| | President |
| |
| Date: | | October 26, 2015 |
Pursuant to the requirements of the Securities Exchange Act of 1934 and the Investment Company Act of 1940, this report has been signed below by the following persons on behalf of the registrant and in the capacities and on the date indicated.
| | |
| Wells Fargo Funds Trust |
| |
| By: | | |
| | /s/ Karla M. Rabusch |
| |
| | Karla M. Rabusch |
| | President |
| |
| Date: | | October 26, 2015 |
| |
| By: | | |
| | /s/ Nancy Wiser |
| |
| | Nancy Wiser |
| | Treasurer |
| |
| Date: | | October 26, 2015 |