
UNITED STATES
SECURITIES AND EXCHANGE COMMISSION
Washington, D.C. 20549
FORM N-CSR
CERTIFIED SHAREHOLDER REPORT OF REGISTERED
MANAGEMENT INVESTMENT COMPANIES
Investment Company Act file number: 811-09253
Wells Fargo Funds Trust
(Exact name of registrant as specified in charter)
525 Market St., San Francisco, CA 94105
(Address of principal executive offices) (Zip code)
C. David Messman
Wells Fargo Funds Management, LLC
525 Market St., San Francisco, CA 94105
(Name and address of agent for service)
Registrant’s telephone number, including area code: 800-222-8222
Date of fiscal year end: October 31
Registrant is making a filing for 9 of its series:
Wells Fargo International Bond Fund, Wells Fargo Strategic Income Fund, Wells Fargo Asia Pacific Fund, Wells Fargo Diversified International Fund, Wells Fargo Emerging Markets Equity Fund, Wells Fargo Emerging Markets Equity Income Fund, Wells Fargo Global Opportunities Fund, Wells Fargo International Equity Fund, and Wells Fargo Intrinsic World Equity Fund.
Date of reporting period: October 31, 2015
ITEM 1. REPORT TO STOCKHOLDERS
Annual Report
October 31, 2015

Wells Fargo International Bond Fund


Reduce clutter. Save trees.
Sign up for electronic delivery of prospectuses and shareholder reports at wellsfargo.com/advantagedelivery
Contents
The views expressed and any forward-looking statements are as of October 31, 2015, unless otherwise noted, and are those of the Fund managers and/or Wells Fargo Funds Management, LLC. Discussions of individual securities, or the markets generally, or any Wells Fargo Fund are not intended as individual recommendations. Future events or results may vary significantly from those expressed in any forward-looking statements. The views expressed are subject to change at any time in response to changing circumstances in the market. Wells Fargo Funds Management, LLC and the Fund disclaim any obligation to publicly update or revise any views expressed or forward-looking statements.
NOT FDIC INSURED ¡ NO BANK GUARANTEE ¡ MAY LOSE VALUE
| | | | |
| 2 | | Wells Fargo International Bond Fund | | Letter to shareholders (unaudited) |

Karla M. Rabusch
President
Wells Fargo Funds
Economic data continued to indicate that the U.S. economy was in a sluggish but consistent recovery.
The difference in policy between the Fed and other central banks led the U.S. dollar to appreciate against most major currencies.
Dear Valued Shareholder:
We are pleased to offer you this annual report for the Wells Fargo International Bond Fund for the 12-month period that ended October 31, 2015. The period was marked by continued low global interest rates and sluggish economic recovery in developed markets. However, the expectation that the U.S. Federal Reserve (Fed) would soon raise its key interest rate, combined with signs of further quantitative easing from other central banks, depressed the prices of international assets for U.S. dollar-based investors.
The Fed showed signs of raising its key rate, but other central banks continued to ease.
Economic data continued to indicate that the U.S. economy was in a sluggish but consistent recovery. For example, the U.S. unemployment rate eased from 5.8% at the beginning of the reporting period (November 2014) to 5.0% at the end (October 2015). Throughout the reporting period, the Federal Open Market Committee (FOMC), which is the Fed’s monetary policymaking body, kept its key interest rate effectively at zero.
As the period progressed, various comments by Fed Chair Janet Yellen led investors to believe that the FOMC would soon raise its key federal funds rate. The FOMC remained on hold at its September 2015 meeting, however, citing concerns about a weaker global economy and subdued U.S. inflation. The FOMC’s decision caused some uncertainty, but by the end of the period, most investors expected a modest Fed rate hike in late 2015 or early 2016.
In contrast, the European Central Bank (ECB) showed no signs of raising rates in the near future, as the eurozone continued to grapple with sluggish growth. The eurozone reported annualized gross domestic product growth of 1.6% in the second quarter of 2015, which was the highest annualized growth for the past eight quarters. Yet while the unemployment rate improved, it remained stubbornly above 10%. The ECB thus maintained a variety of measures aimed at encouraging lending, including making funds available to banks at low interest rates and imposing a negative interest rate on bank deposits held at the central bank.
Other major central banks, such as the People’s Bank of China and the Bank of Japan, also remained in easing mode in response to sluggish growth in their respective economies. The difference in policy between the Fed and other central banks led the U.S. dollar to appreciate against most major currencies.
Slow but persistent international growth supported risk-based assets, but the stronger dollar depressed the returns of international investments.
In developed markets, the persistent modest-growth, low-inflation environment provided a favorable backdrop for sovereign bonds, investment-grade corporate bonds, and high-yield debt. The main sour note was struck in energy- and commodity-related subsectors of the high-yield bond universe. Persistent low prices for oil, natural gas, and industrial metals such as copper put pressure on highly leveraged energy and metals and mining companies and led to increasing defaults in commodity-related sectors. The Barclays U.S. Aggregate Bond Index,1 which comprises investment-grade debt, ended the period with a 1.96% gain. By
| 1 | The Barclays U.S. Aggregate Bond Index is a broad-based benchmark that measures the investment-grade, U.S. dollar-denominated, fixed-rate taxable bond market, including Treasuries, government-related and corporate securities, MBS (agency fixed-rate and hybrid ARM pass-throughs), ABS, and CMBS. You cannot invest directly in an index. |
| | | | | | |
| Letter to shareholders (unaudited) | | Wells Fargo International Bond Fund | | | 3 | |
contrast, the Barclays U.S. Corporate High Yield Bond Index,2 a proxy for the high-yield bond market, lost 1.94% over the 12-month period.
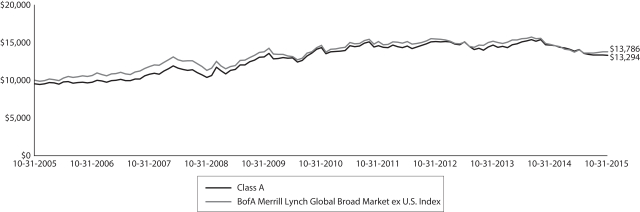
The continued strength of the U.S. dollar versus other currencies provided a potent headwind to international bonds for U.S. dollar-based investors. Partly as a result, the BofA Merrill Lynch Global Broad Market ex U.S. Index3 lost 6.68% during the reporting period.
Don’t let short-term uncertainty derail long-term investment goals.
Periods of uncertainty can present challenges, but experience has taught us that maintaining long-term investment goals can be an effective way to plan for the future. To help you create a sound strategy based on your personal goals and risk tolerance, Wells Fargo Funds offers more than 100 mutual funds and other investments spanning a wide range of asset classes and investment styles. Although diversification cannot guarantee an investment profit or prevent losses, we believe it can be an effective way to manage investment risk and potentially smooth out overall portfolio performance. We encourage investors to know their investments and to understand that appropriate levels of risk-taking may unlock opportunities.
Thank you for choosing to invest with Wells Fargo Funds. We appreciate your confidence in us and remain committed to helping you meet your financial needs.
Sincerely,

Karla M. Rabusch
President
Wells Fargo Funds
Notice to shareholders
At a meeting held August 11-12, 2015, the Board of Trustees of the Fund approved a change in the name of the Fund whereby the word “Advantage” was removed from its name, effective December 15, 2015.
For current information about your fund investments, contact your investment professional, visit our website at wellsfargofunds.com, or call us directly at 1-800-222-8222. We are available 24 hours a day, 7 days a week.
| 2 | The Barclays U.S. Corporate High Yield Bond Index is an unmanaged, U.S. dollar-denominated, nonconvertible, non-investment-grade debt index. The index consists of domestic and corporate bonds rated Ba and below with a minimum outstanding amount of $150 million. You cannot invest directly in an index. |
| 3 | The BofA Merrill Lynch Global Broad Market ex U.S. Index tracks the performance of investment-grade debt publicly issued in the major domestic and eurobond markets, including sovereign, quasi-government, corporate, securitized, and collateralized securities, and excludes all securities denominated in U.S. dollars. You cannot invest directly in an index. |
| | | | |
| 4 | | Wells Fargo International Bond Fund | | Performance highlights (unaudited) |
Investment objective
The Fund seeks total return, consisting of income and capital appreciation.
Manager
Wells Fargo Funds Management, LLC
Subadviser
First International Advisors, LLC
Portfolio managers
Michael Lee
Tony Norris
Alex Perrin
Christopher Wightman
Peter Wilson
Average annual total returns (%) as of October 31, 20151
| | | | | | | | | | | | | | | | | | | | | | | | | | | | | | | | | | |
| | | | | Including sales charge | | | Excluding sales charge | | | Expense ratios2 | |
| | | Inception date | | 1 year | | | 5 year | | | 10 year | | | 1 year | | | 5 year | | | 10 year | | | Gross | | | Net3 | |
| Class A (ESIYX) | | 9-30-2003 | | | (13.57 | ) | | | (2.39 | ) | | | 2.89 | | | | (9.50 | ) | | | (1.48 | ) | | | 3.37 | | | | 1.05 | | | | 1.03 | |
| Class B (ESIUX)* | | 9-30-2003 | | | (14.76 | ) | | | (2.58 | ) | | | 2.84 | | | | (10.29 | ) | | | (2.23 | ) | | | 2.84 | | | | 1.80 | | | | 1.78 | |
| Class C (ESIVX) | | 9-30-2003 | | | (11.21 | ) | | | (2.23 | ) | | | 2.60 | | | | (10.21 | ) | | | (2.23 | ) | | | 2.60 | | | | 1.80 | | | | 1.78 | |
| Class R6 (ESIRX) | | 11-30-2012 | | | – | | | | – | | | | – | | | | (9.18 | ) | | | (1.13 | ) | | | 3.70 | | | | 0.67 | | | | 0.65 | |
| Administrator Class (ESIDX) | | 7-30-2010 | | | – | | | | – | | | | – | | | | (9.36 | ) | | | (1.31 | ) | | | 3.54 | | | | 0.99 | | | | 0.85 | |
| Institutional Class (ESICX) | | 12-15-1993 | | | – | | | | – | | | | – | | | | (9.20 | ) | | | (1.16 | ) | | | 3.68 | | | | 0.72 | | | | 0.70 | |
| BofA Merrill Lynch Global Broad Market ex U.S. Index4 | | – | | | – | | | | – | | | | – | | | | (6.68 | ) | | | (1.16 | ) | | | 3.26 | | | | – | | | | – | |
| * | | Class B shares are closed to investment, except in connection with the reinvestment of any distributions and permitted exchanges. |
Figures quoted represent past performance, which is no guarantee of future results, and do not reflect taxes that a shareholder may pay on fund distributions or the redemption of fund shares. Investment return and principal value of an investment will fluctuate so that an investor’s shares, when redeemed, may be worth more or less than their original cost. Performance shown without sales charges would be lower if sales charges were reflected. Current performance may be lower or higher than the performance data quoted, which assumes the reinvestment of dividends and capital gains. Current month-end performance is available on the Fund’s website, wellsfargofunds.com.
Index returns do not include transaction costs associated with buying and selling securities, any mutual fund fees or expenses, or any taxes. It is not possible to invest directly in an index.
For Class A shares, the maximum front-end sales charge is 4.50%. For Class B shares, the maximum contingent deferred sales charge is 5.00%. For Class C shares, the maximum contingent deferred sales charge is 1.00%. Performance including a contingent deferred sales charge assumes the sales charge for the corresponding time period. Class R6, Administrator Class, and Institutional Class shares are sold without a front-end sales charge or contingent deferred sales charge.
Bond values fluctuate in response to the financial condition of individual issuers, general market and economic conditions, and changes in interest rates. Changes in market conditions and government policies may lead to periods of heightened volatility in the bond market and reduced liquidity for certain bonds held by the Fund. In general, when interest rates rise, bond values fall and investors may lose principal value. Interest-rate changes and their impact on the Fund and its share price can be sudden and unpredictable. Foreign investments are especially volatile and can rise or fall dramatically due to differences in the political and economic conditions of the host country. These risks are generally intensified in emerging markets. The use of derivatives may reduce returns and/or increase volatility. Securities issued by U.S. government agencies or government-sponsored entities may not be guaranteed by the U.S. Treasury. Certain investment strategies tend to increase the total risk of an investment (relative to the broader market). The Fund is exposed to high-yield securities risk and geographic risk. Consult the Fund’s prospectus for additional information on these and other risks.
Please see footnotes on page 5.
| | | | | | |
| Performance highlights (unaudited) | | Wells Fargo International Bond Fund | | | 5 | |
|
| Growth of $10,000 investment as of October 31, 20155 |
|
 |
| 1 | Historical performance shown for Class R6 shares prior to their inception reflects the performance of Institutional Class shares and includes the higher expenses applicable to Institutional Class shares. If these expenses had not been included, returns would be higher. Historical performance shown for Administrator Class shares prior to their inception reflects the performance of Institutional Class shares and has been adjusted to reflect the higher expenses applicable to Administrator Class shares. Historical performance shown for all classes of the Fund prior to July 12, 2010, is based on the performance of the Fund’s predecessor, Evergreen International Bond Fund. |
| 2 | Reflects the expense ratios as stated in the most recent prospectuses. The expense ratios shown are subject to change and may differ from the annualized expense ratios shown in the financial highlights of this report. |
| 3 | The manager has contractually committed through February 29, 2016, to waive fees and/or reimburse expenses to the extent necessary to cap the Fund’s Total Annual Operating Expenses After Fee Waiver at the amounts shown. After this time, the cap may be increased or the commitment to maintain the cap may be terminated only with the approval of the Board of Trustees. Brokerage commissions, stamp duty fees, interest, taxes, acquired fees and expenses, and extraordinary expenses are excluded from the cap. Without this cap, the Fund’s returns would have been lower. |
| 4 | The BofA Merrill Lynch Global Broad Market ex U.S. Index tracks the performance of investment-grade debt publicly issued in the major domestic and euro bond markets, including sovereign, quasi-government, corporate, securitized, and collateralized securities, and excludes all securities denominated in U.S. dollars. You cannot invest directly in an index. |
| 5 | The chart compares the performance of Class A shares for the most recent ten years with the BofA Merrill Lynch Global Broad Market ex U.S. Index. The chart assumes a hypothetical investment of $10,000 in Class A shares and reflects all operating expenses and assumes the maximum initial sales charge of 4.50%. |
| 6 | The ten largest holdings, excluding cash and cash equivalents, are calculated based on the value of the investments divided by total net assets of the Fund. Holdings are subject to change and may have changed since the date specified. |
| 7 | Amounts are calculated based on the total long-term investments of the Fund. These amounts are subject to change and may have changed since the date specified. |
| | | | |
| 6 | | Wells Fargo International Bond Fund | | Performance highlights (unaudited) |
MANAGER’S DISCUSSION
Fund highlights
| n | | The Fund underperformed its benchmark, the BofA Merrill Lynch Global Broad Market ex U.S. Index, for the 12-month period that ended October 31, 2015. |
| n | | Currency and sector effects detracted. With a continued strong U.S. dollar, allocations to many of the smaller currencies detracted from value. |
| n | | Country allocations and duration positioning were the largest contributors to relative performance. We continued to keep the Fund’s duration shorter than that of the benchmark. |
Country allocations and duration positioning were the largest contributors to relative performance.
Outside of the major developed markets, both nominal and real yields continued to offer better relative value, and we maintained the Fund’s long-term underweight to the bond markets of Japan and the core European Union (such as Germany, France, and the Netherlands).
During the reporting period, we came to believe that the U.S. offered better relative value and thus increased the Fund’s U.S. exposure. We began to increase U.S. exposure in early 2015 in expectation that U.S. growth levels—and thus yields—would converge with other regions, particularly Europe. Growth levels have indeed converged, but we believe that the convergence of interest rates has likely only started. During the reporting period, an underweight to Japan and overweights to Australia, New Zealand, Spain, South Korea, South Africa, and Mexico all added relative value. Detractors to performance came from overweights to Italy, Brazil, Poland, Norway, Canada, and Malaysia. On the whole, country allocations aided relative performance.
| | | | |
| Ten largest holdings as of October 31, 20156 | |
New Zealand, 4.50%, 4-15-2027 | | | 4.87 | |
Mexico, 4.75%, 6-14-2018 | | | 4.48 | |
U.S. Treasury Note, 2.00%, 8-15-2025 | | | 4.45 | |
Poland, 4.00%, 10-25-2023 | | | 4.22 | |
United Kingdom Gilt, 2.75%, 9-7-2024 | | | 4.01 | |
Singapore, 3.00%, 9-1-2024 | | | 3.65 | |
Bonos y Obligaciones del Estado, 1.40%, 1-31-2020 | | | 2.89 | |
United Kingdom Gilt, 2.00%, 9-7-2025 | | | 2.78 | |
Australian Government Bond Series 138, 3.25%,
4-21-2029 | | | 2.59 | |
Korea, 3.00%, 9-10-2024 | | | 2.55 | |
|
| Portfolio allocation as of October 31, 20157 |
|
 |
As of the end of the reporting period, the Fund’s positioning in local bond markets was as follows: underweight the bond markets of Japan, Germany, France, Canada, Italy, and Belgium and overweight the U.S., Australia, New Zealand, Brazil, Spain, South Korea, Mexico, Poland, Romania, Singapore, and South Africa.
The Fund’s overall duration remained shorter than that of the benchmark, which added relative value over the reporting period. We did prefer longer-duration bonds in Australia, South Korea, New Zealand, Poland, and Singapore, where inflation is subdued and central banks have room to ease as economies enter a cyclical slowdown.
Currency and sector allocation detracted from overall performance.
Overall, currency allocations detracted from relative performance. Continued weakness in emerging markets against a backdrop of rising risk aversion in global markets led to some extreme volatility in currencies. The major currencies of the U.S. dollar, the euro, the Japanese yen, and the British pound spent much of 2015 trading in sideways ranges while we awaited clues as to the next major move.
With a continued strong U.S. dollar, allocations to many of the smaller currencies detracted from value. Positions in the Malaysian ringgit, Mexican peso, Norwegian krone, South Korean won, South African rand, Polish zloty, and
Brazilian real were the main detractors. An underweight to the British pound also detracted. Currency hedging costs were significant throughout the period.
Please see footnotes on page 5.
| | | | | | |
| Performance highlights (unaudited) | | Wells Fargo International Bond Fund | | | 7 | |
On the positive side, allocations to the Australian dollar, Canadian dollar, Swedish krona, Thai baht, and U.S. dollar added value, as did an underweight to the euro.
Among bond market sectors, the relative yields for high-yield bonds (relative to sovereign bonds) edged higher during the reporting period and ended the period at near-term highs. We maintained a bias toward quality in the Fund’s credit exposure and an underweight to cyclical issuers. At the end of the reporting period, the Fund had an underweight to mortgage-backed securities in favor of sovereign bonds in smaller markets. Although an overweight to high-yield bonds and an underweight to mortgage-backed securities contributed, those effects were more than offset by the negative effects of overweights to emerging markets debt, quasi-sovereign bonds, and investment-grade corporates.
We remain cautiously optimistic on the markets
On the whole, global growth remains modest and continues to move slightly lower. Inflation has remained weak, with some parts of the world close to deflation. Against that backdrop, the past year was marked by continued accommodative central bank monetary policy, with lower interest rates and more quantitative easing. Statements by central bankers suggest that an easy monetary policy is likely to continue in the near future. In our view, accommodative central banks, low growth, and low inflation provided a positive environment for international fixed-income investing.
We continue to favor the smaller economies where growth continues to slow and central banks have room to ease monetary policy further. In developed markets, the current low-growth and low-inflationary environment, together with the likelihood that central bank rates will stay firmly anchored close to zero, means that the low level of yields will likely persist over the long term, with longer-dated yields trading within a range. We continue to keep a duration profile that is between 85% and 90% of the benchmark. As of the end of the reporting period, yields were in the middle of a range that we expect them to trade in over the next few years. We await an opportunity to increase duration back to neutral and eventually longer than that of the benchmark.
The only smaller currency exposure we had as of the end of the reporting period was to the Polish zloty. All other emerging currencies were hedged back to the base currency, the U.S. dollar. At some point, possibly when pessimism toward emerging markets reaches an extreme, we will have the opportunity to add selective exposure to smaller currencies. We kept an underweight to commodity-linked currencies, such as the Australian and Canadian dollars, as commodity prices remained low.
Please see footnotes on page 5.
| | | | |
| 8 | | Wells Fargo International Bond Fund | | Fund expenses (unaudited) |
As a shareholder of the Fund, you incur two types of costs: (1) transaction costs, including sales charges (loads) on purchase payments and contingent deferred sales charges (if any) on redemptions and (2) ongoing costs, including management fees, distribution (12b-1) and/or shareholder servicing fees, and other Fund expenses. This example is intended to help you understand your ongoing costs (in dollars) of investing in the Fund and to compare these costs with the ongoing costs of investing in other mutual funds.
The example is based on an investment of $1,000 invested at the beginning of the six-month period and held for the entire period from May 1, 2015 to October 31, 2015.
Actual expenses
The “Actual” line of the table below provides information about actual account values and actual expenses. You may use the information in this line, together with the amount you invested, to estimate the expenses that you paid over the period. Simply divide your account value by $1,000 (for example, an $8,600 account value divided by $1,000 = 8.6), then multiply the result by the number in the “Actual” line under the heading entitled “Expenses paid during period” for your applicable class of shares to estimate the expenses you paid on your account during this period.
Hypothetical example for comparison purposes
The “Hypothetical” line of the table below provides information about hypothetical account values and hypothetical expenses based on the Fund’s actual expense ratio and an assumed rate of return of 5% per year before expenses, which is not the Fund’s actual return. The hypothetical account values and expenses may not be used to estimate the actual ending account balance or expenses you paid for the period. You may use this information to compare the ongoing costs of investing in the Fund and other funds. To do so, compare this 5% hypothetical example with the 5% hypothetical examples that appear in the shareholder reports of the other funds.
Please note that the expenses shown in the table are meant to highlight your ongoing costs only and do not reflect any transactional costs, such as sales charges (loads) and contingent deferred sales charges. Therefore, the “Hypothetical” line of the table is useful in comparing ongoing costs only and will not help you determine the relative total costs of owning different funds. In addition, if these transactional costs were included, your costs would have been higher.
| | | | | | | | | | | | | | | | |
| | | Beginning
account value
5-1-2015 | | | Ending
account value
10-31-2015 | | | Expenses
paid during
the period1 | | | Net annualized
expense ratio | |
Class A | | | | | | | | | | | | | | | | |
Actual | | $ | 1,000.00 | | | $ | 945.63 | | | $ | 5.05 | | | | 1.03 | % |
Hypothetical (5% return before expenses) | | $ | 1,000.00 | | | $ | 1,020.01 | | | $ | 5.24 | | | | 1.03 | % |
Class B | | | | | | | | | | | | | | | | |
Actual | | $ | 1,000.00 | | | $ | 941.58 | | | $ | 8.71 | | | | 1.78 | % |
Hypothetical (5% return before expenses) | | $ | 1,000.00 | | | $ | 1,016.23 | | | $ | 9.05 | | | | 1.78 | % |
Class C | | | | | | | | | | | | | | | | |
Actual | | $ | 1,000.00 | | | $ | 941.06 | | | $ | 8.71 | | | | 1.78 | % |
Hypothetical (5% return before expenses) | | $ | 1,000.00 | | | $ | 1,016.23 | | | $ | 9.05 | | | | 1.78 | % |
Class R6 | | | | | | | | | | | | | | | | |
Actual | | $ | 1,000.00 | | | $ | 946.86 | | | $ | 3.19 | | | | 0.65 | % |
Hypothetical (5% return before expenses) | | $ | 1,000.00 | | | $ | 1,021.93 | | | $ | 3.31 | | | | 0.65 | % |
Administrator Class | | | | | | | | | | | | | | | | |
Actual | | $ | 1,000.00 | | | $ | 946.60 | | | $ | 4.17 | | | | 0.85 | % |
Hypothetical (5% return before expenses) | | $ | 1,000.00 | | | $ | 1,020.92 | | | $ | 4.33 | | | | 0.85 | % |
Institutional Class | | | | | | | | | | | | | | | | |
Actual | | $ | 1,000.00 | | | $ | 946.81 | | | $ | 3.43 | | | | 0.70 | % |
Hypothetical (5% return before expenses) | | $ | 1,000.00 | | | $ | 1,021.68 | | | $ | 3.57 | | | | 0.70 | % |
| 1 | Expenses paid is equal to the annualized expense ratio of each class multiplied by the average account value over the period, multiplied by the number of days in the most recent fiscal half-year divided by the number of days in the fiscal year (to reflect the one-half-year period). |
| | | | | | |
| Portfolio of investments—October 31, 2015 | | Wells Fargo International Bond Fund | | | 9 | |
| | | | | | | | | | | | | | | | |
| Security name | | Interest rate | | | Maturity date | | | Principal | | | Value | |
| | | | |
Corporate Bonds and Notes: 3.03% | | | | | | | | | | | | | | | | |
| | | | |
| United States: 3.03% | | | | | | | | | | | | | | | | |
Amazon.com Incorporated (Consumer Discretionary, Internet & Catalog Retail) | | | 3.80 | % | | | 12-5-2024 | | | $ | 5,800,000 | | | $ | 6,054,719 | |
Arrow Electronics Incorporated (Information Technology, Electronic Equipment, Instruments & Components) | | | 3.50 | | | | 4-1-2022 | | | | 5,775,000 | | | | 5,619,537 | |
AT&T Incorporated (Telecommunication Services, Diversified Telecommunication Services) | | | 3.00 | | | | 6-30-2022 | | | | 5,950,000 | | | | 5,837,640 | |
Ford Motor Credit Company LLC (Consumer Discretionary, Automobiles) | | | 2.46 | | | | 3-27-2020 | | | | 2,600,000 | | | | 2,546,016 | |
Goldman Sachs Group Incorporated (Financials, Capital Markets) | | | 2.75 | | | | 9-15-2020 | | | | 5,000,000 | | | | 5,027,535 | |
Lam Research Corporation (Information Technology, Semiconductors & Semiconductor Equipment) | | | 3.80 | | | | 3-15-2025 | | | | 6,000,000 | | | | 5,627,190 | |
NBCUniversal Media LLC (Consumer Discretionary, Media) | | | 2.88 | | | | 1-15-2023 | | | | 1,265,000 | | | | 1,269,264 | |
| | | | |
Total Corporate Bonds and Notes (Cost $32,715,351) | | | | | | | | | | | | | | | 31,981,901 | |
| | | | | | | | | | | | | | | | |
| | | | |
Foreign Corporate Bonds and Notes @: 18.77% | | | | | | | | | | | | | | | | |
| | | | |
| Australia: 0.52% | | | | | | | | | | | | | | | | |
General Electric Capital Corporation (Financials, Diversified Financial Services, AUD) | | | 6.00 | | | | 3-15-2019 | | | | 1,367,000 | | | | 1,070,810 | |
Transurban Finance Company Limited (Financials, Diversified Financial Services, EUR) | | | 1.88 | | | | 9-16-2024 | | | | 4,090,000 | | | | 4,431,033 | |
| | | | |
| | | | | | | | | | | | | | | 5,501,843 | |
| | | | | | | | | | | | | | | | |
| | | | |
| Bermuda: 0.58% | | | | | | | | | | | | | | | | |
Bacardi Limited (Consumer Staples, Beverages, EUR) | | | 2.75 | | | | 7-3-2023 | | | | 5,204,000 | | | | 6,117,106 | |
| | | | | | | | | | | | | | | | |
| | | | |
| Brazil: 0.27% | | | | | | | | | | | | | | | | |
BRF SA (Consumer Staples, Food Products, BRL) 144A | | | 7.75 | | | | 5-22-2018 | | | | 13,137,000 | | | | 2,827,322 | |
| | | | | | | | | | | | | | | | |
| | | | |
| Czech Republic: 0.84% | | | | | | | | | | | | | | | | |
EP Energy LLC (Energy, Oil, Gas & Consumable Fuels, EUR) | | | 5.88 | | | | 11-1-2019 | | | | 7,295,000 | | | | 8,947,682 | |
| | | | | | | | | | | | | | | | |
| | | | |
| France: 0.57% | | | | | | | | | | | | | | | | |
Autoroutes Du Sud de la France (Industrials, Transportation Infrastructure, EUR) | | | 2.95 | | | | 1-17-2024 | | | | 5,000,000 | | | | 6,083,639 | |
| | | | | | | | | | | | | | | | |
| | | | |
| Germany: 2.32% | | | | | | | | | | | | | | | | |
HP Pelzer Holding GmbH (Consumer Discretionary, Auto Components, EUR) | | | 7.50 | | | | 7-15-2021 | | | | 875,000 | | | | 1,009,823 | |
KfW (Financials, Banks, TRY) | | | 5.00 | | | | 1-16-2017 | | | | 3,745,000 | | | | 1,203,820 | |
KfW (Financials, Banks, AUD) | | | 5.00 | | | | 3-19-2024 | | | | 16,755,000 | | | | 13,601,926 | |
KfW (Financials, Banks, AUD) | | | 5.50 | | | | 2-9-2022 | | | | 4,000,000 | | | | 3,276,523 | |
Landwirtschaftliche Rentenbank (Financials, Banks, ZAR) | | | 8.25 | | | | 5-23-2022 | | | | 5,400,000 | | | | 384,973 | |
Rapid Holding GmbH (Energy, Energy Equipment & Services, EUR) 144A | | | 6.63 | | | | 11-15-2020 | | | | 2,100,000 | | | | 2,343,443 | |
Volkswagen Leasing GmbH Company (Financials, Consumer Finance, EUR) | | | 2.63 | | | | 1-15-2024 | | | | 2,426,000 | | | | 2,716,214 | |
| | | | |
| | | | | | | | | | | | | | | 24,536,722 | |
| | | | | | | | | | | | | | | | |
| | | | |
| Ireland: 1.18% | | | | | | | | | | | | | | | | |
GE Capital UK Funding Company (Financials, Capital Markets, GBP) | | | 4.13 | | | | 9-13-2023 | | | | 4,700,000 | | | | 7,851,032 | |
GE Capital UK Funding Company (Financials, Capital Markets, GBP) | | | 5.13 | | | | 5-24-2023 | | | | 1,000,000 | | | | 1,769,332 | |
Ryanair Limited (Industrials, Airlines, EUR) | | | 1.13 | | | | 3-10-2023 | | | | 2,680,000 | | | | 2,831,261 | |
| | | | |
| | | | | | | | | | | | | | | 12,451,625 | |
| | | | | | | | | | | | | | | | |
| | | | |
| Luxembourg: 0.35% | | | | | | | | | | | | | | | | |
Befesa Zinc Aser SA (Utilities, Water Utilities, EUR) | | | 8.88 | | | | 5-15-2018 | | | | 2,925,000 | | | | 3,256,683 | |
The accompanying notes are an integral part of these financial statements.
| | | | |
| 10 | | Wells Fargo International Bond Fund | | Portfolio of investments—October 31, 2015 |
| | | | | | | | | | | | | | | | |
| Security name | | Interest rate | | | Maturity date | | | Principal | | | Value | |
| | | | |
| Luxembourg (continued) | | | | | | | | | | | | | | | | |
European Investment Bank (Financials, Banks, ZAR) | | | 9.00 | % | | | 3-31-2021 | | | | 5,790,000 | | | $ | 431,081 | |
| | | | |
| | | | | | | | | | | | | | | 3,687,764 | |
| | | | | | | | | | | | | | | | |
| | | | |
| Mexico: 0.09% | | | | | | | | | | | | | | | | |
America Movil SAB de CV (Telecommunication Services, Wireless Telecommunication Services, MXN) | | | 7.13 | | | | 12-9-2024 | | | | 7,250,000 | | | | 432,512 | |
Petroleos Mexicanos (Energy, Oil, Gas & Consumable Fuels, MXN) 144A | | | 7.19 | | | | 9-12-2024 | | | | 9,532,000 | | | | 541,559 | |
| | | | |
| | | | | | | | | | | | | | | 974,071 | |
| | | | | | | | | | | | | | | | |
| | | | |
| Netherlands: 0.34% | | | | | | | | | | | | | | | | |
Schaeffler Finance BV (Financials, Diversified Financial Services, EUR) | | | 3.50 | | | | 5-15-2022 | | | | 3,200,000 | | | | 3,584,860 | |
| | | | | | | | | | | | | | | | |
| | | | |
| Norway: 1.05% | | | | | | | | | | | | | | | | |
Kommunalbanken AS (Financials, Banks, AUD) | | | 5.25 | | | | 7-15-2024 | | | | 12,650,000 | | | | 10,391,836 | |
Lock AS (Financials, Diversified Financial Services, EUR) 144A | | | 7.00 | | | | 8-15-2021 | | | | 600,000 | | | | 689,811 | |
| | | | |
| | | | | | | | | | | | | | | 11,081,647 | |
| | | | | | | | | | | | | | | | |
| | | | |
| Philippines: 0.69% | | | | | | | | | | | | | | | | |
Asian Development Bank (Financials, Banks, AUD) | | | 3.75 | | | | 3-12-2025 | | | | 9,731,000 | | | | 7,282,942 | |
| | | | | | | | | | | | | | | | |
| | | | |
| Spain: 1.73% | | | | | | | | | | | | | | | | |
Ence Energia Y Celulosa (Materials, Paper & Forest Products, EUR) 144A | | | 5.38 | | | | 11-1-2022 | | | | 875,000 | | | | 988,597 | |
Ephios Bondco plc (Health Care, Health Care Providers & Services, EUR) 144A | | | 6.25 | | | | 7-1-2022 | | | | 1,200,000 | | | | 1,378,961 | |
Gas Natural Fenosa (Energy, Oil, Gas & Consumable Fuels, EUR) | | | 2.88 | | | | 3-11-2024 | | | | 1,000,000 | | | | 1,197,708 | |
Gas Natural Fenosa (Energy, Oil, Gas & Consumable Fuels, EUR) | | | 3.88 | | | | 4-11-2022 | | | | 2,200,000 | | | | 2,785,311 | |
Grupo Antolin Irausa SA (Consumer Discretionary, Auto Components, EUR) 144A | | | 5.13 | | | | 6-30-2022 | | | | 1,000,000 | | | | 1,124,436 | |
PortAventura Entertainment Barcelona BV (Consumer Discretionary, Hotels, Restaurants & Leisure, EUR) 144A | | | 7.25 | | | | 12-1-2020 | | | | 750,000 | | | | 853,227 | |
PortAventura Entertainment Barcelona BV (Consumer Discretionary, Hotels, Restaurants & Leisure, EUR) | | | 7.25 | | | | 12-1-2020 | | | | 1,150,000 | | | | 1,308,282 | |
Telefonica Emisiones S.A.U. (Telecommunication Services, Diversified Telecommunication Services, GBP) | | | 5.29 | | | | 12-9-2022 | | | | 5,100,000 | | | | 8,650,416 | |
| | | | |
| | | | | | | | | | | | | | | 18,286,938 | |
| | | | | | | | | | | | | | | | |
| | | | |
| United Kingdom: 4.51% | | | | | | | | | | | | | | | | |
AA Bond Company Limited (Financials, Diversified Financial Services, GBP) | | | 4.25 | | | | 7-31-2043 | | | | 3,495,000 | | | | 5,567,574 | |
Delphi Automotive plc (Consumer Discretionary, Auto Components, EUR) | | | 1.50 | | | | 3-10-2025 | | | | 3,100,000 | | | | 3,184,759 | |
FirstGroup plc (Industrials, Road & Rail, GBP) | | | 5.25 | | | | 11-29-2022 | | | | 3,020,000 | | | | 5,028,369 | |
GHD Bondco plc (Consumer Discretionary, Distributors, GBP) | | | 7.00 | | | | 4-15-2020 | | | | 1,475,000 | | | | 1,943,194 | |
GKN plc (Consumer Discretionary, Auto Components, GBP) | | | 5.38 | | | | 9-19-2022 | | | | 2,000,000 | | | | 3,335,380 | |
Heathrow Funding Limited (Industrials, Transportation Infrastructure, EUR) | | | 1.88 | | | | 5-23-2024 | | | | 561,000 | | | | 644,230 | |
Heathrow Funding Limited (Industrials, Transportation Infrastructure, GBP) | | | 5.23 | | | | 2-15-2023 | | | | 1,250,000 | | | | 2,186,046 | |
Heathrow Funding Limited (Industrials, Transportation Infrastructure, GBP) | | | 7.13 | | | | 2-14-2024 | | | | 1,900,000 | | | | 3,598,933 | |
Ineos Finance plc (Financials, Diversified Financial Services, EUR) 144A | | | 4.00 | | | | 5-1-2023 | | | | 3,150,000 | | | | 3,325,343 | |
Jaguar Land Rover plc (Consumer Discretionary, Automobiles, GBP) 144A | | | 3.88 | | | | 3-1-2023 | | | | 400,000 | | | | 581,183 | |
Jaguar Land Rover plc (Consumer Discretionary, Automobiles, GBP) | | | 5.00 | | | | 2-15-2022 | | | | 1,000,000 | | | | 1,588,433 | |
New Look Secured Issuer plc (Consumer Discretionary, Textiles, Apparel & Luxury Goods, GBP) 144A | | | 6.50 | | | | 7-1-2022 | | | | 2,600,000 | | | | 4,012,407 | |
TES Finance plc (Financials, Diversified Financial Services, GBP) | | | 6.75 | | | | 7-15-2020 | | | | 1,750,000 | | | | 2,549,420 | |
The accompanying notes are an integral part of these financial statements.
| | | | | | |
| Portfolio of investments—October 31, 2015 | | Wells Fargo International Bond Fund | | | 11 | |
| | | | | | | | | | | | | | | | |
| Security name | | Interest rate | | | Maturity date | | | Principal | | | Value | |
| | | |
| United Kingdom (continued) | | | | | | | | | | | | | |
Tesco plc (Consumer Staples, Food & Staples Retailing, GBP) | | | 6.13 | % | | | 2-24-2022 | | | | 2,400,000 | | | $ | 3,909,756 | |
Twinkle Pizza plc (Consumer Discretionary, Hotels, Restaurants & Leisure, GBP) | | | 6.63 | | | | 8-1-2021 | | | | 1,450,000 | | | | 2,324,358 | |
United Utilities Water plc (Utilities, Water Utilities, GBP) | | | 5.75 | | | | 3-25-2022 | | | | 1,200,000 | | | | 2,171,328 | |
Wagamama Finance plc (Financials, Diversified Financial Services, GBP) 144A | | | 7.88 | | | | 2-1-2020 | | | | 450,000 | | | | 730,487 | |
Wagamama Finance plc (Financials, Diversified Financial Services, GBP) | | | 7.88 | | | | 2-1-2020 | | | | 620,000 | | | | 1,006,449 | |
| | | | |
| | | | | | | | | | | | | | | 47,687,649 | |
| | | | | | | | | | | | | | | | |
| | | | |
| United States: 3.73% | | | | | | | | | | | | | | | | |
Albemarle Corporation (Materials, Chemicals, EUR) | | | 1.88 | | | | 12-8-2021 | | | | 3,910,000 | | | | 4,145,921 | |
Amgen Incorporated (Health Care, Biotechnology, EUR) | | | 4.00 | | | | 9-13-2029 | | | | 3,500,000 | | | | 5,508,312 | |
Discovery Communications Company (Consumer Discretionary, Media, EUR) | | | 1.90 | | | | 3-19-2027 | | | | 4,800,000 | | | | 4,649,673 | |
Morgan Stanley (Financials, Capital Markets, EUR) | | | 1.75 | | | | 1-30-2025 | | | | 5,750,000 | | | | 6,252,109 | |
Priceline Group Incorporated (Consumer Discretionary, Internet & Catalog Retail, EUR) | | | 1.80 | | | | 3-3-2027 | | | | 1,970,000 | | | | 1,959,190 | |
Priceline Group Incorporated (Consumer Discretionary, Internet & Catalog Retail, EUR) | | | 2.38 | | | | 9-23-2024 | | | | 5,659,000 | | | | 6,276,003 | |
Verizon Communications Incorporated (Telecommunication Services, Diversified Telecommunication Services, EUR) | | | 3.25 | | | | 2-17-2026 | | | | 5,864,000 | | | | 7,228,419 | |
Walgreens Boots Alliance Incorporated (Consumer Staples, Food & Staples Retailing, EUR) | | | 3.60 | | | | 11-20-2025 | | | | 2,250,000 | | | | 3,380,087 | |
| | | | |
| | | | | | | | | | | | | | | 39,399,714 | |
| | | | | | | | | | | | | | | | |
| | | | |
Total Foreign Corporate Bonds and Notes
(Cost $222,341,526) | | | | | | | | | | | | | | | 198,451,524 | |
| | | | | | | | | | | | | | | | |
| | | | |
Foreign Government Bonds @: 62.02% | | | | | | | | | | | | | | | | |
Australian Government Bond Series 138 (AUD) | | | 3.25 | | | | 4-21-2029 | | | | 37,125,000 | | | | 27,418,952 | |
Australian Government Bond Series 146 (AUD) | | | 1.75 | | | | 11-21-2020 | | | | 23,050,000 | | | | 16,181,359 | |
Bonos y Obligaciones del Estado (EUR) | | | 1.40 | | | | 1-31-2020 | | | | 26,795,000 | | | | 30,549,093 | |
Bonos y Obligaciones del Estado 144A (EUR) | | | 2.15 | | | | 10-31-2025 | | | | 22,465,000 | | | | 25,755,674 | |
Brazil (BRL) | | | 10.00 | | | | 1-1-2017 | | | | 32,620,000 | | | | 7,995,830 | |
Brazil (BRL) | | | 10.00 | | | | 1-1-2019 | | | | 116,150,000 | | | | 26,035,676 | |
Brazil (BRL) | | | 10.00 | | | | 1-1-2025 | | | | 83,740,000 | | | | 15,889,503 | |
Canada 144A (CAD) | | | 2.90 | | | | 6-15-2024 | | | | 20,900,000 | | | | 17,177,767 | |
Colombia (COP) | | | 7.00 | | | | 5-4-2022 | | | | 8,100,000,000 | | | | 2,733,972 | |
Colombia (COP) | | | 7.75 | | | | 4-14-2021 | | | | 1,630,000,000 | | | | 572,526 | |
France (EUR) | | | 1.00 | | | | 11-25-2025 | | | | 3,745,000 | | | | 4,164,256 | |
Hungary (HUF) | | | 6.75 | | | | 11-24-2017 | | | | 462,450,000 | | | | 1,821,170 | |
Indonesia (IDR) | | | 7.88 | | | | 4-15-2019 | | | | 48,400,000,000 | | | | 3,437,629 | |
Indonesia (IDR) | | | 10.00 | | | | 7-15-2017 | | | | 17,700,000,000 | | | | 1,322,492 | |
Italy Buoni Poliennali del Tesoro (EUR) | | | 2.50 | | | | 12-1-2024 | | | | 5,400,000 | | | | 6,461,853 | |
Korea (KRW) | | | 3.00 | | | | 9-10-2024 | | | | 28,650,000,000 | | | | 26,969,877 | |
Korea (KRW) | | | 3.13 | | | | 3-10-2019 | | | | 25,530,000,000 | | | | 23,425,233 | |
Malaysia (MYR) | | | 3.66 | | | | 10-15-2020 | | | | 7,650,000 | | | | 1,775,438 | |
Malaysia (MYR) | | | 3.96 | | | | 9-15-2025 | | | | 46,700,000 | | | | 10,708,606 | |
Malaysia (MYR) | | | 4.18 | | | | 7-15-2024 | | | | 6,400,000 | | | | 1,491,212 | |
Malaysia (MYR) | | | 4.50 | | | | 4-15-2030 | | | | 17,950,000 | | | | 4,228,362 | |
Mexico (MXN) | | | 4.75 | | | | 6-14-2018 | | | | 775,400,000 | | | | 47,306,779 | |
Mexico (MXN) | | | 10.00 | | | | 12-5-2024 | | | | 47,450,000 | | | | 3,677,049 | |
The accompanying notes are an integral part of these financial statements.
| | | | |
| 12 | | Wells Fargo International Bond Fund | | Portfolio of investments—October 31, 2015 |
| | | | | | | | | | | | | | | | |
| Security name | | Interest rate | | | Maturity date | | | Principal | | | Value | |
| | | | |
Foreign Government Bonds @ (continued) | | | | | | | | | | | | | | | | |
New Zealand (NZD) | | | 4.50 | % | | | 4-15-2027 | | | | 68,330,000 | | | $ | 51,432,509 | |
Poland (PLN) | | | 1.50 | | | | 4-25-2020 | | | | 10,800,000 | | | | 2,732,030 | |
Poland (PLN) | | | 3.25 | | | | 7-25-2025 | | | | 10,625,000 | | | | 2,887,706 | |
Poland (PLN) | | | 4.00 | | | | 10-25-2023 | | | | 156,200,000 | | | | 44,604,319 | |
Province of British Columbia (AUD) | | | 4.25 | | | | 11-27-2024 | | | | 14,090,000 | | | | 10,733,868 | |
Province of Ontario (AUD) | | | 6.25 | | | | 9-29-2020 | | | | 13,230,000 | | | | 10,829,317 | |
Queensland Treasury (AUD) | | | 5.75 | | | | 7-22-2024 | | | | 26,855,000 | | | | 23,067,837 | |
Republic of South Africa (ZAR) | | | 7.75 | | | | 2-28-2023 | | | | 275,781,000 | | | | 19,569,112 | |
Republic of South Africa (ZAR) | | | 8.00 | | | | 12-21-2018 | | | | 160,925,000 | | | | 11,818,493 | |
Romania (RON) | | | 5.75 | | | | 4-29-2020 | | | | 34,700,000 | | | | 9,845,690 | |
Romania (RON) | | | 5.85 | | | | 4-26-2023 | | | | 7,810,000 | | | | 2,280,579 | |
Singapore (SGD) | | | 2.88 | | | | 9-1-2030 | | | | 11,600,000 | | | | 8,425,795 | |
Singapore (SGD) | | | 3.00 | | | | 9-1-2024 | | | | 51,555,000 | | | | 38,586,207 | |
State of New South Wales Australia (AUD) | | | 5.00 | | | | 8-20-2024 | | | | 31,136,000 | | | | 25,929,689 | |
Thailand (THB) | | | 3.25 | | | | 6-16-2017 | | | | 40,507,000 | | | | 1,170,377 | |
Thailand (THB) | | | 3.85 | | | | 12-12-2025 | | | | 40,000,000 | | | | 1,242,952 | |
Turkey (TRY) | | | 9.00 | | | | 3-8-2017 | | | | 5,019,000 | | | | 1,699,168 | |
United Kingdom Gilt (GBP) | | | 2.00 | | | | 9-7-2025 | | | | 18,900,000 | | | | 29,353,874 | |
United Kingdom Gilt (GBP) | | | 2.75 | | | | 9-7-2024 | | | | 25,525,000 | | | | 42,334,479 | |
United Kingdom Gilt (GBP) | | | 4.75 | | | | 12-7-2030 | | | | 4,850,000 | | | | 9,874,156 | |
| | | | |
Total Foreign Government Bonds (Cost $725,921,627) | | | | | | | | | | | | | | | 655,518,465 | |
| | | | | | | | | | | | | | | | |
| | | | |
U.S. Treasury Securities: 7.99% | | | | | | | | | | | | | | | | |
U.S. Treasury Note | | | 2.00 | | | | 8-15-2025 | | | $ | 47,650,000 | | | | 47,038,555 | |
U.S. Treasury Note | | | 1.50 | | | | 1-31-2022 | | | | 25,300,000 | | | | 24,833,519 | |
U.S. Treasury Note | | | 1.38 | | | | 2-28-2019 | | | | 12,525,000 | | | | 12,610,621 | |
| | | | |
Total U.S. Treasury Securities (Cost $84,624,308) | | | | | | | | | | | | | | | 84,482,695 | |
| | | | | | | | | | | | | | | | |
| | | | |
Yankee Corporate Bonds and Notes: 4.93% | | | | | | | | | | | | | | | | |
| | | | |
| Bermuda: 0.27% | | | | | | | | | | | | | | | | |
Qtel International Finance Limited (Telecommunication Services, Diversified Telecommunication Services) | | | 4.75 | | | | 2-16-2021 | | | | 525,000 | | | | 581,952 | |
Qtel International Finance Limited (Telecommunication Services, Diversified Telecommunication Services) | | | 5.00 | | | | 10-19-2025 | | | | 2,050,000 | | | | 2,246,587 | |
| | | | |
| | | | | | | | | | | | | | | 2,828,539 | |
| | | | | | | | | | | | | | | | |
| | | | |
| Cayman Islands: 0.58% | | | | | | | | | | | | | | | | |
HPHT Finance Limited (Financials, Diversified Financial Services) 144A | | | 2.88 | | | | 3-17-2020 | | | | 1,650,000 | | | | 1,650,391 | |
International Petroleum Investment Company Limited (Energy, Oil, Gas & Consumable Fuels) | | | 5.00 | | | | 11-15-2020 | | | | 2,950,000 | | | | 3,296,625 | |
UPCB Finance IV Limited (Financials, Diversified Financial Services) 144A | | | 5.38 | | | | 1-15-2025 | | | | 1,200,000 | | | | 1,201,500 | |
| | | | |
| | | | | | | | | | | | | | | 6,148,516 | |
| | | | | | | | | | | | | | | | |
| | | | |
| Israel: 0.32% | | | | | | | | | | | | | | | | |
B Communications Limited (Telecommunication Services, Diversified Telecommunication Services) 144A | | | 7.38 | | | | 2-15-2021 | | | | 3,162,000 | | | | 3,430,770 | |
| | | | | | | | | | | | | | | | |
| | | | |
| Luxembourg: 0.47% | | | | | | | | | | | | | | | | |
Actavis Funding SCS (Health Care, Pharmaceuticals) | | | 3.45 | | | | 3-15-2022 | | | | 5,000,000 | | | | 4,968,870 | |
| | | | | | | | | | | | | | | | |
The accompanying notes are an integral part of these financial statements.
| | | | | | |
| Portfolio of investments—October 31, 2015 | | Wells Fargo International Bond Fund | | | 13 | |
| | | | | | | | | | | | | | | | |
| Security name | | Interest rate | | | Maturity date | | | Principal | | | Value | |
| | | | |
| Netherlands: 1.88% | | | | | | | | | | | | | | | | |
ABN AMRO Bank NV (Financials, Banks) 144A | | | 2.45 | % | | | 6-4-2020 | | | $ | 5,275,000 | | | $ | 5,278,814 | |
Fiat Chrysler Automobiles (Consumer Discretionary, Automobiles) | | | 5.25 | | | | 4-15-2023 | | | | 2,150,000 | | | | 2,150,000 | |
Mubadala Development Company (Energy, Oil, Gas & Consumable Fuels) | | | 5.50 | | | | 4-20-2021 | | | | 3,200,000 | | | | 3,646,176 | |
Myriad International Holdings BV (Consumer Discretionary, Media) | | | 6.00 | | | | 7-18-2020 | | | | 2,950,000 | | | | 3,142,222 | |
Siemens Financieringsmaatschappij NV (Industrials, Electrical Equipment) 144A | | | 2.90 | | | | 5-27-2022 | | | | 5,600,000 | | | | 5,661,051 | |
| | | | |
| | | | | | | | | | | | | | | 19,878,263 | |
| | | | | | | | | | | | | | | | |
| | | | |
| Switzerland: 0.23% | | | | | | | | | | | | | | | | |
Credit Suisse Group Funding Limited (Financials, Diversified Financial Services) 144A | | | 3.80 | | | | 9-15-2022 | | | | 2,400,000 | | | | 2,422,486 | |
| | | | | | | | | | | | | | | | |
| | | | |
| Turkey: 0.04% | | | | | | | | | | | | | | | | |
Anadolu Efes (Consumer Staples, Beverages) | | | 3.38 | | | | 11-1-2022 | | | | 425,000 | | | | 371,165 | |
| | | | | | | | | | | | | | | | |
| | | | |
| United Kingdom: 1.14% | | | | | | | | | | | | | | | | |
British Sky Broadcasting Group plc (Consumer Discretionary, Media) 144A | | | 3.13 | | | | 11-26-2022 | | | | 1,362,000 | | | | 1,332,520 | |
British Sky Broadcasting Group plc (Consumer Discretionary, Media) 144A | | | 3.75 | | | | 9-16-2024 | | | | 4,100,000 | | | | 4,087,809 | |
Imperial Tobacco Finance Company plc (Consumer Staples, Tobacco) 144A | | | 3.75 | | | | 7-21-2022 | | | | 5,350,000 | | | | 5,416,966 | |
Jaguar Land Rover Automobiles plc (Consumer Discretionary, Automobiles) 144A | | | 3.50 | | | | 3-15-2020 | | | | 1,200,000 | | | | 1,186,500 | |
| | | | |
| | | | | | | | | | | | | | | 12,023,795 | |
| | | | | | | | | | | | | | | | |
| | | | |
Total Yankee Corporate Bonds and Notes (Cost $50,915,693) | | | | | | | | | | | | | | | 52,072,404 | |
| | | | | | | | | | | | | | | | |
| | | | |
| | | Yield | | | | | | Shares | | | | |
| Short-Term Investments: 1.28% | | | | | | | | | | | | | | | | |
| | | | |
| Investment Companies: 1.28% | | | | | | | | | | | | | | | | |
Wells Fargo Cash Investment Money Market Fund, Select
Class (l)(u) | | | 0.16 | | | | | | | | 13,510,109 | | | | 13,510,109 | |
| | | | | | | | | | | | | | | | |
| | | | |
Total Short-Term Investments (Cost $13,510,109) | | | | | | | | | | | | | | | 13,510,109 | |
| | | | | | | | | | | | | | | | |
| | | | | | | | |
| Total investments in securities (Cost $1,130,028,614) * | | | 98.02 | % | | | 1,036,017,098 | |
Other assets and liabilities, net | | | 1.98 | | | | 20,972,937 | |
| | | | | | | | |
| Total net assets | | | 100.00 | % | | $ | 1,056,990,035 | |
| | | | | | | | |
| @ | Foreign bond principal is denominated in the local currency of the issuer. |
| (l) | The issuer of the security is an affiliated person of the Fund as defined in the Investment Company Act of 1940. |
| (u) | The rate represents the 7-day annualized yield at period end. |
| 144A | The security may be resold in transactions exempt from registration, normally to qualified institutional buyers, pursuant to Rule 144A under the Securities Act of 1933. |
| * | Cost for federal income tax purposes is $1,131,288,985 and unrealized gains (losses) consists of: |
| | | | |
Gross unrealized gains | | $ | 4,855,776 | |
Gross unrealized losses | | | (100,127,663 | ) |
| | | | |
Net unrealized losses | | $ | (95,271,887 | ) |
The accompanying notes are an integral part of these financial statements.
| | | | |
| 14 | | Wells Fargo International Bond Fund | | Statement of assets and liabilities—October 31, 2015 |
| | | | |
| | | | |
| |
Assets | | | | |
Investments | | | | |
In unaffiliated securities, at value (cost $1,116,518,505) | | $ | 1,022,506,989 | |
In affiliated securities, at value (cost $13,510,109) | | | 13,510,109 | |
| | | | |
Total investments, at value (cost $1,130,028,614) | | | 1,036,017,098 | |
Foreign currency, at value (cost $14,351,047) | | | 14,314,085 | |
Receivable for investments sold | | | 2,360,582 | |
Receivable for Fund shares sold | | | 3,264,879 | |
Receivable for interest | | | 11,735,017 | |
Unrealized gains on forward foreign currency contracts | | | 11,600,520 | |
Prepaid expenses and other assets | | | 56,409 | |
| | | | |
Total assets | | | 1,079,348,590 | |
| | | | |
| |
Liabilities | | | | |
Payable for investments purchased | | | 1,640,259 | |
Payable for Fund shares redeemed | | | 1,182,983 | |
Unrealized losses on forward foreign currency contracts | | | 18,700,982 | |
Management fee payable | | | 493,198 | |
Distribution fees payable | | | 5,007 | |
Administration fees payable | | | 85,869 | |
Accrued expenses and other liabilities | | | 250,257 | |
| | | | |
Total liabilities | | | 22,358,555 | |
| | | | |
Total net assets | | $ | 1,056,990,035 | |
| | | | |
| |
NET ASSETS CONSIST OF | | | | |
Paid-in capital | | $ | 1,194,821,755 | |
Overdistributed net investment income | | | (48,221,909 | ) |
Accumulated net realized gains on investments | | | 11,765,435 | |
Net unrealized losses on investments | | | (101,375,246 | ) |
| | | | |
Total net assets | | $ | 1,056,990,035 | |
| | | | |
| |
COMPUTATION OF NET ASSET VALUE AND OFFERING PRICE PER SHARE | | | | |
Net assets – Class A | | $ | 79,727,346 | |
Shares outstanding – Class A1 | | | 8,187,027 | |
Net asset value per share – Class A | | | $9.74 | |
Maximum offering price per share – Class A2 | | | $10.20 | |
Net assets – Class B | | $ | 402,849 | |
Shares outstanding – Class B1 | | | 41,644 | |
Net asset value per share – Class B | | | $9.67 | |
Net assets – Class C | | $ | 6,894,668 | |
Shares outstanding – Class C1 | | | 719,615 | |
Net asset value per share – Class C | | | $9.58 | |
Net assets – Class R6 | | $ | 13,152,036 | |
Shares outstanding – Class R61 | | | 1,341,995 | |
Net asset value per share – Class R6 | | | $9.80 | |
Net assets – Administrator Class | | $ | 266,849,183 | |
Shares outstanding – Administrator Class1 | | | 27,376,146 | |
Net asset value per share – Administrator Class | | | $9.75 | |
Net assets – Institutional Class | | $ | 689,963,953 | |
Shares outstanding – Institutional Class1 | | | 70,506,481 | |
Net asset value per share – Institutional Class | | | $9.79 | |
| 1 | The Fund has an unlimited number of authorized shares. |
| 2 | Maximum offering price is computed as 100/95.50 of net asset value. On investments of $50,000 or more, the offering price is reduced. |
The accompanying notes are an integral part of these financial statements.
| | | | | | |
| Statement of operations—year ended October 31, 2015 | | Wells Fargo International Bond Fund | | | 15 | |
| | | | |
| | | | |
| |
Investment income | | | | |
Interest (net of foreign interest withholding taxes of $289,910) | | $ | 49,115,686 | |
Securities lending income, net | | | 65,132 | |
Income from affiliated securities | | | 19,471 | |
| | | | |
Total investment income | | | 49,200,289 | |
| | | | |
| |
Expenses | | | | |
Management fee | | | 6,962,399 | |
Administration fees | | | | |
Class A | | | 154,374 | |
Class B | | | 936 | |
Class C | | | 14,271 | |
Class R6 | | | 3,030 | |
Administrator Class | | | 307,448 | |
Institutional Class | | | 619,487 | |
Shareholder servicing fees | | | | |
Class A | | | 241,210 | |
Class B | | | 1,407 | |
Class C | | | 22,298 | |
Administrator Class | | | 765,262 | |
Distribution fees | | | | |
Class B | | | 4,388 | |
Class C | | | 66,894 | |
Custody and accounting fees | | | 441,778 | |
Professional fees | | | 55,312 | |
Registration fees | | | 89,654 | |
Shareholder report expenses | | | 144,643 | |
Trustees’ fees and expenses | | | 12,770 | |
Other fees and expenses | | | 30,395 | |
| | | | |
Total expenses | | | 9,937,956 | |
Less: Fee waivers and/or expense reimbursements | | | (675,670 | ) |
| | | | |
Net expenses | | | 9,262,286 | |
| | | | |
Net investment income | | | 39,938,003 | |
| | | | |
| |
REALIZED AND UNREALIZED GAINS (LOSSES) ON INVESTMENTS | | | | |
| |
Net realized gains (losses) on: | | | | |
Unaffiliated securities | | | (119,914,620 | ) |
Forward foreign currency contract transactions | | | 16,037,918 | |
| | | | |
Net realized losses on investments | | | (103,876,702 | ) |
| | | | |
| |
Net change in unrealized gains (losses) on: | | | | |
Unaffiliated securities | | | (58,530,596 | ) |
Forward foreign currency contract transactions | | | 1,726,564 | |
| | | | |
Net change in unrealized gains (losses) on investments | | | (56,804,032 | ) |
| | | | |
Net realized and unrealized gains (losses) on investments | | | (160,680,734 | ) |
| | | | |
Net decrease in net assets resulting from operations | | $ | (120,742,731 | ) |
| | | | |
The accompanying notes are an integral part of these financial statements.
| | | | |
| 16 | | Wells Fargo International Bond Fund | | Statement of changes in net assets |
| | | | | | | | | | | | | | | | |
| | | Year ended
October 31, 2015 | | | Year ended
October 31, 2014 | |
| | | | |
Operations | | | | | | | | | | | | | | | | |
Net investment income | | | | | | $ | 39,938,003 | | | | | | | $ | 51,017,278 | |
Net realized losses on investments | | | | | | | (103,876,702 | ) | | | | | | | (19,851,675 | ) |
Net change in unrealized gains (losses) on investments | | | | | | | (56,804,032 | ) | | | | | | | (23,841,553 | ) |
| | | | |
Net increase (decrease) in net assets resulting from operations | | | | | | | (120,742,731 | ) | | | | | | | 7,324,050 | |
| | | | |
| | | | |
Distributions to shareholders from | | | | | | | | | | | | | | | | |
Net investment income | | | | | | | | | | | | | | | | |
Class A | | | | | | | (423,572 | ) | | | | | | | (1,131,543 | ) |
Class B | | | | | | | 0 | | | | | | | | (3,281 | ) |
Class C | | | | | | | 0 | | | | | | | | (58,435 | ) |
Class R6 | | | | | | | (48,140 | ) | | | | | | | (51,175 | ) |
Administrator Class | | | | | | | (1,661,619 | ) | | | | | | | (4,290,193 | ) |
Institutional Class | | | | | | | (4,268,266 | ) | | | | | | | (13,007,391 | ) |
Net realized gains | | | | | | | | | | | | | | | | |
Class A | | | | | | | (287,937 | ) | | | | | | | (3,719,413 | ) |
Class B | | | | | | | (2,272 | ) | | | | | | | (57,769 | ) |
Class C | | | | | | | (31,156 | ) | | | | | | | (526,829 | ) |
Class R6 | | | | | | | (18,411 | ) | | | | | | | (83,684 | ) |
Administrator Class | | | | | | | (1,004,296 | ) | | | | | | | (11,543,115 | ) |
Institutional Class | | | | | | | (2,298,056 | ) | | | | | | | (36,033,594 | ) |
| | | | |
Total distributions to shareholders | | | | | | | (10,043,725 | ) | | | | | | | (70,506,422 | ) |
| | | | |
| | | | |
Capital share transactions | | | Shares | | | | | | | | Shares | | | | | |
Proceeds from shares sold | | | | | | | | | | | | | | | | |
Class A | | | 4,376,785 | | | | 44,490,295 | | | | 2,749,646 | | | | 30,368,557 | |
Class B | | | 2 | | | | 19 | | | | 891 | | | | 9,492 | |
Class C | | | 29,172 | | | | 297,439 | | | | 72,519 | | | | 795,278 | |
Class R6 | | | 1,089,162 | | | | 11,067,245 | | | | 408,110 | | | | 4,564,894 | |
Administrator Class | | | 7,459,622 | | | | 76,084,803 | | | | 10,060,042 | | | | 111,082,502 | |
Institutional Class | | | 21,605,888 | | | | 222,681,252 | | | | 17,799,377 | | | | 196,135,780 | |
| | | | |
| | | | | | | 354,621,053 | | | | | | | | 342,956,503 | |
| | | | |
Reinvestment of distributions | | | | | | | | | | | | | | | | |
Class A | | | 66,631 | | | | 705,372 | | | | 437,747 | | | | 4,731,956 | |
Class B | | | 185 | | | | 1,968 | | | | 5,011 | | | | 53,798 | |
Class C | | | 2,403 | | | | 25,233 | | | | 43,996 | | | | 468,648 | |
Class R6 | | | 6,273 | | | | 66,551 | | | | 12,385 | | | | 134,859 | |
Administrator Class | | | 250,106 | | | | 2,645,484 | | | | 1,432,764 | | | | 15,504,058 | |
Institutional Class | | | 440,841 | | | | 4,675,573 | | | | 3,278,437 | | | | 35,575,623 | |
| | | | |
| | | | | | | 8,120,181 | | | | | | | | 56,468,942 | |
| | | | |
Payment for shares redeemed | | | | | | | | | | | | | | | | |
Class A | | | (5,719,183 | ) | | | (57,542,516 | ) | | | (3,778,957 | ) | | | (41,860,001 | ) |
Class B | | | (41,312 | ) | | | (422,819 | ) | | | (100,427 | ) | | | (1,099,942 | ) |
Class C | | | (395,376 | ) | | | (3,980,181 | ) | | | (471,593 | ) | | | (5,113,839 | ) |
Class R6 | | | (279,791 | ) | | | (2,789,621 | ) | | | (108,372 | ) | | | (1,209,097 | ) |
Administrator Class | | | (13,481,584 | ) | | | (136,684,425 | ) | | | (7,924,711 | ) | | | (87,207,416 | ) |
Institutional Class | | | (28,068,413 | ) | | | (285,845,548 | ) | | | (42,834,796 | ) | | | (471,768,358 | ) |
| | | | |
| | | | | | | (487,265,110 | ) | | | | | | | (608,258,653 | ) |
| | | | |
Net decrease in net assets resulting from capital share transactions | | | | | | | (124,523,876 | ) | | | | | | | (208,833,208 | ) |
| | | | |
Total decrease in net assets | | | | | | | (255,310,332 | ) | | | | | | | (272,015,580 | ) |
| | | | |
| | | | |
Net assets | | | | | | | | | | | | | | | | |
Beginning of period | | | | | | | 1,312,300,367 | | | | | | | | 1,584,315,947 | |
| | | | |
End of period | | | | | | $ | 1,056,990,035 | | | | | | | $ | 1,312,300,367 | |
| | | | |
Undistributed (overdistributed) net investment income | | | | | | $ | (48,221,909 | ) | | | | | | $ | 2,633,136 | |
| | | | |
The accompanying notes are an integral part of these financial statements.
| | | | | | |
| Financial highlights | | Wells Fargo International Bond Fund | | | 17 | |
(For a share outstanding throughout each period)
| | | | | | | | | | | | | | | | | | | | |
| | | Year ended October 31 | |
| CLASS A | | 2015 | | | 2014 | | | 2013 | | | 2012 | | | 2011 | |
Net asset value, beginning of period | | | $10.84 | | | | $11.32 | | | | $11.83 | | | | $11.85 | | | | $12.23 | |
Net investment income | | | 0.31 | 1 | | | 0.37 | 1 | | | 0.36 | 1 | | | 0.33 | 1 | | | 0.39 | 1 |
Net realized and unrealized gains (losses) on investments | | | (1.33 | ) | | | (0.34 | ) | | | (0.73 | ) | | | 0.08 | | | | (0.18 | ) |
| | | | | | | | | | | | | | | | | | | | |
Total from investment operations | | | (1.02 | ) | | | 0.03 | | | | (0.37 | ) | | | 0.41 | | | | 0.21 | |
Distributions to shareholders from | | | | | | | | | | | | | | | | | | | | |
Net investment income | | | (0.05 | ) | | | (0.12 | ) | | | (0.02 | ) | | | (0.29 | ) | | | (0.51 | ) |
Net realized gains | | | (0.03 | ) | | | (0.39 | ) | | | (0.12 | ) | | | (0.14 | ) | | | (0.08 | ) |
| | | | | | | | | | | | | | | | | | | | |
Total distributions to shareholders | | | (0.08 | ) | | | (0.51 | ) | | | (0.14 | ) | | | (0.43 | ) | | | (0.59 | ) |
Net asset value, end of period | | | $9.74 | | | | $10.84 | | | | $11.32 | | | | $11.83 | | | | $11.85 | |
Total return2 | | | (9.50 | )% | | | 0.26 | % | | | (3.18 | )% | | | 3.66 | % | | | 1.93 | % |
Ratios to average net assets (annualized) | | | | | | | | | | | | | | | | | | | | |
Gross expenses | | | 1.06 | % | | | 1.05 | % | | | 1.05 | % | | | 1.04 | % | | | 1.02 | % |
Net expenses | | | 1.03 | % | | | 1.03 | % | | | 1.03 | % | | | 1.03 | % | | | 1.02 | % |
Net investment income | | | 3.07 | % | | | 3.29 | % | | | 2.93 | % | | | 2.88 | % | | | 3.26 | % |
Supplemental data | | | | | | | | | | | | | | | | | | | | |
Portfolio turnover rate | | | 136 | % | | | 103 | % | | | 129 | % | | | 79 | % | | | 88 | % |
Net assets, end of period (000s omitted) | | | $79,727 | | | | $102,624 | | | | $113,846 | | | | $139,600 | | | | $286,577 | |
| 1 | Calculated based upon average shares outstanding |
| 2 | Total return calculations do not include any sales charges. |
The accompanying notes are an integral part of these financial statements.
| | | | |
| 18 | | Wells Fargo International Bond Fund | | Financial highlights |
(For a share outstanding throughout each period)
| | | | | | | | | | | | | | | | | | | | |
| | | Year ended October 31 | |
| CLASS B | | 2015 | | | 2014 | | | 2013 | | | 2012 | | | 2011 | |
Net asset value, beginning of period | | | $10.81 | | | | $11.27 | | | | $11.85 | | | | $11.88 | | | | $12.25 | |
Net investment income | | | 0.24 | 1 | | | 0.29 | 1 | | | 0.27 | 1 | | | 0.24 | 1 | | | 0.31 | 1 |
Net realized and unrealized gains (losses) on investments | | | (1.35 | ) | | | (0.34 | ) | | | (0.73 | ) | | | 0.09 | | | | (0.19 | ) |
| | | | | | | | | | | | | | | | | | | | |
Total from investment operations | | | (1.11 | ) | | | (0.05 | ) | | | (0.46 | ) | | | 0.33 | | | | 0.12 | |
Distributions to shareholders from | | | | | | | | | | | | | | | | | | | | |
Net investment income | | | 0.00 | | | | (0.02 | ) | | | 0.00 | | | | (0.22 | ) | | | (0.41 | ) |
Net realized gains | | | (0.03 | ) | | | (0.39 | ) | | | (0.12 | ) | | | (0.14 | ) | | | (0.08 | ) |
| | | | | | | | | | | | | | | | | | | | |
Total distributions to shareholders | | | (0.03 | ) | | | (0.41 | ) | | | (0.12 | ) | | | (0.36 | ) | | | (0.49 | ) |
Net asset value, end of period | | | $9.67 | | | | $10.81 | | | | $11.27 | | | | $11.85 | | | | $11.88 | |
Total return2 | | | (10.29 | )% | | | (0.44 | )% | | | (3.90 | )% | | | 2.90 | % | | | 1.15 | % |
Ratios to average net assets (annualized) | | | | | | | | | | | | | | | | | | | | |
Gross expenses | | | 1.80 | % | | | 1.78 | % | | | 1.80 | % | | | 1.79 | % | | | 1.77 | % |
Net expenses | | | 1.77 | % | | | 1.77 | % | | | 1.78 | % | | | 1.78 | % | | | 1.77 | % |
Net investment income | | | 2.33 | % | | | 2.57 | % | | | 2.13 | % | | | 2.12 | % | | | 2.53 | % |
Supplemental data | | | | | | | | | | | | | | | | | | | | |
Portfolio turnover rate | | | 136 | % | | | 103 | % | | | 129 | % | | | 79 | % | | | 88 | % |
Net assets, end of period (000s omitted) | | | $403 | | | | $895 | | | | $1,998 | | | | $4,008 | | | | $6,925 | |
| 1 | Calculated based upon average shares outstanding |
| 2 | Total return calculations do not include any sales charges. |
The accompanying notes are an integral part of these financial statements.
| | | | | | |
| Financial highlights | | Wells Fargo International Bond Fund | | | 19 | |
(For a share outstanding throughout each period)
| | | | | | | | | | | | | | | | | | | | |
| | | Year ended October 31 | |
| CLASS C | | 2015 | | | 2014 | | | 2013 | | | 2012 | | | 2011 | |
Net asset value, beginning of period | | | $10.70 | | | | $11.19 | | | | $11.76 | | | | $11.81 | | | | $12.20 | |
Net investment income | | | 0.23 | 1 | | | 0.28 | 1 | | | 0.26 | 1 | | | 0.24 | 1 | | | 0.31 | 1 |
Net realized and unrealized gains (losses) on investments | | | (1.32 | ) | | | (0.34 | ) | | | (0.71 | ) | | | 0.08 | | | | (0.19 | ) |
| | | | | | | | | | | | | | | | | | | | |
Total from investment operations | | | (1.09 | ) | | | (0.06 | ) | | | (0.45 | ) | | | 0.32 | | | | 0.12 | |
Distributions to shareholders from | | | | | | | | | | | | | | | | | | | | |
Net investment income | | | 0.00 | | | | (0.04 | ) | | | (0.00 | )2 | | | (0.23 | ) | | | (0.43 | ) |
Net realized gains | | | (0.03 | ) | | | (0.39 | ) | | | (0.12 | ) | | | (0.14 | ) | | | (0.08 | ) |
| | | | | | | | | | | | | | | | | | | | |
Total distributions to shareholders | | | (0.03 | ) | | | (0.43 | ) | | | (0.12 | ) | | | (0.37 | ) | | | (0.51 | ) |
Net asset value, end of period | | | $9.58 | | | | $10.70 | | | | $11.19 | | | | $11.76 | | | | $11.81 | |
Total return3 | | | (10.21 | )% | | | (0.52 | )% | | | (3.84 | )% | | | 2.86 | % | | | 1.11 | % |
Ratios to average net assets (annualized) | | | | | | | | | | | | | | | | | | | | |
Gross expenses | | | 1.81 | % | | | 1.80 | % | | | 1.80 | % | | | 1.79 | % | | | 1.77 | % |
Net expenses | | | 1.78 | % | | | 1.78 | % | | | 1.78 | % | | | 1.78 | % | | | 1.77 | % |
Net investment income | | | 2.33 | % | | | 2.54 | % | | | 2.15 | % | | | 2.12 | % | | | 2.50 | % |
Supplemental data | | | | | | | | | | | | | | | | | | | | |
Portfolio turnover rate | | | 136 | % | | | 103 | % | | | 129 | % | | | 79 | % | | | 88 | % |
Net assets, end of period (000s omitted) | | | $6,895 | | | | $11,597 | | | | $16,097 | | | | $23,448 | | | | $27,861 | |
| 1 | Calculated based upon average shares outstanding |
| 2 | Amount is less than $0.005 per share. |
| 3 | Total return calculations do not include any sales charges. |
The accompanying notes are an integral part of these financial statements.
| | | | |
| 20 | | Wells Fargo International Bond Fund | | Financial highlights |
(For a share outstanding throughout each period)
| | | | | | | | | | | | |
| | | Year ended October 31 | |
| CLASS R6 | | 2015 | | | 2014 | | | 20131 | |
Net asset value, beginning of period | | | $10.88 | | | | $11.36 | | | | $11.80 | |
Net investment income | | | 0.35 | 2 | | | 0.42 | 2 | | | 0.39 | 2 |
Net realized and unrealized gains (losses) on investments | | | (1.34 | ) | | | (0.35 | ) | | | (0.69 | ) |
| | | | | | | | | | | | |
Total from investment operations | | | (0.99 | ) | | | 0.07 | | | | (0.30 | ) |
Distributions to shareholders from | | | | | | | | | | | | |
Net investment income | | | (0.06 | ) | | | (0.16 | ) | | | (0.02 | ) |
Net realized gains | | | (0.03 | ) | | | (0.39 | ) | | | (0.12 | ) |
| | | | | | | | | | | | |
Total distributions to shareholders | | | (0.09 | ) | | | (0.55 | ) | | | (0.14 | ) |
Net asset value, end of period | | | $9.80 | | | | $10.88 | | | | $11.36 | |
Total return3 | | | (9.18 | )% | | | 0.60 | % | | | (2.52 | )% |
Ratios to average net assets (annualized) | | | | | | | | | | | | |
Gross expenses | | | 0.68 | % | | | 0.67 | % | | | 0.68 | % |
Net expenses | | | 0.65 | % | | | 0.65 | % | | | 0.65 | % |
Net investment income | | | 3.46 | % | | | 3.64 | % | | | 3.70 | % |
Supplemental data | | | | | | | | | | | | |
Portfolio turnover rate | | | 136 | % | | | 103 | % | | | 129 | % |
Net assets, end of period (000s omitted) | | | $13,152 | | | | $5,729 | | | | $2,433 | |
| 1 | For the period from November 30, 2012 (commencement of class operations) to October 31, 2013 |
| 2 | Calculated based upon average shares outstanding |
| 3 | Returns for periods of less than one year are not annualized. |
The accompanying notes are an integral part of these financial statements.
| | | | | | |
| Financial highlights | | Wells Fargo International Bond Fund | | | 21 | |
(For a share outstanding throughout each period)
| | | | | | | | | | | | | | | | | | | | |
| | | Year ended October 31 | |
| ADMINISTRATOR CLASS | | 2015 | | | 2014 | | | 2013 | | | 2012 | | | 2011 | |
Net asset value, beginning of period | | | $10.84 | | | | $11.32 | | | | $11.81 | | | | $11.83 | | | | $12.23 | |
Net investment income | | | 0.33 | 1 | | | 0.39 | 1 | | | 0.36 | 1 | | | 0.35 | 1 | | | 0.38 | 1 |
Net realized and unrealized gains (losses) on investments | | | (1.34 | ) | | | (0.34 | ) | | | (0.71 | ) | | | 0.08 | | | | (0.16 | ) |
| | | | | | | | | | | | | | | | | | | | |
Total from investment operations | | | (1.01 | ) | | | 0.05 | | | | (0.35 | ) | | | 0.43 | | | | 0.22 | |
Distributions to shareholders from | | | | | | | | | | | | | | | | | | | | |
Net investment income | | | (0.05 | ) | | | (0.14 | ) | | | (0.02 | ) | | | (0.31 | ) | | | (0.54 | ) |
Net realized gains | | | (0.03 | ) | | | (0.39 | ) | | | (0.12 | ) | | | (0.14 | ) | | | (0.08 | ) |
| | | | | | | | | | | | | | | | | | | | |
Total distributions to shareholders | | | (0.08 | ) | | | (0.53 | ) | | | (0.14 | ) | | | (0.45 | ) | | | (0.62 | ) |
Net asset value, end of period | | | $9.75 | | | | $10.84 | | | | $11.32 | | | | $11.81 | | | | $11.83 | |
Total return | | | (9.36 | )% | | | 0.43 | % | | | (2.98 | )% | | | 3.89 | % | | | 2.03 | % |
Ratios to average net assets (annualized) | | | | | | | | | | | | | | | | | | | | |
Gross expenses | | | 0.99 | % | | | 0.99 | % | | | 0.99 | % | | | 0.97 | % | | | 0.95 | % |
Net expenses | | | 0.85 | % | | | 0.85 | % | | | 0.85 | % | | | 0.85 | % | | | 0.85 | % |
Net investment income | | | 3.26 | % | | | 3.47 | % | | | 3.15 | % | | | 3.04 | % | | | 3.21 | % |
Supplemental data | | | | | | | | | | | | | | | | | | | | |
Portfolio turnover rate | | | 136 | % | | | 103 | % | | | 129 | % | | | 79 | % | | | 88 | % |
Net assets, end of period (000s omitted) | | | $266,849 | | | | $359,383 | | | | $334,778 | | | | $294,330 | | | | $170,836 | |
| 1 | Calculated based upon average shares outstanding |
The accompanying notes are an integral part of these financial statements.
| | | | |
| 22 | | Wells Fargo International Bond Fund | | Financial highlights |
(For a share outstanding throughout each period)
| | | | | | | | | | | | | | | | | | | | |
| | | Year ended October 31 | |
| INSTITUTIONAL CLASS | | 2015 | | | 2014 | | | 2013 | | | 2012 | | | 2011 | |
Net asset value, beginning of period | | | $10.87 | | | | $11.35 | | | | $11.82 | | | | $11.84 | | | | $12.23 | |
Net investment income | | | 0.35 | 1 | | | 0.41 | 1 | | | 0.37 | | | | 0.36 | | | | 0.44 | |
Net realized and unrealized gains (losses) on investments | | | (1.34 | ) | | | (0.35 | ) | | | (0.70 | ) | | | 0.09 | | | | (0.20 | ) |
| | | | | | | | | | | | | | | | | | | | |
Total from investment operations | | | (0.99 | ) | | | 0.06 | | | | (0.33 | ) | | | 0.45 | | | | 0.24 | |
Distributions to shareholders from | | | | | | | | | | | | | | | | | | | | |
Net investment income | | | (0.06 | ) | | | (0.15 | ) | | | (0.02 | ) | | | (0.33 | ) | | | (0.55 | ) |
Net realized gains | | | (0.03 | ) | | | (0.39 | ) | | | (0.12 | ) | | | (0.14 | ) | | | (0.08 | ) |
| | | | | | | | | | | | | | | | | | | | |
Total distributions to shareholders | | | (0.09 | ) | | | (0.54 | ) | | | (0.14 | ) | | | (0.47 | ) | | | (0.63 | ) |
Net asset value, end of period | | | $9.79 | | | | $10.87 | | | | $11.35 | | | | $11.82 | | | | $11.84 | |
Total return | | | (9.20 | )% | | | 0.55 | % | | | (2.78 | )% | | | 3.99 | % | | | 2.19 | % |
Ratios to average net assets (annualized) | | | | | | | | | | | | | | | | | | | | |
Gross expenses | | | 0.73 | % | | | 0.72 | % | | | 0.72 | % | | | 0.71 | % | | | 0.69 | % |
Net expenses | | | 0.70 | % | | | 0.70 | % | | | 0.70 | % | | | 0.71 | % | | | 0.69 | % |
Net investment income | | | 3.41 | % | | | 3.62 | % | | | 3.26 | % | | | 3.19 | % | | | 3.60 | % |
Supplemental data | | | | | | | | | | | | | | | | | | | | |
Portfolio turnover rate | | | 136 | % | | | 103 | % | | | 129 | % | | | 79 | % | | | 88 | % |
Net assets, end of period (000s omitted) | | | $689,964 | | | | $832,072 | | | | $1,115,163 | | | | $1,270,164 | | | | $1,228,793 | |
| 1 | Calculated based upon average shares outstanding. |
The accompanying notes are an integral part of these financial statements.
| | | | | | |
| Notes to financial statements | | Wells Fargo International Bond Fund | | | 23 | |
1. ORGANIZATION
Wells Fargo Funds Trust (the “Trust”), a Delaware statutory trust organized on March 10, 1999, is an open-end management investment company registered under the Investment Company Act of 1940, as amended (the “1940 Act”). As an investment company, the Trust follows the accounting and reporting guidance in Financial Accounting Standards Board (“FASB”) Accounting Standards Codification Topic 946, Financial Services – Investment Companies. These financial statements report on the Wells Fargo International Bond Fund (the “Fund”) which is a diversified series of the Trust.
2. SIGNIFICANT ACCOUNTING POLICIES
The following significant accounting policies, which are consistently followed in the preparation of the financial statements of the Fund, are in conformity with U.S. generally accepted accounting principles which require management to make estimates and assumptions that affect the reported amounts of assets and liabilities, disclosure of contingent assets and liabilities at the date of the financial statements, and the reported amounts of revenues and expenses during the reporting period. Actual results could differ from those estimates.
Securities valuation
All investments are valued each business day as of the close of regular trading on the New York Stock Exchange (generally 4 p.m. Eastern Time).
Debt securities are valued at the evaluated bid price provided by an independent pricing service or, if a reliable price is not available, the quoted bid price from an independent broker-dealer.
The values of securities denominated in foreign currencies are translated into U.S. dollars at rates provided by an independent foreign currency pricing source at a time each business day specified by the Management Valuation Team of Wells Fargo Funds Management, LLC (“Funds Management”).
Investments in registered open-end investment companies are valued at net asset value. Interests in non-registered investment vehicles that are redeemable at net asset value are fair valued at net asset value when available.
Investments which are not valued using any of the methods discussed above are valued at their fair value, as determined in good faith by the Board of Trustees of the Fund. The Board of Trustees has established a Valuation Committee comprised of the Trustees and has delegated to it the authority to take any actions regarding the valuation of portfolio securities that the Valuation Committee deems necessary or appropriate, including determining the fair value of portfolio securities, unless the determination has been delegated to the Management Valuation Team. The Board of Trustees retains the authority to make or ratify any valuation decisions or approve any changes to the Valuation Procedures as it deems appropriate. On a quarterly basis, the Board of Trustees receives reports on any valuation actions taken by the Valuation Committee or the Management Valuation Team which may include items for ratification.
Valuations of fair valued securities are compared to the next actual sales price when available, or other appropriate market values, to assess the continued appropriateness of the fair valuation methodologies used. These securities are fair valued on a day-to-day basis, taking into consideration changes to appropriate market information and any significant changes to the inputs considered in the valuation process until there is a readily available price provided on an exchange or by an independent pricing service. Valuations received from an independent pricing service or independent broker-dealer quotes are periodically validated by comparisons to most recent trades and valuations provided by other independent pricing services in addition to the review of prices by the manager and/or subadviser. Unobservable inputs used in determining fair valuations are identified based on the type of security, taking into consideration factors utilized by market participants in valuing the investment, knowledge about the issuer and the current market environment.
Foreign currency translation
The accounting records of the Fund are maintained in U.S. dollars. The values of other assets and liabilities denominated in foreign currencies are translated into U.S. dollars at rates provided by an independent foreign currency pricing source at a time each business day specified by the Management Valuation Team. Purchases and sales of securities, and income and expenses are converted at the rate of exchange on the respective dates of such transactions. Net realized foreign exchange gains or losses arise from sales of foreign currencies, currency gains or losses realized between the trade and settlement dates on securities transactions, and the difference between the amounts of dividends, interest and foreign withholding taxes recorded and the U.S. dollar equivalent of the amounts actually paid or received. Net unrealized foreign exchange gains and losses arise from changes in the fair value of assets and liabilities other than investments in securities resulting from changes in exchange rates. The changes in net assets arising from changes in exchange rates and the changes in net assets resulting from changes in market prices of securities are not separately presented. Such changes are included in net realized and unrealized gains or losses from investments.
| | | | |
| 24 | | Wells Fargo International Bond Fund | | Notes to financial statements |
Forward foreign currency contracts
The Fund is subject to foreign currency exchange rate risk in the normal course of pursuing its investment objectives. A forward foreign currency contract is an agreement between two parties to purchase or sell a specific currency for an agreed-upon price at a future date. The Fund enters into forward foreign currency contracts to facilitate transactions in foreign-denominated securities and to attempt to minimize the risk to the Fund from adverse changes in the relationship between currencies. Forward foreign currency contracts are recorded at the forward rate and marked-to-market daily. When the contracts are closed, realized gains and losses arising from such transactions are recorded as realized gains or losses on forward foreign currency contract transactions. The Fund could be exposed to risks if the counterparties to the contracts are unable to meet the terms of their contracts or if the value of the foreign currency changes unfavorably. The Fund’s maximum risk of loss from counterparty credit risk is the unrealized gains on the contracts. This risk may be mitigated if there is a master netting arrangement between the Fund and the counterparty.
Security loans
The Fund may lend its securities from time to time in order to earn additional income in the form of fees or interest on securities received as collateral or the investment of any cash received as collateral. The Fund continues to receive interest or dividends on the securities loaned. The Fund receives collateral in the form of cash or securities with a value at least equal to the value of the securities on loan. The value of the loaned securities is determined at the close of each business day and any additional required collateral is delivered to the Fund on the next business day. In a securities lending transaction, the net asset value of the Fund will be affected by an increase or decrease in the value of the securities loaned and by an increase or decrease in the value of the instrument in which collateral is invested. The amount of securities lending activity undertaken by the Fund fluctuates from time to time. In the event of default or bankruptcy by the borrower, the Fund may be prevented from recovering the loaned securities or gaining access to the collateral or may experience delays or costs in doing so. In addition, the investment of any cash collateral received may lose all or part of its value. The Fund has the right under the lending agreement to recover the securities from the borrower on demand.
The Fund lends its securities through an unaffiliated securities lending agent. Cash collateral received in connection with its securities lending transactions is invested in Securities Lending Cash Investments, LLC (the “Securities Lending Fund”). The Securities Lending Fund is exempt from registration under Section 3(c)(7) of the 1940 Act and is managed by Funds Management and is subadvised by Wells Capital Management Incorporated (“WellsCap”). Funds Management receives an advisory fee starting at 0.05% and declining to 0.01% as the average daily net assets of the Securities Lending Fund increase. All of the fees received by Funds Management are paid to WellsCap for its services as subadviser. The Securities Lending Fund seeks to provide a positive return compared to the daily Fed Funds Open rate by investing in high-quality, U.S. dollar-denominated short-term money market instruments. Securities Lending Fund investments are fair valued based upon the amortized cost valuation technique. Income earned from investment in the Securities Lending Fund is included in securities lending income on the Statement of Operations.
When-issued transactions
The Fund may purchase securities on a forward commitment or when-issued basis. The Fund records a when-issued transaction on the trade date and will segregate assets in an amount at least equal in value to the Fund’s commitment to purchase when-issued securities. Securities purchased on a when-issued basis are marked-to-market daily and the Fund begins earning interest on the settlement date. Losses may arise due to changes in the market value of the underlying securities or if the counterparty does not perform under the contract.
Security transactions and income recognition
Securities transactions are recorded on a trade date basis. Realized gains or losses are recorded on the basis of identified cost.
Interest income is accrued daily and bond discounts are accreted and premiums are amortized daily based on the effective interest method. To the extent debt obligations are placed on non-accrual status, any related interest income may be reduced by writing off interest receivables when the collection of all or a portion of interest has become doubtful based on consistently applied procedures. If the issuer subsequently resumes interest payments or when the collectability of interest is reasonably assured, the debt obligation is removed from non-accrual status.
Income from foreign securities is recorded net of foreign taxes withheld where recovery of such taxes is not assured.
| | | | | | |
| Notes to financial statements | | Wells Fargo International Bond Fund | | | 25 | |
Distributions to shareholders
Distributions to shareholders from net investment income and net realized gains, if any, are recorded on the ex-dividend date. Such distributions are determined in conformity with federal income tax regulations, which may differ in amount or character from net investment income and realized gains recognized for purposes of U.S. generally accepted accounting principles.
Federal and other taxes
The Fund intends to continue to qualify as a regulated investment company by distributing substantially all of its investment company taxable income and any net realized capital gains (after reduction for capital loss carryforwards) sufficient to relieve it from all, or substantially all, federal income taxes. Accordingly, no provision for federal income taxes was required.
The Fund’s income and federal excise tax returns and all financial records supporting those returns for the prior three fiscal years are subject to examination by the federal and Delaware revenue authorities. Management has analyzed the Fund’s tax positions taken on federal, state, and foreign tax returns for all open tax years and does not believe that there are any uncertain tax positions that require recognition of a tax liability.
Reclassifications are made to the Fund’s capital accounts for permanent tax differences to reflect income and gains available for distribution (or available capital loss carryforwards) under federal income tax regulations. U.S. generally accepted accounting principles require that certain components of net assets be adjusted to reflect permanent differences between financial and tax reporting. These reclassifications have no effect on net assets or net asset values per share. The primary permanent differences causing such reclassifications are due to foreign currency transactions and net operating losses. At October 31, 2015, as a result of permanent book-to-tax differences, the following reclassification adjustments were made on the Statement of Assets and Liabilities:
| | | | |
| Paid-in capital | | Overdistributed
net investment income | | Accumulated net
realized gains
on investments |
| $(23,589,277) | | $(84,391,451) | | $107,980,728 |
As of October 31, 2015, the Fund had a qualified late-year ordinary loss of $47,186,120 which will be recognized on the first day of the following fiscal year.
Class allocations
The separate classes of shares offered by the Fund differ principally in applicable sales charges, distribution, shareholder servicing, and administration fees. Class specific expenses are charged directly to that share class. Investment income, common expenses, and realized and unrealized gains (losses) on investments are allocated daily to each class of shares based on the relative proportion of net assets of each class.
3. FAIR VALUATION MEASUREMENTS
Fair value measurements of investments are determined within a framework that has established a fair value hierarchy based upon the various data inputs utilized in determining the value of the Fund’s investments. The three-level hierarchy gives the highest priority to unadjusted quoted prices in active markets for identical assets or liabilities (Level 1) and the lowest priority to significant unobservable inputs (Level 3). The Fund’s investments are classified within the fair value hierarchy based on the lowest level of input that is significant to the fair value measurement. The inputs are summarized into three broad levels as follows:
| n | | Level 1 – quoted prices in active markets for identical securities |
| n | | Level 2 – other significant observable inputs (including quoted prices for similar securities, interest rates, prepayment speeds, credit risk, use of amortized cost, etc.) |
| n | | Level 3 – significant unobservable inputs (including the Fund’s own assumptions in determining the fair value of investments) |
The inputs or methodologies used for valuing investments in securities are not necessarily an indication of the risk associated with investing in those securities.
| | | | |
| 26 | | Wells Fargo International Bond Fund | | Notes to financial statements |
The following is a summary of the inputs used in valuing the Fund’s assets and liabilities as of October 31, 2015:
| | | | | | | | | | | | | | | | |
| | | Quoted prices
(Level 1) | | | Other significant
observable inputs
(Level 2) | | | Significant
unobservable inputs
(Level 3) | | | Total | |
Assets | | | | | | | | | | | | | | | | |
Investments in: | | | | | | | | | | | | | | | | |
| | | | |
Corporate bonds and notes | | $ | 0 | | | $ | 31,981,901 | | | $ | 0 | | | $ | 31,981,901 | |
| | | | |
Foreign corporate bonds and notes | | | 0 | | | | 198,451,524 | | | | 0 | | | | 198,451,524 | |
| | | | |
Foreign government bonds | | | 0 | | | | 655,518,465 | | | | 0 | | | | 655,518,465 | |
| | | | |
U.S. Treasury securities | | | 84,482,695 | | | | 0 | | | | 0 | | | | 84,482,695 | |
| | | | |
Yankee corporate bonds and notes | | | 0 | | | | 52,072,404 | | | | 0 | | | | 52,072,404 | |
| | | | |
Short-term investments | | | | | | | | | | | | | | | | |
Investment companies | | | 13,510,109 | | | | 0 | | | | 0 | | | | 13,510,109 | |
| | | | 97,992,804 | | | | 938,024,294 | | | | 0 | | | | 1,036,017,098 | |
| | | | |
Forward foreign currency contracts | | | 0 | | | | 11,600,520 | | | | 0 | | | | 11,600,520 | |
Total assets | | $ | 97,992,804 | | | $ | 949,624,814 | | | $ | 0 | | | $ | 1,047,617,618 | |
Liabilities | | | | | | | | | | | | | | | | |
| | | | |
Forward foreign currency contracts | | $ | 0 | | | $ | 18,700,982 | | | $ | 0 | | | $ | 18,700,982 | |
Total liabilities | | $ | 0 | | | $ | 18,700,982 | | | $ | 0 | | | $ | 18,700,982 | |
Forward foreign currency contracts are reported at their unrealized gains (losses) at measurement date, which represents the change in the contract’s value from trade date. All other assets and liabilities are reported at their market value at measurement date.
The Fund recognizes transfers between levels within the fair value hierarchy at the end of the reporting period. At October 31, 2015, the Fund did not have any transfers into/out of Level 1, Level 2, or Level 3.
4. TRANSACTIONS WITH AFFILIATES
Management fee
Funds Management, an indirect wholly owned subsidiary of Wells Fargo & Company (“Wells Fargo”), is the manager of the Fund and provides advisory and fund-level administrative services under an investment management agreement. Under the investment management agreement, Funds Management is responsible for, among other services, implementing the investment objectives and strategies of the Fund, supervising the applicable subadviser, providing fund-level administrative services in connection with the Fund’s operations, and providing any other fund-level administrative services reasonably necessary for the operation of the Fund. As compensation for its services under the investment management agreement, Funds Management is entitled to receive an annual management fee starting at 0.60% and declining to 0.48% as the average daily net assets of the Fund increase.
Prior to July 1, 2015, Funds Management provided advisory services pursuant to an investment advisory agreement and was entitled to receive an annual fee which started at 0.55% and declined to 0.45% as the average daily net assets of the Fund increased. In addition, fund-level administrative services were provided by Funds Management under a separate administration agreement at an annual fee which started at 0.05% and declined to 0.03% as the average daily net assets of the Fund increased. For financial statement purposes, the advisory fee and fund-level administration fee for the year ended October 31, 2015 have been included in management fee on the Statement of Operations.
For the year ended October 31, 2015, the management fee was equivalent to an annual rate of 0.58% of the Fund’s average daily net assets.
Funds Management has retained the services of a subadviser to provide daily portfolio management to the Fund. The fee for subadvisory services is borne by Funds Management. First International Advisors, LLC, an affiliate of Funds Management and an indirect, wholly owned subsidiary of Wells Fargo, is the subadviser to the Fund and is entitled to receive a fee from Funds Management at an annual rate starting at 0.35% and declining to 0.20% as the average daily net assets of the Fund increase.
| | | | | | |
| Notes to financial statements | | Wells Fargo International Bond Fund | | | 27 | |
Administration fees
Under a class-level administration agreement, Funds Management provides class-level administrative services to the Fund, which includes paying fees and expenses for services provided by the transfer agent, sub-transfer agents, omnibus account servicers and record-keepers. As compensation for its services under the class-level administration agreement, Funds Management receives an annual fee which is calculated based on the average daily net assets of each class as follows:
| | | | |
| | | Class-level
administration fee | |
Class A, Class B, Class C | | | 0.16 | % |
Class R6 | | | 0.03 | |
Administrator Class | | | 0.10 | |
Institutional Class | | | 0.08 | |
Funds Management has contractually waived and/or reimbursed management and administration fees to the extent necessary to maintain certain net operating expense ratios for the Fund. Waiver of fees and/or reimbursement of expenses by Funds Management were made first from fund level expenses on a proportionate basis and then from class specific expenses. Funds Management has committed through February 29, 2016 to waive fees and/or reimburse expenses to the extent necessary to cap the Fund’s expenses at 1.03% for Class A shares, 1.78% for Class B shares, 1.78% for Class C shares, 0.65% for Class R6 shares, 0.85% for Administrator Class shares, and 0.70% for Institutional Class shares. After this time, the cap may be increased or the commitment to maintain the cap may be terminated only with the approval of the Board of Trustees.
Distribution fees
The Trust has adopted a distribution plan for Class B and Class C shares of the Fund pursuant to Rule 12b-1 under the 1940 Act. Distribution fees are charged to Class B and Class C shares and paid to Wells Fargo Funds Distributor, LLC (“Funds Distributor”), the principal underwriter, at an annual rate of 0.75% of the average daily net assets of Class B and Class C shares.
In addition, Funds Distributor is entitled to receive the front-end sales charge from the purchase of Class A shares and a contingent deferred sales charge on the redemption of certain Class A shares. Funds Distributor is also entitled to receive the contingent deferred sales charges from redemptions of Class B and Class C shares. For the year ended October 31, 2015, Funds Distributor received $1,948 from the sale of Class A shares and $11 in contingent deferred sales charges from redemptions of Class C shares.
Shareholder servicing fees
The Trust has entered into contracts with one or more shareholder servicing agents, whereby Class A, Class B, Class C, and Administrator Class of the Fund is charged a fee at an annual rate of 0.25% of the average daily net assets of each respective class.
A portion of these total shareholder servicing fees were paid to affiliates of Wells Fargo.
5. INVESTMENT PORTFOLIO TRANSACTIONS
Purchases and sales of investments, excluding short-term securities, for the year ended October 31, 2015 were as follows:
| | | | | | |
Purchases at cost | | Sales proceeds |
U.S.
government | | Non-U.S.
government | | U.S.
government | | Non-U.S.
government |
$187,277,756 | | $1,401,900,814 | | $102,829,321 | | $1,568,037,531 |
6. DERIVATIVE TRANSACTIONS
During the year ended October 31, 2015, the Fund entered into forward foreign currency contracts for economic hedging purposes.
| | | | |
| 28 | | Wells Fargo International Bond Fund | | Notes to financial statements |
At October 31, 2015, the Fund had forward foreign currency contracts outstanding as follows:
Forward foreign currency contracts to buy:
| | | | | | | | | | | | | | | | | | |
| Exchange date | | Counterparty | | Contracts to
receive | | | U.S. value at
October 31, 2015 | | | In exchange
for U.S. $ | | | Unrealized
gains
(losses) | |
| 11-12-2015 | | State Street Bank | | | 4,113,150,000 | JPY | | $ | 34,087,957 | | | $ | 34,423,669 | | | $ | (335,712 | ) |
| 11-12-2015 | | State Street Bank | | | 19,670,000,000 | JPY | | | 163,016,206 | | | | 157,905,722 | | | | 5,110,484 | |
| 11-12-2015 | | State Street Bank | | | 1,860,000,000 | JPY | | | 15,414,852 | | | | 15,539,120 | | | | (124,268 | ) |
| 11-12-2015 | | State Street Bank | | | 8,150,000,000 | JPY | | | 67,543,573 | | | | 67,827,925 | | | | (284,352 | ) |
| 11-12-2015 | | State Street Bank | | | 1,055,000,000 | JPY | | | 8,743,370 | | | | 8,863,111 | | | | (119,741 | ) |
| 11-12-2015 | | State Street Bank | | | 12,250,000 | MYR | | | 2,848,941 | | | | 3,143,040 | | | | (294,099 | ) |
| 11-24-2015 | | State Street Bank | | | 10,740,000 | BRL | | | 2,766,262 | | | | 2,737,910 | | | | 28,352 | |
| 11-24-2015 | | State Street Bank | | | 49,125,000 | THB | | | 1,380,104 | | | | 1,360,426 | | | | 19,678 | |
| 11-30-2015 | | State Street Bank | | | 138,135,000 | ZAR | | | 9,935,247 | | | | 10,234,944 | | | | (299,697 | ) |
| 11-30-2015 | | State Street Bank | | | 231,565,000 | ZAR | | | 16,655,124 | | | | 17,506,525 | | | | (851,401 | ) |
| 12-7-2015 | | State Street Bank | | | 13,540,000 | CAD | | | 10,352,641 | | | | 10,490,895 | | | | (138,254 | ) |
| 12-11-2015 | | State Street Bank | | | 2,505,000 | TRY | | | 849,504 | | | | 812,271 | | | | 37,233 | |
| 12-16-2015 | | State Street Bank | | | 20,650,000 | EUR | | | 22,723,289 | | | | 23,150,509 | | | | (427,220 | ) |
| 12-16-2015 | | State Street Bank | | | 9,300,000 | EUR | | | 10,233,733 | | | | 10,393,141 | | | | (159,408 | ) |
| 12-16-2015 | | State Street Bank | | | 14,400,000 | EUR | | | 15,845,780 | | | | 16,366,594 | | | | (520,814 | ) |
| 12-16-2015 | | State Street Bank | | | 288,300,000 | EUR | | | 317,245,726 | | | | 326,767,581 | | | | (9,521,855 | ) |
| 12-17-2015 | | State Street Bank | | | 10,250,000 | AUD | | | 7,293,005 | | | | 7,345,991 | | | | (52,986 | ) |
| 1-22-2016 | | State Street Bank | | | 4,800,000,000 | KRW | | | 4,199,549 | | | | 4,229,448 | | | | (29,899 | ) |
| | | | | | | | | | | | | | | | | | | | | | |
| Exchange date | | Counterparty | | Contracts to
receive | | | U.S. value at
October 31, 2015 | | | In exchange
for | | | U.S. value at
October 31, 2015 | | | Unrealized
gains | |
| 1-22-2016 | | State Street Bank | | | 9,280,000,000 | JPY | | $ | 77,024,371 | | | | 68,352,599 | EUR | | $ | 75,278,508 | | | $ | 1,745,863 | |
Forward foreign currency contracts to sell:
| | | | | | | | | | | | | | | | | | |
| Exchange date | | Counterparty | | Contracts to
deliver | | | U.S. value at
October 31, 2015 | | | In exchange
for U.S. $ | | | Unrealized
gains
(losses) | |
| 11-10-2015 | | State Street Bank | | | 1,295,000,000 | COP | | $ | 446,685 | | | $ | 441,377 | | | $ | (5,308 | ) |
| 11-12-2015 | | State Street Bank | | | 1,450,000,000 | JPY | | | 12,016,955 | | | | 12,014,889 | | | | (2,066 | ) |
| 11-12-2015 | | State Street Bank | | | 6,000,000 | MYR | | | 1,395,400 | | | | 1,440,576 | | | | 45,176 | |
| 11-23-2015 | | State Street Bank | | | 68,200,000 | BRL | | | 17,572,451 | | | | 19,078,524 | | | | 1,506,073 | |
| 11-23-2015 | | State Street Bank | | | 93,000,000 | BRL | | | 23,962,433 | | | | 25,567,010 | | | | 1,604,577 | |
| 11-24-2015 | | State Street Bank | | | 5,600,000 | BRL | | | 1,442,371 | | | | 1,363,526 | | | | (78,845 | ) |
| 11-24-2015 | | State Street Bank | | | 6,750,000,000 | IDR | | | 490,226 | | | | 466,966 | | | | (23,260 | ) |
| 11-24-2015 | | State Street Bank | | | 5,140,000 | BRL | | | 1,323,891 | | | | 1,250,152 | | | | (73,739 | ) |
| 11-30-2015 | | State Street Bank | | | 204,700,000 | ZAR | | | 14,722,881 | | | | 14,805,727 | | | | 82,846 | |
| 11-30-2015 | | State Street Bank | | | 165,000,000 | ZAR | | | 11,867,491 | | | | 12,459,601 | | | | 592,110 | |
| 12-7-2015 | | State Street Bank | | | 36,000,000 | CAD | | | 27,525,487 | | | | 27,169,299 | | | | (356,188 | ) |
| 12-9-2015 | | State Street Bank | | | 538,500,000 | HUF | | | 1,904,406 | | | | 1,911,957 | | | | 7,551 | |
| 12-11-2015 | | State Street Bank | | | 1,220,000 | TRY | | | 413,731 | | | | 394,360 | | | | (19,371 | ) |
| 12-11-2015 | | State Street Bank | | | 22,000,000 | GBP | | | 33,908,694 | | | | 33,826,342 | | | | (82,352 | ) |
| 12-11-2015 | | State Street Bank | | | 20,225,000 | GBP | | | 31,172,879 | | | | 30,967,044 | | | | (205,835 | ) |
| 12-14-2015 | | State Street Bank | | | 77,000,000 | NZD | | | 51,983,139 | | | | 48,118,840 | | | | (3,864,299 | ) |
| 12-17-2015 | | State Street Bank | | | 221,300,000 | AUD | | | 157,457,748 | | | | 156,871,050 | | | | (586,698 | ) |
| | | | | | |
| Notes to financial statements | | Wells Fargo International Bond Fund | | | 29 | |
| | | | | | | | | | | | | | | | | | |
| Exchange date | | Counterparty | | Contracts to
deliver | | | U.S. value at
October 31, 2015 | | | In exchange
for U.S. $ | | | Unrealized
gains
(losses) | |
| 1-15-2016 | | State Street Bank | | | 51,300,000 | SGD | | $ | 36,531,089 | | | $ | 36,546,921 | | | $ | 15,832 | |
| 1-15-2016 | | State Street Bank | | | 14,525,000 | SGD | | | 10,343,354 | | | | 10,486,539 | | | | 143,185 | |
| 1-22-2016 | | State Street Bank | | | 62,400,000,000 | KRW | | | 54,594,131 | | | | 55,198,769 | | | | 604,638 | |
| 1-22-2016 | | State Street Bank | | | 40,535,000 | MYR | | | 9,387,144 | | | | 9,416,671 | | | | 29,527 | |
| 1-22-2016 | | State Street Bank | | | 22,645,000 | MYR | | | 5,244,156 | | | | 5,271,551 | | | | 27,395 | |
| 1-28-2016 | | State Street Bank | | | 177,200,000 | PLN | | | 45,750,402 | | | | 45,592,619 | | | | (157,783 | ) |
| 1-29-2016 | | State Street Bank | | | 598,875,000 | MXN | | | 36,035,097 | | | | 35,949,565 | | | | (85,532 | ) |
The Fund had average contract amounts of $721,056,475 and $586,207,170 in forward foreign currency contracts to buy and forward foreign currency contracts to sell, respectively, during the year ended October 31, 2015.
The fair value, realized gains or losses and change in unrealized gains or losses, if any, on derivative instruments are reflected in the appropriate financial statements.
For certain types of derivative transactions, the Fund has entered into International Swaps and Derivatives Association, Inc. master agreements (“ISDA Master Agreements”) or similar agreements with approved counterparties. The ISDA Master Agreements or similar agreements may have requirements to deliver/deposit securities or cash to/with an exchange or broker-dealer as collateral and allows the Fund to offset, with each counterparty, certain derivative financial instrument’s assets and/or liabilities with collateral held or pledged. Collateral requirements differ by type of derivative. Collateral or margin requirements are set by the broker or exchange clearing house for exchange traded derivatives while collateral terms are contract specific for over-the-counter traded derivatives. Cash collateral that has been pledged to cover obligations of the Fund under ISDA Master Agreements or similar agreements, if any, are reported separately in the Statement of Assets and Liabilities. Securities pledged as collateral, if any, are noted in the Portfolio of Investments. With respect to balance sheet offsetting, absent an event of default by the counterparty or a termination of the agreement, the reported amounts of financial assets and financial liabilities in the Statement of Assets and Liabilities are not offset across transactions between the Fund and the applicable counterparty. A reconciliation of the gross amounts on the Statement of Assets and Liabilities to the net amounts by derivative type, including any collateral exposure, is as follows:
| | | | | | | | | | | | | | | | |
| Derivative type | | Counterparty | | Gross amounts
of assets in the
Statement of
Assets and
Liabilities | | Amounts
subject to
netting
agreements | | | Collateral
received | | | Net amount
of assets | |
Forward foreign currency contracts | | State Street Bank | | $11,600,520* | | $ | (11,600,520 | ) | | $ | 0 | | | $ | 0 | |
| * | | Amount represents net unrealized gains. |
| | | | | | | | | | | | | | | | |
| Derivative type | | Counterparty | | Gross amounts
of liabilities in the
Statement of
Assets and
Liabilities | | Amounts
subject to
netting
agreements | | | Collateral
received | | | Net amount
of liabilities | |
Forward foreign currency contracts | | State Street Bank | | $18,700,982** | | $ | (11,600,520 | ) | | $ | 0 | | | $ | 7,100,462 | |
| ** | | Amount represents net unrealized losses. |
7. BANK BORROWINGS
The Trust (excluding the money market funds) and Wells Fargo Variable Trust are parties to a $200,000,000 revolving credit agreement whereby the Fund is permitted to use bank borrowings for temporary or emergency purposes, such as to fund shareholder redemption requests. Interest under the credit agreement is charged to the Fund based on a borrowing rate equal to the higher of the Federal Funds rate in effect on that day plus 1.25% or the overnight LIBOR rate in effect on that day plus 1.25%. In addition, an annual commitment fee equal to 0.20% of the unused balance is allocated to each participating fund. Prior to September 1, 2015, the revolving credit agreement amount was $150,000,000 and the annual commitment fee was equal to 0.10% of the unused balance which was allocated to each participating fund. For the year ended October 31, 2015, the Fund paid $2,568 in commitment fees.
For the year ended October 31, 2015, there were no borrowings by the Fund under the agreement.
| | | | |
| 30 | | Wells Fargo International Bond Fund | | Notes to financial statements |
8. DISTRIBUTIONS TO SHAREHOLDERS
The tax character of distributions paid during the years ended October 31, 2014 and 2015 were as follows:
| | | | | | | | |
| | | Year ended October 31, | |
| | | 2015 | | | 2014 | |
Ordinary income | | $ | 10,043,689 | | | $ | 21,238,755 | |
Long-term capital gain | | | 36 | | | | 49,267,667 | |
As of October 31, 2015, the components of distributable earnings on a tax basis were as follows:
| | | | |
Undistributed
long-term
gain | | Unrealized
losses | | Late-year
ordinary losses
deferred |
$5,967,222 | | $(96,598,262) | | $(47,186,120) |
9. INDEMNIFICATION
Under the Trust’s organizational documents, the officers and Trustees have been granted certain indemnification rights against certain liabilities that may arise out of performance of their duties to the Trust. Additionally, in the normal course of business, the Trust may enter into contracts with service providers that contain a variety of indemnification clauses. The Trust’s maximum exposure under these arrangements is dependent on future claims that may be made against the Fund and, therefore, cannot be estimated.
10. SUBSEQUENT DISTRIBUTIONS
On December 11, 2015, the Fund declared distributions from long-term capital gains to shareholders of record on December 10, 2015. The per share amounts payable on December 14, 2015 were as follows:
| | | | |
| | | Long-term capital gains | |
Class A | | $ | 0.05733 | |
Class B | | | 0.05733 | |
Class C | | | 0.05733 | |
Class R6 | | | 0.05733 | |
Administrator Class | | | 0.05733 | |
Institutional Class | | | 0.05733 | |
These distributions are not reflected in the accompanying financial statements. The final determination of the source of all distributions is subject to change and made after the Fund’s tax year-end.
| | | | | | |
| Report of independent registered public accounting firm | | Wells Fargo International Bond Fund | | | 31 | |
BOARD OF TRUSTEES AND SHAREHOLDERS OF WELLS FARGO FUNDS TRUST:
We have audited the accompanying statement of assets and liabilities, including the portfolio of investments, of the Wells Fargo International Bond Fund (the “Fund”), one of the funds constituting the Wells Fargo Funds Trust, as of October 31, 2015, and the related statement of operations for the year then ended, the statements of changes in net assets for each of the years in the two-year period then ended, and the financial highlights for each of the years or periods in the five-year period then ended. These financial statements and financial highlights are the responsibility of the Fund’s management. Our responsibility is to express an opinion on these financial statements and financial highlights based on our audits.
We conducted our audits in accordance with the standards of the Public Company Accounting Oversight Board (United States). Those standards require that we plan and perform the audit to obtain reasonable assurance about whether the financial statements and financial highlights are free of material misstatement. An audit includes examining, on a test basis, evidence supporting the amounts and disclosures in the financial statements. Our procedures included confirmation of securities owned as of October 31, 2015, by correspondence with the custodian and brokers, or by other appropriate auditing procedures. An audit also includes assessing the accounting principles used and significant estimates made by management, as well as evaluating the overall financial statement presentation. We believe that our audits provide a reasonable basis for our opinion.
In our opinion, the financial statements and financial highlights referred to above present fairly, in all material respects, the financial position of the Wells Fargo International Bond Fund as of October 31, 2015, the results of its operations for the year then ended, the changes in its net assets for each of the years in the two-year period then ended, and the financial highlights for each of the years or periods in the five-year period then ended, in conformity with U.S. generally accepted accounting principles.

Boston, Massachusetts
December 22, 2015
| | | | |
| 32 | | Wells Fargo International Bond Fund | | Other information (unaudited) |
TAX INFORMATION
Pursuant to Section 852 of the Internal Revenue Code, $36 was designated as long-term capital gain distributions for the fiscal year ended October 31, 2015.
For the fiscal year ended October 31, 2015, $2,655,660 has been designated as interest-related dividends for nonresident alien shareholders pursuant to Section 871 of the Internal Revenue Code.
For the fiscal year ended October 31, 2015, $3,642,092 has been designated as short-term capital gain dividends for nonresident alien shareholders pursuant to Section 871 of the Internal Revenue Code.
PROXY VOTING INFORMATION
A description of the policies and procedures that the Fund uses to determine how to vote proxies relating to portfolio securities is available, upon request, by calling 1-800-222-8222, visiting our website at wellsfargofunds.com, or visiting the SEC website at sec.gov. Information regarding how the Fund voted proxies relating to portfolio securities during the most recent 12-month period ended June 30 is available on the Fund’s website at wellsfargofunds.com or by visiting the SEC website at sec.gov.
PORTFOLIO HOLDINGS INFORMATION
The complete portfolio holdings for the Fund are publicly available monthly on the Fund’s website (wellsfargofunds.com), on a one-month delayed basis. In addition, top ten holdings information (excluding derivative positions) for the Fund is publicly available on the Fund’s website on a monthly, seven-day or more delayed basis. The Fund files its complete schedule of portfolio holdings with the SEC for the first and third quarters of each fiscal year on Form N-Q, which is available by visiting the SEC website at sec.gov. In addition, the Fund’s Form N-Q may be reviewed and copied at the SEC’s Public Reference Room in Washington, DC, and at regional offices in New York City, at 233 Broadway, and in Chicago, at 175 West Jackson Boulevard, Suite 900. Information about the Public Reference Room may be obtained by calling 1-800-SEC-0330.
| | | | | | |
| Other information (unaudited) | | Wells Fargo International Bond Fund | | | 33 | |
BOARD OF TRUSTEES AND OFFICERS
Each of the Trustees and Officers1 listed in the table below acts in identical capacities for each fund in the Wells Fargo family of funds, which consists of 144 mutual funds comprising the Wells Fargo Funds Trust, Wells Fargo Variable Trust, Wells Fargo Master Trust and four closed-end funds (collectively the “Fund Complex”). This table should be read in conjunction with the Prospectus and the Statement of Additional Information2. The mailing address of each Trustee and Officer is 525 Market Street, 12th Floor, San Francisco, CA 94105. Each Trustee and Officer serves an indefinite term, however, each Trustee serves such term until reaching the mandatory retirement age established by the Trustees.
Independent Trustees
| | | | | | |
Name and
year of birth | | Position held and length of service* | | Principal occupations during past five years or longer | | Other
public company or
investment company
directorships during
past 5 years |
William R. Ebsworth
(Born 1957) | | Trustee, since 2015** | | Retired. From 1984 to 2013, equities analyst, portfolio manager, research director at Fidelity Management and Research Company in Boston, Tokyo, and Hong Kong, and retired in 2013 as Chief Investment Officer of Fidelity Strategic Advisers, Inc. where he led a team of investment professionals managing client assets. Prior thereto, Board member of Hong Kong Securities Clearing Co., Hong Kong Options Clearing Corp., the Thailand International Fund, Ltd., Fidelity Investments Life Insurance Company, and Empire Fidelity Investments Life Insurance Company. Mr. Ebsworth is a CFA® charterholder and an Adjunct Lecturer, Finance, at Babson College. | | Asset Allocation Trust |
Jane A. Freeman (Born 1953) | | Trustee, since 2015** | | Retired. From 2012 to 2014 and 1999 to 2008, Chief Financial Officer of Scientific Learning Corporation. From 2008 to 2012, Ms. Freeman provided consulting services related to strategic business projects. Prior to 1999, Portfolio Manager at Rockefeller & Co. and Scudder, Stevens & Clark. Board member of the Harding Loevner Funds from 1996 to 2014, serving as both Lead Independent Director and chair of the Audit Committee. Board member of the Russell Exchange Traded Funds Trust from 2011 to 2012 and the chair of the Audit Committee. Ms. Freeman is Chair of Taproot Foundation (non-profit organization), a Board Member of Ruth Bancroft Garden (non-profit organization) and an inactive chartered financial analyst. | | Asset Allocation Trust; Harding Loevner Funds; Russell Exchange Traded Funds Trust |
Peter G. Gordon (Born 1942) | | Trustee, since 1998; Chairman, since 2005 | | Co-Founder, Retired Chairman, President and CEO of Crystal Geyser Water Company. Trustee Emeritus, Colby College. | | Asset Allocation Trust |
Isaiah Harris, Jr. (Born 1952) | | Trustee, since 2009 | | Retired. Chairman of the Board of CIGNA Corporation since 2009, and Director since 2005. From 2003 to 2011, Director of Deluxe Corporation. Prior thereto, President and CEO of BellSouth Advertising and Publishing Corp. from 2005 to 2007, President and CEO of BellSouth Enterprises from 2004 to 2005 and President of BellSouth Consumer Services from 2000 to 2003. Emeritus member of the Iowa State University Foundation Board of Governors. Emeritus Member of the Advisory Board of Iowa State University School of Business. Advisory Board Member, Palm Harbor Academy (charter school). Mr. Harris is a certified public accountant. | | CIGNA Corporation; Asset Allocation Trust |
Judith M. Johnson (Born 1949) | | Trustee, since 2008;
Audit Committee Chairman, since 2008 | | Retired. Prior thereto, Chief Executive Officer and Chief Investment Officer of Minneapolis Employees Retirement Fund from 1996 to 2008. Ms. Johnson is an attorney, certified public accountant and a certified managerial accountant. | | Asset Allocation Trust |
| David F. Larcker (Born 1950) | | Trustee, since 2009 | | James Irvin Miller Professor of Accounting at the Graduate School of Business, Stanford University, Morgan Stanley Director of the Center for Leadership Development and Research and Senior Faculty of The Rock Center for Corporate Governance since 2006. From 2005 to 2008, Professor of Accounting at the Graduate School of Business, Stanford University. Prior thereto, Ernst & Young Professor of Accounting at The Wharton School, University of Pennsylvania from 1985 to 2005. | | Asset Allocation Trust |
| | | | |
| 34 | | Wells Fargo International Bond Fund | | Other information (unaudited) |
| | | | | | |
Name and
year of birth | | Position held and length of service* | | Principal occupations during past five years or longer | | Other
public company or
investment company
directorships during past 5 years |
| Olivia S. Mitchell (Born 1953) | | Trustee, since 2006 | | International Foundation of Employee Benefit Plans Professor, Wharton School of the University of Pennsylvania since 1993. Director of Wharton’s Pension Research Council and Boettner Center on Pensions & Retirement Research, and Research Associate at the National Bureau of Economic Research. Previously, Cornell University Professor from 1978 to 1993. | | Asset Allocation Trust |
| Timothy J. Penny (Born 1951) | | Trustee, since 1996 | | President and Chief Executive Officer of Southern Minnesota Initiative Foundation, a non-profit organization, since 2007 and Senior Fellow at the Humphrey Institute Policy Forum at the University of Minnesota since 1995. Member of the Board of Trustees of NorthStar Education Finance, Inc., a non-profit organization, since 2007. | | Asset Allocation Trust |
| Michael S. Scofield (Born 1943) | | Trustee, since 2010 | | Served on the Investment Company Institute’s Board of Governors and Executive Committee from 2008-2011 as well the Governing Council of the Independent Directors Council from 2006-2011 and the Independent Directors Council Executive Committee from 2008-2011. Chairman of the IDC from 2008-2010. Institutional Investor (Fund Directions) Trustee of Year in 2007. Trustee of the Evergreen Funds complex (and its predecessors) from 1984 to 2010. Chairman of the Evergreen Funds from 2000-2010. Former Trustee of the Mentor Funds. Retired Attorney, Law Offices of Michael S. Scofield. | | Asset Allocation Trust |
| Donald C. Willeke (Born 1940) | | Trustee, since 1996*** | | Principal of the law firm of Willeke & Daniels. General Counsel of the Minneapolis Employees Retirement Fund from 1984 until its consolidation into the Minnesota Public Employees Retirement Association on June 30, 2010. Director and Vice Chair of The Tree Trust (non-profit corporation). Director of the American Chestnut Foundation (non-profit corporation). | | Asset Allocation Trust |
| * | Length of service dates reflect the Trustee’s commencement of service with the Trust’s predecessor entities, where applicable. |
| ** | William R. Ebsworth and Jane A. Freeman each became a Trustee effective January 1, 2015. |
| *** | Donald Willeke will retire as a Trustee effective December 31, 2015. |
Officers
| | | | | | |
Name and year of birth | | Position held and length of service | | Principal occupations during past five years or longer | | |
Karla M. Rabusch
(Born 1959) | | President, since 2003 | | Executive Vice President of Wells Fargo Bank, N.A. and President of Wells Fargo Funds Management, LLC since 2003. | | |
Nancy Wiser1
(Born 1967) | | Treasurer, since 2012 | | Executive Vice President of Wells Fargo Funds Management, LLC since 2011. Chief Operating Officer and Chief Compliance Officer at LightBox Capital Management LLC, from 2008 to 2011. | | |
C. David Messman (Born 1960) | | Secretary, since 2000; Chief Legal Officer, since 2003 | | Senior Vice President and Secretary of Wells Fargo Funds Management, LLC since 2001. Assistant General Counsel of Wells Fargo Bank, N.A. since 2013 and Vice President and Managing Counsel of Wells Fargo Bank N.A. from 1996 to 2013. | | |
Debra Ann Early
(Born 1964) | | Chief Compliance Officer, since 2007 | | Executive Vice President of Wells Fargo Funds Management, LLC since 2014, Senior Vice President and Chief Compliance Officer from 2007 to 2014. | | |
David Berardi
(Born 1975) | | Assistant Treasurer, since 2009 | | Vice President of Wells Fargo Funds Management, LLC since 2009. Vice President of Evergreen Investment Management Company, LLC from 2008 to 2010. Manager of Fund Reporting and Control for Evergreen Investment Management Company, LLC from 2004 to 2010. | | |
Jeremy DePalma1 (Born 1974) | | Assistant Treasurer, since 2009 | | Senior Vice President of Wells Fargo Funds Management, LLC since 2009. Senior Vice President of Evergreen Investment Management Company, LLC from 2008 to 2010 and head of the Fund Reporting and Control Team within Fund Administration from 2005 to 2010. | | |
| 1 | Nancy Wiser acts as Treasurer of 72 funds in the Fund Complex. Jeremy DePalma acts as Treasurer of 72 funds and Assistant Treasurer of 72 funds in the Fund Complex. |
| 2 | The Statement of Additional Information includes additional information about the Trustees and is available, without charge, upon request, by calling 1-800-222-8222 or by visiting the website at wellsfargofunds.com. |
| | | | | | |
| Other information (unaudited) | | Wells Fargo International Bond Fund | | | 35 | |
BOARD CONSIDERATION OF INVESTMENT ADVISORY, INVESTMENT MANAGEMENT AND SUB-ADVISORY AGREEMENTS:
Under the Investment Company Act of 1940 (the “1940 Act”), the Board of Trustees (the “Board”) of Wells Fargo Funds Trust (the “Trust”) must determine annually whether to approve the continuation of the Trust’s investment advisory and sub-advisory agreements. In this regard, at an in-person meeting held on May 19-20, 2015 (the “Meeting”), the Board, all the members of which have no direct or indirect interest in the investment advisory and sub-advisory agreements and are not “interested persons” of the Trust, as defined in the 1940 Act (the “Independent Trustees”), reviewed and approved for Wells Fargo Advantage International Bond Fund (the “Fund”): (i) an investment advisory agreement (the “Advisory Agreement”) with Wells Fargo Funds Management, LLC (“Funds Management”); (ii) an investment management agreement (the “Management Agreement”) with Funds Management; and (iii) an investment sub-advisory agreement (the “Sub-Advisory Agreement”) with First International Advisors, LLC (the “Sub-Adviser”), an affiliate of Funds Management. The Management Agreement combines the terms of the Advisory Agreement with the terms of the Fund’s Amended and Restated Administration Agreement (the “Administration Agreement”) applicable to Fund-level administrative services. The Advisory Agreement, the Management Agreement and the Sub-Advisory Agreement are collectively referred to as the “Advisory Agreements.”
At the Meeting, the Board considered the factors and reached the conclusions described below relating to the selection of Funds Management and the Sub-Adviser and the approval of the Advisory Agreements. Prior to the Meeting, including at an in-person meeting in March 2015, the Trustees conferred extensively among themselves and with representatives of Funds Management about these matters. Also, the Board has adopted a team-based approach, with each team consisting of a sub-set of Trustees, to assist the full Board in the discharge of its duties in reviewing performance and other matters throughout the year. The Independent Trustees were assisted in their evaluation of the Advisory Agreements by independent legal counsel, from whom they received separate legal advice and with whom they met separately.
In providing information to the Board, Funds Management and the Sub-Adviser were guided by a detailed set of requests for information submitted to them by independent legal counsel on behalf of the Independent Trustees at the start of the Board’s annual contract renewal process earlier in 2015. In considering and approving the Advisory Agreements, the Trustees considered the information they believed relevant, including but not limited to the information discussed below. The Board considered not only the specific information presented in connection with the Meeting, but also the knowledge gained over time through interaction with Funds Management and the Sub-Adviser about various topics. In this regard, the Board reviewed reports of Funds Management at each of its quarterly meetings, which included, among other things, portfolio reviews and performance reports. In addition, the Board and the teams mentioned above confer with portfolio managers at various times throughout the year. The Board did not identify any particular information or consideration that was all-important or controlling, and each individual Trustee may have attributed different weights to various factors.
After its deliberations, the Board unanimously approved the continuation of the Advisory Agreement for the period from June 1, 2015 through June 30, 2015, approved the Management Agreement for the period from July 1, 2015 through May 31, 2016, and approved the continuation of the Sub-Advisory Agreement for a one-year term through May 31, 2016. The Board also determined that the compensation payable to Funds Management and the Sub-Adviser under each of the Advisory Agreements was reasonable. The Board considered the approval of the Advisory Agreements for the Fund as part of its consideration of agreements for funds across the complex, but its approvals were made on a fund-by-fund basis. The following summarizes a number of important, but not necessarily all, factors considered by the Board in support of its approvals.
Nature, extent and quality of services
The Board received and considered various information regarding the nature, extent and quality of services provided to the Fund by Funds Management and the Sub-Adviser under the Advisory Agreements. This information included, among other things, a summary of the background and experience of senior management of Funds Management, and the qualifications, background, tenure and responsibilities of each of the portfolio managers primarily responsible for the day-to-day portfolio management of the Fund. The Board noted that the services to be provided to the Fund pursuant to the Management Agreement combined the advisory services previously provided to the Fund pursuant to the Fund’s Advisory Agreement with the Fund-level administrative services previously provided to the Fund pursuant to the Fund’s Administration Agreement. The Board received a representation from Funds Management that combining these services would not result in any change to the nature or level of services provided by Funds Management to the Fund.
The Board evaluated the ability of Funds Management and the Sub-Adviser to attract and retain qualified investment professionals, including research, advisory and supervisory personnel. The Board further considered the compliance
| | | | |
| 36 | | Wells Fargo International Bond Fund | | Other information (unaudited) |
programs and compliance records of Funds Management and the Sub-Adviser. In addition, the Board took into account the full range of services provided to the Fund by Funds Management and its affiliates.
Fund performance and expenses
The Board considered the performance results for the Fund over various time periods ended March 31, 2015. The Board considered these results in comparison to the performance of funds in a universe that was determined by Lipper Inc. (“Lipper”) to be similar to the Fund (the “Universe”), and in comparison to the Fund’s benchmark index and to other comparative data. Lipper is an independent provider of investment company data. The Board received a description of the methodology used by Lipper to select the mutual funds in the performance Universe. The Board noted that the performance of the Fund (Class A) was lower than the average performance of the Universe for all periods under review. The Board also noted that the performance of the Fund was higher than its benchmark, the BofA Merrill Lynch Global Broad Market ex US Index, for all periods under review.
The Board received information concerning, and discussed factors contributing to, the underperformance of the Fund relative to the Universe for all periods. The Board took note of the explanations for the relative underperformance, including an explanation of currency exposure and other detractors from Fund performance, and of outperformance relative to the benchmark for all periods under review.
The Board also received and considered information regarding the Fund’s net operating expense ratios and their various components, including actual management fees (which reflect fee waivers, if any, and include advisory, administration and transfer agent fees), custodian and other non-management fees, and Rule 12b-1 and non-Rule 12b-1 service fees. The Board considered these ratios in comparison to the median ratios of funds in class-specific expense groups that were determined by Lipper to be similar to the Fund (the “Groups”). The Board received a description of the methodology used by Lipper to select the mutual funds in the expense Groups and an explanation of how funds comprising expense groups and their expense ratios may vary from year-to-year. Based on the Lipper reports, the Board noted that the net operating expense ratios of the Fund were lower than the median net operating expense ratios of the expense Groups.
The Board took into account the Fund performance and expense information provided to it among the factors considered in deciding to re-approve the Advisory Agreement and Sub-Advisory Agreement and approve the Management Agreement.
Investment advisory and sub-advisory fee rates
The Board reviewed and considered the contractual investment advisory fee rates that are payable by the Fund to Funds Management for investment advisory services (the “Advisory Agreement Rates”), both on a stand-alone basis and on a combined basis with the Fund’s fund-level and class-level contractual administration fee rates (the “Management Rates”). The Board noted that the Management Rates include transfer agency and sub-transfer agency costs. The Board also noted that the fee rate to be paid by the Fund under the Management Agreement will incorporate the advisory fee and Fund-level administration fee previously payable separately by the Fund under the Fund’s Advisory Agreement and Administration Agreement with Funds Management. The Board also reviewed and considered the contractual investment sub-advisory fee rates that are payable by Funds Management to the Sub-Adviser for investment sub-advisory services (the “Sub-Advisory Agreement Rates”).
Among other information reviewed by the Board was a comparison of the Management Rates of the Fund with those of other funds in the expense Groups at a common asset level. The Board noted that the Management Rates of the Fund were lower than the average rates for the Fund’s expense Groups for all share classes.
The Board also received and considered information about the portion of the total advisory fee that was retained by Funds Management after payment of the fee to the Sub-Adviser for sub-advisory services. In assessing the reasonableness of this amount, the Board received and evaluated information about the nature and extent of responsibilities retained and risks assumed by Funds Management and not delegated to or assumed by the Sub-Adviser, and about Funds Management’s on-going oversight services. However, given the affiliation between Funds Management and the Sub-Adviser, the Board ascribed limited relevance to the allocation of the advisory fee between them.
The Board also received and considered information about the nature and extent of services offered and fee rates charged by Funds Management and the Sub-Adviser to other types of clients with investment strategies similar to those of the Fund. In this regard, the Board received information about the significantly greater scope of services, and compliance, reporting and other legal burdens and risks of managing mutual funds compared with those associated with managing assets of non-mutual fund clients such as collective funds or institutional separate accounts.
| | | | | | |
| Other information (unaudited) | | Wells Fargo International Bond Fund | | | 37 | |
Based on its consideration of the factors and information it deemed relevant, including those described here, the Board determined that the compensation payable to Funds Management under the Management Agreement and Advisory Agreement and to the Sub-Adviser under the Sub-Advisory Agreement was reasonable, in light of the services covered by the Advisory Agreements.
Profitability
The Board received and considered information concerning the profitability of Funds Management, as well as the profitability of Wells Fargo as a whole, from providing services to the Fund and the fund family as a whole. The Board also received and considered information concerning the profitability of the Sub-Adviser from providing services to the fund family as a whole, noting that the Sub-Adviser’s profitability information with respect to providing services to the Fund was subsumed in the Wells Fargo profitability analysis.
Funds Management reported on the methodologies and estimates used in calculating profitability. Among other things, the Board noted that the levels of profitability reported on a fund-by-fund basis varied widely, depending on factors such as the size and type of fund. Based on its review, the Board did not deem the profits reported by Funds Management or Wells Fargo from its services to the Fund to be at a level that would prevent it from approving the continuation of the Advisory Agreements.
Economies of scale
With respect to possible economies of scale, the Board noted the existence of breakpoints in the Fund’s advisory and management fee structures, and the Fund’s administration fee structure, which operate generally to reduce the Fund’s expense ratios as the Fund grows in size. It considered that, for a small fund or a fund that shrinks in size, breakpoints conversely can result in higher fee levels. The Board also considered that fee waiver and expense reimbursement arrangements and competitive fee rates at the outset are means of sharing potential economies of scale with shareholders of the Fund and the fund family as a whole. The Board considered Funds Management’s view that any analyses of potential economies of scale in managing a particular fund are inherently limited in light of the joint and common costs and investments that Funds Management incurs across the fund family as a whole.
The Board concluded that the Fund’s fee and expense arrangements, including contractual breakpoints, constituted a reasonable approach to sharing potential economies of scale with the Fund and its shareholders.
Other benefits to Funds Management and the Sub-Adviser
The Board received and considered information regarding potential “fall-out” or ancillary benefits received by Funds Management and its affiliates, including the Sub-Adviser, as a result of their relationships with the Fund. Ancillary benefits could include, among others, benefits directly attributable to other relationships with the Fund and benefits potentially derived from an increase in Funds Management’s and the Sub-Adviser’s business as a result of their relationships with the Fund. The Board noted that various affiliates of Funds Management may receive distribution-related fees, shareholder servicing payments and sub-transfer agency fees in respect of shares sold or held through them and services provided.
The Board also reviewed information about fees earned by Funds Management from managing a private investment vehicle for the fund family’s securities lending collateral and commissions earned by an affiliated broker from portfolio transactions.
Based on its consideration of the factors and information it deemed relevant, including those described here, the Board did not find that any ancillary benefits received by Funds Management and its affiliates, including the Sub-Adviser, were unreasonable.
Conclusion
At the Meeting, after considering the above-described factors and based on its deliberations and its evaluation of the information described above, the Board unanimously approved the continuation of the Advisory Agreement for the period from June 1, 2015 through June 30, 2015, approved the Management Agreement for the period from July 1, 2015 through May 31, 2016, and approved the continuation of the Sub-Advisory Agreement for a one-year term through May 31, 2016. The Board also determined that the compensation payable to Funds Management and the Sub-Adviser under each of the Advisory Agreements was reasonable.
| | | | |
| 38 | | Wells Fargo International Bond Fund | | List of abbreviations |
The following is a list of common abbreviations for terms and entities that may have appeared in this report.
| ACA | — ACA Financial Guaranty Corporation |
| ADR | — American depositary receipt |
| ADS | — American depositary shares |
| AGC | — Assured Guaranty Corporation |
| AGM | — Assured Guaranty Municipal |
| Ambac | — Ambac Financial Group Incorporated |
| AMT | — Alternative minimum tax |
| BAN | — Bond anticipation notes |
| BHAC | — Berkshire Hathaway Assurance Corporation |
| CAB | — Capital appreciation bond |
| CCAB | — Convertible capital appreciation bond |
| CDA | — Community Development Authority |
| CDO | — Collateralized debt obligation |
| DRIVER | — Derivative inverse tax-exempt receipts |
| DW&P | — Department of Water & Power |
| DWR | — Department of Water Resources |
| ECFA | — Educational & Cultural Facilities Authority |
| EDA | — Economic Development Authority |
| EDFA | — Economic Development Finance Authority |
| ETF | — Exchange-traded fund |
| FDIC | — Federal Deposit Insurance Corporation |
| FFCB | — Federal Farm Credit Banks |
| FGIC | — Financial Guaranty Insurance Corporation |
| FHA | — Federal Housing Administration |
| FHLB | — Federal Home Loan Bank |
| FHLMC | — Federal Home Loan Mortgage Corporation |
| FICO | — The Financing Corporation |
| FNMA | — Federal National Mortgage Association |
| GDR | — Global depositary receipt |
| GNMA | — Government National Mortgage Association |
| HCFR | — Healthcare facilities revenue |
| HEFA | — Health & Educational Facilities Authority |
| HEFAR | — Higher education facilities authority revenue |
| HFA | — Housing Finance Authority |
| HFFA | — Health Facilities Financing Authority |
| HUD | — Department of Housing and Urban Development |
| IDA | — Industrial Development Authority |
| IDAG | — Industrial Development Agency |
| KRW | — Republic of Korea won |
| LIBOR | — London Interbank Offered Rate |
| LIFER | — Long Inverse Floating Exempt Receipts |
| LLC | — Limited liability company |
| LLLP | — Limited liability limited partnership |
| LLP | — Limited liability partnership |
| MBIA | — Municipal Bond Insurance Association |
| MFHR | — Multifamily housing revenue |
| MSTR | — Municipal securities trust receipts |
| MUD | — Municipal Utility District |
| National | — National Public Finance Guarantee Corporation |
| PCFA | — Pollution Control Financing Authority |
| PCL | — Public Company Limited |
| PCR | — Pollution control revenue |
| PFA | — Public Finance Authority |
| PFFA | — Public Facilities Financing Authority |
| PFOTER | — Puttable floating option tax-exempt receipts |
| plc | — Public limited company |
| PUTTER | — Puttable tax-exempt receipts |
| R&D | — Research & development |
| Radian | — Radian Asset Assurance |
| RAN | — Revenue anticipation notes |
| RDA | — Redevelopment Authority |
| RDFA | — Redevelopment Finance Authority |
| REIT | — Real estate investment trust |
| ROC | — Reset option certificates |
| SAVRS | — Select auction variable rate securities |
| SBA | — Small Business Authority |
| SDR | — Swedish depositary receipt |
| SFHR | — Single-family housing revenue |
| SFMR | — Single-family mortgage revenue |
| SPA | — Standby purchase agreement |
| SPDR | — Standard & Poor’s Depositary Receipts |
| SPEAR | — Short Puttable Exempt Adjustable Receipts |
| STRIPS | — Separate trading of registered interest and |
| TAN | — Tax anticipation notes |
| TIPS | — Treasury inflation-protected securities |
| TRAN | — Tax revenue anticipation notes |
| TTFA | — Transportation Trust Fund Authority |
| TVA | — Tennessee Valley Authority |
This page is intentionally left blank.
This page is intentionally left blank.

For more information
More information about Wells Fargo Funds is available free upon request. To obtain literature, please write, email, visit the Fund’s website, or call:
Wells Fargo Funds
P.O. Box 8266
Boston, MA 02266-8266
Email: wfaf@wellsfargo.com
Website: wellsfargofunds.com
Individual investors: 1-800-222-8222
Retail investment professionals: 1-888-877-9275
Institutional investment professionals: 1-866-765-0778
This report and the financial statements contained herein are submitted for the general information of the shareholders of Wells Fargo Funds. If this report is used for promotional purposes, distribution of the report must be accompanied or preceded by a current prospectus. Before investing, please consider the investment objectives, risks, charges, and expenses of the investment. For a current prospectus and, if available, a summary prospectus, containing this information, call 1-800-222-8222 or visit the Fund’s website at wellsfargofunds.com. Read the prospectus carefully before you invest or send money.
Wells Fargo Funds Management, LLC, a wholly owned subsidiary of Wells Fargo & Company, provides investment advisory and administrative services for Wells Fargo Funds. Other affiliates of Wells Fargo & Company provide subadvisory and other services for the Funds. The Funds are distributed by Wells Fargo Funds Distributor, LLC, Member FINRA, an affiliate of Wells Fargo & Company.
NOT FDIC INSURED ¡ NO BANK GUARANTEE ¡ MAY LOSE VALUE
© 2015 Wells Fargo Funds Management, LLC. All rights reserved.
| | |
 | | 238501 12-15 A235/AR235 10-15 |
Annual Report
October 31, 2015

Wells Fargo Strategic Income Fund


Reduce clutter. Save trees.
Sign up for electronic delivery of prospectuses and shareholder reports at wellsfargo.com/advantagedelivery
Contents
The views expressed and any forward-looking statements are as of October 31, 2015, unless otherwise noted, and are those of the Fund managers and/or Wells Fargo Funds Management, LLC. Discussions of individual securities, or the markets generally, or any Wells Fargo Fund are not intended as individual recommendations. Future events or results may vary significantly from those expressed in any forward-looking statements. The views expressed are subject to change at any time in response to changing circumstances in the market. Wells Fargo Funds Management, LLC and the Fund disclaim any obligation to publicly update or revise any views expressed or forward-looking statements.
NOT FDIC INSURED ¡ NO BANK GUARANTEE ¡ MAY LOSE VALUE
| | | | |
| 2 | | Wells Fargo Strategic Income Fund | | Letter to shareholders (unaudited) |

Karla M. Rabusch
President
Wells Fargo Funds
Economic data continued to indicate that the U.S. economy was in a sluggish but consistent recovery.
The difference in policy between the Fed and other central banks led the U.S. dollar to appreciate against most major currencies.
Dear Valued Shareholder:
We are pleased to offer you this annual report for the Wells Fargo Strategic Income Fund for the 12-month period that ended October 31, 2015. The period was marked by continued low global interest rates and sluggish economic recovery in developed markets. However, the expectation that the U.S. Federal Reserve (Fed) would soon raise its key interest rate, combined with signs of further quantitative easing from other central banks, depressed the prices of international assets for U.S. dollar–based investors.
The Fed showed signs of raising its key rate, but other central banks continued to ease.
Economic data continued to indicate that the U.S. economy was in a sluggish but consistent recovery. For example, the U.S. unemployment rate eased from 5.8% at the beginning of the reporting period (November 2014) to 5.0% at the end (October 2015). Throughout the reporting period, the Federal Open Market Committee (FOMC), which is the Fed’s monetary policymaking body, kept its key interest rate effectively at zero.
As the period progressed, various comments by Fed Chair Janet Yellen led investors to believe that the FOMC would soon raise its key federal funds rate. The FOMC remained on hold at its September 2015 meeting, however, citing concerns about a weaker global economy and subdued U.S. inflation. The FOMC’s decision caused some uncertainty, but by the end of the period, most investors expected a modest Fed rate hike in late 2015 or early 2016.
In contrast, the European Central Bank (ECB) showed no signs of raising rates in the near future, as the eurozone continued to grapple with sluggish growth. The eurozone reported annualized gross domestic product growth of 1.6% in the second quarter of 2015, which was the highest annualized growth for the past eight quarters. Yet while the unemployment rate improved, it remained stubbornly above 10%. The ECB thus maintained a variety of measures aimed at encouraging lending, including making funds available to banks at low interest rates and imposing a negative interest rate on bank deposits held at the central bank.
Other major central banks, such as the People’s Bank of China and the Bank of Japan, also remained in easing mode in response to sluggish growth in their respective economies. The difference in policy between the Fed and other central banks led the U.S. dollar to appreciate against most major currencies.
Slow but persistent international growth supported risk-based assets, but the stronger dollar depressed the returns of international investments.
In developed markets, the persistent modest-growth, low-inflation environment provided a favorable backdrop for sovereign bonds, investment-grade corporate bonds, and high-yield debt. The main sour note was struck in energy- and commodity-related subsectors of the high-yield bond universe. Persistent low prices for oil, natural gas, and industrial metals such as copper put pressure on highly leveraged energy and metals and mining companies and led to increasing defaults in commodity-related sectors. The Barclays U.S. Aggregate Bond Index,1 which
| 1 | The Barclays U.S. Aggregate Bond Index is a broad-based benchmark that measures the investment-grade, U.S. dollar–denominated, fixed-rate taxable bond market, including Treasuries, government-related and corporate securities, MBS (agency fixed-rate and hybrid ARM pass-throughs), ABS, and CMBS. You cannot invest directly in an index. |
| | | | | | |
| Letter to shareholders (unaudited) | | Wells Fargo Strategic Income Fund | | | 3 | |
comprises investment-grade debt, ended the period with a 1.96% gain. By contrast, the Barclays U.S. Corporate High Yield Bond Index,2 a proxy for the high-yield bond market, lost 1.94% over the 12-month period.
The continued strength of the U.S. dollar versus other currencies provided a potent headwind to international bonds for U.S. dollar–based investors. Partly as a result, the BofA Merrill Lynch Global Broad Market ex U.S. Index3 lost 6.68% during the reporting period.
Don’t let short-term uncertainty derail long-term investment goals.
Periods of uncertainty can present challenges, but experience has taught us that maintaining long-term investment goals can be an effective way to plan for the future. To help you create a sound strategy based on your personal goals and risk tolerance, Wells Fargo Funds offers more than 100 mutual funds and other investments spanning a wide range of asset classes and investment styles. Although diversification cannot guarantee an investment profit or prevent losses, we believe it can be an effective way to manage investment risk and potentially smooth out overall portfolio performance. We encourage investors to know their investments and to understand that appropriate levels of risk-taking may unlock opportunities.
Thank you for choosing to invest with Wells Fargo Funds. We appreciate your confidence in us and remain committed to helping you meet your financial needs.
Sincerely,

Karla M. Rabusch
President
Wells Fargo Funds
Notice to shareholders
At a meeting held August 11-12, 2015, the Board of Trustees of the Fund approved a change in the name of the Fund whereby the word “Advantage” was removed from its name, effective December 15, 2015.
Notice to shareholders
Effective December 15, 2015, changes in pricing for the Wells Fargo Strategic Income Fund lowered the sales charges for some investors in Class A shares of the Fund and reduced the maximum purchase amount for Class C shares of the Fund. Please see the Fund’s current prospectus for additional details.
For current information about your fund investments, contact your investment professional, visit our website at wellsfargofunds.com, or call us directly at 1-800-222-8222. We are available 24 hours a day, 7 days a week.
| 2 | The Barclays U.S. Corporate High Yield Bond Index is an unmanaged, U.S. dollar–denominated, nonconvertible, non-investment-grade debt index. The index consists of domestic and corporate bonds rated Ba and below with a minimum outstanding amount of $150 million. You cannot invest directly in an index. |
| 3 | The BofA Merrill Lynch Global Broad Market ex U.S. Index tracks the performance of investment-grade debt publicly issued in the major domestic and eurobond markets, including sovereign, quasi-government, corporate, securitized, and collateralized securities, and excludes all securities denominated in U.S. dollars. You cannot invest directly in an index. |
| | | | |
| 4 | | Wells Fargo Strategic Income Fund | | Performance highlights (unaudited) |
Investment objective
The Fund seeks total return, consisting of a high level of current income and capital appreciation.
Manager
Wells Fargo Funds Management, LLC
Subadvisers
First International Advisers, LLC
Wells Capital Management Incorporated
Portfolio managers
Ashok Bhatia, CFA
David Germany, Ph.D
Niklas Nordenfelt, CFA
Tony Norris
Margaret D. Patel
Alex Perrin
Thomas M. Price, CFA
Scott M. Smith, CFA
Noah Wise, CFA
Average annual total returns (%) as of October 31, 2015
| | | | | | | | | | | | | | | | | | | | | | | | | | |
| | | | | Including sales charge | | | Excluding sales charge | | | Expense ratios1 (%) | |
| | | Inception date | | 1 year | | | Since inception | | | 1 year | | | Since inception | | | Gross | | | Net2 | |
| Class A (WSIAX) | | 1-31-2013 | | | (7.99 | ) | | | (2.12 | ) | | | (3.64 | ) | | | (0.47 | ) | | | 1.49 | | | | 0.91 | |
| Class C (WSICX ) | | 1-31-2013 | | | (5.28 | ) | | | (1.23 | ) | | | (4.35 | ) | | | (1.23 | ) | | | 2.24 | | | | 1.66 | |
| Administrator Class (WSIDX) | | 1-31-2013 | | | – | | | | – | | | | (3.51 | ) | | | (0.31 | ) | | | 1.43 | | | | 0.76 | |
| Institutional Class (WSINX) | | 1-31-2013 | | | – | | | | – | | | | (3.28 | ) | | | (0.17 | ) | | | 1.16 | | | | 0.61 | |
| Barclays U.S. Universal Bond Index3 | | – | | | – | | | | – | | | | 1.67 | | | | 2.16 | | | | – | | | | – | |
| BofA Merrill Lynch 3 Month U.S. Dollar LIBOR Constant Maturity Index4 | | – | | | – | | | | – | | | | 0.26 | | | | 0.26 | | | | – | | | | – | |
Figures quoted represent past performance, which is no guarantee of future results, and do not reflect taxes that a shareholder may pay on fund distributions or the redemption of fund shares. Investment return and principal value of an investment will fluctuate so that an investor’s shares, when redeemed, may be worth more or less than their original cost. Performance shown without sales charges would be lower if sales charges were reflected. Current performance may be lower or higher than the performance data quoted, which assumes the reinvestment of dividends and capital gains. Current month-end performance is available on the Fund’s website, wellsfargofunds.com.
Index returns do not include transaction costs associated with buying and selling securities, any mutual fund fees or expenses, or any taxes. It is not possible to invest directly in an index.
For Class A shares, the maximum front-end sales charge is 4.50%. For Class C shares, the maximum contingent deferred sales charge is 1.00%. Performance including a contingent deferred sales charge assumes the sales charge for the corresponding time period. Administrator Class and Institutional Class shares are sold without a front-end sales charge or contingent deferred sales charge.
Bond values fluctuate in response to the financial condition of individual issuers, general market and economic conditions, and changes in interest rates. Changes in market conditions and government policies may lead to periods of heightened volatility in the bond market and reduced liquidity for certain bonds held by the Fund. In general, when interest rates rise, bond values fall and investors may lose principal value. Interest rate changes and their impact on the Fund and its share price can be sudden and unpredictable. High-yield securities have a greater risk of default and tend to be more volatile than higher-rated debt securities. Loans are subject to risks similar to those associated with other below-investment-grade bond investments, such as credit risk (for example, risk of issuer default), below-investment-grade bond risk (for example, risk of greater volatility in value), and risk that the loan may become illiquid or difficult to price. Foreign investments are especially volatile and can rise or fall dramatically due to differences in the political and economic conditions of the host country. These risks are generally intensified in emerging markets. The use of derivatives may reduce returns and/or increase volatility. Certain investment strategies tend to increase the total risk of an investment (relative to the broader market). The Fund is exposed to mortgage- and asset-backed securities risk and regional risk. Consult the Fund’s prospectus for additional information on these and other risks.
Please see footnotes on page 5.
| | | | | | |
| Performance highlights (unaudited) | | Wells Fargo Strategic Income Fund | | | 5 | |
|
| Growth of $10,000 investment as of October 31, 20155 |
|
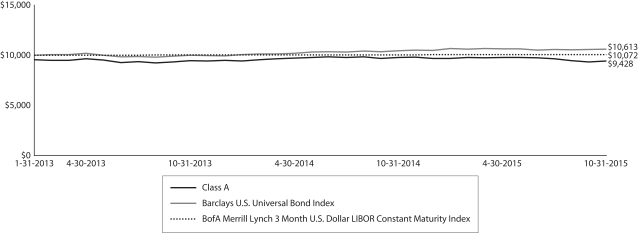 |
| 1 | Reflects the expense ratios as stated in the most recent prospectuses, which include the impact of 0.01% in acquired fund fees and expenses. The expense ratios shown are subject to change and may differ from the annualized expense ratios shown in the financial highlights of this report, which do not include acquired fund fees and expenses. |
| 2 | The manager has contractually committed through Feburary 29, 2016, to waive fees and/or reimburse expenses to the extent necessary to cap the Fund’s Total Annual Operating Expenses After Fee Waiver at 0.90% for Class A, 1.65% for Class C, 0.75% for Administrator Class, and 0.60% for Institutional Class. After this time, the cap may be increased or the commitment to maintain the cap may be terminated only with the approval of the Board of Trustees. Brokerage commissions, stamp duty fees, interest, taxes, acquired fees and expenses, and extraordinary expenses are excluded from the cap. Without this cap, the Fund’s returns would have been lower. |
| 3 | The Barclays U.S. Universal Bond Index is an unmanaged market-value-weighted performance benchmark for the U.S. dollar–denominated bond market, which includes investment-grade, high-yield, and emerging markets debt securities with maturities of one year or more. You cannot invest directly in an index. |
| 4 | The BofA Merrill Lynch 3 Month U.S. Dollar LIBOR Constant Maturity Index is based on the assumed purchase of a synthetic instrument having 3 months to maturity and with a coupon equal to the closing quote for 3-Month LIBOR. That issue is sold the following day (priced at a yield equal to the current day closing 3-Month LIBOR rate) and is rolled into a new 3-Month instrument. The index, therefore, will always have a constant maturity equal to exactly 3 months. You cannot invest directly in an index. |
| 5 | The chart compares the performance of Class A shares since inception with the Barclays U.S. Universal Bond Index. The chart assumes a hypothetical investment of $10,000 in Class A shares and reflects all operating expenses and assumes the maximum initial sales charge of 4.50%. |
| 6 | The ten largest holdings, excluding cash and cash equivalents, are calculated based on the value of the investments divided by total net assets of the Fund. Holdings are subject to change and may have changed since the date specified. |
| 7 | Amounts are calculated based on the total long-term investments of the Fund. These amounts are subject to change and may have changed since the date specified. |
| | | | |
| 6 | | Wells Fargo Strategic Income Fund | | Performance highlights (unaudited) |
MANAGERS’ DISCUSSION
Fund highlights
| n | | The Fund (Class A, excluding sales charges) returned -3.64% during the 12-month period that ended October 31, 2015. The Fund has a flexible fixed-income strategy that seeks to invest in the best relative-value opportunities. However, it underperformed short-term investments, which benefited from strong demand for highly liquid assets, and also underperformed the Barclays U.S. Universal Bond Index. |
| n | | An allocation to local-currency emerging sovereign debt was a significant detractor. Allocations to several emerging markets currencies detracted as well, although it helped results that this exposure was reduced during the 12-month period. |
| n | | Our decision to reduce the Fund’s duration limited its interest-rate exposure, but precluded the Fund from benefiting from a decline in U.S. interest rates. |
| | | | |
| Ten largest holdings (%) as of October 31, 20156 | |
Poland, 4.00%, 10-25-2023 | | | 2.54 | |
Mexico, 4.75%, 6-14-2018 | | | 2.51 | |
Indonesia, 7.88%, 4-15-2019 | | | 2.49 | |
ACAS CLO Limited Trust Series 2015-1A Class B, 2.42%, 4-18-2027 | | | 2.46 | |
JPMBB Commercial Mortgage Securities Trust Series 2014-C19 Class D, 4.68%, 4-15-2047 | | | 2.18 | |
First Data Corporation, 3.70%, 9-24-2018 | | | 1.76 | |
Spin Holdco Incorporated, 4.25%, 11-14-2019 | | | 1.56 | |
Dell Equipment Finance Trust Series 2014-1 Class D, 2.68%, 6-22-2020 | | | 1.53 | |
Brazil, 10.00%, 1-1-2019 | | | 1.48 | |
Level 3 Financing Incorporated, 4.00%,
8-1-2019 | | | 1.47 | |
The U.S. economy grew while emerging markets countries struggled.
The economic environment was characterized by continued although unspectacular U.S. growth and European growth stabilizing. Emerging markets, however, continued to struggle in the face of low commodity prices and a slowdown in China. Indeed, a sharp rise in fears associated with rising debt in some emerging countries and a possible bursting of a debt-fueled bubble in China caused markets to price in an increased risk of a global recession in the third quarter, with sharp falls in global equity markets, rising volatility, and a jump in credit spreads. Returns on local-currency emerging markets debt were especially weak, reflecting the sharp decline in many of those currencies versus the U.S. dollar.
Taken together, these stresses were the largest detractors from performance. For much of the reporting period, the Fund benefited from our decision to underweight exposure to emerging markets currencies either by hedging some or all currency exposures or by reducing the allocation to emerging markets bonds below levels we typically would hold. Even so, the Fund remained exposed to some degree to the drop in emerging markets currencies. Meanwhile, the credit-oriented part of the Fund experienced losses when credit spreads widened in the third quarter. Finally, the decision to hedge most U.S. interest-rate exposure meant that the portfolio did not benefit from the decline in U.S. rates when other markets came under pressure.
|
| Portfolio allocation as of October 31, 20157 |
|
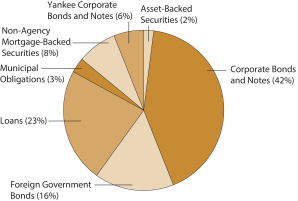 |
The Fund’s strategy focused on protecting against interest-rate risk, finding credit opportunities that represented relative value, and benefiting from a stronger dollar.
To protect against rising interest rates, the Fund’s duration was 0.9 years at the end of the reporting period. The Fund’s largest sector allocations were to corporate credit (both investment-grade and high yield), bank loans, and local currency emerging markets bonds. About one-half of the emerging markets currency exposure was hedged back into U.S. dollars and about 40% of the high-yield bonds were in short-term securities. Emerging markets bond exposure was reduced several times during the period as we increased the Fund’s allocation to U.S. credit. While we originally focused
Please see footnotes on page 5.
| | | | | | |
| Performance highlights (unaudited) | | Wells Fargo Strategic Income Fund | | | 7 | |
on adding high-yield bonds, we shifted to adding higher-credit quality in recent months. Indeed, given the rally in high yield this October, we have been shifting exposure toward the investment-grade area, in both corporate credit and commercial mortgage-backed securities.
We see value in credit and will wait for longer-run emerging markets opportunities.
Going forward, we expect the U.S. economy to continue to grow at a modest pace, which we believe will be supportive of credit at current spreads. To be sure, China has slowed, but this slowdown occurred at the beginning of 2015 and recent data suggests that the economy has stabilized. Similarly, while we are mindful of the high level of debt in the Chinese private sector and with local governments, the central government’s balance sheet is still in good shape, enabling it to finance expansionary policy, if desired, and to alleviate debt pressures elsewhere in the economy. For this reason, we felt strongly that the sell-off in the third quarter was excessive, as indicated by the recovery in both high yield and emerging markets debt in October. Similarly, the combination of high interest rates and low currency values in many emerging markets currencies indicates longer-run opportunities in that area. However, we plan to wait until there is further evidence of these markets stabilizing before lifting any more currency hedges.
Please see footnotes on page 5.
| | | | |
| 8 | | Wells Fargo Strategic Income Fund | | Fund expenses (unaudited) |
As a shareholder of the Fund, you incur two types of costs: (1) transaction costs, including sales charges (loads) on purchase payments and contingent deferred sales charges (if any) on redemptions and (2) ongoing costs, including management fees, distribution (12b-1) and/or shareholder servicing fees, and other Fund expenses. This example is intended to help you understand your ongoing costs (in dollars) of investing in the Fund and to compare these costs with the ongoing costs of investing in other mutual funds.
The example is based on an investment of $1,000 invested at the beginning of the six-month period and held for the entire period from May 1, 2015 to October 31, 2015.
Actual expenses
The “Actual” line of the table below provides information about actual account values and actual expenses. You may use the information in this line, together with the amount you invested, to estimate the expenses that you paid over the period. Simply divide your account value by $1,000 (for example, an $8,600 account value divided by $1,000 = 8.6), then multiply the result by the number in the “Actual” line under the heading entitled “Expenses paid during period” for your applicable class of shares to estimate the expenses you paid on your account during this period.
Hypothetical example for comparison purposes
The “Hypothetical” line of the table below provides information about hypothetical account values and hypothetical expenses based on the Fund’s actual expense ratio and an assumed rate of return of 5% per year before expenses, which is not the Fund’s actual return. The hypothetical account values and expenses may not be used to estimate the actual ending account balance or expenses you paid for the period. You may use this information to compare the ongoing costs of investing in the Fund and other funds. To do so, compare this 5% hypothetical example with the 5% hypothetical examples that appear in the shareholder reports of the other funds.
Please note that the expenses shown in the table are meant to highlight your ongoing costs only and do not reflect any transactional costs, such as sales charges (loads) and contingent deferred sales charges. Therefore, the “Hypothetical” line of the table is useful in comparing ongoing costs only and will not help you determine the relative total costs of owning different funds. In addition, if these transactional costs were included, your costs would have been higher.
| | | | | | | | | | | | | | | | |
| | | Beginning
account value 5-1-2015 | | | Ending account value 10-31-2015 | | | Expenses paid during the period¹ | | | Net annualized expense ratio | |
Class A | | | | | | | | | | | | | | | | |
Actual | | $ | 1,000.00 | | | $ | 964.10 | | | $ | 4.46 | | | | 0.90 | % |
Hypothetical (5% return before expenses) | | $ | 1,000.00 | | | $ | 1,020.67 | | | $ | 4.58 | | | | 0.90 | % |
Class C | | | | | | | | | | | | | | | | |
Actual | | $ | 1,000.00 | | | $ | 959.87 | | | $ | 8.15 | | | | 1.65 | % |
Hypothetical (5% return before expenses) | | $ | 1,000.00 | | | $ | 1,016.89 | | | $ | 8.39 | | | | 1.65 | % |
Administrator Class | | | | | | | | | | | | | | | | |
Actual | | $ | 1,000.00 | | | $ | 964.21 | | | $ | 3.71 | | | | 0.75 | % |
Hypothetical (5% return before expenses) | | $ | 1,000.00 | | | $ | 1,021.42 | | | $ | 3.82 | | | | 0.75 | % |
Institutional Class | | | | | | | | | | | | | | | | |
Actual | | $ | 1,000.00 | | | $ | 965.15 | | | $ | 2.97 | | | | 0.60 | % |
Hypothetical (5% return before expenses) | | $ | 1,000.00 | | | $ | 1,022.18 | | | $ | 3.06 | | | | 0.60 | % |
| 1 | Expenses paid is equal to the annualized expense ratio of each class multiplied by the average account value over the period, multiplied by the number of days in the most recent fiscal half-year divided by the number of days in the fiscal year (to reflect the one-half-year period). |
| | | | | | |
| Portfolio of investments—October 31, 2015 | | Wells Fargo Strategic Income Fund | | | 9 | |
| | | | | | | | | | | | | | | | |
| Security name | | Interest rate | | | Maturity date | | | Principal | | | Value | |
| | | | |
Asset-Backed Securities: 1.53% | | | | | | | | | | | | | | | | |
Dell Equipment Finance Trust Series 2014-1 Class D 144A | | | 2.68 | % | | | 6-22-2020 | | | $ | 300,000 | | | $ | 300,684 | |
| | | | | | | | | | | | | | | | |
| | | | |
Total Asset-Backed Securities (Cost $299,953) | | | | | | | | | | | | | | | 300,684 | |
| | | | | | | | | | | | | | | | |
| | | | |
Corporate Bonds and Notes: 37.31% | | | | | | | | | | | | | | | | |
| | | | |
Consumer Discretionary: 6.37% | | | | | | | | | | | | | | | | |
| | | | |
| Automobiles: 1.30% | | | | | | | | | | | | | | | | |
Ford Motor Company | | | 7.45 | | | | 7-16-2031 | | | | 200,000 | | | | 256,906 | |
| | | | | | | | | | | | | | | | |
| | | | |
| Hotels, Restaurants & Leisure: 1.41% | | | | | | | | | | | | | | | | |
CCM Merger Incorporated 144A | | | 9.13 | | | | 5-1-2019 | | | | 70,000 | | | | 74,200 | |
Greektown Holdings LLC 144A | | | 8.88 | | | | 3-15-2019 | | | | 200,000 | | | | 203,000 | |
| | | | |
| | | | | | | | | | | | | | | 277,200 | |
| | | | | | | | | | | | | | | | |
| | | | |
| Household Durables: 1.78% | | | | | | | | | | | | | | | | |
DR Horton Incorporated | | | 4.75 | | | | 5-15-2017 | | | | 175,000 | | | | 181,125 | |
Pulte Group Incorporated | | | 7.63 | | | | 10-15-2017 | | | | 155,000 | | | | 168,950 | |
| | | | |
| | | | | | | | | | | | | | | 350,075 | |
| | | | | | | | | | | | | | | | |
| | | | |
| Media: 0.57% | | | | | | | | | | | | | | | | |
CCO Holdings LLC | | | 5.13 | | | | 2-15-2023 | | | | 15,000 | | | | 15,038 | |
CCO Holdings LLC 144A | | | 5.13 | �� | | | 5-1-2023 | | | | 5,000 | | | | 5,025 | |
CCO Holdings LLC 144A | | | 5.38 | | | | 5-1-2025 | | | | 5,000 | | | | 4,950 | |
CCO Holdings LLC 144A | | | 5.88 | | | | 5-1-2027 | | | | 5,000 | | | | 5,000 | |
Cequel Communications Holdings I LLC 144A | | | 5.13 | | | | 12-15-2021 | | | | 5,000 | | | | 4,800 | |
Gray Television Incorporated | | | 7.50 | | | | 10-1-2020 | | | | 75,000 | | | | 78,278 | |
| | | | |
| | | | | | | | | | | | | | | 113,091 | |
| | | | | | | | | | | | | | | | |
| | | | |
| Specialty Retail: 1.31% | | | | | | | | | | | | | | | | |
Century Intermediate Holding Company (PIK at 10.50%) ¥(i)144A | | | 9.75 | | | | 2-15-2019 | | | | 5,000 | | | | 5,169 | |
Penske Auto Group Incorporated | | | 5.75 | | | | 10-1-2022 | | | | 50,000 | | | | 51,625 | |
Sally Holdings Incorporated | | | 6.88 | | | | 11-15-2019 | | | | 180,000 | | | | 186,300 | |
Sonic Automotive Incorporated | | | 5.00 | | | | 5-15-2023 | | | | 15,000 | | | | 14,588 | |
| | | | |
| | | | | | | | | | | | | | | 257,682 | |
| | | | | | | | | | | | | | | | |
| | | | |
Consumer Staples: 0.82% | | | | | | | | | | | | | | | | |
| | | | |
| Beverages: 0.82% | | | | | | | | | | | | | | | | |
Constellation Brands Incorporated | | | 7.25 | | | | 9-1-2016 | | | | 155,000 | | | | 161,781 | |
| | | | | | | | | | | | | | | | |
| | | | |
Energy: 7.46% | | | | | | | | | | | | | | | | |
| | | | |
| Energy Equipment & Services: 2.92% | | | | | | | | | | | | | | | | |
Bristow Group Incorporated | | | 6.25 | | | | 10-15-2022 | | | | 150,000 | | | | 130,494 | |
Era Group Incorporated | | | 7.75 | | | | 12-15-2022 | | | | 130,000 | | | | 120,250 | |
Forum Energy Technologies Incorporated | | | 6.25 | | | | 10-1-2021 | | | | 5,000 | | | | 4,188 | |
NGPL PipeCo LLC 144A | | | 7.12 | | | | 12-15-2017 | | | | 75,000 | | | | 69,375 | |
NGPL PipeCo LLC 144A | | | 7.77 | | | | 12-15-2037 | | | | 95,000 | | | | 77,900 | |
PHI Incorporated | | | 5.25 | | | | 3-15-2019 | | | | 85,000 | | | | 75,225 | |
Targa Resources Partners 144A | | | 5.00 | | | | 1-15-2018 | | | | 100,000 | | | | 98,500 | |
| | | | |
| | | | | | | | | | | | | | | 575,932 | |
| | | | | | | | | | | | | | | | |
The accompanying notes are an integral part of these financial statements.
| | | | |
| 10 | | Wells Fargo Strategic Income Fund | | Portfolio of investments—October 31, 2015 |
| | | | | | | | | | | | | | | | |
| Security name | | Interest rate | | | Maturity date | | | Principal | | | Value | |
| | | | |
| Oil, Gas & Consumable Fuels: 4.54% | | | | | | | | | | | | | | | | |
Buckeye Partners LP | | | 4.35 | % | | | 10-15-2024 | | | $ | 100,000 | | | $ | 91,707 | |
CSI Compressco LP | | | 7.25 | | | | 8-15-2022 | | | | 30,000 | | | | 24,900 | |
Energy Transfer Partners LP | | | 4.05 | | | | 3-15-2025 | | | | 200,000 | | | | 176,050 | |
Exterran Partners LP | | | 6.00 | | | | 4-1-2021 | | | | 50,000 | | | | 43,250 | |
Northern Tier Energy LLC | | | 7.13 | | | | 11-15-2020 | | | | 25,000 | | | | 25,438 | |
Rockies Express Pipeline LLC 144A | | | 5.63 | | | | 4-15-2020 | | | | 50,000 | | | | 50,563 | |
Sabine Pass LNG LP | | | 6.50 | | | | 11-1-2020 | | | | 100,000 | | | | 100,750 | |
Sabine Pass LNG LP | | | 7.50 | | | | 11-30-2016 | | | | 150,000 | | | | 154,781 | |
Suburban Propane Partners LP | | | 5.50 | | | | 6-1-2024 | | | | 15,000 | | | | 14,550 | |
TC Pipelines LP | | | 4.38 | | | | 3-13-2025 | | | | 100,000 | | | | 94,183 | |
Ultra Petroleum Corporation 144A | | | 6.13 | | | | 10-1-2024 | | | | 30,000 | | | | 16,800 | |
WPX Energy Incorporated | | | 5.25 | | | | 1-15-2017 | | | | 100,000 | | | | 101,000 | |
| | | | |
| | | | | | | | | | | | | | | 893,972 | |
| | | | | | | | | | | | | | | | |
| | | | |
Financials: 11.11% | | | | | | | | | | | | | | | | |
| | | | |
| Banks: 1.55% | | | | | | | | | | | | | | | | |
CIT Group Incorporated | | | 4.25 | | | | 8-15-2017 | | | | 165,000 | | | | 168,713 | |
JPMorgan Chase & Company ± | | | 6.00 | | | | 12-31-2049 | | | | 135,000 | | | | 136,958 | |
| | | | |
| | | | | | | | | | | | | | | 305,671 | |
| | | | | | | | | | | | | | | | |
| | | | |
| Capital Markets: 2.49% | | | | | | | | | | | | | | | | |
Goldman Sachs Group Incorporated | | | 4.25 | | | | 10-21-2025 | | | | 200,000 | | | | 200,928 | |
Jefferies Finance LLC 144A | | | 6.88 | | | | 4-15-2022 | | | | 55,000 | | | | 51,700 | |
Jefferies Finance LLC 144A | | | 7.38 | | | | 4-1-2020 | | | | 25,000 | | | | 24,500 | |
Morgan Stanley | | | 4.10 | | | | 5-22-2023 | | | | 210,000 | | | | 213,457 | |
| | | | |
| | | | | | | | | | | | | | | 490,585 | |
| | | | | | | | | | | | | | | | |
| | | | |
| Consumer Finance: 2.31% | | | | | | | | | | | | | | | | |
Navient Corporation | | | 6.00 | | | | 1-25-2017 | | | | 150,000 | | | | 153,930 | |
Navient Corporation | | | 8.00 | | | | 3-25-2020 | | | | 30,000 | | | | 31,800 | |
SLM Corporation | | | 6.13 | | | | 3-25-2024 | | | | 30,000 | | | | 27,075 | |
Springleaf Finance Corporation | | | 5.25 | | | | 12-15-2019 | | | | 200,000 | | | | 199,000 | |
Springleaf Finance Corporation | | | 8.25 | | | | 10-1-2023 | | | | 40,000 | | | | 43,900 | |
| | | | |
| | | | | | | | | | | | | | | 455,705 | |
| | | | | | | | | | | | | | | | |
| | | | |
| Insurance: 1.18% | | | | | | | | | | | | | | | | |
Fairfax US Incorporated 144A | | | 4.88 | | | | 8-13-2024 | | | | 200,000 | | | | 197,585 | |
Hub Holdings LLC (PIK at 8.88%) ¥144A | | | 8.13 | | | | 7-15-2019 | | | | 35,000 | | | | 34,038 | |
| | | | |
| | | | | | | | | | | | | | | 231,623 | |
| | | | | | | | | | | | | | | | |
| | | | |
| REITs: 3.58% | | | | | | | | | | | | | | | | |
American Tower Corporation | | | 3.50 | | | | 1-31-2023 | | | | 200,000 | | | | 193,845 | |
Digital Delta Holdings LLC 144A | | | 4.75 | | | | 10-1-2025 | | | | 170,000 | | | | 172,432 | |
DuPont Fabros Technology Incorporated LP | | | 5.88 | | | | 9-15-2021 | | | | 85,000 | | | | 89,250 | |
Iron Mountain Incorporated | | | 6.00 | | | | 8-15-2023 | | | | 75,000 | | | | 78,656 | |
Omega Healthcare Investors Incorporated | | | 4.50 | | | | 1-15-2025 | | | | 175,000 | | | | 171,298 | |
| | | | |
| | | | | | | | | | | | | | | 705,481 | |
| | | | | | | | | | | | | | | | |
The accompanying notes are an integral part of these financial statements.
| | | | | | |
| Portfolio of investments—October 31, 2015 | | Wells Fargo Strategic Income Fund | | | 11 | |
| | | | | | | | | | | | | | | | |
| Security name | | Interest rate | | | Maturity date | | | Principal | | | Value | |
| | | | |
Health Care: 1.06% | | | | | | | | | | | | | | | | |
| | | | |
| Health Care Providers & Services: 1.06% | | | | | | | | | | | | | | | | |
MPH Acquisition Holdings LLC 144A | | | 6.63 | % | | | 4-1-2022 | | | $ | 100,000 | | | $ | 102,000 | |
Tenet Healthcare Corporation | | | 6.25 | | | | 11-1-2018 | | | | 100,000 | | | | 106,500 | |
| | | | |
| | | | | | | | | | | | | | | 208,500 | |
| | | | | | | | | | | | | | | | |
| | | | |
Industrials: 3.49% | | | | | | | | | | | | | | | | |
| | | | |
| Air Freight & Logistics: 1.00% | | | | | | | | | | | | | | | | |
FedEx Corporation | | | 4.75 | | | | 11-15-2045 | | | | 200,000 | | | | 196,445 | |
| | | | | | | | | | | | | | | | |
| | | | |
| Airlines: 0.58% | | | | | | | | | | | | | | | | |
American Airlines Incorporated | | | 4.38 | | | | 4-1-2024 | | | | 113,595 | | | | 114,163 | |
| | | | | | | | | | | | | | | | |
| | | | |
| Commercial Services & Supplies: 0.23% | | | | | | | | | | | | | | | | |
Covanta Holding Corporation | | | 5.88 | | | | 3-1-2024 | | | | 45,000 | | | | 44,663 | |
| | | | | | | | | | | | | | | | |
| | | | |
| Machinery: 0.82% | | | | | | | | | | | | | | | | |
Case New Holland Industrial Incorporated | | | 7.88 | | | | 12-1-2017 | | | | 150,000 | | | | 161,625 | |
| | | | | | | | | | | | | | | | |
| | | | |
| Trading Companies & Distributors: 0.86% | | | | | | | | | | | | | | | | |
United Rentals North America Incorporated | | | 7.38 | | | | 5-15-2020 | | | | 160,000 | | | | 169,800 | |
| | | | | | | | | | | | | | | | |
| | | | |
Information Technology: 3.66% | | | | | | | | | | | | | | | | |
| | | | |
| Electronic Equipment, Instruments & Components: 0.25% | | | | | | | | | | | | | | | | |
Zebra Technologies Corporation | | | 7.25 | | | | 10-15-2022 | | | | 45,000 | | | | 48,994 | |
| | | | | | | | | | | | | | | | |
| | | | |
| IT Services: 1.16% | | | | | | | | | | | | | | | | |
Audatex North America Incorporated 144A | | | 6.13 | | | | 11-1-2023 | | | | 10,000 | | | | 10,063 | |
Fidelity National Information Services Incorporated | | | 4.50 | | | | 10-15-2022 | | | | 200,000 | | | | 204,225 | |
First Data Corporation | | | 11.75 | | | | 8-15-2021 | | | | 3,000 | | | | 3,420 | |
SunGard Data Systems Incorporated | | | 6.63 | | | | 11-1-2019 | | | | 10,000 | | | | 10,350 | |
| | | | |
| | | | | | | | | | | | | | | 228,058 | |
| | | | | | | | | | | | | | | | |
| | | | |
| Semiconductors & Semiconductor Equipment: 1.02% | | | | | | | | | | | | | | | | |
KLA-Tencor Corporation | | | 4.13 | | | | 11-1-2021 | | | | 200,000 | | | | 200,897 | |
| | | | | | | | | | | | | | | | |
| | | | |
| Software: 0.26% | | | | | | | | | | | | | | | | |
Activision Blizzard Incorporated 144A | | | 5.63 | | | | 9-15-2021 | | | | 15,000 | | | | 15,866 | |
Boxer Parent Company Incorporated (PIK at 9.75%) ¥144A | | | 9.00 | | | | 10-15-2019 | | | | 50,000 | | | | 35,750 | |
| | | | |
| | | | | | | | | | | | | | | 51,616 | |
| | | | | | | | | | | | | | | | |
| | | | |
| Technology Hardware, Storage & Peripherals: 0.97% | | | | | | | | | | | | | | | | |
NCR Corporation | | | 5.00 | | | | 7-15-2022 | | | | 175,000 | | | | 171,938 | |
NCR Corporation | | | 5.88 | | | | 12-15-2021 | | | | 10,000 | | | | 10,100 | |
NCR Corporation | | | 6.38 | | | | 12-15-2023 | | | | 10,000 | | | | 10,288 | |
| | | | |
| | | | | | | | | | | | | | | 192,326 | |
| | | | | | | | | | | | | | | | |
| | | | |
Telecommunication Services: 2.76% | | | | | | | | | | | | | | | | |
| | | | |
| Diversified Telecommunication Services: 1.52% | | | | | | | | | | | | | | | | |
GCI Incorporated | | | 6.75 | | | | 6-1-2021 | | | | 115,000 | | | | 119,025 | |
Verizon Communications Incorporated | | | 6.55 | | | | 9-15-2043 | | | | 150,000 | | | | 179,972 | |
| | | | |
| | | | | | | | | | | | | | | 298,997 | |
| | | | | | | | | | | | | | | | |
The accompanying notes are an integral part of these financial statements.
| | | | |
| 12 | | Wells Fargo Strategic Income Fund | | Portfolio of investments—October 31, 2015 |
| | | | | | | | | | | | | | | | |
| Security name | | Interest rate | | | Maturity date | | | Principal | | | Value | |
| | | | |
| Wireless Telecommunication Services: 1.24% | | | | | | | | | | | | | | | | |
CC Holdings GS V LLC | | | 3.85 | % | | | 4-15-2023 | | | $ | 200,000 | | | $ | 197,859 | |
T-Mobile USA Incorporated | | | 6.38 | | | | 3-1-2025 | | | | 20,000 | | | | 20,050 | |
T-Mobile USA Incorporated | | | 6.84 | | | | 4-28-2023 | | | | 25,000 | | | | 25,813 | |
| | | | |
| | | | | | | | | | | | | | | 243,722 | |
| | | | | | | | | | | | | | | | |
| | | | |
Utilities: 0.58% | | | | | | | | | | | | | | | | |
| | | | |
| Independent Power & Renewable Electricity Producers: 0.58% | | | | | | | | | | | | | | | | |
NSG Holdings LLC 144A | | | 7.75 | | | | 12-15-2025 | | | | 103,101 | | | | 113,926 | |
| | | | | | | | | | | | | | | | |
| | | | |
Total Corporate Bonds and Notes (Cost $7,522,332) | | | | | | | | | | | | | | | 7,349,436 | |
| | | | | | | | | | | | | | | | |
| | | | |
Foreign Government Bonds @: 14.50% | | | | | | | | | | | | | | | | |
Brazil (BRL) | | | 10.00 | | | | 1-1-2017 | | | | 430,000 | | | | 105,451 | |
Brazil (BRL) | | | 10.00 | | | | 1-1-2019 | | | | 1,300,000 | | | | 291,168 | |
Indonesia (IDR) | | | 7.88 | | | | 4-15-2019 | | | | 6,900,000,000 | | | | 490,075 | |
Mexico (MXN) | | | 4.75 | | | | 6-14-2018 | | | | 8,100,000 | | | | 494,177 | |
Poland (PLN) | | | 4.00 | | | | 10-25-2023 | | | | 1,750,000 | | | | 499,728 | |
Republic of South Africa (ZAR) | | | 7.75 | | | | 2-28-2023 | | | | 3,675,000 | | | | 260,774 | |
Republic of South Africa (ZAR) | | | 8.00 | | | | 12-21-2018 | | | | 2,700,000 | | | | 198,291 | |
Romania (RON) | | | 4.75 | | | | 6-24-2019 | | | | 1,000,000 | | | | 271,198 | |
Romania (RON) | | | 6.00 | | | | 4-30-2016 | | | | 970,000 | | | | 246,542 | |
| | | | |
Total Foreign Government Bonds (Cost $3,433,430) | | | | | | | | | | | | | | | 2,857,404 | |
| | | | | | | | | | | | | | | | |
| | | | |
Loans: 19.99% | | | | | | | | | | | | | | | | |
| | | | |
Consumer Discretionary: 5.88% | | | | | | | | | | | | | | | | |
| | | | |
| Auto Components: 0.76% | | | | | | | | | | | | | | | | |
Allison Transmission Incorporated ± | | | 3.50 | | | | 8-23-2019 | | | | 150,708 | | | | 150,754 | |
| | | | | | | | | | | | | | | | |
| | | | |
| Distributors: 1.56% | | | | | | | | | | | | | | | | |
Spin Holdco Incorporated ± | | | 4.25 | | | | 11-14-2019 | | | | 311,066 | | | | 307,047 | |
| | | | | | | | | | | | | | | | |
| | | | |
| Hotels, Restaurants & Leisure: 0.52% | | | | | | | | | | | | | | | | |
Belmond Interfin Limited ± | | | 4.00 | | | | 3-21-2021 | | | | 103,425 | | | | 102,218 | |
| | | | | | | | | | | | | | | | |
| | | | |
| Media: 1.05% | | | | | | | | | | | | | | | | |
Learfield Communications Incorporated ± | | | 4.50 | | | | 10-9-2020 | | | | 152,745 | | | | 152,363 | |
Salem Communications Corporation ± | | | 4.50 | | | | 3-16-2020 | | | | 27,400 | | | | 26,989 | |
TWCC Holdings Corporation ± | | | 5.75 | | | | 2-11-2020 | | | | 27,283 | | | | 27,286 | |
| | | | |
| | | | | | | | | | | | | | | 206,638 | |
| | | | | | | | | | | | | | | | |
| | | | |
| Multiline Retail: 0.20% | | | | | | | | | | | | | | | | |
New Albertson’s Incorporated ± | | | 4.75 | | | | 6-27-2021 | | | | 39,600 | | | | 39,328 | |
| | | | | | | | | | | | | | | | |
| | | | |
| Specialty Retail: 1.79% | | | | | | | | | | | | | | | | |
Focus Brands Incorporated ± | | | 4.25 | | | | 2-21-2018 | | | | 158,220 | | | | 157,824 | |
Pep Boys-Manny, Moe & Jack ± | | | 4.25 | | | | 10-11-2018 | | | | 194,500 | | | | 194,136 | |
| | | | |
| | | | | | | | | | | | | | | 351,960 | |
| | | | | | | | | | | | | | | | |
The accompanying notes are an integral part of these financial statements.
| | | | | | |
| Portfolio of investments—October 31, 2015 | | Wells Fargo Strategic Income Fund | | | 13 | |
| | | | | | | | | | | | | | | | |
| Security name | | Interest rate | | | Maturity date | | | Principal | | | Value | |
| | | | |
Energy: 0.09% | | | | | | | | | | | | | | | | |
| | | | |
| Energy Equipment & Services: 0.09% | | | | | | | | | | | | | | | | |
ExGen Renewables I LLC ± | | | 5.25 | % | | | 2-14-2021 | | | $ | 17,203 | | | $ | 17,246 | |
| | | | | | | | | | | | | | | | |
| | | | |
Financials: 0.88% | | | | | | | | | | | | | | | | |
| | | | |
| Diversified Financial Services: 0.25% | | | | | | | | | | | | | | | | |
TMFS Holdings LLC ± | | | 5.50 | | | | 7-30-2021 | | | | 49,500 | | | | 49,129 | |
| | | | | | | | | | | | | | | | |
| | | | |
| Real Estate Management & Development: 0.63% | | | | | | | | | | | | | | | | |
Capital Automotive LP ± | | | 4.00 | | | | 4-10-2019 | | | | 124,916 | | | | 125,041 | |
| | | | | | | | | | | | | | | | |
| | | | |
Health Care: 1.41% | | | | | | | | | | | | | | | | |
| | | | |
| Health Care Providers & Services: 0.60% | | | | | | | | | | | | | | | | |
Community Health Systems Incorporated ± | | | 4.00 | | | | 1-27-2021 | | | | 69,611 | | | | 69,379 | |
Surgery Center Holdings Incorporated ± | | | 5.25 | | | | 11-3-2020 | | | | 49,625 | | | | 49,336 | |
| | | | |
| | | | | | | | | | | | | | | 118,715 | |
| | | | | | | | | | | | | | | | |
| | | | |
| Pharmaceuticals: 0.81% | | | | | | | | | | | | | | | | |
Valeant Pharmaceuticals International Incorporated ± | | | 3.75 | | | | 12-11-2019 | | | | 170,559 | | | | 159,073 | |
| | | | | | | | | | | | | | | | |
| | | | |
Industrials: 2.99% | | | | | | | | | | | | | | | | |
| | | | |
| Commercial Services & Supplies: 1.44% | | | | | | | | | | | | | | | | |
Interactive Data Corporation ± | | | 4.75 | | | | 5-2-2021 | | | | 148,125 | | | | 148,063 | |
KAR Auction Services Incorporated ± | | | 3.50 | | | | 3-11-2021 | | | | 135,629 | | | | 135,629 | |
| | | | |
| | | | | | | | | | | | | | | 283,692 | |
| | | | | | | | | | | | | | | | |
| | | | |
| Construction & Engineering: 0.17% | | | | | | | | | | | | | | | | |
USIC Holdings Incorporated ± | | | 4.00 | | | | 7-10-2020 | | | | 34,447 | | | | 33,873 | |
| | | | | | | | | | | | | | | | |
| | | | |
| Transportation Infrastructure: 1.38% | | | | | | | | | | | | | | | | |
HGIM Corporation ± | | | 5.50 | | | | 6-18-2020 | | | | 216,166 | | | | 140,238 | |
OSG Bulk Ships Incorporated ± | | | 5.25 | | | | 8-5-2019 | | | | 14,813 | | | | 14,637 | |
OSG International Incorporated ± | | | 5.75 | | | | 8-5-2019 | | | | 118,500 | | | | 117,611 | |
| | | | |
| | | | | | | | | | | | | | | 272,486 | |
| | | | | | | | | | | | | | | | |
| | | | |
Information Technology: 4.11% | | | | | | | | | | | | | | | | |
| | | | |
| Internet Software & Services: 0.87% | | | | | | | | | | | | | | | | |
Applied Systems Incorporated ± | | | 4.25 | | | | 1-25-2021 | | | | 98,513 | | | | 97,682 | |
Vertafore Incorporated ± | | | 4.25 | | | | 10-3-2019 | | | | 73,340 | | | | 73,248 | |
| | | | |
| | | | | | | | | | | | | | | 170,930 | |
| | | | | | | | | | | | | | | | |
| | | | |
| IT Services: 1.76% | | | | | | | | | | | | | | | | |
First Data Corporation ± | | | 3.70 | | | | 9-24-2018 | | | | 350,000 | | | | 347,375 | |
| | | | | | | | | | | | | | | | |
| | | | |
| Semiconductors & Semiconductor Equipment: 0.13% | | | | | | | | | | | | | | | | |
Freescale Semiconductor Incorporated ± | | | 4.25 | | | | 3-1-2020 | | | | 24,811 | | | | 24,782 | |
| | | | | | | | | | | | | | | | |
| | | | |
| Technology Hardware, Storage & Peripherals: 1.35% | | | | | | | | | | | | | | | | |
Dell Incorporated ± | | | 4.00 | | | | 4-29-2020 | | | | 265,908 | | | | 265,759 | |
| | | | | | | | | | | | | | | | |
The accompanying notes are an integral part of these financial statements.
| | | | |
| 14 | | Wells Fargo Strategic Income Fund | | Portfolio of investments—October 31, 2015 |
| | | | | | | | | | | | | | | | |
| Security name | | Interest rate | | | Maturity date | | | Principal | | | Value | |
| | | | |
Telecommunication Services: 3.76% | | | | | | | | | | | | | | | | |
| | | | |
| Diversified Telecommunication Services: 2.65% | | | | | | | | | | | | | | | | |
Intelsat Jackson Holdings SA ± | | | 3.75 | % | | | 6-30-2019 | | | $ | 240,332 | | | $ | 232,608 | |
Level 3 Financing Incorporated ± | | | 4.00 | | | | 8-1-2019 | | | | 288,205 | | | | 288,865 | |
| | | | |
| | | | | | | | | | | | | | | 521,473 | |
| | | | | | | | | | | | | | | | |
| | | | |
| Wireless Telecommunication Services: 1.11% | | | | | | | | | | | | | | | | |
Syniverse Holdings Incorporated ± | | | 4.00 | | | | 4-23-2019 | | | | 242,380 | | | | 219,051 | |
| | | | | | | | | | | | | | | | |
| | | | |
Utilities : 0.87% | | | | | | | | | | | | | | | | |
| | | | |
| Electric Utilities: 0.87% | | | | | | | | | | | | | | | | |
Green Energy Partners ± | | | 6.50 | | | | 11-13-2021 | | | | 45,000 | | | | 43,425 | |
Texas Competitive Electric Holdings Company LLC ±(s) | | | 4.66 | | | | 10-10-2016 | | | | 400,000 | | | | 127,832 | |
| | | | |
| | | | | | | | | | | | | | | 171,257 | |
| | | | | | | | | | | | | | | | |
| | | | |
Total Loans (Cost $4,343,077) | | | | | | | | | | | | | | | 3,937,827 | |
| | | | | | | | | | | | | | | | |
| | | | |
Municipal Obligations: 2.70% | | | | | | | | | | | | | | | | |
| | | | |
| Idaho: 0.46% | | | | | | | | | | | | | | | | |
Idaho Housing & Finance Association Legacy Public Charter School (Education Revenue) | | | 7.00 | | | | 5-1-2017 | | | | 90,000 | | | | 89,924 | |
| | | | | | | | | | | | | | | | |
| | | | |
| Illinois: 0.98% | | | | | | | | | | | | | | | | |
Chicago IL Refunding Taxable Project Series E (GO Revenue) | | | 6.05 | | | | 1-1-2029 | | | | 200,000 | | | | 192,664 | |
| | | | | | | | | | | | | | | | |
| | | | |
| Texas: 1.26% | | | | | | | | | | | | | | | | |
North Texas Tollway Authority Build America Bonds Sub Lien Series B-2 (Transportation Revenue) | | | 8.91 | | | | 2-1-2030 | | | | 210,000 | | | | 249,335 | |
| | | | | | | | | | | | | | | | |
| | | | |
Total Municipal Obligations (Cost $546,927) | | | | | | | | | | | | | | | 531,923 | |
| | | | | | | | | | | | | | | | |
| | | | |
Non-Agency Mortgage-Backed Securities: 6.88% | | | | | | | | | | | | | | | | |
ACAS CLO Limited Trust Series 2015-1A Class B ±144A | | | 2.42 | | | | 4-18-2027 | | | | 500,000 | | | | 485,387 | |
BB-UBS Trust Series 2012-TFT Class C ±144A | | | 3.47 | | | | 6-5-2030 | | | | 150,000 | | | | 144,213 | |
GS Mortgage Securities Trust Series 2014-GC24 Class D ±144A | | | 4.53 | | | | 9-10-2047 | | | | 325,000 | | | | 269,826 | |
JPMBB Commercial Mortgage Securities Trust Series 2014-C19 Class D ±144A | | | 4.68 | | | | 4-15-2047 | | | | 493,000 | | | | 429,495 | |
Morgan Stanley Capital I Trust Series 2007-HQ11 Class AM ± | | | 5.48 | | | | 2-12-2044 | | | | 25,000 | | | | 25,994 | |
| | | | |
Total Non-Agency Mortgage-Backed Securities (Cost $1,422,894) | | | | | | | | | | | | | | | 1,354,915 | |
| | | | | | | | | | | | | | | | |
| | | | |
Yankee Corporate Bonds and Notes: 4.98% | | | | | | | | | | | | | | | | |
| | | | |
Consumer Discretionary: 0.26% | | | | | | | | | | | | | | | | |
| | | | |
| Automobiles: 0.26% | | | | | | | | | | | | | | | | |
Jaguar Land Rover Automotive plc 144A | | | 4.13 | | | | 12-15-2018 | | | | 50,000 | | | | 51,250 | |
| | | | | | | | | | | | | | | | |
| | | | |
Energy: 0.42% | | | | | | | | | | | | | | | | |
| | | | |
| Energy Equipment & Services: 0.42% | | | | | | | | | | | | | | | | |
Ensco plc | | | 5.20 | | | | 3-15-2025 | | | | 100,000 | | | | 83,549 | |
| | | | | | | | | | | | | | | | |
| | | | |
Financials: 1.21% | | | | | | | | | | | | | | | | |
| | | | |
| Banks: 1.21% | | | | | | | | | | | | | | | | |
BPCE SA 144A | | | 5.15 | | | | 7-21-2024 | | | | 230,000 | | | | 237,446 | |
| | | | | | | | | | | | | | | | |
The accompanying notes are an integral part of these financial statements.
| | | | | | |
| Portfolio of investments—October 31, 2015 | | Wells Fargo Strategic Income Fund | | | 15 | |
| | | | | | | | | | | | | | | | |
| Security name | | Interest rate | | | Maturity date | | | Principal | | | Value | |
| | | | |
Health Care: 1.59% | | | | | | | | | | | | | | | | |
| | | | |
| Pharmaceuticals: 1.59% | | | | | | | | | | | | | | | | |
Actavis Funding SCS | | | 3.80 | % | | | 3-15-2025 | | | $ | 150,000 | | | $ | 148,703 | |
Mallinckrodt International Finance SA | | | 3.50 | | | | 4-15-2018 | | | | 170,000 | | | | 164,688 | |
| | | | |
| | | | | | | | | | | | | | | 313,391 | |
| | | | | | | | | | | | | | | | |
| | | | |
Information Technology: 0.80% | | | | | | | | | | | | | | | | |
| | | | |
| Technology Hardware, Storage & Peripherals: 0.80% | | | | | | | | | | | | | | | | |
Seagate Technology HDD Holdings | | | 4.75 | | | | 1-1-2025 | | | | 175,000 | | | | 157,234 | |
| | | | | | | | | | | | | | | | |
| | | | |
Telecommunication Services: 0.70% | | | | | | | | | | | | | | | | |
| | | | |
| Diversified Telecommunication Services: 0.70% | | | | | | | | | | | | | | | | |
Intelsat Jackson Holdings SA | | | 5.50 | | | | 8-1-2023 | | | | 100,000 | | | | 83,000 | |
Intelsat Luxembourg SA | | | 8.13 | | | | 6-1-2023 | | | | 85,000 | | | | 50,363 | |
Virgin Media Finance plc 144A | | | 5.38 | | | | 4-15-2021 | | | | 4,500 | | | | 4,725 | |
| | | | |
| | | | | | | | | | | | | | | 138,088 | |
| | | | | | | | | | | | | | | | |
| | | | |
Total Yankee Corporate Bonds and Notes (Cost $1,070,429) | | | | | | | | | | | | | | | 980,958 | |
| | | | | | | | | | | | | | | | |
| | | | |
| | | Yield | | | | | | Shares | | | | |
| | | | |
Short-Term Investments: 10.46% | | | | | | | | | | | | | | | | |
| | | | |
| Investment Companies: 9.39% | | | | | | | | | | | | | | | | |
Wells Fargo Cash Investment Money Market Fund, Select Class (l)(u) | | | 0.16 | | | | | | | | 1,849,610 | | | | 1,849,610 | |
| | | | | | | | | | | | | | | | |
| | | | |
| | | | | | | | | Principal | | | | |
| | | | |
| U.S. Treasury Securities: 1.07% | | | | | | | | | | | | | | | | |
U.S. Treasury Bill #(z) | | | 0.05 | | | | 12-17-2015 | | | $ | 210,000 | | | | 209,993 | |
| | | | | | | | | | | | | | | | |
| | | | |
Total Short-Term Investments (Cost $2,059,595) | | | | | | | | | | | | | | | 2,059,603 | |
| | | | | | | | | | | | | | | | |
| | | | | | | | |
| Total investments in securities (Cost $20,698,637) * | | | 98.35 | % | | | 19,372,750 | |
Other assets and liabilities, net | | | 1.65 | | | | 325,831 | |
| | | | | | | | |
| Total net assets | | | 100.00 | % | | $ | 19,698,581 | |
| | | | | | | | |
| 144A | The security may be resold in transactions exempt from registration, normally to qualified institutional buyers, pursuant to Rule 144A under the Securities Act of 1933. |
| ¥ | A payment-in-kind (PIK) security is a security in which the issuer may make interest or dividend payments in cash or additional securities. These additional securities generally have the same terms as the original holdings. |
| (i) | Illiquid security for which the designation as illiquid is unaudited. |
| ± | Variable rate investment. The rate shown is the rate in effect at period end. |
| @ | Foreign bond principal is denominated in the local currency of the issuer. |
| (s) | The security is currently in default with regards to scheduled interest and/or principal payments. The Fund has stopped accruing interest on the security. |
| (l) | The issuer of the security is an affiliated person of the Fund as defined in the Investment Company Act of 1940. |
| (u) | The rate represents the 7-day annualized yield at period end. |
| # | All or a portion of this security is segregated as collateral for investments in derivative instruments. |
| (z) | Zero coupon security. The rate represents the current yield to maturity. |
| * | Cost for federal income tax purposes is $20,717,781 and unrealized gains (losses) consists of: |
| | | | |
Gross unrealized gains | | $ | 68,607 | |
Gross unrealized losses | | | (1,413,638 | ) |
| | | | |
Net unrealized losses | | $ | (1,345,031 | ) |
The accompanying notes are an integral part of these financial statements.
| | | | |
| 16 | | Wells Fargo Strategic Income Fund | | Statement of assets and liabilities—October 31, 2015 |
| | | | |
| | | | |
| |
Assets | | | | |
Investments | | | | |
In unaffiliated securities, at value (cost $18,849,027) | | $ | 17,523,140 | |
In affiliated securities, at value (cost $1,849,610) | | | 1,849,610 | |
| | | | |
Total investments, at value (cost $20,698,637) | | | 19,372,750 | |
Cash | | | 64,205 | |
Segregated cash | | | 60,937 | |
Foreign currency, at value (cost $18,141) | | | 18,114 | |
Receivable for investments sold | | | 668 | |
Receivable for interest | | | 205,907 | |
Receivable for daily variation margin on open futures contracts | | | 8,477 | |
Unrealized gains on credit default swap transactions | | | 1,436 | |
Premiums paid on credit default swap transactions | | | 29,950 | |
Receivable from manager | | | 15,292 | |
Prepaid expenses and other assets | | | 19,249 | |
| | | | |
Total assets | | | 19,796,985 | |
| | | | |
| |
Liabilities | | | | |
Unrealized losses on forward foreign currency contracts | | | 44,898 | |
Payable for daily variation margin on open futures contracts | | | 6,084 | |
Distribution fee payable | | | 461 | |
Administration fees payable | | | 1,465 | |
Trustees’ fees and expenses payable | | | 4,844 | |
Professional fees payable | | | 40,652 | |
| | | | |
Total liabilities | | | 98,404 | |
| | | | |
Total net assets | | $ | 19,698,581 | |
| | | | |
| |
NET ASSETS CONSIST OF | | | | |
Paid-in capital | | $ | 22,200,172 | |
Undistributed net investment income | | | 44,882 | |
Accumulated net realized losses on investments | | | (1,234,417 | ) |
Net unrealized losses on investments | | | (1,312,056 | ) |
| | | | |
Total net assets | | $ | 19,698,581 | |
| | | | |
| |
COMPUTATION OF NET ASSET VALUE AND OFFERING PRICE PER SHARE | | | | |
Net assets – Class A | | $ | 927,510 | |
Shares outstanding – Class A1 | | | 101,564 | |
Net asset value per share – Class A | | | $9.13 | |
Maximum offering price per share – Class A2 | | | $9.56 | |
Net assets – Class C | | $ | 710,899 | |
Shares outstanding – Class C1 | | | 78,158 | |
Net asset value per share – Class C | | | $9.10 | |
Net assets – Administrator Class | | $ | 495,956 | |
Shares outstanding – Administrator Class1 | | | 54,116 | |
Net asset value per share – Administrator Class | | | $9.16 | |
Net assets – Institutional Class | | $ | 17,564,216 | |
Shares outstanding – Institutional Class1 | | | 1,920,921 | |
Net asset value per share – Institutional Class | | | $9.14 | |
| 1 | The Fund has an unlimited number of authorized shares. |
| 2 | Maximum offering price is computed as 100/95.50 of net asset value. On investments of $50,000 or more, the offering price is reduced. |
The accompanying notes are an integral part of these financial statements.
| | | | | | |
| Statement of operations—year ended October 31, 2015 | | Wells Fargo Strategic Income Fund | | | 17 | |
| | | | |
| | | | |
| |
Investment income | | | | |
Interest (net of foreign withholding taxes of $2,760) | | $ | 1,523,963 | |
Income from affiliated securities | | | 2,341 | |
Securities lending income, net | | | 352 | |
| | | | |
Total investment income | | | 1,526,656 | |
| | | | |
| |
Expenses | | | | |
Management fee | | | 172,383 | |
Administration fees | | | | |
Class A | | | 1,481 | |
Class C | | | 1,184 | |
Administrator Class | | | 522 | |
Institutional Class | | | 24,518 | |
Shareholder servicing fees | | | | |
Class A | | | 2,314 | |
Class C | | | 1,850 | |
Administrator Class | | | 1,305 | |
Distribution fee | | | | |
Class C | | | 5,549 | |
Custody and accounting fees | | | 33,480 | |
Professional fees | | | 51,018 | |
Registration fees | | | 60,961 | |
Shareholder report expenses | | | 15,165 | |
Trustees’ fees and expenses | | | 24,839 | |
Other fees and expenses | | | 9,087 | |
| | | | |
Total expenses | | | 405,656 | |
Less: Fee waivers and/or expense reimbursements | | | (196,175 | ) |
| | | | |
Net expenses | | | 209,481 | |
| | | | |
Net investment income | | | 1,317,175 | |
| | | | |
| |
REALIZED AND UNREALIZED GAINS (LOSSES) ON INVESTMENTS | | | | |
| |
Net realized gains (losses) on: | | | | |
Unaffiliated securities | | | (1,424,645 | ) |
Futures transactions | | | (614,950 | ) |
Forward foreign currency contract transactions | | | 740,294 | |
Credit default swap transactions | | | 2,320 | |
| | | | |
Net realized losses on investments | | | (1,296,981 | ) |
| | | | |
| |
Net change in unrealized gains (losses) on: | | | | |
Unaffiliated securities | | | (606,214 | ) |
Futures transactions | | | 169,920 | |
Forward foreign currency contract transactions | | | (231,831 | ) |
Credit default swap transactions | | | 1,436 | |
| | | | |
Net change in unrealized gains (losses) on investments | | | (666,689 | ) |
| | | | |
Net realized and unrealized gains (losses) on investments | | | (1,963,670 | ) |
| | | | |
Net decrease in net assets resulting from operations | | $ | (646,495 | ) |
| | | | |
The accompanying notes are an integral part of these financial statements.
| | | | |
| 18 | | Wells Fargo Strategic Income Fund | | Statement of changes in net assets |
| | | | | | | | | | | | | | | | |
| | | Year ended
October 31, 2015 | | | Year ended
October 31, 2014 | |
| | | | |
Operations | | | | | | | | | | | | | | | | |
Net investment income | | | | | | $ | 1,317,175 | | | | | | | $ | 1,331,266 | |
Net realized losses on investments | | | | | | | (1,296,981 | ) | | | | | | | (982,908 | ) |
Net change in unrealized gains (losses) on investments | | | | | | | (666,689 | ) | | | | | | | 537,097 | |
| | | | |
Net increase (decrease) in net assets resulting from operations | | | | | | | (646,495 | ) | | | | | | | 885,455 | |
| | | | |
| | | | |
Distributions to shareholders from | | | | | | | | | | | | | | | | |
Net investment income | | | | | | | | | | | | | | | | |
Class A | | | | | | | (21,334 | ) | | | | | | | (15,762 | ) |
Class C | | | | | | | (14,917 | ) | | | | | | | (13,400 | ) |
Administrator Class | | | | | | | (12,399 | ) | | | | | | | (13,793 | ) |
Institutional Class | | | | | | | (935,496 | ) | | | | | | | (852,736 | ) |
Tax basis return of capital | | | | | | | | | | | | | | | | |
Class A | | | | | | | (2,416 | ) | | | | | | | 0 | |
Class C | | | | | | | (1,689 | ) | | | | | | | 0 | |
Administrator Class | | | | | | | (1,404 | ) | | | | | | | 0 | |
Institutional Class | | | | | | | (105,941 | ) | | | | | | | 0 | |
| | | | |
Total distributions to shareholders | | | | | | | (1,095,596 | ) | | | | | | | (895,691 | ) |
| | | | |
| | | | |
Capital share transactions | | | Shares | | | | | | | | Shares | | | | | |
Proceeds from shares sold | | | | | | | | | | | | | | | | |
Class A | | | 44,768 | | | | 426,513 | | | | 22,517 | | | | 217,023 | |
Class C | | | 5,907 | | | | 55,667 | | | | 46,130 | | | | 444,536 | |
Administrator Class | | | 0 | | | | 0 | | | | 4,115 | | | | 40,000 | |
Institutional Class | | | 190,379 | | | | 1,736,500 | | | | 1,475,076 | | | | 14,500,000 | |
| | | | |
| | | | | | | 2,218,680 | | | | | | | | 15,201,559 | |
| | | | |
Reinvestment of distributions | | | | | | | | | | | | | | | | |
Class A | | | 2,260 | | | | 21,553 | | | | 1,619 | | | | 15,592 | |
Class C | | | 1,740 | | | | 16,606 | | | | 1,394 | | | | 13,400 | |
Administrator Class | | | 1,443 | | | | 13,803 | | | | 1,431 | | | | 13,793 | |
Institutional Class | | | 109,213 | | | | 1,041,437 | | | | 88,370 | | | | 852,736 | |
| | | | |
| | | | | | | 1,093,399 | | | | | | | | 895,521 | |
| | | | |
Payment for shares redeemed | | | | | | | | | | | | | | | | |
Class A | | | (18,900 | ) | | | (178,898 | ) | | | (4,382 | ) | | | (42,882 | ) |
Class C | | | (15,520 | ) | | | (148,738 | ) | | | (15,103 | ) | | | (147,854 | ) |
Administrator Class | | | (4,192 | ) | | | (39,990 | ) | | | 0 | | | | 0 | |
Institutional Class | | | (2,358,709 | ) | | | (22,270,242 | ) | | | 0 | | | | 0 | |
| | | | |
| | | | | | | (22,637,868 | ) | | | | | | | (190,736 | ) |
| | | | |
Net increase (decrease) in net assets resulting from capital share transactions | | | | | | | (19,325,789 | ) | | | | | | | 15,906,344 | |
| | | | |
Total increase (decrease) in net assets | | | | | | | (21,067,880 | ) | | | | | | | 15,896,108 | |
| | | | |
| | | | |
Net assets | | | | | | | | | | | | | | | | |
Beginning of period | | | | | | | 40,766,461 | | | | | | | | 24,870,353 | |
| | | | |
End of period | | | | | | $ | 19,698,581 | | | | | | | $ | 40,766,461 | |
| | | | |
Undistributed net investment income | | | | | | $ | 44,882 | | | | | | | $ | 164,697 | |
| | | | |
The accompanying notes are an integral part of these financial statements.
| | | | | | |
| Financial highlights | | Wells Fargo Strategic Income Fund | | | 19 | |
(For a share outstanding throughout each period)
| | | | | | | | | | | | |
| | | Year ended October 31 | |
| CLASS A | | 2015 | | | 2014 | | | 20131 | |
Net asset value, beginning of period | | | $9.72 | | | | $9.66 | | | | $10.00 | |
Net investment income | | | 0.34 | | | | 0.37 | | | | 0.27 | |
Net realized and unrealized gains (losses) on investments | | | (0.69 | ) | | | (0.05 | ) | | | (0.36 | ) |
| | | | | | | | | | | | |
Total from investment operations | | | (0.35 | ) | | | 0.32 | | | | (0.09 | ) |
Distributions to shareholders from | | | | | | | | | | | | |
Net investment income | | | (0.22 | ) | | | (0.26 | ) | | | (0.25 | ) |
Tax basis return of capital | | | (0.02 | ) | | | 0.00 | | | | 0.00 | |
| | | | | | | | | | | | |
Total distributions to shareholders | | | (0.24 | ) | | | (0.26 | ) | | | (0.25 | ) |
Net asset value, end of period | | | $9.13 | | | | $9.72 | | | | $9.66 | |
Total return2 | | | (3.64 | )% | | | 3.36 | % | | | (0.89 | )% |
Ratios to average net assets (annualized) | | | | | | | | | | | | |
Gross expenses | | | 1.63 | % | | | 1.51 | % | | | 1.85 | % |
Net expenses | | | 0.90 | % | | | 0.90 | % | | | 0.90 | % |
Net investment income | | | 3.77 | % | | | 4.02 | % | | | 3.76 | % |
Supplemental data | | | | | | | | | | | | |
Portfolio turnover rate | | | 53 | % | | | 51 | % | | | 39 | % |
Net assets, end of period (000s omitted) | | | $928 | | | | $714 | | | | $518 | |
| 1 | For the period from January 31, 2013 (commencement of class operations) to October 31, 2013 |
| 2 | Total return calculations do not include any sales charges. Returns for periods of less than one year are not annualized. |
The accompanying notes are an integral part of these financial statements.
| | | | |
| 20 | | Wells Fargo Strategic Income Fund | | Financial highlights |
(For a share outstanding throughout each period)
| | | | | | | | | | | | |
| | | Year ended October 31 | |
| CLASS C | | 2015 | | | 2014 | | | 20131 | |
Net asset value, beginning of period | | | $9.71 | | | | $9.65 | | | | $10.00 | |
Net investment income | | | 0.28 | | | | 0.31 | | | | 0.21 | |
Net realized and unrealized gains (losses) on investments | | | (0.68 | ) | | | (0.06 | ) | | | (0.37 | ) |
| | | | | | | | | | | | |
Total from investment operations | | | (0.40 | ) | | | 0.25 | | | | (0.16 | ) |
Distributions to shareholders from | | | | | | | | | | | | |
Net investment income | | | (0.19 | ) | | | (0.19 | ) | | | (0.19 | ) |
Tax basis return of capital | | | (0.02 | ) | | | 0.00 | | | | 0.00 | |
| | | | | | | | | | | | |
Total distributions to shareholders | | | (0.21 | ) | | | (0.19 | ) | | | (0.19 | ) |
Net asset value, end of period | | | $9.10 | | | | $9.71 | | | | $9.65 | |
Total return2 | | | (4.35 | )% | | | 2.61 | % | | | (1.51 | )% |
Ratios to average net assets (annualized) | | | | | | | | | | | | |
Gross expenses | | | 2.37 | % | | | 2.25 | % | | | 2.60 | % |
Net expenses | | | 1.65 | % | | | 1.65 | % | | | 1.65 | % |
Net investment income | | | 3.02 | % | | | 3.25 | % | | | 3.01 | % |
Supplemental data | | | | | | | | | | | | |
Portfolio turnover rate | | | 53 | % | | | 51 | % | | | 39 | % |
Net assets, end of period (000s omitted) | | | $711 | | | | $835 | | | | $518 | |
| 1 | For the period from January 31, 2013 (commencement of class operations) to October 31, 2013 |
| 2 | Total return calculations do not include any sales charges. Returns for periods of less than one year are not annualized. |
The accompanying notes are an integral part of these financial statements.
| | | | | | |
| Financial highlights | | Wells Fargo Strategic Income Fund | | | 21 | |
(For a share outstanding throughout each period)
| | | | | | | | | | | | |
| | | Year ended October 31 | |
| ADMINISTRATOR CLASS | | 2015 | | | 2014 | | | 20131 | |
Net asset value, beginning of period | | | $9.74 | | | | $9.66 | | | | $10.00 | |
Net investment income | | | 0.37 | | | | 0.39 | | | | 0.28 | |
Net realized and unrealized gains (losses) on investments | | | (0.70 | ) | | | (0.05 | ) | | | (0.37 | ) |
| | | | | | | | | | | | |
Total from investment operations | | | (0.33 | ) | | | 0.34 | | | | (0.09 | ) |
Distributions to shareholders from | | | | | | | | | | | | |
Net investment income | | | (0.22 | ) | | | (0.26 | ) | | | (0.25 | ) |
Tax basis return of capital | | | (0.03 | ) | | | 0.00 | | | | 0.00 | |
| | | | | | | | | | | | |
Total distributions to shareholders | | | (0.25 | ) | | | (0.26 | ) | | | (0.25 | ) |
Net asset value, end of period | | | $9.16 | | | | $9.74 | | | | $9.66 | |
Total return2 | | | (3.51 | )% | | | 3.63 | % | | | (0.85 | )% |
Ratios to average net assets (annualized) | | | | | | | | | | | | |
Gross expenses | | | 1.56 | % | | | 1.46 | % | | | 1.79 | % |
Net expenses | | | 0.75 | % | | | 0.75 | % | | | 0.75 | % |
Net investment income | | | 3.92 | % | | | 4.18 | % | | | 3.90 | % |
Supplemental data | | | | | | | | | | | | |
Portfolio turnover rate | | | 53 | % | | | 51 | % | | | 39 | % |
Net assets, end of period (000s omitted) | | | $496 | | | | $554 | | | | $496 | |
| 1 | For the period from January 31, 2013 (commencement of class operations) to October 31, 2013 |
| 2 | Returns for periods of less than one year are not annualized. |
The accompanying notes are an integral part of these financial statements.
| | | | |
| 22 | | Wells Fargo Strategic Income Fund | | Financial highlights |
(For a share outstanding throughout each period)
| | | | | | | | | | | | |
| | | Year ended October 31 | |
| INSTITUTIONAL CLASS | | 2015 | | | 2014 | | | 20131 | |
Net asset value, beginning of period | | | $9.71 | | | | $9.66 | | | | $10.00 | |
Net investment income | | | 0.40 | | | | 0.41 | 2 | | | 0.29 | |
Net realized and unrealized gains (losses) on investments | | | (0.71 | ) | | | (0.07 | ) | | | (0.36 | ) |
| | | | | | | | | | | | |
Total from investment operations | | | (0.31 | ) | | | 0.34 | | | | (0.07 | ) |
Distributions to shareholders from | | | | | | | | | | | | |
Net investment income | | | (0.23 | ) | | | (0.29 | ) | | | (0.27 | ) |
Tax basis return of capital | | | (0.03 | ) | | | 0.00 | | | | 0.00 | |
| | | | | | | | | | | | |
Total distributions to shareholders | | | (0.26 | ) | | | (0.29 | ) | | | (0.27 | ) |
Net asset value, end of period | | | $9.14 | | | | $9.71 | | | | $9.66 | |
Total return3 | | | (3.28 | )% | | | 3.60 | % | | | (0.66 | )% |
Ratios to average net assets (annualized) | | | | | | | | | | | | |
Gross expenses | | | 1.19 | % | | | 1.14 | % | | | 1.52 | % |
Net expenses | | | 0.60 | % | | | 0.60 | % | | | 0.60 | % |
Net investment income | | | 4.04 | % | | | 4.25 | % | | | 4.05 | % |
Supplemental data | | | | | | | | | | | | |
Portfolio turnover rate | | | 53 | % | | | 51 | % | | | 39 | % |
Net assets, end of period (000s omitted) | | | $17,564 | | | | $38,664 | | | | $23,338 | |
| 1 | For the period from January 31, 2013 (commencement of class operations) to October 31, 2013 |
| 2 | Calculated based upon average shares outstanding |
| 3 | Returns for periods of less than one year are not annualized. |
The accompanying notes are an integral part of these financial statements.
| | | | | | |
| Notes to financial statements | | Wells Fargo Strategic Income Fund | | | 23 | |
1. ORGANIZATION
Wells Fargo Funds Trust (the “Trust”), a Delaware statutory trust organized on March 10, 1999, is an open-end management investment company registered under the Investment Company Act of 1940, as amended (the “1940 Act”). As an investment company, the Trust follows the accounting and reporting guidance in Financial Accounting Standards Board (“FASB”) Accounting Standards Codification Topic 946, Financial Services – Investment Companies. These financial statements report on the Wells Fargo Strategic Income Fund (the “Fund”) which is a diversified series of the Trust.
2. SIGNIFICANT ACCOUNTING POLICIES
The following significant accounting policies, which are consistently followed in the preparation of the financial statements of the Fund, are in conformity with U.S. generally accepted accounting principles which require management to make estimates and assumptions that affect the reported amounts of assets and liabilities, disclosure of contingent assets and liabilities at the date of the financial statements, and the reported amounts of revenues and expenses during the reporting period. Actual results could differ from those estimates.
Securities valuation
All investments are valued each business day as of the close of regular trading on the New York Stock Exchange (generally 4 p.m. Eastern Time).
Debt securities are valued at the evaluated bid price provided by an independent pricing service or, if a reliable price is not available, the quoted bid price from an independent broker-dealer.
Futures that are listed on a foreign or domestic exchange or market are valued at the official closing price or, if none, the last sales price.
Non-listed swaps are valued at the evaluated price provided by an independent pricing service or, if a reliable price is not available, the quoted bid price from an independent broker-dealer.
The values of securities denominated in foreign currencies are translated into U.S. dollars at rates provided by an independent foreign currency pricing source at a time each business day specified by the Management Valuation Team of Wells Fargo Funds Management, LLC (“Funds Management”).
Investments in registered open-end investment companies are valued at net asset value. Interests in non-registered investment vehicles that are redeemable at net asset value are fair valued at net asset value when available.
Investments which are not valued using any of the methods discussed above are valued at their fair value, as determined in good faith by the Board of Trustees of the Fund. The Board of Trustees has established a Valuation Committee comprised of the Trustees and has delegated to it the authority to take any actions regarding the valuation of portfolio securities that the Valuation Committee deems necessary or appropriate, including determining the fair value of portfolio securities, unless the determination has been delegated to the Management Valuation Team. The Board of Trustees retains the authority to make or ratify any valuation decisions or approve any changes to the Valuation Procedures as it deems appropriate. On a quarterly basis, the Board of Trustees receives reports on any valuation actions taken by the Valuation Committee or the Management Valuation Team which may include items for ratification.
Valuations of fair valued securities are compared to the next actual sales price when available, or other appropriate market values, to assess the continued appropriateness of the fair valuation methodologies used. These securities are fair valued on a day-to-day basis, taking into consideration changes to appropriate market information and any significant changes to the inputs considered in the valuation process until there is a readily available price provided on an exchange or by an independent pricing service. Valuations received from an independent pricing service or independent broker-dealer quotes are periodically validated by comparisons to most recent trades and valuations provided by other independent pricing services in addition to the review of prices by the manager and/or subadviser. Unobservable inputs used in determining fair valuations are identified based on the type of security, taking into consideration factors utilized by market participants in valuing the investment, knowledge about the issuer and the current market environment.
Foreign currency translation
The accounting records of the Fund are maintained in U.S. dollars. The values of other assets and liabilities denominated in foreign currencies are translated into U.S. dollars at rates provided by an independent foreign currency pricing source at a time each business day specified by the Management Valuation Team. Purchases and sales of securities, and income and expenses are converted at the rate of exchange on the respective dates of such transactions. Net realized foreign exchange gains or losses arise from sales of foreign currencies, currency gains or losses realized between the trade and settlement dates on securities transactions, and the difference between the amounts of dividends, interest and foreign
| | | | |
| 24 | | Wells Fargo Strategic Income Fund | | Notes to financial statements |
withholding taxes recorded and the U.S. dollar equivalent of the amounts actually paid or received. Net unrealized foreign exchange gains and losses arise from changes in the fair value of assets and liabilities other than investments in securities resulting from changes in exchange rates. The changes in net assets arising from changes in exchange rates and the changes in net assets resulting from changes in market prices of securities are not separately presented. Such changes are included in net realized and unrealized gains or losses from investments.
Forward foreign currency contracts
The Fund is subject to foreign currency exchange rate risk in the normal course of pursuing its investment objectives. A forward foreign currency contract is an agreement between two parties to purchase or sell a specific currency for an agreed-upon price at a future date. The Fund enters into forward foreign currency contracts to facilitate transactions in foreign-denominated securities and to attempt to minimize the risk to the Fund from adverse changes in the relationship between currencies. Forward foreign currency contracts are recorded at the forward rate and marked-to-market daily. When the contracts are closed, realized gains and losses arising from such transactions are recorded as realized gains or losses on forward foreign currency contract transactions. The Fund could be exposed to risks if the counterparties to the contracts are unable to meet the terms of their contracts or if the value of the foreign currency changes unfavorably. The Fund’s maximum risk of loss from counterparty credit risk is the unrealized gains on the contracts. This risk may be mitigated if there is a master netting arrangement between the Fund and the counterparty.
Security loans
The Fund may lend its securities from time to time in order to earn additional income in the form of fees or interest on securities received as collateral or the investment of any cash received as collateral. The Fund continues to receive interest or dividends on the securities loaned. The Fund receives collateral in the form of cash or securities with a value at least equal to the value of the securities on loan. The value of the loaned securities is determined at the close of each business day and any additional required collateral is delivered to the Fund on the next business day. In a securities lending transaction, the net asset value of the Fund will be affected by an increase or decrease in the value of the securities loaned and by an increase or decrease in the value of the instrument in which collateral is invested. The amount of securities lending activity undertaken by the Fund fluctuates from time to time. In the event of default or bankruptcy by the borrower, the Fund may be prevented from recovering the loaned securities or gaining access to the collateral or may experience delays or costs in doing so. In addition, the investment of any cash collateral received may lose all or part of its value. The Fund has the right under the lending agreement to recover the securities from the borrower on demand.
The Fund lends its securities through an unaffiliated securities lending agent. Cash collateral received in connection with its securities lending transactions is invested in Securities Lending Cash Investments, LLC (the “Securities Lending Fund”). The Securities Lending Fund is exempt from registration under Section 3(c)(7) of the 1940 Act and is managed by Funds Management and is subadvised by Wells Capital Management Incorporated (“WellsCap”). Funds Management receives an advisory fee starting at 0.05% and declining to 0.01% as the average daily net assets of the Securities Lending Fund increase. All of the fees received by Funds Management are paid to WellsCap for its services as subadviser. The Securities Lending Fund seeks to provide a positive return compared to the daily Fed Funds Open rate by investing in high-quality, U.S. dollar-denominated short-term money market instruments. Securities Lending Fund investments are fair valued based upon the amortized cost valuation technique. Income earned from investment in the Securities Lending Fund is included in securities lending income on the Statement of Operations.
When-issued transactions
The Fund may purchase securities on a forward commitment or when-issued basis. The Fund records a when-issued transaction on the trade date and will segregate assets in an amount at least equal in value to the Fund’s commitment to purchase when-issued securities. Securities purchased on a when-issued basis are marked-to-market daily and the Fund begins earning interest on the settlement date. Losses may arise due to changes in the market value of the underlying securities or if the counterparty does not perform under the contract.
Loans
The Fund may invest in direct debt instruments which are interests in amounts owed to lenders by corporate or other borrowers. The loans pay interest at rates which are periodically reset by reference to a base lending rate plus a spread. Investments in loans may be in the form of participations in loans or assignments of all or a portion of loans from third parties. When the Fund purchases participations, it generally has no rights to enforce compliance with terms of the loan agreement with the borrower. As a result, the Fund assumes the credit risk of both the borrower and the lender that is selling the participation. When the Fund purchases assignments from lenders, it acquires direct rights against the borrower on the loan and may enforce compliance by the borrower with the terms of the loan agreement. Loans may include fully funded term loans or unfunded loan commitments, which are contractual obligations for future funding.
| | | | | | |
| Notes to financial statements | | Wells Fargo Strategic Income Fund | | | 25 | |
Futures contracts
The Fund is subject to interest rate risk in the normal course of pursuing its investment objectives. The Fund may buy and sell futures contracts in order to gain exposure to, or protect against, changes in security values and interest rates. The primary risks associated with the use of futures contracts are the imperfect correlation between changes in market values of securities held by the Fund and the prices of futures contracts, and the possibility of an illiquid market.
The aggregate principal amounts of the contracts are not recorded in the financial statements. Fluctuations in the value of the contracts are recorded in the Statement of Assets and Liabilities as an asset or liability and in the Statement of Operations as unrealized gains or losses until the contracts are closed, at which point they are recorded as net realized gains or losses on futures contracts. With futures contracts, there is minimal counterparty risk to the Fund since futures are exchange traded and the exchange’s clearinghouse, as counterparty to all exchange traded futures, guarantees the futures against default.
Credit default swaps
The Fund is subject to credit risk in the normal course of pursuing its investment objectives. The Fund may enter into credit default swap contracts for hedging or speculative purposes to provide or receive a measure of protection against default on a referenced entity, obligation or index or for investment gains. Credit default swaps involve an exchange of a stream of payments for protection against the loss in value of an underlying security or index. Under the terms of the swap, one party acts as a guarantor (referred to as the seller of protection) and receives a periodic stream of payments, provided that there is no credit event, from another party (referred to as the buyer of protection) that is a fixed percentage applied to a notional principal amount over the term of the swap. An index credit default swap references all the names in the index, and if a credit event is triggered, the credit event is settled based on that name’s weight in the index. A credit event includes bankruptcy, failure to pay, obligation default, obligation acceleration, repudiation/moratorium, and restructuring. The Fund may enter into credit default swaps as either the seller of protection or the buyer of protection. As the seller of protection, the Fund is subject to investment exposure on the notional amount of the swap and has assumed the risk of default of the underlying security or index. As the buyer of protection, the Fund could be exposed to risks if the seller of the protection defaults on its obligation to perform, or if there are unfavorable changes in the fluctuation of interest rates. The maximum potential amount of future payments (undiscounted) that the Fund as the seller of protection could be required to make under the credit default swap contract would be an amount equal to the notional amount of the swap contract. The Fund’s maximum risk of loss from counterparty risk, either as the protection seller or as the protection buyer, is the fair value of the contract. This risk is mitigated by having a master netting arrangement between the Fund and the counterparty and by having the counterparty post collateral to cover the Fund’s exposure to the counterparty.
If the Fund is the seller of protection and a credit event occurs, as defined under the terms of that particular swap agreement, the Fund will pay to the buyer of protection the notional amount of the swap and take delivery of the referenced obligation or underlying securities comprising the referenced index. If the Fund is the buyer of protection and a credit event occurs, as defined under the terms of that particular swap agreement, the Fund will receive from the seller of protection the notional amount of the swap and deliver the referenced obligation or underlying securities comprising the referenced index.
Any premiums paid or received on the transactions are recorded as an asset or liability on the Statement of Assets and Liabilities and amortized. The value of the swap contract is marked-to-market daily based on quotations from an independent pricing service or an independent broker-dealer and any change in value is recorded as an unrealized gain or loss. Periodic payments made or received are recorded as realized gains or losses. In addition, payments received or made as a result of a credit event or termination of the contract are recognized as realized gains or losses.
Certain credit default swap contracts entered into by the Fund provide for conditions that result in events of default or termination that enable the counterparty to the agreement to cause an early termination of the transactions under those agreements. Any election by the counterparty to terminate early may impact the amounts reported on the financial statements.
Security transactions and income recognition
Securities transactions are recorded on a trade date basis. Realized gains or losses are recorded on the basis of identified cost.
Interest income is accrued daily and bond discounts are accreted and premiums are amortized daily based on the effective interest method. To the extent debt obligations are placed on non-accrual status, any related interest income may be reduced by writing off interest receivables when the collection of all or a portion of interest has become doubtful
| | | | |
| 26 | | Wells Fargo Strategic Income Fund | | Notes to financial statements |
based on consistently applied procedures. If the issuer subsequently resumes interest payments or when the collectability of interest is reasonably assured, the debt obligation is removed from non-accrual status.
Income from foreign securities is recorded net of foreign taxes withheld where recovery of such taxes is not assured.
Distributions to shareholders
Distributions to shareholders from net investment income and net realized gains, if any, are recorded on the ex-dividend date. Such distributions are determined in conformity with federal income tax regulations, which may differ in amount or character from net investment income and realized gains recognized for purposes of U.S. generally accepted accounting principles.
Federal and other taxes
The Fund intends to continue to qualify as a regulated investment company by distributing substantially all of its investment company taxable income and any net realized capital gains (after reduction for capital loss carryforwards) sufficient to relieve it from all, or substantially all, federal income taxes. Accordingly, no provision for federal income taxes was required.
The Fund’s income and federal excise tax returns and all financial records supporting those returns for the prior three fiscal years are subject to examination by the federal and Delaware revenue authorities. Management has analyzed the Fund’s tax positions taken on federal, state, and foreign tax returns for all open tax years and does not believe that there are any uncertain tax positions that require recognition of a tax liability.
Reclassifications are made to the Fund’s capital accounts for permanent tax differences to reflect income and gains available for distribution (or available capital loss carryforwards) under federal income tax regulations. U.S. generally accepted accounting principles require that certain components of net assets be adjusted to reflect permanent differences between financial and tax reporting. These reclassifications have no effect on net assets or net asset values per share. The primary permanent differences causing such reclassifications are due to foreign currency transactions and swaps. At October 31, 2015, as a result of permanent book-to-tax differences, the following reclassification adjustments were made on the Statement of Assets and Liabilities:
| | |
Undistributed net investment income | | Accumulated net realized losses on investments |
| $(452,844) | | $452,844 |
As of October 31, 2015, the Fund had capital loss carryforwards which consist of $497,909 in short-term capital losses and $656,818 in long-term capital losses.
Class allocations
The separate classes of shares offered by the Fund differ principally in applicable sales charges, distribution, shareholder servicing, and administration fees. Class specific expenses are charged directly to that share class. Investment income, common expenses, and realized and unrealized gains (losses) on investments are allocated daily to each class of shares based on the relative proportion of net assets of each class.
3. FAIR VALUATION MEASUREMENTS
Fair value measurements of investments are determined within a framework that has established a fair value hierarchy based upon the various data inputs utilized in determining the value of the Fund’s investments. The three-level hierarchy gives the highest priority to unadjusted quoted prices in active markets for identical assets or liabilities (Level 1) and the lowest priority to significant unobservable inputs (Level 3). The Fund’s investments are classified within the fair value hierarchy based on the lowest level of input that is significant to the fair value measurement. The inputs are summarized into three broad levels as follows:
| n | | Level 1 – quoted prices in active markets for identical securities |
| n | | Level 2 – other significant observable inputs (including quoted prices for similar securities, interest rates, prepayment speeds, credit risk, use of amortized cost, etc.) |
| n | | Level 3 – significant unobservable inputs (including the Fund’s own assumptions in determining the fair value of investments) |
| | | | | | |
| Notes to financial statements | | Wells Fargo Strategic Income Fund | | | 27 | |
The inputs or methodologies used for valuing investments in securities are not necessarily an indication of the risk associated with investing in those securities.
The following is a summary of the inputs used in valuing the Fund’s assets and liabilities as of October 31, 2015:
| | | | | | | | | | | | | | | | |
| | | Quoted prices
(Level 1) | | | Other significant
observable inputs
(Level 2) | | | Significant
unobservable inputs
(Level 3) | | | Total | |
Assets | | | | | | | | | | | | | | | | |
Investments in: | | | | | | | | | | | | | | | | |
| | | | |
Asset-backed securities | | $ | 0 | | | $ | 300,684 | | | $ | 0 | | | $ | 300,684 | |
| | | | |
Corporate bonds and notes | | | 0 | | | | 7,349,436 | | | | 0 | | | | 7,349,436 | |
| | | | |
Foreign government bonds | | | 0 | | | | 2,857,404 | | | | 0 | | | | 2,857,404 | |
| | | | |
Loans | | | 0 | | | | 3,695,779 | | | | 242,048 | | | | 3,937,827 | |
| | | | |
Municipal obligations | | | 0 | | | | 531,923 | | | | 0 | | | | 531,923 | |
| | | | |
Non-agency mortgage-backed securities | | | 0 | | | | 1,354,915 | | | | 0 | | | | 1,354,915 | |
| | | | |
Yankee corporate bonds and notes | | | 0 | | | | 980,958 | | | | 0 | | | | 980,958 | |
| | | | |
Short-term investments | | | | | | | | | | | | | | | | |
Investment companies | | | 1,849,610 | | | | 0 | | | | 0 | | | | 1,849,610 | |
U.S. Treasury securities | | | 209,993 | | | | 0 | | | | 0 | | | | 209,993 | |
| | | 2,059,603 | | | | 17,071,099 | | | | 242,048 | | | | 19,372,750 | |
Credit default swap contracts | | | 0 | | | | 31,386 | | | | 0 | | | | 31,386 | |
Futures contracts | | | 8,477 | | | | 0 | | | | 0 | | | | 8,477 | |
Total assets | | $ | 2,068,080 | | | $ | 17,102,485 | | | $ | 242,048 | | | $ | 19,412,613 | |
Liabilities | | | | | | | | | | | | | | | | |
| | | | |
Forward foreign currency contracts | | $ | 0 | | | $ | 44,898 | | | $ | 0 | | | $ | 44,898 | |
| | | | |
Futures contracts | | | 6,084 | | | | 0 | | | | 0 | | | | 6,084 | |
Total liabilities | | $ | 6,084 | | | $ | 44,898 | | | $ | 0 | | | $ | 50,982 | |
Forward foreign currency contracts are reported at their unrealized gains (losses) at measurement date, which represents the change in the contract’s value from trade date. Futures contracts are reported at their variation margin at measurement date, which represents the amount due from the Fund at that date. Swap contracts consists of unrealized gains and premiums paid on swap contracts, which represents the change in the contract’s value from trade date. All other assets and liabilities are reported at their market value at measurement date.
The Fund recognizes transfers between levels within the fair value hierarchy at the end of the reporting period. At October 31, 2015, the Fund did not have any transfers into/out of Level 1 or Level 2.
The following is a reconciliation of assets in which significant unobservable inputs (Level 3) were used in determining fair value:
| | | | |
| | | Loans | |
Balance as of October 31, 2014 | | $ | 1,127,246 | |
Accrued discounts (premiums) | | | (328 | ) |
Realized gains (losses) | | | 658 | |
Change in unrealized gains (losses) | | | 6,588 | |
Purchases | | | 60,175 | |
Sales | | | (519,737 | ) |
Transfers into Level 3 | | | 63,765 | |
Transfers out of Level 3 | | | (496,319 | ) |
Balance as of October 31, 2015 | | $ | 242,048 | |
Change in unrealized gains (losses) relating to securities still held at October 31, 2015 | | $ | (1,864 | ) |
| | | | |
| 28 | | Wells Fargo Strategic Income Fund | | Notes to financial statements |
The investment type categorized above was valued using indicative broker quotes. These indicative broker quotes are considered Level 3 inputs. Quantitative unobservable inputs used by the brokers are often proprietary and not provided to the Fund and therefore the disclosure that would address these inputs is not included above.
4. TRANSACTIONS WITH AFFILIATES
Management fee
Funds Management, an indirect wholly owned subsidiary of Wells Fargo & Company (“Wells Fargo”), is the manager of the Fund and provides advisory and fund-level administrative services under an investment management agreement. Under the investment management agreement, Funds Management is responsible for, among other services, implementing the investment objectives and strategies of the Fund, supervising the applicable subadvisers, providing fund-level administrative services in connection with the Fund’s operations, and providing any other fund-level administrative services reasonably necessary for the operation of the Fund. As compensation for its services under the investment management agreement, Funds Management is entitled to receive an annual management fee starting at 0.525% and declining to 0.405% as the average daily net assets of the Fund increase.
Prior to July 1, 2015, Funds Management provided advisory services pursuant to an investment advisory agreement and was entitled to receive an annual fee which started at 0.475% and declined to 0.375% as the average daily net assets of the Fund increased. In addition, fund-level administrative services were provided by Funds Management under a separate administration agreement at an annual fee which started at 0.05% and declined to 0.03% as the average daily net assets of the Fund increased. For financial statement purposes, the advisory fee and fund-level administration fee for the year ended October 31, 2015 have been included in management fee on the Statement of Operations.
For the year ended October 31, 2015, the management fee was equivalent to an annual rate of 0.525% of the Fund’s average daily net assets.
Funds Management has retained the services of certain subadvisers to provide daily portfolio management to the Fund. The fee for subadvisory services is borne by Funds Management. WellsCap, an affiliate of Funds Management and an indirect wholly owned subsidiary of Wells Fargo, is a subadviser to the Fund and is entitled to receive a fee from Funds Management at an annual rate starting at 0.30% and declining to 0.15% as the average daily net assets of the Fund increase. First International Advisors, LLC, an affiliate of Funds Management and an indirect wholly owned subsidiary of Wells Fargo, is also a subadviser to the Fund and is entitled to receive a fee from Funds Management at an annual rate starting at 0.35% and declining to 0.20% as the average daily net assets of the Fund increase.
Administration fees
Under a class-level administration agreement, Funds Management provides class-level administrative services to the Fund, which includes paying fees and expenses for services provided by the transfer agent, sub-transfer agents, omnibus account servicers and record-keepers. As compensation for its services under the class-level administration agreement, Funds Management receives an annual fee which is calculated based on the average daily net assets of each class as follows:
| | | | |
| | | Class-level
administration fee | |
Class A, Class C | | | 0.16 | % |
Administrator Class | | | 0.10 | |
Institutional Class | | | 0.08 | |
Funds Management has contractually waived and/or reimbursed management and administration fees to the extent necessary to maintain certain net operating expense ratios for the Fund. Waiver of fees and/or reimbursement of expenses by Funds Management were made first from fund level expenses on a proportionate basis and then from class specific expenses. Funds Management has committed through February 29, 2016 to waive fees and/or reimburse expenses to the extent necessary to cap the Fund’s expenses at 0.90% for Class A shares, 1.65% for Class C shares, 0.75% for Administrator Class shares, and 0.60% for Institutional Class shares. After this time, the cap may be increased or the commitment to maintain the cap may be terminated only with the approval of the Board of Trustees.
| | | | | | |
| Notes to financial statements | | Wells Fargo Strategic Income Fund | | | 29 | |
Distribution fee
The Trust has adopted a distribution plan for Class C shares of the Fund pursuant to Rule 12b-1 under the 1940 Act. A distribution fee is charged to Class C shares and paid to Wells Fargo Funds Distributor, LLC (“Funds Distributor”), the principal underwriter, at an annual rate of 0.75% of the average daily net assets of Class C shares.
In addition, Funds Distributor is entitled to receive the front-end sales charge from the purchase of Class A shares and a contingent deferred sales charge on the redemption of certain Class A shares. Funds Distributor is also entitled to receive the contingent deferred sales charges from redemptions of Class C shares. For the year ended October 31, 2015, Funds Distributor received $29 from the sale of Class A shares.
Shareholder servicing fees
The Trust has entered into contracts with one or more shareholder servicing agents, whereby Class A, Class C, and Administrator Class of the Fund is charged a fee at an annual rate of 0.25% of the average daily net assets of each respective class.
A portion of these total shareholder servicing fees were paid to affiliates of Wells Fargo.
5. INVESTMENT PORTFOLIO TRANSACTIONS
Purchases and sales of investments, excluding short-term securities, for the year ended October 31, 2015 were as follows:
| | | | | | |
Purchases at cost | | Sales proceeds |
U.S.
government | | Non-U.S.
government | | U.S.
government | | Non-U.S.
government |
| $228,167 | | $15,748,263 | | $227,134 | | $33,719,095 |
6. DERIVATIVE TRANSACTIONS
During the year ended October 31, 2015, the Fund entered into futures contracts to manage duration exposure.
At October 31, 2015, the Fund had long and short futures contracts outstanding as follows:
| | | | | | | | | | | | | | |
| Expiration date | | Counterparty | | Contracts | | Type | | Contract value at October 31, 2015 | | | Unrealized
gains (losses) | |
| 12-21-2015 | | JPMorgan | | 65 Short | | 10-Year U.S. Treasury Notes | | $ | 8,299,688 | | | $ | 63,752 | |
| 12-21-2015 | | JPMorgan | | 1 Short | | U.S. Treasury Bonds | | | 156,438 | | | | (2,064 | ) |
| 12-31-2015 | | JPMorgan | | 14 Long | | 5-Year U.S. Treasury Notes | | | 1,676,828 | | | | (4,027 | ) |
The Fund had an average notional amount of $1,410,978 in long futures contracts and $15,066,258 in short futures contracts during the year ended October 31, 2015.
During the year ended October 31, 2015, the Fund entered into forward foreign currency contracts for economic hedging purposes.
At October 31, 2015, the Fund had forward foreign currency contracts outstanding as follows:
Forward foreign currency contracts to buy:
| | | | | | | | | | | | | | | | | | |
| Exchange date | | Counterparty | | Contracts to
receive | | | U.S. value at October 31, 2015 | | | In exchange for U.S. $ | | | Unrealized
losses | |
| 11-5-2015 | | State Street Bank | | | 2,000,000 MXN | | | $ | 121,073 | | | $ | 121,419 | | | $ | (346 | ) |
| 11-5-2015 | | State Street Bank | | | 6,375,000 ZAR | | | | 460,499 | | | | 470,708 | | | | (10,209 | ) |
| | | | |
| 30 | | Wells Fargo Strategic Income Fund | | Notes to financial statements |
Forward foreign currency contracts to sell:
| | | | | | | | | | | | | | | | | | |
| Exchange date | | Counterparty | | Contracts to
deliver | | | U.S. value at
October 31, 2015 | | | In exchange
for U.S. $ | | | Unrealized
losses | |
| 11-5-2015 | | State Street Bank | | | 2,000,000 | PLN | | $ | 517,518 | | | $ | 516,328 | | | $ | (1,190 | ) |
| 11-5-2015 | | State Street Bank | | | 1,570,000 | BRL | | | 406,982 | | | | 388,325 | | | | (18,657 | ) |
| 11-5-2015 | | State Street Bank | | | 6,375,000 | ZAR | | | 460,499 | | | | 458,468 | | | | (2,031 | ) |
| 11-5-2015 | | State Street Bank | | | 8,240,000 | MXN | | | 498,820 | | | | 487,646 | | | | (11,174 | ) |
| 11-23-2015 | | State Street Bank | | | 1,650,000 | BRL | | | 425,140 | | | | 423,849 | | | | (1,291 | ) |
The Fund had average contract amounts of $1,063,731 and $6,412,336 in forward foreign currency contracts to buy and forward foreign currency contracts to sell, respectively, during the year ended October 31, 2015.
The Fund enters into credit default swap contracts as a substitute for taking a position in the underlying security or basket of securities or to potentially enhance the Fund’s total return. At October 31, 2015, the Fund had the following credit default swap contracts outstanding:
Credit default swaps on an index – Buy protection
| | | | | | | | | | | | | | | | | | | | | | | | |
| Expiration | | Counterparty | | Reference index | | Notional amount | | | Fixed
payments
made | | | Value | | | Premiums
paid | | | Unrealized gains | |
| 6-6-2020 | | JPMorgan | | Markit CDX North America
High Yield Index | | $ | 495,000 | | | | 5.00 | % | | $ | 31,386 | | | $ | 29,950 | | | $ | 1,436 | |
The Fund had an average notional balance on credit default swaps of $138,329 during the year ended October 31, 2015.
The Fund’s credit default swap transactions may contain provisions for early termination in the event the net assets of the Fund declines below specific levels identified by the counterparty. If these levels are triggered, the counterparty may terminate the transaction and seek payment or request full collateralization of the derivative transactions in net liability positions. As of October 31, 2015, the Fund had segregated $60,937 as cash collateral for outstanding credit default swap transactions.
A summary of derivative instruments by primary risk exposure is outlined in the following tables.
The fair value of derivative instruments as of October 31, 2015 was as follows for the Fund:
| | | | | | | | | | | | |
| | | Asset derivatives | | | Liability derivatives | |
| | | Statement of Assets and
Liabilities location | | Fair value | | | Statement of Assets and
Liabilities location | | Fair value | |
Interest rate contracts | | Receivable for daily variation margin on open futures contracts | | $ | 8,477 | * | | Payable for daily variation margin on open futures contracts | | $ | 6,084 | * |
Forward foreign currency contracts | | Unrealized gains on forward foreign currency contracts | | | 0 | | | Unrealized losses on forward foreign currency contracts | | | 44,898 | |
Credit contracts | | Unrealized gains and premiums paid on credit default swap transactions | | | 31,386 | | | Unrealized losses and premiums received on credit default swap transactions | | | 0 | |
| | | | | $ | 39,863 | | | | | $ | 50,982 | |
| * | Only the current day’s variation margin as of October 31, 2015 is reported separately on the Statement of Assets and Liabilities. |
| | | | | | |
| Notes to financial statements | | Wells Fargo Strategic Income Fund | | | 31 | |
The effect of derivative instruments on the Statement of Operations for the year ended October 31, 2015 was as follows for the Fund:
| | | | | | | | | | | | |
| | | Amount of realized gains (losses) on derivatives | |
| | | Futures
contracts | | | Forward currency
contracts | | | Credit
default
swaps | |
Interest rate contracts | | $ | (614,950 | ) | | $ | 0 | | | $ | 0 | |
Forward foreign currency contracts | | | 0 | | | | 740,294 | | | | 0 | |
Credit contracts | | | 0 | | | | 0 | | | | 2,320 | |
| | | $ | (614,950 | ) | | $ | 740,294 | | | $ | 2,320 | |
| |
| | | Change in unrealized gains (losses) on derivatives | |
| | | Futures contracts | | | Forward currency contracts | | | Credit default swaps | |
Interest rate contracts | | $ | 169,920 | | | $ | 0 | | | $ | 0 | |
Forward foreign currency contracts | | | 0 | | | | (231,831 | ) | | | 0 | |
Credit contracts | | | 0 | | | | 0 | | | | 1,436 | |
| | | $ | 169,920 | | | $ | (231,831 | ) | | $ | 1,436 | |
For certain types of derivative transactions, the Fund has entered into International Swaps and Derivatives Association, Inc. master agreements (“ISDA Master Agreements”) or similar agreements with approved counterparties. The ISDA Master Agreements or similar agreements may have requirements to deliver/deposit securities or cash to/with an exchange or broker-dealer as collateral and allows the Fund to offset, with each counterparty, certain derivative financial instrument’s assets and/or liabilities with collateral held or pledged. Collateral requirements differ by type of derivative. Collateral or margin requirements are set by the broker or exchange clearing house for exchange traded derivatives while collateral terms are contract specific for over-the-counter traded derivatives. Cash collateral that has been pledged to cover obligations of the Fund under ISDA Master Agreements or similar agreements, if any, are reported separately in the Statement of Assets and Liabilities. Securities pledged as collateral, if any, are noted in the Portfolio of Investments. With respect to balance sheet offsetting, absent an event of default by the counterparty or a termination of the agreement, the reported amounts of financial assets and financial liabilities in the Statement of Assets and Liabilities are not offset across transactions between the Fund and the applicable counterparty. A reconciliation of the gross amounts on the Statement of Assets and Liabilities to the net amounts by derivative type, including any collateral exposure, is as follows:
| | | | | | | | | | | | | | | | |
| Derivative type | | Counterparty | | Gross amounts of assets in the Statement of Assets and Liabilities | | Amounts subject to netting agreements | | | Collateral received | | | Net amount of assets | |
Credit default swaps | | JPMorgan | | $31,386* | | $ | 0 | | | $ | 0 | | | $ | 31,386 | |
Futures - variation margin | | JPMorgan | | 8,477 | | | (6,084 | ) | | | 0 | | | | 2,393 | |
| * | The value of swap contracts consists of unrealized gains and premiums paid on swap contracts as reflected on the Statement of Assets and Liabilities. |
| | | | | | | | | | | | | | | | |
| Derivative type | | Counterparty | | Gross amounts of liabilities in the Statement of Assets and Liabilities | | Amounts subject to netting agreements | | | Collateral pledged | | | Net amount of liabilities | |
Futures – variation margin | | JPMorgan | | $6,084 | | $ | (6,084 | ) | | $ | 0 | | | $ | 0 | |
Forward foreign currency contracts | | State Street Bank | | 44,898** | | | 0 | | | | 0 | | | | 44,898 | |
| ** | Amount represents net unrealized losses. |
| | | | |
| 32 | | Wells Fargo Strategic Income Fund | | Notes to financial statements |
7. BANK BORROWINGS
The Trust (excluding the money market funds) and Wells Fargo Variable Trust are parties to a $200,000,000 revolving credit agreement whereby the Fund is permitted to use bank borrowings for temporary or emergency purposes, such as to fund shareholder redemption requests. Interest under the credit agreement is charged to the Fund based on a borrowing rate equal to the higher of the Federal Funds rate in effect on that day plus 1.25% or the overnight LIBOR rate in effect on that day plus 1.25%. In addition, an annual commitment fee equal to 0.20% of the unused balance is allocated to each participating fund. Prior to September 1, 2015, the revolving credit agreement amount was $150,000,000 and the annual commitment fee was equal to 0.10% of the unused balance which was allocated to each participating fund. For the year ended October 31, 2015, the Fund paid $71 in commitment fees.
For the year ended October 31, 2015, there were no borrowings by the Fund under the agreement.
8. DISTRIBUTIONS TO SHAREHOLDERS
The tax character of distributions paid during the years ended October 31, 2015 and October 31, 2014 were as follows:
| | | | | | | | |
| | | Year ended October 31, | |
| | | 2015 | | | 2014 | |
Ordinary income | | $ | 984,146 | | | $ | 893,748 | |
Long-term capital gain | | | 0 | | | | 1,943 | |
Tax basis return of capital | | | 111,450 | | | | 0 | |
As of October 31, 2015, the components of distributable earnings on a tax basis were as follows:
| | |
Unrealized losses | | Capital loss carryforward |
| $(1,346,864) | | $(1,154,727) |
9. INDEMNIFICATION
Under the Trust’s organizational documents, the officers and Trustees have been granted certain indemnification rights against certain liabilities that may arise out of performance of their duties to the Trust. Additionally, in the normal course of business, the Trust may enter into contracts with service providers that contain a variety of indemnification clauses. The Trust’s maximum exposure under these arrangements is dependent on future claims that may be made against the Fund and, therefore, cannot be estimated.
| | | | | | |
| Report of independent registered public accounting firm | | Wells Fargo Strategic Income Fund | | | 33 | |
BOARD OF TRUSTEES AND SHAREHOLDERS OF WELLS FARGO FUNDS TRUST:
We have audited the accompanying statement of assets and liabilities, including the portfolio of investments, of the Wells Fargo Strategic Income Fund (the “Fund”), one of the funds constituting the Wells Fargo Funds Trust, as of October 31, 2015, and the related statement of operations for the year then ended, the statements of changes in net assets for each of the years in the two-year period then ended, and the financial highlights for each of the years in the two-year period then ended and the period from January 31, 2013 (commencement of operations) to October 31, 2013. These financial statements and financial highlights are the responsibility of the Fund’s management. Our responsibility is to express an opinion on these financial statements and financial highlights based on our audits.
We conducted our audits in accordance with the standards of the Public Company Accounting Oversight Board (United States). Those standards require that we plan and perform the audit to obtain reasonable assurance about whether the financial statements and financial highlights are free of material misstatement. An audit includes examining, on a test basis, evidence supporting the amounts and disclosures in the financial statements. Our procedures included confirmation of securities owned as of October 31, 2015, by correspondence with the custodian and brokers, or by other appropriate auditing procedures. An audit also includes assessing the accounting principles used and significant estimates made by management, as well as evaluating the overall financial statement presentation. We believe that our audits provide a reasonable basis for our opinion.
In our opinion, the financial statements and financial highlights referred to above present fairly, in all material respects, the financial position of the Wells Fargo Strategic Income Fund as of October 31, 2015, the results of its operations for the year then ended, the changes in its net assets for each of the years in the two-year period then ended, and the financial highlights for each of the years in the two-year period then ended and the period from January 31, 2013 (commencement of operations) to October 31, 2013, in conformity with U.S. generally accepted accounting principles.

Boston, Massachusetts
December 22, 2015
| | | | |
| 34 | | Wells Fargo Strategic Income Fund | | Other information (unaudited) |
TAX INFORMATION
For the fiscal year ended October 31, 2015, $805,681 has been designated as interest-related dividends for nonresident alien shareholders pursuant to Section 871 of the Internal Revenue Code.
PROXY VOTING INFORMATION
A description of the policies and procedures that the Fund uses to determine how to vote proxies relating to portfolio securities is available, upon request, by calling 1-800-222-8222, visiting our website at wellsfargofunds.com, or visiting the SEC website at sec.gov. Information regarding how the Fund voted proxies relating to portfolio securities during the most recent 12-month period ended June 30 is available on the Fund’s website at wellsfargofunds.com or by visiting the SEC website at sec.gov.
PORTFOLIO HOLDINGS INFORMATION
The complete portfolio holdings for the Fund are publicly available monthly on the Fund’s website (wellsfargofunds.com), on a one-month delayed basis. In addition, top ten holdings information (excluding derivative positions) for the Fund is publicly available on the Fund’s website on a monthly, seven-day or more delayed basis. The Fund files its complete schedule of portfolio holdings with the SEC for the first and third quarters of each fiscal year on Form N-Q, which is available by visiting the SEC website at sec.gov. In addition, the Fund’s Form N-Q may be reviewed and copied at the SEC’s Public Reference Room in Washington, DC, and at regional offices in New York City, at 233 Broadway, and in Chicago, at 175 West Jackson Boulevard, Suite 900. Information about the Public Reference Room may be obtained by calling 1-800-SEC-0330.
| | | | | | |
| Other information (unaudited) | | Wells Fargo Strategic Income Fund | | | 35 | |
BOARD OF TRUSTEES AND OFFICERS
Each of the Trustees and Officers1 listed in the table below acts in identical capacities for each fund in the Wells Fargo family of funds, which consists of 144 mutual funds comprising the Wells Fargo Funds Trust, Wells Fargo Variable Trust, Wells Fargo Master Trust and four closed-end funds (collectively the “Fund Complex”). This table should be read in conjunction with the Prospectus and the Statement of Additional Information2. The mailing address of each Trustee and Officer is 525 Market Street, 12th Floor, San Francisco, CA 94105. Each Trustee and Officer serves an indefinite term, however, each Trustee serves such term until reaching the mandatory retirement age established by the Trustees.
Independent Trustees
| | | | | | |
Name and year of birth | | Position held and length of service* | | Principal occupations during past five years or longer | | Other public company
or investment company
directorships during
past 5 years |
William R. Ebsworth
(Born 1957) | | Trustee, since 2015** | | Retired. From 1984 to 2013, equities analyst, portfolio manager, research director at Fidelity Management and Research Company and retired in 2013 as Chief Investment Officer of Fidelity Strategic Advisers, Inc. in Boston, Tokyo, and Hong Kong where he led a team of investment professionals managing client assets. Prior thereto, Board member of Hong Kong Securities Clearing Co., Hong Kong Options Clearing Corp., the Thailand International Fund, Ltd., Fidelity Investments Life Insurance Company, and Empire Fidelity Investments Life Insurance Company. Mr. Ebsworth is a CFA ® charterholder and an Adjunct Lecturer, Finance, at Babson College. | | Asset Allocation Trust |
Jane A. Freeman
(Born 1953) | | Trustee, since 2015** | | Retired. From 2012 to 2014 and 1999 to 2008, Chief Financial Officer of Scientific Learning Corporation. From 2008 to 2012, Ms. Freeman provided consulting services related to strategic business projects. Prior to 1999, Portfolio Manager at Rockefeller & Co. and Scudder, Stevens & Clark. Board member of the Harding Loevner Funds from 1996 to 2014, serving as both Lead Independent Director and chair of the Audit Committee. Board member of the Russell Exchange Traded Funds Trust from 2011 to 2012 and the chair of the Audit Committee. Ms. Freeman is Chair of Taproot Foundation (non-profit organization), a Board Member of Ruth Bancroft Garden (non-profit organization) and an inactive chartered financial analyst. | | Asset Allocation Trust; Harding Loevner Funds; Russell Exchange Traded Funds Trust |
Peter G. Gordon
(Born 1942) | | Trustee, since 1998; Chairman, since 2005 | | Co-Founder, Retired Chairman, President and CEO of Crystal Geyser Water Company. Trustee Emeritus, Colby College. | | Asset Allocation Trust |
Isaiah Harris, Jr.
(Born 1952) | | Trustee, since 2009 | | Retired. Chairman of the Board of CIGNA Corporation since 2009, and Director since 2005. From 2003 to 2011, Director of Deluxe Corporation. Prior thereto, President and CEO of BellSouth Advertising and Publishing Corp. from 2005 to 2007, President and CEO of BellSouth Enterprises from 2004 to 2005 and President of BellSouth Consumer Services from 2000 to 2003. Emeritus member of the Iowa State University Foundation Board of Governors. Emeritus Member of the Advisory Board of Iowa State University School of Business. Advisory Board Member, Palm Harbor Academy (charter school). Mr. Harris is a certified public accountant. | | CIGNA Corporation; Asset Allocation Trust |
Judith M. Johnson
(Born 1949) | | Trustee, since 2008; Audit Committee Chairman, since 2008 | | Retired. Prior thereto, Chief Executive Officer and Chief Investment Officer of Minneapolis Employees Retirement Fund from 1996 to 2008. Ms. Johnson is an attorney, certified public accountant and a certified managerial accountant. | | Asset Allocation Trust |
David F. Larcker
(Born 1950) | | Trustee, since 2009 | | James Irvin Miller Professor of Accounting at the Graduate School of Business, Stanford University, Morgan Stanley Director of the Center for Leadership Development and Research and Senior Faculty of The Rock Center for Corporate Governance since 2006. From 2005 to 2008, Professor of Accounting at the Graduate School of Business, Stanford University. Prior thereto, Ernst & Young Professor of Accounting at The Wharton School, University of Pennsylvania from 1985 to 2005. | | Asset Allocation Trust |
| | | | |
| 36 | | Wells Fargo Strategic Income Fund | | Other information (unaudited) |
| | | | | | |
Name and year of birth | | Position held and length of service* | | Principal occupations during past five years or longer | | Other public company
or investment company
directorships during
past 5 years |
Olivia S. Mitchell
(Born 1953) | | Trustee, since 2006 | | International Foundation of Employee Benefit Plans Professor, Wharton School of the University of Pennsylvania since 1993. Director of Wharton’s Pension Research Council and Boettner Center on Pensions & Retirement Research, and Research Associate at the National Bureau of Economic Research. Previously, Cornell University Professor from 1978 to 1993. | | Asset Allocation Trust |
Timothy J. Penny
(Born 1951) | | Trustee, since 1996 | | President and Chief Executive Officer of Southern Minnesota Initiative Foundation, a non-profit organization, since 2007 and Senior Fellow at the Humphrey Institute Policy Forum at the University of Minnesota since 1995. Member of the Board of Trustees of NorthStar Education Finance, Inc., a non-profit organization, since 2007. | | Asset Allocation Trust |
Michael S. Scofield
(Born 1943) | | Trustee, since 2010 | | Served on the Investment Company Institute’s Board of Governors and Executive Committee from 2008-2011 as well the Governing Council of the Independent Directors Council from 2006-2011 and the Independent Directors Council Executive Committee from 2008-2011. Chairman of the IDC from 2008-2010. Institutional Investor (Fund Directions) Trustee of Year in 2007. Trustee of the Evergreen Funds complex (and its predecessors) from 1984 to 2010. Chairman of the Evergreen Funds from 2000-2010. Former Trustee of the Mentor Funds. Retired Attorney, Law Offices of Michael S. Scofield. | | Asset Allocation Trust |
Donald C. Willeke
(Born 1940) | | Trustee, since 1996*** | | Principal of the law firm of Willeke & Daniels. General Counsel of the Minneapolis Employees Retirement Fund from 1984 until its consolidation into the Minnesota Public Employees Retirement Association on June 30, 2010. Director and Vice Chair of The Tree Trust (non-profit corporation). Director of the American Chestnut Foundation (non-profit corporation). | | Asset Allocation Trust |
| * | Length of service dates reflect the Trustee’s commencement of service with the Trust’s predecessor entities, where applicable. |
| ** | William R. Ebsworth and Jane A. Freeman each became a Trustee effective January 1, 2015. |
| *** | Donald Willeke will retire as a Trustee effective December 31, 2015. |
Officers
| | | | | | |
Name and year of birth | | Position held and length of service | | Principal occupations during past five years or longer | | |
Karla M. Rabusch
(Born 1959) | | President, since 2003 | | Executive Vice President of Wells Fargo Bank, N.A. and President of Wells Fargo Funds Management, LLC since 2003. | | |
Nancy Wiser1
(Born 1967) | | Treasurer, since 2012 | | Executive Vice President of Wells Fargo Funds Management, LLC since 2011. Chief Operating Officer and Chief Compliance Officer at LightBox Capital Management LLC, from 2008 to 2011. | | |
C. David Messman
(Born 1960) | | Secretary, since 2000; Chief Legal Officer, since 2003 | | Senior Vice President and Secretary of Wells Fargo Funds Management, LLC since 2001. Assistant General Counsel of Wells Fargo Bank, N.A. since 2013 and Vice President and Managing Counsel of Wells Fargo Bank N.A. from 1996 to 2013. | | |
Debra Ann Early
(Born 1964) | | Chief Compliance Officer, since 2007 | | Executive Vice President of Wells Fargo Funds Management, LLC since 2014, Senior Vice President and Chief Compliance Officer from 2007 to 2014. | | |
David Berardi
(Born 1975) | | Assistant Treasurer, since 2009 | | Vice President of Wells Fargo Funds Management, LLC since 2009. Vice President of Evergreen Investment Management Company, LLC from 2008 to 2010. Manager of Fund Reporting and Control for Evergreen Investment Management Company, LLC from 2004 to 2010. | | |
Jeremy DePalma1
(Born 1974) | | Assistant Treasurer, since 2009 | | Senior Vice President of Wells Fargo Funds Management, LLC since 2009. Senior Vice President of Evergreen Investment Management Company, LLC from 2008 to 2010 and head of the Fund Reporting and Control Team within Fund Fund Administration from 2005 to 2010. | | |
| 1 | Nancy Wiser acts as Treasurer of 72 funds in the Fund Complex. Jeremy DePalma acts as Treasurer of 72 funds and Assistant Treasurer of 72 funds in the Fund Complex. |
| 2 | The Statement of Additional Information includes additional information about the Trustees and is available, without charge, upon request, by calling 1-800-222-8222 or by visiting the website at wellsfargofunds.com. |
| | | | | | |
| Other information (unaudited) | | Wells Fargo Strategic Income Fund | | | 37 | |
BOARD CONSIDERATION OF INVESTMENT ADVISORY, INVESTMENT MANAGEMENT AND SUB-ADVISORY AGREEMENTS:
Under the Investment Company Act of 1940 (the “1940 Act”), the Board of Trustees (the “Board”) of Wells Fargo Funds Trust (the “Trust”) must determine annually whether to approve the continuation of the Trust’s investment advisory and sub-advisory agreements. In this regard, at an in-person meeting held on May 19-20, 2015 (the “Meeting”), the Board, all the members of which have no direct or indirect interest in the investment advisory and sub-advisory agreements and are not “interested persons” of the Trust, as defined in the 1940 Act (the “Independent Trustees”), reviewed and approved for Wells Fargo Advantage Strategic Income Fund (the “Fund”): (i) an investment advisory agreement (the “Advisory Agreement”) with Wells Fargo Funds Management, LLC (“Funds Management”); (ii) an investment management agreement (the “Management Agreement”) with Funds Management; (iii) an investment sub-advisory agreement with Wells Capital Management Incorporated (“WellsCap”), an affiliate of Funds Management; and (iv) an investment sub-advisory agreement with First International Advisors, LLC (“FIA”), an affiliate of Funds Management. The Management Agreement combines the terms of the Advisory Agreement with the terms of the Fund’s Amended and Restated Administration Agreement (the “Administration Agreement”) applicable to Fund-level administrative services. The sub-advisory agreements with WellsCap and FIA (the “Sub-Advisers” are collectively referred to as the Sub-Advisory Agreements, and the Advisory Agreement, the Management Agreement, and the Sub-Advisory Agreements are collectively referred to as the “Advisory Agreements.”
At the Meeting, the Board considered the factors and reached the conclusions described below relating to the selection of Funds Management and the Sub-Advisers and the approval of the Advisory Agreements. Prior to the Meeting, including at an in-person meeting in March 2015, the Trustees conferred extensively among themselves and with representatives of Funds Management about these matters. Also, the Board has adopted a team-based approach, with each team consisting of a sub-set of Trustees, to assist the full Board in the discharge of its duties in reviewing performance and other matters throughout the year. The Independent Trustees were assisted in their evaluation of the Advisory Agreements by independent legal counsel, from whom they received separate legal advice and with whom they met separately.
In providing information to the Board, Funds Management and the Sub-Advisers were guided by a detailed set of requests for information submitted to them by independent legal counsel on behalf of the Independent Trustees at the start of the Board’s annual contract renewal process earlier in 2015. In considering and approving the Advisory Agreements, the Trustees considered the information they believed relevant, including but not limited to the information discussed below. The Board considered not only the specific information presented in connection with the Meeting, but also the knowledge gained over time through interaction with Funds Management and the Sub-Advisers about various topics. In this regard, the Board reviewed reports of Funds Management at each of its quarterly meetings, which included, among other things, portfolio reviews and performance reports. In addition, the Board and the teams mentioned above confer with portfolio managers at various times throughout the year. The Board did not identify any particular information or consideration that was all-important or controlling, and each individual Trustee may have attributed different weights to various factors.
After its deliberations, the Board unanimously approved the continuation of the Advisory Agreement for the period from June 1, 2015 through June 30, 2015, approved the Management Agreement for the period from July 1, 2015 through May 31, 2016, and approved the continuation of each of the Sub-Advisory Agreements for a one-year term through May 31, 2016. The Board also determined that the compensation payable to Funds Management and the Sub-Advisers under each of the Advisory Agreements was reasonable. The Board considered the approval of the Advisory Agreements for the Fund as part of its consideration of agreements for funds across the complex, but its approvals were made on a fund-by-fund basis. The following summarizes a number of important, but not necessarily all, factors considered by the Board in support of its approvals.
Nature, extent and quality of services
The Board received and considered various information regarding the nature, extent and quality of services provided to the Fund by Funds Management and the Sub-Advisers under the Advisory Agreements. This information included, among other things, a summary of the background and experience of senior management of Funds Management, and the qualifications, background, tenure and responsibilities of each of the portfolio managers primarily responsible for the day-to-day portfolio management of the Fund. The Board noted that the services to be provided to the Fund pursuant to the Management Agreement combined the advisory services previously provided to the Fund pursuant to the Fund’s Advisory Agreement with the Fund-level administrative services previously provided to the Fund pursuant to the Fund’s Administration Agreement. The Board received a representation from Funds Management that combining these services would not result in any change to the nature or level of services provided by Funds Management to the Fund.
| | | | |
| 38 | | Wells Fargo Strategic Income Fund | | Other information (unaudited) |
The Board evaluated the ability of Funds Management and the Sub-Advisers to attract and retain qualified investment professionals, including research, advisory and supervisory personnel. The Board further considered the compliance programs and compliance records of Funds Management and the Sub-Advisers. In addition, the Board took into account the full range of services provided to the Fund by Funds Management and its affiliates.
Fund performance and expenses
The Board considered the performance results for the Fund through the period ended March 31, 2015. The Board considered these results in comparison to the performance of funds in a universe that was determined by Lipper Inc. (“Lipper”) to be similar to the Fund (the “Universe”), and in comparison to the Fund’s benchmark index and to other comparative data. Lipper is an independent provider of investment company data. The Board received a description of the methodology used by Lipper to select the mutual funds in the performance Universe. The Board noted the limited operating history of the Fund, which commenced operations in 2013. The Board noted that the performance of the Fund (Administrator Class) was lower than the average performance of the Universe for the one-year period under review and for the first quarter 2015. The Board also noted that the performance of the Fund was lower than its benchmark, the Barclays U.S. Universal Bond Index, for the one-year period under review and for the first quarter 2015. The Board also noted that the Fund experienced a portfolio manager change in 2015.
The Board also received and considered information regarding the Fund’s net operating expense ratios and their various components, including actual management fees (which reflect fee waivers, if any, and include advisory, administration and transfer agent fees), custodian and other non-management fees, and Rule 12b-1 and non-Rule 12b-1 service fees. The Board considered these ratios in comparison to the median ratios of funds in class-specific expense groups that were determined by Lipper to be similar to the Fund (the “Groups”). The Board received a description of the methodology used by Lipper to select the mutual funds in the expense Groups and an explanation of how funds comprising expense groups and their expense ratios may vary from year-to-year. Based on the Lipper reports, the Board noted that the net operating expense ratios of the Fund were lower than the median net operating expense ratios of the expense Groups.
The Board took into account the Fund performance and expense information provided to it among the factors considered in deciding to re-approve the Advisory Agreement and Sub-Advisory Agreements and approve the Management Agreement.
Investment advisory and sub-advisory fee rates
The Board reviewed and considered the contractual investment advisory fee rates that are payable by the Fund to Funds Management for investment advisory services (the “Advisory Agreement Rates”), both on a stand-alone basis and on a combined basis with the Fund’s fund-level and class-level contractual administration fee rates (the “Management Rates”). The Board noted that the Management Rates include transfer agency and sub-transfer agency costs. The Board also noted that the fee rate to be paid by the Fund under the Management Agreement will incorporate the advisory fee and Fund-level administration fee previously payable separately by the Fund under the Fund’s Advisory Agreement and Administration Agreement with Funds Management. The Board also reviewed and considered the contractual investment sub-advisory fee rates that are payable by Funds Management to the Sub-Advisers for investment sub-advisory services (the “Sub-Advisory Agreement Rates”).
Among other information reviewed by the Board was a comparison of the Management Rates of the Fund with those of other funds in the expense Groups at a common asset level. The Board noted that the Management Rates of the Fund were lower than the average rates for the Fund’s expense Groups for all share classes.
The Board also received and considered information about the portion of the total advisory fee that was retained by Funds Management after payment of the fee to the Sub-Advisers for sub-advisory services. In assessing the reasonableness of this amount, the Board received and evaluated information about the nature and extent of responsibilities retained and risks assumed by Funds Management and not delegated to or assumed by the Sub-Advisers, and about Funds Management’s on-going oversight services. However, given the affiliation between Funds Management and the Sub-Advisers, the Board ascribed limited relevance to the allocation of the advisory fee between them.
The Board also received and considered information about the nature and extent of services offered and fee rates charged by Funds Management and the Sub-Advisers to other types of clients with investment strategies similar to those of the Fund. In this regard, the Board received information about the significantly greater scope of services, and compliance, reporting and other legal burdens and risks of managing mutual funds compared with those associated with managing assets of non-mutual fund clients such as collective funds or institutional separate accounts.
| | | | | | |
| Other information (unaudited) | | Wells Fargo Strategic Income Fund | | | 39 | |
Based on its consideration of the factors and information it deemed relevant, including those described here, the Board determined that the compensation payable to Funds Management under the Management Agreement and Advisory Agreement and to the Sub-Advisers under the Sub-Advisory Agreements was reasonable, in light of the services covered by the Advisory Agreements.
Profitability
The Board received and considered information concerning the profitability of Funds Management, as well as the profitability of Wells Fargo as a whole, from providing services to the Fund and the fund family as a whole. The Board also received and considered information concerning the profitability of the Sub-Advisers from providing services to the fund family as a whole, noting that the Sub-Advisers’ profitability information with respect to providing services to the Fund was subsumed in the Wells Fargo profitability analysis.
Funds Management reported on the methodologies and estimates used in calculating profitability. Among other things, the Board noted that the levels of profitability reported on a fund-by-fund basis varied widely, depending on factors such as the size and type of fund. Based on its review, the Board did not deem the profits reported by Funds Management or Wells Fargo from its services to the Fund to be at a level that would prevent it from approving the continuation of the Advisory Agreements.
Economies of scale
With respect to possible economies of scale, the Board noted the existence of breakpoints in the Fund’s advisory and management fee structures, and the Fund’s administration fee structure, which operate generally to reduce the Fund’s expense ratios as the Fund grows in size. It considered that, for a small fund or a fund that shrinks in size, breakpoints conversely can result in higher fee levels. The Board also considered that fee waiver and expense reimbursement arrangements and competitive fee rates at the outset are means of sharing potential economies of scale with shareholders of the Fund and the fund family as a whole. The Board considered Funds Management’s view that any analyses of potential economies of scale in managing a particular fund are inherently limited in light of the joint and common costs and investments that Funds Management incurs across the fund family as a whole.
The Board concluded that the Fund’s fee and expense arrangements, including contractual breakpoints, constituted a reasonable approach to sharing potential economies of scale with the Fund and its shareholders.
Other benefits to Funds Management and the Sub-Advisers
The Board received and considered information regarding potential “fall-out” or ancillary benefits received by Funds Management and its affiliates, including the Sub-Advisers, as a result of their relationships with the Fund. Ancillary benefits could include, among others, benefits directly attributable to other relationships with the Fund and benefits potentially derived from an increase in Funds Management’s and the Sub-Advisers’ business as a result of their relationships with the Fund. The Board noted that various affiliates of Funds Management may receive distribution-related fees, shareholder servicing payments and sub-transfer agency fees in respect of shares sold or held through them and services provided.
The Board also reviewed information about soft dollar credits earned and utilized by the WellsCap, fees earned by Funds Management and WellsCap from managing a private investment vehicle for the fund family’s securities lending collateral and commissions earned by an affiliated broker from portfolio transactions.
Based on its consideration of the factors and information it deemed relevant, including those described here, the Board did not find that any ancillary benefits received by Funds Management and its affiliates, including the Sub-Advisers, were unreasonable.
Conclusion
At the Meeting, after considering the above-described factors and based on its deliberations and its evaluation of the information described above, the Board unanimously approved the continuation of the Advisory Agreement for the period from June 1, 2015 through June 30, 2015, approved the Management Agreement for the period from July 1, 2015 through May 31, 2016, and approved the continuation of each of the Sub-Advisory Agreements for a one-year term through May 31, 2016. The Board also determined that the compensation payable to Funds Management and the Sub-Advisers under each of the Advisory Agreements was reasonable.
| | | | |
| 40 | | Wells Fargo Strategic Income Fund | | List of abbreviations |
The following is a list of common abbreviations for terms and entities that may have appeared in this report.
| ACA | — ACA Financial Guaranty Corporation |
| ADR | — American depositary receipt |
| ADS | — American depositary shares |
| AGC | — Assured Guaranty Corporation |
| AGM | — Assured Guaranty Municipal |
| Ambac | — Ambac Financial Group Incorporated |
| AMT | — Alternative minimum tax |
| BAN | — Bond anticipation notes |
| BHAC | — Berkshire Hathaway Assurance Corporation |
| CAB | — Capital appreciation bond |
| CCAB | — Convertible capital appreciation bond |
| CDA | — Community Development Authority |
| CDO | — Collateralized debt obligation |
| DRIVER | — Derivative inverse tax-exempt receipts |
| DW&P | — Department of Water & Power |
| DWR | — Department of Water Resources |
| ECFA | — Educational & Cultural Facilities Authority |
| EDA | — Economic Development Authority |
| EDFA | — Economic Development Finance Authority |
| ETF | — Exchange-traded fund |
| FDIC | — Federal Deposit Insurance Corporation |
| FFCB | — Federal Farm Credit Banks |
| FGIC | — Financial Guaranty Insurance Corporation |
| FHA | — Federal Housing Administration |
| FHLB | — Federal Home Loan Bank |
| FHLMC | — Federal Home Loan Mortgage Corporation |
| FICO | — The Financing Corporation |
| FNMA | — Federal National Mortgage Association |
| GDR | — Global depositary receipt |
| GNMA | — Government National Mortgage Association |
| HCFR | — Healthcare facilities revenue |
| HEFA | — Health & Educational Facilities Authority |
| HEFAR | — Higher education facilities authority revenue |
| HFA | — Housing Finance Authority |
| HFFA | — Health Facilities Financing Authority |
| HUD | — Department of Housing and Urban Development |
| IDA | — Industrial Development Authority |
| IDAG | — Industrial Development Agency |
| KRW | — Republic of Korea won |
| LIBOR | — London Interbank Offered Rate |
| LIFER | — Long Inverse Floating Exempt Receipts |
| LLC | — Limited liability company |
| LLLP | — Limited liability limited partnership |
| LLP | — Limited liability partnership |
| MBIA | — Municipal Bond Insurance Association |
| MFHR | — Multifamily housing revenue |
| MSTR | — Municipal securities trust receipts |
| MUD | — Municipal Utility District |
| National | — National Public Finance Guarantee Corporation |
| PCFA | — Pollution Control Financing Authority |
| PCL | — Public Company Limited |
| PCR | — Pollution control revenue |
| PFA | — Public Finance Authority |
| PFFA | — Public Facilities Financing Authority |
| PFOTER | — Puttable floating option tax-exempt receipts |
| plc | — Public limited company |
| PUTTER | — Puttable tax-exempt receipts |
| R&D | — Research & development |
| Radian | — Radian Asset Assurance |
| RAN | — Revenue anticipation notes |
| RDA | — Redevelopment Authority |
| RDFA | — Redevelopment Finance Authority |
| REIT | — Real estate investment trust |
| ROC | — Reset option certificates |
| SAVRS | — Select auction variable rate securities |
| SBA | — Small Business Authority |
| SDR | — Swedish depositary receipt |
| SFHR | — Single-family housing revenue |
| SFMR | — Single-family mortgage revenue |
| SPA | — Standby purchase agreement |
| SPDR | — Standard & Poor’s Depositary Receipts |
| SPEAR | — Short Puttable Exempt Adjustable Receipts |
| STRIPS | — Separate trading of registered interest and |
| TAN | — Tax anticipation notes |
| TIPS | — Treasury inflation-protected securities |
| TRAN | — Tax revenue anticipation notes |
| TTFA | — Transportation Trust Fund Authority |
| TVA | — Tennessee Valley Authority |

For more information
More information about Wells Fargo Funds is available free upon request. To obtain literature, please write, email, visit the Fund’s website, or call:
Wells Fargo Funds
P.O. Box 8266
Boston, MA 02266-8266
Email: wfaf@wellsfargo.com
Website: wellsfargofunds.com
Individual investors: 1-800-222-8222
Retail investment professionals: 1-888-877-9275
Institutional investment professionals: 1-866-765-0778
This report and the financial statements contained herein are submitted for the general information of the shareholders of Wells Fargo Funds. If this report is used for promotional purposes, distribution of the report must be accompanied or preceded by a current prospectus. Before investing, please consider the investment objectives, risks, charges, and expenses of the investment. For a current prospectus and, if available, a summary prospectus, containing this information, call 1-800-222-8222 or visit the Fund’s website at wellsfargofunds.com. Read the prospectus carefully before you invest or send money.
Wells Fargo Funds Management, LLC, a wholly owned subsidiary of Wells Fargo & Company, provides investment advisory and administrative services for Wells Fargo Funds. Other affiliates of Wells Fargo & Company provide subadvisory and other services for the Funds. The Funds are distributed by Wells Fargo Funds Distributor, LLC, Member FINRA, an affiliate of Wells Fargo & Company.
NOT FDIC INSURED ¡ NO BANK GUARANTEE ¡ MAY LOSE VALUE
© 2015 Wells Fargo Funds Management, LLC. All rights reserved.
| | |
 | | 238504 12-15 A263/AR263 10-15 |
Annual Report
October 31, 2015

Wells Fargo Asia Pacific Fund


Reduce clutter. Save trees.
Sign up for electronic delivery of prospectuses and shareholder reports at wellsfargo.com/advantagedelivery
Contents
The views expressed and any forward-looking statements are as of October 31, 2015, unless otherwise noted, and are those of the Fund managers and/or Wells Fargo Funds Management, LLC. Discussions of individual securities, or the markets generally, or any Wells Fargo Fund are not intended as individual recommendations. Future events or results may vary significantly from those expressed in any forward-looking statements. The views expressed are subject to change at any time in response to changing circumstances in the market. Wells Fargo Funds Management, LLC and the Fund disclaim any obligation to publicly update or revise any views expressed or forward-looking statements.
NOT FDIC INSURED ¡ NO BANK GUARANTEE ¡ MAY LOSE VALUE
| | | | |
| 2 | | Wells Fargo Asia Pacific Fund | | Letter to shareholders (unaudited) |

Karla M. Rabusch
President
Wells Fargo Funds
Economic data continued to indicate that the U.S. economy was in a sluggish but consistent recovery.
Other major central banks, including the European Central Bank and the Bank of Japan, also maintained easy monetary policy in order to support their respective economies.
Dear Valued Shareholder:
We are pleased to offer you this annual report for the Wells Fargo Asia Pacific Fund for the 12-month period that ended October 31, 2015. The period was marked by continued low global interest rates and sluggish economic recoveries in developed markets. However, the expectation that the U.S. Federal Reserve (Fed) would soon raise its key interest rate, combined with signs of further quantitative easing from other central banks, depressed the prices of international assets for U.S. dollar-based investors.
The Fed showed signs of raising its key rate, but other central banks continued to maintain an easy monetary policy.
Economic data continued to indicate that the U.S. economy was in a sluggish but consistent recovery. For example, the U.S. unemployment rate eased from 5.8% at the beginning of the reporting period (November 2014) to 5.0% at the end (October 2015). Throughout the reporting period, the Federal Open Market Committee (FOMC), which is the Fed’s monetary policymaking body, kept its key interest rate effectively at zero.
As the period progressed, various comments by Fed Chair Janet Yellen led investors to believe that the FOMC would soon raise its key federal funds rate. The FOMC remained on hold at its September 2015 meeting, however, citing concerns about a weaker global economy and subdued U.S. inflation. The FOMC’s decision caused some uncertainty, but by the end of the period, most investors expected a modest Fed rate hike in late 2015 or early 2016.
In contrast, the People’s Bank of China (PBOC) continued to take several steps to support the slowing Chinese economy. In October 2015, the PBOC cut its benchmark one-year lending and deposit rates for the sixth time since November 2014 and trimmed the percentage of deposits that large banks need to hold as reserves for the fourth time. The moves were aimed at supporting the economy by encouraging lending. The PBOC’s actions tended to put pressure on the yuan versus foreign currencies, pressure that was only reinforced when the PBOC officially devalued the currency in August.
Other major central banks, including the European Central Bank and the Bank of Japan, also maintained easy monetary policy in order to support their respective economies. The difference in policy between the Fed and other central banks led the U.S. dollar to appreciate against most major currencies, including most emerging markets currencies.
The year was a difficult one for emerging markets investing, marked by slower growth in China and a stronger dollar that depressed the returns of international assets.
Emerging markets faced a number of internal and external headwinds during the past 12 months. Internal factors included not only an economic slowdown in China—with the country’s annual growth rate dipping below 7% for the first time since 2009—but also persistent low prices for oil, natural gas, and industrial metals such as copper. Low oil and commodity prices weakened the economies of commodity producers, including Brazil, which also grappled with a political scandal involving corruption at its state-owned oil firm. Among external factors, global investors continued to worry about the timing of the first rate hike in the U.S. since 2006. The prospect for a U.S. rate hike led to a stronger U.S. dollar; given that many emerging markets have issued U.S. dollar-denominated debt, dollar strength could make it more difficult for emerging countries to repay their creditors.
| | | | | | |
| Letter to shareholders (unaudited) | | Wells Fargo Asia Pacific Fund | | | 3 | |
As measured in local currency, the Morgan Stanley Capital International (MSCI) Emerging Markets Index (Net)1 lost 3.47% for the 12-month period, reflecting the headwinds in emerging markets. However, in U.S. dollar terms—the relevant return for U.S. dollar-based investors—the index declined 14.53% for the reporting period. This difference in returns highlights the dollar’s strength during the reporting period.
Don’t let short-term uncertainty derail long-term investment goals.
Periods of uncertainty can present challenges, but experience has taught us that maintaining long-term investment goals can be an effective way to plan for the future. To help you create a sound strategy based on your personal goals and risk tolerance, Wells Fargo Funds offers more than 100 mutual funds and other investments spanning a wide range of asset classes and investment styles. Although diversification cannot guarantee an investment profit or prevent losses, we believe it can be an effective way to manage investment risk and potentially smooth out overall portfolio performance. We encourage investors to know their investments and to understand that appropriate levels of risk-taking may unlock opportunities.
Thank you for choosing to invest with Wells Fargo Funds. We appreciate your confidence in us and remain committed to helping you meet your financial needs.
Sincerely,

Karla M. Rabusch
President
Wells Fargo Funds
Notice to shareholders
At a meeting held August 11-12, 2015, the Board of Trustees of the Fund approved a change in the name of the Fund whereby the word “Advantage” was removed from its name, effective December 15, 2015.
For current information about your fund investments, contact your investment professional, visit our website at wellsfargofunds.com, or call us directly at 1-800-222-8222. We are available 24 hours a day, 7 days a week.
| 1 | The Morgan Stanley Capital International (MSCI) Emerging Markets Index (Net) is a free-float-adjusted market-capitalization-weighted index that is designed to measure the equity market performance of emerging markets. The MSCI Emerging Markets Index (Net) consists of the following 23 emerging markets country indexes: Brazil, Chile, China, Colombia, Czech Republic, Egypt, Greece, Hungary, India, Indonesia, Korea, Malaysia, Mexico, Peru, the Philippines, Poland, Qatar, Russia, South Africa, Taiwan, Thailand, Turkey, and United Arab Emirates. You cannot invest directly in an index. Source: MSCI. MSCI makes no express or implied warranties or representations and shall have no liability whatsoever with respect to any MSCI data contained herein. The MSCI data may not be further redistributed or used as a basis for other indexes or any securities or financial products. This report is not approved, reviewed, or produced by MSCI. |
| | | | |
| 4 | | Wells Fargo Asia Pacific Fund | | Performance highlights (unaudited) |
Investment objective
The Fund seeks long-term total capital appreciation.
Manager
Wells Fargo Funds Management, LLC
Subadviser
Wells Capital Management Incorporated
Portfolio managers
Anthony L.T. Cragg
Alison Shimada
Average annual total returns (%) as of October 31, 20151
| | | | | | | | | | | | | | | | | | | | | | | | | | | | | | | | | | |
| | | | | Including sales charge | | | Excluding sales charge | | | Expense ratios2 (%) | |
| | | Inception date | | 1 year | | | 5 year | | | 10 year | | | 1 year | | | 5 year | | | 10 year | | | Gross | | | Net3 | |
| Class A (WFAAX) | | 7-31-2007 | | | (6.62 | ) | | | 3.65 | | | | 5.20 | | | | (0.95 | ) | | | 4.89 | | | | 5.83 | | | | 1.67 | | | | 1.61 | |
| Class C (WFCAX) | | 7-31-2007 | | | (2.71 | ) | | | 4.11 | | | | 5.03 | | | | (1.71 | ) | | | 4.11 | | | | 5.03 | | | | 2.42 | | | | 2.36 | |
| Administrator Class (WFADX) | | 7-30-2010 | | | – | | | | – | | | | – | | | | (0.83 | ) | | | 5.11 | | | | 5.93 | | | | 1.59 | | | | 1.41 | |
| Institutional Class (WFPIX) | | 7-30-2010 | | | – | | | | – | | | | – | | | | (0.65 | ) | | | 5.27 | | | | 6.02 | | | | 1.34 | | | | 1.26 | |
| MSCI AC Asia Pacific Index (Net)4 | | – | | | – | | | | – | | | | – | | | | (2.91 | ) | | | 3.36 | | | | 4.47 | | | | – | | | | – | |
Figures quoted represent past performance, which is no guarantee of future results, and do not reflect taxes that a shareholder may pay on fund distributions or the redemption of fund shares. Investment return and principal value of an investment will fluctuate so that an investor’s shares, when redeemed, may be worth more or less than their original cost. Performance shown without sales charges would be lower if sales charges were reflected. Current performance may be lower or higher than the performance data quoted, which assumes the reinvestment of dividends and capital gains. Current month-end performance is available on the Fund’s website, wellsfargofunds.com.
Index returns do not include transaction costs associated with buying and selling securities, any mutual fund fees or expenses, or any taxes. It is not possible to invest directly in an index.
For Class A shares, the maximum front-end sales charge is 5.75%. For Class C shares, the maximum contingent deferred sales charge is 1.00%. Performance including a contingent deferred sales charge assumes the sales charge for the corresponding time period. Administrator Class and Institutional Class shares are sold without a front-end sales charge or contingent deferred sales charge.
Stock values fluctuate in response to the activities of individual companies and general market and economic conditions. Foreign investments are especially volatile and can rise or fall dramatically due to differences in the political and economic conditions of the host country. These risks are generally intensified in emerging markets. The use of derivatives may reduce returns and/or increase volatility. Certain investment strategies tend to increase the total risk of an investment (relative to the broader market). The Fund is exposed to geographic risk and smaller-company securities risk. Consult the Fund’s prospectus for additional information on these and other risks.
Please see footnotes on page 5.
| | | | | | |
| Performance highlights (unaudited) | | Wells Fargo Asia Pacific Fund | | | 5 | |
|
| Growth of $10,000 investment as of October 31, 20155 |
|
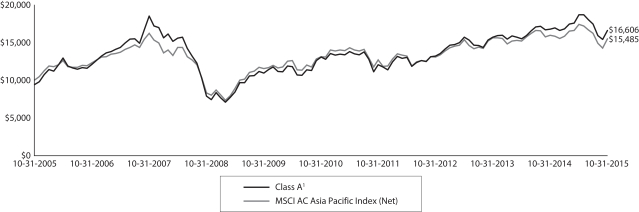 |
| 1 | Historical performance shown for the Class A shares prior to its inception reflects the performance of the former Investor Class shares, and includes the higher expenses applicable to the former Investor Class shares. If these expenses has not been included, returns would be higher. Historical performance shown for the Class C shares prior to its inception is based on the performance of the former Investor Class shares, and has been adjusted to reflect the higher expenses applicable to Class C shares. Historical performance shown for Administrator and Institutional Class shares prior to their inception reflects the performance of Class A shares, and includes the higher expenses applicable to Class A shares. If these expenses had not been included, returns would be higher. |
| 2 | Reflects the expense ratios as stated in the most recent prospectuses, which include the impact of 0.01% in acquired fund fees and expenses. The expense ratios shown are subject to change and may differ from the annualized expense ratios shown in the financial highlights of this report, which do not include acquired fund fees and expenses. |
| 3 | The manager has contractually committed through February 29, 2016, to waive fees and/or reimburse expenses to the extent necessary to cap the Fund’s Total Annual Operating Expenses After Fee Waiver at 1.60% for Class A, 2.35% for Class C, 1.40% for Administrator Class, and 1.25% for Institutional Class. After this time, the cap may be increased or the commitment to maintain the cap may be terminated only with the approval of the Board of Trustees. Brokerage commissions, stamp duty fees, interest, taxes, acquired fees and expenses, and extraordinary expenses are excluded from the cap. Without this cap, the Fund’s returns would have been lower. |
| 4 | The Morgan Stanley Capital International (MSCI) All Country (AC) Asia Pacific Index (Net) is a free-float-adjusted market-capitalization-weighted index that is designed to measure the equity market performance of the developed and emerging markets in the Pacific region. The MSCI AC Asia Pacific Index (Net) consists of the following 12 developed and emerging markets countries: Australia, China, Hong Kong, Indonesia, Japan, Korea, Malaysia, New Zealand, the Philippines, Singapore, Taiwan, and Thailand. You cannot invest directly in an index. Source: MSCI. MSCI makes no express or implied warranties or representations and shall have no liability whatsoever with respect to any MSCI data contained herein. The MSCI data may not be further redistributed or used as a basis for other indexes or any securities or financial products. This report is not approved, reviewed, or produced by MSCI. |
| 5 | The chart compares the performance of Class A shares for the most recent ten years with the MSCI AC Asia Pacific Index (Net). The chart assumes a hypothetical investment of $10,000 in Class A shares and reflects all operating expenses and assumes the maximum initial sales charge of 5.75%. |
| 6 | The ten largest holdings, excluding cash and cash equivalents, are calculated based on the value of the investments divided by total net assets of the Fund. Holdings are subject to change and may have changed since the date specified. |
| 7 | Amounts are calculated based on the total long-term investments of the Fund. These amounts are subject to change and may have changed since the date specified. |
| * | This security was not held in the Fund at the end of the reporting period. |
| | | | |
| 6 | | Wells Fargo Asia Pacific Fund | | Performance highlights (unaudited) |
MANAGER’S DISCUSSION
Fund highlights
| n | | The Fund outperformed its benchmark, the MSCI AC Asia Pacific Index (Net) , for the 12-month period that ended October 31, 2015. |
| n | | Overall stock selection contributed to relative returns for the period, led by the industrials and financials sectors. Stock selection in consumer staples and telecommunication services detracted from relative returns. |
| n | | Among countries, strong stock selection helped the Fund’s relative outperformance in China/Hong Kong, Taiwan, and the Philippines. Unfavorable stock selection in Japan, India, and Indonesia detracted from relative performance. |
The Fund outperformed its benchmark during a volatile market.
During the 12-month period, returns in Asian markets fluctuated according to factors that included fears of slowing Chinese growth, the pace of reforms in India and Indonesia, and concerns about the effect of rising interest rates in the United States. From a sector perspective, holdings in the industrials and financials sectors contributed for the reporting period, but stock selection in the consumer staples and telecommunication services sectors detracted.
In the industrials sector, the Fund benefited from investments in airlines such as Japan Airlines Company, Limited, and Air New Zealand Limited and aerospace companies including AviChina Industry & Technology Company, Limited, and Korea Aerospace Industries, Limited. The banking industry was a key driver in the financials sector, with the Fund benefiting from investments in Bank of China Limited while avoiding Australian banks that underperformed. In the consumer staples sector, the Fund’s investments in the tobacco industry detracted, with notable weakness in Indonesia’s clove cigarette manufacturer PT Gudang Garam Tbk.* In telecommunication services, the Fund experienced declines in several wireless telecommunications holdings, including Japan’s SoftBank Group Corporation.
| | | | |
| Ten largest holdings (%) as of October 31, 20156 | |
Resona Holdings Incorporated | | | 2.87 | |
Mitsui Fudosan Company Limited | | | 2.77 | |
Sumitomo Mitsui Trust Holdings Incorporated | | | 2.40 | |
Japan Airlines Company Limited | | | 2.18 | |
China Mobile Limited | | | 1.96 | |
ORIX Corporation | | | 1.91 | |
China Construction Bank H Shares | | | 1.89 | |
Mitsubishi UFJ Financial Group Incorporated | | | 1.83 | |
Industrial & Commercial Bank of China Limited H Shares | | | 1.65 | |
Alibaba Group Holding Limited ADR | | | 1.61 | |
Looking at individual countries, notable areas of success included China/Hong Kong, Australia, and Taiwan. In China/Hong Kong, stock selection in the consumer discretionary and materials sectors was quite strong on a relative basis. The Fund also benefited from an overweight to the country as a whole. In Australia, an average underweight of approximately 9% drove relative outperformance in the worst-performing developed market in the index. In Taiwan, the Fund benefited from positive contributions from holdings in the information technology (IT) and consumer staples sectors. An underweight to Japan coupled with weak stock selection led to relative underperformance in that market. Unfavorable stock selection and portfolio weights also led to relative underperformance in India and Indonesia.
Please see footnotes on page 5.
| | | | | | |
| Performance highlights (unaudited) | | Wells Fargo Asia Pacific Fund | | | 7 | |
|
| Sector distribution as of October 31, 20157 |
|
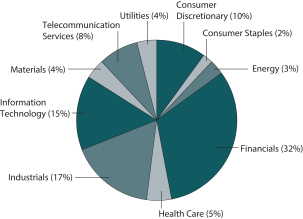 |
|
| Country allocation as of October 31, 20157 |
|
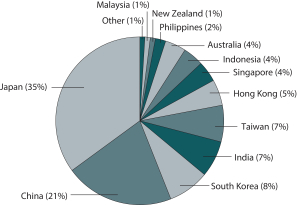
|
Our investment outlook on the Asia Pacific region remains positive.
China has entered into an easing cycle, with further reduction in interest rates and reserve requirement ratios and more targeted quantitative measures most likely in store for the rest of the year. We have become more cautious on China following the government’s poor handling of stock market intervention and of the Tianjin explosions. As we do expect China’s stock market volatility to persist, we will exercise caution with regards to A-share and H-share exposure. (China’s A shares are traded on mainland exchanges, while the H shares are traded in Hong Kong.) The inclusion of China’s A shares in MSCI indexes may well be delayed following the controversial market intervention, but that will not deter us from looking for attractively valued, high-return opportunities in the domestic market. We continue to prefer secular growth sectors, companies that benefit from reform of state-owned enterprises, and companies delivering rising profitability on lower commodity and financing costs.
We are underweight South Korea and are monitoring the two main issues of its currency and the state of its IT sector. We will look for sustainable earnings stories in South Korea in order to selectively increase our exposure. The Indian market remained quite resilient despite a sell-off in the rest of emerging Asia. We see some positive signs in India, such as an easing of inflation and increasing tax receipts. The Indonesian market will likely move in line with government policy actions because government reform remains an important theme in the market. In both India and Indonesia, the sustained decline in the oil price is particularly helpful to government budgets as well as to consumption trends.
In Japan, the economic reforms initiated by Prime Minister Shinzō Abe remain a factor in supporting improving corporate attitudes toward reinvestment. Further catalysts in Japan include strong earnings momentum and corporate governance. In the current environment, we favor exposure to services and materials that boost efficiency as well as services that meet the needs of the aging population. We also like companies that stand to benefit from improved consumption, including tourism, and globally competitive companies that can benefit from a weaker yen. We are selective on stocks that provide value-added services with stable cash flow in New Zealand. In Australia, we are sticking with nonexport and noncommodity businesses. Overall, we expect pockets of strong performance led by north Asia, but selectivity in stocks and countries is crucial.
We maintain our view that while all countries face some sort of challenge, some seem to be fundamentally attractive but others seem to have more fundamentally attractive but others have more serious structural problems. We believe that market corrections allow the markets to clear and reset where necessary. This type of market requires close scrutiny of company fundamentals but also can lead to longer-term opportunities.
Please see footnotes on page 5.
| | | | |
| 8 | | Wells Fargo Asia Pacific Fund | | Fund expenses (unaudited) |
As a shareholder of the Fund, you incur two types of costs: (1) transaction costs, including sales charges (loads) on purchase payments and contingent deferred sales charges (if any) on redemptions and (2) ongoing costs, including management fees, distribution (12b-1) and/or shareholder servicing fees, and other Fund expenses. This example is intended to help you understand your ongoing costs (in dollars) of investing in the Fund and to compare these costs with the ongoing costs of investing in other mutual funds.
The example is based on an investment of $1,000 invested at the beginning of the six-month period and held for the entire period from May 1, 2015 to October 31, 2015.
Actual expenses
The “Actual” line of the table below provides information about actual account values and actual expenses. You may use the information in this line, together with the amount you invested, to estimate the expenses that you paid over the period. Simply divide your account value by $1,000 (for example, an $8,600 account value divided by $1,000 = 8.6), then multiply the result by the number in the “Actual” line under the heading entitled “Expenses paid during period” for your applicable class of shares to estimate the expenses you paid on your account during this period.
Hypothetical example for comparison purposes
The “Hypothetical” line of the table below provides information about hypothetical account values and hypothetical expenses based on the Fund’s actual expense ratio and an assumed rate of return of 5% per year before expenses, which is not the Fund’s actual return. The hypothetical account values and expenses may not be used to estimate the actual ending account balance or expenses you paid for the period. You may use this information to compare the ongoing costs of investing in the Fund and other funds. To do so, compare this 5% hypothetical example with the 5% hypothetical examples that appear in the shareholder reports of the other funds.
Please note that the expenses shown in the table are meant to highlight your ongoing costs only and do not reflect any transactional costs, such as sales charges (loads) and contingent deferred sales charges. Therefore, the “Hypothetical” line of the table is useful in comparing ongoing costs only and will not help you determine the relative total costs of owning different funds. In addition, if these transactional costs were included, your costs would have been higher.
| | | | | | | | | | | | | | | | |
| | | Beginning
account value
5-1-2015 | | | Ending
account value
10-31-2015 | | | Expenses
paid during
the period¹ | | | Net annualized
expense ratio | |
Class A | | | | | | | | | | | | | | | | |
Actual | | $ | 1,000.00 | | | $ | 887.57 | | | $ | 7.61 | | | | 1.60 | % |
Hypothetical (5% return before expenses) | | $ | 1,000.00 | | | $ | 1,017.14 | | | $ | 8.13 | | | | 1.60 | % |
Class C | | | | | | | | | | | | | | | | |
Actual | | $ | 1,000.00 | | | $ | 884.10 | | | $ | 11.16 | | | | 2.35 | % |
Hypothetical (5% return before expenses) | | $ | 1,000.00 | | | $ | 1,013.36 | | | $ | 11.93 | | | | 2.35 | % |
Administrator Class | | | | | | | | | | | | | | | | |
Actual | | $ | 1,000.00 | | | $ | 887.88 | | | $ | 6.66 | | | | 1.40 | % |
Hypothetical (5% return before expenses) | | $ | 1,000.00 | | | $ | 1,018.15 | | | $ | 7.12 | | | | 1.40 | % |
Institutional Class | | | | | | | | | | | | | | | | |
Actual | | $ | 1,000.00 | | | $ | 888.64 | | | $ | 5.95 | | | | 1.25 | % |
Hypothetical (5% return before expenses) | | $ | 1,000.00 | | | $ | 1,018.90 | | | $ | 6.36 | | | | 1.25 | % |
| 1 | Expenses paid is equal to the annualized expense ratio of each class multiplied by the average account value over the period, multiplied by the number of days in the most recent fiscal half-year divided by the number of days in the fiscal year (to reflect the one-half-year period). |
| | | | | | |
| Portfolio of investments—October 31, 2015 | | Wells Fargo Asia Pacific Fund | | | 9 | |
| | | | | | | | | | | | |
| Security name | | | | | | Shares | | | Value | |
| | | | |
Common Stocks: 95.59% | | | | | | | | | | | | |
| | | | |
| Australia: 3.49% | | | | | | | | | | | | |
AMP Limited (Financials, Insurance) | | | | | | | 348,157 | | | $ | 1,412,058 | |
Healthscope Limited (Health Care, Health Care Providers & Services) | | | | | | | 681,600 | | | | 1,304,899 | |
Medibank Private Limited (Financials, Insurance) | | | | | | | 511,627 | | | | 858,328 | |
MYOB Group Limited (Information Technology, Internet Software & Services) † | | | | | | | 676,700 | | | | 1,587,605 | |
Suncorp Group Limited (Financials, Insurance) | | | | | | | 69,300 | | | | 643,766 | |
| | | | |
| | | | | | | | | | | 5,806,656 | |
| | | | | | | | | | | | |
| | | | |
| China: 19.15% | | | | | | | | | | | | |
Alibaba Group Holding Limited ADR (Information Technology, Internet Software & Services) † | | | | | | | 32,000 | | | | 2,682,560 | |
AviChina Industry & Technology Company Limited H Shares (Industrials, Aerospace & Defense) | | | | | | | 975,000 | | | | 794,579 | |
Baidu Incorporated ADR (Information Technology, Internet Software & Services) † | | | | | | | 13,060 | | | | 2,448,358 | |
Bank of China Limited H Shares (Financials, Banks) | | | | | | | 1,380,000 | | | | 650,755 | |
Beijing Enterprises Water Group Limited (Utilities, Water Utilities) | | | | | | | 1,222,000 | | | | 967,850 | |
BYD Company Limited H Shares (Consumer Discretionary, Automobiles) † | | | | | | | 216,500 | | | | 1,346,134 | |
China Construction Bank H Shares (Financials, Banks) | | | | | | | 4,335,000 | | | | 3,141,817 | |
China Life Insurance Company Limited H Shares (Financials, Insurance) | | | | | | | 228,000 | | | | 822,187 | |
China Longyuan Power Group Corporation H Shares (Utilities, Independent Power & Renewable Electricity Producers) | | | | | | | 1,470,000 | | | | 1,343,941 | |
China Mobile Limited (Telecommunication Services, Wireless Telecommunication Services) | | | | | �� | | 271,500 | | | | 3,255,254 | |
China Pacific Insurance H Shares (Financials, Insurance) | | | | | | | 204,400 | | | | 814,206 | |
China Petroleum & Chemical Corporation H Shares (Energy, Oil, Gas & Consumable Fuels) | | | | | | | 1,624,000 | | | | 1,170,651 | |
China State Construction International Holdings Limited (Industrials, Construction & Engineering) | | | | | | | 666,000 | | | | 1,010,588 | |
CRRC Corporation Limited H Shares (Industrials, Machinery) « | | | | | | | 937,000 | | | | 1,191,130 | |
Dalian Wanda Commercial Properties Company Limited H Shares (Financials, Real Estate Management & Development) 144A | | | | | | | 137,000 | | | | 914,361 | |
Huaneng Renewables Corporation Limited H Shares (Utilities, Independent Power & Renewable Electricity Producers) | | | | | | | 4,424,000 | | | | 1,373,884 | |
Industrial & Commercial Bank of China Limited H Shares (Financials, Banks) | | | | | | | 4,315,000 | | | | 2,737,026 | |
PetroChina Company Limited H Shares (Energy, Oil, Gas & Consumable Fuels) | | | | | | | 1,454,000 | | | | 1,138,342 | |
Ping An Insurance (Group) Company of China Limited H Shares (Financials, Insurance) | | | | | | | 281,000 | | | | 1,577,323 | |
Zhuzhou CSR Times Electric Company Limited H Shares (Industrials, Electrical Equipment) | | | | | | | 132,500 | | | | 857,731 | |
Zijin Mining Group Company Limited H Shares (Materials, Metals & Mining) | | | | | | | 2,778,000 | | | | 743,176 | |
ZTE Corporation H Shares (Information Technology, Communications Equipment) | | | | | | | 345,000 | | | | 830,792 | |
| | | | |
| | | | | | | | | | | 31,812,645 | |
| | | | | | | | | | | | |
| | | | |
| Hong Kong: 4.84% | | | | | | | | | | | | |
China Everbright International Limited (Industrials, Commercial Services & Supplies) | | | | | | | 579,000 | | | | 932,405 | |
China Gas Holdings Limited (Utilities, Gas Utilities) | | | | | | | 844,000 | | | | 1,343,240 | |
China Merchants Holdings International Company Limited (Industrials, Transportation Infrastructure) | | | | | | | 230,000 | | | | 763,829 | |
China Overseas Land & Investment Limited (Financials, Real Estate Management & Development) | | | | | | | 696,000 | | | | 2,247,987 | |
China Overseas Property Holding Limited (Financials, Real Estate Management & Development) † | | | | | | | 232,000 | | | | 39,811 | |
China Power International Development Limited (Utilities, Independent Power & Renewable Electricity Producers) | | | | | | | 1,238,000 | | | | 777,998 | |
China Unicom Limited (Telecommunication Services, Diversified Telecommunication Services) | | | | | | | 530,000 | | | | 645,904 | |
COSCO Pacific Limited (Industrials, Transportation Infrastructure) (a) | | | | | | | 992,241 | | | | 1,283,668 | |
| | | | |
| | | | | | | | | | | 8,034,842 | |
| | | | | | | | | | | | |
| | | | |
| India: 7.23% | | | | | | | | | | | | |
Astra Microwave Products Limited (Information Technology, Communications Equipment) | | | | | | | 315,900 | | | | 617,500 | |
Bharti Infratel Limited (Telecommunication Services, Wireless Telecommunication Services) | | | | | | | 136,500 | | | | 811,254 | |
Coal India Limited (Energy, Oil, Gas & Consumable Fuels) | | | | | | | 333,500 | | | | 1,628,865 | |
The accompanying notes are an integral part of these financial statements.
| | | | |
| 10 | | Wells Fargo Asia Pacific Fund | | Portfolio of investments—October 31, 2015 |
| | | | | | | | | | | | |
| Security name | | | | | | Shares | | | Value | |
| | | | |
| India (continued) | | | | | | | | | | | | |
HDFC Bank Limited (Financials, Banks) | | | | | | | 117,100 | | | $ | 1,962,091 | |
Hindalco Industries Limited (Materials, Metals & Mining) | | | | | | | 645,200 | | | | 826,711 | |
Hindustan Zinc Limited (Materials, Metals & Mining) | | | | | | | 348,500 | | | | 836,698 | |
Inox Wind Limited (Industrials, Electrical Equipment) † | | | | | | | 157,300 | | | | 951,542 | |
Larsen & Toubro Limited (Industrials, Construction & Engineering) | | | | | | | 33,400 | | | | 719,840 | |
Reliance Industries Limited (Energy, Oil, Gas & Consumable Fuels) | | | | | | | 64,300 | | | | 931,256 | |
Suzlon Energy Limited (Industrials, Electrical Equipment) † | | | | | | | 3,504,400 | | | | 1,313,872 | |
Voltas Limited (Industrials, Construction & Engineering) | | | | | | | 326,400 | | | | 1,409,502 | |
| | | | |
| | | | | | | | | | | 12,009,131 | |
| | | | | | | | | | | | |
| | | | |
| Indonesia: 4.18% | | | | | | | | | | | | |
PT Bank Rakyat Indonesia Tbk (Financials, Banks) | | | | | | | 1,330,400 | | | | 1,018,229 | |
PT Blue Bird Tbk (Industrials, Road & Rail) | | | | | | | 2,499,700 | | | | 1,053,538 | |
PT Hanjaya Mandala Sampoerna Tbk (Consumer Staples, Tobacco) | | | | | | | 253,500 | | | | 1,701,869 | |
PT Indocement Tunggal Prakarsa Tbk (Materials, Construction Materials) | | | | | | | 582,800 | | | | 762,256 | |
PT Siloam International Hospitals Tbk (Health Care, Health Care Providers & Services) | | | | | | | 926,300 | | | | 736,260 | |
PT Telekomunikasi Indonesia Persero Tbk (Telecommunication Services, Diversified Telecommunication Services) | | | | | | | 8,509,800 | | | | 1,669,517 | |
| | | | |
| | | | | | | | | | | 6,941,669 | |
| | | | | | | | | | | | |
| | | | |
| Japan: 34.86% | | | | | | | | | | | | |
ASICS Corporation (Consumer Discretionary, Textiles, Apparel & Luxury Goods) | | | | | | | 33,000 | | | | 911,483 | |
Bridgestone Corporation (Consumer Discretionary, Auto Components) | | | | | | | 52,700 | | | | 1,932,556 | |
FANUC Corporation (Industrials, Machinery) | | | | | | | 6,500 | | | | 1,146,869 | |
FUJIFILM Holdings Corporation (Information Technology, Technology Hardware, Storage & Peripherals) | | | | | | | 40,700 | | | | 1,623,471 | |
Hitachi Limited (Information Technology, Electronic Equipment, Instruments & Components) | | | | | | | 335,000 | | | | 1,932,544 | |
Isuzu Motors Limited (Consumer Discretionary, Automobiles) | | | | | | | 135,700 | | | | 1,584,911 | |
Japan Airlines Company Limited (Industrials, Airlines) | | | | | | | 96,100 | | | | 3,620,388 | |
Japan Hotel REIT Investment Corporation (Financials, REITs) | | | | | | | 2,000 | | | | 1,389,113 | |
Japan Post Holdings Company Limited (Financials, Insurance) (a) | | | | | | | 60,900 | | | | 812,537 | |
Japan Rental Housing Investment Incorporated (Financials, REITs) | | | | | | | 2,400 | | | | 1,605,520 | |
Kawasaki Heavy Industries Limited (Industrials, Machinery) | | | | | | | 406,000 | | | | 1,629,598 | |
Kubota Corporation (Industrials, Machinery) | | | | | | | 129,000 | | | | 1,999,687 | |
M3 Incorporated (Health Care, Health Care Technology) | | | | | | | 54,400 | | | | 1,054,388 | |
Matsumotokiyoshi Holdings Company Limited (Consumer Staples, Food & Staples Retailing) | | | | | | | 36,700 | | | | 1,571,355 | |
Mitsubishi Electric Corporation (Industrials, Electrical Equipment) | | | | | | | 137,000 | | | | 1,426,819 | |
Mitsubishi UFJ Financial Group Incorporated (Financials, Banks) | | | | | | | 469,400 | | | | 3,035,859 | |
Mitsui Fudosan Company Limited (Financials, Real Estate Management & Development) | | | | | | | 169,000 | | | | 4,599,106 | |
Nagoya Railroad Company Limited (Industrials, Road & Rail) | | | | | | | 504,000 | | | | 2,082,929 | |
NTT DOCOMO Incorporated (Telecommunication Services, Wireless Telecommunication Services) | | | | | | | 55,100 | | | | 1,073,099 | |
ORIX Corporation (Financials, Diversified Financial Services) | | | | | | | 216,800 | | | | 3,166,097 | |
Otsuka Corporation (Information Technology, IT Services) | | | | | | | 23,200 | | | | 1,121,483 | |
Panasonic Corporation (Consumer Discretionary, Household Durables) | | | | | | | 139,700 | | | | 1,639,064 | |
Resona Holdings Incorporated (Financials, Banks) | | | | | | | 900,600 | | | | 4,765,366 | |
Sekisui House Limited (Consumer Discretionary, Household Durables) | | | | | | | 141,700 | | | | 2,358,797 | |
SoftBank Group Corporation (Telecommunication Services, Wireless Telecommunication Services) | | | | | | | 36,800 | | | | 2,061,827 | |
Sumitomo Mitsui Trust Holdings Incorporated (Financials, Banks) | | | | | | | 1,038,000 | | | | 3,984,412 | |
Toyota Motor Corporation (Consumer Discretionary, Automobiles) | | | | | | | 36,900 | | | | 2,260,657 | |
Tsukui Corporation (Health Care, Health Care Providers & Services) | | | | | | | 142,000 | | | | 1,525,012 | |
| | | | |
| | | | | | | | | | | 57,914,947 | |
| | | | | | | | | | | | |
The accompanying notes are an integral part of these financial statements.
| | | | | | |
| Portfolio of investments—October 31, 2015 | | Wells Fargo Asia Pacific Fund | | | 11 | |
| | | | | | | | | | | | |
| Security name | | | | | | Shares | | | Value | |
| | | | |
| Malaysia: 1.19% | | | | | | | | | | | | |
IHH Healthcare Bhd (Health Care, Health Care Providers & Services) | | | | | | | 1,282,600 | | | $ | 1,884,735 | |
Media Prima Berhad (Consumer Discretionary, Media) | | | | | | | 283,700 | | | | 91,793 | |
| | | | |
| | | | | | | | | | | 1,976,528 | |
| | | | | | | | | | | | |
| | | | |
| New Zealand: 1.26% | | | | | | | | | | | | |
Air New Zealand Limited (Industrials, Airlines) | | | | | | | 491,200 | | | | 966,211 | |
SKYCITY Entertainment Group Limited (Consumer Discretionary, Hotels, Restaurants & Leisure) | | | | | | | 415,800 | | | | 1,127,944 | |
| | | | |
| | | | | | | | | | | 2,094,155 | |
| | | | | | | | | | | | |
| | | | |
| Philippines: 1.57% | | | | | | | | | | | | |
ABS-CBN Holdings Corporation (Consumer Discretionary, Media) | | | | | | | 656,550 | | | | 945,461 | |
Metro Pacific Investments Corporation (Financials, Diversified Financial Services) | | | | | | | 15,024,600 | | | | 1,669,922 | |
| | | | |
| | | | | | | | | | | 2,615,383 | |
| | | | | | | | | | | | |
| | | | |
| Singapore: 4.20% | | | | | | | | | | | | |
City Developments Limited (Financials, Real Estate Management & Development) | | | | | | | 131,000 | | | | 741,370 | |
First Resources Limited (Consumer Staples, Food Products) | | | | | | | 649,000 | | | | 869,379 | |
Mapletree Commercial Trust (Financials, REITs) | | | | | | | 1,311,600 | | | | 1,281,544 | |
Singapore Post Limited (Industrials, Air Freight & Logistics) | | | | | | | 880,800 | | | | 1,188,943 | |
Singapore Technologies Engineering Limited (Industrials, Aerospace & Defense) | | | | | | | 322,000 | | | | 758,947 | |
Singapore Telecommunications Limited (Telecommunication Services, Diversified Telecommunication Services) | | | | | | | 752,800 | | | | 2,138,895 | |
| | | | |
| | | | | | | | | | | 6,979,078 | |
| | | | | | | | | | | | |
| | | | |
| South Korea: 6.60% | | | | | | | | | | | | |
Hana Financial Group Incorporated (Financials, Banks) | | | | | | | 51,790 | | | | 1,259,480 | |
KB Financial Group Incorporated (Financials, Banks) | | | | | | | 39,500 | | | | 1,251,414 | |
Korea Electric Power Corporation (Utilities, Electric Utilities) | | | | | | | 35,190 | | | | 1,584,414 | |
LG Chem Limited (Materials, Chemicals) | | | | | | | 8,900 | | | | 2,365,986 | |
Macquarie Korea Infrastructure Fund (Financials, Capital Markets) | | | | | | | 138,700 | | | | 973,291 | |
POSCO (Materials, Metals & Mining) | | | | | | | 8,200 | | | | 1,318,649 | |
Samsung Electronics Company Limited (Information Technology, Technology Hardware, Storage & Peripherals) | | | | | | | 663 | | | | 795,219 | |
SK Telecom Company Limited (Telecommunication Services, Wireless Telecommunication Services) | | | | | | | 6,700 | | | | 1,418,807 | |
| | | | |
| | | | | | | | | | | 10,967,260 | |
| | | | | | | | | | | | |
| | | | |
| Taiwan: 6.59% | | | | | | | | | | | | |
Advanced Semiconductor Engineering Incorporated (Information Technology, Semiconductors & Semiconductor Equipment) | | | | | | | 718,000 | | | | 828,898 | |
Chicony Electronics Company Limited (Information Technology, Technology Hardware, Storage & Peripherals) | | | | | | | 362,598 | | | | 863,012 | |
CTBC Financial Holding Company Limited (Financials, Banks) | | | | | | | 1,430,163 | | | | 783,524 | |
Hon Hai Precision Industry Company Limited (Information Technology, Electronic Equipment, Instruments & Components) | | | | | | | 679,350 | | | | 1,805,752 | |
King Yuan Electronics Company Limited (Information Technology, Semiconductors & Semiconductor Equipment) | | | | | | | 1,047,000 | | | | 668,180 | |
Merida Industry Company Limited (Consumer Discretionary, Leisure Products) | | | | | | | 149,000 | | | | 870,853 | |
Siliconware Precision Industries Company (Information Technology, Semiconductors & Semiconductor Equipment) | | | | | | | 673,000 | | | | 889,194 | |
St. Shine Optical Company Limited (Health Care, Health Care Equipment & Supplies) | | | | | | | 68,000 | | | | 1,026,146 | |
Taiwan Semiconductor Manufacturing Company Limited (Information Technology, Semiconductors & Semiconductor Equipment) | | | | | | | 387,000 | | | | 1,630,689 | |
United Microelectronics Corporation (Information Technology, Semiconductors & Semiconductor Equipment) | | | | | | | 2,180,000 | | | | 795,081 | |
WPG Holdings Company Limited (Information Technology, Electronic Equipment, Instruments & Components) | | | | | | | 761,000 | | | | 794,082 | |
| | | | |
| | | | | | | | | | | 10,955,411 | |
| | | | | | | | | | | | |
The accompanying notes are an integral part of these financial statements.
| | | | |
| 12 | | Wells Fargo Asia Pacific Fund | | Portfolio of investments—October 31, 2015 |
| | | | | | | | | | | | | | | | |
| Security name | | | | | | | | Shares | | | Value | |
| | | | |
| Thailand: 0.43% | | | | | | | | | | | | | | | | |
Major Cineplex Group PCL (Consumer Discretionary, Media) | | | | | | | | | | | 823,600 | | | $ | 717,835 | |
| | | | | | | | | | | | | | | | |
| | | | |
Total Common Stocks (Cost $158,007,318) | | | | | | | | | | | | | | | 158,825,540 | |
| | | | | | | | | | | | | | | | |
| | | | |
| | | | | | Expiration date | | | | | | | |
| | | | |
Participation Notes: 1.29% | | | | | | | | | | | | | | | | |
| | | | |
| China: 1.29% | | | | | | | | | | | | | | | | |
UBS AG (China Vanke Company Limited Class A) (Financials, Real Estate Management & Development) † | | | | | | | 5-4-2018 | | | | 580,000 | | | | 1,253,435 | |
UBS AG (Shanghai International Air Company Limited Class A) (Industrials, Transportation Infrastructure) † | | | | | | | 8-29-2016 | | | | 187,382 | | | | 895,215 | |
| | | | |
Total Participation Notes (Cost $2,134,359) | | | | | | | | | | | | | | | 2,148,650 | |
| | | | | | | | | | | | | | | | |
| | | | |
| | | Dividend yield | | | | | | | | | | |
| Preferred Stocks: 1.32% | | | | | | | | | | | | | | | | |
| | | | |
| South Korea: 1.32% | | | | | | | | | | | | | | | | |
Samsung Electronics Company Limited (Information Technology, Technology Hardware, Storage & Peripherals) ± | | | 1.79 | % | | | | | | | 2,100 | | | | 2,193,407 | |
| | | | | | | | | | | | | | | | |
| | | | |
Total Preferred Stocks (Cost $1,559,325) | | | | | | | | | | | | | | | 2,193,407 | |
| | | | | | | | | | | | | | | | |
| | | | |
| | | Yield | | | | | | | | | | |
| | | | |
Short-Term Investments: 1.26% | | | | | | | | | | | | | | | | |
| | | | |
| Investment Companies: 1.26% | | | | | | | | | | | | | | | | |
Securities Lending Cash Investments, LLC (l)(r)(u) | | | 0.14 | | | | | | | | 631,800 | | | | 631,800 | |
Wells Fargo Cash Investment Money Market Fund, Select Class (l)(u) | | | 0.16 | | | | | | | | 1,464,576 | | | | 1,464,576 | |
| | | | |
Total Short-Term Investments (Cost $2,096,376) | | | | | | | | | | | | | | | 2,096,376 | |
| | | | | | | | | | | | | | | | |
| | | | | | | | |
| Total investments in securities (Cost $163,797,378) * | | | 99.46 | % | | | 165,263,973 | |
Other assets and liabilities, net | | | 0.54 | | | | 890,019 | |
| | | | | | | | |
| Total net assets | | | 100.00 | % | | $ | 166,153,992 | |
| | | | | | | | |
| † | Non-income-earning security |
| « | All or a portion of this security is on loan. |
| 144A | The security may be resold in transactions exempt from registration, normally to qualified institutional buyers, pursuant to Rule 144A under the Securities Act of 1933. |
| (a) | The security is fair valued in accordance with procedures approved by the Board of Trustees. |
| ± | Variable rate investment. The rate shown is the rate in effect at period end. |
| (l) | The issuer of the security is an affiliated person of the Fund as defined in the Investment Company Act of 1940. |
| (r) | The investment is a non-registered investment vehicle purchased with cash collateral received from securities on loan. |
| (u) | The rate represents the 7-day annualized yield at period end. |
| * | Cost for federal income tax purposes is $165,189,745 and unrealized gains (losses) consists of: |
| | | | |
Gross unrealized gains | | $ | 12,884,542 | |
Gross unrealized losses | | | (12,810,314 | ) |
| | | | |
Net unrealized gains | | $ | 74,228 | |
The accompanying notes are an integral part of these financial statements.
| | | | | | |
| Statement of assets and liabilities—October 31, 2015 | | Wells Fargo Asia Pacific Fund | | | 13 | |
| | | | |
| | | | |
| |
Assets | | | | |
Investments | | | | |
In unaffiliated securities (including $599,632 of securities loaned), at value (cost $161,701,002) | | $ | 163,167,597 | |
In affiliated securities, at value (cost $2,096,376) | | | 2,096,376 | |
| | | | |
Total investments, at value (cost $163,797,378) | | | 165,263,973 | |
Foreign currency, at value (cost $1,380,621) | | | 1,378,286 | |
Receivable for investments sold | | | 872,435 | |
Receivable for Fund shares sold | | | 121,412 | |
Receivable for dividends | | | 428,315 | |
Receivable for securities lending income | | | 272 | |
Prepaid expenses and other assets | | | 40,137 | |
| | | | |
Total assets | | | 168,104,830 | |
| | | | |
| |
Liabilities | | | | |
Payable for investments purchased | | | 833,977 | |
Payable for Fund shares redeemed | | | 229,535 | |
Payable upon receipt of securities loaned | | | 631,800 | |
Management fee payable | | | 119,414 | |
Distribution fee payable | | | 2,262 | |
Administration fees payable | | | 38,287 | |
Accrued expenses and other liabilities | | | 95,563 | |
| | | | |
Total liabilities | | | 1,950,838 | |
| | | | |
Total net assets | | $ | 166,153,992 | |
| | | | |
| |
NET ASSETS CONSIST OF | | | | |
Paid-in capital | | $ | 276,317,492 | |
Undistributed net investment income | | | 2,254,942 | |
Accumulated net realized losses on investments | | | (113,880,721 | ) |
Net unrealized gains on investments | | | 1,462,279 | |
| | | | |
Total net assets | | $ | 166,153,992 | |
| | | | |
| |
COMPUTATION OF NET ASSET VALUE AND OFFERING PRICE PER SHARE | | | | |
Net assets – Class A | | $ | 137,577,599 | |
Shares outstanding – Class A1 | | | 11,540,056 | |
Net asset value per share – Class A | | | $11.92 | |
Maximum offering price per share – Class A2 | | | $12.65 | |
Net assets – Class C | | $ | 3,494,625 | |
Shares outstanding – Class C1 | | | 309,475 | |
Net asset value per share – Class C | | | $11.29 | |
Net assets – Administrator Class | | $ | 14,047,571 | |
Shares outstanding – Administrator Class1 | | | 1,198,483 | |
Net asset value per share – Administrator Class | | | $11.72 | |
Net assets – Institutional Class | | $ | 11,034,197 | |
Shares outstanding – Institutional Class1 | | | 940,677 | |
Net asset value per share – Institutional Class | | | $11.73 | |
| 1 | The Fund has an unlimited number of authorized shares. |
| 2 | Maximum offering price is computed as 100/94.25 of net asset value. On investments of $50,000 or more, the offering price is reduced. |
The accompanying notes are an integral part of these financial statements.
| | | | |
| 14 | | Wells Fargo Asia Pacific Fund | | Statement of operations—year ended October 31, 2015 |
| | | | |
| | | | |
| |
Investment income | | | | |
Dividends (net of foreign withholding taxes of $424,584) | | $ | 3,973,540 | |
Securities lending income, net | | | 25,736 | |
Income from affiliated securities | | | 6,214 | |
| | | | |
Total investment income | | | 4,005,490 | |
| | | | |
| |
Expenses | | | | |
Management fee | | | 1,788,721 | |
Administration fees | | | | |
Class A | | | 25,252 | |
Class C | | | 7,416 | |
Administrator Class | | | 16,677 | |
Institutional Class | | | 3,359 | |
Investor Class | | | 469,824 | 1 |
Shareholder servicing fees | | | | |
Class A | | | 27,107 | |
Class C | | | 7,691 | |
Administrator Class | | | 35,400 | |
Investor Class | | | 366,658 | 1 |
Distribution fee | | | | |
Class C | | | 23,072 | |
Custody and accounting fees | | | 154,193 | |
Professional fees | | | 67,618 | |
Registration fees | | | 66,125 | |
Shareholder report expenses | | | 49,685 | |
Trustees’ fees and expenses | | | 19,653 | |
Other fees and expenses | | | 26,417 | |
| | | | |
Total expenses | | | 3,154,868 | |
Less: Fee waivers and/or expense reimbursements | | | (237,211 | ) |
| | | | |
Net expenses | | | 2,917,657 | |
| | | | |
Net investment income | | | 1,087,833 | |
| | | | |
| |
REALIZED AND UNREALIZED GAINS (LOSSES) ON INVESTMENTS | | | | |
Net realized gains on: | | | | |
Unaffiliated securities | | | 5,728,892 | |
Forward foreign currency contract transactions | | | 79,885 | |
| | | | |
Net realized gains on investments | | | 5,808,777 | |
| | | | |
Net change in unrealized gains (losses) on investments | | | (10,236,642 | ) |
| | | | |
Net realized and unrealized gains (losses) on investments | | | (4,427,865 | ) |
| | | | |
Net decrease in net assets resulting from operations | | $ | (3,340,032 | ) |
| | | | |
| 1 | For the period from November 1, 2014 to October 23, 2015. Effective at the close of business on October 23, 2015, Investor Class shares were converted to Class A shares and are no longer offered by the Fund. |
The accompanying notes are an integral part of these financial statements.
| | | | | | |
| Statement of changes in net assets | | Wells Fargo Asia Pacific Fund | | | 15 | |
| | | | | | | | | | | | | | | | |
| | | Year ended
October 31, 2015 | | | Year ended
October 31, 2014 | |
| | | | |
Operations | | | | | | | | | | | | | | | | |
Net investment income | | | | | | $ | 1,087,833 | | | | | | | $ | 1,447,027 | |
Net realized gains on investments | | | | | | | 5,808,777 | | | | | | | | 14,500,418 | |
Net change in unrealized losses on investments | | | | | | | (10,236,642 | ) | | | | | | | (4,886,948 | ) |
| | | | |
Net increase (decrease) in net assets resulting from operations | | | | | | | (3,340,032 | ) | | | | | | | 11,060,497 | |
| | | | |
| | | | |
Distributions to shareholders from | | | | | | | | | | | | | | | | |
Net investment income | | | | | | | | | | | | | | | | |
Class A | | | | | | | (82,320 | ) | | | | | | | (174,427 | ) |
Class C | | | | | | | (18,378 | ) | | | | | | | (39,188 | ) |
Administrator Class | | | | | | | (197,300 | ) | | | | | | | (357,092 | ) |
Institutional Class | | | | | | | (18,960 | ) | | | | | | | (3,952 | ) |
Investor Class | | | | | | | (1,661,776 | )1 | | | | | | | (4,117,147 | ) |
| | | | |
Total distributions to shareholders | | | | | | | (1,978,734 | ) | | | | | | | (4,691,806 | ) |
| | | | |
| | | | |
Capital share transactions | | | Shares | | | | | | | | Shares | | | | | |
Proceeds from shares sold | | | | | | | | | | | | | | | | |
Class A | | | 11,260,731 | | | | 136,016,227 | | | | 213,375 | | | | 2,569,331 | |
Class C | | | 140,676 | | | | 1,691,622 | | | | 91,389 | | | | 1,033,884 | |
Administrator Class | | | 1,087,437 | | | | 13,023,913 | | | | 515,591 | | | | 6,073,555 | |
Institutional Class | | | 971,690 | | | | 10,822,354 | | | | 32,247 | | | | 390,907 | |
Investor Class | | | 3,572,603 | 1 | | | 44,979,487 | 1 | | | 2,513,982 | | | | 29,455,819 | |
| | | | |
| | | | | | | 206,533,603 | | | | | | | | 39,523,496 | |
| | | | |
Reinvestment of distributions | | | | | | | | | | | | | | | | |
Class A | | | 6,243 | | | | 74,538 | | | | 14,068 | | | | 162,768 | |
Class C | | | 1,201 | | | | 13,666 | | | | 2,369 | | | | 26,174 | |
Administrator Class | | | 16,772 | | | | 196,572 | | | | 29,465 | | | | 334,721 | |
Institutional Class | | | 687 | | | | 8,043 | | | | 348 | | | | 3,952 | |
Investor Class | | | 138,610 | 1 | | | 1,630,058 | 1 | | | 353,802 | | | | 4,029,801 | |
| | | | |
| | | | | | | 1,922,877 | | | | | | | | 4,557,416 | |
| | | | |
Payment for shares redeemed | | | | | | | | | | | | | | | | |
Class A | | | (281,262 | ) | | | (3,389,825 | ) | | | (417,097 | ) | | | (4,930,591 | ) |
Class C | | | (42,158 | ) | | | (493,632 | ) | | | (61,548 | ) | | | (667,173 | ) |
Administrator Class | | | (1,069,973 | ) | | | (12,472,235 | ) | | | (470,899 | ) | | | (5,405,459 | ) |
Institutional Class | | | (73,533 | ) | | | (850,292 | ) | | | (1,888 | ) | | | (22,609 | ) |
Investor Class | | | (16,272,754 | )1 | | | (194,126,550 | )1 | | | (4,536,103 | ) | | | (52,779,516 | ) |
| | | | |
| | | | | | | (211,332,534 | ) | | | | | | | (63,805,348 | ) |
| | | | |
Net decrease in net assets resulting from capital share transactions | | | | | | | (2,876,054 | ) | | | | | | | (19,724,436 | ) |
| | | | |
Total decrease in net assets | | | | | | | (8,194,820 | ) | | | | | | | (13,355,745 | ) |
| | | | |
| | | | |
Net assets | | | | | | | | | | | | | | | | |
Beginning of period | | | | | | | 174,348,812 | | | | | | | | 187,704,557 | |
| | | | |
End of period | | | | | | $ | 166,153,992 | | | | | | | $ | 174,348,812 | |
| | | | |
Undistributed net investment income | | | | | | $ | 2,254,942 | | | | | | | $ | 1,079,573 | |
| | | | |
| 1 | For the period from November 1, 2014 to October 23, 2015. Effective at the close of business on October 23, 2015, Investor Class shares were converted to Class A shares and are no longer offered by the Fund. |
The accompanying notes are an integral part of these financial statements.
| | | | |
| 16 | | Wells Fargo Asia Pacific Fund | | Financial highlights |
(For a share outstanding throughout each period)
| | | | | | | | | | | | | | | | | | | | |
| | | Year ended October 31 | |
| CLASS A | | 2015 | | | 2014 | | | 2013 | | | 2012 | | | 2011 | |
Net asset value, beginning of period | | | $12.18 | | | | $11.72 | | | | $10.19 | | | | $9.30 | | | | $10.15 | |
Net investment income | | | 0.04 | 1 | | | 0.09 | 1 | | | 0.12 | 1 | | | 0.10 | 1 | | | 0.08 | 1 |
Net realized and unrealized gains (losses) on investments | | | (0.16 | ) | | | 0.67 | | | | 1.79 | | | | 0.79 | | | | (0.89 | ) |
| | | | | | | | | | | | | | | | | | | | |
Total from investment operations | | | (0.12 | ) | | | 0.76 | | | | 1.91 | | | | 0.89 | | | | (0.81 | ) |
Distributions to shareholders from | | | | | | | | | | | | | | | | | | | | |
Net investment income | | | (0.14 | ) | | | (0.30 | ) | | | (0.38 | ) | | | 0.00 | | | | (0.04 | ) |
Net asset value, end of period | | | $11.92 | | | | $12.18 | | | | $11.72 | | | | $10.19 | | | | $9.30 | |
Total return2 | | | (0.95 | )% | | | 6.61 | % | | | 19.24 | % | | | 9.57 | % | | | (7.97 | )% |
Ratios to average net assets (annualized) | | | | | | | | | | | | | | | | | | | | |
Gross expenses | | | 1.72 | % | | | 1.71 | % | | | 1.79 | % | | | 1.86 | % | | | 1.73 | % |
Net expenses | | | 1.60 | % | | | 1.60 | % | | | 1.60 | % | | | 1.60 | % | | | 1.60 | % |
Net investment income | | | 0.34 | % | | | 0.80 | % | | | 1.08 | % | | | 1.04 | % | | | 0.83 | % |
Supplemental data | | | | | | | | | | | | | | | | | | | | |
Portfolio turnover rate | | | 113 | % | | | 113 | % | | | 187 | % | | | 163 | % | | | 196 | % |
Net assets, end of period (000s omitted) | | | $137,578 | | | | $6,755 | | | | $8,720 | | | | $5,699 | | | | $31,000 | |
| 1 | Calculated based upon average shares outstanding |
| 2 | Total return calculations do not include any sales charges. |
The accompanying notes are an integral part of these financial statements.
| | | | | | |
| Financial highlights | | Wells Fargo Asia Pacific Fund | | | 17 | |
(For a share outstanding throughout each period)
| | | | | | | | | | | | | | | | | | | | |
| | | Year ended October 31 | |
| CLASS C | | 2015 | | | 2014 | | | 2013 | | | 2012 | | | 2011 | |
Net asset value, beginning of period | | | $11.57 | | | | $11.15 | | | | $9.73 | | | | $8.98 | | | | $9.96 | |
Net investment income (loss) | | | (0.00 | )1,2 | | | 0.01 | 1 | | | 0.05 | | | | 0.09 | 1 | | | 0.01 | |
Net realized and unrealized gains (losses) on investments | | | (0.20 | ) | | | 0.63 | | | | 1.69 | | | | 0.69 | | | | (0.86 | ) |
| | | | | | | | | | | | | | | | | | | | |
Total from investment operations | | | (0.20 | ) | | | 0.64 | | | | 1.74 | | | | 0.78 | | | | (0.85 | ) |
Distributions to shareholders from | | | | | | | | | | | | | | | | | | | | |
Net investment income | | | (0.08 | ) | | | (0.22 | ) | | | (0.32 | ) | | | (0.03 | ) | | | (0.13 | ) |
Net asset value, end of period | | | $11.29 | | | | $11.57 | | | | $11.15 | | | | $9.73 | | | | $8.98 | |
Total return3 | | | (1.71 | )% | | | 5.76 | % | | | 18.44 | % | | | 8.78 | % | | | (8.67 | )% |
Ratios to average net assets (annualized) | | | | | | | | | | | | | | | | | | | | |
Gross expenses | | | 2.46 | % | | | 2.46 | % | | | 2.54 | % | | | 2.62 | % | | | 2.48 | % |
Net expenses | | | 2.35 | % | | | 2.35 | % | | | 2.35 | % | | | 2.35 | % | | | 2.35 | % |
Net investment income (loss) | | | (0.01 | )% | | | 0.12 | % | | | 0.37 | % | | | 0.92 | % | | | 0.18 | % |
Supplemental data | | | | | | | | | | | | | | | | | | | | |
Portfolio turnover rate | | | 113 | % | | | 113 | % | | | 187 | % | | | 163 | % | | | 196 | % |
Net assets, end of period (000s omitted) | | | $3,495 | | | | $2,427 | | | | $1,980 | | | | $1,673 | | | | $1,274 | |
| 1 | Calculated based upon average shares outstanding |
| 2 | Amount is less than $0.005. |
| 3 | Total return calculations do not include any sales charges. |
The accompanying notes are an integral part of these financial statements.
| | | | |
| 18 | | Wells Fargo Asia Pacific Fund | | Financial highlights |
(For a share outstanding throughout each period)
| | | | | | | | | | | | | | | | | | | | |
| | | Year ended October 31 | |
| ADMINISTRATOR CLASS | | 2015 | | | 2014 | | | 2013 | | | 2012 | | | 2011 | |
Net asset value, beginning of period | | | $11.99 | | | | $11.54 | | | | $10.04 | | | | $9.29 | | | | $10.15 | |
Net investment income | | | 0.11 | 1 | | | 0.12 | 1 | | | 0.14 | 1 | | | 0.17 | | | | 0.12 | 1 |
Net realized and unrealized gains (losses) on investments | | | (0.21 | ) | | | 0.65 | | | | 1.77 | | | | 0.71 | | | | (0.89 | ) |
| | | | | | | | | | | | | | | | | | | | |
Total from investment operations | | | (0.10 | ) | | | 0.77 | | | | 1.91 | | | | 0.88 | | | | (0.77 | ) |
Distributions to shareholders from | | | | | | | | | | | | | | | | | | | | |
Net investment income | | | (0.17 | ) | | | (0.32 | ) | | | (0.41 | ) | | | (0.13 | ) | | | (0.09 | ) |
Net asset value, end of period | | | $11.72 | | | | $11.99 | | | | $11.54 | | | | $10.04 | | | | $9.29 | |
Total return | | | (0.83 | )% | | | 6.86 | % | | | 19.57 | % | | | 9.66 | % | | | (7.68 | )% |
Ratios to average net assets (annualized) | | | | | | | | | | | | | | | | | | | | |
Gross expenses | | | 1.56 | % | | | 1.52 | % | | | 1.61 | % | | | 1.67 | % | | | 1.52 | % |
Net expenses | | | 1.40 | % | | | 1.40 | % | | | 1.40 | % | | | 1.40 | % | | | 1.39 | % |
Net investment income | | | 0.87 | % | | | 1.04 | % | | | 1.26 | % | | | 1.74 | % | | | 1.14 | % |
Supplemental data | | | | | | | | | | | | | | | | | | | | |
Portfolio turnover rate | | | 113 | % | | | 113 | % | | | 187 | % | | | 163 | % | | | 196 | % |
Net assets, end of period (000s omitted) | | | $14,048 | | | | $13,956 | | | | $12,577 | | | | $12,860 | | | | $13,959 | |
| 1 | Calculated based upon average shares outstanding |
The accompanying notes are an integral part of these financial statements.
| | | | | | |
| Financial highlights | | Wells Fargo Asia Pacific Fund | | | 19 | |
(For a share outstanding throughout each period)
| | | | | | | | | | | | | | | | | | | | |
| | | Year ended October 31 | |
| INSTITUTIONAL CLASS | | 2015 | | | 2014 | | | 2013 | | | 2012 | | | 2011 | |
Net asset value, beginning of period | | | $12.00 | | | | $11.55 | | | | $10.05 | | | | $9.30 | | | | $10.15 | |
Net investment income | | | 0.15 | 1 | | | 0.14 | 1 | | | 0.18 | 1 | | | 0.18 | | | | 0.13 | |
Net realized and unrealized gains (losses) on investments | | | (0.23 | ) | | | 0.65 | | | | 1.74 | | | | 0.71 | | | | (0.89 | ) |
| | | | | | | | | | | | | | | | | | | | |
Total from investment operations | | | (0.08 | ) | | | 0.79 | | | | 1.92 | | | | 0.89 | | | | (0.76 | ) |
Distributions to shareholders from | | | | | | | | | | | | | | | | | | | | |
Net investment income | | | (0.19 | ) | | | (0.34 | ) | | | (0.42 | ) | | | (0.14 | ) | | | (0.09 | ) |
Net asset value, end of period | | | $11.73 | | | | $12.00 | | | | $11.55 | | | | $10.05 | | | | $9.30 | |
Total return | | | (0.65 | )% | | | 6.99 | % | | | 19.70 | % | | | 9.90 | % | | | (7.55 | )% |
Ratios to average net assets (annualized) | | | | | | | | | | | | | | | | | | | | |
Gross expenses | | | 1.36 | % | | | 1.27 | % | | | 1.33 | % | | | 1.42 | % | | | 1.29 | % |
Net expenses | | | 1.25 | % | | | 1.25 | % | | | 1.25 | % | | | 1.25 | % | | | 1.24 | % |
Net investment income | | | 1.27 | % | | | 1.15 | % | | | 1.62 | % | | | 1.86 | % | | | 1.30 | % |
Supplemental data | | | | | | | | | | | | | | | | | | | | |
Portfolio turnover rate | | | 113 | % | | | 113 | % | | | 187 | % | | | 163 | % | | | 196 | % |
Net assets, end of period (000s omitted) | | | $11,034 | | | | $502 | | | | $129 | | | | $12 | | | | $11 | |
| 1 | Calculated based upon average shares outstanding |
The accompanying notes are an integral part of these financial statements.
| | | | |
| 20 | | Wells Fargo Asia Pacific Fund | | Notes to financial statements |
1. ORGANIZATION
Wells Fargo Funds Trust (the “Trust”), a Delaware statutory trust organized on March 10, 1999, is an open-end management investment company registered under the Investment Company Act of 1940, as amended (the “1940 Act”). As an investment company, the Trust follows the accounting and reporting guidance in Financial Accounting Standards Board (“FASB”) Accounting Standards Codification Topic 946, Financial Services – Investment Companies. These financial statements report on the Wells Fargo Asia Pacific Fund (the “Fund”) which is a diversified series of the Trust.
Effective at the close of business on October 23, 2015, Investor Class shares became Class A shares in a tax-free conversion. Shareholder of Investor Class received Class A shares at a value equal to the value of their Investor Class shares immediately prior to the conversion. Investor Class shares are no longer offered by the Fund.
2. SIGNIFICANT ACCOUNTING POLICIES
The following significant accounting policies, which are consistently followed in the preparation of the financial statements of the Fund, are in conformity with U.S. generally accepted accounting principles which require management to make estimates and assumptions that affect the reported amounts of assets and liabilities, disclosure of contingent assets and liabilities at the date of the financial statements, and the reported amounts of revenues and expenses during the reporting period. Actual results could differ from those estimates.
Securities valuation
All investments are valued each business day as of the close of regular trading on the New York Stock Exchange (generally 4 p.m. Eastern Time).
Equity securities that are listed on a foreign or domestic exchange or market are valued at the official closing price or, if none, the last sales price. If no sale occurs on the primary exchange or market that day, the prior day’s price will be deemed “stale” and a fair value price will be determined in accordance with the Fund’s Valuation Procedures.
Equity securities that are not listed on a foreign or domestic exchange or market, but have a public trading market, are valued at the quoted bid price from an independent broker-dealer that the Management Valuation Team of Wells Fargo Funds Management, LLC (“Funds Management”) has determined is an acceptable source.
The values of securities denominated in foreign currencies are translated into U.S. dollars at rates provided by an independent foreign currency pricing source at a time each business day specified by the Management Valuation Team.
Many securities markets and exchanges outside the U.S. close prior to the close of the New York Stock Exchange and therefore may not fully reflect trading or events that occur after the close of the principal exchange in which the foreign securities are traded, but before the close of the New York Stock Exchange. If such trading or events are expected to materially affect the value of such securities, then fair value pricing procedures approved by the Board of Trustees of the Fund are applied. These procedures take into account multiple factors including movements in U.S. securities markets after foreign exchanges close. Foreign securities that are fair valued under these procedures are categorized as Level 2 and the application of these procedures may result in transfers between Level 1 and Level 2. Depending on market activity, such fair valuations may be frequent. Such fair value pricing may result in net asset values that are higher or lower than net asset values based on the last reported sales price or latest quoted bid price. On October 31, 2015, such fair value pricing was used in pricing foreign securities.
Investments in registered open-end investment companies are valued at net asset value. Interests in non-registered investment vehicles that are redeemable at net asset value are fair valued at net asset value when available.
Investments which are not valued using any of the methods discussed above are valued at their fair value, as determined in good faith by the Board of Trustees. The Board of Trustees has established a Valuation Committee comprised of the Trustees and has delegated to it the authority to take any actions regarding the valuation of portfolio securities that the Valuation Committee deems necessary or appropriate, including determining the fair value of portfolio securities, unless the determination has been delegated to the Management Valuation Team. The Board of Trustees retains the authority to make or ratify any valuation decisions or approve any changes to the Valuation Procedures as it deems appropriate. On a quarterly basis, the Board of Trustees receives reports on any valuation actions taken by the Valuation Committee or the Management Valuation Team which may include items for ratification.
Valuations of fair valued securities are compared to the next actual sales price when available, or other appropriate market values, to assess the continued appropriateness of the fair valuation methodologies used. These securities are fair valued on a day-to-day basis, taking into consideration changes to appropriate market information and any significant changes to the inputs considered in the valuation process until there is a readily available price provided on an exchange
| | | | | | |
| Notes to financial statements | | Wells Fargo Asia Pacific Fund | | | 21 | |
or by an independent pricing service. Valuations received from an independent pricing service or independent broker-dealer quotes are periodically validated by comparisons to most recent trades and valuations provided by other independent pricing services in addition to the review of prices by the manager and/or subadviser. Unobservable inputs used in determining fair valuations are identified based on the type of security, taking into consideration factors utilized by market participants in valuing the investment, knowledge about the issuer and the current market environment.
Foreign currency translation
The accounting records of the Fund are maintained in U.S. dollars. The values of other assets and liabilities denominated in foreign currencies are translated into U.S. dollars at rates provided by an independent foreign currency pricing source at a time each business day specified by the Management Valuation Team. Purchases and sales of securities, and income and expenses are converted at the rate of exchange on the respective dates of such transactions. Net realized foreign exchange gains or losses arise from sales of foreign currencies, currency gains or losses realized between the trade and settlement dates on securities transactions, and the difference between the amounts of dividends, interest and foreign withholding taxes recorded and the U.S. dollar equivalent of the amounts actually paid or received. Net unrealized foreign exchange gains and losses arise from changes in the fair value of assets and liabilities other than investments in securities resulting from changes in exchange rates. The changes in net assets arising from changes in exchange rates and the changes in net assets resulting from changes in market prices of securities are not separately presented. Such changes are included in net realized and unrealized gains or losses from investments.
Forward foreign currency contracts
The Fund is subject to foreign currency exchange rate risk in the normal course of pursuing its investment objectives. A forward foreign currency contract is an agreement between two parties to purchase or sell a specific currency for an agreed-upon price at a future date. The Fund enters into forward foreign currency contracts to facilitate transactions in foreign-denominated securities and to attempt to minimize the risk to the Fund from adverse changes in the relationship between currencies. Forward foreign currency contracts are recorded at the forward rate and marked-to-market daily. When the contracts are closed, realized gains and losses arising from such transactions are recorded as realized gains or losses on forward foreign currency contract transactions. The Fund could be exposed to risks if the counterparties to the contracts are unable to meet the terms of their contracts or if the value of the foreign currency changes unfavorably. The Fund’s maximum risk of loss from counterparty credit risk is the unrealized gains on the contracts. This risk may be mitigated if there is a master netting arrangement between the Fund and the counterparty.
Security loans
The Fund may lend its securities from time to time in order to earn additional income in the form of fees or interest on securities received as collateral or the investment of any cash received as collateral. The Fund continues to receive interest or dividends on the securities loaned. The Fund receives collateral in the form of cash or securities with a value at least equal to the value of the securities on loan. The value of the loaned securities is determined at the close of each business day and any additional required collateral is delivered to the Fund on the next business day. In a securities lending transaction, the net asset value of the Fund will be affected by an increase or decrease in the value of the securities loaned and by an increase or decrease in the value of the instrument in which collateral is invested. The amount of securities lending activity undertaken by the Fund fluctuates from time to time. In the event of default or bankruptcy by the borrower, the Fund may be prevented from recovering the loaned securities or gaining access to the collateral or may experience delays or costs in doing so. In addition, the investment of any cash collateral received may lose all or part of its value. The Fund has the right under the lending agreement to recover the securities from the borrower on demand.
The Fund lends its securities through an unaffiliated securities lending agent. Cash collateral received in connection with its securities lending transactions is invested in Securities Lending Cash Investments, LLC (the “Securities Lending Fund”). The Securities Lending Fund is exempt from registration under Section 3(c)(7) of the 1940 Act and is managed by Funds Management and is subadvised by Wells Capital Management Incorporated (“WellsCap”). Funds Management receives an advisory fee starting at 0.05% and declining to 0.01% as the average daily net assets of the Securities Lending Fund increase. All of the fees received by Funds Management are paid to WellsCap for its services as subadviser. The Securities Lending Fund seeks to provide a positive return compared to the daily Fed Funds Open rate by investing in high-quality, U.S. dollar-denominated short-term money market instruments. Securities Lending Fund investments are fair valued based upon the amortized cost valuation technique. Income earned from investment in the Securities Lending Fund is included in securities lending income on the Statement of Operations.
Security transactions and income recognition
Securities transactions are recorded on a trade date basis. Realized gains or losses are recorded on the basis of identified cost.
| | | | |
| 22 | | Wells Fargo Asia Pacific Fund | | Notes to financial statements |
Dividend income is recognized on the ex-dividend date, except for certain dividends from foreign securities, which are recorded as soon as the custodian verifies the ex-dividend date. Dividend income from foreign securities is recorded net of foreign taxes withheld where recovery of such taxes is not assured.
Distributions to shareholders
Distributions to shareholders from net investment income and net realized gains, if any, are recorded on the ex-dividend date. Such distributions are determined in conformity with federal income tax regulations, which may differ in amount or character from net investment income and realized gains recognized for purposes of U.S. generally accepted accounting principles.
Federal and other taxes
The Fund intends to continue to qualify as a regulated investment company by distributing substantially all of its investment company taxable income and any net realized capital gains (after reduction for capital loss carryforwards) sufficient to relieve it from all, or substantially all, federal income taxes. Accordingly, no provision for federal income taxes was required.
The Fund’s income and federal excise tax returns and all financial records supporting those returns for the prior three fiscal years are subject to examination by the federal and Delaware revenue authorities. Management has analyzed the Fund’s tax positions taken on federal, state, and foreign tax returns for all open tax years and does not believe that there are any uncertain tax positions that require recognition of a tax liability.
Reclassifications are made to the Fund’s capital accounts for permanent tax differences to reflect income and gains available for distribution (or available capital loss carryforwards) under federal income tax regulations. U.S. generally accepted accounting principles require that certain components of net assets be adjusted to reflect permanent differences between financial and tax reporting. These reclassifications have no effect on net assets or net asset values per share. The primary permanent differences causing such reclassifications are due to foreign currency transactions, passive foreign investment companies. At October 31, 2015, as a result of permanent book-to-tax differences, the following reclassification adjustments were made on the Statement of Assets and Liabilities:
| | |
Undistributed net investment income | | Accumulated net realized losses on investments |
| $2,066,270 | | $(2,066,270) |
As of October 31, 2015, the Fund had capital loss carryforwards available to offset future net realized capital gains in the amount of $113,203,545 with $32,386,341 expiring in 2016; and $80,817,204 expiring in 2017.
Class allocations
The separate classes of shares offered by the Fund differ principally in applicable sales charges, distribution, shareholder servicing, and administration fees. Class specific expenses are charged directly to that share class. Investment income, common expenses, and realized and unrealized gains (losses) on investments are allocated daily to each class of shares based on the relative proportion of net assets of each class.
3. FAIR VALUATION MEASUREMENTS
Fair value measurements of investments are determined within a framework that has established a fair value hierarchy based upon the various data inputs utilized in determining the value of the Fund’s investments. The three-level hierarchy gives the highest priority to unadjusted quoted prices in active markets for identical assets or liabilities (Level 1) and the lowest priority to significant unobservable inputs (Level 3). The Fund’s investments are classified within the fair value hierarchy based on the lowest level of input that is significant to the fair value measurement. The inputs are summarized into three broad levels as follows:
| n | | Level 1 – quoted prices in active markets for identical securities |
| n | | Level 2 – other significant observable inputs (including quoted prices for similar securities, interest rates, prepayment speeds, credit risk, use of amortized cost, etc.) |
| n | | Level 3 – significant unobservable inputs (including the Fund’s own assumptions in determining the fair value of investments) |
The inputs or methodologies used for valuing investments in securities are not necessarily an indication of the risk associated with investing in those securities.
| | | | | | |
| Notes to financial statements | | Wells Fargo Asia Pacific Fund | | | 23 | |
The following is a summary of the inputs used in valuing the Fund’s assets and liabilities as of October 31, 2015:
| | | | | | | | | | | | | | | | |
| | | Quoted prices (Level 1) | | | Other significant observable inputs (Level 2) | | | Significant unobservable inputs (Level 3) | | | Total | |
Assets | | | | | | | | | | | | | | | | |
Investments in : | | | | | | | | | | | | | | | | |
| | | | |
Common stocks | | | | | | | | | | | | | | | | |
Australia | | $ | 1,587,605 | | | $ | 4,219,051 | | | $ | 0 | | | $ | 5,806,656 | |
China | | | 5,130,918 | | | | 26,681,727 | | | | 0 | | | | 31,812,645 | |
Hong Kong | | | 39,811 | | | | 6,711,363 | | | | 1,283,668 | | | | 8,034,842 | |
India | | | 0 | | | | 12,009,131 | | | | 0 | | | | 12,009,131 | |
Indonesia | | | 0 | | | | 6,941,669 | | | | 0 | | | | 6,941,669 | |
Japan | | | 0 | | | | 57,914,947 | | | | 0 | | | | 57,914,947 | |
Malaysia | | | 91,793 | | | | 1,884,735 | | | | 0 | | | | 1,976,528 | |
New Zealand | | | 0 | | | | 2,094,155 | | | | 0 | | | | 2,094,155 | |
Philippines | | | 0 | | | | 2,615,383 | | | | 0 | | | | 2,615,383 | |
Singapore | | | 0 | | | | 6,979,078 | | | | 0 | | | | 6,979,078 | |
South Korea | | | 973,291 | | | | 9,993,969 | | | | 0 | | | | 10,967,260 | |
Taiwan | | | 0 | | | | 10,955,411 | | | | 0 | | | | 10,955,411 | |
Thailand | | | 717,835 | | | | 0 | | | | 0 | | | | 717,835 | |
| | | | |
Participation notes | | | | | | | | | | | | | | | | |
China | | | 0 | | | | 2,148,650 | | | | 0 | | | | 2,148,650 | |
| | | | |
Preferred stocks | | | | | | | | | | | | | | | | |
South Korea | | | 0 | | | | 2,193,407 | | | | 0 | | | | 2,193,407 | |
| | | | |
Short-term investments | | | | | | | | | | | | | | | | |
Investment companies | | | 1,464,576 | | | | 631,800 | | | | 0 | | | | 2,096,376 | |
Total assets | | $ | 10,005,829 | | | $ | 153,974,476 | | | $ | 1,283,668 | | | $ | 165,263,973 | |
The Fund recognizes transfers between levels within the fair value hierarchy at the end of the reporting period. At October 31, 2015, fair value pricing was used in pricing certain foreign securities and securities valued at $86,649,783 were transferred from Level 1 to Level 2. The Fund did not have any transfers into/out of Level 3.
4. TRANSACTIONS WITH AFFILIATES
Management fee
Funds Management, an indirect wholly owned subsidiary of Wells Fargo & Company (“Wells Fargo”), is the manager of the Fund and provides advisory and fund-level administrative services under an investment management agreement. Under the investment management agreement, Funds Management is responsible for, among other services, implementing the investment objectives and strategies of the Fund, supervising the applicable subadviser, providing fund-level administrative services in connection with the Fund’s operations, and providing any other fund-level administrative services reasonably necessary for the operation of the Fund. As compensation for its services under the investment management agreement, Funds Management is entitled to receive an annual management fee starting at 1.00% and declining to 0.83% as the average daily net assets of the Fund increase.
Prior to July 1, 2015, Funds Management provided advisory services pursuant to an investment advisory agreement and was entitled to receive an annual fee which started at 0.95% and declined to 0.80% as the average daily net assets of the Fund increased. In addition, fund-level administrative services were provided by Funds Management under a separate administration agreement at an annual fee which started at 0.05% and declined to 0.03% as the average daily net assets of the Fund increased. For financial statement purposes, the advisory fee and fund-level administration fee for the year ended October 31, 2015 have been included in management fee on the Statement of Operations.
For the year ended October 31, 2015, the management fee was equivalent to an annual rate of 1.00% of the Fund’s average daily net assets.
| | | | |
| 24 | | Wells Fargo Asia Pacific Fund | | Notes to financial statements |
Funds Management has retained the services of a subadviser to provide daily portfolio management to the Fund. The fee for subadvisory services is borne by Funds Management. WellsCap, an affiliate of Funds Management and an indirect wholly owned subsidiary of Wells Fargo, is the subadviser to the Fund and is entitled to receive a fee from Funds Management at an annual rate starting at 0.65% and declining to 0.45% as the average daily net assets of the Fund increase.
Administration fees
Under a class-level administration agreement, Funds Management provides class-level administrative services to the Fund, which includes paying fees and expenses for services provided by the transfer agent, sub-transfer agents, omnibus account servicers and record-keepers. As compensation for its services under the class-level administration agreement, Funds Management receives an annual fee which is calculated based on the average daily net assets of each class as follows:
| | | | | | | | |
| | | Class-level administration fee | |
| | | Current rate | | | Rate prior to
July 1, 2015 | |
Class A, Class C | | | 0.21 | % | | | 0.26 | % |
Administrator Class | | | 0.13 | | | | 0.10 | |
Institutional Class | | | 0.13 | | | | 0.08 | |
Investor Class | | | 0.32 | | | | 0.32 | |
Funds Management has contractually waived and/or reimbursed management and administration fees to the extent necessary to maintain certain net operating expense ratios for the Fund. Waiver of fees and/or reimbursement of expenses by Funds Management were made first from fund level expenses on a proportionate basis and then from class specific expenses. Funds Management has committed through February 29, 2016 to waive fees and/or reimburse expenses to the extent necessary to cap the Fund’s expenses at 1.60% for Class A shares, 2.35% for Class C shares, 1.40% for Administrator Class shares, 1.25% for Institutional Class shares, and 1.65% for Investor Class shares. After this time, the cap may be increased or the commitment to maintain the cap may be terminated only with the approval of the Board of Trustees.
Distribution fee
The Trust has adopted a distribution plan for Class C shares of the Fund pursuant to Rule 12b-1 under the 1940 Act. A distribution fee is charged to Class C shares and paid to Wells Fargo Funds Distributor, LLC (“Funds Distributor”), the principal underwriter, at an annual rate of 0.75% of the average daily net assets of Class C shares.
In addition, Funds Distributor is entitled to receive the front-end sales charge from the purchase of Class A shares and a contingent deferred sales charge on the redemption of certain Class A shares. Funds Distributor is also entitled to receive the contingent deferred sales charges from redemptions of Class C shares. For the year ended October 31, 2015, Funds Distributor received $16,861 from the sale of Class A shares and $38 in contingent deferred sales charges from redemptions of Class C shares, respectively.
Shareholder servicing fees
The Trust has entered into contracts with one or more shareholder servicing agents, whereby Class A, Class C, Administrator Class, and Investor Class of the Fund is charged a fee at an annual rate of 0.25% of the average daily net assets of each respective class.
A portion of these total shareholder servicing fees were paid to affiliates of Wells Fargo.
5. INVESTMENT PORTFOLIO TRANSACTIONS
Purchases and sales of investments, excluding U.S. government obligations (if any) and short-term securities, for the year ended October 31, 2015 were $193,827,023 and $200,450,415, respectively.
6. DERIVATIVE TRANSACTIONS
During the year ended October 31, 2015, the Fund entered into forward foreign currency contracts for economic hedging purposes.
| | | | | | |
| Notes to financial statements | | Wells Fargo Asia Pacific Fund | | | 25 | |
As of October 31, 2015, the Fund did not have any open forward foreign currency contracts. The Fund had average contract amounts of $144,315 and $142,813 in forward foreign currency contracts to buy and forward foreign currency contracts to sell, respectively, during the year ended October 31, 2015.
The fair value, realized gains or losses and change in unrealized gains or losses, if any, on derivative instruments are reflected in the appropriate financial statements.
7. BANK BORROWINGS
The Trust (excluding the money market funds) and Wells Fargo Variable Trust are parties to a $200,000,000 revolving credit agreement whereby the Fund is permitted to use bank borrowings for temporary or emergency purposes, such as to fund shareholder redemption requests. Interest under the credit agreement is charged to the Fund based on a borrowing rate equal to the higher of the Federal Funds rate in effect on that day plus 1.25% or the overnight LIBOR rate in effect on that day plus 1.25%. In addition, an annual commitment fee equal to 0.20% of the unused balance is allocated to each participating fund. Prior to September 1, 2015, the revolving credit agreement amount was $150,000,000 and the annual commitment fee was equal to 0.10% of the unused balance which was allocated to each participating fund. For the year ended October 31, 2015, the Fund paid $377 in commitment fees.
For the year ended October 31, 2015, there were no borrowings by the Fund under the agreement.
8. DISTRIBUTIONS TO SHAREHOLDERS
The tax character of distributions paid was $1,978,734 and $4,691,806 of ordinary income for the years ended October 31, 2015 and October 31, 2014, respectively.
As of October 31, 2015, the components of distributable earnings on a tax basis were as follows:
| | | | |
Undistributed
ordinary income | | Unrealized
gains | | Capital loss
carryforward |
| $2,972,272 | | $67,773 | | $(113,203,545) |
9. CONCENTRATION RISK
Concentration risks result from exposure to a limited number of sectors or geographic region. Funds that invest a substantial portion of their assets in any sector or geographic region may be more affected by changes in that sector or geographic region than would be a fund whose investments are not heavily weighted in any sector or geographic region.
10. INDEMNIFICATION
Under the Trust’s organizational documents, the officers and Trustees have been granted certain indemnification rights against certain liabilities that may arise out of performance of their duties to the Trust. Additionally, in the normal course of business, the Trust may enter into contracts with service providers that contain a variety of indemnification clauses. The Trust’s maximum exposure under these arrangements is dependent on future claims that may be made against the Fund and, therefore, cannot be estimated.
| | | | |
| 26 | | Wells Fargo Asia Pacific Fund | | Report of independent registered public accounting firm |
BOARD OF TRUSTEES AND SHAREHOLDERS OF WELLS FARGO FUNDS TRUST:
We have audited the accompanying statement of assets and liabilities, including the portfolio of investments, of the Wells Fargo Asia Pacific Fund (the “Fund”), one of the funds constituting the Wells Fargo Funds Trust, as of October 31, 2015, and the related statement of operations for the year then ended, the statements of changes in net assets for each of the years in the two-year period then ended, and the financial highlights for each of the years in the five-year period then ended. These financial statements and financial highlights are the responsibility of the Fund’s management. Our responsibility is to express an opinion on these financial statements and financial highlights based on our audits.
We conducted our audits in accordance with the standards of the Public Company Accounting Oversight Board (United States). Those standards require that we plan and perform the audit to obtain reasonable assurance about whether the financial statements and financial highlights are free of material misstatement. An audit includes examining, on a test basis, evidence supporting the amounts and disclosures in the financial statements. Our procedures included confirmation of securities owned as of October 31, 2015, by correspondence with the custodian and brokers, or by other appropriate auditing procedures. An audit also includes assessing the accounting principles used and significant estimates made by management, as well as evaluating the overall financial statement presentation. We believe that our audits provide a reasonable basis for our opinion.
In our opinion, the financial statements and financial highlights referred to above present fairly, in all material respects, the financial position of the Wells Fargo Asia Pacific Fund as of October 31, 2015, the results of its operations for the year then ended, the changes in its net assets for each of the years in the two-year period then ended, and the financial highlights for each of the years in the five-year period then ended, in conformity with U.S. generally accepted accounting principles.

Boston, Massachusetts
December 22, 2015
| | | | | | |
| Other information (unaudited) | | Wells Fargo Asia Pacific Fund | | | 27 | |
TAX INFORMATION
Pursuant to Section 854 of the Internal Revenue Code, $1,978,734 of income dividends paid during the fiscal year ended October 31, 2015 has been designated as qualified dividend income (QDI).
Pursuant to Section 853 of the Internal Revenue Code, the Fund expects to designate amounts as foreign taxes paid for the fiscal year ended October 31, 2015. Additional details will be available in the semiannual report.
PROXY VOTING INFORMATION
A description of the policies and procedures that the Fund uses to determine how to vote proxies relating to portfolio securities is available, upon request, by calling 1-800-222-8222, visiting our website at wellsfargofunds.com, or visiting the SEC website at sec.gov. Information regarding how the Fund voted proxies relating to portfolio securities during the most recent 12-month period ended June 30 is available on the Fund’s website at wellsfargofunds.com or by visiting the SEC website at sec.gov.
PORTFOLIO HOLDINGS INFORMATION
The complete portfolio holdings for the Fund are publicly available monthly on the Fund’s website (wellsfargofunds.com), on a one-month delayed basis. In addition, top ten holdings information (excluding derivative positions) for the Fund is publicly available on the Fund’s website on a monthly, seven-day or more delayed basis. The Fund files its complete schedule of portfolio holdings with the SEC for the first and third quarters of each fiscal year on Form N-Q, which is available by visiting the SEC website at sec.gov. In addition, the Fund’s Form N-Q may be reviewed and copied at the SEC’s Public Reference Room in Washington, DC, and at regional offices in New York City, at 233 Broadway, and in Chicago, at 175 West Jackson Boulevard, Suite 900. Information about the Public Reference Room may be obtained by calling 1-800-SEC-0330.
| | | | |
| 28 | | Wells Fargo Asia Pacific Fund | | Other information (unaudited) |
BOARD OF TRUSTEES AND OFFICERS
Each of the Trustees and Officers1 listed in the table below acts in identical capacities for each fund in the Wells Fargo family of funds, which consists of 144 mutual funds comprising the Wells Fargo Funds Trust, Wells Fargo Variable Trust, Wells Fargo Master Trust and four closed-end funds (collectively the “Fund Complex”). This table should be read in conjunction with the Prospectus and the Statement of Additional Information2. The mailing address of each Trustee and Officer is 525 Market Street, 12th Floor, San Francisco, CA 94105. Each Trustee and Officer serves an indefinite term, however, each Trustee serves such term until reaching the mandatory retirement age established by the Trustees.
Independent Trustees
| | | | | | |
Name and year of birth | | Position held and length of service* | | Principal occupations during past five years or longer | | Other public company or investment company
directorships during
past 5 years |
William R. Ebsworth (Born 1957) | | Trustee, since 2015** | | Retired. From 1984 to 2013, equities analyst, portfolio manager, research director at Fidelity Management and Research Company in Boston, Tokyo, and Hong Kong, and retired in 2013 as Chief Investment Officer of Fidelity Strategic Advisers, Inc. where he led a team of investment professionals managing client assets. Prior thereto, Board member of Hong Kong Securities Clearing Co., Hong Kong Options Clearing Corp., the Thailand International Fund, Ltd., Fidelity Investments Life Insurance Company, and Empire Fidelity Investments Life Insurance Company. Mr. Ebsworth is a CFA® charterholder and an Adjunct Lecturer, Finance, at Babson College. | | Asset Allocation Trust |
| Jane A. Freeman (Born 1953) | | Trustee, since 2015** | | Retired. From 2012 to 2014 and 1999 to 2008, Chief Financial Officer of Scientific Learning Corporation. From 2008 to 2012, Ms. Freeman provided consulting services related to strategic business projects. Prior to 1999, Portfolio Manager at Rockefeller & Co. and Scudder, Stevens & Clark. Board member of the Harding Loevner Funds from 1996 to 2014, serving as both Lead Independent Director and chair of the Audit Committee. Board member of the Russell Exchange Traded Funds Trust from 2011 to 2012 and the chair of the Audit Committee. Ms. Freeman is Chair of Taproot Foundation (non-profit organization), a Board Member of Ruth Bancroft Garden (non-profit organization) and an inactive chartered financial analyst. | | Asset Allocation Trust; Harding Loevner Funds; Russell Exchange Traded Funds Trust |
| Peter G. Gordon (Born 1942) | | Trustee, since 1998; Chairman, since 2005 | | Co-Founder, Retired Chairman, President and CEO of Crystal Geyser Water Company. Trustee Emeritus, Colby College. | | Asset Allocation Trust |
| Isaiah Harris, Jr. (Born 1952) | | Trustee, since 2009 | | Retired. Chairman of the Board of CIGNA Corporation since 2009, and Director since 2005. From 2003 to 2011, Director of Deluxe Corporation. Prior thereto, President and CEO of BellSouth Advertising and Publishing Corp. from 2005 to 2007, President and CEO of BellSouth Enterprises from 2004 to 2005 and President of BellSouth Consumer Services from 2000 to 2003. Emeritus member of the Iowa State University Foundation Board of Governors. Emeritus Member of the Advisory Board of Iowa State University School of Business. Advisory Board Member, Palm Harbor Academy (charter school). Mr. Harris is a certified public accountant. | | CIGNA Corporation; Asset Allocation Trust |
Judith M. Johnson (Born 1949) | | Trustee, since 2008; Audit Committee Chairman, since 2008 | | Retired. Prior thereto, Chief Executive Officer and Chief Investment Officer of Minneapolis Employees Retirement Fund from 1996 to 2008. Ms. Johnson is an attorney, certified public accountant and a certified managerial accountant. | | Asset Allocation Trust |
David F. Larcker (Born 1950) | | Trustee, since 2009 | | James Irvin Miller Professor of Accounting at the Graduate School of Business, Stanford University, Morgan Stanley Director of the Center for Leadership Development and Research and Senior Faculty of The Rock Center for Corporate Governance since 2006. From 2005 to 2008, Professor of Accounting at the Graduate School of Business, Stanford University. Prior thereto, Ernst & Young Professor of Accounting at The Wharton School, University of Pennsylvania from 1985 to 2005. | | Asset Allocation Trust |
| | | | | | |
| Other information (unaudited) | | Wells Fargo Asia Pacific Fund | | | 29 | |
| | | | | | |
Name and year of birth | | Position held and length of service* | | Principal occupations during past five years or longer | | Other public company or investment company
directorships during
past 5 years |
Olivia S. Mitchell (Born 1953) | | Trustee, since 2006 | | International Foundation of Employee Benefit Plans Professor, Wharton School of the University of Pennsylvania since 1993. Director of Wharton’s Pension Research Council and Boettner Center on Pensions & Retirement Research, and Research Associate at the National Bureau of Economic Research. Previously, Cornell University Professor from 1978 to 1993. | | Asset Allocation Trust |
Timothy J. Penny (Born 1951) | | Trustee, since 1996 | | President and Chief Executive Officer of Southern Minnesota Initiative Foundation, a non-profit organization, since 2007 and Senior Fellow at the Humphrey Institute Policy Forum at the University of Minnesota since 1995. Member of the Board of Trustees of NorthStar Education Finance, Inc., a non-profit organization, since 2007. | | Asset Allocation Trust |
Michael S. Scofield (Born 1943) | | Trustee, since 2010 | | Served on the Investment Company Institute’s Board of Governors and Executive Committee from 2008-2011 as well the Governing Council of the Independent Directors Council from 2006-2011 and the Independent Directors Council Executive Committee from 2008-2011. Chairman of the IDC from 2008-2010. Institutional Investor (Fund Directions) Trustee of Year in 2007. Trustee of the Evergreen Funds complex (and its predecessors) from 1984 to 2010. Chairman of the Evergreen Funds from 2000-2010. Former Trustee of the Mentor Funds. Retired Attorney, Law Offices of Michael S. Scofield. | | Asset Allocation Trust |
Donald C. Willeke (Born 1940) | | Trustee, since 1996*** | | Principal of the law firm of Willeke & Daniels. General Counsel of the Minneapolis Employees Retirement Fund from 1984 until its consolidation into the Minnesota Public Employees Retirement Association on
June 30, 2010. Director and Vice Chair of The Tree Trust (non-profit corporation). Director of the American Chestnut Foundation (non-profit corporation). | | Asset Allocation Trust |
| * | Length of service dates reflect the Trustee’s commencement of service with the Trust’s predecessor entities, where applicable. |
| ** | William R. Ebsworth and Jane A. Freeman each became a Trustee effective January 1, 2015. |
| *** | Donald Willeke will retire as a Trustee effective December 31, 2015. |
Officers
| | | | | | |
Name and year of birth | | Position held and length of service | | Principal occupations during past five years or longer | | |
Karla M. Rabusch (Born 1959) | | President, since 2003 | | Executive Vice President of Wells Fargo Bank, N.A. and President of Wells Fargo Funds Management, LLC since 2003. | | |
Jeremy DePalma1 (Born 1974) | | Treasurer, since 2012 | | Senior Vice President of Wells Fargo Funds Management, LLC since 2009. Senior Vice President of Evergreen Investment Management Company, LLC from 2008 to 2010 and head of the Fund Reporting and Control Team within Fund Administration from 2005 to 2010. | | |
C. David Messman (Born 1960) | | Secretary, since 2000; Chief Legal Officer, since 2003 | | Senior Vice President and Secretary of Wells Fargo Funds Management, LLC since 2001. Assistant General Counsel of Wells Fargo Bank, N.A. since 2013 and Vice President and Managing Counsel of Wells Fargo Bank N.A. from 1996 to 2013. | | |
Debra Ann Early (Born 1964) | | Chief Compliance Officer, since 2007 | | Executive Vice President of Wells Fargo Funds Management, LLC since 2014, Senior Vice President and Chief Compliance Officer from 2007 to 2014. | | |
David Berardi (Born 1975) | | Assistant Treasurer, since 2009 | | Vice President of Wells Fargo Funds Management, LLC since 2009. Vice President of Evergreen Investment Management Company, LLC from 2008 to 2010. Manager of Fund Reporting and Control for Evergreen Investment Management Company, LLC from 2004 to 2010. | | |
| 1 | Jeremy DePalma acts as Treasurer of 72 funds and Assistant Treasurer of 72 funds in the Fund Complex. |
| 2 | The Statement of Additional Information includes additional information about the Trustees and is available, without charge, upon request, by calling
1-800-222-8222 or by visiting the website at wellsfargofunds.com. |
| | | | |
| 30 | | Wells Fargo Asia Pacific Fund | | Other information (unaudited) |
BOARD CONSIDERATION OF INVESTMENT ADVISORY, INVESTMENT MANAGEMENT AND SUB-ADVISORY AGREEMENTS:
Under the Investment Company Act of 1940 (the “1940 Act”), the Board of Trustees (the “Board”) of Wells Fargo Funds Trust (the “Trust”) must determine annually whether to approve the continuation of the Trust’s investment advisory and sub-advisory agreements. In this regard, at an in-person meeting held on May 19-20, 2015 (the “Meeting”), the Board, all the members of which have no direct or indirect interest in the investment advisory and sub-advisory agreements and are not “interested persons” of the Trust, as defined in the 1940 Act (the “Independent Trustees”), reviewed and approved for Wells Fargo Advantage Asia Pacific Fund (the “Fund”): (i) an investment advisory agreement (the “Advisory Agreement”) with Wells Fargo Funds Management, LLC (“Funds Management”); (ii) an investment management agreement (the “Management Agreement”) with Funds Management; and (iii) an investment sub-advisory agreement (the “Sub-Advisory Agreement”) with Wells Capital Management Incorporated (the “Sub-Adviser”), an affiliate of Funds Management. The Management Agreement combines the terms of the Advisory Agreement with the terms of the Fund’s Amended and Restated Administration Agreement (the “Administration Agreement”) applicable to Fund-level administrative services. The Advisory Agreement, the Management Agreement and the Sub-Advisory Agreement are collectively referred to as the “Advisory Agreements.”
At the Meeting, the Board considered the factors and reached the conclusions described below relating to the selection of Funds Management and the Sub-Adviser and the approval of the Advisory Agreements. Prior to the Meeting, including at an in-person meeting in March 2015, the Trustees conferred extensively among themselves and with representatives of Funds Management about these matters. Also, the Board has adopted a team-based approach, with each team consisting of a sub-set of Trustees, to assist the full Board in the discharge of its duties in reviewing performance and other matters throughout the year. The Independent Trustees were assisted in their evaluation of the Advisory Agreements by independent legal counsel, from whom they received separate legal advice and with whom they met separately.
In providing information to the Board, Funds Management and the Sub-Adviser were guided by a detailed set of requests for information submitted to them by independent legal counsel on behalf of the Independent Trustees at the start of the Board’s annual contract renewal process earlier in 2015. In considering and approving the Advisory Agreements, the Trustees considered the information they believed relevant, including but not limited to the information discussed below. The Board considered not only the specific information presented in connection with the Meeting, but also the knowledge gained over time through interaction with Funds Management and the Sub-Adviser about various topics. In this regard, the Board reviewed reports of Funds Management at each of its quarterly meetings, which included, among other things, portfolio reviews and performance reports. In addition, the Board and the teams mentioned above confer with portfolio managers at various times throughout the year. The Board did not identify any particular information or consideration that was all-important or controlling, and each individual Trustee may have attributed different weights to various factors.
After its deliberations, the Board unanimously approved the continuation of the Advisory Agreement for the period from June 1, 2015 through June 30, 2015, approved the Management Agreement for the period from July 1, 2015 through May 31, 2016, and approved the continuation of the Sub-Advisory Agreement for a one-year term through May 31, 2016. The Board also determined that the compensation payable to Funds Management and the Sub-Adviser under each of the Advisory Agreements was reasonable. The Board considered the approval of the Advisory Agreements for the Fund as part of its consideration of agreements for funds across the complex, but its approvals were made on a fund-by-fund basis. The following summarizes a number of important, but not necessarily all, factors considered by the Board in support of its approvals.
Nature, extent and quality of services
The Board received and considered various information regarding the nature, extent and quality of services provided to the Fund by Funds Management and the Sub-Adviser under the Advisory Agreements. This information included, among other things, a summary of the background and experience of senior management of Funds Management, and the qualifications, background, tenure and responsibilities of each of the portfolio managers primarily responsible for the day-to-day portfolio management of the Fund. The Board noted that the services to be provided to the Fund pursuant to the Management Agreement combined the advisory services previously provided to the Fund pursuant to the Fund’s Advisory Agreement with the Fund-level administrative services previously provided to the Fund pursuant to the Fund’s Administration Agreement. The Board received a representation from Funds Management that combining these services would not result in any change to the nature or level of services provided by Funds Management to the Fund.
The Board evaluated the ability of Funds Management and the Sub-Adviser to attract and retain qualified investment professionals, including research, advisory and supervisory personnel. The Board further considered the compliance
| | | | | | |
| Other information (unaudited) | | Wells Fargo Asia Pacific Fund | | | 31 | |
programs and compliance records of Funds Management and the Sub-Adviser. In addition, the Board took into account the full range of services provided to the Fund by Funds Management and its affiliates.
Fund performance and expenses
The Board considered the performance results for the Fund over various time periods ended March 31, 2015. The Board considered these results in comparison to the performance of funds in a universe that was determined by Lipper Inc. (“Lipper”) to be similar to the Fund (the “Universe”), and in comparison to the Fund’s benchmark index and to other comparative data. Lipper is an independent provider of investment company data. The Board received a description of the methodology used by Lipper to select the mutual funds in the performance Universe. The Board noted that the performance of the Fund (Class A) was higher than the average performance of the Universe for all periods under review. The Board also noted that the performance of the Fund was higher than its benchmark, the MSCI All Country Asia Pacific Index (Net), for all periods under review except the first quarter of 2015.
The Board also received and considered information regarding the Fund’s net operating expense ratios and their various components, including actual management fees (which reflect fee waivers, if any, and include advisory, administration and transfer agent fees), custodian and other non-management fees, and Rule 12b-1 and non-Rule 12b-1 service fees. The Board considered these ratios in comparison to the median ratios of funds in class-specific expense groups that were determined by Lipper to be similar to the Fund (the “Groups”). The Board received a description of the methodology used by Lipper to select the mutual funds in the expense Groups and an explanation of how funds comprising expense groups and their expense ratios may vary from year-to-year. Based on the Lipper reports, the Board noted that the net operating expense ratios of the Fund were lower than the median net operating expense ratios of the expense Groups. The Board discussed and accepted Funds Management’s proposal to increase the net operating expense ratio cap for the Administrator Class. In accepting such proposed new net operating expense ratio cap, the Board noted that the Fund’s new net operating expense ratios would still be lower than the median net operating expense ratio of the expense Groups. The Board also discussed and accepted Funds Management’s proposal to convert the Investor Class shares into Class A shares.
The Board took into account the Fund performance and expense information provided to it among the factors considered in deciding to re-approve the Advisory Agreement and Sub-Advisory Agreement and approve the Management Agreement.
Investment advisory and sub-advisory fee rates
The Board reviewed and considered the contractual investment advisory fee rates that are payable by the Fund to Funds Management for investment advisory services (the “Advisory Agreement Rates”), both on a stand-alone basis and on a combined basis with the Fund’s fund-level and class-level contractual administration fee rates (the “Management Rates”). The Board noted that the Management Rates include transfer agency and sub-transfer agency costs. The Board also noted that the fee rate to be paid by the Fund under the Management Agreement will incorporate the advisory fee and Fund-level administration fee previously payable separately by the Fund under the Fund’s Advisory Agreement and Administration Agreement with Funds Management. The Board also reviewed and considered the contractual investment sub-advisory fee rates that are payable by Funds Management to the Sub-Adviser for investment sub-advisory services (the “Sub-Advisory Agreement Rates”).
Among other information reviewed by the Board was a comparison of the Management Rates of the Fund with those of other funds in the expense Groups at a common asset level. The Board noted that the Management Rates of the Fund were in range of the average rates for the Fund’s expense Groups for all share classes except the Investor Class. The Board discussed and accepted Funds Management’s proposal to convert the Investor Class shares into Class A shares.
The Board also received and considered information about the portion of the total advisory fee that was retained by Funds Management after payment of the fee to the Sub-Adviser for sub-advisory services. In assessing the reasonableness of this amount, the Board received and evaluated information about the nature and extent of responsibilities retained and risks assumed by Funds Management and not delegated to or assumed by the Sub-Adviser, and about Funds Management’s on-going oversight services. However, given the affiliation between Funds Management and the Sub-Adviser, the Board ascribed limited relevance to the allocation of the advisory fee between them.
The Board also received and considered information about the nature and extent of services offered and fee rates charged by Funds Management and the Sub-Adviser to other types of clients with investment strategies similar to those of the Fund. In this regard, the Board received information about the significantly greater scope of services, and compliance, reporting and other legal burdens and risks of managing mutual funds compared with those associated with managing assets of non-mutual fund clients such as collective funds or institutional separate accounts.
| | | | |
| 32 | | Wells Fargo Asia Pacific Fund | | Other information (unaudited) |
Based on its consideration of the factors and information it deemed relevant, including those described here, the Board determined that the compensation payable to Funds Management under the Management Agreement and Advisory Agreement and to the Sub-Adviser under the Sub-Advisory Agreement was reasonable, in light of the services covered by the Advisory Agreements.
Profitability
The Board received and considered information concerning the profitability of Funds Management, as well as the profitability of Wells Fargo as a whole, from providing services to the Fund and the fund family as a whole. The Board also received and considered information concerning the profitability of the Sub-Adviser from providing services to the fund family as a whole, noting that the Sub-Adviser’s profitability information with respect to providing services to the Fund was subsumed in the Wells Fargo profitability analysis.
Funds Management reported on the methodologies and estimates used in calculating profitability. Among other things, the Board noted that the levels of profitability reported on a fund-by-fund basis varied widely, depending on factors such as the size and type of fund. Based on its review, the Board did not deem the profits reported by Funds Management or Wells Fargo from its services to the Fund to be at a level that would prevent it from approving the continuation of the Advisory Agreements.
Economies of scale
With respect to possible economies of scale, the Board noted the existence of breakpoints in the Fund’s advisory and management fee structures, and the Fund’s administration fee structure, which operate generally to reduce the Fund’s expense ratios as the Fund grows in size. It considered that, for a small fund or a fund that shrinks in size, breakpoints conversely can result in higher fee levels. The Board also considered that fee waiver and expense reimbursement arrangements and competitive fee rates at the outset are means of sharing potential economies of scale with shareholders of the Fund and the fund family as a whole. The Board considered Funds Management’s view that any analyses of potential economies of scale in managing a particular fund are inherently limited in light of the joint and common costs and investments that Funds Management incurs across the fund family as a whole.
The Board concluded that the Fund’s fee and expense arrangements, including contractual breakpoints, constituted a reasonable approach to sharing potential economies of scale with the Fund and its shareholders.
Other benefits to Funds Management and the Sub-Adviser
The Board received and considered information regarding potential “fall-out” or ancillary benefits received by Funds Management and its affiliates, including the Sub-Adviser, as a result of their relationships with the Fund. Ancillary benefits could include, among others, benefits directly attributable to other relationships with the Fund and benefits potentially derived from an increase in Funds Management’s and the Sub-Adviser’s business as a result of their relationships with the Fund. The Board noted that various affiliates of Funds Management may receive distribution-related fees, shareholder servicing payments and sub-transfer agency fees in respect of shares sold or held through them and services provided.
The Board also reviewed information about soft dollar credits earned and utilized by the Sub-Adviser, fees earned by Funds Management and the Sub-Adviser from managing a private investment vehicle for the fund family’s securities lending collateral and commissions earned by an affiliated broker from portfolio transactions.
Based on its consideration of the factors and information it deemed relevant, including those described here, the Board did not find that any ancillary benefits received by Funds Management and its affiliates, including the Sub-Adviser, were unreasonable.
Conclusion
At the Meeting, after considering the above-described factors and based on its deliberations and its evaluation of the information described above, the Board unanimously approved the continuation of the Advisory Agreement for the period from June 1, 2015 through June 30, 2015, approved the Management Agreement for the period from July 1, 2015 through May 31, 2016, and approved the continuation of the Sub-Advisory Agreement for a one-year term through May 31, 2016. The Board also determined that the compensation payable to Funds Management and the Sub-Adviser under each of the Advisory Agreements was reasonable.
| | | | | | |
| List of abbreviations | | Wells Fargo Asia Pacific Fund | | | 33 | |
The following is a list of common abbreviations for terms and entities that may have appeared in this report.
| ACA | — ACA Financial Guaranty Corporation |
| ADR | — American depositary receipt |
| ADS | — American depositary shares |
| AGC | — Assured Guaranty Corporation |
| AGM | — Assured Guaranty Municipal |
| Ambac | — Ambac Financial Group Incorporated |
| AMT | — Alternative minimum tax |
| BAN | — Bond anticipation notes |
| BHAC | — Berkshire Hathaway Assurance Corporation |
| CAB | — Capital appreciation bond |
| CCAB | — Convertible capital appreciation bond |
| CDA | — Community Development Authority |
| CDO | — Collateralized debt obligation |
| DRIVER | — Derivative inverse tax-exempt receipts |
| DW&P | — Department of Water & Power |
| DWR | — Department of Water Resources |
| ECFA | — Educational & Cultural Facilities Authority |
| EDA | — Economic Development Authority |
| EDFA | — Economic Development Finance Authority |
| ETF | — Exchange-traded fund |
| FDIC | — Federal Deposit Insurance Corporation |
| FFCB | — Federal Farm Credit Banks |
| FGIC | — Financial Guaranty Insurance Corporation |
| FHA | — Federal Housing Administration |
| FHLB | — Federal Home Loan Bank |
| FHLMC | — Federal Home Loan Mortgage Corporation |
| FICO | — The Financing Corporation |
| FNMA | — Federal National Mortgage Association |
| GDR | — Global depositary receipt |
| GNMA | — Government National Mortgage Association |
| HCFR | — Healthcare facilities revenue |
| HEFA | — Health & Educational Facilities Authority |
| HEFAR | — Higher education facilities authority revenue |
| HFA | — Housing Finance Authority |
| HFFA | — Health Facilities Financing Authority |
| HUD | — Department of Housing and Urban Development |
| IDA | — Industrial Development Authority |
| IDAG | — Industrial Development Agency |
| KRW | — Republic of Korea won |
| LIBOR | — London Interbank Offered Rate |
| LIFER | — Long Inverse Floating Exempt Receipts |
| LLC | — Limited liability company |
| LLLP | — Limited liability limited partnership |
| LLP | — Limited liability partnership |
| MBIA | — Municipal Bond Insurance Association |
| MFHR | — Multifamily housing revenue |
| MSTR | — Municipal securities trust receipts |
| MUD | — Municipal Utility District |
| National | — National Public Finance Guarantee Corporation |
| PCFA | — Pollution Control Financing Authority |
| PCL | — Public Company Limited |
| PCR | — Pollution control revenue |
| PFA | — Public Finance Authority |
| PFFA | — Public Facilities Financing Authority |
| PFOTER | — Puttable floating option tax-exempt receipts |
| plc | — Public limited company |
| PUTTER | — Puttable tax-exempt receipts |
| R&D | — Research & development |
| Radian | — Radian Asset Assurance |
| RAN | — Revenue anticipation notes |
| RDA | — Redevelopment Authority |
| RDFA | — Redevelopment Finance Authority |
| REIT | — Real estate investment trust |
| ROC | — Reset option certificates |
| SAVRS | — Select auction variable rate securities |
| SBA | — Small Business Authority |
| SDR | — Swedish depositary receipt |
| SFHR | — Single-family housing revenue |
| SFMR | — Single-family mortgage revenue |
| SPA | — Standby purchase agreement |
| SPDR | — Standard & Poor’s Depositary Receipts |
| SPEAR | — Short Puttable Exempt Adjustable Receipts |
| STRIPS | — Separate trading of registered interest and |
| TAN | — Tax anticipation notes |
| TIPS | — Treasury inflation-protected securities |
| TRAN | — Tax revenue anticipation notes |
| TTFA | — Transportation Trust Fund Authority |
| TVA | — Tennessee Valley Authority |
This page is intentionally left blank.
This page is intentionally left blank.
This page is intentionally left blank.

For more information
More information about Wells Fargo Funds is available free upon request. To obtain literature, please write, email, visit the Fund’s website, or call:
Wells Fargo Funds
P.O. Box 8266
Boston, MA 02266-8266
Email: wfaf@wellsfargo.com
Website: wellsfargofunds.com
Individual investors: 1-800-222-8222
Retail investment professionals: 1-888-877-9275
Institutional investment professionals: 1-866-765-0778
This report and the financial statements contained herein are submitted for the general information of the shareholders of Wells Fargo Funds. If this report is used for promotional purposes, distribution of the report must be accompanied or preceded by a current prospectus. Before investing, please consider the investment objectives, risks, charges, and expenses of the investment. For a current prospectus and, if available, a summary prospectus, containing this information, call 1-800-222-8222 or visit the Fund’s website at wellsfargofunds.com. Read the prospectus carefully before you invest or send money.
Wells Fargo Funds Management, LLC, a wholly owned subsidiary of Wells Fargo & Company, provides investment advisory and administrative services for Wells Fargo Funds. Other affiliates of Wells Fargo & Company provide subadvisory and other services for the Funds. The Funds are distributed by Wells Fargo Funds Distributor, LLC, Member FINRA, an affiliate of Wells Fargo & Company.
NOT FDIC INSURED ¡ NO BANK GUARANTEE ¡ MAY LOSE VALUE
© 2015 Wells Fargo Funds Management, LLC. All rights reserved.
| | |
 | | 238505 12-15 A236/AR236 10-15 |
Annual Report
October 31, 2015

Wells Fargo Diversified International Fund


Reduce clutter. Save trees.
Sign up for electronic delivery of prospectuses and shareholder reports at wellsfargo.com/advantagedelivery
Contents
The views expressed and any forward-looking statements are as of October 31, 2015, unless otherwise noted, and are those of the Fund managers and/or Wells Fargo Funds Management, LLC. Discussions of individual securities, or the markets generally, or any Wells Fargo Fund are not intended as individual recommendations. Future events or results may vary significantly from those expressed in any forward-looking statements. The views expressed are subject to change at any time in response to changing circumstances in the market. Wells Fargo Funds Management, LLC and the Fund disclaim any obligation to publicly update or revise any views expressed or forward-looking statements.
NOT FDIC INSURED ¡ NO BANK GUARANTEE ¡ MAY LOSE VALUE
| | | | |
| 2 | | Wells Fargo Diversified International Fund | | Letter to shareholders (unaudited) |

Karla M. Rabusch
President
Wells Fargo Funds
Signs of encouragement in the eurozone were more than offset by slowing economic growth in China.
The decline of oil and natural gas prices that began during the summer of 2014 continued into 2015.
Dear Valued Shareholder:
We are pleased to offer you this annual report for the Wells Fargo Diversified International Fund for the 12-month period that ended October 31, 2015. During the period, investors confronted concerns about slowing economic growth in China and a dramatic rise and fall in the country’s equity markets, diverging central bank policies globally, contentious negotiations to refinance Greece’s sovereign debt, low commodity prices, and ongoing currency volatility. These disparate influences tended to obscure improving economic data in the U.S. and several developed European countries.
Low commodity prices and slower global growth overshadowed improved economic data.
In Europe, the eurozone’s largest economies—France, Germany, Italy, and Spain—reported gross domestic product (GDP) growth on an annualized basis for the second quarter of 2015, although results were uneven for smaller, developing economies in the region. While annualized GDP growth slowed in the third quarter in the eurozone overall, it remained positive. Signs of encouragement in the eurozone were more than offset by slowing economic growth in China. China posted third-quarter GDP growth of 6.9%. While that pace might be envied by other developed economies, it is below levels many investors have come to expect from China. Furthermore, the government indicated the full-year growth target of 7% may not be met.
Stocks generally moved higher in April and early May 2015 before events served to discourage equity investors as summer advanced. The decline of oil and natural gas prices that began during the summer of 2014 continued into 2015. At the same time, the value of the U.S. dollar increased relative to other currencies, particularly those in emerging markets. Both conditions concerned investors. Sustained low oil, natural gas, and other commodity prices hampered economies in several emerging markets. Slowed commodity consumption among developed markets also suggested a deceleration of global growth.
Global central bank policies diverge.
After ending its quantitative easing-related bond-buying program toward the end of 2014, the U.S. Federal Reserve (Fed) signaled its intention to increase the federal funds rate. However, concerns about slowing growth, particularly in emerging markets, prompted the Fed to defer an interest-rate increase. Investors globally fell into a holding pattern at times as they tried to anticipate the Fed’s next move. Meanwhile, the Bank of Japan announced in October 2014 significant expansion of its economic stimulus programs to include additional injections of liquidity into the economy through bond purchases. In addition, the Government Pension Investment Fund announced plans to reduce government bond investments and direct those assets to investments in the Japanese stock market. The People’s Bank of China also took initiatives to spur economic growth by cutting interest rates for the sixth time in less than a year in October 2015; lowering bank reserve requirements to encourage lending; and allowing the renminbi to depreciate to support exports and to advance government efforts to transition to a more market-driven economy.
During the summer of 2015, the Hang Seng Index1 in Hong Kong experienced a dramatic decline after a similarly dramatic ascent during late 2014 and early 2015, falling to levels not seen since 2013. Contentious negotiations between Greece and its debtors to refinance the country’s sovereign debt also concerned investors during June 2015. After weeks of stalemated negotiations, the government accepted additional spending reductions in order to secure new loan agreements.
| 1 | The Hang Seng Index is a free-float-adjusted market-capitalization-weighted stock market index in Hong Kong. It is used to record and monitor daily changes of the largest companies of the Hong Kong stock market and is the main indicator of the overall market performance in Hong Kong. You cannot invest directly in an index. |
| | | | | | |
| Letter to shareholders (unaudited) | | Wells Fargo Diversified International Fund | | | 3 | |
Developed European and Asian equity markets, as measured by the Morgan Stanley Capital International (MSCI) Europe, Australasia, Far East (EAFE) Index (Net)2 returned -0.07% for the 12-month period that ended October 31, 2015.
The effect of slowing growth in China, a stronger U.S. dollar, and stubbornly low prices for oil, natural gas, and other commodities was particularly difficult for many emerging markets economies that rely on commodities as an economic engine. During the period, emerging markets stocks suffered more significantly than international developed markets, earning a return of -14.53%, as measured by the MSCI Emerging Markets Index (Net).3 U.S. investors in international equity markets also often saw the value of their overseas investments reduced upon translation to dollars.
Don’t let short-term uncertainty derail long-term investment goals.
Periods of investment uncertainty can present challenges, but experience has taught us that maintaining long-term investment goals can be an effective way to plan for the future. To help you create a sound strategy based on your personal goals and risk tolerance, Wells Fargo Funds offers more than 100 mutual funds and other investments spanning a wide range of asset classes and investment styles. Although diversification cannot guarantee an investment profit or prevent losses, we believe it can be an effective way to manage investment risk and potentially smooth out overall portfolio performance. We encourage investors to know their investments and to understand that appropriate levels of risk-taking may unlock opportunities.
Thank you for choosing to invest with Wells Fargo Funds. We appreciate your confidence in us and remain committed to helping you meet your financial needs.
Sincerely,

Karla M. Rabusch
President
Wells Fargo Funds
Notice to shareholders
At a meeting held August 11-12, 2015, the Board of Trustees of the Fund approved a change in the name of the Fund whereby the word “Advantage” was removed from its name, effective December 15, 2015.
For current information about your fund investments, contact your investment professional, visit our website at wellsfargofunds.com, or call us directly at 1-800-222-8222. We are available 24 hours a day, 7 days a week.
| 2 | Morgan Stanley Capital International (MSCI) Europe, Australasia, Far East (EAFE) Index (Net) is a free-float-adjusted market-capitalization-weighted index that is designed to measure the equity market performance of developed markets, excluding the U.S. and Canada. The MSCI EAFE Index (Net) consists of the following 21 developed markets country indexes: Australia, Austria, Belgium, Denmark, Finland, France, Germany, Hong Kong, Ireland, Israel, Italy, Japan, the Netherlands, New Zealand, Norway, Portugal, Singapore, Spain, Sweden, Switzerland, and the United Kingdom. You cannot invest directly in an index. Source: MSCI. MSCI makes no express or implied warranties or representations and shall have no liability whatsoever with respect to any MSCI data contained herein. The MSCI data may not be further redistributed or used as a basis for other indexes or any securities or financial products. This report is not approved, reviewed, or produced by MSCI. |
| 3 | MSCI Emerging Markets Index (Net) is a free-float-adjusted market-capitalization-weighted index that is designed to measure the equity market performance of emerging markets. The MSCI Emerging Markets Index (Net) consists of the following 23 emerging markets country indexes: Brazil, Chile, China, Colombia, Czech Republic, Egypt, Greece, Hungary, India, Indonesia, Korea, Malaysia, Mexico, Peru, the Philippines, Poland, Qatar, Russia, South Africa, Taiwan, Thailand, Turkey, and United Arab Emirates. You cannot invest directly in an index. |
| | | | |
| 4 | | Wells Fargo Diversified International Fund | | Performance highlights (unaudited) |
Investment objective
The Fund seeks long-term total capital appreciation.
Manager
Wells Fargo Funds Management, LLC
Subadvisers
Artisan Partners Limited Partnership
LSV Asset Management
Wells Capital Management Incorporated
Portfolio managers
Jeffrey Everett, CFA
Josef Lakonishok, Ph.D.
Puneet Mansharamani, CFA
Menno Vermeulen, CFA
Dale A. Winner, CFA
Mark L. Yockey, CFA
Average annual total returns (%) as of October 31, 20151
| | | | | | | | | | | | | | | | | | | | | | | | | | | | | | | | | | |
| | | | | Including sales charge | | | Excluding sales charge | | | Expense ratios2 (%) | |
| | | Inception date | | 1 year | | | 5 year | | | 10 year | | | 1 year | | | 5 year | | | 10 year | | | Gross | | | Net3 | |
| Class A (SILAX) | | 9-24-1997 | | | (6.35 | ) | | | 3.81 | | | | 2.84 | | | | (0.66 | ) | | | 5.06 | | | | 3.46 | | | | 1.71 | | | | 1.41 | |
| Class B (SILBX)* | | 9-24-1997 | | | (6.39 | ) | | | 3.92 | | | | 2.92 | | | | (1.39 | ) | | | 4.26 | | | | 2.92 | | | | 2.46 | | | | 2.16 | |
| Class C (WFECX) | | 4-1-1998 | | | (2.44 | ) | | | 4.25 | | | | 2.70 | | | | (1.44 | ) | | | 4.25 | | | | 2.70 | | | | 2.46 | | | | 2.16 | |
| Class R (WDIHX) | | 9-30-2015 | | | – | | | | – | | | | – | | | | (0.86 | ) | | | 4.85 | | | | 3.29 | | | | 1.96 | | | | 1.60 | |
| Class R6 (WDIRX) | | 9-30-2015 | | | – | | | | – | | | | – | | | | (0.46 | ) | | | 5.23 | | | | 3.66 | | | | 1.28 | | | | 0.89 | |
| Administrator Class (WFIEK) | | 11-8-1999 | | | – | | | | – | | | | – | | | | (0.46 | ) | | | 5.23 | | | | 3.66 | | | | 1.63 | | | | 1.25 | |
| Institutional Class (WFISX) | | 8-31-2006 | | | – | | | | – | | | | – | | | | (0.23 | ) | | | 5.41 | | | | 3.84 | | | | 1.38 | | | | 0.99 | |
| MSCI EAFE Index (Net)4 | | – | | | – | | | | – | | | | – | | | | (0.07 | ) | | | 4.81 | | | | 4.05 | | | | – | | | | – | |
| * | | Class B shares are closed to investment, except in connection with the reinvestment of any distributions and permitted exchanges. |
Figures quoted represent past performance, which is no guarantee of future results, and do not reflect taxes that a shareholder may pay on fund distributions or the redemption of fund shares. Investment return and principal value of an investment will fluctuate so that an investor’s shares, when redeemed, may be worth more or less than their original cost. Performance shown without sales charges would be lower if sales charges were reflected. Current performance may be lower or higher than the performance data quoted, which assumes the reinvestment of dividends and capital gains. Current month-end performance is available on the Fund’s website, wellsfargofunds.com.
Index returns do not include transaction costs associated with buying and selling securities, any mutual fund fees or expenses, or any taxes. It is not possible to invest directly in an index.
For Class A shares, the maximum front-end sales charge is 5.75%. For Class B shares, the maximum contingent deferred sales charge is 5.00%. For Class C shares, the maximum contingent deferred sales charge is 1.00%. Performance including a contingent deferred sales charge assumes the sales charge for the corresponding time period. Class R, Class R6, Administrator Class, and Institutional Class shares are sold without a front-end sales charge or contingent deferred sales charge.
Stock values fluctuate in response to the activities of individual companies and general market and economic conditions. Foreign investments are especially volatile and can rise or fall dramatically due to differences in the political and economic conditions of the host country. These risks are generally intensified in emerging markets. The use of derivatives may reduce returns and/or increase volatility. Certain investment strategies tend to increase the total risk of an investment (relative to the broader market). The Fund is exposed to smaller-company securities risk. Consult the Fund’s prospectus for additional information on these and other risks.
Please see footnotes on page 5.
| | | | | | |
| Performance highlights (unaudited) | | Wells Fargo Diversified International Fund | | | 5 | |
|
Growth of $10,000 investment as of October 31, 20155 |
|
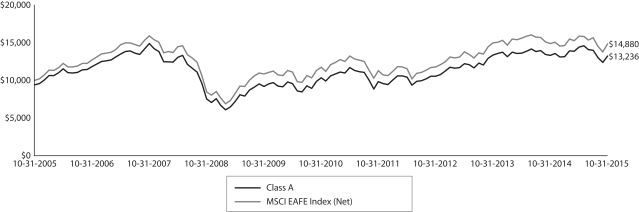 |
| 1 | Historical performance shown for the Class R shares prior to their inception reflects the performance of the Administrator Class shares, adjusted to reflect the higher expenses applicable to Class R shares. Historical performance shown for the Class R6 shares prior to their inception reflects the performance of the Administrator Class shares, and includes the higher expenses applicable to Administrator Class shares. If these expenses had not been included, returns for Class R6 would be higher. |
| 2 | Reflects the expense ratios as stated in the most recent prospectus. The expense ratios shown are subject to change and may differ from the annualized expense ratios shown in the financial highlights of this report. |
| 3 | The manager has contractually committed through February 29, 2016 (February 28, 2017 for Class R and Class R6), to waive fees and/or reimburse expenses to the extent necessary to cap the Fund’s Total Annual Operating Expenses After Fee Waiver at the amounts shown. After this time, the cap may be increased or the commitment to maintain the cap may be terminated only with the approval of the Board of Trustees. Brokerage commissions, stamp duty fees, interest, taxes, acquired fees and expenses, and extraordinary expenses are excluded from the cap. Without this cap, the Fund’s returns would have been lower. |
| 4 | The Morgan Stanley Capital International (MSCI) Europe, Australasia, and Far East (EAFE) Index (Net) is a free-float-adjusted market-capitalization weighted index that is designed to measure the equity market performance of developed markets, excluding the U.S. and Canada. The MSCI EAFE Index (Net) consists of the following 21 developed markets country indexes: Australia, Austria, Belgium, Denmark, Finland, France, Germany, Hong Kong, Ireland, Israel, Italy, Japan, the Netherlands, New Zealand, Norway, Portugal, Singapore, Spain, Sweden, Switzerland, and the United Kingdom. You cannot invest directly in an index. Source: MSCI. MSCI makes no express or implied warranties or representations and shall have no liability whatsoever with respect to any MSCI data contained herein. The MSCI data may not be further redistributed or used as a basis for other indexes or any securities or financial products. This report is not approved, reviewed, or produced by MSCI. |
| 5 | The chart compares the performance of Class A shares for the most recent ten years with the MSCI EAFE Index (Net). The chart assumes a hypothetical investment of $10,000 in Class A shares and reflects all operating expenses and assumes the maximum initial sales charge of 5.75%. |
| 6 | The ten largest holdings, excluding cash and cash equivalents, are calculated based on the value of the investments divided by total net assets of the Fund. Holdings are subject to change and may have changed since the date specified. |
| 7 | Amounts are calculated based on the total long-term investments of the Fund. These amounts are subject to change and may have changed since the date specified. |
| | | | |
| 6 | | Wells Fargo Diversified International Fund | | Performance highlights (unaudited) |
MANAGERS’ DISCUSSION
Fund highlights
| n | | The Fund underperformed its benchmark, the MSCI EAFE Index (Net), for the 12-month period that ended October 31, 2015. |
| n | | Two of the three subadvisors—LSV Asset Management (LSV) and Artisan Partners Limited Partnership (Artisan Partners)—struggled for the reporting period. Value stocks significantly underperformed growth stocks, creating a more challenging investment climate for LSV. Artisan Partners’ investments in China accounted for the majority of its underperformance. Wells Capital Management Incorporated (WellsCap) posted strong relative results for the period. |
| n | | All three teams continued to execute their disciplined investment approaches, and all continued to find what they believed were attractive investment candidates in the current market environment. |
During the 12-month reporting period, the MSCI EAFE Index (Net) advanced 9.1% in local-currency terms. However, the effect of an appreciating dollar erased gains for U.S. dollar–based investors, and the index declined 0.07% in U.S. dollar terms.
WellsCap
WellsCap maintains a blend equity style that emphasizes bottom-up stock selection based on rigorous, in-depth fundamental company research and incorporates consideration of top-down factors and developments as they affect market and economic activity within regions, countries, and sectors.
The investment team generated positive absolute and relative returns, identifying opportunities in Japan, developed Europe, and Hong Kong/China, with mixed findings across emerging markets.
Some of the best stock performances came from the financial services sector, with ANIMA Holding S.p.A. the top relative contributor. Other notable contributors included China Everbright Limited; Man Group plc; Daiwa House Industry Company, Limited; and Rheinmetall AG. Detractors included Hitachi, Limited; Hana Financial Group Incorporated; Coca-Cola East Japan Company, Limited; QUALCOMM Incorporated; and Eni S.p.A. We exited the Fund’s holding in scandal-ridden Volkswagen AG.
In Europe, opportunities arose based on microeconomic fundamentals and signs of a cyclical economic recovery. We favored companies that are engaged in self-help restructuring through the implementation of operational efficiencies such as careful investment, cost cutting, and portfolio reshaping. Such companies seem set to bolster their profitability and benefit from the additional impetus of structural reforms and continent-wide cyclical recovery. In Italy, targeted reforms, ranging from streamlining the country’s banking system and public bureaucracy to labor market and tax incentives, are further uplifting economic activity and benefiting holdings Prysmian S.p.A. and ANIMA Holding. In Germany, we added to positions in Rheinmetall and initiated holdings in SAP AG.
In Japan, the distinctions between corporate new Japan and old Japan continued to widen. We watched core holdings transform their operating margins from lows of close to 5% three years ago to well over double that magnitude in industry segments ranging from those with rising domestic reflation—such as Mitsubishi UFJ Financial Group, Incorporated, and Mitsui Fudosan Company, Limited—to areas marked by increased innovation, such as Yaskawa Electric Corporation. While the reform program initiated by Prime Minister Shinzō Abe—popularly known as Abenomics—has already demonstrated the force and flexibility of incipient monetary and fiscal accommodation, elements of the more difficult to achieve long-term structural and corporate governance reforms are just beginning to take shape.
This past year’s volatility in global capital markets was no more evident than in the swings in China’s A-share market, coincident with disruptions in energy and metals commodity markets. Our base-case assessment suggests that Chinese officials have several policy levers at their disposal to gradually assist with a more orderly and flexible adjustment. We continued to build positions in undervalued restructuring state-owned enterprises such as China Mobile Limited. We particularly favor the reforming financial services arena, represented by holding China Everbright Limited. We also liked several firms poised to benefit from the nation’s move away from industrial and commodity spending to consumer and discretionary spending, including Dongfeng Motor Group Company, Limited, and Kweichow Moutai Company, Limited.
We retained an underweight to emerging markets equities. Outside of China and South Korea, we find few opportunities in emerging markets and increasing company, country, and currency risks. An underweight to Brazil aided relative results given that market’s weak performance.
Please see footnotes on page 5.
| | | | | | |
| Performance highlights (unaudited) | | Wells Fargo Diversified International Fund | | | 7 | |
| | | | |
| Ten largest holdings (%) as of October 31, 20156 | |
Bayer AG | | | 2.16 | |
Baidu Incorporated ADR | | | 1.62 | |
Toyota Motor Corporation | | | 1.60 | |
Mitsubishi UFJ Financial Group Incorporated | | | 1.46 | |
Medtronic plc | | | 1.45 | |
AIA Group Limited | | | 1.18 | |
Rheinmetall AG | | | 1.17 | |
BP plc | | | 1.06 | |
Hitachi Limited | | | 1.06 | |
Novartis AG | | | 1.05 | |
Artisan partners
Artisan Partners invests in what the team considers to be dominant, high-quality companies that are exposed to positive secular growth trends or themes at reasonable valuations.
The reporting period opened on a high note as investors cheered Europe’s new quantitative easing program, though markets continued to grapple with falling commodity prices and deflationary pressures. Later in the period, mounting fears over China’s slowing growth triggered global volatility. The reporting period ended on an optimistic note as investors took solace in accommodative central bank policy in Europe and China.
The Artisan Partners portion of the Fund trailed the MSCI EAFE Index (Net). Stock-specific factors were a main source of underperformance. Chinese internet company Baidu, Incorporated, and German automaker Porsche Automobil Holding SE were notable detractors. Baidu announced a major speculative investment in online-to-offline offerings, such as group buying and movie tickets, which is expected to weigh on margins in the near to medium term. Still, Baidu’s core search business remains strong. Porsche was initially pressured by slowing Chinese end-market demand. Later, shares fell sharply in response to an emissions-cheating scandal involving Volkswagen (of which Porsche is a major shareholder). We fully exited the position in October 2015.
Contributors included health care products company Covidien plc and Irish airline Ryanair Limited.* Covidien was acquired by Medtronic PLC (a current portfolio holding), unlocking substantial synergies. Ryanair’s differentiated growth strategy targeting high-frequency, short-haul routes across Europe proved successful, yielding steadily increasing monthly passenger growth and market-share gains.
As always, our portfolio positioning was the residual of our bottom-up investment process and a strategy that has remained consistent for the past 20 years. Looking forward, we would not be surprised to see heightened volatility as markets digest China’s new normal growth rate. Because China is a major commodity importer, the potential for further downward pressure on commodity-price-dependent countries and companies is likely, in our view. These are areas we’ve typically steered clear of, and now is no exception. Instead, we continue to do what we’ve always done: seek what we believe are high-quality companies with sustainable competitive advantages exposed to longer-term areas of secular growth.
|
| Sector distribution as of October 31, 20157 |
|
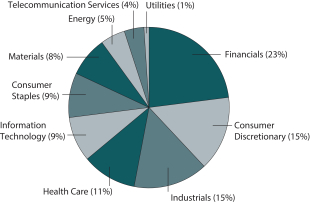 |
LSV
LSV seeks to add value through a quantitative selection process that favors deep-value stocks.
The LSV portion of the Fund underperformed the MSCI EAFE Index (Net) over the past 12 months, largely because of exposure to emerging markets and our deep- value bias.
Some of the best-performing sectors in the period included consumer staples and health care, as investors favored defensive stocks. We had difficulty finding cheap stocks in these sectors, and as a result, the portfolio was underweight relative to the benchmark. This positioning had a negative impact on performance, as did an overweight to energy stocks, particularly early in the period. Stock selection was mixed, with good selection in
the financials and industrials sectors. However, this was offset by poor selection in the utilities and consumer discretionary sectors. Notable contributors in the period included NTT DOCOMO, Incorporated, in the telecommunication services sector; GS Retail Company, Limited,* and Delhaize Group SA in the consumer staples sector; industrials holding
| * | This security was not held in the Fund at the end of the reporting period. |
Please see footnotes on page 5.
| | | | |
| 8 | | Wells Fargo Diversified International Fund | | Performance highlights (unaudited) |
Thales SA; and underweights to HSBC Holdings plc and BHP Billiton Limited. Detractors included Westjet Airlines Limited, Tata Motors Limited, Lend Lease Corporation Limited, Arrium Limited, and Banco do Brasil S.A.
The most significant changes in sector exposure over the past year were a decrease in the portfolio’s allocation to energy stocks and an increase in the exposure to consumer discretionary stocks. The LSV portion of the Fund is overweight financials and materials stocks and underweight consumer staples and health care. We believe that valuations in the LSV portion of the Fund remain attractive.
|
| Country allocation as of October 31, 20157 |
|
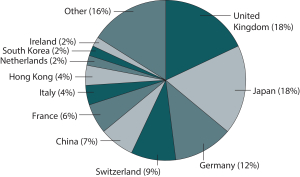 |
Please see footnotes on page 5.
| | | | | | |
| Fund expenses (unaudited) | | Wells Fargo Diversified International Fund | | | 9 | |
As a shareholder of the Fund, you incur two types of costs: (1) transaction costs, including sales charges (loads) on purchase payments and contingent deferred sales charges (if any) on redemptions and (2) ongoing costs, including management fees, distribution (12b-1) and/or shareholder servicing fees, and other Fund expenses. This example is intended to help you understand your ongoing costs (in dollars) of investing in the Fund and to compare these costs with the ongoing costs of investing in other mutual funds.
The example is based on an investment of $1,000 invested at the beginning of the six-month period and held for the entire period from May 1, 2015 to October 31, 2015.
Actual expenses
The “Actual” line of the table below provides information about actual account values and actual expenses. You may use the information in this line, together with the amount you invested, to estimate the expenses that you paid over the period. Simply divide your account value by $1,000 (for example, an $8,600 account value divided by $1,000 = 8.6), then multiply the result by the number in the “Actual” line under the heading entitled “Expenses paid during period” for your applicable class of shares to estimate the expenses you paid on your account during this period.
Hypothetical example for comparison purposes
The “Hypothetical” line of the table below provides information about hypothetical account values and hypothetical expenses based on the Fund’s actual expense ratio and an assumed rate of return of 5% per year before expenses, which is not the Fund’s actual return. The hypothetical account values and expenses may not be used to estimate the actual ending account balance or expenses you paid for the period. You may use this information to compare the ongoing costs of investing in the Fund and other funds. To do so, compare this 5% hypothetical example with the 5% hypothetical examples that appear in the shareholder reports of the other funds.
Please note that the expenses shown in the table are meant to highlight your ongoing costs only and do not reflect any transactional costs, such as sales charges (loads) and contingent deferred sales charges. Therefore, the “Hypothetical” line of the table is useful in comparing ongoing costs only and will not help you determine the relative total costs of owning different funds. In addition, if these transactional costs were included, your costs would have been higher.
| | | | | | | | | | | | | | | | |
| | | Beginning
account value
5-1-2015 | | | Ending
account value
10-31-2015 | | | Expenses
paid during
the period¹ | | | Net annualized
expense ratio | |
Class A | | | | | | | | | | | | | | | | |
Actual | | $ | 1,000.00 | | | $ | 917.32 | | | $ | 6.77 | | | | 1.40 | % |
Hypothetical (5% return before expenses) | | $ | 1,000.00 | | | $ | 1,018.15 | | | $ | 7.12 | | | | 1.40 | % |
Class B | | | | | | | | | | | | | | | | |
Actual | | $ | 1,000.00 | | | $ | 913.78 | | | $ | 10.37 | | | | 2.15 | % |
Hypothetical (5% return before expenses) | | $ | 1,000.00 | | | $ | 1,014.37 | | | $ | 10.92 | | | | 2.15 | % |
Class C | | | | | | | | | | | | | | | | |
Actual | | $ | 1,000.00 | | | $ | 914.04 | | | $ | 10.37 | | | | 2.15 | % |
Hypothetical (5% return before expenses) | | $ | 1,000.00 | | | $ | 1,014.37 | | | $ | 10.92 | | | | 2.15 | % |
Class R | | | | | | | | | | | | | | | | |
Actual | | $ | 1,000.00 | | | $ | 915.88 | | | $ | 7.73 | | | | 1.60 | % |
Hypothetical (5% return before expenses) | | $ | 1,000.00 | | | $ | 1,017.14 | | | $ | 8.13 | | | | 1.60 | % |
Class R6 | | | | | | | | | | | | | | | | |
Actual | | $ | 1,000.00 | | | $ | 918.02 | | | $ | 4.30 | | | | 0.89 | % |
Hypothetical (5% return before expenses) | | $ | 1,000.00 | | | $ | 1,020.72 | | | $ | 4.53 | | | | 0.89 | % |
Administrator Class | | | | | | | | | | | | | | | | |
Actual | | $ | 1,000.00 | | | $ | 918.02 | | | $ | 6.04 | | | | 1.25 | % |
Hypothetical (5% return before expenses) | | $ | 1,000.00 | | | $ | 1,018.90 | | | $ | 6.36 | | | | 1.25 | % |
Institutional Class | | | | | | | | | | | | | | | | |
Actual | | $ | 1,000.00 | | | $ | 919.14 | | | $ | 4.79 | | | | 0.99 | % |
Hypothetical (5% return before expenses) | | $ | 1,000.00 | | | $ | 1,020.21 | | | $ | 5.04 | | | | 0.99 | % |
| 1 | Expenses paid is equal to the annualized expense ratio of each class multiplied by the average account value over the period, multiplied by the number of days in the most recent fiscal half-year divided by the number of days in the fiscal year (to reflect the one-half-year period). |
| | | | |
| 10 | | Wells Fargo Diversified International Fund | | Portfolio of investments—October 31, 2015 |
| | | | | | | | | | | | |
| Security name | | | | | | Shares | | | Value | |
| | | | |
Common Stocks: 94.84% | | | | | | | | | | | | |
| | | | |
| Australia: 1.30% | | | | | | | | | | | | |
Arrium Limited (Materials, Metals & Mining) † | | | | | | | 397,400 | | | $ | 28,080 | |
Bendigo Bank Limited (Financials, Banks) | | | | | | | 26,100 | | | | 197,999 | |
BHP Billiton Limited (Materials, Metals & Mining) | | | | | | | 6,127 | | | | 100,487 | |
Challenger Financial Services Group Limited (Financials, Diversified Financial Services) | | | | | | | 36,300 | | | | 211,674 | |
CSR Limited (Materials, Construction Materials) | | | | | | | 59,900 | | | | 117,266 | |
Downer EDI Limited (Industrials, Commercial Services & Supplies) | | | | | | | 42,300 | | | | 106,296 | |
Fortescue Metals Group Limited (Materials, Metals & Mining) « | | | | | | | 29,600 | | | | 43,738 | |
Lend Lease Corporation Limited (Financials, Real Estate Management & Development) | | | | | | | 20,800 | | | | 191,308 | |
Metcash Limited (Consumer Staples, Food & Staples Retailing) | | | | | | | 28,500 | | | | 24,006 | |
Mineral Resources Limited (Materials, Metals & Mining) | | | | | | | 14,900 | | | | 44,946 | |
Primary Health Care Limited (Health Care, Health Care Providers & Services) | | | | | | | 34,700 | | | | 91,166 | |
Seven Network Limited (Industrials, Trading Companies & Distributors) « | | | | | | | 15,300 | | | | 54,717 | |
United Construction Group Limited (Industrials, Construction & Engineering) | | | | | | | 14,100 | | | | 22,714 | |
| | | | |
| | | | | | | | | | | 1,234,397 | |
| | | | | | | | | | | | |
| | | | |
| Austria: 0.31% | | | | | | | | | | | | |
OMV AG (Energy, Oil, Gas & Consumable Fuels) | | | | | | | 5,300 | | | | 141,127 | |
Voestalpine AG (Materials, Metals & Mining) | | | | | | | 4,300 | | | | 155,471 | |
| | | | |
| | | | | | | | | | | 296,598 | |
| | | | | | | | | | | | |
| | | | |
| Belgium: 1.51% | | | | | | | | | | | | |
Anheuser-Busch InBev NV (Consumer Staples, Beverages) | | | | | | | 4,596 | | | | 548,416 | |
Delhaize Group SA (Consumer Staples, Food & Staples Retailing) | | | | | | | 3,600 | | | | 334,040 | |
Telenet Group Holding NV (Consumer Discretionary, Media) † | | | | | | | 4,719 | | | | 274,472 | |
UCB SA (Health Care, Pharmaceuticals) | | | | | | | 3,277 | | | | 283,257 | |
| | | | |
| | | | | | | | | | | 1,440,185 | |
| | | | | | | | | | | | |
| | | | |
| Brazil: 0.32% | | | | | | | | | | | | |
Banco do Brasil SA (Financials, Banks) | | | | | | | 12,100 | | | | 50,144 | |
Companhia de Saneamento Basico do Estado de Sao Paulo SA (Utilities, Water Utilities) | | | | | | | 17,700 | | | | 76,804 | |
Companhia de Saneamento de Minas Gerais SA (Utilities, Water Utilities) | | | | | | | 5,300 | | | | 17,860 | |
Cosan Limited Class A (Energy, Oil, Gas & Consumable Fuels) | | | | | | | 6,395 | | | | 22,383 | |
JBS SA (Consumer Staples, Food Products) | | | | | | | 37,400 | | | | 138,070 | |
| | | | |
| | | | | | | | | | | 305,261 | |
| | | | | | | | | | | | |
| | | | |
| Canada: 1.64% | | | | | | | | | | | | |
Cameco Corporation (Energy, Oil, Gas & Consumable Fuels) | | | | | | | 23,154 | | | | 328,092 | |
Lundin Mining Corporation (Materials, Metals & Mining) † | | | | | | | 79,672 | | | | 268,701 | |
Magna International Incorporated Class A (Consumer Discretionary, Auto Components) | | | | | | | 8,000 | | | | 421,903 | |
Metro Incorporated (Consumer Staples, Food & Staples Retailing) | | | | | | | 5,600 | | | | 160,128 | |
Valeant Pharmaceuticals International Incorporated (Health Care, Pharmaceuticals) † | | | | | | | 2,294 | | | | 215,108 | |
WestJet Airlines Limited (Industrials, Airlines) | | | | | | | 9,200 | | | | 170,266 | |
| | | | |
| | | | | | | | | | | 1,564,198 | |
| | | | | | | | | | | | |
| | | | |
| China: 6.18% | | | | | | | | | | | | |
Baidu Incorporated ADR (Information Technology, Internet Software & Services) † | | | | | | | 8,237 | | | | 1,544,190 | |
Beijing Enterprises Water Group Limited (Utilities, Water Utilities) | | | | | | | 76,000 | | | | 60,194 | |
The accompanying notes are an integral part of these financial statements.
| | | | | | |
| Portfolio of investments—October 31, 2015 | | Wells Fargo Diversified International Fund | | | 11 | |
| | | | | | | | | | | | |
| Security name | | | | | | Shares | | | Value | |
| | | | |
| China (continued) | | | | | | | | | | | | |
Biostime International Holdings Limited (Consumer Staples, Food Products) | | | | | | | 82,000 | | | $ | 182,069 | |
China Communications Services Corporation Limited H Shares (Telecommunication Services, Diversified Telecommunication Services) | | | | | | | 220,000 | | | | 88,253 | |
China Mobile Limited (Telecommunication Services, Wireless Telecommunication Services) | | | | | | | 30,000 | | | | 359,697 | |
China Petroleum & Chemical Corporation H Shares (Energy, Oil, Gas & Consumable Fuels) | | | | | | | 236,000 | | | | 170,119 | |
China Railway Construction Corporation Limited H Shares (Industrials, Construction & Engineering) | | | | | | | 141,500 | | | | 211,512 | |
Dongfeng Motor Group Company Limited H Shares (Consumer Discretionary, Automobiles) | | | | | | | 544,000 | | | | 780,858 | |
Industrial & Commercial Bank of China Limited H Shares (Financials, Banks) | | | | | | | 743,000 | | | | 471,289 | |
PICC Property & Casualty Company Limited H Shares (Financials, Insurance) | | | | | | | 61,000 | | | | 138,413 | |
Ping An Insurance (Group) Company of China Limited H Shares (Financials, Insurance) | | | | | | | 67,370 | | | | 378,165 | |
Shanghai Pharmaceuticals Holding Company Limited H Shares (Health Care, Pharmaceuticals) | | | | | | | 179,100 | | | | 413,105 | |
Tencent Holdings Limited (Information Technology, Internet Software & Services) | | | | | | | 46,900 | | | | 884,036 | |
Xtep International Holdings Limited (Consumer Discretionary, Textiles, Apparel & Luxury Goods) | | | | | | | 395,050 | | | | 204,900 | |
| | | | |
| | | | | | | | | | | 5,886,800 | |
| | | | | | | | | | | | |
| | | | |
| Czech Republic: 0.10% | | | | | | | | | | | | |
CEZ AS (Utilities, Electric Utilities) | | | | | | | 4,900 | | | | 97,905 | |
| | | | | | | | | | | | |
| | | | |
| Denmark: 0.10% | | | | | | | | | | | | |
Sydbank AG (Financials, Banks) | | | | | | | 2,800 | | | | 92,103 | |
| | | | | | | | | | | | |
| | | | |
| Finland: 0.16% | | | | | | | | | | | | |
TietoEnator Oyj (Information Technology, IT Services) | | | | | | | 5,800 | | | | 148,731 | |
| | | | | | | | | | | | |
| | | | |
| France: 5.76% | | | | | | | | | | | | |
Alstom SA (Industrials, Machinery) † | | | | | | | 5,100 | | | | 166,006 | |
Arkema SA (Materials, Chemicals) | | | | | | | 910 | �� | | | 66,502 | |
AXA SA (Financials, Insurance) | | | | | | | 9,900 | | | | 264,212 | |
BNP Paribas SA (Financials, Banks) | | | | | | | 3,600 | | | | 218,150 | |
Compagnie de Saint-Gobain SA (Industrials, Building Products) | | | | | | | 20,175 | | | | 844,547 | |
Compagnie Generale des Etablissements Michelin SCA Class B (Consumer Discretionary, Auto Components) | | | | | | | 1,400 | | | | 139,266 | |
Credit Agricole SA (Financials, Banks) | | | | | | | 10,900 | | | | 137,672 | |
Electricite de France SA (Utilities, Electric Utilities) | | | | | | | 9,500 | | | | 176,581 | |
L’Oreal SA (Consumer Staples, Personal Products) | | | | | | | 1,414 | | | | 257,779 | |
LVMH Moet Hennessy Louis Vuitton SA (Consumer Discretionary, Textiles, Apparel & Luxury Goods) | | | | | | | 1,636 | | | | 304,573 | |
Orange SA (Telecommunication Services, Diversified Telecommunication Services) | | | | | | | 15,829 | | | | 279,092 | |
Pernod-Ricard SA (Consumer Staples, Beverages) | | | | | | | 2,659 | | | | 312,883 | |
Renault SA (Consumer Discretionary, Automobiles) | | | | | | | 2,500 | | | | 235,560 | |
Sanofi-Aventis SA (Health Care, Pharmaceuticals) | | | | | | | 4,900 | | | | 494,292 | |
SCOR SE (Financials, Insurance) | | | | | | | 7,700 | | | | 286,306 | |
Societe Generale SA (Financials, Banks) | | | | | | | 3,700 | | | | 171,840 | |
Thales SA (Industrials, Aerospace & Defense) | | | | | | | 2,600 | | | | 187,957 | |
Total SA (Energy, Oil, Gas & Consumable Fuels) | | | | | | | 6,000 | | | | 290,153 | |
Zodiac Aerospace SA (Industrials, Aerospace & Defense) | | | | | | | 25,648 | | | | 647,015 | |
| | | | |
| | | | | | | | | | | 5,480,386 | |
| | | | | | | | | | | | |
| | | | |
| Germany: 11.08% | | | | | | | | | | | | |
Allianz AG (Financials, Insurance) | | | | | | | 4,347 | | | | 761,020 | |
BASF SE (Materials, Chemicals) | | | | | | | 3,500 | | | | 286,733 | |
Bayer AG (Health Care, Pharmaceuticals) | | | | | | | 15,419 | | | | 2,055,898 | |
The accompanying notes are an integral part of these financial statements.
| | | | |
| 12 | | Wells Fargo Diversified International Fund | | Portfolio of investments—October 31, 2015 |
| | | | | | | | | | | | |
| Security name | | | | | | Shares | | | Value | |
| | | | |
| Germany (continued) | | | | | | | | | | | | |
Bayerische Motoren Werke AG (Consumer Discretionary, Automobiles) | | | | | | | 2,200 | | | $ | 225,342 | |
Beiersdorf AG (Consumer Staples, Personal Products) | | | | | | | 5,174 | | | | 491,405 | |
Daimler AG (Consumer Discretionary, Automobiles) | | | | | | | 4,800 | | | | 416,226 | |
Deutsche Bank AG (Financials, Capital Markets) | | | | | | | 6,300 | | | | 176,329 | |
E.ON SE (Utilities, Multi-Utilities) | | | | | | | 8,100 | | | | 85,448 | |
Hannover Rueckversicherung AG (Financials, Insurance) | | | | | | | 2,200 | | | | 254,342 | |
Hugo Boss AG (Consumer Discretionary, Textiles, Apparel & Luxury Goods) | | | | | | | 3,869 | | | | 397,835 | |
Linde AG (Materials, Chemicals) | | | | | | | 5,332 | | | | 924,864 | |
Metro AG (Consumer Staples, Food & Staples Retailing) | | | | | | | 19,911 | | | | 612,576 | |
Muenchener Rueckversicherungs Gesellschaft AG (Financials, Insurance) | | | | | | | 1,400 | | | | 279,152 | |
Norddeutsche Affinerie AG (Materials, Metals & Mining) | | | | | | | 2,300 | | | | 153,640 | |
Rheinmetall AG (Industrials, Industrial Conglomerates) | | | | | | | 17,672 | | | | 1,111,513 | |
Rhoen Klinikum AG (Health Care, Health Care Providers & Services) | | | | | | | 4,000 | | | | 119,323 | |
SAP AG (Information Technology, Software) | | | | | | | 7,398 | | | | 583,222 | |
Siemens AG (Industrials, Industrial Conglomerates) | | | | | | | 8,887 | | | | 892,647 | |
Stada Arzneimittel AG (Health Care, Pharmaceuticals) | | | | | | | 2,900 | | | | 110,323 | |
Volkswagen AG (Consumer Discretionary, Automobiles) | | | | | | | 1,600 | | | | 221,554 | |
Vonovia SE (Financials, Real Estate Management & Development) | | | | | | | 7,544 | | | | 251,471 | |
Wirecard AG (Information Technology, IT Services) | | | | | | | 2,664 | | | | 137,607 | |
| | | | |
| | | | | | | | | | | 10,548,470 | |
| | | | | | | | | | | | |
| | | | |
| Hong Kong: 3.43% | | | | | | | | | | | | |
AIA Group Limited (Financials, Insurance) | | | | | | | 191,400 | | | | 1,122,241 | |
China Everbright Limited (Financials, Capital Markets) | | | | | | | 298,000 | | | | 701,356 | |
China Resources Cement Holdings Limited (Materials, Construction Materials) | | | | | | | 236,000 | | | | 95,235 | |
Kingboard Laminates Holdings Limited (Information Technology, Electronic Equipment, Instruments & Components) | | | | | | | 226,500 | | | | 94,337 | |
Shenzhen International Holdings Limited (Industrials, Transportation Infrastructure) | | | | | | | 57,500 | | | | 87,319 | |
TCL Communication Technology Holdings Limited (Information Technology, Technology Hardware, Storage & Peripherals) | | | | | | | 117,000 | | | | 87,085 | |
Television Broadcasts Limited (Consumer Discretionary, Media) | | | | | | | 26,800 | | | | 97,673 | |
Value Partners Group Limited (Financials, Capital Markets) | | | | | | | 275,000 | | | | 291,202 | |
Wheelock & Company Limited (Financials, Real Estate Management & Development) | | | | | | | 22,000 | | | | 102,544 | |
Xinyi Glass Holdings Limited (Consumer Discretionary, Auto Components) | | | | | | | 496,000 | | | | 256,959 | |
Xinyi Solar Holdings Limited (Information Technology, Semiconductors & Semiconductor Equipment) | | | | | | | 450,000 | | | | 178,890 | |
Yue Yuen Industrial Holdings Limited (Consumer Discretionary, Textiles, Apparel & Luxury Goods) | | | | | | | 42,000 | | | | 153,218 | |
| | | | |
| | | | | | | | | | | 3,268,059 | |
| | | | | | | | | | | | |
| | | | |
| Hungary: 0.03% | | | | | | | | | | | | |
Richter Gedeon (Health Care, Pharmaceuticals) | | | | | | | 1,700 | | | | 28,358 | |
| | | | | | | | | | | | |
| | | | |
| India: 1.09% | | | | | | | | | | | | |
Adani Ports & Special Economic Zone Limited (Industrials, Transportation Infrastructure) | | | | | | | 114 | | | | 515 | |
Gail Limited (Utilities, Gas Utilities) | | | | | | | 1,800 | | | | 52,020 | |
Housing Development Finance Corporation Limited (Financials, Thrifts & Mortgage Finance) | | | | | | | 23,065 | | | | 442,105 | |
Infosys Limited ADR (Information Technology, IT Services) « | | | | | | | 15,368 | | | | 279,083 | |
Tata Motors Limited ADR (Consumer Discretionary, Automobiles) | | | | | | | 6,600 | | | | 195,162 | |
Tata Steel Limited GDR (Industrials, Machinery) | | | | | | | 17,100 | | | | 64,619 | |
| | | | |
| | | | | | | | | | | 1,033,504 | |
| | | | | | | | | | | | |
The accompanying notes are an integral part of these financial statements.
| | | | | | |
| Portfolio of investments—October 31, 2015 | | Wells Fargo Diversified International Fund | | | 13 | |
| | | | | | | | | | | | |
| Security name | | | | | | Shares | | | Value | |
| | | | |
| Ireland: 1.99% | | | | | | | | | | | | |
Allegion plc (Industrials, Building Products) | | | | | | | 1,026 | | | $ | 66,864 | |
Allergan plc (Health Care, Pharmaceuticals) † | | | | | | | 527 | | | | 162,564 | |
C&C Group plc (Consumer Staples, Beverages) | | | | | | | 18,600 | | | | 74,062 | |
Medtronic plc (Health Care, Health Care Equipment & Supplies) | | | | | | | 18,636 | | | | 1,377,573 | |
Smurfit Kappa Group plc (Materials, Containers & Packaging) | | | | | | | 7,500 | | | | 213,443 | |
| | | | |
| | | | | | | | | | | 1,894,506 | |
| | | | | | | | | | | | |
| | | | |
| Israel: 0.50% | | | | | | | | | | | | |
Bank Hapoalim Limited (Financials, Banks) | | | | | | | 38,000 | | | | 197,804 | |
Teva Pharmaceutical Industries Limited (Health Care, Pharmaceuticals) | | | | | | | 4,600 | | | | 273,116 | |
| | | | |
| | | | | | | | | | | 470,920 | |
| | | | | | | | | | | | |
| | | | |
| Italy: 3.45% | | | | | | | | | | | | |
Anima Holding SpA (Financials, Capital Markets) | | | | | | | 67,979 | | | | 665,600 | |
Enel SpA (Utilities, Electric Utilities) | | | | | | | 48,100 | | | | 221,805 | |
Eni SpA (Energy, Oil, Gas & Consumable Fuels) | | | | | | | 50,250 | | | | 820,595 | |
Intesa Sanpaolo SpA (Financials, Banks) | | | | | | | 96,207 | | | | 334,709 | |
Mediaset SpA (Consumer Discretionary, Media) | | | | | | | 50,769 | | | | 257,683 | |
Mediobanca SpA (Financials, Capital Markets) | | | | | | | 12,000 | | | | 120,681 | |
Prysmian SpA (Industrials, Electrical Equipment) | | | | | | | 40,125 | | | | 866,511 | |
| | | | |
| | | | | | | | | | | 3,287,584 | |
| | | | | | | | | | | | |
| | | | |
| Japan: 17.43% | | | | | | | | | | | | |
Adeka Corporation (Materials, Chemicals) | | | | | | | 8,800 | | | | 129,323 | |
Aisin Seiki Company Limited (Consumer Discretionary, Auto Components) | | | | | | | 3,300 | | | | 130,974 | |
Alpine Electronics Incorporated (Consumer Discretionary, Household Durables) | | | | | | | 11,600 | | | | 152,315 | |
Aozora Bank Limited (Financials, Banks) | | | | | | | 41,000 | | | | 149,857 | |
Calsonic Kansei Corporation (Consumer Discretionary, Auto Components) | | | | | | | 16,000 | | | | 127,515 | |
Coca-Cola East Japan Company Limited (Consumer Staples, Beverages) | | | | | | | 37,800 | | | | 531,255 | |
Dainippon Ink & Chemicals Incorporated (Materials, Chemicals) | | | | | | | 53,000 | | | | 143,464 | |
Daiwa House Industry Company Limited (Financials, Real Estate Management & Development) | | | | | | | 18,400 | | | | 483,005 | |
Daiwa Securities Group Incorporated (Financials, Capital Markets) | | | | | | | 104,000 | | | | 711,107 | |
DCM Japan Holdings Company Limited (Consumer Discretionary, Specialty Retail) | | | | | | | 14,100 | | | | 93,407 | |
Denki Kagaku Kogyo Kabushiki Kaisha (Materials, Chemicals) | | | | | | | 41,000 | | | | 190,261 | |
Eizo Nanao Corporation (Information Technology, Technology Hardware, Storage & Peripherals) | | | | | | | 7,300 | | | | 170,906 | |
Fuji Oil Company Limited (Consumer Staples, Food Products) | | | | | | | 8,800 | | | | 124,089 | |
Fujikura Limited (Industrials, Electrical Equipment) | | | | | | | 25,000 | | | | 128,498 | |
Hitachi Limited (Information Technology, Electronic Equipment, Instruments & Components) | | | | | | | 175,000 | | | | 1,009,538 | |
Ishikawajima-Harima Heavy Industries Company Limited (Industrials, Machinery) | | | | | | | 89,000 | | | | 251,106 | |
Isuzu Motors Limited (Consumer Discretionary, Automobiles) | | | | | | | 12,700 | | | | 148,330 | |
Itochu Corporation (Industrials, Trading Companies & Distributors) | | | | | | | 14,600 | | | | 182,689 | |
Japan Airlines Company Limited (Industrials, Airlines) | | | | | | | 6,300 | | | | 237,341 | |
Japan Tobacco Incorporated (Consumer Staples, Tobacco) | | | | | | | 11,220 | | | | 388,344 | |
JX Holdings Incorporated (Energy, Oil, Gas & Consumable Fuels) | | | | | | | 28,500 | | | | 111,910 | |
KDDI Corporation (Telecommunication Services, Wireless Telecommunication Services) | | | | | | | 5,800 | | | | 140,350 | |
Kyorin Company Limited (Health Care, Pharmaceuticals) | | | | | | | 7,900 | | | | 132,806 | |
Maeda Road Construction Company Limited (Industrials, Construction & Engineering) | | | | | | | 11,000 | | | | 199,952 | |
Marubeni Corporation (Industrials, Trading Companies & Distributors) | | | | | | | 30,000 | | | | 173,341 | |
Miraca Holdings Incorporated (Health Care, Health Care Providers & Services) | | | | | | | 1,800 | | | | 80,109 | |
The accompanying notes are an integral part of these financial statements.
| | | | |
| 14 | | Wells Fargo Diversified International Fund | | Portfolio of investments—October 31, 2015 |
| | | | | | | | | | | | |
| Security name | | | | | | Shares | | | Value | |
| | | | |
| Japan (continued) | | | | | | | | | | | | |
Mitsubishi Corporation (Industrials, Trading Companies & Distributors) | | | | | | | 8,800 | | | $ | 159,989 | |
Mitsubishi Gas Chemical Company Incorporated (Materials, Chemicals) | | | | | | | 22,800 | | | | 127,119 | |
Mitsubishi UFJ Financial Group Incorporated (Financials, Banks) | | | | | | | 215,500 | | | | 1,393,753 | |
Mitsui & Company Limited (Industrials, Trading Companies & Distributors) | | | | | | | 14,400 | | | | 182,634 | |
Mitsui Fudosan Company Limited (Financials, Real Estate Management & Development) | | | | | | | 22,000 | | | | 598,700 | |
Mizuho Financial Group Incorporated (Financials, Banks) | | | | | | | 154,300 | | | | 317,834 | |
NGK Insulators Limited (Industrials, Machinery) | | | | | | | 25,000 | | | | 541,246 | |
Nippon Telegraph & Telephone Corporation (Telecommunication Services, Diversified Telecommunication Services) | | | | | | | 15,800 | | | | 579,250 | |
Nissan Motor Company Limited (Consumer Discretionary, Automobiles) | | | | | | | 28,900 | | | | 299,584 | |
Nitto Denko Corporation (Materials, Chemicals) | | | | | | | 7,200 | | | | 461,696 | |
Nomura Holdings Incorporated (Financials, Capital Markets) | | | | | | | 139,100 | | | | 874,987 | |
NTT DOCOMO Incorporated (Telecommunication Services, Wireless Telecommunication Services) | | | | | | | 11,700 | | | | 227,863 | |
Olympus Corporation (Health Care, Health Care Equipment & Supplies) | | | | | | | 16,900 | | | | 570,059 | |
Ono Pharmaceutical Company Limited (Health Care, Pharmaceuticals) | | | | | | | 900 | | | | 123,295 | |
Resona Holdings Incorporated (Financials, Banks) | | | | | | | 54,000 | | | | 285,731 | |
S Foods Incorporated (Consumer Staples, Food Products) | | | | | | | 7,500 | | | | 130,370 | |
Sankyu Incorporated (Industrials, Road & Rail) | | | | | | | 28,000 | | | | 157,731 | |
Seino Holdings Company Limited (Industrials, Road & Rail) | | | | | | | 3,000 | | | | 35,605 | |
Sojitz Corporation (Industrials, Trading Companies & Distributors) | | | | | | | 77,400 | | | | 170,241 | |
Sumitomo Corporation (Industrials, Trading Companies & Distributors) | | | | | | | 19,900 | | | | 217,652 | |
Sumitomo Metal Mining Company Limited (Materials, Metals & Mining) | | | | | | | 11,000 | | | | 136,470 | |
Sumitomo Mitsui Financial Group Incorporated (Financials, Banks) | | | | | | | 8,000 | | | | 319,149 | |
Toyo Tire & Rubber Company Limited (Consumer Discretionary, Auto Components) | | | | | | | 5,900 | | | | 124,152 | |
Toyota Motor Corporation (Consumer Discretionary, Automobiles) | | | | | | | 24,800 | | | | 1,519,356 | |
Tsumura & Company (Health Care, Pharmaceuticals) | | | | | | | 5,600 | | | | 134,938 | |
West Holdings Corporation (Consumer Discretionary, Household Durables) | | | | | | | 32,600 | | | | 191,229 | |
Yaskawa Electric Corporation (Information Technology, Electronic Equipment, Instruments & Components) | | | | | | | 16,500 | | | | 195,721 | |
Yokohama Rubber Company Limited (Consumer Discretionary, Auto Components) | | | | | | | 10,500 | | | | 201,848 | |
| | | | |
| | | | | | | | | | | 16,599,994 | |
| | | | | | | | | | | | |
| | | | |
| Liechtenstein: 0.10% | | | | | | | | | | | | |
Verwaltungs-und Privat-Bank AG (Financials, Capital Markets) | | | | | | | 1,177 | | | | 94,665 | |
| | | | | | | | | | | | |
| | | | |
| Mexico: 0.97% | | | | | | | | | | | | |
Genomma Lab Internacional SAB (Health Care, Pharmaceuticals) † | | | | | | | 69,400 | | | | 50,923 | |
Grupo Televisa SAB ADR (Consumer Discretionary, Media) | | | | | | | 30,040 | | | | 875,366 | |
| | | | |
| | | | | | | | | | | 926,289 | |
| | | | | | | | | | | | |
| | | | |
| Netherlands: 2.36% | | | | | | | | | | | | |
Aegon NV (Financials, Insurance) | | | | | | | 17,300 | | | | 106,161 | |
Akzo Nobel NV (Materials, Chemicals) « | | | | | | | 11,418 | | | | 807,599 | |
ASML Holdings NV (Information Technology, Semiconductors & Semiconductor Equipment) | | | | | | | 8,657 | | | | 803,034 | |
ING Groep NV (Financials, Banks) | | | | | | | 14,300 | | | | 208,120 | |
Koninklijke Ahold NV (Consumer Staples, Food & Staples Retailing) | | | | | | | 15,600 | | | | 317,347 | |
| | | | |
| | | | | | | | | | | 2,242,261 | |
| | | | | | | | | | | | |
| | | | |
| Norway: 1.08% | | | | | | | | | | | | |
DnB Nor ASA (Financials, Banks) | | | | | | | 12,100 | | | | 154,057 | |
Frontline 2012 Limited (Energy, Oil, Gas & Consumable Fuels) 144A | | | | | | | 27,611 | | | | 194,976 | |
The accompanying notes are an integral part of these financial statements.
| | | | | | |
| Portfolio of investments—October 31, 2015 | | Wells Fargo Diversified International Fund | | | 15 | |
| | | | | | | | | | | | |
| Security name | | | | | | Shares | | | Value | |
| | | | |
| Norway (continued) | | | | | | | | | | | | |
Golden Ocean Group Limited (Industrials, Marine) | | | | | | | 8,495 | | | $ | 16,484 | |
Marine Harvest ASA (Consumer Staples, Food Products) | | | | | | | 33,675 | | | | 451,984 | |
Yara International ASA (Materials, Chemicals) | | | | | | | 4,600 | | | | 208,959 | |
| | | | |
| | | | | | | | | | | 1,026,460 | |
| | | | | | | | | | | | |
| | | | |
| Poland: 0.09% | | | | | | | | | | | | |
Asseco Poland SA (Information Technology, Software) | | | | | | | 5,900 | | | | 87,088 | |
| | | | | | | | | | | | |
| | | | |
| Russia: 0.29% | | | | | | | | | | | | |
Gazprom Neft Sponsored ADR (Energy, Oil, Gas & Consumable Fuels) | | | | | | | 10,500 | | | | 119,216 | |
LUKOIL ADR (Energy, Oil, Gas & Consumable Fuels) | | | | | | | 4,200 | | | | 152,250 | |
| | | | |
| | | | | | | | | | | 271,466 | |
| | | | | | | | | | | | |
| | | | |
| Singapore: 0.22% | | | | | | | | | | | | |
DBS Group Holdings Limited (Financials, Banks) | | | | | | | 17,000 | | | | 209,016 | |
| | | | | | | | | | | | |
| | | | |
| South Africa: 0.29% | | | | | | | | | | | | |
Barclays Africa Group Limited (Financials, Banks) | | | | | | | 9,300 | | | | 119,187 | |
Imperial Holdings Limited (Consumer Discretionary, Distributors) | | | | | | | 5,700 | | | | 74,195 | |
Omnia Holdings Limited (Materials, Chemicals) | | | | | | | 7,600 | | | | 84,298 | |
| | | | |
| | | | | | | | | | | 277,680 | |
| | | | | | | | | | | | |
| | | | |
| South Korea: 2.01% | | | | | | | | | | | | |
BS Financial Group Incorporated (Financials, Banks) | | | | | | | 1,018 | | | | 12,464 | |
Hana Financial Group Incorporated (Financials, Banks) | | | | | | | 21,524 | | | | 523,442 | |
Industrial Bank of Korea (Financials, Banks) | | | | | | | 13,500 | | | | 165,251 | |
Kwangju Bank (Financials, Banks)† | | | | | | | 1,044 | | | | 7,442 | |
LS Industrial Systems Company Limited (Industrials, Electrical Equipment) | | | | | | | 2,300 | | | | 99,982 | |
Orion Corporation (Consumer Staples, Food Products) | | | | | | | 3 | | | | 2,522 | |
Samsung Electronics Company Limited GDR (Information Technology, Semiconductors & Semiconductor Equipment)144A | | | | | | | 905 | | | | 540,709 | |
SK Telecom Company Limited (Telecommunication Services, Wireless Telecommunication Services) | | | | | | | 2,100 | | | | 444,701 | |
Woori Bank (Financials, Banks) | | | | | | | 13,760 | | | | 119,362 | |
| | | | |
| | | | | | | | | | | 1,915,875 | |
| | | | | | | | | | | | |
| | | | |
| Spain: 1.33% | | | | | | | | | | | | |
Banco Santander Central Hispano SA (Financials, Banks) | | | | | | | 22,800 | | | | 127,365 | |
Gas Natural SDG SA (Utilities, Gas Utilities) | | | | | | | 6,000 | | | | 129,791 | |
Grifols SA (Health Care, Biotechnology) | | | | | | | 4,471 | | | | 207,074 | |
Grifols SA ADR (Health Care, Biotechnology) | | | | | | | 7,044 | | | | 245,202 | |
International Consolidated Airlines Group SA (Industrials, Airlines) † | | | | | | | 62,429 | | | | 559,509 | |
| | | | |
| | | | | | | | | | | 1,268,941 | |
| | | | | | | | | | | | |
| | | | |
| Sweden: 1.89% | | | | | | | | | | | | |
Autoliv Incorporated SDR (Consumer Discretionary, Auto Components) | | | | | | | 2,800 | | | | 337,667 | |
Boliden AB (Materials, Metals & Mining) | | | | | | | 9,400 | | | | 179,976 | |
Nordea Bank AB (Financials, Banks) | | | | | | | 15,000 | | | | 165,505 | |
Saab AB Class B (Industrials, Aerospace & Defense) | | | | | | | 1,000 | | | | 28,162 | |
Swedbank AB Class A (Financials, Banks) | | | | | | | 13,760 | | | | 315,288 | |
Telefonaktiebolaget LM Ericsson Class B (Information Technology, Communications Equipment) | | | | | | | 20,500 | | | | 199,516 | |
TeliaSonera AB (Telecommunication Services, Diversified Telecommunication Services) | | | | | | | 40,300 | | | | 205,914 | |
The accompanying notes are an integral part of these financial statements.
| | | | |
| 16 | | Wells Fargo Diversified International Fund | | Portfolio of investments—October 31, 2015 |
| | | | | | | | | | | | |
| Security name | | | | | | Shares | | | Value | |
| | | | |
| Sweden (continued) | | | | | | | | | | | | |
Volvo AB Class B (Industrials, Machinery) | | | | | | | 35,770 | | | $ | 369,974 | |
| | | | |
| | | | | | | | | | | 1,802,002 | |
| | | | | | | | | | | | |
| | | | |
| Switzerland: 8.25% | | | | | | | | | | | | |
ABB Limited (Industrials, Electrical Equipment) | | | | | | | 29,647 | | | | 559,311 | |
Actelion Limited (Health Care, Biotechnology) | | | | | | | 3,544 | | | | 491,957 | |
Adecco SA (Industrials, Professional Services) | | | | | | | 5,276 | | | | 392,193 | |
Baloise Holding AG (Financials, Insurance) | | | | | | | 2,000 | | | | 239,794 | |
Credit Suisse Group AG (Financials, Capital Markets) | | | | | | | 29,324 | | | | 731,376 | |
Georg Fischer AG (Industrials, Machinery) | | | | | | | 300 | | | | 184,321 | |
Nestle SA (Consumer Staples, Food Products) | | | | | | | 12,181 | | | | 930,311 | |
Novartis AG (Health Care, Pharmaceuticals) | | | | | | | 11,022 | | | | 998,468 | |
Roche Holding AG (Health Care, Pharmaceuticals) | | | | | | | 3,305 | | | | 897,304 | |
Swiss Life Holding AG (Financials, Insurance) | | | | | | | 1,100 | | | | 262,119 | |
Swiss Reinsurance AG (Financials, Insurance) | | | | | | | 3,900 | | | | 362,040 | |
Syngenta AG (Materials, Chemicals) | | | | | | | 2,127 | | | | 714,609 | |
TE Connectivity Limited (Information Technology, Electronic Equipment, Instruments & Components) | | | | | | | 3,125 | | | | 201,375 | |
Zurich Insurance Group AG (Financials, Insurance) | | | | | | | 3,383 | | | | 892,774 | |
| | | | |
| | | | | | | | | | | 7,857,952 | |
| | | | | | | | | | | | |
| | | | |
| Taiwan: 0.26% | | | | | | | | | | | | |
Innolux Display Corporation (Information Technology, Electronic Equipment, Instruments & Components) | | | | | | | 225,000 | | | | 75,482 | |
Pegatron Corporation (Information Technology, Technology Hardware, Storage & Peripherals) | | | | | | | 70,000 | | | | 171,056 | |
| | | | |
| | | | | | | | | | | 246,538 | |
| | | | | | | | | | | | |
| | | | |
| Thailand: 0.14% | | | | | | | | | | | | |
Bangchak Petroleum PCL (Energy, Oil, Gas & Consumable Fuels) | | | | | | | 135,400 | | | | 137,046 | |
| | | | | | | | | | | | |
| | | | |
| United Kingdom: 17.45% | | | | | | | | | | | | |
3i Group plc (Financials, Capital Markets) | | | | | | | 22,400 | | | | 172,549 | |
Amlin plc (Financials, Insurance) | | | | | | | 7,000 | | | | 71,029 | |
Anglo American plc (Materials, Metals & Mining) | | | | | | | 9,600 | | | | 80,541 | |
Aon plc (Financials, Insurance) | | | | | | | 1,734 | | | | 161,800 | |
AstraZeneca plc (Health Care, Pharmaceuticals) | | | | | | | 2,700 | | | | 172,078 | |
Aviva plc (Financials, Insurance) | | | | | | | 22,000 | | | | 164,419 | |
Babcock International Group plc (Industrials, Commercial Services & Supplies) | | | | | | | 11,409 | | | | 169,128 | |
BAE Systems plc (Industrials, Aerospace & Defense) | | | | | | | 58,900 | | | | 398,428 | |
Barclays plc (Financials, Banks) | | | | | | | 114,371 | | | | 407,479 | |
Barratt Developments plc (Consumer Discretionary, Household Durables) | | | | | | | 15,900 | | | | 149,785 | |
Bellway plc (Consumer Discretionary, Household Durables) | | | | | | | 4,200 | | | | 167,760 | |
Bovis Homes Group plc (Consumer Discretionary, Household Durables) | | | | | | | 8,600 | | | | 135,652 | |
BP plc (Energy, Oil, Gas & Consumable Fuels) | | | | | | | 170,476 | | | | 1,013,136 | |
BT Group plc (Telecommunication Services, Diversified Telecommunication Services) | | | | | | | 75,944 | | | | 542,355 | |
Capita plc (Industrials, Professional Services) | | | | | | | 17,028 | | | | 334,019 | |
Carnival plc (Consumer Discretionary, Hotels, Restaurants & Leisure) | | | | | | | 8,288 | | | | 461,274 | |
Centrica plc (Utilities, Multi-Utilities) | | | | | | | 41,800 | | | | 145,446 | |
Crest Nicholson Holdings plc (Consumer Discretionary, Household Durables) | | | | | | | 20,500 | | | | 171,473 | |
Croda International plc (Materials, Chemicals) | | | | | | | 7,889 | | | | 351,905 | |
Delphi Automotive plc (Consumer Discretionary, Auto Components) | | | | | | | 8,565 | | | | 712,522 | |
The accompanying notes are an integral part of these financial statements.
| | | | | | |
| Portfolio of investments—October 31, 2015 | | Wells Fargo Diversified International Fund | | | 17 | |
| | | | | | | | | | | | | | |
| Security name | | | | | | | Shares | | | Value | |
| | | | |
| United Kingdom (continued) | | | | | | | | | | | | | | |
Diageo plc (Consumer Staples, Beverages) | | | | | | | | | 322 | | | $ | 9,283 | |
easyJet plc (Industrials, Airlines) | | | | | | | | | 6,900 | | | | 185,873 | |
Firstgroup plc (Industrials, Road & Rail) † | | | | | | | | | 32,500 | | | | 48,373 | |
GlaxoSmithKline plc (Health Care, Pharmaceuticals) | | | | | | | | | 8,800 | | | | 189,778 | |
HSBC Bank plc | | | | | | | | | 23,887 | | | | 354,588 | |
Imperial Tobacco Group plc (Consumer Staples, Tobacco) | | | | | | | | | 5,981 | | | | 322,065 | |
Intercontinental Hotels Group plc (Consumer Discretionary, Hotels, Restaurants & Leisure) | | | | | | | | | 7,861 | | | | 314,121 | |
J Sainsbury plc (Consumer Staples, Food & Staples Retailing) | | | | | | | | | 90,900 | | | | 372,457 | |
Johnson Matthey plc (Materials, Chemicals) | | | | | | | | | 17,455 | | | | 694,258 | |
Liberty Global plc Class A (Consumer Discretionary, Media) | | | | | | | | | 11,793 | | | | 525,024 | |
Liberty Global plc Class C (Consumer Discretionary, Media) | | | | | | | | | 18,971 | | | | 808,923 | |
Liberty Global-Latin America and Caribbean Group plc Class C (Consumer Discretionary, Media) † | | | | | | | | | 38 | | | | 1,469 | |
Lloyds Banking Group plc (Financials, Banks) | | | | | | | | | 483,107 | | | | 548,331 | |
Man Group plc (Financials, Capital Markets) | | | | | | | | | 363,950 | | | | 934,140 | |
Mitie Group plc (Industrials, Commercial Services & Supplies) | | | | | | | | | 31,900 | | | | 157,849 | |
Mondi plc (Materials, Paper & Forest Products) | | | | | | | | | 5,200 | | | | 120,246 | |
Old Mutual plc (Financials, Insurance) | | | | | | | | | 59,600 | | | | 194,797 | |
Pace plc (Consumer Discretionary, Household Durables) | | | | | | | | | 19,300 | | | | 110,859 | |
Petrofac Limited (Energy, Energy Equipment & Services) | | | | | | | | | 12,200 | | | | 158,298 | |
Qinetiq Group plc (Industrials, Aerospace & Defense) | | | | | | | | | 47,700 | | | | 164,340 | |
Reckitt Benckiser Group plc (Consumer Staples, Household Products) | | | | | | | | | 6,372 | | | | 621,846 | |
Redrow plc (Consumer Discretionary, Household Durables) | | | | | | | | | 24,200 | | | | 172,712 | |
Royal Dutch Shell plc Class B (Energy, Oil, Gas & Consumable Fuels) | | | | | | | | | 19,000 | | | | 497,513 | |
Smiths Group plc (Industrials, Industrial Conglomerates) | | | | | | | | | 28,525 | | | | 421,998 | |
Standard Chartered plc (Financials, Banks) | | | | | | | | | 13,300 | | | | 147,638 | |
Tullett Prebon plc (Financials, Capital Markets) | | | | | | | | | 20,600 | | | | 111,409 | |
Vodafone Group plc (Telecommunication Services, Wireless Telecommunication Services) | | | | | | | | | 233,216 | | | | 767,498 | |
William Morrison Supermarkets plc (Consumer Staples, Food & Staples Retailing) | | | | | | | | | 66,200 | | | | 171,656 | |
Wolseley plc (Industrials, Trading Companies & Distributors) | | | | | | | | | 13,347 | | | | 783,619 | |
Worldpay Group plc (Information Technology, IT Services) †144A | | | | | | | | | 34,903 | | | | 150,120 | |
WPP plc (Consumer Discretionary, Media) | | | | | | | | | 25,356 | | | | 568,401 | |
| | | | |
| | | | | | | | | | | | | 16,612,260 | |
| | | | | | | | | | | | | | |
| | | | |
| United States: 1.73% | | | | | | | | | | | | | | |
Cognizant Technology Solutions Corporation Class A (Information Technology, IT Services) † | | | | | | | | | 9,063 | | | | 617,281 | |
QUALCOMM Incorporated (Information Technology, Communications Equipment) | | | | | | | | | 8,524 | | | | 506,496 | |
Royal Caribbean Cruises Limited (Consumer Discretionary, Hotels, Restaurants & Leisure) | | | | | | | | | 3,070 | | | | 301,935 | |
WABCO Holdings Incorporated (Industrials, Machinery) † | | | | | | | | | 1,928 | | | | 216,379 | |
| | | | |
| | | | | | | | | | | | | 1,642,091 | |
| | | | | | | | | | | | | | |
| | | | |
Total Common Stocks (Cost $84,627,100) | | | | | | | | | | | | | 90,295,589 | |
| | | | | | | | | | | | | | |
| | | | |
| | | | | Expiration date | | | | | | | |
| Participation Notes: 0.34% | | | | | | | | | | | | | | |
| | | | |
| China: 0.34% | | | | | | | | | | | | | | |
HSBC Bank plc (Kweichow Moutai Company Limited Class A) (Consumer Staples, Beverages) † | | | | | 2-19-2019 | | | | 3,410 | | | | 115,289 | |
Standard Chartered Bank (Kweichow Moutai Company Limited Class A) (Consumer Staples, Beverages) † | | | | | 4-18-2016 | | | | 6,231 | | | | 210,665 | |
| | | | |
Total Participation Notes (Cost $289,566) | | | | | | | | | | | | | 325,954 | |
| | | | | | | | | | | | | | |
The accompanying notes are an integral part of these financial statements.
| | | | |
| 18 | | Wells Fargo Diversified International Fund | | Portfolio of investments—October 31, 2015 |
| | | | | | | | | | | | | | |
| Security name | | Dividend yield | | | | | Shares | | | Value | |
| | | | |
Preferred Stocks: 0.32% | | | | | | | | | | | | | | |
| | | | |
| Brazil: 0.03% | | | | | | | | | | | | | | |
Companhia Energetica de Minas Gerais SA (Utilities, Electric Utilities) ± | | | 26.39 | % | | | | | 13,600 | | | $ | 25,240 | |
| | | | | | | | | | | | | | |
| | | | |
| Germany: 0.29% | | | | | | | | | | | | | | |
Henkel AG & Company KGaA (Consumer Staples, Household Products) ± | | | 1.29 | | | | | | 2,573 | | | | 279,051 | |
| | | | | | | | | | | | | | |
| | | | |
Total Preferred Stocks (Cost $287,206) | | | | | | | | | | | | | 304,291 | |
| | | | | | | | | | | | | | |
| | | | |
| | | Expiration date | | | | | | | | | |
| Rights: 0.00% | | | | | | | | | | | | | | |
| | | | |
| Spain: 0.00% | | | | | | | | | | | | | | |
Banco Santander SA (Financials, Banks) † | | | 11-9-2015 | | | | | | 22,800 | | | | 1,254 | |
| | | | | | | | | | | | | | |
| | | | |
Total Rights (Cost $1,291) | | | | | | | | | | | | | 1,254 | |
| | | | | | | | | | | | | | |
| | | | |
| | | Yield | | | | | | | | | |
| Short-Term Investments: 3.60% | | | | | | | | | | | | | | |
| | | | |
| Investment Companies: 3.60% | | | | | | | | | | | | | | |
Securities Lending Cash Investments, LLC (l)(r)(u) | | | 0.14 | | | | | | 353,678 | | | | 353,678 | |
Wells Fargo Cash Investment Money Market Fund, Select Class (l)(u) | | | 0.16 | | | | | | 3,073,631 | | | | 3,073,631 | |
| | | | |
Total Short-Term Investments (Cost $3,427,309) | | | | | | | | | | | | | 3,427,309 | |
| | | | | | | | | | | | | | |
| | | | | | | | |
| Total investments in securities (Cost $88,632,472) * | | | 99.10 | % | | | 94,354,397 | |
Other assets and liabilities, net | | | 0.90 | | | | 859,637 | |
| | | | | | | | |
| Total net assets | | | 100.00 | % | | $ | 95,214,034 | |
| | | | | | | | |
| † | Non-income-earning security |
| « | All or a portion of this security is on loan. |
| 144A | The security may be resold in transactions exempt from registration, normally to qualified institutional buyers, pursuant to Rule 144A under the Securities Act of 1933. |
| ± | Variable rate investment. The rate shown is the rate in effect at period end. |
| (l) | The issuer of the security is an affiliated person of the Fund as defined in the Investment Company Act of 1940. |
| (r) | The investment is a non-registered investment vehicle purchased with cash collateral received from securities on loan. |
| (u) | The rate represents the 7-day annualized yield at period end. |
| * | Cost for federal income tax purposes is $90,386,520 and unrealized gains (losses) consists of: |
| | | | |
Gross unrealized gains | | $ | 13,378,123 | |
Gross unrealized losses | | | (9,410,246 | ) |
| | | | |
Net unrealized gains | | $ | 3,967,877 | |
The accompanying notes are an integral part of these financial statements.
| | | | | | |
| Statement of assets and liabilities—October 31, 2015 | | Wells Fargo Diversified International Fund | | | 19 | |
| | | | |
| | | | |
| |
Assets | | | | |
Investments | | | | |
In unaffiliated securities (including $339,267 of securities loaned), at value (cost $85,205,163) | | $ | 90,927,088 | |
In affiliated securities, at value (cost $3,427,309) | | | 3,427,309 | |
| | | | |
Total investments, at value (cost $88,632,472) | | | 94,354,397 | |
Foreign currency, at value (cost $972,930) | | | 921,220 | |
Receivable for investments sold | | | 237,641 | |
Receivable for Fund shares sold | | | 122,694 | |
Receivable for dividends | | | 262,030 | |
Receivable for securities lending income | | | 827 | |
Unrealized gains on forward foreign currency contracts | | | 123,291 | |
Prepaid expenses and other assets | | | 69,640 | |
| | | | |
Total assets | | | 96,091,740 | |
| | | | |
| |
Liabilities | | | | |
Payable for investments purchased | | | 362,734 | |
Payable for Fund shares redeemed | | | 57,267 | |
Payable upon receipt of securities loaned | | | 353,678 | |
Management fee payable | | | 28,246 | |
Distribution fees payable | | | 2,239 | |
Administration fees payable | | | 19,547 | |
Accrued expenses and other liabilities | | | 53,995 | |
| | | | |
Total liabilities | | | 877,706 | |
| | | | |
Total net assets | | $ | 95,214,034 | |
| | | | |
| |
NET ASSETS CONSIST OF | | | | |
Paid-in capital | | $ | 190,663,832 | |
Undistributed net investment income | | | 1,033,199 | |
Accumulated net realized losses on investments | | | (102,271,938 | ) |
Net unrealized gains on investments | | | 5,788,941 | |
| | | | |
Total net assets | | $ | 95,214,034 | |
| | | | |
| |
COMPUTATION OF NET ASSET VALUE AND OFFERING PRICE PER SHARE | | | | |
Net assets – Class A | | $ | 73,891,439 | |
Shares outstanding – Class A1 | | | 6,344,710 | |
Net asset value per share – Class A | | | $11.65 | |
Maximum offering price per share – Class A2 | | | $12.36 | |
Net assets – Class B | | $ | 50,138 | |
Shares outstanding – Class B1 | | | 4,423 | |
Net asset value per share – Class B | | | $11.34 | |
Net assets – Class C | | $ | 3,573,109 | |
Shares outstanding – Class C1 | | | 332,699 | |
Net asset value per share – Class C | | | $10.74 | |
Net assets – Class R | | $ | 26,641 | |
Shares outstanding – Class R1 | | | 2,246 | |
Net asset value per share – Class R | | | $11.86 | |
Net assets – Class R6 | | $ | 26,657 | |
Shares outstanding – Class R61 | | | 2,246 | |
Net asset value per share – Class R6 | | | $11.87 | |
Net assets – Administrator Class | | $ | 10,540,224 | |
Shares outstanding – Administrator Class1 | | | 888,223 | |
Net asset value per share – Administrator Class | | | $11.87 | |
Net assets – Institutional Class | | $ | 7,105,826 | |
Shares outstanding – Institutional Class1 | | | 637,842 | |
Net asset value per share – Institutional Class | | | $11.14 | |
| 1 | The Fund has an unlimited number of authorized shares. |
| 2 | Maximum offering price is computed as 100/94.25 of net asset value. On investments of $50,000 or more, the offering price is reduced. |
The accompanying notes are an integral part of these financial statements.
| | | | |
| 20 | | Wells Fargo Diversified International Fund | | Statement of operations—year ended October 31, 2015 |
| | | | |
| | | | |
| |
Investment income | | | | |
Dividends (net of foreign withholding taxes of $194,876) | | $ | 2,224,992 | |
Securities lending income, net | | | 39,461 | |
Income from affiliated securities | | | 4,003 | |
| | | | |
Total investment income | | | 2,268,456 | |
| | | | |
| |
Expenses | | | | |
Management fee | | | 807,916 | |
Administration fees | | | | |
Class A | | | 63,751 | |
Class B | | | 93 | |
Class C | | | 5,507 | |
Class R | | | 5 | 1 |
Class R6 | | | 1 | 1 |
Administrator Class | | | 9,896 | |
Institutional Class | | | 3,749 | |
Investor Class | | | 155,379 | 2 |
Shareholder servicing fees | | | | |
Class A | | | 65,966 | |
Class B | | | 99 | |
Class C | | | 5,809 | |
Class R | | | 6 | 1 |
Administrator Class | | | 22,124 | |
Investor Class | | | 120,494 | 2 |
Distribution fees | | | | |
Class B | | | 296 | |
Class C | | | 17,427 | |
Class R | | | 6 | 1 |
Custody and accounting fees | | | 166,463 | |
Professional fees | | | 60,418 | |
Registration fees | | | 69,463 | |
Shareholder report expenses | | | 39,019 | |
Trustees’ fees and expenses | | | 22,322 | |
Other fees and expenses | | | 54,155 | |
| | | | |
Total expenses | | | 1,690,364 | |
Less: Fee waivers and/or expense reimbursements | | | (414,051 | ) |
| | | | |
Net expenses | | | 1,276,313 | |
| | | | |
Net investment income | | | 992,143 | |
| | | | |
| |
REALIZED AND UNREALIZED GAINS (LOSSES) ON INVESTMENTS | | | | |
| |
Net realized gains on: | | | | |
Unaffiliated securities | | | 2,420,442 | |
Forward foreign currency contract transactions | | | 225,501 | |
| | | | |
Net realized gains on investments | | | 2,645,943 | |
| | | | |
| |
Net change in unrealized gains (losses) on: | | | | |
Unaffiliated securities | | | (4,830,303 | ) |
Forward foreign currency contract transactions | | | 61,388 | |
| | | | |
Net change in unrealized gains (losses) on investments | | | (4,768,915 | ) |
| | | | |
Net realized and unrealized gains (losses) on investments | | | (2,122,972 | ) |
| | | | |
Net decrease in net assets resulting from operations | | $ | (1,130,829 | ) |
| | | | |
| 1 | For the period from September 30, 2015 (commencement of class operations) to October 31, 2015 |
| 2 | For the period from November 1, 2014 to October 23, 2015. Effective at the close of business on October 23, 2015, Investor Class shares were converted to Class A shares and are no longer offered by the Fund. |
The accompanying notes are an integral part of these financial statements.
| | | | | | |
| Statement of changes in net assets | | Wells Fargo Diversified International Fund | | | 21 | |
| | | | | | | | | | | | | | | | |
| | | Year ended
October 31, 2015 | | | Year ended
October 31, 2014 | |
| | | | |
Operations | | | | | | | | | | | | | | | | |
Net investment income | | | | | | $ | 992,143 | | | | | | | $ | 1,716,255 | |
Net realized gains on investments | | | | | | | 2,645,943 | | | | | | | | 1,412,567 | |
Net change in unrealized gains (losses) on investments | | | | | | | (4,768,915 | ) | | | | | | | (3,468,155 | ) |
| | | | |
Net decrease in net assets resulting from operations | | | | | | | (1,130,829 | ) | | | | | | | (339,333 | ) |
| | | | |
| | | | |
Distributions to shareholders from | | | | | | | | | | | | | | | | |
Net investment income | | | | | | | | | | | | | | | | |
Class A | | | | | | | (567,395 | ) | | | | | | | (435,361 | ) |
Class B | | | | | | | 0 | | | | | | | | (908 | ) |
Class C | | | | | | | (25,962 | ) | | | | | | | (22,476 | ) |
Administrator Class | | | | | | | (172,327 | ) | | | | | | | (131,295 | ) |
Institutional Class | | | | | | | (79,049 | ) | | | | | | | (53,962 | ) |
Investor Class | | | | | | | (1,116,769 | )1 | | | | | | | (713,363 | ) |
| | | | |
Total distributions to shareholders | | | | | | | (1,961,502 | ) | | | | | | | (1,357,365 | ) |
| | | | |
| | | | |
Capital share transactions | | | Shares | | | | | | | | Shares | | | | | |
Proceeds from shares sold | | | | | | | | | | | | | | | | |
Class A | | | 4,606,846 | | | | 54,061,650 | | | | 219,116 | | | | 2,676,314 | |
Class B | | | 4,423 | | | | 54,704 | | | | 825 | | | | 9,731 | |
Class C | | | 226,478 | | | | 2,559,311 | | | | 58,503 | | | | 663,191 | |
Class R | | | 2,246 | 2 | | | 25,000 | 2 | | | N/A | | | | N/A | |
Class R6 | | | 2,246 | 2 | | | 25,000 | 2 | | | N/A | | | | N/A | |
Administrator Class | | | 459,323 | | | | 5,711,707 | | | | 394,241 | | | | 4,991,123 | |
Institutional Class | | | 523,640 | | | | 5,896,811 | | | | 220,008 | | | | 2,622,722 | |
Investor Class | | | 772,749 | 1 | | | 9,262,576 | 1 | | | 651,354 | | | | 7,987,677 | |
| | | | |
| | | | | | | 77,596,759 | | | | | | | | 18,950,758 | |
| | | | |
Reinvestment of distributions | | | | | | | | | | | | | | | | |
Class A | | | 45,755 | | | | 531,212 | | | | 32,439 | | | | 401,923 | |
Class B | | | 0 | | | | 0 | | | | 76 | | | | 908 | |
Class C | | | 2,080 | | | | 22,425 | | | | 1,848 | | | | 21,270 | |
Administrator Class | | | 14,509 | | | | 171,495 | | | | 10,249 | | | | 129,239 | |
Institutional Class | | | 5,648 | | | | 62,524 | | | | 3,024 | | | | 35,774 | |
Investor Class | | | 94,956 | 1 | | | 1,098,641 | 1 | | | 56,897 | | | | 702,683 | |
| | | | |
| | | | | | | 1,886,297 | | | | | | | | 1,291,797 | |
| | | | |
Payment for shares redeemed | | | | | | | | | | | | | | | | |
Class A | | | (383,282 | ) | | | (4,674,632 | ) | | | (536,727 | ) | | | (6,662,045 | ) |
Class B | | | (3,247 | ) | | | (36,560 | ) | | | (12,466 | ) | | | (146,566 | ) |
Class C | | | (41,808 | ) | | | (464,550 | ) | | | (68,203 | ) | | | (768,688 | ) |
Administrator Class | | | (180,963 | ) | | | (2,216,207 | ) | | | (466,124 | ) | | | (5,945,695 | ) |
Institutional Class | | | (124,691 | ) | | | (1,439,122 | ) | | | (193,900 | ) | | | (2,280,030 | ) |
Investor Class | | | (4,980,967 | )1 | | | (58,064,112 | )1 | | | (562,951 | ) | | | (6,893,625 | ) |
| | | | |
| | | | | | | (66,895,183 | ) | | | | | | | (22,696,649 | ) |
| | | | |
Net increase (decrease) in net assets resulting from capital share transactions | | | | | | | 12,587,873 | | | | | | | | (2,454,094 | ) |
| | | | |
Total increase (decrease) in net assets | | | | | | | 9,495,542 | | | | | | | | (4,150,792 | ) |
| | | | |
| | | | |
Net assets | | | | | | | | | | | | | | | | |
Beginning of period | | | | | | | 85,718,492 | | | | | | | | 89,869,284 | |
| | | | |
End of period | | | | | | $ | 95,214,034 | | | | | | | $ | 85,718,492 | |
| | | | |
Undistributed net investment income | | | | | | $ | 1,033,199 | | | | | | | $ | 1,883,816 | |
| | | | |
| 1 | For the period from November 1, 2014 to October 23, 2015. Effective at the close of business on October 23, 2015, Investor Class shares were converted to Class A shares and are no longer offered by the Fund. |
| 2 | For the period from September 30, 2015 (commencement of class operations) to October 31, 2015 |
The accompanying notes are an integral part of these financial statements.
| | | | |
| 22 | | Wells Fargo Diversified International Fund | | Financial highlights |
(For a share outstanding throughout each period)
| | | | | | | | | | | | | | | | | | | | |
| | | Year ended October 31 | |
| CLASS A | | 2015 | | | 2014 | | | 2013 | | | 2012 | | | 2011 | |
Net asset value, beginning of period | | | $12.01 | | | | $12.25 | | | | $10.25 | | | | $9.69 | | | | $10.29 | |
Net investment income | | | 0.13 | 1 | | | 0.24 | 1 | | | 0.19 | 1 | | | 0.19 | 1 | | | 0.16 | |
Net realized and unrealized gains (losses) on investments | | | (0.21 | ) | | | (0.29 | ) | | | 2.41 | | | | 0.51 | | | | (0.65 | ) |
| | | | | | | | | | | | | | | | | | | | |
Total from investment operations | | | (0.08 | ) | | | (0.05 | ) | | | 2.60 | | | | 0.70 | | | | (0.49 | ) |
Distributions to shareholders from | | | | | | | | | | | | | | | | | | | | |
Net investment income | | | (0.28 | ) | | | (0.19 | ) | | | (0.60 | ) | | | (0.14 | ) | | | (0.11 | ) |
Net asset value, end of period | | | $11.65 | | | | $12.01 | | | | $12.25 | | | | $10.25 | | | | $9.69 | |
Total return2 | | | (0.66 | )% | | | (0.49 | )% | | | 26.59 | % | | | 7.45 | % | | | (4.83 | )% |
Ratios to average net assets (annualized) | | | | | | | | | | | | | | | | | | | | |
Gross expenses | | | 1.85 | % | | | 1.76 | % | | | 1.92 | % | | | 1.68 | % | | | 1.47 | % |
Net expenses | | | 1.40 | % | | | 1.41 | % | | | 1.41 | % | | | 1.41 | % | | | 1.41 | % |
Net investment income | | | 1.07 | % | | | 1.93 | % | | | 1.75 | % | | | 1.96 | % | | | 1.47 | % |
Supplemental data | | | | | | | | | | | | | | | | | | | | |
Portfolio turnover rate | | | 31 | % | | | 33 | % | | | 40 | % | | | 57 | % | | | 53 | % |
Net assets, end of period (000s omitted) | | | $73,891 | | | | $24,921 | | | | $28,928 | | | | $22,434 | | | | $23,862 | |
| 1 | Calculated based upon average shares outstanding |
| 2 | Total return calculations do not include any sales charges. Returns for periods of less than one year are not annualized. |
The accompanying notes are an integral part of these financial statements.
| | | | | | |
| Financial highlights | | Wells Fargo Diversified International Fund | | | 23 | |
(For a share outstanding throughout each period)
| | | | | | | | | | | | | | | | | | | | |
| | | Year ended October 31 | |
| CLASS B | | 2015 | | | 2014 | | | 2013 | | | 2012 | | | 2011 | |
Net asset value, beginning of period | | | $11.50 | | | | $11.71 | | | | $9.80 | | | | $9.19 | | | | $9.74 | |
Net investment income (loss) | | | 0.03 | 1 | | | 0.13 | 1 | | | 0.09 | 1 | | | 0.10 | 1 | | | 0.06 | 1 |
Net realized and unrealized gains (losses) on investments | | | (0.19 | ) | | | (0.27 | ) | | | 2.32 | | | | 0.51 | | | | (0.61 | ) |
| | | | | | | | | | | | | | | | | | | | |
Total from investment operations | | | (0.16 | ) | | | (0.14 | ) | | | 2.41 | | | | 0.61 | | | | (0.55 | ) |
Distributions to shareholders from | | | | | | | | | | | | | | | | | | | | |
Net investment income | | | 0.00 | | | | (0.07 | ) | | | (0.50 | ) | | | (0.00 | )3 | | | 0.00 | |
Net asset value, end of period | | | $11.34 | | | | $11.50 | | | | $11.71 | | | | $9.80 | | | | $9.19 | |
Total return2 | | | (1.39 | )% | | | (1.25 | )% | | | 25.70 | % | | | 6.69 | % | | | (5.65 | )% |
Ratios to average net assets (annualized) | | | | | | | | | | | | | | | | | | | | |
Gross expenses | | | 2.59 | % | | | 2.52 | % | | | 2.68 | % | | | 2.35 | % | | | 2.23 | % |
Net expenses | | | 2.15 | % | | | 2.16 | % | | | 2.16 | % | | | 2.12 | % | | | 2.16 | % |
Net investment income (loss) | | | 0.29 | % | | | 1.10 | % | | | 0.88 | % | | | 1.11 | % | | | 0.64 | % |
Supplemental data | | | | | | | | | | | | | | | | | | | | |
Portfolio turnover rate | | | 31 | % | | | 33 | % | | | 40 | % | | | 57 | % | | | 53 | % |
Net assets, end of period (000s omitted) | | | $50 | | | | $37 | | | | $174 | | | | $299 | | | | $482 | |
| 1 | Calculated based upon average shares outstanding |
| 2 | Total return calculations do not include any sales charges. Returns for periods of less than one year are not annualized. |
The accompanying notes are an integral part of these financial statements.
| | | | |
| 24 | | Wells Fargo Diversified International Fund | | Financial highlights |
(For a share outstanding throughout each period)
| | | | | | | | | | | | | | | | | | | | |
| | | Year ended October 31 | |
| CLASS C | | 2015 | | | 2014 | | | 2013 | | | 2012 | | | 2011 | |
Net asset value, beginning of period | | | $11.08 | | | | $11.35 | | | | $9.54 | | | | $9.01 | | | | $9.59 | |
Net investment income (loss) | | | 0.04 | 1 | | | 0.13 | 1 | | | 0.09 | 1 | | | 0.11 | 1 | | | 0.07 | 1 |
Net realized and unrealized gains (losses) on investments | | | (0.20 | ) | | | (0.27 | ) | | | 2.25 | | | | 0.48 | | | | (0.61 | ) |
| | | | | | | | | | | | | | | | | | | | |
Total from investment operations | | | (0.16 | ) | | | (0.14 | ) | | | 2.34 | | | | 0.59 | | | | (0.54 | ) |
Distributions to shareholders from | | | | | | | | | | | | | | | | | | | | |
Net investment income | | | (0.18 | ) | | | (0.13 | ) | | | (0.53 | ) | | | (0.06 | ) | | | (0.04 | ) |
Net asset value, end of period | | | $10.74 | | | | $11.08 | | | | $11.35 | | | | $9.54 | | | | $9.01 | |
Total return2 | | | (1.44 | )% | | | (1.24 | )% | | | 25.67 | % | | | 6.67 | % | | | (5.65 | )% |
Ratios to average net assets (annualized) | | | | | | | | | | | | | | | | | | | | |
Gross expenses | | | 2.60 | % | | | 2.51 | % | | | 2.66 | % | | | 2.43 | % | | | 2.22 | % |
Net expenses | | | 2.15 | % | | | 2.16 | % | | | 2.16 | % | | | 2.16 | % | | | 2.16 | % |
Net investment income (loss) | | | 0.33 | % | | | 1.15 | % | | | 0.84 | % | | | 1.21 | % | | | 0.72 | % |
Supplemental data | | | | | | | | | | | | | | | | | | | | |
Portfolio turnover rate | | | 31 | % | | | 33 | % | | | 40 | % | | | 57 | % | | | 53 | % |
Net assets, end of period (000s omitted) | | | $3,573 | | | | $1,616 | | | | $1,746 | | | | $628 | | | | $625 | |
| 1 | Calculated based upon average shares outstanding |
| 2 | Total return calculations do not include any sales charges. Returns for periods of less than one year are not annualized. |
The accompanying notes are an integral part of these financial statements.
| | | | | | |
| Financial highlights | | Wells Fargo Diversified International Fund | | | 25 | |
(For a share outstanding throughout the period)
| | | | |
| CLASS R | | Year ended
October 31, 20151 | |
Net asset value, beginning of period | | | $11.13 | |
Net investment loss | | | (0.01 | ) |
Net realized and unrealized gains (losses) on investments | | | 0.74 | |
| | | | |
Total from investment operations | | | 0.73 | |
Net asset value, end of period | | | $11.86 | |
Total return2 | | | 6.56 | % |
Ratios to average net assets (annualized) | | | | |
Gross expenses | | | 2.15 | % |
Net expenses | | | 1.60 | % |
Net investment loss | | | (0.65 | )% |
Supplemental data | | | | |
Portfolio turnover rate | | | 31 | % |
Net assets, end of period (000s omitted) | | | $27 | |
| 1 | For the period from September 30, 2015 (commencement of class operations) to October 31, 2015 |
| 2 | Returns for periods of less than one year are not annualized. |
The accompanying notes are an integral part of these financial statements.
| | | | |
| 26 | | Wells Fargo Diversified International Fund | | Financial highlights |
(For a share outstanding throughout the period)
| | | | |
| CLASS R6 | | Year ended
October 31, 20151 | |
Net asset value, beginning of period | | | $11.13 | |
Net investment income | | | 0.00 | 2 |
Net realized and unrealized gains (losses) on investments | | | 0.74 | |
| | | | |
Total from investment operations | | | 0.74 | |
Net asset value, end of period | | | $11.87 | |
Total return3 | | | 6.65 | % |
Ratios to average net assets (annualized) | | | | |
Gross expenses | | | 1.46 | % |
Net expenses | | | 0.89 | % |
Net investment income | | | 0.05 | % |
Supplemental data | | | | |
Portfolio turnover rate | | | 31 | % |
Net assets, end of period (000s omitted) | | | $27 | |
| 1 | For the period from September 30, 2015 (commencement of class operations) to October 31, 2015 |
| 2 | Amount is less than $0.005 per share. |
| 3 | Returns for periods of less than one year are not annualized. |
The accompanying notes are an integral part of these financial statements.
| | | | | | |
| Financial highlights | | Wells Fargo Diversified International Fund | | | 27 | |
(For a share outstanding throughout each period)
| | | | | | | | | | | | | | | | | | | | |
| | | Year ended October 31 | |
| ADMINISTRATOR CLASS | | 2015 | | | 2014 | | | 2013 | | | 2012 | | | 2011 | |
Net asset value, beginning of period | | | $12.23 | | | | $12.47 | | | | $10.42 | | | | $9.68 | | | | $10.28 | |
Net investment income | | | 0.16 | 1 | | | 0.26 | 1 | | | 0.19 | 1 | | | 0.21 | 1 | | | 0.05 | 1 |
Net realized and unrealized gains (losses) on investments | | | (0.22 | ) | | | (0.30 | ) | | | 2.47 | | | | 0.53 | | | | (0.52 | ) |
| | | | | | | | | | | | | | | | | | | | |
Total from investment operations | | | (0.06 | ) | | | (0.04 | ) | | | 2.66 | | | | 0.74 | | | | (0.47 | ) |
Distributions to shareholders from | | | | | | | | | | | | | | | | | | | | |
Net investment income | | | (0.30 | ) | | | (0.20 | ) | | | (0.61 | ) | | | 0.00 | | | | (0.13 | ) |
Net asset value, end of period | | | $11.87 | | | | $12.23 | | | | $12.47 | | | | $10.42 | | | | $9.68 | |
Total return2 | | | (0.46 | )% | | | (0.39 | )% | | | 26.85 | % | | | 7.64 | % | | | (4.69 | )% |
Ratios to average net assets (annualized) | | | | | | | | | | | | | | | | | | | | |
Gross expenses | | | 1.72 | % | | | 1.60 | % | | | 1.74 | % | | | 1.52 | % | | | 1.35 | % |
Net expenses | | | 1.25 | % | | | 1.25 | % | | | 1.25 | % | | | 1.25 | % | | | 1.24 | % |
Net investment income | | | 1.31 | % | | | 2.10 | % | | | 1.72 | % | | | 2.11 | % | | | 0.44 | % |
Supplemental data | | | | | | | | | | | | | | | | | | | | |
Portfolio turnover rate | | | 31 | % | | | 33 | % | | | 40 | % | | | 57 | % | | | 53 | % |
Net assets, end of period (000s omitted) | | | $10,540 | | | | $7,283 | | | | $8,195 | | | | $3,504 | | | | $3,421 | |
| 1 | Calculated based upon average shares outstanding |
| 2 | Returns for periods of less than one year are not annualized. |
The accompanying notes are an integral part of these financial statements.
| | | | |
| 28 | | Wells Fargo Diversified International Fund | | Financial highlights |
(For a share outstanding throughout each period)
| | | | | | | | | | | | | | | | | | | | |
| | | Year ended October 31 | |
| INSTITUTIONAL CLASS | | 2015 | | | 2014 | | | 2013 | | | 2012 | | | 2011 | |
Net asset value, beginning of period | | | $11.50 | | | | $11.79 | | | | $10.20 | | | | $9.69 | | | | $10.29 | |
Net investment income | | | 0.17 | 1 | | | 0.26 | 1 | | | 0.20 | 1 | | | 0.19 | 1 | | | 0.23 | |
Net realized and unrealized gains (losses) on investments | | | (0.20 | ) | | | (0.27 | ) | | | 2.37 | | | | 0.51 | | | | (0.68 | ) |
| | | | | | | | | | | | | | | | | | | | |
Total from investment operations | | | (0.03 | ) | | | (0.01 | ) | | | 2.57 | | | | 0.70 | | | | (0.45 | ) |
Distributions to shareholders from | | | | | | | | | | | | | | | | | | | | |
Net investment income | | | (0.33 | ) | | | (0.28 | ) | | | (0.98 | ) | | | (0.19 | ) | | | (0.15 | ) |
Net asset value, end of period | | | $11.14 | | | | $11.50 | | | | $11.79 | | | | $10.20 | | | | $9.69 | |
Total return2 | | | (0.23 | )% | | | (0.18 | )% | | | 27.28 | % | | | 7.51 | % | | | (4.48 | )% |
Ratios to average net assets (annualized) | | | | | | | | | | | | | | | | | | | | |
Gross expenses | | | 1.47 | % | | | 1.33 | % | | | 1.50 | % | | | 1.20 | % | | | 1.03 | % |
Net expenses | | | 0.99 | % | | | 0.99 | % | | | 0.99 | % | | | 0.99 | % | | | 0.99 | % |
Net investment income | | | 1.45 | % | | | 2.23 | % | | | 1.94 | % | | | 1.96 | % | | | 2.17 | % |
Supplemental data | | | | | | | | | | | | | | | | | | | | |
Portfolio turnover rate | | | 31 | % | | | 33 | % | | | 40 | % | | | 57 | % | | | 53 | % |
Net assets, end of period (000s omitted) | | | $7,106 | | | | $2,683 | | | | $2,406 | | | | $7,367 | | | | $419,925 | |
| 1 | Calculated based upon average shares outstanding |
| 2 | Returns for periods of less than one year are not annualized. |
The accompanying notes are an integral part of these financial statements.
| | | | | | |
| Notes to financial statements | | Wells Fargo Diversified International Fund | | | 29 | |
1. ORGANIZATION
Wells Fargo Funds Trust (the “Trust”), a Delaware statutory trust organized on March 10, 1999, is an open-end management investment company registered under the Investment Company Act of 1940, as amended (the “1940 Act”). As an investment company, the Trust follows the accounting and reporting guidance in Financial Accounting Standards Board (“FASB”) Accounting Standards Codification Topic 946, Financial Services – Investment Companies. These financial statements report on the Wells Fargo Diversified International Fund (the “Fund”) which is a diversified series of the Trust.
Effective at the close of business on October 23, 2015, Investor Class shares became Class A shares in a tax-free conversion. Shareholder of Investor Class received Class A shares at a value equal to the value of their Investor Class shares immediately prior to the conversion. Investor Class shares are no longer offered by the Fund.
2. SIGNIFICANT ACCOUNTING POLICIES
The following significant accounting policies, which are consistently followed in the preparation of the financial statements of the Fund, are in conformity with U.S. generally accepted accounting principles which require management to make estimates and assumptions that affect the reported amounts of assets and liabilities, disclosure of contingent assets and liabilities at the date of the financial statements, and the reported amounts of revenues and expenses during the reporting period. Actual results could differ from those estimates.
Securities valuation
All investments are valued each business day as of the close of regular trading on the New York Stock Exchange (generally 4 p.m. Eastern Time).
Equity securities that are listed on a foreign or domestic exchange or market are valued at the official closing price or, if none, the last sales price. If no sale occurs on the primary exchange or market that day, the prior day’s price will be deemed “stale” and a fair value price will be determined in accordance with the Fund’s Valuation Procedures.
Equity securities that are not listed on a foreign or domestic exchange or market, but have a public trading market, are valued at the quoted bid price from an independent broker-dealer that the Management Valuation Team of Wells Fargo Funds Management, LLC (“Funds Management”) has determined is an acceptable source.
The values of securities denominated in foreign currencies are translated into U.S. dollars at rates provided by an independent foreign currency pricing source at a time each business day specified by the Management Valuation Team.
Many securities markets and exchanges outside the U.S. close prior to the close of the New York Stock Exchange and therefore may not fully reflect trading or events that occur after the close of the principal exchange in which the foreign securities are traded, but before the close of the New York Stock Exchange. If such trading or events are expected to materially affect the value of such securities, then fair value pricing procedures approved by the Board of Trustees of the Fund are applied. These procedures take into account multiple factors including movements in U.S. securities markets after foreign exchanges close. Foreign securities that are fair valued under these procedures are categorized as Level 2 and the application of these procedures may result in transfers between Level 1 and Level 2. Depending on market activity, such fair valuations may be frequent. Such fair value pricing may result in net asset values that are higher or lower than net asset values based on the last reported sales price or latest quoted bid price. On October 31 2015, such fair value pricing was used in pricing foreign securities.
Investments in registered open-end investment companies are valued at net asset value. Interests in non-registered investment vehicles that are redeemable at net asset value are fair valued at net asset value when available.
Investments which are not valued using any of the methods discussed above are valued at their fair value, as determined in good faith by the Board of Trustees. The Board of Trustees has established a Valuation Committee comprised of the Trustees and has delegated to it the authority to take any actions regarding the valuation of portfolio securities that the Valuation Committee deems necessary or appropriate, including determining the fair value of portfolio securities, unless the determination has been delegated to the Management Valuation Team. The Board of Trustees retains the authority to make or ratify any valuation decisions or approve any changes to the Valuation Procedures as it deems appropriate. On a quarterly basis, the Board of Trustees receives reports on any valuation actions taken by the Valuation Committee or the Management Valuation Team which may include items for ratification.
Valuations of fair valued securities are compared to the next actual sales price when available, or other appropriate market values, to assess the continued appropriateness of the fair valuation methodologies used. These securities are fair valued on a day-to-day basis, taking into consideration changes to appropriate market information and any significant changes to the inputs considered in the valuation process until there is a readily available price provided on an exchange
| | | | |
| 30 | | Wells Fargo Diversified International Fund | | Notes to financial statements |
or by an independent pricing service. Valuations received from an independent pricing service or independent broker-dealer quotes are periodically validated by comparisons to most recent trades and valuations provided by other independent pricing services in addition to the review of prices by the manager and/or subadviser. Unobservable inputs used in determining fair valuations are identified based on the type of security, taking into consideration factors utilized by market participants in valuing the investment, knowledge about the issuer and the current market environment.
Foreign currency translation
The accounting records of the Fund are maintained in U.S. dollars. The values of other assets and liabilities denominated in foreign currencies are translated into U.S. dollars at rates provided by an independent foreign currency pricing source at a time each business day specified by the Management Valuation Team. Purchases and sales of securities, and income and expenses are converted at the rate of exchange on the respective dates of such transactions. Net realized foreign exchange gains or losses arise from sales of foreign currencies, currency gains or losses realized between the trade and settlement dates on securities transactions, and the difference between the amounts of dividends, interest and foreign withholding taxes recorded and the U.S. dollar equivalent of the amounts actually paid or received. Net unrealized foreign exchange gains and losses arise from changes in the fair value of assets and liabilities other than investments in securities resulting from changes in exchange rates. The changes in net assets arising from changes in exchange rates and the changes in net assets resulting from changes in market prices of securities are not separately presented. Such changes are included in net realized and unrealized gains or losses from investments.
Forward foreign currency contracts
The Fund is subject to foreign currency exchange rate risk in the normal course of pursuing its investment objectives. A forward foreign currency contract is an agreement between two parties to purchase or sell a specific currency for an agreed-upon price at a future date. The Fund enters into forward foreign currency contracts to facilitate transactions in foreign-denominated securities and to attempt to minimize the risk to the Fund from adverse changes in the relationship between currencies. Forward foreign currency contracts are recorded at the forward rate and marked-to-market daily. When the contracts are closed, realized gains and losses arising from such transactions are recorded as realized gains or losses on forward foreign currency contract transactions. The Fund could be exposed to risks if the counterparties to the contracts are unable to meet the terms of their contracts or if the value of the foreign currency changes unfavorably. The Fund’s maximum risk of loss from counterparty credit risk is the unrealized gains on the contracts. This risk may be mitigated if there is a master netting arrangement between the Fund and the counterparty.
Security loans
The Fund may lend its securities from time to time in order to earn additional income in the form of fees or interest on securities received as collateral or the investment of any cash received as collateral. The Fund continues to receive interest or dividends on the securities loaned. The Fund receives collateral in the form of cash or securities with a value at least equal to the value of the securities on loan. The value of the loaned securities is determined at the close of each business day and any additional required collateral is delivered to the Fund on the next business day. In a securities lending transaction, the net asset value of the Fund will be affected by an increase or decrease in the value of the securities loaned and by an increase or decrease in the value of the instrument in which collateral is invested. The amount of securities lending activity undertaken by the Fund fluctuates from time to time. In the event of default or bankruptcy by the borrower, the Fund may be prevented from recovering the loaned securities or gaining access to the collateral or may experience delays or costs in doing so. In addition, the investment of any cash collateral received may lose all or part of its value. The Fund has the right under the lending agreement to recover the securities from the borrower on demand.
The Fund lends its securities through an unaffiliated securities lending agent. Cash collateral received in connection with its securities lending transactions is invested in Securities Lending Cash Investments, LLC (the “Securities Lending Fund”). The Securities Lending Fund is exempt from registration under Section 3(c)(7) of the 1940 Act and is managed by Funds Management and is subadvised by Wells Capital Management Incorporated (“WellsCap”). Funds Management receives an advisory fee starting at 0.05% and declining to 0.01% as the average daily net assets of the Securities Lending Fund increase. All of the fees received by Funds Management are paid to WellsCap for its services as subadviser. The Securities Lending Fund seeks to provide a positive return compared to the daily Fed Funds Open rate by investing in high-quality, U.S. dollar-denominated short-term money market instruments. Securities Lending Fund investments are fair valued based upon the amortized cost valuation technique. Income earned from investment in the Securities Lending Fund is included in securities lending income on the Statement of Operations.
Security transactions and income recognition
Securities transactions are recorded on a trade date basis. Realized gains or losses are recorded on the basis of identified cost.
| | | | | | |
| Notes to financial statements | | Wells Fargo Diversified International Fund | | | 31 | |
Dividend income is recognized on the ex-dividend date, except for certain dividends from foreign securities, which are recorded as soon as the custodian verifies the ex-dividend date. Dividend income from foreign securities is recorded net of foreign taxes withheld where recovery of such taxes is not assured.
Distributions to shareholders
Distributions to shareholders from net investment income and net realized gains, if any, are recorded on the ex-dividend date. Such distributions are determined in conformity with federal income tax regulations, which may differ in amount or character from net investment income and realized gains recognized for purposes of U.S. generally accepted accounting principles.
Federal and other taxes
The Fund intends to continue to qualify as a regulated investment company by distributing substantially all of its investment company taxable income and any net realized capital gains (after reduction for capital loss carryforwards) sufficient to relieve it from all, or substantially all, federal income taxes. Accordingly, no provision for federal income taxes was required.
The Fund’s income and federal excise tax returns and all financial records supporting those returns for the prior three fiscal years are subject to examination by the federal and Delaware revenue authorities. Management has analyzed the Fund’s tax positions taken on federal, state, and foreign tax returns for all open tax years and does not believe that there are any uncertain tax positions that require recognition of a tax liability.
Reclassifications are made to the Fund’s capital accounts for permanent tax differences to reflect income and gains available for distribution (or available capital loss carryforwards) under federal income tax regulations. U.S. generally accepted accounting principles require that certain components of net assets be adjusted to reflect permanent differences between financial and tax reporting. These reclassifications have no effect on net assets or net asset values per share. The primary permanent difference causing such reclassifications is due to foreign currency transactions. At October 31, 2015, as a result of permanent book-to-tax differences, the following reclassification adjustments were made on the Statement of Assets and Liabilities:
| | | | |
| Paid-in capital | | Undistributed net
investment income | | Accumulated net
realized losses
on investments |
| $13 | | $118,742 | | $(118,755) |
Capital loss carryforwards that do not expire are required to be utilized prior to capital loss carryforwards that expire. As of October 31, 2015, capital loss carryforwards available to offset future net realized capital gains were as follows through the indicated expiration dates:
| | | | |
| | | No expiration |
| 2017 | | Short-term | | Long-term |
$89,306,475 | | $9,194,452 | | $2,025,419 |
Class allocations
The separate classes of shares offered by the Fund differ principally in applicable sales charges, distribution, shareholder servicing, and administration fees. Class specific expenses are charged directly to that share class. Investment income, common expenses, and realized and unrealized gains (losses) on investments are allocated daily to each class of shares based on the relative proportion of net assets of each class.
3. FAIR VALUATION MEASUREMENTS
Fair value measurements of investments are determined within a framework that has established a fair value hierarchy based upon the various data inputs utilized in determining the value of the Fund’s investments. The three-level hierarchy gives the highest priority to unadjusted quoted prices in active markets for identical assets or liabilities (Level 1) and the lowest priority to significant unobservable inputs (Level 3). The Fund’s investments are classified within the fair value hierarchy based on the lowest level of input that is significant to the fair value measurement. The inputs are summarized into three broad levels as follows:
| n | | Level 1 – quoted prices in active markets for identical securities |
| n | | Level 2 – other significant observable inputs (including quoted prices for similar securities, interest rates, prepayment speeds, credit risk, use of amortized cost, etc.) |
| n | | Level 3 – significant unobservable inputs (including the Fund’s own assumptions in determining the fair value of investments) |
| | | | |
| 32 | | Wells Fargo Diversified International Fund | | Notes to financial statements |
The inputs or methodologies used for valuing investments in securities are not necessarily an indication of the risk associated with investing in those securities.
The following is a summary of the inputs used in valuing the Fund’s assets and liabilities as of October 31, 2015:
| | | | | | | | | | | | | | | | |
| | | Quoted prices
(Level 1) | | | Other significant
observable inputs
(Level 2) | | | Significant
unobservable inputs
(Level 3) | | | Total | |
Assets | | | | | | | | | | | | | | | | |
Investments in: | | | | | | | | | | | | | | | | |
| | | | |
Common stocks | | | | | | | | | | | | | | | | |
Australia | | $ | 0 | | | $ | 1,234,397 | | | $ | 0 | | | $ | 1,234,397 | |
Austria | | | 0 | | | | 296,598 | | | | 0 | | | | 296,598 | |
Belgium | | | 0 | | | | 1,440,185 | | | | 0 | | | | 1,440,185 | |
Brazil | | | 22,383 | | | | 282,878 | | | | 0 | | | | 305,261 | |
Canada | | | 1,564,198 | | | | 0 | | | | 0 | | | | 1,564,198 | |
China | | | 1,749,090 | | | | 4,137,710 | | | | 0 | | | | 5,886,800 | |
Czech Republic | | | 0 | | | | 97,905 | | | | 0 | | | | 97,905 | |
Denmark | | | 0 | | | | 92,103 | | | | 0 | | | | 92,103 | |
Finland | | | 0 | | | | 148,731 | | | | 0 | | | | 148,731 | |
France | | | 0 | | | | 5,480,386 | | | | 0 | | | | 5,480,386 | |
Germany | | | 0 | | | | 10,548,470 | | | | 0 | | | | 10,548,470 | |
Hong Kong | | | 0 | | | | 3,268,059 | | | | 0 | | | | 3,268,059 | |
Hungary | | | 0 | | | | 28,358 | | | | 0 | | | | 28,358 | |
India | | | 526,265 | | | | 507,239 | | | | 0 | | | | 1,033,504 | |
Ireland | | | 1,607,001 | | | | 287,505 | | | | 0 | | | | 1,894,506 | |
Israel | | | 0 | | | | 470,920 | | | | 0 | | | | 470,920 | |
Italy | | | 0 | | | | 3,287,584 | | | | 0 | | | | 3,287,584 | |
Japan | | | 0 | | | | 16,599,994 | | | | 0 | | | | 16,599,994 | |
Liechtenstein | | | 94,665 | | | | 0 | | | | 0 | | | | 94,665 | |
Mexico | | | 926,289 | | | | 0 | | | | 0 | | | | 926,289 | |
Netherlands | | | 208,120 | | | | 2,034,141 | | | | 0 | | | | 2,242,261 | |
Norway | | | 194,976 | | | | 831,484 | | | | 0 | | | | 1,026,460 | |
Poland | | | 0 | | | | 87,088 | | | | 0 | | | | 87,088 | |
Russia | | | 152,250 | | | | 119,216 | | | | 0 | | | | 271,466 | |
Singapore | | | 0 | | | | 209,016 | | | | 0 | | | | 209,016 | |
South Africa | | | 84,298 | | | | 193,382 | | | | 0 | | | | 277,680 | |
South Korea | | | 0 | | | | 1,915,875 | | | | 0 | | | | 1,915,875 | |
Spain | | | 245,202 | | | | 1,023,739 | | | | 0 | | | | 1,268,941 | |
Sweden | | | 0 | | | | 1,802,002 | | | | 0 | | | | 1,802,002 | |
Switzerland | | | 201,375 | | | | 7,656,577 | | | | 0 | | | | 7,857,952 | |
Taiwan | | | 0 | | | | 246,538 | | | | 0 | | | | 246,538 | |
Thailand | | | 137,046 | | | | 0 | | | | 0 | | | | 137,046 | |
United Kingdom | | | 2,470,717 | | | | 14,141,543 | | | | 0 | | | | 16,612,260 | |
United States | | | 1,642,091 | | | | 0 | | | | 0 | | | | 1,642,091 | |
| | | | |
Participation notes | | | | | | | | | | | | | | | | |
China | |
| 0
|
| | | 325,954 | | | | 0 | | | | 325,954 | |
| | | | |
Preferred stocks | | | | | | | | | | | | | | | | |
Brazil | | | 0 | | | | 25,240 | | | | 0 | | | | 25,240 | |
Germany | | | 0 | | | | 279,051 | | | | 0 | | | | 279,051 | |
| | | | |
Rights | | | | | | | | | | | | | | | | |
Spain | | | 0 | | | | 1,254 | | | | 0 | | | | 1,254 | |
| | | | |
Short-term investments | | | | | | | | | | | | | | | | |
Investment companies | | | 3,073,631 | | | | 353,678 | | | | 0 | | | | 3,427,309 | |
| | | 14,899,597 | | | | 79,454,800 | | | | 0 | | | | 94,354,397 | |
| | | | |
Forward foreign currency contracts | | | 0 | | | | 123,291 | | | | 0 | | | | 123,291 | |
Total assets | | $ | 14,899,597 | | | $ | 79,578,091 | | | $ | 0 | | | $ | 94,477,688 | |
| | | | | | |
| Notes to financial statements | | Wells Fargo Diversified International Fund | | | 33 | |
Forward foreign currency contracts are reported at their unrealized gains (losses) at measurement date, which represents the change in the contract’s value from trade date. All other assets and liabilities are reported at their market value at measurement date.
The Fund recognizes transfers between levels within the fair value hierarchy at the end of the reporting period. At October 31, 2015, fair value pricing was used in pricing certain foreign securities and securities valued at $64,278,514 were transferred from Level 1 to Level 2. The Fund did not have any transfers into/out of Level 3.
4. TRANSACTIONS WITH AFFILIATES AND OTHER EXPENSES
Management fee
Funds Management, an indirect wholly owned subsidiary of Wells Fargo & Company (“Wells Fargo”), is the manager of the Fund and provides advisory and fund-level administrative services under an investment management agreement. Under the investment management agreement, Funds Management is responsible for, among other services, implementing the investment objectives and strategies of the Fund, supervising the applicable subadvisers, providing fund-level administrative services in connection with the Fund’s operations, and providing any other fund-level administrative services reasonably necessary for the operation of the Fund. As compensation for its services under the investment management agreement, Funds Management is entitled to receive an annual management fee starting at 0.90% and declining to 0.73% as the average daily net assets of the Fund increase.
Prior to July 1, 2015, Funds Management provided advisory services pursuant to an investment advisory agreement and was entitled to receive an annual fee which started at 0.85% and declined to 0.70% as the average daily net assets of the Fund increased. In addition, fund-level administrative services were provided by Funds Management under a separate administration agreement at an annual fee which started at 0.05% and declined to 0.03% as the average daily net assets of the Fund increased. For financial statement purposes, the advisory fee and fund-level administration fee for the year ended October 31, 2015 have been included in management fee on the Statement of Operations.
For the year ended October 31 2015, the management fee was equivalent to an annual rate of 0.90% of the Fund’s average daily net assets.
Funds Management has retained the services of a certain subadvisers to provide daily portfolio management to the Fund. The fee for subadvisory services is borne by Funds Management. Artisan Partners Limited Partnership, LSV Asset Management, and Wells Cap (an affiliate of Funds Management and an indirect wholly owned subsidiary of Wells Fargo) are the subadvisers to the Fund and are entitled to receive a fee from Funds Management which is calculated based on the average daily net assets of the Fund as follows:
| | | | | | | | |
| | | Annual subadvisory fee | |
| | | starting at | | | declining to | |
Artisan Partners Limited Partnership | | | 0.80 | % | | | 0.50 | % |
LSV Asset Management | | | 0.35 | | | | 0.30 | |
WellsCap | | | 0.45 | | | | 0.40 | |
Administration fees
Under a class-level administration agreement, Funds Management provides class-level administrative services to the Fund, which includes paying fees and expenses for services provided by the transfer agent, sub-transfer agents, omnibus account servicers and record-keepers. As compensation for its services under the class-level administration agreement, Funds Management receives an annual fee which is calculated based on the average daily net assets of each class as follows:
| | | | | | | | |
| | | Class-level administration fee | |
| | | Current rate | | | Rate prior to
July 1, 2015 | |
Class A, Class B, Class C | | | 0.21 | % | | | 0.26 | % |
Class R | | | 0.21 | | | | N/A | |
Class R6 | | | 0.03 | | | | N/A | |
Administrator Class | | | 0.13 | | | | 0.10 | |
Institutional Class | | | 0.13 | | | | 0.08 | |
Investor Class | | | 0.32 | | | | 0.32 | |
| | | | |
| 34 | | Wells Fargo Diversified International Fund | | Notes to financial statements |
Funds Management has contractually waived and/or reimbursed management and administration fees to the extent necessary to maintain certain net operating expense ratios for the Fund. Waiver of fees and/or reimbursement of expenses by Funds Management were made first from fund level expenses on a proportionate basis and then from class specific expenses. Funds Management has committed to waive fees and/or reimburse expenses to the extent necessary to cap expenses as follows:
| | | | | | | | |
| | | Expense
ratio cap | | | Expiration date | |
Class A | | | 1.41% | | | | February 29, 2016 | |
Class B | | | 2.16% | | | | February 29, 2016 | |
Class C | | | 2.16% | | | | February 29, 2016 | |
Class R | | | 1.60% | | | | February 28, 2017 | |
Class R6 | | | 0.89% | | | | February 28, 2017 | |
Administrator Class | | | 1.25% | | | | February 29, 2016 | |
Institutional Class | | | 0.99% | | | | February 29, 2016 | |
After this time, the cap may be increased or the commitment to maintain the cap may be terminated only with the approval of the Board of Trustees.
Distribution fees
The Trust has adopted a distribution plan for Class B, Class C, and Class R shares of the Fund pursuant to Rule 12b-1 under the 1940 Act. Distribution fees are charged to Class B, Class C, and Class R shares and paid to Wells Fargo Funds Distributor, LLC (“Funds Distributor”), the principal underwriter, at an annual rate of 0.75% of the average daily net assets of Class B and Class C shares and 0.25% of the average daily net assets of Class R shares.
In addition, Funds Distributor is entitled to receive the front-end sales charge from the purchase of Class A shares and a contingent deferred sales charge on the redemption of certain Class A shares. Funds Distributor is also entitled to receive the contingent deferred sales charges from redemptions of Class B and Class C shares. For the year ended October 31, 2015, Funds Distributor received $2,855 from the sale of Class A shares and $131 in contingent deferred sales charges from redemptions of Class C shares.
Shareholder servicing fees
The Trust has entered into contracts with one or more shareholder servicing agents, whereby Class A, Class B, Class C, Class R, Administrator Class, and Investor Class of the Fund is charged a fee at an annual rate of 0.25% of the average daily net assets of each respective class.
A portion of these total shareholder servicing fees were paid to affiliates of Wells Fargo.
5. INVESTMENT PORTFOLIO TRANSACTIONS
Purchases and sales of investments, excluding U.S. government obligations (if any) and short-term securities, for the year ended October 31, 2015 were $37,005,546 and $26,147,064, respectively.
6. DERIVATIVE TRANSACTIONS
During the year ended October 31, 2015, the Fund entered into forward foreign currency contracts for economic hedging purposes.
At October 31, 2015, the Fund had forward foreign currency contracts outstanding as follows:
Forward foreign currency contracts to sell:
| | | | | | | | | | | | | | | | | | |
| Exchange Date | | Counterparty | | Contracts
to deliver | | | U.S. value at October 31, 2015 | | | In exchange for U.S. $ | | | Unrealized
gains | |
11-27-2015 | | Credit Suisse | | | 88,500 | EUR | | $ | 97,348 | | | $ | 99,450 | | | $ | 2,102 | |
11-27-2015 | | Credit Suisse | | | 1,354,300 | EUR | | | 1,489,699 | | | | 1,559,598 | | | | 69,899 | |
12-28-2015 | | Morgan Stanley | | | 397,700 | EUR | | | 437,755 | | | | 447,234 | | | | 9,479 | |
1-13-2016 | | Citibank | | | 134,796,000 | JPY | | | 1,118,652 | | | | 1,126,624 | | | | 7,972 | |
1-13-2016 | | Credit Suisse | | | 1,116,551 | EUR | | | 1,229,449 | | | | 1,263,288 | | | | 33,839 | |
| | | | | | |
| Notes to financial statements | | Wells Fargo Diversified International Fund | | | 35 | |
The Fund had average contract amounts of $289,251 and $4,000,660 in forward foreign currency contracts to buy and forward foreign currency contracts to sell, respectively, during the year ended October 31, 2015.
The fair value, realized gains or losses and change in unrealized gains or losses, if any, on derivative instruments are reflected in the appropriate financial statements.
For certain types of derivative transactions, the Fund has entered into International Swaps and Derivatives Association, Inc. master agreements (“ISDA Master Agreements”) or similar agreements with approved counterparties. The ISDA Master Agreements or similar agreements may have requirements to deliver/deposit securities or cash to/with an exchange or broker-dealer as collateral and allows the Fund to offset, with each counterparty, certain derivative financial instrument’s assets and/or liabilities with collateral held or pledged. Collateral requirements differ by type of derivative. Collateral or margin requirements are set by the broker or exchange clearing house for exchange traded derivatives while collateral terms are contract specific for over-the-counter traded derivatives. Cash collateral that has been pledged to cover obligations of the Fund under ISDA Master Agreements or similar agreements, if any, are reported separately in the Statement of Assets and Liabilities. Securities pledged as collateral, if any, are noted in the Portfolio of Investments. With respect to balance sheet offsetting, absent an event of default by the counterparty or a termination of the agreement, the reported amounts of financial assets and financial liabilities in the Statement of Assets and Liabilities are not offset across transactions between the Fund and the applicable counterparty. A reconciliation of the gross amounts on the Statement of Assets and Liabilities to the net amounts by derivative type, including any collateral exposure, is as follows:
| | | | | | | | | | | | | | | | | | |
| Derivative type | | Counterparty | | Gross amounts
of assets in the
Statement of
Assets and
Liabilities | | | Amounts
subject to
netting
agreements | | | Collateral
received | | | Net amount
of assets | |
Forward foreign currency contracts | | Credit Suisse | | $ | 105,840 | * | | $ | 0 | | | $ | 0 | | | $ | 105,840 | |
| | Citibank | | | 7,972 | * | | | 0 | | | | 0 | | | | 7,972 | |
| | Morgan Stanley | | | 9,479 | * | | | 0 | | | | 0 | | | | 9,479 | |
| | * | Amount represents net unrealized gains. | |
7. BANK BORROWINGS
The Trust (excluding the money market funds) and Wells Fargo Variable Trust are parties to a $200,000,000 revolving credit agreement whereby the Fund is permitted to use bank borrowings for temporary or emergency purposes, such as to fund shareholder redemption requests. Interest under the credit agreement is charged to the Fund based on a borrowing rate equal to the higher of the Federal Funds rate in effect on that day plus 1.25% or the overnight LIBOR rate in effect on that day plus 1.25%. In addition, an annual commitment fee equal to 0.20% of the unused balance is allocated to each participating fund. Prior to September 1, 2015, the revolving credit agreement amount was $150,000,000 and the annual commitment fee was equal to 0.10% of the unused balance which was allocated to each participating fund. For the year ended October 31, 2015, the Fund paid $188 commitment fees.
For the year ended October 31, 2015, there were no borrowings by the Fund under the agreement.
8. DISTRIBUTIONS TO SHAREHOLDERS
The tax character of distributions paid was $1,961,502 and $1,357,365 of ordinary income for the years ended October 31, 2015 and October 31, 2014, respectively.
As of October 31, 2015, the components of distributable earnings on a tax basis were as follows:
| | | | |
Undistributed
ordinary income | | Unrealized
gains | | Capital loss
carryforward |
| $1,164,812 | | $3,911,736 | | $(100,526,346) |
9. INDEMNIFICATION
Under the Trust’s organizational documents, the officers and Trustees have been granted certain indemnification rights against certain liabilities that may arise out of performance of their duties to the Trust. Additionally, in the normal course of business, the Trust may enter into contracts with service providers that contain a variety of indemnification clauses. The Trust’s maximum exposure under these arrangements is dependent on future claims that may be made against the Fund and, therefore, cannot be estimated.
| | | | |
| 36 | | Wells Fargo Diversified International Fund | | Report of independent registered public accounting firm |
BOARD OF TRUSTEES AND SHAREHOLDERS OF WELLS FARGO FUNDS TRUST:
We have audited the accompanying statement of assets and liabilities, including the portfolio of investments, of the Wells Fargo Diversified International Fund (the “Fund”), one of the funds constituting the Wells Fargo Funds Trust, as of October 31, 2015, and the related statement of operations for the year then ended, the statements of changes in net assets for each of the years in the two-year period then ended, and the financial highlights for each of the years or periods in the five-year period then ended. These financial statements and financial highlights are the responsibility of the Fund’s management. Our responsibility is to express an opinion on these financial statements and financial highlights based on our audits.
We conducted our audits in accordance with the standards of the Public Company Accounting Oversight Board (United States). Those standards require that we plan and perform the audit to obtain reasonable assurance about whether the financial statements and financial highlights are free of material misstatement. An audit includes examining, on a test basis, evidence supporting the amounts and disclosures in the financial statements. Our procedures included confirmation of securities owned as of October 31, 2015, by correspondence with the custodian and brokers, or by other appropriate auditing procedures. An audit also includes assessing the accounting principles used and significant estimates made by management, as well as evaluating the overall financial statement presentation. We believe that our audits provide a reasonable basis for our opinion.
In our opinion, the financial statements and financial highlights referred to above present fairly, in all material respects, the financial position of the Wells Fargo Diversified International Fund as of October 31, 2015, the results of its operations for the year then ended, the changes in its net assets for each of the years in the two-year period then ended, and the financial highlights for each of the years or periods in the five-year period then ended, in conformity with U.S. generally accepted accounting principles.

Boston, Massachusetts
December 22, 2015
| | | | | | |
| Other information (unaudited) | | Wells Fargo Diversified International Fund | | | 37 | |
TAX INFORMATION
For corporate shareholders, pursuant to Section 854 of the Internal Revenue Code, 4.17% of ordinary income dividends qualify for the corporate dividends-received deduction for the fiscal year ended October 31, 2015.
Pursuant to Section 854 of the Internal Revenue Code, $1,961,502 of income dividends paid during the fiscal year ended October 31, 2015 has been designated as qualified dividend income (QDI).
Pursuant to Section 853 of the Internal Revenue Code, the Fund expects to designate amounts as foreign taxes paid for the fiscal year ended October 31 2015. Additional details will be available in the semiannual report.
PROXY VOTING INFORMATION
A description of the policies and procedures that the Fund uses to determine how to vote proxies relating to portfolio securities is available, upon request, by calling 1-800-222-8222, visiting our website at wellsfargofunds.com, or visiting the SEC website at sec.gov. Information regarding how the Fund voted proxies relating to portfolio securities during the most recent 12-month period ended June 30 is available on the Fund’s website at wellsfargofunds.com or by visiting the SEC website at sec.gov.
PORTFOLIO HOLDINGS INFORMATION
The complete portfolio holdings for the Fund are publicly available monthly on the Fund’s website (wellsfargofunds.com), on a one-month delayed basis. In addition, top ten holdings information (excluding derivative positions) for the Fund is publicly available on the Fund’s website on a monthly, seven-day or more delayed basis. The Fund files its complete schedule of portfolio holdings with the SEC for the first and third quarters of each fiscal year on Form N-Q, which is available by visiting the SEC website at sec.gov. In addition, the Fund’s Form N-Q may be reviewed and copied at the SEC’s Public Reference Room in Washington, DC, and at regional offices in New York City, at 233 Broadway, and in Chicago, at 175 West Jackson Boulevard, Suite 900. Information about the Public Reference Room may be obtained by calling 1-800-SEC-0330.
| | | | |
| 38 | | Wells Fargo Diversified International Fund | | Other information (unaudited) |
BOARD OF TRUSTEES AND OFFICERS
Each of the Trustees and Officers1 listed in the table below acts in identical capacities for each fund in the Wells Fargo family of funds, which consists of 144 mutual funds comprising the Wells Fargo Funds Trust, Wells Fargo Variable Trust, Wells Fargo Master Trust and four closed-end funds (collectively the “Fund Complex”). This table should be read in conjunction with the Prospectus and the Statement of Additional Information2. The mailing address of each Trustee and Officer is 525 Market Street, 12th Floor, San Francisco, CA 94105. Each Trustee and Officer serves an indefinite term, however, each Trustee serves such term until reaching the mandatory retirement age established by the Trustees.
Independent Trustees
| | | | | | |
Name and
year of birth | | Position held and
length of service* | | Principal occupations during past five years or longer | | Other
public company or
investment company
directorships during
past 5 years |
William R. Ebsworth
(Born 1957) | | Trustee, since 2015** | | Retired. From 1984 to 2013, equities analyst, portfolio manager, research director at Fidelity Management and Research Company in Boston, Tokyo, and Hong Kong, and retired in 2013 as Chief Investment Officer of Fidelity Strategic Advisers, Inc. where he led a team of investment professionals managing client assets. Prior thereto, Board member of Hong Kong Securities Clearing Co., Hong Kong Options Clearing Corp., the Thailand International Fund, Ltd., Fidelity Investments Life Insurance Company, and Empire Fidelity Investments Life Insurance Company. Mr. Ebsworth is a CFA® charterholder and an Adjunct Lecturer, Finance, at Babson College. | | Asset Allocation Trust |
Jane A. Freeman
(Born 1953) | | Trustee, since 2015** | | Retired. From 2012 to 2014 and 1999 to 2008, Chief Financial Officer of Scientific Learning Corporation. From 2008 to 2012, Ms. Freeman provided consulting services related to strategic business projects. Prior to 1999, Portfolio Manager at Rockefeller & Co. and Scudder, Stevens & Clark. Board member of the Harding Loevner Funds from 1996 to 2014, serving as both Lead Independent Director and chair of the Audit Committee. Board member of the Russell Exchange Traded Funds Trust from 2011 to 2012 and the chair of the Audit Committee. Ms. Freeman is Chair of Taproot Foundation (non-profit organization), a Board Member of Ruth Bancroft Garden (non-profit organization) and an inactive chartered financial analyst. | | Asset Allocation Trust; Harding Loevner Funds; Russell Exchange Traded Funds Trust |
Peter G. Gordon
(Born 1942) | | Trustee, since 1998; Chairman, since 2005 | | Co-Founder, Retired Chairman, President and CEO of Crystal Geyser Water Company. Trustee Emeritus, Colby College. | | Asset Allocation Trust |
Isaiah Harris, Jr.
(Born 1952) | | Trustee, since 2009 | | Retired. Chairman of the Board of CIGNA Corporation since 2009, and Director since 2005. From 2003 to 2011, Director of Deluxe Corporation. Prior thereto, President and CEO of BellSouth Advertising and Publishing Corp. from 2005 to 2007, President and CEO of BellSouth Enterprises from 2004 to 2005 and President of BellSouth Consumer Services from 2000 to 2003. Emeritus member of the Iowa State University Foundation Board of Governors. Emeritus Member of the Advisory Board of Iowa State University School of Business. Advisory Board Member, Palm Harbor Academy (charter school). Mr. Harris is a certified public accountant. | | CIGNA Corporation; Asset Allocation Trust |
Judith M. Johnson
(Born 1949) | | Trustee, since 2008;
Audit Committee Chairman, since 2008 | | Retired. Prior thereto, Chief Executive Officer and Chief Investment Officer of Minneapolis Employees Retirement Fund from 1996 to 2008. Ms. Johnson is an attorney, certified public accountant and a certified managerial accountant. | | Asset Allocation Trust |
David F. Larcker
(Born 1950) | | Trustee, since 2009 | | James Irvin Miller Professor of Accounting at the Graduate School of Business, Stanford University, Morgan Stanley Director of the Center for Leadership Development and Research and Senior Faculty of The Rock Center for Corporate Governance since 2006. From 2005 to 2008, Professor of Accounting at the Graduate School of Business, Stanford University. Prior thereto, Ernst & Young Professor of Accounting at The Wharton School, University of Pennsylvania from 1985 to 2005. | | Asset Allocation Trust |
| | | | | | |
| Other information (unaudited) | | Wells Fargo Diversified International Fund | | | 39 | |
| | | | | | |
Name and
year of birth | | Position held and
length of service* | | Principal occupations during past five years or longer | | Other
public company or
investment company
directorships during
past 5 years |
Olivia S. Mitchell
(Born 1953) | | Trustee, since 2006 | | International Foundation of Employee Benefit Plans Professor, Wharton School of the University of Pennsylvania since 1993. Director of Wharton’s Pension Research Council and Boettner Center on Pensions & Retirement Research, and Research Associate at the National Bureau of Economic Research. Previously, Cornell University Professor from 1978 to 1993. | | Asset Allocation Trust |
Timothy J. Penny
(Born 1951) | | Trustee, since 1996 | | President and Chief Executive Officer of Southern Minnesota Initiative Foundation, a non-profit organization, since 2007 and Senior Fellow at the Humphrey Institute Policy Forum at the University of Minnesota since 1995. Member of the Board of Trustees of NorthStar Education Finance, Inc., a non-profit organization, since 2007. | | Asset Allocation Trust |
Michael S. Scofield
(Born 1943) | | Trustee, since 2010 | | Served on the Investment Company Institute’s Board of Governors and Executive Committee from 2008-2011 as well the Governing Council of the Independent Directors Council from 2006-2011 and the Independent Directors Council Executive Committee from 2008-2011. Chairman of the IDC from 2008-2010. Institutional Investor (Fund Directions) Trustee of Year in 2007. Trustee of the Evergreen Funds complex (and its predecessors) from 1984 to 2010. Chairman of the Evergreen Funds from 2000-2010. Former Trustee of the Mentor Funds. Retired Attorney, Law Offices of Michael S. Scofield. | | Asset Allocation Trust |
Donald C. Willeke
(Born 1940) | | Trustee, since 1996*** | | Principal of the law firm of Willeke & Daniels. General Counsel of the Minneapolis Employees Retirement Fund from 1984 until its consolidation into the Minnesota Public Employees Retirement Association on June 30, 2010. Director and Vice Chair of The Tree Trust (non-profit corporation). Director of the American Chestnut Foundation (non-profit corporation). | | Asset Allocation Trust |
| * | Length of service dates reflect the Trustee’s commencement of service with the Trust’s predecessor entities, where applicable. |
| ** | William R. Ebsworth and Jane A. Freeman each became a Trustee effective January 1, 2015. |
| *** | Donald Willeke will retire as a Trustee effective December 31, 2015. |
Officers
| | | | | | |
Name and
year of birth | | Position held and
length of service | | Principal occupations during past five years or longer | | |
Karla M. Rabusch
(Born 1959) | | President, since 2003 | | Executive Vice President of Wells Fargo Bank, N.A. and President of Wells Fargo Funds Management, LLC since 2003. | | |
Jeremy DePalma1
(Born 1974) | | Treasurer, since 2012 | | Senior Vice President of Wells Fargo Funds Management, LLC since 2009. Senior Vice President of Evergreen Investment Management Company, LLC from 2008 to 2010 and head of the Fund Reporting and Control Team within Fund Administration from 2005 to 2010. | | |
C. David Messman
(Born 1960) | | Secretary, since 2000; Chief Legal Officer, since 2003 | | Senior Vice President and Secretary of Wells Fargo Funds Management, LLC since 2001. Assistant General Counsel of Wells Fargo Bank, N.A. since 2013 and Vice President and Managing Counsel of Wells Fargo Bank N.A. from 1996 to 2013. | | |
Debra Ann Early
(Born 1964) | | Chief Compliance Officer, since 2007 | | Executive Vice President of Wells Fargo Funds Management, LLC since 2014, Senior Vice President and Chief Compliance Officer from 2007 to 2014. | | |
David Berardi
(Born 1975) | | Assistant Treasurer, since 2009 | | Vice President of Wells Fargo Funds Management, LLC since 2009. Vice President of Evergreen Investment Management Company, LLC from 2008 to 2010. Manager of Fund Reporting and Control for Evergreen Investment Management Company, LLC from 2004 to 2010. | | |
| 1 | Jeremy DePalma acts as Treasurer of 72 funds and Assistant Treasurer of 72 funds in the Fund Complex. |
| 2 | The Statement of Additional Information includes additional information about the Trustees and is available, without charge, upon request, by calling 1-800-222-8222 or by visiting the website at wellsfargoadvantagefunds.com. |
| | | | |
| 40 | | Wells Fargo Diversified International Fund | | Other information (unaudited) |
BOARD CONSIDERATION OF INVESTMENT ADVISORY, INVESTMENT MANAGEMENT AND SUB-ADVISORY AGREEMENTS:
Under the Investment Company Act of 1940 (the “1940 Act”), the Board of Trustees (the “Board”) of Wells Fargo Funds Trust (the “Trust”) must determine annually whether to approve the continuation of the Trust’s investment advisory and sub-advisory agreements. In this regard, at an in-person meeting held on May 19-20, 2015 (the “Meeting”), the Board, all the members of which have no direct or indirect interest in the investment advisory and sub-advisory agreements and are not “interested persons” of the Trust, as defined in the 1940 Act (the “Independent Trustees”), reviewed and approved for Wells Fargo Advantage Diversified International Fund (the “Fund”): (i) an investment advisory agreement (the “Advisory Agreement”) with Wells Fargo Funds Management, LLC (“Funds Management”); (ii) an investment management agreement (the “Management Agreement”) with Funds Management; (iii) an investment sub-advisory agreement with Wells Capital Management Incorporated (“WellsCap”), an affiliate of Funds Management; (iv) an investment sub-advisory agreement with Artisan Partners, LP ( “Artisan”); and (v) an investment sub-advisory agreement with LSV Asset Management (“LSV”). The Management Agreement combines the terms of the Advisory Agreement with the terms of the Fund’s Amended and Restated Administration Agreement (the “Administration Agreement”) applicable to Fund-level administrative services. The sub-advisory agreements with WellsCap, Artisan and LSV (the “Sub-Advisers”) are collectively referred to as the “Sub-Advisory Agreements,” and the Advisory Agreement, the Management Agreement and the Sub-Advisory Agreements are collectively referred to as the “Advisory Agreements.”
At the Meeting, the Board considered the factors and reached the conclusions described below relating to the selection of Funds Management and the Sub-Advisers and the approval of the Advisory Agreements. Prior to the Meeting, including at an in-person meeting in March 2015, the Trustees conferred extensively among themselves and with representatives of Funds Management about these matters. Also, the Board has adopted a team-based approach, with each team consisting of a sub-set of Trustees, to assist the full Board in the discharge of its duties in reviewing performance and other matters throughout the year. The Independent Trustees were assisted in their evaluation of the Advisory Agreements by independent legal counsel, from whom they received separate legal advice and with whom they met separately.
In providing information to the Board, Funds Management and the Sub-Advisers were guided by a detailed set of requests for information submitted to them by independent legal counsel on behalf of the Independent Trustees at the start of the Board’s annual contract renewal process earlier in 2015. In considering and approving the Advisory Agreements, the Trustees considered the information they believed relevant, including but not limited to the information discussed below. The Board considered not only the specific information presented in connection with the Meeting, but also the knowledge gained over time through interaction with Funds Management and the Sub-Advisers about various topics. In this regard, the Board reviewed reports of Funds Management at each of its quarterly meetings, which included, among other things, portfolio reviews and performance reports. In addition, the Board and the teams mentioned above confer with portfolio managers at various times throughout the year. The Board did not identify any particular information or consideration that was all-important or controlling, and each individual Trustee may have attributed different weights to various factors.
After its deliberations, the Board unanimously approved the continuation of the Advisory Agreement for the period from June 1, 2015 through June 30, 2015, approved the Management Agreement for the period from July 1, 2015 through May 31, 2016, and approved the continuation of each Sub-Advisory Agreement for a one-year term through May 31, 2016. The Board also determined that the compensation payable to Funds Management and the Sub-Advisers under each of the Advisory Agreements was reasonable. The Board considered the approval of the Advisory Agreements for the Fund as part of its consideration of agreements for funds across the complex, but its approvals were made on a fund-by-fund basis. The following summarizes a number of important, but not necessarily all, factors considered by the Board in support of its approvals.
Nature, extent and quality of services
The Board received and considered various information regarding the nature, extent and quality of services provided to the Fund by Funds Management and the Sub-Advisers under the Advisory Agreements. This information included, among other things, a summary of the background and experience of senior management of Funds Management, and the qualifications, background, tenure and responsibilities of each of the portfolio managers primarily responsible for the day-to-day portfolio management of the Fund. The Board noted that the services to be provided to the Fund pursuant to the Management Agreement combined the advisory services previously provided to the Fund pursuant to the Fund’s Advisory Agreement with the Fund-level administrative services previously provided to the Fund pursuant to the Fund’s Administration Agreement. The Board received a representation from Funds Management that combining these services would not result in any change to the nature or level of services provided by Funds Management to the Fund.
| | | | | | |
| Other information (unaudited) | | Wells Fargo Diversified International Fund | | | 41 | |
The Board evaluated the ability of Funds Management and the Sub-Advisers to attract and retain qualified investment professionals, including research, advisory and supervisory personnel. The Board further considered the compliance programs and compliance records of Funds Management and the Sub-Advisers. In addition, the Board took into account the full range of services provided to the Fund by Funds Management and its affiliates.
Fund performance and expenses
The Board considered the performance results for the Fund over various time periods ended March 31, 2015. The Board considered these results in comparison to the performance of funds in a universe that was determined by Lipper Inc. (“Lipper”) to be similar to the Fund (the “Universe”), and in comparison to the Fund’s benchmark index and to other comparative data. Lipper is an independent provider of investment company data. The Board received a description of the methodology used by Lipper to select the mutual funds in the performance Universe. The Board noted that the performance of the Fund (Administrator Class) was higher than or in range of the average performance of the Universe for all periods under review. The Board also noted that the performance of the Fund was higher or in range of its benchmark, the MSCI EAFE Index (Net), for all periods under review.
The Board also received and considered information regarding the Fund’s net operating expense ratios and their various components, including actual management fees (which reflect fee waivers, if any, and include advisory, administration and transfer agent fees), custodian and other non-management fees, and Rule 12b-1 and non-Rule 12b-1 service fees. The Board considered these ratios in comparison to the median ratios of funds in class-specific expense groups that were determined by Lipper to be similar to the Fund (the “Groups”). The Board received a description of the methodology used by Lipper to select the mutual funds in the expense Groups and an explanation of how funds comprising expense groups and their expense ratios may vary from year-to-year. Based on the Lipper reports, the Board noted that the net operating expense ratios of the Fund were equal to or lower than the median net operating expense ratios of the expense Groups for all share classes except the Investor Class. The Board discussed and accepted Funds Management’s proposal to reduce the net operating expense ratio caps for the Class A, Class B and Class C, and to convert the Investor Class shares into Class A shares.
The Board took into account the Fund performance and expense information provided to it among the factors considered in deciding to re-approve the Advisory Agreement and the Sub-Advisory Agreements and approve the Management Agreement.
Investment advisory and sub-advisory fee rates
The Board reviewed and considered the contractual investment advisory fee rates that are payable by the Fund to Funds Management for investment advisory services (the “Advisory Agreement Rates”), both on a stand-alone basis and on a combined basis with the Fund’s fund-level and class-level contractual administration fee rates (the “Management Rates”). The Board noted that the Management Rates include transfer agency and sub-transfer agency costs. The Board also noted that the fee rate to be paid by the Fund under the Management Agreement will incorporate the advisory fee and Fund-level administration fee previously payable separately by the Fund under the Fund’s Advisory Agreement and Administration Agreement with Funds Management. The Board also reviewed and considered the contractual investment sub-advisory fee rates that are payable by Funds Management to each of the Sub-Advisers for investment sub-advisory services (the “Sub-Advisory Agreement Rates”).
Among other information reviewed by the Board was a comparison of the Management Rates of the Fund with those of other funds in the expense Groups at a common asset level. The Board noted that the Management Rates of the Fund were in range of the average rates for the Fund’s expense Groups for all share classes except the Investor Class. The Board discussed and accepted Funds Management’s proposal to convert the Investor Class shares into Class A shares.
The Board also received and considered information about the portion of the total advisory fee that was retained by Funds Management after payment of the fee to the Sub-Advisers for sub-advisory services. In assessing the reasonableness of this amount, the Board received and evaluated information about the nature and extent of responsibilities retained and risks assumed by Funds Management and not delegated to or assumed by the Sub-Advisers, and about Funds Management’s on-going oversight services. However, given the affiliation between Funds Management and WellsCap, the Board ascribed limited relevance to the allocation of the advisory fee between them. The Board also considered that the sub-advisory fees paid to Artisan and LSV had been negotiated by Funds Management on an arm’s length basis.
The Board also received and considered information about the nature and extent of services offered and fee rates charged by Funds Management and the Sub-Advisers to other types of clients with investment strategies similar to those of the Fund. In this regard, the Board received information about the significantly greater scope of services, and
| | | | |
| 42 | | Wells Fargo Diversified International Fund | | Other information (unaudited) |
compliance, reporting and other legal burdens and risks of managing mutual funds compared with those associated with managing assets of non-mutual fund clients such as collective funds or institutional separate accounts.
Based on its consideration of the factors and information it deemed relevant, including those described here, the Board determined that the compensation payable to Funds Management under the Management Agreement and Advisory Agreement and to the Sub-Advisers under the Sub-Advisory Agreements was reasonable, in light of the services covered by the Advisory Agreements.
Profitability
The Board received and considered information concerning the profitability of Funds Management, as well as the profitability of Wells Fargo as a whole, from providing services to the Fund and the fund family as a whole. The Board also received and considered information concerning the profitability of WellsCap from providing services to the fund family as a whole, noting that WellsCap’s profitability information with respect to providing services to the Fund was subsumed in the Wells Fargo profitability analysis. The Board did not consider profitability with respect to Artisan or LSV, as the sub-advisory fees paid to Artisan and LSV had been negotiated by Funds Management on an arm’s length basis.
Funds Management reported on the methodologies and estimates used in calculating profitability. Among other things, the Board noted that the levels of profitability reported on a fund-by-fund basis varied widely, depending on factors such as the size and type of fund. Based on its review, the Board did not deem the profits reported by Funds Management or Wells Fargo from its services to the Fund to be at a level that would prevent it from approving the continuation of the Advisory Agreements.
Economies of scale
With respect to possible economies of scale, the Board noted the existence of breakpoints in the Fund’s advisory and management fee structures, and the Fund’s administration fee structure, which operate generally to reduce the Fund’s expense ratios as the Fund grows in size. It considered that, for a small fund or a fund that shrinks in size, breakpoints conversely can result in higher fee levels. The Board also considered that fee waiver and expense reimbursement arrangements and competitive fee rates at the outset are means of sharing potential economies of scale with shareholders of the Fund and the fund family as a whole. The Board considered Funds Management’s view that any analyses of potential economies of scale in managing a particular fund are inherently limited in light of the joint and common costs and investments that Funds Management incurs across the fund family as a whole.
The Board concluded that the Fund’s fee and expense arrangements, including contractual breakpoints, constituted a reasonable approach to sharing potential economies of scale with the Fund and its shareholders.
Other benefits to Funds Management and the Sub-Advisers
The Board received and considered information regarding potential “fall-out” or ancillary benefits received by Funds Management and its affiliates, including WellsCap, and Artisan and LSV, as a result of their relationships with the Fund. Ancillary benefits could include, among others, benefits directly attributable to other relationships with the Fund and benefits potentially derived from an increase in Funds Management’s and the Sub-Advisers’ business as a result of their relationships with the Fund. The Board noted that various affiliates of Funds Management may receive distribution-related fees, shareholder servicing payments and sub-transfer agency fees in respect of shares sold or held through them and services provided.
The Board also reviewed information about soft dollar credits earned and utilized by WellsCap and Artisan, fees earned by Funds Management and WellsCap from managing a private investment vehicle for the fund family’s securities lending collateral and commissions earned by an affiliated broker from portfolio transactions.
Based on its consideration of the factors and information it deemed relevant, including those described here, the Board did not find that any ancillary benefits received by Funds Management and its affiliates, including WellsCap, or either Artisan or LSV were unreasonable.
Conclusion
At the Meeting, after considering the above-described factors and based on its deliberations and its evaluation of the information described above, the Board unanimously approved the continuation of the Advisory Agreement for the period from June 1, 2015 through June 30, 2015, approved the Management Agreement for the period from July 1, 2015 through May 31, 2016, and approved the continuation of each Sub-Advisory Agreement for a one-year term through May 31, 2016. The Board also determined that the compensation payable to Funds Management and the Sub-Advisers under each of the Advisory Agreements was reasonable.
| | | | | | |
| List of abbreviations | | Wells Fargo Diversified International Fund | | | 43 | |
The following is a list of common abbreviations for terms and entities that may have appeared in this report.
| ACA | — ACA Financial Guaranty Corporation |
| ADR | — American depositary receipt |
| ADS | — American depositary shares |
| AGC | — Assured Guaranty Corporation |
| AGM | — Assured Guaranty Municipal |
| Ambac | — Ambac Financial Group Incorporated |
| AMT | — Alternative minimum tax |
| BAN | — Bond anticipation notes |
| BHAC | — Berkshire Hathaway Assurance Corporation |
| CAB | — Capital appreciation bond |
| CCAB | — Convertible capital appreciation bond |
| CDA | — Community Development Authority |
| CDO | — Collateralized debt obligation |
| DRIVER | — Derivative inverse tax-exempt receipts |
| DW&P | — Department of Water & Power |
| DWR | — Department of Water Resources |
| ECFA | — Educational & Cultural Facilities Authority |
| EDA | — Economic Development Authority |
| EDFA | — Economic Development Finance Authority |
| ETF | — Exchange-traded fund |
| FDIC | — Federal Deposit Insurance Corporation |
| FFCB | — Federal Farm Credit Banks |
| FGIC | — Financial Guaranty Insurance Corporation |
| FHA | — Federal Housing Administration |
| FHLB | — Federal Home Loan Bank |
| FHLMC | — Federal Home Loan Mortgage Corporation |
| FICO | — The Financing Corporation |
| FNMA | — Federal National Mortgage Association |
| GDR | — Global depositary receipt |
| GNMA | — Government National Mortgage Association |
| HCFR | — Healthcare facilities revenue |
| HEFA | — Health & Educational Facilities Authority |
| HEFAR | — Higher education facilities authority revenue |
| HFA | — Housing Finance Authority |
| HFFA | — Health Facilities Financing Authority |
| HUD | — Department of Housing and Urban Development |
| IDA | — Industrial Development Authority |
| IDAG | — Industrial Development Agency |
| KRW | — Republic of Korea won |
| LIBOR | — London Interbank Offered Rate |
| LIFER | — Long Inverse Floating Exempt Receipts |
| LLC | — Limited liability company |
| LLLP | — Limited liability limited partnership |
| LLP | — Limited liability partnership |
| MBIA | — Municipal Bond Insurance Association |
| MFHR | — Multifamily housing revenue |
| MSTR | — Municipal securities trust receipts |
| MUD | — Municipal Utility District |
| National | — National Public Finance Guarantee Corporation |
| PCFA | — Pollution Control Financing Authority |
| PCL | — Public Company Limited |
| PCR | — Pollution control revenue |
| PFA | — Public Finance Authority |
| PFFA | — Public Facilities Financing Authority |
| PFOTER | — Puttable floating option tax-exempt receipts |
| plc | — Public limited company |
| PUTTER | — Puttable tax-exempt receipts |
| R&D | — Research & development |
| Radian | — Radian Asset Assurance |
| RAN | — Revenue anticipation notes |
| RDA | — Redevelopment Authority |
| RDFA | — Redevelopment Finance Authority |
| REIT | — Real estate investment trust |
| ROC | — Reset option certificates |
| SAVRS | — Select auction variable rate securities |
| SBA | — Small Business Authority |
| SDR | — Swedish depositary receipt |
| SFHR | — Single-family housing revenue |
| SFMR | — Single-family mortgage revenue |
| SPA | — Standby purchase agreement |
| SPDR | — Standard & Poor’s Depositary Receipts |
| SPEAR | — Short Puttable Exempt Adjustable Receipts |
| STRIPS | — Separate trading of registered interest and |
| TAN | — Tax anticipation notes |
| TIPS | — Treasury inflation-protected securities |
| TRAN | — Tax revenue anticipation notes |
| TTFA | — Transportation Trust Fund Authority |
| TVA | — Tennessee Valley Authority |
This page is intentionally left blank.

For more information
More information about Wells Fargo Funds is available free upon request. To obtain literature, please write, email, visit the Fund’s website, or call:
Wells Fargo Funds
P.O. Box 8266
Boston, MA 02266-8266
Email: wfaf@wellsfargo.com
Website: wellsfargofunds.com
Individual investors: 1-800-222-8222
Retail investment professionals: 1-888-877-9275
Institutional investment professionals: 1-866-765-0778
This report and the financial statements contained herein are submitted for the general information of the shareholders of Wells Fargo Funds. If this report is used for promotional purposes, distribution of the report must be accompanied or preceded by a current prospectus. Before investing, please consider the investment objectives, risks, charges, and expenses of the investment. For a current prospectus and, if available, a summary prospectus, containing this information, call 1-800-222-8222 or visit the Fund’s website at wellsfargofunds.com. Read the prospectus carefully before you invest or send money.
Wells Fargo Funds Management, LLC, a wholly owned subsidiary of Wells Fargo & Company, provides investment advisory and administrative services for Wells Fargo Funds. Other affiliates of Wells Fargo & Company provide subadvisory and other services for the Funds. The Funds are distributed by Wells Fargo Funds Distributor, LLC, Member FINRA, an affiliate of Wells Fargo & Company.
NOT FDIC INSURED ¡ NO BANK GUARANTEE ¡ MAY LOSE VALUE
© 2015 Wells Fargo Funds Management, LLC. All rights reserved.
| | |
 | | 238506 12-15 A237/AR237 10-15 |
Annual Report
October 31, 2015

Wells Fargo Emerging Markets Equity Fund


Reduce clutter. Save trees.
Sign up for electronic delivery of prospectuses and shareholder reports at wellsfargo.com/advantagedelivery
Contents
The views expressed and any forward-looking statements are as of October 31, 2015, unless otherwise noted, and are those of the Fund managers and/or Wells Fargo Funds Management, LLC. Discussions of individual securities, or the markets generally, or any Wells Fargo Fund are not intended as individual recommendations. Future events or results may vary significantly from those expressed in any forward-looking statements. The views expressed are subject to change at any time in response to changing circumstances in the market. Wells Fargo Funds Management, LLC and the Fund disclaim any obligation to publicly update or revise any views expressed or forward-looking statements.
NOT FDIC INSURED ¡ NO BANK GUARANTEE ¡ MAY LOSE VALUE
| | | | |
| 2 | | Wells Fargo Emerging Markets Equity Fund | | Letter to shareholders (unaudited) |

Karla M. Rabusch
President
Wells Fargo Funds
Economic data continued to indicate that the U.S. economy was in a sluggish but consistent recovery.
Other major central banks, including the European Central Bank and the Bank of Japan, also continued to ease in order to support their respective economies.
Dear Valued Shareholder:
We are pleased to offer you this annual report for the Wells Fargo Emerging Markets Equity Fund for the 12-month period that ended October 31, 2015. The period was marked by continued low global interest rates and sluggish economic recovery in developed markets. However, the expectation that the U.S. Federal Reserve (Fed) would soon raise its key interest rate, combined with signs of further quantitative easing from other central banks, depressed the prices of international assets for U.S. dollar-based investors.
The Fed showed signs of raising its key rate, but other central banks continued to ease.
Economic data continued to indicate that the U.S. economy was in a sluggish but consistent recovery. For example, the U.S. unemployment rate eased from 5.8% at the beginning of the reporting period (November 2014) to 5.0% at the end (October 2015). Throughout the reporting period, the Federal Open Market Committee (FOMC), which is the Fed’s monetary policymaking body, kept its key interest rate effectively at zero.
As the period progressed, various comments by Fed Chair Janet Yellen led investors to believe that the FOMC would soon raise its key federal funds rate. The FOMC remained on hold at its September 2015 meeting, however, citing concerns about a weaker global economy and subdued U.S. inflation. The FOMC’s decision caused some uncertainty, but by the end of the period, most investors expected a modest Fed rate hike in late 2015 or early 2016.
In contrast, the People’s Bank of China (PBOC) continued to take several steps to support the slowing Chinese economy. In October 2015, the PBOC cut its benchmark one-year lending and deposit rates for the sixth time since November 2014 and trimmed the percentage of deposits that large banks need to hold as reserves for the fourth time. The moves were aimed at supporting the economy by encouraging lending. The PBOC’s actions tended to put pressure on the yuan versus foreign currencies, pressure that was only reinforced when the PBOC officially devalued the currency in August.
Other major central banks, including the European Central Bank and the Bank of Japan, also continued to ease in order to support their respective economies. The difference in policy between the Fed and other central banks led the U.S. dollar to appreciate against most major currencies, including most emerging markets currencies.
The year was a difficult one for emerging markets investing, marked by slower growth in China and a stronger dollar that depressed the returns of international assets.
Emerging markets faced a number of internal and external headwinds during the past 12 months. Internal factors included not only an economic slowdown in China—with the country’s annual growth rate dipping below 7% for the first time since 2009—but also persistent low prices for oil, natural gas, and industrial metals such as copper. Low oil and commodity prices weakened the economies of commodity producers, including Brazil, which also grappled with a political scandal involving corruption at its state-owned oil firm. Among external factors, global investors continued to worry about the timing of the first rate hike in the U.S. since 2006. The prospect for a U.S. rate hike led to a stronger U.S. dollar; given that many emerging markets have issued U.S. dollar-denominated debt, dollar strength could make it more difficult for emerging countries to repay their creditors.
| | | | | | |
| Letter to shareholders (unaudited) | | Wells Fargo Emerging Markets Equity Fund | | | 3 | |
As measured in local currency, the Morgan Stanley Capital International (MSCI) Emerging Markets Index (Net)1 lost 3.47% for the 12-month period, reflecting the headwinds in emerging markets. However, in U.S. dollar terms—the relevant return for U.S. dollar-based investors—the index declined 14.53% for the reporting period. This difference in returns highlights the dollar’s strength during the reporting period.
Don’t let short-term uncertainty derail long-term investment goals.
Periods of uncertainty can present challenges, but experience has taught us that maintaining long-term investment goals can be an effective way to plan for the future. To help you create a sound strategy based on your personal goals and risk tolerance, Wells Fargo Funds offers more than 100 mutual funds and other investments spanning a wide range of asset classes and investment styles. Although diversification cannot guarantee an investment profit or prevent losses, we believe it can be an effective way to manage investment risk and potentially smooth out overall portfolio performance. We encourage investors to know their investments and to understand that appropriate levels of risk-taking may unlock opportunities.
Thank you for choosing to invest with Wells Fargo Funds. We appreciate your confidence in us and remain committed to helping you meet your financial needs.
Sincerely,

Karla M. Rabusch
President
Wells Fargo Funds
Notice to shareholders
At a meeting held August 11-12, 2015, the Board of Trustees of the Fund approved a change in the name of the Fund whereby the word “Advantage” was removed from its name, effective December 15, 2015.
For current information about your fund investments, contact your investment professional, visit our website at wellsfargofunds.com, or call us directly at 1-800-222-8222. We are available 24 hours a day, 7 days a week.
| 1 | The Morgan Stanley Capital International (MSCI) Emerging Markets Index (Net) is a free-float-adjusted market-capitalization-weighted index that is designed to measure the equity market performance of emerging markets. The MSCI Emerging Markets Index (Net) consists of the following 23 emerging markets country indexes: Brazil, Chile, China, Colombia, Czech Republic, Egypt, Greece, Hungary, India, Indonesia, Korea, Malaysia, Mexico, Peru, the Philippines, Poland, Qatar, Russia, South Africa, Taiwan, Thailand, Turkey, and United Arab Emirates. You cannot invest directly in an index. Source: MSCI. MSCI makes no express or implied warranties or representations and shall have no liability whatsoever with respect to any MSCI data contained herein. The MSCI data may not be further redistributed or used as a basis for other indexes or any securities or financial products. This report is not approved, reviewed, or produced by MSCI. |
| | | | |
| 4 | | Wells Fargo Emerging Markets Equity Fund | | Performance highlights (unaudited) |
Investment objective
The Fund seeks long-term capital appreciation.
Manager
Wells Fargo Funds Management, LLC
Subadviser
Wells Capital Management Incorporated
Portfolio managers
Derrick Irwin, CFA
Richard Peck, CFA
Yi (Jerry) Zhang, Ph.D, CFA
Average annual total returns (%) as of October 31, 20151
| | | | | | | | | | | | | | | | | | | | | | | | | | | | | | | | | | |
| | | | | Including sales charge | | | Excluding sales charge | | | Expense ratios2 (%) | |
| | | Inception date | | 1 year | | | 5 year | | | 10 year | | | 1 year | | | 5 year | | | 10 year | | | Gross | | | Net3 | |
| Class A (EMGAX) | | 9-6-1994 | | | (19.91 | ) | | | (4.11 | ) | | | 6.66 | | | | (15.02 | ) | | | (2.97 | ) | | | 7.29 | | | | 1.60 | | | | 1.60 | |
| Class B (EMGBX)* | | 9-6-1994 | | | (19.84 | ) | | | (4.07 | ) | | | 6.74 | | | | (15.62 | ) | | | (3.68 | ) | | | 6.74 | | | | 2.35 | | | | 2.35 | |
| Class C (EMGCX) | | 9-6-1994 | | | (16.63 | ) | | | (3.69 | ) | | | 6.50 | | | | (15.63 | ) | | | (3.69 | ) | | | 6.50 | | | | 2.35 | | | | 2.35 | |
| Class R6 (EMGDX) | | 6-28-2013 | | | – | | | | – | | | | – | | | | (14.61 | ) | | | (2.52 | ) | | | 7.69 | | | | 1.17 | | | | 1.17 | |
| Administrator Class (EMGYX) | | 9-6-1994 | | | – | | | | – | | | | – | | | | (14.91 | ) | | | (2.81 | ) | | | 7.52 | | | | 1.52 | | | | 1.50 | |
| Institutional Class (EMGNX) | | 7-30-2010 | | | – | | | | – | | | | – | | | | (14.66 | ) | | | (2.55 | ) | | | 7.68 | | | | 1.27 | | | | 1.23 | |
| MSCI Emerging Markets Index (Net)4 | | – | | | – | | | | – | | | | – | | | | (14.53 | ) | | | (2.80 | ) | | | 5.70 | | | | – | | | | – | |
| * | | Class B shares are closed to investment, except in connection with the reinvestment of any distributions and permitted exchanges. |
Figures quoted represent past performance, which is no guarantee of future results, and do not reflect taxes that a shareholder may pay on fund distributions or the redemption of fund shares. Investment return and principal value of an investment will fluctuate so that an investor’s shares, when redeemed, may be worth more or less than their original cost. Performance shown without sales charges would be lower if sales charges were reflected. Current performance may be lower or higher than the performance data quoted, which assumes the reinvestment of dividends and capital gains. Current month-end performance is available on the Fund’s website, wellsfargofunds.com.
Index returns do not include transaction costs associated with buying and selling securities, any mutual fund fees or expenses, or any taxes. It is not possible to invest directly in an index.
For Class A shares, the maximum front-end sales charge is 5.75%. For Class B shares, the maximum contingent deferred sales charge is 5.00%. For Class C shares, the maximum contingent deferred sales charge is 1.00%. Performance including a contingent deferred sales charge assumes the sales charge for the corresponding time period. Class R6, Administrator Class, and Institutional Class shares are sold without a front-end sales charge or contingent deferred sales charge.
Stock values fluctuate in response to the activities of individual companies and general market and economic conditions. Foreign investments are especially volatile and can rise or fall dramatically due to differences in the political and economic conditions of the host country. These risks are generally intensified in emerging markets. The use of derivatives may reduce returns and/or increase volatility. Certain investment strategies tend to increase the total risk of an investment (relative to the broader market). The Fund is exposed to smaller-company securities risk. Consult the Fund’s prospectus for additional information on these and other risks.
Please see footnotes on page 5.
| | | | | | |
| Performance highlights (unaudited) | | Wells Fargo Emerging Markets Equity Fund | | | 5 | |
|
| Growth of $10,000 investment as of October 31, 20155 |
|
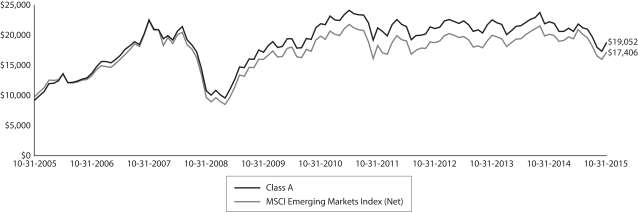 |
| 1 | Historical performance shown for Class R6 shares prior to their inception reflects the performance of Institutional Class shares and includes the higher expenses applicable to Institutional Class shares. If these expenses had not been included, returns would have been higher. Historical performance shown for Institutional Class shares prior to their inception reflects the performance of Administrator Class shares and includes the higher expenses applicable to Administrator Class shares. If these expenses had not been included, returns would be higher. Historical performance shown for all classes of the Fund prior to July 19, 2010, is based on the performance of the Fund’s predecessor, Evergreen Emerging Markets Growth Fund. |
| 2 | Reflects the expense ratios as stated in the most recent prospectuses, which include the impact of 0.01% in acquired fund fees and expenses. The expense ratios shown are subject to change and may differ from the annualized expense ratios shown in the financial highlights of this report, which do not include acquired fund fees and expenses. |
| 3 | The manager has contractually committed through February 28, 2017, to waive fees and/or reimburse expenses to the extent necessary to cap the Fund’s Total Annual Operating Expenses After Fee Waiver at 1.61% for Class A, 2.36% for Class B, 2.36% for Class C, 1.18% for Class R6, 1.49% for Administrator Class, and 1.22% for Institutional Class. After this time, the cap may be increased or the commitment to maintain the cap may be terminated only with the approval of the Board of Trustees. Brokerage commissions, stamp duty fees, interest, taxes, acquired fees and expenses, and extraordinary expenses are excluded from the cap. Without this cap, the Fund’s returns would have been lower. |
| 4 | The Morgan Stanley Capital International (MSCI) Emerging Markets Index (Net) is a free-float-adjusted market-capitalization-weighted index that is designed to measure the equity market performance of emerging markets. The MSCI Emerging Markets Index (Net) consists of the following 23 emerging markets country indexes: Brazil, Chile, China, Colombia, Czech Republic, Egypt, Greece, Hungary, India, Indonesia, Korea, Malaysia, Mexico, Peru, the Philippines, Poland, Qatar, Russia, South Africa, Taiwan, Thailand, Turkey, and United Arab Emirates. You cannot invest directly in an index. Source: MSCI. MSCI makes no express or implied warranties or representations and shall have no liability whatsoever with respect to any MSCI data contained herein. The MSCI data may not be further redistributed or used as a basis for other indexes or any securities or financial products. This report is not approved, reviewed, or produced by MSCI. |
| 5 | The chart compares the performance of Class A shares for the most recent ten years with the MSCI Emerging Markets Index (Net). The chart assumes a hypothetical investment of $10,000 in Class A shares and reflects all operating expenses and assumes the maximum initial sales charge of 5.75%. |
| 6 | The ten largest holdings, excluding cash and cash equivalents, are calculated based on the value of the investments divided by total net assets of the Fund. Holdings are subject to change and may have changed since the date specified. |
| 7 | Amounts are calculated based on the total long-term investments of the Fund. These amounts are subject to change and may have changed since the date specified. |
| * | This security was not held in the Fund at the end of the reporting period. |
| | | | |
| 6 | | Wells Fargo Emerging Markets Equity Fund | | Performance highlights (unaudited) |
MANAGER’S DISCUSSION
Fund highlights
| n | | The Fund underperformed its benchmark, the MSCI Emerging Markets Index (Net) for the 12-month period that ended October 31, 2015. |
| n | | The largest relative detractors among sectors included financials, health care, and energy. South Africa and Russia were among the most notable detractors on a country basis. |
| n | | Top contributing sectors included consumer staples and information technology (IT). Among countries, contributors included China/Hong Kong, India, and Malaysia. |
For most of the year, global macroeconomic factors rather than company fundamentals were the primary drivers of emerging markets.
Emerging markets fell sharply in December 2014 as the decline in crude oil prices, a strengthening U.S. dollar, and weak economic data in other developed economies weighed on sentiment. Russian equities fell more than 20% in U.S. dollar terms as the ruble experienced a crisis that required aggressive central bank action and political intervention to stabilize. Other oil-dependent economies also struggled, and aggressive currency moves made for a challenging investment environment. China was the exception, as financial stocks rallied sharply due to stimulus measures from the Chinese government. The rocky end to 2014 underscored investor nervousness following several years of slowing economic growth and emerging markets equity underperformance.
Going into 2015, currency swings dominated the emerging markets landscape, and the Russian ruble and the Indian rupee rallied sharply while other currencies remained under pressure. Chinese equities performed strongly as the government continued its supportive economic policies but simultaneously stoked equity market speculation. The U.S. Federal Reserve looked more likely to delay hiking interest rates, and this boosted markets, particularly in quantitative-easing-dependent countries like Brazil and Russia. China’s Hong Kong-listed shares rose on a surge of capital from mainland China combined with a surprise cut in the requirement reserve ratio for Chinese banks. By late April, emerging markets equities were approaching the top of the trading range in which they had been stuck for the past several years.
As if on cue, markets reversed course from late April through the end of August as the rampaging mainland Chinese equity market sharply reversed, undermining virtually the entire emerging markets universe. Over the four-month period starting in late April, the MSCI Emerging Markets Index (Net) suffered a 26.7% decline, the second-largest drawdown since the global financial crisis. Signs of stability emerged by October, and bargain-seeking investors reemerged, driving a large, if potentially unstable, rally.
We made modest changes to the portfolio during the reporting period. We trimmed positions such as Taiwan Semiconductor Manufacturing Company, Limited, and South Korea’s AmorePacific Corporation on profit-taking and Brazil’s Petroleo Brasileiro S.A. and Russia’s Sberbank Russia OJSC* because of deterioration in their fundamentals. We also eliminated some small positions that had been previously traded down. One of the notable additions was China’s Tencent Holdings Limited, taking advantage of a fallback in price.
| | | | |
| Ten largest holdings (%) as of October 31, 20156 | |
Samsung Electronics Company Limited | | | 5.27 | |
Taiwan Semiconductor Manufacturing Company Limited ADR | | | 3.58 | |
China Mobile Limited | | | 3.09 | |
China Life Insurance Company Limited H Shares | | | 2.90 | |
Fomento Economico Mexicano SAB de CV ADR | | | 2.87 | |
AIA Group Limited | | | 2.02 | |
Uni-President Enterprises Corporation | | | 1.95 | |
Ctrip.com International Limited ADR | | | 1.91 | |
ITC Limited | | | 1.71 | |
America Movil SAB de CV ADR | | | 1.70 | |
Strong stock performance in China/Hong Kong, India, and Malaysia was offset by weak returns in South Africa and Russia. In China/Hong Kong, the Fund benefited from an overweight to the markets and from strong absolute performances from such names as Ctrip.com International, Limited; China Life Insurance Company Limited; and SINA Corporation. Our biggest challenges were related to the Fund’s underweight position in Tencent (China) and its significant shareholder Naspers Limited (South Africa) because Tencent appreciated sharply early in the period. Additionally, slow growth in South Africa and trouble in Nigeria weighed on Shoprite Holdings Limited, a South African grocer with operations in both countries.
Please see footnotes on page 5.
| | | | | | |
| Performance highlights (unaudited) | | Wells Fargo Emerging Markets Equity Fund | | | 7 | |
Sectorally, consumer staples leaders were well diversified and included Mexican bottler and retailer Fomento Economico Mexicano, S.A.B de C.V.; Taiwanese consumer food and beverage company Uni-President Enterprises Corporation; and KT&G Corporation, the Korean tobacco and ginseng market leader. Certain Chinese internet companies, along with an overweight to Taiwanese semiconductor giant Taiwan Semiconductor Manufacturing Company, Limited, helped drive performance in IT. The Fund lagged in the financials sector, as Chinese banks, to which it has no exposure, performed well early in the year. An underweight to the health care sector, which held up better than the benchmark, along with unfavorable stock selection in that sector, detracted from relative results.
|
| Sector distribution as of October 31, 20157 |
|
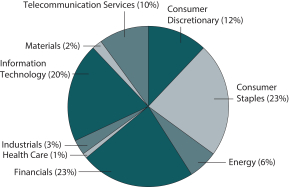 |
|
| Country allocation as October 31, 20157 |
|
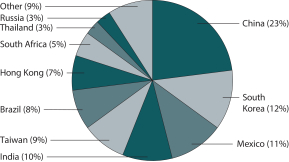 |
We remain cautiously optimistic about the opportunities in emerging markets.
Growth in emerging markets will likely be subdued in the near term. Many of the global macroeconomic trends currently in place may continue to be the main market drivers through the remainder of 2015, although we would hope to a lesser degree. Slowing growth in China and sustainably lower commodity prices will act as headwinds to global growth and may tip individual companies and even certain economies into crisis. So far, adjustment mechanisms such as flexible exchange rates and high levels of foreign exchange reserves have worked well. However, if the current trend of declining foreign exchange reserves (in China and elsewhere) continues, it will undoubtedly have a tightening effect on monetary conditions in emerging markets.
We believe that even in a slower-growth environment, emerging markets will continue to be an important component of the global economy, offering many excellent companies with strong long-term growth prospects. Often, times of stress provide the opportunity to buy such assets at compelling valuations. Further, just as we need to be vigilant of markets coming undone quickly, we must remember that economies can adjust more quickly than expected. For instance, there are already signs of adjustment occurring in countries with large current account surpluses, such as Brazil and South Africa. Aggressive currency declines have begun to alter the terms of trade, which in turn may be closing trade gaps in both countries. Sentiment is extremely negative in emerging markets, and often that is the point where conditions begin to improve. Finally, in our view emerging markets equity valuations are not stretched, particularly when compared with their developed markets counterparts.
Please see footnotes on page 5.
| | | | |
| 8 | | Wells Fargo Emerging Markets Equity Fund | | Fund expenses (unaudited) |
As a shareholder of the Fund, you incur two types of costs: (1) transaction costs, including sales charges (loads) on purchase payments and contingent deferred sales charges (if any) on redemptions and (2) ongoing costs, including management fees, distribution (12b-1) and/or shareholder servicing fees, and other Fund expenses. This example is intended to help you understand your ongoing costs (in dollars) of investing in the Fund and to compare these costs with the ongoing costs of investing in other mutual funds.
The example is based on an investment of $1,000 invested at the beginning of the six-month period and held for the entire period from May 1, 2015 to October 31, 2015.
Actual expenses
The “Actual” line of the table below provides information about actual account values and actual expenses. You may use the information in this line, together with the amount you invested, to estimate the expenses that you paid over the period. Simply divide your account value by $1,000 (for example, an $8,600 account value divided by $1,000 = 8.6), then multiply the result by the number in the “Actual” line under the heading entitled “Expenses paid during period” for your applicable class of shares to estimate the expenses you paid on your account during this period.
Hypothetical example for comparison purposes
The “Hypothetical” line of the table below provides information about hypothetical account values and hypothetical expenses based on the Fund’s actual expense ratio and an assumed rate of return of 5% per year before expenses, which is not the Fund’s actual return. The hypothetical account values and expenses may not be used to estimate the actual ending account balance or expenses you paid for the period. You may use this information to compare the ongoing costs of investing in the Fund and other funds. To do so, compare this 5% hypothetical example with the 5% hypothetical examples that appear in the shareholder reports of the other funds.
Please note that the expenses shown in the table are meant to highlight your ongoing costs only and do not reflect any transactional costs, such as sales charges (loads) and contingent deferred sales charges. Therefore, the “Hypothetical” line of the table is useful in comparing ongoing costs only and will not help you determine the relative total costs of owning different funds. In addition, if these transactional costs were included, your costs would have been higher.
| | | | | | | | | | | | | | | | |
| | | Beginning account value 5-1-2015 | | | Ending account value 10-31-2015 | | | Expenses paid during the period1 | | | Net annualized expense ratio | |
Class A | | | | | | | | | | | | | | | | |
Actual | | $ | 1,000.00 | | | $ | 862.25 | | | $ | 7.60 | | | | 1.62 | % |
Hypothetical (5% return before expenses) | | $ | 1,000.00 | | | $ | 1,017.04 | | | $ | 8.24 | | | | 1.62 | % |
Class B | | | | | | | | | | | | | | | | |
Actual | | $ | 1,000.00 | | | $ | 859.38 | | | $ | 11.01 | | | | 2.37 | % |
Hypothetical (5% return before expenses) | | $ | 1,000.00 | | | $ | 1,013.36 | | | $ | 11.93 | | | | 2.37 | % |
Class C | | | | | | | | | | | | | | | | |
Actual | | $ | 1,000.00 | | | $ | 859.39 | | | $ | 11.11 | | | | 2.37 | % |
Hypothetical (5% return before expenses) | | $ | 1,000.00 | | | $ | 1,013.26 | | | $ | 12.03 | | | | 2.37 | % |
Class R6 | | | | | | | | | | | | | | | | |
Actual | | $ | 1,000.00 | | | $ | 864.42 | | | $ | 5.55 | | | | 1.18 | % |
Hypothetical (5% return before expenses) | | $ | 1,000.00 | | | $ | 1,019.26 | | | $ | 6.01 | | | | 1.18 | % |
Administrator Class | | | | | | | | | | | | | | | | |
Actual | | $ | 1,000.00 | | | $ | 862.79 | | | $ | 6.95 | | | | 1.48 | % |
Hypothetical (5% return before expenses) | | $ | 1,000.00 | | | $ | 1,017.74 | | | $ | 7.53 | | | | 1.48 | % |
Institutional Class | | | | | | | | | | | | | | | | |
Actual | | $ | 1,000.00 | | | $ | 863.97 | | | $ | 5.73 | | | | 1.22 | % |
Hypothetical (5% return before expenses) | | $ | 1,000.00 | | | $ | 1,019.06 | | | $ | 6.21 | | | | 1.22 | % |
| 1 | Expenses paid is equal to the annualized expense ratio of each class multiplied by the average account value over the period, multiplied by the number of days in the most recent fiscal half-year divided by the number of days in the fiscal year (to reflect the one-half-year period). |
| | | | | | |
| Portfolio of investments—October 31, 2015 | | Wells Fargo Emerging Markets Equity Fund | | | 9 | |
| | | | | | | | | | | | |
| Security name | | | | | | Shares | | | Value | |
| | | | | | | | | | | | |
| | | | |
Common Stocks: 96.38% | | | | | | | | | | | | |
| | | | |
| Argentina: 0.51% | | | | | | | | | | | | |
MercadoLibre Incorporated (Information Technology, Internet Software & Services) « | | | | | | | 175,300 | | | $ | 17,244,261 | |
| | | | | | | | | | | | |
| | | | |
| Brazil: 6.03% | | | | | | | | | | | | |
Ambev SA ADR (Consumer Staples, Beverages) | | | | | | | 8,022,000 | | | | 39,067,140 | |
B2W Cia Digital (Consumer Discretionary, Internet & Catalog Retail) † | | | | | | | 2,951,424 | | | | 11,147,386 | |
Banco Bradesco SA ADR (Financials, Banks) | | | | | | | 4,735,249 | | | | 25,759,755 | |
BM&F Bovespa SA (Financials, Diversified Financial Services) | | | | | | | 8,659,000 | | | | 25,602,821 | |
BRF Brasil Foods SA ADR (Consumer Staples, Food Products) | | | | | | | 976,078 | | | | 14,963,276 | |
CETIP SA (Financials, Capital Markets) | | | | | | | 3,081,437 | | | | 27,258,007 | |
Lojas Renner SA (Consumer Discretionary, Multiline Retail) | | | | | | | 3,833,000 | | | | 18,388,850 | |
Multiplan Empreendimentos Imobiliarios SA (Financials, Real Estate Management & Development) | | | | | | | 1,126,200 | | | | 12,279,005 | |
Petroleo Brasileiro SA ADR Class A (Energy, Oil, Gas & Consumable Fuels) † | | | | | | | 1,482,953 | | | | 5,916,982 | |
Raia Drogasil SA (Consumer Staples, Food & Staples Retailing) | | | | | | | 1,522,600 | | | | 15,783,763 | |
Rumo Logistica Operadora Multimodal SA (Industrials, Road & Rail) † | | | | | | | 3,095,351 | | | | 5,890,301 | |
Vale SA ADR (Materials, Metals & Mining) « | | | | | | | 421,636 | | | | 1,838,333 | |
| | | | |
| | | | | | | | | | | 203,895,619 | |
| | | | | | | | | | | | |
| | | | |
| Chile: 1.94% | | | | | | | | | | | | |
Banco Santander Chile SA ADR (Financials, Banks) | | | | | | | 1,669,200 | | | | 31,698,108 | |
SACI Falabella (Consumer Discretionary, Multiline Retail) | | | | | | | 5,042,942 | | | | 33,908,872 | |
| | | | |
| | | | | | | | | | | 65,606,980 | |
| | | | | | | | | | | | |
| | | | |
| China: 22.90% | | | | | | | | | | | | |
51Job Incorporated ADR (Industrials, Professional Services) Ǡ | | | | | | | 1,123,941 | | | | 38,000,445 | |
Alibaba Group Holding Limited ADR (Information Technology, Internet Software & Services) † | | | | | | | 308,037 | | | | 25,822,742 | |
Baidu Incorporated ADR (Information Technology, Internet Software & Services) † | | | | | | | 176,540 | | | | 33,095,954 | |
China Auto Rental Incorporated (Consumer Discretionary, Automobiles) †« | | | | | | | 1,256,469 | | | | 2,197,016 | |
China Life Insurance Company Limited H Shares (Financials, Insurance) | | | | | | | 27,168,290 | | | | 97,971,085 | |
China Mobile Limited (Telecommunication Services, Wireless Telecommunication Services) | | | | | | | 8,720,165 | | | | 104,553,779 | |
CNOOC Limited (Energy, Oil, Gas & Consumable Fuels) | | | | | | | 33,674,000 | | | | 38,035,171 | |
Ctrip.com International Limited ADR (Consumer Discretionary, Internet & Catalog Retail) † | | | | | | | 693,816 | | | | 64,504,074 | |
Hengan International Group Company Limited (Consumer Staples, Personal Products) | | | | | | | 5,077,000 | | | | 54,823,614 | |
Legend Holdings Corporation H Shares (Financials, Diversified Financial Services) Ǡ | | | | | | | 908,901 | | | | 3,513,064 | |
Mindray Medical International Limited ADR (Health Care, Health Care Equipment & Supplies) | | | | | | | 644,148 | | | | 15,446,669 | |
New Oriental Education & Technology Group Incorporated (Consumer Discretionary, Diversified Consumer Services) | | | | | | | 1,761,182 | | | | 48,450,117 | |
PetroChina Company Limited H Shares (Energy, Oil, Gas & Consumable Fuels) | | | | | | | 21,266,000 | | | | 16,649,232 | |
Shandong Weigao Group Medical Polymer Company Limited H Shares (Health Care, Health Care Equipment & Supplies) | | | | | | | 18,024,000 | | | | 12,444,927 | |
SINA Corporation (Information Technology, Internet Software & Services) Ǡ | | | | | | | 1,165,907 | | | | 55,543,809 | |
Tencent Holdings Limited (Information Technology, Internet Software & Services) | | | | | | | 1,678,800 | | | | 31,644,324 | |
Tingyi Holding Corporation (Consumer Staples, Food Products) | | | | | | | 22,498,000 | | | | 38,517,455 | |
Tsingtao Brewery Company Limited H Shares (Consumer Staples, Beverages) | | | | | | | 8,310,000 | | | | 39,667,715 | |
Vipshop Holdings Limited ADR (Consumer Discretionary, Internet & Catalog Retail) Ǡ | | | | | | | 1,634,738 | | | | 33,544,824 | |
Weibo Corporation ADR (Information Technology, Internet Software & Services) Ǡ | | | | | | | 1,243,046 | | | | 20,037,902 | |
| | | | |
| | | | | | | | | | | 774,463,918 | |
| | | | | | | | | | | | |
The accompanying notes are an integral part of these financial statements.
| | | | |
| 10 | | Wells Fargo Emerging Markets Equity Fund | | Portfolio of investments—October 31, 2015 |
| | | | | | | | | | | | |
| Security name | | | | | | Shares | | | Value | |
| | | | | | | | | | | | |
| | | | |
| Colombia: 0.55% | | | | | | | | | | | | |
Bancolombia SA ADR (Financials, Banks) « | | | | | | | 542,400 | | | $ | 18,777,888 | |
| | | | | | | | | | | | |
| | | | |
| Hong Kong: 6.51% | | | | | | | | | | | | |
AIA Group Limited (Financials, Insurance) | | | | | | | 11,651,400 | | | | 68,315,996 | |
Belle International Holdings Limited (Consumer Discretionary, Textiles, Apparel & Luxury Goods) | | | | | | | 54,659,000 | | | | 53,053,997 | |
Johnson Electric Holdings Limited (Industrials, Electrical Equipment) | | | | | | | 4,214,250 | | | | 15,424,132 | |
Li Ning Company Limited (Consumer Discretionary, Textiles, Apparel & Luxury Goods) † | | | | | | | 25,884,207 | | | | 13,486,528 | |
Sun Art Retail Group Limited (Consumer Staples, Food & Staples Retailing) « | | | | | | | 30,190,500 | | | | 24,677,397 | |
WH Group Limited (Consumer Staples, Food Products) †144A | | | | | | | 81,905,500 | | | | 45,166,678 | |
| | | | |
| | | | | | | | | | | 220,124,728 | |
| | | | | | | | | | | | |
| | | | |
| India: 10.12% | | | | | | | | | | | | |
Bharti Airtel Limited (Telecommunication Services, Wireless Telecommunication Services) | | | | | | | 4,038,728 | | | | 21,527,901 | |
Bharti Infratel Limited (Telecommunication Services, Wireless Telecommunication Services) | | | | | | | 3,378,464 | | | | 20,079,068 | |
HDFC Bank Limited ADR (Financials, Banks) | | | | | | | 123,826 | | | | 7,570,722 | |
Housing Development Finance Corporation Limited (Financials, Thrifts & Mortgage Finance) | | | | | | | 2,230,700 | | | | 42,757,535 | |
ICICI Bank Limited ADR (Financials, Banks) | | | | | | | 5,911,775 | | | | 50,959,501 | |
Indusind Bank Limited (Financials, Banks) | | | | | | | 817,217 | | | | 11,377,959 | |
Infosys Limited ADR (Information Technology, IT Services) « | | | | | | | 3,052,460 | | | | 55,432,674 | |
ITC Limited (Consumer Staples, Tobacco) | | | | | | | 11,312,640 | | | | 57,811,208 | |
Reliance Industries Limited (Energy, Oil, Gas & Consumable Fuels) | | | | | | | 1,834,200 | | | | 26,564,681 | |
Reliance Industries Limited GDR (Energy, Oil, Gas & Consumable Fuels) 144A | | | | | | | 1,246,587 | | | | 35,777,047 | |
Ultra Tech Cement Limited (Materials, Construction Materials) | | | | | | | 286,000 | | | | 12,628,662 | |
| | | | |
| | | | | | | | | | | 342,486,958 | |
| | | | | | | | | | | | |
| | | | |
| Indonesia: 2.19% | | | | | | | | | | | | |
PT Astra International Tbk (Consumer Discretionary, Automobiles) | | | | | | | 14,651,000 | | | | 6,298,152 | |
PT Bank Central Asia Tbk (Financials, Banks) | | | | | | | 9,549,500 | | | | 8,971,060 | |
PT Blue Bird Tbk (Industrials, Road & Rail) | | | | | | | 13,605,309 | | | | 5,734,174 | |
PT Link Net Tbk (Telecommunication Services, Diversified Telecommunication Services) † | | | | | | | 44,178,161 | | | | 13,843,730 | |
PT Matahari Department Store Tbk (Consumer Discretionary, Multiline Retail) | | | | | | | 10,474,600 | | | | 12,611,287 | |
PT Telekomunikasi Indonesia Persero Sponsored ADR Tbk (Telecommunication Services, Diversified Telecommunication Services) « | | | | | | | 666,877 | | | | 26,515,030 | |
| | | | |
| | | | | | | | | | | 73,973,433 | |
| | | | | | | | | | | | |
| | | | |
| Malaysia: 1.12% | | | | | | | | | | | | |
Genting Bhd (Consumer Discretionary, Hotels, Restaurants & Leisure) | | | | | | | 8,480,900 | | | | 14,619,192 | |
Genting Malaysia Bhd (Consumer Discretionary, Hotels, Restaurants & Leisure) | | | | | | | 17,996,300 | | | | 17,996,949 | |
Sime Darby Bhd (Industrials, Industrial Conglomerates) | | | | | | | 2,665,937 | | | | 5,177,211 | |
| | | | |
| | | | | | | | | | | 37,793,352 | |
| | | | | | | | | | | | |
| | | | |
| Mexico: 10.99% | | | | | | | | | | | | |
America Movil SAB de CV ADR (Telecommunication Services, Wireless Telecommunication Services) « | | | | | | | 3,232,320 | | | | 57,567,619 | |
Cemex SAB de CV ADR (Materials, Construction Materials) † | | | | | | | 3,089,994 | | | | 19,497,862 | |
Fibra Uno Administracion SAB de CV (Financials, REITs) | | | | | | | 25,836,922 | | | | 56,654,840 | |
Fomento Economico Mexicano SAB de CV ADR (Consumer Staples, Beverages) | | | | | | | 979,100 | | | | 97,019,019 | |
Grupo Financiero Banorte SAB de CV (Financials, Banks) | | | | | | | 9,798,611 | | | | 52,458,025 | |
Grupo Financiero Santander SAB de CV ADR (Financials, Banks) | | | | | | | 2,508,441 | | | | 22,952,235 | |
Grupo Sanborns SA de CV (Consumer Discretionary, Multiline Retail) | | | | | | | 1,714,153 | | | | 3,009,507 | |
The accompanying notes are an integral part of these financial statements.
| | | | | | |
| Portfolio of investments—October 31, 2015 | | Wells Fargo Emerging Markets Equity Fund | | | 11 | |
| | | | | | | | | | | | |
| Security name | | | | | | Shares | | | Value | |
| | | | | | | | | | | | |
| | | | |
| Mexico (continued) | | | | | | | | | | | | |
Grupo Televisa SAB ADR (Consumer Discretionary, Media) | | | | | | | 1,017,000 | | | $ | 29,635,380 | |
Wal-Mart de Mexico SAB de CV (Consumer Staples, Food & Staples Retailing) | | | | | | | 12,477,100 | | | | 33,047,568 | |
| | | | |
| | | | | | | | | | | 371,842,055 | |
| | | | | | | | | | | | |
| | | | |
| Peru: 0.29% | | | | | | | | | | | | |
Compania de Minas Buenaventura SA ADR (Materials, Metals & Mining) | | | | | | | 1,523,600 | | | | 9,766,276 | |
| | | | | | | | | | | | |
| | | | |
| Philippines: 0.82% | | | | | | | | | | | | |
Ayala Corporation (Financials, Diversified Financial Services) | | | | | | | 647,624 | | | | 10,774,665 | |
Metropolitan Bank & Trust Company (Financials, Banks) | | | | | | | 4,287,486 | | | | 7,777,270 | |
SM Investments Corporation (Industrials, Industrial Conglomerates) | | | | | | | 488,582 | | | | 9,112,238 | |
| | | | |
| | | | | | | | | | | 27,664,173 | |
| | | | | | | | | | | | |
| | | | |
| Russia: 2.63% | | | | | | | | | | | | |
LUKOIL PJSC ADR (Energy, Oil, Gas & Consumable Fuels) | | | | | | | 636,249 | | | | 23,112,144 | |
Magnit (Consumer Staples, Food & Staples Retailing) (a) | | | | | | | 95,300 | | | | 16,550,389 | |
Mobile Telesystems ADR (Telecommunication Services, Wireless Telecommunication Services) | | | | | | | 1,417,800 | | | | 9,967,134 | |
Sberbank of Russia (Financials, Banks) (a) | | | | | | | 2,417,377 | | | | 3,412,896 | |
Sberbank of Russia ADR (Financials, Banks) | | | | | | | 2,181,195 | | | | 13,320,333 | |
Yandex NV Class A (Information Technology, Internet Software & Services) † | | | | | | | 1,395,106 | | | | 22,461,207 | |
| | | | |
| | | | | | | | | | | 88,824,103 | |
| | | | | | | | | | | | |
| | | | |
| South Africa: 4.46% | | | | | | | | | | | | |
Anglo American Platinum Limited (Materials, Metals & Mining) | | | | | | | 106,832 | | | | 1,868,562 | |
AngloGold Ashanti Limited ADR (Materials, Metals & Mining) † | | | | | | | 1,077,592 | | | | 9,094,876 | |
Clicks Group Limited (Consumer Staples, Food & Staples Retailing) | | | | | | | 860,000 | | | | 6,272,721 | |
Impala Platinum Holdings Limited (Materials, Metals & Mining) † | | | | | | | 1,290,758 | | | | 3,520,109 | |
MTN Group Limited (Telecommunication Services, Wireless Telecommunication Services) | | | | | | | 2,142,643 | | | | 24,393,156 | |
Sasol Limited (Energy, Oil, Gas & Consumable Fuels) | | | | | | | 130,000 | | | | 4,165,417 | |
Shoprite Holdings Limited (Consumer Staples, Food & Staples Retailing) | | | | | | | 3,738,100 | | | | 38,845,032 | |
Standard Bank Group Limited (Financials, Banks) | | | | | | | 2,245,190 | | | | 23,327,806 | |
Tiger Brands Limited (Consumer Staples, Food Products) | | | | | | | 1,725,333 | | | | 39,447,773 | |
| | | | |
| | | | | | | | | | | 150,935,452 | |
| | | | | | | | | | | | |
| | | | |
| South Korea: 11.49% | | | | | | | | | | | | |
Amorepacific Corporation (Consumer Staples, Personal Products) | | | | | | | 42,200 | | | | 13,929,982 | |
KT Corporation ADR (Telecommunication Services, Diversified Telecommunication Services) Ǡ | | | | | | | 4,024,813 | | | | 52,805,547 | |
KT&G Corporation (Consumer Staples, Tobacco) | | | | | | | 327,091 | | | | 32,707,665 | |
Naver Corporation (Information Technology, Internet Software & Services) | | | | | | | 60,200 | | | | 31,609,507 | |
Samsung Electronics Company Limited (Information Technology, Technology Hardware, Storage & Peripherals) | | | | | | | 148,536 | | | | 178,157,883 | |
Samsung Life Insurance Company Limited (Financials, Insurance) | | | | | | | 561,337 | | | | 53,595,439 | |
SK Hynix Incorporated (Information Technology, Semiconductors & Semiconductor Equipment) | | | | | | | 963,000 | | | | 25,772,022 | |
| | | | |
| | | | | | | | | | | 388,578,045 | |
| | | | | | | | | | | | |
| | | | |
| Taiwan: 8.68% | | | | | | | | | | | | |
104 Corporation (Industrials, Commercial Services & Supplies) (l) | | | | | | | 1,655,000 | | | | 7,546,611 | |
Far Eastern New Century Corporation (Industrials, Industrial Conglomerates) | | | | | | | 12,066,448 | | | | 10,966,888 | |
Media Tek Incorporated (Information Technology, Semiconductors & Semiconductor Equipment) | | | | | | | 2,959,881 | | | | 23,082,174 | |
President Chain Store Corporation (Consumer Staples, Food & Staples Retailing) | | | | | | | 4,365,000 | | | | 28,977,761 | |
The accompanying notes are an integral part of these financial statements.
| | | | |
| 12 | | Wells Fargo Emerging Markets Equity Fund | | Portfolio of investments—October 31, 2015 |
| | | | | | | | | | | | | | | | |
| Security name | | | | | | | | Shares | | | Value | |
| | | | | | | | | | | | | | | | |
| | | | |
| Taiwan (continued) | | | | | | | | | | | | | | | | |
Taiwan Semiconductor Manufacturing Company Limited (Information Technology, Semiconductors & Semiconductor Equipment) | | | | | | | | | | | 8,585,224 | | | $ | 36,175,264 | |
Taiwan Semiconductor Manufacturing Company Limited ADR (Information Technology, Semiconductors & Semiconductor Equipment) | | | | | | | | | | | 5,507,852 | | | | 120,952,430 | |
Uni-President Enterprises Corporation (Consumer Staples, Food Products) | | | | | | | | | | | 39,062,368 | | | | 66,045,063 | |
| | | | |
| | | | | | | | | | | | | | | 293,746,191 | |
| | | | | | | | | | | | | | | | |
| | | | |
| Thailand: 3.44% | | | | | | | | | | | | | | | | |
Bangkok Bank PCL (Financials, Banks) | | | | | | | | | | | 2,869,800 | | | | 13,472,877 | |
PTT Exploration & Production PCL (Energy, Oil, Gas & Consumable Fuels) | | | | | | | | | | | 5,978,139 | | | | 12,269,745 | |
PTT PCL (Energy, Oil, Gas & Consumable Fuels) | | | | | | | | | | | 2,945,900 | | | | 22,777,044 | |
Siam Commercial Bank PCL (Financials, Banks) | | | | | | | | | | | 8,355,100 | | | | 31,360,254 | |
Thai Beverage PCL (Consumer Staples, Beverages) | | | | | | | | | | | 76,027,000 | | | | 36,558,952 | |
| | | | |
| | | | | | | | | | | | | | | 116,438,872 | |
| | | | | | | | | | | | | | | | |
| | | | |
| Turkey: 0.83% | | | | | | | | | | | | | | | | |
Anadolu Efes Biracilik Ve Malt Sanayii AS (Consumer Staples, Beverages) | | | | | | | | | | | 2,720,453 | | | | 21,442,999 | |
Avivasa Emeklilik Ve Hayat AS (Financials, Insurance) « | | | | | | | | | | | 1,246,853 | | | | 6,778,699 | |
| | | | |
| | | | | | | | | | | | | | | 28,221,698 | |
| | | | | | | | | | | | | | | | |
| | | | |
| United Arab Emirates: 0.10% | | | | | | | | | | | | | | | | |
Emaar Malls Group (Financials, Real Estate Management & Development) † | | | | | | | | | | | 3,773,147 | | | | 3,219,466 | |
| | | | | | | | | | | | | | | | |
| | | | |
| United Kingdom: 0.78% | | | | | | | | | | | | | | | | |
Standard Chartered plc (Financials, Banks) | | | | | | | | | | | 2,376,301 | | | | 26,378,448 | |
| | | | | | | | | | | | | | | | |
| | | | |
Total Common Stocks (Cost $3,364,572,848) | | | | | | | | | | | | | | | 3,259,981,916 | |
| | | | | | | | | | | | | | | | |
| | | | |
| | | Interest rate | | | Maturity date | | | Principal | | | | |
| Convertible Debentures: 0.00% | | | | | | | | | | | | | | | | |
| | | | |
| Brazil: 0.00% | | | | | | | | | | | | | | | | |
Lupatech SA (Energy, Energy Equipment & Services) (a)(i)(s) | | | 6.50 | % | | | 4-15-2018 | | | $ | 303,000 | | | | 1,260 | |
| | | | | | | | | | | | | | | | |
| | | | |
Total Convertible Debentures (Cost $160,691) | | | | | | | | | | | | | | | 1,260 | |
| | | | | | | | | | | | | | | | |
| | | | |
| | | Dividend yield | | | | | | Shares | | | | |
| Preferred Stocks: 1.61% | | | | | | | | | | | | | | | | |
| | | | |
| Brazil: 1.61% | | | | | | | | | | | | | | | | |
Lojas Americanas SA (Consumer Discretionary, Multiline Retail) ± | | | 0.20 | | | | | | | | 11,539,628 | | | | 50,019,116 | |
Vale SA ADR (Materials, Metals & Mining) «± | | | 8.23 | | | | | | | | 1,203,500 | | | | 4,332,600 | |
| | | | |
Total Preferred Stocks (Cost $79,837,677) | | | | | | | | | | | | | | | 54,351,716 | |
| | | | | | | | | | | | | | | | |
| | | | |
| | | | | | Expiration date | | | | | | | |
| Warrants: 0.00% | | | | | | | | | | | | | | | | |
| | | | |
| Malaysia: 0.00% | | | | | | | | | | | | | | | | |
Genting Bhd (Consumer Discretionary, Hotels, Restaurants & Leisure) † | | | | | | | 12-18-2018 | | | | 620,325 | | | | 127,790 | |
| | | | | | | | | | | | | | | | |
| | | | |
Total Warrants (Cost $292,284) | | | | | | | | | | | | | | | 127,790 | |
| | | | | | | | | | | | | | | | |
The accompanying notes are an integral part of these financial statements.
| | | | | | |
| Portfolio of investments—October 31, 2015 | | Wells Fargo Emerging Markets Equity Fund | | | 13 | |
| | | | | | | | | | | | | | |
| Security name | | Yield | | | | | Shares | | | Value | |
| | | | | | | | | | | | | | |
| | | | |
Short-Term Investments: 5.24% | | | | | | | | | | | | | | |
| | | | |
| Investment Companies: 5.24% | | | | | | | | | | | | | | |
Securities Lending Cash Investments, LLC (l)(r)(u) | | | 0.14 | % | | | | | 114,754,652 | | | $ | 114,754,652 | |
Wells Fargo Cash Investment Money Market Fund, Select Class (l)(u) | | | 0.16 | | | | | | 62,554,744 | | | | 62,554,744 | |
| | | | |
Total Short-Term Investments (Cost $177,309,396) | | | | | | | | | | | | | 177,309,396 | |
| | | | | | | | | | | | | | |
| | | | | | | | |
| Total investments in securities (Cost $3,622,172,896) * | | | 103.23 | % | | | 3,491,772,078 | |
Other assets and liabilities, net | | | (3.23 | ) | | | (109,233,813 | ) |
| | | | | | | | |
| Total net assets | | | 100.00 | % | | $ | 3,382,538,265 | |
| | | | | | | | |
| « | All or a portion of this security is on loan. |
| † | Non-income-earning security |
| 144A | The security may be resold in transactions exempt from registration, normally to qualified institutional buyers, pursuant to Rule 144A under the Securities Act of 1933. |
| (a) | The security is fair valued in accordance with procedures approved by the Board of Trustees. |
| (l) | The issuer of the security is an affiliated person of the Fund as defined in the Investment Company Act of 1940. |
| (i) | Illiquid security for which the designation as illiquid is unaudited. |
| (s) | The security is currently in default with regards to scheduled interest and/or principal payments. The Fund has stopped accruing interest on the security. |
| ± | Variable rate investment. The rate shown is the rate in effect at period end. |
| (r) | The investment is a non-registered investment vehicle purchased with cash collateral received from securities on loan. |
| (u) | The rate represents the 7-day annualized yield at period end. |
| * | Cost for federal income tax purposes is $3,643,152,230 and unrealized gains (losses) consists of: |
| | | | |
Gross unrealized gains | | $ | 540,331,611 | |
Gross unrealized losses | | | (691,711,763 | ) |
| | | | |
Net unrealized losses | | $ | (151,380,152 | ) |
The accompanying notes are an integral part of these financial statements.
| | | | |
| 14 | | Wells Fargo Emerging Markets Equity Fund | | Statement of assets and liabilities—October 31, 2015 |
| | | | |
| | | | |
| |
Assets | | | | |
Investments | | | | |
In unaffiliated securities (including $112,719,923 of securities loaned), at value (cost $3,439,187,564) | | $ | 3,306,916,071 | |
In affiliated securities, at value (cost $182,985,332) | | | 184,856,007 | |
| | | | |
Total investments, at value (cost $3,622,172,896) | | | 3,491,772,078 | |
Foreign currency, at value (cost $3,940,424) | | | 3,209,435 | |
Receivable for investments sold | | | 6,284,046 | |
Receivable for Fund shares sold | | | 7,663,113 | |
Receivable for dividends | | | 1,169,110 | |
Receivable for securities lending income | | | 54,705 | |
Prepaid expenses and other assets | | | 95,757 | |
| | | | |
Total assets | | | 3,510,248,244 | |
| | | | |
| |
Liabilities | | | | |
Payable for Fund shares redeemed | | | 8,277,376 | |
Payable upon receipt of securities loaned | | | 114,754,652 | |
Due to custodian bank | | | 424,152 | |
Management fee payable | | | 3,063,171 | |
Distribution fees payable | | | 56,897 | |
Administration fees payable | | | 471,629 | |
Accrued expenses and other liabilities | | | 662,102 | |
| | | | |
Total liabilities | | | 127,709,979 | |
| | | | |
Total net assets | | $ | 3,382,538,265 | |
| | | | |
| |
NET ASSETS CONSIST OF | | | | |
Paid-in capital | | $ | 3,772,275,882 | |
Undistributed net investment income | | | 6,664,024 | |
Accumulated net realized losses on investments | | | (265,197,893 | ) |
Net unrealized losses on investments | | | (131,203,748 | ) |
| | | | |
Total net assets | | $ | 3,382,538,265 | |
| | | | |
| |
COMPUTATION OF NET ASSET VALUE AND OFFERING PRICE PER SHARE | | | | |
Net assets – Class A | | $ | 873,992,390 | |
Shares outstanding – Class A1 | | | 48,308,262 | |
Net asset value per share – Class A | | | $18.09 | |
Maximum offering price per share – Class A2 | | | $19.19 | |
Net assets – Class B | | $ | 1,453,466 | |
Shares outstanding – Class B1 | | | 94,406 | |
Net asset value per share – Class B | | | $15.40 | |
Net assets – Class C | | $ | 84,004,101 | |
Shares outstanding – Class C1 | | | 5,497,799 | |
Net asset value per share – Class C | | | $15.28 | |
Net assets – Class R6 | | $ | 95,190,117 | |
Shares outstanding – Class R61 | | | 5,009,640 | |
Net asset value per share – Class R6 | | | $19.00 | |
Net assets – Administrator Class | | $ | 181,223,578 | |
Shares outstanding – Administrator Class1 | | | 9,540,833 | |
Net asset value per share – Administrator Class | | | $18.99 | |
Net assets – Institutional Class | | $ | 2,146,674,613 | |
Shares outstanding – Institutional Class1 | | | 113,013,502 | |
Net asset value per share – Institutional Class | | | $18.99 | |
| 1 | The Fund has an unlimited number of authorized shares. |
| 2 | Maximum offering price is computed as 100/94.25 of net asset value. On investments of $50,000 or more, the offering price is reduced. |
The accompanying notes are an integral part of these financial statements.
| | | | | | |
| Statement of operations—year ended October 31, 2015 | | Wells Fargo Emerging Markets Equity Fund | | | 15 | |
| | | | |
| | | | |
| |
Investment income | | | | |
Dividends (net of foreign withholding taxes of $9,945,878) | | $ | 88,546,726 | |
Securities lending income, net | | | 1,353,581 | |
Income from affiliated securities | | | 145,195 | |
| | | | |
Total investment income | | | 90,045,502 | |
| | | | |
| |
Expenses | | | | |
Management fee | | | 46,621,047 | |
Administration fees | | | | |
Class A | | | 3,254,189 | |
Class B | | | 7,132 | |
Class C | | | 267,646 | |
Class R6 | | | 16,555 | |
Administrator Class | | | 384,730 | |
Institutional Class | | | 2,453,156 | |
Shareholder servicing fees | | | | |
Class A | | | 3,315,273 | |
Class B | | | 6,935 | |
Class C | | | 272,151 | |
Administrator Class | | | 831,033 | |
Distribution fees | | | | |
Class B | | | 21,409 | |
Class C | | | 816,453 | |
Custody and accounting fees | | | 3,145,741 | |
Professional fees | | | 65,269 | |
Registration fees | | | 296,628 | |
Shareholder report expenses | | | 687,174 | |
Trustees’ fees and expenses | | | 11,513 | |
Other fees and expenses | | | 158,386 | |
| | | | |
Total expenses | | | 62,632,420 | |
Less: Fee waivers and/or expense reimbursements | | | (716,732 | ) |
| | | | |
Net expenses | | | 61,915,688 | |
| | | | |
Net investment income | | | 28,129,814 | |
| | | | |
| |
REALIZED AND UNREALIZED GAINS (LOSSES) ON INVESTMENTS | | | | |
| |
Net realized gains (losses) on: | | | | |
Unaffiliated securities | | | (251,806,008 | ) |
Forward foreign currency contract transactions | | | 104,391 | |
| | | | |
Net realized losses on investments | | | (251,701,617 | ) |
| | | | |
| |
Net change in unrealized gains (losses) on: | | | | |
Unaffiliated securities | | | (489,847,966 | ) |
Affiliated securities | | | 908,438 | |
| | | | |
Net change in unrealized gains (losses) on investments | | | (488,939,528 | ) |
| | | | |
Net realized and unrealized gains (losses) on investments | | | (740,641,145 | ) |
| | | | |
Net decrease in net assets resulting from operations | | $ | (712,511,331 | ) |
| | | | |
The accompanying notes are an integral part of these financial statements.
| | | | |
| 16 | | Wells Fargo Emerging Markets Equity Fund | | Statement of changes in net assets |
| | | | | | | | | | | | | | | | |
| | | Year ended
October 31, 2015 | | | Year ended
October 31, 2014 | |
| | | | |
Operations | | | | | | | | | | | | | | | | |
Net investment income | | | | | | $ | 28,129,814 | | | | | | | $ | 29,047,921 | |
Net realized gains (losses) on investments | | | | | | | (251,701,617 | ) | | | | | | | 21,339,971 | |
Net change in unrealized gains (losses) on investments | | | | | | | (488,939,528 | ) | | | | | | | (75,469,857 | ) |
| | | | |
Net decrease in net assets resulting from operations | | | | | | | (712,511,331 | ) | | | | | | | (25,081,965 | ) |
| | | | |
| | | | |
Distributions to shareholders from | | | | | | | | | | | | | | | | |
Net investment income | | | | | | | | | | | | | | | | |
Class A | | | | | | | (9,924,128 | ) | | | | | | | 0 | |
Class R6 | | | | | | | (428,978 | ) | | | | | | | (45,340 | ) |
Administrator Class | | | | | | | (2,112,578 | ) | | | | | | | (1,783,180 | ) |
Institutional Class | | | | | | | (32,080,756 | ) | | | | | | | (8,965,400 | ) |
| | | | |
Total distributions to shareholders | | | | | | | (44,546,440 | ) | | | | | | | (10,793,920 | ) |
| | | | |
| | | | |
Capital share transactions | | | Shares | | | | | | | | Shares | | | | | |
Proceeds from shares sold | | | | | | | | | | | | | | | | |
Class A | | | 18,081,212 | | | | 353,509,537 | | | | 32,727,297 | | | | 667,582,307 | |
Class B | | | 251 | | | | 4,375 | | | | 783 | | | | 13,808 | |
Class C | | | 176,868 | | | | 2,961,953 | | | | 586,118 | | | | 10,456,764 | |
Class R6 | | | 3,603,754 | | | | 73,604,149 | | | | 1,873,283 | | | | 41,555,780 | |
Administrator Class | | | 4,842,916 | | | | 101,861,997 | | | | 13,152,480 | | | | 287,170,895 | |
Institutional Class | | | 43,932,979 | | | | 875,566,645 | | | | 62,516,706 | | | | 1,409,003,391 | |
| | | | |
| | | | | | | 1,407,508,656 | | | | | | | | 2,415,782,945 | |
| | | | |
Reinvestment of distributions | | | | | | | | | | | | | | | | |
Class A | | | 489,710 | | | | 9,691,371 | | | | 0 | | | | 0 | |
Class R6 | | | 20,724 | | | | 428,978 | | | | 2,064 | | | | 45,340 | |
Administrator Class | | | 97,246 | | | | 2,017,592 | | | | 75,992 | | | | 1,668,033 | |
Institutional Class | | | 1,420,577 | | | | 29,405,954 | | | | 367,774 | | | | 8,083,670 | |
| | | | |
| | | | | | | 41,543,895 | | | | | | | | 9,797,043 | |
| | | | |
Payment for shares redeemed | | | | | | | | | | | | | | | | |
Class A | | | (40,351,435 | ) | | | (778,700,113 | ) | | | (22,649,849 | ) | | | (476,947,718 | ) |
Class B | | | (200,667 | ) | | | (3,410,499 | ) | | | (298,920 | ) | | | (5,386,850 | ) |
Class C | | | (2,307,745 | ) | | | (38,097,771 | ) | | | (2,319,143 | ) | | | (41,212,489 | ) |
Class R6 | | | (211,230 | ) | | | (4,141,231 | ) | | | (489,299 | ) | | | (10,990,607 | ) |
Administrator Class | | | (16,085,608 | ) | | | (308,944,371 | ) | | | (38,648,549 | ) | | | (875,255,756 | ) |
Institutional Class | | | (61,121,682 | ) | | | (1,222,764,057 | ) | | | (29,608,625 | ) | | | (662,852,447 | ) |
| | | | |
| | | | | | | (2,356,058,042 | ) | | | | | | | (2,072,645,867 | ) |
| | | | |
Net increase (decrease) in net assets resulting from capital share transactions | | | | | | | (907,005,491 | ) | | | | | | | 352,934,121 | |
| | | | |
Total increase (decrease) in net assets | | | | | | | (1,664,063,262 | ) | | | | | | | 317,058,236 | |
| | | | |
| | | | |
Net assets | | | | | | | | | | | | | | | | |
Beginning of period | | | | | | | 5,046,601,527 | | | | | | | | 4,729,543,291 | |
| | | | |
End of period | | | | | | $ | 3,382,538,265 | | | | | | | $ | 5,046,601,527 | |
| | | | |
Undistributed net investment income | | | | | | $ | 6,664,024 | | | | | | | $ | 23,514,409 | |
| | | | |
The accompanying notes are an integral part of these financial statements.
| | | | | | |
| Financial highlights | | Wells Fargo Emerging Markets Equity Fund | | | 17 | |
(For a share outstanding throughout each period)
| | | | | | | | | | | | | | | | | | | | |
| | | Year ended October 31 | |
| CLASS A | | 2015 | | | 2014 | | | 2013 | | | 2012 | | | 2011 | |
Net asset value, beginning of period | | | $21.44 | | | | $21.77 | | | | $20.48 | | | | $20.93 | | | | $21.65 | |
Net investment income | | | 0.08 | | | | 0.07 | | | | 0.02 | | | | 0.10 | | | | 0.08 | |
Net realized and unrealized gains (losses) on investments | | | (3.29 | ) | | | (0.40 | ) | | | 1.33 | | | | (0.19 | ) | | | (0.80 | ) |
| | | | | | | | | | | | | | | | | | | | |
Total from investment operations | | | (3.21 | ) | | | (0.33 | ) | | | 1.35 | | | | (0.09 | ) | | | (0.72 | ) |
Distributions to shareholders from | | | | | | | | | | | | | | | | | | | | |
Net investment income | | | (0.14 | ) | | | 0.00 | | | | (0.06 | ) | | | (0.14 | ) | | | (0.00 | )1 |
Net realized gains | | | 0.00 | | | | 0.00 | | | | 0.00 | | | | (0.22 | ) | | | 0.00 | |
| | | | | | | | | | | | | | | | | | | | |
Total distributions to shareholders | | | (0.14 | ) | | | 0.00 | | | | (0.06 | ) | | | (0.36 | ) | | | (0.00 | )1 |
Net asset value, end of period | | | $18.09 | | | | $21.44 | | | | $21.77 | | | | $20.48 | | | | $20.93 | |
Total return2 | | | (15.02 | )% | | | (1.52 | )% | | | 6.62 | % | | | (0.31 | )% | | | (3.32 | )% |
Ratios to average net assets (annualized) | | | | | | | | | | | | | | | | | | | | |
Gross expenses | | | 1.64 | % | | | 1.64 | % | | | 1.65 | % | | | 1.67 | % | | | 1.68 | % |
Net expenses | | | 1.64 | % | | | 1.64 | % | | | 1.65 | % | | | 1.67 | % | | | 1.68 | % |
Net investment income | | | 0.37 | % | | | 0.36 | % | | | 0.15 | % | | | 0.51 | % | | | 0.44 | % |
Supplemental data | | | | | | | | | | | | | | | | | | | | |
Portfolio turnover rate | | | 8 | % | | | 7 | % | | | 13 | % | | | 7 | % | | | 5 | % |
Net assets, end of period (000s omitted) | | | $873,992 | | | | $1,502,597 | | | | $1,306,269 | | | | $920,709 | | | | $917,633 | |
| 1 | Amount is less than $0.005. |
| 2 | Total return calculations do not include any sales charges. |
The accompanying notes are an integral part of these financial statements.
| | | | |
| 18 | | Wells Fargo Emerging Markets Equity Fund | | Financial highlights |
(For a share outstanding throughout each period)
| | | | | | | | | | | | | | | | | | | | |
| | | Year ended October 31 | |
| CLASS B | | 2015 | | | 2014 | | | 2013 | | | 2012 | | | 2011 | |
Net asset value, beginning of period | | | $18.25 | | | | $18.67 | | | | $17.64 | | | | $18.06 | | | | $18.82 | |
Net investment loss | | | (0.08 | )1 | | | (0.08 | )1 | | | (0.12 | )1 | | | (0.05 | )1 | | | (0.08 | )1 |
Net realized and unrealized gains (losses) on investments | | | (2.77 | ) | | | (0.34 | ) | | | 1.15 | | | | (0.15 | ) | | | (0.68 | ) |
| | | | | | | | | | | | | | | | | | | | |
Total from investment operations | | | (2.85 | ) | | | (0.42 | ) | | | 1.03 | | | | (0.20 | ) | | | (0.76 | ) |
Distributions to shareholders from | | | | | | | | | | | | | | | | | | | | |
Net realized gains | | | 0.00 | | | | 0.00 | | | | 0.00 | | | | (0.22 | ) | | | 0.00 | |
Net asset value, end of period | | | $15.40 | | | | $18.25 | | | | $18.67 | | | | $17.64 | | | | $18.06 | |
Total return2 | | | (15.62 | )% | | | (2.25 | )% | | | 5.84 | % | | | (1.06 | )% | | | (4.04 | )% |
Ratios to average net assets (annualized) | | | | | | | | | | | | | | | | | | | | |
Gross expenses | | | 2.38 | % | | | 2.39 | % | | | 2.39 | % | | | 2.41 | % | | | 2.43 | % |
Net expenses | | | 2.38 | % | | | 2.39 | % | | | 2.39 | % | | | 2.41 | % | | | 2.43 | % |
Net investment loss | | | (0.46 | )% | | | (0.46 | )% | | | (0.64 | )% | | | (0.28 | )% | | | (0.39 | )% |
Supplemental data | | | | | | | | | | | | | | | | | | | | |
Portfolio turnover rate | | | 8 | % | | | 7 | % | | | 13 | % | | | 7 | % | | | 5 | % |
Net assets, end of period (000s omitted) | | | $1,453 | | | | $5,380 | | | | $11,071 | | | | $15,408 | | | | $21,652 | |
| 1 | Calculated based upon average shares outstanding |
| 2 | Total return calculations do not include any sales charges. |
The accompanying notes are an integral part of these financial statements.
| | | | | | |
| Financial highlights | | Wells Fargo Emerging Markets Equity Fund | | | 19 | |
(For a share outstanding throughout each period)
| | | | | | | | | | | | | | | | | | | | |
| | | Year ended October 31 | |
| CLASS C | | 2015 | | | 2014 | | | 2013 | | | 2012 | | | 2011 | |
Net asset value, beginning of period | | | $18.11 | | | | $18.53 | | | | $17.51 | | | | $17.92 | | | | $18.68 | |
Net investment loss | | | (0.06 | )1 | | | (0.08 | )1 | | | (0.11 | )1 | | | (0.06 | ) | | | (0.06 | )1 |
Net realized and unrealized gains (losses) on investments | | | (2.77 | ) | | | (0.34 | ) | | | 1.13 | | | | (0.13 | ) | | | (0.70 | ) |
| | | | | | | | | | | | | | | | | | | | |
Total from investment operations | | | (2.83 | ) | | | (0.42 | ) | | | 1.02 | | | | (0.19 | ) | | | (0.76 | ) |
Distributions to shareholders from | | | | | | | | | | | | | | | | | | | | |
Net realized gains | | | 0.00 | | | | 0.00 | | | | 0.00 | | | | (0.22 | ) | | | 0.00 | |
Net asset value, end of period | | | $15.28 | | | | $18.11 | | | | $18.53 | | | | $17.51 | | | | $17.92 | |
Total return2 | | | (15.63 | )% | | | (2.27 | )% | | | 5.83 | % | | | (1.01 | )% | | | (4.07 | )% |
Ratios to average net assets (annualized) | | | | | | | | | | | | | | | | | | | | |
Gross expenses | | | 2.39 | % | | | 2.39 | % | | | 2.39 | % | | | 2.42 | % | | | 2.43 | % |
Net expenses | | | 2.39 | % | | | 2.39 | % | | | 2.39 | % | | | 2.42 | % | | | 2.43 | % |
Net investment loss | | | (0.39 | )% | | | (0.42 | )% | | | (0.62 | )% | | | (0.24 | )% | | | (0.32 | )% |
Supplemental data | | | | | | | | | | | | | | | | | | | | |
Portfolio turnover rate | | | 8 | % | | | 7 | % | | | 13 | % | | | 7 | % | | | 5 | % |
Net assets, end of period (000s omitted) | | | $84,004 | | | | $138,169 | | | | $173,454 | | | | $183,471 | | | | $200,796 | |
| 1 | Calculated based upon average shares outstanding |
| 2 | Total return calculations do not include any sales charges. |
The accompanying notes are an integral part of these financial statements.
| | | | |
| 20 | | Wells Fargo Emerging Markets Equity Fund | | Financial highlights |
(For a share outstanding throughout each period)
| | | | | | | | | | | | |
| | | Year ended October 31 | |
| CLASS R6 | | 2015 | | | 2014 | | | 20131 | |
Net asset value, beginning of period | | | $22.53 | | | | $22.86 | | | | $20.89 | |
Net investment income | | | 0.19 | | | | 0.21 | | | | 0.01 | 2 |
Net realized and unrealized gains (losses) on investments | | | (3.46 | ) | | | (0.44 | ) | | | 1.96 | |
| | | | | | | | | | | | |
Total from investment operations | | | (3.27 | ) | | | (0.23 | ) | | | 1.97 | |
Distributions to shareholders from | | | | | | | | | | | | |
Net investment income | | | (0.26 | ) | | | (0.10 | ) | | | 0.00 | |
Net asset value, end of period | | | $19.00 | | | | $22.53 | | | | $22.86 | |
Total return3 | | | (14.61 | )% | | | (1.01 | )% | | | 9.43 | % |
Ratios to average net assets (annualized) | | | | | | | | | | | | |
Gross expenses | | | 1.19 | % | | | 1.17 | % | | | 1.17 | % |
Net expenses | | | 1.18 | % | | | 1.17 | % | | | 1.17 | % |
Net investment income | | | 0.84 | % | | | 0.88 | % | | | 0.15 | % |
Supplemental data | | | | | | | | | | | | |
Portfolio turnover rate | | | 8 | % | | | 7 | % | | | 13 | % |
Net assets, end of period (000s omitted) | | | $95,190 | | | | $35,967 | | | | $4,809 | |
| 1 | For the period from June 28, 2013 (commencement of class operations) to October 31, 2013 |
| 2 | Calculated based upon average shares outstanding |
| 3 | Returns for periods of less than one year are not annualized. |
The accompanying notes are an integral part of these financial statements.
| | | | | | |
| Financial highlights | | Wells Fargo Emerging Markets Equity Fund | | | 21 | |
(For a share outstanding throughout each period)
| | | | | | | | | | | | | | | | | | | | |
| | | Year ended October 31 | |
| ADMINISTRATOR CLASS | | 2015 | | | 2014 | | | 2013 | | | 2012 | | | 2011 | |
Net asset value, beginning of period | | | $22.44 | | | | $22.79 | | | | $21.44 | | | | $21.90 | | | | $22.63 | |
Net investment income | | | 0.12 | 1 | | | 0.13 | 1 | | | 0.05 | | | | 0.14 | | | | 0.02 | |
Net realized and unrealized gains (losses) on investments | | | (3.46 | ) | | | (0.44 | ) | | | 1.40 | | | | (0.18 | ) | | | (0.73 | ) |
| | | | | | | | | | | | | | | | | | | | |
Total from investment operations | | | (3.34 | ) | | | (0.31 | ) | | | 1.45 | | | | (0.04 | ) | | | (0.71 | ) |
Distributions to shareholders from | | | | | | | | | | | | | | | | | | | | |
Net investment income | | | (0.11 | ) | | | (0.04 | ) | | | (0.10 | ) | | | (0.20 | ) | | | (0.02 | ) |
Net realized gains | | | 0.00 | | | | 0.00 | | | | 0.00 | | | | (0.22 | ) | | | 0.00 | |
| | | | | | | | | | | | | | | | | | | | |
Total distributions to shareholders | | | (0.11 | ) | | | (0.04 | ) | | | (0.10 | ) | | | (0.42 | ) | | | (0.02 | ) |
Net asset value, end of period | | | $18.99 | | | | $22.44 | | | | $22.79 | | | | $21.44 | | | | $21.90 | |
Total return | | | (14.91 | )% | | | (1.36 | )% | | | 6.83 | % | | | (0.13 | )% | | | (3.14 | )% |
Ratios to average net assets (annualized) | | | | | | | | | | | | | | | | | | | | |
Gross expenses | | | 1.49 | % | | | 1.48 | % | | | 1.48 | % | | | 1.47 | % | | | 1.47 | % |
Net expenses | | | 1.48 | % | | | 1.48 | % | | | 1.48 | % | | | 1.47 | % | | | 1.47 | % |
Net investment income | | | 0.58 | % | | | 0.57 | % | | | 0.35 | % | | | 0.72 | % | | | 0.70 | % |
Supplemental data | | | | | | | | | | | | | | | | | | | | |
Portfolio turnover rate | | | 8 | % | | | 7 | % | | | 13 | % | | | 7 | % | | | 5 | % |
Net assets, end of period (000s omitted) | | | $181,224 | | | | $464,135 | | | | $1,050,660 | | | | $634,428 | | | | $529,083 | |
| 1 | Calculated based upon average shares outstanding |
The accompanying notes are an integral part of these financial statements.
| | | | |
| 22 | | Wells Fargo Emerging Markets Equity Fund | | Financial highlights |
(For a share outstanding throughout each period)
| | | | | | | | | | | | | | | | | | | | |
| | | Year ended October 31 | |
| INSTITUTIONAL CLASS | | 2015 | | | 2014 | | | 2013 | | | 2012 | | | 2011 | |
Net asset value, beginning of period | | | $22.52 | | | | $22.86 | | | | $21.50 | | | | $21.96 | | | | $22.66 | |
Net investment income | | | 0.17 | | | | 0.15 | | | | 0.11 | | | | 0.22 | | | | 0.16 | |
Net realized and unrealized gains (losses) on investments | | | (3.45 | ) | | | (0.40 | ) | | | 1.40 | | | | (0.22 | ) | | | (0.81 | ) |
| | | | | | | | | | | | | | | | | | | | |
Total from investment operations | | | (3.28 | ) | | | (0.25 | ) | | | 1.51 | | | | 0.00 | | | | (0.65 | ) |
Distributions to shareholders from | | | | | | | | | | | | | | | | | | | | |
Net investment income | | | (0.25 | ) | | | (0.09 | ) | | | (0.15 | ) | | | (0.24 | ) | | | (0.05 | ) |
Net realized gains | | | 0.00 | | | | 0.00 | | | | 0.00 | | | | (0.22 | ) | | | 0.00 | |
| | | | | | | | | | | | | | | | | | | | |
Total distributions to shareholders | | | (0.25 | ) | | | (0.09 | ) | | | (0.15 | ) | | | (0.46 | ) | | | (0.05 | ) |
Net asset value, end of period | | | $18.99 | | | | $22.52 | | | | $22.86 | | | | $21.50 | | | | $21.96 | |
Total return | | | (14.66 | )% | | | (1.09 | )% | | | 7.07 | % | | | 0.13 | % | | | (2.89 | )% |
Ratios to average net assets (annualized) | | | | | | | | | | | | | | | | | | | | |
Gross expenses | | | 1.24 | % | | | 1.21 | % | | | 1.22 | % | | | 1.24 | % | | | 1.24 | % |
Net expenses | | | 1.22 | % | | | 1.21 | % | | | 1.22 | % | | | 1.24 | % | | | 1.23 | % |
Net investment income | | | 0.82 | % | | | 0.77 | % | | | 0.57 | % | | | 1.04 | % | | | 0.93 | % |
Supplemental data | | | | | | | | | | | | | | | | | | | | |
Portfolio turnover rate | | | 8 | % | | | 7 | % | | | 13 | % | | | 7 | % | | | 5 | % |
Net assets, end of period (000s omitted) | | | $2,146,675 | | | | $2,900,353 | | | | $2,183,281 | | | | $1,176,567 | | | | $541,644 | |
The accompanying notes are an integral part of these financial statements.
| | | | | | |
| Notes to financial statements | | Wells Fargo Emerging Markets Equity Fund | | | 23 | |
1. ORGANIZATION
Wells Fargo Funds Trust (the “Trust”), a Delaware statutory trust organized on March 10, 1999, is an open-end management investment company registered under the Investment Company Act of 1940, as amended (the “1940 Act”). As an investment company, the Trust follows the accounting and reporting guidance in Financial Accounting Standards Board (“FASB”) Accounting Standards Codification Topic 946, Financial Services – Investment Companies. These financial statements report on the Wells Fargo Emerging Markets Equity Fund (the “Fund”) which is a diversified series of the Trust.
2. SIGNIFICANT ACCOUNTING POLICIES
The following significant accounting policies, which are consistently followed in the preparation of the financial statements of the Fund, are in conformity with U.S. generally accepted accounting principles which require management to make estimates and assumptions that affect the reported amounts of assets and liabilities, disclosure of contingent assets and liabilities at the date of the financial statements, and the reported amounts of revenues and expenses during the reporting period. Actual results could differ from those estimates.
Securities valuation
All investments are valued each business day as of the close of regular trading on the New York Stock Exchange (generally 4 p.m. Eastern Time).
Equity securities that are listed on a foreign or domestic exchange or market are valued at the official closing price or, if none, the last sales price. If no sale occurs on the primary exchange or market that day, the prior day’s price will be deemed “stale” and a fair value price will be determined in accordance with the Fund’s Valuation Procedures.
Equity securities that are not listed on a foreign or domestic exchange or market, but have a public trading market, are valued at the quoted bid price from an independent broker-dealer that the Management Valuation Team of Wells Fargo Funds Management, LLC (“Funds Management”) has determined is an acceptable source.
The values of securities denominated in foreign currencies are translated into U.S. dollars at rates provided by an independent foreign currency pricing source at a time each business day specified by the Management Valuation Team.
Many securities markets and exchanges outside the U.S. close prior to the close of the New York Stock Exchange and therefore may not fully reflect trading or events that occur after the close of the principal exchange in which the foreign securities are traded, but before the close of the New York Stock Exchange. If such trading or events are expected to materially affect the value of such securities, then fair value pricing procedures approved by the Board of Trustees of the Fund are applied. These procedures take into account multiple factors including movements in U.S. securities markets after foreign exchanges close. Foreign securities that are fair valued under these procedures are categorized as Level 2 and the application of these procedures may result in transfers between Level 1 and Level 2. Depending on market activity, such fair valuations may be frequent. Such fair value pricing may result in net asset values that are higher or lower than net asset values based on the last reported sales price or latest quoted bid price. On October 31, 2015, such fair value pricing was used in pricing foreign securities.
Debt securities are valued at the evaluated bid price provided by an independent pricing service or, if a reliable price is not available, the quoted bid price from an independent broker-dealer.
Investments in registered open-end investment companies are valued at net asset value. Interests in non-registered investment vehicles that are redeemable at net asset value are fair valued at net asset value when available.
Investments which are not valued using any of the methods discussed above are valued at their fair value, as determined in good faith by the Board of Trustees. The Board of Trustees has established a Valuation Committee comprised of the Trustees and has delegated to it the authority to take any actions regarding the valuation of portfolio securities that the Valuation Committee deems necessary or appropriate, including determining the fair value of portfolio securities, unless the determination has been delegated to the Management Valuation Team. The Board of Trustees retains the authority to make or ratify any valuation decisions or approve any changes to the Valuation Procedures as it deems appropriate. On a quarterly basis, the Board of Trustees receives reports on any valuation actions taken by the Valuation Committee or the Management Valuation Team which may include items for ratification.
Valuations of fair valued securities are compared to the next actual sales price when available, or other appropriate market values, to assess the continued appropriateness of the fair valuation methodologies used. These securities are fair valued on a day-to-day basis, taking into consideration changes to appropriate market information and any significant changes to the inputs considered in the valuation process until there is a readily available price provided on an exchange or by an independent pricing service. Valuations received from an independent pricing service or independent broker-dealer quotes
| | | | |
| 24 | | Wells Fargo Emerging Markets Equity Fund | | Notes to financial statements |
are periodically validated by comparisons to most recent trades and valuations provided by other independent pricing services in addition to the review of prices by the manager and/or subadviser. Unobservable inputs used in determining fair valuations are identified based on the type of security, taking into consideration factors utilized by market participants in valuing the investment, knowledge about the issuer and the current market environment.
Foreign currency translation
The accounting records of the Fund are maintained in U.S. dollars. The values of other assets and liabilities denominated in foreign currencies are translated into U.S. dollars at rates provided by an independent foreign currency pricing source at a time each business day specified by the Management Valuation Team. Purchases and sales of securities, and income and expenses are converted at the rate of exchange on the respective dates of such transactions. Net realized foreign exchange gains or losses arise from sales of foreign currencies, currency gains or losses realized between the trade and settlement dates on securities transactions, and the difference between the amounts of dividends, interest and foreign withholding taxes recorded and the U.S. dollar equivalent of the amounts actually paid or received. Net unrealized foreign exchange gains and losses arise from changes in the fair value of assets and liabilities other than investments in securities resulting from changes in exchange rates. The changes in net assets arising from changes in exchange rates and the changes in net assets resulting from changes in market prices of securities are not separately presented. Such changes are included in net realized and unrealized gains or losses from investments.
Forward foreign currency contracts
The Fund is subject to foreign currency exchange rate risk in the normal course of pursuing its investment objectives. A forward foreign currency contract is an agreement between two parties to purchase or sell a specific currency for an agreed-upon price at a future date. The Fund enters into forward foreign currency contracts to facilitate transactions in foreign-denominated securities and to attempt to minimize the risk to the Fund from adverse changes in the relationship between currencies. Forward foreign currency contracts are recorded at the forward rate and marked-to-market daily. When the contracts are closed, realized gains and losses arising from such transactions are recorded as realized gains or losses on forward foreign currency contract transactions. The Fund could be exposed to risks if the counterparties to the contracts are unable to meet the terms of their contracts or if the value of the foreign currency changes unfavorably. The Fund’s maximum risk of loss from counterparty credit risk is the unrealized gains on the contracts. This risk may be mitigated if there is a master netting arrangement between the Fund and the counterparty.
Security loans
The Fund may lend its securities from time to time in order to earn additional income in the form of fees or interest on securities received as collateral or the investment of any cash received as collateral. The Fund continues to receive interest or dividends on the securities loaned. The Fund receives collateral in the form of cash or securities with a value at least equal to the value of the securities on loan. The value of the loaned securities is determined at the close of each business day and any additional required collateral is delivered to the Fund on the next business day. In a securities lending transaction, the net asset value of the Fund will be affected by an increase or decrease in the value of the securities loaned and by an increase or decrease in the value of the instrument in which collateral is invested. The amount of securities lending activity undertaken by the Fund fluctuates from time to time. In the event of default or bankruptcy by the borrower, the Fund may be prevented from recovering the loaned securities or gaining access to the collateral or may experience delays or costs in doing so. In addition, the investment of any cash collateral received may lose all or part of its value. The Fund has the right under the lending agreement to recover the securities from the borrower on demand.
The Fund lends its securities through an unaffiliated securities lending agent. Cash collateral received in connection with its securities lending transactions is invested in Securities Lending Cash Investments, LLC (the “Securities Lending Fund”). The Securities Lending Fund is exempt from registration under Section 3(c)(7) of the 1940 Act and is managed by Funds Management and is subadvised by Wells Capital Management Incorporated (“WellsCap”). Funds Management receives an advisory fee starting at 0.05% and declining to 0.01% as the average daily net assets of the Securities Lending Fund increase. All of the fees received by Funds Management are paid to WellsCap for its services as subadviser. The Securities Lending Fund seeks to provide a positive return compared to the daily Fed Funds Open rate by investing in high-quality, U.S. dollar-denominated short-term money market instruments. Securities Lending Fund investments are fair valued based upon the amortized cost valuation technique. Income earned from investment in the Securities Lending Fund is included in securities lending income on the Statement of Operations.
Security transactions and income recognition
Securities transactions are recorded on a trade date basis. Realized gains or losses are recorded on the basis of identified cost.
| | | | | | |
| Notes to financial statements | | Wells Fargo Emerging Markets Equity Fund | | | 25 | |
Dividend income is recognized on the ex-dividend date, except for certain dividends from foreign securities, which are recorded as soon as the custodian verifies the ex-dividend date. Dividend income from foreign securities is recorded net of foreign taxes withheld where recovery of such taxes is not assured.
Distributions to shareholders
Distributions to shareholders from net investment income and net realized gains, if any, are recorded on the ex-dividend date. Such distributions are determined in conformity with federal income tax regulations, which may differ in amount or character from net investment income and realized gains recognized for purposes of U.S. generally accepted accounting principles.
Federal and other taxes
The Fund intends to continue to qualify as a regulated investment company by distributing substantially all of its investment company taxable income and any net realized capital gains (after reduction for capital loss carryforwards) sufficient to relieve it from all, or substantially all, federal income taxes. Accordingly, no provision for federal income taxes was required.
The Fund’s income and federal excise tax returns and all financial records supporting those returns for the prior three fiscal years are subject to examination by the federal and Delaware revenue authorities. Management has analyzed the Fund’s tax positions taken on federal, state, and foreign tax returns for all open tax years and does not believe that there are any uncertain tax positions that require recognition of a tax liability.
Reclassifications are made to the Fund’s capital accounts for permanent tax differences to reflect income and gains available for distribution (or available capital loss carryforwards) under federal income tax regulations. U.S. generally accepted accounting principles require that certain components of net assets be adjusted to reflect permanent differences between financial and tax reporting. These reclassifications have no effect on net assets or net asset values per share. The primary permanent differences causing such reclassifications are due to foreign currency transactions and passive foreign investment companies. At October 31, 2015, as a result of permanent book-to-tax differences, the following reclassification adjustments were made on the Statement of Assets and Liabilities:
| | |
Undistributed net
investment income | | Accumulated net
realized losses
on investments |
| $(433,759) | | $433,759 |
Capital loss carryforwards that do not expire are required to be utilized prior to capital loss carryforwards that expire. As of October 31, 2015, capital loss carryforwards available to offset future net realized capital gains were as follows through the indicated expiration dates:
| | | | |
| | | No expiration |
| 2017 | | Short-term | | Long-term |
| $10,889,490 | | $27,469,490 | | $223,167,755 |
Class allocations
The separate classes of shares offered by the Fund differ principally in applicable sales charges, distribution, shareholder servicing, and administration fees. Class specific expenses are charged directly to that share class. Investment income, common expenses, and realized and unrealized gains (losses) on investments are allocated daily to each class of shares based on the relative proportion of net assets of each class.
3. FAIR VALUATION MEASUREMENTS
Fair value measurements of investments are determined within a framework that has established a fair value hierarchy based upon the various data inputs utilized in determining the value of the Fund’s investments. The three-level hierarchy gives the highest priority to unadjusted quoted prices in active markets for identical assets or liabilities (Level 1) and the lowest priority to significant unobservable inputs (Level 3). The Fund’s investments are classified within the fair value hierarchy based on the lowest level of input that is significant to the fair value measurement. The inputs are summarized into three broad levels as follows:
| | | | |
| 26 | | Wells Fargo Emerging Markets Equity Fund | | Notes to financial statements |
| n | | Level 1 – quoted prices in active markets for identical securities |
| n | | Level 2 – other significant observable inputs (including quoted prices for similar securities, interest rates, prepayment speeds, credit risk, use of amortized cost, etc.) |
| n | | Level 3 – significant unobservable inputs (including the Fund’s own assumptions in determining the fair value of investments) |
The inputs or methodologies used for valuing investments in securities are not necessarily an indication of the risk associated with investing in those securities.
The following is a summary of the inputs used in valuing the Fund’s assets and liabilities as of October 31, 2015:
| | | | | | | | | | | | | | | | |
| | | Quoted prices
(Level 1) | | | Other significant
observable inputs
(Level 2) | | | Significant
unobservable inputs
(Level 3) | | | Total | |
Assets | | | | | | | | | | | | | | | | |
Investments in: | | | | | | | | | | | | | | | | |
| | | | |
Common stocks | | | | | | | | | | | | | | | | |
Argentina | | $ | 17,244,261 | | | $ | 0 | | | $ | 0 | | | $ | 17,244,261 | |
Brazil | | | 87,545,486 | | | | 116,350,133 | | | | 0 | | | | 203,895,619 | |
Chile | | | 65,606,980 | | | | 0 | | | | 0 | | | | 65,606,980 | |
China | | | 334,446,536 | | | | 440,017,382 | | | | 0 | | | | 774,463,918 | |
Colombia | | | 18,777,888 | | | | 0 | | | | 0 | | | | 18,777,888 | |
Hong Kong | | | 0 | | | | 220,124,728 | | | | 0 | | | | 220,124,728 | |
India | | | 149,739,944 | | | | 192,747,014 | | | | 0 | | | | 342,486,958 | |
Indonesia | | | 26,515,030 | | | | 47,458,403 | | | | 0 | | | | 73,973,433 | |
Malaysia | | | 0 | | | | 37,793,352 | | | | 0 | | | | 37,793,352 | |
Mexico | | | 371,842,055 | | | | 0 | | | | 0 | | | | 371,842,055 | |
Peru | | | 9,766,276 | | | | 0 | | | | 0 | | | | 9,766,276 | |
Philippines | | | 0 | | | | 27,664,173 | | | | 0 | | | | 27,664,173 | |
Russia | | | 32,428,341 | | | | 56,395,762 | | | | 0 | | | | 88,824,103 | |
South Africa | | | 9,094,876 | | | | 141,840,576 | | | | 0 | | | | 150,935,452 | |
South Korea | | | 85,513,212 | | | | 303,064,833 | | | | 0 | | | | 388,578,045 | |
Taiwan | | | 120,952,430 | | | | 172,793,761 | | | | 0 | | | | 293,746,191 | |
Thailand | | | 66,407,043 | | | | 50,031,829 | | | | 0 | | | | 116,438,872 | |
Turkey | | | 6,778,699 | | | | 21,442,999 | | | | 0 | | | | 28,221,698 | |
United Arab Emirates | | | 0 | | | | 3,219,466 | | | | 0 | | | | 3,219,466 | |
United Kingdom | | | 0 | | | | 26,378,448 | | | | 0 | | | | 26,378,448 | |
| | | | |
Convertible debentures | | | 0 | | | | 0 | | | | 1,260 | | | | 1,260 | |
| | | | |
Preferred stocks | | | | | | | | | | | | | | | | |
Brazil | | | 4,332,600 | | | | 50,019,116 | | | | 0 | | | | 54,351,716 | |
| | | | |
Warrants | | | | | | | | | | | | | | | | |
Malaysia | | | 0 | | | | 127,790 | | | | 0 | | | | 127,790 | |
| | | | |
Short-term investments | | | | | | | | | | | | | | | | |
Investment companies | | | 62,554,744 | | | | 114,754,652 | | | | 0 | | | | 177,309,396 | |
Total assets | | $ | 1,469,546,401 | | | $ | 2,022,224,417 | | | $ | 1,260 | | | $ | 3,491,772,078 | |
The Fund recognizes transfers between levels within the fair value hierarchy at the end of the reporting period. At October 31, 2015, fair value pricing was used in pricing certain foreign securities and securities valued at $1,748,725,195 were transferred from Level 1 to Level 2. The Fund did not have any transfers into/out of Level 3.
4. TRANSACTIONS WITH AFFILIATES
Management fee
Funds Management, an indirect wholly owned subsidiary of Wells Fargo & Company (“Wells Fargo”), is the manager of the Fund and provides advisory and fund-level administrative services under an investment management agreement. Under the investment management agreement, Funds Management is responsible for, among other services,
| | | | | | |
| Notes to financial statements | | Wells Fargo Emerging Markets Equity Fund | | | 27 | |
implementing the investment objectives and strategies of the Fund, supervising the applicable subadviser, providing fund-level administrative services in connection with the Fund’s operations, and providing any other fund-level administrative services reasonably necessary for the operation of the Fund. As compensation for its services under the investment management agreement, Funds Management is entitled to receive an annual management fee starting at 1.15% and declining to 0.955% as the average daily net assets of the Fund increase.
Prior to July 1, 2015, Funds Management provided advisory services pursuant to an investment advisory agreement and was entitled to receive an annual fee which started at 1.10% and declined to 0.925% as the average daily net assets of the Fund increased. From November 1, 2014 through February 28, 2015, Funds Management received an annual advisory fee which started at 1.10% and declined to 0.95% as the average daily net assets of the Fund increased. In addition prior to July 1, 2015, fund-level administrative services were provided by Funds Management under a separate administration agreement at an annual fee which started at 0.05% and declined to 0.03% as the average daily net assets of the Fund increased. For financial statement purposes, the advisory fee and fund-level administration fee for the year ended October 31, 2015 have been included in management fee on the Statement of Operations.
For the year ended October 31 2015, the management fee was equivalent to an annual rate of 1.05% of the Fund’s average daily net assets.
Funds Management has retained the services of a subadviser to provide daily portfolio management to the Fund. The fee for subadvisory services is borne by Funds Management. WellsCap, an affiliate of Funds Management and an indirect wholly owned subsidiary of Wells Fargo, is the subadviser to the Fund and is entitled to receive a fee from Funds Management at an annual rate starting at 0.65% and declining to 0.45% as the average daily net assets of the Fund increase.
Administration fees
Under a class-level administration agreement, Funds Management provides class-level administrative services to the Fund, which includes paying fees and expenses for services provided by the transfer agent, sub-transfer agents, omnibus account servicers and record-keepers. As compensation for its services under the class-level administration agreement, Funds Management receives an annual fee which is calculated based on the average daily net assets of each class as follows:
| | | | | | | | |
| | | Class-level administration fee | |
| | | Current rate | | | Rate prior to July 1, 2015 | |
Class A, Class B, Class C | | | 0.21 | % | | | 0.26 | % |
Class R6 | | | 0.03 | | | | 0.03 | |
Administrator Class | | | 0.13 | | | | 0.10 | |
Institutional Class | | | 0.13 | | | | 0.08 | |
Funds Management has contractually waived and/or reimbursed management and administration fees to the extent necessary to maintain certain net operating expense ratios for the Fund. Waiver of fees and/or reimbursement of expenses by Funds Management were made first from fund level expenses on a proportionate basis and then from class specific expenses. Funds Management has committed through February 28, 2017 to waive fees and/or reimburse expenses to the extent necessary to cap the Fund’s expenses at 1.61% for Class A shares, 2.36% for Class B shares, 2.36% for Class C shares, 1.18% for Class R6 shares, 1.49% for Administrator Class shares and 1.22% for Institutional Class shares. After this time, the cap may be increased or the commitment to maintain the cap may be terminated only with the approval of the Board of Trustees. Prior to July 1, 2015, the Fund’s expenses were capped at 1.67% for Class A shares, 2.42% for Class B shares, 2.42% for Class C shares, 1.50% for Administrator Class shares and 1.23% for Institutional Class shares.
Distribution fees
The Trust has adopted a distribution plan for Class B and Class C shares of the Fund pursuant to Rule 12b-1 under the 1940 Act. Distribution fees are charged to Class B and Class C shares and paid to Wells Fargo Funds Distributor, LLC (“Funds Distributor”), the principal underwriter, at an annual rate of 0.75% of the average daily net assets of Class B and Class C shares.
In addition, Funds Distributor is entitled to receive the front-end sales charge from the purchase of Class A shares and a contingent deferred sales charge on the redemption of certain Class A shares. Funds Distributor is also entitled to receive the contingent deferred sales charges from redemptions of Class B and Class C shares. For the year ended October 31, 2015, Funds Distributor received $6,041 from the sale of Class A shares and $178 in contingent deferred sales charges from redemptions of Class C shares.
| | | | |
| 28 | | Wells Fargo Emerging Markets Equity Fund | | Notes to financial statements |
Shareholder servicing fees
The Trust has entered into contracts with one or more shareholder servicing agents, whereby Class A, Class B, Class C, and Administrator Class of the Fund is charged a fee at an annual rate of 0.25% of the average daily net assets of each respective class.
A portion of these total shareholder servicing fees were paid to affiliates of Wells Fargo.
5. INVESTMENT PORTFOLIO TRANSACTIONS
Purchases and sales of investments, excluding U.S. government obligations (if any) and short-term securities, for the year ended October 31, 2015 were $344,475,898 and $1,143,249,546, respectively.
6. INVESTMENTS IN AFFILIATES
An affiliated investment is a company which is under common ownership or control of the Fund or which the Fund has ownership of at least 5% of the outstanding voting shares. The following is a summary of transactions for the long-term holdings of issuers that were either affiliates of the Fund at the beginning of the period or the end of the period.
| | | | | | | | | | | | | | | | | | | | | | | | | | | | |
| | | Shares,
beginning
of period | | | Shares
purchased | | | Shares
sold | | | Shares, end of period | | | Value, end of period | | | Income from
affiliated securities | | | Realized gains (losses) | |
104 Corporation | | | 1,655,000 | | | | 0 | | | | 0 | | | | 1,655,000 | | | $ | 7,546,611 | | | $ | 0 | | | $ | 0 | |
7. DERIVATIVE TRANSACTIONS
During the year ended October 31, 2015, the Fund entered into forward foreign currency contracts for economic hedging purposes.
As of October 31, 2015, the Fund did not have any open forward foreign currency contracts. The Fund had average contract amounts of $111,529 and $406,742 in forward foreign currency contracts to buy and forward foreign currency contracts to sell, respectively, during the year ended October 31, 2015.
The fair value, realized gains or losses and change in unrealized gains or losses, if any, on derivative instruments are reflected in the appropriate financial statements.
8. BANK BORROWINGS
The Trust (excluding the money market funds) and Wells Fargo Variable Trust are parties to a $200,000,000 revolving credit agreement whereby the Fund is permitted to use bank borrowings for temporary or emergency purposes, such as to fund shareholder redemption requests. Interest under the credit agreement is charged to the Fund based on a borrowing rate equal to the higher of the Federal Funds rate in effect on that day plus 1.25% or the overnight LIBOR rate in effect on that day plus 1.25%. In addition, an annual commitment fee equal to 0.20% of the unused balance is allocated to each participating fund. Prior to September 1, 2015, the revolving credit agreement amount was $150,000,000 and the annual commitment fee was equal to 0.10% of the unused balance which was allocated to each participating fund. For the year ended October 31, 2015, the Fund paid $9,513 in commitment fees.
For the year ended October 31, 2015, there were no borrowings by the Fund under the agreement.
9. DISTRIBUTIONS TO SHAREHOLDERS
The tax character of distributions paid was $44,546,440 and $10,793,920 of ordinary income for the years ended October 31, 2015 and October 31, 2014, respectively.
As of October 31, 2015, the components of distributable earnings on a tax basis were as follows:
| | | | |
Undistributed ordinary income | | Unrealized losses | | Capital loss carryforward |
| $23,967,259 | | $(152,168,360) | | $(261,526,735) |
10. INDEMNIFICATION
Under the Trust’s organizational documents, the officers and Trustees have been granted certain indemnification rights against certain liabilities that may arise out of performance of their duties to the Trust. Additionally, in the normal course of business, the Trust may enter into contracts with service providers that contain a variety of indemnification clauses. The Trust’s maximum exposure under these arrangements is dependent on future claims that may be made against the Fund and, therefore, cannot be estimated.
| | | | | | |
| Report of independent registered public accounting firm | | Wells Fargo Emerging Markets Equity Fund | | | 29 | |
BOARD OF TRUSTEES AND SHAREHOLDERS OF WELLS FARGO FUNDS TRUST:
We have audited the accompanying statement of assets and liabilities, including the portfolio of investments, of the Wells Fargo Emerging Markets Equity Fund (the “Fund”), one of the funds constituting the Wells Fargo Funds Trust, as of October 31, 2015, and the related statement of operations for the year then ended, the statements of changes in net assets for each of the years in the two-year period then ended, and the financial highlights for each of the years or periods in the five-year period then ended. These financial statements and financial highlights are the responsibility of the Fund’s management. Our responsibility is to express an opinion on these financial statements and financial highlights based on our audits.
We conducted our audits in accordance with the standards of the Public Company Accounting Oversight Board (United States). Those standards require that we plan and perform the audit to obtain reasonable assurance about whether the financial statements and financial highlights are free of material misstatement. An audit includes examining, on a test basis, evidence supporting the amounts and disclosures in the financial statements. Our procedures included confirmation of securities owned as of October 31, 2015, by correspondence with the custodian and brokers, or by other appropriate auditing procedures. An audit also includes assessing the accounting principles used and significant estimates made by management, as well as evaluating the overall financial statement presentation. We believe that our audits provide a reasonable basis for our opinion.
In our opinion, the financial statements and financial highlights referred to above present fairly, in all material respects, the financial position of the Wells Fargo Emerging Markets Equity Fund as of October 31, 2015, the results of its operations for the year then ended, the changes in its net assets for each of the years in the two-year period then ended, and the financial highlights for each of the years or periods in the five-year period then ended, in conformity with U.S. generally accepted accounting principles.

Boston, Massachusetts
December 22, 2015
| | | | |
| 30 | | Wells Fargo Emerging Markets Equity Fund | | Other information (unaudited) |
TAX INFORMATION
Pursuant to Section 854 of the Internal Revenue Code, $44,546,440 of income dividends paid during the fiscal year ended October 31, 2015 has been designated as qualified dividend income (QDI).
Pursuant to Section 853 of the Internal Revenue Code, the Fund expects to designate amounts as foreign taxes paid for the fiscal year ended October 31 2015. Additional details will be available in the semiannual report.
PROXY VOTING INFORMATION
A description of the policies and procedures that the Fund uses to determine how to vote proxies relating to portfolio securities is available, upon request, by calling 1-800-222-8222, visiting our website at wellsfargofunds.com, or visiting the SEC website at sec.gov. Information regarding how the Fund voted proxies relating to portfolio securities during the most recent 12-month period ended June 30 is available on the Fund’s website at wellsfargofunds.com or by visiting the SEC website at sec.gov.
PORTFOLIO HOLDINGS INFORMATION
The complete portfolio holdings for the Fund are publicly available monthly on the Fund’s website (wellsfargofunds.com), on a one-month delayed basis. In addition, top ten holdings information (excluding derivative positions) for the Fund is publicly available on the Fund’s website on a monthly, seven-day or more delayed basis. The Fund files its complete schedule of portfolio holdings with the SEC for the first and third quarters of each fiscal year on Form N-Q, which is available by visiting the SEC website at sec.gov. In addition, the Fund’s Form N-Q may be reviewed and copied at the SEC’s Public Reference Room in Washington, DC, and at regional offices in New York City, at 233 Broadway, and in Chicago, at 175 West Jackson Boulevard, Suite 900. Information about the Public Reference Room may be obtained by calling 1-800-SEC-0330.
| | | | | | |
| Other information (unaudited) | | Wells Fargo Emerging Markets Equity Fund | | | 31 | |
BOARD OF TRUSTEES AND OFFICERS
Each of the Trustees and Officers1 listed in the table below acts in identical capacities for each fund in the Wells Fargo family of funds, which consists of 144 mutual funds comprising the Wells Fargo Funds Trust, Wells Fargo Variable Trust, Wells Fargo Master Trust and four closed-end funds (collectively the “Fund Complex”). This table should be read in conjunction with the Prospectus and the Statement of Additional Information2. The mailing address of each Trustee and Officer is 525 Market Street, 12th Floor, San Francisco, CA 94105. Each Trustee and Officer serves an indefinite term, however, each Trustee serves such term until reaching the mandatory retirement age established by the Trustees.
Independent Trustees
| | | | | | |
Name and
year of birth | | Position held and
length of service* | | Principal occupations during past five years or longer | | Other
public company or
investment company
directorships during
past 5 years |
William R. Ebsworth
(Born 1957) | | Trustee, since 2015** | | Retired. From 1984 to 2013, equities analyst, portfolio manager, research director at Fidelity Management and Research Company in Boston, Tokyo, and Hong Kong, and retired in 2013 as Chief Investment Officer of Fidelity Strategic Advisers, Inc. where he led a team of investment professionals managing client assets. Prior thereto, Board member of Hong Kong Securities Clearing Co., Hong Kong Options Clearing Corp., the Thailand International Fund, Ltd., Fidelity Investments Life Insurance Company, and Empire Fidelity Investments Life Insurance Company. Mr. Ebsworth is a CFA® charterholder and an Adjunct Lecturer, Finance, at Babson College. | | Asset Allocation Trust |
Jane A. Freeman
(Born 1953) | | Trustee, since 2015** | | Retired. From 2012 to 2014 and 1999 to 2008, Chief Financial Officer of Scientific Learning Corporation. From 2008 to 2012, Ms. Freeman provided consulting services related to strategic business projects. Prior to 1999, Portfolio Manager at Rockefeller & Co. and Scudder, Stevens & Clark. Board member of the Harding Loevner Funds from 1996 to 2014, serving as both Lead Independent Director and chair of the Audit Committee. Board member of the Russell Exchange Traded Funds Trust from 2011 to 2012 and the chair of the Audit Committee. Ms. Freeman is Chair of Taproot Foundation (non-profit organization), a Board Member of Ruth Bancroft Garden (non-profit organization) and an inactive chartered financial analyst. | | Asset Allocation Trust; Harding Loevner Funds; Russell Exchange Traded Funds Trust |
Peter G. Gordon
(Born 1942) | | Trustee, since 1998; Chairman, since 2005 | | Co-Founder, Retired Chairman, President and CEO of Crystal Geyser Water Company. Trustee Emeritus, Colby College. | | Asset Allocation Trust |
Isaiah Harris, Jr.
(Born 1952) | | Trustee, since 2009 | | Retired. Chairman of the Board of CIGNA Corporation since 2009, and Director since 2005. From 2003 to 2011, Director of Deluxe Corporation. Prior thereto, President and CEO of BellSouth Advertising and Publishing Corp. from 2005 to 2007, President and CEO of BellSouth Enterprises from 2004 to 2005 and President of BellSouth Consumer Services from 2000 to 2003. Emeritus member of the Iowa State University Foundation Board of Governors. Emeritus Member of the Advisory Board of Iowa State University School of Business. Advisory Board Member, Palm Harbor Academy (charter school). Mr. Harris is a certified public accountant. | | CIGNA Corporation; Asset Allocation Trust |
Judith M. Johnson
(Born 1949) | | Trustee, since 2008; Audit Committee Chairman, since 2008 | | Retired. Prior thereto, Chief Executive Officer and Chief Investment Officer of Minneapolis Employees Retirement Fund from 1996 to 2008. Ms. Johnson is an attorney, certified public accountant and a certified managerial accountant. | | Asset Allocation Trust |
David F. Larcker
(Born 1950) | | Trustee, since 2009 | | James Irvin Miller Professor of Accounting at the Graduate School of Business, Stanford University, Morgan Stanley Director of the Center for Leadership Development and Research and Senior Faculty of The Rock Center for Corporate Governance since 2006. From 2005 to 2008, Professor of Accounting at the Graduate School of Business, Stanford University. Prior thereto, Ernst & Young Professor of Accounting at The Wharton School, University of Pennsylvania from 1985 to 2005. | | Asset Allocation Trust |
| | | | |
| 32 | | Wells Fargo Emerging Markets Equity Fund | | Other information (unaudited) |
| | | | | | |
Name and
year of birth | | Position held and
length of service* | | Principal occupations during past five years or longer | | Other
public company or
investment company
directorships during
past 5 years |
Olivia S. Mitchell
(Born 1953) | | Trustee, since 2006 | | International Foundation of Employee Benefit Plans Professor, Wharton School of the University of Pennsylvania since 1993. Director of Wharton’s Pension Research Council and Boettner Center on Pensions & Retirement Research, and Research Associate at the National Bureau of Economic Research. Previously, Cornell University Professor from 1978 to 1993. | | Asset Allocation Trust |
Timothy J. Penny
(Born 1951) | | Trustee, since 1996 | | President and Chief Executive Officer of Southern Minnesota Initiative Foundation, a non-profit organization, since 2007 and Senior Fellow at the Humphrey Institute Policy Forum at the University of Minnesota since 1995. Member of the Board of Trustees of NorthStar Education Finance, Inc., a non-profit organization, since 2007. | | Asset Allocation Trust |
Michael S. Scofield
(Born 1943) | | Trustee, since 2010 | | Served on the Investment Company Institute’s Board of Governors and Executive Committee from 2008-2011 as well the Governing Council of the Independent Directors Council from 2006-2011 and the Independent Directors Council Executive Committee from 2008-2011. Chairman of the IDC from 2008-2010. Institutional Investor (Fund Directions) Trustee of Year in 2007. Trustee of the Evergreen Funds complex (and its predecessors) from 1984 to 2010. Chairman of the Evergreen Funds from 2000-2010. Former Trustee of the Mentor Funds. Retired Attorney, Law Offices of Michael S. Scofield. | | Asset Allocation Trust |
Donald C. Willeke
(Born 1940) | | Trustee, since 1996*** | | Principal of the law firm of Willeke & Daniels. General Counsel of the Minneapolis Employees Retirement Fund from 1984 until its consolidation into the Minnesota Public Employees Retirement Association on June 30, 2010. Director and Vice Chair of The Tree Trust (non-profit corporation). Director of the American Chestnut Foundation (non-profit corporation). | | Asset Allocation Trust |
| * | Length of service dates reflect the Trustee’s commencement of service with the Trust’s predecessor entities, where applicable. |
| ** | William R. Ebsworth and Jane A. Freeman each became a Trustee effective January 1, 2015. |
| *** | Donald Willeke will retire as a Trustee effective December 31, 2015. |
Officers
| | | | | | |
Name and
year of birth | | Position held and
length of service | | Principal occupations during past five years or longer | | |
Karla M. Rabusch
(Born 1959) | | President, since 2003 | | Executive Vice President of Wells Fargo Bank, N.A. and President of Wells Fargo Funds Management, LLC since 2003. | | |
Jeremy DePalma1
(Born 1974) | | Treasurer, since 2012 | | Senior Vice President of Wells Fargo Funds Management, LLC since 2009. Senior Vice President of Evergreen Investment Management Company, LLC from 2008 to 2010 and head of the Fund Reporting and Control Team within Fund Administration from 2005 to 2010. | | |
C. David Messman
(Born 1960) | | Secretary, since 2000; Chief Legal Officer, since 2003 | | Senior Vice President and Secretary of Wells Fargo Funds Management, LLC since 2001. Assistant General Counsel of Wells Fargo Bank, N.A. since 2013 and Vice President and Managing Counsel of Wells Fargo Bank N.A. from 1996 to 2013. | | |
Debra Ann Early
(Born 1964) | | Chief Compliance Officer, since 2007 | | Executive Vice President of Wells Fargo Funds Management, LLC since 2014, Senior Vice President and Chief Compliance Officer from 2007 to 2014. | | |
David Berardi
(Born 1975) | | Assistant Treasurer, since 2009 | | Vice President of Wells Fargo Funds Management, LLC since 2009. Vice President of Evergreen Investment Management Company, LLC from 2008 to 2010. Manager of Fund Reporting and Control for Evergreen Investment Management Company, LLC from 2004 to 2010. | | |
| 1 | Jeremy DePalma acts as Treasurer of 72 funds and Assistant Treasurer of 72 funds in the Fund Complex. |
| 2 | The Statement of Additional Information includes additional information about the Trustees and is available, without charge, upon request, by calling
1-800-222-8222 or by visiting the website at wellsfargofunds.com. |
| | | | | | |
| Other information (unaudited) | | Wells Fargo Emerging Markets Equity Fund | | | 33 | |
BOARD CONSIDERATION OF INVESTMENT ADVISORY, INVESTMENT MANAGEMENT AND SUB-ADVISORY AGREEMENTS:
Under the Investment Company Act of 1940 (the “1940 Act”), the Board of Trustees (the “Board”) of Wells Fargo Funds Trust (the “Trust”) must determine annually whether to approve the continuation of the Trust’s investment advisory and sub-advisory agreements. In this regard, at an in-person meeting held on May 19-20, 2015 (the “Meeting”), the Board, all the members of which have no direct or indirect interest in the investment advisory and sub-advisory agreements and are not “interested persons” of the Trust, as defined in the 1940 Act (the “Independent Trustees”), reviewed and approved for Wells Fargo Advantage Emerging Markets Equity Fund (the “Fund”): (i) an investment advisory agreement (the “Advisory Agreement”) with Wells Fargo Funds Management, LLC (“Funds Management”); (ii) an investment management agreement (the “Management Agreement”) with Funds Management; and (iii) an investment sub-advisory agreement (the “Sub-Advisory Agreement”) with Wells Capital Management Incorporated (the “Sub-Adviser”), an affiliate of Funds Management. The Management Agreement combines the terms of the Advisory Agreement with the terms of the Fund’s Amended and Restated Administration Agreement (the “Administration Agreement”) applicable to Fund-level administrative services. The Advisory Agreement, the Management Agreement and the Sub-Advisory Agreement are collectively referred to as the “Advisory Agreements.”
At the Meeting, the Board considered the factors and reached the conclusions described below relating to the selection of Funds Management and the Sub-Adviser and the approval of the Advisory Agreements. Prior to the Meeting, including at an in-person meeting in March 2015, the Trustees conferred extensively among themselves and with representatives of Funds Management about these matters. Also, the Board has adopted a team-based approach, with each team consisting of a sub-set of Trustees, to assist the full Board in the discharge of its duties in reviewing performance and other matters throughout the year. The Independent Trustees were assisted in their evaluation of the Advisory Agreements by independent legal counsel, from whom they received separate legal advice and with whom they met separately.
In providing information to the Board, Funds Management and the Sub-Adviser were guided by a detailed set of requests for information submitted to them by independent legal counsel on behalf of the Independent Trustees at the start of the Board’s annual contract renewal process earlier in 2015. In considering and approving the Advisory Agreements, the Trustees considered the information they believed relevant, including but not limited to the information discussed below. The Board considered not only the specific information presented in connection with the Meeting, but also the knowledge gained over time through interaction with Funds Management and the Sub-Adviser about various topics. In this regard, the Board reviewed reports of Funds Management at each of its quarterly meetings, which included, among other things, portfolio reviews and performance reports. In addition, the Board and the teams mentioned above confer with portfolio managers at various times throughout the year. The Board did not identify any particular information or consideration that was all-important or controlling, and each individual Trustee may have attributed different weights to various factors.
After its deliberations, the Board unanimously approved the continuation of the Advisory Agreement for the period from June 1, 2015 through June 30, 2015, approved the Management Agreement for the period from July 1, 2015 through May 31, 2016, and approved the continuation of the Sub-Advisory Agreement for a one-year term through May 31, 2016. The Board also determined that the compensation payable to Funds Management and the Sub-Adviser under each of the Advisory Agreements was reasonable. The Board considered the approval of the Advisory Agreements for the Fund as part of its consideration of agreements for funds across the complex, but its approvals were made on a fund-by-fund basis. The following summarizes a number of important, but not necessarily all, factors considered by the Board in support of its approvals.
Nature, extent and quality of services
The Board received and considered various information regarding the nature, extent and quality of services provided to the Fund by Funds Management and the Sub-Adviser under the Advisory Agreements. This information included, among other things, a summary of the background and experience of senior management of Funds Management, and the qualifications, background, tenure and responsibilities of each of the portfolio managers primarily responsible for the day-to-day portfolio management of the Fund. The Board noted that the services to be provided to the Fund pursuant to the Management Agreement combined the advisory services previously provided to the Fund pursuant to the Fund’s Advisory Agreement with the Fund-level administrative services previously provided to the Fund pursuant to the Fund’s Administration Agreement. The Board received a representation from Funds Management that combining these services would not result in any change to the nature or level of services provided by Funds Management to the Fund.
| | | | |
| 34 | | Wells Fargo Emerging Markets Equity Fund | | Other information (unaudited) |
The Board evaluated the ability of Funds Management and the Sub-Adviser to attract and retain qualified investment professionals, including research, advisory and supervisory personnel. The Board further considered the compliance programs and compliance records of Funds Management and the Sub-Adviser. In addition, the Board took into account the full range of services provided to the Fund by Funds Management and its affiliates.
Fund performance and expenses
The Board considered the performance results for the Fund over various time periods ended March 31, 2015. The Board considered these results in comparison to the performance of funds in a universe that was determined by Lipper Inc. (“Lipper”) to be similar to the Fund (the “Universe”), and in comparison to the Fund’s benchmark index and to other comparative data. Lipper is an independent provider of investment company data. The Board received a description of the methodology used by Lipper to select the mutual funds in the performance Universe. The Board noted that the performance of the Fund (Administrator Class) was lower than the average performance of the Universe for all periods under review except the five- and ten-year periods. The Board also noted that the performance of the Fund was lower than its benchmark, the MSCI Emerging Markets Index (Net), for all periods under review except the five- and ten-year periods.
The Board received information concerning, and discussed factors contributing to, the underperformance of the Fund relative to the Universe and benchmark for the periods noted above. The Board took note of the explanations for the relative underperformance in these periods, including with respect to investment decisions and sector allocations that affected the Fund’s performance and of longer term outperformance.
The Board also received and considered information regarding the Fund’s net operating expense ratios and their various components, including actual management fees (which reflect fee waivers, if any, and include advisory, administration and transfer agent fees), custodian and other non-management fees, and Rule 12b-1 and non-Rule 12b-1 service fees. The Board considered these ratios in comparison to the median ratios of funds in class-specific expense groups that were determined by Lipper to be similar to the Fund (the “Groups”). The Board received a description of the methodology used by Lipper to select the mutual funds in the expense Groups and an explanation of how funds comprising expense groups and their expense ratios may vary from year-to-year. Based on the Lipper reports, the Board noted that the net operating expense ratios of the Fund were lower than or equal to the median net operating expense ratios of the expense Groups. The Board discussed and accepted Funds Management’s proposal to decrease net operating expense ratio caps for the Administrator Class, Institutional Class, Class A, Class B and Class C.
The Board took into account the Fund performance and expense information provided to it among the factors considered in deciding to re-approve the Advisory Agreement and Sub-Advisory Agreement and approve the Management Agreement.
Investment advisory and sub-advisory fee rates
The Board reviewed and considered the contractual investment advisory fee rates that are payable by the Fund to Funds Management for investment advisory services (the “Advisory Agreement Rates”), both on a stand-alone basis and on a combined basis with the Fund’s fund-level and class-level contractual administration fee rates (the “Management Rates”). The Board noted that the Management Rates include transfer agency and sub-transfer agency costs. The Board also noted that the fee rate to be paid by the Fund under the Management Agreement will incorporate the advisory fee and Fund-level administration fee previously payable separately by the Fund under the Fund’s Advisory Agreement and Administration Agreement with Funds Management. The Board also reviewed and considered the contractual investment sub-advisory fee rates that are payable by Funds Management to the Sub-Adviser for investment sub-advisory services (the “Sub-Advisory Agreement Rates”).
Among other information reviewed by the Board was a comparison of the Management Rates of the Fund with those of other funds in the expense Groups at a common asset level. The Board noted that the Management Rates of the Fund were lower than or in range of the average rates of the Fund’s expense Groups for all share classes.
The Board also received and considered information about the portion of the total advisory fee that was retained by Funds Management after payment of the fee to the Sub-Adviser for sub-advisory services. In assessing the reasonableness of this amount, the Board received and evaluated information about the nature and extent of responsibilities retained and risks assumed by Funds Management and not delegated to or assumed by the Sub-Adviser, and about Funds Management’s on-going oversight services. However, given the affiliation between Funds Management and the Sub-Adviser, the Board ascribed limited relevance to the allocation of the advisory fee between them.
| | | | | | |
| Other information (unaudited) | | Wells Fargo Emerging Markets Equity Fund | | | 35 | |
The Board also received and considered information about the nature and extent of services offered and fee rates charged by Funds Management and the Sub-Adviser to other types of clients with investment strategies similar to those of the Fund. In this regard, the Board received information about the significantly greater scope of services, and compliance, reporting and other legal burdens and risks of managing mutual funds compared with those associated with managing assets of non-mutual fund clients such as collective funds or institutional separate accounts.
Based on its consideration of the factors and information it deemed relevant, including those described here, the Board determined that the compensation payable to Funds Management under the Management Agreement and Advisory Agreement and to the Sub-Adviser under the Sub-Advisory Agreement was reasonable, in light of the services covered by the Advisory Agreements.
Profitability
The Board received and considered information concerning the profitability of Funds Management, as well as the profitability of Wells Fargo as a whole, from providing services to the Fund and the fund family as a whole. The Board also received and considered information concerning the profitability of the Sub-Adviser from providing services to the fund family as a whole, noting that the Sub-Adviser’s profitability information with respect to providing services to the Fund was subsumed in the Wells Fargo profitability analysis.
Funds Management reported on the methodologies and estimates used in calculating profitability. Among other things, the Board noted that the levels of profitability reported on a fund-by-fund basis varied widely, depending on factors such as the size and type of fund. Based on its review, the Board did not deem the profits reported by Funds Management or Wells Fargo from its services to the Fund to be at a level that would prevent it from approving the continuation of the Advisory Agreements.
Economies of scale
With respect to possible economies of scale, the Board noted the existence of breakpoints in the Fund’s advisory and management fee structures, and the Fund’s administration fee structure, which operate generally to reduce the Fund’s expense ratios as the Fund grows in size. It considered that, for a small fund or a fund that shrinks in size, breakpoints conversely can result in higher fee levels. The Board also considered that fee waiver and expense reimbursement arrangements and competitive fee rates at the outset are means of sharing potential economies of scale with shareholders of the Fund and the fund family as a whole. The Board considered Funds Management’s view that any analyses of potential economies of scale in managing a particular fund are inherently limited in light of the joint and common costs and investments that Funds Management incurs across the fund family as a whole.
The Board concluded that the Fund’s fee and expense arrangements, including contractual breakpoints, constituted a reasonable approach to sharing potential economies of scale with the Fund and its shareholders.
Other benefits to Funds Management and the Sub-Adviser
The Board received and considered information regarding potential “fall-out” or ancillary benefits received by Funds Management and its affiliates, including the Sub-Adviser, as a result of their relationships with the Fund. Ancillary benefits could include, among others, benefits directly attributable to other relationships with the Fund and benefits potentially derived from an increase in Funds Management’s and the Sub-Adviser’s business as a result of their relationships with the Fund. The Board noted that various affiliates of Funds Management may receive distribution-related fees, shareholder servicing payments and sub-transfer agency fees in respect of shares sold or held through them and services provided.
The Board also reviewed information about soft dollar credits earned and utilized by the Sub-Adviser, fees earned by Funds Management and the Sub-Adviser from managing a private investment vehicle for the fund family’s securities lending collateral and commissions earned by an affiliated broker from portfolio transactions.
Based on its consideration of the factors and information it deemed relevant, including those described here, the Board did not find that any ancillary benefits received by Funds Management and its affiliates, including the Sub-Adviser, were unreasonable.
Conclusion
At the Meeting, after considering the above-described factors and based on its deliberations and its evaluation of the information described above, the Board unanimously approved the continuation of the Advisory Agreement for the period from June 1, 2015 through June 30, 2015, approved the Management Agreement for the period from July 1, 2015 through May 31, 2016, and approved the continuation of the Sub-Advisory Agreement for a one-year term through May 31, 2016. The Board also determined that the compensation payable to Funds Management and the Sub-Adviser under each of the Advisory Agreements was reasonable.
| | | | |
| 36 | | Wells Fargo Emerging Markets Equity Fund | | List of abbreviations |
The following is a list of common abbreviations for terms and entities that may have appeared in this report.
| ACA | — ACA Financial Guaranty Corporation |
| ADR | — American depositary receipt |
| ADS | — American depositary shares |
| AGC | — Assured Guaranty Corporation |
| AGM | — Assured Guaranty Municipal |
| Ambac | — Ambac Financial Group Incorporated |
| AMT | — Alternative minimum tax |
| BAN | — Bond anticipation notes |
| BHAC | — Berkshire Hathaway Assurance Corporation |
| CAB | — Capital appreciation bond |
| CCAB | — Convertible capital appreciation bond |
| CDA | — Community Development Authority |
| CDO | — Collateralized debt obligation |
| DRIVER | — Derivative inverse tax-exempt receipts |
| DW&P | — Department of Water & Power |
| DWR | — Department of Water Resources |
| ECFA | — Educational & Cultural Facilities Authority |
| EDA | — Economic Development Authority |
| EDFA | — Economic Development Finance Authority |
| ETF | — Exchange-traded fund |
| FDIC | — Federal Deposit Insurance Corporation |
| FFCB | — Federal Farm Credit Banks |
| FGIC | — Financial Guaranty Insurance Corporation |
| FHA | — Federal Housing Administration |
| FHLB | — Federal Home Loan Bank |
| FHLMC | — Federal Home Loan Mortgage Corporation |
| FICO | — The Financing Corporation |
| FNMA | — Federal National Mortgage Association |
| GDR | — Global depositary receipt |
| GNMA | — Government National Mortgage Association |
| HCFR | — Healthcare facilities revenue |
| HEFA | — Health & Educational Facilities Authority |
| HEFAR | — Higher education facilities authority revenue |
| HFA | — Housing Finance Authority |
| HFFA | — Health Facilities Financing Authority |
| HUD | — Department of Housing and Urban Development |
| IDA | — Industrial Development Authority |
| IDAG | — Industrial Development Agency |
| KRW | — Republic of Korea won |
| LIBOR | — London Interbank Offered Rate |
| LIFER | — Long Inverse Floating Exempt Receipts |
| LLC | — Limited liability company |
| LLLP | — Limited liability limited partnership |
| LLP | — Limited liability partnership |
| MBIA | — Municipal Bond Insurance Association |
| MFHR | — Multifamily housing revenue |
| MSTR | — Municipal securities trust receipts |
| MUD | — Municipal Utility District |
| National | — National Public Finance Guarantee Corporation |
| PCFA | — Pollution Control Financing Authority |
| PCL | — Public Company Limited |
| PCR | — Pollution control revenue |
| PFA | — Public Finance Authority |
| PFFA | — Public Facilities Financing Authority |
| PFOTER | — Puttable floating option tax-exempt receipts |
| plc | — Public limited company |
| PUTTER | — Puttable tax-exempt receipts |
| R&D | — Research & development |
| Radian | — Radian Asset Assurance |
| RAN | — Revenue anticipation notes |
| RDA | — Redevelopment Authority |
| RDFA | — Redevelopment Finance Authority |
| REIT | — Real estate investment trust |
| ROC | — Reset option certificates |
| SAVRS | — Select auction variable rate securities |
| SBA | — Small Business Authority |
| SDR | — Swedish depositary receipt |
| SFHR | — Single-family housing revenue |
| SFMR | — Single-family mortgage revenue |
| SPA | — Standby purchase agreement |
| SPDR | — Standard & Poor’s Depositary Receipts |
| SPEAR | — Short Puttable Exempt Adjustable Receipts |
| STRIPS | — Separate trading of registered interest and |
| TAN | — Tax anticipation notes |
| TIPS | — Treasury inflation-protected securities |
| TRAN | — Tax revenue anticipation notes |
| TTFA | — Transportation Trust Fund Authority |
| TVA | — Tennessee Valley Authority |

For more information
More information about Wells Fargo Funds is available free upon request. To obtain literature, please write, email, visit the Fund’s website, or call:
Wells Fargo Funds
P.O. Box 8266
Boston, MA 02266-8266
Email: wfaf@wellsfargo.com
Website: wellsfargofunds.com
Individual investors: 1-800-222-8222
Retail investment professionals: 1-888-877-9275
Institutional investment professionals: 1-866-765-0778
This report and the financial statements contained herein are submitted for the general information of the shareholders of Wells Fargo Funds. If this report is used for promotional purposes, distribution of the report must be accompanied or preceded by a current prospectus. Before investing, please consider the investment objectives, risks, charges, and expenses of the investment. For a current prospectus and, if available, a summary prospectus, containing this information, call 1-800-222-8222 or visit the Fund’s website at wellsfargofunds.com. Read the prospectus carefully before you invest or send money.
Wells Fargo Funds Management, LLC, a wholly owned subsidiary of Wells Fargo & Company, provides investment advisory and administrative services for Wells Fargo Funds. Other affiliates of Wells Fargo & Company provide subadvisory and other services for the Funds. The Funds are distributed by Wells Fargo Funds Distributor, LLC, Member FINRA, an affiliate of Wells Fargo & Company.
NOT FDIC INSURED ¡ NO BANK GUARANTEE ¡ MAY LOSE VALUE
© 2015 Wells Fargo Funds Management, LLC. All rights reserved.
| | |
 | | 238507 12-15 A238/AR238 10-15 |
Annual Report
October 31, 2015

Wells Fargo
Emerging Markets Equity Income Fund


Reduce clutter. Save trees.
Sign up for electronic delivery of prospectuses and shareholder reports at wellsfargo.com/advantagedelivery
Contents
The views expressed and any forward-looking statements are as of October 31, 2015, unless otherwise noted, and are those of the Fund managers and/or Wells Fargo Funds Management, LLC. Discussions of individual securities, or the markets generally, or any Wells Fargo Fund are not intended as individual recommendations. Future events or results may vary significantly from those expressed in any forward-looking statements. The views expressed are subject to change at any time in response to changing circumstances in the market. Wells Fargo Funds Management, LLC and the Fund disclaim any obligation to publicly update or revise any views expressed or forward-looking statements.
NOT FDIC INSURED ¡ NO BANK GUARANTEE ¡ MAY LOSE VALUE
| | | | |
| 2 | | Wells Fargo Emerging Markets Equity Income Fund | | Letter to shareholders (unaudited) |

Karla M. Rabusch
President
Wells Fargo Funds
Economic data continued to indicate that the U.S. economy was in a sluggish but consistent recovery.
Other major central banks, including the European Central Bank and the Bank of Japan, also continued to ease in order to support their respective economies.
Dear Valued Shareholder:
We are pleased to offer you this annual report for the Wells Fargo Emerging Markets Fund Equity Income for the 12-month period that ended October 31, 2015. The period was marked by continued low global interest rates and sluggish economic recovery in developed markets. However, the expectation that the U.S. Federal Reserve (Fed) would soon raise its key interest rate, combined with signs of further quantitative easing from other central banks, depressed the prices of international assets for U.S. dollar–based investors.
The Fed showed signs of raising its key rate, but other central banks continued to ease.
Economic data continued to indicate that the U.S. economy was in a sluggish but consistent recovery. For example, the U.S. unemployment rate eased from 5.8% at the beginning of the reporting period (November 2014) to 5.0% at the end (October 2015). Throughout the reporting period, the Federal Open Market Committee (FOMC), which is the Fed’s monetary policymaking body, kept its key interest rate effectively at zero.
As the period progressed, various comments by Fed Chair Janet Yellen led investors to believe that the FOMC would soon raise its key federal funds rate. The FOMC remained on hold at its September 2015 meeting, however, citing concerns about a weaker global economy and subdued U.S. inflation. The FOMC’s decision caused some uncertainty, but by the end of the period, most investors expected a modest Fed rate hike in late 2015 or early 2016.
In contrast, the People’s Bank of China (PBOC) continued to take several steps to support the slowing Chinese economy. In October 2015, the PBOC cut its benchmark one-year lending and deposit rates for the sixth time since November 2014 and trimmed the percentage of deposits that large banks need to hold as reserves for the fourth time. The moves were aimed at supporting the economy by encouraging lending. The PBOC’s actions tended to put pressure on the yuan versus foreign currencies, pressure that was only reinforced when the PBOC officially devalued the currency in August.
Other major central banks, including the European Central Bank and the Bank of Japan, also continued to ease in order to support their respective economies. The difference in policy between the Fed and other central banks led the U.S. dollar to appreciate against most major currencies, including most emerging markets currencies.
The year was a difficult one for emerging markets investing, marked by slower growth in China and a stronger dollar that depressed the returns of international assets.
Emerging markets faced a number of internal and external headwinds during the past 12 months. Internal factors included not only an economic slowdown in China—with the country’s annual growth rate dipping below 7% for the first time since 2009—but also persistent low prices for oil, natural gas, and industrial metals such as copper. Low oil and commodity prices weakened the economies of commodity producers, including Brazil, which also grappled with a political scandal involving corruption at its state-owned oil firm. Among external factors, global investors continued to worry about the timing of the first rate hike in the U.S. since 2006. The prospect for a U.S. rate hike led to a stronger U.S. dollar; given that many emerging markets have issued U.S. dollar–denominated debt, dollar strength could make it more difficult for emerging countries to repay their creditors.
| | | | | | |
| Letter to shareholders (unaudited) | | Wells Fargo Emerging Markets Equity Income Fund | | | 3 | |
As measured in local currency, the Morgan Stanley Capital International (MSCI) Emerging Markets Index (Net)1 lost 3.47% for the 12-month period, reflecting the headwinds in emerging markets. However, in U.S. dollar terms—the relevant return for U.S. dollar–based investors—the index declined 14.53% for the reporting period. This difference in returns highlights the dollar’s strength during the reporting period.
Don’t let short-term uncertainty derail long-term investment goals.
Periods of uncertainty can present challenges, but experience has taught us that maintaining long-term investment goals can be an effective way to plan for the future. To help you create a sound strategy based on your personal goals and risk tolerance, Wells Fargo Funds offers more than 100 mutual funds and other investments spanning a wide range of asset classes and investment styles. Although diversification cannot guarantee an investment profit or prevent losses, we believe it can be an effective way to manage investment risk and potentially smooth out overall portfolio performance. We encourage investors to know their investments and to understand that appropriate levels of risk-taking may unlock opportunities.
Thank you for choosing to invest with Wells Fargo Funds. We appreciate your confidence in us and remain committed to helping you meet your financial needs.
Sincerely,

Karla M. Rabusch
President
Wells Fargo Funds
Notice to shareholders
At a meeting held August 11-12, 2015, the Board of Trustees of the Fund approved a change in the name of the Fund whereby the word “Advantage” was removed from its name, effective December 15, 2015.
For current information about your fund investments, contact your investment professional, visit our website at wellsfargofunds.com, or call us directly at 1-800-222-8222. We are available 24 hours a day, 7 days a week.
| 1 | The Morgan Stanley Capital International (MSCI) Emerging Markets Index (Net) is a free-float-adjusted market-capitalization-weighted index that is designed to measure the equity market performance of emerging markets. The MSCI Emerging Markets Index (Net) consists of the following 23 emerging markets country indexes: Brazil, Chile, China, Colombia, Czech Republic, Egypt, Greece, Hungary, India, Indonesia, Korea, Malaysia, Mexico, Peru, the Philippines, Poland, Qatar, Russia, South Africa, Taiwan, Thailand, Turkey, and United Arab Emirates. You cannot invest directly in an index. Source: MSCI. MSCI makes no express or implied warranties or representations and shall have no liability whatsoever with respect to any MSCI data contained herein. The MSCI data may not be further redistributed or used as a basis for other indexes or any securities or financial products. This report is not approved, reviewed, or produced by MSCI. |
| | | | |
| 4 | | Wells Fargo Emerging Markets Equity Income Fund | | Performance highlights (unaudited) |
Investment objective
The Fund seeks long-term capital appreciation and current income.
Manager
Wells Fargo Funds Management, LLC
Subadviser
Wells Capital Management Incorporated
Portfolio managers
Anthony L.T. Cragg
Alison Shimada
Average annual total returns (%) as of October 31, 20151
| | | | | | | | | | | | | | | | | | | | | | | | | | |
| | | | | Including sales charge | | | Excluding sales charge | | | Expense ratios2 (%) | |
| | | Inception date | | 1 year | | | Since Inception | | | 1 year | | | Since Inception | | | Gross | | | Net3 | |
| Class A (EQIAX ) | | 5-31-2012 | | | (15.48 | ) | | | 2.26 | | | | (10.34 | ) | | | 4.04 | | | | 2.03 | | | | 1.66 | |
| Class C (EQICX) | | 5-31-2012 | | | (11.83 | ) | | | 3.29 | | | | (10.95 | ) | | | 3.29 | | | | 2.78 | | | | 2.41 | |
| Class R (EQIHX) | | 9-30-2015 | | | – | | | | – | | | | (10.58 | ) | | | 3.78 | | | | 2.28 | | | | 1.91 | |
| Class R6 (EQIRX) | | 9-30-2015 | | | – | | | | – | | | | (10.04 | ) | | | 4.44 | | | | 1.60 | | | | 1.21 | |
| Administrator Class (EQIDX) | | 5-31-2012 | | | – | | | | – | | | | (10.12 | ) | | | 4.27 | | | | 1.95 | | | | 1.46 | |
| Institutional Class (EQIIX) | | 5-31-2012 | | | – | | | | – | | | | (9.95 | ) | | | 4.47 | | | | 1.70 | | | | 1.26 | |
| MSCI Emerging Markets Index (Net)4 | | – | | | – | | | | – | | | | (14.53 | ) | | | 0.56 | | | | – | | | | – | |
Figures quoted represent past performance, which is no guarantee of future results, and do not reflect taxes that a shareholder may pay on fund distributions or the redemption of fund shares. Investment return and principal value of an investment will fluctuate so that an investor’s shares, when redeemed, may be worth more or less than their original cost. Performance shown without sales charges would be lower if sales charges were reflected. Current performance may be lower or higher than the performance data quoted, which assumes the reinvestment of dividends and capital gains. Current month-end performance is available on the Fund’s website, wellsfargofunds.com.
Index returns do not include transaction costs associated with buying and selling securities, any mutual fund fees or expenses, or any taxes. It is not possible to invest directly in an index.
For Class A shares, the maximum front-end sales charge is 5.75%. For Class C shares, the maximum contingent deferred sales charge is 1.00%. Performance including a contingent deferred sales charge assumes the sales charge for the corresponding time period. Class R, Class R6, Administrator Class and Institutional Class shares are sold without a front-end sales charge or contingent deferred sales charge.
Stock values fluctuate in response to the activities of individual companies and general market and economic conditions. Foreign investments are especially volatile and can rise or fall dramatically due to differences in the political and economic conditions of the host country. These risks are generally intensified in emerging markets. The use of derivatives may reduce returns and/or increase volatility. Certain investment strategies tend to increase the total risk of an investment (relative to the broader market). The Fund is exposed to smaller-company securities risk. Consult the Fund’s prospectus for additional information on these and other risks.
Please see footnotes on page 5.
| | | | | | |
| Performance highlights (unaudited) | | Wells Fargo Emerging Markets Equity Income Fund | | | 5 | |
|
| Growth of $10,000 investment as of October 31, 20155 |
|
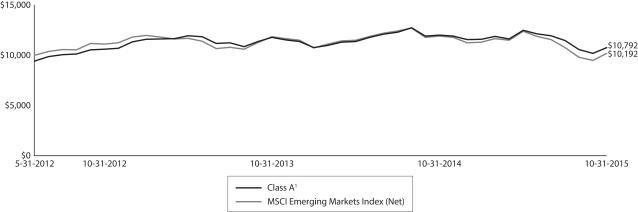 |
| 1 | Historical performance shown for the Class R shares prior to their inception reflects the performance of the Administrator Class shares, adjusted to reflect the higher expenses applicable to Class R shares. Historical performance shown for the Class R6 shares prior to their inception reflects the performance of the Institutional Class shares, and includes the higher expenses applicable to Institutional Class shares. If these expenses had not been included, returns for Class R6 shares would be higher. |
| 2 | Reflects the expense ratios as stated in the most recent prospectuses, which include the impact of 0.01% in acquired fund fees and expenses. The expense ratios shown are subject to change and may differ from the annualized expense ratios shown in the financial highlights of this report, which do not include acquired fund fees and expenses. |
| 3 | The manager has contractually committed through February 29, 2016 (February 28, 2017 for Class R and Class R6), to waive fees and/or reimburse expenses to the extent necessary to cap the Fund’s Total Annual Operating Expenses After Fee Waiver at 1.65% for Class A, 2.40% for Class C, 1.90% for Class R, 1.20% for Class R6, 1.45% for Administrator Class, and 1.25% for Institutional Class. After this time, the cap may be increased or the commitment to maintain the cap may be terminated only with the approval of the Board of Trustees. Brokerage commissions, stamp duty fees, interest, taxes, acquired fees and expenses, and extraordinary expenses are excluded from the cap. Without this cap, the Fund’s returns would have been lower. |
| 4 | The Morgan Stanley Capital International (MSCI) Emerging Markets Index (Net) is a free-float-adjusted market-capitalization-weighted index that is designed to measure the equity market performance of emerging markets. The MSCI Emerging Markets Index (Net) consists of the following 23 emerging markets country indexes: Brazil, Chile, China, Colombia, Czech Republic, Egypt, Greece, Hungary, India, Indonesia, Korea, Malaysia, Mexico, Peru, the Philippines, Poland, Qatar, Russia, South Africa, Taiwan, Thailand, Turkey, and United Arab Emirates. You cannot invest directly in an index. Source: MSCI. MSCI makes no express or implied warranties or representations and shall have no liability whatsoever with respect to any MSCI data contained herein. The MSCI data may not be further redistributed or used as a basis for other indexes or any securities or financial products. This report is not approved, reviewed, or produced by MSCI. |
| 5 | The chart compares the performance of Class A shares since inception with the MSCI Emerging Markets Index (Net). The chart assumes a hypothetical investment of $10,000 in Class A shares and reflects all operating expenses and assumes the maximum initial sales charge of 5.75%. |
| 6 | The ten largest holdings, excluding cash and cash equivalents, are calculated based on the value of the investments divided by total net assets of the Fund. Holdings are subject to change and may have changed since the date specified. |
| 7 | Amounts are calculated based on the total long-term investments of the Fund. These amounts are subject to change and may have changed since the date specified. |
| * | This security was not held in the Fund at the end of the reporting period. |
| | | | |
| 6 | | Wells Fargo Emerging Markets Equity Income Fund | | Performance highlights (unaudited) |
MANAGER’S DISCUSSION
Fund highlights
| n | | The Fund outperformed its benchmark, the MSCI Emerging Markets Index (Net), for the 12-month period that ended October 31, 2015. |
| n | | Overall stock selection contributed to relative returns for the period. However, an underweight to the information technology (IT) and health care sectors detracted from relative returns. |
| n | | Among countries, strong stock selection helped the Fund’s relative outperformance in China/Hong Kong, Mexico, and Brazil. Unfavorable stock selection in South Africa and the Philippines detracted from relative performance, as did underweight positions to India and South Korea. |
The Fund outperformed its benchmark during a volatile market.
During the 12-month period, returns in emerging markets fluctuated as a result of factors that included fears of slowing Chinese growth, the pace of reforms in India and Indonesia, the ongoing Russia/Ukraine crisis, political concerns in Brazil, and the probable effect of rising interest rates in the United States. Against that backdrop, stock selection in industrials, consumer discretionary, and telecommunication services aided relative results. On the opposite side of the spectrum, an underweight to IT and unfavorable stock selection in that sector detracted from relative results. An underweight to health care also detracted because the sector significantly outperformed for the reporting period.
Outperformance in the industrials sector primarily was driven by the Fund’s exposure to transportation infrastructure stocks such as Mexico’s Grupo Aeroportuario del Pacifico, S.A.B. de C.V., and Grupo Aeroportuario del Centro Norte, S.A.B. de C.V., as well as Malaysia’s Westports Holdings Bhd.* and Hong Kong–headquartered COSCO Pacific Limited. The textiles apparel and luxury goods industry was a key driver in the consumer discretionary sector, with the Fund benefiting from investments in ANTA Sports Products Limited,* Texwinca Holdings Limited, and Yue Yuen Industrial (Holdings) Limited.*
| | | | |
| Ten largest holdings (%) as of October 31, 20156 | |
China Mobile Limited | | | 3.07 | |
Industrial & Commercial Bank of China Limited H Shares | | | 2.18 | |
China Construction Bank H Shares | | | 2.15 | |
PT Telekomunikasi Indonesia Persero Tbk | | | 1.96 | |
Grupo Aeroportuario del Centro Norte SAB de CV | | | 1.87 | |
Grupo Aeroportuario del Pacifico SAB de CV | | | 1.86 | |
Grupo Financiero Santander SAB de CV Class B | | | 1.79 | |
SK Telecom Company Limited ADR | | | 1.75 | |
HSBC Bank plc (Coal India Limited) | | | 1.68 | |
COSCO Pacific Limited | | | 1.67 | |
|
| Sector distribution as of October 31, 20157 |
|
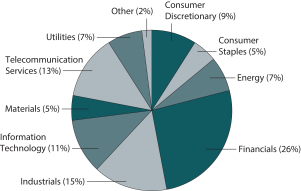 |
Please see footnotes on page 5.
| | | | | | |
| Performance highlights (unaudited) | | Wells Fargo Emerging Markets Equity Income Fund | | | 7 | |
|
| Country allocation as of October 31, 20157 |
|
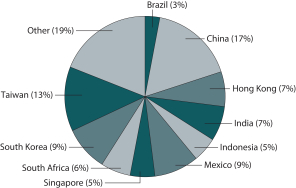 |
On a country basis, notable areas of success included China/Hong Kong, Mexico, and Brazil. In China/Hong Kong, the Fund benefited from holdings in the industrials and materials sectors. In Mexico, the Fund also benefited from holdings in the industrials sector, principally two airport companies. In Brazil, the avoidance of the energy sector was a primary contributor to returns, as was the general underweight to the country leading up to Standard & Poor’s downgrade of the country’s sovereign credit rating to junk status.
Our investment outlook on the emerging markets region remains positive.
China has entered into an easing cycle, with further reduction in interest rates and reserve requirement ratios
and more targeted quantitative measures most likely in store for the rest of the year. We have become more cautious on China on the back of the government’s poor handling of stock market intervention and of the Tianjin explosions. We continue to prefer secular growth sectors, companies that benefit from reform of state-owned enterprises, and companies delivering rising profitability on lower commodity and financing costs.
We are underweight South Korea and are monitoring the two main issues of its currency and the state of its IT sector. We will look for sustainable earnings stories in South Korea in order to selectively increase our exposure. The Indian market remained quite resilient despite a sell-off in the rest of emerging Asia. We see some positive signs in India, such as an easing of inflation and increasing tax receipts. The Indonesian market will likely move in line with government policy actions because government reform remains an important theme in the market. In both India and Indonesia, the sustained decline in the oil price is particularly helpful to government budgets as well as to consumption trends.
Latin America is facing another year of decelerating economic growth. We perceive the limits for faster growth to be cyclical in Mexico, Peru, and Colombia. Conversely, we believe the growth gap in Brazil and Chile to be structural. We have negatively changed our stance on Brazil to reflect our belief that risks in that market now outweigh the rewards due to a longer-than-expected timeline for its macroeconomic recovery. Despite the depressed price of crude oil, Mexico’s economic outlook stands out because of its diversification and the visibility of its economic policies.
In the Europe, Middle East, and Africa (EMEA) region, investors assume that Western sanctions against Russia will remain for the foreseeable future. However, Russia’s active military involvement in the Middle East had the potential to change the geopolitical picture in the region and the relationship with the West. In Poland, we expect an introduction of sectoral taxes and additional spending following the completion of parliamentary elections. By contrast, we had a higher level of uncertainty about Turkey as the country headed into yet another round of parliamentary elections in early November. Given many EMEA markets’ recent corrections and further currency adjustments, we will be looking for select opportunities in the region, driven by company-specific stories.
We maintain our view that while all countries face some sort of challenge, some appear to be fundamentally attractive but others seem to have more serious structural problems. We believe that market corrections allow the markets to clear and reset where necessary, and the dividend yields on the Fund’s holdings should help dampen volatility. This type of market requires close scrutiny of company fundamentals but also can lead to longer-term opportunities.
Please see footnotes on page 5.
| | | | |
| 8 | | Wells Fargo Emerging Markets Equity Income Fund | | Fund expenses (unaudited) |
As a shareholder of the Fund, you incur two types of costs: (1) transaction costs, including sales charges (loads) on purchase payments and contingent deferred sales charges (if any) on redemptions and (2) ongoing costs, including management fees, distribution (12b-1) and/or shareholder servicing fees, and other Fund expenses. This example is intended to help you understand your ongoing costs (in dollars) of investing in the Fund and to compare these costs with the ongoing costs of investing in other mutual funds.
The example is based on an investment of $1,000 invested at the beginning of the six-month period and held for the entire period from May 1, 2015 to October 31, 2015.
Actual expenses
The “Actual” line of the table below provides information about actual account values and actual expenses. You may use the information in this line, together with the amount you invested, to estimate the expenses that you paid over the period. Simply divide your account value by $1,000 (for example, an $8,600 account value divided by $1,000 = 8.6), then multiply the result by the number in the “Actual” line under the heading entitled “Expenses paid during period” for your applicable class of shares to estimate the expenses you paid on your account during this period.
Hypothetical example for comparison purposes
The “Hypothetical” line of the table below provides information about hypothetical account values and hypothetical expenses based on the Fund’s actual expense ratio and an assumed rate of return of 5% per year before expenses, which is not the Fund’s actual return. The hypothetical account values and expenses may not be used to estimate the actual ending account balance or expenses you paid for the period. You may use this information to compare the ongoing costs of investing in the Fund and other funds. To do so, compare this 5% hypothetical example with the 5% hypothetical examples that appear in the shareholder reports of the other funds.
Please note that the expenses shown in the table are meant to highlight your ongoing costs only and do not reflect any transactional costs, such as sales charges (loads) and contingent deferred sales charges. Therefore, the “Hypothetical” line of the table is useful in comparing ongoing costs only and will not help you determine the relative total costs of owning different funds. In addition, if these transactional costs were included, your costs would have been higher.
| | | | | | | | | | | | | | | | |
| | | Beginning
account value
5-1-2015 | | | Ending
account value
10-31-2015 | | | Expenses
paid during
the period¹ | | | Net annualized
expense ratio | |
Class A | | | | | | | | | | | | | | | | |
Actual | | $ | 1,000.00 | | | $ | 864.02 | | | $ | 7.75 | | | | 1.65 | % |
Hypothetical (5% return before expenses) | | $ | 1,000.00 | | | $ | 1,016.89 | | | $ | 8.39 | | | | 1.65 | % |
Class C | | | | | | | | | | | | | | | | |
Actual | | $ | 1,000.00 | | | $ | 860.70 | | | $ | 11.26 | | | | 2.40 | % |
Hypothetical (5% return before expenses) | | $ | 1,000.00 | | | $ | 1,013.11 | | | $ | 12.18 | | | | 2.40 | % |
Class R | | | | | | | | | | | | | | | | |
Actual | | $ | 1,000.00 | | | $ | 862.25 | | | $ | 8.92 | | | | 1.90 | % |
Hypothetical (5% return before expenses) | | $ | 1,000.00 | | | $ | 1,015.63 | | | $ | 9.65 | | | | 1.90 | % |
Class R6 | | | | | | | | | | | | | | | | |
Actual | | $ | 1,000.00 | | | $ | 864.97 | | | $ | 5.64 | | | | 1.20 | % |
Hypothetical (5% return before expenses) | | $ | 1,000.00 | | | $ | 1,019.16 | | | $ | 6.11 | | | | 1.20 | % |
Administrator Class | | | | | | | | | | | | | | | | |
Actual | | $ | 1,000.00 | | | $ | 864.80 | | | $ | 6.82 | | | | 1.45 | % |
Hypothetical (5% return before expenses) | | $ | 1,000.00 | | | $ | 1,017.90 | | | $ | 7.38 | | | | 1.45 | % |
Institutional Class | | | | | | | | | | | | | | | | |
Actual | | $ | 1,000.00 | | | $ | 865.76 | | | $ | 5.88 | | | | 1.25 | % |
Hypothetical (5% return before expenses) | | $ | 1,000.00 | | | $ | 1,018.90 | | | $ | 6.36 | | | | 1.25 | % |
| 1 | Expenses paid is equal to the annualized expense ratio of each class multiplied by the average account value over the period, multiplied by the number of days in the most recent fiscal half-year divided by the number of days in the fiscal year (to reflect the one-half-year period). |
| | | | | | |
| Portfolio of investments—October 31, 2015 | | Wells Fargo Emerging Markets Equity Income Fund | | | 9 | |
| | | | | | | | | | | | |
| Security name | | | | | | Shares | | | Value | |
| | | | |
Common Stocks: 83.53% | | | | | | | | | | | | |
| | | | |
| Brazil: 3.03% | | | | | | | | | | | | |
Ambev SA (Consumer Staples, Beverages) | | | | | | | 431,100 | | | $ | 2,133,162 | |
Cielo SA (Information Technology, IT Services) | | | | | | | 125,200 | | | | 1,188,480 | |
Fpc Par Corretora de Seguros SA (Financials, Insurance) | | | | | | | 135,543 | | | | 379,319 | |
Valid Solucoes SA (Industrials, Commercial Services & Supplies) | | | | | | | 234,068 | | | | 2,657,237 | |
| | | | |
| | | | | | | | | | | 6,358,198 | |
| | | | | | | | | | | | |
| | | | |
| Cayman Islands: 0.99% | | | | | | | | | | | | |
KWG Property Holding Limited (Financials, Real Estate Management & Development) | | | | | | | 2,897,500 | | | | 2,089,306 | |
| | | | | | | | | | | | |
| | | | |
| Chile: 1.06% | | | | | | | | | | | | |
Aguas Andinas SA Class A (Utilities, Water Utilities) | | | | | | | 4,259,473 | | | | 2,228,193 | |
| | | | | | | | | | | | |
| | | | |
| China: 14.02% | | | | | | | | | | | | |
Agricultural Bank of China Limited H Shares (Financials, Banks) | | | | | | | 2,021,000 | | | | 826,408 | |
Bank of China Limited H Shares (Financials, Banks) | | | | | | | 3,416,000 | | | | 1,610,853 | |
Beijing Capital International Airport Company Limited H Shares (Industrials, Transportation Infrastructure) | | | | | | | 1,382,000 | | | | 1,479,222 | |
China BlueChemical Limited H Shares (Materials, Chemicals) | | | | | | | 2,748,000 | | | | 819,578 | |
China Construction Bank H Shares (Financials, Banks) | | | | | | | 6,218,000 | | | | 4,506,532 | |
China Mobile Limited (Telecommunication Services, Wireless Telecommunication Services) | | | | | | | 538,000 | | | | 6,450,558 | |
China Petroleum & Chemical Corporation H Shares (Energy, Oil, Gas & Consumable Fuels) | | | | | | | 4,455,600 | | | | 3,211,793 | |
China State Construction International Holdings Limited (Industrials, Construction & Engineering) | | | | | | | 710,000 | | | | 1,077,353 | |
Huaneng Power International Incorporated H Shares (Utilities, Independent Power & Renewable Electricity Producers) | | | | | | | 1,256,000 | | | | 1,359,796 | |
Industrial & Commercial Bank of China Limited H Shares (Financials, Banks) | | | | | | | 7,232,000 | | | | 4,587,294 | |
PetroChina Company Limited H Shares (Energy, Oil, Gas & Consumable Fuels) | | | | | | | 3,426,000 | | | | 2,682,228 | |
Qinhuangdao Port Company H Shares Limited (Industrials, Transportation Infrastructure) | | | | | | | 1,720,500 | | | | 825,917 | |
| | | | |
| | | | | | | | | | | 29,437,532 | |
| | | | | | | | | | | | |
| | | | |
| Czech Republic: 1.50% | | | | | | | | | | | | |
Komercni Banka AS (Financials, Banks) | | | | | | | 15,217 | | | | 3,153,535 | |
| | | | | | | | | | | | |
| | | | |
| Hong Kong: 6.54% | | | | | | | | | | | | |
China Power International Development Limited (Utilities, Independent Power & Renewable Electricity Producers) | | | | | | | 4,978,000 | | | | 3,128,333 | |
COSCO Pacific Limited (Industrials, Transportation Infrastructure) (a) | | | | | | | 2,715,517 | | | | 3,513,081 | |
Far East Horizon Limited (Financials, Diversified Financial Services) | | | | | | | 1,132,000 | | | | 941,569 | |
Franshion Properties China Limited (Financials, Real Estate Management & Development) | | | | | | | 5,368,000 | | | | 1,478,483 | |
Nagacorp Limited (Consumer Discretionary, Hotels, Restaurants & Leisure) | | | | | | | 2,910,000 | | | | 2,057,952 | |
Texwinca Holdings Limited (Consumer Discretionary, Textiles, Apparel & Luxury Goods) | | | | | | | 2,690,000 | | | | 2,617,857 | |
| | | | |
| | | | | | | | | | | 13,737,275 | |
| | | | | | | | | | | | |
| | | | |
| Indonesia: 4.51% | | | | | | | | | | | | |
PT Bank Rakyat Indonesia Tbk (Financials, Banks) | | | | | | | 1,570,900 | | | | 1,202,297 | |
PT Hanjaya Mandala Sampoerna Tbk (Consumer Staples, Tobacco) | | | | | | | 296,000 | | | | 1,987,192 | |
PT Indo Tambangraya Megah Tbk (Energy, Oil, Gas & Consumable Fuels) | | | | | | | 876,200 | | | | 540,145 | |
PT Indocement Tunggal Prakarsa Tbk (Materials, Construction Materials) | | | | | | | 491,100 | | | | 642,319 | |
PT Perusahaan Gas Negara Persero Tbk (Utilities, Gas Utilities) | | | | | | | 4,506,100 | | | | 984,218 | |
PT Telekomunikasi Indonesia Persero Tbk (Telecommunication Services, Diversified Telecommunication Services) | | | | | | | 21,021,000 | | | | 4,124,059 | |
| | | | |
| | | | | | | | | | | 9,480,230 | |
| | | | | | | | | | | | |
The accompanying notes are an integral part of these financial statements.
| | | | |
| 10 | | Wells Fargo Emerging Markets Equity Income Fund | | Portfolio of investments—October 31, 2015 |
| | | | | | | | | | | | |
| Security name | | | | | | Shares | | | Value | |
| | | | |
| Malaysia: 2.03% | | | | | | | | | | | | |
Malakoff Corporation Bhd (Utilities, Independent Power & Renewable Electricity Producers) | | | | | | | 3,678,275 | | | $ | 1,461,694 | |
Telecom Malaysia Bhd (Telecommunication Services, Diversified Telecommunication Services) | | | | | | | 1,179,681 | | | | 1,829,971 | |
Tenaga Nasional Bhd (Utilities, Electric Utilities) | | | | | | | 329,800 | | | | 969,375 | |
| | | | |
| | | | | | | | | | | 4,261,040 | |
| | | | | | | | | | | | |
| | | | |
| Mexico: 8.69% | | | | | | | | | | | | |
Bolsa Mexicana de Valores SAB de CV (Financials, Diversified Financial Services) | | | | | | | 816,862 | | | | 1,364,915 | |
Grupo Aeroportuario del Centro Norte SAB de CV (Industrials, Transportation Infrastructure) | | | | | | | 765,484 | | | | 3,931,738 | |
Grupo Aeroportuario del Pacifico SAB de CV (Industrials, Transportation Infrastructure) | | | | | | | 432,425 | | | | 3,900,197 | |
Grupo Financiero Santander SAB de CV Class B (Financials, Banks) | | | | | | | 2,041,879 | | | | 3,751,772 | |
Macquarie Mexico Real Estate Management SA de CV (Financials, REITs) 144A | | | | | | | 1,980,542 | | | | 2,740,994 | |
Wal-Mart de Mexico SAB de CV (Consumer Staples, Food & Staples Retailing) | | | | | | | 966,394 | | | | 2,559,647 | |
| | | | |
| | | | | | | | | | | 18,249,263 | |
| | | | | | | | | | | | |
| | | | |
| Panama: 1.95% | | | | | | | | | | | | |
Banco Latinoamericano de Comercio Exterior SA (Financials, Banks) | | | | | | | 72,575 | | | | 1,961,702 | |
Copa Holdings SA Class A (Industrials, Airlines) | | | | | | | 42,021 | | | | 2,122,901 | |
| | | | |
| | | | | | | | | | | 4,084,603 | |
| | | | | | | | | | | | |
| | | | |
| Philippines: 1.33% | | | | | | | | | | | | |
Premium Leisure Corporation (Financials, Diversified Financial Services) | | | | | | | 52,610,000 | | | | 1,276,611 | |
Semirara Mining and Power Corporation (Energy, Oil, Gas & Consumable Fuels) | | | | | | | 526,920 | | | | 1,506,288 | |
| | | | |
| | | | | | | | | | | 2,782,899 | |
| | | | | | | | | | | | |
| | | | |
| Poland: 1.13% | | | | | | | | | | | | |
Asseco Poland SA (Information Technology, Software) | | | | | | | 160,653 | | | | 2,371,349 | |
| | | | | | | | | | | | |
| | | | |
| Qatar: 0.84% | | | | | | | | | | | | |
Industries Qatar (Industrials, Industrial Conglomerates) | | | | | | | 52,127 | | | | 1,760,607 | |
| | | | | | | | | | | | |
| | | | |
| Russia: 1.60% | | | | | | | | | | | | |
MegaFon OAO (Telecommunication Services, Wireless Telecommunication Services) | | | | | | | 145,107 | | | | 1,868,945 | |
Tatneft ADR (Energy, Oil, Gas & Consumable Fuels) | | | | | | | 48,537 | | | | 1,496,809 | |
| | | | |
| | | | | | | | | | | 3,365,754 | |
| | | | | | | | | | | | |
| | | | |
| Singapore: 5.16% | | | | | | | | | | | | |
Asian Pay Television Trust (Consumer Discretionary, Media) | | | | | | | 3,986,100 | | | | 2,244,855 | |
CapitaRetail China Trust (Financials, REITs) | | | | | | | 949,200 | | | | 1,027,619 | |
Hutchison Port Holdings Trust (Industrials, Transportation Infrastructure) | | | | | | | 3,242,200 | | | | 1,795,712 | |
Jardine Cycle & Carriage Limited (Consumer Discretionary, Distributors) | | | | | | | 86,800 | | | | 2,009,663 | |
Lippo Malls Indonesia Retail Trust (Financials, REITs) | | | | | | | 1,180,000 | | | | 269,541 | |
Singapore Telecommunications Limited (Telecommunication Services, Diversified Telecommunication Services) | | | | | | | 1,224,800 | | | | 3,479,966 | |
| | | | |
| | | | | | | | | | | 10,827,356 | |
| | | | | | | | | | | | |
| | | | |
| South Africa: 5.26% | | | | | | | | | | | | |
Barclays Africa Group Limited (Financials, Banks) | | | | | | | 186,011 | | | | 2,383,888 | |
FirstRand Limited (Financials, Diversified Financial Services) | | | | | | | 283,973 | | | | 1,040,573 | |
MMI Holdings Limited (Financials, Insurance) | | | | | | | 668,384 | | | | 1,212,880 | |
Reunert Limited (Industrials, Industrial Conglomerates) | | | | | | | 442,599 | | | | 2,158,146 | |
Sasol Limited (Energy, Oil, Gas & Consumable Fuels) | | | | | | | 26,984 | | | | 864,612 | |
The accompanying notes are an integral part of these financial statements.
| | | | | | |
| Portfolio of investments—October 31, 2015 | | Wells Fargo Emerging Markets Equity Income Fund | | | 11 | |
| | | | | | | | | | | | |
| Security name | | | | | | Shares | | | Value | |
| | | | |
| South Africa (continued) | | | | | | | | | | | | |
Truworths International Limited (Consumer Discretionary, Specialty Retail) | | | | | | | 212,298 | | | $ | 1,436,371 | |
Vodacom Group Proprietary Limited (Consumer Discretionary, Media) | | | | | | | 180,373 | | | | 1,948,232 | |
| | | | |
| | | | | | | | | | | 11,044,702 | |
| | | | | | | | | | | | |
| | | | |
| South Korea: 8.80% | | | | | | | | | | | | |
Grand Korea Leisure Company Limited (Consumer Discretionary, Hotels, Restaurants & Leisure) | | | | | | | 23,069 | | | | 641,286 | |
Hite Jinro Company Limited (Consumer Staples, Beverages) | | | | | | | 46,013 | | | | 922,670 | |
Kangwon Land Incorporated (Consumer Discretionary, Hotels, Restaurants & Leisure) | | | | | | | 54,373 | | | | 2,017,436 | |
Korea Electric Power Corporation (Utilities, Electric Utilities) | | | | | | | 69,850 | | | | 3,144,966 | |
Korea Reinsurance Company (Financials, Insurance) | | | | | | | 131,615 | | | | 1,569,133 | |
KT&G Corporation (Consumer Staples, Tobacco) | | | | | | | 9,599 | | | | 959,858 | |
Macquarie Korea Infrastructure Fund (Financials, Capital Markets) | | | | | | | 346,433 | | | | 2,431,002 | |
POSCO (Materials, Metals & Mining) | | | | | | | 19,360 | | | | 3,113,298 | |
SK Telecom Company Limited ADR (Telecommunication Services, Wireless Telecommunication Services) | | | | | | | 156,301 | | | | 3,682,452 | |
| | | | |
| | | | | | | | | | | 18,482,101 | |
| | | | | | | | | | | | |
| | | | |
| Taiwan: 12.55% | | | | | | | | | | | | |
Advanced Semiconductor Engineering Incorporated (Information Technology, Semiconductors & Semiconductor Equipment) | | | | | | | 1,707,000 | | | | 1,970,654 | |
Cathay Financial Holding Company Limited (Financials, Insurance) | | | | | | | 731,000 | | | | 1,041,233 | |
Chicony Electronics Company Limited (Information Technology, Technology Hardware, Storage & Peripherals) | | | | | | | 1,138,972 | | | | 2,710,843 | |
Chunghwa Telecom Company Limited (Telecommunication Services, Diversified Telecommunication Services) | | | | | | | 405,000 | | | | 1,240,863 | |
Cleanaway Company Limited (Industrials, Commercial Services & Supplies) | | | | | | | 139,000 | | | | 682,890 | |
CTBC Financial Holding Company Limited (Financials, Banks) | | | | | | | 1,772,380 | | | | 971,009 | |
CTCI Corporation (Industrials, Construction & Engineering) | | | | | | | 822,000 | | | | 1,070,110 | |
Delta Electronics Incorporated (Information Technology, Electronic Equipment, Instruments & Components) | | | | | | | 272,000 | | | | 1,383,007 | |
Hon Hai Precision Industry Company Limited (Information Technology, Electronic Equipment, Instruments & Components) | | | | | | | 1,098,300 | | | | 2,919,346 | |
King Yuan Electronics Company Limited (Information Technology, Semiconductors & Semiconductor Equipment) | | | | | | | 1,408,000 | | | | 898,564 | |
Merida Industry Company Limited (Consumer Discretionary, Leisure Products) | | | | | | | 166,000 | | | | 970,212 | |
Namchow Chemical Industrial Company Limited (Consumer Staples, Food Products) | | | | | | | 399,000 | | | | 864,943 | |
Nan Ya Plastics Corporation (Materials, Chemicals) | | | | | | | 535,000 | | | | 1,061,619 | |
Siliconware Precision Industries Company (Information Technology, Semiconductors & Semiconductor Equipment) | | | | | | | 2,140,000 | | | | 2,827,452 | |
Taiwan Semiconductor Manufacturing Company Limited (Information Technology, Semiconductors & Semiconductor Equipment) | | | | | | | 490,000 | | | | 2,064,696 | |
Teco Electric & Machinery Company Limited (Industrials, Electrical Equipment) | | | | | | | 1,197,000 | | | | 1,043,271 | |
United Microelectronics Corporation ADR (Information Technology, Semiconductors & Semiconductor Equipment) | | | | | | | 839,536 | | | | 1,553,142 | |
WPG Holdings Company Limited (Information Technology, Electronic Equipment, Instruments & Components) | | | | | | | 1,022,000 | | | | 1,066,428 | |
| | | | |
| | | | | | | | | | | 26,340,282 | |
| | | | | | | | | | | | |
| | | | |
| Thailand: 1.07% | | | | | | | | | | | | |
Land & Houses PCL (Financials, Real Estate Management & Development) | | | | | | | 4,213,100 | | | | 1,011,265 | |
Major Cineplex Group PCL (Consumer Discretionary, Media) | | | | | | | 1,407,500 | | | | 1,226,752 | |
| | | | |
| | | | | | | | | | | 2,238,017 | |
| | | | | | | | | | | | |
| | | | |
| Turkey: 1.47% | | | | | | | | | | | | |
Emlak Konut Gayrimenkul Yati (Financials, REITs) | | | | | | | 1,094,692 | | | | 1,060,457 | |
Tupras Turkiye Petrol Rafinerileri AS (Energy, Oil, Gas & Consumable Fuels) † | | | | | | | 76,683 | | | | 2,023,506 | |
| | | | |
| | | | | | | | | | | 3,083,963 | |
| | | | | | | | | | | | |
| | | | |
Total Common Stocks (Cost $184,074,204) | | | | | | | | | | | 175,376,205 | |
| | | | | | | | | | | | |
The accompanying notes are an integral part of these financial statements.
| | | | |
| 12 | | Wells Fargo Emerging Markets Equity Income Fund | | Portfolio of investments—October 31, 2015 |
| | | | | | | | | | | | | | | | |
| Security name | | | | | Expiration date | | | Shares | | | Value | |
| | | | |
Participation Notes: 8.87% | | | | | | | | | | | | | | | | |
| | | | |
| China: 1.96% | | | | | | | | | | | | | | | | |
HSBC Bank plc (China Vanke Company Limited Class A) (Financials, Real Estate Management & Development) † | | | | | | | 2-11-2019 | | | | 1,333,000 | | | $ | 2,880,738 | |
HSBC Bank plc (Daqin Railway Company Limited Class A) (Industrials, Road & Rail) † | | | | | | | 10-28-2020 | | | | 262,622 | | | | 379,059 | |
Standard Chartered Bank (Daqin Railway Company Limited Class A) (Industrials, Road & Rail) † | | | | | | | 3-30-2016 | | | | 584,000 | | | | 842,925 | |
| | | | |
| | | | | | | | | | | | | | | 4,102,722 | |
| | | | | | | | | | | | | | | | |
| | | | |
| India: 6.91% | | | | | | | | | | | | | | | | |
HSBC Bank plc (Bharti Infratel Limited) (Telecommunication Services, Wireless Telecommunication Services) † | | | | | | | 11-22-2023 | | | | 325,133 | | | | 1,934,948 | |
HSBC Bank plc (Bharti Infratel Limited) (Telecommunication Services, Wireless Telecommunication Services) † | | | | | | | 10-1-2018 | | | | 73,027 | | | | 434,602 | |
HSBC Bank plc (Coal India Limited) (Materials, Metals & Mining) † | | | | | | | 11-2-2020 | | | | 720,606 | | | | 3,527,172 | |
HSBC Bank plc (Credit Analysis & Research) (Financials, Diversified Financial Services) † | | | | | | | 5-2-2024 | | | | 94,568 | | | | 1,880,624 | |
HSBC Bank plc (Gujarat Pipavav Limited) (Industrials, Marine) † | | | | | | | 3-3-2025 | | | | 354,537 | | | | 875,276 | |
HSBC Bank plc (Hero Motorcorp) (Industrials, Automobiles) † | | | | | | | 7-29-2019 | | | | 34,530 | | | | 1,363,849 | |
HSBC Bank plc (Hexaware Technologies Limited) (Financials, Diversified Financial Services) † | | | | | | | 5-12-2016 | | | | 515,674 | | | | 1,893,261 | |
HSBC Bank plc (NTPC Limited) (Utilities, Electric Utilities) † | | | | | | | 5-6-2024 | | | | 268,653 | | | | 545,889 | |
HSBC Bank plc (Oil & Natural Gas Corporation Limited) (Energy, Oil, Gas & Consumable Fuels) † | | | | | | | 1-10-2024 | | | | 294,051 | | | | 1,111,082 | |
HSBC Bank plc (Power Finance Corporation) (Financials, Diversified Financial Services) † | | | | | | | 10-28-2020 | | | | 258,077 | | | | 946,919 | |
| | | | |
| | | | | | | | | | | | | | | 14,513,622 | |
| | | | | | | | | | | | | | | | |
| | | | |
Total Participation Notes (Cost $20,243,710) | | | | | | | | | | | | | | | 18,616,344 | |
| | | | | | | | | | | | | | | | |
| | | | |
Exchange-Traded Funds: 1.53% | | | | | | | | | | | | | | | | |
| | | | |
| United States: 1.53% | | | | | | | | | | | | | | | | |
Market Vectors Russia ETF | | | | | | | | | | | 191,794 | | | | 3,204,878 | |
| | | | | | | | | | | | | | | | |
| | | | |
Total Exchange-Traded Funds (Cost $3,371,317) | | | | | | | | | | | | | | | 3,204,878 | |
| | | | | | | | | | | | | | | | |
| | | | |
| | | Yield | | | | | | | | | | |
| Short-Term Investments: 5.19% | | | | | | | | | | | | | | | | |
| | | | |
| Investment Companies: 5.19% | | | | | | | | | | | | | | | | |
Wells Fargo Cash Investment Money Market Fund, Select Class (l)(u) | | | 0.16 | % | | | | | | | 10,906,978 | | | | 10,906,979 | |
| | | | | | | | | | | | | | | | |
| | | | |
Total Short-Term Investments (Cost $10,906,979) | | | | | | | | | | | | | | | 10,906,979 | |
| | | | | | | | | | | | | | | | |
| | | | | | | | |
| Total investments in securities (Cost $218,596,210) * | | | 97.59 | % | | | 208,104,406 | |
Other assets and liabilities, net | | | 2.41 | | | | 1,850,279 | |
| | | | | | | | |
| Total net assets | | | 100.00 | % | | $ | 209,954,685 | |
| | | | | | | | |
| † | Non-income-earning security |
| (l) | The issuer of the security is an affiliated person of the Fund as defined in the Investment Company Act of 1940. |
| (u) | The rate represents the 7-day annualized yield at period end. |
| 144A | The security may be resold in transactions exempt from registration, normally to qualified institutional buyers, pursuant to Rule 144A under the Securities Act of 1933. |
| (a) | The security is fair valued in accordance with procedures approved by the Board of Trustees. |
| * | Cost for federal income tax purposes is $219,248,480 and unrealized gains (losses) consists of: |
| | | | |
Gross unrealized gains | | $ | 5,406,863 | |
Gross unrealized losses | | | (16,550,937 | ) |
| | | | |
Net unrealized losses | | $ | (11,144,074 | ) |
The accompanying notes are an integral part of these financial statements.
| | | | | | |
| Statement of assets and liabilities—October 31, 2015 | | Wells Fargo Emerging Markets Equity Income Fund | | | 13 | |
| | | | |
| | | | |
| |
Assets | | | | |
Investments | | | | |
In unaffiliated securities, at value (cost $207,689,231) | | $ | 197,197,427 | |
In affiliated securities, at value (cost $10,906,979) | | | 10,906,979 | |
| | | | |
Total investments, at value (cost $218,596,210) | | | 208,104,406 | |
Cash | | | 8,555 | |
Foreign currency, at value (cost $293,252) | | | 292,241 | |
Receivable for investments sold | | | 1,893,321 | |
Receivable for Fund shares sold | | | 2,935,626 | |
Receivable for dividends | | | 78,029 | |
Prepaid expenses and other assets | | | 75,982 | |
| | | | |
Total assets | | | 213,388,160 | |
| | | | |
| |
Liabilities | | | | |
Payable for investments purchased | | | 2,892,152 | |
Payable for Fund shares redeemed | | | 308,375 | |
Management fee payable | | | 157,642 | |
Distribution fees payable | | | 6,832 | |
Administration fees payable | | | 25,533 | |
Accrued expenses and other liabilities | | | 42,941 | |
| | | | |
Total liabilities | | | 3,433,475 | |
| | | | |
Total net assets | | $ | 209,954,685 | |
| | | | |
| |
NET ASSETS CONSIST OF | | | | |
Paid-in capital | | $ | 227,992,639 | |
Undistributed net investment income | | | 85,687 | |
Accumulated net realized losses on investments | | | (7,633,349 | ) |
Net unrealized losses on investments | | | (10,490,292 | ) |
| | | | |
Total net assets | | $ | 209,954,685 | |
| | | | |
| |
COMPUTATION OF NET ASSET VALUE AND OFFERING PRICE PER SHARE | | | | |
Net assets – Class A | | $ | 22,865,641 | |
Shares outstanding – Class A1 | | | 2,293,445 | |
Net asset value per share – Class A | | | $9.97 | |
Maximum offering price per share – Class A2 | | | $10.58 | |
Net assets – Class C | | $ | 10,189,659 | |
Shares outstanding – Class C1 | | | 1,025,233 | |
Net asset value per share – Class C | | | $9.94 | |
Net assets – Class R | | $ | 26,476 | |
Shares outstanding – Class R1 | | | 2,649 | |
Net asset value per share – Class R | | | $9.99 | |
Net assets – Class R6 | | $ | 26,493 | |
Shares outstanding – Class R61 | | | 2,656 | |
Net asset value per share – Class R6 | | | $9.97 | |
Net assets – Administrator Class | | $ | 43,928,116 | |
Shares outstanding – Administrator Class1 | | | 4,393,839 | |
Net asset value per share – Administrator Class | | | $10.00 | |
Net assets – Institutional Class | | $ | 132,918,300 | |
Shares outstanding – Institutional Class1 | | | 13,317,405 | |
Net asset value per share – Institutional Class | | | $9.98 | |
| 1 | The Fund has an unlimited number of authorized shares. |
| 2 | Maximum offering price is computed as 100/94.25 of net asset value. On investments of $50,000 or more, the offering price is reduced. |
The accompanying notes are an integral part of these financial statements.
| | | | |
| 14 | | Wells Fargo Emerging Markets Equity Income Fund | | Statement of operations—year ended October 31, 2015 |
| | | | |
| | | | |
| |
Investment income | | | | |
Dividends (net of foreign withholding taxes of $521,968) | | $ | 5,061,534 | |
Income from affiliated securities | | | 4,560 | |
| | | | |
Total investment income | | | 5,066,094 | |
| | | | |
| |
Expenses | | | | |
Management fee | | | 1,513,861 | |
Administration fees | | | | |
Fund level | | | 36,155 | |
Class A | | | 45,149 | |
Class C | | | 20,632 | |
Class R | | | 5 | 1 |
Class R6 | | | 1 | 1 |
Administrator Class | | | 50,404 | |
Institutional Class | | | 66,845 | |
Shareholder servicing fees | | | | |
Class A | | | 46,988 | |
Class C | | | 21,511 | |
Class R | | | 6 | 1 |
Administrator Class | | | 112,772 | |
Distribution fees | | | | |
Class C | | | 64,534 | |
Class R | | | 6 | 1 |
Custody and accounting fees | | | 150,808 | |
Professional fees | | | 49,014 | |
Registration fees | | | 74,536 | |
Shareholder report expenses | | | 18,324 | |
Trustees’ fees and expenses | | | 21,433 | |
Interest expense | | | 1,472 | |
Other fees and expenses | | | 21,558 | |
| | | | |
Total expenses | | | 2,316,014 | |
Less: Fee waivers and/or expense reimbursements | | | (365,325 | ) |
| | | | |
Net expenses | | | 1,950,689 | |
| | | | |
Net investment income | | | 3,115,405 | |
| | | | |
| |
REALIZED AND UNREALIZED GAINS (LOSSES) ON INVESTMENTS | | | | |
| |
Net realized gains (losses) on: | | | | |
Unaffiliated securities | | | (5,869,275 | ) |
Forward foreign currency contract transactions | | | 16,010 | |
| | | | |
Net realized losses on investments | | | (5,853,265 | ) |
| | | | |
Net change in unrealized gains (losses) on investments | | | (14,976,313 | ) |
| | | | |
Net realized and unrealized gains (losses) on investments | | | (20,829,578 | ) |
| | | | |
Net decrease in net assets resulting from operations | | $ | (17,714,173 | ) |
| | | | |
| 1 | For the period from September 30, 2015 (commencement of class operations) to October 31, 2015 |
The accompanying notes are an integral part of these financial statements.
| | | | | | |
| Statement of changes in net assets | | Wells Fargo Emerging Markets Equity Income Fund | | | 15 | |
| | | | | | | | | | | | | | | | |
| | | Year ended
October 31, 2015 | | | Year ended
October 31, 2014 | |
| | | | |
Operations | | | | | | | | | | | | | | | | |
Net investment income | | | | | | $ | 3,115,405 | | | | | | | $ | 2,263,545 | |
Net realized losses on investments | | | | | | | (5,853,265 | ) | | | | | | | (1,885,047 | ) |
Net change in unrealized gains (losses) on investments | | | | | | | (14,976,313 | ) | | | | | | | 3,323,488 | |
| | | | |
Net increase (decrease) in net assets resulting from operations | | | | | | | (17,714,173 | ) | | | | | | | 3,701,986 | |
| | | | |
| | | | |
Distributions to shareholders from | | | | | | | | | | | | | | | | |
Net investment income | | | | | | | | | | | | | | | | |
Class A | | | | | | | (384,317 | ) | | | | | | | (365,935 | ) |
Class C | | | | | | | (127,515 | ) | | | | | | | (99,761 | ) |
Class R | | | | | | | (10 | )1 | | | | | | | N/A | |
Class R6 | | | | | | | (19 | )1 | | | | | | | N/A | |
Administrator Class | | | | | | | (1,016,111 | ) | | | | | | | (734,156 | ) |
Institutional Class | | | | | | | (1,553,325 | ) | | | | | | | (960,146 | ) |
Net realized gains | | | | | | | | | | | | | | | | |
Class A | | | | | | | 0 | | | | | | | | (297,936 | ) |
Class C | | | | | | | 0 | | | | | | | | (99,039 | ) |
Administrator Class | | | | | | | 0 | | | | | | | | (465,603 | ) |
Institutional Class | | | | | | | 0 | | | | | | | | (190,076 | ) |
| | | | |
Total distributions to shareholders | | | | | | | (3,081,297 | ) | | | | | | | (3,212,652 | ) |
| | | | |
| | | | |
Capital share transactions | | | Shares | | | | | | | | Shares | | | | | |
Proceeds from shares sold | | | | | | | | | | | | | | | | |
Class A | | | 1,696,774 | | | | 18,394,271 | | | | 1,137,117 | | | | 12,671,376 | |
Class C | | | 795,767 | | | | 8,556,504 | | | | 413,136 | | | | 4,655,213 | |
Class R | | | 2,648 | 1 | | | 25,000 | 1 | | | N/A | | | | N/A | |
Class R6 | | | 2,654 | 1 | | | 25,000 | 1 | | | N/A | | | | N/A | |
Administrator Class | | | 5,721,244 | | | | 61,488,744 | | | | 4,410,592 | | | | 50,555,968 | |
Institutional Class | | | 12,481,918 | | | | 130,171,618 | | | | 5,192,856 | | | | 56,567,470 | |
| | | | |
| | | | | | | 218,661,137 | | | | | | | | 124,450,027 | |
| | | | |
Reinvestment of distributions | | | | | | | | | | | | | | | | |
Class A | | | 36,083 | | | | 380,492 | | | | 58,552 | | | | 659,941 | |
Class C | | | 11,577 | | | | 122,069 | | | | 17,625 | | | | 198,800 | |
Class R | | | 1 | 1 | | | 10 | 1 | | | N/A | | | | N/A | |
Class R6 | | | 2 | 1 | | | 19 | 1 | | | N/A | | | | N/A | |
Administrator Class | | | 94,283 | | | | 997,261 | | | | 102,116 | | | | 1,157,719 | |
Institutional Class | | | 77,609 | | | | 795,126 | | | | 76,117 | | | | 868,402 | |
| | | | |
| | | | | | | 2,294,977 | | | | | | | | 2,884,862 | |
| | | | |
Payment for shares redeemed | | | | | | | | | | | | | | | | |
Class A | | | (675,914 | ) | | | (7,063,488 | ) | | | (693,777 | ) | | | (8,135,229 | ) |
Class C | | | (346,771 | ) | | | (3,609,550 | ) | | | (38,131 | ) | | | (422,208 | ) |
Administrator Class | | | (6,081,753 | ) | | | (63,197,111 | ) | | | (999,004 | ) | | | (11,045,099 | ) |
Institutional Class | | | (2,337,484 | ) | | | (24,746,171 | ) | | | (2,688,911 | ) | | | (30,101,322 | ) |
| | | | |
| | | | | | | (98,616,320 | ) | | | | | | | (49,703,858 | ) |
| | | | |
Net increase in net assets resulting from capital share transactions | | | | | | | 122,339,794 | | | | | | | | 77,631,031 | |
| | | | |
Total increase in net assets | | | | | | | 101,544,324 | | | | | | | | 78,120,365 | |
| | | | |
| | | | |
Net assets | | | | | | | | | | | | | | | | |
Beginning of period | | | | | | | 108,410,361 | | | | | | | | 30,289,996 | |
| | | | |
End of period | | | | | | $ | 209,954,685 | | | | | | | $ | 108,410,361 | |
| | | | |
Undistributed net investment income | | | | | | $ | 85,687 | | | | | | | $ | 233,041 | |
| | | | |
| 1 | For the period from September 30, 2015 (commencement of class operations) to October 31, 2015 |
The accompanying notes are an integral part of these financial statements.
| | | | |
| 16 | | Wells Fargo Emerging Markets Equity Income Fund | | Financial highlights |
(For a share outstanding throughout each period)
| | | | | | | | | | | | | | | | |
| | | Year ended October 31 | |
| CLASS A | | 2015 | | | 2014 | | | 2013 | | | 20121 | |
Net asset value, beginning of period | | | $11.33 | | | | $11.79 | | | | $11.17 | | | | $10.00 | |
Net investment income | | | 0.20 | | | | 0.33 | | | | 0.31 | | | | 0.13 | |
Net realized and unrealized gains (losses) on investments | | | (1.36 | ) | | | (0.11 | ) | | | 0.88 | | | | 1.15 | |
| | | | | | | | | | | | | | | | |
Total from investment operations | | | (1.16 | ) | | | 0.22 | | | | 1.19 | | | | 1.28 | |
Distributions to shareholders from | | | | | | | | | | | | | | | | |
Net investment income | | | (0.20 | ) | | | (0.31 | ) | | | (0.34 | ) | | | (0.11 | ) |
Net realized gains | | | 0.00 | | | | (0.37 | ) | | | (0.23 | ) | | | 0.00 | |
| | | | | | | | | | | | | | | | |
Total distributions to shareholders | | | (0.20 | ) | | | (0.68 | ) | | | (0.57 | ) | | | (0.11 | ) |
Net asset value, end of period | | | $9.97 | | | | $11.33 | | | | $11.79 | | | | $11.17 | |
Total return2 | | | (10.34 | )% | | | 2.05 | % | | | 10.94 | % | | | 12.80 | % |
Ratios to average net assets (annualized) | | | | | | | | | | | | | | | | |
Gross expenses | | | 1.89 | % | | | 2.09 | % | | | 2.88 | % | | | 4.29 | % |
Net expenses | | | 1.65 | % | | | 1.65 | % | | | 1.65 | % | | | 1.65 | % |
Net investment income | | | 2.22 | % | | | 3.12 | % | | | 2.64 | % | | | 2.94 | % |
Supplemental data | | | | | | | | | | | | | | | | |
Portfolio turnover rate | | | 84 | % | | | 91 | % | | | 85 | % | | | 39 | % |
Net assets, end of period (000s omitted) | | | $22,866 | | | | $14,010 | | | | $8,658 | | | | $628 | |
| 1 | For the period from May 31, 2012 (commencement of class operations) to October 31, 2012 |
| 2 | Total return calculations do not include any sales charges. Returns for periods of less than one year are not annualized. |
The accompanying notes are an integral part of these financial statements.
| | | | | | |
| Financial highlights | | Wells Fargo Emerging Markets Equity Income Fund | | | 17 | |
(For a share outstanding throughout each period)
| | | | | | | | | | | | | | | | |
| | | Year ended October 31 | |
| CLASS C | | 2015 | | | 2014 | | | 2013 | | | 20121 | |
Net asset value, beginning of period | | | $11.32 | | | | $11.79 | | | | $11.16 | | | | $10.00 | |
Net investment income | | | 0.14 | | | | 0.23 | | | | 0.22 | | | | 0.10 | |
Net realized and unrealized gains (losses) on investments | | | (1.38 | ) | | | (0.08 | ) | | | 0.89 | | | | 1.13 | |
| | | | | | | | | | | | | | | | |
Total from investment operations | | | (1.24 | ) | | | 0.15 | | | | 1.11 | | | | 1.23 | |
Distributions to shareholders from | | | | | | | | | | | | | | | | |
Net investment income | | | (0.14 | ) | | | (0.25 | ) | | | (0.25 | ) | | | (0.07 | ) |
Net realized gains | | | 0.00 | | | | (0.37 | ) | | | (0.23 | ) | | | 0.00 | |
| | | | | | | | | | | | | | | | |
Total distributions to shareholders | | | (0.14 | ) | | | (0.62 | ) | | | (0.48 | ) | | | (0.07 | ) |
Net asset value, end of period | | | $9.94 | | | | $11.32 | | | | $11.79 | | | | $11.16 | |
Total return2 | | | (10.95 | )% | | | 1.27 | % | | | 10.11 | % | | | 12.49 | % |
Ratios to average net assets (annualized) | | | | | | | | | | | | | | | | |
Gross expenses | | | 2.64 | % | | | 2.83 | % | | | 3.81 | % | | | 5.03 | % |
Net expenses | | | 2.40 | % | | | 2.40 | % | | | 2.40 | % | | | 2.41 | % |
Net investment income | | | 1.45 | % | | | 2.17 | % | | | 1.80 | % | | | 2.24 | % |
Supplemental data | | | | | | | | | | | | | | | | |
Portfolio turnover rate | | | 84 | % | | | 91 | % | | | 85 | % | | | 39 | % |
Net assets, end of period (000s omitted) | | | $10,190 | | | | $6,390 | | | | $2,028 | | | | $562 | |
| 1 | For the period from May 31, 2012 (commencement of class operations) to October 31, 2012 |
| 2 | Total return calculations do not include any sales charges. Returns for periods of less than one year are not annualized. |
The accompanying notes are an integral part of these financial statements.
| | | | |
| 18 | | Wells Fargo Emerging Markets Equity Income Fund | | Financial highlights |
(For a share outstanding throughout the period)
| | | | |
| CLASS R | | Year ended
October 31, 20151 | |
Net asset value, beginning of period | | | $9.44 | |
Net investment loss | | | (0.01 | )2 |
Net realized and unrealized gains (losses) on investments | | | 0.56 | |
| | | | |
Total from investment operations | | | 0.55 | |
Distributions to shareholders from | | | | |
Net investment income | | | (0.00 | )3 |
Net asset value, end of period | | | $9.99 | |
Total return4 | | | 5.87 | % |
Ratios to average net assets (annualized) | | | | |
Gross expenses | | | 2.10 | % |
Net expenses | | | 1.90 | % |
Net investment loss | | | (0.90 | )% |
Supplemental data | | | | |
Portfolio turnover rate | | | 84 | % |
Net assets, end of period (000s omitted) | | | $26 | |
| 1 | For the period from September 30, 2015 (commencement of class operations) to October 31, 2015 |
| 2 | Calculated based upon average shares outstanding. |
| 3 | Amount is less than $0.005. |
| 4 | Returns for periods of less than one year are not annualized. |
The accompanying notes are an integral part of these financial statements.
| | | | | | |
| Financial highlights | | Wells Fargo Emerging Markets Equity Income Fund | | | 19 | |
(For a share outstanding throughout the period)
| | | | |
| CLASS R6 | | Year ended
October 31, 20151 | |
Net asset value, beginning of period | | | $9.42 | |
Net investment loss | | | (0.00 | )2,3 |
Net realized and unrealized gains (losses) on Investments | | | 0.56 | |
| | | | |
Total from investment operations | | | 0.56 | |
Distributions to shareholders from | | | | |
Net investment income | | | (0.01 | ) |
Net asset value, end of period | | | $9.97 | |
Total return4 | | | 5.91 | % |
Ratios to average net assets (annualized) | | | | |
Gross expenses | | | 1.40 | % |
Net expenses | | | 1.20 | % |
Net investment loss | | | (0.19 | )% |
Supplemental data | | | | |
Portfolio turnover rate | | | 84 | % |
Net assets, end of period (000s omitted) | | | $26 | |
| 1 | For the period from September 30, 2015 (commencement of class operations) to October 31, 2015 |
| 2 | Amount is less than $0.005. |
| 3 | Calculated based upon average shares outstanding. |
| 4 | Returns for periods of less than one year are not annualized. |
The accompanying notes are an integral part of these financial statements.
| | | | |
| 20 | | Wells Fargo Emerging Markets Equity Income Fund | | Financial highlights |
(For a share outstanding throughout each period)
| | | | | | | | | | | | | | | | |
| | | Year ended October 31 | |
| ADMINISTRATOR CLASS | | 2015 | | | 2014 | | | 2013 | | | 20121 | |
Net asset value, beginning of period | | | $11.35 | | | | $11.80 | | | | $11.17 | | | | $10.00 | |
Net investment income | | | 0.23 | | | | 0.33 | 2 | | | 0.32 | | | | 0.14 | |
Net realized and unrealized gains (losses) on investments | | | (1.37 | ) | | | (0.08 | ) | | | 0.89 | | | | 1.14 | |
| | | | | | | | | | | | | | | | |
Total from investment operations | | | (1.14 | ) | | | 0.25 | | | | 1.21 | | | | 1.28 | |
Distributions to shareholders from | | | | | | | | | | | | | | | | |
Net investment income | | | (0.21 | ) | | | (0.33 | ) | | | (0.35 | ) | | | (0.11 | ) |
Net realized gains | | | 0.00 | | | | (0.37 | ) | | | (0.23 | ) | | | 0.00 | |
| | | | | | | | | | | | | | | | |
Total distributions to shareholders | | | (0.21 | ) | | | (0.70 | ) | | | (0.58 | ) | | | (0.11 | ) |
Net asset value, end of period | | | $10.00 | | | | $11.35 | | | | $11.80 | | | | $11.17 | |
Total return2 | | | (10.12 | )% | | | 2.30 | % | | | 11.13 | % | | | 12.89 | % |
Ratios to average net assets (annualized) | | | | | | | | | | | | | | | | |
Gross expenses | | | 1.76 | % | | | 1.91 | % | | | 2.94 | % | | | 4.14 | % |
Net expenses | | | 1.45 | % | | | 1.45 | % | | | 1.45 | % | | | 1.45 | % |
Net investment income | | | 2.38 | % | | | 2.89 | % | | | 2.70 | % | | | 3.17 | % |
Supplemental data | | | | | | | | | | | | | | | | |
Portfolio turnover rate | | | 84 | % | | | 91 | % | | | 85 | % | | | 39 | % |
Net assets, end of period (000s omitted) | | | $43,928 | | | | $52,896 | | | | $13,527 | | | | $5,285 | |
| 1 | For the period from May 31, 2012 (commencement of class operations) to October 31, 2012 |
| 2 | Returns for periods of less than one year are not annualized. |
The accompanying notes are an integral part of these financial statements.
| | | | | | |
| Financial highlights | | Wells Fargo Emerging Markets Equity Income Fund | | | 21 | |
(For a share outstanding throughout each period)
| | | | | | | | | | | | | | | | |
| | | Year ended October 31 | |
| INSTITUTIONAL CLASS | | 2015 | | | 2014 | | | 2013 | | | 20121 | |
Net asset value, beginning of period | | | $11.34 | | | | $11.79 | | | | $11.17 | | | | $10.00 | |
Net investment income | | | 0.25 | 2 | | | 0.35 | | | | 0.34 | | | | 0.15 | |
Net realized and unrealized gains (losses) on investments | | | (1.36 | ) | | | (0.07 | ) | | | 0.89 | | | | 1.14 | |
| | | | | | | | | | | | | | | | |
Total from investment operations | | | (1.11 | ) | | | 0.28 | | | | 1.23 | | | | 1.29 | |
Distributions to shareholders from | | | | | | | | | | | | | | | | |
Net investment income | | | (0.25 | ) | | | (0.36 | ) | | | (0.38 | ) | | | (0.12 | ) |
Net realized gains | | | 0.00 | | | | (0.37 | ) | | | (0.23 | ) | | | 0.00 | |
| | | | | | | | | | | | | | | | |
Total distributions to shareholders | | | (0.25 | ) | | | (0.73 | ) | | | (0.61 | ) | | | (0.12 | ) |
Net asset value, end of period | | | $9.98 | | | | $11.34 | | | | $11.79 | | | | $11.17 | |
Total return3 | | | (9.95 | )% | | | 2.52 | % | | | 11.32 | % | | | 12.98 | % |
Ratios to average net assets (annualized) | | | | | | | | | | | | | | | | |
Gross expenses | | | 1.51 | % | | | 1.62 | % | | | 2.74 | % | | | 3.92 | % |
Net expenses | | | 1.25 | % | | | 1.25 | % | | | 1.25 | % | | | 1.25 | % |
Net investment income | | | 2.41 | % | | | 3.69 | % | | | 2.88 | % | | | 3.39 | % |
Supplemental data | | | | | | | | | | | | | | | | |
Portfolio turnover rate | | | 84 | % | | | 91 | % | | | 85 | % | | | 39 | % |
Net assets, end of period (000s omitted) | | | $132,918 | | | | $35,114 | | | | $6,077 | | | | $5,082 | |
| 1 | For the period from May 31, 2012 (commencement of class operations) to October 31, 2012 |
| 2 | Calculated based upon average shares outstanding. |
| 3 | Returns for periods of less than one year are not annualized. |
The accompanying notes are an integral part of these financial statements.
| | | | |
| 22 | | Wells Fargo Emerging Markets Equity Income Fund | | Notes to financial statements |
1. ORGANIZATION
Wells Fargo Funds Trust (the “Trust”), a Delaware statutory trust organized on March 10, 1999, is an open-end management investment company registered under the Investment Company Act of 1940, as amended (the “1940 Act”). As an investment company, the Trust follows the accounting and reporting guidance in Financial Accounting Standards Board (“FASB”) Accounting Standards Codification Topic 946, Financial Services – Investment Companies. These financial statements report on the Wells Fargo Emerging Markets Equity Income Fund (the “Fund”) which is a diversified series of the Trust.
2. SIGNIFICANT ACCOUNTING POLICIES
The following significant accounting policies, which are consistently followed in the preparation of the financial statements of the Fund, are in conformity with U.S. generally accepted accounting principles which require management to make estimates and assumptions that affect the reported amounts of assets and liabilities, disclosure of contingent assets and liabilities at the date of the financial statements, and the reported amounts of revenues and expenses during the reporting period. Actual results could differ from those estimates.
Securities valuation
All investments are valued each business day as of the close of regular trading on the New York Stock Exchange (generally 4 p.m. Eastern Time).
Equity securities that are listed on a foreign or domestic exchange or market are valued at the official closing price or, if none, the last sales price. If no sale occurs on the primary exchange or market that day, the prior day’s price will be deemed “stale” and a fair value price will be determined in accordance with the Fund’s Valuation Procedures.
Equity securities that are not listed on a foreign or domestic exchange or market, but have a public trading market, are valued at the quoted bid price from an independent broker-dealer that the Management Valuation Team of Wells Fargo Funds Management, LLC (“Funds Management”) has determined is an acceptable source.
The values of securities denominated in foreign currencies are translated into U.S. dollars at rates provided by an independent foreign currency pricing source at a time each business day specified by the Management Valuation Team.
Many securities markets and exchanges outside the U.S. close prior to the close of the New York Stock Exchange and therefore may not fully reflect trading or events that occur after the close of the principal exchange in which the foreign securities are traded, but before the close of the New York Stock Exchange. If such trading or events are expected to materially affect the value of such securities, then fair value pricing procedures approved by the Board of Trustees of the Fund are applied. These procedures take into account multiple factors including movements in U.S. securities markets after foreign exchanges close. Foreign securities that are fair valued under these procedures are categorized as Level 2 and the application of these procedures may result in transfers between Level 1 and Level 2. Depending on market activity, such fair valuations may be frequent. Such fair value pricing may result in net asset values that are higher or lower than net asset values based on the last reported sales price or latest quoted bid price. On October 31, 2015, such fair value pricing was used in pricing foreign securities.
Investments in registered open-end investment companies are valued at net asset value.
Investments which are not valued using any of the methods discussed above are valued at their fair value, as determined in good faith by the Board of Trustees. The Board of Trustees has established a Valuation Committee comprised of the Trustees and has delegated to it the authority to take any actions regarding the valuation of portfolio securities that the Valuation Committee deems necessary or appropriate, including determining the fair value of portfolio securities, unless the determination has been delegated to the Management Valuation Team. The Board of Trustees retains the authority to make or ratify any valuation decisions or approve any changes to the Valuation Procedures as it deems appropriate. On a quarterly basis, the Board of Trustees receives reports on any valuation actions taken by the Valuation Committee or the Management Valuation Team which may include items for ratification.
Valuations of fair valued securities are compared to the next actual sales price when available, or other appropriate market values, to assess the continued appropriateness of the fair valuation methodologies used. These securities are fair valued on a day-to-day basis, taking into consideration changes to appropriate market information and any significant changes to the inputs considered in the valuation process until there is a readily available price provided on an exchange or by an independent pricing service. Valuations received from an independent pricing service or independent broker-dealer quotes are periodically validated by comparisons to most recent trades and valuations provided by other independent pricing services in addition to the review of prices by the manager and/or subadviser. Unobservable inputs
| | | | | | |
| Notes to financial statements | | Wells Fargo Emerging Markets Equity Income Fund | | | 23 | |
used in determining fair valuations are identified based on the type of security, taking into consideration factors utilized by market participants in valuing the investment, knowledge about the issuer and the current market environment.
Foreign currency translation
The accounting records of the Fund are maintained in U.S. dollars. The values of other assets and liabilities denominated in foreign currencies are translated into U.S. dollars at rates provided by an independent foreign currency pricing source at a time each business day specified by the Management Valuation Team. Purchases and sales of securities, and income and expenses are converted at the rate of exchange on the respective dates of such transactions. Net realized foreign exchange gains or losses arise from sales of foreign currencies, currency gains or losses realized between the trade and settlement dates on securities transactions, and the difference between the amounts of dividends, interest and foreign withholding taxes recorded and the U.S. dollar equivalent of the amounts actually paid or received. Net unrealized foreign exchange gains and losses arise from changes in the fair value of assets and liabilities other than investments in securities resulting from changes in exchange rates. The changes in net assets arising from changes in exchange rates and the changes in net assets resulting from changes in market prices of securities are not separately presented. Such changes are included in net realized and unrealized gains or losses from investments.
Forward foreign currency contracts
The Fund is subject to foreign currency exchange rate risk in the normal course of pursuing its investment objectives. A forward foreign currency contract is an agreement between two parties to purchase or sell a specific currency for an agreed-upon price at a future date. The Fund enters into forward foreign currency contracts to facilitate transactions in foreign-denominated securities and to attempt to minimize the risk to the Fund from adverse changes in the relationship between currencies. Forward foreign currency contracts are recorded at the forward rate and marked-to-market daily. When the contracts are closed, realized gains and losses arising from such transactions are recorded as realized gains or losses on forward foreign currency contract transactions. The Fund could be exposed to risks if the counterparties to the contracts are unable to meet the terms of their contracts or if the value of the foreign currency changes unfavorably. The Fund’s maximum risk of loss from counterparty credit risk is the unrealized gains on the contracts. This risk may be mitigated if there is a master netting arrangement between the Fund and the counterparty.
Security transactions and income recognition
Securities transactions are recorded on a trade date basis. Realized gains or losses are recorded on the basis of identified cost.
Dividend income is recognized on the ex-dividend date, except for certain dividends from foreign securities, which are recorded as soon as the custodian verifies the ex-dividend date. Dividend income from foreign securities is recorded net of foreign taxes withheld where recovery of such taxes is not assured.
Distributions to shareholders
Distributions to shareholders from net investment income and net realized gains, if any, are recorded on the ex-dividend date. Such distributions are determined in conformity with federal income tax regulations, which may differ in amount or character from net investment income and realized gains recognized for purposes of U.S. generally accepted accounting principles.
Federal and other taxes
The Fund intends to continue to qualify as a regulated investment company by distributing substantially all of its investment company taxable income and any net realized capital gains (after reduction for capital loss carryforwards) sufficient to relieve it from all, or substantially all, federal income taxes. Accordingly, no provision for federal income taxes was required.
The Fund’s income and federal excise tax returns and all financial records supporting those returns for the prior three fiscal years are subject to examination by the federal and Delaware revenue authorities. Management has analyzed the Fund’s tax positions taken on federal, state, and foreign tax returns for all open tax years and does not believe that there are any uncertain tax positions that require recognition of a tax liability.
Reclassifications are made to the Fund’s capital accounts for permanent tax differences to reflect income and gains available for distribution (or available capital loss carryforwards) under federal income tax regulations. U.S. generally accepted accounting principles require that certain components of net assets be adjusted to reflect permanent differences between financial and tax reporting. These reclassifications have no effect on net assets or net asset values
| | | | |
| 24 | | Wells Fargo Emerging Markets Equity Income Fund | | Notes to financial statements |
per share. The primary permanent difference causing such reclassifications is due to foreign currency transactions. At October 31, 2015, as a result of permanent book-to-tax differences, the following reclassification adjustments were made on the Statement of Assets and Liabilities:
| | |
Undistributed
net investment
income | | Accumulated net
realized losses
on investments |
| $(181,462) | | $181,462 |
As of October 31, 2015, the Fund had capital loss carryforwards which consist of $5,052,990, in short-term capital losses and $1,973,419 in long-term capital losses.
Class allocations
The separate classes of shares offered by the Fund differ principally in applicable sales charges, distribution, shareholder servicing, and administration fees. Class specific expenses are charged directly to that share class. Investment income, common expenses, and realized and unrealized gains (losses) on investments are allocated daily to each class of shares based on the relative proportion of net assets of each class.
3. FAIR VALUATION MEASUREMENTS
Fair value measurements of investments are determined within a framework that has established a fair value hierarchy based upon the various data inputs utilized in determining the value of the Fund’s investments. The three-level hierarchy gives the highest priority to unadjusted quoted prices in active markets for identical assets or liabilities (Level 1) and the lowest priority to significant unobservable inputs (Level 3). The Fund’s investments are classified within the fair value hierarchy based on the lowest level of input that is significant to the fair value measurement. The inputs are summarized into three broad levels as follows:
| n | | Level 1 – quoted prices in active markets for identical securities |
| n | | Level 2 – other significant observable inputs (including quoted prices for similar securities, interest rates, prepayment speeds, credit risk, use of amortized cost, etc.) |
| n | | Level 3 – significant unobservable inputs (including the Fund’s own assumptions in determining the fair value of investments) |
The inputs or methodologies used for valuing investments in securities are not necessarily an indication of the risk associated with investing in those securities.
| | | | | | |
| Notes to financial statements | | Wells Fargo Emerging Markets Equity Income Fund | | | 25 | |
The following is a summary of the inputs used in valuing the Fund’s assets and liabilities as of October 31, 2015:
| | | | | | | | | | | | | | | | |
| | | Quoted prices
(Level 1) | | | Other significant
observable inputs
(Level 2) | | | Significant
unobservable inputs
(Level 3) | | | Total | |
Assets | | | | | | | | | | | | | | | | |
Investments in: | | | | | | | | | | | | | | | | |
| | | | |
Common stocks | | | | | | | | | | | | | | | | |
Brazil | | $ | 0 | | | $ | 6,358,198 | | | $ | 0 | | | $ | 6,358,198 | |
Cayman Islands | | | 0 | | | | 2,089,306 | | | | 0 | | | | 2,089,306 | |
Chile | | | 2,228,193 | | | | 0 | | | | 0 | | | | 2,228,193 | |
China | | | 0 | | | | 29,437,532 | | | | 0 | | | | 29,437,532 | |
Czech Republic | | | 0 | | | | 3,153,535 | | | | 0 | | | | 3,153,535 | |
Hong Kong | | | 0 | | | | 10,224,194 | | | | 3,513,081 | | | | 13,737,275 | |
Indonesia | | | 0 | | | | 9,480,230 | | | | 0 | | | | 9,480,230 | |
Malaysia | | | 0 | | | | 4,261,040 | | | | 0 | | | | 4,261,040 | |
Mexico | | | 18,249,263 | | | | 0 | | | | 0 | | | | 18,249,263 | |
Panama | | | 4,084,603 | | | | 0 | | | | 0 | | | | 4,084,603 | |
Philippines | | | 0 | | | | 2,782,899 | | | | 0 | | | | 2,782,899 | |
Poland | | | 0 | | | | 2,371,349 | | | | 0 | | | | 2,371,349 | |
Qatar | | | 0 | | | | 1,760,607 | | | | 0 | | | | 1,760,607 | |
Russia | | | 0 | | | | 3,365,754 | | | | 0 | | | | 3,365,754 | |
Singapore | | | 269,541 | | | | 10,557,815 | | | | 0 | | | | 10,827,356 | |
South Africa | | | 2,158,146 | | | | 8,886,556 | | | | 0 | | | | 11,044,702 | |
South Korea | | | 9,090,748 | | | | 9,391,353 | | | | 0 | | | | 18,482,101 | |
Taiwan | | | 1,553,142 | | | | 24,787,140 | | | | 0 | | | | 26,340,282 | |
Thailand | | | 1,226,752 | | | | 1,011,265 | | | | 0 | | | | 2,238,017 | |
Turkey | | | 0 | | | | 3,083,963 | | | | 0 | | | | 3,083,963 | |
| | | | |
Participation notes | | | | | | | | | | | | | | | | |
China | | | 0 | | | | 4,102,722 | | | | 0 | | | | 4,102,722 | |
India | | | 0 | | | | 14,513,622 | | | | 0 | | | | 14,513,622 | |
| | | | |
Exchange-traded funds | | | | | | | | | | | | | | | | |
United States | | | 3,204,878 | | | | 0 | | | | 0 | | | | 3,204,878 | |
| | | | |
Short-term investments | | | | | | | | | | | | | | | | |
Investment companies | | | 10,906,979 | | | | 0 | | | | 0 | | | | 10,906,979 | |
Total assets | | $ | 52,972,245 | | | $ | 151,619,080 | | | $ | 3,513,081 | | | $ | 208,104,406 | |
The Fund recognizes transfers between levels within the fair value hierarchy at the end of the reporting period. At October 31, 2015, fair value pricing was used in pricing certain foreign securities and securities valued at $62,239,267 were transferred from Level 1 to Level 2.
The following is a reconciliation of assets in which significant unobservable inputs (Level 3) were used in determining fair value:
| | | | |
| | | Common stocks | |
Balance as of October 31, 2014 | | $ | 0 | |
Accrued discounts (premiums) | | | 0 | |
Realized gains (losses) | | | 0 | |
Change in unrealized gains (losses) | | | 0 | |
Purchases | | | 0 | |
Sales | | | 0 | |
Transfers into Level 3 | | | 3,513,081 | |
Transfers out of Level 3 | | | 0 | |
Balance as of October 31, 2015 | | $ | 3,513,081 | |
Change in unrealized gains (losses) relating to securities still held at October 31, 2015 | | $ | 0 | |
Due to lack of market activity, the investment type categorized above was valued using the last observed traded price.
| | | | |
| 26 | | Wells Fargo Emerging Markets Equity Income Fund | | Notes to financial statements |
4. TRANSACTIONS WITH AFFILIATES
Management fee
Funds Management, an indirect wholly owned subsidiary of Wells Fargo & Company (“Wells Fargo”), is the manager of the Fund and provides advisory and fund-level administrative services under an investment management agreement. Under the investment management agreement, Funds Management is responsible for, among other services, implementing the investment objectives and strategies of the Fund, supervising the applicable subadviser, providing fund-level administrative services in connection with the Fund’s operations, and providing any other fund-level administrative services reasonably necessary for the operation of the Fund. As compensation for its services under the investment management agreement, Funds Management is entitled to receive an annual management fee starting at 1.15% and declining to 0.955% as the average daily net assets of the Fund increase.
Prior to July 1, 2015, Funds Management provided advisory services pursuant to an investment advisory agreement and was entitled to receive an annual fee which started at 1.10% and declined to 0.925% as the average daily net assets of the Fund increased. From November 1, 2014 through February 28, 2015, Funds Management received an annual advisory fee which started at 1.10% and declined to 0.95% as the average daily net assets of the Fund increased. In addition, prior to July 1, 2015, fund-level administrative services were provided by Funds Management under a separate administration agreement at an annual fee which started at 0.05% and declined to 0.03% as the average daily net assets of the Fund increased. For financial statement purposes, the advisory fee and fund-level administration fee for the year ended October 31, 2015 have been included in management fee on the Statement of Operations.
For the year ended October 31, 2015, the management fee was equivalent to an annual rate of 1.15% of the Fund’s average daily net assets.
Funds Management has retained the services of a subadviser to provide daily portfolio management to the Fund. The fee for subadvisory services is borne by Funds Management. WellsCap, an affiliate of Funds Management and an indirect wholly owned subsidiary of Wells Fargo, is the subadviser to the Fund and is entitled to receive a fee from Funds Management at an annual rate starting at 0.65% and declining to 0.45% as the average daily net assets of the Fund increase.
Administration fees
Under a class-level administration agreement, Funds Management provides class-level administrative services to the Fund, which includes paying fees and expenses for services provided by the transfer agent, sub-transfer agents, omnibus account servicers and record-keepers. As compensation for its services under the class-level administration agreement, Funds Management receives an annual fee which is calculated based on the average daily net assets of each class as follows:
| | | | | | | | |
| | | Class-level administration fee | |
| | | Current rate | | | Rate prior to
July 1, 2015 | |
Class A, Class C | | | 0.21 | % | | | 0.26 | % |
Class R | | | 0.21 | | | | N/A | |
Class R6 | | | 0.03 | | | | N/A | |
Administrator Class | | | 0.13 | | | | 0.10 | |
Institutional Class | | | 0.13 | | | | 0.08 | |
| | | | | | |
| Notes to financial statements | | Wells Fargo Emerging Markets Equity Income Fund | | | 27 | |
Funds Management has contractually waived and/or reimbursed management and administration fees to the extent necessary to maintain certain net operating expense ratios for the Fund. Waiver of fees and/or reimbursement of expenses by Funds Management were made first from fund level expenses on a proportionate basis and then from class specific expenses. Funds Management has committed to waive fees and/or reimburse expenses to the extent necessary to cap expenses as follows:
| | | | | | | | |
| | | Expense
ratio cap | | | Expiration date | |
Class A | | | 1.65% | | | | February 29, 2016 | |
Class C | | | 2.40% | | | | February 29, 2016 | |
Class R | | | 1.90% | | | | February 28, 2017 | |
Class R6 | | | 1.20% | | | | February 28, 2017 | |
Administrator Class | | | 1.45% | | | | February 29, 2016 | |
Institutional Class | | | 1.25% | | | | February 29, 2016 | |
Distribution fees
The Trust has adopted a distribution plan for Class C and Class R shares of the Fund pursuant to Rule 12b-1 under the 1940 Act. Distribution fees are charged to Class C and Class R shares and paid to Wells Fargo Funds Distributor, LLC (“Funds Distributor”), the principal underwriter, at an annual rate of 0.75% of the average daily net assets of Class C shares and 0.25% of the average daily net assets of Class R shares.
In addition, Funds Distributor is entitled to receive the front-end sales charge from the purchase of Class A shares and a contingent deferred sales charge on the redemption of certain Class A shares. Funds Distributor is also entitled to receive the contingent deferred sales charges from redemptions of Class C shares. For the year ended October 31, 2015, Funds Distributor received $21,718 from the sale of Class A shares and $40 in contingent deferred sales charges from redemptions of Class C shares.
Shareholder servicing fees
The Trust has entered into contracts with one or more shareholder servicing agents, whereby Class A, Class C, Class R, and Administrator Class of the Fund is charged a fee at an annual rate of 0.25% of the average daily net assets of each respective class.
A portion of these total shareholder servicing fees were paid to affiliates of Wells Fargo.
5. INVESTMENT PORTFOLIO TRANSACTIONS
Purchases and sales of investments, excluding U.S. government obligations (if any) and short-term securities, for the year ended October 31, 2015 were $223,072,064 and $106,288,124, respectively.
6. DERIVATIVE TRANSACTIONS
During the year ended October 31, 2015, the Fund entered into forward foreign currency contracts for economic hedging purposes. As of October 31, 2015, the Fund did not have any open forward foreign currency contracts. The Fund had average contract amounts of $159,270 and $90,940 in forward foreign currency contracts to buy and forward foreign currency contracts to sell, respectively, during the year ended October 31, 2015.
The fair value, realized gains or losses and change in unrealized gains or losses, if any, on derivative instruments are reflected in the appropriate financial statements.
7. BANK BORROWINGS
The Trust (excluding the money market funds) and Wells Fargo Variable Trust are parties to a $200,000,000 revolving credit agreement whereby the Fund is permitted to use bank borrowings for temporary or emergency purposes, such as to fund shareholder redemption requests. Interest under the credit agreement is charged to the Fund based on a borrowing rate equal to the higher of the Federal Funds rate in effect on that day plus 1.25% or the overnight LIBOR rate in effect on that day plus 1.25%. In addition, an annual commitment fee equal to 0.20% of the unused balance is allocated to each participating fund. Prior to September 1, 2015, the revolving credit agreement amount was $150,000,000 and the annual commitment fee was equal to 0.10% of the unused balance which was allocated to each participating fund. For the year ended October 31, 2015, the Fund paid $276 in commitment fees.
During the year ended October 31, 2015, the Fund had average borrowings outstanding of $107,445 (on an annualized basis) at an average rate of 1.37% and paid interest in the amount of $1,472.
| | | | |
| 28 | | Wells Fargo Emerging Markets Equity Income Fund | | Notes to financial statements |
8. DISTRIBUTIONS TO SHAREHOLDERS
The tax character of distributions paid during the years ended October 31, 2015 and October 31, 2014 were as follows:
| | | | | | | | |
| | | Year ended October 31 | |
| | | 2015 | | | 2014 | |
Ordinary income | | $ | 3,081,297 | | | $ | 2,947,712 | |
Long-term capital gain | | | 0 | | | | 264,940 | |
As of October 31, 2015, the components of distributable earnings on a tax basis were as follows:
| | | | |
Undistributed
ordinary income | | Unrealized losses | | Capital loss
carryforward |
| $129,503 | | $(11,141,048) | | $(7,026,409) |
9. CONCENTRATION RISK
Concentration risks result from exposure to a limited number of sectors. A fund that invests a substantial portion of its assets in any sector may be more affected by changes in that sector than would be a fund whose investments are not heavily weighted in any sector.
10. INDEMNIFICATION
Under the Trust’s organizational documents, the officers and Trustees have been granted certain indemnification rights against certain liabilities that may arise out of performance of their duties to the Trust. Additionally, in the normal course of business, the Trust may enter into contracts with service providers that contain a variety of indemnification clauses. The Trust’s maximum exposure under these arrangements is dependent on future claims that may be made against the Fund and, therefore, cannot be estimated.
11. SUBSEQUENT DISTRIBUTIONS
On November 23, 2015, the Fund declared distributions from net investment income to shareholders of record on November 20, 2015. The per share amounts payable on November 24, 2015 were as follows:
| | | | |
Class A | | $ | 0.00512 | |
Class C | | | 0.00269 | |
Class R | | | 0.00273 | |
Class R6 | | | 0.00666 | |
Administrator Class | | | 0.00535 | |
Institutional Class | | | 0.00630 | |
These distributions are not reflected in the accompanying financial statements. The final determination of the source of all distributions is subject to change and made after the Fund’s tax year-end.
| | | | | | |
| Report of independent registered public accounting firm | | Wells Fargo Emerging Markets Equity Income Fund | | | 29 | |
BOARD OF TRUSTEES AND SHAREHOLDERS OF WELLS FARGO FUNDS TRUST:
We have audited the accompanying statement of assets and liabilities, including the portfolio of investments, of the Wells Fargo Emerging Markets Equity Income Fund (the “Fund”), one of the funds constituting the Wells Fargo Funds Trust, as of October 31, 2015, and the related statement of operations for the year then ended, the statements of changes in net assets for each of the years in the two-year period then ended, and the financial highlights for each of the years or periods in the three-year period then ended and the period from May 31, 2012 (commencement of operations) to October 31, 2012. These financial statements and financial highlights are the responsibility of the Fund’s management. Our responsibility is to express an opinion on these financial statements and financial highlights based on our audits.
We conducted our audits in accordance with the standards of the Public Company Accounting Oversight Board (United States). Those standards require that we plan and perform the audit to obtain reasonable assurance about whether the financial statements and financial highlights are free of material misstatement. An audit includes examining, on a test basis, evidence supporting the amounts and disclosures in the financial statements. Our procedures included confirmation of securities owned as of October 31, 2015, by correspondence with the custodian and brokers, or by other appropriate auditing procedures. An audit also includes assessing the accounting principles used and significant estimates made by management, as well as evaluating the overall financial statement presentation. We believe that our audits provide a reasonable basis for our opinion.
In our opinion, the financial statements and financial highlights referred to above present fairly, in all material respects, the financial position of the Wells Fargo Emerging Markets Equity Income Fund as of October 31, 2015, the results of its operations for the year then ended, the changes in its net assets for each of the years in the two-year period then ended, and the financial highlights for each of the years or periods in the three-year period then ended and the period from May 31, 2012 (commencement of operations) to October 31, 2012, in conformity with U.S. generally accepted accounting principles.

Boston, Massachusetts
December 22, 2015
| | | | |
| 30 | | Wells Fargo Emerging Markets Equity Income Fund | | Other information (unaudited) |
TAX INFORMATION
Pursuant to Section 854 of the Internal Revenue Code, $2,975,778 of income dividends paid during the fiscal year ended October 31, 2015 has been designated as qualified dividend income (QDI).
Pursuant to Section 853 of the Internal Revenue Code, the Fund expects to designate amounts as foreign taxes paid for the fiscal year ended October 31, 2015. Additional details will be available in the semiannual report.
PROXY VOTING INFORMATION
A description of the policies and procedures that the Fund uses to determine how to vote proxies relating to portfolio securities is available, upon request, by calling 1-800-222-8222, visiting our website at wellsfargofunds.com, or visiting the SEC website at sec.gov. Information regarding how the Fund voted proxies relating to portfolio securities during the most recent 12-month period ended June 30 is available on the Fund’s website at wellsfargofunds.com or by visiting the SEC website at sec.gov.
PORTFOLIO HOLDINGS INFORMATION
The complete portfolio holdings for the Fund are publicly available monthly on the Fund’s website (wellsfargofunds.com), on a one-month delayed basis. In addition, top ten holdings information (excluding derivative positions) for the Fund is publicly available on the Fund’s website on a monthly, seven-day or more delayed basis. The Fund files its complete schedule of portfolio holdings with the SEC for the first and third quarters of each fiscal year on Form N-Q, which is available by visiting the SEC website at sec.gov. In addition, the Fund’s Form N-Q may be reviewed and copied at the SEC’s Public Reference Room in Washington, DC, and at regional offices in New York City, at 233 Broadway, and in Chicago, at 175 West Jackson Boulevard, Suite 900. Information about the Public Reference Room may be obtained by calling 1-800-SEC-0330.
| | | | | | |
| Other information (unaudited) | | Wells Fargo Emerging Markets Equity Income Fund | | | 31 | |
BOARD OF TRUSTEES AND OFFICERS
Each of the Trustees and Officers1 listed in the table below acts in identical capacities for each fund in the Wells Fargo family of funds, which consists of 144 mutual funds comprising the Wells Fargo Funds Trust, Wells Fargo Variable Trust, Wells Fargo Master Trust and four closed-end funds (collectively the “Fund Complex”). This table should be read in conjunction with the Prospectus and the Statement of Additional Information2. The mailing address of each Trustee and Officer is 525 Market Street, 12th Floor, San Francisco, CA 94105. Each Trustee and Officer serves an indefinite term, however, each Trustee serves such term until reaching the mandatory retirement age established by the Trustees.
Independent Trustees
| | | | | | |
Name and
year of birth | | Position held and
length of service* | | Principal occupations during past five years or longer | | Other
public company or
investment company
directorships during
past 5 years |
William R. Ebsworth
(Born 1957) | | Trustee, since 2015** | | Retired. From 1984 to 2013, equities analyst, portfolio manager, research director at Fidelity Management and Research Company in Boston, Tokyo, and Hong Kong, and retired in 2013 as Chief Investment Officer of Fidelity Strategic Advisers, Inc. where he led a team of investment professionals managing client assets. Prior thereto, Board member of Hong Kong Securities Clearing Co., Hong Kong Options Clearing Corp., the Thailand International Fund, Ltd., Fidelity Investments Life Insurance Company, and Empire Fidelity Investments Life Insurance Company. Mr. Ebsworth is a CFA® charterholder and an Adjunct Lecturer, Finance, at Babson College. | | Asset Allocation Trust |
Jane A. Freeman
(Born 1953) | | Trustee, since 2015** | | Retired. From 2012 to 2014 and 1999 to 2008, Chief Financial Officer of Scientific Learning Corporation. From 2008 to 2012, Ms. Freeman provided consulting services related to strategic business projects. Prior to 1999, Portfolio Manager at Rockefeller & Co. and Scudder, Stevens & Clark. Board member of the Harding Loevner Funds from 1996 to 2014, serving as both Lead Independent Director and chair of the Audit Committee. Board member of the Russell Exchange Traded Funds Trust from 2011 to 2012 and the chair of the Audit Committee. Ms. Freeman is Chair of Taproot Foundation (non-profit organization), a Board Member of Ruth Bancroft Garden (non-profit organization) and an inactive chartered financial analyst. | | Asset Allocation Trust; Harding Loevner Funds; Russell Exchange Traded Funds Trust |
Peter G. Gordon
(Born 1942) | | Trustee, since 1998; Chairman, since 2005 | | Co-Founder, Retired Chairman, President and CEO of Crystal Geyser Water Company. Trustee Emeritus, Colby College. | | Asset Allocation Trust |
Isaiah Harris, Jr.
(Born 1952) | | Trustee, since 2009 | | Retired. Chairman of the Board of CIGNA Corporation since 2009, and Director since 2005. From 2003 to 2011, Director of Deluxe Corporation. Prior thereto, President and CEO of BellSouth Advertising and Publishing Corp. from 2005 to 2007, President and CEO of BellSouth Enterprises from 2004 to 2005 and President of BellSouth Consumer Services from 2000 to 2003. Emeritus member of the Iowa State University Foundation Board of Governors. Emeritus Member of the Advisory Board of Iowa State University School of Business. Advisory Board Member, Palm Harbor Academy (charter school). Mr. Harris is a certified public accountant. | | CIGNA Corporation; Asset Allocation Trust |
Judith M. Johnson
(Born 1949) | | Trustee, since 2008;
Audit Committee Chairman, since 2008 | | Retired. Prior thereto, Chief Executive Officer and Chief Investment Officer of Minneapolis Employees Retirement Fund from 1996 to 2008. Ms. Johnson is an attorney, certified public accountant and a certified managerial accountant. | | Asset Allocation Trust |
David F. Larcker
(Born 1950) | | Trustee, since 2009 | | James Irvin Miller Professor of Accounting at the Graduate School of Business, Stanford University, Morgan Stanley Director of the Center for Leadership Development and Research and Senior Faculty of The Rock Center for Corporate Governance since 2006. From 2005 to 2008, Professor of Accounting at the Graduate School of Business, Stanford University. Prior thereto, Ernst & Young Professor of Accounting at The Wharton School, University of Pennsylvania from 1985 to 2005. | | Asset Allocation Trust |
| | | | |
| 32 | | Wells Fargo Emerging Markets Equity Income Fund | | Other information (unaudited) |
| | | | | | |
Name and
year of birth | | Position held and
length of service* | | Principal occupations during past five years or longer | | Other
public company or
investment company
directorships during
past 5 years |
Olivia S. Mitchell
(Born 1953) | | Trustee, since 2006 | | International Foundation of Employee Benefit Plans Professor, Wharton School of the University of Pennsylvania since 1993. Director of Wharton’s Pension Research Council and Boettner Center on Pensions & Retirement Research, and Research Associate at the National Bureau of Economic Research. Previously, Cornell University Professor from 1978 to 1993. | | Asset Allocation Trust |
Timothy J. Penny
(Born 1951) | | Trustee, since 1996 | | President and Chief Executive Officer of Southern Minnesota Initiative Foundation, a non-profit organization, since 2007 and Senior Fellow at the Humphrey Institute Policy Forum at the University of Minnesota since 1995. Member of the Board of Trustees of NorthStar Education Finance, Inc., a non-profit organization, since 2007. | | Asset Allocation Trust |
Michael S. Scofield
(Born 1943) | | Trustee, since 2010 | | Served on the Investment Company Institute’s Board of Governors and Executive Committee from 2008-2011 as well the Governing Council of the Independent Directors Council from 2006-2011 and the Independent Directors Council Executive Committee from 2008-2011. Chairman of the IDC from 2008-2010. Institutional Investor (Fund Directions) Trustee of Year in 2007. Trustee of the Evergreen Funds complex (and its predecessors) from 1984 to 2010. Chairman of the Evergreen Funds from 2000-2010. Former Trustee of the Mentor Funds. Retired Attorney, Law Offices of Michael S. Scofield. | | Asset Allocation Trust |
Donald C. Willeke
(Born 1940) | | Trustee, since 1996*** | | Principal of the law firm of Willeke & Daniels. General Counsel of the Minneapolis Employees Retirement Fund from 1984 until its consolidation into the Minnesota Public Employees Retirement Association on June 30, 2010. Director and Vice Chair of The Tree Trust (non-profit corporation). Director of the American Chestnut Foundation (non-profit corporation). | | Asset Allocation Trust |
| * | Length of service dates reflect the Trustee’s commencement of service with the Trust’s predecessor entities, where applicable. |
| ** | William R. Ebsworth and Jane A. Freeman each became a Trustee effective January 1, 2015. |
| *** | Donald Willeke will retire as a Trustee effective December 31, 2015. |
Officers
| | | | | | |
Name and
year of birth | | Position held and
length of service | | Principal occupations during past five years or longer | | |
Karla M. Rabusch
(Born 1959) | | President, since 2003 | | Executive Vice President of Wells Fargo Bank, N.A. and President of Wells Fargo Funds Management, LLC since 2003. | | |
Jeremy DePalma1
(Born 1974) | | Treasurer, since 2012 | | Senior Vice President of Wells Fargo Funds Management, LLC since 2009. Senior Vice President of Evergreen Investment Management Company, LLC from 2008 to 2010 and head of the Fund Reporting and Control Team within Fund Administration from 2005 to 2010. | | |
C. David Messman
(Born 1960) | | Secretary, since 2000; Chief Legal Officer, since 2003 | | Senior Vice President and Secretary of Wells Fargo Funds Management, LLC since 2001. Assistant General Counsel of Wells Fargo Bank, N.A. since 2013 and Vice President and Managing Counsel of Wells Fargo Bank N.A. from 1996 to 2013. | | |
Debra Ann Early
(Born 1964) | | Chief Compliance Officer, since 2007 | | Executive Vice President of Wells Fargo Funds Management, LLC since 2014, Senior Vice President and Chief Compliance Officer from 2007 to 2014. | | |
David Berardi
(Born 1975) | | Assistant Treasurer, since 2009 | | Vice President of Wells Fargo Funds Management, LLC since 2009. Vice President of Evergreen Investment Management Company, LLC from 2008 to 2010. Manager of Fund Reporting and Control for Evergreen Investment Management Company, LLC from 2004 to 2010. | | |
| 1 | Jeremy DePalma acts as Treasurer of 72 funds and Assistant Treasurer of 72 funds in the Fund Complex. |
| 2 | The Statement of Additional Information includes additional information about the Trustees and is available, without charge, upon request, by calling 1-800-222-8222 or by visiting the website at wellsfargofunds.com. |
| | | | | | |
| Other information (unaudited) | | Wells Fargo Emerging Markets Equity Income Fund | | | 33 | |
BOARD CONSIDERATION OF INVESTMENT ADVISORY, INVESTMENT MANAGEMENT AND SUB-ADVISORY AGREEMENTS:
Under the Investment Company Act of 1940 (the “1940 Act”), the Board of Trustees (the “Board”) of Wells Fargo Funds Trust (the “Trust”) must determine annually whether to approve the continuation of the Trust’s investment advisory and sub-advisory agreements. In this regard, at an in-person meeting held on May 19-20, 2015 (the “Meeting”), the Board, all the members of which have no direct or indirect interest in the investment advisory and sub-advisory agreements and are not “interested persons” of the Trust, as defined in the 1940 Act (the “Independent Trustees”), reviewed and approved for Wells Fargo Advantage Emerging Markets Equity Income Fund (the “Fund”): (i) an investment advisory agreement (the “Advisory Agreement”) with Wells Fargo Funds Management, LLC (“Funds Management”); (ii) an investment management agreement (the “Management Agreement”) with Funds Management; and (iii) an investment sub-advisory agreement (the “Sub-Advisory Agreement”) with Wells Capital Management Incorporated (the “Sub-Adviser”), an affiliate of Funds Management. The Management Agreement combines the terms of the Advisory Agreement with the terms of the Fund’s Amended and Restated Administration Agreement (the “Administration Agreement”) applicable to Fund-level administrative services. The Advisory Agreement, the Management Agreement and the Sub-Advisory Agreement are collectively referred to as the “Advisory Agreements.”
At the Meeting, the Board considered the factors and reached the conclusions described below relating to the selection of Funds Management and the Sub-Adviser and the approval of the Advisory Agreements. Prior to the Meeting, including at an in-person meeting in March 2015, the Trustees conferred extensively among themselves and with representatives of Funds Management about these matters. Also, the Board has adopted a team-based approach, with each team consisting of a sub-set of Trustees, to assist the full Board in the discharge of its duties in reviewing performance and other matters throughout the year. The Independent Trustees were assisted in their evaluation of the Advisory Agreements by independent legal counsel, from whom they received separate legal advice and with whom they met separately.
In providing information to the Board, Funds Management and the Sub-Adviser were guided by a detailed set of requests for information submitted to them by independent legal counsel on behalf of the Independent Trustees at the start of the Board’s annual contract renewal process earlier in 2015. In considering and approving the Advisory Agreements, the Trustees considered the information they believed relevant, including but not limited to the information discussed below. The Board considered not only the specific information presented in connection with the Meeting, but also the knowledge gained over time through interaction with Funds Management and the Sub-Adviser about various topics. In this regard, the Board reviewed reports of Funds Management at each of its quarterly meetings, which included, among other things, portfolio reviews and performance reports. In addition, the Board and the teams mentioned above confer with portfolio managers at various times throughout the year. The Board did not identify any particular information or consideration that was all-important or controlling, and each individual Trustee may have attributed different weights to various factors.
After its deliberations, the Board unanimously approved the continuation of the Advisory Agreement for the period from June 1, 2015 through June 30, 2015, approved the Management Agreement for the period from July 1, 2015 through May 31, 2016, and approved the continuation of the Sub-Advisory Agreement for a one-year term through May 31, 2016. The Board also determined that the compensation payable to Funds Management and the Sub-Adviser under each of the Advisory Agreements was reasonable. The Board considered the approval of the Advisory Agreements for the Fund as part of its consideration of agreements for funds across the complex, but its approvals were made on a fund-by-fund basis. The following summarizes a number of important, but not necessarily all, factors considered by the Board in support of its approvals.
Nature, extent and quality of services
The Board received and considered various information regarding the nature, extent and quality of services provided to the Fund by Funds Management and the Sub-Adviser under the Advisory Agreements. This information included, among other things, a summary of the background and experience of senior management of Funds Management, and the qualifications, background, tenure and responsibilities of each of the portfolio managers primarily responsible for the day-to-day portfolio management of the Fund. The Board noted that the services to be provided to the Fund pursuant to the Management Agreement combined the advisory services previously provided to the Fund pursuant to the Fund’s Advisory Agreement with the Fund-level administrative services previously provided to the Fund pursuant to the Fund’s Administration Agreement. The Board received a representation from Funds Management that combining these services would not result in any change to the nature or level of services provided by Funds Management to the Fund.
The Board evaluated the ability of Funds Management and the Sub-Adviser to attract and retain qualified investment professionals, including research, advisory and supervisory personnel. The Board further considered the compliance
| | | | |
| 34 | | Wells Fargo Emerging Markets Equity Income Fund | | Other information (unaudited) |
programs and compliance records of Funds Management and the Sub-Adviser. In addition, the Board took into account the full range of services provided to the Fund by Funds Management and its affiliates.
Fund performance and expenses
The Board considered the performance results for the Fund over various time periods ended March 31, 2015. The Board considered these results in comparison to the performance of funds in a universe that was determined by Lipper Inc. (“Lipper”) to be similar to the Fund (the “Universe”), and in comparison to the Fund’s benchmark index and to other comparative data. Lipper is an independent provider of investment company data. The Board received a description of the methodology used by Lipper to select the mutual funds in the performance Universe. The Board noted that the performance of the Fund (Administrator Class) was higher than the average performance of the Universe for all periods under review except the first quarter of 2015. The Board also noted that the performance of the Fund was higher than its benchmark, the MSCI Emerging Markets Index (Net), for all periods under review except the first quarter of 2015.
The Board also received and considered information regarding the Fund’s net operating expense ratios and their various components, including actual management fees (which reflect fee waivers, if any, and include advisory, administration and transfer agent fees), custodian and other non-management fees, and Rule 12b-1 and non-Rule 12b-1 service fees. The Board considered these ratios in comparison to the median ratios of funds in class-specific expense groups that were determined by Lipper to be similar to the Fund (the “Groups”). The Board received a description of the methodology used by Lipper to select the mutual funds in the expense Groups and an explanation of how funds comprising expense groups and their expense ratios may vary from year-to-year. Based on the Lipper reports, the Board noted that the net operating expense ratios of the Fund were lower than or in range of the median net operating expense ratios of the expense Groups for all share classes.
The Board took into account the Fund performance and expense information provided to it among the factors considered in deciding to re-approve the Advisory Agreement and Sub-Advisory Agreement and approve the Management Agreement.
Investment advisory and sub-advisory fee rates
The Board reviewed and considered the contractual investment advisory fee rates that are payable by the Fund to Funds Management for investment advisory services (the “Advisory Agreement Rates”), both on a stand-alone basis and on a combined basis with the Fund’s fund-level and class-level contractual administration fee rates (the “Management Rates”). The Board noted that the Management Rates include transfer agency and sub-transfer agency costs. The Board also noted that the fee rate to be paid by the Fund under the Management Agreement will incorporate the advisory fee and Fund-level administration fee previously payable separately by the Fund under the Fund’s Advisory Agreement and Administration Agreement with Funds Management. The Board also reviewed and considered the contractual investment sub-advisory fee rates that are payable by Funds Management to the Sub-Adviser for investment sub-advisory services (the “Sub-Advisory Agreement Rates”).
Among other information reviewed by the Board was a comparison of the Management Rates of the Fund with those of other funds in the expense Groups at a common asset level. The Board noted that the Management Rates of the Fund were higher than the average rates for the Fund’s expense Groups for all share classes. However, the Board also noted that the net operating expense ratios of the Fund were lower than or in range of the median net operating expense ratios of the expense Groups for all share classes.
The Board also received and considered information about the portion of the total advisory fee that was retained by Funds Management after payment of the fee to the Sub-Adviser for sub-advisory services. In assessing the reasonableness of this amount, the Board received and evaluated information about the nature and extent of responsibilities retained and risks assumed by Funds Management and not delegated to or assumed by the Sub-Adviser, and about Funds Management’s on-going oversight services. However, given the affiliation between Funds Management and the Sub-Adviser, the Board ascribed limited relevance to the allocation of the advisory fee between them.
The Board also received and considered information about the nature and extent of services offered and fee rates charged by Funds Management and the Sub-Adviser to other types of clients with investment strategies similar to those of the Fund. In this regard, the Board received information about the significantly greater scope of services, and compliance, reporting and other legal burdens and risks of managing mutual funds compared with those associated with managing assets of non-mutual fund clients such as collective funds or institutional separate accounts.
| | | | | | |
| Other information (unaudited) | | Wells Fargo Emerging Markets Equity Income Fund | | | 35 | |
Based on its consideration of the factors and information it deemed relevant, including those described here, the Board determined that the compensation payable to Funds Management under the Management Agreement and Advisory Agreement and to the Sub-Adviser under the Sub-Advisory Agreement was reasonable, in light of the services covered by the Advisory Agreements.
Profitability
The Board received and considered information concerning the profitability of Funds Management, as well as the profitability of Wells Fargo as a whole, from providing services to the Fund and the fund family as a whole. The Board also received and considered information concerning the profitability of the Sub-Adviser from providing services to the fund family as a whole, noting that the Sub-Adviser’s profitability information with respect to providing services to the Fund was subsumed in the Wells Fargo profitability analysis.
Funds Management reported on the methodologies and estimates used in calculating profitability. Among other things, the Board noted that the levels of profitability reported on a fund-by-fund basis varied widely, depending on factors such as the size and type of fund. Based on its review, the Board did not deem the profits reported by Funds Management or Wells Fargo from its services to the Fund to be at a level that would prevent it from approving the continuation of the Advisory Agreements.
Economies of scale
With respect to possible economies of scale, the Board noted the existence of breakpoints in the Fund’s advisory and management fee structures, and the Fund’s administration fee structure, which operate generally to reduce the Fund’s expense ratios as the Fund grows in size. It considered that, for a small fund or a fund that shrinks in size, breakpoints conversely can result in higher fee levels. The Board also considered that fee waiver and expense reimbursement arrangements and competitive fee rates at the outset are means of sharing potential economies of scale with shareholders of the Fund and the fund family as a whole. The Board considered Funds Management’s view that any analyses of potential economies of scale in managing a particular fund are inherently limited in light of the joint and common costs and investments that Funds Management incurs across the fund family as a whole.
The Board concluded that the Fund’s fee and expense arrangements, including contractual breakpoints, constituted a reasonable approach to sharing potential economies of scale with the Fund and its shareholders.
Other benefits to Funds Management and the Sub-Adviser
The Board received and considered information regarding potential “fall-out” or ancillary benefits received by Funds Management and its affiliates, including the Sub-Adviser, as a result of their relationships with the Fund. Ancillary benefits could include, among others, benefits directly attributable to other relationships with the Fund and benefits potentially derived from an increase in Funds Management’s and the Sub-Adviser’s business as a result of their relationships with the Fund. The Board noted that various affiliates of Funds Management may receive distribution-related fees, shareholder servicing payments and sub-transfer agency fees in respect of shares sold or held through them and services provided.
The Board also reviewed information about soft dollar credits earned and utilized by the Sub-Adviser, fees earned by Funds Management and the Sub-Adviser from managing a private investment vehicle for the fund family’s securities lending collateral and commissions earned by an affiliated broker from portfolio transactions.
Based on its consideration of the factors and information it deemed relevant, including those described here, the Board did not find that any ancillary benefits received by Funds Management and its affiliates, including the Sub-Adviser, were unreasonable.
Conclusion
At the Meeting, after considering the above-described factors and based on its deliberations and its evaluation of the information described above, the Board unanimously approved the continuation of the Advisory Agreement for the period from June 1, 2015 through June 30, 2015, approved the Management Agreement for the period from July 1, 2015 through May 31, 2016, and approved the continuation of the Sub-Advisory Agreement for a one-year term through May 31, 2016. The Board also determined that the compensation payable to Funds Management and the Sub-Adviser under each of the Advisory Agreements was reasonable.
| | | | |
| 36 | | Wells Fargo Emerging Markets Equity Income Fund | | List of abbreviations |
The following is a list of common abbreviations for terms and entities that may have appeared in this report.
| ACA | — ACA Financial Guaranty Corporation |
| ADR | — American depositary receipt |
| ADS | — American depositary shares |
| AGC | — Assured Guaranty Corporation |
| AGM | — Assured Guaranty Municipal |
| Ambac | — Ambac Financial Group Incorporated |
| AMT | — Alternative minimum tax |
| BAN | — Bond anticipation notes |
| BHAC | — Berkshire Hathaway Assurance Corporation |
| CAB | — Capital appreciation bond |
| CCAB | — Convertible capital appreciation bond |
| CDA | — Community Development Authority |
| CDO | — Collateralized debt obligation |
| DRIVER | — Derivative inverse tax-exempt receipts |
| DW&P | — Department of Water & Power |
| DWR | — Department of Water Resources |
| ECFA | — Educational & Cultural Facilities Authority |
| EDA | — Economic Development Authority |
| EDFA | — Economic Development Finance Authority |
| ETF | — Exchange-traded fund |
| FDIC | — Federal Deposit Insurance Corporation |
| FFCB | — Federal Farm Credit Banks |
| FGIC | — Financial Guaranty Insurance Corporation |
| FHA | — Federal Housing Administration |
| FHLB | — Federal Home Loan Bank |
| FHLMC | — Federal Home Loan Mortgage Corporation |
| FICO | — The Financing Corporation |
| FNMA | — Federal National Mortgage Association |
| GDR | — Global depositary receipt |
| GNMA | — Government National Mortgage Association |
| HCFR | — Healthcare facilities revenue |
| HEFA | — Health & Educational Facilities Authority |
| HEFAR | — Higher education facilities authority revenue |
| HFA | — Housing Finance Authority |
| HFFA | — Health Facilities Financing Authority |
| HUD | — Department of Housing and Urban Development |
| IDA | — Industrial Development Authority |
| IDAG | — Industrial Development Agency |
| KRW | — Republic of Korea won |
| LIBOR | — London Interbank Offered Rate |
| LIFER | — Long Inverse Floating Exempt Receipts |
| LLC | — Limited liability company |
| LLLP | — Limited liability limited partnership |
| LLP | — Limited liability partnership |
| MBIA | — Municipal Bond Insurance Association |
| MFHR | — Multifamily housing revenue |
| MSTR | — Municipal securities trust receipts |
| MUD | — Municipal Utility District |
| National | — National Public Finance Guarantee Corporation |
| PCFA | — Pollution Control Financing Authority |
| PCL | — Public Company Limited |
| PCR | — Pollution control revenue |
| PFA | — Public Finance Authority |
| PFFA | — Public Facilities Financing Authority |
| PFOTER | — Puttable floating option tax-exempt receipts |
| plc | — Public limited company |
| PUTTER | — Puttable tax-exempt receipts |
| R&D | — Research & development |
| Radian | — Radian Asset Assurance |
| RAN | — Revenue anticipation notes |
| RDA | — Redevelopment Authority |
| RDFA | — Redevelopment Finance Authority |
| REIT | — Real estate investment trust |
| ROC | — Reset option certificates |
| SAVRS | — Select auction variable rate securities |
| SBA | — Small Business Authority |
| SDR | — Swedish depositary receipt |
| SFHR | — Single-family housing revenue |
| SFMR | — Single-family mortgage revenue |
| SPA | — Standby purchase agreement |
| SPDR | — Standard & Poor’s Depositary Receipts |
| SPEAR | — Short Puttable Exempt Adjustable Receipts |
| STRIPS | — Separate trading of registered interest and |
| TAN | — Tax anticipation notes |
| TIPS | — Treasury inflation-protected securities |
| TRAN | — Tax revenue anticipation notes |
| TTFA | — Transportation Trust Fund Authority |
| TVA | — Tennessee Valley Authority |

For more information
More information about Wells Fargo Funds is available free upon request. To obtain literature, please write, email, visit the Fund’s website, or call:
Wells Fargo Funds
P.O. Box 8266
Boston, MA 02266-8266
Email: wfaf@wellsfargo.com
Website: wellsfargofunds.com
Individual investors: 1-800-222-8222
Retail investment professionals: 1-888-877-9275
Institutional investment professionals: 1-866-765-0778
This report and the financial statements contained herein are submitted for the general information of the shareholders of Wells Fargo Funds. If this report is used for promotional purposes, distribution of the report must be accompanied or preceded by a current prospectus. Before investing, please consider the investment objectives, risks, charges, and expenses of the investment. For a current prospectus and, if available, a summary prospectus, containing this information, call 1-800-222-8222 or visit the Fund’s website at wellsfargofunds.com. Read the prospectus carefully before you invest or send money.
Wells Fargo Funds Management, LLC, a wholly owned subsidiary of Wells Fargo & Company, provides investment advisory and administrative services for Wells Fargo Funds. Other affiliates of Wells Fargo & Company provide subadvisory and other services for the Funds. The Funds are distributed by Wells Fargo Funds Distributor, LLC, Member FINRA, an affiliate of Wells Fargo & Company.
NOT FDIC INSURED ¡ NO BANK GUARANTEE ¡ MAY LOSE VALUE
© 2015 Wells Fargo Funds Management, LLC. All rights reserved.
| | |
 | | 238508 12-15 A262/AR262 10-15 |
Annual Report
October 31, 2015

Wells Fargo Global Opportunities Fund


Reduce clutter. Save trees.
Sign up for electronic delivery of prospectuses and shareholder reports at wellsfargo.com/advantagedelivery
Contents
The views expressed and any forward-looking statements are as of October 31, 2015, unless otherwise noted, and are those of the Fund managers and/or Wells Fargo Funds Management, LLC. Discussions of individual securities, or the markets generally, or any Wells Fargo Fund are not intended as individual recommendations. Future events or results may vary significantly from those expressed in any forward-looking statements. The views expressed are subject to change at any time in response to changing circumstances in the market. Wells Fargo Funds Management, LLC and the Fund disclaim any obligation to publicly update or revise any views expressed or forward-looking statements.
NOT FDIC INSURED ¡ NO BANK GUARANTEE ¡ MAY LOSE VALUE
| | | | |
| 2 | | Wells Fargo Global Opportunities Fund | | Letter to shareholders (unaudited) |

Karla M. Rabusch
President
Wells Fargo Funds
Signs of encouragement in the eurozone were more than offset by slowing economic growth in China.
The decline of oil and natural gas prices that began during the summer of 2014 continued into 2015.
Dear Valued Shareholder:
We are pleased to offer you this annual report for the Wells Fargo Global Opportunities Fund for the 12-month period that ended October 31, 2015. During the period, investors confronted concerns about slowing economic growth in China and a dramatic rise and fall in the country’s equity markets, diverging central bank policies globally, contentious negotiations to refinance Greece’s sovereign debt, low commodity prices, and ongoing currency volatility. These disparate influences tended to obscure improving economic data in the U.S. and several developed European countries.
Low commodity prices and slower global growth overshadowed improved economic data.
In Europe, the eurozone’s largest economies—France, Germany, Italy, and Spain—reported gross domestic product (GDP) growth on an annualized basis for the second quarter of 2015, although results were uneven for smaller, developing economies in the region. While annualized GDP growth slowed in the third quarter in the eurozone overall, it remained positive. Signs of encouragement in the eurozone were more than offset by slowing economic growth in China. China posted third-quarter GDP growth of 6.9%. While that pace might be envied by other developed economies, it is below levels many investors have come to expect from China. Furthermore, the government indicated the full-year growth target of 7% may not be met.
Stocks generally moved higher in April and early May 2015 before events served to discourage equity investors as summer advanced. The decline of oil and natural gas prices that began during the summer of 2014 continued into 2015. At the same time, the value of the U.S. dollar increased relative to other currencies, particularly those in emerging markets. Both conditions concerned investors. Sustained low oil, natural gas, and other commodity prices hampered economies in several emerging markets. Slowed commodity consumption among developed markets also suggested a deceleration of global growth.
Global central bank policies diverge.
After ending its quantitative easing-related bond-buying program toward the end of 2014, the U.S. Federal Reserve (Fed) signaled its intention to increase the federal funds rate. However, concerns about slowing growth, particularly in emerging markets, prompted the Fed to defer an interest-rate increase. Investors globally fell into a holding pattern at times as they tried to anticipate the Fed’s next move. Meanwhile, the Bank of Japan announced in October 2014 significant expansion of its economic stimulus programs to include additional injections of liquidity into the economy through bond purchases. In addition, the Government Pension Investment Fund announced plans to reduce government bond investments and direct those assets to investments in the Japanese stock market. The People’s Bank of China also took initiatives to spur economic growth by cutting interest rates for the sixth time in less than a year in October 2015; lowering bank reserve requirements to encourage lending; and allowing the renminbi to depreciate to support exports and to advance government efforts to transition to a more market-driven economy.
During the summer of 2015, the Hang Seng Index1 in Hong Kong experienced a dramatic decline after a similarly dramatic ascent during late 2014 and early 2015, falling to levels not seen since 2013. Contentious negotiations between Greece and its debtors to refinance the country’s sovereign debt also concerned investors during June 2015. After weeks of stalemated negotiations, the government
| 1 | The Hang Seng Index is a free-float-adjusted market-capitalization-weighted stock market index in Hong Kong. It is used to record and monitor daily changes of the largest companies of the Hong Kong stock market and is the main indicator of the overall market performance in Hong Kong. You cannot invest directly in an index. |
| | | | | | |
| Letter to shareholders (unaudited) | | Wells Fargo Global Opportunities Fund | | | 3 | |
accepted additional spending reductions in order to secure new loan agreements. Developed European and Asian equity markets, as measured by Morgan Stanley Capital International (MSCI) Europe, Australasia, Far East (EAFE) Index (Net),2 returned -0.07% for the 12-month period that ended October 31, 2015.
The effect of slowing growth in China, a stronger U.S. dollar, and stubbornly low prices for oil, natural gas, and other commodities was particularly difficult for many emerging markets economies that rely on commodities as an economic engine. During the period, emerging markets stocks suffered more significantly than international developed markets, earning a return of -14.53%, as measured by the MSCI Emerging Markets Index (Net).3 U.S. investors in international equity markets also often saw the value of their overseas investments reduced upon translation to dollars.
Don’t let short-term uncertainty derail long-term investment goals.
Periods of investment uncertainty can present challenges, but experience has taught us that maintaining long-term investment goals can be an effective way to plan for the future. To help you create a sound strategy based on your personal goals and risk tolerance, Wells Fargo Funds offers more than 100 mutual funds and other investments spanning a wide range of asset classes and investment styles. Although diversification cannot guarantee an investment profit or prevent losses, we believe it can be an effective way to manage investment risk and potentially smooth out overall portfolio performance. We encourage investors to know their investments and to understand that appropriate levels of risk-taking may unlock opportunities.
Thank you for choosing to invest with Wells Fargo Funds. We appreciate your confidence in us and remain committed to helping you meet your financial needs.
Sincerely,

Karla M. Rabusch
President
Wells Fargo Funds
Notice to shareholders
At a meeting held August 11-12, 2015, the Board of Trustees of the Fund approved a change in the name of the Fund whereby the word “Advantage” was removed from its name, effective December 15, 2015.
For current information about your fund investments, contact your investment professional, visit our website at wellsfargofunds.com, or call us directly at 1-800-222-8222. We are available 24 hours a day, 7 days a week.
| 2 | The Morgan Stanley Capital International (MSCI) Europe, Australasia, Far East (EAFE) Index (Net) is a free-float-adjusted market-capitalization-weighted index that is designed to measure the equity market performance of developed markets, excluding the U.S. and Canada. The MSCI EAFE Index (Net) consists of the following 21 developed markets country indexes: Australia, Austria, Belgium, Denmark, Finland, France, Germany, Hong Kong, Ireland, Israel, Italy, Japan, the Netherlands, New Zealand, Norway, Portugal, Singapore, Spain, Sweden, Switzerland, and the United Kingdom. You cannot invest directly in an index. Source: MSCI. MSCI makes no express or implied warranties or representations and shall have no liability whatsoever with respect to any MSCI data contained herein. The MSCI data may not be further redistributed or used as a basis for other indexes or any securities or financial products. This report is not approved, reviewed, or produced by MSCI. |
| 3 | The MSCI Emerging Markets Index (Net) is a free-float-adjusted market-capitalization-weighted index that is designed to measure the equity market performance of emerging markets. The MSCI Emerging Markets Index (Net) consists of the following 23 emerging markets country indexes: Brazil, Chile, China, Colombia, Czech Republic, Egypt, Greece, Hungary, India, Indonesia, Korea, Malaysia, Mexico, Peru, the Philippines, Poland, Qatar, Russia, South Africa, Taiwan, Thailand, Turkey, and United Arab Emirates. You cannot invest directly in an index. |
| | | | |
| 4 | | Wells Fargo Global Opportunities Fund | | Performance highlights (unaudited) |
Investment objective
The Fund seeks long-term capital appreciation.
Manager
Wells Fargo Funds Management, LLC
Subadviser
Wells Capital Management Incorporated
Portfolio managers
Oleg Makhorine
Robert Rifkin, CFA
James M. Tringas, CFA, CPA
Bryant VanCronkhite, CFA, CPA
Average annual total returns (%) as of October 31, 20151
| | | | | | | | | | | | | | | | | | | | | | | | | | | | | | | | | | |
| | | | | Including sales charge | | | Excluding sales charge | | | Expense ratios2 (%) | |
| | | Inception date | | 1 year | | | 5 year | | | 10 year | | | 1 year | | | 5 year | | | 10 year | | | Gross | | | Net3 | |
| Class A (EKGAX ) | | 3-16-1988 | | | (3.75 | ) | | | 5.79 | | | | 6.61 | | | | 2.12 | | | | 7.05 | | | | 7.25 | | | | 1.53 | | | | 1.53 | |
| Class B (EKGBX)* | | 2-1-1993 | | | (2.73 | ) | | | 5.93 | | | | 6.70 | | | | 1.34 | | | | 6.24 | | | | 6.70 | | | | 2.28 | | | | 2.28 | |
| Class C (EKGCX) | | 2-1-1993 | | | 0.34 | | | | 6.24 | | | | 6.45 | | | | 1.34 | | | | 6.24 | | | | 6.45 | | | | 2.28 | | | | 2.28 | |
| Administrator Class (EKGYX) | | 1-13-1997 | | | – | | | | – | | | | – | | | | 2.27 | | | | 7.22 | | | | 7.48 | | | | 1.45 | | | | 1.41 | |
| Institutional Class (EKGIX) | | 7-30-2010 | | | – | | | | – | | | | – | | | | 2.53 | | | | 7.49 | | | | 7.62 | | | | 1.20 | | | | 1.16 | |
| S&P Developed SmallCap Index4 | | – | | | – | | | | – | | | | – | | | | 3.34 | | | | 10.23 | | | | 7.39 | | | | – | | | | – | |
| * | | Class B shares are closed to investment, except in connection with the reinvestment of any distributions and permitted exchanges. |
Figures quoted represent past performance, which is no guarantee of future results, and do not reflect taxes that a shareholder may pay on fund distributions or the redemption of fund shares. Investment return and principal value of an investment will fluctuate so that an investor’s shares, when redeemed, may be worth more or less than their original cost. Performance shown without sales charges would be lower if sales charges were reflected. Current performance may be lower or higher than the performance data quoted, which assumes the reinvestment of dividends and capital gains. Current month-end performance is available on the Fund’s website, wellsfargofunds.com.
Index returns do not include transaction costs associated with buying and selling securities, any mutual fund fees or expenses, or any taxes. It is not possible to invest directly in an index.
For Class A shares, the maximum front-end sales charge is 5.75%. For Class B shares, the maximum contingent deferred sales charge is 5.00%. For Class C shares, the maximum contingent deferred sales charge is 1.00%. Performance including a contingent deferred sales charge assumes the sales charge for the corresponding time period. Administrator Class and Institutional Class shares are sold without a front-end sales charge or contingent deferred sales charge.
Stock values fluctuate in response to the activities of individual companies and general market and economic conditions. Foreign investments are especially volatile and can rise or fall dramatically due to differences in the political and economic conditions of the host country. These risks are generally intensified in emerging markets. The use of derivatives may reduce returns and/or increase volatility. Certain investment strategies tend to increase the total risk of an investment (relative to the broader market). The Fund is exposed to geographic risk and smaller-company securities risk. Consult the Fund’s prospectus for additional information on these and other risks.
Please see footnotes on page 5.
| | | | | | |
| Performance highlights (unaudited) | | Wells Fargo Global Opportunities Fund | | | 5 | |
|
| Growth of $10,000 investment as of October 31, 20155 |
|
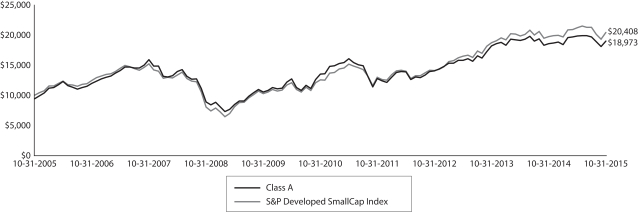 |
| 1 | Historical performance shown for Institutional Class shares prior to their inception reflects the performance of Administrator Class shares, and includes the higher expenses applicable to Administrator Class shares. If these expenses had not been included, returns would be higher. Historical performance shown for all classes of the Fund prior to July 19, 2010, is based on the performance of the Fund’s predecessor, Evergreen Global Opportunities Fund. |
| 2 | Reflects the expense ratios as stated in the most recent prospectuses, which include the impact of 0.01% in acquired fund fees and expenses. The expense ratios shown are subject to change and may differ from the annualized expense ratios shown in the financial highlights of this report, which do not include acquired fund fees and expenses. |
| 3 | The manager has contractually committed through February 29, 2016, to waive fees and/or reimburse expenses to the extent necessary to cap the Fund’s Total Annual Operating Expenses After Fee Waiver at 1.55% for Class A, 2.30% for Class B, 2.30% for Class C, 1.40% for Administrator Class, and 1.15% for Institutional Class. After this time, the cap may be increased or the commitment to maintain the cap may be terminated only with the approval of the Board of Trustees. Brokerage commissions, stamp duty fees, interest, taxes, acquired fees and expenses, and extraordinary expenses are excluded from the cap. Without this cap, the Fund’s returns would have been lower. |
| 4 | The S&P Developed SmallCap Index is a float-adjusted market-capitalization-weighted index designed to measure the equity market performance of small-capitalization companies located in developed markets. The index is composed of companies within the bottom 15% of the cumulative market capitalization in developed markets. The index covers all publicly listed equities with float-adjusted market values of U.S. $100 million or more and annual dollar value traded of at least U.S. $50 million in all included countries. You cannot invest directly in an index. |
| 5 | The chart compares the performance of Class A shares for the most recent ten years with the S&P Developed SmallCap Index. The chart assumes a hypothetical investment of $10,000 in Class A shares and reflects all operating expenses and assumes the maximum initial sales charge of 5.75%. |
| 6 | The ten largest holdings, excluding cash and cash equivalents, are calculated based on the value of the investments divided by total net assets of the Fund. Holdings are subject to change and may have changed since the date specified. |
| 7 | Amounts are calculated based on the total long-term investments of the Fund. These amounts are subject to change and may have changed since the date specified. |
| | | | |
| 6 | | Wells Fargo Global Opportunities Fund | | Performance highlights (unaudited) |
MANAGER’S DISCUSSION
Fund highlights
| n | | The Fund underperformed its benchmark, the S&P Developed SmallCap Index, for the 12-month period that ended October 31, 2015. |
| n | | Stock selection in the consumer discretionary and information technology (IT) sectors detracted from relative performance. However, this was partly offset by strength in the industrials, materials, and health care sectors. |
| n | | Geographically, stock selection was weakest in the U.K. and Switzerland but strongest in Canada and the U.S. |
Headlines during the fiscal year were largely dominated by monetary policies across the globe.
Although the U.S. Federal Reserve (Fed) ended its bond-buying program, also known as quantitative easing, nearly one year ago, the Fed remained in the spotlight as investors anxiously awaited the first interest-rate hike in several years. In Europe, the European Central Bank (ECB) began its own version of quantitative easing, which helped weaken the euro, boost exports, and increase equity market returns. The Asia Pacific region also saw its fair share of currency-related headlines; China’s surprise currency devaluation triggered a global sell-off in risk assets during the month of August and further pressured stocks in commodity-sensitive countries such as Canada and Australia. In Japan, while the yen did not drastically weaken as it had in the prior two fiscal years, Japanese Prime Minister Shinzō Abe and the Bank of Japan are being measured against their earlier promises to deliver inflation.
As bottom-up investors, we evaluate how these global macroeconomic events might affect the Fund’s holdings, but we do not derive our security selection from macroeconomic bets. We aim to use market volatility opportunistically, and we will seek to use any future volatility to the advantage of our bottom-up stock-selection process.
| | | | |
| Ten largest holdings (%) as of October 31, 20156 | |
GSI Group Incorporated | | | 1.97 | |
Simpson Manufacturing Company Incorporated | | | 1.79 | |
Eagle Materials Incorporated | | | 1.76 | |
Douglas Dynamics Incorporated | | | 1.74 | |
Brown & Brown Incorporated | | | 1.73 | |
Analogic Corporation | | | 1.69 | |
WD-40 Company | | | 1.68 | |
TreeHouse Foods Incorporated | | | 1.65 | |
Krispy Kreme Doughnuts Incorporated | | | 1.64 | |
Mueller Industries Incorporated | | | 1.61 | |
Stock selection in the consumer discretionary and IT sectors detracted from performance during the recent fiscal year. In the consumer discretionary sector, a notable detractor was Krispy Kreme Doughnuts, Incorporated, a U.S.-based retailer and wholesaler of doughnuts and other food and beverage products. While the company is reporting positive trends in its domestic retail stores and its international expansion is proceeding as expected, reduced orders from a large wholesale customer negatively affected margins. Management is working to better align costs with revenue and address recent challenges. We believe the long-term opportunities in the core business outweigh the near-term wholesale issues.
The IT sector was negatively affected by our exposure to Teradata Corporation, a provider of analytic data platforms, applications, and services. The company is navigating a difficult spending environment as clients evaluate newly emerging open-source solutions and divert larger portions of their IT budgets toward cyber-security projects. While we appreciate the fundamental challenges, we continue to find the reward-to-risk profile of the company attractive.
Stock selection in the industrials, materials, and health care sectors contributed to relative performance during the period. In the industrials sector, USG People N.V., a Dutch-based provider of employment services, and Teleperformance SE, a French-based call center outsourcer, were among our top international performers in the sector. Domestically, shares of Courier Corporation, one of America’s major book manufacturers, appreciated significantly following a buyout offer from R.R. Donnelley & Sons Company. In addition, Matthews International Corporation, a provider of memorialization products and caskets, outperformed the broader index as the company benefited from lower copper prices and management continued to effectively allocate capital by making earnings accretive acquisitions.
Outperformance in the materials sector was largely driven by exposure to Innospec Incorporated, a provider of specialty chemicals. In health care, German-based Gerresheimer AG, a manufacturer of specialty glass and plastic pharmaceutical products, announced the acquisition of Centor U.S. Holding Incorporated, a leading provider of prescription vials. The
Please see footnotes on page 5.
| | | | | | |
| Performance highlights (unaudited) | | Wells Fargo Global Opportunities Fund | | | 7 | |
deal is highly accretive and is expected to support revenue growth in the years to come. In addition, U.S.-based health care equipment and services company STERIS Corporation announced the acquisition of U.K.-based Synergy Health plc at the start of the fiscal year. Following a prolonged antitrust review, shares of STERIS appreciated on the announcement that a federal judge rejected a request from the Federal Trade Commission to block the deal.
|
| Sector distribution as of October 31, 20157 |
|
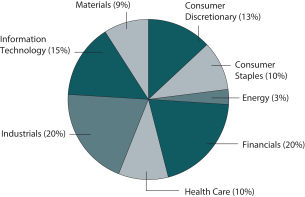 |
Our investment philosophy focuses on company-specific factors rather than on headline-dominating macroeconomic events.
We believe that it would be imprudent to allocate investor capital based on speculation about global political outcomes or concerns over the debate on monetary policy. Instead, we analyze each potential investment on the merits of that company’s competitive advantages, the fundamentals of its business model, and our estimate of the underlying value of its business compared with its market value. We will continue to allow our well-defined, repeatable process to guide us through any volatility, with the expectation that it should result in above-average risk-adjusted returns compared with the benchmark over a full investment cycle.
|
| Country allocation as of October 31, 20157 |
|
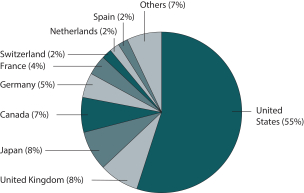 |
Please see footnotes on page 5.
| | | | |
| 8 | | Wells Fargo Global Opportunities Fund | | Fund expenses (unaudited) |
As a shareholder of the Fund, you incur two types of costs: (1) transaction costs, including sales charges (loads) on purchase payments and contingent deferred sales charges (if any) on redemptions and (2) ongoing costs, including management fees, distribution (12b-1) and/or shareholder servicing fees, and other Fund expenses. This example is intended to help you understand your ongoing costs (in dollars) of investing in the Fund and to compare these costs with the ongoing costs of investing in other mutual funds.
The example is based on an investment of $1,000 invested at the beginning of the six-month period and held for the entire period from May 1, 2015 to October 31, 2015.
Actual expenses
The “Actual” line of the table below provides information about actual account values and actual expenses. You may use the information in this line, together with the amount you invested, to estimate the expenses that you paid over the period. Simply divide your account value by $1,000 (for example, an $8,600 account value divided by $1,000 = 8.6), then multiply the result by the number in the “Actual” line under the heading entitled “Expenses paid during period” for your applicable class of shares to estimate the expenses you paid on your account during this period.
Hypothetical example for comparison purposes
The “Hypothetical” line of the table below provides information about hypothetical account values and hypothetical expenses based on the Fund’s actual expense ratio and an assumed rate of return of 5% per year before expenses, which is not the Fund’s actual return. The hypothetical account values and expenses may not be used to estimate the actual ending account balance or expenses you paid for the period. You may use this information to compare the ongoing costs of investing in the Fund and other funds. To do so, compare this 5% hypothetical example with the 5% hypothetical examples that appear in the shareholder reports of the other funds.
Please note that the expenses shown in the table are meant to highlight your ongoing costs only and do not reflect any transactional costs, such as sales charges (loads) and contingent deferred sales charges. Therefore, the “Hypothetical” line of the table is useful in comparing ongoing costs only and will not help you determine the relative total costs of owning different funds. In addition, if these transactional costs were included, your costs would have been higher.
| | | | | | | | | | | | | | | | |
| | | Beginning
account value
5-1-2015 | | | Ending
account value
10-31-2015 | | | Expenses
paid during
the period¹ | | | Net annualized
expense ratio | |
Class A | | | | | | | | | | | | | | | | |
Actual | | $ | 1,000.00 | | | $ | 957.07 | | | $ | 7.65 | | | | 1.55 | % |
Hypothetical (5% return before expenses) | | $ | 1,000.00 | | | $ | 1,017.39 | | | $ | 7.88 | | | | 1.55 | % |
Class B | | | | | | | | | | | | | | | | |
Actual | | $ | 1,000.00 | | | $ | 953.36 | | | $ | 11.32 | | | | 2.30 | % |
Hypothetical (5% return before expenses) | | $ | 1,000.00 | | | $ | 1,013.61 | | | $ | 11.67 | | | | 2.30 | % |
Class C | | | | | | | | | | | | | | | | |
Actual | | $ | 1,000.00 | | | $ | 953.32 | | | $ | 11.32 | | | | 2.30 | % |
Hypothetical (5% return before expenses) | | $ | 1,000.00 | | | $ | 1,013.61 | | | $ | 11.67 | | | | 2.30 | % |
Administrator Class | | | | | | | | | | | | | | | | |
Actual | | $ | 1,000.00 | | | $ | 957.63 | | | $ | 6.91 | | | | 1.40 | % |
Hypothetical (5% return before expenses) | | $ | 1,000.00 | | | $ | 1,018.15 | | | $ | 7.12 | | | | 1.40 | % |
Institutional Class | | | | | | | | | | | | | | | | |
Actual | | $ | 1,000.00 | | | $ | 958.80 | | | $ | 5.68 | | | | 1.15 | % |
Hypothetical (5% return before expenses) | | $ | 1,000.00 | | | $ | 1,019.41 | | | $ | 5.85 | | | | 1.15 | % |
| 1 | Expenses paid is equal to the annualized expense ratio of each class multiplied by the average account value over the period, multiplied by the number of days in the most recent fiscal half-year divided by the number of days in the fiscal year (to reflect the one-half-year period). |
| | | | | | |
| Portfolio of investments—October 31, 2015 | | Wells Fargo Global Opportunities Fund | | | 9 | |
| | | | | | | | | | | | |
| Security name | | | | | | Shares | | | Value | |
| | | | |
Common Stocks: 96.48% | | | | | | | | | | | | |
| | | | |
| Austria: 0.67% | | | | | | | | | | | | |
UNIQA Insurance Group AG (Financials, Insurance) | | | | | | | 168,348 | | | $ | 1,563,334 | |
| | | | | | | | | | | | |
| | | | |
| Canada: 6.30% | | | | | | | | | | | | |
Canadian Western Bank (Financials, Banks) « | | | | | | | 78,927 | | | | 1,516,852 | |
Cott Corporation (Consumer Staples, Beverages) | | | | | | | 139,900 | | | | 1,461,955 | |
Cott Corporation - Canadian Exchange (Consumer Staples, Beverages) | | | | | | | 135,434 | | | | 1,413,792 | |
Finning International Incorporated (Industrials, Trading Companies & Distributors) | | | | | | | 47,385 | | | | 757,377 | |
GSI Group Incorporated (Information Technology, Electronic Equipment, Instruments & Components) † | | | | | | | 341,271 | | | | 4,610,571 | |
Maple Leaf Foods Incorporated (Consumer Staples, Food Products) | | | | | | | 137,511 | | | | 2,186,337 | |
MBAC Fertilizer Corporation - Legend Shares (Materials, Chemicals) (i) | | | | | | | 84,000 | | | | 2,248 | |
MTY Food Group Incorporated (Consumer Discretionary, Hotels, Restaurants & Leisure) | | | | | | | 52,418 | | | | 1,215,443 | |
Parex Resources Incorporated (Energy, Oil, Gas & Consumable Fuels) † | | | | | | | 90,375 | | | | 678,711 | |
Western Forest Products Incorporated (Materials, Paper & Forest Products) « | | | | | | | 625,617 | | | | 923,402 | |
| | | | |
| | | | | | | | | | | 14,766,688 | |
| | | | | | | | | | | | |
| | | | |
| China: 0.52% | | | | | | | | | | | | |
Plastec Technologies Limited (Materials, Chemicals) (a) | | | | | | | 152,438 | | | | 1,219,504 | |
| | | | | | | | | | | | |
| | | | |
| Denmark: 0.59% | | | | | | | | | | | | |
Jyske Bank AS (Financials, Banks) † | | | | | | | 28,541 | | | | 1,392,218 | |
| | | | | | | | | | | | |
| | | | |
| France: 3.74% | | | | | | | | | | | | |
ALTEN SA (Information Technology, IT Services) | | | | | | | 43,182 | | | | 2,238,470 | |
Eutelsat Communications SA (Consumer Discretionary, Media) | | | | | | | 50,532 | | | | 1,665,510 | |
M6 Metropole Television SA (Consumer Discretionary, Media) | | | | | | | 82,186 | | | | 1,580,911 | |
Mersen SA (Industrials, Electrical Equipment) | | | | | | | 52,310 | | | | 982,488 | |
Teleperformance SE (Industrials, Professional Services) | | | | | | | 29,220 | | | | 2,293,213 | |
| | | | |
| | | | | | | | | | | 8,760,592 | |
| | | | | | | | | | | | |
| | | | |
| Germany: 4.88% | | | | | | | | | | | | |
Cancom SE (Information Technology, IT Services) | | | | | | | 40,443 | | | | 1,586,506 | |
Gerresheimer AG (Health Care, Life Sciences Tools & Services) | | | | | | | 34,961 | | | | 2,726,078 | |
Hochtief AG (Industrials, Construction & Engineering) | | | | | | | 20,878 | | | | 1,942,337 | |
Kion Group AG (Industrials, Machinery) | | | | | | | 34,775 | | | | 1,567,027 | |
TAG Immobilien AG (Financials, Real Estate Management & Development) « | | | | | | | 124,214 | | | | 1,607,819 | |
TLG Immobilien AG (Financials, REITs) | | | | | | | 105,917 | | | | 1,992,370 | |
| | | | |
| | | | | | | | | | | 11,422,137 | |
| | | | | | | | | | | | |
| | | | |
| Hong Kong: 1.03% | | | | | | | | | | | | |
Sunlight REIT (Financials, REITs) | | | | | | | 4,783,000 | | | | 2,419,969 | |
| | | | | | | | | | | | |
| | | | |
| Israel: 0.61% | | | | | | | | | | | | |
Orbotech Limited (Information Technology, Electronic Equipment, Instruments & Components) † | | | | | | | 85,800 | | | | 1,419,990 | |
| | | | | | | | | | | | |
| | | | |
| Italy: 1.14% | | | | | | | | | | | | |
Azimut Holding SpA (Financials, Capital Markets) | | | | | | | 47,594 | | | | 1,144,779 | |
Davide Campari-Milano SpA (Consumer Staples, Beverages) | | | | | | | 178,358 | | | | 1,527,353 | |
| | | | |
| | | | | | | | | | | 2,672,132 | |
| | | | | | | | | | | | |
The accompanying notes are an integral part of these financial statements.
| | | | |
| 10 | | Wells Fargo Global Opportunities Fund | | Portfolio of investments—October 31, 2015 |
| | | | | | | | | | | | |
| Security name | | | | | | Shares | | | Value | |
| | | | |
| Japan: 7.68% | | | | | | | | | | | | |
Aeon Delight Company Limited (Industrials, Commercial Services & Supplies) | | | | | | | 54,300 | | | $ | 1,564,288 | |
Chiba Bank Limited (Financials, Banks) | | | | | | | 124,000 | | | | 904,584 | |
DTS Corporation (Information Technology, IT Services) | | | | | | | 70,900 | | | | 1,675,940 | |
FamilyMart Company Limited (Consumer Staples, Food & Staples Retailing) | | | | | | | 43,800 | | | | 1,790,402 | |
Hitachi Chemical Company Limited (Materials, Chemicals) | | | | | | | 74,600 | | | | 1,179,246 | |
Horiba Limited (Information Technology, Electronic Equipment, Instruments & Components) | | | | | | | 34,400 | | | | 1,353,588 | |
Musashi Seimitsu Industry Company Limited (Consumer Discretionary, Auto Components) | | | | | | | 67,100 | | | | 1,361,945 | |
Nihon Parkerizing Company Limited (Materials, Chemicals) | | | | | | | 144,100 | | | | 1,281,808 | |
ORIX JREIT Incorporated (Financials, REITs) | | | | | | | 1,439 | | | | 1,937,139 | |
Ship Healthcare Holdings Incorporated (Health Care, Health Care Providers & Services) | | | | | | | 61,469 | | | | 1,488,977 | |
Sumitomo Warehouse Company Limited (Industrials, Transportation Infrastructure) | | | | | | | 384,000 | | | | 2,037,228 | |
Taikisha Limited (Industrials, Construction & Engineering) | | | | | | | 58,400 | | | | 1,413,750 | |
| | | | |
| | | | | | | | | | | 17,988,895 | |
| | | | | | | | | | | | |
| | | | |
| Netherlands: 1.99% | | | | | | | | | | | | |
Arcadis NV (Industrials, Construction & Engineering) | | | | | | | 62,968 | | | | 1,587,382 | |
BinckBank NV (Financials, Capital Markets) | | | | | | | 169,663 | | | | 1,492,421 | |
USG People NV (Industrials, Professional Services) | | | | | | | 99,880 | | | | 1,587,528 | |
| | | | |
| | | | | | | | | | | 4,667,331 | |
| | | | | | | | | | | | |
| | | | |
| Norway: 0.50% | | | | | | | | | | | | |
SpareBank 1 SR Bank ASA (Financials, Banks) | | | | | | | 245,115 | | | | 1,170,876 | |
| | | | | | | | | | | | |
| | | | |
| South Korea: 0.62% | | | | | | | | | | | | |
BS Financial Group Incorporated (Financials, Banks) | | | | | | | 118,392 | | | | 1,449,568 | |
| | | | | | | | | | | | |
| | | | |
| Spain: 1.69% | | | | | | | | | | | | |
Almirall SA (Health Care, Pharmaceuticals) | | | | | | | 57,447 | | | | 1,105,758 | |
Merlin Properties Socimi SA (Financials, REITs) | | | | | | | 185,040 | | | | 2,371,235 | |
Prosegur Compania de Seguridad SA (Industrials, Commercial Services & Supplies) | | | | | | | 106,830 | | | | 475,326 | |
| | | | |
| | | | | | | | | | | 3,952,319 | |
| | | | | | | | | | | | |
| | | | |
| Sweden: 0.52% | | | | | | | | | | | | |
Rezidor Hotel Group AB (Consumer Discretionary, Hotels, Restaurants & Leisure) | | | | | | | 285,682 | | | | 1,213,811 | |
| | | | | | | | | | | | |
| | | | |
| Switzerland: 2.32% | | | | | | | | | | | | |
Aryzta AG (Consumer Staples, Food Products) | | | | | | | 35,978 | | | | 1,620,090 | |
Dufry AG (Consumer Discretionary, Specialty Retail) † | | | | | | | 11,688 | | | | 1,365,453 | |
Kuoni Reisen Holding AG (Consumer Discretionary, Hotels, Restaurants & Leisure) « | | | | | | | 7,131 | | | | 1,476,486 | |
OC Oerlikon Corporation AG (Information Technology, Electronic Equipment, Instruments & Components) | | | | | | | 102,408 | | | | 982,698 | |
| | | | |
| | | | | | | | | | | 5,444,727 | |
| | | | | | | | | | | | |
| | | | |
| United Kingdom: 8.22% | | | | | | | | | | | | |
Bovis Homes Group plc (Consumer Discretionary, Household Durables) | | | | | | | 100,262 | | | | 1,581,478 | |
Cambian Group plc (Health Care, Health Care Providers & Services) | | | | | | | 452,173 | | | | 1,129,253 | |
Consort Medical plc (Health Care, Health Care Equipment & Supplies) | | | | | | | 102,907 | | | | 1,548,340 | |
Hunting plc (Energy, Energy Equipment & Services) | | | | | | | 112,008 | | | | 620,849 | |
Jupiter Fund Management plc (Financials, Capital Markets) | | | | | | | 347,981 | | | | 2,413,645 | |
Keller Group plc (Industrials, Construction & Engineering) | | | | | | | 78,869 | | | | 988,402 | |
The accompanying notes are an integral part of these financial statements.
| | | | | | |
| Portfolio of investments—October 31, 2015 | | Wells Fargo Global Opportunities Fund | | | 11 | |
| | | | | | | | | | | | |
| Security name | | | | | | Shares | | | Value | |
| | | | |
| United Kingdom (continued) | | | | | | | | | | | | |
Lancashire Holdings Limited (Financials, Insurance) | | | | | | | 64,899 | | | $ | 710,948 | |
Mears Group plc (Industrials, Commercial Services & Supplies) | | | | | | | 242,559 | | | | 1,548,065 | |
Morgan Advanced Materials plc (Industrials, Machinery) | | | | | | | 332,016 | | | | 1,430,079 | |
Pace plc (Consumer Discretionary, Household Durables) | | | | | | | 294,826 | | | | 1,693,480 | |
Savills plc (Financials, Real Estate Management & Development) | | | | | | | 136,652 | | | | 1,928,680 | |
SIG plc (Industrials, Trading Companies & Distributors) | | | | | | | 642,542 | | | | 1,319,029 | |
Spectris plc (Information Technology, Electronic Equipment, Instruments & Components) | | | | | | | 47,621 | | | | 1,221,349 | |
Stock Spirits Group plc (Consumer Staples, Beverages) | | | | | | | 380,448 | | | | 1,117,279 | |
| | | | |
| | | | | | | | | | | 19,250,876 | |
| | | | | | | | | | | | |
| | | | |
| United States: 53.46% | | | | | | | | | | | | |
A. Schulman Incorporated (Materials, Chemicals) | | | | | | | 58,011 | | | | 2,082,015 | |
ACCO Brands Corporation (Industrials, Commercial Services & Supplies) † | | | | | | | 314,612 | | | | 2,538,919 | |
ACI Worldwide Incorporated (Information Technology, Software) † | | | | | | | 107,800 | | | | 2,581,810 | |
Analogic Corporation (Health Care, Health Care Equipment & Supplies) | | | | | | | 45,124 | | | | 3,953,765 | |
ARRIS Group Incorporated (Information Technology, Communications Equipment) † | | | | | | | 47,300 | | | | 1,336,698 | |
Atwood Oceanics Incorporated (Energy, Energy Equipment & Services) « | | | | | | | 38,100 | | | | 630,555 | |
Brown & Brown Incorporated (Financials, Insurance) | | | | | | | 125,422 | | | | 4,047,368 | |
Christopher & Banks Corporation (Consumer Discretionary, Specialty Retail) † | | | | | | | 172,028 | | | | 251,161 | |
Coherent Incorporated (Information Technology, Electronic Equipment, Instruments & Components) † | | | | | | | 38,200 | | | | 2,070,440 | |
Delta Apparel Incorporated (Consumer Discretionary, Textiles, Apparel & Luxury Goods) † | | | | | | | 51,757 | | | | 850,368 | |
Denny’s Corporation (Consumer Discretionary, Hotels, Restaurants & Leisure) † | | | | | | | 146,099 | | | | 1,601,245 | |
DineEquity Incorporated (Consumer Discretionary, Hotels, Restaurants & Leisure) | | | | | | | 30,100 | | | | 2,511,845 | |
Dixie Group Incorporated (Consumer Discretionary, Household Durables) Ǡ | | | | | | | 178,671 | | | | 1,173,868 | |
Douglas Dynamics Incorporated (Industrials, Machinery) | | | | | | | 186,302 | | | | 4,087,466 | |
Eagle Materials Incorporated (Materials, Construction Materials) | | | | | | | 62,500 | | | | 4,126,875 | |
ESCO Technologies Incorporated (Industrials, Machinery) | | | | | | | 30,600 | | | | 1,134,954 | |
First Citizens BancShares Corporation Class A (Financials, Banks) | | | | | | | 14,096 | | | | 3,610,549 | |
Franklin Electric Company Incorporated (Industrials, Electrical Equipment) | | | | | | | 111,762 | | | | 3,683,676 | |
Gramercy Property Trust Incorporated (Financials, REITs) | | | | | | | 61,800 | | | | 1,401,624 | |
Guess? Incorporated (Consumer Discretionary, Specialty Retail) | | | | | | | 76,400 | | | | 1,608,220 | |
Gulfport Energy Corporation (Energy, Oil, Gas & Consumable Fuels) † | | | | | | | 39,600 | | | | 1,206,612 | |
Haemonetics Corporation (Health Care, Health Care Equipment & Supplies) † | | | | | | | 63,376 | | | | 2,140,841 | |
Hatteras Financial Corporation (Financials, REITs) | | | | | | | 144,300 | | | | 2,064,933 | |
Helen of Troy Limited (Consumer Discretionary, Household Durables) † | | | | | | | 27,500 | | | | 2,728,275 | |
Imation Corporation (Information Technology, Technology Hardware, Storage & Peripherals) † | | | | | | | 494,388 | | | | 998,664 | |
Innospec Incorporated (Materials, Chemicals) | | | | | | | 49,305 | | | | 2,723,608 | |
Kadant Incorporated (Industrials, Machinery) | | | | | | | 73,976 | | | | 3,041,893 | |
Krispy Kreme Doughnuts Incorporated (Consumer Discretionary, Hotels, Restaurants & Leisure) † | | | | | | | 280,300 | | | | 3,837,307 | |
Liberty Tax Incorporated (Consumer Discretionary, Diversified Consumer Services) « | | | | | | | 110,220 | | | | 2,544,980 | |
Matthews International Corporation Class A (Industrials, Commercial Services & Supplies) | | | | | | | 46,685 | | | | 2,695,125 | |
Mueller Industries Incorporated (Industrials, Machinery) | | | | | | | 120,000 | | | | 3,782,400 | |
Neenah Paper Incorporated (Materials, Paper & Forest Products) | | | | | | | 49,350 | | | | 3,326,683 | |
NETGEAR Incorporated (Information Technology, Communications Equipment) † | | | | | | | 59,293 | | | | 2,454,730 | |
Patterson-UTI Energy Incorporated (Energy, Energy Equipment & Services) | | | | | | | 89,400 | | | | 1,331,166 | |
ProAssurance Corporation (Financials, Insurance) | | | | | | | 45,500 | | | | 2,409,680 | |
Progress Software Corporation (Information Technology, Software) † | | | | | | | 95,500 | | | | 2,318,740 | |
Schweitzer-Mauduit International Incorporated (Materials, Paper & Forest Products) | | | | | | | 87,200 | | | | 3,385,104 | |
Simpson Manufacturing Company Incorporated (Industrials, Building Products) | | | | | | | 110,170 | | | | 4,184,257 | |
Spectrum Brands Holdings Incorporated (Consumer Staples, Household Products) | | | | | | | 33,300 | | | | 3,191,805 | |
The accompanying notes are an integral part of these financial statements.
| | | | |
| 12 | | Wells Fargo Global Opportunities Fund | | Portfolio of investments—October 31, 2015 |
| | | | | | | | | | | | | | |
| Security name | | | | | | | Shares | | | Value | |
| | | | |
| United States (continued) | | | | | | | | | | | | | | |
Steel Excel Incorporated (Energy, Energy Equipment & Services) † | | | | | | | | | 109,434 | | | $ | 1,843,963 | |
Steris Corporation (Health Care, Health Care Equipment & Supplies) « | | | | | | | | | 36,200 | | | | 2,713,190 | |
Teradata Corporation (Information Technology, IT Services) † | | | | | | | | | 97,600 | | | | 2,743,536 | |
Theravance Incorporated (Health Care, Pharmaceuticals) « | | | | | | | | | 144,008 | | | | 1,264,390 | |
TreeHouse Foods Incorporated (Consumer Staples, Food Products) † | | | | | | | | | 45,200 | | | | 3,870,928 | |
UMB Financial Corporation (Financials, Banks) | | | | | | | | | 75,500 | | | | 3,705,540 | |
Vishay Intertechnology Incorporated (Information Technology, Electronic Equipment, Instruments & Components) | | | | | | | | | 344,690 | | | | 3,653,714 | |
WD-40 Company (Consumer Staples, Household Products) | | | | | | | | | 41,228 | | | | 3,940,572 | |
WellCare Health Plans Incorporated (Health Care, Health Care Providers & Services) † | | | | | | | | | 31,700 | | | | 2,808,620 | |
Westwood Holdings Group Incorporated (Financials, Capital Markets) | | | | | | | | | 52,850 | | | | 3,070,585 | |
| | | | |
| | | | | | | | | | | | | 125,265,262 | |
| | | | | | | | | | | | | | |
| | | | |
Total Common Stocks (Cost $206,905,996) | | | | | | | | | | | | | 226,040,229 | |
| | | | | | | | | | | | | | |
| | | | |
| | | Dividend yield | | | | | | | | | |
| Preferred Stocks: 0.40% | | | | | | | | | | | | | | |
| | | | |
| Germany: 0.40% | | | | | | | | | | | | | | |
Draegerwerk AG & Company KGAA (Health Care, Health Care Equipment & Supplies) | | | 2.15 | % | | | | | 13,051 | | | | 939,838 | |
| | | | | | | | | | | | | | |
| | | | |
Total Preferred Stocks (Cost $1,294,513) | | | | | | | | | | | | | 939,838 | |
| | | | | | | | | | | | | | |
| | | | |
| | | Yield | | | | | | | | | |
| Short-Term Investments: 7.45% | | | | | | | | | | | | | | |
| | | | |
| Investment Companies: 7.45% | | | | | | | | | | | | | | |
Securities Lending Cash Investments, LLC (l)(r)(u) | | | 0.14 | | | | | | 8,920,925 | | | | 8,920,925 | |
Wells Fargo Cash Investment Money Market Fund, Select Class (l)(u) | | | 0.16 | | | | | | 8,536,183 | | | | 8,536,183 | |
| | | | |
Total Short-Term Investments (Cost $17,457,108) | | | | | | | | | | | | | 17,457,108 | |
| | | | | | | | | | | | | | |
| | | | | | | | |
| Total investments in securities (Cost $225,657,617) * | | | 104.33 | % | | | 244,437,175 | |
Other assets and liabilities, net | | | (4.33 | ) | | | (10,140,931 | ) |
| | | | | | | | |
| Total net assets | | | 100.00 | % | | $ | 234,296,244 | |
| | | | | | | | |
| † | Non-income-earning security |
| « | All or a portion of this security is on loan. |
| (a) | The security is fair valued in accordance with procedures approved by the Board of Trustees. |
| (i) | Illiquid security for which the designation as illiquid is unaudited. |
| (l) | The issuer of the security is an affiliated person of the Fund as defined in the Investment Company Act of 1940. |
| (r) | The investment is a non-registered investment vehicle purchased with cash collateral received from securities on loan. |
| (u) | The rate represents the 7-day annualized yield at period end. |
| * | Cost for federal income tax purposes is $227,582,779 and unrealized gains (losses) consists of: |
| | | | |
Gross unrealized gains | | $ | 37,335,605 | |
Gross unrealized losses | | | (20,481,209 | ) |
| | | | |
Net unrealized gains | | $ | 16,854,396 | |
The accompanying notes are an integral part of these financial statements.
| | | | | | |
| Statement of assets and liabilities—October 31, 2015 | | Wells Fargo Global Opportunities Fund | | | 13 | |
| | | | |
| | | | |
| |
Assets | | | | |
Investments | | | | |
In unaffiliated securities (including $8,804,543 of securities loaned), at value (cost $208,200,509) | | $ | 226,980,067 | |
In affiliated securities, at value (cost $17,457,108) | | | 17,457,108 | |
| | | | |
Total investments, at value (cost $225,657,617) | | | 244,437,175 | |
Foreign currency, at value (cost $130,437) | | | 130,732 | |
Receivable for investments sold | | | 2,492,717 | |
Receivable for Fund shares sold | | | 201,199 | |
Receivable for dividends | | | 258,577 | |
Receivable for securities lending income | | | 7,760 | |
Prepaid expenses and other assets | | | 30,622 | |
| | | | |
Total assets | | | 247,558,782 | |
| | | | |
| |
Liabilities | | | | |
Payable for investments purchased | | | 3,748,926 | |
Payable for Fund shares redeemed | | | 204,413 | |
Payable upon receipt of securities loaned | | | 8,920,925 | |
Management fee payable | | | 191,162 | |
Distribution fees payable | | | 26,585 | |
Administration fees payable | | | 39,978 | |
Accrued expenses and other liabilities | | | 130,549 | |
| | | | |
Total liabilities | | | 13,262,538 | |
| | | | |
Total net assets | | $ | 234,296,244 | |
| | | | |
| |
NET ASSETS CONSIST OF | | | | |
Paid-in capital | | $ | 205,965,749 | |
Undistributed net investment income | | | 1,188,486 | |
Accumulated net realized gains on investments | | | 8,361,462 | |
Net unrealized gains on investments | | | 18,780,547 | |
| | | | |
Total net assets | | $ | 234,296,244 | |
| | | | |
| |
COMPUTATION OF NET ASSET VALUE AND OFFERING PRICE PER SHARE | | | | |
Net assets – Class A | | $ | 151,740,347 | |
Shares outstanding – Class A1 | | | 4,075,558 | |
Net asset value per share – Class A | | | $37.23 | |
Maximum offering price per share – Class A2 | | | $39.50 | |
Net assets – Class B | | $ | 4,206,172 | |
Shares outstanding – Class B1 | | | 149,079 | |
Net asset value per share – Class B | | | $28.21 | |
Net assets – Class C | | $ | 36,215,368 | |
Shares outstanding – Class C1 | | | 1,275,501 | |
Net asset value per share – Class C | | | $28.39 | |
Net assets – Administrator Class | | $ | 31,765,101 | |
Shares outstanding – Administrator Class1 | | | 821,824 | |
Net asset value per share – Administrator Class | | | $38.65 | |
Net assets – Institutional Class | | $ | 10,369,256 | |
Shares outstanding – Institutional Class1 | | | 268,406 | |
Net asset value per share – Institutional Class | | | $38.63 | |
| 1 | The Fund has an unlimited number of authorized shares. |
| 2 | Maximum offering price is computed as 100/94.25 of net asset value. On investments of $50,000 or more, the offering price is reduced. |
The accompanying notes are an integral part of these financial statements.
| | | | |
| 14 | | Wells Fargo Global Opportunities Fund | | Statement of operations—year ended October 31, 2015 |
| | | | |
| | | | |
| |
Investment income | | | | |
Dividends (net of foreign withholding taxes of $209,819) | | $ | 4,362,932 | |
Securities lending income, net | | | 234,341 | |
Income from affiliated securities | | | 10,694 | |
| | | | |
Total investment income | | | 4,607,967 | |
| | | | |
| |
Expenses | | | | |
Management fee | | | 2,406,116 | |
Administration fees | | | | |
Class A | | | 391,259 | |
Class B | | | 19,653 | |
Class C | | | 95,986 | |
Administrator Class | | | 40,716 | |
Institutional Class | | | 8,069 | |
Shareholder servicing fees | | | | |
Class A | | | 401,455 | |
Class B | | | 19,750 | |
Class C | | | 98,378 | |
Administrator Class | | | 92,624 | |
Distribution fees | | | | |
Class B | | | 59,249 | |
Class C | | | 295,134 | |
Custody and accounting fees | | | 103,035 | |
Professional fees | | | 68,021 | |
Registration fees | | | 56,239 | |
Shareholder report expenses | | | 50,158 | |
Trustees’ fees and expenses | | | 17,456 | |
Other fees and expenses | | | 25,417 | |
| | | | |
Total expenses | | | 4,248,715 | |
Less: Fee waivers and/or expense reimbursements | | | (59,817 | ) |
| | | | |
Net expenses | | | 4,188,898 | |
| | | | |
Net investment income | | | 419,069 | |
| | | | |
| |
REALIZED AND UNREALIZED GAINS (LOSSES) ON INVESTMENTS | | | | |
| |
Net realized gains on: | | | | |
Unaffiliated securities | | | 10,394,755 | |
Forward foreign currency contract transactions | | | 214,346 | |
| | | | |
Net realized gains on investments | | | 10,609,101 | |
| | | | |
| |
Net change in unrealized gains (losses) on: | | | | |
Unaffiliated securities | | | (5,169,652 | ) |
Forward foreign currency contract transactions | | | (224,896 | ) |
| | | | |
Net change in unrealized gains (losses) on investments | | | (5,394,548 | ) |
| | | | |
Net realized and unrealized gains (losses) on investments | | | 5,214,553 | |
| | | | |
Net increase in net assets resulting from operations | | $ | 5,633,622 | |
| | | | |
The accompanying notes are an integral part of these financial statements.
| | | | | | |
| Statement of changes in net assets | | Wells Fargo Global Opportunities Fund | | | 15 | |
| | | | | | | | | | | | | | | | |
| | | | | | Year ended
October 31, 2015 | | | | | | Year ended
October 31, 2014 | |
| | | | |
Operations | | | | | | | | | | | | | | | | |
Net investment income (loss) | | | | | | $ | 419,069 | | | | | | | $ | (166,255 | ) |
Net realized gains on investments | | | | | | | 10,609,101 | | | | | | | | 43,058,242 | |
Net change in unrealized gains (losses) on investments | | | | | | | (5,394,548 | ) | | | | | | | (36,690,231 | ) |
| | | | |
Net increase in net assets resulting from operations | | | | | | | 5,633,622 | | | | | | | | 6,201,756 | |
| | | | |
| | | | |
Distributions to shareholders from | | | | | | | | | | | | | | | | |
Net investment income | | | | | | | | | | | | | | | | |
Class A | | | | | | | (112,091 | ) | | | | | | | (1,289,731 | ) |
Class C | | | | | | | 0 | | | | | | | | (17,006 | ) |
Administrator Class | | | | | | | (31,925 | ) | | | | | | | (475,665 | ) |
Institutional Class | | | | | | | (45,625 | ) | | | | | | | (23,151 | ) |
Net realized gains | | | | | | | | | | | | | | | | |
Class A | | | | | | | (25,688,232 | ) | | | | | | | 0 | |
Class B | | | | | | | (2,100,714 | ) | | | | | | | 0 | |
Class C | | | | | | | (7,981,435 | ) | | | | | | | 0 | |
Administrator Class | | | | | | | (5,573,313 | ) | | | | | | | 0 | |
Institutional Class | | | | | | | (1,170,657 | ) | | | | | | | 0 | |
| | | | |
Total distributions to shareholders | | | | | | | (42,703,992 | ) | | | | | | | (1,805,553 | ) |
| | | | |
| | | | |
Capital share transactions | | | Shares | | | | | | | | Shares | | | | | |
Proceeds from shares sold | | | | | | | | | | | | | | | | |
Class A | | | 385,971 | | | | 14,800,661 | | | | 339,559 | | | | 14,931,283 | |
Class B | | | 2,614 | | | | 75,178 | | | | 4,025 | | | | 140,530 | |
Class C | | | 83,130 | | | | 2,405,203 | | | | 55,031 | | | | 1,941,771 | |
Administrator Class | | | 192,685 | | | | 7,651,580 | | | | 300,922 | | | | 13,658,466 | |
Institutional Class | | | 207,276 | | | | 8,364,650 | | | | 87,544 | | | | 4,024,855 | |
| | | | |
| | | | | | | 33,297,272 | | | | | | | | 34,696,905 | |
| | | | |
Reinvestment of distributions | | | | | | | | | | | | | | | | |
Class A | | | 656,362 | | | | 23,808,617 | | | | 27,164 | | | | 1,188,435 | |
Class B | | | 73,234 | | | | 2,024,915 | | | | 0 | | | | 0 | |
Class C | | | 236,312 | | | | 6,574,187 | | | | 392 | | | | 13,875 | |
Administrator Class | | | 146,011 | | | | 5,492,203 | | | | 9,728 | | | | 438,256 | |
Institutional Class | | | 21,540 | | | | 812,381 | | | | 514 | | | | 23,151 | |
| | | | |
| | | | | | | 38,712,303 | | | | | | | | 1,663,717 | |
| | | | |
Payment for shares redeemed | | | | | | | | | | | | | | | | |
Class A | | | (830,863 | ) | | | (31,796,199 | ) | | | (761,396 | ) | | | (33,410,938 | ) |
Class B | | | (267,575 | ) | | | (7,895,832 | ) | | | (232,231 | ) | | | (8,230,660 | ) |
Class C | | | (244,958 | ) | | | (7,212,225 | ) | | | (152,969 | ) | | | (5,417,774 | ) |
Administrator Class | | | (726,799 | ) | | | (30,614,585 | ) | | | (292,897 | ) | | | (13,293,051 | ) |
Institutional Class | | | (78,685 | ) | | | (3,130,872 | ) | | | (18,605 | ) | | | (837,713 | ) |
| | | | |
| | | | | | | (80,649,713 | ) | | | | | | | (61,190,136 | ) |
| | | | |
Net decrease in net assets resulting from capital share transactions | | | | | | | (8,640,138 | ) | | | | | | | (24,829,514 | ) |
| | | | |
Total decrease in net assets | | | | | | | (45,710,508 | ) | | | | | | | (20,433,311 | ) |
| | | | |
| | | | |
Net assets | | | | | | | | | | | | | | | | |
Beginning of period | | | | | | | 280,006,752 | | | | | | | | 300,440,063 | |
| | | | |
End of period | | | | | | $ | 234,296,244 | | | | | | | $ | 280,006,752 | |
| | | | |
Undistributed (accumulated) net investment income (loss) | | | | | | $ | 1,188,486 | | | | | | | $ | (57,884 | ) |
| | | | |
The accompanying notes are an integral part of these financial statements.
| | | | |
| 16 | | Wells Fargo Global Opportunities Fund | | Financial highlights |
(For a share outstanding throughout each period)
| | | | | | | | | | | | | | | | | | | | |
| | | Year ended October 31 | |
| CLASS A | | 2015 | | | 2014 | | | 2013 | | | 2012 | | | 2011 | |
Net asset value, beginning of period | | | $43.26 | | | | $42.68 | | | | $33.17 | | | | $30.14 | | | | $31.91 | |
Net investment income | | | 0.10 | 1 | | | 0.03 | 1 | | | 0.16 | 1 | | | 0.20 | 1 | | | 0.12 | 1 |
Net realized and unrealized gains (losses) on investments | | | 0.64 | | | | 0.86 | | | | 9.58 | | | | 2.87 | | | | (1.89 | ) |
| | | | | | | | | | | | | | | | | | | | |
Total from investment operations | | | 0.74 | | | | 0.89 | | | | 9.74 | | | | 3.07 | | | | (1.77 | ) |
Distributions to shareholders from | | | | | | | | | | | | | | | | | | | | |
Net investment income | | | (0.03 | ) | | | (0.31 | ) | | | (0.23 | ) | | | (0.04 | ) | | | 0.00 | |
Net realized gains | | | (6.74 | ) | | | 0.00 | | | | 0.00 | | | | 0.00 | | | | 0.00 | |
| | | | | | | | | | | | | | | | | | | | |
Total distributions to shareholders | | | (6.77 | ) | | | (0.31 | ) | | | (0.23 | ) | | | (0.04 | ) | | | 0.00 | |
Net asset value, end of period | | | $37.23 | | | | $43.26 | | | | $42.68 | | | | $33.17 | | | | $30.14 | |
Total return2 | | | 2.12 | % | | | 2.07 | % | | | 29.50 | % | | | 10.24 | %�� | | | (5.55 | )% |
Ratios to average net assets (annualized) | | | | | | | | | | | | | | | | | | | | |
Gross expenses | | | 1.57 | % | | | 1.57 | % | | | 1.59 | % | | | 1.55 | % | | | 1.55 | % |
Net expenses | | | 1.55 | % | | | 1.55 | % | | | 1.55 | % | | | 1.54 | % | | | 1.53 | % |
Net investment income | | | 0.27 | % | | | 0.06 | % | | | 0.43 | % | | | 0.65 | % | | | 0.34 | % |
Supplemental data | | | | | | | | | | | | | | | | | | | | |
Portfolio turnover rate | | | 42 | % | | | 66 | % | | | 59 | % | | | 85 | % | | | 76 | % |
Net assets, end of period (000s omitted) | | | $151,740 | | | | $167,166 | | | | $181,764 | | | | $156,433 | | | | $174,937 | |
| 1 | Calculated based upon average shares outstanding |
| 2 | Total return calculations do not include any sales charges. |
The accompanying notes are an integral part of these financial statements.
| | | | | | |
| Financial highlights | | Wells Fargo Global Opportunities Fund | | | 17 | |
(For a share outstanding throughout each period)
| | | | | | | | | | | | | | | | | | | | |
| | | Year ended October 31 | |
| CLASS B | | 2015 | | | 2014 | | | 2013 | | | 2012 | | | 2011 | |
Net asset value, beginning of period | | | $34.62 | | | | $34.18 | | | | $26.58 | | | | $24.30 | | | | $25.92 | |
Net investment loss | | | (0.14 | )1 | | | (0.25 | )1 | | | (0.09 | )1 | | | (0.03 | )1 | | | (0.12 | )1 |
Net realized and unrealized gains (losses) on investments | | | 0.47 | | | | 0.69 | | | | 7.69 | | | | 2.31 | | | | (1.50 | ) |
| | | | | | | | | | | | | | | | | | | | |
Total from investment operations | | | 0.33 | | | | 0.44 | | | | 7.60 | | | | 2.28 | | | | (1.62 | ) |
Distributions to shareholders from | | | | | | | | | | | | | | | | | | | | |
Net realized gains | | | (6.74 | ) | | | 0.00 | | | | 0.00 | | | | 0.00 | | | | 0.00 | |
Net asset value, end of period | | | $28.21 | | | | $34.62 | | | | $34.18 | | | | $26.58 | | | | $24.30 | |
Total return2 | | | 1.34 | % | | | 1.29 | % | | | 28.54 | % | | | 9.42 | % | | | (6.25 | )% |
Ratios to average net assets (annualized) | | | | | | | | | | | | | | | | | | | | |
Gross expenses | | | 2.32 | % | | | 2.32 | % | | | 2.34 | % | | | 2.30 | % | | | 2.30 | % |
Net expenses | | | 2.30 | % | | | 2.30 | % | | | 2.30 | % | | | 2.29 | % | | | 2.28 | % |
Net investment loss | | | (0.49 | )% | | | (0.71 | )% | | | (0.32 | )% | | | (0.10 | )% | | | (0.43 | )% |
Supplemental data | | | | | | | | | | | | | | | | | | | | |
Portfolio turnover rate | | | 42 | % | | | 66 | % | | | 59 | % | | | 85 | % | | | 76 | % |
Net assets, end of period (000s omitted) | | | $4,206 | | | | $11,799 | | | | $19,446 | | | | $21,181 | | | | $26,598 | |
| 1 | Calculated based upon average shares outstanding |
| 2 | Total return calculations do not include any sales charges. |
The accompanying notes are an integral part of these financial statements.
| | | | |
| 18 | | Wells Fargo Global Opportunities Fund | | Financial highlights |
(For a share outstanding throughout each period)
| | | | | | | | | | | | | | | | | | | | |
| | | Year ended October 31 | |
| CLASS C | | 2015 | | | 2014 | | | 2013 | | | 2012 | | | 2011 | |
Net asset value, beginning of period | | | $34.80 | | | | $34.36 | | | | $26.73 | | | | $24.43 | | | | $26.05 | |
Net investment loss | | | (0.14 | )1 | | | (0.24 | )1 | | | (0.09 | )1 | | | (0.03 | )1 | | | (0.11 | )1 |
Net realized and unrealized gains (losses) on investments | | | 0.47 | | | | 0.69 | | | | 7.72 | | | | 2.33 | | | | (1.51 | ) |
| | | | | | | | | | | | | | | | | | | | |
Total from investment operations | | | 0.33 | | | | 0.45 | | | | 7.63 | | | | 2.30 | | | | (1.62 | ) |
Distributions to shareholders from | | | | | | | | | | | | | | | | | | | | |
Net investment income | | | 0.00 | | | | (0.01 | ) | | | 0.00 | | | | 0.00 | | | | 0.00 | |
Net realized gains | | | (6.74 | ) | | | 0.00 | | | | 0.00 | | | | 0.00 | | | | 0.00 | |
| | | | | | | | | | | | | | | | | | | | |
Total distributions to shareholders | | | (6.74 | ) | | | (0.01 | ) | | | 0.00 | | | | 0.00 | | | | 0.00 | |
Net asset value, end of period | | | $28.39 | | | | $34.80 | | | | $34.36 | | | | $26.73 | | | | $24.43 | |
Total return2 | | | 1.34 | % | | | 1.32 | % | | | 28.54 | % | | | 9.41 | % | | | (6.25 | )% |
Ratios to average net assets (annualized) | | | | | | | | | | | | | | | | | | | | |
Gross expenses | | | 2.32 | % | | | 2.32 | % | | | 2.34 | % | | | 2.30 | % | | | 2.30 | % |
Net expenses | | | 2.30 | % | | | 2.30 | % | | | 2.30 | % | | | 2.29 | % | | | 2.28 | % |
Net investment loss | | | (0.48 | )% | | | (0.69 | )% | | | (0.31 | )% | | | (0.11 | )% | | | (0.41 | )% |
Supplemental data | | | | | | | | | | | | | | | | | | | | |
Portfolio turnover rate | | | 42 | % | | | 66 | % | | | 59 | % | | | 85 | % | | | 76 | % |
Net assets, end of period (000s omitted) | | | $36,215 | | | | $41,792 | | | | $44,618 | | | | $37,753 | | | | $45,135 | |
| 1 | Calculated based upon average shares outstanding |
| 2 | Total return calculations do not include any sales charges. |
The accompanying notes are an integral part of these financial statements.
| | | | | | |
| Financial highlights | | Wells Fargo Global Opportunities Fund | | | 19 | |
(For a share outstanding throughout each period)
| | | | | | | | | | | | | | | | | | | | |
| | | Year ended October 31 | |
| ADMINISTRATOR CLASS | | 2015 | | | 2014 | | | 2013 | | | 2012 | | | 2011 | |
Net asset value, beginning of period | | | $44.60 | | | | $44.00 | | | | $34.21 | | | | $31.10 | | | | $32.92 | |
Net investment income | | | 0.16 | 1 | | | 0.09 | | | | 0.22 | 1 | | | 0.26 | 1 | | | 0.15 | |
Net realized and unrealized gains (losses) on investments | | | 0.66 | | | | 0.90 | | | | 9.86 | | | | 2.96 | | | | (1.93 | ) |
| | | | | | | | | | | | | | | | | | | | |
Total from investment operations | | | 0.82 | | | | 0.99 | | | | 10.08 | | | | 3.22 | | | | (1.78 | ) |
Distributions to shareholders from | | | | | | | | | | | | | | | | | | | | |
Net investment income | | | (0.03 | ) | | | (0.39 | ) | | | (0.29 | ) | | | (0.11 | ) | | | (0.04 | ) |
Net realized gains | | | (6.74 | ) | | | 0.00 | | | | 0.00 | | | | 0.00 | | | | 0.00 | |
| | | | | | | | | | | | | | | | | | | | |
Total distributions to shareholders | | | (6.77 | ) | | | (0.39 | ) | | | (0.29 | ) | | | (0.11 | ) | | | (0.04 | ) |
Net asset value, end of period | | | $38.65 | | | | $44.60 | | | | $44.00 | | | | $34.21 | | | | $31.10 | |
Total return | | | 2.27 | % | | | 2.22 | % | | | 29.73 | % | | | 10.44 | % | | | (5.39 | )% |
Ratios to average net assets (annualized) | | | | | | | | | | | | | | | | | | | | |
Gross expenses | | | 1.43 | % | | | 1.41 | % | | | 1.42 | % | | | 1.38 | % | | | 1.37 | % |
Net expenses | | | 1.40 | % | | | 1.40 | % | | | 1.40 | % | | | 1.38 | % | | | 1.36 | % |
Net investment income | | | 0.41 | % | | | 0.22 | % | | | 0.58 | % | | | 0.81 | % | | | 0.53 | % |
Supplemental data | | | | | | | | | | | | | | | | | | | | |
Portfolio turnover rate | | | 42 | % | | | 66 | % | | | 59 | % | | | 85 | % | | | 76 | % |
Net assets, end of period (000s omitted) | | | $31,765 | | | | $53,966 | | | | $52,461 | | | | $44,360 | | | | $49,860 | |
| 1 | Calculated based upon average shares outstanding |
The accompanying notes are an integral part of these financial statements.
| | | | |
| 20 | | Wells Fargo Global Opportunities Fund | | Financial highlights |
(For a share outstanding throughout each period)
| | | | | | | | | | | | | | | | | | | | |
| | | Year ended October 31 | |
| INSTITUTIONAL CLASS | | 2015 | | | 2014 | | | 2013 | | | 2012 | | | 2011 | |
Net asset value, beginning of period | | | $44.67 | | | | $44.05 | | | | $34.25 | | | | $31.18 | | | | $32.94 | |
Net investment income | | | 0.20 | | | | 0.15 | | | | 0.32 | 1 | | | 0.36 | 1 | | | 0.25 | |
Net realized and unrealized gains (losses) on investments | | | 0.72 | | | | 0.96 | | | | 9.86 | | | | 2.93 | | | | (1.94 | ) |
| | | | | | | | | | | | | | | | | | | | |
Total from investment operations | | | 0.92 | | | | 1.11 | | | | 10.18 | | | | 3.29 | | | | (1.69 | ) |
Distributions to shareholders from | | | | | | | | | | | | | | | | | | | | |
Net investment income | | | (0.22 | ) | | | (0.49 | ) | | | (0.38 | ) | | | (0.22 | ) | | | (0.07 | ) |
Net realized gains | | | (6.74 | ) | | | 0.00 | | | | 0.00 | | | | 0.00 | | | | 0.00 | |
| | | | | | | | | | | | | | | | | | | | |
Total distributions to shareholders | | | (6.96 | ) | | | (0.49 | ) | | | (0.38 | ) | | | (0.22 | ) | | | (0.07 | ) |
Net asset value, end of period | | | $38.63 | | | | $44.67 | | | | $44.05 | | | | $34.25 | | | | $31.18 | |
Total return | | | 2.53 | % | | | 2.48 | % | | | 30.06 | % | | | 10.70 | % | | | (5.15 | )% |
Ratios to average net assets (annualized) | | | | | | | | | | | | | | | | | | | | |
Gross expenses | | | 1.18 | % | | | 1.14 | % | | | 1.16 | % | | | 1.12 | % | | | 1.08 | % |
Net expenses | | | 1.15 | % | | | 1.14 | % | | | 1.15 | % | | | 1.12 | % | | | 1.08 | % |
Net investment income | | | 0.66 | % | | | 0.47 | % | | | 0.83 | % | | | 1.13 | % | | | 1.18 | % |
Supplemental data | | | | | | | | | | | | | | | | | | | | |
Portfolio turnover rate | | | 42 | % | | | 66 | % | | | 59 | % | | | 85 | % | | | 76 | % |
Net assets, end of period (000s omitted) | | | $10,369 | | | | $5,284 | | | | $2,151 | | | | $1,263 | | | | $1,486 | |
| 1 | Calculated based upon average shares outstanding |
The accompanying notes are an integral part of these financial statements.
| | | | | | |
| Notes to financial statements | | Wells Fargo Global Opportunities Fund | | | 21 | |
1. ORGANIZATION
Wells Fargo Funds Trust (the “Trust”), a Delaware statutory trust organized on March 10, 1999, is an open-end management investment company registered under the Investment Company Act of 1940, as amended (the “1940 Act”). As an investment company, the Trust follows the accounting and reporting guidance in Financial Accounting Standards Board (“FASB”) Accounting Standards Codification Topic 946, Financial Services – Investment Companies. These financial statements report on the Wells Fargo Global Opportunities Fund (the “Fund”) which is a diversified series of the Trust.
2. SIGNIFICANT ACCOUNTING POLICIES
The following significant accounting policies, which are consistently followed in the preparation of the financial statements of the Fund, are in conformity with U.S. generally accepted accounting principles which require management to make estimates and assumptions that affect the reported amounts of assets and liabilities, disclosure of contingent assets and liabilities at the date of the financial statements, and the reported amounts of revenues and expenses during the reporting period. Actual results could differ from those estimates.
Securities valuation
All investments are valued each business day as of the close of regular trading on the New York Stock Exchange (generally 4 p.m. Eastern Time).
Equity securities that are listed on a foreign or domestic exchange or market are valued at the official closing price or, if none, the last sales price. If no sale occurs on the primary exchange or market that day, the prior day’s price will be deemed “stale” and a fair value price will be determined in accordance with the Fund’s Valuation Procedures.
Equity securities that are not listed on a foreign or domestic exchange or market, but have a public trading market, are valued at the quoted bid price from an independent broker-dealer that the Management Valuation Team of Wells Fargo Funds Management, LLC (“Funds Management”) has determined is an acceptable source.
The values of securities denominated in foreign currencies are translated into U.S. dollars at rates provided by an independent foreign currency pricing source at a time each business day specified by the Management Valuation Team.
Many securities markets and exchanges outside the U.S. close prior to the close of the New York Stock Exchange and therefore may not fully reflect trading or events that occur after the close of the principal exchange in which the foreign securities are traded, but before the close of the New York Stock Exchange. If such trading or events are expected to materially affect the value of such securities, then fair value pricing procedures approved by the Board of Trustees of the Fund are applied. These procedures take into account multiple factors including movements in U.S. securities markets after foreign exchanges close. Foreign securities that are fair valued under these procedures are categorized as Level 2 and the application of these procedures may result in transfers between Level 1 and Level 2. Depending on market activity, such fair valuations may be frequent. Such fair value pricing may result in net asset values that are higher or lower than net asset values based on the last reported sales price or latest quoted bid price. On October 31, 2015, such fair value pricing was used in pricing foreign securities.
Investments in registered open-end investment companies are valued at net asset value. Interests in non-registered investment vehicles that are redeemable at net asset value are fair valued at net asset value when available
Investments which are not valued using any of the methods discussed above are valued at their fair value, as determined in good faith by the Board of Trustees. The Board of Trustees has established a Valuation Committee comprised of the Trustees and has delegated to it the authority to take any actions regarding the valuation of portfolio securities that the Valuation Committee deems necessary or appropriate, including determining the fair value of portfolio securities, unless the determination has been delegated to the Management Valuation Team. The Board of Trustees retains the authority to make or ratify any valuation decisions or approve any changes to the Valuation Procedures as it deems appropriate. On a quarterly basis, the Board of Trustees receives reports on any valuation actions taken by the Valuation Committee or the Management Valuation Team which may include items for ratification.
Valuations of fair valued securities are compared to the next actual sales price when available, or other appropriate market values, to assess the continued appropriateness of the fair valuation methodologies used. These securities are fair valued on a day-to-day basis, taking into consideration changes to appropriate market information and any significant changes to the inputs considered in the valuation process until there is a readily available price provided on an exchange or by an independent pricing service. Valuations received from an independent pricing service or independent broker-dealer quotes are periodically validated by comparisons to most recent trades and valuations provided by other independent pricing services in addition to the review of prices by the manager and/or subadviser. Unobservable inputs
| | | | |
| 22 | | Wells Fargo Global Opportunities Fund | | Notes to financial statements |
used in determining fair valuations are identified based on the type of security, taking into consideration factors utilized by market participants in valuing the investment, knowledge about the issuer and the current market environment.
Foreign currency translation
The accounting records of the Fund are maintained in U.S. dollars. The values of other assets and liabilities denominated in foreign currencies are translated into U.S. dollars at rates provided by an independent foreign currency pricing source at a time each business day specified by the Management Valuation Team. Purchases and sales of securities, and income and expenses are converted at the rate of exchange on the respective dates of such transactions. Net realized foreign exchange gains or losses arise from sales of foreign currencies, currency gains or losses realized between the trade and settlement dates on securities transactions, and the difference between the amounts of dividends, interest and foreign withholding taxes recorded and the U.S. dollar equivalent of the amounts actually paid or received. Net unrealized foreign exchange gains and losses arise from changes in the fair value of assets and liabilities other than investments in securities resulting from changes in exchange rates. The changes in net assets arising from changes in exchange rates and the changes in net assets resulting from changes in market prices of securities are not separately presented. Such changes are included in net realized and unrealized gains or losses from investments.
Forward foreign currency contracts
The Fund is subject to foreign currency exchange rate risk in the normal course of pursuing its investment objectives. A forward foreign currency contract is an agreement between two parties to purchase or sell a specific currency for an agreed-upon price at a future date. The Fund enters into forward foreign currency contracts to facilitate transactions in foreign-denominated securities and to attempt to minimize the risk to the Fund from adverse changes in the relationship between currencies. Forward foreign currency contracts are recorded at the forward rate and marked-to-market daily. When the contracts are closed, realized gains and losses arising from such transactions are recorded as realized gains or losses on forward foreign currency contract transactions. The Fund could be exposed to risks if the counterparties to the contracts are unable to meet the terms of their contracts or if the value of the foreign currency changes unfavorably. The Fund’s maximum risk of loss from counterparty credit risk is the unrealized gains on the contracts. This risk may be mitigated if there is a master netting arrangement between the Fund and the counterparty.
Security loans
The Fund may lend its securities from time to time in order to earn additional income in the form of fees or interest on securities received as collateral or the investment of any cash received as collateral. The Fund continues to receive interest or dividends on the securities loaned. The Fund receives collateral in the form of cash or securities with a value at least equal to the value of the securities on loan. The value of the loaned securities is determined at the close of each business day and any additional required collateral is delivered to the Fund on the next business day. In a securities lending transaction, the net asset value of the Fund will be affected by an increase or decrease in the value of the securities loaned and by an increase or decrease in the value of the instrument in which collateral is invested. The amount of securities lending activity undertaken by the Fund fluctuates from time to time. In the event of default or bankruptcy by the borrower, the Fund may be prevented from recovering the loaned securities or gaining access to the collateral or may experience delays or costs in doing so. In addition, the investment of any cash collateral received may lose all or part of its value. The Fund has the right under the lending agreement to recover the securities from the borrower on demand.
The Fund lends its securities through an unaffiliated securities lending agent. Cash collateral received in connection with its securities lending transactions is invested in Securities Lending Cash Investments, LLC (the “Securities Lending Fund”). The Securities Lending Fund is exempt from registration under Section 3(c)(7) of the 1940 Act and is managed by Funds Management and is subadvised by Wells Capital Management Incorporated (“WellsCap”). Funds Management receives an advisory fee starting at 0.05% and declining to 0.01% as the average daily net assets of the Securities Lending Fund increase. All of the fees received by Funds Management are paid to WellsCap for its services as subadviser. The Securities Lending Fund seeks to provide a positive return compared to the daily Fed Funds Open rate by investing in high-quality, U.S. dollar-denominated short-term money market instruments. Securities Lending Fund investments are fair valued based upon the amortized cost valuation technique. Income earned from investment in the Securities Lending Fund is included in securities lending income on the Statement of Operations.
Security transactions and income recognition
Securities transactions are recorded on a trade date basis. Realized gains or losses are recorded on the basis of identified cost.
Dividend income is recognized on the ex-dividend date, except for certain dividends from foreign securities, which are recorded as soon as the custodian verifies the ex-dividend date. Dividend income from foreign securities is recorded net of foreign taxes withheld where recovery of such taxes is not assured.
| | | | | | |
| Notes to financial statements | | Wells Fargo Global Opportunities Fund | | | 23 | |
Distributions to shareholders
Distributions to shareholders from net investment income and net realized gains, if any, are recorded on the ex-dividend date. Such distributions are determined in conformity with federal income tax regulations, which may differ in amount or character from net investment income and realized gains recognized for purposes of U.S. generally accepted accounting principles.
Federal and other taxes
The Fund intends to continue to qualify as a regulated investment company by distributing substantially all of its investment company taxable income and any net realized capital gains (after reduction for capital loss carryforwards) sufficient to relieve it from all, or substantially all, federal income taxes. Accordingly, no provision for federal income taxes was required.
The Fund’s income and federal excise tax returns and all financial records supporting those returns for the prior three fiscal years are subject to examination by the federal and Delaware revenue authorities. Management has analyzed the Fund’s tax positions taken on federal, state, and foreign tax returns for all open tax years and does not believe that there are any uncertain tax positions that require recognition of a tax liability.
Reclassifications are made to the Fund’s capital accounts for permanent tax differences to reflect income and gains available for distribution (or available capital loss carryforwards) under federal income tax regulations. U.S. generally accepted accounting principles require that certain components of net assets be adjusted to reflect permanent differences between financial and tax reporting. These reclassifications have no effect on net assets or net asset values per share. The primary permanent differences causing such reclassifications are due to foreign currency transactions and passive foreign investment companies. At October 31, 2015, as a result of permanent book-to-tax differences, the following reclassification adjustments were made on the Statement of Assets and Liabilities:
| | |
Undistributed net investment income | | Accumulated net realized gains on investments |
| $1,016,942 | | $(1,016,942) |
Class allocations
The separate classes of shares offered by the Fund differ principally in applicable sales charges, distribution, shareholder servicing, and administration fees. Class specific expenses are charged directly to that share class. Investment income, common expenses, and realized and unrealized gains (losses) on investments are allocated daily to each class of shares based on the relative proportion of net assets of each class.
3. FAIR VALUATION MEASUREMENTS
Fair value measurements of investments are determined within a framework that has established a fair value hierarchy based upon the various data inputs utilized in determining the value of the Fund’s investments. The three-level hierarchy gives the highest priority to unadjusted quoted prices in active markets for identical assets or liabilities (Level 1) and the lowest priority to significant unobservable inputs (Level 3). The Fund’s investments are classified within the fair value hierarchy based on the lowest level of input that is significant to the fair value measurement. The inputs are summarized into three broad levels as follows:
| n | | Level 1 – quoted prices in active markets for identical securities |
| n | | Level 2 – other significant observable inputs (including quoted prices for similar securities, interest rates, prepayment speeds, credit risk, use of amortized cost, etc.) |
| n | | Level 3 – significant unobservable inputs (including the Fund’s own assumptions in determining the fair value of investments) |
The inputs or methodologies used for valuing investments in securities are not necessarily an indication of the risk associated with investing in those securities.
| | | | |
| 24 | | Wells Fargo Global Opportunities Fund | | Notes to financial statements |
The following is a summary of the inputs used in valuing the Fund’s assets and liabilities as of October 31, 2015:
| | | | | | | | | | | | | | | | |
| | | Quoted prices (Level 1) | | | Other significant
observable inputs
(Level 2) | | | Significant
unobservable inputs
(Level 3) | | | Total | |
Assets | | | | | | | | | | | | | | | | |
Investments in: | | | | | | | | | | | | | | | | |
| | | | |
Common stocks | | | | | | | | | | | | | | | | |
Austria | | $ | 0 | | | $ | 1,563,334 | | | $ | 0 | | | $ | 1,563,334 | |
Canada | | | 14,764,440 | | | | 2,248 | | | | 0 | | | | 14,766,688 | |
China | | | 0 | | | | 0 | | | | 1,219,504 | | | | 1,219,504 | |
Denmark | | | 0 | | | | 1,392,218 | | | | 0 | | | | 1,392,218 | |
France | | | 982,488 | | | | 7,778,104 | | | | 0 | | | | 8,760,592 | |
Germany | | | 0 | | | | 11,422,137 | | | | 0 | | | | 11,422,137 | |
Hong Kong | | | 0 | | | | 2,419,969 | | | | 0 | | | | 2,419,969 | |
Israel | | | 1,419,990 | | | | 0 | | | | 0 | | | | 1,419,990 | |
Italy | | | 0 | | | | 2,672,132 | | | | 0 | | | | 2,672,132 | |
Japan | | | 0 | | | | 17,988,895 | | | | 0 | | | | 17,988,895 | |
Netherlands | | | 0 | | | | 4,667,331 | | | | 0 | | | | 4,667,331 | |
Norway | | | 0 | | | | 1,170,876 | | | | 0 | | | | 1,170,876 | |
South Korea | | | 0 | | | | 1,449,568 | | | | 0 | | | | 1,449,568 | |
Spain | | | 0 | | | | 3,952,319 | | | | 0 | | | | 3,952,319 | |
Sweden | | | 1,213,811 | | | | 0 | | | | 0 | | | | 1,213,811 | |
Switzerland | | | 0 | | | | 5,444,727 | | | | 0 | | | | 5,444,727 | |
United Kingdom | | | 7,036,417 | | | | 12,214,459 | | | | 0 | | | | 19,250,876 | |
United States | | | 123,421,299 | | | | 1,843,963 | | | | 0 | | | | 125,265,262 | |
| | | | |
Preferred stocks | | | | | | | | | | | | | | | | |
Germany | | | 0 | | | | 939,838 | | | | 0 | | | | 939,838 | |
| | | | |
Short-term investments | | | | | | | | | | | | | | | | |
Investment companies | | | 8,536,183 | | | | 8,920,925 | | | | 0 | | | | 17,457,108 | |
Total assets | | $ | 157,374,628 | | | $ | 85,843,043 | | | $ | 1,219,504 | | | $ | 244,437,175 | |
The Fund recognizes transfers between levels within the fair value hierarchy at the end of the reporting period. At October 31, 2015, fair value pricing was used in pricing certain foreign securities and securities valued at $57,844,944 were transferred from Level 1 to Level 2. The Fund did not have any transfers into/out of Level 3.
4. TRANSACTIONS WITH AFFILIATES
Management fee
Funds Management, an indirect wholly owned subsidiary of Wells Fargo & Company (“Wells Fargo”), is the manager of the Fund and provides advisory and fund-level administrative services under an investment management agreement. Under the investment management agreement, Funds Management is responsible for, among other services, implementing the investment objectives and strategies of the Fund, supervising the applicable subadviser, providing fund-level administrative services in connection with the Fund’s operations, and providing any other fund-level administrative services reasonably necessary for the operation of the Fund. As compensation for its services under the investment management agreement, Funds Management is entitled to receive an annual management fee starting at 0.95% and declining to 0.83% as the average daily net assets of the Fund increase.
Prior to July 1, 2015, Funds Management provided advisory services pursuant to an investment advisory agreement and was entitled to receive an annual fee which started at 0.90% and declined to 0.80% as the average daily net assets of the Fund increased. In addition, fund-level administrative services were provided by Funds Management under a separate administration agreement at an annual fee which started at 0.05% and declined to 0.03% as the average daily net assets of the Fund increased. For financial statement purposes, the advisory fee and fund-level administration fee for the year ended October 31, 2015 have been included in management fee on the Statement of Operations.
For the year ended October 31, 2015, the management fee was equivalent to an annual rate of 0.95% of the Fund’s average daily net assets.
| | | | | | |
| Notes to financial statements | | Wells Fargo Global Opportunities Fund | | | 25 | |
Funds Management has retained the services of a subadviser to provide daily portfolio management to the Fund. The fee for subadvisory services is borne by Funds Management. WellsCap, an affiliate of Funds Management and an indirect wholly owned subsidiary of Wells Fargo, is the subadviser to the Fund and is entitled to receive a fee from Funds Management at an annual rate starting at 0.55% and declining to 0.40% as the average daily net assets of the Fund increase.
Administration fees
Under a class-level administration agreement, Funds Management provides class-level administrative services to the Fund, which includes paying fees and expenses for services provided by the transfer agent, sub-transfer agents, omnibus account servicers and record-keepers. As compensation for its services under the class-level administration agreement, Funds Management receives an annual fee which is calculated based on the average daily net assets of each class as follows:
| | | | | | | | |
| | | Class-level administration fee | |
| | | Current rate | | | Rate prior to
July 1, 2015 | |
Class A, Class B, Class C | | | 0.21 | % | | | 0.26 | % |
Administrator Class | | | 0.13 | | | | 0.10 | |
Institutional Class | | | 0.13 | | | | 0.08 | |
Funds Management has contractually waived and/or reimbursed management and administration fees to the extent necessary to maintain certain net operating expense ratios for the Fund. Waiver of fees and/or reimbursement of expenses by Funds Management were made first from fund level expenses on a proportionate basis and then from class specific expenses. Funds Management has committed through February 29, 2016 to waive fees and/or reimburse expenses to the extent necessary to cap the Fund’s expenses at 1.55% for Class A shares, 2.30% for Class B shares, 2.30% for Class C shares, 1.40% for Administrator Class shares, and 1.15% for Institutional Class shares. After this time, the cap may be increased or the commitment to maintain the cap may be terminated only with the approval of the Board of Trustees.
Distribution fees
The Trust has adopted a distribution plan for Class B and Class C shares of the Fund pursuant to Rule 12b-1 under the 1940 Act. Distribution fees are charged to Class B and Class C shares and paid to Wells Fargo Funds Distributor, LLC (“Funds Distributor”), the principal underwriter, at an annual rate of 0.75% of the average daily net assets of Class B and Class C shares.
In addition, Funds Distributor is entitled to receive the front-end sales charge from the purchase of Class A shares and a contingent deferred sales charge on the redemption of certain Class A shares. Funds Distributor is also entitled to receive the contingent deferred sales charges from redemptions of Class B and Class C shares. For the year ended October 31, 2015, Funds Distributor received $ 3,833 from the sale of Class A shares and $320 and $152 in contingent deferred sales charges from redemptions of Class B and Class C shares, respectively.
Shareholder servicing fees
The Trust has entered into contracts with one or more shareholder servicing agents, whereby Class A, Class B, Class C, and Administrator Class of the Fund is charged a fee at an annual rate of 0.25% of the average daily net assets of each respective class.
A portion of these total shareholder servicing fees were paid to affiliates of Wells Fargo.
5. INVESTMENT PORTFOLIO TRANSACTIONS
Purchases and sales of investments, excluding U.S. government obligations (if any) and short-term securities, for the year ended October 31, 2015 were $100,635,136 and $144,761,173, respectively.
6. DERIVATIVE TRANSACTIONS
During the year ended October 31, 2015, the Fund entered into forward foreign currency contracts for economic hedging purposes.
As of October 31, 2015, the Fund did not have any open forward foreign currency contracts. The Fund had average contract amounts of $443,410 and $484,485 in forward foreign currency contracts to buy and forward foreign currency contracts to sell, respectively, during the year ended October 31, 2015.
| | | | |
| 26 | | Wells Fargo Global Opportunities Fund | | Notes to financial statements |
The fair value, realized gains or losses and change in unrealized gains or losses, if any, on derivative instruments are reflected in the appropriate financial statements.
7. BANK BORROWINGS
The Trust (excluding the money market funds) and Wells Fargo Variable Trust are parties to a $200,000,000 revolving credit agreement whereby the Fund is permitted to use bank borrowings for temporary or emergency purposes, such as to fund shareholder redemption requests. Interest under the credit agreement is charged to the Fund based on a borrowing rate equal to the higher of the Federal Funds rate in effect on that day plus 1.25% or the overnight LIBOR rate in effect on that day plus 1.25%. In addition, an annual commitment fee equal to 0.20% of the unused balance is allocated to each participating fund. Prior to September 1, 2015, the revolving credit agreement amount was $150,000,000 and the annual commitment fee was equal to 0.10% of the unused balance which was allocated to each participating fund. For the year ended October 31, 2015, the Fund paid $543 in commitment fees.
For the year ended October 31, 2015, there were no borrowings by the Fund under the agreement.
8. DISTRIBUTIONS TO SHAREHOLDERS
The tax character of distributions paid during the years ended October 31, 2015 and October 31, 2014 were as follows:
| | | | | | | | |
| | | Year ended October 31 | |
| | | 2015 | | | 2014 | |
Ordinary income | | $ | 9,467,443 | | | $ | 1,805,553 | |
Long-term capital gain | | | 33,236,549 | | | | 0 | |
As of October 31, 2015, the components of distributable earnings on a tax basis were as follows:
| | | | |
Undistributed ordinary income | | Undistributed long-term gain | | Unrealized gains |
$1,198,043 | | $10,286,625 | | $16,853,763 |
9. INDEMNIFICATION
Under the Trust’s organizational documents, the officers and Trustees have been granted certain indemnification rights against certain liabilities that may arise out of performance of their duties to the Trust. Additionally, in the normal course of business, the Trust may enter into contracts with service providers that contain a variety of indemnification clauses. The Trust’s maximum exposure under these arrangements is dependent on future claims that may be made against the Fund and, therefore, cannot be estimated.
10. SUBSEQUENT DISTRIBUTIONS
On December 11, 2015, the Fund declared distributions from long-term capital gains to shareholders of record on December 10, 2015. The per share amounts payable on December 14, 2015 were as follows:
| | | | |
| | | Long-term capital gains | |
Class A | | | $1.59180 | |
Class B | | | 1.59180 | |
Class C | | | 1.59180 | |
Administrator Class | | | 1.59180 | |
Institutional Class | | | 1.59180 | |
These distributions are not reflected in the accompanying financial statements. The final determination of the source of all distributions is subject to change and made after the Fund’s tax year-end.
| | | | | | |
| Report of independent registered public accounting firm | | Wells Fargo Global Opportunities Fund | | | 27 | |
BOARD OF TRUSTEES AND SHAREHOLDERS OF WELLS FARGO FUNDS TRUST:
We have audited the accompanying statement of assets and liabilities, including the portfolio of investments, of the Wells Fargo Global Opportunities Fund (the “Fund”), one of the funds constituting the Wells Fargo Funds Trust, as of October 31, 2015, and the related statement of operations for the year then ended, the statements of changes in net assets for each of the years in the two-year period then ended, and the financial highlights for each of the years in the five-year period then ended. These financial statements and financial highlights are the responsibility of the Fund’s management. Our responsibility is to express an opinion on these financial statements and financial highlights based on our audits.
We conducted our audits in accordance with the standards of the Public Company Accounting Oversight Board (United States). Those standards require that we plan and perform the audit to obtain reasonable assurance about whether the financial statements and financial highlights are free of material misstatement. An audit includes examining, on a test basis, evidence supporting the amounts and disclosures in the financial statements. Our procedures included confirmation of securities owned as of October 31, 2015, by correspondence with the custodian and brokers, or by other appropriate auditing procedures. An audit also includes assessing the accounting principles used and significant estimates made by management, as well as evaluating the overall financial statement presentation. We believe that our audits provide a reasonable basis for our opinion.
In our opinion, the financial statements and financial highlights referred to above present fairly, in all material respects, the financial position of the Wells Fargo Global Opportunities Fund as of October 31, 2015, the results of its operations for the year then ended, the changes in its net assets for each of the years in the two-year period then ended, and the financial highlights for each of the years in the five-year period then ended, in conformity with U.S. generally accepted accounting principles.

Boston, Massachusetts
December 22, 2015
| | | | |
| 28 | | Wells Fargo Global Opportunities Fund | | Other information (unaudited) |
TAX INFORMATION
For corporate shareholders, pursuant to Section 854 of the Internal Revenue Code, 13.95% of ordinary income dividends qualify for the corporate dividends-received deduction for the fiscal year ended October 31, 2015.
Pursuant to Section 852 of the Internal Revenue Code, $33,236,549 was designated as long-term capital gain distributions for the fiscal year ended October 31, 2015.
Pursuant to Section 854 of the Internal Revenue Code, $3,275,787 of income dividends paid during the fiscal year ended October 31, 2015 has been designated as qualified dividend income (QDI).
PROXY VOTING INFORMATION
A description of the policies and procedures that the Fund uses to determine how to vote proxies relating to portfolio securities is available, upon request, by calling 1-800-222-8222, visiting our website at wellsfargofunds.com, or visiting the SEC website at sec.gov. Information regarding how the Fund voted proxies relating to portfolio securities during the most recent 12-month period ended June 30 is available on the Fund’s website at wellsfargofunds.com or by visiting the SEC website at sec.gov.
PORTFOLIO HOLDINGS INFORMATION
The complete portfolio holdings for the Fund are publicly available monthly on the Fund’s website (wellsfargofunds.com), on a one-month delayed basis. In addition, top ten holdings information (excluding derivative positions) for the Fund is publicly available on the Fund’s website on a monthly, seven-day or more delayed basis. The Fund files its complete schedule of portfolio holdings with the SEC for the first and third quarters of each fiscal year on Form N-Q, which is available by visiting the SEC website at sec.gov. In addition, the Fund’s Form N-Q may be reviewed and copied at the SEC’s Public Reference Room in Washington, DC, and at regional offices in New York City, at 233 Broadway, and in Chicago, at 175 West Jackson Boulevard, Suite 900. Information about the Public Reference Room may be obtained by calling 1-800-SEC-0330.
| | | | | | |
| Other information (unaudited) | | Wells Fargo Global Opportunities Fund | | | 29 | |
BOARD OF TRUSTEES AND OFFICERS
Each of the Trustees and Officers1 listed in the table below acts in identical capacities for each fund in the Wells Fargo family of funds, which consists of 144 mutual funds comprising the Wells Fargo Funds Trust, Wells Fargo Variable Trust, Wells Fargo Master Trust and four closed-end funds (collectively the “Fund Complex”). This table should be read in conjunction with the Prospectus and the Statement of Additional Information2. The mailing address of each Trustee and Officer is 525 Market Street, 12th Floor, San Francisco, CA 94105. Each Trustee and Officer serves an indefinite term, however, each Trustee serves such term until reaching the mandatory retirement age established by the Trustees.
Independent Trustees
| | | | | | |
Name and year of birth | | Position held and length of service* | | Principal occupations during past five years or longer | | Other public company or
investment company
directorships during
past 5 years |
William R. Ebsworth
(Born 1957) | | Trustee, since 2015** | | Retired. From 1984 to 2013, equities analyst, portfolio manager, research director at Fidelity Management and Research Company in Boston, Tokyo, and Hong Kong, and retired in 2013 as Chief Investment Officer of Fidelity Strategic Advisers, Inc. where he led a team of investment professionals managing client assets. Prior thereto, Board member of Hong Kong Securities Clearing Co., Hong Kong Options Clearing Corp., the Thailand International Fund, Ltd., Fidelity Investments Life Insurance Company, and Empire Fidelity Investments Life Insurance Company. Mr. Ebsworth is a CFA® charterholder and an Adjunct Lecturer, Finance, at Babson College. | | Asset Allocation Trust |
| Jane A. Freeman (Born 1953) | | Trustee, since 2015** | | Retired. From 2012 to 2014 and 1999 to 2008, Chief Financial Officer of Scientific Learning Corporation. From 2008 to 2012, Ms. Freeman provided consulting services related to strategic business projects. Prior to 1999, Portfolio Manager at Rockefeller & Co. and Scudder, Stevens & Clark. Board member of the Harding Loevner Funds from 1996 to 2014, serving as both Lead Independent Director and chair of the Audit Committee. Board member of the Russell Exchange Traded Funds Trust from 2011 to 2012 and the chair of the Audit Committee. Ms. Freeman is Chair of Taproot Foundation (non-profit organization), a Board Member of Ruth Bancroft Garden (non-profit organization) and an inactive chartered financial analyst. | | Asset Allocation Trust; Harding Loevner Funds; Russell Exchange Traded Funds Trust |
| Peter G. Gordon (Born 1942) | | Trustee, since 1998; Chairman, since 2005 | | Co-Founder, Retired Chairman, President and CEO of Crystal Geyser Water Company. Trustee Emeritus, Colby College. | | Asset Allocation Trust |
| Isaiah Harris, Jr. (Born 1952) | | Trustee, since 2009 | | Retired. Chairman of the Board of CIGNA Corporation since 2009, and Director since 2005. From 2003 to 2011, Director of Deluxe Corporation. Prior thereto, President and CEO of BellSouth Advertising and Publishing Corp. from 2005 to 2007, President and CEO of BellSouth Enterprises from 2004 to 2005 and President of BellSouth Consumer Services from 2000 to 2003. Emeritus member of the Iowa State University Foundation Board of Governors. Emeritus Member of the Advisory Board of Iowa State University School of Business. Advisory Board Member, Palm Harbor Academy (charter school). Mr. Harris is a certified public accountant. | | CIGNA Corporation; Asset Allocation Trust |
Judith M. Johnson
(Born 1949) | | Trustee, since 2008; Audit Committee Chairman, since 2008 | | Retired. Prior thereto, Chief Executive Officer and Chief Investment Officer of Minneapolis Employees Retirement Fund from 1996 to 2008. Ms. Johnson is an attorney, certified public accountant and a certified managerial accountant. | | Asset Allocation Trust |
| David F. Larcker (Born 1950) | | Trustee, since 2009 | | James Irvin Miller Professor of Accounting at the Graduate School of Business, Stanford University, Morgan Stanley Director of the Center for Leadership Development and Research and Senior Faculty of The Rock Center for Corporate Governance since 2006. From 2005 to 2008, Professor of Accounting at the Graduate School of Business, Stanford University. Prior thereto, Ernst & Young Professor of Accounting at The Wharton School, University of Pennsylvania from 1985 to 2005. | | Asset Allocation Trust |
| | | | |
| 30 | | Wells Fargo Global Opportunities Fund | | Other information (unaudited) |
| | | | | | |
Name and year of birth | | Position held and length of service* | | Principal occupations during past five years or longer | | Other public company or
investment company
directorships during
past 5 years |
| Olivia S. Mitchell (Born 1953) | | Trustee, since 2006 | | International Foundation of Employee Benefit Plans Professor, Wharton School of the University of Pennsylvania since 1993. Director of Wharton’s Pension Research Council and Boettner Center on Pensions & Retirement Research, and Research Associate at the National Bureau of Economic Research. Previously, Cornell University Professor from 1978 to 1993. | | Asset Allocation Trust |
| Timothy J. Penny (Born 1951) | | Trustee, since 1996 | | President and Chief Executive Officer of Southern Minnesota Initiative Foundation, a non-profit organization, since 2007 and Senior Fellow at the Humphrey Institute Policy Forum at the University of Minnesota since 1995. Member of the Board of Trustees of NorthStar Education Finance, Inc., a non-profit organization, since 2007. | | Asset Allocation Trust |
| Michael S. Scofield (Born 1943) | | Trustee, since 2010 | | Served on the Investment Company Institute’s Board of Governors and Executive Committee from 2008-2011 as well the Governing Council of the Independent Directors Council from 2006-2011 and the Independent Directors Council Executive Committee from 2008-2011. Chairman of the IDC from 2008-2010. Institutional Investor (Fund Directions) Trustee of Year in 2007. Trustee of the Evergreen Funds complex (and its predecessors) from 1984 to 2010. Chairman of the Evergreen Funds from 2000-2010. Former Trustee of the Mentor Funds. Retired Attorney, Law Offices of Michael S. Scofield. | | Asset Allocation Trust |
| Donald C. Willeke (Born 1940) | | Trustee, since 1996*** | | Principal of the law firm of Willeke & Daniels. General Counsel of the Minneapolis Employees Retirement Fund from 1984 until its consolidation into the Minnesota Public Employees Retirement Association on June 30, 2010. Director and Vice Chair of The Tree Trust (non-profit corporation). Director of the American Chestnut Foundation (non-profit corporation). | | Asset Allocation Trust |
| * | Length of service dates reflect the Trustee’s commencement of service with the Trust’s predecessor entities, where applicable. |
| ** | William R. Ebsworth and Jane A. Freeman each became a Trustee effective January 1, 2015. |
| *** | Donald Willeke will retire as a Trustee effective December 31, 2015. |
Officers
| | | | | | |
Name and year of birth | | Position held and
length of service | | Principal occupations during past five years or longer | | |
| Karla M. Rabusch (Born 1959) | | President, since 2003 | | Executive Vice President of Wells Fargo Bank, N.A. and President of Wells Fargo Funds Management, LLC since 2003. | | |
| Jeremy DePalma1 (Born 1974) | | Treasurer, since 2012 | | Senior Vice President of Wells Fargo Funds Management, LLC since 2009. Senior Vice President of Evergreen Investment Management Company, LLC from 2008 to 2010 and head of the Fund Reporting and Control Team within Fund Administration from 2005 to 2010. | | |
| C. David Messman (Born 1960) | | Secretary, since 2000; Chief Legal Officer, since 2003 | | Senior Vice President and Secretary of Wells Fargo Funds Management, LLC since 2001. Assistant General Counsel of Wells Fargo Bank, N.A. since 2013 and Vice President and Managing Counsel of Wells Fargo Bank N.A. from 1996 to 2013. | | |
Debra Ann Early (Born 1964) | | Chief Compliance Officer, since 2007 | | Executive Vice President of Wells Fargo Funds Management, LLC since 2014, Senior Vice President and Chief Compliance Officer from 2007 to 2014. | | |
David Berardi (Born 1975) | | Assistant Treasurer, since 2009 | | Vice President of Wells Fargo Funds Management, LLC since 2009. Vice President of Evergreen Investment Management Company, LLC from 2008 to 2010. Manager of Fund Reporting and Control for Evergreen Investment Management Company, LLC from 2004 to 2010. | | |
| 1 | Jeremy DePalma acts as Treasurer of 72 funds and Assistant Treasurer of 72 funds in the Fund Complex. |
| 2 | The Statement of Additional Information includes additional information about the Trustees and is available, without charge, upon request, by calling 1-800-222-8222 or by visiting the website at wellsfargofunds.com. |
| | | | | | |
| Other information (unaudited) | | Wells Fargo Global Opportunities Fund | | | 31 | |
BOARD CONSIDERATION OF INVESTMENT ADVISORY, INVESTMENT MANAGEMENT AND SUB-ADVISORY AGREEMENTS:
Under the Investment Company Act of 1940 (the “1940 Act”), the Board of Trustees (the “Board”) of Wells Fargo Funds Trust (the “Trust”) must determine annually whether to approve the continuation of the Trust’s investment advisory and sub-advisory agreements. In this regard, at an in-person meeting held on May 19-20, 2015 (the “Meeting”), the Board, all the members of which have no direct or indirect interest in the investment advisory and sub-advisory agreements and are not “interested persons” of the Trust, as defined in the 1940 Act (the “Independent Trustees”), reviewed and approved for Wells Fargo Advantage Global Opportunities Fund (the “Fund”): (i) an investment advisory agreement (the “Advisory Agreement”) with Wells Fargo Funds Management, LLC (“Funds Management”); (ii) an investment management agreement (the “Management Agreement”) with Funds Management; and (iii) an investment sub-advisory agreement (the “Sub-Advisory Agreement”) with Wells Capital Management Incorporated (the “Sub-Adviser”), an affiliate of Funds Management. The Management Agreement combines the terms of the Advisory Agreement with the terms of the Fund’s Amended and Restated Administration Agreement (the “Administration Agreement”) applicable to Fund-level administrative services. The Advisory Agreement, the Management Agreement and the Sub-Advisory Agreement are collectively referred to as the “Advisory Agreements.”
At the Meeting, the Board considered the factors and reached the conclusions described below relating to the selection of Funds Management and the Sub-Adviser and the approval of the Advisory Agreements. Prior to the Meeting, including at an in-person meeting in March 2015, the Trustees conferred extensively among themselves and with representatives of Funds Management about these matters. Also, the Board has adopted a team-based approach, with each team consisting of a sub-set of Trustees, to assist the full Board in the discharge of its duties in reviewing performance and other matters throughout the year. The Independent Trustees were assisted in their evaluation of the Advisory Agreements by independent legal counsel, from whom they received separate legal advice and with whom they met separately.
In providing information to the Board, Funds Management and the Sub-Adviser were guided by a detailed set of requests for information submitted to them by independent legal counsel on behalf of the Independent Trustees at the start of the Board’s annual contract renewal process earlier in 2015. In considering and approving the Advisory Agreements, the Trustees considered the information they believed relevant, including but not limited to the information discussed below. The Board considered not only the specific information presented in connection with the Meeting, but also the knowledge gained over time through interaction with Funds Management and the Sub-Adviser about various topics. In this regard, the Board reviewed reports of Funds Management at each of its quarterly meetings, which included, among other things, portfolio reviews and performance reports. In addition, the Board and the teams mentioned above confer with portfolio managers at various times throughout the year. The Board did not identify any particular information or consideration that was all-important or controlling, and each individual Trustee may have attributed different weights to various factors.
After its deliberations, the Board unanimously approved the continuation of the Advisory Agreement for the period from June 1, 2015 through June 30, 2015, approved the Management Agreement for the period from July 1, 2015 through May 31, 2016, and approved the continuation of the Sub-Advisory Agreement for a one-year term through May 31, 2016. The Board also determined that the compensation payable to Funds Management and the Sub-Adviser under each of the Advisory Agreements was reasonable. The Board considered the approval of the Advisory Agreements for the Fund as part of its consideration of agreements for funds across the complex, but its approvals were made on a fund-by-fund basis. The following summarizes a number of important, but not necessarily all, factors considered by the Board in support of its approvals.
Nature, extent and quality of services
The Board received and considered various information regarding the nature, extent and quality of services provided to the Fund by Funds Management and the Sub-Adviser under the Advisory Agreements. This information included, among other things, a summary of the background and experience of senior management of Funds Management, and the qualifications, background, tenure and responsibilities of each of the portfolio managers primarily responsible for the day-to-day portfolio management of the Fund. The Board noted that the services to be provided to the Fund pursuant to the Management Agreement combined the advisory services previously provided to the Fund pursuant to the Fund’s Advisory Agreement with the Fund-level administrative services previously provided to the Fund pursuant to the Fund’s Administration Agreement. The Board received a representation from Funds Management that combining these services would not result in any change to the nature or level of services provided by Funds Management to the Fund.
The Board evaluated the ability of Funds Management and the Sub-Adviser to attract and retain qualified investment professionals, including research, advisory and supervisory personnel. The Board further considered the compliance
| | | | |
| 32 | | Wells Fargo Global Opportunities Fund | | Other information (unaudited) |
programs and compliance records of Funds Management and the Sub-Adviser. In addition, the Board took into account the full range of services provided to the Fund by Funds Management and its affiliates.
Fund performance and expenses
The Board considered the performance results for the Fund over various time periods ended March 31, 2015. The Board considered these results in comparison to the performance of funds in a universe that was determined by Lipper Inc. (“Lipper”) to be similar to the Fund (the “Universe”), and in comparison to the Fund’s benchmark index and to other comparative data. Lipper is an independent provider of investment company data. The Board received a description of the methodology used by Lipper to select the mutual funds in the performance Universe. The Board noted that the performance of the Fund (Administrator Class) was higher than the average performance of the Universe for all periods under review. The Board also noted that the performance of the Fund was lower than its benchmark, the S&P Developed SmallCap Index, for all periods under review except the first quarter of 2015 and the ten-year period.
The Board received information concerning, and discussed factors contributing to, the underperformance of the Fund relative to the benchmark for the periods noted above. The Board took note of the explanations for the relative underperformance, including with respect to overall investment approach and investment decisions that affected the Fund’s performance, and noted the Fund’s outperformance relative to the Universe for all periods under review.
The Board also received and considered information regarding the Fund’s net operating expense ratios and their various components, including actual management fees (which reflect fee waivers, if any, and include advisory, administration and transfer agent fees), custodian and other non-management fees, and Rule 12b-1 and non-Rule 12b-1 service fees. The Board considered these ratios in comparison to the median ratios of funds in class-specific expense groups that were determined by Lipper to be similar to the Fund (the “Groups”). The Board received a description of the methodology used by Lipper to select the mutual funds in the expense Groups and an explanation of how funds comprising expense groups and their expense ratios may vary from year-to-year. Based on the Lipper reports, the Board noted that the net operating expense ratios of the funder were lower than or in range of the median net operating expense ratios of the expense Groups.
The Board took into account the Fund performance and expense information provided to it among the factors considered in deciding to re-approve the Advisory Agreement and Sub-Advisory Agreement and approve the Management Agreement.
Investment advisory and sub-advisory fee rates
The Board reviewed and considered the contractual investment advisory fee rates that are payable by the Fund to Funds Management for investment advisory services (the “Advisory Agreement Rates”), both on a stand-alone basis and on a combined basis with the Fund’s fund-level and class-level contractual administration fee rates (the “Management Rates”). The Board noted that the Management Rates include transfer agency and sub-transfer agency costs. The Board also noted that the fee rate to be paid by the Fund under the Management Agreement will incorporate the advisory fee and Fund-level administration fee previously payable separately by the Fund under the Fund’s Advisory Agreement and Administration Agreement with Funds Management. The Board also reviewed and considered the contractual investment sub-advisory fee rates that are payable by Funds Management to the Sub-Adviser for investment sub-advisory services (the “Sub-Advisory Agreement Rates”).
Among other information reviewed by the Board was a comparison of the Management Rates of the Fund with those of other funds in the expense Groups at a common asset level. The Board noted that the Management Rates of the Fund were lower than or in range of the average rates for the Fund’s expense Groups for all share classes.
The Board also received and considered information about the portion of the total advisory fee that was retained by Funds Management after payment of the fee to the Sub-Adviser for sub-advisory services. In assessing the reasonableness of this amount, the Board received and evaluated information about the nature and extent of responsibilities retained and risks assumed by Funds Management and not delegated to or assumed by the Sub-Adviser, and about Funds Management’s on-going oversight services. However, given the affiliation between Funds Management and the Sub-Adviser, the Board ascribed limited relevance to the allocation of the advisory fee between them.
The Board also received and considered information about the nature and extent of services offered and fee rates charged by Funds Management and the Sub-Adviser to other types of clients with investment strategies similar to those of the Fund. In this regard, the Board received information about the significantly greater scope of services, and compliance, reporting and other legal burdens and risks of managing mutual funds compared with those associated with managing assets of non-mutual fund clients such as collective funds or institutional separate accounts.
| | | | | | |
| Other information (unaudited) | | Wells Fargo Global Opportunities Fund | | | 33 | |
Based on its consideration of the factors and information it deemed relevant, including those described here, the Board determined that the compensation payable to Funds Management under the Management Agreement and Advisory Agreement and to the Sub-Adviser under the Sub-Advisory Agreement was reasonable, in light of the services covered by the Advisory Agreements.
Profitability
The Board received and considered information concerning the profitability of Funds Management, as well as the profitability of Wells Fargo as a whole, from providing services to the Fund and the fund family as a whole. The Board also received and considered information concerning the profitability of the Sub-Adviser from providing services to the fund family as a whole, noting that the Sub-Adviser’s profitability information with respect to providing services to the Fund was subsumed in the Wells Fargo profitability analysis.
Funds Management reported on the methodologies and estimates used in calculating profitability. Among other things, the Board noted that the levels of profitability reported on a fund-by-fund basis varied widely, depending on factors such as the size and type of fund. Based on its review, the Board did not deem the profits reported by Funds Management or Wells Fargo from its services to the Fund to be at a level that would prevent it from approving the continuation of the Advisory Agreements.
Economies of scale
With respect to possible economies of scale, the Board noted the existence of breakpoints in the Fund’s advisory and management fee structures, and the Fund’s administration fee structure, which operate generally to reduce the Fund’s expense ratios as the Fund grows in size. It considered that, for a small fund or a fund that shrinks in size, breakpoints conversely can result in higher fee levels. The Board also considered that fee waiver and expense reimbursement arrangements and competitive fee rates at the outset are means of sharing potential economies of scale with shareholders of the Fund and the fund family as a whole. The Board considered Funds Management’s view that any analyses of potential economies of scale in managing a particular fund are inherently limited in light of the joint and common costs and investments that Funds Management incurs across the fund family as a whole.
The Board concluded that the Fund’s fee and expense arrangements, including contractual breakpoints, constituted a reasonable approach to sharing potential economies of scale with the Fund and its shareholders.
Other benefits to Funds Management and the Sub-Adviser
The Board received and considered information regarding potential “fall-out” or ancillary benefits received by Funds Management and its affiliates, including the Sub-Adviser, as a result of their relationships with the Fund. Ancillary benefits could include, among others, benefits directly attributable to other relationships with the Fund and benefits potentially derived from an increase in Funds Management’s and the Sub-Adviser’s business as a result of their relationships with the Fund. The Board noted that various affiliates of Funds Management may receive distribution-related fees, shareholder servicing payments and sub-transfer agency fees in respect of shares sold or held through them and services provided.
The Board also reviewed information about soft dollar credits earned and utilized by the Sub-Adviser, fees earned by Funds Management and the Sub-Adviser from managing a private investment vehicle for the fund family’s securities lending collateral and commissions earned by an affiliated broker from portfolio transactions.
Based on its consideration of the factors and information it deemed relevant, including those described here, the Board did not find that any ancillary benefits received by Funds Management and its affiliates, including the Sub-Adviser, were unreasonable.
Conclusion
At the Meeting, after considering the above-described factors and based on its deliberations and its evaluation of the information described above, the Board unanimously approved the continuation of the Advisory Agreement for the period from June 1, 2015 through June 30, 2015, approved the Management Agreement for the period from July 1, 2015 through May 31, 2016, and approved the continuation of the Sub-Advisory Agreement for a one-year term through May 31, 2016. The Board also determined that the compensation payable to Funds Management and the Sub-Adviser under each of the Advisory Agreements was reasonable.
| | | | |
| 34 | | Wells Fargo Global Opportunities Fund | | List of abbreviations |
The following is a list of common abbreviations for terms and entities that may have appeared in this report.
| ACA | — ACA Financial Guaranty Corporation |
| ADR | — American depositary receipt |
| ADS | — American depositary shares |
| AGC | — Assured Guaranty Corporation |
| AGM | — Assured Guaranty Municipal |
| Ambac | — Ambac Financial Group Incorporated |
| AMT | — Alternative minimum tax |
| BAN | — Bond anticipation notes |
| BHAC | — Berkshire Hathaway Assurance Corporation |
| CAB | — Capital appreciation bond |
| CCAB | — Convertible capital appreciation bond |
| CDA | — Community Development Authority |
| CDO | — Collateralized debt obligation |
| DRIVER | — Derivative inverse tax-exempt receipts |
| DW&P | — Department of Water & Power |
| DWR | — Department of Water Resources |
| ECFA | — Educational & Cultural Facilities Authority |
| EDA | — Economic Development Authority |
| EDFA | — Economic Development Finance Authority |
| ETF | — Exchange-traded fund |
| FDIC | — Federal Deposit Insurance Corporation |
| FFCB | — Federal Farm Credit Banks |
| FGIC | — Financial Guaranty Insurance Corporation |
| FHA | — Federal Housing Administration |
| FHLB | — Federal Home Loan Bank |
| FHLMC | — Federal Home Loan Mortgage Corporation |
| FICO | — The Financing Corporation |
| FNMA | — Federal National Mortgage Association |
| GDR | — Global depositary receipt |
| GNMA | — Government National Mortgage Association |
| HCFR | — Healthcare facilities revenue |
| HEFA | — Health & Educational Facilities Authority |
| HEFAR | — Higher education facilities authority revenue |
| HFA | — Housing Finance Authority |
| HFFA | — Health Facilities Financing Authority |
| HUD | — Department of Housing and Urban Development |
| IDA | — Industrial Development Authority |
| IDAG | — Industrial Development Agency |
| KRW | — Republic of Korea won |
| LIBOR | — London Interbank Offered Rate |
| LIFER | — Long Inverse Floating Exempt Receipts |
| LLC | — Limited liability company |
| LLLP | — Limited liability limited partnership |
| LLP | — Limited liability partnership |
| MBIA | — Municipal Bond Insurance Association |
| MFHR | — Multifamily housing revenue |
| MSTR | — Municipal securities trust receipts |
| MUD | — Municipal Utility District |
| National | — National Public Finance Guarantee Corporation |
| PCFA | — Pollution Control Financing Authority |
| PCL | — Public Company Limited |
| PCR | — Pollution control revenue |
| PFA | — Public Finance Authority |
| PFFA | — Public Facilities Financing Authority |
| PFOTER | — Puttable floating option tax-exempt receipts |
| plc | — Public limited company |
| PUTTER | — Puttable tax-exempt receipts |
| R&D | — Research & development |
| Radian | — Radian Asset Assurance |
| RAN | — Revenue anticipation notes |
| RDA | — Redevelopment Authority |
| RDFA | — Redevelopment Finance Authority |
| REIT | — Real estate investment trust |
| ROC | — Reset option certificates |
| SAVRS | — Select auction variable rate securities |
| SBA | — Small Business Authority |
| SDR | — Swedish depositary receipt |
| SFHR | — Single-family housing revenue |
| SFMR | — Single-family mortgage revenue |
| SPA | — Standby purchase agreement |
| SPDR | — Standard & Poor’s Depositary Receipts |
| SPEAR | — Short Puttable Exempt Adjustable Receipts |
| STRIPS | — Separate trading of registered interest and |
| TAN | — Tax anticipation notes |
| TIPS | — Treasury inflation-protected securities |
| TRAN | — Tax revenue anticipation notes |
| TTFA | — Transportation Trust Fund Authority |
| TVA | — Tennessee Valley Authority |
This page is intentionally left blank.
This page is intentionally left blank.

For more information
More information about Wells Fargo Funds is available free upon request. To obtain literature, please write, email, visit the Fund’s website, or call:
Wells Fargo Funds
P.O. Box 8266
Boston, MA 02266-8266
Email: wfaf@wellsfargo.com
Website: wellsfargofunds.com
Individual investors: 1-800-222-8222
Retail investment professionals: 1-888-877-9275
Institutional investment professionals: 1-866-765-0778
This report and the financial statements contained herein are submitted for the general information of the shareholders of Wells Fargo Funds. If this report is used for promotional purposes, distribution of the report must be accompanied or preceded by a current prospectus. Before investing, please consider the investment objectives, risks, charges, and expenses of the investment. For a current prospectus and, if available, a summary prospectus, containing this information, call 1-800-222-8222 or visit the Fund’s website at wellsfargofunds.com. Read the prospectus carefully before you invest or send money.
Wells Fargo Funds Management, LLC, a wholly owned subsidiary of Wells Fargo & Company, provides investment advisory and administrative services for Wells Fargo Funds. Other affiliates of Wells Fargo & Company provide subadvisory and other services for the Funds. The Funds are distributed by Wells Fargo Funds Distributor, LLC, Member FINRA, an affiliate of Wells Fargo & Company.
NOT FDIC INSURED ¡ NO BANK GUARANTEE ¡ MAY LOSE VALUE
© 2015 Wells Fargo Funds Management, LLC. All rights reserved.
| | |
 | | 238509 12-15 A239/AR239 10-15 |
Annual Report
October 31, 2015

Wells Fargo International Equity Fund


Reduce clutter. Save trees.
Sign up for electronic delivery of prospectuses and shareholder reports at wellsfargo.com/advantagedelivery
Contents
The views expressed and any forward-looking statements are as of October 31, 2015, unless otherwise noted, and are those of the Fund managers and/or Wells Fargo Funds Management, LLC. Discussions of individual securities, or the markets generally, or any Wells Fargo Fund are not intended as individual recommendations. Future events or results may vary significantly from those expressed in any forward-looking statements. The views expressed are subject to change at any time in response to changing circumstances in the market. Wells Fargo Funds Management, LLC and the Fund disclaim any obligation to publicly update or revise any views expressed or forward-looking statements.
NOT FDIC INSURED ¡ NO BANK GUARANTEE ¡ MAY LOSE VALUE
| | | | |
| 2 | | Wells Fargo International Equity Fund | | Letter to shareholders (unaudited) |

Karla M. Rabusch
President
Wells Fargo Funds
Signs of encouragement in the eurozone were more than offset by slowing economic growth in China.
The decline of oil and natural gas prices that began during the summer of 2014 continued into 2015.
Dear Valued Shareholder:
We are pleased to offer you this annual report for the Wells Fargo International Equity Fund for the 12-month period that ended October 31, 2015. During the period, investors confronted concerns about slowing economic growth in China and a dramatic rise and fall in the country’s equity markets, diverging central bank policies globally, contentious negotiations to refinance Greece’s sovereign debt, low commodity prices, and ongoing currency volatility. These disparate influences tended to obscure improving economic data in the U.S. and several developed European countries.
Low commodity prices and slower global growth overshadowed improved economic data.
In Europe, the eurozone’s largest economies—France, Germany, Italy, and Spain—reported gross domestic product (GDP) growth on an annualized basis for the second quarter of 2015, although results were uneven for smaller, developing economies in the region. While annualized GDP growth slowed in the third quarter in the eurozone overall, it remained positive. Signs of encouragement in the eurozone were more than offset by slowing economic growth in China. China posted third-quarter GDP growth of 6.9%. While that pace might be envied by other developed economies, it is below levels many investors have come to expect from China. Furthermore, the government indicated the full-year growth target of 7% may not be met.
Stocks generally moved higher in April and early May 2015 before events served to discourage equity investors as summer advanced. The decline of oil and natural gas prices that began during the summer of 2014 continued into 2015. At the same time, the value of the U.S. dollar increased relative to other currencies, particularly those in emerging markets. Both conditions concerned investors. Sustained low oil, natural gas, and other commodity prices hampered economies in several emerging markets. Slowed commodity consumption among developed markets also suggested a deceleration of global growth.
Global central bank policies diverge.
After ending its quantitative easing-related bond-buying program toward the end of 2014, the U.S. Federal Reserve (Fed) signaled its intention to increase the federal funds rate. However, concerns about slowing growth, particularly in emerging markets, prompted the Fed to defer an interest-rate increase. Investors globally fell into a holding pattern at times as they tried to anticipate the Fed’s next move. Meanwhile, the Bank of Japan announced in October 2014 significant expansion of its economic stimulus programs to include additional injections of liquidity into the economy through bond purchases. In addition, the Government Pension Investment Fund announced plans to reduce government bond investments and direct those assets to investments in the Japanese stock market. The People’s Bank of China also took initiatives to spur economic growth by cutting interest rates for the sixth time in less than a year in October 2015; lowering bank reserve requirements to encourage lending; and allowing the renminbi to depreciate to support exports and to advance government efforts to transition to a more market-driven economy.
During the summer of 2015, the Hang Seng Index1 in Hong Kong experienced a dramatic decline after a similarly dramatic ascent during late 2014 and early 2015, falling to levels not seen since 2013. Contentious negotiations between Greece and its debtors to refinance the country’s sovereign debt also concerned investors
| 1 | The Hang Seng Index is a free-float-adjusted market-capitalization-weighted stock market index in Hong Kong. It is used to record and monitor daily changes of the largest companies of the Hong Kong stock market and is the main indicator of the overall market performance in Hong Kong. You cannot invest directly in an index. |
| | | | | | |
| Letter to shareholders (unaudited) | | Wells Fargo International Equity Fund | | | 3 | |
during June 2015. After weeks of stalemated negotiations, the government accepted additional spending reductions in order to secure new loan agreements. Developed European and Asian equity markets, as measured by Morgan Stanley Capital International (MSCI) Europe, Australasia, Far East (EAFE) Index (Net),2 returned -0.07% for the 12-month period that ended October 31, 2015.
The effect of slowing growth in China, a stronger U.S. dollar, and stubbornly low prices for oil, natural gas, and other commodities was particularly difficult for many emerging markets economies that rely on commodities as an economic engine. During the period, emerging markets stocks suffered more significantly than international developed markets, earning a return of -14.53%, as measured by the MSCI Emerging Markets Index (Net).3 U.S. investors in international equity markets also often saw the value of their overseas investments reduced upon translation to dollars.
Don’t let short-term uncertainty derail long-term investment goals.
Periods of investment uncertainty can present challenges, but experience has taught us that maintaining long-term investment goals can be an effective way to plan for the future. To help you create a sound strategy based on your personal goals and risk tolerance, Wells Fargo Funds offers more than 100 mutual funds and other investments spanning a wide range of asset classes and investment styles. Although diversification cannot guarantee an investment profit or prevent losses, we believe it can be an effective way to manage investment risk and potentially smooth out overall portfolio performance. We encourage investors to know their investments and to understand that appropriate levels of risk-taking may unlock opportunities.
Thank you for choosing to invest with Wells Fargo Funds. We appreciate your confidence in us and remain committed to helping you meet your financial needs.
Sincerely,

Karla M. Rabusch
President
Wells Fargo Funds
Notice to shareholders
At a meeting held August 11-12, 2015, the Board of Trustees of the Fund approved a change in the name of the Fund whereby the word “Advantage” was removed from its name, effective December 15, 2015.
For current information about your fund investments, contact your investment professional, visit our website at wellsfargofunds.com, or call us directly at 1-800-222-8222. We are available 24 hours a day, 7 days a week.
| 2 | The Morgan Stanley Capital International (MSCI) Europe, Australasia, Far East (EAFE) Index (Net) is a free-float-adjusted market-capitalization-weighted index that is designed to measure the equity market performance of developed markets, excluding the U.S. and Canada. The MSCI EAFE Index (Net) consists of the following 21 developed markets country indexes: Australia, Austria, Belgium, Denmark, Finland, France, Germany, Hong Kong, Ireland, Israel, Italy, Japan, the Netherlands, New Zealand, Norway, Portugal, Singapore, Spain, Sweden, Switzerland, and the United Kingdom. You cannot invest directly in an index. Source: MSCI. MSCI makes no express or implied warranties or representations and shall have no liability whatsoever with respect to any MSCI data contained herein. The MSCI data may not be further redistributed or used as a basis for other indexes or any securities or financial products. This report is not approved, reviewed, or produced by MSCI. |
| 3 | The MSCI Emerging Markets Index (Net) is a free-float-adjusted market-capitalization-weighted index that is designed to measure the equity market performance of emerging markets. The MSCI Emerging Markets Index (Net) consists of the following 23 emerging markets country indexes: Brazil, Chile, China, Colombia, Czech Republic, Egypt, Greece, Hungary, India, Indonesia, Korea, Malaysia, Mexico, Peru, the Philippines, Poland, Qatar, Russia, South Africa, Taiwan, Thailand, Turkey, and United Arab Emirates. You cannot invest directly in an index. |
| | | | |
| 4 | | Wells Fargo International Equity Fund | | Performance highlights (unaudited) |
Investment objective
The Fund seeks long-term capital appreciation.
Manager
Wells Fargo Funds Management, LLC
Subadviser
Wells Capital Management Incorporated
Portfolio managers
Jeffrey Everett, CFA
Dale Winner, CFA
Average annual total returns (%) as of October 31, 20151
| | | | | | | | | | | | | | | | | | | | | | | | | | | | | | | | | | |
| | | | | Including sales charge | | | Excluding sales charge | | | Expense ratios2 (%) | |
| | | Inception date | | 1 year | | | 5 year | | | 10 year | | | 1 year | | | 5 year | | | 10 year | | | Gross | | | Net3 | |
| Class A (WFEAX) | | 1-20-1998 | | | 0.70 | | | | 3.24 | | | | 2.77 | | | | 6.85 | | | | 4.48 | | | | 3.38 | | | | 1.48 | | | | 1.09 | |
| Class B (WFEBX)* | | 9-6-1979 | | | 1.00 | | | | 3.33 | | | | 2.84 | | | | 6.00 | | | | 3.68 | | | | 2.84 | | | | 2.23 | | | | 1.84 | |
| Class C (WFEFX) | | 3-6-1998 | | | 5.03 | | | | 3.69 | | | | 2.61 | | | | 6.03 | | | | 3.69 | | | | 2.61 | | | | 2.23 | | | | 1.84 | |
| Class R (WFERX) | | 10-10-2003 | | | – | | | | – | | | | – | | | | 6.53 | | | | 4.21 | | | | 3.12 | | | | 1.73 | | | | 1.34 | |
| Class R6 (WFEHX) | | 9-30-2015 | | | – | | | | – | | | | – | | | | 7.07 | | | | 4.73 | | | | 3.64 | | | | 1.05 | | | | 0.88 | |
| Administrator Class (WFEDX) | | 7-16-2010 | | | – | | | | – | | | | – | | | | 6.89 | | | | 4.48 | | | | 3.51 | | | | 1.40 | | | | 1.09 | |
| Institutional Class (WFENX) | | 3-9-1998 | | | – | | | | – | | | | – | | | | 7.07 | | | | 4.73 | | | | 3.64 | | | | 1.15 | | | | 0.84 | |
| MSCI ACWI ex USA (Net)4 | | – | | | – | | | | – | | | | – | | | | (4.68 | ) | | | 2.60 | | | | 4.16 | | | | – | | | | – | |
| * | | Class B shares are closed to investment, except in connection with the reinvestment of any distributions and permitted exchanges. |
Figures quoted represent past performance, which is no guarantee of future results, and do not reflect taxes that a shareholder may pay on fund distributions or the redemption of fund shares. Investment return and principal value of an investment will fluctuate so that an investor’s shares, when redeemed, may be worth more or less than their original cost. Performance shown without sales charges would be lower if sales charges were reflected. Current performance may be lower or higher than the performance data quoted, which assumes the reinvestment of dividends and capital gains. Current month-end performance is available on the Fund’s website, wellsfargofunds.com.
Index returns do not include transaction costs associated with buying and selling securities, any mutual fund fees or expenses, or any taxes. It is not possible to invest directly in an index.
For Class A shares, the maximum front-end sales charge is 5.75%. For Class B shares, the maximum contingent deferred sales charge is 5.00%. For Class C shares, the maximum contingent deferred sales charge is 1.00%. Performance including a contingent deferred sales charge assumes the sales charge for the corresponding time period. Class R, Class R6, Administrator Class, and Institutional Class shares are sold without a front-end sales charge or contingent deferred sales charge.
Stock values fluctuate in response to the activities of individual companies and general market and economic conditions. Foreign investments are especially volatile and can rise or fall dramatically due to differences in the political and economic conditions of the host country. These risks are generally intensified in emerging markets. The use of derivatives may reduce returns and/or increase volatility. Certain investment strategies tend to increase the total risk of an investment (relative to the broader market). The Fund is exposed to smaller-company securities risk. Consult the Fund’s prospectus for additional information on these and other risks.
Please see footnotes on page 5.
| | | | | | |
| Performance highlights (unaudited) | | Wells Fargo International Equity Fund | | | 5 | |
|
| Growth of $10,000 investment as of October 31, 20155 |
|
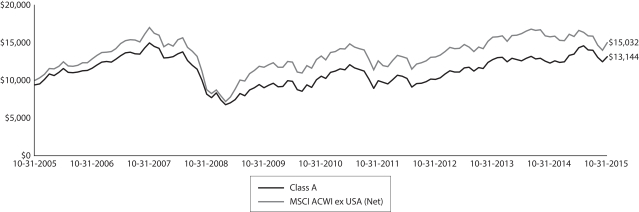 |
| 1 | Historical performance shown for Class R6 shares prior to their inception reflects the performance of Institutional Class shares and includes the higher expenses applicable to Institutional Class shares. If these expenses had not been included, returns would be higher. Historical performance shown for Administrator Class shares prior to their inception reflects the performance of Institutional Class shares and has been adjusted to reflect the higher expenses applicable to Administrator Class shares. Historical performance shown for all classes of the Fund prior to July 12, 2010, is based on the performance of the Fund’s predecessor, Evergreen International Equity Fund. |
| 2 | Reflects the expense ratios as stated in the most recent prospectuses. The expense ratios shown are subject to change and may differ from the annualized expense ratios shown in the financial highlights of this report. |
| 3 | The manager has contractually committed through February 29, 2016 (February 28, 2017 for Class R6), to waive fees and/or reimburse expenses to the extent necessary to cap the Fund’s Total Annual Fund Operating Expenses After Fee Waiver at the amounts shown. After this time, the cap may be increased or the commitment to maintain the cap may be terminated only with the approval of the Board of Trustees. Brokerage commissions, stamp duty fees, interest, taxes, acquired fund fees and expenses, and extraordinary expenses are excluded from the cap. Without this cap, the Fund’s returns would have been lower. |
| 4 | The Morgan Stanley Capital International (MSCI) All Country World Index (ACWI) ex USA (Net) is a free float-adjusted market-capitalization weighted index that is designed to measure the equity market performance of developed and emerging markets. You cannot invest directly in an index. Source: MSCI. MSCI makes no express or implied warranties or representations and shall have no liability whatsoever with respect to any MSCI data contained herein. The MSCI data may not be further redistributed or used as a basis for other indexes or any securities or financial products. This report is not approved, reviewed, or produced by MSCI. |
| 5 | The chart compares the performance of Class A shares for the most recent ten years with the MSCI ACWI ex USA (Net). The chart assumes a hypothetical investment of $10,000 in Class A shares and reflects all operating expenses and assumes the maximum initial sales charge of 5.75%. |
| 6 | The ten largest holdings, excluding cash and cash equivalents, are calculated based on the value of the investments divided by total net assets of the Fund. Holdings are subject to change and may have changed since the date specified. |
| 7 | Amounts are calculated based on the total long-term investments of the Fund. These amounts are subject to change and may have changed since the date specified. |
| | | | |
| 6 | | Wells Fargo International Equity Fund | | Performance highlights (unaudited) |
MANAGER’S DISCUSSION
Fund highlights
| n | | The Fund outperformed the MSCI ACWI ex USA (Net) for the 12-month period that ended October 31, 2015. |
| n | | The Fund remained overweight in the stocks of a number of companies in Japan, Hong Kong, and China and increased its positions in select undervalued European company stocks. The Fund benefited from positive stock-specific and sector allocation attribution across Italy, the United Kingdom, Hong Kong, and Canada as well as partial hedges of euro and yen currency exposures. |
| n | | Financials sector stocks, including asset managers, conglomerates, and regional banks, and industrials sector holdings contributed to performance. Consumer sector investments in the automobile, beverages, apparel industries, and information technology sector stocks of equipment manufacturers detracted from performance. |
Stock selection drove fund performance amid volatility and diverging central bank policies.
This past year’s volatility in global capital markets was best evidenced by the swings in China’s A-share market, as a margin-financed stock-buying frenzy among retail investors metamorphosed into panic coincident with disruptions in energy and metals commodity markets. During the period, we continued to find underresearched and undervalued stocks that we believed were poised to capitalize on advantages stemming from self-help restructuring and targeted national structural reforms. These influences drove total return in many of our stock picks across Europe, Japan, Hong Kong, and China. The Bank of Japan (BoJ) and European Central Bank (ECB) remain at the early stages of monetary policy accommodation, in stark contrast to the U.S. Federal Reserve’s move away from quantitative easing. BoJ and ECB monetary policies exerted reflationary pressure on their countries’ economies and the U.S. dollar relative to home exchange rates, which influenced our stock-picking and portfolio management decisions.
Some of the best stock performances came from the financials sector, with ANIMA Holding S.p.A., an Italian asset manager, the top relative contributor. Other notable positive performers included China Everbright Limited, which benefited from capital market reforms in Hong Kong and Shanghai; asset manager Man Group plc; Daiwa House Industry Company, Limited, which benefited from reflation in Japan; and Rheinmetall AG, a German cyclical company that benefited from self-help restructuring. We retained an underweight to emerging markets equities, notably Brazil, with positive attribution results. Outside of China and South Korea, we found few opportunities amid increasing emerging markets company, country, and currency risks. We exited our holding in Volkswagen AG after a stop-loss reevaluation of the stock when emissions-testing concerns emerged. Negative performance effects came from electrical equipment manufacturer Hitachi, Limited; Hana Financial Group Incorporated, a South Korean diversified bank; Coca-Cola East Japan Company, Limited; telecommunications equipment manufacturer QUALCOMM Incorporated; and Eni S.p.A., an integrated energy company.
Regionally, divergent and compelling investment opportunities are emerging.
In Europe, opportunities arose amid signs of a cyclical economic recovery in the context of a watchful ECB that is focused on stemming systematic risks in banking and financial markets. The ECB’s actions helped address challenges facing the European Union member states as they seek political cooperation to secure their currency union. Companies engaged in self-help restructuring through operational efficiencies such as careful investment of corporate resources, cost-cutting, and portfolio reshaping bolstered their profitability and benefited from the additional impetus of structural reforms and economic recovery. In Italy, targeted reforms ranging from streamlining the country’s banking system and public bureaucracy to labor market and tax incentives uplifted economic activity. Prysmian S.p.A., an undervalued Italian cable manufacturer, and ANIMA, which benefited from reflation and business reforms, remain core representative holdings. In Germany, we added to our position in Rheinmetall, which we believe remains undervalued even after benefiting from ongoing automobile and defense business self-help restructuring, and initiated a position in SAP SE, an undervalued application software franchise undergoing a business-model transformation.
In Japan, the distinctions between the new and old corporate regimes continue to widen. We have watched core holdings increase their operating margins. Corporate reforms under Prime Minister Shinzo Abe continued to benefit industry segments. For example, reflation helped the capital markets and real estate industries where portfolio investments include Mitsubishi UFJ Financial Group, Incorporated, and Mitsui Fudosan Company, Limited, respectively.
Please see footnotes on page 5.
| | | | | | |
| Performance highlights (unaudited) | | Wells Fargo International Equity Fund | | | 7 | |
Yaskawa Electric Corporation, a robotics manufacturer, complemented its technological leadership with enhanced corporate governance standards by adopting Japan’s corporate stewardship code, which is intended to promote sustainable company growth through investment and dialogue. We note that while Abenomics, as the Prime Minister’s reform program has become known, has demonstrated the force and flexibility of monetary and fiscal accommodation, elements of the more-difficult-to-achieve long-term structural reforms under his leadership are beginning to take shape as, for example, he encourages reallocation of pension capital from government bonds to equities; pressures corporate tax rates toward levels under 30%; champions approval of the Trans-Pacific Partnership, representing 40% of world gross domestic product with the U.S./Japan nexus at its hub; and increases demands on the private sector to share responsibility for spurring a positive national wealth effect.
In China, our base-case assessment suggests that while the policy challenges of transitioning from an exclusively state-controlled to more market-driven economy are daunting—with inevitable growing pains—government officials have several policy levers at their disposal to accomplish an orderly and flexible liberalization. We believe recent policy easing remained incremental, leaving room for further growth enhancement measures. We continued to build positions in undervalued and restructuring state-owned enterprises such as China Mobile Limited, which is still 72% government-owned and has a 30% cash-to-market capitalization ratio. We also maintained investments in the reforming financial services arena, including China Everbright, which is an undercovered diversified financial services and asset management firm that is in the process of executing a corporate governance realignment. Several firms poised to benefit from the nation’s move away from industrial spending to consumer spending populate our portfolio, including automobile manufacturer Dongfeng Motor Group Company, Limited, and beverage and spirits company Kweichow Moutai Company, Limited.
We continue to adhere to our investment process.
We are identifying opportunities in select equities in Japan, developed European markets, Hong Kong, and China, with mixed findings across emerging markets. Many of the companies we are monitoring currently trade in domestic markets that are approximately half the book-to-value market multiple of U.S. equities, with substantial potential for profitability enhancement as they normalize earnings power and monetize benefits from the collapse of commodity prices, lower credit costs, and currency rates that can prove advantageous, particularly to exporters. Our bottom-up stock-selection process continues to steer our portfolio to what we deem to be more nonconsensus, underearning, and undervalued equities, particularly in Japan, Europe, and Hong Kong—companies benefiting from a confluence of restructuring, reflation, and/or reform tailwinds.
| | | | |
| Ten largest holdings (%) as of October 31, 20156 | |
Mitsubishi UFJ Financial Group Incorporated | | | 3.46 | |
Rheinmetall AG | | | 3.26 | |
Hitachi Limited | | | 3.17 | |
Man Group plc | | | 2.84 | |
Siemens AG | | | 2.70 | |
Prysmian SpA | | | 2.64 | |
Nomura Holdings Incorporated | | | 2.57 | |
Akzo Nobel NV | | | 2.54 | |
Wolseley plc | | | 2.52 | |
Eni SpA | | | 2.51 | |
|
| Sector distribution as of October 31, 20157 |
|
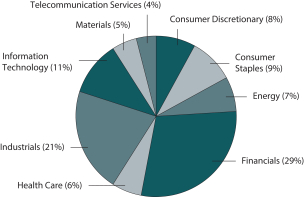 |
|
| Country allocation as of October 31, 20157 |
|
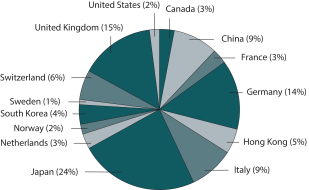 |
Please see footnotes on page 5.
| | | | |
| 8 | | Wells Fargo International Equity Fund | | Fund expenses (unaudited) |
As a shareholder of the Fund, you incur two types of costs: (1) transaction costs, including sales charges (loads) on purchase payments and contingent deferred sales charges (if any) on redemptions and (2) ongoing costs, including management fees, distribution (12b-1) and/or shareholder servicing fees, and other Fund expenses. This example is intended to help you understand your ongoing costs (in dollars) of investing in the Fund and to compare these costs with the ongoing costs of investing in other mutual funds.
The example is based on an investment of $1,000 invested at the beginning of the six-month period and held for the entire period from May 1, 2015 to October 31, 2015.
Actual expenses
The “Actual” line of the table below provides information about actual account values and actual expenses. You may use the information in this line, together with the amount you invested, to estimate the expenses that you paid over the period. Simply divide your account value by $1,000 (for example, an $8,600 account value divided by $1,000 = 8.6), then multiply the result by the number in the “Actual” line under the heading entitled “Expenses paid during period” for your applicable class of shares to estimate the expenses you paid on your account during this period.
Hypothetical example for comparison purposes
The “Hypothetical” line of the table below provides information about hypothetical account values and hypothetical expenses based on the Fund’s actual expense ratio and an assumed rate of return of 5% per year before expenses, which is not the Fund’s actual return. The hypothetical account values and expenses may not be used to estimate the actual ending account balance or expenses you paid for the period. You may use this information to compare the ongoing costs of investing in the Fund and other funds. To do so, compare this 5% hypothetical example with the 5% hypothetical examples that appear in the shareholder reports of the other funds.
Please note that the expenses shown in the table are meant to highlight your ongoing costs only and do not reflect any transactional costs, such as sales charges (loads) and contingent deferred sales charges. Therefore, the “Hypothetical” line of the table is useful in comparing ongoing costs only and will not help you determine the relative total costs of owning different funds. In addition, if these transactional costs were included, your costs would have been higher.
| | | | | | | | | | | | | | | | |
| | | Beginning
account value 5-1-2015 | | | Ending account value 10-31-2015 | | | Expenses paid during the period¹ | | | Net annualized expense ratio | |
Class A | | | | | | | | | | | | | | | | |
Actual | | $ | 1,000.00 | | | $ | 917.26 | | | $ | 5.27 | | | | 1.09 | % |
Hypothetical (5% return before expenses) | | $ | 1,000.00 | | | $ | 1,019.71 | | | $ | 5.55 | | | | 1.09 | % |
Class B | | | | | | | | | | | | | | | | |
Actual | | $ | 1,000.00 | | | $ | 913.61 | | | $ | 8.87 | | | | 1.84 | % |
Hypothetical (5% return before expenses) | | $ | 1,000.00 | | | $ | 1,015.93 | | | $ | 9.35 | | | | 1.84 | % |
Class C | | | | | | | | | | | | | | | | |
Actual | | $ | 1,000.00 | | | $ | 913.50 | | | $ | 8.87 | | | | 1.84 | % |
Hypothetical (5% return before expenses) | | $ | 1,000.00 | | | $ | 1,015.93 | | | $ | 9.35 | | | | 1.84 | % |
Class R | | | | | | | | | | | | | | | | |
Actual | | $ | 1,000.00 | | | $ | 915.95 | | | $ | 6.47 | | | | 1.34 | % |
Hypothetical (5% return before expenses) | | $ | 1,000.00 | | | $ | 1,018.45 | | | $ | 6.82 | | | | 1.34 | % |
Class R6 | | | | | | | | | | | | | | | | |
Actual | | $ | 1,000.00 | | | $ | 918.47 | | | $ | 4.26 | | | | 0.88 | % |
Hypothetical (5% return before expenses) | | $ | 1,000.00 | | | $ | 1,020.77 | | | $ | 4.48 | | | | 0.88 | % |
Administrator Class | | | | | | | | | | | | | | | | |
Actual | | $ | 1,000.00 | | | $ | 917.41 | | | $ | 5.27 | | | | 1.09 | % |
Hypothetical (5% return before expenses) | | $ | 1,000.00 | | | $ | 1,019.71 | | | $ | 5.55 | | | | 1.09 | % |
Institutional Class | | | | | | | | | | | | | | | | |
Actual | | $ | 1,000.00 | | | $ | 918.47 | | | $ | 4.06 | | | | 0.84 | % |
Hypothetical (5% return before expenses) | | $ | 1,000.00 | | | $ | 1,020.97 | | | $ | 4.28 | | | | 0.84 | % |
| 1 | Expenses paid is equal to the annualized expense ratio of each class multiplied by the average account value over the period, multiplied by the number of days in the most recent fiscal half-year divided by the number of days in the fiscal year (to reflect the one-half-year period). |
| | | | | | |
| Portfolio of investments—October 31, 2015 | | Wells Fargo International Equity Fund | | | 9 | |
| | | | | | | | | | | | |
| Security name | | | | | | Shares | | | Value | |
| | | | | | | | | | | | |
| | | | |
Common Stocks: 89.03% | | | | | | | | | | | | |
| | | | |
| Australia: 0.31% | | | | | | | | | | | | |
BHP Billiton Limited (Materials, Metals & Mining) | | | | | | | 80,061 | | | $ | 1,313,059 | |
| | | | | | | | | | | | |
| | | | |
| Brazil: 0.07% | | | | | | | | | | | | |
Cosan Limited Class A (Energy, Oil, Gas & Consumable Fuels) | | | | | | | 85,591 | | | | 299,569 | |
| | | | | | | | | | | | |
| | | | |
| Canada: 2.45% | | | | | | | | | | | | |
Cameco Corporation (Energy, Oil, Gas & Consumable Fuels) | | | | | | | 305,986 | | | | 4,335,822 | |
Lundin Mining Corporation (Materials, Metals & Mining) † | | | | | | | 1,045,224 | | | | 3,525,113 | |
Valeant Pharmaceuticals International Incorporated (Health Care, Pharmaceuticals) † | | | | | | | 27,105 | | | | 2,541,636 | |
| | | | |
| | | | | | | | | | | 10,402,571 | |
| | | | | | | | | | | | |
| | | | |
| China: 6.93% | | | | | | | | | | | | |
Biostime International Holdings Limited (Consumer Staples, Food Products) | | | | | | | 1,234,000 | | | | 2,739,910 | |
China Mobile Limited (Telecommunication Services, Wireless Telecommunication Services) | | | | | | | 382,500 | | | | 4,586,131 | |
Dongfeng Motor Group Company Limited H Shares (Consumer Discretionary, Automobiles) | | | | | | | 6,952,000 | | | | 9,978,906 | |
Industrial & Commercial Bank of China Limited H Shares (Financials, Banks) | | | | | | | 9,490,000 | | | | 6,019,555 | |
Shanghai Pharmaceuticals Holding Company Limited H Shares (Health Care, Pharmaceuticals) | | | | | | | 1,582,500 | | | | 3,650,127 | |
Xtep International Holdings Limited (Consumer Discretionary, Textiles, Apparel & Luxury Goods) | | | | | | | 4,763,180 | | | | 2,470,516 | |
| | | | |
| | | | | | | | | | | 29,445,145 | |
| | | | | | | | | | | | |
| | | | |
| France: 2.50% | | | | | | | | | | | | |
Compagnie de Saint-Gobain SA (Industrials, Building Products) | | | | | | | 253,604 | | | | 10,616,129 | |
| | | | | | | | | | | | |
| | | | |
| Germany: 12.77% | | | | | | | | | | | | |
Bayer AG (Health Care, Pharmaceuticals) | | | | | | | 59,576 | | | | 7,943,590 | |
Hugo Boss AG (Consumer Discretionary, Textiles, Apparel & Luxury Goods) | | | | | | | 49,477 | | | | 5,087,533 | |
Metro AG (Consumer Staples, Food & Staples Retailing) | | | | | | | 257,877 | | | | 7,933,762 | |
Rheinmetall AG (Industrials, Industrial Conglomerates) | | | | | | | 219,971 | | | | 13,835,481 | |
SAP SE (Information Technology, Software) | | | | | | | 101,226 | | | | 7,980,158 | |
Siemens AG (Industrials, Industrial Conglomerates) | | | | | | | 114,082 | | | | 11,458,868 | |
| | | | |
| | | | | | | | | | | 54,239,392 | |
| | | | | | | | | | | | |
| | | | |
| Hong Kong: 4.40% | | | | | | | | | | | | |
China Everbright Limited (Financials, Capital Markets) | | | | | | | 3,888,000 | | | | 9,150,583 | |
Value Partners Group Limited (Financials, Capital Markets) | | | | | | | 3,614,000 | | | | 3,826,924 | |
Xinyi Glass Holdings Limited (Consumer Discretionary, Auto Components) | | | | | | | 6,516,000 | | | | 3,375,701 | |
Xinyi Solar Holdings Limited (Information Technology, Semiconductors & Semiconductor Equipment) « | | | | | | | 5,918,000 | | | | 2,352,608 | |
| | | | |
| | | | | | | | | | | 18,705,816 | |
| | | | | | | | | | | | |
| | | | |
| Italy: 8.26% | | | | | | | | | | | | |
ANIMA Holding SpA (Financials, Capital Markets) | | | | | | | 898,258 | | | | 8,795,083 | |
Eni SpA (Energy, Oil, Gas & Consumable Fuels) | | | | | | | 652,546 | | | | 10,656,237 | |
Intesa Sanpaolo SpA (Financials, Banks) | | | | | | | 1,271,168 | | | | 4,422,463 | |
Prysmian SpA (Industrials, Electrical Equipment) | | | | | | | 519,682 | | | | 11,222,685 | |
| | | | |
| | | | | | | | | | | 35,096,468 | |
| | | | | | | | | | | | |
The accompanying notes are an integral part of these financial statements.
| | | | |
| 10 | | Wells Fargo International Equity Fund | | Portfolio of investments—October 31, 2015 |
| | | | | | | | | | | | |
| Security name | | | | | | Shares | | | Value | |
| | | | | | | | | | | | |
| | | | |
| Japan: 21.23% | | | | | | | | | | | | |
Coca-Cola East Japan Company Limited (Consumer Staples, Beverages) | | | | | | | 491,900 | | | $ | 6,913,342 | |
Daiwa House Industry Company Limited (Financials, Real Estate Management & Development) | | | | | | | 251,500 | | | | 6,601,948 | |
Daiwa Securities Group Incorporated (Financials, Capital Markets) | | | | | | | 1,444,000 | | | | 9,873,451 | |
Hitachi Limited (Information Technology, Electronic Equipment, Instruments & Components) | | | | | | | 2,336,000 | | | | 13,475,892 | |
Mitsubishi UFJ Financial Group Incorporated (Financials, Banks) | | | | | | | 2,271,600 | | | | 14,691,641 | |
Mitsui Fudosan Company Limited (Financials, Real Estate Management & Development) | | | | | | | 315,000 | | | | 8,572,299 | |
Nitto Denko Corporation (Materials, Chemicals) | | | | | | | 78,588 | | | | 5,039,407 | |
Nomura Holdings Incorporated (Financials, Capital Markets) | | | | | | | 1,738,000 | | | | 10,932,616 | |
Toyota Motor Corporation (Consumer Discretionary, Automobiles) | | | | | | | 136,400 | | | | 8,356,468 | |
West Holdings Corporation (Consumer Discretionary, Household Durables) | | | | | | | 430,600 | | | | 2,525,869 | |
Yaskawa Electric Corporation (Information Technology, Electronic Equipment, Instruments & Components) | | | | | | | 271,600 | | | | 3,221,692 | |
| | | | |
| | | | | | | | | | | 90,204,625 | |
| | | | | | | | | | | | |
| | | | |
| Netherlands: 2.54% | | | | | | | | | | | | |
Akzo Nobel NV (Materials, Chemicals) « | | | | | | | 152,465 | | | | 10,783,905 | |
| | | | | | | | | | | | |
| | | | |
| Norway: 1.54% | | | | | | | | | | | | |
Frontline 2012 Limited (Energy, Oil, Gas & Consumable Fuels) 144A | | | | | | | 321,643 | | | | 2,271,290 | |
Golden Ocean Group Limited (Industrials, Marine) †« | | | | | | | 87,655 | | | | 170,085 | |
Marine Harvest ASA (Consumer Staples, Food Products) | | | | | | | 304,424 | | | | 4,085,959 | |
| | | | |
| | | | | | | | | | | 6,527,334 | |
| | | | | | | | | | | | |
| | | | |
| South Korea: 3.73% | | | | | | | | | | | | |
Hana Financial Group Incorporated (Financials, Banks) | | | | | | | 278,193 | | | | 6,765,371 | |
Samsung Electronics Company Limited GDR (Information Technology, Semiconductors & Semiconductor Equipment) 144A | | | | | | | 13,879 | | | | 8,292,269 | |
SK Telecom Company Limited (Telecommunication Services, Wireless Telecommunication Services) | | | | | | | 3,806 | | | | 805,967 | |
| | | | |
| | | | | | | | | | | 15,863,607 | |
| | | | | | | | | | | | |
| | | | |
| Sweden: 1.33% | | | | | | | | | | | | |
Volvo AB Class B (Industrials, Machinery) | | | | | | | 545,336 | | | | 5,640,481 | |
| | | | | | | | | | | | |
| | | | |
| Switzerland: 5.59% | | | | | | | | | | | | |
ABB Limited (Industrials, Electrical Equipment) | | | | | | | 404,960 | | | | 7,639,852 | |
Novartis AG (Health Care, Pharmaceuticals) | | | | | | | 94,405 | | | | 8,552,022 | |
Zurich Insurance Group AG (Financials, Insurance) | | | | | | | 28,681 | | | | 7,568,913 | |
| | | | |
| | | | | | | | | | | 23,760,787 | |
| | | | | | | | | | | | |
| | | | |
| United Kingdom: 13.88% | | | | | | | | | | | | |
BP plc (Energy, Oil, Gas & Consumable Fuels) | | | | | | | 1,552,079 | | | | 9,223,983 | |
Capita plc (Industrials, Professional Services) | | | | | | | 224,364 | | | | 4,401,098 | |
Man Group plc (Financials, Capital Markets) | | | | | | | 4,702,343 | | | | 12,069,364 | |
Reckitt Benckiser Group plc (Consumer Staples, Household Products) | | | | | | | 83,045 | | | | 8,104,399 | |
Smiths Group plc (Industrials, Industrial Conglomerates) | | | | | | | 297,702 | | | | 4,404,199 | |
Vodafone Group plc (Telecommunication Services, Wireless Telecommunication Services) | | | | | | | 3,055,345 | | | | 10,054,931 | |
Wolseley plc (Industrials, Trading Companies & Distributors) | | | | | | | 182,586 | | | | 10,719,856 | |
| | | | |
| | | | | | | | | | | 58,977,830 | |
| | | | | | | | | | | | |
The accompanying notes are an integral part of these financial statements.
| | | | | | |
| Portfolio of investments—October 31, 2015 | | Wells Fargo International Equity Fund | | | 11 | |
| | | | | | | | | | | | | | | | |
| Security name | | | | | | | | Shares | | | Value | |
| | | | | | | | | | | | | | | | |
| | | | |
| United States: 1.50% | | | | | | | | | | | | | | | | |
QUALCOMM Incorporated (Information Technology, Communications Equipment) | | | | | | | | | | | 106,929 | | | $ | 6,353,721 | |
| | | | | | | | | | | | | | | | |
| | | | |
Total Common Stocks (Cost $354,957,309) | | | | | | | | | | | | | | | 378,230,439 | |
| | | | | | | | | | | | | | | | |
| | | | |
| | | | | | Expiration date | | | | | | | |
| Participation Notes: 0.98% | | | | | | | | | | | | | | | | |
| | | | |
| China: 0.98% | | | | | | | | | | | | | | | | |
HSBC Bank plc (Kweichow Moutai Company Limited Class A) (Consumer Staples, Beverages) † | | | | | | | 2-19-2019 | | | | 30,360 | | | | 1,026,447 | |
HSBC Bank plc (Kweichow Moutai Company Limited Class A) (Consumer Staples, Beverages) † | | | | | | | 12-4-2024 | | | | 34,600 | | | | 1,169,798 | |
Standard Chartered Bank (Kweichow Moutai Company Limited Class A) (Consumer Staples, Beverages) † | | | | | | | 4-18-2016 | | | | 57,471 | | | | 1,943,048 | |
| | | | |
Total Participation Notes (Cost $3,795,249) | | | | | | | | | | | | | | | 4,139,293 | |
| | | | | | | | | | | | | | | | |
| | | | |
| | | Yield | | | | | | | | | | |
| Short-Term Investments: 10.48% | | | | | | | | | | | | | | | | |
| | | | |
| Investment Companies: 10.48% | | | | | | | | | | | | | | | | |
Securities Lending Cash Investments, LLC (l)(r)(u) | | | 0.14 | % | | | | | | | 1,039,471 | | | | 1,039,471 | |
Wells Fargo Cash Investment Money Market Fund, Select Class (l)(u) | | | 0.16 | | | | | | | | 43,482,773 | | | | 43,482,773 | |
| | | | |
Total Short-Term Investments (Cost $44,522,244) | | | | | | | | | | | | | | | 44,522,244 | |
| | | | | | | | | | | | | | | | |
| | | | | | | | |
| Total investments in securities (Cost $403,274,802) * | | | 100.49 | % | | | 426,891,976 | |
Other assets and liabilities, net | | | (0.49 | ) | | | (2,077,156 | ) |
| | | | | | | | |
| Total net assets | | | 100.00 | % | | $ | 424,814,820 | |
| | | | | | | | |
| † | Non-income-earning security |
| « | All or a portion of this security is on loan. |
| 144A | The security may be resold in transactions exempt from registration, normally to qualified institutional buyers, pursuant to Rule 144A under the Securities Act of 1933. |
| (l) | The issuer of the security is an affiliated person of the Fund as defined in the Investment Company Act of 1940. |
| (r) | The investment is a non-registered investment vehicle purchased with cash collateral received from securities on loan. |
| (u) | The rate represents the 7-day annualized yield at period end. |
| * | Cost for federal income tax purposes is $405,579,866 and unrealized gains (losses) consists of: |
| | | | |
Gross unrealized gains | | $ | 38,263,858 | |
Gross unrealized losses | | | (16,951,748 | ) |
| | | | |
Net unrealized gains | | $ | 21,312,110 | |
The accompanying notes are an integral part of these financial statements.
| | | | |
| 12 | | Wells Fargo International Equity Fund | | Statement of assets and liabilities—October 31, 2015 |
| | | | |
| | | | |
| |
Assets | | | | |
Investments | | | | |
In unaffiliated securities (including $930,331 of securities loaned), at value (cost $358,752,558) | | $ | 382,369,732 | |
In affiliated securities, at value (cost $44,522,244) | | | 44,522,244 | |
| | | | |
Total investments, at value (cost $403,274,802) | | | 426,891,976 | |
Foreign currency, at value (cost $164,799) | | | 163,691 | |
Receivable for Fund shares sold | | | 4,594,084 | |
Receivable for dividends | | | 1,175,187 | |
Receivable for securities lending income | | | 1,098 | |
Unrealized gains on forward foreign currency contracts | | | 1,235,384 | |
Prepaid expenses and other assets | | | 60,785 | |
| | | | |
Total assets | | | 434,122,205 | |
| | | | |
| |
Liabilities | | | | |
Payable for investments purchased | | | 7,532,850 | |
Payable for Fund shares redeemed | | | 303,684 | |
Payable upon receipt of securities loaned | | | 1,039,471 | |
Management fee payable | | | 195,529 | |
Distribution fees payable | | | 20,433 | |
Administration fees payable | | | 58,519 | |
Accrued expenses and other liabilities | | | 156,899 | |
| | | | |
Total liabilities | | | 9,307,385 | |
| | | | |
Total net assets | | $ | 424,814,820 | |
| | | | |
| |
NET ASSETS CONSIST OF | | | | |
Paid-in capital | | $ | 441,321,987 | |
Undistributed net investment income | | | 4,903,871 | |
Accumulated net realized losses on investments | | | (46,251,087 | ) |
Net unrealized gains on investments | | | 24,840,049 | |
| | | | |
Total net assets | | $ | 424,814,820 | |
| | | | |
| |
COMPUTATION OF NET ASSET VALUE AND OFFERING PRICE PER SHARE | | | | |
Net assets – Class A | | $ | 145,654,487 | |
Shares outstanding – Class A1 | | | 12,635,200 | |
Net asset value per share – Class A | | | $11.53 | |
Maximum offering price per share – Class A2 | | | $12.23 | |
Net assets – Class B | | $ | 2,638,867 | |
Shares outstanding – Class B1 | | | 235,368 | |
Net asset value per share – Class B | | | $11.21 | |
Net assets – Class C | | $ | 29,079,927 | |
Shares outstanding – Class C1 | | | 2,573,424 | |
Net asset value per share – Class C | | | $11.30 | |
Net assets – Class R | | $ | 2,146,996 | |
Shares outstanding – Class R1 | | | 184,156 | |
Net asset value per share – Class R | | | $11.66 | |
Net assets – Class R6 | | $ | 26,385 | |
Shares outstanding – Class R61 | | | 2,296 | |
Net asset value per share – Class R6 | | | $11.49 | |
Net assets – Administrator Class | | $ | 52,469,493 | |
Shares outstanding – Administrator Class1 | | | 4,631,634 | |
Net asset value per share – Administrator Class | | | $11.33 | |
Net assets – Institutional Class | | $ | 192,798,665 | |
Shares outstanding – Institutional Class1 | | | 16,775,803 | |
Net asset value per share – Institutional Class | | | $11.49 | |
| 1 | The Fund has an unlimited number of authorized shares. |
| 2 | Maximum offering price is computed as 100/94.25 of net asset value. On investments of $50,000 or more, the offering price is reduced. |
The accompanying notes are an integral part of these financial statements.
| | | | | | |
| Statement of operations—year ended October 31, 2015 | | Wells Fargo International Equity Fund | | | 13 | |
| | | | |
| | | | |
| |
Investment income | | | | |
Dividends (net of foreign withholding taxes of $519,108) | | $ | 6,452,276 | |
Securities lending income, net | | | 99,388 | |
Income from affiliated securities | | | 29,507 | |
| | | | |
Total investment income | | | 6,581,171 | |
| | | | |
| |
Expenses | | | | |
Management fee | | | 2,322,207 | |
Administration fees | | | | |
Class A | | | 274,780 | |
Class B | | | 8,320 | |
Class C | | | 48,377 | |
Class R | | | 4,481 | |
Class R6 | | | 1 | 1 |
Administrator Class | | | 30,873 | |
Institutional Class | | | 96,295 | |
Shareholder servicing fees | | | | |
Class A | | | 286,300 | |
Class B | | | 8,465 | |
Class C | | | 50,750 | |
Class R | | | 4,689 | |
Administrator Class | | | 65,226 | |
Distribution fees | | | | |
Class B | | | 25,393 | |
Class C | | | 152,249 | |
Class R | | | 4,689 | |
Custody and accounting fees | | | 98,075 | |
Professional fees | | | 91,512 | |
Registration fees | | | 70,887 | |
Shareholder report expenses | | | 54,598 | |
Trustees’ fees and expenses | | | 21,998 | |
Other fees and expenses | | | 25,486 | |
| | | | |
Total expenses | | | 3,745,651 | |
Less: Fee waivers and/or expense reimbursements | | | (980,497 | ) |
| | | | |
Net expenses | | | 2,765,154 | |
| | | | |
Net investment income | | | 3,816,017 | |
| | | | |
| |
REALIZED AND UNREALIZED GAINS (LOSSES) ON INVESTMENTS | | | | |
Net realized gains on: | | | | |
Unaffiliated securities | | | 5,113,220 | |
Forward foreign currency contract transactions | | | 1,698,364 | |
| | | | |
Net realized gains on investments | | | 6,811,584 | |
| | | | |
Net change in unrealized gains (losses) on: | | | | |
Unaffiliated securities | | | (6,231,266 | ) |
Forward foreign currency contract transactions | | | 794,474 | |
| | | | |
Net change in unrealized gains (losses) on investments | | | (5,436,792 | ) |
| | | | |
Net realized and unrealized gains (losses) on investments | | | 1,374,792 | |
| | | | |
Net increase in net assets resulting from operations | | $ | 5,190,809 | |
| | | | |
| 1 | For the period from September 30, 2015 (commencement of class operations) to October 31, 2015 |
The accompanying notes are an integral part of these financial statements.
| | | | |
| 14 | | Wells Fargo International Equity Fund | | Statement of changes in net assets |
| | | | | | | | | | | | | | | | |
| | | Year ended
October 31, 2015 | | | Year ended
October 31, 2014 | |
| | | | |
Operations | | | | | | | | | | | | | | | | |
Net investment income | | | | | | $ | 3,816,017 | | | | | | | $ | 6,499,158 | |
Net realized gains on investments | | | | | | | 6,811,584 | | | | | | | | 2,939,425 | |
Net change in unrealized gains (losses) on investments | | | | | | | (5,436,792 | ) | | | | | | | (17,267,991 | ) |
| | | | | | | | | | | | | | | | |
Net increase (decrease) in net assets resulting from operations | | | | | | | 5,190,809 | | | | | | | | (7,829,408 | ) |
| | | | |
| | | | |
Distributions to shareholders from | | | | | | | | | | | | | | | | |
Net investment income | | | | | | | | | | | | | | | | |
Class A | | | | | | | (4,144,449 | ) | | | | | | | (2,501,560 | ) |
Class B | | | | | | | (133,491 | ) | | | | | | | (86,510 | ) |
Class C | | | | | | | (589,249 | ) | | | | | | | (245,790 | ) |
Class R | | | | | | | (58,692 | ) | | | | | | | (13,985 | ) |
Administrator Class | | | | | | | (444,265 | ) | | | | | | | (102,289 | ) |
Institutional Class | | | | | | | (3,012,972 | ) | | | | | | | (1,898,103 | ) |
| | | | | | | | | | | | | | | | |
Total distributions to shareholders | | | | | | | (8,383,118 | ) | | | | | | | (4,848,237 | ) |
| | | | |
| | | | |
Capital share transactions | | | Shares | | | | | | | | Shares | | | | | |
Proceeds from shares sold | | | | | | | | | | | | | | | | |
Class A | | | 5,686,291 | | | | 68,771,982 | | | | 1,770,644 | | | | 20,755,971 | |
Class B | | | 4,367 | | | | 52,179 | | | | 2,057 | | | | 23,111 | |
Class C | | | 1,364,465 | | | | 16,286,613 | | | | 286,544 | | | | 3,296,726 | |
Class R | | | 127,293 | | | | 1,581,522 | | | | 34,731 | | | | 411,910 | |
Class R6 | | | 2,296 | 1 | | | 25,000 | 1 | | | N/A | | | | N/A | |
Administrator Class | | | 5,575,269 | | | | 66,219,302 | | | | 1,087,000 | | | | 12,536,509 | |
Institutional Class | | | 14,609,456 | | | | 168,904,517 | | | | 1,478,849 | | | | 17,423,599 | |
| | | | |
| | | | | | | 321,841,115 | | | | | | | | 54,447,826 | |
| | | | |
Reinvestment of distributions | | | | | | | | | | | | | | | | |
Class A | | | 350,957 | | | | 3,835,959 | | | | 183,571 | | | | 2,204,689 | |
Class B | | | 12,086 | | | | 129,201 | | | | 7,028 | | | | 82,440 | |
Class C | | | 47,129 | | | | 508,047 | | | | 18,292 | | | | 216,764 | |
Class R | | | 2,725 | | | | 30,167 | | | | 467 | | | | 5,680 | |
Administrator Class | | | 41,287 | | | | 443,423 | | | | 6,202 | | | | 73,240 | |
Institutional Class | | | 220,501 | | | | 2,396,847 | | | | 100,489 | | | | 1,200,840 | |
| | | | |
| | | | | | | 7,343,644 | | | | | | | | 3,783,653 | |
| | | | |
Payment for shares redeemed | | | | | | | | | | | | | | | | |
Class A | | | (2,058,420 | ) | | | (23,991,275 | ) | | | (2,964,305 | ) | | | (34,898,761 | ) |
Class B | | | (158,096 | ) | | | (1,803,160 | ) | | | (218,071 | ) | | | (2,489,646 | ) |
Class C | | | (316,369 | ) | | | (3,631,747 | ) | | | (273,075 | ) | | | (3,147,560 | ) |
Class R | | | (84,187 | ) | | | (995,805 | ) | | | (83,667 | ) | | | (995,507 | ) |
Administrator Class | | | (2,153,660 | ) | | | (24,140,441 | ) | | | (259,973 | ) | | | (2,909,657 | ) |
Institutional Class | | | (3,722,844 | ) | | | (43,032,964 | ) | | | (2,848,720 | ) | | | (33,494,543 | ) |
| | | | |
| | | | | | | (97,595,392 | ) | | | | | | | (77,935,674 | ) |
| | | | |
Net increase (decrease) in net assets resulting from capital share transactions | | | | | | | 231,589,367 | | | | | | | | (19,704,195 | ) |
| | | | |
Total increase (decrease) in net assets | | | | | | | 228,397,058 | | | | | | | | (32,381,840 | ) |
| | | | |
| | | | |
Net assets | | | | | | | | | | | | | | | | |
Beginning of period | | | | | | | 196,417,762 | | | | | | | | 228,799,602 | |
| | | | |
End of period | | | | | | $ | 424,814,820 | | | | | | | $ | 196,417,762 | |
| | | | |
Undistributed net investment income | | | | | | $ | 4,903,871 | | | | | | | $ | 7,799,740 | |
| | | | |
| 1 | For the period from September 30, 2015 (commencement of class operations) to October 31, 2015 |
The accompanying notes are an integral part of these financial statements.
| | | | | | |
| Financial highlights | | Wells Fargo International Equity Fund | | | 15 | |
(For a share outstanding throughout each period)
| | | | | | | | | | | | | | | | | | | | |
| | | Year ended October 31 | |
| CLASS A | | 2015 | | | 2014 | | | 2013 | | | 2012 | | | 2011 | |
Net asset value, beginning of period | | | $11.28 | | | | $11.98 | | | | $9.77 | | | | $9.82 | | | | $10.41 | |
Net investment income | | | 0.18 | 1 | | | 0.37 | 1 | | | 0.21 | | | | 0.25 | | | | 0.17 | |
Net realized and unrealized gains (losses) on investments | | | 0.57 | | | | (0.81 | ) | | | 2.27 | | | | (0.09 | ) | | | (0.75 | ) |
| | | | | | | | | | | | | | | | | | | | |
Total from investment operations | | | 0.75 | | | | (0.44 | ) | | | 2.48 | | | | 0.16 | | | | (0.58 | ) |
Distributions to shareholders from | | | | | | | | | | | | | | | | | | | | |
Net investment income | | | (0.50 | ) | | | (0.26 | ) | | | (0.27 | ) | | | (0.21 | ) | | | (0.01 | ) |
Net asset value, end of period | | | $11.53 | | | | $11.28 | | | | $11.98 | | | | $9.77 | | | | $9.82 | |
Total return2 | | | 6.85 | % | | | (3.77 | )% | | | 25.99 | % | | | 1.83 | % | | | (5.62 | )% |
Ratios to average net assets (annualized) | | | | | | | | | | | | | | | | | | | | |
Gross expenses | | | 1.53 | % | | | 1.53 | % | | | 1.56 | % | | | 1.53 | % | | | 1.46 | % |
Net expenses | | | 1.09 | % | | | 1.09 | % | | | 1.09 | % | | | 1.09 | % | | | 1.09 | % |
Net investment income | | | 1.50 | % | | | 3.14 | % | | | 2.03 | % | | | 2.49 | % | | | 1.55 | % |
Supplemental data | | | | | | | | | | | | | | | | | | | | |
Portfolio turnover rate | | | 27 | % | | | 32 | % | | | 38 | % | | | 115 | % | | | 44 | % |
Net assets, end of period (000s omitted) | | | $145,654 | | | | $97,640 | | | | $115,821 | | | | $114,219 | | | | $162,954 | |
| 1 | Calculated based upon average shares outstanding |
| 2 | Total return calculations do not include any sales charges. |
The accompanying notes are an integral part of these financial statements.
| | | | |
| 16 | | Wells Fargo International Equity Fund | | Financial highlights |
(For a share outstanding throughout each period)
| | | | | | | | | | | | | | | | | | | | |
| | | Year ended October 31 | |
| CLASS B | | 2015 | | | 2014 | | | 2013 | | | 2012 | | | 2011 | |
Net asset value, beginning of period | | | $10.95 | | | | $11.62 | | | | $9.47 | | | | $9.48 | | | | $10.12 | |
Net investment income | | | 0.08 | 1 | | | 0.28 | 1 | | | 0.13 | 1 | | | 0.16 | 1 | | | 0.08 | 1 |
Net realized and unrealized gains (losses) on investments | | | 0.56 | | | | (0.79 | ) | | | 2.21 | | | | (0.07 | ) | | | (0.72 | ) |
| | | | | | | | | | | | | | | | | | | | |
Total from investment operations | | | 0.64 | | | | (0.51 | ) | | | 2.34 | | | | 0.09 | | | | (0.64 | ) |
Distributions to shareholders from | | | | | | | | | | | | | | | | | | | | |
Net investment income | | | (0.38 | ) | | | (0.16 | ) | | | (0.19 | ) | | | (0.10 | ) | | | 0.00 | |
Net asset value, end of period | | | $11.21 | | | | $10.95 | | | | $11.62 | | | | $9.47 | | | | $9.48 | |
Total return2 | | | 6.00 | % | | | (4.48 | )% | | | 25.07 | % | | | 0.99 | % | | | (6.32 | )% |
Ratios to average net assets (annualized) | | | | | | | | | | | | | | | | | | | | |
Gross expenses | | | 2.29 | % | | | 2.28 | % | | | 2.31 | % | | | 2.28 | % | | | 2.21 | % |
Net expenses | | | 1.84 | % | | | 1.84 | % | | | 1.84 | % | | | 1.84 | % | | | 1.84 | % |
Net investment income | | | 0.68 | % | | | 2.40 | % | | | 1.27 | % | | | 1.67 | % | | | 0.77 | % |
Supplemental data | | | | | | | | | | | | | | | | | | | | |
Portfolio turnover rate | | | 27 | % | | | 32 | % | | | 38 | % | | | 115 | % | | | 44 | % |
Net assets, end of period (000s omitted) | | | $2,639 | | | | $4,127 | | | | $6,810 | | | | $8,303 | | | | $12,873 | |
| 1 | Calculated based upon average shares outstanding |
| 2 | Total return calculations do not include any sales charges. |
The accompanying notes are an integral part of these financial statements.
| | | | | | |
| Financial highlights | | Wells Fargo International Equity Fund | | | 17 | |
(For a share outstanding throughout each period)
| | | | | | | | | | | | | | | | | | | | |
| | | Year ended October 31 | |
| CLASS C | | 2015 | | | 2014 | | | 2013 | | | 2012 | | | 2011 | |
Net asset value, beginning of period | | | $11.06 | | | | $11.75 | | | | $9.58 | | | | $9.59 | | | | $10.24 | |
Net investment income | | | 0.08 | 1 | | | 0.27 | 1 | | | 0.14 | 1 | | | 0.16 | 1 | | | 0.06 | |
Net realized and unrealized gains (losses) on investments | | | 0.57 | | | | (0.79 | ) | | | 2.22 | | | | (0.07 | ) | | | (0.71 | ) |
| | | | | | | | | | | | | | | | | | | | |
Total from investment operations | | | 0.65 | | | | (0.52 | ) | | | 2.36 | | | | 0.09 | | | | (0.65 | ) |
Distributions to shareholders from | | | | | | | | | | | | | | | | | | | | |
Net investment income | | | (0.41 | ) | | | (0.17 | ) | | | (0.19 | ) | | | (0.10 | ) | | | 0.00 | |
Net asset value, end of period | | | $11.30 | | | | $11.06 | | | | $11.75 | | | | $9.58 | | | | $9.59 | |
Total return2 | | | 6.03 | % | | | (4.49 | )% | | | 25.05 | % | | | 1.08 | % | | | (6.35 | )% |
Ratios to average net assets (annualized) | | | | | | | | | | | | | | | | | | | | |
Gross expenses | | | 2.28 | % | | | 2.28 | % | | | 2.31 | % | | | 2.28 | % | | | 2.21 | % |
Net expenses | | | 1.84 | % | | | 1.84 | % | | | 1.84 | % | | | 1.84 | % | | | 1.84 | % |
Net investment income | | | 0.72 | % | | | 2.37 | % | | | 1.30 | % | | | 1.72 | % | | | 0.79 | % |
Supplemental data | | | | | | | | | | | | | | | | | | | | |
Portfolio turnover rate | | | 27 | % | | | 32 | % | | | 38 | % | | | 115 | % | | | 44 | % |
Net assets, end of period (000s omitted) | | | $29,080 | | | | $16,346 | | | | $16,997 | | | | $16,760 | | | | $22,578 | |
| 1 | Calculated based upon average shares outstanding |
| 2 | Total return calculations do not include any sales charges. |
The accompanying notes are an integral part of these financial statements.
| | | | |
| 18 | | Wells Fargo International Equity Fund | | Financial highlights |
(For a share outstanding throughout each period)
| | | | | | | | | | | | | | | | | | | | |
| | | Year ended October 31 | |
| CLASS R | | 2015 | | | 2014 | | | 2013 | | | 2012 | | | 2011 | |
Net asset value, beginning of period | | | $11.40 | | | | $11.96 | | | | $9.75 | | | | $9.79 | | | | $10.40 | |
Net investment income | | | 0.15 | 1 | | | 0.32 | 1 | | | 0.18 | 1 | | | 0.20 | 1 | | | 0.14 | 1 |
Net realized and unrealized gains (losses) on investments | | | 0.57 | | | | (0.79 | ) | | | 2.27 | | | | (0.06 | ) | | | (0.75 | ) |
| | | | | | | | | | | | | | | | | | | | |
Total from investment operations | | | 0.72 | | | | (0.47 | ) | | | 2.45 | | | | 0.14 | | | | (0.61 | ) |
Distributions to shareholders from | | | | | | | | | | | | | | | | | | | | |
Net investment income | | | (0.46 | ) | | | (0.09 | ) | | | (0.24 | ) | | | (0.18 | ) | | | 0.00 | |
Net asset value, end of period | | | $11.66 | | | | $11.40 | | | | $11.96 | | | | $9.75 | | | | $9.79 | |
Total return | | | 6.53 | % | | | (4.00 | )% | | | 25.68 | % | | | 1.58 | % | | | (5.87 | )% |
Ratios to average net assets (annualized) | | | | | | | | | | | | | | | | | | | | |
Gross expenses | | | 1.78 | % | | | 1.78 | % | | | 1.81 | % | | | 1.78 | % | | | 1.71 | % |
Net expenses | | | 1.34 | % | | | 1.34 | % | | | 1.34 | % | | | 1.34 | % | | | 1.34 | % |
Net investment income | | | 1.23 | % | | | 2.71 | % | | | 1.72 | % | | | 2.11 | % | | | 1.31 | % |
Supplemental data | | | | | | | | | | | | | | | | | | | | |
Portfolio turnover rate | | | 27 | % | | | 32 | % | | | 38 | % | | | 115 | % | | | 44 | % |
Net assets, end of period (000s omitted) | | | $2,147 | | | | $1,576 | | | | $2,234 | | | | $2,196 | | | | $3,050 | |
| 1 | Calculated based upon average shares outstanding |
The accompanying notes are an integral part of these financial statements.
| | | | | | |
| Financial highlights | | Wells Fargo International Equity Fund | | | 19 | |
(For a share outstanding throughout the period)
| | | | |
| CLASS R6 | | Year ended
October 31, 20151 | |
Net asset value, beginning of period | | | $10.89 | |
Net investment income | | | 0.00 | 2 |
Net realized and unrealized gains (losses) on investments | | | 0.60 | |
| | | | |
Total from investment operations | | | 0.60 | |
Net asset value, end of period | | | $11.49 | |
Total return3 | | | 5.51 | % |
Ratios to average net assets (annualized) | | | | |
Gross expenses | | | 1.05 | % |
Net expenses | | | 0.88 | % |
Net investment income | | | 0.23 | % |
Supplemental data | | | | |
Portfolio turnover rate | | | 27 | % |
Net assets, end of period (000s omitted) | | | $26 | |
| 1 | For the period from September 30, 2015 (commencement of class operations) to October 31, 2015 |
| 2 | Amount is less than $0.005 per share. |
| 3 | Returns for periods of less than one year are not annualized. |
The accompanying notes are an integral part of these financial statements.
| | | | |
| 20 | | Wells Fargo International Equity Fund | | Financial highlights |
(For a share outstanding throughout each period)
| | | | | | | | | | | | | | | | | | | | |
| | | Year ended October 31 | |
| ADMINISTRATOR CLASS | | 2015 | | | 2014 | | | 2013 | | | 2012 | | | 2011 | |
Net asset value, beginning of period | | | $11.09 | | | | $11.79 | | | | $9.62 | | | | $9.67 | | | | $10.28 | |
Net investment income | | | 0.17 | 1 | | | 0.37 | 1 | | | 0.22 | | | | 0.25 | | | | 0.16 | |
Net realized and unrealized gains (losses) on investments | | | 0.57 | | | | (0.80 | ) | | | 2.22 | | | | (0.09 | ) | | | (0.74 | ) |
| | | | | | | | | | | | | | | | | | | | |
Total from investment operations | | | 0.74 | | | | (0.43 | ) | | | 2.44 | | | | 0.16 | | | | (0.58 | ) |
Distributions to shareholders from | | | | | | | | | | | | | | | | | | | | |
Net investment income | | | (0.50 | ) | | | (0.27 | ) | | | (0.27 | ) | | | (0.21 | ) | | | (0.03 | ) |
Net asset value, end of period | | | $11.33 | | | | $11.09 | | | | $11.79 | | | | $9.62 | | | | $9.67 | |
Total return | | | 6.89 | % | | | (3.82 | )% | | | 26.00 | % | | | 1.88 | % | | | (5.68 | )% |
Ratios to average net assets (annualized) | | | | | | | | | | | | | | | | | | | | |
Gross expenses | | | 1.40 | % | | | 1.37 | % | | | 1.37 | % | | | 1.36 | % | | | 1.25 | % |
Net expenses | | | 1.09 | % | | | 1.09 | % | | | 1.09 | % | | | 1.09 | % | | | 1.09 | % |
Net investment income | | | 1.44 | % | | | 3.21 | % | | | 2.08 | % | | | 2.52 | % | | | 1.58 | % |
Supplemental data | | | | | | | | | | | | | | | | | | | | |
Portfolio turnover rate | | | 27 | % | | | 32 | % | | | 38 | % | | | 115 | % | | | 44 | % |
Net assets, end of period (000s omitted) | | | $52,469 | | | | $12,962 | | | | $3,955 | | | | $3,505 | | | | $3,436 | |
| 1 | Calculated based upon average shares outstanding |
The accompanying notes are an integral part of these financial statements.
| | | | | | |
| Financial highlights | | Wells Fargo International Equity Fund | | | 21 | |
(For a share outstanding throughout each period)
| | | | | | | | | | | | | | | | | | | | |
| | | Year ended October 31 | |
| INSTITUTIONAL CLASS | | 2015 | | | 2014 | | | 2013 | | | 2012 | | | 2011 | |
Net asset value, beginning of period | | | $11.25 | | | | $11.96 | | | | $9.76 | | | | $9.83 | | | | $10.42 | |
Net investment income | | | 0.19 | 1 | | | 0.37 | 1 | | | 0.24 | 1 | | | 0.37 | | | | 0.19 | 1 |
Net realized and unrealized gains (losses) on investments | | | 0.58 | | | | (0.77 | ) | | | 2.26 | | | | (0.19 | ) | | | (0.75 | ) |
| | | | | | | | | | | | | | | | | | | | |
Total from investment operations | | | 0.77 | | | | (0.40 | ) | | | 2.50 | | | | 0.18 | | | | (0.56 | ) |
Distributions to shareholders from | | | | | | | | | | | | | | | | | | | | |
Net investment income | | | (0.53 | ) | | | (0.31 | ) | | | (0.30 | ) | | | (0.25 | ) | | | (0.03 | ) |
Net asset value, end of period | | | $11.49 | | | | $11.25 | | | | $11.96 | | | | $9.76 | | | | $9.83 | |
Total return | | | 7.07 | % | | | (3.53 | )% | | | 26.31 | % | | | 2.05 | % | | | (5.38 | )% |
Ratios to average net assets (annualized) | | | | | | | | | | | | | | | | | | | | |
Gross expenses | | | 1.15 | % | | | 1.10 | % | | | 1.13 | % | | | 1.10 | % | | | 1.03 | % |
Net expenses | | | 0.84 | % | | | 0.84 | % | | | 0.84 | % | | | 0.84 | % | | | 0.84 | % |
Net investment income | | | 1.67 | % | | | 3.18 | % | | | 2.29 | % | | | 2.67 | % | | | 1.78 | % |
Supplemental data | | | | | | | | | | | | | | | | | | | | |
Portfolio turnover rate | | | 27 | % | | | 32 | % | | | 38 | % | | | 115 | % | | | 44 | % |
Net assets, end of period (000s omitted) | | | $192,799 | | | | $63,766 | | | | $82,982 | | | | $138,245 | | | | $227,158 | |
| 1 | Calculated based upon average shares outstanding |
The accompanying notes are an integral part of these financial statements.
| | | | |
| 22 | | Wells Fargo International Equity Fund | | Notes to financial statements |
1. ORGANIZATION
Wells Fargo Funds Trust (the “Trust”), a Delaware statutory trust organized on March 10, 1999, is an open-end management investment company registered under the Investment Company Act of 1940, as amended (the “1940 Act”). As an investment company, the Trust follows the accounting and reporting guidance in Financial Accounting Standards Board (“FASB”) Accounting Standards Codification Topic 946, Financial Services – Investment Companies. These financial statements report on the Wells Fargo International Equity Fund (the “Fund”) which is a diversified series of the Trust.
2. SIGNIFICANT ACCOUNTING POLICIES
The following significant accounting policies, which are consistently followed in the preparation of the financial statements of the Fund, are in conformity with U.S. generally accepted accounting principles which require management to make estimates and assumptions that affect the reported amounts of assets and liabilities, disclosure of contingent assets and liabilities at the date of the financial statements, and the reported amounts of revenues and expenses during the reporting period. Actual results could differ from those estimates.
Securities valuation
All investments are valued each business day as of the close of regular trading on the New York Stock Exchange (generally 4 p.m. Eastern Time).
Equity securities that are listed on a foreign or domestic exchange or market are valued at the official closing price or, if none, the last sales price. If no sale occurs on the primary exchange or market that day, the prior day’s price will be deemed “stale” and a fair value price will be determined in accordance with the Fund’s Valuation Procedures.
Equity securities that are not listed on a foreign or domestic exchange or market, but have a public trading market, are valued at the quoted bid price from an independent broker-dealer that the Management Valuation Team of Wells Fargo Funds Management, LLC (“Funds Management”) has determined is an acceptable source.
The values of securities denominated in foreign currencies are translated into U.S. dollars at rates provided by an independent foreign currency pricing source at a time each business day specified by the Management Valuation Team.
Many securities markets and exchanges outside the U.S. close prior to the close of the New York Stock Exchange and therefore may not fully reflect trading or events that occur after the close of the principal exchange in which the foreign securities are traded, but before the close of the New York Stock Exchange. If such trading or events are expected to materially affect the value of such securities, then fair value pricing procedures approved by the Board of Trustees of the Fund are applied. These procedures take into account multiple factors including movements in U.S. securities markets after foreign exchanges close. Foreign securities that are fair valued under these procedures are categorized as Level 2 and the application of these procedures may result in transfers between Level 1 and Level 2. Depending on market activity, such fair valuations may be frequent. Such fair value pricing may result in net asset values that are higher or lower than net asset values based on the last reported sales price or latest quoted bid price. On October 31, 2015, such fair value pricing was used in pricing foreign securities.
Investments in registered open-end investment companies are valued at net asset value. Interests in non-registered investment vehicles that are redeemable at net asset value are fair valued at net asset value when available.
Investments which are not valued using any of the methods discussed above are valued at their fair value, as determined in good faith by the Board of Trustees. The Board of Trustees has established a Valuation Committee comprised of the Trustees and has delegated to it the authority to take any actions regarding the valuation of portfolio securities that the Valuation Committee deems necessary or appropriate, including determining the fair value of portfolio securities, unless the determination has been delegated to the Management Valuation Team. The Board of Trustees retains the authority to make or ratify any valuation decisions or approve any changes to the Valuation Procedures as it deems appropriate. On a quarterly basis, the Board of Trustees receives reports on any valuation actions taken by the Valuation Committee or the Management Valuation Team which may include items for ratification.
Valuations of fair valued securities are compared to the next actual sales price when available, or other appropriate market values, to assess the continued appropriateness of the fair valuation methodologies used. These securities are fair valued on a day-to-day basis, taking into consideration changes to appropriate market information and any significant changes to the inputs considered in the valuation process until there is a readily available price provided on an exchange or by an independent pricing service. Valuations received from an independent pricing service or independent broker-dealer quotes are periodically validated by comparisons to most recent trades and valuations provided by other independent pricing services in addition to the review of prices by the manager and/or subadviser. Unobservable inputs
| | | | | | |
| Notes to financial statements | | Wells Fargo International Equity Fund | | | 23 | |
used in determining fair valuations are identified based on the type of security, taking into consideration factors utilized by market participants in valuing the investment, knowledge about the issuer and the current market environment.
Foreign currency translation
The accounting records of the Fund are maintained in U.S. dollars. The values of other assets and liabilities denominated in foreign currencies are translated into U.S. dollars at rates provided by an independent foreign currency pricing source at a time each business day specified by the Management Valuation Team. Purchases and sales of securities, and income and expenses are converted at the rate of exchange on the respective dates of such transactions. Net realized foreign exchange gains or losses arise from sales of foreign currencies, currency gains or losses realized between the trade and settlement dates on securities transactions, and the difference between the amounts of dividends, interest and foreign withholding taxes recorded and the U.S. dollar equivalent of the amounts actually paid or received. Net unrealized foreign exchange gains and losses arise from changes in the fair value of assets and liabilities other than investments in securities resulting from changes in exchange rates. The changes in net assets arising from changes in exchange rates and the changes in net assets resulting from changes in market prices of securities are not separately presented. Such changes are included in net realized and unrealized gains or losses from investments.
Forward foreign currency contracts
The Fund is subject to foreign currency exchange rate risk in the normal course of pursuing its investment objectives. A forward foreign currency contract is an agreement between two parties to purchase or sell a specific currency for an agreed-upon price at a future date. The Fund enters into forward foreign currency contracts to facilitate transactions in foreign-denominated securities and to attempt to minimize the risk to the Fund from adverse changes in the relationship between currencies. Forward foreign currency contracts are recorded at the forward rate and marked-to-market daily. When the contracts are closed, realized gains and losses arising from such transactions are recorded as realized gains or losses on forward foreign currency contract transactions. The Fund could be exposed to risks if the counterparties to the contracts are unable to meet the terms of their contracts or if the value of the foreign currency changes unfavorably. The Fund’s maximum risk of loss from counterparty credit risk is the unrealized gains on the contracts. This risk may be mitigated if there is a master netting arrangement between the Fund and the counterparty.
Security loans
The Fund may lend its securities from time to time in order to earn additional income in the form of fees or interest on securities received as collateral or the investment of any cash received as collateral. The Fund continues to receive interest or dividends on the securities loaned. The Fund receives collateral in the form of cash or securities with a value at least equal to the value of the securities on loan. The value of the loaned securities is determined at the close of each business day and any additional required collateral is delivered to the Fund on the next business day. In a securities lending transaction, the net asset value of the Fund will be affected by an increase or decrease in the value of the securities loaned and by an increase or decrease in the value of the instrument in which collateral is invested. The amount of securities lending activity undertaken by the Fund fluctuates from time to time. In the event of default or bankruptcy by the borrower, the Fund may be prevented from recovering the loaned securities or gaining access to the collateral or may experience delays or costs in doing so. In addition, the investment of any cash collateral received may lose all or part of its value. The Fund has the right under the lending agreement to recover the securities from the borrower on demand.
The Fund lends its securities through an unaffiliated securities lending agent. Cash collateral received in connection with its securities lending transactions is invested in Securities Lending Cash Investments, LLC (the “Securities Lending Fund”). The Securities Lending Fund is exempt from registration under Section 3(c)(7) of the 1940 Act and is managed by Funds Management and is subadvised by Wells Capital Management Incorporated (“WellsCap”). Funds Management receives an advisory fee starting at 0.05% and declining to 0.01% as the average daily net assets of the Securities Lending Fund increase. All of the fees received by Funds Management are paid to WellsCap for its services as subadviser. The Securities Lending Fund seeks to provide a positive return compared to the daily Fed Funds Open rate by investing in high-quality, U.S. dollar-denominated short-term money market instruments. Securities Lending Fund investments are fair valued based upon the amortized cost valuation technique. Income earned from investment in the Securities Lending Fund is included in securities lending income on the Statement of Operations.
Security transactions and income recognition
Securities transactions are recorded on a trade date basis. Realized gains or losses are recorded on the basis of identified cost.
Dividend income is recognized on the ex-dividend date, except for certain dividends from foreign securities, which are recorded as soon as the custodian verifies the ex-dividend date. Dividend income from foreign securities is recorded net of foreign taxes withheld where recovery of such taxes is not assured.
| | | | |
| 24 | | Wells Fargo International Equity Fund | | Notes to financial statements |
Distributions to shareholders
Distributions to shareholders from net investment income and net realized gains, if any, are recorded on the ex-dividend date. Such distributions are determined in conformity with federal income tax regulations, which may differ in amount or character from net investment income and realized gains recognized for purposes of U.S. generally accepted accounting principles.
Federal and other taxes
The Fund intends to continue to qualify as a regulated investment company by distributing substantially all of its investment company taxable income and any net realized capital gains (after reduction for capital loss carryforwards) sufficient to relieve it from all, or substantially all, federal income taxes. Accordingly, no provision for federal income taxes was required.
The Fund’s income and federal excise tax returns and all financial records supporting those returns for the prior three fiscal years are subject to examination by the federal and Delaware revenue authorities. Management has analyzed the Fund’s tax positions taken on federal, state, and foreign tax returns for all open tax years and does not believe that there are any uncertain tax positions that require recognition of a tax liability.
Reclassifications are made to the Fund’s capital accounts for permanent tax differences to reflect income and gains available for distribution (or available capital loss carryforwards) under federal income tax regulations. U.S. generally accepted accounting principles require that certain components of net assets be adjusted to reflect permanent differences between financial and tax reporting. These reclassifications have no effect on net assets or net asset values per share. The primary permanent difference causing such reclassifications is due to foreign currency transactions. At October 31, 2015, as a result of permanent book-to-tax differences, the following reclassification adjustments were made on the Statement of Assets and Liabilities:
| | |
Undistributed net
investment income | | Accumulated net
realized losses
on investments |
| $1,671,232 | | $(1,671,232) |
As of October 31, 2015, the Fund had capital loss carryforwards available to offset future net realized capital gains in the amount of $43,946,020 expiring in 2016.
Class allocations
The separate classes of shares offered by the Fund differ principally in applicable sales charges, distribution, shareholder servicing, and administration fees. Class specific expenses are charged directly to that share class. Investment income, common expenses, and realized and unrealized gains (losses) on investments are allocated daily to each class of shares based on the relative proportion of net assets of each class.
3. FAIR VALUATION MEASUREMENTS
Fair value measurements of investments are determined within a framework that has established a fair value hierarchy based upon the various data inputs utilized in determining the value of the Fund’s investments. The three-level hierarchy gives the highest priority to unadjusted quoted prices in active markets for identical assets or liabilities (Level 1) and the lowest priority to significant unobservable inputs (Level 3). The Fund’s investments are classified within the fair value hierarchy based on the lowest level of input that is significant to the fair value measurement. The inputs are summarized into three broad levels as follows:
| n | | Level 1 – quoted prices in active markets for identical securities |
| n | | Level 2 – other significant observable inputs (including quoted prices for similar securities, interest rates, prepayment speeds, credit risk, use of amortized cost, etc.) |
| n | | Level 3 – significant unobservable inputs (including the Fund’s own assumptions in determining the fair value of investments) |
The inputs or methodologies used for valuing investments in securities are not necessarily an indication of the risk associated with investing in those securities.
| | | | | | |
| Notes to financial statements | | Wells Fargo International Equity Fund | | | 25 | |
The following is a summary of the inputs used in valuing the Fund’s assets and liabilities as of October 31, 2015:
| | | | | | | | | | | | | | | | |
| | | Quoted prices
(Level 1) | | | Other significant
observable inputs
(Level 2) | | | Significant
unobservable inputs
(Level 3) | | | Total | |
Assets | | | | | | | | | | | | | | | | |
Investments in: | | | | | | | | | | | | | | | | |
| | | | |
Common stocks | | | | | | | | | | | | | | | | |
Australia | | $ | 0 | | | $ | 1,313,059 | | | $ | 0 | | | $ | 1,313,059 | |
Brazil | | | 299,569 | | | | 0 | | | | 0 | | | | 299,569 | |
Canada | | | 10,402,571 | | | | 0 | | | | 0 | | | | 10,402,571 | |
China | | | 2,470,516 | | | | 26,974,629 | | | | 0 | | | | 29,445,145 | |
France | | | 0 | | | | 10,616,129 | | | | 0 | | | | 10,616,129 | |
Germany | | | 0 | | | | 54,239,392 | | | | 0 | | | | 54,239,392 | |
Hong Kong | | | 0 | | | | 18,705,816 | | | | 0 | | | | 18,705,816 | |
Italy | | | 0 | | | | 35,096,468 | | | | 0 | | | | 35,096,468 | |
Japan | | | 0 | | | | 90,204,625 | | | | 0 | | | | 90,204,625 | |
Netherlands | | | 0 | | | | 10,783,905 | | | | 0 | | | | 10,783,905 | |
Norway | | | 2,271,290 | | | | 4,256,044 | | | | 0 | | | | 6,527,334 | |
South Korea | | | 0 | | | | 15,863,607 | | | | 0 | | | | 15,863,607 | |
Sweden | | | 0 | | | | 5,640,481 | | | | 0 | | | | 5,640,481 | |
Switzerland | | | 0 | | | | 23,760,787 | | | | 0 | | | | 23,760,787 | |
United Kingdom | | | 0 | | | | 58,977,830 | | | | 0 | | | | 58,977,830 | |
United States | | | 6,353,721 | | | | 0 | | | | 0 | | | | 6,353,721 | |
| | | | |
Participation notes | | | | | | | | | | | | | | | | |
China | | | 0 | | | | 4,139,293 | | | | 0 | | | | 4,139,293 | |
| | | | |
Short-term investments | | | | | | | | | | | | | | | | |
Investment companies | | | 43,482,773 | | | | 1,039,471 | | | | 0 | | | | 44,522,244 | |
| | | 65,280,440 | | | | 361,611,536 | | | | 0 | | | | 426,891,976 | |
Forward foreign currency contracts | | | 0 | | | | 1,235,384 | | | | 0 | | | | 1,235,384 | |
Total assets | | $ | 65,280,440 | | | $ | 362,846,920 | | | $ | 0 | | | $ | 428,127,360 | |
Forward foreign currency contracts are reported at their unrealized gains (losses) at measurement date, which represents the change in the contract’s value from trade date. All other assets and liabilities are reported at their market value at measurement date.
The Fund recognizes transfers between levels within the fair value hierarchy at the end of the reporting period. At October 31, 2015, fair value pricing was used in pricing certain foreign securities and securities valued at $296,023,566 were transferred from Level 1 to Level 2. The Fund did not have any transfers into/out of Level 3.
4. TRANSACTIONS WITH AFFILIATES
Management fee
Funds Management, an indirect wholly owned subsidiary of Wells Fargo & Company (“Wells Fargo”), is the manager of the Fund and provides advisory and fund-level administrative services under an investment management agreement. Under the investment management agreement, Funds Management is responsible for, among other services, implementing the investment objectives and strategies of the Fund, supervising the applicable subadviser, providing fund-level administrative services in connection with the Fund’s operations, and providing any other fund-level administrative services reasonably necessary for the operation of the Fund. As compensation for its services under the investment management agreement, Funds Management is entitled to receive an annual management fee starting at 0.90% and declining to 0.73% as the average daily net assets of the Fund increase.
Prior to July 1, 2015, Funds Management provided advisory services pursuant to an investment advisory agreement and was entitled to receive an annual fee which started at 0.85% and declined to 0.70% as the average daily net assets of the Fund increased. In addition, fund-level administrative services were provided by Funds Management under a separate
| | | | |
| 26 | | Wells Fargo International Equity Fund | | Notes to financial statements |
administration agreement at an annual fee which started at 0.05% and declined to 0.03% as the average daily net assets of the Fund increased. For financial statement purposes, the advisory fee and fund-level administration fee for the year ended October 31, 2015 have been included in management fee on the Statement of Operations.
For the year ended October 31, 2015, the management fee was equivalent to an annual rate of 0.90% of the Fund’s average daily net assets.
Funds Management has retained the services of a subadviser to provide daily portfolio management to the Fund. The fee for subadvisory services is borne by Funds Management. WellsCap, an affiliate of Funds Management and an indirect wholly owned subsidiary of Wells Fargo, is the subadviser to the Fund and is entitled to receive a fee from Funds Management at an annual rate starting at 0.45% and declining to 0.40% as the average daily net assets of the Fund increase.
Administration fees
Under a class-level administration agreement, Funds Management provides class-level administrative services to the Fund, which includes paying fees and expenses for services provided by the transfer agent, sub-transfer agents, omnibus account servicers and record-keepers. As compensation for its services under the class-level administration agreement, Funds Management receives an annual fee which is calculated based on the average daily net assets of each class as follows:
| | | | | | | | |
| | | Class-level administration fee | |
| | | Current rate | | | Rate prior to
July 1, 2015 | |
Class A, Class B, Class C, Class R | | | 0.21 | % | | | 0.26 | % |
Class R6 | | | 0.03 | | | | N/A | |
Administrator Class | | | 0.13 | | | | 0.10 | |
Institutional Class | | | 0.13 | | | | 0.08 | |
Funds Management has contractually waived and/or reimbursed management and administration fees to the extent necessary to maintain certain net operating expense ratios for the Fund. Waiver of fees and/or reimbursement of expenses by Funds Management were made first from fund level expenses on a proportionate basis and then from class specific expenses. Funds Management has committed to waive fees and/or reimburse expenses to the extent necessary to cap expenses as follows:
| | | | | | | | |
| | | Expense
ratio cap | | | Expiration date | |
Class A | | | 1.09 | % | | | February 29, 2016 | |
Class B | | | 1.84 | % | | | February 29, 2016 | |
Class C | | | 1.84 | % | | | February 29, 2016 | |
Class R | | | 1.34 | % | | | February 29, 2016 | |
Class R6 | | | 0.88 | % | | | February 28, 2017 | |
Administrator Class | | | 1.09 | % | | | February 29, 2016 | |
Institutional Class | | | 0.84 | % | | | February 29, 2016 | |
Distribution fees
The Trust has adopted a distribution plan for Class B, Class C, and Class R shares of the Fund pursuant to Rule 12b-1 under the 1940 Act. Distribution fees are charged to Class B, Class C, and Class R shares and paid to Wells Fargo Funds Distributor, LLC (“Funds Distributor”), the principal underwriter, at an annual rate of 0.75% of the average daily net assets of Class B and Class C shares and 0.25% of the average daily net assets of Class R shares.
In addition, Funds Distributor is entitled to receive the front-end sales charge from the purchase of Class A shares and a contingent deferred sales charge on the redemption of certain Class A shares. Funds Distributor is also entitled to receive the contingent deferred sales charges from redemptions of Class B and Class C shares. For the year ended October 31, 2015, Funds Distributor received $43,296 from the sale of Class A shares and $154 in contingent deferred sales charges from redemptions of Class C shares.
| | | | | | |
| Notes to financial statements | | Wells Fargo International Equity Fund | | | 27 | |
Shareholder servicing fees
The Trust has entered into contracts with one or more shareholder servicing agents, whereby Class A, Class B, Class C, Class R, and Administrator Class of the Fund is charged a fee at an annual rate of 0.25% of the average daily net assets of each respective class.
A portion of these total shareholder servicing fees were paid to affiliates of Wells Fargo.
5. INVESTMENT PORTFOLIO TRANSACTIONS
Purchases and sales of investments, excluding U.S. government obligations (if any) and short-term securities, for the year ended October 31, 2015 were $266,864,676 and $62,738,342, respectively.
6. DERIVATIVE TRANSACTIONS
During the year ended October 31, 2015, the Fund entered into forward foreign currency contracts for economic hedging purposes.
At October 31, 2015, the Fund had forward foreign currency contracts outstanding as follows:
Forward foreign currency contracts to sell:
| | | | | | | | | | | | | | | | | | |
| Exchange date | | Counterparty | | Contracts to deliver | | | U.S. value at
October 31, 2015 | | | In exchange
for U.S. $ | | | Unrealized
gains | |
| 11-27-2015 | | Credit Suisse | | | 8,012,500 | EUR | | $ | 8,813,564 | | | $ | 9,227,115 | | | $ | 413,551 | |
| 11-27-2015 | | Credit Suisse | | | 12,110,000 | EUR | | | 13,320,719 | | | | 13,608,370 | | | | 287,651 | |
| 12-28-2015 | | Morgan Stanley | | | 2,756,000 | EUR | | | 3,033,575 | | | | 3,099,265 | | | | 65,690 | |
| 1-13-2016 | | Citibank | | | 1,834,443,000 | JPY | | | 15,223,777 | | | | 15,332,255 | | | | 108,478 | |
| 1-13-2016 | | Credit Suisse | | | 11,879,000 | EUR | | | 13,080,124 | | | | 13,440,138 | | | | 360,014 | |
The Fund had average contract amounts of $1,871,963 and $32,153,715 in forward foreign currency contracts to buy and forward foreign currency contracts to sell, respectively, during the year ended October 31, 2015.
The fair value, realized gains or losses and change in unrealized gains or losses, if any, on derivative instruments are reflected in the appropriate financial statements.
For certain types of derivative transactions, the Fund has entered into International Swaps and Derivatives Association, Inc. master agreements (“ISDA Master Agreements”) or similar agreements with approved counterparties. The ISDA Master Agreements or similar agreements may have requirements to deliver/deposit securities or cash to/with an exchange or broker-dealer as collateral and allows the Fund to offset, with each counterparty, certain derivative financial instrument’s assets and/or liabilities with collateral held or pledged. Collateral requirements differ by type of derivative. Collateral or margin requirements are set by the broker or exchange clearing house for exchange traded derivatives while collateral terms are contract specific for over-the-counter traded derivatives. Cash collateral that has been pledged to cover obligations of the Fund under ISDA Master Agreements or similar agreements, if any, are reported separately in the Statement of Assets and Liabilities. Securities pledged as collateral, if any, are noted in the Portfolio of Investments. With respect to balance sheet offsetting, absent an event of default by the counterparty or a termination of the agreement, the reported amounts of financial assets and financial liabilities in the Statement of Assets and Liabilities are not offset across transactions between the Fund and the applicable counterparty. A reconciliation of the gross amounts on the Statement of Assets and Liabilities to the net amounts by derivative type, including any collateral exposure, is as follows:
| | | | | | | | | | | | | | | | |
| Derivative type | | Counterparty | | Gross amounts
of assets in the
Statement of
Assets and
Liabilities | | Amounts subject to
netting
agreements | | | Collateral
pledged | | | Net amount
of assets | |
Forward foreign currency contracts | | Citibank | | $108,478* | | $ | 0 | | | $ | 0 | | | $ | 108,478 | |
| | Credit Suisse | | 1,061,216* | | | 0 | | | | 0 | | | | 1,061,216 | |
| | Morgan Stanley | | 65,690* | | | 0 | | | | 0 | | | | 65,690 | |
| | * | Amount represents net unrealized gains. | |
| | | | |
| 28 | | Wells Fargo International Equity Fund | | Notes to financial statements |
7. BANK BORROWINGS
The Trust (excluding the money market funds) and Wells Fargo Variable Trust are parties to a $200,000,000 revolving credit agreement whereby the Fund is permitted to use bank borrowings for temporary or emergency purposes, such as to fund shareholder redemption requests. Interest under the credit agreement is charged to the Fund based on a borrowing rate equal to the higher of the Federal Funds rate in effect on that day plus 1.25% or the overnight LIBOR rate in effect on that day plus 1.25%. In addition, an annual commitment fee equal to 0.20% of the unused balance is allocated to each participating fund. Prior to September 1, 2015, the revolving credit agreement amount was $150,000,000 and the annual commitment fee was equal to 0.10% of the unused balance which was allocated to each participating fund. For the year ended October 31, 2015, the Fund paid $520 in commitment fees.
For the year ended October 31, 2015, there were no borrowings by the Fund under the agreement.
8. DISTRIBUTIONS TO SHAREHOLDERS
The tax character of distributions paid was $8,383,118 and $4,848,237 of ordinary income for the years ended October 31, 2015 and October 31, 2014, respectively.
As of October 31, 2015, the components of distributable earnings on a tax basis were as follows:
| | | | |
Undistributed
ordinary income | | Unrealized
gains | | Capital loss
carryforward |
| $6,186,872 | | $21,294,835 | | $(43,946,020) |
9. CONCENTRATION RISK
Concentration risks result from exposure to a limited number of sectors. A fund that invests a substantial portion of its assets in any sector may be more affected by changes in that sector than would be a fund whose investments are not heavily weighted in any sector.
10. INDEMNIFICATION
Under the Trust’s organizational documents, the officers and Trustees have been granted certain indemnification rights against certain liabilities that may arise out of performance of their duties to the Trust. Additionally, in the normal course of business, the Trust may enter into contracts with service providers that contain a variety of indemnification clauses. The Trust’s maximum exposure under these arrangements is dependent on future claims that may be made against the Fund and, therefore, cannot be estimated.
| | | | | | |
| Report of independent registered public accounting firm | | Wells Fargo International Equity Fund | | | 29 | |
BOARD OF TRUSTEES AND SHAREHOLDERS OF WELLS FARGO FUNDS TRUST:
We have audited the accompanying statement of assets and liabilities, including the portfolio of investments, of the Wells Fargo International Equity Fund (the “Fund”), one of the funds constituting the Wells Fargo Funds Trust, as of October 31, 2015, and the related statement of operations for the year then ended, the statements of changes in net assets for each of the years in the two-year period then ended, and the financial highlights for each of the years or periods in the five-year period then ended. These financial statements and financial highlights are the responsibility of the Fund’s management. Our responsibility is to express an opinion on these financial statements and financial highlights based on our audits.
We conducted our audits in accordance with the standards of the Public Company Accounting Oversight Board (United States). Those standards require that we plan and perform the audit to obtain reasonable assurance about whether the financial statements and financial highlights are free of material misstatement. An audit includes examining, on a test basis, evidence supporting the amounts and disclosures in the financial statements. Our procedures included confirmation of securities owned as of October 31, 2015, by correspondence with the custodian and brokers, or by other appropriate auditing procedures. An audit also includes assessing the accounting principles used and significant estimates made by management, as well as evaluating the overall financial statement presentation. We believe that our audits provide a reasonable basis for our opinion.
In our opinion, the financial statements and financial highlights referred to above present fairly, in all material respects, the financial position of the Wells Fargo International Equity Fund as of October 31, 2015, the results of its operations for the year then ended, the changes in its net assets for each of the years in the two-year period then ended, and the financial highlights for each of the years or periods in the five-year period then ended, in conformity with U.S. generally accepted accounting principles.

Boston, Massachusetts
December 22, 2015
| | | | |
| 30 | | Wells Fargo International Equity Fund | | Other information (unaudited) |
TAX INFORMATION
Pursuant to Section 854 of the Internal Revenue Code, $6,971,385 of income dividends paid during the fiscal year ended October 31, 2015 has been designated as qualified dividend income (QDI).
Pursuant to Section 853 of the Internal Revenue Code, the Fund expects to designate amounts as foreign taxes paid for the fiscal year ended October 31 2015. Additional details will be available in the semiannual report.
PROXY VOTING INFORMATION
A description of the policies and procedures that the Fund uses to determine how to vote proxies relating to portfolio securities is available, upon request, by calling 1-800-222-8222, visiting our website at wellsfargofunds.com, or visiting the SEC website at sec.gov. Information regarding how the Fund voted proxies relating to portfolio securities during the most recent 12-month period ended June 30 is available on the Fund’s website at wellsfargofunds.com or by visiting the SEC website at sec.gov.
PORTFOLIO HOLDINGS INFORMATION
The complete portfolio holdings for the Fund are publicly available monthly on the Fund’s website (wellsfargofunds.com), on a one-month delayed basis. In addition, top ten holdings information (excluding derivative positions) for the Fund is publicly available on the Fund’s website on a monthly, seven-day or more delayed basis. The Fund files its complete schedule of portfolio holdings with the SEC for the first and third quarters of each fiscal year on Form N-Q, which is available by visiting the SEC website at sec.gov. In addition, the Fund’s Form N-Q may be reviewed and copied at the SEC’s Public Reference Room in Washington, DC, and at regional offices in New York City, at 233 Broadway, and in Chicago, at 175 West Jackson Boulevard, Suite 900. Information about the Public Reference Room may be obtained by calling 1-800-SEC-0330.
| | | | | | |
| Other information (unaudited) | | Wells Fargo International Equity Fund | | | 31 | |
BOARD OF TRUSTEES AND OFFICERS
Each of the Trustees and Officers1 listed in the table below acts in identical capacities for each fund in the Wells Fargo family of funds, which consists of 144 mutual funds comprising the Wells Fargo Funds Trust, Wells Fargo Variable Trust, Wells Fargo Master Trust and four closed-end funds (collectively the “Fund Complex”). This table should be read in conjunction with the Prospectus and the Statement of Additional Information2. The mailing address of each Trustee and Officer is 525 Market Street, 12th Floor, San Francisco, CA 94105. Each Trustee and Officer serves an indefinite term, however, each Trustee serves such term until reaching the mandatory retirement age established by the Trustees.
Independent Trustees
| | | | | | |
Name and
year of birth | | Position held and
length of service* | | Principal occupations during past five years or longer | | Other
public company or
investment company
directorships during
past 5 years |
William R. Ebsworth
(Born 1957) | | Trustee, since 2015** | | Retired. From 1984 to 2013, equities analyst, portfolio manager, research director at Fidelity Management and Research Company in Boston, Tokyo, and Hong Kong, and retired in 2013 as Chief Investment Officer of Fidelity Strategic Advisers, Inc. where he led a team of investment professionals managing client assets. Prior thereto, Board member of Hong Kong Securities Clearing Co., Hong Kong Options Clearing Corp., the Thailand International Fund, Ltd., Fidelity Investments Life Insurance Company, and Empire Fidelity Investments Life Insurance Company. Mr. Ebsworth is a CFA® charterholder and an Adjunct Lecturer, Finance, at Babson College. | | Asset Allocation Trust |
| Jane A. Freeman (Born 1953) | | Trustee, since 2015** | | Retired. From 2012 to 2014 and 1999 to 2008, Chief Financial Officer of Scientific Learning Corporation. From 2008 to 2012, Ms. Freeman provided consulting services related to strategic business projects. Prior to 1999, Portfolio Manager at Rockefeller & Co. and Scudder, Stevens & Clark. Board member of the Harding Loevner Funds from 1996 to 2014, serving as both Lead Independent Director and chair of the Audit Committee. Board member of the Russell Exchange Traded Funds Trust from 2011 to 2012 and the chair of the Audit Committee. Ms. Freeman is Chair of Taproot Foundation (non-profit organization), a Board Member of Ruth Bancroft Garden (non-profit organization) and an inactive chartered financial analyst. | | Asset Allocation Trust; Harding Loevner Funds; Russell Exchange Traded Funds Trust |
Peter G. Gordon
(Born 1942) | | Trustee, since 1998; Chairman, since 2005 | | Co-Founder, Retired Chairman, President and CEO of Crystal Geyser Water Company. Trustee Emeritus, Colby College. | | Asset Allocation Trust |
Isaiah Harris, Jr.
(Born 1952) | | Trustee, since 2009 | | Retired. Chairman of the Board of CIGNA Corporation since 2009, and Director since 2005. From 2003 to 2011, Director of Deluxe Corporation. Prior thereto, President and CEO of BellSouth Advertising and Publishing Corp. from 2005 to 2007, President and CEO of BellSouth Enterprises from 2004 to 2005 and President of BellSouth Consumer Services from 2000 to 2003. Emeritus member of the Iowa State University Foundation Board of Governors. Emeritus Member of the Advisory Board of Iowa State University School of Business. Advisory Board Member, Palm Harbor Academy (charter school). Mr. Harris is a certified public accountant. | | CIGNA Corporation; Asset Allocation Trust |
Judith M. Johnson
(Born 1949) | | Trustee, since 2008; Audit Committee Chairman, since 2008 | | Retired. Prior thereto, Chief Executive Officer and Chief Investment Officer of Minneapolis Employees Retirement Fund from 1996 to 2008. Ms. Johnson is an attorney, certified public accountant and a certified managerial accountant. | | Asset Allocation Trust |
David F. Larcker
(Born 1950) | | Trustee, since 2009 | | James Irvin Miller Professor of Accounting at the Graduate School of Business, Stanford University, Morgan Stanley Director of the Center for Leadership Development and Research and Senior Faculty of The Rock Center for Corporate Governance since 2006. From 2005 to 2008, Professor of Accounting at the Graduate School of Business, Stanford University. Prior thereto, Ernst & Young Professor of Accounting at The Wharton School, University of Pennsylvania from 1985 to 2005. | | Asset Allocation Trust |
| | | | |
| 32 | | Wells Fargo International Equity Fund | | Other information (unaudited) |
| | | | | | |
Name and
year of birth | | Position held and
length of service* | | Principal occupations during past five years or longer | | Other
public company or
investment company
directorships during
past 5 years |
Olivia S. Mitchell
(Born 1953) | | Trustee, since 2006 | | International Foundation of Employee Benefit Plans Professor, Wharton School of the University of Pennsylvania since 1993. Director of Wharton’s Pension Research Council and Boettner Center on Pensions & Retirement Research, and Research Associate at the National Bureau of Economic Research. Previously, Cornell University Professor from 1978 to 1993. | | Asset Allocation Trust |
Timothy J. Penny
(Born 1951) | | Trustee, since 1996 | | President and Chief Executive Officer of Southern Minnesota Initiative Foundation, a non-profit organization, since 2007 and Senior Fellow at the Humphrey Institute Policy Forum at the University of Minnesota since 1995. Member of the Board of Trustees of NorthStar Education Finance, Inc., a non-profit organization, since 2007. | | Asset Allocation Trust |
Michael S. Scofield
(Born 1943) | | Trustee, since 2010 | | Served on the Investment Company Institute’s Board of Governors and Executive Committee from 2008-2011 as well the Governing Council of the Independent Directors Council from 2006-2011 and the Independent Directors Council Executive Committee from 2008-2011. Chairman of the IDC from 2008-2010. Institutional Investor (Fund Directions) Trustee of Year in 2007. Trustee of the Evergreen Funds complex (and its predecessors) from 1984 to 2010. Chairman of the Evergreen Funds from 2000-2010. Former Trustee of the Mentor Funds. Retired Attorney, Law Offices of Michael S. Scofield. | | Asset Allocation Trust |
Donald C. Willeke
(Born 1940) | | Trustee, since 1996*** | | Principal of the law firm of Willeke & Daniels. General Counsel of the Minneapolis Employees Retirement Fund from 1984 until its consolidation into the Minnesota Public Employees Retirement Association on June 30, 2010. Director and Vice Chair of The Tree Trust (non-profit corporation). Director of the American Chestnut Foundation (non-profit corporation). | | Asset Allocation Trust |
| * | Length of service dates reflect the Trustee’s commencement of service with the Trust’s predecessor entities, where applicable. |
| ** | William R. Ebsworth and Jane A. Freeman each became a Trustee effective January 1, 2015. |
| *** | Donald Willeke will retire as a Trustee effective December 31, 2015. |
Officers
| | | | | | |
Name and
year of birth | | Position held and
length of service | | Principal occupations during past five years or longer | | |
Karla M. Rabusch
(Born 1959) | | President, since 2003 | | Executive Vice President of Wells Fargo Bank, N.A. and President of Wells Fargo Funds Management, LLC since 2003. | | |
Jeremy DePalma1
(Born 1974) | | Treasurer, since 2012 | | Senior Vice President of Wells Fargo Funds Management, LLC since 2009. Senior Vice President of Evergreen Investment Management Company, LLC from 2008 to 2010 and head of the Fund Reporting and Control Team within Fund Administration from 2005 to 2010. | | |
C. David Messman
(Born 1960) | | Secretary, since 2000; Chief Legal Officer, since 2003 | | Senior Vice President and Secretary of Wells Fargo Funds Management, LLC since 2001. Assistant General Counsel of Wells Fargo Bank, N.A. since 2013 and Vice President and Managing Counsel of Wells Fargo Bank N.A. from 1996 to 2013. | | |
Debra Ann Early
(Born 1964) | | Chief Compliance Officer, since 2007 | | Executive Vice President of Wells Fargo Funds Management, LLC since 2014, Senior Vice President and Chief Compliance Officer from 2007 to 2014. | | |
David Berardi
(Born 1975) | | Assistant Treasurer, since 2009 | | Vice President of Wells Fargo Funds Management, LLC since 2009. Vice President of Evergreen Investment Management Company, LLC from 2008 to 2010. Manager of Fund Reporting and Control for Evergreen Investment Management Company, LLC from 2004 to 2010. | | |
| 1 | Jeremy DePalma acts as Treasurer of 72 funds and Assistant Treasurer of 72 funds in the Fund Complex. |
| 2 | The Statement of Additional Information includes additional information about the Trustees and is available, without charge, upon request, by calling
1-800-222-8222 or by visiting the website at wellsfargofunds.com. |
| | | | | | |
| Other information (unaudited) | | Wells Fargo International Equity Fund | | | 33 | |
BOARD CONSIDERATION OF INVESTMENT ADVISORY, INVESTMENT MANAGEMENT AND SUB-ADVISORY AGREEMENTS:
Under the Investment Company Act of 1940 (the “1940 Act”), the Board of Trustees (the “Board”) of Wells Fargo Funds Trust (the “Trust”) must determine annually whether to approve the continuation of the Trust’s investment advisory and sub-advisory agreements. In this regard, at an in-person meeting held on May 19-20, 2015 (the “Meeting”), the Board, all the members of which have no direct or indirect interest in the investment advisory and sub-advisory agreements and are not “interested persons” of the Trust, as defined in the 1940 Act (the “Independent Trustees”), reviewed and approved for Wells Fargo Advantage International Equity Fund (the “Fund”): (i) an investment advisory agreement (the “Advisory Agreement”) with Wells Fargo Funds Management, LLC (“Funds Management”); (ii) an investment management agreement (the “Management Agreement”) with Funds Management; and (iii) an investment sub-advisory agreement (the “Sub-Advisory Agreement”) with Wells Capital Management Incorporated (the “Sub-Adviser”), an affiliate of Funds Management. The Management Agreement combines the terms of the Advisory Agreement with the terms of the Fund’s Amended and Restated Administration Agreement (the “Administration Agreement”) applicable to Fund-level administrative services. The Advisory Agreement, the Management Agreement and the Sub-Advisory Agreement are collectively referred to as the “Advisory Agreements.”
At the Meeting, the Board considered the factors and reached the conclusions described below relating to the selection of Funds Management and the Sub-Adviser and the approval of the Advisory Agreements. Prior to the Meeting, including at an in-person meeting in March 2015, the Trustees conferred extensively among themselves and with representatives of Funds Management about these matters. Also, the Board has adopted a team-based approach, with each team consisting of a sub-set of Trustees, to assist the full Board in the discharge of its duties in reviewing performance and other matters throughout the year. The Independent Trustees were assisted in their evaluation of the Advisory Agreements by independent legal counsel, from whom they received separate legal advice and with whom they met separately.
In providing information to the Board, Funds Management and the Sub-Adviser were guided by a detailed set of requests for information submitted to them by independent legal counsel on behalf of the Independent Trustees at the start of the Board’s annual contract renewal process earlier in 2015. In considering and approving the Advisory Agreements, the Trustees considered the information they believed relevant, including but not limited to the information discussed below. The Board considered not only the specific information presented in connection with the Meeting, but also the knowledge gained over time through interaction with Funds Management and the Sub-Adviser about various topics. In this regard, the Board reviewed reports of Funds Management at each of its quarterly meetings, which included, among other things, portfolio reviews and performance reports. In addition, the Board and the teams mentioned above confer with portfolio managers at various times throughout the year. The Board did not identify any particular information or consideration that was all-important or controlling, and each individual Trustee may have attributed different weights to various factors.
After its deliberations, the Board unanimously approved the continuation of the Advisory Agreement for the period from June 1, 2015 through June 30, 2015, approved the Management Agreement for the period from July 1, 2015 through May 31, 2016, and approved the continuation of the Sub-Advisory Agreement for a one-year term through May 31, 2016. The Board also determined that the compensation payable to Funds Management and the Sub-Adviser under each of the Advisory Agreements was reasonable. The Board considered the approval of the Advisory Agreements for the Fund as part of its consideration of agreements for funds across the complex, but its approvals were made on a fund-by-fund basis. The following summarizes a number of important, but not necessarily all, factors considered by the Board in support of its approvals.
Nature, extent and quality of services
The Board received and considered various information regarding the nature, extent and quality of services provided to the Fund by Funds Management and the Sub-Adviser under the Advisory Agreements. This information included, among other things, a summary of the background and experience of senior management of Funds Management, and the qualifications, background, tenure and responsibilities of each of the portfolio managers primarily responsible for the day-to-day portfolio management of the Fund. The Board noted that the services to be provided to the Fund pursuant to the Management Agreement combined the advisory services previously provided to the Fund pursuant to the Fund’s Advisory Agreement with the Fund-level administrative services previously provided to the Fund pursuant to the Fund’s Administration Agreement. The Board received a representation from Funds Management that combining these services would not result in any change to the nature or level of services provided by Funds Management to the Fund.
The Board evaluated the ability of Funds Management and the Sub-Adviser to attract and retain qualified investment professionals, including research, advisory and supervisory personnel. The Board further considered the compliance programs and compliance records of Funds Management and the Sub-Adviser. In addition, the Board took into account the full range of services provided to the Fund by Funds Management and its affiliates.
| | | | |
| 34 | | Wells Fargo International Equity Fund | | Other information (unaudited) |
Fund performance and expenses
The Board considered the performance results for the Fund over various time periods ended March 31, 2015. The Board considered these results in comparison to the performance of funds in a universe that was determined by Lipper Inc. (“Lipper”) to be similar to the Fund (the “Universe”), and in comparison to the Fund’s benchmark index and to other comparative data. Lipper is an independent provider of investment company data. The Board received a description of the methodology used by Lipper to select the mutual funds in the performance Universe. The Board noted that the performance of the Fund (Class A) was higher than or in range of the average performance of the Universe for all periods under review. The Board also noted that the performance of the Fund was higher than its benchmark, the MSCI ACWI Index ex USA (Net), for all periods under review except the ten-year period.
The Board received information concerning, and discussed factors contributing to, the underperformance of the Fund relative to the benchmark for the period noted above. The Board took note of the explanations for the relative underperformance, including an explanation of the market environment that affected the Fund’s performance, and the performance of the Fund relative to the Universe.
The Board also received and considered information regarding the Fund’s net operating expense ratios and their various components, including actual management fees (which reflect fee waivers, if any, and include advisory, administration and transfer agent fees), custodian and other non-management fees, and Rule 12b-1 and non-Rule 12b-1 service fees. The Board considered these ratios in comparison to the median ratios of funds in class-specific expense groups that were determined by Lipper to be similar to the Fund (the “Groups”). The Board received a description of the methodology used by Lipper to select the mutual funds in the expense Groups and an explanation of how funds comprising expense groups and their expense ratios may vary from year-to-year. Based on the Lipper reports, the Board noted that the net operating expense ratios of the Fund were lower than the median net operating expense ratios of the expense Groups. The Board discussed and accepted Funds Management’s proposal to increase net operating expense ratio caps for Class R, Class A, Class B, Class C, Administrator Class, and Institutional Class. In accepting such proposed new net operating expense ratio caps, the Board noted that the Fund’s new net operating expense ratios would still be lower than the median net operating expense ratios of the expense Groups.
The Board took into account the Fund performance and expense information provided to it among the factors considered in deciding to re-approve the Advisory Agreement and Sub-Advisory Agreement and approve the Management Agreement.
Investment advisory and sub-advisory fee rates
The Board reviewed and considered the contractual investment advisory fee rates that are payable by the Fund to Funds Management for investment advisory services (the “Advisory Agreement Rates”), both on a stand-alone basis and on a combined basis with the Fund’s fund-level and class-level contractual administration fee rates (the “Management Rates”). The Board noted that the Management Rates include transfer agency and sub-transfer agency costs. The Board also noted that the fee rate to be paid by the Fund under the Management Agreement will incorporate the advisory fee and Fund-level administration fee previously payable separately by the Fund under the Fund’s Advisory Agreement and Administration Agreement with Funds Management. The Board also reviewed and considered the contractual investment sub-advisory fee rates that are payable by Funds Management to the Sub-Adviser for investment sub-advisory services (the “Sub-Advisory Agreement Rates”).
Among other information reviewed by the Board was a comparison of the Management Rates of the Fund with those of other funds in the expense Groups at a common asset level. The Board noted that the Management Rates of the Fund were in range of the average rates for the Fund’s expense Groups for all share classes.
The Board also received and considered information about the portion of the total advisory fee that was retained by Funds Management after payment of the fee to the Sub-Adviser for sub-advisory services. In assessing the reasonableness of this amount, the Board received and evaluated information about the nature and extent of responsibilities retained and risks assumed by Funds Management and not delegated to or assumed by the Sub-Adviser, and about Funds Management’s on-going oversight services. However, given the affiliation between Funds Management and the Sub-Adviser, the Board ascribed limited relevance to the allocation of the advisory fee between them.
The Board also received and considered information about the nature and extent of services offered and fee rates charged by Funds Management and the Sub-Adviser to other types of clients with investment strategies similar to those of the Fund. In this regard, the Board received information about the significantly greater scope of services, and compliance, reporting and other legal burdens and risks of managing mutual funds compared with those associated with managing assets of non-mutual fund clients such as collective funds or institutional separate accounts.
| | | | | | |
| Other information (unaudited) | | Wells Fargo International Equity Fund | | | 35 | |
Based on its consideration of the factors and information it deemed relevant, including those described here, the Board determined that the compensation payable to Funds Management under the Management Agreement and Advisory Agreement and to the Sub-Adviser under the Sub-Advisory Agreement was reasonable, in light of the services covered by the Advisory Agreements.
Profitability
The Board received and considered information concerning the profitability of Funds Management, as well as the profitability of Wells Fargo as a whole, from providing services to the Fund and the fund family as a whole. The Board also received and considered information concerning the profitability of the Sub-Adviser from providing services to the fund family as a whole, noting that the Sub-Adviser’s profitability information with respect to providing services to the Fund was subsumed in the Wells Fargo profitability analysis.
Funds Management reported on the methodologies and estimates used in calculating profitability. Among other things, the Board noted that the levels of profitability reported on a fund-by-fund basis varied widely, depending on factors such as the size and type of fund. Based on its review, the Board did not deem the profits reported by Funds Management or Wells Fargo from its services to the Fund to be at a level that would prevent it from approving the continuation of the Advisory Agreements.
Economies of scale
With respect to possible economies of scale, the Board noted the existence of breakpoints in the Fund’s advisory and management fee structures, and the Fund’s administration fee structure, which operate generally to reduce the Fund’s expense ratios as the Fund grows in size. It considered that, for a small fund or a fund that shrinks in size, breakpoints conversely can result in higher fee levels. The Board also considered that fee waiver and expense reimbursement arrangements and competitive fee rates at the outset are means of sharing potential economies of scale with shareholders of the Fund and the fund family as a whole. The Board considered Funds Management’s view that any analyses of potential economies of scale in managing a particular fund are inherently limited in light of the joint and common costs and investments that Funds Management incurs across the fund family as a whole.
The Board concluded that the Fund’s fee and expense arrangements, including contractual breakpoints, constituted a reasonable approach to sharing potential economies of scale with the Fund and its shareholders.
Other benefits to Funds Management and the Sub-Adviser
The Board received and considered information regarding potential “fall-out” or ancillary benefits received by Funds Management and its affiliates, including the Sub-Adviser, as a result of their relationships with the Fund. Ancillary benefits could include, among others, benefits directly attributable to other relationships with the Fund and benefits potentially derived from an increase in Funds Management’s and the Sub-Adviser’s business as a result of their relationships with the Fund. The Board noted that various affiliates of Funds Management may receive distribution-related fees, shareholder servicing payments and sub-transfer agency fees in respect of shares sold or held through them and services provided.
The Board also reviewed information about soft dollar credits earned and utilized by the Sub-Adviser, fees earned by Funds Management and the Sub-Adviser from managing a private investment vehicle for the fund family’s securities lending collateral and commissions earned by an affiliated broker from portfolio transactions.
Based on its consideration of the factors and information it deemed relevant, including those described here, the Board did not find that any ancillary benefits received by Funds Management and its affiliates, including the Sub-Adviser, were unreasonable.
Conclusion
At the Meeting, after considering the above-described factors and based on its deliberations and its evaluation of the information described above, the Board unanimously approved the continuation of the Advisory Agreement for the period from June 1, 2015 through June 30, 2015, approved the Management Agreement for the period from July 1, 2015 through May 31, 2016, and approved the continuation of the Sub-Advisory Agreement for a one-year term through May 31, 2016. The Board also determined that the compensation payable to Funds Management and the Sub-Adviser under each of the Advisory Agreements was reasonable.
| | | | |
| 36 | | Wells Fargo International Equity Fund | | List of abbreviations |
The following is a list of common abbreviations for terms and entities that may have appeared in this report.
| ACA | — ACA Financial Guaranty Corporation |
| ADR | — American depositary receipt |
| ADS | — American depositary shares |
| AGC | — Assured Guaranty Corporation |
| AGM | — Assured Guaranty Municipal |
| Ambac | — Ambac Financial Group Incorporated |
| AMT | — Alternative minimum tax |
| BAN | — Bond anticipation notes |
| BHAC | — Berkshire Hathaway Assurance Corporation |
| CAB | — Capital appreciation bond |
| CCAB | — Convertible capital appreciation bond |
| CDA | — Community Development Authority |
| CDO | — Collateralized debt obligation |
| DRIVER | — Derivative inverse tax-exempt receipts |
| DW&P | — Department of Water & Power |
| DWR | — Department of Water Resources |
| ECFA | — Educational & Cultural Facilities Authority |
| EDA | — Economic Development Authority |
| EDFA | — Economic Development Finance Authority |
| ETF | — Exchange-traded fund |
| FDIC | — Federal Deposit Insurance Corporation |
| FFCB | — Federal Farm Credit Banks |
| FGIC | — Financial Guaranty Insurance Corporation |
| FHA | — Federal Housing Administration |
| FHLB | — Federal Home Loan Bank |
| FHLMC | — Federal Home Loan Mortgage Corporation |
| FICO | — The Financing Corporation |
| FNMA | — Federal National Mortgage Association |
| GDR | — Global depositary receipt |
| GNMA | — Government National Mortgage Association |
| HCFR | — Healthcare facilities revenue |
| HEFA | — Health & Educational Facilities Authority |
| HEFAR | — Higher education facilities authority revenue |
| HFA | — Housing Finance Authority |
| HFFA | — Health Facilities Financing Authority |
| HUD | — Department of Housing and Urban Development |
| IDA | — Industrial Development Authority |
| IDAG | — Industrial Development Agency |
| KRW | — Republic of Korea won |
| LIBOR | — London Interbank Offered Rate |
| LIFER | — Long Inverse Floating Exempt Receipts |
| LLC | — Limited liability company |
| LLLP | — Limited liability limited partnership |
| LLP | — Limited liability partnership |
| MBIA | — Municipal Bond Insurance Association |
| MFHR | — Multifamily housing revenue |
| MSTR | — Municipal securities trust receipts |
| MUD | — Municipal Utility District |
| National | — National Public Finance Guarantee Corporation |
| PCFA | — Pollution Control Financing Authority |
| PCL | — Public Company Limited |
| PCR | — Pollution control revenue |
| PFA | — Public Finance Authority |
| PFFA | — Public Facilities Financing Authority |
| PFOTER | — Puttable floating option tax-exempt receipts |
| plc | — Public limited company |
| PUTTER | — Puttable tax-exempt receipts |
| R&D | — Research & development |
| Radian | — Radian Asset Assurance |
| RAN | — Revenue anticipation notes |
| RDA | — Redevelopment Authority |
| RDFA | — Redevelopment Finance Authority |
| REIT | — Real estate investment trust |
| ROC | — Reset option certificates |
| SAVRS | — Select auction variable rate securities |
| SBA | — Small Business Authority |
| SDR | — Swedish depositary receipt |
| SFHR | — Single-family housing revenue |
| SFMR | — Single-family mortgage revenue |
| SPA | — Standby purchase agreement |
| SPDR | — Standard & Poor’s Depositary Receipts |
| SPEAR | — Short Puttable Exempt Adjustable Receipts |
| STRIPS | — Separate trading of registered interest and |
| TAN | — Tax anticipation notes |
| TIPS | — Treasury inflation-protected securities |
| TRAN | — Tax revenue anticipation notes |
| TTFA | — Transportation Trust Fund Authority |
| TVA | — Tennessee Valley Authority |

For more information
More information about Wells Fargo Funds is available free upon request. To obtain literature, please write, email, visit the Fund’s website, or call:
Wells Fargo Funds
P.O. Box 8266
Boston, MA 02266-8266
Email: wfaf@wellsfargo.com
Website: wellsfargofunds.com
Individual investors: 1-800-222-8222
Retail investment professionals: 1-888-877-9275
Institutional investment professionals: 1-866-765-0778
This report and the financial statements contained herein are submitted for the general information of the shareholders of Wells Fargo Funds. If this report is used for promotional purposes, distribution of the report must be accompanied or preceded by a current prospectus. Before investing, please consider the investment objectives, risks, charges, and expenses of the investment. For a current prospectus and, if available, a summary prospectus, containing this information, call 1-800-222-8222 or visit the Fund’s website at wellsfargofunds.com. Read the prospectus carefully before you invest or send money.
Wells Fargo Funds Management, LLC, a wholly owned subsidiary of Wells Fargo & Company, provides investment advisory and administrative services for Wells Fargo Funds. Other affiliates of Wells Fargo & Company provide subadvisory and other services for the Funds. The Funds are distributed by Wells Fargo Funds Distributor, LLC, Member FINRA, an affiliate of Wells Fargo & Company.
NOT FDIC INSURED ¡ NO BANK GUARANTEE ¡ MAY LOSE VALUE
© 2015 Wells Fargo Funds Management, LLC. All rights reserved.
| | |
 | | 238510 12-15 A240/AR240 10-15 |
Annual Report
October 31, 2015

Wells Fargo Intrinsic World Equity Fund


Reduce clutter. Save trees.
Sign up for electronic delivery of prospectuses and shareholder reports at wellsfargo.com/advantagedelivery
Contents
The views expressed and any forward-looking statements are as of October 31, 2015, unless otherwise noted, and are those of the Fund managers and/or Wells Fargo Funds Management, LLC. Discussions of individual securities, or the markets generally, or any Wells Fargo Fund are not intended as individual recommendations. Future events or results may vary significantly from those expressed in any forward-looking statements. The views expressed are subject to change at any time in response to changing circumstances in the market. Wells Fargo Funds Management, LLC and the Fund disclaim any obligation to publicly update or revise any views expressed or forward-looking statements.
NOT FDIC INSURED ¡ NO BANK GUARANTEE ¡ MAY LOSE VALUE
| | | | |
| 2 | | Wells Fargo Intrinsic World Equity Fund | | Letter to shareholders (unaudited) |

Karla M. Rabusch
President
Wells Fargo Funds
Signs of encouragement in the eurozone were more than offset by slowing economic growth in China.
The decline of oil and natural gas prices that began during the summer of 2014 continued into 2015.
Dear Valued Shareholder:
We are pleased to offer you this annual report for the Wells Fargo Intrinsic World Equity Fund for the 12-month period that ended October 31, 2015. During the period, investors confronted concerns about slowing economic growth in China and a dramatic rise and fall in the country’s equity markets, diverging central bank policies globally, contentious negotiations to refinance Greece’s sovereign debt, low commodity prices, and ongoing currency volatility. These disparate influences tended to obscure improving economic data in the U.S. and several developed European countries.
Low commodity prices and slower global growth overshadowed improved economic data.
In Europe, the eurozone’s largest economies—France, Germany, Italy, and Spain—reported gross domestic product (GDP) growth on an annualized basis for the second quarter of 2015, although results were uneven for smaller, developing economies in the region. While annualized GDP growth slowed in the third quarter in the eurozone overall, it remained positive. Signs of encouragement in the eurozone were more than offset by slowing economic growth in China. China posted third-quarter GDP growth of 6.9%. While that pace might be envied by other developed economies, it is below levels many investors have come to expect from China. Furthermore, the government indicated the full-year growth target of 7% may not be met.
Stocks generally moved higher in April and early May 2015 before events served to discourage equity investors as summer advanced. The decline of oil and natural gas prices that began during the summer of 2014 continued into 2015. At the same time, the value of the U.S. dollar increased relative to other currencies, particularly those in emerging markets. Both conditions concerned investors. Sustained low oil, natural gas, and other commodity prices hampered economies in several emerging markets. Slowed commodity consumption among developed markets also suggested a deceleration of global growth.
Global central bank policies diverge.
After ending its quantitative easing-related bond-buying program toward the end of 2014, the U.S. Federal Reserve (Fed) signaled its intention to increase the federal funds rate. However, concerns about slowing growth, particularly in emerging markets, prompted the Fed to defer an interest-rate increase. Investors globally fell into a holding pattern at times as they tried to anticipate the Fed’s next move. Meanwhile, the Bank of Japan announced in October 2014 significant expansion of its economic stimulus programs to include additional injections of liquidity into the economy through bond purchases. In addition, the Government Pension Investment Fund announced plans to reduce government bond investments and direct those assets to investments in the Japanese stock market. The People’s Bank of China also took initiatives to spur economic growth by cutting interest rates for the sixth time in less than a year in October 2015; lowering bank reserve requirements to encourage lending; and allowing the renminbi to depreciate to support exports and to advance government efforts to transition to a more market-driven economy.
During the summer of 2015, the Hang Seng Index1 in Hong Kong experienced a dramatic decline after a similarly dramatic ascent during late 2014 and early 2015, falling to levels not seen since 2013. Contentious negotiations between Greece and its debtors to refinance the country’s sovereign debt also concerned investors during June 2015. After weeks of stalemated negotiations, the government accepted additional spending reductions in order to secure new loan agreements.
| 1 | The Hang Seng Index is a free-float-adjusted market-capitalization-weighted stock market index in Hong Kong. It is used to record and monitor daily changes of the largest companies of the Hong Kong stock market and is the main indicator of the overall market performance in Hong Kong. You cannot invest directly in an index. |
| | | | | | |
| Letter to shareholders (unaudited) | | Wells Fargo Intrinsic World Equity Fund | | | 3 | |
Developed European and Asian equity markets, as measured by the Morgan Stanley Capital International (MSCI) Europe, Australasia, Far East (EAFE) Index (Net),2 returned -0.07% for the 12-month period that ended October 31, 2015.
The effect of slowing growth in China, a stronger U.S. dollar, and stubbornly low prices for oil, natural gas, and other commodities was particularly difficult for many emerging markets economies that rely on commodities as an economic engine. During the period, emerging markets stocks suffered more significantly than international developed markets, earning a return of -14.53%, as measured by the MSCI Emerging Markets Index (Net).3 U.S. investors in international equity markets also often saw the value of their overseas investments reduced upon translation to dollars.
Don’t let short-term uncertainty derail long-term investment goals.
Periods of investment uncertainty can present challenges, but experience has taught us that maintaining long-term investment goals can be an effective way to plan for the future. To help you create a sound strategy based on your personal goals and risk tolerance, Wells Fargo Funds offers more than 100 mutual funds and other investments spanning a wide range of asset classes and investment styles. Although diversification cannot guarantee an investment profit or prevent losses, we believe it can be an effective way to manage investment risk and potentially smooth out overall portfolio performance. We encourage investors to know their investments and to understand that appropriate levels of risk-taking may unlock opportunities.
Thank you for choosing to invest with Wells Fargo Funds. We appreciate your confidence in us and remain committed to helping you meet your financial needs.
Sincerely,

Karla M. Rabusch
President
Wells Fargo Funds
Notice to shareholders
At a meeting held August 11-12, 2015, the Board of Trustees of the Fund approved a change in the name of the Fund whereby the word “Advantage” was removed from its name, effective December 15, 2015.
For current information about your fund investments, contact your investment professional, visit our website at wellsfargofunds.com, or call us directly at 1-800-222-8222. We are available 24 hours a day, 7 days a week.
| 2 | The Morgan Stanley Capital International (MSCI) Europe, Australasia, Far East (EAFE) Index (Net) is a free-float-adjusted market-capitalization-weighted index that is designed to measure the equity market performance of developed markets, excluding the U.S. and Canada. The MSCI EAFE Index (Net) consists of the following 21 developed markets country indexes: Australia, Austria, Belgium, Denmark, Finland, France, Germany, Hong Kong, Ireland, Israel, Italy, Japan, the Netherlands, New Zealand, Norway, Portugal, Singapore, Spain, Sweden, Switzerland, and the United Kingdom. You cannot invest directly in an index. Source: MSCI. MSCI makes no express or implied warranties or representations and shall have no liability whatsoever with respect to any MSCI data contained herein. The MSCI data may not be further redistributed or used as a basis for other indexes or any securities or financial products. This report is not approved, reviewed, or produced by MSCI. |
| 3 | The MSCI Emerging Markets Index (Net) is a free-float-adjusted market-capitalization-weighted index that is designed to measure the equity market performance of emerging markets. The MSCI Emerging Markets Index (Net) consists of the following 23 emerging markets country indexes: Brazil, Chile, China, Colombia, Czech Republic, Egypt, Greece, Hungary, India, Indonesia, Korea, Malaysia, Mexico, Peru, the Philippines, Poland, Qatar, Russia, South Africa, Taiwan, Thailand, Turkey, and United Arab Emirates. You cannot invest directly in an index. |
| | | | |
| 4 | | Wells Fargo Intrinsic World Equity Fund | | Performance highlights (unaudited) |
Investment objective
The Fund seeks long-term capital appreciation.
Manager
Wells Fargo Funds Management, LLC
Subadviser
Metropolitan West Capital Management, LLC
Portfolio managers
Jean-Baptiste Nadal, CFA
Jeffrey Peck
Average annual total returns (%) as of October 31, 20151
| | | | | | | | | | | | | | | | | | | | | | | | | | | | | | | | | | |
| | | | | Including sales charge | | | Excluding sales charge | | | Expense ratios2 (%) | |
| | | Inception date | | 1 year | | | 5 year | | | 10 year | | | 1 year | | | 5 year | | | 10 year | | | Gross | | | Net3 | |
| Class A (EWEAX) | | 4-30-1996 | | | (1.78 | ) | | | 8.74 | | | | 5.57 | | | | 4.23 | | | | 10.03 | | | | 6.19 | | | | 1.42 | | | | 1.40 | |
| Class C (EWECX) | | 5-18-2007 | | | 2.41 | | | | 9.21 | | | | 5.40 | | | | 3.41 | | | | 9.21 | | | | 5.40 | | | | 2.17 | | | | 2.15 | |
| Administrator Class (EWEIX) | | 5-18-2007 | | | – | | | | – | | | | – | | | | 4.51 | | | | 10.31 | | | | 6.41 | | | | 1.34 | | | | 1.15 | |
| Institutional Class (EWENX) | | 7-30-2010 | | | – | | | | – | | | | – | | | | 4.72 | | | | 10.53 | | | | 6.51 | | | | 1.09 | | | | 0.95 | |
| MSCI World Index (Net)4 | | – | | | – | | | | – | | | | – | | | | 1.77 | | | | 9.15 | | | | 5.79 | | | | – | | | | – | |
Figures quoted represent past performance, which is no guarantee of future results, and do not reflect taxes that a shareholder may pay on fund distributions or the redemption of fund shares. Investment return and principal value of an investment will fluctuate so that an investor’s shares, when redeemed, may be worth more or less than their original cost. Performance shown without sales charges would be lower if sales charges were reflected. Current performance may be lower or higher than the performance data quoted, which assumes the reinvestment of dividends and capital gains. Current month-end performance is available on the Fund’s website, wellsfargofunds.com.
Index returns do not include transaction costs associated with buying and selling securities, any mutual fund fees or expenses, or any taxes. It is not possible to invest directly in an index.
For Class A shares, the maximum front-end sales charge is 5.75%. For Class C shares, the maximum contingent deferred sales charge is 1.00%. Performance including a contingent deferred sales charge assumes the sales charge for the corresponding time period. Administrator Class and Institutional Class shares are sold without a front-end sales charge or contingent deferred sales charge.
Stock values fluctuate in response to the activities of individual companies and general market and economic conditions. Foreign investments are especially volatile and can rise or fall dramatically due to differences in the political and economic conditions of the host country. These risks are generally intensified in emerging markets. The use of derivatives may reduce returns and/or increase volatility. Certain investment strategies tend to increase the total risk of an investment (relative to the broader market). The Fund is exposed to focused portfolio risk, geographic risk, and smaller-company securities risk. Consult the Fund’s prospectus for additional information on these and other risks.
Please see footnotes on page 5.
| | | | | | |
| Performance highlights (unaudited) | | Wells Fargo Intrinsic World Equity Fund | | | 5 | |
|
| Growth of $10,000 investment as of October 31, 20155 |
|
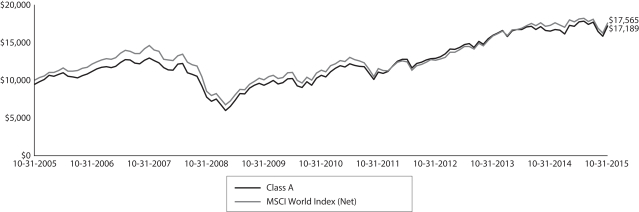
|
| 1 | Historical performance shown for Class C shares prior to their inception reflects the performance of Class A shares, and has been adjusted to reflect the higher expenses applicable to Class C shares. Historical performance shown for Institutional Class shares prior to their inception reflects the performance of Administrator Class shares, and includes the higher expenses applicable to Administrator Class shares. If these expenses had not been included, returns would be higher. Historical performance shown for Administrator Class shares prior to their inception reflects the performance of Class A shares, and includes the higher expenses applicable to Class A shares. If these expenses had not been included, returns would be higher. Historical performance shown for all classes of the Fund prior to July 19, 2010, is based on the performance of the Fund’s predecessor, Evergreen Intrinsic World Equity Fund. |
| 2 | Reflects the expense ratios as stated in the most recent prospectuses. The expense ratios shown are subject to change and may differ from the annualized expense ratios shown in the financial highlights of this report. |
| 3 | The manager has contractually committed through February 29, 2016, to waive fees and/or reimburse expenses to the extent necessary to cap the Fund’s Total Annual Operating Expenses After Fee Waiver at the amounts shown. After this time, the cap may be increased or the commitment to maintain the cap may be terminated only with the approval of the Board of Trustees. Brokerage commissions, stamp duty fees, interest, taxes, acquired fees and expenses, and extraordinary expenses are excluded from the cap. Without this cap, the Fund’s returns would have been lower. |
| 4 | The Morgan Stanley Capital International (MSCI) World Index (Net) is a free-float-adjusted market-capitalization-weighted index that is designed to measure the equity market performance of developed markets. The MSCI World Index (Net) consists of the following 23 developed markets country indexes: Australia, Austria, Belgium, Canada, Denmark, Finland, France, Germany, Hong Kong, Ireland, Israel, Italy, Japan, the Netherlands, New Zealand, Norway, Portugal, Singapore, Spain, Sweden, Switzerland, the United Kingdom, and the United States. You cannot invest directly in an index. Source: MSCI. MSCI makes no express or implied warranties or representations and shall have no liability whatsoever with respect to any MSCI data contained herein. The MSCI data may not be further redistributed or used as a basis for other indexes or any securities or financial products. This report is not approved, reviewed, or produced by MSCI. |
| 5 | The chart compares the performance of Class A shares for the most recent ten years with the MSCI World Index (Net). The chart assumes a hypothetical investment of $10,000 in Class A shares and reflects all operating expenses and assumes the maximum initial sales charge of 5.75%. |
| 6 | The ten largest holdings, excluding cash and cash equivalents, are calculated based on the value of the investments divided by total net assets of the Fund. Holdings are subject to change and may have changed since the date specified. |
| 7 | Amounts are calculated based on the total long-term investments of the Fund. These amounts are subject to change and may have changed since the date specified. |
| * | This security was not held in the Fund at the end of the reporting period. |
| | | | |
| 6 | | Wells Fargo Intrinsic World Equity Fund | | Performance highlights (unaudited) |
MANAGER’S DISCUSSION
Fund highlights
| n | | The Fund outperformed its benchmark, the MSCI World Index (Net), for the 12-month period that ended
October 31, 2015. |
| n | | Stock selection drove the Fund’s outperformance. Relative sector weightings, which are a by-product of our bottom-up security-selection process, had a modest net positive effect. |
| n | | Security selection in the financials, consumer staples, and industrials sectors contributed to performance relative to the index. Stock selection in the telecommunication services sector detracted from relative return. |
The Fund outperformed in a global stock market environment filled with uncertainties.
We adhered to the same intrinsic value investment philosophy and process and consistently applied it to the Fund. Our fundamental analysis involves identifying the stocks of what we believe are high-quality, value-creating businesses that are selling at a discount to our estimate of intrinsic (or true) value and that possess what we believe are identifiable catalysts that could close the valuation gap over our investment time horizon.
Stock selection in the financials, consumer staples, and industrials sectors contributed to relative performance. In financials, wealth management provider UBS AG and financial services and leasing company ORIX Corporation were the principal contributors. In consumer staples and industrials, contributors were Japanese household and personal care company Kao Corporation and high-end plumbing products maker TOTO Limited,* respectively.
By contrast, security selection in the telecommunication services sector detracted from performance relative to the benchmark, with wireless services provider Millicom International Cellular S.A. the main detractor.
By country, stock selection in Japan and the Netherlands, as well as underweights to underperforming commodity-driven Canada and Australia, contributed to relative value for the period. Conversely, security selection in Sweden detracted from relative returns. Over the long term, we seek to add value primarily through stock selection due to our research-intensive, bottom-up investment process.
| | | | |
| Ten largest holdings (%) as of October 31, 20156 | |
Microsoft Corporation | | | 2.41 | |
Motorola Solutions Incorporated | | | 2.40 | |
Unilever NV | | | 2.37 | |
Oracle Corporation | | | 2.34 | |
AIA Group Limited | | | 2.30 | |
EOG Resources Incorporated | | | 2.26 | |
Gilead Sciences Incorporated | | | 2.24 | |
Samsonite International SA | | | 2.23 | |
Sensata Technologies Holding NV | | | 2.22 | |
ORIX Corporation | | | 2.22 | |
Our long-term investment process has typically resulted in low portfolio turnover as the team seeks to invest in businesses over a three- to five-year investment horizon. However, periods of increased market volatility and temporary market dislocations in the past often provided opportunities to upgrade the portfolio, which might result in slightly higher turnover. During the fiscal year, we sold 16 companies in 8 different sectors and also invested in 16 new companies across 8 sectors. There were a number of new additions to the Fund: 1. Sony Corporation in consumer discretionary; 2. The Procter & Gamble Company in consumer staples; 3. Chevron Corporation in energy; 4. BB&T Corporation; CaixaBank, S.A.; and CIT Group Incorporated in financials; 5. Gilead Sciences, Incorporated; Merck & Company, Incorporated;
and Roche Holding Limited AG in health care; 6. AerCap Holdings N.V.; Honeywell International Incorporated; Lockheed Martin Corporation; and Nidec Corporation in industrials; 7. Microsoft Corporation and Motorola Solutions, Incorporated, in information technology; and 8. Verizon Communications Incorporated in telecommunication services. All of these trades were driven by company-specific, fundamental analysis rather than top-down sector allocation decisions.
Please see footnotes on page 5.
| | | | | | |
| Performance highlights (unaudited) | | Wells Fargo Intrinsic World Equity Fund | | | 7 | |
|
| Sector distribution as of October 31, 20157 |
|
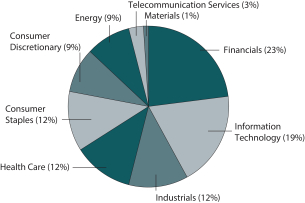 |
|
| Country allocation as of October 31, 20157 |
|
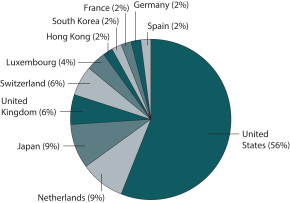 |
We remain confident that our investment process should create shareholder value over time.
There was no shortage of macroeconomic events over the past 12 months. Much of the recent domestic market commentary focused on when the U.S. Federal Reserve (Fed) will begin to raise short-term interest rates. The Fed’s counterparts in China, Europe, and Japan kept their monetary spigots wide open. In China, investors focused on slowing economic growth. In the eurozone, the quantitative easing (QE) program helped keep economic growth stable, yet not spectacular. Japan continued to demonstrate its determination to pursue the country’s inflation targets as Prime Minister Shinzo Abe encouraged public pension funds to reduce their allocation to low-yielding government bonds in favor of an increased allocation to stocks. This helped drive Tokyo stocks to 15-year highs during the period.
Within the U.S., the performance shift away from low-quality companies outpacing their high-quality peers appears to be continuing. We believe the historic return and risk advantages of high-quality company stocks will revert to historical norms. Activist activity within this space continued, reflecting the value opportunity within high-quality companies. High-quality companies possess a greater arsenal to enhance shareholder value in a slower-growth global economy. The risks of rising interest rates, decelerating earnings growth, and increasing equity market volatility will continue. These factors historically benefited high-quality companies, as these companies with strong free cash flow, shareholder-receptive management, and sufficient margins of safety can better navigate riskier environments.
Within Europe, the European Central Bank’s QE policy should continue to boost equity markets, improve sales growth, and enhance earnings, especially for those companies with an export-based business. We anticipate this new trend to play out for the foreseeable future to the potential benefit of our investors.
Our investment team maintains a long-term focus on what we believe are strong company fundamentals, the determination to seek out disconnected stock prices in the marketplace, and an ability to identify catalysts to unlock valuation that we believe will continue to return value to our clients.
Please see footnotes on page 5.
| | | | |
| 8 | | Wells Fargo Intrinsic World Equity Fund | | Fund expenses (unaudited) |
As a shareholder of the Fund, you incur two types of costs: (1) transaction costs, including sales charges (loads) on purchase payments and contingent deferred sales charges (if any) on redemptions and (2) ongoing costs, including management fees, distribution (12b-1) and/or shareholder servicing fees, and other Fund expenses. This example is intended to help you understand your ongoing costs (in dollars) of investing in the Fund and to compare these costs with the ongoing costs of investing in other mutual funds.
The example is based on an investment of $1,000 invested at the beginning of the six-month period and held for the entire period from May 1, 2015 to October 31, 2015.
Actual expenses
The “Actual” line of the table below provides information about actual account values and actual expenses. You may use the information in this line, together with the amount you invested, to estimate the expenses that you paid over the period. Simply divide your account value by $1,000 (for example, an $8,600 account value divided by $1,000 = 8.6), then multiply the result by the number in the “Actual” line under the heading entitled “Expenses paid during period” for your applicable class of shares to estimate the expenses you paid on your account during this period.
Hypothetical example for comparison purposes
The “Hypothetical” line of the table below provides information about hypothetical account values and hypothetical expenses based on the Fund’s actual expense ratio and an assumed rate of return of 5% per year before expenses, which is not the Fund’s actual return. The hypothetical account values and expenses may not be used to estimate the actual ending account balance or expenses you paid for the period. You may use this information to compare the ongoing costs of investing in the Fund and other funds. To do so, compare this 5% hypothetical example with the 5% hypothetical examples that appear in the shareholder reports of the other funds.
Please note that the expenses shown in the table are meant to highlight your ongoing costs only and do not reflect any transactional costs, such as sales charges (loads) and contingent deferred sales charges. Therefore, the “Hypothetical” line of the table is useful in comparing ongoing costs only and will not help you determine the relative total costs of owning different funds. In addition, if these transactional costs were included, your costs would have been higher.
| | | | | | | | | | | | | | | | |
| | | Beginning
account value
5-1-2015 | | | Ending
account value
10-31-2015 | | | Expenses
paid during
the period1 | | | Net annualized
expense ratio | |
Class A | | | | | | | | | | | | | | | | |
Actual | | $ | 1,000.00 | | | $ | 968.18 | | | $ | 6.95 | | | | 1.40 | % |
Hypothetical (5% return before expenses) | | $ | 1,000.00 | | | $ | 1,018.15 | | | $ | 7.12 | | | | 1.40 | % |
Class C | | | | | | | | | | | | | | | | |
Actual | | $ | 1,000.00 | | | $ | 964.05 | | | $ | 10.64 | | | | 2.15 | % |
Hypothetical (5% return before expenses) | | $ | 1,000.00 | | | $ | 1,014.37 | | | $ | 10.92 | | | | 2.15 | % |
Administrator Class | | | | | | | | | | | | | | | | |
Actual | | $ | 1,000.00 | | | $ | 969.33 | | | $ | 5.71 | | | | 1.15 | % |
Hypothetical (5% return before expenses) | | $ | 1,000.00 | | | $ | 1,019.41 | | | $ | 5.85 | | | | 1.15 | % |
Institutional Class | | | | | | | | | | | | | | | | |
Actual | | $ | 1,000.00 | | | $ | 970.25 | | | $ | 4.72 | | | | 0.95 | % |
Hypothetical (5% return before expenses) | | $ | 1,000.00 | | | $ | 1,020.42 | | | $ | 4.84 | | | | 0.95 | % |
| 1 | Expenses paid is equal to the annualized expense ratio of each class multiplied by the average account value over the period, multiplied by the number of days in the most recent fiscal half-year divided by the number of days in the fiscal year (to reflect the one-half-year period). |
| | | | | | |
| Portfolio of investments—October 31, 2015 | | Wells Fargo Intrinsic World Equity Fund | | | 9 | |
| | | | | | | | | | | | |
| Security name | | | | | | Shares | | | Value | |
| | | | |
Common Stocks: 99.35% | | | | | | | | | | | | |
| | | | |
| France: 2.09% | | | | | | | | | | | | |
Societe Generale SA (Financials, Banks) | | | | | | | 76,332 | | | $ | 3,545,102 | |
| | | | | | | | | | | | |
| | | | |
| Germany: 1.80% | | | | | | | | | | | | |
Siemens AG (Industrials, Industrial Conglomerates) | | | | | | | 30,444 | | | | 3,057,921 | |
| | | | | | | | | | | | |
| | | | |
| Hong Kong: 2.31% | | | | | | | | | | | | |
AIA Group Limited (Financials, Insurance) | | | | | | | 667,200 | | | | 3,912,013 | |
| | | | | | | | | | | | |
| | | | |
| Japan: 8.80% | | | | | | | | | | | | |
Honda Motor Company Limited (Consumer Discretionary, Automobiles) | | | | | | | 98,520 | | | | 3,259,085 | |
Kao Corporation (Consumer Staples, Personal Products) | | | | | | | 68,600 | | | | 3,521,877 | |
Nidec Corporation (Industrials, Electrical Equipment) | | | | | | | 26,010 | | | | 1,960,011 | |
ORIX Corporation (Financials, Diversified Financial Services) | | | | | | | 257,500 | | | | 3,760,470 | |
ORIX Corporation ADR (Financials, Diversified Financial Services) | | | | | | | 7,800 | | | | 568,620 | |
Sony Corporation (Consumer Discretionary, Household Durables) | | | | | | | 65,700 | | | | 1,867,549 | |
| | | | |
| | | | | | | | | | | 14,937,612 | |
| | | | | | | | | | | | |
| | | | |
| Luxembourg: 3.54% | | | | | | | | | | | | |
Millicom International Cellular SA (Telecommunication Services, Wireless Telecommunication Services) | | | | | | | 39,850 | | | | 2,221,500 | |
Samsonite International SA (Consumer Discretionary, Textiles, Apparel & Luxury Goods) | | | | | | | 1,280,970 | | | | 3,793,030 | |
| | | | |
| | | | | | | | | | | 6,014,530 | |
| | | | | | | | | | | | |
| | | | |
| Netherlands: 9.39% | | | | | | | | | | | | |
Aercap Holdings NV (Industrials, Trading Companies & Distributors) † | | | | | | | 64,420 | | | | 2,673,430 | |
Airbus Group NV (Industrials, Aerospace & Defense) | | | | | | | 25,610 | | | | 1,783,359 | |
Heineken NV (Consumer Staples, Beverages) | | | | | | | 40,532 | | | | 3,691,770 | |
Sensata Technologies Holding NV (Industrials, Electrical Equipment) † | | | | | | | 78,282 | | | | 3,764,581 | |
Unilever NV (Consumer Staples, Food Products) « | | | | | | | 89,461 | | | | 4,023,956 | |
| | | | |
| | | | | | | | | | | 15,937,096 | |
| | | | | | | | | | | | |
| | | | |
| South Korea: 2.21% | | | | | | | | | | | | |
Samsung Electronics Company Limited (Information Technology, Technology Hardware, Storage & Peripherals) | | | | | | | 3,133 | | | | 3,757,800 | |
| | | | | | | | | | | | |
| | | | |
| Spain: 1.66% | | | | | | | | | | | | |
CaixaBank SA (Financials, Banks) | | | | | | | 736,574 | | | | 2,821,193 | |
| | | | | | | | | | | | |
| | | | |
| Switzerland: 6.00% | | | | | | | | | | | | |
Novartis AG ADR (Health Care, Pharmaceuticals) | | | | | | | 39,211 | | | | 3,545,851 | |
Roche Holding AG (Health Care, Pharmaceuticals) | | | | | | | 12,677 | | | | 3,441,791 | |
UBS Group AG (Financials, Capital Markets) | | | | | | | 160,300 | | | | 3,201,580 | |
| | | | |
| | | | | | | | | | | 10,189,222 | |
| | | | | | | | | | | | |
| | | | |
| United Kingdom: 6.36% | | | | | | | | | | | | |
Barclays plc (Financials, Banks) | | | | | | | 960,560 | | | | 3,422,263 | |
BG Group plc (Energy, Oil, Gas & Consumable Fuels) | | | | | | | 165,246 | | | | 2,610,642 | |
Diageo plc (Consumer Staples, Beverages) | | | | | | | 75,676 | | | | 2,181,734 | |
Royal Dutch Shell plc Class A (Energy, Oil, Gas & Consumable Fuels) | | | | | | | 98,310 | | | | 2,575,271 | |
| | | | |
| | | | | | | | | | | 10,789,910 | |
| | | | | | | | | | | | |
The accompanying notes are an integral part of these financial statements.
| | | | |
| 10 | | Wells Fargo Intrinsic World Equity Fund | | Portfolio of investments—October 31, 2015 |
| | | | | | | | | | | | | | |
| Security name | | | | | | | Shares | | | Value | |
| | | | |
| United States: 55.19% | | | | | | | | | | | | | | |
Abbott Laboratories (Health Care, Health Care Equipment & Supplies) | | | | | | | | | 69,728 | | | $ | 3,123,814 | |
Apple Incorporated (Information Technology, Technology Hardware, Storage & Peripherals) | | | | | | | | | 28,514 | | | | 3,407,423 | |
Autoliv Incorporated SDR (Consumer Discretionary, Auto Components) | | | | | | | | | 28,712 | | | | 3,462,531 | |
BB&T Corporation (Financials, Banks) | | | | | | | | | 84,550 | | | | 3,141,033 | |
Charles Schwab Corporation (Financials, Capital Markets) | | | | | | | | | 101,965 | | | | 3,111,972 | |
Chevron Corporation (Energy, Oil, Gas & Consumable Fuels) | | | | | | | | | 32,611 | | | | 2,963,688 | |
CIT Group Incorporated (Financials, Banks) | | | | | | | | | 75,929 | | | | 3,264,947 | |
EMC Corporation (Information Technology, Technology Hardware, Storage & Peripherals) | | | | | | | | | 142,747 | | | | 3,742,826 | |
EOG Resources Incorporated (Energy, Oil, Gas & Consumable Fuels) | | | | | | | | | 44,599 | | | | 3,828,824 | |
Express Scripts Holding Company (Health Care, Health Care Providers & Services) † | | | | | | | | | 38,866 | | | | 3,357,245 | |
FMC Corporation (Materials, Chemicals) | | | | | | | | | 31,156 | | | | 1,268,361 | |
Gilead Sciences Incorporated (Health Care, Biotechnology) | | | | | | | | | 35,091 | | | | 3,794,390 | |
Goldman Sachs Group Incorporated (Financials, Capital Markets) | | | | | | | | | 19,559 | | | | 3,667,313 | |
Honeywell International Incorporated (Industrials, Aerospace & Defense) | | | | | | | | | 20,867 | | | | 2,155,144 | |
Lockheed Martin Corporation (Industrials, Aerospace & Defense) | | | | | | | | | 9,595 | | | | 2,109,269 | |
Merck & Company Incorporated (Health Care, Pharmaceuticals) | | | | | | | | | 61,130 | | | | 3,341,366 | |
Microsoft Corporation (Information Technology, Software) | | | | | | | | | 77,630 | | | | 4,086,441 | |
Motorola Solutions Incorporated (Information Technology, Communications Equipment) | | | | | | | | | 58,180 | | | | 4,070,855 | |
Oracle Corporation (Information Technology, Software) | | | | | | | | | 102,153 | | | | 3,967,623 | |
PepsiCo Incorporated (Consumer Staples, Beverages) | | | | | | | | | 35,108 | | | | 3,587,687 | |
QUALCOMM Incorporated (Information Technology, Communications Equipment) | | | | | | | | | 28,346 | | | | 1,684,319 | |
Schlumberger Limited (Energy, Energy Equipment & Services) | | | | | | | | | 39,600 | | | | 3,095,136 | |
SunTrust Banks Incorporated (Financials, Banks) | | | | | | | | | 83,114 | | | | 3,450,893 | |
Texas Instruments Incorporated (Information Technology, Semiconductors & Semiconductor Equipment) | | | | | | | | | 65,713 | | | | 3,727,241 | |
The Procter & Gamble Company (Consumer Staples, Household Products) | | | | | | | | | 31,075 | | | | 2,373,509 | |
The Walt Disney Company (Consumer Discretionary, Media) | | | | | | | | | 29,956 | | | | 3,407,195 | |
United Parcel Service Incorporated Class B (Industrials, Air Freight & Logistics) | | | | | | | | | 31,783 | | | | 3,274,285 | |
Verizon Communications Incorporated (Telecommunication Services, Diversified Telecommunication Services) | | | | | | | | | 76,181 | | | | 3,571,365 | |
Visa Incorporated Class A (Information Technology, IT Services) | | | | | | | | | 47,032 | | | | 3,648,743 | |
| | | | |
| | | | | | | | | | | | | 93,685,438 | |
| | | | | | | | | | | | | | |
| | | | |
Total Common Stocks (Cost $138,866,668) | | | | | | | | | | | | | 168,647,837 | |
| | | | | | | | | | | | | | |
| | | Yield | | | | | | | | | |
| | | | |
Short-Term Investments: 2.71% | | | | | | | | | | | | | | |
| | | | |
| Investment Companies: 2.71% | | | | | | | | | | | | | | |
Securities Lending Cash Investments, LLC (l)(r)(u) | | | 0.14 | % | | | | | 3,947,850 | | | | 3,947,850 | |
Wells Fargo Cash Investment Money Market Fund, Select Class (l)(u) | | | 0.16 | | | | | | 641,400 | | | | 641,400 | |
| | | | |
Total Short-Term Investments (Cost $4,589,250) | | | | | | | | | | | | | 4,589,250 | |
| | | | | | | | | | | | | | |
| | | | | | | | |
| Total investments in securities (Cost $143,455,918) * | | | 102.06 | % | | | 173,237,087 | |
Other assets and liabilities, net | | | (2.06 | ) | | | (3,490,675 | ) |
| | | | | | | | |
| Total net assets | | | 100.00 | % | | $ | 169,746,412 | |
| | | | | | | | |
| † | Non-income-earning security |
| « | All or a portion of this security is on loan. |
| (l) | The issuer of the security is an affiliated person of the Fund as defined in the Investment Company Act of 1940. |
| (r) | The investment is a non-registered investment vehicle purchased with cash collateral received from securities on loan. |
| (u) | The rate represents the 7-day annualized yield at period end. |
| * | Cost for federal income tax purposes is $144,157,125 and unrealized gains (losses) consists of: |
| | | | |
Gross unrealized gains | | $ | 38,674,495 | |
Gross unrealized losses | | | (9,594,533 | ) |
| | | | |
Net unrealized gains | | $ | 29,079,962 | |
The accompanying notes are an integral part of these financial statements.
| | | | | | |
| Statement of assets and liabilities—October 31, 2015 | | Wells Fargo Intrinsic World Equity Fund | | | 11 | |
| | | | |
| | | | |
| |
Assets | | | | |
Investments | | | | |
In unaffiliated securities (including $3,818,802 of securities loaned), at value (cost $138,866,668) | | $ | 168,647,837 | |
In affiliated securities, at value (cost $4,589,250) | | | 4,589,250 | |
| | | | |
Total investments, at value (cost $143,455,918) | | | 173,237,087 | |
Foreign currency, at value (cost $739) | | | 718 | |
Receivable for investments sold | | | 452,853 | |
Receivable for Fund shares sold | | | 29,339 | |
Receivable for dividends | | | 272,750 | |
Receivable for securities lending income | | | 534 | |
Prepaid expenses and other assets | | | 30,192 | |
| | | | |
Total assets | | | 174,023,473 | |
| | | | |
| |
Liabilities | | | | |
Payable for Fund shares redeemed | | | 75,801 | |
Payable upon receipt of securities loaned | | | 3,947,850 | |
Management fee payable | | | 110,168 | |
Distribution fee payable | | | 5,779 | |
Administration fees payable | | | 29,851 | |
Accrued expenses and other liabilities | | | 107,612 | |
| | | | |
Total liabilities | | | 4,277,061 | |
| | | | |
Total net assets | | $ | 169,746,412 | |
| | | | |
| |
NET ASSETS CONSIST OF | | | | |
Paid-in capital | | $ | 120,908,438 | |
Undistributed net investment income | | | 1,000,309 | |
Accumulated net realized gains on investments | | | 18,057,414 | |
Net unrealized gains on investments | | | 29,780,251 | |
| | | | |
Total net assets | | $ | 169,746,412 | |
| | | | |
| |
COMPUTATION OF NET ASSET VALUE AND OFFERING PRICE PER SHARE | | | | |
Net assets – Class A | | $ | 149,492,387 | |
Shares outstanding – Class A1 | | | 6,551,911 | |
Net asset value per share – Class A | | | $22.82 | |
Maximum offering price per share – Class A2 | | | $24.21 | |
Net assets – Class C | | $ | 8,957,645 | |
Shares outstanding – Class C1 | | | 407,291 | |
Net asset value per share – Class C | | | $21.99 | |
Net assets – Administrator Class | | $ | 6,238,642 | |
Shares outstanding – Administrator Class1 | | | 274,153 | |
Net asset value per share – Administrator Class | | | $22.76 | |
Net assets – Institutional Class | | $ | 5,057,738 | |
Shares outstanding – Institutional Class1 | | | 221,559 | |
Net asset value per share – Institutional Class | | | $22.83 | |
| 1 | The Fund has an unlimited number of authorized shares. |
| 2 | Maximum offering price is computed as 100/94.25 of net asset value. On investments of $50,000 or more, the offering price is reduced. |
The accompanying notes are an integral part of these financial statements.
| | | | |
| 12 | | Wells Fargo Intrinsic World Equity Fund | | Statement of operations—year ended October 31, 2015 |
| | | | |
| | | | |
| |
Investment income | | | | |
Dividends (net of foreign withholding taxes of $201,562) | | $ | 3,800,547 | |
Securities lending income, net | | | 36,923 | |
Income from affiliated securities | | | 1,435 | |
| | | | |
Total investment income | | | 3,838,905 | |
| | | | |
| |
Expenses | | | | |
Management fee | | | 1,490,431 | |
Administration fees | | | | |
Class A | | | 377,595 | |
Class C | | | 23,528 | |
Administrator Class | | | 6,598 | |
Institutional Class | | | 4,620 | |
Shareholder servicing fees | | | | |
Class A | | | 387,465 | |
Class C | | | 24,093 | |
Administrator Class | | | 14,151 | |
Distribution fee | | | | |
Class C | | | 72,280 | |
Custody and accounting fees | | | 43,522 | |
Professional fees | | | 70,451 | |
Registration fees | | | 57,486 | |
Shareholder report expenses | | | 40,725 | |
Trustees’ fees and expenses | | | 20,638 | |
Other fees and expenses | | | 13,221 | |
| | | | |
Total expenses | | | 2,646,804 | |
Less: Fee waivers and/or expense reimbursements | | | (155,960 | ) |
| | | | |
Net expenses | | | 2,490,844 | |
| | | | |
Net investment income | | | 1,348,061 | |
| | | | |
| |
REALIZED AND UNREALIZED GAINS (LOSSES) ON INVESTMENTS | | | | |
Net realized gains on investments | | | 18,667,164 | |
Net change in unrealized gains (losses) on investments | | | (12,629,315 | ) |
| | | | |
Net realized and unrealized gains (losses) on investments | | | 6,037,849 | |
| | | | |
Net increase in net assets resulting from operations | | $ | 7,385,910 | |
| | | | |
The accompanying notes are an integral part of these financial statements.
| | | | | | |
| Statement of changes in net assets | | Wells Fargo Intrinsic World Equity Fund | | | 13 | |
| | | | | | | | | | | | | | | | |
| | | Year ended
October 31, 2015 | | | Year ended
October 31, 2014 | |
| | | |
Operations | | | | | | | | | | | | |
Net investment income | | | | | | $ | 1,348,061 | | | | | | | $ | 1,272,982 | |
Net realized gains on investments | | | | | | | 18,667,164 | | | | | | | | 14,277,155 | |
Net change in unrealized gains (losses) on investments | | | | | | | (12,629,315 | ) | | | | | | | (9,175,909 | ) |
| | | | |
Net increase in net assets resulting from operations | | | | | | | 7,385,910 | | | | | | | | 6,374,228 | |
| | | | |
| | | | |
Distributions to shareholders from | | | | | | | | | | | | | | | | |
Net investment income | | | | | | | | | | | | | | | | |
Class A | | | | | | | (856,992 | ) | | | | | | | (1,863,591 | ) |
Class C | | | | | | | 0 | | | | | | | | (51,916 | ) |
Administrator Class | | | | | | | (51,944 | ) | | | | | | | (64,491 | ) |
Institutional Class | | | | | | | (48,847 | ) | | | | | | | (34,571 | ) |
Net realized gains | | | | | | | | | | | | | | | | |
Class A | | | | | | | (2,600,451 | ) | | | | | | | 0 | |
Class C | | | | | | | (169,828 | ) | | | | | | | 0 | |
Administrator Class | | | | | | | (108,609 | ) | | | | | | | 0 | |
Institutional Class | | | | | | | (77,473 | ) | | | | | | | 0 | |
| | | | |
Total distributions to shareholders | | | | | | | (3,914,144 | ) | | | | | | | (2,014,569 | ) |
| | | | |
| | | | |
Capital share transactions | | | Shares | | | | | | | | Shares | | | | | |
Proceeds from shares sold | | | | | | | | | | | | | | | | |
Class A | | | 179,787 | | | | 4,097,757 | | | | 233,908 | | | | 5,271,086 | |
Class C | | | 35,552 | | | | 773,618 | | | | 50,986 | | | | 1,125,201 | |
Administrator Class | | | 93,043 | | | | 2,104,873 | | | | 311,050 | | | | 6,906,837 | |
Institutional Class | | | 161,738 | | | | 3,667,260 | | | | 77,064 | | | | 1,740,401 | |
| | | | |
| | | | | | | 10,643,508 | | | | | | | | 15,043,525 | |
| | | | |
Reinvestment of distributions | | | | | | | | | | | | | | | | |
Class A | | | 152,110 | | | | 3,351,854 | | | | 80,375 | | | | 1,805,214 | |
Class C | | | 7,388 | | | | 156,548 | | | | 2,231 | | | | 48,726 | |
Administrator Class | | | 7,067 | | | | 155,486 | | | | 2,592 | | | | 57,936 | |
Institutional Class | | | 3,982 | | | | 87,906 | | | | 1,542 | | | | 34,536 | |
| | | | |
| | | | | | | 3,751,794 | | | | | | | | 1,946,412 | |
| | | | |
Payment for shares redeemed | | | | | | | | | | | | | | | | |
Class A | | | (795,378 | ) | | | (18,121,192 | ) | | | (1,004,696 | ) | | | (22,616,282 | ) |
Class C | | | (88,016 | ) | | | (1,946,944 | ) | | | (70,464 | ) | | | (1,532,097 | ) |
Administrator Class | | | (154,125 | ) | | | (3,437,971 | ) | | | (228,770 | ) | | | (5,076,626 | ) |
Institutional Class | | | (86,058 | ) | | | (1,969,384 | ) | | | (44,254 | ) | | | (998,282 | ) |
| | | | |
| | | | | | | (25,475,491 | ) | | | | | | | (30,223,287 | ) |
| | | | |
Net decrease in net assets resulting from capital share transactions | | | | | | | (11,080,189 | ) | | | | | | | (13,233,350 | ) |
| | | | |
Total decrease in net assets | | | | | | | (7,608,423 | ) | | | | | | | (8,873,691 | ) |
| | | | |
| | | | |
Net assets | | | | | | | | | | | | | | | | |
Beginning of period | | | | | | | 177,354,835 | | | | | | | | 186,228,526 | |
| | | | |
End of period | | | | | | $ | 169,746,412 | | | | | | | $ | 177,354,835 | |
| | | | |
Undistributed net investment income | | | | | | $ | 1,000,309 | | | | | | | $ | 538,166 | |
| | | | |
The accompanying notes are an integral part of these financial statements.
| | | | |
| 14 | | Wells Fargo Intrinsic World Equity Fund | | Financial highlights |
(For a share outstanding throughout each period)
| | | | | | | | | | | | | | | | | | | | |
| | | Year ended October 31 | |
| CLASS A | | 2015 | | | 2014 | | | 2013 | | | 2012 | | | 2011 | |
Net asset value, beginning of period | | | $22.39 | | | | $21.88 | | | | $17.94 | | | | $15.55 | | | | $15.06 | |
Net investment income | | | 0.19 | | | | 0.17 | | | | 0.20 | | | | 0.16 | | | | 0.12 | 1 |
Net realized and unrealized gains (losses) on investments | | | 0.73 | | | | 0.59 | | | | 4.00 | | | | 1.87 | | | | 0.48 | |
| | | | | | | | | | | | | | | | | | | | |
Total from investment operations | | | 0.92 | | | | 0.76 | | | | 4.20 | | | | 2.03 | | | | 0.60 | |
Distributions to shareholders from | | | | | | | | | | | | | | | | | | | | |
Net investment income | | | (0.12 | ) | | | (0.25 | ) | | | (0.26 | ) | | | (0.11 | ) | | | (0.11 | ) |
Net realized gains | | | (0.37 | ) | | | 0.00 | | | | 0.00 | | | | 0.00 | | | | 0.00 | |
| | | | | | | | | | | | | | | | | | | | |
Total distributions to shareholders | | | (0.49 | ) | | | (0.25 | ) | | | (0.26 | ) | | | (0.11 | ) | | | (0.11 | ) |
Regulatory settlement proceeds | | | 0.00 | | | | 0.00 | | | | 0.00 | | | | 0.47 | | | | 0.00 | |
Net asset value, end of period | | | $22.82 | | | | $22.39 | | | | $21.88 | | | | $17.94 | | | | $15.55 | |
Total return2 | | | 4.23 | % | | | 3.45 | % | | | 23.74 | % | | | 16.25 | %3 | | | 4.00 | % |
Ratios to average net assets (annualized) | | | | | | | | | | | | | | | | | | | | |
Gross expenses | | | 1.48 | % | | | 1.47 | % | | | 1.49 | % | | | 1.51 | % | | | 1.50 | % |
Net expenses | | | 1.40 | % | | | 1.40 | % | | | 1.40 | % | | | 1.40 | % | | | 1.40 | % |
Net investment income | | | 0.79 | % | | | 0.70 | % | | | 0.95 | % | | | 0.91 | % | | | 0.79 | % |
Supplemental data | | | | | | | | | | | | | | | | | | | | |
Portfolio turnover rate | | | 32 | % | | | 23 | % | | | 22 | % | | | 27 | % | | | 12 | % |
Net assets, end of period (000s omitted) | | | $149,492 | | | | $157,061 | | | | $168,621 | | | | $146,930 | | | | $139,100 | |
| 1 | Calculated based upon average shares outstanding |
| 2 | Total return calculations do not include any sales charges. |
| 3 | During the year ended October 31, 2012, the Fund received a regulatory settlement from an unaffiliated third party which had an impact of 2.92% on the total return. |
The accompanying notes are an integral part of these financial statements.
| | | | | | |
| Financial highlights | | Wells Fargo Intrinsic World Equity Fund | | | 15 | |
(For a share outstanding throughout each period)
| | | | | | | | | | | | | | | | | | | | |
| | | Year ended October 31 | |
| CLASS C | | 2015 | | | 2014 | | | 2013 | | | 2012 | | | 2011 | |
Net asset value, beginning of period | | | $21.64 | | | | $21.19 | | | | $17.37 | | | | $15.15 | | | | $14.68 | |
Net investment income (loss) | | | 0.01 | 1 | | | (0.02 | ) | | | 0.05 | | | | 0.02 | | | | (0.01 | )1 |
Net realized and unrealized gains (losses) on investments | | | 0.71 | | | | 0.58 | | | | 3.89 | | | | 1.82 | | | | 0.49 | |
| | | | | | | | | | | | | | | | | | | | |
Total from investment operations | | | 0.72 | | | | 0.56 | | | | 3.94 | | | | 1.84 | | | | 0.48 | |
Distributions to shareholders from | | | | | | | | | | | | | | | | | | | | |
Net investment income | | | 0.00 | | | | (0.11 | ) | | | (0.12 | ) | | | (0.09 | ) | | | (0.01 | ) |
Net realized gains | | | (0.37 | ) | | | 0.00 | | | | 0.00 | | | | 0.00 | | | | 0.00 | |
| | | | | | | | | | | | | | | | | | | | |
Total distributions to shareholders | | | (0.37 | ) | | | (0.11 | ) | | | (0.12 | ) | | | (0.09 | ) | | | (0.01 | ) |
Regulatory settlement proceeds | | | 0.00 | | | | 0.00 | | | | 0.00 | | | | 0.47 | | | | 0.00 | |
Net asset value, end of period | | | $21.99 | | | | $21.64 | | | | $21.19 | | | | $17.37 | | | | $15.15 | |
Total return2 | | | 3.41 | % | | | 2.65 | % | | | 22.82 | % | | | 15.39 | %3 | | | 3.27 | % |
Ratios to average net assets (annualized) | | | | | | | | | | | | | | | | | | | | |
Gross expenses | | | 2.23 | % | | | 2.22 | % | | | 2.24 | % | | | 2.26 | % | | | 2.20 | % |
Net expenses | | | 2.15 | % | | | 2.15 | % | | | 2.15 | % | | | 2.15 | % | | | 2.15 | % |
Net investment income (loss) | | | 0.05 | % | | | (0.06 | )% | | | 0.20 | % | | | 0.16 | % | | | (0.05 | )% |
Supplemental data | | | | | | | | | | | | | | | | | | | | |
Portfolio turnover rate | | | 32 | % | | | 23 | % | | | 22 | % | | | 27 | % | | | 12 | % |
Net assets, end of period (000s omitted) | | | $8,958 | | | | $9,788 | | | | $9,949 | | | | $7,341 | | | | $6,817 | |
| 1 | Calculated based upon average shares outstanding |
| 2 | Total return calculations do not include any sales charges. |
| 3 | During the year ended October 31, 2012, the Fund received a regulatory settlement from an unaffiliated third party which had an impact of 2.92% on the total return. |
The accompanying notes are an integral part of these financial statements.
| | | | |
| 16 | | Wells Fargo Intrinsic World Equity Fund | | Financial highlights |
(For a share outstanding throughout each period)
| | | | | | | | | | | | | | | | | | | | |
| | | Year ended October 31 | |
| ADMINISTRATOR CLASS | | 2015 | | | 2014 | | | 2013 | | | 2012 | | | 2011 | |
Net asset value, beginning of period | | | $22.33 | | | | $21.81 | | | | $17.89 | | | | $15.52 | | | | $15.02 | |
Net investment income | | | 0.23 | 1 | | | 0.22 | 1 | | | 0.24 | 1 | | | 0.19 | 1 | | | 0.15 | 1 |
Net realized and unrealized gains (losses) on investments | | | 0.75 | | | | 0.59 | | | | 3.99 | | | | 1.87 | | | | 0.49 | |
| | | | | | | | | | | | | | | | | | | | |
Total from investment operations | | | 0.98 | | | | 0.81 | | | | 4.23 | | | | 2.06 | | | | 0.64 | |
Distributions to shareholders from | | | | | | | | | | | | | | | | |
Net investment income | | | (0.18 | ) | | | (0.29 | ) | | | (0.31 | ) | | | (0.16 | ) | | | (0.14 | ) |
Net realized gains | | | (0.37 | ) | | | 0.00 | | | | 0.00 | | | | 0.00 | | | | 0.00 | |
| | | | | | | | | | | | | | | | | | | | |
Total distributions to shareholders | | | (0.55 | ) | | | (0.29 | ) | | | (0.31 | ) | | | (0.16 | ) | | | (0.14 | ) |
Regulatory settlement proceeds | | | 0.00 | | | | 0.00 | | | | 0.00 | | | | 0.47 | | | | 0.00 | |
Net asset value, end of period | | | $22.76 | | | | $22.33 | | | | $21.81 | | | | $17.89 | | | | $15.52 | |
Total return | | | 4.51 | % | | | 3.70 | % | | | 24.03 | % | | | 16.52 | %2 | | | 4.27 | % |
Ratios to average net assets (annualized) | | | | | | | | | | | | | | | | |
Gross expenses | | | 1.34 | % | | | 1.29 | % | | | 1.31 | % | | | 1.34 | % | | | 1.30 | % |
Net expenses | | | 1.15 | % | | | 1.15 | % | | | 1.15 | % | | | 1.15 | % | | | 1.15 | % |
Net investment income | | | 1.01 | % | | | 0.96 | % | | | 1.18 | % | | | 1.14 | % | | | 0.99 | % |
Supplemental data | | | | | | | | | | | | | | | | |
Portfolio turnover rate | | | 32 | % | | | 23 | % | | | 22 | % | | | 27 | % | | | 12 | % |
Net assets, end of period (000s omitted) | | | $6,239 | | | | $7,327 | | | | $5,306 | | | | $2,001 | | | | $1,986 | |
| 1 | Calculated based upon average shares outstanding |
| 2 | During the year ended October 31, 2012, the Fund received a regulatory settlement from an unaffiliated third party which had an impact of 2.93% on the total return. |
The accompanying notes are an integral part of these financial statements.
| | | | | | |
| Financial highlights | | Wells Fargo Intrinsic World Equity Fund | | | 17 | |
(For a share outstanding throughout each period)
| | | | | | | | | | | | | | | | | | | | |
| | | Year ended October 31 | |
| INSTITUTIONAL CLASS | | 2015 | | | 2014 | | | 2013 | | | 2012 | | | 2011 | |
Net asset value, beginning of period | | | $22.40 | | | | $21.87 | | | | $17.93 | | | | $15.54 | | | | $15.02 | |
Net investment income | | | 0.28 | | | | 0.25 | 1 | | | 0.26 | 1 | | | 0.17 | 1 | | | 0.16 | |
Net realized and unrealized gains (losses) on investments | | | 0.75 | | | | 0.60 | | | | 4.02 | | | | 1.92 | | | | 0.51 | |
| | | | | | | | | | | | | | | | | | | | |
Total from investment operations | | | 1.03 | | | | 0.85 | | | | 4.28 | | | | 2.09 | | | | 0.67 | |
Distributions to shareholders from | | | | | | | | | | | | | | | | | | | | |
Net investment income | | | (0.23 | ) | | | (0.32 | ) | | | (0.34 | ) | | | (0.17 | ) | | | (0.15 | ) |
Net realized gains | | | (0.37 | ) | | | 0.00 | | | | 0.00 | | | | 0.00 | | | | 0.00 | |
| | | | | | | | | | | | | | | | | | | | |
Total distributions to shareholders | | | (0.60 | ) | | | (0.32 | ) | | | (0.34 | ) | | | (0.17 | ) | | | (0.15 | ) |
Regulatory settlement proceeds | | | 0.00 | | | | 0.00 | | | | 0.00 | | | | 0.47 | | | | 0.00 | |
Net asset value, end of period | | | $22.83 | | | | $22.40 | | | | $21.87 | | | | $17.93 | | | | $15.54 | |
Total return | | | 4.72 | % | | | 3.90 | % | | | 24.28 | % | | | 16.74 | %3 | | | 4.50 | % |
Ratios to average net assets (annualized) | | | | | | | | | | | | | | | | | | | | |
Gross expenses | | | 1.09 | % | | | 1.04 | % | | | 1.06 | % | | | 1.10 | % | | | 1.00 | % |
Net expenses | | | 0.95 | % | | | 0.95 | % | | | 0.95 | % | | | 0.95 | % | | | 0.95 | % |
Net investment income | | | 1.23 | % | | | 1.11 | % | | | 1.32 | % | | | 1.03 | % | | | 1.12 | % |
Supplemental data | | | | | | | | | | | | | | | | | | | | |
Portfolio turnover rate | | | 32 | % | | | 23 | % | | | 22 | % | | | 27 | % | | | 12 | % |
Net assets, end of period (000s omitted) | | | $5,058 | | | | $3,179 | | | | $2,352 | | | | $561 | | | | $573 | |
| 1 | Calculated based upon average shares outstanding |
| 2 | During the year ended October 31, 2012, the Fund received a regulatory settlement from an unaffiliated third party which had an impact of 2.93% on the total return. |
The accompanying notes are an integral part of these financial statements.
| | | | |
| 18 | | Wells Fargo Intrinsic World Equity Fund | | Notes to financial statements |
1. ORGANIZATION
Wells Fargo Funds Trust (the “Trust”), a Delaware statutory trust organized on March 10, 1999, is an open-end management investment company registered under the Investment Company Act of 1940, as amended (the “1940 Act”). As an investment company, the Trust follows the accounting and reporting guidance in Financial Accounting Standards Board (“FASB”) Accounting Standards Codification Topic 946, Financial Services – Investment Companies. These financial statements report on the Wells Fargo Intrinsic World Equity Fund (the “Fund”) which is a diversified series of the Trust.
2. SIGNIFICANT ACCOUNTING POLICIES
The following significant accounting policies, which are consistently followed in the preparation of the financial statements of the Fund, are in conformity with U.S. generally accepted accounting principles which require management to make estimates and assumptions that affect the reported amounts of assets and liabilities, disclosure of contingent assets and liabilities at the date of the financial statements, and the reported amounts of revenues and expenses during the reporting period. Actual results could differ from those estimates.
Securities valuation
All investments are valued each business day as of the close of regular trading on the New York Stock Exchange (generally 4 p.m. Eastern Time).
Equity securities that are listed on a foreign or domestic exchange or market are valued at the official closing price or, if none, the last sales price. If no sale occurs on the primary exchange or market that day, the prior day’s price will be deemed “stale” and a fair value price will be determined in accordance with the Fund’s Valuation Procedures.
Equity securities that are not listed on a foreign or domestic exchange or market, but have a public trading market, are valued at the quoted bid price from an independent broker-dealer that the Management Valuation Team of Wells Fargo Funds Management, LLC (“Funds Management”) has determined is an acceptable source.
The values of securities denominated in foreign currencies are translated into U.S. dollars at rates provided by an independent foreign currency pricing source at a time each business day specified by the Management Valuation Team.
Many securities markets and exchanges outside the U.S. close prior to the close of the New York Stock Exchange and therefore may not fully reflect trading or events that occur after the close of the principal exchange in which the foreign securities are traded, but before the close of the New York Stock Exchange. If such trading or events are expected to materially affect the value of such securities, then fair value pricing procedures approved by the Board of Trustees of the Fund are applied. These procedures take into account multiple factors including movements in U.S. securities markets after foreign exchanges close. Foreign securities that are fair valued under these procedures are categorized as Level 2 and the application of these procedures may result in transfers between Level 1 and Level 2. Depending on market activity, such fair valuations may be frequent. Such fair value pricing may result in net asset values that are higher or lower than net asset values based on the last reported sales price or latest quoted bid price. On October 31, 2015, such fair value pricing was used in pricing foreign securities.
Investments in registered open-end investment companies are valued at net asset value. Interests in non-registered investment vehicles that are redeemable at net asset value are fair valued at net asset value when available.
Investments which are not valued using any of the methods discussed above are valued at their fair value, as determined in good faith by the Board of Trustees. The Board of Trustees has established a Valuation Committee comprised of the Trustees and has delegated to it the authority to take any actions regarding the valuation of portfolio securities that the Valuation Committee deems necessary or appropriate, including determining the fair value of portfolio securities, unless the determination has been delegated to the Management Valuation Team. The Board of Trustees retains the authority to make or ratify any valuation decisions or approve any changes to the Valuation Procedures as it deems appropriate. On a quarterly basis, the Board of Trustees receives reports on any valuation actions taken by the Valuation Committee or the Management Valuation Team which may include items for ratification.
Valuations of fair valued securities are compared to the next actual sales price when available, or other appropriate market values, to assess the continued appropriateness of the fair valuation methodologies used. These securities are fair valued on a day-to-day basis, taking into consideration changes to appropriate market information and any significant changes to the inputs considered in the valuation process until there is a readily available price provided on an exchange or by an independent pricing service. Valuations received from an independent pricing service or independent broker-dealer quotes are periodically validated by comparisons to most recent trades and valuations provided by other independent pricing services in addition to the review of prices by the manager and/or subadviser. Unobservable inputs
| | | | | | |
| Notes to financial statements | | Wells Fargo Intrinsic World Equity Fund | | | 19 | |
used in determining fair valuations are identified based on the type of security, taking into consideration factors utilized by market participants in valuing the investment, knowledge about the issuer and the current market environment.
Foreign currency translation
The accounting records of the Fund are maintained in U.S. dollars. The values of other assets and liabilities denominated in foreign currencies are translated into U.S. dollars at rates provided by an independent foreign currency pricing source at a time each business day specified by the Management Valuation Team. Purchases and sales of securities, and income and expenses are converted at the rate of exchange on the respective dates of such transactions. Net realized foreign exchange gains or losses arise from sales of foreign currencies, currency gains or losses realized between the trade and settlement dates on securities transactions, and the difference between the amounts of dividends, interest and foreign withholding taxes recorded and the U.S. dollar equivalent of the amounts actually paid or received. Net unrealized foreign exchange gains and losses arise from changes in the fair value of assets and liabilities other than investments in securities resulting from changes in exchange rates. The changes in net assets arising from changes in exchange rates and the changes in net assets resulting from changes in market prices of securities are not separately presented. Such changes are included in net realized and unrealized gains or losses from investments.
Security loans
The Fund may lend its securities from time to time in order to earn additional income in the form of fees or interest on securities received as collateral or the investment of any cash received as collateral. The Fund continues to receive interest or dividends on the securities loaned. The Fund receives collateral in the form of cash or securities with a value at least equal to the value of the securities on loan. The value of the loaned securities is determined at the close of each business day and any additional required collateral is delivered to the Fund on the next business day. In a securities lending transaction, the net asset value of the Fund will be affected by an increase or decrease in the value of the securities loaned and by an increase or decrease in the value of the instrument in which collateral is invested. The amount of securities lending activity undertaken by the Fund fluctuates from time to time. In the event of default or bankruptcy by the borrower, the Fund may be prevented from recovering the loaned securities or gaining access to the collateral or may experience delays or costs in doing so. In addition, the investment of any cash collateral received may lose all or part of its value. The Fund has the right under the lending agreement to recover the securities from the borrower on demand.
The Fund lends its securities through an unaffiliated securities lending agent. Cash collateral received in connection with its securities lending transactions is invested in Securities Lending Cash Investments, LLC (the “Securities Lending Fund”). The Securities Lending Fund is exempt from registration under Section 3(c)(7) of the 1940 Act and is managed by Funds Management and is subadvised by Wells Capital Management Incorporated (“WellsCap”). Funds Management receives an advisory fee starting at 0.05% and declining to 0.01% as the average daily net assets of the Securities Lending Fund increase. All of the fees received by Funds Management are paid to WellsCap for its services as subadviser. The Securities Lending Fund seeks to provide a positive return compared to the daily Fed Funds Open rate by investing in high-quality, U.S. dollar-denominated short-term money market instruments. Securities Lending Fund investments are fair valued based upon the amortized cost valuation technique. Income earned from investment in the Securities Lending Fund is included in securities lending income on the Statement of Operations.
Security transactions and income recognition
Securities transactions are recorded on a trade date basis. Realized gains or losses are recorded on the basis of identified cost.
Dividend income is recognized on the ex-dividend date, except for certain dividends from foreign securities, which are recorded as soon as the custodian verifies the ex-dividend date. Dividend income from foreign securities is recorded net of foreign taxes withheld where recovery of such taxes is not assured.
Distributions to shareholders
Distributions to shareholders from net investment income and net realized gains, if any, are recorded on the ex-dividend date. Such distributions are determined in conformity with federal income tax regulations, which may differ in amount or character from net investment income and realized gains recognized for purposes of U.S. generally accepted accounting principles.
Federal and other taxes
The Fund intends to continue to qualify as a regulated investment company by distributing substantially all of its investment company taxable income and any net realized capital gains (after reduction for capital loss carryforwards) sufficient to relieve it from all, or substantially all, federal income taxes. Accordingly, no provision for federal income taxes was required.
| | | | |
| 20 | | Wells Fargo Intrinsic World Equity Fund | | Notes to financial statements |
The Fund’s income and federal excise tax returns and all financial records supporting those returns for the prior three fiscal years are subject to examination by the federal and Delaware revenue authorities. Management has analyzed the Fund’s tax positions taken on federal, state, and foreign tax returns for all open tax years and does not believe that there are any uncertain tax positions that require recognition of a tax liability.
Reclassifications are made to the Fund’s capital accounts for permanent tax differences to reflect income and gains available for distribution (or available capital loss carryforwards) under federal income tax regulations. U.S. generally accepted accounting principles require that certain components of net assets be adjusted to reflect permanent differences between financial and tax reporting. These reclassifications have no effect on net assets or net asset values per share. The primary permanent difference causing such reclassifications is due to passive foreign investment companies. At October 31, 2015, as a result of permanent book-to-tax differences, the following reclassification adjustments were made on the Statement of Assets and Liabilities:
| | |
Undistributed net investment income | | Accumulated net realized gains on investments |
| $71,865 | | $(71,865) |
Class allocations
The separate classes of shares offered by the Fund differ principally in applicable sales charges, distribution, shareholder servicing, and administration fees. Class specific expenses are charged directly to that share class. Investment income, common expenses, and realized and unrealized gains (losses) on investments are allocated daily to each class of shares based on the relative proportion of net assets of each class.
3. FAIR VALUATION MEASUREMENTS
Fair value measurements of investments are determined within a framework that has established a fair value hierarchy based upon the various data inputs utilized in determining the value of the Fund’s investments. The three-level hierarchy gives the highest priority to unadjusted quoted prices in active markets for identical assets or liabilities (Level 1) and the lowest priority to significant unobservable inputs (Level 3). The Fund’s investments are classified within the fair value hierarchy based on the lowest level of input that is significant to the fair value measurement. The inputs are summarized into three broad levels as follows:
| n | | Level 1 – quoted prices in active markets for identical securities |
| n | | Level 2 – other significant observable inputs (including quoted prices for similar securities, interest rates, prepayment speeds, credit risk, use of amortized cost, etc.) |
| n | | Level 3 – significant unobservable inputs (including the Fund’s own assumptions in determining the fair value of investments) |
The inputs or methodologies used for valuing investments in securities are not necessarily an indication of the risk associated with investing in those securities.
| | | | | | |
| Notes to financial statements | | Wells Fargo Intrinsic World Equity Fund | | | 21 | |
The following is a summary of the inputs used in valuing the Fund’s assets and liabilities as of October 31, 2015:
| | | | | | | | | | | | | | | | |
| | | Quoted prices
(Level 1) | | | Other significant
observable inputs
(Level 2) | | | Significant
unobservable inputs
(Level 3) | | | Total | |
Assets | | | | | | | | | | | | | | | | |
Investments in : | | | | | | | | | | | | | | | | |
| | | | |
Common stocks | | | | | | | | | | | | | | | | |
France | | $ | 0 | | | $ | 3,545,102 | | | $ | 0 | | | $ | 3,545,102 | |
Germany | | | 0 | | | | 3,057,921 | | | | 0 | | | | 3,057,921 | |
Hong Kong | | | 0 | | | | 3,912,013 | | | | 0 | | | | 3,912,013 | |
Japan | | | 568,620 | | | | 14,368,992 | | | | 0 | | | | 14,937,612 | |
Luxembourg | | | 3,793,030 | | | | 2,221,500 | | | | 0 | | | | 6,014,530 | |
Netherlands | | | 10,461,967 | | | | 5,475,129 | | | | 0 | | | | 15,937,096 | |
South Korea | | | 0 | | | | 3,757,800 | | | | 0 | | | | 3,757,800 | |
Spain | | | 0 | | | | 2,821,193 | | | | 0 | | | | 2,821,193 | |
Switzerland | | | 3,545,851 | | | | 6,643,371 | | | | 0 | | | | 10,189,222 | |
United Kingdom | | | 0 | | | | 10,789,910 | | | | 0 | | | | 10,789,910 | |
United States | | | 90,222,907 | | | | 3,462,531 | | | | 0 | | | | 93,685,438 | |
| | | | |
Short-term investments | | | | | | | | | | | | | | | | |
Investment companies | | | 641,400 | | | | 3,947,850 | | | | 0 | | | | 4,589,250 | |
Total assets | | $ | 109,233,775 | | | $ | 64,003,312 | | | $ | 0 | | | $ | 173,237,087 | |
The Fund recognizes transfers between levels within the fair value hierarchy at the end of the reporting period. At October 31, 2015, fair value pricing was used in pricing certain foreign securities and securities valued at $46,763,338 were transferred from Level 1 to Level 2. The Fund did not have any transfers into/out of Level 3.
4. TRANSACTIONS WITH AFFILIATES
Management fee
Funds Management, an indirect wholly owned subsidiary of Wells Fargo & Company (“Wells Fargo”), is the manager of the Fund and provides advisory and fund-level administrative services under an investment management agreement. Under the investment management agreement, Funds Management is responsible for, among other services, implementing the investment objectives and strategies of the Fund, supervising the applicable subadviser, providing fund-level administrative services in connection with the Fund’s operations, and providing any other fund-level administrative services reasonably necessary for the operation of the Fund. As compensation for its services under the investment management agreement, Funds Management is entitled to receive an annual management fee starting at 0.85% and declining to 0.68% as the average daily net assets of the Fund increase.
Prior to July 1, 2015, Funds Management provided advisory services pursuant to an investment advisory agreement and was entitled to receive an annual fee which started at 0.80% and declined to 0.65% as the average daily net assets of the Fund increased. In addition, fund-level administrative services were provided by Funds Management under a separate administration agreement at an annual fee which started at 0.05% and declined to 0.03% as the average daily net assets of the Fund increased. For financial statement purposes, the advisory fee and fund-level administration fee for the year ended October 31, 2015 have been included in management fee on the Statement of Operations.
For the year ended October 31, 2015, the management fee was equivalent to an annual rate of 0.85% of the Fund’s average daily net assets.
Funds Management has retained the services of a subadviser to provide daily portfolio management to the Fund. The fee for subadvisory services is borne by Funds Management. Metropolitan West Capital Management, LLC, an affiliate of Funds Management and an indirect wholly owned subsidiary of Wells Fargo, is the subadviser to the Fund and is entitled to receive a fee from Funds Management at an annual rate starting at 0.35% and declining to 0.20% as the average daily net assets of the Fund increase.
| | | | |
| 22 | | Wells Fargo Intrinsic World Equity Fund | | Notes to financial statements |
Administration fees
Under a class-level administration agreement, Funds Management provides class-level administrative services to the Fund, which includes paying fees and expenses for services provided by the transfer agent, sub-transfer agents, omnibus account servicers and record-keepers. As compensation for its services under the class-level administration agreement, Funds Management receives an annual fee which is calculated based on the average daily net assets of each class as follows:
| | | | | | | | |
| | | Class-level administration fee | |
| | | Current rate | | | Rate prior to
July 1, 2015 | |
Class A, Class C | | | 0.21 | % | | | 0.26 | % |
Administrator Class | | | 0.13 | | | | 0.10 | |
Institutional Class | | | 0.13 | | | | 0.08 | |
Funds Management has contractually waived and/or reimbursed management and administration fees to the extent necessary to maintain certain net operating expense ratios for the Fund. Waiver of fees and/or reimbursement of expenses by Funds Management were made first from fund level expenses on a proportionate basis and then from class specific expenses. Funds Management has committed through February 29, 2016 to waive fees and/or reimburse expenses to the extent necessary to cap the Fund’s expenses at 1.40% for Class A shares, 2.15% for Class C shares, 1.15% for Administrator Class shares, and 0.95% for Institutional Class shares. After this time, the cap may be increased or the commitment to maintain the cap may be terminated only with the approval of the Board of Trustees.
Distribution fee
The Trust has adopted a distribution plan for Class C shares of the Fund pursuant to Rule 12b-1 under the 1940 Act. A distribution fee is charged to Class C shares and paid to Wells Fargo Funds Distributor, LLC (“Funds Distributor”), the principal underwriter, at an annual rate of 0.75% of the average daily net assets of Class C shares.
In addition, Funds Distributor is entitled to receive the front-end sales charge from the purchase of Class A shares and a contingent deferred sales charge on the redemption of certain Class A shares. Funds Distributor is also entitled to receive the contingent deferred sales charges from redemptions of Class C shares. For the year ended October 31, 2015, Funds Distributor received $2,925 from the sale of Class A shares.
Shareholder servicing fees
The Trust has entered into contracts with one or more shareholder servicing agents, whereby Class A, Class C, and Administrator Class of the Fund is charged a fee at an annual rate of 0.25% of the average daily net assets of each respective class.
A portion of these total shareholder servicing fees were paid to affiliates of Wells Fargo.
5. INVESTMENT PORTFOLIO TRANSACTIONS
Purchases and sales of investments, excluding U.S. government obligations (if any) and short-term securities, for the year ended October 31, 2015 were $55,391,404 and $67,376,661, respectively.
6. BANK BORROWINGS
The Trust (excluding the money market funds) and Wells Fargo Variable Trust are parties to a $200,000,000 revolving credit agreement whereby the Fund is permitted to use bank borrowings for temporary or emergency purposes, such as to fund shareholder redemption requests. Interest under the credit agreement is charged to the Fund based on a borrowing rate equal to the higher of the Federal Funds rate in effect on that day plus 1.25% or the overnight LIBOR rate in effect on that day plus 1.25%. In addition, an annual commitment fee equal to 0.20% of the unused balance is allocated to each participating fund. Prior to September 1, 2015, the revolving credit agreement amount was $150,000,000 and the annual commitment fee was equal to 0.10% of the unused balance which was allocated to each participating fund. For the year ended October 31, 2015, the Fund paid $370 in commitment fees.
For the year ended October 31, 2015, there were no borrowings by the Fund under the agreement.
| | | | | | |
| Notes to financial statements | | Wells Fargo Intrinsic World Equity Fund | | | 23 | |
7. DISTRIBUTIONS TO SHAREHOLDERS
The tax character of distributions paid during the years ended October 31, 2015 and October 31, 2014 were as follows:
| | | | | | | | |
| | | Year ended October 31 | |
| | | 2015 | | | 2014 | |
Ordinary income | | $ | 957,783 | | | $ | 2,014,569 | |
Long-term capital gain | | | 2,956,361 | | | | 0 | |
As of October 31, 2015, the components of distributable earnings on a tax basis were as follows:
| | | | |
Undistributed
ordinary
income | | Undistributed
long-term
gain | | Unrealized
gains |
| $2,314,430 | | $17,454,157 | | $29,079,043 |
8. INDEMNIFICATION
Under the Trust’s organizational documents, the officers and Trustees have been granted certain indemnification rights against certain liabilities that may arise out of performance of their duties to the Trust. Additionally, in the normal course of business, the Trust may enter into contracts with service providers that contain a variety of indemnification clauses. The Trust’s maximum exposure under these arrangements is dependent on future claims that may be made against the Fund and, therefore, cannot be estimated.
| | | | |
| 24 | | Wells Fargo Intrinsic World Equity Fund | | Report of independent registered public accounting firm |
BOARD OF TRUSTEES AND SHAREHOLDERS OF WELLS FARGO FUNDS TRUST:
We have audited the accompanying statement of assets and liabilities, including the portfolio of investments, of the Wells Fargo Intrinsic World Equity Fund (the “Fund”), one of the funds constituting the Wells Fargo Funds Trust, as of October 31, 2015, and the related statement of operations for the year then ended, the statements of changes in net assets for each of the years in the two-year period then ended, and the financial highlights for each of the years in the five-year period then ended. These financial statements and financial highlights are the responsibility of the Fund’s management. Our responsibility is to express an opinion on these financial statements and financial highlights based on our audits.
We conducted our audits in accordance with the standards of the Public Company Accounting Oversight Board (United States). Those standards require that we plan and perform the audit to obtain reasonable assurance about whether the financial statements and financial highlights are free of material misstatement. An audit includes examining, on a test basis, evidence supporting the amounts and disclosures in the financial statements. Our procedures included confirmation of securities owned as of October 31, 2015, by correspondence with the custodian and brokers, or by other appropriate auditing procedures. An audit also includes assessing the accounting principles used and significant estimates made by management, as well as evaluating the overall financial statement presentation. We believe that our audits provide a reasonable basis for our opinion.
In our opinion, the financial statements and financial highlights referred to above present fairly, in all material respects, the financial position of the Wells Fargo Intrinsic World Equity Fund as of October 31, 2015, the results of its operations for the year then ended, the changes in its net assets for each of the years in the two-year period then ended, and the financial highlights for each of the years in the five-year period then ended, in conformity with U.S. generally accepted accounting principles.

Boston, Massachusetts
December 22, 2015
| | | | | | |
| Other information (unaudited) | | Wells Fargo Intrinsic World Equity Fund | | | 25 | |
TAX INFORMATION
For corporate shareholders, pursuant to Section 854 of the Internal Revenue Code, 100% of ordinary income dividends qualify for the corporate dividends-received deduction for the fiscal year ended October 31, 2015.
Pursuant to Section 852 of the Internal Revenue Code, $2,956,361 was designated as long-term capital gain distributions for the fiscal year ended October 31, 2015.
Pursuant to Section 854 of the Internal Revenue Code, $957,783 of income dividends paid during the fiscal year ended October 31, 2015 has been designated as qualified dividend income (QDI).
PROXY VOTING INFORMATION
A description of the policies and procedures that the Fund uses to determine how to vote proxies relating to portfolio securities is available, upon request, by calling 1-800-222-8222, visiting our website at wellsfargofunds.com, or visiting the SEC website at sec.gov. Information regarding how the Fund voted proxies relating to portfolio securities during the most recent 12-month period ended June 30 is available on the Fund’s website at wellsfargofunds.com or by visiting the SEC website at sec.gov.
PORTFOLIO HOLDINGS INFORMATION
The complete portfolio holdings for the Fund are publicly available monthly on the Fund’s website (wellsfargofunds.com), on a one-month delayed basis. In addition, top ten holdings information (excluding derivative positions) for the Fund is publicly available on the Fund’s website on a monthly, seven-day or more delayed basis. The Fund files its complete schedule of portfolio holdings with the SEC for the first and third quarters of each fiscal year on Form N-Q, which is available by visiting the SEC website at sec.gov. In addition, the Fund’s Form N-Q may be reviewed and copied at the SEC’s Public Reference Room in Washington, DC, and at regional offices in New York City, at 233 Broadway, and in Chicago, at 175 West Jackson Boulevard, Suite 900. Information about the Public Reference Room may be obtained by calling 1-800-SEC-0330.
| | | | |
| 26 | | Wells Fargo Intrinsic World Equity Fund | | Other information (unaudited) |
BOARD OF TRUSTEES AND OFFICERS
Each of the Trustees and Officers1 listed in the table below acts in identical capacities for each fund in the Wells Fargo family of funds, which consists of 144 mutual funds comprising the Wells Fargo Funds Trust, Wells Fargo Variable Trust, Wells Fargo Master Trust and four closed-end funds (collectively the “Fund Complex”). This table should be read in conjunction with the Prospectus and the Statement of Additional Information2. The mailing address of each Trustee and Officer is 525 Market Street, 12th Floor, San Francisco, CA 94105. Each Trustee and Officer serves an indefinite term, however, each Trustee serves such term until reaching the mandatory retirement age established by the Trustees.
Independent Trustees
| | | | | | |
Name and year of birth | | Position held and length of service* | | Principal occupations during past five years or longer | | Other public company or
investment company
directorships during
past 5 years |
William R. Ebsworth (Born 1957) | | Trustee, since 2015** | | Retired. From 1984 to 2013, equities analyst, portfolio manager, research director at Fidelity Management and Research Company in Boston, Tokyo, and Hong Kong, and retired in 2013 as Chief Investment Officer of Fidelity Strategic Advisers, Inc. where he led a team of investment professionals managing client assets. Prior thereto, Board member of Hong Kong Securities Clearing Co., Hong Kong Options Clearing Corp., the Thailand International Fund, Ltd., Fidelity Investments Life Insurance Company, and Empire Fidelity Investments Life Insurance Company. Mr. Ebsworth is a CFA® charterholder and an Adjunct Lecturer, Finance, at Babson College. | | Asset Allocation Trust |
Jane A. Freeman (Born 1953) | | Trustee, since 2015** | | Retired. From 2012 to 2014 and 1999 to 2008, Chief Financial Officer of Scientific Learning Corporation. From 2008 to 2012, Ms. Freeman provided consulting services Loevner Funds; Russell related to strategic business projects. Prior to 1999, Portfolio Manager at Rockefeller Exchange Traded Funds Trust & Co. and Scudder, Stevens & Clark. Board member of the Harding Loevner Funds from 1996 to 2014, serving as both Lead Independent Director and chair of the Audit Committee. Board member of the Russell Exchange Traded Funds Trust from 2011 to 2012 and the chair of the Audit Committee. Ms. Freeman is Chair of Taproot Foundation (non-profit organization), a Board Member of Ruth Bancroft Garden (non-profit organization) and an inactive chartered financial analyst. | | Asset Allocation Trust, Harding Loevner Funds, Russell Exchange Traded Funds Trust |
Peter G. Gordon (Born 1942) | | Trustee, since 1998; Chairman, since 2005 | | Co-Founder, Retired Chairman, President and CEO of Crystal Geyser Water Company. Trustee Emeritus, Colby College. | | Asset Allocation Trust |
Isaiah Harris, Jr. (Born 1952) | | Trustee, since 2009 | | Retired. Chairman of the Board of CIGNA Corporation since 2009, and Director since 2005. From 2003 to 2011, Director of Deluxe Corporation. Prior thereto, President and CEO of BellSouth Advertising and Publishing Corp. from 2005 to 2007, President and CEO of BellSouth Enterprises from 2004 to 2005 and President of BellSouth Consumer Services from 2000 to 2003. Emeritus member of the Iowa State University Foundation Board of Governors. Emeritus Member of the Advisory Board of Iowa State University School of Business. Advisory Board Member, Palm Harbor Academy (charter school). Mr. Harris is a certified public accountant. | | CIGNA Corporation; Asset Allocation Trust |
Judith M. Johnson (Born 1949) | | Trustee, since 2008; Audit Committee Chairman, since 2008 | | Retired. Prior thereto, Chief Executive Officer and Chief Investment Officer of Minneapolis Employees Retirement Fund from 1996 to 2008. Ms. Johnson is an attorney, certified public accountant and a certified managerial accountant. | | Asset Allocation Trust |
David F. Larcker (Born 1950) | | Trustee, since 2009 | | James Irvin Miller Professor of Accounting at the Graduate School of Business, Stanford University, Morgan Stanley Director of the Center for Leadership Development and Research and Senior Faculty of The Rock Center for Corporate Governance since 2006. From 2005 to 2008, Professor of Accounting at the Graduate School of Business, Stanford University. Prior thereto, Ernst & Young Professor of Accounting at The Wharton School, University of Pennsylvania from 1985 to 2005. | | Asset Allocation Trust |
| | | | | | |
| Other information (unaudited) | | Wells Fargo Intrinsic World Equity Fund | | | 27 | |
| | | | | | |
Name and year of birth | | Position held and length of service* | | Principal occupations during past five years or longer | | Other public company or
investment company
directorships during
past 5 years |
Olivia S. Mitchell (Born 1953) | | Trustee, since 2006 | | International Foundation of Employee Benefit Plans Professor, Wharton School of the University of Pennsylvania since 1993. Director of Wharton’s Pension Research Council and Boettner Center on Pensions & Retirement Research, and Research Associate at the National Bureau of Economic Research. Previously, Cornell University Professor from 1978 to 1993. | | Asset Allocation Trust |
Timothy J. Penny (Born 1951) | | Trustee, since 1996 | | President and Chief Executive Officer of Southern Minnesota Initiative Foundation, a non-profit organization, since 2007 and Senior Fellow at the Humphrey Institute Policy Forum at the University of Minnesota since 1995. Member of the Board of Trustees of NorthStar Education Finance, Inc., a non-profit organization, since 2007. | | Asset Allocation Trust |
Michael S. Scofield (Born 1943) | | Trustee, since 2010 | | Served on the Investment Company Institute’s Board of Governors and Executive Committee from 2008-2011 as well the Governing Council of the Independent Directors Council from 2006-2011 and the Independent Directors Council Executive Committee from 2008-2011. Chairman of the IDC from 2008-2010. Institutional Investor (Fund Directions) Trustee of Year in 2007. Trustee of the Evergreen Funds complex (and its predecessors) from 1984 to 2010. Chairman of the Evergreen Funds from 2000-2010. Former Trustee of the Mentor Funds. Retired Attorney, Law Offices of Michael S. Scofield. | | Asset Allocation Trust |
Donald C. Willeke (Born 1940) | | Trustee, since 1996*** | | Principal of the law firm of Willeke & Daniels. General Counsel of the Minneapolis Employees Retirement Fund from 1984 until its consolidation into the Minnesota Public Employees Retirement Association on June 30, 2010. Director and Vice Chair of The Tree Trust (non-profit corporation). Director of the American Chestnut Foundation (non-profit corporation). | | Asset Allocation Trust |
| * | Length of service dates reflect the Trustee’s commencement of service with the Trust’s predecessor entities, where applicable. |
| ** | William R. Ebsworth and Jane A. Freeman each became a Trustee effective January 1, 2015. |
| *** | Donald Willeke will retire as a Trustee effective December 31, 2015. |
Officers
| | | | | | |
Name and year of birth | | Position held and length of service | | Principal occupations during past five years or longer | | |
Karla M. Rabusch (Born 1959) | | President, since 2003 | | Executive Vice President of Wells Fargo Bank, N.A. and President of Wells Fargo Funds Management, LLC since 2003. | | |
Jeremy DePalma1 (Born 1974) | | Treasurer, since 2012 | | Senior Vice President of Wells Fargo Funds Management, LLC since 2009. Senior Vice President of Evergreen Investment Management Company, LLC from 2008 to 2010 and head of the Fund Reporting and Control Team within Fund Administration from 2005 to 2010. | | |
C. David Messman (Born 1960) | | Secretary, since 2000; Chief Legal Officer, since 2003 | | Senior Vice President and Secretary of Wells Fargo Funds Management, LLC since 2001. Assistant General Counsel of Wells Fargo Bank, N.A. since 2013 and Vice President and Managing Counsel of Wells Fargo Bank N.A. from 1996 to 2013. | | |
Debra Ann Early (Born 1964) | | Chief Compliance Officer, since 2007 | | Executive Vice President of Wells Fargo Funds Management, LLC since 2014, Senior Vice President and Chief Compliance Officer from 2007 to 2014. | | |
David Berardi (Born 1975) | | Assistant Treasurer, since 2009 | | Vice President of Wells Fargo Funds Management, LLC since 2009. Vice President of Evergreen Investment Management Company, LLC from 2008 to 2010. Manager of Fund Reporting and Control for Evergreen Investment Management Company, LLC from 2004 to 2010. | | |
| 1 | Jeremy DePalma acts as Treasurer of 72 funds and Assistant Treasurer of 72 funds in the Fund Complex. |
| 2 | The Statement of Additional Information includes additional information about the Trustees and is available, without charge, upon request, by calling 1-800-222-8222 or by visiting the website at wellsfargofunds.com. |
| | | | |
| 28 | | Wells Fargo Intrinsic World Equity Fund | | Other information (unaudited) |
BOARD CONSIDERATION OF INVESTMENT ADVISORY, INVESTMENT MANAGEMENT AND SUB-ADVISORY AGREEMENTS:
Under the Investment Company Act of 1940 (the “1940 Act”), the Board of Trustees (the “Board”) of Wells Fargo Funds Trust (the “Trust”) must determine annually whether to approve the continuation of the Trust’s investment advisory and sub-advisory agreements. In this regard, at an in-person meeting held on May 19-20, 2015 (the “Meeting”), the Board, all the members of which have no direct or indirect interest in the investment advisory and sub-advisory agreements and are not “interested persons” of the Trust, as defined in the 1940 Act (the “Independent Trustees”), reviewed and approved for Wells Fargo Advantage Intrinsic World Equity Fund (the “Fund”): (i) an investment advisory agreement (the “Advisory Agreement”) with Wells Fargo Funds Management, LLC (“Funds Management”); (ii) an investment management agreement (the “Management Agreement”) with Funds Management; and (iii) an investment sub-advisory agreement (the “Sub-Advisory Agreement”) with Metropolitan West Capital Management, LLC (the “Sub-Adviser”), an affiliate of Funds Management. The Management Agreement combines the terms of the Advisory Agreement with the terms of the Fund’s Amended and Restated Administration Agreement (the “Administration Agreement”) applicable to Fund-level administrative services. The Advisory Agreement, the Management Agreement and the Sub-Advisory Agreement are collectively referred to as the “Advisory Agreements.”
At the Meeting, the Board considered the factors and reached the conclusions described below relating to the selection of Funds Management and the Sub-Adviser and the approval of the Advisory Agreements. Prior to the Meeting, including at an in-person meeting in March 2015, the Trustees conferred extensively among themselves and with representatives of Funds Management about these matters. Also, the Board has adopted a team-based approach, with each team consisting of a sub-set of Trustees, to assist the full Board in the discharge of its duties in reviewing performance and other matters throughout the year. The Independent Trustees were assisted in their evaluation of the Advisory Agreements by independent legal counsel, from whom they received separate legal advice and with whom they met separately.
In providing information to the Board, Funds Management and the Sub-Adviser were guided by a detailed set of requests for information submitted to them by independent legal counsel on behalf of the Independent Trustees at the start of the Board’s annual contract renewal process earlier in 2015. In considering and approving the Advisory Agreements, the Trustees considered the information they believed relevant, including but not limited to the information discussed below. The Board considered not only the specific information presented in connection with the Meeting, but also the knowledge gained over time through interaction with Funds Management and the Sub-Adviser about various topics. In this regard, the Board reviewed reports of Funds Management at each of its quarterly meetings, which included, among other things, portfolio reviews and performance reports. In addition, the Board and the teams mentioned above confer with portfolio managers at various times throughout the year. The Board did not identify any particular information or consideration that was all-important or controlling, and each individual Trustee may have attributed different weights to various factors.
After its deliberations, the Board unanimously approved the continuation of the Advisory Agreement for the period from June 1, 2015 through June 30, 2015, approved the Management Agreement for the period from July 1, 2015 through May 31, 2016, and approved the continuation of the Sub-Advisory Agreement for a one-year term through May 31, 2016. The Board also determined that the compensation payable to Funds Management and the Sub-Adviser under each of the Advisory Agreements was reasonable. The Board considered the approval of the Advisory Agreements for the Fund as part of its consideration of agreements for funds across the complex, but its approvals were made on a fund-by-fund basis. The following summarizes a number of important, but not necessarily all, factors considered by the Board in support of its approvals.
Nature, extent and quality of services
The Board received and considered various information regarding the nature, extent and quality of services provided to the Fund by Funds Management and the Sub-Adviser under the Advisory Agreements. This information included, among other things, a summary of the background and experience of senior management of Funds Management, and the qualifications, background, tenure and responsibilities of each of the portfolio managers primarily responsible for the day-to-day portfolio management of the Fund. The Board noted that the services to be provided to the Fund pursuant to the Management Agreement combined the advisory services previously provided to the Fund pursuant to the Fund’s Advisory Agreement with the Fund-level administrative services previously provided to the Fund pursuant to the Fund’s Administration Agreement. The Board received a representation from Funds Management that combining these services would not result in any change to the nature or level of services provided by Funds Management to the Fund.
| | | | | | |
| Other information (unaudited) | | Wells Fargo Intrinsic World Equity Fund | | | 29 | |
The Board evaluated the ability of Funds Management and the Sub-Adviser to attract and retain qualified investment professionals, including research, advisory and supervisory personnel. The Board further considered the compliance programs and compliance records of Funds Management and the Sub-Adviser. In addition, the Board took into account the full range of services provided to the Fund by Funds Management and its affiliates.
Fund performance and expenses
The Board considered the performance results for the Fund over various time periods ended March 31, 2015. The Board considered these results in comparison to the performance of funds in a universe that was determined by Lipper Inc. (“Lipper”) to be similar to the Fund (the “Universe”), and in comparison to the Fund’s benchmark index and to other comparative data. Lipper is an independent provider of investment company data. The Board received a description of the methodology used by Lipper to select the mutual funds in the performance Universe. The Board noted that the performance of the Fund (Administrator Class) was higher than or in range of the average performance of the Universe for all periods under review except the one-year period. The Board also noted that the performance of the Fund was higher than its benchmark, the MSCI World Index (Net), for all periods under review except the one- and three-year periods.
The Board received information concerning, and discussed factors contributing to, the underperformance of the Fund relative to the Universe and benchmark for the periods identified above. The Board took note of the explanations for the relative underperformance in these periods, including with respect to sector allocations that affected the Fund’s performance, and of longer term and recent outperformance.
The Board also received and considered information regarding the Fund’s net operating expense ratios and their various components, including actual management fees (which reflect fee waivers, if any, and include advisory, administration and transfer agent fees), custodian and other non-management fees, and Rule 12b-1 and non-Rule 12b-1 service fees. The Board considered these ratios in comparison to the median ratios of funds in class-specific expense groups that were determined by Lipper to be similar to the Fund (the “Groups”). The Board received a description of the methodology used by Lipper to select the mutual funds in the expense Groups and an explanation of how funds comprising expense groups and their expense ratios may vary from year-to-year. Based on the Lipper reports, the Board noted that the net operating expense ratios of the Fund were lower than or equal to the median net operating expense ratios of the expense Groups. The Board accepted Funds Management’s proposal to increase the net operating expense ratio caps for the Administrator Class, and to decrease the caps for Class A and Class C. In accepting such proposed new net operating expense ratio caps, the Board noted that the Fund’s new net operating expense ratios would still be lower than or equal to the median net operating expense ratios of the expense Groups.
The Board took into account the Fund performance and expense information provided to it among the factors considered in deciding to re-approve the Advisory Agreement and Sub-Advisory Agreement and approve the Management Agreement.
Investment advisory and sub-advisory fee rates
The Board reviewed and considered the contractual investment advisory fee rates that are payable by the Fund to Funds Management for investment advisory services (the “Advisory Agreement Rates”), both on a stand-alone basis and on a combined basis with the Fund’s fund-level and class-level contractual administration fee rates (the “Management Rates”). The Board noted that the Management Rates include transfer agency and sub-transfer agency costs. The Board also noted that the fee rate to be paid by the Fund under the Management Agreement will incorporate the advisory fee and Fund-level administration fee previously payable separately by the Fund under the Fund’s Advisory Agreement and Administration Agreement with Funds Management. The Board also reviewed and considered the contractual investment sub-advisory fee rates that are payable by Funds Management to the Sub-Adviser for investment sub-advisory services (the “Sub-Advisory Agreement Rates”).
Among other information reviewed by the Board was a comparison of the Management Rates of the Fund with those of other funds in the expense Groups at a common asset level. The Board noted that the Management Rates of the Fund were lower than or in range of the average rates for the Fund’s expense Groups for all share classes.
The Board also received and considered information about the portion of the total advisory fee that was retained by Funds Management after payment of the fee to the Sub-Adviser for sub-advisory services. In assessing the reasonableness of this amount, the Board received and evaluated information about the nature and extent of responsibilities retained and risks assumed by Funds Management and not delegated to or assumed by the Sub-Adviser, and about Funds Management’s on-going oversight services. However, given the affiliation between Funds Management and the Sub-Adviser, the Board ascribed limited relevance to the allocation of the advisory fee between them.
| | | | |
| 30 | | Wells Fargo Intrinsic World Equity Fund | | Other information (unaudited) |
The Board also received and considered information about the nature and extent of services offered and fee rates charged by Funds Management and the Sub-Adviser to other types of clients with investment strategies similar to those of the Fund. In this regard, the Board received information about the significantly greater scope of services, and compliance, reporting and other legal burdens and risks of managing mutual funds compared with those associated with managing assets of non-mutual fund clients such as collective funds or institutional separate accounts.
Based on its consideration of the factors and information it deemed relevant, including those described here, the Board determined that the compensation payable to Funds Management under the Management Agreement and Advisory Agreement and to the Sub-Adviser under the Sub-Advisory Agreement was reasonable, in light of the services covered by the Advisory Agreements.
Profitability
The Board received and considered information concerning the profitability of Funds Management, as well as the profitability of Wells Fargo as a whole, from providing services to the Fund and the fund family as a whole. The Board also received and considered information concerning the profitability of the Sub-Adviser from providing services to the fund family as a whole, noting that the Sub-Adviser’s profitability information with respect to providing services to the Fund was subsumed in the Wells Fargo profitability analysis.
Funds Management reported on the methodologies and estimates used in calculating profitability. Among other things, the Board noted that the levels of profitability reported on a fund-by-fund basis varied widely, depending on factors such as the size and type of fund. Based on its review, the Board did not deem the profits reported by Funds Management or Wells Fargo from its services to the Fund to be at a level that would prevent it from approving the continuation of the Advisory Agreements.
Economies of scale
With respect to possible economies of scale, the Board noted the existence of breakpoints in the Fund’s advisory and management fee structures, and the Fund’s administration fee structure, which operate generally to reduce the Fund’s expense ratios as the Fund grows in size. It considered that, for a small fund or a fund that shrinks in size, breakpoints conversely can result in higher fee levels. The Board also considered that fee waiver and expense reimbursement arrangements and competitive fee rates at the outset are means of sharing potential economies of scale with shareholders of the Fund and the fund family as a whole. The Board considered Funds Management’s view that any analyses of potential economies of scale in managing a particular fund are inherently limited in light of the joint and common costs and investments that Funds Management incurs across the fund family as a whole.
The Board concluded that the Fund’s fee and expense arrangements, including contractual breakpoints, constituted a reasonable approach to sharing potential economies of scale with the Fund and its shareholders.
Other benefits to Funds Management and the Sub-Adviser
The Board received and considered information regarding potential “fall-out” or ancillary benefits received by Funds Management and its affiliates, including the Sub-Adviser, as a result of their relationships with the Fund. Ancillary benefits could include, among others, benefits directly attributable to other relationships with the Fund and benefits potentially derived from an increase in Funds Management’s and the Sub-Adviser’s business as a result of their relationships with the Fund. The Board noted that various affiliates of Funds Management may receive distribution-related fees, shareholder servicing payments and sub-transfer agency fees in respect of shares sold or held through them and services provided.
The Board also reviewed information about soft dollar credits earned and utilized by the Sub-Adviser, fees earned by Funds Management from managing a private investment vehicle for the fund family’s securities lending collateral and commissions earned by an affiliated broker from portfolio transactions.
Based on its consideration of the factors and information it deemed relevant, including those described here, the Board did not find that any ancillary benefits received by Funds Management and its affiliates, including the Sub-Adviser, were unreasonable.
Conclusion
At the Meeting, after considering the above-described factors and based on its deliberations and its evaluation of the information described above, the Board unanimously approved the continuation of the Advisory Agreement for the period from June 1, 2015 through June 30, 2015, approved the Management Agreement for the period from July 1, 2015 through May 31, 2016, and approved the continuation of the Sub-Advisory Agreement for a one-year term through May 31, 2016. The Board also determined that the compensation payable to Funds Management and the Sub-Adviser under each of the Advisory Agreements was reasonable.
| | | | | | |
| List of abbreviations | | Wells Fargo Intrinsic World Equity Fund | | | 31 | |
The following is a list of common abbreviations for terms and entities that may have appeared in this report.
| ACA | — ACA Financial Guaranty Corporation |
| ADR | — American depositary receipt |
| ADS | — American depositary shares |
| AGC | — Assured Guaranty Corporation |
| AGM | — Assured Guaranty Municipal |
| Ambac | — Ambac Financial Group Incorporated |
| AMT | — Alternative minimum tax |
| BAN | — Bond anticipation notes |
| BHAC | — Berkshire Hathaway Assurance Corporation |
| CAB | — Capital appreciation bond |
| CCAB | — Convertible capital appreciation bond |
| CDA | — Community Development Authority |
| CDO | — Collateralized debt obligation |
| DRIVER | — Derivative inverse tax-exempt receipts |
| DW&P | — Department of Water & Power |
| DWR | — Department of Water Resources |
| ECFA | — Educational & Cultural Facilities Authority |
| EDA | — Economic Development Authority |
| EDFA | — Economic Development Finance Authority |
| ETF | — Exchange-traded fund |
| FDIC | — Federal Deposit Insurance Corporation |
| FFCB | — Federal Farm Credit Banks |
| FGIC | — Financial Guaranty Insurance Corporation |
| FHA | — Federal Housing Administration |
| FHLB | — Federal Home Loan Bank |
| FHLMC | — Federal Home Loan Mortgage Corporation |
| FICO | — The Financing Corporation |
| FNMA | — Federal National Mortgage Association |
| GDR | — Global depositary receipt |
| GNMA | — Government National Mortgage Association |
| HCFR | — Healthcare facilities revenue |
| HEFA | — Health & Educational Facilities Authority |
| HEFAR | — Higher education facilities authority revenue |
| HFA | — Housing Finance Authority |
| HFFA | — Health Facilities Financing Authority |
| HUD | — Department of Housing and Urban Development |
| IDA | — Industrial Development Authority |
| IDAG | — Industrial Development Agency |
| KRW | — Republic of Korea won |
| LIBOR | — London Interbank Offered Rate |
| LIFER | — Long Inverse Floating Exempt Receipts |
| LLC | — Limited liability company |
| LLLP | — Limited liability limited partnership |
| LLP | — Limited liability partnership |
| MBIA | — Municipal Bond Insurance Association |
| MFHR | — Multifamily housing revenue |
| MSTR | — Municipal securities trust receipts |
| MUD | — Municipal Utility District |
| National | — National Public Finance Guarantee Corporation |
| PCFA | — Pollution Control Financing Authority |
| PCL | — Public Company Limited |
| PCR | — Pollution control revenue |
| PFA | — Public Finance Authority |
| PFFA | — Public Facilities Financing Authority |
| PFOTER | — Puttable floating option tax-exempt receipts |
| plc | — Public limited company |
| PUTTER | — Puttable tax-exempt receipts |
| R&D | — Research & development |
| Radian | — Radian Asset Assurance |
| RAN | — Revenue anticipation notes |
| RDA | — Redevelopment Authority |
| RDFA | — Redevelopment Finance Authority |
| REIT | — Real estate investment trust |
| ROC | — Reset option certificates |
| SAVRS | — Select auction variable rate securities |
| SBA | — Small Business Authority |
| SDR | — Swedish depositary receipt |
| SFHR | — Single-family housing revenue |
| SFMR | — Single-family mortgage revenue |
| SPA | — Standby purchase agreement |
| SPDR | — Standard & Poor’s Depositary Receipts |
| SPEAR | — Short Puttable Exempt Adjustable Receipts |
| STRIPS | — Separate trading of registered interest and |
| TAN | — Tax anticipation notes |
| TIPS | — Treasury inflation-protected securities |
| TRAN | — Tax revenue anticipation notes |
| TTFA | — Transportation Trust Fund Authority |
| TVA | — Tennessee Valley Authority |
This page is intentionally left blank.

For more information
More information about Wells Fargo Funds is available free upon request. To obtain literature, please write, email, visit the Fund’s website, or call:
Wells Fargo Funds
P.O. Box 8266
Boston, MA 02266-8266
Email: wfaf@wellsfargo.com
Website: wellsfargofunds.com
Individual investors: 1-800-222-8222
Retail investment professionals: 1-888-877-9275
Institutional investment professionals: 1-866-765-0778
This report and the financial statements contained herein are submitted for the general information of the shareholders of Wells Fargo Funds. If this report is used for promotional purposes, distribution of the report must be accompanied or preceded by a current prospectus. Before investing, please consider the investment objectives, risks, charges, and expenses of the investment. For a current prospectus and, if available, a summary prospectus, containing this information, call 1-800-222-8222 or visit the Fund’s website at wellsfargofunds.com. Read the prospectus carefully before you invest or send money.
Wells Fargo Funds Management, LLC, a wholly owned subsidiary of Wells Fargo & Company, provides investment advisory and administrative services for Wells Fargo Funds. Other affiliates of Wells Fargo & Company provide subadvisory and other services for the Funds. The Funds are distributed by Wells Fargo Funds Distributor, LLC, Member FINRA, an affiliate of Wells Fargo & Company.
NOT FDIC INSURED ¡ NO BANK GUARANTEE ¡ MAY LOSE VALUE
© 2015 Wells Fargo Funds Management, LLC. All rights reserved.
| | |
 | | 238511 12-15 A241/AR241 10-15 |
ITEM 2. CODE OF ETHICS
(a) As of the end of the period covered by the report, Wells Fargo Funds Trust has adopted a code of ethics that applies to its President and Treasurer. A copy of the code of ethics is filed as an exhibit to this Form N-CSR.
(c) During the period covered by this report, there were no amendments to the provisions of the code of ethics adopted in Item 2(a) above.
(d) During the period covered by this report, there were no implicit or explicit waivers to the provisions of the code of ethics adopted in Item 2(a) above.
ITEM 3. AUDIT COMMITTEE FINANCIAL EXPERT
The Board of Trustees of Wells Fargo Funds Trust has determined that Judith Johnson is an audit committee financial expert, as defined in Item 3 of Form N-CSR. Mrs. Johnson is independent for purposes of Item 3 of Form N-CSR.
ITEM 4. PRINCIPAL ACCOUNTANT FEES AND SERVICES
(a), (b), (c), (d) The following table presents aggregate fees billed in each of the last two fiscal years for services rendered to the Registrant by the Registrant’s principal accountant. These fees were billed to the registrant and were approved by the Registrant’s audit committee.
| | | | | | | | |
| | | Fiscal
year ended
October 31, 2015 | | | Fiscal
year ended
October 31, 2014 | |
Audit fees | | $ | 308,960 | | | $ | 308,960 | |
Audit-related fees | | | — | | | | — | |
Tax fees (1) | | | 40,770 | | | | 38,530 | |
All other fees | | | — | | | | — | |
| | | | | | | | |
| | $ | 349,730 | | | $ | 347,490 | |
| | | | | | | | |
| (1) | Tax fees consist of fees for tax compliance, tax advice, tax planning and excise tax. |
(e) The Chairman of the Audit Committees is authorized to pre-approve: (1) audit services for the mutual funds of Wells Fargo Funds Trust; (2) non-audit tax or compliance consulting or training services provided to the Funds by the independent auditors (“Auditors”) if the fees for any particular engagement are not anticipated to exceed $50,000; and (3) non-audit tax or compliance consulting or training services provided by the Auditors to a Fund’s investment adviser and its controlling entities (where pre-approval is required because the engagement relates directly to the operations and financial reporting of the Fund) if the fee to the Auditors for any particular engagement is not anticipated to exceed $50,000. For any such pre-approval sought from the Chairman, Management shall prepare a brief description of the proposed services. If the Chairman approves of such service, he or she shall sign the statement prepared by Management. Such written statement shall be presented to the full Committees at their next regularly scheduled meetings.
(f) Not applicable
(g) Not applicable
(h) Not applicable
ITEM 5. AUDIT COMMITTEE OF LISTED REGISTRANTS
Not applicable.
ITEM 6. INVESTMENTS
A Portfolio of Investments for each series of Wells Fargo Funds Trust is included as part of the report to shareholders filed under Item 1 of this Form.
ITEM 7. DISCLOSURE OF PROXY VOTING POLICIES AND PROCEDURES FOR CLOSED-END MANAGEMENT INVESTMENT COMPANIES
Not applicable.
ITEM 8. PORTFOLIO MANAGERS OF CLOSED-END MANAGEMENT INVESTMENT COMPANIES
Not applicable.
ITEM 9. PURCHASES OF EQUITY SECURITIES BY CLOSED-END MANAGEMENT INVESTMENT COMPANY AND AFFILIATED PURCHASERS
Not applicable.
ITEM 10. SUBMISSION OF MATTERS TO A VOTE OF SECURITY HOLDERS
There have been no material changes to the procedures by which shareholders may recommend nominees to the registrant’s Board of Trustees that have been implemented since the registrant’s last provided disclosure in response to the requirements of this Item.
ITEM 11. CONTROLS AND PROCEDURES
(a) The President and Treasurer have concluded that the Wells Fargo Funds Trust (the “Trust”) disclosure controls and procedures (as defined in Rule 30a-3(c) under the Investment Company Act of 1940) provide reasonable assurances that material information relating to the Trust is made known to them by the appropriate persons based on their evaluation of these controls and procedures as of a date within 90 days of the filing of this report.
(b) There were no significant changes in the Trust’s internal controls over financial reporting (as defined in Rule 30a-3(d) under the Investment Company Act of 1940) that occurred during the second fiscal quarter of the period covered by this report that materially affected, or is reasonably likely to materially affect, the registrant’s internal control over financial reporting.
ITEM 12. EXHIBITS
(a)(1) Code of Ethics pursuant to Item 2 of Form N-CSR is filed and attached hereto as Exhibit COE.
(a)(2) Certification pursuant to Rule 30a-2(a) under the Investment Company Act of 1940 (17 CFR 270.30a-2(a)) is filed and attached hereto as Exhibit 99.CERT.
(a)(3) Not applicable.
(b) Certification pursuant to Rule 30a-2(b) under the Investment Company Act of 1940 (17 CFR 270.30a-2(b)) is filed and attached hereto as Exhibit 99.906CERT.
SIGNATURES
Pursuant to the requirements of the Securities Exchange Act of 1934 and the Investment Company Act of 1940, the registrant has duly caused this report to be signed on its behalf by the undersigned, thereunto duly authorized.
| | |
| Wells Fargo Funds Trust |
| |
| By: | | |
| | /s/ Karla M. Rabusch |
| |
| | Karla M. Rabusch |
| | President |
|
| Date: December 22, 2015 |
Pursuant to the requirements of the Securities Exchange Act of 1934 and the Investment Company Act of 1940, this report has been signed below by the following persons on behalf of the registrant and in the capacities and on the date indicated.
| | |
| Wells Fargo Funds Trust |
| |
| By: | | |
| | /s/ Karla M. Rabusch |
| |
| | Karla M. Rabusch |
| | President |
|
| Date: December 22, 2015 |
| |
| By: | | |
| | /s/ Nancy Wiser |
| |
| | Nancy Wiser |
| | Treasurer |
|
| Date: December 22, 2015 |
| |
| By: | | |
| | /s/ Jeremy DePalma |
| |
| | Jeremy DePalma |
| | Treasurer |
|
| Date: December 22, 2015 |