
UNITED STATES
SECURITIES AND EXCHANGE COMMISSION
Washington, D.C. 20549
FORM N-CSRS
CERTIFIED SHAREHOLDER REPORT OF REGISTERED
MANAGEMENT INVESTMENT COMPANIES
Investment Company Act file number: 811-09253
Wells Fargo Funds Trust
(Exact name of registrant as specified in charter)
525 Market St., San Francisco, CA 94105
(Address of principal executive offices) (Zip code)
C. David Messman
Wells Fargo Funds Management, LLC
525 Market St., San Francisco, CA 94105
(Name and address of agent for service)
Registrant’s telephone number, including area code: 800-222-8222
Date of fiscal year end: January 31
Registrant is making a filing for 10 of its series:
Wells Fargo 100% Treasury Money Fund, Wells Fargo California Municipal Money Market Fund, Wells Fargo Cash Investment Money Market Fund, Wells Fargo Government Money Market Fund, Wells Fargo Heritage Money Market Fund, Wells Fargo Money Market Fund, Wells Fargo Municipal Cash Management Money Market Fund, Wells Fargo Municipal Money Market Fund, Wells Fargo National Tax-Free Money Market Fund, and Wells Fargo Treasury Plus Money Market Fund.
Date of reporting period: July 31, 2016
| ITEM 1. | REPORT TO STOCKHOLDERS |
| | |
Semi-Annual Report July 31, 2016 | |  |
Retail Money Market Funds

| | ¡ | Wells Fargo California Municipal Money Market Fund |

For further information about your Fund, contact your investment professional, visit our website at wellsfargofunds.com, or call us directly at 1-800-222-8222. We are available 24 hours a day, 7 days a week.
| | | | |
| 2 | | Wells Fargo California Municipal Money Market Fund | | Performance highlights (unaudited) |
The Fund is currently closed to new investors.1
Investment objective
The Fund seeks current income exempt from regular federal income tax and California individual income tax, while preserving capital and liquidity.
Manager
Wells Fargo Funds Management, LLC
Subadviser
Wells Capital Management Incorporated
Portfolio managers
James Randazzo
Jeffrey L. Weaver, CFA®
| | | | | | | | | | | | | | |
| Average annual total returns (%) as of July 31, 20162 | | | | | | | | | | |
| | | | | | | Expense ratios3 (%) |
| | | Inception date | | 1 year | | 5 year | | 10 year | | | | Gross | | Net4 |
Class A (SGCXX) | | 1-1-1992 | | 0.03 | | 0.02 | | 0.58 | | | | 0.64 | | 0.64 |
Administrator Class (WCMXX) | | 6-30-2010 | | 0.07 | | 0.03 | | 0.69 | | | | 0.37 | | 0.30 |
Premier Class (WCTXX)* | | 3-31-2008 | | 0.11 | | 0.03 | | 0.70 | | | | 0.25 | | 0.20 |
Service Class (WFCXX) | | 11-8-1999 | | 0.03 | | 0.02 | | 0.64 | | | | 0.54 | | 0.45 |
Sweep Class | | 6-30-2010 | | 0.03 | | 0.02 | | 0.64 | | | | 0.99 | | 0.99 |
| | | | | | | |
| Yield summary (%) as of July 31, 20164 | | | | | | | | | | | | | | |
| | | Class A | | Administrator Class | | Premier Class* | | Service Class | | Sweep Class | | | | |
7-day current yield | | 0.01 | | 0.15 | | 0.24 | | 0.01 | | 0.01 | | | | |
7-day compound yield | | 0.01 | | 0.15 | | 0.24 | | 0.01 | | 0.01 | | | | |
30-day simple yield | | 0.01 | | 0.12 | | 0.22 | | 0.01 | | 0.01 | | | | |
30-day compound yield | | 0.01 | | 0.12 | | 0.22 | | 0.01 | | 0.01 | | | | |
* Effective April 1, 2016, Institutional Class was renamed Premier Class.
Figures quoted represent past performance, which is no guarantee of future results, and do not reflect taxes that a shareholder may pay on fund distributions or the redemption of fund shares. Investment returns will fluctuate. The Fund’s yield figures more closely reflect the current earnings of the Fund than the total return figures. Current performance may be lower or higher than the performance data quoted, which assumes the reinvestment of dividends and capital gains. Current month-end performance is available on the Fund’s website, wellsfargofunds.com.
Each class is sold without a front-end sales charge or contingent deferred sales charge.
An investment in a money market fund is not insured or guaranteed by the Federal Deposit Insurance Corporation or any other government agency. Although the Fund seeks to preserve the value of your investment at $1.00 per share, it is possible to lose money by investing in a money market fund. A portion of the Fund’s income may be subject to federal, state, and/or local income taxes or the alternative minimum tax (AMT).
Please see footnotes on page 4.
| | | | |
| Performance highlights (unaudited) | | Wells Fargo California Municipal Money Market Fund | | 3 |
| | | | | | | | | | | | | | | | | | |
| Revenue source distribution as of July 31, 20165 | | | | | | | | | | Effective maturity distribution as of July 31, 20165 | | | |
| | Airport Revenue | | | 2% | | | | | | | 2-7 days | | | 98% | | | |
| | | Education Revenue | | | 5% | | | | | | | 15-29 days | | | 2% | | | |
| | | General Obligation Revenue | | | 10% | | | | | | | | | | | | | |
| | | Health Revenue | | | 8% | | | | | | | | | | | | | |
| | | Housing Revenue | | | 17% | | | | | | | | | | | | | |
| | | Industrial Development Revenue | | | 3% | | | | | | | | | | | | | |
| | | Miscellaneous Revenue | | | 12% | | | | | | | | | | | | | |
| | | Resource Recovery Revenue | | | 3% | | | | | | | | | | | | | |
| | | Tax Revenue | | | 5% | | | | | | | | | | | | | |
| | | Transportation Revenue | | | 5% | | | | | | | | | | | | | |
| | | Utilities Revenue | | | 20% | | | | | | | | | | | | | |
| | | Water & Sewer Revenue | | | 10% | | | | | | | | | | | | | |
| | | | | |
Weighted average maturity as of July 31, 20166 | | | | | | | | | | | | | | | | |
| | | 6 days | | | | | | | | | | | | | |
| | | | | |
Weighted average life as of July 31, 20167 | | | | | | | | | | | | | | | | |
| | | 6 days | | | | | | | | | | | | | |
| 1 | Please see the Fund’s current Statement of Additional Information for further details. |
| 2 | Historical performance shown for Administrator Class shares prior to their inception reflects the performance of Premier Class shares, and has not been adjusted to reflect higher expenses applicable to Administrator Class shares. If these expenses had been adjusted, returns would be lower. Historical performance shown for Premier Class shares prior to their inception reflects the performance of Service Class shares, and includes the higher expenses applicable to Service Class shares. If these expenses had not been included, returns would be higher. Historical performance shown for Sweep Class shares prior to their inception reflects the performance of Service Class shares, and has not been adjusted to reflect the higher expenses applicable to Sweep Class shares. If these expenses had been adjusted, returns would be lower. |
| 3 | Reflects the expense ratios as stated in the most recent prospectuses. The expense ratios shown are subject to change and may differ from the annualized expense ratios shown in the financial highlights of this report. |
| 4 | The manager has contractually committed through May 31, 2017, to waive fees and/or reimburse expenses to the extent necessary to cap the Fund’s Total Annual Fund Operating Expenses After Fee Waiver at 0.65% for Class A, 0.30% for Administrator Class, 0.20% for Premier Class, 0.45% for Service Class, and 1.00% for Sweep Class. After this time, the cap may be increased or the commitment to maintain the cap may be terminated only with the approval of the Board of Trustees. Brokerage commissions, stamp duty fees, interest, taxes, acquired fund fees and expenses, and extraordinary expenses are excluded from the cap. Without this cap, the Fund’s returns would have been lower. Without waived fees and/or reimbursed expenses, the Fund’s 7-day current yield would have been (0.19)%, 0.08%, 0.20%, (0.09)%, and (0.54)% for Class A, Administrator Class, Premier Class, Service Class, and Sweep Class, respectively. |
| 5 | Amounts are calculated based on the total investments of the Fund. These amounts are subject to change and may have changed since the date specified. |
| 6 | Weighted Average Maturity (WAM): WAM is an average of the effective maturities of all securities held in the portfolio, weighted by each security’s percentage of total investments. The maturity of a portfolio security is the period remaining until the date on which the principal amount is unconditionally required to be paid, or in the case of a security called for redemption, the date on which the redemption payment is unconditionally required to be made. WAM calculations allow for the maturities of certain securities with demand features or periodic interest rate resets to be shortened. WAM is a way to measure a fund’s sensitivity to potential interest rate changes. Rule 2a-7 under the Investment Company Act of 1940 requires money market funds to maintain a WAM of 60 calendar days or less. WAM is subject to change and may have changed since the date specified. |
| 7 | Weighted Average Life (WAL): WAL is an average of the final maturities of all securities held in the portfolio, weighted by their percentage of total investments. The maturity of a portfolio security is the period remaining until the date on which the principal amount is unconditionally required to be paid, or in the case of a security called for redemption, the date on which the redemption payment is unconditionally required to be made. In contrast to WAM, the calculation of WAL allows for the maturities of certain securities with demand features to be shortened, but not the periodic interest rate resets. WAL is a way to measure a fund’s potential sensitivity to credit spread changes. Rule 2a-7 under the Investment Company Act of 1940 requires money market funds to maintain a WAL of 120 calendar days or less. WAL is subject to change and may have changed since the date specified. |
| | | | |
| 4 | | Wells Fargo California Municipal Money Market Fund | | Fund expenses (unaudited) |
As a shareholder of the Fund, you incur ongoing costs, including management fees, distribution (12b-1) and/or shareholder servicing fees, and other Fund expenses. This example is intended to help you understand your ongoing costs (in dollars) of investing in the Fund and to compare these costs with the ongoing costs of investing in other mutual funds.
The example is based on an investment of $1,000 invested at the beginning of the six-month period and held for the entire period from February 1, 2016 to July 31, 2016.
Actual Expenses
The “Actual” line of the table below provides information about actual account values and actual expenses. You may use the information in this line, together with the amount you invested, to estimate the expenses that you paid over the period. Simply divide your account value by $1,000 (for example, an $8,600 $8,600 account value divided by $1,000 = 8.6), then multiply the result by the number in the “Actual” line under the heading entitled “Expenses paid during period” for your applicable class of shares to estimate the expenses you paid on your account during this period.
Hypothetical Example for Comparison Purposes
The “Hypothetical” line of the table below provides information about hypothetical account values and hypothetical expenses based on the Fund’s actual expense ratio and an assumed rate of return of 5% per year before expenses, which is not the Fund’s actual return. The hypothetical account values and expenses may not be used to estimate the actual ending balance or expenses you paid for the period. You may use this information to compare the ongoing costs of investing in the Fund and other funds. To do so, compare this 5% hypothetical example with the 5% hypothetical examples that appear in the shareholder reports of the other funds.
Please note that the expenses shown in the table are meant to highlight your ongoing costs only and do not reflect any transactional costs, such as sakes charges (loads) and contingent deferred sales charges. Therefore, the “Hypothetical” line of the table is useful in comparing ongoing costs only and will not help you determine the relative total costs of owning different funds. In addition, if these transactional costs were included, your cost would have been higher.
| | | | | | | | | | | | | | | | |
| | | Beginning account | | | Ending | | | Expenses | | | | |
| | | value | | | account value | | | paid during | | | Annualized net | |
| | | 2-1-2016 | | | 7-31-2016 | | | the period¹ | | | expense ratio | |
Class A | | | | | | | | | | | | | | | | |
Actual | | | $1,000.00 | | | | $1,000.05 | | | | $1.60 | | | | 0.32% | |
Hypothetical (5% return before expenses) | | | $1,000.00 | | | | $1,023.34 | | | | $1.61 | | | | 0.32% | |
Administrator Class | | | | | | | | | | | | | | | | |
Actual | | | $1,000.00 | | | | $1,000.41 | | | | $1.20 | | | | 0.24% | |
Hypothetical (5% return before expenses) | | | $1,000.00 | | | | $1,023.73 | | | | $1.21 | | | | 0.24% | |
Institutional Class | | | | | | | | | | | | | | | | |
Actual | | | $1,000.00 | | | | $1,000.77 | | | | $0.85 | | | | 0.17% | |
Hypothetical (5% return before expenses) | | | $1,000.00 | | | | $1,024.08 | | | | $0.86 | | | | 0.17% | |
Service Class | | | | | | | | | | | | | | | | |
Actual | | | $1,000.00 | | | | $1,000.05 | | | | $1.45 | | | | 0.29% | |
Hypothetical (5% return before expenses) | | | $1,000.00 | | | | $1,023.49 | | | | $1.46 | | | | 0.29% | |
Sweep Class | | | | | | | | | | | | | | | | |
Actual | | | $1,000.00 | | | | $1,000.04 | | | | $1.60 | | | | 0.32% | |
Hypothetical (5% return before expenses) | | | $1,000.00 | | | | $1,023.34 | | | | $1.61 | | | | 0.32% | |
| 1 | Expenses paid is equal to the annualized net expense ratio of each class multiplied by the average account value over the period, multiplied by the number of days in the most recent fiscal half-year divided by the number of days in the fiscal year (to reflect the one-half-year period). |
| | | | |
| Portfolio of investments — July 31, 2016 (unaudited) | | Wells Fargo California Municipal Money Market Fund | | 5 |
| | | | | | | | | | | | | | | | | | | | |
Security name | | Interest rate | | Maturity date | | Principal | | Value |
| | | | |
Municipal Obligations : 87.90% | | | | | | | | | | | | | | | | | |
| | | | |
California : 87.90% | | | | | | | | | | | | | | | | | |
| | | | |
Other Municipal Debt : 3.44% | | | | | | | | | | | | | | | | | |
California GO Series A2 (GO Revenue) | | | | 0.43 | % | | 8-3-2016 | | | $ | 14,000,000 | | | | $ | 14,000,000 | |
Los Angeles County CA Capital Asset Leasing Corporation Series B- TE (Housing Revenue) | | | | 0.42 | | | 8-15-2016 | | | | 15,000,000 | | | | | 15,000,000 | |
Los Angeles County CA Metropolitan Transportation Authority Series A (Transportation Revenue) | | | | 0.43 | | | 8-4-2016 | | | | 5,000,000 | | | | | 5,000,000 | |
San Jose CA Unified School District Santa Clara County Election of 2002 Series C (GO Revenue, National Insured) | | | | 5.00 | | | 8-1-2017 | | | | 1,295,000 | | | | | 1,295,000 | |
| | | | |
| | | | | | | | | | | | | | | | 35,295,000 | |
| | | | | | | | | | | | | | | | | | |
| | | | |
Variable Rate Demand Notes ø: 84.46% | | | | | | | | | | | | | | | | | |
Association of Bay Area Governments Finance Authority for Nonprofit Corporation California Menlo School (Education Revenue, Northern Trust Company LOC) | | | | 0.45 | | | 9-1-2033 | | | | 11,400,000 | | | | | 11,400,000 | |
Association of Bay Area Governments Finance Authority for Nonprofit Corporation California MFHR Fine Arts Building Projects Series A (Housing Revenue, FNMA Insured, FNMA LIQ) | | | | 0.52 | | | 7-15-2035 | | | | 6,100,000 | | | | | 6,100,000 | |
Association of Bay Area Governments Finance Authority for Nonprofit Corporation California San Francisco University High School Series A (Education Revenue, Northern Trust Company LOC) | | | | 0.45 | | | 4-1-2036 | | | | 5,895,000 | | | | | 5,895,000 | |
Bakersfield CA Waste Water Tender Option Bond Trust Receipts/Certificates Series XM0076 (Water & Sewer Revenue, AGM Insured, Bank of America NA LIQ) 144A | | | | 0.60 | | | 9-15-2032 | | | | 10,630,000 | | | | | 10,630,000 | |
Burbank CA Unified School District Series 2013 ROC RR II R-14055 (GO Revenue, Citibank NA LIQ) 144A | | | | 0.46 | | | 2-1-2021 | | | | 5,520,000 | | | | | 5,520,000 | |
California Alternative Energy Source Financing Authority GE Capital Corporation Series A (Utilities Revenue) | | | | 0.45 | | | 10-1-2020 | | | | 25,330,000 | | | | | 25,330,000 | |
California CDA Charter Court Apartments Series L (Housing Revenue, FHLMC LIQ) | | | | 0.52 | | | 9-1-2040 | | | | 3,555,000 | | | | | 3,555,000 | |
California CDA MFHR Desert Palms Series A (Housing Revenue, FHLMC LOC) | | | | 0.52 | | | 8-1-2045 | | | | 7,000,000 | | | | | 7,000,000 | |
California CDA MFHR Granite Oaks Apartments Series R (Housing Revenue, FNMA Insured, FNMA LIQ) | | | | 0.46 | | | 10-15-2030 | | | | 3,985,000 | | | | | 3,985,000 | |
California CDA MFHR Imperial Park Apartments Series OO (Housing Revenue, FHLMC LOC) | | | | 0.50 | | | 11-1-2040 | | | | 6,620,000 | | | | | 6,620,000 | |
California CDA Motion Picture & Television Fund Series A (Health Revenue, Northern Trust Company LOC) | | | | 0.54 | | | 3-1-2031 | | | | 20,450,000 | | | | | 20,450,000 | |
California CDA Oakmont Senior Living Series Y (Housing Revenue, FNMA Insured, FNMA LIQ) | | | | 0.46 | | | 8-1-2031 | | | | 9,100,000 | | | | | 9,100,000 | |
California CDA Seasons Senior Apartments Series B (Housing Revenue, FNMA Insured, FNMA LIQ) | | | | 0.46 | | | 5-15-2037 | | | | 5,265,000 | | | | | 5,265,000 | |
California CDA Sutter Health Series A (Health Revenue, Ambac Insured, Credit Suisse LIQ) 144A | | | | 0.47 | | | 8-15-2038 | | | | 6,000,000 | | | | | 6,000,000 | |
California CDA Sutter Health Series B (Health Revenue, Credit Suisse LIQ) 144A | | | | 0.47 | | | 11-15-2048 | | | | 13,713,253 | | | | | 13,713,253 | |
California Enterprise Development Authority Pocino Foods Company Project Series A (Industrial Development Revenue, City National Bank LOC) | | | | 0.47 | | | 11-1-2033 | | | | 7,550,000 | | | | | 7,550,000 | |
California GO Kindergarten Series A2 (GO Revenue, State Street Bank & Trust Company LOC) | | | | 0.32 | | | 5-1-2034 | | | | 12,655,000 | | | | | 12,655,000 | |
California HFA Series 3206 (Housing Revenue, Morgan Stanley Bank LIQ) 144A | | | | 0.67 | | | 8-1-2037 | | | | 13,695,000 | | | | | 13,695,000 | |
California HFFA City of Hope Series B (Health Revenue) | | | | 0.43 | | | 11-15-2042 | | | | 14,450,000 | | | | | 14,450,000 | |
California HFFA St. Joseph Health System Series B (Health Revenue, U.S. Bank NA LOC) | | | | 0.38 | | | 7-1-2041 | | | | 3,100,000 | | | | | 3,100,000 | |
California HFFA Tender Option Bond Trust Receipts/Certificates Series XF0236 (Health Revenue, TD Bank NA LIQ) 144A | | | | 0.47 | | | 8-15-2031 | | | | 9,500,000 | | | | | 9,500,000 | |
California Infrastructure & Economic Development Bank Pacific Gas & Electric Company Series A (Utilities Revenue, Union Bank NA LOC) | | | | 0.39 | | | 11-1-2026 | | | | 19,700,000 | | | | | 19,700,000 | |
The accompanying notes are an integral part of these financial statements.
| | | | |
| 6 | | Wells Fargo California Municipal Money Market Fund | | Portfolio of investments — July 31, 2016 (unaudited) |
| | | | | | | | | | | | | | | | | | | | |
Security name | | Interest rate | | Maturity date | | Principal | | Value |
| | | | |
Variable Rate Demand Notes ø(continued) | | | | | | | | | | | | | | | | | | | | |
| | | | |
California Infrastructure & Economic Development Bank Pacific Gas & Electric Company Series B (Utilities Revenue, Union Bank NA LOC) | | | | 0.39 | % | | | | 11-1-2026 | | | | $ | 7,635,000 | | | | $ | 7,635,000 | |
California Infrastructure & Economic Development Bank ROC RR-II-R- 11527 (Transportation Revenue, Ambac Insured, Citibank NA LIQ) 144A | | | | 0.46 | | | | | 7-1-2030 | | | | | 9,900,000 | | | | | 9,900,000 | |
California Infrastructure & Economic Development Bank Saddleback Valley Christian Schools Project Series A (Miscellaneous Revenue, East West Bank LOC) 144A | | | | 0.46 | | | | | 12-1-2040 | | | | | 14,250,000 | | | | | 14,250,000 | |
California Municipal Finance Authority Chevron USA Recovery Zone Project Series A (Industrial Development Revenue) | | | | 0.26 | | | | | 11-1-2035 | | | | | 9,525,000 | | | | | 9,525,000 | |
California Municipal Finance Authority High Desert Partnership (Education Revenue, Union Bank NA LOC) | | | | 0.50 | | | | | 4-1-2042 | | | | | 1,240,000 | | | | | 1,240,000 | |
California PCFA Exempt Facilities Exxon Mobil Project (Industrial Development Revenue) | | | | 0.34 | | | | | 12-1-2029 | | | | | 8,995,000 | | | | | 8,995,000 | |
California PCFA Pacific Gas & Electric Project Series B (Utilities Revenue, Canadian Imperial Bank LOC) | | | | 0.41 | | | | | 11-1-2026 | | | | | 22,600,000 | | | | | 22,600,000 | |
California PCFA Pacific Gas & Electric Project Series C (Utilities Revenue, Mizuho Bank Limited LOC) | | | | 0.41 | | | | | 11-1-2026 | | | | | 8,000,000 | | | | | 8,000,000 | |
California PCFA Pacific Gas & Electric Project Series E (Utilities Revenue, Sumitomo Mitsui Banking LOC) | | | | 0.36 | | | | | 11-1-2026 | | | | | 19,190,000 | | | | | 19,190,000 | |
California PCFA Solid Waste John B. & Ann M. Verwey Project (Resource Recovery Revenue, CoBank LOC) | | | | 0.50 | | | | | 5-1-2028 | | | | | 3,400,000 | | | | | 3,400,000 | |
California PCFA Solid Waste Milk Time Dairy Farms Project (Resource Recovery Revenue, CoBank LOC) | | | | 0.53 | | | | | 11-1-2027 | | | | | 6,000,000 | | | | | 6,000,000 | |
California PCFA Solid Waste Milk Time Dairy Farms Project (Resource Recovery Revenue, Rabobank LOC) | | | | 0.54 | | | | | 11-1-2027 | | | | | 1,400,000 | | | | | 1,400,000 | |
California PCFA Waste Connection Incorporated Project (Resource Recovery Revenue, Bank of America NA LOC) | | | | 0.53 | | | | | 8-1-2018 | | | | | 10,100,000 | | | | | 10,100,000 | |
California Series B3 (GO Revenue, Citibank NA LOC) | | | | 0.30 | | | | | 5-1-2034 | | | | | 11,900,000 | | | | | 11,900,000 | |
California Statewide CDA PCR Chevron USA Incorporated Project (Resource Recovery Revenue) | | | | 0.26 | | | | | 5-15-2024 | | | | | 10,400,000 | | | | | 10,400,000 | |
California Statewide Communities Concord Green Apartments Project (Housing Revenue, East West Bank LOC) | | | | 0.52 | | | | | 6-1-2028 | | | | | 8,700,000 | | | | | 8,700,000 | |
California Tender Option Bond Trust Receipts/Certificates Series XF0279 (GO Revenue, State Street Bank & Trust Company LIQ) 144A | | | | 0.46 | | | | | 7-1-2042 | | | | | 10,000,000 | | | | | 10,000,000 | |
California Tender Option Bond Trust Receipts/Certificates Series XM0147 (Education Revenue, Morgan Stanley Bank LIQ) 144A | | | | 0.48 | | | | | 1-1-2039 | | | | | 10,000,000 | | | | | 10,000,000 | |
California Tender Option Bond Trust Receipts/Certificates Series ZF0261 (Water & Sewer Revenue, TD Bank NA LIQ) 144A | | | | 0.47 | | | | | 11-1-2039 | | | | | 7,850,000 | | | | | 7,850,000 | |
California Tender Option Bond Trust Receipts/Certificates Series ZF0300 (Education Revenue, AGM Insured, JPMorgan Chase & Company LIQ) 144A | | | | 0.52 | | | | | 5-1-2030 | | | | | 4,775,000 | | | | | 4,775,000 | |
California Tender Option Bond Trust Receipts/Certificates Series ZF0323 (GO Revenue, JPMorgan Chase & Company LIQ) 144A | | | | 0.56 | | | | | 2-1-2019 | | | | | 5,340,000 | | | | | 5,340,000 | |
California University Systemwide Series A (Education Revenue, AGM Insured, Bank of America NA LIQ) 144A | | | | 0.56 | | | | | 11-1-2033 | | | | | 5,685,000 | | | | | 5,685,000 | |
Elsinore Valley CA Municipal Water District Series A Eclipse Funding Trust Solar Eclipse 2007-0069 (Miscellaneous Revenue, U.S. Bank NA LOC, U.S. Bank NA LIQ) 144A | | | | 0.51 | | | | | 7-1-2034 | | | | | 25,550,000 | | | | | 25,550,000 | |
Irvine CA Improvement Bond Act of 1915 Assessment District #03-19 Series B (Miscellaneous Revenue, U.S. Bank NA LOC) | | | | 0.35 | | | | | 9-2-2029 | | | | | 10,900,000 | | | | | 10,900,000 | |
Irvine CA Improvement Bond Act of 1915 Reassessment District #04- 20 Series A (Miscellaneous Revenue, Sumitomo Mitsui Banking LOC) | | | | 0.47 | | | | | 9-2-2050 | | | | | 21,600,000 | | | | | 21,600,000 | |
Irvine CA Improvement Bond Act of 1915 Reassessment District #05- 21 Series A (Miscellaneous Revenue, U.S. Bank NA LOC) 144A | | | | 0.35 | | | | | 9-2-2050 | | | | | 13,844,000 | | | | | 13,844,000 | |
Irvine CA Improvement Bond Act of 1915 Reassessment District #87-8 (Miscellaneous Revenue, State Street Bank & Trust Company LOC) | | | | 0.35 | | | | | 9-2-2024 | | | | | 100,000 | | | | | 100,000 | |
Irvine CA Improvement Bond Act of 1915 Reassessment District #97- 17 (Miscellaneous Revenue, State Street Bank & Trust Company LOC) | | | | 0.35 | | | | | 9-2-2023 | | | | | 21,800,000 | | | | | 21,800,000 | |
Irvine Ranch CA Water District Series A (Water & Sewer Revenue, U.S. Bank NA LOC) | | | | 0.34 | | | | | 10-1-2041 | | | | | 4,500,000 | | | | | 4,500,000 | |
JPMorgan Chase PUTTER/DRIVER Trust Series 3841 (Transportation Revenue, Ambac Insured, JPMorgan Chase & Company LIQ) 144A | | | | 0.47 | | | | | 7-1-2024 | | | | | 31,735,000 | | | | | 31,735,000 | |
JPMorgan Chase PUTTER/DRIVER Trust Series 4414 (Airport Revenue, JPMorgan Chase & Company LIQ) 144A | | | | 0.47 | | | | | 5-15-2021 | | | | | 5,000,000 | | | | | 5,000,000 | |
The accompanying notes are an integral part of these financial statements.
| | | | |
| Portfolio of investments — July 31, 2016 (unaudited) | | Wells Fargo California Municipal Money Market Fund | | 7 |
| | | | | | | | | | | | | | | | | | | | |
Security name | | Interest rate | | Maturity date | | Principal | | Value |
| | | | |
Variable Rate Demand Notes ø(continued) | | | | | | | | | | | | | | | | | | | | |
| | | | |
Los Angeles CA Certificate of Participation Samuel A. Fryer Yavney Series A (Education Revenue, California Bank & Trust LOC) | | | | 0.44 | % | | | | 8-1-2038 | | | | $ | 7,150,000 | | | | $ | 7,150,000 | |
Los Angeles CA IDA Megatoys Project (Industrial Development Revenue, East West Bank LOC) | | | | 0.50 | | | | | 7-1-2031 | | | | | 3,000,000 | | | | | 3,000,000 | |
Los Angeles CA Tender Option Bond Trust Receipts/Certificates Series XF0041 (Airport Revenue, JPMorgan Chase & Company LIQ) 144A | | | | 0.52 | | | | | 11-15-2025 | | | | | 8,000,000 | | | | | 8,000,000 | |
Los Angeles CA Tender Option Bond Trust Receipts/Certificates Series ZF0158 (Airport Revenue, JPMorgan Chase & Company LIQ) 144A | | | | 0.52 | | | | | 8-1-2022 | | | | | 3,060,000 | | | | | 3,060,000 | |
Manteca CA RDA Amended Merger Project (Tax Revenue, State Street Bank & Trust Company LOC) | | | | 0.35 | | | | | 10-1-2042 | | | | | 9,915,000 | | | | | 9,915,000 | |
Modesto CA MFHR Live Oak Apartments Project (Housing Revenue, FNMA Insured, FNMA LIQ) | | | | 0.52 | | | | | 9-15-2024 | | | | | 3,875,000 | | | | | 3,875,000 | |
Northern California Power Agency Hydroelectric Project Series A (Utilities Revenue, Bank of Montreal LOC) | | | | 0.41 | | | | | 7-1-2032 | | | | | 24,200,000 | | | | | 24,200,000 | |
Orange County CA Water District Series A (Water & Sewer Revenue, Citibank NA LOC) | | | | 0.43 | | | | | 8-1-2042 | | | | | 20,550,000 | | | | | 20,550,000 | |
Sacramento CA Housing Authority Lofts at Natomas Apartments Series F (Housing Revenue, FNMA Insured, FNMA LIQ) | | | | 0.46 | | | | | 6-15-2036 | | | | | 5,190,000 | | | | | 5,190,000 | |
Sacramento CA MUD Tender Option Bond Trust Receipts/Certificates Series XM0067 (Utilities Revenue, Bank of America NA LIQ) 144A | | | | 0.75 | | | | | 8-15-2026 | | | | | 9,970,000 | | | | | 9,970,000 | |
Sacramento County CA Housing Authority Logan Park Apartments Series E (Housing Revenue, FHLMC LOC) | | | | 0.52 | | | | | 5-1-2042 | | | | | 10,000,000 | | | | | 10,000,000 | |
Sacramento County CA Housing Authority MFHR Cascades Series D (Housing Revenue, FNMA Insured, FNMA LIQ) | | | | 0.46 | | | | | 9-15-2035 | | | | | 6,535,000 | | | | | 6,535,000 | |
Sacramento County CA Housing Authority Shenandoah Apartments Series F (Housing Revenue, FNMA Insured, FNMA LIQ) | | | | 0.46 | | | | | 9-15-2036 | | | | | 5,205,000 | | | | | 5,205,000 | |
Sacramento County CA Sanitation Districts Financing Authority PUTTER Series 2821 (Water & Sewer Revenue, AGM/FGIC Insured, JPMorgan Chase & Company LIQ) 144A | | | | 0.51 | | | | | 3-1-2026 | | | | | 6,620,000 | | | | | 6,620,000 | |
San Diego CA Community College District Tender Option Bond Trust Receipts/Certificates Series XM0290 (GO Revenue, Royal Bank of Canada LIQ) 144A | | | | 0.46 | | | | | 8-1-2019 | | | | | 11,000,000 | | | | | 11,000,000 | |
San Diego County CA Regional Transportation Commission Limited Tax Series A (Tax Revenue, JPMorgan Chase & Company SPA) | | | | 0.43 | | | | | 4-1-2038 | | | | | 18,000,000 | | | | | 18,000,000 | |
San Diego County CA Regional Transportation Commission Limited Tax Series C (Tax Revenue, Mizuho Corporate Bank SPA) | | | | 0.43 | | | | | 4-1-2038 | | | | | 13,400,000 | | | | | 13,400,000 | |
San Francisco CA City & County RDA Orlando Cepeda Place Series D (Housing Revenue, Citibank NA LOC) | | | | 0.50 | | | | | 11-1-2033 | | | | | 5,825,000 | | | | | 5,825,000 | |
San Francisco CA Tender Option Bond Trust Receipts/Certificates Series XF0226 (Water & Sewer Revenue, State Street Bank & Trust Company LIQ) 144A | | | | 0.47 | | | | | 11-1-2043 | | | | | 4,130,000 | | | | | 4,130,000 | |
San Francisco CA Tender Option Bond Trust Receipts/Certificates Series XM0237 (Water & Sewer Revenue, Bank of America NA LIQ) 144A | | | | 0.46 | | | | | 11-1-2036 | | | | | 8,500,000 | | | | | 8,500,000 | |
San Francisco City & County CA Public Utilities Commission Series 3153X (Water & Sewer Revenue, Morgan Stanley Bank LIQ) 144A | | | | 0.47 | | | | | 11-1-2039 | | | | | 1,509,500 | | | | | 1,509,500 | |
San Francisco City & County CA RDA Fillmore Center 1999 Issue B1 (Housing Revenue, FHLMC LIQ) | | | | 0.47 | | | | | 12-1-2017 | | | | | 27,500,000 | | | | | 27,500,000 | |
San Joaquin CA Delta Community College Tender Option Bond Trust Receipts/Certificates Series ZF0180 (GO Revenue, JPMorgan Chase & Company LIQ) 144A | | | | 0.54 | | | | | 8-1-2022 | | | | | 2,415,000 | | | | | 2,415,000 | |
San Jose CA MFHR Raintree Apartments Series A (Housing Revenue, FHLMC LIQ) | | | | 0.52 | | | | | 2-1-2038 | | | | | 10,600,000 | | | | | 10,600,000 | |
San Jose CA Turnleaf Apartments Series A (Housing Revenue, FHLMC LIQ) | | | | 0.47 | | | | | 6-1-2036 | | | | | 4,230,000 | | | | | 4,230,000 | |
San Luis Obispo County CA Community College District Series ZF2097 (GO Revenue, Morgan Stanley Bank LIQ) 144A | | | | 0.50 | | | | | 8-1-2040 | | | | | 3,290,000 | | | | | 3,290,000 | |
San Luis Obispo County CA Community College District Series ZF2098 (GO Revenue, Morgan Stanley Bank LIQ) 144A | | | | 0.50 | | | | | 8-1-2040 | | | | | 3,290,000 | | | | | 3,290,000 | |
The accompanying notes are an integral part of these financial statements.
| | | | |
| 8 | | Wells Fargo California Municipal Money Market Fund | | Portfolio of investments — July 31, 2016 (unaudited) |
| | | | | | | | | | | | | | | | | | | | | | | | | |
Security name | | | | Interest rate | | Maturity date | | Principal | | Value |
| | | | | |
Variable Rate Demand Notes ø(continued) | | | | | | | | | | | | | | | | | | | | | | | | | |
| | | | | |
San Luis Obispo County CA Financing Authority Series 3030 Nacimiento Water Project Series A (Water & Sewer Revenue, BHAC/MBIA Insured, Morgan Stanley Bank LIQ) 144A | | | | | | | | | 0.47 | % | | | | 9-1-2038 | | | | $ | 23,570,000 | | | | $ | 23,570,000 | |
San Marcos CA Unified School District Series 3269 (GO Revenue, Morgan Stanley Bank LIQ) 144A | | | | | | | | | 0.47 | | | | | 8-1-2031 | | | | | 5,000,000 | | | | | 5,000,000 | |
Santa Clara County CA Refunding Bond Sub Series B (Utilities Revenue, Bank of Tokyo-Mitsubishi LOC) | | | | | | | | | 0.43 | | | | | 7-1-2027 | | | | | 25,500,000 | | | | | 25,500,000 | |
Southern California Public Power Authority Magnolia Power Project Series 1A (Utilities Revenue, U.S. Bank NA LOC) | | | | | | | | | 0.43 | | | | | 7-1-2036 | | | | | 14,900,000 | | | | | 14,900,000 | |
Tahoe Forest California Hospital District (Health Revenue, U.S. Bank NA LOC) | | | | | | | | | 0.35 | | | | | 7-1-2033 | | | | | 2,030,000 | | | | | 2,030,000 | |
Ventura County CA Community College District Series 2015 PUTTER Series XF0138 (GO Revenue, JPMorgan Chase & Company LIQ) 144A | | | | | | | | | 0.47 | | | | | 2-1-2023 | | | | | 6,000,000 | | | | | 6,000,000 | |
| | | | | |
| | | | | | | | | | | | | | | | | | | | | | | | 867,086,753 | |
| | | | | | | | | | | | | | | | | | | | | | | | | |
| | | | | |
Total Municipal Obligations (Cost $902,381,753) | | | | | | | | | | | | | | | | | | | | | | | | 902,381,753 | |
| | | | | | | | | | | | | | | | | | | | | | | | | |
| | | | | |
Other : 1.46% | | | | | | | | | | | | | | | | | | | | | | | | | |
Nuveen California Dividend Advantage Municipal Fund Variable Rate Demand Preferred Shares Series 3 (Deutsche Bank LIQ) ±§144A | | | | | | | | | 0.56 | | | | | 3-1-2040 | | | | | 6,000,000 | | | | | 6,000,000 | |
Nuveen California Dividend Advantage Municipal Fund Variable Rate Demand Preferred Shares Series 5 (Citibank NA LIQ) ±§144A | | | | | | | | | 0.62 | | | | | 8-1-2040 | | | | | 9,000,000 | | | | | 9,000,000 | |
| | | | | |
Total Other (Cost $15,000,000) | | | | | | | | | | | | | | | | | | | | | | | | 15,000,000 | |
| | | | | | | | | | | | | | | | | | | | | | | | | |
| | | | | |
Repurchase Agreements : 3.60% | | | | | | | | | | | | | | | | | | | | | | | | | |
Societe Generale, dated 7-29-2016, maturity value $37,001,018 ^^ | | | | | | | | | 0.33 | | | | | 8-1-2016 | | | | | 37,000,000 | | | | | 37,000,000 | |
| | | | | | | | | | | | | | | | | | | | | | | | | |
| | | | | |
Total Repurchase Agreements (Cost $37,000,000) | | | | | | | | | | | | | | | | | | | | | | | | 37,000,000 | |
| | | | | | | | | | | | | | | | | | | | | | | | | |
| | | | | |
Total investments in securities (Cost $954,381,753)* | | | | 92.96 | % | | | | | | | | | | | | | | | | | | | 954,381,753 | |
| | | | | |
| Other assets and liabilities, net | | | | 7.04 | | | | | | | | | | | | | | | | | | | | 72,297,455 | |
| | | | | | | | | | | | | | | | | | | | | | | | | |
| | | | | |
Total net assets | | | | 100.00 | % | | | | | | | | | | | | | | | | | | $ | 1,026,679,208 | |
| | | | | | | | | | | | | | | | | | | | | | | | | |
| ø | Variable rate demand notes are subject to a demand feature which reduces the effective maturity. The maturity date shown represents the final maturity date of the security. The interest rate is determined and reset by the issuer daily, weekly, or monthly depending upon the terms of the security. The rate shown is the rate in effect at period end. |
| 144A | The security may be resold in transactions exempt from registration, normally to qualified institutional buyers, pursuant to Rule 144A under the Securities Act of 1933. |
| ± | Variable rate investment. The rate shown is the rate in effect at period end. |
| § | The security is subject to a demand feature which reduces the effective maturity. |
| ^^ | Collateralized by U.S. government securities, 0.00% to 8.13%, 7-31-2016 to 8-15-2045, fair value including accrued interest is $37,740,000. |
| * | Cost for federal income tax purposes is substantially the same as for financial reporting purposes. |
| The | accompanying notes are an integral part of these financial statements. |
| | | | |
| Statement of assets and liabilities–July 31, 2016 (unaudited) | | Wells Fargo California Municipal Money Market Fund | | 9 |
| | | | |
Assets | | | | |
Investments in unaffiliated securities, at amortized cost | | $ | 954,381,753 | |
Cash | | | 46,386 | |
Receivable for investments sold | | | 72,052,910 | |
Receivable for Fund shares sold | | | 32 | |
Receivable for interest | | | 602,720 | |
Prepaid expenses and other assets | | | 29,195 | |
| | | | |
Total assets | | | 1,027,112,996 | |
| | | | |
| |
Liabilities | | | | |
Dividends payable | | | 101,175 | |
Payable for Fund shares redeemed | | | 4,696 | |
Management fee payable | | | 21,173 | |
Distribution fee payable | | | 16 | |
Administration fees payable | | | 119,473 | |
Custodian and accounting fees payable | | | 65,797 | |
Shareholder servicing fees payable | | | 94,913 | |
Accrued expenses and other liabilities | | | 26,545 | |
| | | | |
Total liabilities | | | 433,788 | |
| | | | |
Total net assets | | $ | 1,026,679,208 | |
| | | | |
| |
NET ASSETS CONSIST OF | | | | |
Paid-in capital | | $ | 1,026,565,426 | |
Overdistributed net investment income | | | (152) | |
Accumulated net realized gains on investments | | | 113,934 | |
| | | | |
Total net assets | | $ | 1,026,679,208 | |
| | | | |
| |
COMPUTATION OF NET ASSET VALUE PER SHARE | | | | |
Net assets - Class A | | $ | 423,791,696 | |
Shares outstanding - Class A1 | | | 423,739,999 | |
Net asset value per share - Class A | | $ | 1.00 | |
Net assets - Administrator Class | | $ | 50,128 | |
Shares outstanding - Administrator Class1 | | | 50,122 | |
Net asset value per share - Administrator Class | | $ | 1.00 | |
Net assets - Premier Class | | $ | 584,976,254 | |
Shares outstanding - Premier Class1 | | | 584,904,887 | |
Net asset value per share - Premier Class | | $ | 1.00 | |
Net assets - Service Class | | $ | 17,800,946 | |
Shares outstanding - Service Class1 | | | 17,798,773 | |
Net asset value per share - Service Class | | $ | 1.00 | |
Net assets - Sweep Class | | $ | 60,184 | |
Shares outstanding - Sweep Class1 | | | 60,176 | |
Net asset value per share - Sweep Class | | $ | 1.00 | |
| 1 | The Fund has an unlimited number of authorized shares. |
The accompanying notes are an integral part of these financial statements.
| | | | |
| 10 | | Wells Fargo California Municipal Money Market Fund | | Statement of operations–six months ended July 31, 2016 (unaudited) |
| | | | |
Investment income | | | | |
Interest | | $ | 1,783,674 | |
| | | | |
| |
Expenses | | | | |
Management fee | | | 842,874 | |
Administration fees | | | | |
Class A | | | 478,529 | |
Administrator Class | | | 25 | |
Premier Class1 | | | 257,879 | |
Service Class | | | 26,403 | |
Sweep Class | | | 57 | |
Shareholder servicing fees | | | | |
Class A | | | 543,784 | |
Administrator Class | | | 25 | |
Service Class | | | 54,252 | |
Sweep Class | | | 64 | |
Distribution fee | | | | |
Sweep Class | | | 92 | |
Custody and accounting fees | | | 29,505 | |
Professional fees | | | 22,800 | |
Registration fees | | | 15,919 | |
Shareholder report expenses | | | 8,807 | |
Trustees’ fees and expenses | | | 11,223 | |
Other fees and expenses | | | 9,558 | |
| | | | |
Total expenses | | | 2,301,796 | |
Less: Fee waivers and/or expense reimbursements | | | (1,006,501) | |
| | | | |
Net expenses | | | 1,295,295 | |
| | | | |
Net investment income | | | 488,379 | |
| | | | |
Net realized gains on investments | | | 64,784 | |
| | | | |
Net increase in net assets resulting from operations | | $ | 553,163 | |
| | | | |
| | 1 | Effective April 1, 2016, Institutional Class was renamed Premier Class. |
The accompanying notes are an integral part of these financial statements.
| | | | |
| Statement of changes in net assets | | Wells Fargo California Municipal Money Market Fund | | 11 |
| | | | | | | | | | | | | | | | |
| | | Six months ended | | | | | | | |
| | | July 31, 2016 | | | Year ended | |
| | | (unaudited) | | | January 31, 2016 | |
| |
Operations | | | | | | | | | | | | | | | | |
Net investment income | | | | | | $ | 488,379 | | | | | | | $ | 112,186 | |
Net realized gains on investments | | | | | | | 64,784 | | | | | | | | 311,774 | |
| | | | |
Net increase in net assets resulting from operations | | | | | | | 553,163 | | | | | | | | 423,960 | |
| | | | |
| | | | |
Distributions to shareholders from | | | | | | | | | | | | | | | | |
Net investment income | | | | | | | | | | | | | | | | |
Class A | | | | | | | (21,809) | | | | | | | | (45,318) | |
Administrator Class | | | | | | | (20) | | | | | | | | (8) | |
Premier Class1 | | | | | | | (464,282) | | | | | | | | (60,185) | |
Service Class | | | | | | | (2,266) | | | | | | | | (5,346) | |
Sweep Class | | | | | | | (2) | | | | | | | | (1,329) | |
Net realized gains | | | | | | | | | | | | | | | | |
Class A | | | | | | | 0 | | | | | | | | (113,446) | |
Administrator Class | | | | | | | 0 | | | | | | | | (12) | |
Premier Class1 | | | | | | | 0 | | | | | | | | (161,423) | |
Service Class | | | | | | | 0 | | | | | | | | (12,232) | |
Sweep Class | | | | | | | 0 | | | | | | | | (13) | |
| | | | |
Total distributions to shareholders | | | | | | | (488,379) | | | | | | | | (399,312) | |
| | | | |
| | | | |
| Capital share transactions | | Shares | | | | | | Shares | | | | |
Proceeds from shares sold | | | | | | | | | | | | | | | | |
Class A | | | 336,514,606 | | | | 336,514,606 | | | | 1,007,509,902 | | | | 1,007,509,902 | |
Premier Class1 | | | 1,023,709,350 | | | | 1,023,709,350 | | | | 1,768,363,722 | | | | 1,768,363,722 | |
Service Class | | | 22,749,250 | | | | 22,749,250 | | | | 49,450,855 | | | | 49,450,855 | |
Sweep Class | | | 8,248 | | | | 8,248 | | | | 50,005 | | | | 50,005 | |
| | | | |
| | | | | | | 1,382,981,454 | | | | | | | | 2,825,374,484 | |
| | | | |
Reinvestment of distributions | | | | | | | | | | | | | | | | |
Class A | | | 20,834 | | | | 20,834 | | | | 143,766 | | | | 143,766 | |
Administrator Class | | | 20 | | | | 20 | | | | 20 | | | | 20 | |
Premier Class1 | | | 27,762 | | | | 27,762 | | | | 31,668 | | | | 31,668 | |
Service Class | | | 912 | | | | 912 | | | | 7,910 | | | | 7,910 | |
Sweep Class | | | 2 | | | | 2 | | | | 1,342 | | | | 1,342 | |
| | | | |
| | | | | | | 49,530 | | | | | | | | 184,706 | |
| | | | |
Payment for shares redeemed | | | | | | | | | | | | | | | | |
Class A | | | (364,936,412) | | | | (364,936,412) | | | | (1,003,710,430) | | | | (1,003,710,430) | |
Administrator Class | | | 0 | | | | 0 | | | | (50,000) | | | | (50,000) | |
Premier Class1 | | | (1,122,674,906) | | | | (1,122,674,906) | | | | (1,755,840,961) | | | | (1,755,840,961) | |
Service Class | | | (58,632,138) | | | | (58,632,138) | | | | (52,339,853) | | | | (52,339,853) | |
Sweep Class | | | 0 | | | | 0 | | | | (25,562,208) | | | | (25,562,208) | |
| | | | |
| | | | | | | (1,546,243,456) | | | | | | | | (2,837,503,452) | |
| | | | |
Net decrease in net assets resulting from capital share transactions | | | | | | | (163,212,472) | | | | | | | | (11,944,262) | |
| | | | |
Total decrease in net assets | | | | | | | (163,147,688) | | | | | | | | (11,919,614) | |
| | | | |
| | | | |
Net assets | | | | | | | | | | | | | | | | |
Beginning of period | | | | | | | 1,189,826,896 | | | | | | | | 1,201,746,510 | |
| | | | |
End of period | | | | | | $ | 1,026,679,208 | | | | | | | $ | 1,189,826,896 | |
| | | | |
Overdistributed net investment income | | | | | | $ | (152) | | | | | | | $ | (152) | |
| | | | |
| | 1 | Effective April 1, 2016, Institutional Class was renamed Premier Class. |
The accompanying notes are an integral part of these financial statements.
| | | | |
| 12 | | Wells Fargo California Municipal Money Market Fund | | Financial highlights |
(For a share outstanding throughout each period)
| | | | | | | | | | | | | | | | | | | | | | | | | | |
| | | Six months ended
July 31, 2016 | | | Year ended January 31 | |
| CLASS A | | (unaudited) | | | 2016 | | | 2015 | | | 2014 | | | 2013 | | | 2012 | |
Net asset value, beginning of period | | | | | $1.00 | | | | $1.00 | | | | $1.00 | | | | $1.00 | | | | $1.00 | | | | $1.00 | |
Net investment income | | | | | 0.001 | | | | 0.001 | | | | 0.001 | | | | 0.001 | | | | 0.001 | | | | 0.001 | |
Net realized gains on investments | | | | | 0.001 | | | | 0.001 | | | | 0.001 | | | | 0.001 | | | | 0.001 | | | | 0.001 | |
| | | | | | | | | | | | | | | | | | | | | | | | | | |
Total from investment operations | | | | | 0.001 | | | | 0.001 | | | | 0.001 | | | | 0.001 | | | | 0.001 | | | | 0.001 | |
Distributions to shareholders from | | | | | | | | | | | | | | | | | | | | | | | | | | |
Net investment income | | | | | (0.00)1 | | | | (0.00)1 | | | | (0.00)1 | | | | (0.00)1 | | | | (0.00)1 | | | | (0.00)1 | |
Net realized gains | | | | | 0.00 | | | | (0.00)1 | | | | (0.00)1 | | | | (0.00)1 | | | | (0.00)1 | | | | (0.00)1 | |
| | | | | | | | | | | | | | | | | | | | | | | | | | |
Total distributions to shareholders | | | | | (0.00)1 | | | | (0.00)1 | | | | (0.00)1 | | | | (0.00)1 | | | | (0.00)1 | | | | (0.00)1 | |
Net asset value, end of period | | | | | $1.00 | | | | $1.00 | | | | $1.00 | | | | $1.00 | | | | $1.00 | | | | $1.00 | |
Total return2 | | | | | 0.00% | | | | 0.03% | | | | 0.02% | | | | 0.01% | | | | 0.02% | | | | 0.02% | |
Ratios to average net assets (annualized) | | | | | | | | | | | | | | | | | | | | | | | | | | |
Gross expenses | | | | | 0.64% | | | | 0.64% | | | | 0.63% | | | | 0.63% | | | | 0.64% | | | | 0.63% | |
Net expenses | | | | | 0.32% | | | | 0.07% | | | | 0.07% | | | | 0.10% | | | | 0.17% | | | | 0.16% | |
Net investment income | | | | | 0.01% | | | | 0.01% | | | | 0.01% | | | | 0.01% | | | | 0.01% | | | | 0.01% | |
Supplemental data | | | | | | | | | | | | | | | | | | | | | | | | | | |
Net assets, end of period (000s omitted) | | | | | $423,792 | | | | $452,174 | | | | $448,217 | | | | $649,144 | | | | $623,898 | | | | $1,128,321 | |
| | 1 | Amount is less than $0.005. |
| | 2 | Returns for periods of less than one year are not annualized. |
The accompanying notes are an integral part of these financial statements.
| | | | |
| Financial highlights | | Wells Fargo California Municipal Money Market Fund | | 13 |
(For a share outstanding throughout each period)
| | | | | | | | | | | | | | | | | | | | | | | | | | |
| | | Six months ended
July 31, 2016 | | | Year ended January 31 | |
| ADMINISTRATOR CLASS | | (unaudited) | | | 2016 | | | 2015 | | | 2014 | | | 2013 | | | 2012 | |
Net asset value, beginning of period | | | | | $1.00 | | | | $1.00 | | | | $1.00 | | | | $1.00 | | | | $1.00 | | | | $1.00 | |
Net investment income | | | | | 0.001 | | | | 0.001 | | | | 0.001 | | | | 0.001 | | | | 0.001 | | | | 0.001 | |
Net realized gains on investments | | | | | 0.001 | | | | 0.001 | | | | 0.001 | | | | 0.001 | | | | 0.001 | | | | 0.001 | |
| | | | | | | | | | | | | | | | | | | | | | | | | | |
Total from investment operations | | | | | 0.001 | | | | 0.001 | | | | 0.001 | | | | 0.001 | | | | 0.001 | | | | 0.001 | |
Distributions to shareholders from | | | | | | | | | | | | | | | | | | | | | | | | | | |
Net investment income | | | | | (0.00)1 | | | | (0.00)1 | | | | (0.00)1 | | | | (0.00)1 | | | | (0.00)1 | | | | (0.00)1 | |
Net realized gains | | | | | 0.00 | | | | (0.00)1 | | | | (0.00)1 | | | | (0.00)1 | | | | (0.00)1 | | | | (0.00)1 | |
| | | | | | | | | | | | | | | | | | | | | | | | | | |
Total distributions to shareholders | | | | | (0.00)1 | | | | (0.00)1 | | | | (0.00)1 | | | | (0.00)1 | | | | (0.00)1 | | | | (0.00)1 | |
Net asset value, end of period | | | | | $1.00 | | | | $1.00 | | | | $1.00 | | | | $1.00 | | | | $1.00 | | | | $1.00 | |
Total return2 | | | | | 0.04% | | | | 0.03% | | | | 0.02% | | | | 0.01% | | | | 0.02% | | | | 0.02% | |
Ratios to average net assets (annualized) | | | | | | | | | | | | | | | | | | | | | | | | | | |
Gross expenses | | | | | 0.36% | | | | 0.36% | | | | 0.36% | | | | 0.36% | | | | 0.36% | | | | 0.36% | |
Net expenses | | | | | 0.24% | | | | 0.07% | | | | 0.07% | | | | 0.10% | | | | 0.17% | | | | 0.15% | |
Net investment income | | | | | 0.08% | | | | 0.01% | | | | 0.01% | | | | 0.01% | | | | 0.01% | | | | 0.01% | |
Supplemental data | | | | | | | | | | | | | | | | | | | | | | | | | | |
Net assets, end of period (000s omitted) | | | | | $50 | | | | $50 | | | | $100 | | | | $100 | | | | $100 | | | | $100 | |
| | 1 | Amount is less than $0.005. |
| | 2 | Returns for periods of less than one year are not annualized. |
The accompanying notes are an integral part of these financial statements.
| | | | |
| 14 | | Wells Fargo California Municipal Money Market Fund | | Financial highlights |
(For a share outstanding throughout each period)
| | | | | | | | | | | | | | | | | | | | | | | | | | |
| | | Six months ended
July 31, 2016 | | | Year ended January 31 | |
| PREMIER CLASS1 | | (unaudited) | | | 2016 | | | 2015 | | | 2014 | | | 2013 | | | 2012 | |
Net asset value, beginning of period | | | | | $1.00 | | | | $1.00 | | | | $1.00 | | | | $1.00 | | | | $1.00 | | | | $1.00 | |
Net investment income | | | | | 0.002 | | | | 0.002 | | | | 0.002 | | | | 0.002 | | | | 0.002 | | | | 0.002 | |
Net realized gains on investments | | | | | 0.002 | | | | 0.002 | | | | 0.002 | | | | 0.002 | | | | 0.002 | | | | 0.002 | |
| | | | | | | | | | | | | | | | | | | | | | | | | | |
Total from investment operations | | | | | 0.002 | | | | 0.002 | | | | 0.002 | | | | 0.002 | | | | 0.002 | | | | 0.002 | |
Distributions to shareholders from | | | | | | | | | | | | | | | | | | | | | | | | | | |
Net investment income | | | | | (0.00)2 | | | | (0.00)2 | | | | (0.00)2 | | | | (0.00)2 | | | | (0.00)2 | | | | (0.00)2 | |
Net realized gains | | | | | 0.00 | | | | (0.00)2 | | | | (0.00)2 | | | | (0.00)2 | | | | (0.00)2 | | | | (0.00)2 | |
| | | | | | | | | | | | | | | | | | | | | | | | | | |
Total distributions to shareholders | | | | | (0.00)2 | | | | (0.00)2 | | | | (0.00)2 | | | | (0.00)2 | | | | (0.00)2 | | | | (0.00)2 | |
Net asset value, end of period | | | | | $1.00 | | | | $1.00 | | | | $1.00 | | | | $1.00 | | | | $1.00 | | | | $1.00 | |
Total return3 | | | | | 0.08% | | | | 0.03% | | | | 0.02% | | | | 0.01% | | | | 0.02% | | | | 0.03% | |
Ratios to average net assets (annualized) | | | | | | | | | | | | | | | | | | | | | | | | | | |
Gross expenses | | | | | 0.25% | | | | 0.25% | | | | 0.24% | | | | 0.24% | | | | 0.25% | | | | 0.24% | |
Net expenses | | | | | 0.17% | | | | 0.07% | | | | 0.07% | | | | 0.10% | | | | 0.16% | | | | 0.14% | |
Net investment income | | | | | 0.14% | | | | 0.01% | | | | 0.01% | | | | 0.01% | | | | 0.01% | | | | 0.02% | |
Supplemental data | | | | | | | | | | | | | | | | | | | | | | | | | | |
Net assets, end of period (000s omitted) | | | | | $584,976 | | | | $683,865 | | | | $671,300 | | | | $613,101 | | | | $780,069 | | | | $884,793 | |
| 1 | Effective April 1, 2016, Institutional Class was renamed Premier Class. |
| 2 | Amount is less than $0.005. |
| 3 | Returns for periods of less than one year are not annualized. |
The accompanying notes are an integral part of these financial statements.
| | | | |
| Financial highlights | | Wells Fargo California Municipal Money Market Fund | | 15 |
(For a share outstanding throughout each period)
| | | | | | | | | | | | | | | | | | | | | | | | | | |
| | | Six months ended
July 31, 2016 | | | Year ended January 31 | |
| SERVICE CLASS | | (unaudited) | | | 2016 | | | 2015 | | | 2014 | | | 2013 | | | 2012 | |
Net asset value, beginning of period | | | | | $1.00 | | | | $1.00 | | | | $1.00 | | | | $1.00 | | | | $1.00 | | | | $1.00 | |
Net investment income | | | | | 0.001 | | | | 0.001 | | | | 0.001 | | | | 0.001 | | | | 0.001 | | | | 0.001 | |
Net realized gains on investments | | | | | 0.001 | | | | 0.001 | | | | 0.001 | | | | 0.001 | | | | 0.001 | | | | 0.001 | |
| | | | | | | | | | | | | | | | | | | | | | | | | | |
Total from investment operations | | | | | 0.001 | | | | 0.001 | | | | 0.001 | | | | 0.001 | | | | 0.001 | | | | 0.001 | |
Distributions to shareholders from | | | | | | | | | | | | | | | | | | | | | | | | | | |
Net investment income | | | | | (0.00)1 | | | | (0.00)1 | | | | (0.00)1 | | | | (0.00)1 | | | | (0.00)1 | | | | (0.00)1 | |
Net realized gains | | | | | 0.00 | | | | (0.00)1 | | | | (0.00)1 | | | | (0.00)1 | | | | (0.00)1 | | | | (0.00)1 | |
| | | | | | | | | | | | | | | | | | | | | | | | | | |
Total distributions to shareholders | | | | | (0.00)1 | | | | (0.00)1 | | | | (0.00)1 | | | | (0.00)1 | | | | (0.00)1 | | | | (0.00)1 | |
Net asset value, end of period | | | | | $1.00 | | | | $1.00 | | | | $1.00 | | | | $1.00 | | | | $1.00 | | | | $1.00 | |
Total return2 | | | | | 0.01% | | | | 0.03% | | | | 0.02% | | | | 0.01% | | | | 0.02% | | | | 0.02% | |
Ratios to average net assets (annualized) | | | | | | | | | | | | | | | | | | | | | | | | | | |
Gross expenses | | | | | 0.53% | | | | 0.53% | | | | 0.53% | | | | 0.53% | | | | 0.53% | | | | 0.53% | |
Net expenses | | | | | 0.29% | | | | 0.07% | | | | 0.07% | | | | 0.10% | | | | 0.17% | | | | 0.15% | |
Net investment income | | | | | 0.01% | | | | 0.01% | | | | 0.01% | | | | 0.01% | | | | 0.01% | | | | 0.01% | |
Supplemental data | | | | | | | | | | | | | | | | | | | | | | | | | | |
Net assets, end of period (000s omitted) | | | | | $17,801 | | | | $53,686 | | | | $56,564 | | | | $69,935 | | | | $67,724 | | | | $106,229 | |
| 1 | Amount is less than $0.005. |
| 2 | Returns for periods of less than one year are not annualized. |
The accompanying notes are an integral part of these financial statements.
| | | | |
| 16 | | Wells Fargo California Municipal Money Market Fund | | Financial highlights |
(For a share outstanding throughout each period)
| | | | | | | | | | | | | | | | | | | | | | | | | | |
| | | Six months ended
July 31, 2016 | | | Year ended January 31 | |
| SWEEP CLASS | | (unaudited) | | | 2016 | | | 2015 | | | 2014 | | | 2013 | | | 2012 | |
Net asset value, beginning of period | | | | | $1.00 | | | | $1.00 | | | | $1.00 | | | | $1.00 | | | | $1.00 | | | | $1.00 | |
Net investment income | | | | | 0.001 | | | | 0.001 | | | | 0.001 | | | | 0.001 | | | | 0.001 | | | | 0.001 | |
Net realized gains on investments | | | | | 0.001 | | | | 0.001 | | | | 0.001 | | | | 0.001 | | | | 0.001 | | | | 0.001 | |
| | | | | | | | | | | | | | | | | | | | | | | | | | |
Total from investment operations | | | | | 0.001 | | | | 0.001 | | | | 0.001 | | | | 0.001 | | | | 0.001 | | | | 0.001 | |
Distributions to shareholders from | | | | | | | | | | | | | | | | | | | | | | | | | | |
Net investment income | | | | | (0.00)1 | | | | (0.00)1 | | | | (0.00)1 | | | | (0.00)1 | | | | (0.00)1 | | | | (0.00)1 | |
Net realized gains | | | | | 0.00 | | | | (0.00)1 | | | | (0.00)1 | | | | (0.00)1 | | | | (0.00)1 | | | | (0.00)1 | |
| | | | | | | | | | | | | | | | | | | | | | | | | | |
Total distributions to shareholders | | | | | (0.00)1 | | | | (0.00)1 | | | | (0.00)1 | | | | (0.00)1 | | | | (0.00)1 | | | | (0.00)1 | |
Net asset value, end of period | | | | | $1.00 | | | | $1.00 | | | | $1.00 | | | | $1.00 | | | | $1.00 | | | | $1.00 | |
Total return2 | | | | | 0.00% | | | | 0.03% | | | | 0.02% | | | | 0.01% | | | | 0.02% | | | | 0.02% | |
Ratios to average net assets (annualized) | | | | | | | | | | | | | | | | | | | | | | | | | | |
Gross expenses | | | | | 0.98% | | | | 0.99% | | | | 0.98% | | | | 0.98% | | | | 0.99% | | | | 0.98% | |
Net expenses | | | | | 0.32% | | | | 0.07% | | | | 0.07% | | | | 0.10% | | | | 0.17% | | | | 0.17% | |
Net investment income | | | | | 0.01% | | | | 0.01% | | | | 0.01% | | | | 0.01% | | | | 0.01% | | | | 0.01% | |
Supplemental data | | | | | | | | | | | | | | | | | | | | | | | | | | |
Net assets, end of period (000s omitted) | | | | | $60 | | | | $52 | | | | $25,566 | | | | $59,574 | | | | $76,028 | | | | $120,909 | |
| 1 | Amount is less than $0.005. |
| 2 | Returns for periods of less than one year are not annualized. |
The accompanying notes are an integral part of these financial statements.
| | | | |
| Notes to financial statements (unaudited) | | Wells Fargo California Municipal Money Market Fund | | 17 |
1. ORGANIZATION
Wells Fargo Funds Trust (the “Trust”), a Delaware statutory trust organized on March 10, 1999, is an open-end management investment company registered under the Investment Company Act of 1940, as amended (the “1940 Act”). As an investment company, the Trust follows the accounting and reporting guidance in Financial Accounting Standards Board (“FASB”) Accounting Standards Codification Topic 946, Financial Services – Investment Companies. These financial statements report on the Wells Fargo California Municipal Money Market Fund (the “Fund”) which is a diversified series of the Trust.
2. SIGNIFICANT ACCOUNTING POLICIES
The following significant accounting policies, which are consistently followed in the preparation of the financial statements of the Fund, are in conformity with U.S. generally accepted accounting principles which require management to make estimates and assumptions that affect the reported amounts of assets and liabilities, disclosure of contingent assets and liabilities at the date of the financial statements, and the reported amounts of revenues and expenses during the reporting period. Actual results could differ from those estimates.
Securities valuation
As permitted under Rule 2a-7 of the 1940 Act, portfolio securities are valued at amortized cost, which approximates fair value. The amortized cost method involves valuing a security at its cost, plus accretion of discount or minus amortization of premium over the period until maturity.
Investments which are not valued using the method discussed above are valued at their fair value, as determined in good faith by the Board of Trustees of the Fund. The Board of Trustees has established a Valuation Committee comprised of the Trustees and has delegated to it the authority to take any actions regarding the valuation of portfolio securities that the Valuation Committee deems necessary or appropriate, including determining the fair value of portfolio securities, unless the determination has been delegated to the Management Valuation Team of Wells Fargo Funds Management, LLC (“Funds Management”). The Board of Trustees retains the authority to make or ratify any valuation decisions or approve any changes to the Valuation Procedures as it deems appropriate. On a quarterly basis, the Board of Trustees receives reports on any valuation actions taken by the Valuation Committee or the Management Valuation Team which may include items for ratification.
Valuations of fair valued securities are compared to the next actual sales price when available, or other appropriate market values, to assess the continued appropriateness of the fair valuation methodologies used. These securities are fair valued on a day-to-day basis, taking into consideration changes to appropriate market information and any significant changes to the inputs considered in the valuation process until there is a readily available price provided on an exchange or by an independent pricing service. Valuations received from an independent pricing service or independent broker-dealer quotes are periodically validated by comparisons to most recent trades and valuations provided by other independent pricing services in addition to the review of prices by the manager and/or subadviser. Unobservable inputs used in determining fair valuations are identified based on the type of security, taking into consideration factors utilized by market participants in valuing the investment, knowledge about the issuer and the current market environment.
Repurchase agreements
The Fund may invest in repurchase agreements and may participate in pooled repurchase agreement transactions with other funds advised by Funds Management. The repurchase agreements must be fully collateralized based on values that are marked-to-market daily. The collateral may be held by an agent bank under a tri-party agreement. It is the custodian’s responsibility to value collateral daily and to take action to obtain additional collateral as necessary to maintain market value equal to or greater than the resale price. The repurchase agreements are collateralized by instruments such as U.S. Treasury, federal agency, or high-grade corporate obligations. There could be potential loss to the Fund in the event that the Fund is delayed or prevented from exercising its rights to dispose of the collateral, including the risk of a possible decline in the value of the underlying obligations during the period in which the Fund seeks to assert its rights.
Security transactions and income recognition
Securities transactions are recorded on a trade date basis. Realized gains or losses are recorded on the basis of identified cost.
Interest income is accrued daily and bond discounts are accreted and premiums are amortized daily based on the effective interest method. To the extent debt obligations are placed on non-accrual status, any related interest income may be reduced by writing off interest receivables when the collection of all or a portion of interest has become doubtful based on consistently applied procedures. If the issuer subsequently resumes interest payments or when the collectability of interest is reasonably assured, the debt obligation is removed from non-accrual status.
Distributions to shareholders
Distributions to shareholders from net investment income are accrued daily and paid monthly. Distributions from net realized gains, if any, are recorded on the ex-dividend date. Such distributions are determined in conformity with federal income tax regulations, which may differ in amount or character from net investment income and realized gains recognized for purposes of U.S. generally accepted accounting principles.
Federal and other taxes
The Fund intends to continue to qualify as a regulated investment company by distributing substantially all of its investment company taxable and tax-exempt income and any net realized capital gains (after reduction for capital loss carryforwards) sufficient to relieve it from all, or substantially all, federal income taxes. Accordingly, no provision for federal income taxes was required.
| | | | |
| 18 | | Wells Fargo California Municipal Money Market Fund | | Notes to financial statements (unaudited) |
The Fund’s income and federal excise tax returns and all financial records supporting those returns for the prior three fiscal years are subject to examination by the federal and Delaware revenue authorities. Management has analyzed the Fund’s tax positions taken on federal, state, and foreign tax returns for all open tax years and does not believe that there are any uncertain tax positions that require recognition of a tax liability.
Class allocations
The separate classes of shares offered by the Fund differ principally in distribution, shareholder servicing, and administration fees. Class specific expenses are charged directly to that share class. Investment income, common expenses, and realized and unrealized gains (losses) on investments are allocated daily to each class of shares based on the relative proportion of net assets of each class.
3. FAIR VALUATION MEASUREMENTS
Fair value measurements of investments are determined within a framework that has established a fair value hierarchy based upon the various data inputs utilized in determining the value of the Fund’s investments. The three-level hierarchy gives the highest priority to unadjusted quoted prices in active markets for identical assets or liabilities (Level 1) and the lowest priority to significant unobservable inputs (Level 3). The Fund’s investments are classified within the fair value hierarchy based on the lowest level of input that is significant to the fair value measurement. The inputs are summarized into three broad levels as follows:
| | |
| Level 1 – | | quoted prices in active markets for identical securities |
Level 2 – | | other significant observable inputs (including quoted prices for similar securities, interest rates, prepayment speeds, credit risk, use of amortized cost, etc.) |
| Level 3 – | | significant unobservable inputs (including the Fund’s own assumptions in determining the fair value of investments) |
The inputs or methodologies used for valuing investments in securities are not necessarily an indication of the risk associated with investing in those securities.
At July 31, 2016, all of the Fund’s investments in securities were valued using Level 2 inputs since the primary inputs include the credit quality of the issuer and short-term interest rates (both of which are observable) in addition to the use of amortized cost.
The Fund recognizes transfers between levels within the fair value hierarchy at the end of the reporting period. At July 31, 2016, the Fund did not have any transfers into/out of Level 1, Level 2, or Level 3
4. TRANSACTIONS WITH AFFILIATES
Management fee
Funds Management, an indirect wholly owned subsidiary of Wells Fargo & Company (“Wells Fargo”), is the manager of the Fund and provides advisory and fund-level administrative services under an investment management agreement. Under the investment management agreement, Funds Management is responsible for, among other services, implementing the investment objectives and strategies of the Fund, supervising the subadviser, providing fund-level administrative services in connection with the Fund’s operations, and providing any other fund-level administrative services reasonably necessary for the operation of the Fund. As compensation for its services under the investment management agreement, Funds Management is entitled to receive an annual management fee starting at 0.15% and declining to 0.13% as the average daily net assets of the Fund increase. For the six months ended July 31, 2016, the management fee was equivalent to an annual rate of 0.15% of the Fund’s average daily net assets.
Funds Management has retained the services of a subadviser to provide daily portfolio management to the Fund. The fee for subadvisory services is borne by Funds Management. Wells Capital Management Incorporated, an affiliate of Funds Management and an indirect wholly owned subsidiary of Wells Fargo, is the subadviser to the Fund and is entitled to receive a fee from Funds Management at an annual rate starting at 0.05% and declining to 0.01% as the average daily net assets of the Fund increase.
Administration fees
Under a class-level administration agreement, Funds Management provides class-level administrative services to the Fund, which includes paying fees and expenses for services provided by the transfer agent, sub-transfer agents, omnibus account servicers and record-keepers. As compensation for its services under the class-level administration agreement, Funds Management receives an annual fee which is calculated based on the average daily net assets of each class as follows:
| | | | | |
| | | Class-level |
| | | administration fee |
Class A, Sweep Class | | | | 0.22 | % |
| |
Administrator Class | | | | 0.10 | |
| |
Premier Class1 | | | | 0.08 | |
| |
Service Class | | | | 0.12 | |
1 Effective April 1, 2016, Institutional Class was renamed Premier Class.
| | | | |
| Notes to financial statements (unaudited) | | Wells Fargo California Municipal Money Market Fund | | 19 |
Funds Management has contractually waived and/or reimbursed management and administration fees to the extent necessary to maintain certain net operating expense ratios for the Fund. Waiver of fees and/or reimbursement of expenses by Funds Management were made first from fund level expenses on a proportionate basis and then from class specific expenses. Funds Management has committed through May 31, 2017 to waive fees and/or reimburse expenses to the extent necessary to cap the Fund’s expenses at 0.65% for Class A shares, 0.30% for Administrator Class shares, 0.20% for Premier Class shares, 0.45% for Service Class shares, and 1.00% for Sweep Class shares. After this time, the cap may be increased or the commitment to maintain the cap may be terminated only with the approval of the Board of Trustees. During the six months ended July 31, 2016, Funds Management voluntarily waived additional expenses to maintain a positive yield.
Distribution fee
The Trust has adopted a distribution plan for Sweep Class shares of the Fund pursuant to Rule 12b-1 under the 1940 Act. A distribution fee is charged to Sweep Class shares and paid to Wells Fargo Funds Distributor, LLC, the principal underwriter, at an annual rate of 0.35% of the average daily net assets of Sweep Class shares.
Shareholder servicing fees
The Trust has entered into contracts with one or more shareholder servicing agents, whereby Class A, Service Class, and Sweep Class of the Fund are charged a fee at an annual rate of 0.25% of the respective average daily net assets of each class. Administrator Class is charged a fee at an annual rate of 0.10% of its average daily net assets.
A portion of these total shareholder servicing fees were paid to affiliates of Wells Fargo.
5. INDEMNIFICATION
Under the Trust’s organizational documents, the officers and Trustees have been granted certain indemnification rights against certain liabilities that may arise out of performance of their duties to the Trust. Additionally, in the normal course of business, the Trust may enter into contracts with service providers that contain a variety of indemnification clauses. The Trust’s maximum exposure under these arrangements is dependent on future claims that may be made against the Fund and, therefore, cannot be estimated.
6. SUBSEQUENT DISTRIBUTIONS
On August 31, 2016, the Fund declared distributions from short-term capital gains and long-term capital gains to shareholders of record on August 31, 2016. The per share amounts payable on August 31, 2016 were as follows:
| | | | | | | | |
| | | Short-term capital gains | | | Long-term capital gains | |
Class A | | $ | 0.000297665 | | | $ | 0.000074577 | |
Administrator Class | | | 0.000297665 | | | | 0.000074577 | |
Premier Class | | | 0.000297665 | | | | 0.000074577 | |
Service Class | | | 0.000297665 | | | | 0.000074577 | |
Sweep Class | | | 0.000297665 | | | | 0.000074577 | |
These distributions are not reflected in the accompanying financial statements. The final determination of the source of all distributions is subject to change and made after the Fund’s tax year-end.
7. SUBSEQUENT EVENT
Effective at the close of business on September 1, 2016, under a plan of liquidation and termination approved by the Board of Trustees, all shares of the Fund were automatically redeemed and the Fund was liquidated.
| | | | |
| 20 | | Wells Fargo California Municipal Money Market Fund | | Other information (unaudited) |
PROXY VOTING INFORMATION
A description of the policies and procedures that the Fund uses to determine how to vote proxies relating to portfolio securities is available, upon request, by calling 1-800-222-8222, visiting our website at wellsfargofunds.com, or visiting the SEC website at sec.gov. Information regarding how the Fund voted proxies relating to portfolio securities during the most recent 12-month period ended June 30 is available on the Fund’s website at wellsfargofunds.com or by visiting the SEC website at sec.gov.
PORTFOLIO HOLDINGS INFORMATION
The complete portfolio holdings for the Fund are publicly available on the Fund’s website (wellsfargofunds.com) on a 1-day delayed basis. The Fund files its complete schedule of portfolio holdings with the SEC for the first and third quarters of each fiscal year on Form N-Q, which is available by visiting the SEC website at sec.gov. In addition, the Fund’s Form N-Q may be reviewed and copied at the SEC’s Public Reference Room in Washington, DC, and at regional offices in New York City, at 233 Broadway, and in Chicago, at 175 West Jackson Boulevard, Suite 900. Information about the Public Reference Room may be obtained by calling 1-800-SEC-0330.
| | | | |
| Other information (unaudited) | | Wells Fargo California Municipal Money Market Fund | | 21 |
BOARD OF TRUSTEES AND OFFICERS
Each of the Trustees and Officers1 listed in the table below acts in identical capacities for each fund in the Wells Fargo family of funds, which consists of 139 mutual funds comprising the Wells Fargo Funds Trust, Wells Fargo Variable Trust, Wells Fargo Master Trust and four closed-end funds (collectively the “Fund Complex”). This table should be read in conjunction with the Prospectus and the Statement of Additional Information2. The mailing address of each Trustee and Officer is 525 Market Street, 12th Floor, San Francisco, CA 94105. Each Trustee and Officer serves an indefinite term, however, each Trustee serves such term until reaching the mandatory retirement age established by the Trustees.
Independent Trustees
| | | | | | |
Name and year of birth | | Position held and length of service* | | Principal occupations during past five years or longer | | Current other public
company or
investment company
directorships |
| | | |
William R. Ebsworth (Born 1957) | | Trustee, since 2015 | | Retired. From 1984 to 2013, equities analyst, portfolio manager, research director and chief financial officer at Fidelity Management and Research Company in Boston, Tokyo, and Hong Kong and retired in 2013 as Chief Investment Officer of Fidelity Strategic Advisers, Inc. where he lead a team of investment professionals managing client assets. Prior thereto, Board member of Hong Kong Securities Clearing Co., Hong Kong Options Clearing Corp., the Thailand International Fund, Ltd., Fidelity Investments Life Insurance Company, and Empire Fidelity Investments Life Insurance Company. Mr. Ebsworth is a CFA® charterholder and an Adjunct Lecturer, Finance, at Babson College. | | Asset Allocation Trust |
| | | |
Jane A. Freeman (Born 1953) | | Trustee, since 2015 | | Retired. From 2012 to 2014 and 1999 to 2008, Chief Financial Officer of Scientific Learning Corporation. From 2008 to 2012, Ms. Freeman provided consulting services related to strategic business projects. Prior to 1999, Portfolio Manager at Rockefeller & Co. and Scudder, Stevens & Clark. Board member of the Harding Loevner Funds from 1996 to 2014, serving as both Lead Independent Director and chair of the Audit Committee. Board member of the Russell Exchange Traded Funds Trust from 2011 to 2012 and the chair of the Audit Committee. Ms. Freeman is Chair of Taproot Foundation (non-profit organization), a Board Member of Ruth Bancroft Garden (non-profit organization) and an inactive chartered financial analyst. | | Asset Allocation Trust |
| | | |
Peter G. Gordon (Born 1942) | | Trustee, since 1998; Chairman, since 2005 | | Co-Founder, Retired Chairman, President and CEO of Crystal Geyser Water Company. Trustee Emeritus, Colby College. | | Asset Allocation Trust |
| | | |
Isaiah Harris, Jr. (Born 1952) | | Trustee, since 2009 | | Retired. Chairman of the Board of CIGNA Corporation since 2009, and Director since 2005. From 2003 to 2011, Director of Deluxe Corporation. Prior thereto, President and CEO of BellSouth Advertising and Publishing Corp. from 2005 to 2007, President and CEO of BellSouth Enterprises from 2004 to 2005 and President of BellSouth Consumer Services from 2000 to 2003. Emeritus member of the Iowa State University Foundation Board of Governors. Emeritus Member of the Advisory Board of Iowa State University School of Business. Advisory Board Member, Palm Harbor Academy (charter school). Advisory Board Member, Child Evangelism Fellowship (non-profit). Mr. Harris is a certified public accountant (inactive status). | | CIGNA Corporation; Asset Allocation Trust |
| | | |
Judith M. Johnson (Born 1949) | | Trustee, since 2008; Audit Committee Chairman, since 2008 | | Retired. Prior thereto, Chief Executive Officer and Chief Investment Officer of Minneapolis Employees Retirement Fund from 1996 to 2008. Ms. Johnson is an attorney, certified public accountant and a certified managerial accountant. | | Asset Allocation Trust |
| | | |
David F. Larcker (Born 1950) | | Trustee, since 2009 | | James Irvin Miller Professor of Accounting at the Graduate School of Business, Stanford University, Director of the Corporate Governance Research Initiative and Senior Faculty of The Rock Center for Corporate Governance since 2006. From 2005 to 2008, Professor of Accounting at the Graduate School of Business, Stanford University. Prior thereto, Ernst & Young Professor of Accounting at The Wharton School, University of Pennsylvania from 1985 to 2005. | | Asset Allocation Trust |
| | | | |
| 22 | | Wells Fargo California Municipal Money Market Fund | | Other information (unaudited) |
| | | | | | |
Name and year of birth | | Position held and length of service* | | Principal occupations during past five years or longer | | Current other public
company or
investment company
directorships |
| | | |
Olivia S. Mitchell (Born 1953) | | Trustee, since 2006 | | International Foundation of Employee Benefit Plans Professor, Wharton School of the University of Pennsylvania since 1993. Director of Wharton’s Pension Research Council and Boettner Center on Pensions & Retirement Research, and Research Associate at the National Bureau of Economic Research. Previously, Cornell University Professor from 1978 to 1993. | | Asset Allocation Trust |
| | | |
Timothy J. Penny (Born 1951) | | Trustee, since 1996 | | President and Chief Executive Officer of Southern Minnesota Initiative Foundation, a non-profit organization, since 2007 and Senior Fellow at the Humphrey Institute Policy Forum at the University of Minnesota since 1995. Member of the Board of Trustees of NorthStar Education Finance, Inc., a non-profit organization, since 2007. | | Asset Allocation Trust |
| | | |
Michael S. Scofield (Born 1943) | | Trustee, since 2010 | | Served on the Investment Company Institute’s Board of Governors and Executive Committee from 2008-2011 as well the Governing Council of the Independent Directors Council from 2006-2011 and the Independent Directors Council Executive Committee from 2008-2011. Chairman of the IDC from 2008-2010. Institutional Investor (Fund Directions) Trustee of Year in 2007. Trustee of the Evergreen Funds complex (and its predecessors) from 1984 to 2010. Chairman of the Evergreen Funds from 2000-2010. Former Trustee of the Mentor Funds. Retired Attorney, Law Offices of Michael S. Scofield. | | Asset Allocation Trust |
* Length of service dates reflect the Trustee’s commencement of service with the Trust’s predecessor entities, where applicable.
Officers
| | | | | | |
Name and year of birth | | Position held and length of service | | Principal occupations during past five years or longer | | |
| | | |
Karla M. Rabusch (Born 1959) | | President, since 2003 | | Executive Vice President of Wells Fargo Bank, N.A. and President of Wells Fargo Funds Management, LLC since 2003. | | |
| | | |
Nancy Wiser1 (Born 1967) | | Treasurer, since 2012 | | Executive Vice President of Wells Fargo Funds Management, LLC since 2011. Chief Operating Officer and Chief Compliance Officer at LightBox Capital Management LLC, from 2008 to 2011. | | |
| | | |
C. David Messman (Born 1960) | | Secretary, since 2000; Chief Legal Officer, since 2003 | | Senior Vice President and Secretary of Wells Fargo Funds Management, LLC since 2001. Assistant General Counsel of Wells Fargo Bank, N.A. since 2013 and Vice President and Managing Counsel of Wells Fargo Bank, N.A. from 1996 to 2013. | | |
| | | |
Michael Whitaker (Born 1967) | | Chief Compliance Officer, since 2016* | | Executive Vice President of Wells Fargo Funds Management, LLC since 2016. Chief Compliance Officer of Fidelity’s Fixed Income Funds and Asset Allocation Funds from 2008 to 2016, Compliance Officer of FMR Co., Inc. from 2014 to 2016, Fidelity Investments Money Management, Inc. from 2014 to 2016, Fidelity Investments from 2007 to 2016. | | |
| | | |
David Berardi (Born 1975) | | Assistant Treasurer, since 2009 | | Vice President of Wells Fargo Funds Management, LLC since 2009. Vice President of Evergreen Investment Management Company, LLC from 2008 to 2010. Manager of Fund Reporting and Control for Evergreen Investment Management Company, LLC from 2004 to 2010. | | |
| | | |
Jeremy DePalma1 (Born 1974) | | Assistant Treasurer, since 2009 | | Senior Vice President of Wells Fargo Funds Management, LLC since 2009. Senior Vice President of Evergreen Investment Management Company, LLC from 2008 to 2010 and head of the Fund Reporting and Control Team within Fund Administration from 2005 to 2010. | | |
| 1 | Nancy Wiser acts as Treasurer of 71 funds in the Fund Complex. Jeremy DePalma acts as Treasurer of 68 funds and Assistant Treasurer of 71 funds in the Fund Complex. |
| 2 | The Statement of Additional Information includes additional information about the Trustees and is available, without charge, upon request, by calling 1-800-222-8222 or by visiting the website at wellsfargofunds.com. |
| * | Michael Whitaker became Chief Compliance Officer effective May 16, 2016. |
| | | | |
| Other information (unaudited) | | Wells Fargo California Municipal Money Market Fund | | 23 |
BOARD CONSIDERATION OF INVESTMENT MANAGEMENT AND SUB-ADVISORY AGREEMENTS:
Under the Investment Company Act of 1940 (the “1940 Act”), the Board of Trustees (the “Board”) of Wells Fargo Funds Trust (the “Trust”) must determine annually whether to approve the continuation of the Trust’s investment management and sub-advisory agreements. In this regard, at an in-person meeting held on May 24-25, 2016 (the “Meeting”), the Board, all the members of which have no direct or indirect interest in the investment management and sub-advisory agreements and are not “interested persons” of the Trust, as defined in the 1940 Act (the “Independent Trustees”), reviewed and approved for Wells Fargo California Municipal Money Market Fund (the “Fund”): (i) an investment management agreement (the “Management Agreement”) with Wells Fargo Funds Management, LLC (“Funds Management”); and (ii) an investment sub-advisory agreement (the “Sub-Advisory Agreement”) with Wells Capital Management Incorporated (the “Sub-Adviser”), an affiliate of Funds Management. The Management Agreement and the Sub-Advisory Agreement are collectively referred to as the “Advisory Agreements.”
At the Meeting, the Board considered the factors and reached the conclusions described below relating to the selection of Funds Management and the Sub-Adviser and the approval of the Advisory Agreements. Prior to the Meeting, including at an in-person meeting in April 2016, the Trustees conferred extensively among themselves and with representatives of Funds Management about these matters. Also, the Board has adopted a team-based approach, with each team consisting of a sub-set of Trustees, to assist the full Board in the discharge of its duties in reviewing performance and other matters throughout the year. The Independent Trustees were assisted in their evaluation of the Advisory Agreements by independent legal counsel, from whom they received separate legal advice and with whom they met separately.
In providing information to the Board, Funds Management and the Sub-Adviser were guided by a detailed set of requests for information submitted to them by independent legal counsel on behalf of the Independent Trustees at the start of the Board’s annual contract renewal process earlier in 2016. In considering and approving the Advisory Agreements, the Trustees considered the information they believed relevant, including but not limited to the information discussed below. The Board considered not only the specific information presented in connection with the Meeting, but also the knowledge gained over time through interaction with Funds Management and the Sub-Adviser about various topics. In this regard, the Board reviewed reports of Funds Management at each of its quarterly meetings, which included, among other things, portfolio reviews and performance reports. In addition, the Board and the teams mentioned above confer with portfolio managers at various times throughout the year. The Board did not identify any particular information or consideration that was all-important or controlling, and each individual Trustee may have attributed different weights to various factors.
After its deliberations, the Board unanimously approved the continuation of the Advisory Agreements for a one-year term and determined that the compensation payable to Funds Management and the Sub-Adviser under each of the Advisory Agreements was reasonable. The Board considered the approval of the Advisory Agreements for the Fund as part of its consideration of agreements for funds across the complex, but its approvals were made on a fund-by-fund basis. The following summarizes a number of important, but not necessarily all, factors considered by the Board in support of its approvals.
Nature, Extent and Quality of Services
The Board received and considered various information regarding the nature, extent and quality of services provided to the Fund by Funds Management and the Sub-Adviser under the Advisory Agreements. This information included a description of the investment advisory services and Fund-level administrative services covered by the Management Agreement, as well as, among other things, a summary of the background and experience of senior management of Funds Management, and the qualifications, background, tenure and responsibilities of each of the portfolio managers primarily responsible for the day-to-day portfolio management of the Fund.
The Board evaluated the ability of Funds Management and the Sub-Adviser to attract and retain qualified investment professionals, including research, advisory and supervisory personnel. The Board further considered the compliance programs and compliance records of Funds Management and the Sub-Adviser. In addition, the Board took into account the full range of services provided to the Fund by Funds Management and its affiliates.
Fund Performance and Expenses
The Board considered the performance results for the Fund over various time periods ended December 31, 2015. The Board considered these results in comparison to the performance of funds in a universe that was determined by Broadridge Inc. (“Broadridge”) to be similar to the Fund (the “Universe”), and in comparison to other comparative data. Broadridge is an independent provider of investment company data. The Board received a description of the methodology used by Broadridge to select the mutual funds in the performance Universe. The Board noted that the performance of the Fund (Class A) was higher
| | | | |
| 24 | | Wells Fargo California Municipal Money Market Fund | | Other information (unaudited) |
than, equal to or in range of the average performance of the Universe for the one- and three-year periods under review, equal to the Universe for all periods under review. The Board noted that the Fund experienced a portfolio manager change in 2014.
The Board also received and considered information regarding the Fund’s net operating expense ratios and their various components, including actual management fees, custodian and other non-management fees, and Rule 12b-1 and non-Rule 12b-1 shareholder service fees. The Board considered these ratios in comparison to the median ratios of funds in class-specific expense groups that were determined by Broadridge to be similar to the Fund (the “Groups”). The Board received a description of the methodology used by Broadridge to select the mutual funds in the expense Groups and an explanation of how funds comprising expense groups and their expense ratios may vary from year-to-year. Based on the Broadridge reports, the Board noted that the net operating expense ratios of the Fund were lower than the median net operating expense ratios of the expense Groups.
The Board took into account the Fund performance and expense information provided to it among the factors considered in deciding to re-approve the Advisory Agreements.
Investment Management and Sub-Advisory Fee Rates
The Board reviewed and considered the contractual fee rates payable by the Fund to Funds Management under the Management Agreement, as well as the contractual fee rates payable by the Fund to Funds Management for class-level administrative services under a Class-Level Administration Agreement, which include class-level transfer agency and sub-transfer agency costs (collectively, the “Management Rates”). The Board also reviewed and considered the contractual investment sub-advisory fee rates that are payable by Funds Management to the Sub-Adviser for investment sub-advisory services.
Among other information reviewed by the Board was a comparison of the Fund’s Management Rates with the average contractual investment management fee rates of funds in the expense Groups at a common asset level as well as transfer agency costs of the funds in the expense Groups. The Board noted that the Management Rates of the Fund were lower than or in range of the sum of these average rates for the Fund’s expense Groups for all share classes.
The Board also received and considered information about the portion of the total management fee that was retained by Funds Management after payment of the fee to the Sub-Adviser for sub-advisory services. In assessing the reasonableness of this amount, the Board received and evaluated information about the nature and extent of responsibilities retained and risks assumed by Funds Management and not delegated to or assumed by the Sub-Adviser, and about Funds Management’s on-going oversight services. However, given the affiliation between Funds Management and the Sub-Adviser, the Board ascribed limited relevance to the allocation of fees between them.
The Board also received and considered information about the nature and extent of services offered and fee rates charged by Funds Management and the Sub-Adviser to other types of clients with investment strategies similar to those of the Fund. In this regard, the Board received information about the significantly greater scope of services, and compliance, reporting and other legal burdens and risks of managing mutual funds compared with those associated with managing assets of non-mutual fund clients such as collective funds or institutional separate accounts.
Based on its consideration of the factors and information it deemed relevant, including those described here, the Board determined that the compensation payable to Funds Management under the Management Agreement and to the Sub-Adviser under the Sub-Advisory Agreement was reasonable, in light of the services covered by the Advisory Agreements.
Profitability
The Board received and considered information concerning the profitability of Funds Management, as well as the profitability of Wells Fargo as a whole, from providing services to the Fund and the fund family as a whole. The Board also received and considered information concerning the profitability of the Sub-Adviser from providing services to the fund family as a whole, noting that the Sub-Adviser’s profitability information with respect to providing services to the Fund was subsumed in the Wells Fargo and Funds Management profitability analysis.
Funds Management reported on the methodologies and estimates used in calculating profitability. Among other things, the Board noted that the levels of profitability reported on a fund-by-fund basis varied widely, depending on factors such as the size and type of fund. Based on its review, the Board did not deem the profits reported by Funds Management or Wells Fargo from its services to the Fund to be at a level that would prevent it from approving the continuation of the Advisory Agreements.
Economies of Scale
With respect to possible economies of scale, the Board noted the existence of breakpoints in the Fund’s management fee structure, which operate generally to reduce the Fund’s expense ratios as the Fund grows in size. It considered that, for a small
| | | | |
| Other information (unaudited) | | Wells Fargo California Municipal Money Market Fund | | 25 |
fund or a fund that shrinks in size, breakpoints conversely can result in higher fee levels. The Board also considered that fee waiver and expense reimbursement arrangements and competitive fee rates at the outset are means of sharing potential economies of scale with shareholders of the Fund and the fund family as a whole. The Board considered Funds Management’s view that any analyses of potential economies of scale in managing a particular fund are inherently limited in light of the joint and common costs and investments that Funds Management incurs across the fund family as a whole.
The Board concluded that the Fund’s fee and expense arrangements, including contractual breakpoints, constituted a reasonable approach to sharing potential economies of scale with the Fund and its shareholders.
Other Benefits to Funds Management and the Sub-Adviser
The Board received and considered information regarding potential “fall-out” or ancillary benefits received by Funds Management and its affiliates, including the Sub-Adviser, as a result of their relationships with the Fund. Ancillary benefits could include, among others, benefits directly attributable to other relationships with the Fund and benefits potentially derived from an increase in Funds Management’s and the Sub-Adviser’s business as a result of their relationships with the Fund. The Board noted that various affiliates of Funds Management may receive distribution-related fees, shareholder servicing payments and sub-transfer agency fees in respect of shares sold or held through them and services provided.
The Board also reviewed information about soft dollar credits earned and utilized by the Sub-Adviser, fees earned by Funds Management and the Sub-Adviser from managing a private investment vehicle for the fund family’s securities lending collateral and commissions earned by an affiliated broker from portfolio transactions.
Based on its consideration of the factors and information it deemed relevant, including those described here, the Board did not find that any ancillary benefits received by Funds Management and its affiliates, including the Sub-Adviser, were unreasonable.
Conclusion
At the Meeting, after considering the above-described factors and based on its deliberations and its evaluation of the information described above, the Board unanimously approved the continuation of the Advisory Agreements for a one-year term and determined that the compensation payable to Funds Management and the Sub-Adviser under each of the Advisory Agreements was reasonable.
| | | | |
| 26 | | Wells Fargo California Municipal Money Market Fund | | List of abbreviations |
The following is a list of common abbreviations for terms and entities that may have appeared in this report.
ACA — ACA Financial Guaranty Corporation
ADR — American depositary receipt
ADS — American depositary shares
AGC — Assured Guaranty Corporation
AGM — Assured Guaranty Municipal
Ambac — Ambac Financial Group Incorporated
AMT — Alternative minimum tax
AUD — Australian dollar
BAN — Bond anticipation notes
BHAC — Berkshire Hathaway Assurance Corporation
BRL — Brazilian real
CAB — Capital appreciation bond
CAD — Canadian dollar
CCAB — Convertible capital appreciation bond
CDA — Community Development Authority
CDO — Collateralized debt obligation
CHF — Swiss franc
COP — Colombian peso
CLP — Chilean peso
DKK — Danish krone
DRIVER — Derivative inverse tax-exempt receipts
DW&P — Department of Water & Power
DWR — Department of Water Resources
ECFA — Educational & Cultural Facilities Authority
EDA — Economic Development Authority
EDFA — Economic Development Finance Authority
ETF — Exchange-traded fund
EUR — Euro
FDIC — Federal Deposit Insurance Corporation
FFCB — Federal Farm Credit Banks
FGIC — Financial Guaranty Insurance Corporation
FHA — Federal Housing Administration
FHLB — Federal Home Loan Bank
FHLMC — Federal Home Loan Mortgage Corporation
FICO — The Financing Corporation
FNMA — Federal National Mortgage Association
FSA — Farm Service Agency
GBP — Great British pound
GDR — Global depositary receipt
GNMA — Government National Mortgage Association
GO — General obligation
HCFR — Healthcare facilities revenue
HEFA — Health & Educational Facilities Authority
HEFAR — Higher education facilities authority revenue
HFA — Housing Finance Authority
HFFA — Health Facilities Financing Authority
HKD — Hong Kong dollar
HUD — Department of Housing and Urban Development
HUF — Hungarian forint
IDA — Industrial Development Authority
IDAG — Industrial Development Agency
IDR — Indonesian rupiah
IEP — Irish pound
JPY — Japanese yen
KRW — Republic of Korea won
LIBOR — London Interbank Offered Rate
LIFER — Long Inverse Floating Exempt Receipts
LIQ — Liquidity agreement
LLC — Limited liability company
LLLP — Limited liability limited partnership
LLP — Limited liability partnership
LOC — Letter of credit
LP — Limited partnership
MBIA — Municipal Bond Insurance Association
MFHR — Multifamily housing revenue
MSTR — Municipal securities trust receipts
MTN — Medium-term note
MUD — Municipal Utility District
MXN — Mexican peso
MYR — Malaysian ringgit
National — National Public Finance Guarantee Corporation
NGN — Nigerian naira
NOK — Norwegian krone
NZD — New Zealand dollar
PCFA — Pollution Control Financing Authority
PCL — Public Company Limited
PCR — Pollution control revenue
PFA — Public Finance Authority
PFFA — Public Facilities Financing Authority
PFOTER — Puttable floating option tax-exempt receipts
plc — Public limited company
PLN — Polish zloty
PUTTER — Puttable tax-exempt receipts
R&D — Research & development
Radian — Radian Asset Assurance
RAN — Revenue anticipation notes
RDA — Redevelopment Authority
RDFA — Redevelopment Finance Authority
REIT — Real estate investment trust
ROC — Reset option certificates
RON — Romanian lei
RUB — Russian ruble
SAVRS — Select auction variable rate securities
SBA — Small Business Authority
SDR — Swedish depositary receipt
SEK — Swedish krona
SFHR — Single-family housing revenue
SFMR — Single-family mortgage revenue
SGD — Singapore dollar
SPA — Standby purchase agreement
SPDR — Standard & Poor’s Depositary Receipts
SPEAR — Short Puttable Exempt Adjustable Receipts
STRIPS — Separate trading of registered interest and
principal securities
TAN — Tax anticipation notes
TBA — To be announced
THB — Thai baht
TIPS — Treasury inflation-protected securities
TRAN — Tax revenue anticipation notes
TRY — Turkish lira
TTFA — Transportation Trust Fund Authority
TVA — Tennessee Valley Authority
ZAR — South African rand

| | | | |
For more information More information about Wells Fargo Funds is available free upon request. To obtain literature, please write, email, visit the Fund’s website, or call: Wells Fargo Funds P.O. Box 8266 Boston, MA 02266-8266 Email: fundservice@wellsfargo.com Website: wellsfargofunds.com Individual investors: 1-800-222-8222 Retail investment professionals: 1-888-877-9275 | | This report and the financial statements contained herein are submitted for the general information of the shareholders of the Fund. If this report is used for promotional purposes, distribution of the report must be accompanied or preceded by a current prospectus. Before investing, please consider the investment objectives, risks, charges, and expenses of the investment. For a current prospectus and, if available, a summary prospectus, containing this information, call 1-800-222-8222 or visit the Fund’s website at wellsfargofunds.com. Read the prospectus carefully before you invest or send money. Wells Fargo Asset Management (WFAM) is a trade name used by the asset management businesses of Wells Fargo & Company. Wells Fargo Funds Management, LLC, a wholly owned subsidiary of Wells Fargo & Company, provides investment advisory and administrative services for Wells Fargo Funds. Other affiliates of Wells Fargo & Company provide subadvisory and other services for the funds. The funds are distributed by Wells Fargo Funds Distributor, LLC, Member FINRA, an affiliate of Wells Fargo & Company. |
| Institutional investment professionals: 1-866-765-0778 | | NOT FDIC INSURED ¡ NO BANK GUARANTEE ¡ MAY LOSE VALUE | | |
| | | | |
| | © 2016 Wells Fargo Funds Management, LLC. All rights reserved. | | |
| |  Printed on Recycled paper | | 245332 09-16 SA302/SAR302 07-16 |
Semi-Annual Report
July 31, 2016

Retail Money Market Funds

| n | | Wells Fargo Money Market Fund |

Reduce clutter. Save trees.
Sign up for electronic delivery of prospectuses and shareholder reports at wellsfargo.com/advantagedelivery
Contents
| * | A complete schedule of portfolio holdings as of the report date may be obtained, free of charge, by accessing the following website: https://www.wellsfargofunds.com/assets/edocs/regulatory/holdings/money-market-semi.pdf or by calling Wells Fargo Funds at 1-800-222-8222. This complete schedule, filed on Form N-CSRS, is also available on the SEC’s website at sec.gov. |
The views expressed and any forward-looking statements are as of July 31, 2016, unless otherwise noted, and are those of the Fund managers and/or Wells Fargo Funds Management, LLC. Discussions of individual securities, or the markets generally, or any Wells Fargo Fund are not intended as individual recommendations. Future events or results may vary significantly from those expressed in any forward-looking statements. The views expressed are subject to change at any time in response to changing circumstances in the market. Wells Fargo Funds Management, LLC and the Fund disclaim any obligation to publicly update or revise any views expressed or forward-looking statements.
NOT FDIC INSURED ¡ NO BANK GUARANTEE ¡ MAY LOSE VALUE
| | | | |
| 2 | | Wells Fargo Money Market Fund | | Letter to shareholders (unaudited) |

Karla M. Rabusch
President
Wells Fargo Funds
We do not anticipate broad changes to the way we manage our money market funds at this time in order to meet the new rules because we have always emphasized stability of principal and liquidity.
Dear Valued Shareholder:
We are pleased to offer you this semi-annual report for the Wells Fargo Money Market Fund for the six-month period that ended July 31, 2016. The period was marked by preparation for the new amendments to Rule 2a-7 of the Investment Company Act of 1940 (Rule 2a-7) by the U.S. Securities and Exchange Commission. Meanwhile, the U.S. Federal Reserve (Fed) kept the federal funds target rate between 0.25% and 0.50%.
We are preparing to implement the new money market fund regulations.
The amendments to Rule 2a-7, which governs money market funds, are scheduled to be fully implemented by October 2016. To recap, U.S. Treasury and government money market funds will continue to operate much as they do today, with stable $1.00 net asset values (NAVs). Meanwhile, tax-exempt and prime funds will experience more changes. For starters, these types of funds must separate retail investors, such as individuals, and institutional investors. Second, money market fund boards of directors will have discretion to impose either a liquidity fee of up to 2% on shareholder redemptions or a temporary suspension of redemptions (gate) if a fund’s weekly liquid assets fall below 30% of its total assets and the board determines that the fee or gate is in the best interest of the fund’s shareholders.
| | n | | Retail investors will continue to transact at a stable $1.00 NAV but may be subject to liquidity fees and redemption gates. | |
| | n | | Institutional prime and tax-exempt money market funds will transact at a floating, market-based NAV and may be subject to liquidity fees and redemption gates under special circumstances. Once floating NAVs are implemented, daily share prices will fluctuate along with changes, if any, in the market-based value of the underlying portfolio securities. Our Product Alert titled Wells Fargo Announces Effective Dates for Changes to Certain Money Market Funds featured the intraday price times we will use to continue providing same-day settlement and liquidity to our shareholders. | |
| | n | | Additional requirements included increased disclosure and reporting of fund statistics, such as percentage of liquid assets, shareholder flows, and market-based NAVs. In addition, the new regulations also included tighter diversification requirements and enhanced stress-testing measures. | |
| | n | | We will continue to communicate any changes to our money markets funds with our shareholders. Specifically, Product Alerts can be found at our website: wellsfargofunds.com. Click on Product Information and find them under the Product Alerts tab. | |
While there will be many operational changes ahead, we do not anticipate broad changes to the way we manage our money market funds at this time in order to meet the new rules because we have always emphasized stability of principal and liquidity.
Short-term rates remained steady but low.
The Fed kept the federal funds rate steady. On the growth side of its mandate, U.S. economic activity appeared to maintain a modest pace. Global concerns continued to confront the Fed as it tried to assess future conditions in the U.S. While China’s growth and its markets stabilized post first-quarter downdrafts, it continued to “face considerable challenges,” per Fed Chair Janet Yellen in her
| | | | | | |
| Letter to shareholders (unaudited) | | Wells Fargo Money Market Fund | | | 3 | |
monetary policy report to Congress. Further, although commodity prices rebounded from first-quarter lows, other worries remained. The strong dollar, which could hamper manufacturing and exports, is one factor. Another is potential fallout from Brexit, the referendum whereby the U.K. voted to leave the European Union. With growth and inflation low, Chair Yellen has argued in her monetary policy report that there is little room to cut rates further but plenty of scope to raise rates if inflation picks up too quickly.
With regard to Brexit, traditional risk assets—such as equities and foreign exchange—experienced volatility and U.S. Treasury securities benefited from a flight to quality. Money markets, however, were relatively immune to this volatility, with both credit spreads and liquidity little changed.
Don’t let short-term uncertainty derail long-term investment goals.
Periods of uncertainty can present challenges, but experience has taught us that maintaining long-term investment goals can be an effective way to plan for the future. To help you create a sound strategy based on your personal goals and risk tolerance, Wells Fargo Funds offers more than 100 mutual funds spanning a wide range of asset classes and investment styles. Although diversification cannot guarantee an investment profit or prevent losses, we believe it can be an effective way to manage investment risk and potentially smooth out overall portfolio performance. We encourage investors to know their investments and to understand that appropriate levels of risk-taking may unlock opportunities.
Thank you for choosing to invest in Wells Fargo Funds. We appreciate your confidence in us and remain committed to helping you meet your financial needs.
Sincerely,

Karla M. Rabusch
President
Wells Fargo Funds
Periods of uncertainty can present challenges, but experience has taught us that maintaining long-term investment goals can be an effective way to plan for the future.
For further information about your Fund, contact your investment professional, visit our website at wellsfargofunds.com, or call us directly at 1-800-222-8222. We are available 24 hours a day, 7 days a week.
| | | | |
| 4 | | Wells Fargo Money Market Fund | | Performance highlights (unaudited) |
Investment objective
The Fund seeks current income, while preserving capital and liquidity.
Manager
Wells Fargo Funds Management, LLC
Subadvisers
Wells Capital Management Incorporated
Wells Capital Management Singapore
Portfolio managers
Michael C. Bird, CFA®
Jeffrey L. Weaver, CFA®
Laurie White
Average annual total returns (%) as of July 31, 20161
| | | | | | | | | | | | | | | | | | | | | | | | | | | | | | | | | | |
| | | | | Including sales charge | | | Excluding sales charge | | | Expense ratios2 (%) | |
| | | Inception date | | 1 year | | | 5 year | | | 10 year | | | 1 year | | | 5 year | | | 10 year | | | Gross | | | Net3 | |
| Class A (STGXX) | | 7-1-1992 | | | – | | | | – | | | | – | | | | 0.01 | | | | 0.01 | | | | 0.89 | | | | 0.82 | | | | 0.65 | |
| Class B* | | 7-1-1992 | | | (4.99 | ) | | | (0.39 | ) | | | 0.70 | | | | 0.01 | | | | 0.01 | | | | 0.70 | | | | 1.57 | | | | 1.40 | |
| Class C** | | 6-30-2010 | | | (0.99 | ) | | | 0.01 | | | | 0.70 | | | | 0.01 | | | | 0.01 | | | | 0.70 | | | | 1.57 | | | | 1.40 | |
| Daily Class*** | | 6-30-2010 | | | – | | | | – | | | | – | | | | 0.01 | | | | 0.01 | | | | 0.89 | | | | 1.07 | | | | 1.00 | |
| Premier Class (WMPXX) | | 3-31-2016 | | | – | | | | – | | | | – | | | | 0.11 | | | | 0.03 | | | | 0.90 | | | | 0.43 | | | | 0.20 | |
| Service Class (WMOXX) | | 6-30-2010 | | | – | | | | – | | | | – | | | | 0.02 | | | | 0.01 | | | | 0.93 | | | | 0.72 | | | | 0.50 | |
Yield summary (%) as of July 31, 20163
| | | | | | | | | | | | | | | | | | | | | | |
| | | Class A | | Class B* | | | Class C** | | | Daily
Class*** | | | Premier
Class | | | Service
Class | |
| 7-day current yield | | 0.01 | | | 0.01 | | | | 0.01 | | | | 0.01 | | | | 0.31 | | | | 0.01 | |
| 7-day compound yield | | 0.01 | | | 0.01 | | | | 0.01 | | | | 0.01 | | | | 0.31 | | | | 0.01 | |
| 30-day simple yield | | 0.01 | | | 0.01 | | | | 0.01 | | | | 0.01 | | | | 0.31 | | | | 0.02 | |
| 30-day compound yield | | 0.01 | | | 0.01 | | | | 0.01 | | | | 0.01 | | | | 0.31 | | | | 0.02 | |
| * | | Class B shares are closed to investment, except in connection with the reinvestment of any distributions and permitted exchanges. |
| ** | | Class C shares are available only to shareholders making an exchange out of Class C shares of another mutual fund within the Wells Fargo family of funds. |
| *** | | Effective September 1, 2016, Daily Class shares are no longer offered by the Fund. |
Figures quoted represent past performance, which is no guarantee of future results, and do not reflect taxes that a shareholder may pay on fund distributions or the redemption of fund shares. Investment returns will fluctuate. The Fund’s yield figures more closely reflect the current earnings of the Fund than the total return figures. Current performance may be lower or higher than the performance data quoted, which assumes the reinvestment of dividends and capital gains. Current month-end performance is available on the Fund’s website, wellsfargofunds.com.
Class A shares, Daily Class shares, Service Class, and Premier Class shares are sold without a front-end sales charge or contingent deferred sales charge. For Class B shares, the maximum contingent deferred sales charge is 5.00%. For Class C shares, the maximum contingent deferred sales charge is 1.00%. Performance including a contingent deferred sales charge assumes the sales charge for the corresponding time period.
An investment in a money market fund is not insured or guaranteed by the Federal Deposit Insurance Corporation or any other government agency. Although the Fund seeks to preserve the value of your investment at $1.00 per share, it is possible to lose money by investing in a money market fund.
Please see footnotes on page 5.
| | | | | | |
| Performance highlights (unaudited) | | Wells Fargo Money Market Fund | | | 5 | |
|
| Portfolio composition as of July 31, 20164 |
|
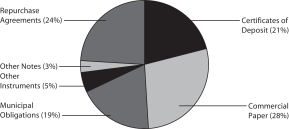 |
|
| Effective maturity distribution as of July 31, 20164 |
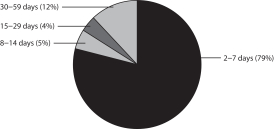 |
|
| Weighted average maturity as of July 31, 20165 |
8 days |
|
| Weighted average life as of July 31, 20166 |
11 days |
| 1 | Historical performance shown for Class C shares prior to their inception reflects the performance of Class B shares. Class B and Class C shares have the same expenses. Historical performance shown for Daily Class shares prior to their inception reflects the performance of Class A shares, and has not been adjusted to reflect the higher expenses applicable to Daily Class shares. If these expenses had been adjusted, returns would be lower. Historical performance shown for Service Class shares prior to their inception reflects the performance of the former Investor Class shares, and includes the higher expenses applicable to the former Investor Class shares. If these expenses had not been included, returns would be higher. Historical performance shown for Premier Class shares prior to their inception reflects the performance of Class A shares, and includes the higher expenses applicable to Class A shares. If these expenses have not been included, returns would be higher. |
| 2 | Reflects the expense ratios as stated in the most recent prospectuses. The expense ratios shown are subject to change and may differ from the annualized expense ratios shown in the financial highlights of this report. |
| 3 | The manager has contractually committed through May 31, 2017, to waive fees and/or reimburse expenses to the extent necessary to cap the Fund’s Total Annual Fund Operating Expenses After Fee Waiver at the amounts shown. After this time, the cap may be increased or the commitment to maintain the cap may be terminated only with the approval of the Board of Trustees. Brokerage commissions, stamp duty fees, interest, taxes, acquired fund fees and expenses, and extraordinary expenses are excluded from the cap. Without this cap, the Fund’s returns would have been lower. Without waived fees and/or reimbursed expenses, the Fund’s 7-day current yield would have been (0.32)%, (1.07)%, (1.07)%, (0.57)%, 0.07%, and (0.22)% for Class A, Class B, Class C, Daily Class, Premier Class, and Service Class, respectively. |
| 4 | Amounts are calculated based on the total investments of the Fund. These amounts are subject to change and may have changed since the date specified. |
| 5 | Weighted Average Maturity (WAM): WAM is an average of the effective maturities of all securities held in the portfolio, weighted by each security’s percentage of total investments. The maturity of a portfolio security is the period remaining until the date on which the principal amount is unconditionally required to be paid, or in the case of a security called for redemption, the date on which the redemption payment is unconditionally required to be made. WAM calculations allow for the maturities of certain securities with demand features or periodic interest rate resets to be shortened. WAM is a way to measure a fund’s sensitivity to potential interest rate changes. Rule 2a-7 under the Investment Company Act of 1940 requires money market funds to maintain a WAM of 60 calendar days or less. WAM is subject to change and may have changed since the date specified. |
| 6 | Weighted Average Life (WAL): WAL is an average of the final maturities of all securities held in the portfolio, weighted by their percentage of total investments. The maturity of a portfolio security is the period remaining until the date on which the principal amount is unconditionally required to be paid, or in the case of a security called for redemption, the date on which the redemption payment is unconditionally required to be made. In contrast to WAM, the calculation of WAL allows for the maturities of certain securities with demand features to be shortened, but not the periodic interest rate resets. WAL is a way to measure a fund’s potential sensitivity to credit spread changes. Rule 2a-7 under the Investment Company Act of 1940 requires money market funds to maintain a WAL of 120 calendar days or less. WAL is subject to change and may have changed since the date specified. |
| | | | |
| 6 | | Wells Fargo Money Market Fund | | Fund expenses (unaudited) |
As a shareholder of the Fund, you incur two types of costs: (1) transaction costs, including contingent deferred sales charges (if any) on redemptions and (2) ongoing costs, including management fees, distribution (12b-1) and/or shareholder service fees, and other Fund expenses. This example is intended to help you understand your ongoing costs (in dollars) of investing in the Fund and to compare these costs with the ongoing costs of investing in other mutual funds.
The example is based on an investment of $1,000 invested at the beginning of the six-month period and held for the entire period from February 1, 2016 to July 31, 2016.
Actual expenses
The “Actual” line of the table below provides information about actual account values and actual expenses. You may use the information in this line, together with the amount you invested, to estimate the expenses that you paid over the period. Simply divide your account value by $1,000 (for example, an $8,600 account value divided by $1,000 = 8.6), then multiply the result by the number in the “Actual” line under the heading entitled “Expenses paid during period” for your applicable class of shares to estimate the expenses you paid on your account during this period.
Hypothetical example for comparison purposes
The “Hypothetical” line of the table below provides information about hypothetical account values and hypothetical expenses based on the Fund’s actual expense ratio and an assumed rate of return of 5% per year before expenses, which is not the Fund’s actual return. The hypothetical account values and expenses may not be used to estimate the actual ending account balance or expenses you paid for the period. You may use this information to compare the ongoing costs of investing in the Fund and other funds. To do so, compare this 5% hypothetical example with the 5% hypothetical examples that appear in the shareholder reports of the other funds.
Please note that the expenses shown in the table are meant to highlight your ongoing costs only and do not reflect any transactional costs, such as sales charges (loads) and contingent deferred sales charges. Therefore, the “Hypothetical” line of the table is useful in comparing ongoing costs only and will not help you determine the relative total costs of owning different funds. In addition, if these transactional costs were included, your cost would have been higher.
| | | | | | | | | | | | | | | | |
| | | Beginning
account value
2-1-2016 | | | Ending
account value
7-31-2016 | | | Expenses
paid during
the period¹ | | | Annualized net
expense ratio | |
Class A | | | | | | | | | | | | | | | | |
Actual | | $ | 1,000.00 | | | $ | 1,000.05 | | | $ | 2.59 | | | | 0.52 | % |
Hypothetical (5% return before expenses) | | $ | 1,000.00 | | | $ | 1,022.34 | | | $ | 2.62 | | | | 0.52 | % |
Class B | | | | | | | | | | | | | | | | |
Actual | | $ | 1,000.00 | | | $ | 1,000.05 | | | $ | 2.59 | | | | 0.52 | % |
Hypothetical (5% return before expenses) | | $ | 1,000.00 | | | $ | 1,022.34 | | | $ | 2.62 | | | | 0.52 | % |
Class C | | | | | | | | | | | | | | | | |
Actual | | $ | 1,000.00 | | | $ | 1,000.05 | | | $ | 2.59 | | | | 0.52 | % |
Hypothetical (5% return before expenses) | | $ | 1,000.00 | | | $ | 1,022.34 | | | $ | 2.62 | | | | 0.52 | % |
Daily Class | | | | | | | | | | | | | | | | |
Actual | | $ | 1,000.00 | | | $ | 1,000.05 | | | $ | 2.59 | | | | 0.52 | % |
Hypothetical (5% return before expenses) | | $ | 1,000.00 | | | $ | 1,022.34 | | | $ | 2.62 | | | | 0.52 | % |
Premier Class | | | | | | | | | | | | | | | | |
Actual | | $ | 1,000.00 | | | $ | 1,001.10 | | | $ | 1.00 | | | | 0.20 | % |
Hypothetical (5% return before expenses) | | $ | 1,000.00 | | | $ | 1,023.93 | | | $ | 1.01 | | | | 0.20 | % |
Service Class | | | | | | | | | | | | | | | | |
Actual | | $ | 1,000.00 | | | $ | 1,000.15 | | | $ | 2.49 | | | | 0.50 | % |
Hypothetical (5% return before expenses) | | $ | 1,000.00 | | | $ | 1,022.44 | | | $ | 2.52 | | | | 0.50 | % |
| 1 | Expenses paid is equal to the annualized net expense ratio of each class multiplied by the average account value over the period, multiplied by the number of days in the most recent fiscal half-year divided by the number of days in the fiscal year (to reflect the one-half-year period). |
| | | | | | |
| Summary portfolio of investments—July 31, 2016 (unaudited) | | Wells Fargo Money Market Fund | | | 7 | |
The Summary portfolio of investments shows the 50 largest portfolio holdings in unaffiliated issuers and any holdings exceeding 1% of the total net assets as of the report date. The remaining securities held are grouped as “Other securities” in each category.
| | | | | | | | | | | | | | | | | | | | |
| Security name | | Interest rate | | | Maturity date | | | Principal | | | Value | | | Percent of
net assets | |
| | | | | |
Agency Securities: 0.63% | | | | | | | | | | | | | | | | | | | | |
FHLB (z) | | | 0.41 | % | | | 8-3-2016 | | | $ | 10,000,000 | | | $ | 9,999,772 | | | | 0.63 | % |
| | | | | | | | | | | | | | | | | | | | |
| | | | | |
Total Agency Securities (Cost $9,999,772) | | | | | | | | | | | | | | | 9,999,772 | | | | 0.63 | |
| | | | | | | | | | | | | | | | | | | | |
| | | | | |
Certificates of Deposit: 21.39% | | | | | | | | | | | | | | | | | | | | |
ABN AMRO Funding LLC | | | 0.40 | | | | 8-1-2016 | | | | 13,000,000 | | | | 13,000,000 | | | | 0.81 | |
Australia & New Zealand Banking Group | | | 0.30 | | | | 8-1-2016 | | | | 20,000,000 | | | | 20,000,000 | | | | 1.25 | |
Bank of Montreal | | | 0.44 | | | | 8-1-2016 | | | | 14,000,000 | | | | 14,000,000 | | | | 0.88 | |
Bank of Montreal | | | 0.44 | | | | 8-2-2016 | | | | 7,000,000 | | | | 7,000,000 | | | | 0.44 | |
Barclays Bank plc 144A(z) | | | 0.68 | | | | 8-1-2016 | | | | 7,000,000 | | | | 7,000,000 | | | | 0.44 | |
Credit Agricole SA | | | 0.32 | | | | 8-1-2016 | | | | 32,000,000 | | | | 32,000,000 | | | | 2.01 | |
DG Bank (New York) | | | 0.65 | | | | 8-8-2016 | | | | 8,000,000 | | | | 8,000,058 | | | | 0.50 | |
DNB Nor Bank ASA | | | 0.30 | | | | 8-1-2016 | | | | 33,000,000 | | | | 33,000,000 | | | | 2.07 | |
HSBC Bank plc | | | 0.35 | | | | 8-1-2016 | | | | 32,000,000 | | | | 32,000,000 | | | | 2.01 | |
HSBC Bank plc ± | | | 0.80 | | | | 8-1-2016 | | | | 3,000,000 | | | | 3,000,000 | | | | 0.19 | |
KBC Bank | | | 0.32 | | | | 8-1-2016 | | | | 29,000,000 | | | | 29,000,000 | | | | 1.82 | |
National Bank of Canada | | | 0.30 | | | | 8-1-2016 | | | | 17,000,000 | | | | 17,000,000 | | | | 1.07 | |
NBAD Americas NV | | | 0.37 | | | | 8-1-2016 | | | | 27,000,000 | | | | 27,000,000 | | | | 1.69 | |
Sumitomo Mitsui Banking Corporation | | | 0.62 | | | | 8-5-2016 | | | | 8,000,000 | | | | 8,000,000 | | | | 0.50 | |
Sumitomo Trust & Banking Corporation | | | 0.46 | | | | 8-1-2016 | | | | 20,000,000 | | | | 20,000,000 | | | | 1.25 | |
Swedbank | | | 0.30 | | | | 8-1-2016 | | | | 27,000,000 | | | | 27,000,000 | | | | 1.69 | |
Other securities | | | | | | | | | | | | | | | 43,996,404 | | | | 2.77 | |
| | | | | |
Total Certificates of Deposit (Cost $340,996,462) | | | | | | | | | | | | | | | 340,996,462 | | | | 21.39 | |
| | | | | | | | | | | | | | | | | | | | |
| | | | | |
Commercial Paper: 28.26% | | | | | | | | | | | | | | | | | | | | |
| | | | | |
| Asset-Backed Commercial Paper: 16.70% | | | | | | | | | | | | | | | | | | | | |
Alpine Securitization Limited 144A(z) | | | 0.55 | | | | 8-8-2016 | | | | 9,000,000 | | | | 8,999,038 | | | | 0.56 | |
Alpine Securitization Limited | | | 0.57 | | | | 8-11-2016 to 8-12-2016 | | | | 8,000,000 | | | | 7,998,654 | | | | 0.50 | |
Anglesea Funding LLC 144A(z) | | | 0.50 | | | | 8-1-2016 | | | | 10,000,000 | | | | 10,000,000 | | | | 0.63 | |
Bennington Stark Capital Company LLC 144A(z) | | | 0.50 | | | | 8-2-2016 | | | | 15,000,000 | | | | 14,999,792 | | | | 0.94 | |
Bennington Stark Capital Company LLC 144A(z) | | | 0.50 | | | | 8-3-2016 | | | | 3,000,000 | | | | 2,999,917 | | | | 0.19 | |
Caisse D’amortissement de la Dette Sociale 144A(z) | | | 0.68 | | | | 9-19-2016 | | | | 9,600,000 | | | | 9,591,180 | | | | 0.60 | |
Chesham Finance Limited 144A(z) | | | 0.50 | | | | 8-1-2016 | | | | 7,000,000 | | | | 7,000,000 | | | | 0.44 | |
Concord Minutemen Capital Company
144A(z) | | | 0.47 | | | | 8-2-2016 | | | | 6,000,000 | | | | 5,999,922 | | | | 0.38 | |
Concord Minutemen Capital Company
144A(z) | | | 0.47 | | | | 8-4-2016 | | | | 8,000,000 | | | | 7,999,687 | | | | 0.50 | |
Institutional Secured Funding LLC 144A(z) | | | 0.55 | | | | 8-1-2016 | | | | 20,000,000 | | | | 20,000,000 | | | | 1.25 | |
Institutional Secured Funding LLC 144A(z) | | | 0.65 | | | | 8-12-2016 | | | | 2,000,000 | | | | 1,999,603 | | | | 0.13 | |
Lexington Parker Capital Company LLC 144A(z) | | | 0.47 | | | | 8-2-2016 | | | | 6,000,000 | | | | 5,999,922 | | | | 0.38 | |
Lexington Parker Capital Company LLC 144A(z) | | | 0.47 | | | | 8-1-2016 | | | | 8,000,000 | | | | 8,000,000 | | | | 0.50 | |
Lexington Parker Capital Company LLC 144A(z) | | | 0.47 | | | | 8-4-2016 | | | | 4,000,000 | | | | 3,999,843 | | | | 0.25 | |
Mountcliff Funding LLC 144A(z) | | | 0.51 | | | | 8-1-2016 | | | | 9,000,000 | | | | 9,000,000 | | | | 0.56 | |
Sheffield Receivable 144A(z) | | | 0.65 | | | | 8-4-2016 | | | | 8,000,000 | | | | 7,999,567 | | | | 0.50 | |
Starbird Funding Corporation | | | 0.63-0.68 | | | | 8-1-2016 to 9-16-2016 | | | | 19,000,000 | | | | 18,997,428 | | | | 1.20 | |
Versailles Commercial Paper LLC ±144A | | | 0.63 | | | | 12-8-2016 | | | | 7,000,000 | | | | 7,000,000 | | | | 0.44 | |
Other securities | | | | | | | | | | | | | | | 107,610,040 | | | | 6.75 | |
| | | | | |
| | | | | | | | | | | | | | | 266,194,593 | | | | 16.70 | |
| | | | | | | | | | | | | | | | | | | | |
The accompanying notes are an integral part of these financial statements.
| | | | |
| 8 | | Wells Fargo Money Market Fund | | Summary portfolio of investments—July 31, 2016 (unaudited) |
| | | | | | | | | | | | | | | | | | | | |
| Security name | | Interest rate | | | Maturity date | | | Principal | | | Value | | | Percent of
net assets | |
| | | | | |
| Financial Company Commercial Paper: 9.68% | | | | | | | | | | | | | | | | | | | | |
Caisse Centrale Desjardins du Quebec
144A(z) | | | 0.55 | % | | | 8-8-2016 | | | $ | 8,200,000 | | | $ | 8,199,127 | | | | 0.51 | % |
Commonwealth Bank of Australia ±144A | | | 0.83 | | | | 8-17-2016 | | | | 7,000,000 | | | | 7,000,000 | | | | 0.44 | |
Dexia Credit Local (z) | | | 0.65 | | | | 9-12-2016 | | | | 8,000,000 | | | | 7,993,933 | | | | 0.50 | |
Macquarie Bank Limited 144A(z) | | | 0.55 | | | | 8-1-2016 | | | | 7,000,000 | | | | 7,000,000 | | | | 0.44 | |
Macquarie Bank Limited | | | 0.55-0.65 | | | | 8-18-2016 to 9-7-2016 | | | | 14,000,000 | | | | 13,994,107 | | | | 0.88 | |
Nederlandse Waterschapsbank NV 144A(z) | | | 0.56 | | | | 8-8-2016 | | | | 8,000,000 | | | | 7,999,129 | | | | 0.50 | |
NRW Bank 144A(z) | | | 0.44 | | | | 8-2-2016 | | | | 10,000,000 | | | | 9,999,878 | | | | 0.63 | |
NV Bank Nederlandse Gemeenten 144A(z) | | | 0.63 | | | | 8-31-2016 | | | | 8,000,000 | | | | 7,995,800 | | | | 0.50 | |
Other securities | | | | | | | | | | | | | | | 84,153,614 | | | | 5.28 | |
| | | | | |
| | | | | | | | | | | | | | | 154,335,588 | | | | 9.68 | |
| | | | | | | | | | | | | | | | | | | | |
| | | | | |
| Other Commercial Paper: 1.88% | | | | | | | | | | | | | | | | | | | | |
China Shipping Container Lines (z) | | | 1.00 | | | | 8-1-2016 | | | | 14,000,000 | | | | 14,000,000 | | | | 0.88 | |
Toyota Motor Credit Corporation (z) | | | 0.60 | | | | 8-3-2016 | | | | 7,000,000 | | | | 6,999,763 | | | | 0.44 | |
Other securities | | | | | | | | | | | | | | | 8,998,818 | | | | 0.56 | |
| | | | | |
| | | | | | | | | | | | | | | 29,998,581 | | | | 1.88 | |
| | | | | | | | | | | | | | | | | | | | |
| | | | | |
Total Commercial Paper (Cost $450,528,762) | | | | | | | | | | | | | | | 450,528,762 | | | | 28.26 | |
| | | | | | | | | | | | | | | | | | | | |
| | | | | |
Municipal Obligations: 18.31% | | | | | | | | | | | | | | | | | | | | |
| | | | | |
Alabama: 0.13% | | | | | | | | | | | | | | | | | | | | |
| | | | | |
| Variable Rate Demand Notes ø: 0.13% | | | | | | | | | | | | | | | | | | | | |
Other securities | | | | | | | | | | | | | | | 2,000,000 | | | | 0.13 | |
| | | | | | | | | | | | | | | | | | | | |
| | | | | |
Arizona: 0.38% | | | | | | | | | | | | | | | | | | | | |
| | | | | |
| Other Municipal Debt: 0.38% | | | | | | | | | | | | | | | | | | | | |
Other securities | | | | | | | | | | | | | | | 5,999,336 | | | | 0.38 | |
| | | | | | | | | | | | | | | | | | | | |
| | | | | |
Arkansas: 0.13% | | | | | | | | | | | | | | | | | | | | |
| | | | | |
| Variable Rate Demand Notes ø: 0.13% | | | | | | | | | | | | | | | | | | | | |
Other securities | | | | | | | | | | | | | | | 2,000,000 | | | | 0.13 | |
| | | | | | | | | | | | | | | | | | | | |
| | | | | |
California: 0.56% | | | | | | | | | | | | | | | | | | | | |
| | | | | |
| Variable Rate Demand Notes ø: 0.56% | | | | | | | | | | | | | | | | | | | | |
Other securities | | | | | | | | | | | | | | | 9,000,000 | | | | 0.56 | |
| | | | | | | | | | | | | | | | | | | | |
| | | | | |
Colorado: 1.48% | | | | | | | | | | | | | | | | | | | | |
| | | | | |
| Variable Rate Demand Notes ø: 1.48% | | | | | | | | | | | | | | | | | | | | |
Colorado HFA MFHR Project B-2 (Housing Revenue, FHLB SPA) | | | 0.48 | | | | 5-1-2052 | | | | 14,675,000 | | | | 14,675,000 | | | | 0.92 | |
Other securities | | | | | | | | | | | | | | | 9,000,000 | | | | 0.56 | |
| | | | | |
| | | | | | | | | | | | | | | 23,675,000 | | | | 1.48 | |
| | | | | | | | | | | | | | | | | | | | |
| | | | | |
Connecticut: 2.49% | | | | | | | | | | | | | | | | | | | | |
| | | | | |
| Variable Rate Demand Notes ø: 2.49% | | | | | | | | | | | | | | | | | | | | |
Connecticut Series C (GO Revenue, Bank of America NA SPA) | | | 0.45 | | | | 5-15-2034 | | | | 6,000,000 | | | | 6,000,000 | | | | 0.38 | |
The accompanying notes are an integral part of these financial statements.
| | | | | | |
| Summary portfolio of investments—July 31, 2016 (unaudited) | | Wells Fargo Money Market Fund | | | 9 | |
| | | | | | | | | | | | | | | | | | | | |
| Security name | | Interest rate | | | Maturity date | | | Principal | | | Value | | | Percent of
net assets | |
| | | | | |
| Variable Rate Demand Notes ø (continued) | | | | | | | | | | | | | | | | | | | | |
Puttable Floating Option Taxable Series TNP-1013 (Miscellaneous Revenue, Bank of America NA LIQ) 144A | | | 0.55 | % | | | 4-15-2046 | | | $ | 33,645,000 | | | $ | 33,645,000 | | | | 2.11 | % |
| | | | | |
| | | | | | | | | | | | | | | 39,645,000 | | | | 2.49 | |
| | | | | | | | | | | | | | | | | | | | |
| | | | | |
District of Columbia: 1.88% | | | | | | | | | | | | | | | | | | | | |
| | | | | |
| Variable Rate Demand Notes ø: 1.88% | | | | | | | | | | | | | | | | | | | | |
Howard University (Education Revenue) ± | | | 0.54 | | | | 8-1-2031 | | | | 28,000,000 | | | | 28,000,000 | | | | 1.76 | |
Other securities | | | | | | | | | | | | | | | 2,000,000 | | | | 0.12 | |
| | | | | |
| | | | | | | | | | | | | | | 30,000,000 | | | | 1.88 | |
| | | | | | | | | | | | | | | | | | | | |
| | | | | |
Georgia: 0.31% | | | | | | | | | | | | | | | | | | | | |
| | | | | |
| Variable Rate Demand Notes ø: 0.31% | | | | | | | | | | | | | | | | | | | | |
Other securities | | | | | | | | | | | | | | | 4,935,000 | | | | 0.31 | |
| | | | | | | | | | | | | | | | | | | | |
| | | | | |
Idaho: 0.13% | | | | | | | | | | | | | | | | | | | | |
| | | | | |
| Other Municipal Debt: 0.13% | | | | | | | | | | | | | | | | | | | | |
Other securities | | | | | | | | | | | | | | | 1,999,857 | | | | 0.13 | |
| | | | | | | | | | | | | | | | | | | | |
| | | | | |
Illinois: 0.63% | | | | | | | | | | | | | | | | | | | | |
| | | | | |
| Variable Rate Demand Notes ø: 0.63% | | | | | | | | | | | | | | | | | | | | |
Other securities | | | | | | | | | | | | | | | 10,000,000 | | | | 0.63 | |
| | | | | | | | | | | | | | | | | | | | |
| | | | | |
Louisiana: 1.42% | | | | | | | | | | | | | | | | | | | | |
| | | | | |
| Variable Rate Demand Notes ø: 1.42% | | | | | | | | | | | | | | | | | | | | |
Puttable Floating Option Taxable Series TNP-1014 (Miscellaneous Revenue, Bank of America NA LIQ) 144A | | | 0.55 | | | | 6-1-2045 | | | | 22,625,000 | | | | 22,625,000 | | | | 1.42 | |
| | | | | | | | | | | | | | | | | | | | |
| | | | | |
| | | | | | | | | | | | | | | 22,625,000 | | | | 1.42 | |
| | | | | | | | | | | | | | | | | | | | |
| | | | | |
Maryland: 0.31% | | | | | | | | | | | | | | | | | | | | |
| | | | | |
| Variable Rate Demand Notes ø: 0.31% | | | | | | | | | | | | | | | | | | | | |
Other securities | | | | | | | | | | | | | | | 4,965,000 | | | | 0.31 | |
| | | | | | | | | | | | | | | | | | | | |
| | | | | |
Massachusetts: 0.31% | | | | | | | | | | | | | | | | | | | | |
| | | | | |
| Variable Rate Demand Notes ø: 0.31% | | | | | | | | | | | | | | | | | | | | |
Other securities | | | | | | | | | | | | | | | 5,000,000 | | | | 0.31 | |
| | | | | | | | | | | | | | | | | | | | |
| | | | | |
Michigan: 0.25% | | | | | | | | | | | | | | | | | | | | |
| | | | | |
| Variable Rate Demand Notes ø: 0.25% | | | | | | | | | | | | | | | | | | | | |
Other securities | | | | | | | | | | | | | | | 4,000,000 | | | | 0.25 | |
| | | | | | | | | | | | | | | | | | | | |
| | | | | |
Minnesota: 0.07% | | | | | | | | | | | | | | | | | | | | |
| | | | | |
| Variable Rate Demand Notes ø: 0.07% | | | | | | | | | | | | | | | | | | | | |
Other securities | | | | | | | | | | | | | | | 1,110,000 | | | | 0.07 | |
| | | | | | | | | | | | | | | | | | | | |
The accompanying notes are an integral part of these financial statements.
| | | | |
| 10 | | Wells Fargo Money Market Fund | | Summary portfolio of investments—July 31, 2016 (unaudited) |
| | | | | | | | | | | | | | | | | | | | |
| Security name | | Interest rate | | | Maturity date | | | Principal | | | Value | | | Percent of
net assets | |
| | | | | |
Missouri: 0.34% | | | | | | | | | | | | | | | | | | | | |
| | | | | |
| Variable Rate Demand Notes ø: 0.34% | | | | | | | | | | | | | | | | | | | | |
Other securities | | | | | | | | | | | | | | $ | 5,500,000 | | | | 0.34 | % |
| | | | | | | | | | | | | | | | | | | | |
| | | | | |
New York: 1.86% | | | | | | | | | | | | | | | | | | | | |
| | | | | |
| Variable Rate Demand Notes ø: 1.86% | | | | | | | | | | | | | | | | | | | | |
New York HFA 605 West 42 Street Series B (Housing Revenue, Bank of China LOC) | | | 0.83 | % | | | 5-1-2048 | | | $ | 10,000,000 | | | | 10,000,000 | | | | 0.63 | |
Other securities | | | | | | | | | | | | | | | 19,700,000 | | | | 1.23 | |
| | | | | |
| | | | | | | | | | | | | | | 29,700,000 | | | | 1.86 | |
| | | | | | | | | | | | | | | | | | | | |
| | | | | |
North Carolina: 0.15% | | | | | | | | | | | | | | | | | | | | |
| | | | | |
| Variable Rate Demand Notes ø: 0.15% | | | | | | | | | | | | | | | | | | | | |
Other securities | | | | | | | | | | | | | | | 2,465,000 | | | | 0.15 | |
| | | | | | | | | | | | | | | | | | | | |
| | | | | |
North Dakota: 0.31% | | | | | | | | | | | | | | | | | | | | |
| | | | | |
| Variable Rate Demand Notes ø: 0.31% | | | | | | | | | | | | | | | | | | | | |
Other securities | | | | | | | | | | | | | | | 5,000,000 | | | | 0.31 | |
| | | | | | | | | | | | | | | | | | | | |
| | | | | |
Ohio: 1.07% | | | | | | | | | | | | | | | | | | | | |
| | | | | |
| Variable Rate Demand Notes ø: 1.07% | | | | | | | | | | | | | | | | | | | | |
Ohio University Hospital Health System Series C (Health Revenue, Barclays Bank plc LOC) | | | 0.53 | | | | 1-15-2050 | | | | 12,000,000 | | | | 12,000,000 | | | | 0.75 | |
Other securities | | | | | | | | | | | | | | | 5,000,000 | | | | 0.32 | |
| | | | | |
| | | | | | | | | | | | | | | 17,000,000 | | | | 1.07 | |
| | | | | | | | | | | | | | | | | | | | |
| | | | | |
Oklahoma: 0.50% | | | | | | | | | | | | | | | | | | | | |
| | | | | |
| Variable Rate Demand Notes ø: 0.50% | | | | | | | | | | | | | | | | | | | | |
Oklahoma Grand River Dam Authority Series C (Utilities Revenue, Barclays Bank plc LOC) | | | 0.53 | | | | 6-1-2039 | | | | 8,000,000 | | | | 8,000,000 | | | | 0.50 | |
| | | | | | | | | | | | | | | | | | | | |
| | | | | |
| | | | | | | | | | | | | | | 8,000,000 | | | | 0.50 | |
| | | | | | | | | | | | | | | | | | | | |
| | | | | |
Oregon: 0.31% | | | | | | | | | | | | | | | | | | | | |
| | | | | |
| Variable Rate Demand Notes ø: 0.31% | | | | | | | | | | | | | | | | | | | | |
Other securities | | | | | | | | | | | | | | | 5,000,000 | | | | 0.31 | |
| | | | | | | | | | | | | | | | | | | | |
| | | | | |
Other: 0.48% | | | | | | | | | | | | | | | | | | | | |
| | | | | |
| Variable Rate Demand Notes ø: 0.48% | | | | | | | | | | | | | | | | | | | | |
Other securities | | | | | | | | | | | | | | | 7,675,000 | | | | 0.48 | |
| | | | | | | | | | | | | | | | | | | | |
| | | | | |
Pennsylvania: 0.13% | | | | | | | | | | | | | | | | | | | | |
| | | | | |
| Other Municipal Debt: 0.13% | | | | | | | | | | | | | | | | | | | | |
Other securities | | | | | | | | | | | | | | | 2,000,000 | | | | 0.13 | |
| | | | | | | | | | | | | | | | | | | | |
| | | | | |
South Carolina: 0.06% | | | | | | | | | | | | | | | | | | | | |
| | | | | |
| Other Municipal Debt: 0.06% | | | | | | | | | | | | | | | | | | | | |
Other securities | | | | | | | | | | | | | | | 1,000,000 | | | | 0.06 | |
| | | | | | | | | | | | | | | | | | | | |
The accompanying notes are an integral part of these financial statements.
| | | | | | |
| Summary portfolio of investments—July 31, 2016 (unaudited) | | Wells Fargo Money Market Fund | | | 11 | |
| | | | | | | | | | | | | | | | | | | | |
| Security name | | Interest rate | | | Maturity date | | | Principal | | | Value | | | Percent of
net assets | |
| | | | | |
Texas: 1.50% | | | | | | | | | | | | | | | | | | | | |
| | | | | |
| Variable Rate Demand Notes ø: 1.50% | | | | | | | | | | | | | | | | | | | | |
Brazos Harbor TX Industrial Development Corporation (Industrial Development Revenue) | | | 0.55 | % | | | 10-1-2036 | | | $ | 15,000,000 | | | $ | 15,000,000 | | | | 0.94 | % |
Other securities | | | | | | | | | | | | | | | 9,000,000 | | | | 0.56 | |
| | | | | |
| | | | | | | | | | | | | | | 24,000,000 | | | | 1.50 | |
| | | | | | | | | | | | | | | | | | | | |
| | | | | |
Utah: 0.13% | | | | | | | | | | | | | | | | | | | | |
| | | | | |
| Variable Rate Demand Notes ø: 0.13% | | | | | | | | | | | | | | | | | | | | |
Other securities | | | | | | | | | | | | | | | 2,000,000 | | | | 0.13 | |
| | | | | | | | | | | | | | | | | | | | |
| | | | | |
Washington: 0.13% | | | | | | | | | | | | | | | | | | | | |
| | | | | |
| Other Municipal Debt: 0.13% | | | | | | | | | | | | | | | | | | | | |
Other securities | | | | | | | | | | | | | | | 2,000,000 | | | | 0.13 | |
| | | | | | | | | | | | | | | | | | | | |
| | | | | |
Wisconsin: 0.86% | | | | | | | | | | | | | | | | | | | | |
| | | | | |
| Variable Rate Demand Notes ø: 0.86% | | | | | | | | | | | | | | | | | | | | |
Wisconsin PFA Cleveland State University Housing Project LLC (Housing Revenue, Bank of America NA LOC) | | | 0.43 | | | | 1-1-2042 | | | | 13,680,000 | | | | 13,680,000 | | | | 0.86 | |
| | | | | | | | | | | | | | | | | | | | |
| | | | | |
| | | | | | | | | | | | | | | 13,680,000 | | | | 0.86 | |
| | | | | | | | | | | | | | | | | | | | |
| | | | | |
Total Municipal Obligations (Cost $291,974,193) | | | | | | | | | | | | | | | 291,974,193 | | | | 18.31 | |
| | | | | | | | | | | | | | | | | | | | |
| | | | | |
Other: 0.31% | | | | | | | | | | | | | | | | | | | | |
Other securities | | | | | | | | | | | | | | | 5,000,000 | | | | 0.31 | |
| | | | | | | | | | | | | | | | | | | | |
| | | | | |
Other Instruments: 4.64% | | | | | | | | | | | | | | | | | | | | |
DBS Bank Limited Pooled Bank Deposit Product § | | | 0.50 | | | | 1-1-2050 | | | | 60,000,000 | | | | 60,000,000 | | | | 3.76 | |
Oversea-Chinese Banking Corporation Pooled Bank Deposit Product § | | | 0.45 | | | | 1-1-2050 | | | | 10,000,000 | | | | 10,000,000 | | | | 0.63 | |
Other securities | | | | | | | | | | | | | | | 4,000,000 | | | | 0.25 | |
| | | | | |
Total Other Instruments (Cost $74,000,000) | | | | | | | | | | | | | | | 74,000,000 | | | | 4.64 | |
| | | | | | | | | | | | | | | | | | | | |
| | | | | |
Other Notes: 3.21% | | | | | | | | | | | | | | | | | | | | |
| | | | | |
| Corporate Bonds and Notes: 3.21% | | | | | | | | | | | | | | | | | | | | |
United Overseas Bank Limited § | | | 0.49 | | | | 1-1-2050 | | | | 40,000,000 | | | | 40,000,000 | | | | 2.51 | |
Other securities | | | | | | | | | | | | | | | 11,090,000 | | | | 0.70 | |
| | | | | |
Total Other Notes (Cost $51,090,000) | | | | | | | | | | | | | | | 51,090,000 | | | | 3.21 | |
| | | | | | | | | | | | | | | | | | | | |
| | | | | |
Repurchase Agreements ^^: 23.81% | | | | | | | | | | | | | | | | | | | | |
Bank of America Corporation, dated 7-29-2016, maturity value $73,002,129 (1) | | | 0.35 | | | | 8-1-2016 | | | | 73,000,000 | | | | 73,000,000 | | | | 4.58 | |
Bank of Nova Scotia, dated 7-29-2016, maturity value $36,675,336 (2) | | | 0.34 | | | | 8-1-2016 | | | | 36,674,297 | | | | 36,674,297 | | | | 2.30 | |
Deutsche Bank Securities, dated 7-29-2016, maturity value $23,000,748 (3) | | | 0.39 | | | | 8-1-2016 | | | | 23,000,000 | | | | 23,000,000 | | | | 1.44 | |
Goldman Sachs & Company, dated 7-1-2016, maturity value $10,006,667 (4)§(i)¢± | | | 0.40 | | | | 8-30-2016 | | | | 10,000,000 | | | | 10,000,000 | | | | 0.63 | |
The accompanying notes are an integral part of these financial statements.
| | | | |
| 12 | | Wells Fargo Money Market Fund | | Summary portfolio of investments—July 31, 2016 (unaudited) |
| | | | | | | | | | | | | | | | | | | | |
| Security name | | Interest rate | | | Maturity date | | | Principal | | | Value | | | Percent of
net assets | |
| | | | | |
Repurchase Agreements ^^ (continued) | | | | | | | | | | | | | | | | | | | | |
GX Clarke & Company, dated 7-29-2016, maturity value $42,001,400 (5) | | | 0.40 | % | | | 8-1-2016 | | | $ | 42,000,000 | | | $ | 42,000,000 | | | | 2.63 | % |
JPMorgan Securities, dated 7-1-2016, maturity value $10,010,325 (6)§(i)¢± | | | 0.59 | | | | 9-2-2016 | | | | 10,000,000 | | | | 10,000,000 | | | | 0.63 | |
JPMorgan Securities, dated 7-1-2016, maturity value $5,001,636 (7)§¢± | | | 0.38 | | | | 8-1-2016 | | | | 5,000,000 | | | | 5,000,000 | | | | 0.31 | |
Normura, dated 7-29-2016 maturity value $180,006,450 (8) | | | 0.43 | | | | 8-1-2016 | | | | 180,000,000 | | | | 180,000,000 | | | | 11.29 | |
| | | | | |
Total Repurchase Agreements (Cost $379,674,297) | | | | | | | | | | | | | | | 379,674,297 | | | | 23.81 | |
| | | | | | | | | | | | | | | | | | | | |
| Total investments in securities (Cost $1,603,263,486) * | | | | | | | | | | | | | | | 1,603,263,486 | | | | 100.56 | |
Other assets and liabilities, net | | | | | | | | | | | | | | | (8,876,938 | ) | | | (0.56 | ) |
| | | | | | | | | | | | | | | | | | | | |
| Total net assets | | | | | | | | | | | | | | $ | 1,594,386,548 | | | | 100.00 | % |
| | | | | | | | | | | | | | | | | | | | |
| (z) | Zero coupon security. The rate represents the current yield to maturity. |
| 144A | The security may be resold in transactions exempt from registration, normally to qualified institutional buyers, pursuant to Rule 144A under the Securities Act of 1933. |
| ± | Variable rate investment. The rate shown is the rate in effect at period end. |
| ø | Variable rate demand notes are subject to a demand feature which reduces the effective maturity. The maturity date shown represents the final maturity date of the security. The interest rate is determined and reset by the issuer daily, weekly, or monthly depending upon the terms of the security. The rate shown is the rate in effect at period end. |
| § | The security is subject to a demand feature which reduces the effective maturity. |
| ¢ | The security represents a long-dated and extendible repurchase agreement which automatically renews on previously set terms. The maturity date represents the next put date. |
| | (1) | U.S. government securities, 3.00% to 3.50%, 2-1-2043 to 9-1-2045, fair value including accrued interest is $75,190,000. |
| | (2) | U.S. government securities, 1.79% to 7.00%, 1-1-2020 to 7-1-2046, fair value including accrued interest is $37,774,526. |
| | (3) | U.S. government securities, 0.75% to 4.75%, 11-30-2016 to 8-15-2040, fair value including accrued interest is $23,460,001. |
| | (4) | U.S. government securities, 0.00% to 4.30%, 8-1-2016 to 8-1-2046, fair value including accrued interest is $10,230,535. |
| | (5) | U.S. government securities, 1.50% to 9.50%, 11-15-2016 to 5-20-2046, fair value including accrued interest is $43,260,005. |
| | (6) | U.S. government securities, 0.00%, 8-2-2016 to 3-7-2017, fair value is $10,200,000. |
| | (7) | U.S. government securities, 2.39% to 9.00%, 12-1-2020 to 2-1-2048, fair value including accrued interest is $5,150,093. |
| | (8) | U.S. government securities, 0.13% to 3.88%, 11-30-2016 to 4-15-2029, fair value including accrued interest is $183,600,035. |
| * | Cost for federal income tax purposes is substantially the same as for financial reporting purposes. |
The accompanying notes are an integral part of these financial statements.
| | | | | | |
| Statement of assets and liabilities—July 31, 2016 (unaudited) | | Wells Fargo Money Market Fund | | | 13 | |
| | | | |
| | | | |
| |
Assets | | | | |
Investments | | | | |
In unaffiliated securities, at amortized cost | | $ | 1,223,589,189 | |
In repurchase agreements, at amortized cost | | | 379,674,297 | |
| | | | |
Total investments, at amortized cost | | | 1,603,263,486 | |
Receivable for Fund shares sold | | | 446,840 | |
Receivable for interest | | | 336,833 | |
Receivable from manager | | | 94,136 | |
Prepaid expenses and other assets | | | 260,772 | |
| | | | |
Total assets | | | 1,604,402,067 | |
| | | | |
| |
Liabilities | | | | |
Dividends payable | | | 75,210 | |
Payable for investments purchased | | | 7,000,260 | |
Payable for Fund shares redeemed | | | 1,414,362 | |
Due to custodian bank | | | 300 | |
Distribution fees payable | | | 131,325 | |
Administration fees payable | | | 344,445 | |
Accrued expenses and other liabilities | | | 1,049,617 | |
| | | | |
Total liabilities | | | 10,015,519 | |
| | | | |
Total net assets | | $ | 1,594,386,548 | |
| | | | |
| |
NET ASSETS CONSIST OF | | | | |
Paid-in capital | | $ | 1,598,634,216 | |
Overdistributed net investment income | | | (367,600 | ) |
Accumulated net realized losses on investments | | | (3,880,068 | ) |
| | | | |
Total net assets | | $ | 1,594,386,548 | |
| | | | |
| |
COMPUTATION OF NET ASSET VALUE PER SHARE | | | | |
Net assets – Class A | | $ | 1,163,066,922 | |
Shares outstanding – Class A1 | | | 1,162,864,424 | |
Net asset value per share – Class A | | | $1.00 | |
Net assets – Class B | | $ | 472,306 | |
Shares outstanding – Class B1 | | | 472,224 | |
Net asset value per share – Class B | | | $1.00 | |
Net assets – Class C | | $ | 13,288,250 | |
Shares outstanding – Class C1 | | | 13,285,935 | |
Net asset value per share – Class C | | | $1.00 | |
Net assets – Daily Class | | $ | 311,186,381 | |
Shares outstanding – Daily Class1 | | | 311,130,157 | |
Net asset value per share – Daily Class | | | $1.00 | |
Net assets – Premier Class | | $ | 100,126 | |
Shares outstanding – Premier Class1 | | | 100,108 | |
Net asset value per share – Premier Class | | | $1.00 | |
Net assets – Service Class | | $ | 106,272,563 | |
Shares outstanding – Service Class1 | | | 106,251,803 | |
Net asset value per share – Service Class | | | $1.00 | |
| 1 | The Fund has an unlimited number of authorized shares. |
The accompanying notes are an integral part of these financial statements.
| | | | |
| 14 | | Wells Fargo Money Market Fund | | Statement of operations—six months ended July 31, 2016 (unaudited) |
| | | | |
| | | | |
| |
Investment income | | | | |
Interest | | $ | 6,374,314 | |
| | | | |
| |
Expenses | | | | |
Management fee | | | 4,036,645 | |
Administration fees | | | | |
Class A | | | 1,321,455 | |
Class B | | | 897 | |
Class C | | | 16,077 | |
Daily Class | | | 1,059,369 | |
Premier Class | | | 27 | 1 |
Service Class | | | 136,623 | |
Shareholder servicing fees | | | | |
Class A | | | 1,501,653 | |
Class B | | | 691 | |
Class C | | | 18,270 | |
Daily Class | | | 1,203,828 | |
Service Class | | | 280,466 | |
Distribution fees | | | | |
Class B | | | 3,057 | |
Class C | | | 54,809 | |
Daily Class | | | 1,203,828 | |
Custody and accounting fees | | | 81,868 | |
Professional fees | | | 25,371 | |
Registration fees | | | 65,368 | |
Shareholder report expenses | | | 950 | |
Trustees’ fees and expenses | | | 4,762 | |
Other fees and expenses | | | 22,142 | |
| | | | |
Total expenses | | | 11,038,156 | |
Less: Fee waivers and/or expense reimbursements | | | (4,807,716 | ) |
| | | | |
Net expenses | | | 6,230,440 | |
| | | | |
Net investment income | | | 143,874 | |
| | | | |
Net realized gains on investments | | | 1,895 | |
| | | | |
Net increase in net assets resulting from operations | | $ | 145,769 | |
| | | | |
| 1 | For the period from March 31, 2016 (commencement of class operations) to July 31, 2016 |
The accompanying notes are an integral part of these financial statements.
| | | | | | |
| Statement of changes in net assets | | Wells Fargo Money Market Fund | | | 15 | |
| | | | | | | | | | | | | | | | |
| | | Six months ended
July 31, 2016
(unaudited) | | | Year ended
January 31, 2016 | |
| | | | |
Operations | | | | | | | | | | | | | | | | |
Net investment income | | | | | | $ | 143,874 | | | | | | | $ | 275,512 | |
Net realized gains on investments | | | | | | | 1,895 | | | | | | | | 2,832 | |
| | | | |
Net increase in net assets resulting from operations | | | | | | | 145,769 | | | | | | | | 278,344 | |
| | | | |
| | | | |
Distributions to shareholders from | | | | | | | | | | | | | | | | |
Net investment income | | | | | | | | | | | | | | | | |
Class A | | | | | | | (60,223 | ) | | | | | | | (91,868 | ) |
Class B | | | | | | | (41 | ) | | | | | | | (238 | ) |
Class C | | | | | | | (733 | ) | | | | | | | (1,307 | ) |
Daily Class | | | | | | | (48,280 | ) | | | | | | | (117,623 | ) |
Investor Class | | | | | | | N/A | | | | | | | | (34,975 | )1 |
Premier Class | | | | | | | (108 | )2 | | | | | | | N/A | |
Service Class | | | | | | | (34,489 | ) | | | | | | | (29,501 | ) |
| | | | |
Total distributions to shareholders | | | | | | | (143,874 | ) | | | | | | | (275,512 | ) |
| | | | |
| | | | |
Capital share transactions | | | Shares | | | | | | | | Shares | | | | | |
Proceeds from shares sold | | | | | | | | | | | | | | | | |
Class A | | | 566,530,639 | | | | 566,530,639 | | | | 1,708,967,716 | | | | 1,708,967,716 | |
Class B | | | 12,747 | | | | 12,747 | | | | 144,381 | | | | 144,381 | |
Class C | | | 2,918,250 | | | | 2,918,250 | | | | 14,112,416 | | | | 14,112,416 | |
Daily Class | | | 2,090,192,376 | | | | 2,090,192,376 | | | | 5,653,474,910 | | | | 5,653,474,910 | |
Investor Class | | | N/A | | | | N/A | | | | 108,715,542 | 1 | | | 108,715,542 | 1 |
Premier Class | | | 100,000 | 2 | | | 100,000 | 2 | | | N/A | | | | N/A | |
Service Class | | | 287,621,016 | | | | 287,621,016 | | | | 889,527,561 | | | | 889,527,561 | |
| | | | |
| | | | | | | 2,947,375,028 | | | | | | | | 8,374,942,527 | |
| | | | |
Reinvestment of distributions | | | | | | | | | | | | | | | | |
Class A | | | 54,739 | | | | 54,739 | | | | 85,462 | | | | 85,462 | |
Class B | | | 39 | | | | 39 | | | | 230 | | | | 230 | |
Class C | | | 677 | | | | 677 | | | | 1,226 | | | | 1,226 | |
Daily Class | | | 28,154 | | | | 28,154 | | | | 63,821 | | | | 63,821 | |
Investor Class | | | N/A | | | | N/A | | | | 26,023 | 1 | | | 26,023 | 1 |
Premier Class | | | 108 | 2 | | | 108 | 2 | | | N/A | | | | N/A | |
Service Class | | | 14,363 | | | | 14,363 | | | | 11,056 | | | | 11,056 | |
| | | | |
| | | | | | | 98,080 | | | | | | | | 187,818 | |
| | | | |
Payment for shares redeemed | | | | | | | | | | | | | | | | |
Class A | | | (609,356,643 | ) | | | (609,356,643 | ) | | | (1,379,870,500 | ) | | | (1,379,870,500 | ) |
Class B | | | (821,131 | ) | | | (821,131 | ) | | | (3,140,844 | ) | | | (3,140,844 | ) |
Class C | | | (6,249,300 | ) | | | (6,249,300 | ) | | | (11,124,036 | ) | | | (11,124,036 | ) |
Daily Class | | | (3,030,947,270 | ) | | | (3,030,947,270 | ) | | | (5,670,757,057 | ) | | | (5,670,757,057 | ) |
Investor Class | | | N/A | | | | N/A | | | | (604,566,492 | )1 | | | (604,566,492 | )1 |
Service Class | | | (455,602,922 | ) | | | (455,602,922 | ) | | | (896,450,778 | ) | | | (896,450,778 | ) |
| | | | |
| | | | | | | (4,102,977,266 | ) | | | | | | | (8,565,909,707 | ) |
| | | | |
Net decrease in net assets resulting from capital share transactions | | | | | | | (1,155,504,158 | ) | | | | | | | (190,779,363 | ) |
| | | | |
Total decrease in net assets | | | | | | | (1,155,502,263 | ) | | | | | | | (190,776,531 | ) |
| | | | |
| | | | |
Net assets | | | | | | | | | | | | | | | | |
Beginning of period | | | | | | | 2,749,888,811 | | | | | | | | 2,940,665,342 | |
| | | | |
End of period | | | | | | $ | 1,594,386,548 | | | | | | | $ | 2,749,888,811 | |
| | | | |
Overdistributed net investment income | | | | | | $ | (367,600 | ) | | | | | | $ | (367,600 | ) |
| | | | |
| 1 | For the period from February 1, 2015 to October 23, 2015. Effective at the close of business on October 23, 2015, Investor Class shares were converted to Class A shares and are no longer offered by the Fund. |
| 2 | For the period from March 31, 2016 (commencement of class operations) to July 31, 2016 |
The accompanying notes are an integral part of these financial statements.
| | | | |
| 16 | | Wells Fargo Money Market Fund | | Financial highlights |
(For a share outstanding throughout each period)
| | | | | | | | | | | | | | | | | | | | | | | | |
| | | Six months ended
July 31, 2016
(unaudited) | | | Year ended January 31 | |
| CLASS A | | | 2016 | | | 2015 | | | 2014 | | | 2013 | | | 2012 | |
Net asset value, beginning of period | | | $1.00 | | | | $1.00 | | | | $1.00 | | | | $1.00 | | | | $1.00 | | | | $1.00 | |
Net investment income | | | 0.00 | 1 | | | 0.00 | 1 | | | 0.00 | 1 | | | 0.00 | 1 | | | 0.00 | 1 | | | 0.00 | 1 |
Net realized gains on investments | | | 0.00 | 1 | | | 0.00 | 1 | | | 0.00 | 1 | | | 0.00 | 1 | | | 0.00 | 1 | | | 0.00 | 1 |
| | | | | | | | | | | | | | | | | | | | | | | | |
Total from investment operations | | | 0.00 | 1 | | | 0.00 | 1 | | | 0.00 | 1 | | | 0.00 | 1 | | | 0.00 | 1 | | | 0.00 | 1 |
Distributions to shareholders from | | | | | | | | | | | | | | | | | | | | | | | | |
Net investment income | | | (0.00 | )1 | | | (0.00 | )1 | | | (0.00 | )1 | | | (0.00 | )1 | | | (0.00 | )1 | | | (0.00 | )1 |
Net asset value, end of period | | | $1.00 | | | | $1.00 | | | | $1.00 | | | | $1.00 | | | | $1.00 | | | | $1.00 | |
Total return2 | | | 0.00 | % | | | 0.01 | % | | | 0.01 | % | | | 0.01 | % | | | 0.01 | % | | | 0.01 | % |
Ratios to average net assets (annualized) | | | | | | | | | | | | | | | | | | | | | | | | |
Gross expenses | | | 0.82 | % | | | 0.82 | % | | | 0.83 | % | | | 0.82 | % | | | 0.80 | % | | | 0.80 | % |
Net expenses | | | 0.52 | % | | | 0.29 | % | | | 0.19 | % | | | 0.22 | % | | | 0.25 | % | | | 0.26 | % |
Net investment income | | | 0.01 | % | | | 0.01 | % | | | 0.01 | % | | | 0.01 | % | | | 0.01 | % | | | 0.01 | % |
Supplemental data | | | | | | | | | | | | | | | | | | | | | | | | |
Net assets, end of period (000s omitted) | | | $1,163,067 | | | | $1,205,785 | | | | $876,562 | | | | $1,468,645 | | | | $2,040,718 | | | | $3,110,020 | |
| 1 | Amount is less than $0.005. |
| 2 | Returns for periods of less than one year are not annualized. |
The accompanying notes are an integral part of these financial statements.
| | | | | | |
| Financial highlights | | Wells Fargo Money Market Fund | | | 17 | |
(For a share outstanding throughout each period)
| | | | | | | | | | | | | | | | | | | | | | | | |
| | | Six months ended
July 31, 2016
(unaudited) | | | Year ended January 31 | |
| CLASS B | | | 2016 | | | 2015 | | | 2014 | | | 2013 | | | 2012 | |
Net asset value, beginning of period | | | $1.00 | | | | $1.00 | | | | $1.00 | | | | $1.00 | | | | $1.00 | | | | $1.00 | |
Net investment income | | | 0.00 | 1 | | | 0.00 | 1 | | | 0.00 | 1 | | | 0.00 | 1 | | | 0.00 | 1 | | | 0.00 | 1 |
Net realized gains on investments | | | 0.00 | 1 | | | 0.00 | 1 | | | 0.00 | 1 | | | 0.00 | | | | 0.00 | 1 | | | 0.00 | 1 |
| | | | | | | | | | | | | | | | | | | | | | | | |
Total from investment operations | | | 0.00 | 1 | | | 0.00 | 1 | | | 0.00 | 1 | | | 0.00 | 1 | | | 0.00 | 1 | | | 0.00 | 1 |
Distributions to shareholders from | | | | | | | | | | | | | | | | | | | | | | | | |
Net investment income | | | (0.00 | )1 | | | (0.00 | )1 | | | (0.00 | )1 | | | (0.00 | )1 | | | (0.00 | )1 | | | (0.00 | )1 |
Net asset value, end of period | | | $1.00 | | | | $1.00 | | | | $1.00 | | | | $1.00 | | | | $1.00 | | | | $1.00 | |
Total return2 | | | 0.01 | % | | | 0.01 | % | | | 0.01 | % | | | 0.01 | % | | | 0.01 | % | | | 0.01 | % |
Ratios to average net assets (annualized) | | | | | | | | | | | | | | | | | | | | | | | | |
Gross expenses | | | 1.49 | % | | | 1.45 | % | | | 1.47 | % | | | 1.47 | % | | | 1.55 | % | | | 1.55 | % |
Net expenses | | | 0.52 | % | | | 0.26 | % | | | 0.19 | % | | | 0.22 | % | | | 0.24 | % | | | 0.26 | % |
Net investment income | | | 0.01 | % | | | 0.01 | % | | | 0.01 | % | | | 0.01 | % | | | 0.01 | % | | | 0.01 | % |
Supplemental data | | | | | | | | | | | | | | | | | | | | | | | | |
Net assets, end of period (000s omitted) | | | $472 | | | | $1,281 | | | | $4,277 | | | | $7,966 | | | | $14,362 | | | | $400,677 | |
| 1 | Amount is less than $0.005. |
| 2 | Returns for periods of less than one year are not annualized. |
The accompanying notes are an integral part of these financial statements.
| | | | |
| 18 | | Wells Fargo Money Market Fund | | Financial highlights |
(For a share outstanding throughout each period)
| | | | | | | | | | | | | | | | | | | | | | | | |
| | | Six months ended
July 31, 2016
(unaudited) | | | Year ended January 31 | |
| CLASS C | | | 2016 | | | 2015 | | | 2014 | | | 2013 | | | 2012 | |
Net asset value, beginning of period | | | $1.00 | | | | $1.00 | | | | $1.00 | | | | $1.00 | | | | $1.00 | | | | $1.00 | |
Net investment income | | | 0.00 | 1 | | | 0.00 | 1 | | | 0.00 | 1 | | | 0.00 | 1 | | | 0.00 | 1 | | | 0.00 | 1 |
Net realized gains on investments | | | 0.00 | 1 | | | 0.00 | 1 | | | 0.00 | 1 | | | 0.00 | 1 | | | 0.00 | 1 | | | 0.00 | 1 |
| | | | | | | | | | | | | | | | | | | | | | | | |
Total from investment operations | | | 0.00 | 1 | | | 0.00 | 1 | | | 0.00 | 1 | | | 0.00 | 1 | | | 0.00 | 1 | | | 0.00 | 1 |
Distributions to shareholders from | | | | | | | | | | | | | | | | | | | | | | | | |
Net investment income | | | (0.00 | )1 | | | (0.00 | )1 | | | (0.00 | )1 | | | (0.00 | )1 | | | (0.00 | )1 | | | (0.00 | )1 |
Net asset value, end of period | | | $1.00 | | | | $1.00 | | | | $1.00 | | | | $1.00 | | | | $1.00 | | | | $1.00 | |
Total return2 | | | 0.00 | % | | | 0.01 | % | | | 0.01 | % | | | 0.01 | % | | | 0.01 | % | | | 0.01 | % |
Ratios to average net assets (annualized) | | | | | | | | | | | | | | | | | | | | | | | | |
Gross expenses | | | 1.57 | % | | | 1.57 | % | | | 1.58 | % | | | 1.57 | % | | | 1.55 | % | | | 1.51 | % |
Net expenses | | | 0.52 | % | | | 0.29 | % | | | 0.19 | % | | | 0.22 | % | | | 0.25 | % | | | 0.26 | % |
Net investment income | | | 0.01 | % | | | 0.01 | % | | | 0.01 | % | | | 0.01 | % | | | 0.01 | % | | | 0.01 | % |
Supplemental data | | | | | | | | | | | | | | | | | | | | | | | | |
Net assets, end of period (000s omitted) | | | $13,288 | | | | $16,617 | | | | $13,628 | | | | $16,270 | | | | $14,491 | | | | $18,910 | |
| 1 | Amount is less than $0.005. |
| 2 | Returns for periods of less than one year are not annualized. |
The accompanying notes are an integral part of these financial statements.
| | | | | | |
| Financial highlights | | Wells Fargo Money Market Fund | | | 19 | |
(For a share outstanding throughout each period)
| | | | | | | | | | | | | | | | | | | | | | | | |
| | | Six months ended
July 31, 2016
(unaudited) | | | Year ended January 31 | |
| DAILY CLASS | | | 2016 | | | 2015 | | | 2014 | | | 2013 | | | 2012 | |
Net asset value, beginning of period | | | $1.00 | | | | $1.00 | | | | $1.00 | | | | $1.00 | | | | $1.00 | | | | $1.00 | |
Net investment income | | | 0.00 | 1 | | | 0.00 | 1 | | | 0.00 | 1 | | | 0.00 | 1 | | | 0.00 | 1 | | | 0.00 | 1 |
Net realized gains on investments | | | 0.00 | 1 | | | 0.00 | 1 | | | 0.00 | 1 | | | 0.00 | 1 | | | 0.00 | 1 | | | 0.00 | 1 |
| | | | | | | | | | | | | | | | | | | | | | | | |
Total from investment operations | | | 0.00 | 1 | | | 0.00 | 1 | | | 0.00 | 1 | | | 0.00 | 1 | | | 0.00 | 1 | | | 0.00 | 1 |
Distributions to shareholders from | | | | | | | | | | | | | | | | | | | | | | | | |
Net investment income | | | (0.00 | )1 | | | (0.00 | )1 | | | (0.00 | )1 | | | (0.00 | )1 | | | (0.00 | )1 | | | (0.00 | )1 |
Net asset value, end of period | | | $1.00 | | | | $1.00 | | | | $1.00 | | | | $1.00 | | | | $1.00 | | | | $1.00 | |
Total return2 | | | 0.00 | % | | | 0.01 | % | | | 0.01 | % | | | 0.01 | % | | | 0.01 | % | | | 0.01 | % |
Ratios to average net assets (annualized) | | | | | | | | | | | | | | | | | | | | | | | | |
Gross expenses | | | 1.07 | % | | | 1.07 | % | | | 1.08 | % | | | 1.07 | % | | | 1.05 | % | | | 1.06 | % |
Net expenses | | | 0.52 | % | | | 0.28 | % | | | 0.19 | % | | | 0.22 | % | | | 0.25 | % | | | 0.26 | % |
Net investment income | | | 0.01 | % | | | 0.01 | % | | | 0.01 | % | | | 0.01 | % | | | 0.01 | % | | | 0.01 | % |
Supplemental data | | | | | | | | | | | | | | | | | | | | | | | | |
Net assets, end of period (000s omitted) | | | $311,186 | | | | $1,251,960 | | | | $1,269,176 | | | | $1,428,618 | | | | $1,270,171 | | | | $1,564,827 | |
| 1 | Amount is less than $0.005. |
| 2 | Returns for periods of less than one year are not annualized. |
The accompanying notes are an integral part of these financial statements.
| | | | |
| 20 | | Wells Fargo Money Market Fund | | Financial highlights |
(For a share outstanding throughout the period)
| | | | |
| PREMIER CLASS | | Period ended
July 31, 20161
(unaudited) | |
Net asset value, beginning of period | | | $1.00 | |
Net investment income | | | 0.00 | 2 |
Net realized gains on investments | | | 0.00 | 2 |
| | | | |
Total from investment operations | | | 0.00 | 2 |
Distributions to shareholders from | | | | |
Net investment income | | | (0.00 | )2 |
Net asset value, end of period | | | $1.00 | |
Total return3 | | | 0.11 | % |
Ratios to average net assets (annualized) | | | | |
Gross expenses | | | 0.43 | % |
Net expenses | | | 0.20 | % |
Net investment income | | | 0.22 | % |
Supplemental data | | | | |
Net assets, end of period (000s omitted) | | | $100 | |
| 1 | For the period from March 31, 2016 (commencement of class operations) to July 31, 2016 |
| 2 | Amount is less than $0.005. |
| 3 | Returns for periods of less than one year are not annualized. |
The accompanying notes are an integral part of these financial statements.
| | | | | | |
| Financial highlights | | Wells Fargo Money Market Fund | | | 21 | |
(For a share outstanding throughout each period)
| | | | | | | | | | | | | | | | | | | | | | | | |
| | | Six months ended
July 31, 2016
(unaudited) | | | Year ended January 31 | |
| SERVICE CLASS | | | 2016 | | | 2015 | | | 2014 | | | 2013 | | | 2012 | |
Net asset value, beginning of period | | | $1.00 | | | | $1.00 | | | | $1.00 | | | | $1.00 | | | | $1.00 | | | | $1.00 | |
Net investment income | | | 0.00 | 1 | | | 0.00 | 1 | | | 0.00 | 1 | | | 0.00 | 1 | | | 0.00 | 1 | | | 0.00 | 1 |
Net realized gains on investments | | | 0.00 | 1 | | | 0.00 | 1 | | | 0.00 | 1 | | | 0.00 | 1 | | | 0.00 | 1 | | | 0.00 | 1 |
| | | | | | | | | | | | | | | | | | | | | | | | |
Total from investment operations | | | 0.00 | 1 | | | 0.00 | 1 | | | 0.00 | 1 | | | 0.00 | 1 | | | 0.00 | 1 | | | 0.00 | 1 |
Distributions to shareholders from | | | | | | | | | | | | | | | | | | | | | | | | |
Net investment income | | | (0.00 | )1 | | | (0.00 | )1 | | | (0.00 | )1 | | | (0.00 | )1 | | | (0.00 | )1 | | | (0.00 | )1 |
Net asset value, end of period | | | $1.00 | | | | $1.00 | | | | $1.00 | | | | $1.00 | | | | $1.00 | | | | $1.00 | |
Total return2 | | | 0.01 | % | | | 0.01 | % | | | 0.01 | % | | | 0.01 | % | | | 0.01 | % | | | 0.01 | % |
Ratios to average net assets (annualized) | | | | | | | | | | | | | | | | | | | | | | | | |
Gross expenses | | | 0.72 | % | | | 0.72 | % | | | 0.73 | % | | | 0.72 | % | | | 0.70 | % | | | 0.71 | % |
Net expenses | | | 0.50 | % | | | 0.28 | % | | | 0.19 | % | | | 0.22 | % | | | 0.25 | % | | | 0.26 | % |
Net investment income | | | 0.01 | % | | | 0.01 | % | | | 0.01 | % | | | 0.01 | % | | | 0.01 | % | | | 0.01 | % |
Supplemental data | | | | | | | | | | | | | | | | | | | | | | | | |
Net assets, end of period (000s omitted) | | | $106,273 | | | | $274,245 | | | | $281,157 | | | | $334,659 | | | | $398,160 | | | | $472,761 | |
| 1 | Amount is less than $0.005. |
| 2 | Returns for periods of less than one year are not annualized. |
The accompanying notes are an integral part of these financial statements.
| | | | |
| 22 | | Wells Fargo Money Market Fund | | Notes to financial statements (unaudited) |
1. ORGANIZATION
Wells Fargo Funds Trust (the “Trust”), a Delaware statutory trust organized on March 10, 1999, is an open-end management investment company registered under the Investment Company Act of 1940, as amended (the “1940 Act”). As an investment company, the Trust follows the accounting and reporting guidance in Financial Accounting Standards Board (“FASB”) Accounting Standards Codification Topic 946, Financial Services – Investment Companies. These financial statements report on the Wells Fargo Money Market Fund (the “Fund”) which is a diversified series of the Trust.
2. SIGNIFICANT ACCOUNTING POLICIES
The following significant accounting policies, which are consistently followed in the preparation of the financial statements of the Fund, are in conformity with U.S. generally accepted accounting principles which require management to make estimates and assumptions that affect the reported amounts of assets and liabilities, disclosure of contingent assets and liabilities at the date of the financial statements, and the reported amounts of revenues and expenses during the reporting period. Actual results could differ from those estimates.
Securities valuation
As permitted under Rule 2a-7 of the 1940 Act, portfolio securities are valued at amortized cost, which approximates fair value. The amortized cost method involves valuing a security at its cost, plus accretion of discount or minus amortization of premium over the period until maturity.
Investments which are not valued using the method discussed above are valued at their fair value, as determined in good faith by the Board of Trustees of the Fund. The Board of Trustees has established a Valuation Committee comprised of the Trustees and has delegated to it the authority to take any actions regarding the valuation of portfolio securities that the Valuation Committee deems necessary or appropriate, including determining the fair value of portfolio securities, unless the determination has been delegated to the Management Valuation Team of Wells Fargo Funds Management, LLC (“Funds Management”). The Board of Trustees retains the authority to make or ratify any valuation decisions or approve any changes to the Valuation Procedures as it deems appropriate. On a quarterly basis, the Board of Trustees receives reports on any valuation actions taken by the Valuation Committee or the Management Valuation Team which may include items for ratification.
Valuations of fair valued securities are compared to the next actual sales price when available, or other appropriate market values, to assess the continued appropriateness of the fair valuation methodologies used. These securities are fair valued on a day-to-day basis, taking into consideration changes to appropriate market information and any significant changes to the inputs considered in the valuation process until there is a readily available price provided on an exchange or by an independent pricing service. Valuations received from an independent pricing service or independent broker-dealer quotes are periodically validated by comparisons to most recent trades and valuations provided by other independent pricing services in addition to the review of prices by the manager and/or subadvisers. Unobservable inputs used in determining fair valuations are identified based on the type of security, taking into consideration factors utilized by market participants in valuing the investment, knowledge about the issuer and the current market environment.
Repurchase agreements
The Fund may invest in repurchase agreements and may participate in pooled repurchase agreement transactions with other funds advised by Funds Management. The repurchase agreements must be fully collateralized based on values that are marked-to-market daily. The collateral may be held by an agent bank under a tri-party agreement. It is the custodian’s responsibility to value collateral daily and to take action to obtain additional collateral as necessary to maintain market value equal to or greater than the resale price. The repurchase agreements are collateralized by instruments such as U.S. Treasury, federal agency, or high-grade corporate obligations. There could be potential loss to the Fund in the event that the Fund is delayed or prevented from exercising its rights to dispose of the collateral, including the risk of a possible decline in the value of the underlying obligations during the period in which the Fund seeks to assert its rights.
When-issued transactions
The Fund may purchase securities on a forward commitment or when-issued basis. The Fund records a when-issued transaction on the trade date and will segregate assets in an amount at least equal in value to the Fund’s commitment to purchase when-issued securities. Securities purchased on a when-issued basis are marked-to-market daily and the Fund begins earning interest on the settlement date. Losses may arise due to changes in the market value of the underlying securities or if the counterparty does not perform under the contract.
Security transactions and income recognition
Securities transactions are recorded on a trade date basis. Realized gains or losses are recorded on the basis of identified cost.
| | | | | | |
| Notes to financial statements (unaudited) | | Wells Fargo Money Market Fund | | | 23 | |
Interest income is accrued daily and bond discounts are accreted and premiums are amortized daily based on the effective interest method. To the extent debt obligations are placed on non-accrual status, any related interest income may be reduced by writing off interest receivables when the collection of all or a portion of interest has become doubtful based on consistently applied procedures. If the issuer subsequently resumes interest payments or when the collectability of interest is reasonably assured, the debt obligation is removed from non-accrual status.
Distributions to shareholders
Distributions to shareholders from net investment income are accrued daily and paid monthly. Distributions from net realized gains, if any, are recorded on the ex-dividend date. Such distributions are determined in conformity with federal income tax regulations, which may differ in amount or character from net investment income and realized gains recognized for purposes of U.S. generally accepted accounting principles.
Federal and other taxes
The Fund intends to continue to qualify as a regulated investment company by distributing substantially all of its investment company taxable income and any net realized capital gains (after reduction for capital loss carryforwards) sufficient to relieve it from all, or substantially all, federal income taxes. Accordingly, no provision for federal income taxes was required.
The Fund’s income and federal excise tax returns and all financial records supporting those returns for the prior three fiscal years are subject to examination by the federal and Delaware revenue authorities. Management has analyzed the Fund’s tax positions taken on federal, state, and foreign tax returns for all open tax years and does not believe that there are any uncertain tax positions that require recognition of a tax liability.
As of January 31, 2016, the Fund had capital loss carryforwards available to offset future net realized capital gains in the amount of $3,881,963 with $3,473,677 expiring in 2017 and $408,286 expiring in 2019.
Class allocations
The separate classes of shares offered by the Fund differ principally in applicable sales charges, distribution, shareholder servicing, and administration fees. Class specific expenses are charged directly to that share class. Investment income, common expenses, and realized and unrealized gains (losses) on investments are allocated daily to each class of shares based on the relative proportion of net assets of each class.
3. FAIR VALUATION MEASUREMENTS
Fair value measurements of investments are determined within a framework that has established a fair value hierarchy based upon the various data inputs utilized in determining the value of the Fund’s investments. The three-level hierarchy gives the highest priority to unadjusted quoted prices in active markets for identical assets or liabilities (Level 1) and the lowest priority to significant unobservable inputs (Level 3). The Fund’s investments are classified within the fair value hierarchy based on the lowest level of input that is significant to the fair value measurement. The inputs are summarized into three broad levels as follows:
| n | | Level 1 – quoted prices in active markets for identical securities |
| n | | Level 2 – other significant observable inputs (including quoted prices for similar securities, interest rates, prepayment speeds, credit risk, use of amortized cost, etc.) |
| n | | Level 3 – significant unobservable inputs (including the Fund’s own assumptions in determining the fair value of investments) |
The inputs or methodologies used for valuing investments in securities are not necessarily an indication of the risk associated with investing in those securities.
At July 31, 2016, all of the Fund’s investments in securities were valued using Level 2 inputs since the primary inputs include the credit quality of the issuer and short-term interest rates (both of which are observable) in addition to the use of amortized cost.
The Fund recognizes transfers between levels within the fair value hierarchy at the end of the reporting period. At July 31, 2016, the Fund did not have any transfers into/out of Level 1, Level 2, or Level 3.
| | | | |
| 24 | | Wells Fargo Money Market Fund | | Notes to financial statements (unaudited) |
4. TRANSACTIONS WITH AFFILIATES
Management fee
Funds Management, an indirect wholly owned subsidiary of Wells Fargo & Company (“Wells Fargo”), is the manager of the Fund and provides advisory and fund-level administrative services under an investment management agreement. Under the investment management agreement, Funds Management is responsible for, among other services, implementing the investment objectives and strategies of the Fund, supervising the subadvisers, providing fund-level administrative services in connection with the Fund’s operations, and providing any other fund-level administrative services reasonably necessary for the operation of the Fund. As compensation for its services under the investment management agreement, Funds Management is entitled to receive an annual management fee starting at 0.35% and declining to 0.23% as the average daily net assets of the Fund increase. For the six months ended July 31, 2016, the management fee was equivalent to an annual rate of 0.34% of the Fund’s average daily net assets.
Funds Management has retained the services of certain subadvisers to provide daily portfolio management to the Fund. Wells Capital Management Incorporated (“WellsCap”), an affiliate of Funds Management and an indirect wholly owned subsidiary of Wells Fargo, is the subadviser to the Fund and is entitled to receive a fee from Funds Management at an annual rate starting at 0.05% and declining to 0.01% as the average daily net assets of the Fund increase. Wells Capital Management Singapore, a separately identifiable department of Wells Fargo Bank, N.A., an affiliate of Funds Management and wholly owned subsidiary of Wells Fargo, is also a subadviser to the Fund and is entitled to receive a fee from WellsCap at an annual rate starting at 0.0025% and declining to 0.0005% as the average daily net assets of the Fund increase.
Administration fees
Under a class-level administration agreement, Funds Management provides class-level administrative services to the Fund, which includes paying fees and expenses for services provided by the transfer agent, sub-transfer agents, omnibus account servicers and record-keepers. As compensation for its services under the class-level administration agreement, Funds Management receives an annual fee which is calculated based on the average daily net assets of each class as follows:
| | | | |
| | | Class-level
administration fee | |
Class A, Class B, Class C, Daily Class | | | 0.22 | % |
Premier Class | | | 0.08 | |
Service Class | | | 0.12 | |
Funds Management has contractually waived and/or reimbursed management and administration fees to the extent necessary to maintain certain net operating expense ratios for the Fund. Waiver of fees and/or reimbursement of expenses by Funds Management were made first from fund level expenses on a proportionate basis and then from class specific expenses. Funds Management has committed through May 31, 2017 to waive fees and/or reimburse expenses to the extent necessary to cap the Fund’s expenses at 0.65% for Class A shares, 1.40% for Class B shares, 1.40% for Class C shares, 1.00% for Daily Class shares, 0.20% for Premier Class shares, and 0.50% for Service Class shares. After this time, the cap may be increased or the commitment to maintain the cap may be terminated only with the approval of the Board of Trustees. During the six months ended July 31, 2016, Funds Management voluntarily waived additional expenses to maintain a positive yield.
Distribution fees
The Trust has adopted a distribution plan for Class B, Class C, and Daily Class shares of the Fund pursuant to Rule 12b-1 under the 1940 Act. Distribution fees are charged to Class B, Class C, and Daily Class shares and paid to Wells Fargo Funds Distributor, LLC (“Funds Distributor”), the principal underwriter, at an annual rate of 0.75% of the average daily net assets of Class B and Class C shares and 0.25% of the average daily net assets of Daily Class shares.
In addition, Funds Distributor is entitled to receive the contingent deferred sales charges from redemptions of Class B and Class C shares.
Shareholder servicing fees
The Trust has entered into contracts with one or more shareholder servicing agents, whereby Class A, Class B, Class C, Daily Class, and Service Class of the Fund are charged a fee at an annual rate of 0.25% of the respective average daily net assets of each class.
A portion of these total shareholder servicing fees were paid to affiliates of Wells Fargo.
| | | | | | |
| Notes to financial statements (unaudited) | | Wells Fargo Money Market Fund | | | 25 | |
5. INDEMNIFICATION
Under the Trust’s organizational documents, the officers and Trustees have been granted certain indemnification rights against certain liabilities that may arise out of performance of their duties to the Trust. Additionally, in the normal course of business, the Trust may enter into contracts with service providers that contain a variety of indemnification clauses. The Trust’s maximum exposure under these arrangements is dependent on future claims that may be made against the Fund and, therefore, cannot be estimated.
6. MONEY MARKET FUND REFORM
On July 23, 2014, the Securities and Exchange Commission voted to amend Rule 2a-7 of the 1940 Act which governs the operations of registered money market funds. The amendments to Rule 2a-7 when implemented may, among other things, require the Fund to change the manner in which it values its securities, impose new liquidity fees on redemptions in certain circumstances, and permit the Fund to limit redemptions in certain circumstances. The amendments have staggered compliance dates. Compliance with a majority of these amendments will be required on October 14, 2016. Effective September 1, 2016, the Fund will be offered as a retail money market fund and continue to transact at a stable $1.00 net asset value (NAV).
| | | | |
| 26 | | Wells Fargo Money Market Fund | | Other information (unaudited) |
PROXY VOTING INFORMATION
A description of the policies and procedures that the Fund uses to determine how to vote proxies relating to portfolio securities is available, upon request, by calling 1-800-222-8222, visiting our website at wellsfargofunds.com, or visiting the SEC website at sec.gov. Information regarding how the Fund voted proxies relating to portfolio securities during the most recent 12-month period ended June 30 is available on the Fund’s website at wellsfargofunds.com or by visiting the SEC website at sec.gov.
PORTFOLIO HOLDINGS INFORMATION
The complete portfolio holdings for the Fund are publicly available on the Fund’s website (wellsfargofunds.com) on a 1-day delayed basis. The Fund files its complete schedule of portfolio holdings with the SEC for the first and third quarters of each fiscal year on Form N-Q, which is available by visiting the SEC website at sec.gov. In addition, the Fund’s Form N-Q may be reviewed and copied at the SEC’s Public Reference Room in Washington, DC, and at regional offices in New York City, at 233 Broadway, and in Chicago, at 175 West Jackson Boulevard, Suite 900. Information about the Public Reference Room may be obtained by calling 1-800-SEC-0330.
| | | | | | |
| Other information (unaudited) | | Wells Fargo Money Market Fund | | | 27 | |
BOARD OF TRUSTEES AND OFFICERS
Each of the Trustees and Officers1 listed in the table below acts in identical capacities for each fund in the Wells Fargo family of funds, which consists of 139 mutual funds comprising the Wells Fargo Funds Trust, Wells Fargo Variable Trust, Wells Fargo Master Trust and four closed-end funds (collectively the “Fund Complex”). This table should be read in conjunction with the Prospectus and the Statement of Additional Information2. The mailing address of each Trustee and Officer is 525 Market Street, 12th Floor, San Francisco, CA 94105. Each Trustee and Officer serves an indefinite term, however, each Trustee serves such term until reaching the mandatory retirement age established by the Trustees.
Independent Trustees
| | | | | | |
Name and year of birth | | Position held and length of service* | | Principal occupations during past five years or longer | | Current other public
company or investment company directorships |
William R. Ebsworth (Born 1957) | | Trustee, since 2015 | | Retired. From 1984 to 2013, equities analyst, portfolio manager, research director and chief financial officer at Fidelity Management and Research Company in Boston, Tokyo, and Hong Kong and retired in 2013 as Chief Investment Officer of Fidelity Strategic Advisers, Inc. where he lead a team of investment professionals managing client assets. Prior thereto, Board member of Hong Kong Securities Clearing Co., Hong Kong Options Clearing Corp., the Thailand International Fund, Ltd., Fidelity Investments Life Insurance Company, and Empire Fidelity Investments Life Insurance Company. Mr. Ebsworth is a CFA® charterholder and an Adjunct Lecturer, Finance, at Babson College. | | Asset Allocation Trust |
Jane A. Freeman (Born 1953) | | Trustee, since 2015 | | Retired. From 2012 to 2014 and 1999 to 2008, Chief Financial Officer of Scientific Learning Corporation. From 2008 to 2012, Ms. Freeman provided consulting services related to strategic business projects. Prior to 1999, Portfolio Manager at Rockefeller & Co. and Scudder, Stevens & Clark. Board member of the Harding Loevner Funds from 1996 to 2014, serving as both Lead Independent Director and chair of the Audit Committee. Board member of the Russell Exchange Traded Funds Trust from 2011 to 2012 and the chair of the Audit Committee. Ms. Freeman is Chair of Taproot Foundation (non-profit organization), a Board Member of Ruth Bancroft Garden (non-profit organization) and an inactive chartered financial analyst. | | Asset Allocation Trust |
Peter G. Gordon (Born 1942) | | Trustee, since 1998; Chairman, since 2005 | | Co-Founder, Retired Chairman, President and CEO of Crystal Geyser Water Company. Trustee Emeritus, Colby College. | | Asset Allocation Trust |
Isaiah Harris, Jr. (Born 1952) | | Trustee, since 2009 | | Retired. Chairman of the Board of CIGNA Corporation since 2009, and Director since 2005. From 2003 to 2011, Director of Deluxe Corporation. Prior thereto, President and CEO of BellSouth Advertising and Publishing Corp. from 2005 to 2007, President and CEO of BellSouth Enterprises from 2004 to 2005 and President of BellSouth Consumer Services from 2000 to 2003. Emeritus member of the Iowa State University Foundation Board of Governors. Emeritus Member of the Advisory Board of Iowa State University School of Business. Advisory Board Member, Palm Harbor Academy (charter school). Advisory Board Member, Child Evangelism Fellowship (non-profit). Mr. Harris is a certified public accountant (inactive status). | | CIGNA Corporation; Asset Allocation Trust |
Judith M. Johnson (Born 1949) | | Trustee, since 2008;
Audit Committee
Chairman, since 2008 | | Retired. Prior thereto, Chief Executive Officer and Chief Investment Officer of Minneapolis Employees Retirement Fund from 1996 to 2008. Ms. Johnson is an attorney, certified public accountant and a certified managerial accountant. | | Asset Allocation Trust |
David F. Larcker (Born 1950) | | Trustee, since 2009 | | James Irvin Miller Professor of Accounting at the Graduate School of Business, Stanford University, Director of the Corporate Governance Research Initiative and Senior Faculty of The Rock Center for Corporate Governance since 2006. From 2005 to 2008, Professor of Accounting at the Graduate School of Business, Stanford University. Prior thereto, Ernst & Young Professor of Accounting at The Wharton School, University of Pennsylvania from 1985 to 2005. | | Asset Allocation Trust |
| | | | |
| 28 | | Wells Fargo Money Market Fund | | Other information (unaudited) |
| | | | | | |
Name and year of birth | | Position held and length of service* | | Principal occupations during past five years or longer | | Current other public
company or
investment company directorships |
Olivia S. Mitchell (Born 1953) | | Trustee, since 2006 | | International Foundation of Employee Benefit Plans Professor, Wharton School of the University of Pennsylvania since 1993. Director of Wharton’s Pension Research Council and Boettner Center on Pensions & Retirement Research, and Research Associate at the National Bureau of Economic Research. Previously, Cornell University Professor from 1978 to 1993. | | Asset Allocation Trust |
Timothy J. Penny (Born 1951) | | Trustee, since 1996 | | President and Chief Executive Officer of Southern Minnesota Initiative Foundation, a non-profit organization, since 2007 and Senior Fellow at the Humphrey Institute Policy Forum at the University of Minnesota since 1995. Member of the Board of Trustees of NorthStar Education Finance, Inc., a non-profit organization, since 2007. | | Asset Allocation Trust |
Michael S. Scofield (Born 1943) | | Trustee, since 2010 | | Served on the Investment Company Institute’s Board of Governors and Executive Committee from 2008-2011 as well the Governing Council of the Independent Directors Council from 2006-2011 and the Independent Directors Council Executive Committee from 2008-2011. Chairman of the IDC from 2008-2010. Institutional Investor (Fund Directions) Trustee of Year in 2007. Trustee of the Evergreen Funds complex (and its predecessors) from 1984 to 2010. Chairman of the Evergreen Funds from 2000-2010. Former Trustee of the Mentor Funds. Retired Attorney, Law Offices of Michael S. Scofield. | | Asset Allocation Trust |
| * | Length of service dates reflect the Trustee’s commencement of service with the Trust’s predecessor entities, where applicable. |
Officers
| | | | | | |
Name and year of birth | | Position held and length of service | | Principal occupations during past five years or longer | | |
Karla M. Rabusch (Born 1959) | | President, since 2003 | | Executive Vice President of Wells Fargo Bank, N.A. and President of Wells Fargo Funds Management, LLC since 2003. | | |
Nancy Wiser1 (Born 1967) | | Treasurer, since 2012 | | Executive Vice President of Wells Fargo Funds Management, LLC since 2011. Chief Operating Officer and Chief Compliance Officer at LightBox Capital Management LLC, from 2008 to 2011. | | |
C. David Messman (Born 1960) | | Secretary, since 2000; Chief Legal Officer, since 2003 | | Senior Vice President and Secretary of Wells Fargo Funds Management, LLC since 2001. Assistant General Counsel of Wells Fargo Bank, N.A. since 2013 and Vice President and Managing Counsel of Wells Fargo Bank, N.A. from 1996 to 2013. | | |
Michael Whitaker (Born 1967) | | Chief Compliance Officer, since 2016* | | Executive Vice President of Wells Fargo Funds Management, LLC since 2016. Chief Compliance Officer of Fidelity’s Fixed Income Funds and Asset Allocation Funds from 2008 to 2016, Compliance Officer of FMR Co., Inc. from 2014 to 2016, Fidelity Investments Money Management, Inc. from 2014 to 2016, Fidelity Investments from 2007 to 2016. | | |
David Berardi (Born 1975) | | Assistant Treasurer, since 2009 | | Vice President of Wells Fargo Funds Management, LLC since 2009. Vice President of Evergreen Investment Management Company, LLC from 2008 to 2010. Manager of Fund Reporting and Control for Evergreen Investment Management Company, LLC from 2004 to 2010. | | |
Jeremy DePalma1 (Born 1974) | | Assistant Treasurer, since 2009 | | Senior Vice President of Wells Fargo Funds Management, LLC since 2009. Senior Vice President of Evergreen Investment Management Company, LLC from 2008 to 2010 and head of the Fund Reporting and Control Team within Fund Administration from 2005 to 2010. | | |
| 1 | Nancy Wiser acts as Treasurer of 71 funds in the Fund Complex. Jeremy DePalma acts as Treasurer of 68 funds and Assistant Treasurer of 71 funds in the Fund Complex. |
| 2 | The Statement of Additional Information includes additional information about the Trustees and is available, without charge, upon request, by calling 1-800-222-8222 or by visiting the website at wellsfargofunds.com. |
| * | Michael Whitaker became Chief Compliance Officer effective May 16, 2016. |
| | | | | | |
| Other information (unaudited) | | Wells Fargo Money Market Fund | | | 29 | |
BOARD CONSIDERATION OF INVESTMENT MANAGEMENT AND SUB-ADVISORY AGREEMENTS:
Under the Investment Company Act of 1940 (the “1940 Act”), the Board of Trustees (the “Board”) of Wells Fargo Funds Trust (the “Trust”) must determine annually whether to approve the continuation of the Trust’s investment management and sub-advisory agreements. In this regard, at an in-person meeting held on May 24-25, 2016 (the “Meeting”), the Board, all the members of which have no direct or indirect interest in the investment management and sub-advisory agreements and are not “interested persons” of the Trust, as defined in the 1940 Act (the “Independent Trustees”), reviewed and approved for Wells Fargo Money Market Fund (the “Fund”): (i) an investment management agreement (the “Management Agreement”) with Wells Fargo Funds Management, LLC (“Funds Management”); (ii) an investment sub-advisory agreement with Wells Capital Management Incorporated (“WellsCap”), an affiliate of Funds Management; and (iii) an investment sub-advisory agreement with the WellsCap and Wells Fargo Bank, N.A. d/b/a Wells Capital Management Singapore (“WellsCap Singapore”), an affiliate of Funds Management. The sub-advisory agreements with WellsCap and WellsCap Singapore (the “Sub-Advisers”) are collectively referred to as the Sub-Advisory Agreements, and the Management Agreement and the Sub-Advisory Agreements are collectively referred to as the “Advisory Agreements.”
At the Meeting, the Board considered the factors and reached the conclusions described below relating to the selection of Funds Management and the Sub-Advisers and the approval of the Advisory Agreements. Prior to the Meeting, including at an in-person meeting in April 2016, the Trustees conferred extensively among themselves and with representatives of Funds Management about these matters. Also, the Board has adopted a team-based approach, with each team consisting of a sub-set of Trustees, to assist the full Board in the discharge of its duties in reviewing performance and other matters throughout the year. The Independent Trustees were assisted in their evaluation of the Advisory Agreements by independent legal counsel, from whom they received separate legal advice and with whom they met separately.
In providing information to the Board, Funds Management and the Sub-Advisers were guided by a detailed set of requests for information submitted to them by independent legal counsel on behalf of the Independent Trustees at the start of the Board’s annual contract renewal process earlier in 2016. In considering and approving the Advisory Agreements, the Trustees considered the information they believed relevant, including but not limited to the information discussed below. The Board considered not only the specific information presented in connection with the Meeting, but also the knowledge gained over time through interaction with Funds Management and the Sub-Advisers about various topics. In this regard, the Board reviewed reports of Funds Management at each of its quarterly meetings, which included, among other things, portfolio reviews and performance reports. In addition, the Board and the teams mentioned above confer with portfolio managers at various times throughout the year. The Board did not identify any particular information or consideration that was all-important or controlling, and each individual Trustee may have attributed different weights to various factors.
After its deliberations, the Board unanimously approved the continuation of the Advisory Agreements for a one-year term and determined that the compensation payable to Funds Management and the Sub-Advisers under each of the Advisory Agreements was reasonable. The Board considered the approval of the Advisory Agreements for the Fund as part of its consideration of agreements for funds across the complex, but its approvals were made on a fund-by-fund basis. The following summarizes a number of important, but not necessarily all, factors considered by the Board in support of its approvals.
Nature, extent and quality of services
The Board received and considered various information regarding the nature, extent and quality of services provided to the Fund by Funds Management and the Sub-Adviser under the Advisory Agreements. This information included a description of the investment advisory services and Fund-level administrative services covered by the Management Agreement, as well as, among other things, a summary of the background and experience of senior management of Funds Management, and the qualifications, background, tenure and responsibilities of each of the portfolio managers primarily responsible for the day-to-day portfolio management of the Fund.
The Board evaluated the ability of Funds Management and the Sub-Advisers to attract and retain qualified investment professionals, including research, advisory and supervisory personnel. The Board further considered the compliance programs and compliance records of Funds Management and the Sub-Advisers. In addition, the Board took into account the full range of services provided to the Fund by Funds Management and its affiliates.
Fund performance and expenses
The Board considered the performance results for the Fund over various time periods ended December 31, 2015. The Board considered these results in comparison to the performance of funds in a universe that was determined by
| | | | |
| 30 | | Wells Fargo Money Market Fund | | Other information (unaudited) |
Broadridge Inc. (“Broadridge”) to be similar to the Fund (the “Universe”), and in comparison to other comparative data. Broadridge is an independent provider of investment company data. The Board received a description of the methodology used by Broadridge to select the mutual funds in the performance Universe. The Board noted that the performance of the Fund (Class A) was higher than or equal to the average performance of the Universe for all periods under review. The Board noted that the Fund experienced a portfolio manager change in 2014.
The Board also received and considered information regarding the Fund’s net operating expense ratios and their various components, including actual management fees, custodian and other non-management fees, and Rule 12b-1 and non-Rule 12b-1 shareholder service fees. The Board considered these ratios in comparison to the median ratios of funds in class-specific expense groups that were determined by Broadridge to be similar to the Fund (the “Groups”). The Board received a description of the methodology used by Broadridge to select the mutual funds in the expense Groups and an explanation of how funds comprising expense groups and their expense ratios may vary from year-to-year. Based on the Broadridge reports, the Board noted that the net operating expense ratios of the Fund were in range of the median net operating expense ratios of the expense Groups.
The Board took into account the Fund performance and expense information provided to it among the factors considered in deciding to re-approve the Advisory Agreements.
Investment management and sub-advisory fee rates
The Board reviewed and considered the contractual fee rates payable by the Fund to Funds Management under the Management Agreement, as well as the contractual fee rates payable by the Fund to Funds Management for class-level administrative services under a Class-Level Administration Agreement, which include class-level transfer agency and sub-transfer agency costs (collectively, the “Management Rates”). The Board also reviewed and considered the contractual investment sub-advisory fee rates that are payable by Funds Management to the Sub-Adviser for investment sub-advisory services.
Among other information reviewed by the Board was a comparison of the Fund’s Management Rates with the average contractual investment management fee rates of funds in the expense Groups at a common asset level as well as transfer agency costs of the funds in the expense Groups. The Board noted that the Management Rates of the Fund were higher than or in range of the sum of these average rates for the Fund’s expense Groups for all share classes.
The Board also received and considered information about the portion of the total management fee that was retained by Funds Management after payment of the fee to the Sub-Adviser for sub-advisory services. In assessing the reasonableness of this amount, the Board received and evaluated information about the nature and extent of responsibilities retained and risks assumed by Funds Management and not delegated to or assumed by the Sub-Advisers, and about Funds Management’s on-going oversight services. However, given the affiliation between Funds Management and the Sub-Advisers, the Board ascribed limited relevance to the allocation of fees between them.
The Board also received and considered information about the nature and extent of services offered and fee rates charged by Funds Management and the Sub-Advisers to other types of clients with investment strategies similar to those of the Fund. In this regard, the Board received information about the significantly greater scope of services, and compliance, reporting and other legal burdens and risks of managing mutual funds compared with those associated with managing assets of non-mutual fund clients such as collective funds or institutional separate accounts.
Based on its consideration of the factors and information it deemed relevant, including those described here, the Board determined that the compensation payable to Funds Management under the Management Agreement and to the Sub-Advisers under the Sub-Advisory Agreements was reasonable, in light of the services covered by the Advisory Agreements.
Profitability
The Board received and considered information concerning the profitability of Funds Management, as well as the profitability of Wells Fargo as a whole, from providing services to the Fund and the fund family as a whole. The Board also received and considered information concerning the profitability of the Sub-Advisers from providing services to the fund family as a whole, noting that the Sub-Advisers’ profitability information with respect to providing services to the Fund was subsumed in the Wells Fargo and Funds Management profitability analysis.
Funds Management reported on the methodologies and estimates used in calculating profitability. Among other things, the Board noted that the levels of profitability reported on a fund-by-fund basis varied widely, depending on factors such as the size and type of fund. Based on its review, the Board did not deem the profits reported by Funds Management or Wells Fargo from its services to the Fund to be at a level that would prevent it from approving the continuation of the Advisory Agreements.
| | | | | | |
| Other information (unaudited) | | Wells Fargo Money Market Fund | | | 31 | |
Economies of scale
With respect to possible economies of scale, the Board noted the existence of breakpoints in the Fund’s management fee structure, which operate generally to reduce the Fund’s expense ratios as the Fund grows in size. It considered that, for a small fund or a fund that shrinks in size, breakpoints conversely can result in higher fee levels. The Board also considered that fee waiver and expense reimbursement arrangements and competitive fee rates at the outset are means of sharing potential economies of scale with shareholders of the Fund and the fund family as a whole. The Board considered Funds Management’s view that any analyses of potential economies of scale in managing a particular fund are inherently limited in light of the joint and common costs and investments that Funds Management incurs across the fund family as a whole.
The Board concluded that the Fund’s fee and expense arrangements, including contractual breakpoints, constituted a reasonable approach to sharing potential economies of scale with the Fund and its shareholders.
Other benefits to Funds Management and the Sub-Advisers
The Board received and considered information regarding potential “fall-out” or ancillary benefits received by Funds Management and its affiliates, including the Sub-Advisers, as a result of their relationships with the Fund. Ancillary benefits could include, among others, benefits directly attributable to other relationships with the Fund and benefits potentially derived from an increase in Funds Management’s and the Sub-Advisers’ business as a result of their relationships with the Fund. The Board noted that various affiliates of Funds Management may receive distribution-related fees, shareholder servicing payments and sub-transfer agency fees in respect of shares sold or held through them and services provided.
The Board also reviewed information about soft dollar credits earned and utilized by the Sub-Advisers, fees earned by Funds Management and the Sub-Advisers from managing a private investment vehicle for the fund family’s securities lending collateral and commissions earned by an affiliated broker from portfolio transactions.
Based on its consideration of the factors and information it deemed relevant, including those described here, the Board did not find that any ancillary benefits received by Funds Management and its affiliates, including the Sub-Advisers, were unreasonable.
Conclusion
At the Meeting, after considering the above-described factors and based on its deliberations and its evaluation of the information described above, the Board unanimously approved the continuation of the Advisory Agreements for a one-year term and determined that the compensation payable to Funds Management and the Sub-Advisers under each of the Advisory Agreements was reasonable.
| | | | |
| 32 | | Wells Fargo Money Market Fund | | List of abbreviations |
The following is a list of common abbreviations for terms and entities that may have appeared in this report.
| ACA | — ACA Financial Guaranty Corporation |
| ADR | — American depositary receipt |
| ADS | — American depositary shares |
| AGC | — Assured Guaranty Corporation |
| AGM | — Assured Guaranty Municipal |
| Ambac | — Ambac Financial Group Incorporated |
| AMT | — Alternative minimum tax |
| BAN | — Bond anticipation notes |
| BHAC | — Berkshire Hathaway Assurance Corporation |
| CAB | — Capital appreciation bond |
| CCAB | — Convertible capital appreciation bond |
| CDA | — Community Development Authority |
| CDO | — Collateralized debt obligation |
| DRIVER | — Derivative inverse tax-exempt receipts |
| DW&P | — Department of Water & Power |
| DWR | — Department of Water Resources |
| ECFA | — Educational & Cultural Facilities Authority |
| EDA | — Economic Development Authority |
| EDFA | — Economic Development Finance Authority |
| ETF | — Exchange-traded fund |
| FDIC | — Federal Deposit Insurance Corporation |
| FFCB | — Federal Farm Credit Banks |
| FGIC | — Financial Guaranty Insurance Corporation |
| FHA | — Federal Housing Administration |
| FHLB | — Federal Home Loan Bank |
| FHLMC | — Federal Home Loan Mortgage Corporation |
| FICO | — The Financing Corporation |
| FNMA | — Federal National Mortgage Association |
| GDR | — Global depositary receipt |
| GNMA | — Government National Mortgage Association |
| HCFR | — Healthcare facilities revenue |
| HEFA | — Health & Educational Facilities Authority |
| HEFAR | — Higher education facilities authority revenue |
| HFA | — Housing Finance Authority |
| HFFA | — Health Facilities Financing Authority |
| HUD | — Department of Housing and Urban Development |
| IDA | — Industrial Development Authority |
| IDAG | — Industrial Development Agency |
| KRW | — Republic of Korea won |
| LIBOR | — London Interbank Offered Rate |
| LIFER | — Long Inverse Floating Exempt Receipts |
| LLC | — Limited liability company |
| LLLP | — Limited liability limited partnership |
| LLP | — Limited liability partnership |
| MBIA | — Municipal Bond Insurance Association |
| MFHR | — Multifamily housing revenue |
| MSTR | — Municipal securities trust receipts |
| MUD | — Municipal Utility District |
| National | — National Public Finance Guarantee Corporation |
| PCFA | — Pollution Control Financing Authority |
| PCL | — Public Company Limited |
| PCR | — Pollution control revenue |
| PFA | — Public Finance Authority |
| PFFA | — Public Facilities Financing Authority |
| PFOTER | — Puttable floating option tax-exempt receipts |
| plc | — Public limited company |
| PUTTER | — Puttable tax-exempt receipts |
| R&D | — Research & development |
| Radian | — Radian Asset Assurance |
| RAN | — Revenue anticipation notes |
| RDA | — Redevelopment Authority |
| RDFA | — Redevelopment Finance Authority |
| REIT | — Real estate investment trust |
| ROC | — Reset option certificates |
| SAVRS | — Select auction variable rate securities |
| SBA | — Small Business Authority |
| SDR | — Swedish depositary receipt |
| SFHR | — Single-family housing revenue |
| SFMR | — Single-family mortgage revenue |
| SPA | — Standby purchase agreement |
| SPDR | — Standard & Poor’s Depositary Receipts |
| SPEAR | — Short Puttable Exempt Adjustable Receipts |
| STRIPS | — Separate trading of registered interest and |
| TAN | — Tax anticipation notes |
| TIPS | — Treasury inflation-protected securities |
| TRAN | — Tax revenue anticipation notes |
| TTFA | — Transportation Trust Fund Authority |
| TVA | — Tennessee Valley Authority |

For more information
More information about Wells Fargo Funds is available free upon request. To obtain literature, please write, email, visit the Fund’s website, or call:
Wells Fargo Funds
P.O. Box 8266
Boston, MA 02266-8266
Email: fundservice@wellsfargo.com
Website: wellsfargofunds.com
Individual investors: 1-800-222-8222
Retail investment professionals: 1-888-877-9275
Institutional investment professionals: 1-866-765-0778
This report and the financial statements contained herein are submitted for the general information of the shareholders of the Fund. If this report is used for promotional purposes, distribution of the report must be accompanied or preceded by a current prospectus. Before investing, please consider the investment objectives, risks, charges, and expenses of the investment. For a current prospectus and, if available, a summary prospectus, containing this information, call 1-800-222-8222 or visit the Fund’s website at wellsfargofunds.com. Read the prospectus carefully before you invest or send money.
Wells Fargo Asset Management (WFAM) is a trade name used by the asset management businesses of Wells Fargo & Company. Wells Fargo Funds Management, LLC, a wholly owned subsidiary of Wells Fargo & Company, provides investment advisory and administrative services for Wells Fargo Funds. Other affiliates of Wells Fargo & Company provide subadvisory and other services for the funds. The funds are distributed by Wells Fargo Funds Distributor, LLC, Member FINRA, an affiliate of Wells Fargo & Company.
NOT FDIC INSURED ¡ NO BANK GUARANTEE ¡ MAY LOSE VALUE
© 2016 Wells Fargo Funds Management, LLC. All rights reserved.
| | |
 | | 245335 09-16 SA306/SAR306 07-16 |
Semi-Annual Report
July 31, 2016

Retail Money Market Funds

| n | | Wells Fargo Municipal Money Market Fund |

Reduce clutter. Save trees.
Sign up for electronic delivery of prospectuses and shareholder reports at wellsfargo.com/advantagedelivery
Contents
The views expressed and any forward-looking statements are as of July 31, 2016, unless otherwise noted, and are those of the Fund managers and/or Wells Fargo Funds Management, LLC. Discussions of individual securities, or the markets generally, or any Wells Fargo Fund are not intended as individual recommendations. Future events or results may vary significantly from those expressed in any forward-looking statements. The views expressed are subject to change at any time in response to changing circumstances in the market. Wells Fargo Funds Management, LLC and the Fund disclaim any obligation to publicly update or revise any views expressed or forward-looking statements.
NOT FDIC INSURED ¡ NO BANK GUARANTEE ¡ MAY LOSE VALUE
| | | | |
| 2 | | Wells Fargo Municipal Money Market Fund | | Letter to shareholders (unaudited) |

Karla M. Rabusch
President
Wells Fargo Funds
We do not anticipate broad changes to the way we manage our money market funds at this time in order to meet the new rules because we have always emphasized stability of principal and liquidity.
Dear Valued Shareholder:
We are pleased to offer you this semi-annual report for the Wells Fargo Municipal Money Market Fund for the six-month period that ended July 31, 2016. The period was marked by preparation for the new amendments to Rule 2a-7 of the Investment Company Act of 1940 (Rule 2a-7) by the U.S. Securities and Exchange Commission. Meanwhile, the U.S. Federal Reserve (Fed) kept the federal funds target rate between 0.25% and 0.50%.
We are preparing to implement the new money market fund regulations.
The amendments to Rule 2a-7, which governs money market funds, are scheduled to be fully implemented by October 2016. To recap, U.S. Treasury and government money market funds will continue to operate much as they do today, with stable $1.00 net asset values (NAVs). Meanwhile, tax-exempt and prime funds will experience more changes. For starters, these types of funds must separate retail investors, such as individuals, and institutional investors. Second, money market fund boards of directors will have discretion to impose either a liquidity fee of up to 2% on shareholder redemptions or a temporary suspension of redemptions (gate) if a fund’s weekly liquid assets fall below 30% of its total assets and the board determines that the fee or gate is in the best interest of the fund’s shareholders.
| | n | | Retail investors will continue to transact at a stable $1.00 NAV but may be subject to liquidity fees and redemption gates. | |
| | n | | Institutional prime and tax-exempt money market funds will transact at a floating, market-based NAV and may be subject to liquidity fees and redemption gates under special circumstances. Once floating NAVs are implemented, daily share prices will fluctuate along with changes, if any, in the market-based value of the underlying portfolio securities. Our Product Alert titled Wells Fargo Announces Effective Dates for Changes to Certain Money Market Funds featured the intraday price times we will use to continue providing same-day settlement and liquidity to our shareholders. | |
| | n | | Additional requirements included increased disclosure and reporting of fund statistics, such as percentage of liquid assets, shareholder flows, and market-based NAVs. In addition, the new regulations also included tighter diversification requirements and enhanced stress-testing measures. | |
| | n | | We will continue to communicate any changes to our money markets funds with our shareholders. Specifically, Product Alerts can be found at our website: wellsfargofunds.com. Click on Product Information and find them under the Product Alerts tab. | |
While there will be many operational changes ahead, we do not anticipate broad changes to the way we manage our money market funds at this time in order to meet the new rules because we have always emphasized stability of principal and liquidity.
Short-term rates remained steady but low.
The Fed kept the federal funds rate steady. On the growth side of its mandate, U.S. economic activity appeared to maintain a modest pace. Global concerns continued to confront the Fed as it tried to assess future conditions in the U.S. While China’s growth and its markets stabilized post first-quarter downdrafts, it continued to “face considerable challenges,” per Fed Chair Janet Yellen in her
| | | | | | |
| Letter to shareholders (unaudited) | | Wells Fargo Municipal Money Market Fund | | | 3 | |
monetary policy report to Congress. Further, although commodity prices rebounded from first-quarter lows, other worries remained. The strong dollar, which could hamper manufacturing and exports, is one factor. Another is potential fallout from Brexit, the referendum whereby the U.K. voted to leave the European Union. With growth and inflation low, Chair Yellen has argued in her monetary policy report that there is little room to cut rates further but plenty of scope to raise rates if inflation picks up too quickly.
With regard to Brexit, traditional risk assets—such as equities and foreign exchange—experienced volatility and U.S. Treasury securities benefited from a flight to quality. Money markets, however, were relatively immune to this volatility, with both credit spreads and liquidity little changed.
Don’t let short-term uncertainty derail long-term investment goals.
Periods of uncertainty can present challenges, but experience has taught us that maintaining long-term investment goals can be an effective way to plan for the future. To help you create a sound strategy based on your personal goals and risk tolerance, Wells Fargo Funds offers more than 100 mutual funds spanning a wide range of asset classes and investment styles. Although diversification cannot guarantee an investment profit or prevent losses, we believe it can be an effective way to manage investment risk and potentially smooth out overall portfolio performance. We encourage investors to know their investments and to understand that appropriate levels of risk-taking may unlock opportunities.
Thank you for choosing to invest in Wells Fargo Funds. We appreciate your confidence in us and remain committed to helping you meet your financial needs.
Sincerely,

Karla M. Rabusch
President
Wells Fargo Funds
Periods of uncertainty can present challenges, but experience has taught us that maintaining long-term investment goals can be an effective way to plan for the future.
For further information about your Fund, contact your investment professional, visit our website at wellsfargofunds.com, or call us directly at 1-800-222-8222. We are available 24 hours a day, 7 days a week.
| | | | |
| 4 | | Wells Fargo Municipal Money Market Fund | | Performance highlights (unaudited) |
Investment objective
The Fund seeks current income exempt from regular federal income tax, while preserving capital and liquidity.
Manager
Wells Fargo Funds Management, LLC
Subadviser
Wells Capital Management Incorporated
Portfolio managers
James Randazzo
Jeffrey L. Weaver, CFA®
Average annual total returns (%) as of July 31, 20161
| | | | | | | | | | | | | | | | | | | | | | |
| | | | | | | | Expense ratios2 (%) | |
| | | Inception date | | 1 year | | | 5 year | | | 10 year | | | Gross | | | Net3 | |
| Class A (WMUXX) | | 1-5-1995 | | | 0.02 | | | | 0.03 | | | | 0.62 | | | | 0.87 | | | | 0.64 | |
| Premier Class (WMTXX)* | | 7-9-2010 | | | 0.11 | | | | 0.05 | | | | 0.74 | | | | 0.48 | | | | 0.20 | |
| Service Class (WMSXX) | | 11-2-1988 | | | 0.02 | | | | 0.03 | | | | 0.71 | | | | 0.77 | | | | 0.45 | |
| Sweep Class** | | 6-30-2000 | | | 0.02 | | | | 0.03 | | | | 0.55 | | | | 1.22 | | | | 1.00 | |
Yield summary (%) as of July 31, 20163
| | | | | | | | | | | | | | |
| | | Class A | | Premier
Class* | | | Service
Class | | | Sweep
Class** | |
| 7-day current yield | | 0.01 | | | 0.31 | | | | 0.06 | | | | 0.01 | |
| 7-day compound yield | | 0.01 | | | 0.31 | | | | 0.06 | | | | 0.01 | |
| 30-day simple yield | | 0.01 | | | 0.29 | | | | 0.04 | | | | 0.01 | |
| 30-day compound yield | | 0.01 | | | 0.29 | | | | 0.04 | | | | 0.01 | |
| * | | Effective April 1, 2016, Institutional Class was renamed Premier Class. |
| ** | | Effective August 26, 2016, Sweep Class shares were liquidated and are no longer offered by the Fund. |
Figures quoted represent past performance, which is no guarantee of future results, and do not reflect taxes that a shareholder may pay on fund distributions or the redemption of fund shares. Investment returns will fluctuate. The Fund’s yield figures more closely reflect the current earnings of the Fund than the total return figures. Current performance may be lower or higher than the performance data quoted, which assumes the reinvestment of dividends and capital gains. Current month-end performance is available on the Fund’s website, wellsfargofunds.com.
Each class is sold without a front-end sales charge or a contingent deferred sales charge.
An investment in a money market fund is not insured or guaranteed by the Federal Deposit Insurance Corporation or any other government agency. Although the Fund seeks to preserve the value of your investment at $1.00 per share, it is possible to lose money by investing in a money market fund. A portion of the Fund’s income may be subject to federal, state, and/or local income taxes or the alternative minimum tax (AMT).
Please see footnotes on page 5.
| | | | | | |
| Performance highlights (unaudited) | | Wells Fargo Municipal Money Market Fund | | | 5 | |
|
| Revenue source distribution as of July 31, 20164 |
|
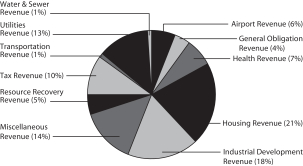 |
| | | | |
| Weighted average maturity as of July 31, 20165 | |
6 days | | | | |
|
| Weighted average life as of July 31, 20166 |
6 days |
|
| Effective maturity distribution as of July 31, 20164 |
|
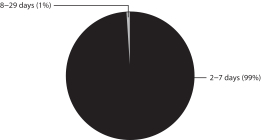
|
|
| 1 | Historical performance shown for Sweep Class shares prior to their inception reflects the performance of Class A shares, and has not been adjusted to include the higher expenses applicable to Sweep Class shares. If these expenses had been adjusted, returns would be lower. |
| 2 | Reflects the expense ratios as stated in the most recent prospectuses. The expense ratios shown are subject to change and may differ from the annualized expense ratios shown in the financial highlights of this report. |
| 3 | The manager has contractually committed through May 31, 2017, to waive fees and/or reimburse expenses to the extent necessary to cap the Fund’s Total Annual Fund Operating Expenses After Fee Waiver at the amounts shown. After this time, the cap may be increased or the commitment to maintain the cap may be terminated only with the approval of the Board of Trustees. Brokerage commissions, stamp duty fees, interest, taxes, acquired fund fees and expenses, and extraordinary expenses are excluded from the cap. Without this cap, the Fund’s returns would have been lower. Without waived fees and/or reimbursed expenses, the Fund’s 7-day current yield would have been (0.39)%, 0.01%, (0.29)%, and (0.73)% for Class A, Premier Class, Service Class, and Sweep Class, respectively. |
| 4 | Amounts are calculated based on the total investments of the Fund. These amounts are subject to change and may have changed since the date specified. |
| 5 | Weighted Average Maturity (WAM): WAM is an average of the effective maturities of all securities held in the portfolio, weighted by each security’s percentage of total investments. The maturity of a portfolio security is the period remaining until the date on which the principal amount is unconditionally required to be paid, or in the case of a security called for redemption, the date on which the redemption payment is unconditionally required to be made. WAM calculations allow for the maturities of certain securities with demand features or periodic interest rate resets to be shortened. WAM is a way to measure a fund’s sensitivity to potential interest rate changes. Rule 2a-7 under the Investment Company Act of 1940 requires money market funds to maintain a WAM of 60 calendar days or less. WAM is subject to change and may have changed since the date specified. |
| 6 | Weighted Average Life (WAL): WAL is an average of the final maturities of all securities held in the portfolio, weighted by their percentage of total investments. The maturity of a portfolio security is the period remaining until the date on which the principal amount is unconditionally required to be paid, or in the case of a security called for redemption, the date on which the redemption payment is unconditionally required to be made. In contrast to WAM, the calculation of WAL allows for the maturities of certain securities with demand features to be shortened, but not the periodic interest rate resets. WAL is a way to measure a fund’s potential sensitivity to credit spread changes. Rule 2a-7 under the Investment Company Act of 1940 requires money market funds to maintain a WAL of 120 calendar days or less. WAL is subject to change and may have changed since the date specified. |
| | | | |
| 6 | | Wells Fargo Municipal Money Market Fund | | Fund expenses (unaudited) |
As a shareholder of the Fund, you incur ongoing costs, including management fees, distribution (12b-1) and/or shareholder servicing fees, and other Fund expenses. This example is intended to help you understand your ongoing costs (in dollars) of investing in the Fund and to compare these costs with the ongoing costs of investing in other mutual funds.
The example is based on an investment of $1,000 invested at the beginning of the six-month period and held for the entire period from February 1, 2016 to July 31, 2016.
Actual expenses
The “Actual” line of the table below provides information about actual account values and actual expenses. You may use the information in this line, together with the amount you invested, to estimate the expenses that you paid over the period. Simply divide your account value by $1,000 (for example, an $8,600 account value divided by $1,000 = 8.6), then multiply the result by the number in the “Actual” line under the heading entitled “Expenses paid during period” for your applicable class of shares to estimate the expenses you paid on your account during this period.
Hypothetical example for comparison purposes
The “Hypothetical” line of the table below provides information about hypothetical account values and hypothetical expenses based on the Fund’s actual expense ratio and an assumed rate of return of 5% per year before expenses, which is not the Fund’s actual return. The hypothetical account values and expenses may not be used to estimate the actual ending account balance or expenses you paid for the period. You may use this information to compare the ongoing costs of investing in the Fund and other funds. To do so, compare this 5% hypothetical example with the 5% hypothetical examples that appear in the shareholder reports of the other funds.
Please note that the expenses shown in the table are meant to highlight your ongoing costs only and do not reflect any transactional costs, such as sales charges (loads) and contingent deferred sales charges. Therefore, the “Hypothetical” line of the table is useful in comparing ongoing costs only and will not help you determine the relative total costs of owning different funds. In addition, if these transactional costs were included, your cost would have been higher.
| | | | | | | | | | | | | | | | |
| | | Beginning
account value
2-1-2016 | | | Ending
account value
7-31-2016 | | | Expenses
paid during
the period¹ | | | Annualized net
expense ratio | |
Class A | | | | | | | | | | | | | | | | |
Actual | | $ | 1,000.00 | | | $ | 1,000.05 | | | $ | 1.84 | | | | 0.37 | % |
Hypothetical (5% return before expenses) | | $ | 1,000.00 | | | $ | 1,023.09 | | | $ | 1.87 | | | | 0.37 | % |
Premier Class2 | | | | | | | | | | | | | | | | |
Actual | | $ | 1,000.00 | | | $ | 1,000.97 | | | $ | 0.85 | | | | 0.17 | % |
Hypothetical (5% return before expenses) | | $ | 1,000.00 | | | $ | 1,024.08 | | | $ | 0.86 | | | | 0.17 | % |
Service Class | | | | | | | | | | | | | | | | |
Actual | | $ | 1,000.00 | | | $ | 1,000.10 | | | $ | 1.70 | | | | 0.34 | % |
Hypothetical (5% return before expenses) | | $ | 1,000.00 | | | $ | 1,023.24 | | | $ | 1.72 | | | | 0.34 | % |
Sweep Class | | | | | | | | | | | | | | | | |
Actual | | $ | 1,000.00 | | | $ | 1,000.05 | | | $ | 1.80 | | | | 0.36 | % |
Hypothetical (5% return before expenses) | | $ | 1,000.00 | | | $ | 1,023.14 | | | $ | 1.82 | | | | 0.36 | % |
| 1 | Expenses paid is equal to the annualized net expense ratio of each class multiplied by the average account value over the period, multiplied by the number of days in the most recent fiscal half-year divided by the number of days in the fiscal year (to reflect the one-half-year period). |
| 2 | Effective April 1, 2016, Institutional Class was renamed Premier Class. |
| | | | | | |
| Portfolio of investments—July 31, 2016 (unaudited) | | Wells Fargo Municipal Money Market Fund | | | 7 | |
| | | | | | | | | | | | | | | | |
| Security name | | Interest rate | | | Maturity date | | | Principal | | | Value | |
| | | | | | | | | | | | | | | | |
| | | | |
Municipal Obligations: 84.57% | | | | | | | | | | | | | | | | |
| | | | |
Alabama: 1.18% | | | | | | | | | | | | | | | | |
| | | | |
| Variable Rate Demand Note ø: 1.18% | | | | | | | | | | | | | | | | |
Chatom AL IDA Board Gulf Opportunity Zone PowerSouth Energy Cooperative Projects Series 2011 (Utilities Revenue) | | | 0.62 | % | | | 8-1-2041 | | | $ | 2,600,000 | | | $ | 2,600,000 | |
| | | | | | | | | | | | | | | | |
| | | | |
Arizona: 0.57% | | | | | | | | | | | | | | | | |
| | | | |
| Variable Rate Demand Note ø: 0.57% | | | | | | | | | | | | | | | | |
Pinal County AZ IDA Solid Waste Disposal Feenstra Investments LLC Project Series 2002 (Resource Recovery Revenue, Farm Credit Services America LOC) | | | 0.50 | | | | 8-1-2027 | | | | 1,250,000 | | | | 1,250,000 | |
| | | | | | | | | | | | | | | | |
| | | | |
California: 1.51% | | | | | | | | | | | | | | | | |
| | | | |
| Other Municipal Debt: 0.32% | | | | | | | | | | | | | | | | |
California GO Series A2 (GO Revenue) | | | 0.43 | | | | 8-3-2016 | | | | 700,000 | | | | 700,000 | |
| | | | | | | | | | | | | | | | |
| | | | |
| Variable Rate Demand Notes ø: 1.19% | | | | | | | | | | | | | | | | |
California HFFA Tender Option Bond Trust Receipts/Certificates Series XF0236 (Health Revenue, TD Bank NA LIQ) 144A | | | 0.47 | | | | 8-15-2031 | | | | 625,000 | | | | 625,000 | |
Southern California Public Power Authority Magnolia Power Project Series 1A (Utilities Revenue, U.S. Bank NA LOC) | | | 0.43 | | | | 7-1-2036 | | | | 2,000,000 | | | | 2,000,000 | |
| | | | |
| | | | | | | | | | | | | | | 2,625,000 | |
| | | | | | | | | | | | | | | | |
| | | | |
Colorado: 3.77% | | | | | | | | | | | | | | | | |
| | | | |
| Variable Rate Demand Notes ø: 3.77% | | | | | | | | | | | | | | | | |
Colorado Health Facilities Authority Catholic Health Initiatives Series 2013-3364 (Health Revenue, Morgan Stanley Bank LIQ) 144A | | | 0.58 | | | | 10-1-2037 | | | | 2,000,000 | | | | 2,000,000 | |
Colorado HFA Worldwest LLP Project Series 1999-A (Industrial Development Revenue, UMB Bank Colorado LOC) 144A | | | 0.74 | | | | 9-1-2023 | | | | 2,690,000 | | | | 2,690,000 | |
Colorado MidCities Metropolitan District #1 Series 2004-B (Tax Revenue, BNP Paribas LOC) | | | 0.48 | | | | 12-1-2031 | | | | 1,430,000 | | | | 1,430,000 | |
Denver CO City & County Airport System Series 2006-A (Airport Revenue, FGIC Insured, Morgan Stanley Bank LIQ) 144A | | | 0.52 | | | | 11-15-2025 | | | | 1,000,000 | | | | 1,000,000 | |
Town of Hudson CO Series A (Industrial Development Revenue, U.S. Bank NA LOC) | | | 0.80 | | | | 11-1-2020 | | | | 1,205,000 | | | | 1,205,000 | |
| | | | |
| | | | | | | | | | | | | | | 8,325,000 | |
| | | | | | | | | | | | | | | | |
| | | | |
Florida: 5.61% | | | | | | | | | | | | | | | | |
| | | | |
| Other Municipal Debt: 2.08% | | | | | | | | | | | | | | | | |
JEA Florida Electric System Series 2000-A (Utilities Revenue) | | | 0.43 | | | | 8-15-2016 | | | | 1,000,000 | | | | 1,000,000 | |
JEA Florida Electric System Series 2000-F-1 (Utilities Revenue) | | | 0.45 | | | | 8-4-2016 | | | | 2,700,000 | | | | 2,700,000 | |
JEA Florida Electric System Series 2008-C-3 (Utilities Revenue) | | | 0.44 | | | | 8-3-2016 | | | | 900,000 | | | | 900,000 | |
| | | | |
| | | | | | | | | | | | | | | 4,600,000 | |
| | | | | | | | | | | | | | | | |
| | | | |
| Variable Rate Demand Notes ø: 3.53% | | | | | | | | | | | | | | | | |
Florida Tender Option Bond Trust Receipts/Certificates Series 2016 XL0027 (Airport Revenue, AGC Insured, JPMorgan Chase & Company LIQ) 144A | | | 0.64 | | | | 10-1-2030 | | | | 3,000,000 | | | | 3,000,000 | |
Florida Tender Option Bond Trust Receipts/Certificates Series 2016 XM0300 (Tax Revenue, Royal Bank of Canada LIQ) 144A | | | 0.47 | | | | 1-1-2020 | | | | 2,800,000 | | | | 2,800,000 | |
Hillsborough County FL Aviation Authority Tender Option Bond Trust Receipts/Certificates Series 2016 ZF0286 (Airport Revenue, AGC Insured, TD Bank NA LIQ) 144A | | | 0.54 | | | | 10-1-2032 | | | | 2,000,000 | | | | 2,000,000 | |
| |
| | | | 7,800,000 | |
| | | | | | | | | | | | | | | | |
The accompanying notes are an integral part of these financial statements.
| | | | |
| 8 | | Wells Fargo Municipal Money Market Fund | | Portfolio of investments—July 31, 2016 (unaudited) |
| | | | | | | | | | | | | | | | |
| Security name | | Interest rate | | | Maturity date | | | Principal | | | Value | |
| | | | | | | | | | | | | | | | |
| | | | |
Georgia: 1.16% | | | | | | | | | | | | | | | | |
| | | | |
| Variable Rate Demand Notes ø: 1.16% | | | | | | | | | | | | | | | | |
Gwinnett County GA Housing Lehman Municipal Trust Receipts/Certificates Series 06-K72 (Housing Revenue, FNMA Insured, Citibank NA LIQ) | | | 0.74 | % | | | 3-1-2037 | | | $ | 1,460,000 | | | $ | 1,460,000 | |
Main Street Natural Gas Incorporated Sub Series A2 (Utilities Revenue, Royal Bank of Canada SPA) | | | 0.54 | | | | 8-1-2040 | | | | 1,095,000 | | | | 1,095,000 | |
| |
| | | | 2,555,000 | |
| | | | | | | | | | | | | | | | |
| | | | |
Illinois: 1.31% | | | | | | | | | | | | | | | | |
| | | | |
| Variable Rate Demand Notes ø: 1.31% | | | | | | | | | | | | | | | | |
Chicago IL Enterprise Zone Gardner Gibson Project (Industrial Development Revenue, Harris NA LOC) | | | 0.54 | | | | 7-1-2033 | | | | 1,890,000 | | | | 1,890,000 | |
Peoria County IL Caterpillar Incorporated Project (Industrial Development Revenue) | | | 0.64 | | | | 2-1-2030 | | | | 1,000,000 | | | | 1,000,000 | |
| |
| | | | 2,890,000 | |
| | | | | | | | | | | | | | | | |
| | | | |
Indiana: 0.74% | | | | | | | | | | | | | | | | |
| | | | |
| Variable Rate Demand Note ø: 0.74% | | | | | | | | | | | | | | | | |
St. Joseph County IN Midcorr Land Development LLC Project (Industrial Development Revenue, PNC Bank NA LOC) | | | 0.56 | | | | 10-1-2023 | | | | 1,630,000 | | | | 1,630,000 | |
| | | | | | | | | | | | | | | | |
| | | | |
Iowa: 2.74% | | | | | | | | | | | | | | | | |
| | | | |
| Variable Rate Demand Notes ø: 2.74% | | | | | | | | | | | | | | | | |
Iowa Finance Authority Barclays Residual Interest Bonds Trust Series 1WE (Miscellaneous Revenue, Barclays Bank plc LOC) 144A | | | 0.59 | | | | 1-1-2019 | | | | 4,300,000 | | | | 4,300,000 | |
Iowa Finance Authority Interwest Project Series 2001 (Industrial Development Revenue, CoBank LOC) | | | 0.50 | | | | 11-1-2016 | | | | 340,000 | | | | 340,000 | |
Iowa Finance Authority Powerfilm Incorporated Project (Industrial Development Revenue, Bank of America NA LOC) | | | 0.61 | | | | 6-1-2028 | | | | 1,400,000 | | | | 1,400,000 | |
| |
| | | | 6,040,000 | |
| | | | | | | | | | | | | | | | |
| | | | |
Kansas: 0.88% | | | | | | | | | | | | | | | | |
| | | | |
| Variable Rate Demand Note ø: 0.88% | | | | | | | | | | | | | | | | |
Olathe KS Integral Senior Living LLC Project (Industrial Development Revenue, U.S. Bank NA LOC) | | | 0.54 | | | | 8-1-2027 | | | | 1,950,000 | | | | 1,950,000 | |
| | | | | | | | | | | | | | | | |
| | | | |
Kentucky: 0.75% | | | | | | | | | | | | | | | | |
| | | | |
| Variable Rate Demand Note ø: 0.75% | | | | | | | | | | | | | | | | |
Jefferson County KY Industrial Building Dant Growth LLC Project Series 2002 (Industrial Development Revenue, Stock Yards Bank & Trust LOC) | | | 0.56 | | | | 9-1-2022 | | | | 1,650,000 | | | | 1,650,000 | |
| | | | | | | | | | | | | | | | |
| | | | |
Louisiana: 2.26% | | | | | | | | | | | | | | | | |
| | | | |
| Variable Rate Demand Notes ø: 2.26% | | | | | | | | | | | | | | | | |
Louisiana BAN Series 2016-A JPMorgan PUTTER Series 5006 (GO Revenue, JPMorgan Chase & Company LOC, JPMorgan Chase & Company LIQ) 144A | | | 0.39 | | | | 8-15-2016 | | | | 1,000,000 | | | | 1,000,000 | |
Louisiana Local Government Environmental Facilities CDA Honeywell International Incorporated Project (Industrial Development Revenue) | | | 0.59 | | | | 12-1-2036 | | | | 4,000,000 | | | | 4,000,000 | |
| |
| | | | 5,000,000 | |
| | | | | | | | | | | | | | | | |
The accompanying notes are an integral part of these financial statements.
| | | | | | |
| Portfolio of investments—July 31, 2016 (unaudited) | | Wells Fargo Municipal Money Market Fund | | | 9 | |
| | | | | | | | | | | | | | | | |
| Security name | | Interest rate | | | Maturity date | | | Principal | | | Value | |
| | | | | | | | | | | | | | | | |
| | | | |
Massachusetts: 0.91% | | | | | | | | | | | | | | | | |
| | | | |
| Variable Rate Demand Notes ø: 0.91% | | | | | | | | | | | | | | | | |
Massachusetts JPMorgan Chase PUTTER/DRIVER Trust Series 5004 (GO Revenue, JPMorgan Chase & Company LOC, JPMorgan Chase & Company LIQ) 144A | | | 0.39 | % | | | 9-1-2017 | | | $ | 1,000,000 | | | $ | 1,000,000 | |
Massachusetts JPMorgan Chase PUTTER/DRIVER Trust Series 5005 (GO Revenue, JPMorgan Chase & Company LOC, JPMorgan Chase & Company LIQ) 144A | | | 0.39 | | | | 6-1-2018 | | | | 1,000,000 | | | | 1,000,000 | |
| |
| | | | 2,000,000 | |
| | | | | | | | | | | | | | | | |
| | | | |
Michigan: 5.63% | | | | | | | | | | | | | | | | |
| | | | |
| Variable Rate Demand Notes ø: 5.63% | | | | | | | | | | | | | | | | |
Eastern Michigan University Barclays Residual Interest Bonds Trust Series 6WE (Miscellaneous Revenue, Barclays Bank plc LOC) 144A | | | 0.59 | | | | 7-1-2018 | | | | 5,500,000 | | | | 5,500,000 | |
Green Lake Township MI Economic Development Corporation (Miscellaneous Revenue, BMO Harris Bank NA LOC) | | | 0.37 | | | | 6-1-2034 | | | | 485,000 | | | | 485,000 | |
Michigan Housing Development Authority Series A (Housing Revenue, AGM Insured, Fortis Bank SA SPA) | | | 0.59 | | | | 4-1-2042 | | | | 1,510,000 | | | | 1,510,000 | |
Michigan Housing Development Authority Series D (Housing Revenue, Bank of Tokyo-Mitsubishi SPA) | | | 0.66 | | | | 12-1-2038 | | | | 4,940,000 | | | | 4,940,000 | |
| |
| | | | 12,435,000 | |
| | | | | | | | | | | | | | | | |
| | | | |
Minnesota: 6.81% | | | | | | | | | | | | | | | | |
| | | | |
| Variable Rate Demand Notes ø: 6.81% | | | | | | | | | | | | | | | | |
Bloomington MN Refunding Bond MFHR Norlan Partnership Series 2000-A-1 (Housing Revenue, FNMA Insured, FNMA LIQ) | | | 0.55 | | | | 7-15-2032 | | | | 4,990,000 | | | | 4,990,000 | |
Coon Rapids MN Drake Apartments Project Series A (Housing Revenue, FNMA Insured, FNMA LIQ) | | | 0.55 | | | | 6-15-2038 | | | | 2,655,000 | | | | 2,655,000 | |
Forest Lake MN Kilkenny Court Apartments Project Series 2008 (Housing Revenue, FNMA Insured, FNMA LIQ) | | | 0.53 | | | | 8-15-2038 | | | | 400,000 | | | | 400,000 | |
Mahtomedi MN Briarcliff Manor Apartments Series A (Housing Revenue, FNMA Insured, FNMA LIQ) | | | 0.55 | | | | 6-15-2038 | | | | 3,645,000 | | | | 3,645,000 | |
Minnesota Bond Securitization Trust Certificate Series S-1 (Miscellaneous Revenue, PNC Bank NA LOC) | | | 0.67 | | | | 2-1-2027 | | | | 1,205,000 | | | | 1,205,000 | |
St. Paul MN Housing & RDA Hampden Square Apartments Series A (Housing Revenue, FNMA Insured, FNMA LIQ) | | | 0.55 | | | | 6-1-2032 | | | | 2,140,000 | | | | 2,140,000 | |
| |
| | | | 15,035,000 | |
| | | | | | | | | | | | | | | | |
| | | | |
Mississippi: 3.44% | | | | | | | | | | | | | | | | |
| | | | |
| Variable Rate Demand Notes ø: 3.44% | | | | | | | | | | | | | | | | |
Mississippi Business Finance Corporation Gulf Opportunity Chevron USA Incorporated Project Series A (Industrial Development Revenue) | | | 0.35 | | | | 12-1-2030 | | | | 5,200,000 | | | | 5,200,000 | |
Mississippi Series A Clipper Tax-Exempt Certificate Trust Series 2009-60 (Miscellaneous Revenue, State Street Bank & Trust Company LIQ) | | | 0.47 | | | | 11-1-2018 | | | | 2,400,000 | | | | 2,400,000 | |
| |
| | | | 7,600,000 | |
| | | | | | | | | | | | | | | | |
| | | | |
Missouri: 0.68% | | | | | | | | | | | | | | | | |
| | | | |
| Variable Rate Demand Note ø: 0.68% | | | | | | | | | | | | | | | | |
St. Charles County MO IDA Kuenz Heating & Sheet Metal Series 2001 (Industrial Development Revenue, U.S. Bank NA LOC) | | | 0.64 | | | | 4-1-2026 | | | | 1,500,000 | | | | 1,500,000 | |
| | | | | | | | | | | | | | | | |
The accompanying notes are an integral part of these financial statements.
| | | | |
| 10 | | Wells Fargo Municipal Money Market Fund | | Portfolio of investments—July 31, 2016 (unaudited) |
| | | | | | | | | | | | | | | | |
| Security name | | Interest rate | | | Maturity date | | | Principal | | | Value | |
| | | | | | | | | | | | | | | | |
| | | | |
Nebraska: 2.22% | | | | | | | | | | | | | | | | |
| | | | |
| Variable Rate Demand Notes ø: 2.22% | | | | | | | | | | | | | | | | |
Lincoln NE Electric System Series 2900 (Utilities Revenue, Credit Suisse LIQ) | | | 0.53 | % | | | 9-1-2037 | | | $ | 597,307 | | | $ | 597,307 | |
Nebraska Investment Finance Authority MFHR Apple Creek Associates Project Series 1985-A (Housing Revenue, Northern Trust Company LOC) | | | 0.44 | | | | 9-1-2031 | | | | 4,310,000 | | | | 4,310,000 | |
| |
| | | | 4,907,307 | |
| | | | | | | | | | | | | | | | |
| | | | |
Nevada: 0.73% | | | | | | | | | | | | | | | | |
| | | | |
| Variable Rate Demand Notes ø: 0.73% | | | | | | | | | | | | | | | | |
Nevada Housing Division Multi-Unit Fort Apache Road LLC Series A (Housing Revenue, Exchange Bank LOC) | | | 0.61 | | | | 10-1-2026 | | | | 1,400,000 | | | | 1,400,000 | |
Reno NV Senior Lien Transportation Rail Access Corridor Project Series 2008-A (Tax Revenue, Bank of New York Mellon LOC) | | | 0.45 | | | | 6-1-2042 | | | | 200,000 | | | | 200,000 | |
| |
| | | | 1,600,000 | |
| | | | | | | | | | | | | | | | |
| | | | |
New York: 2.58% | | | | | | | | | | | | | | | | |
| | | | |
| Variable Rate Demand Notes ø: 2.58% | | | | | | | | | | | | | | | | |
New York NY Fiscal Series 1994-H Sub Series H-3 (GO Revenue, AGM Insured, State Street Bank & Trust Company SPA) | | | 0.40 | | | | 8-1-2021 | | | | 1,500,000 | | | | 1,500,000 | |
New York NY Fiscal Series 2004-H-1 (GO Revenue, Bank of New York Mellon LOC) | | | 0.38 | | | | 3-1-2034 | | | | 2,400,000 | | | | 2,400,000 | |
New York NY Transitional Finance Authority Recovery Bonds Fiscal 2003 Series 3 Sub Series 3F (Tax Revenue, Royal Bank of Canada SPA) | | | 0.38 | | | | 11-1-2022 | | | | 1,800,000 | | | | 1,800,000 | |
| |
| | | | 5,700,000 | |
| | | | | | | | | | | | | | | | |
| | | | |
North Carolina: 4.82% | | | | | | | | | | | | | | | | |
| | | | |
| Variable Rate Demand Notes ø: 4.82% | | | | | | | | | | | | | | | | |
North Carolina Education Care Community HCFR (Health Revenue, Branch Banking & Trust SPA) | | | 0.48 | | | | 10-1-2028 | | | | 4,000,000 | | | | 4,000,000 | |
North Carolina HFA Home Ownership Series 15-C (Housing Revenue, AGM Insured, TD Bank NA SPA) | | | 0.44 | | | | 7-1-2032 | | | | 2,005,000 | | | | 2,005,000 | |
North Carolina HFA Home Ownership Series 16-C (Housing Revenue, TD Bank NA SPA) | | | 0.44 | | | | 7-1-2032 | | | | 2,600,000 | | | | 2,600,000 | |
North Carolina Tender Option Bond Trust Receipts/Certificates Series XF2165 (Education Revenue, Morgan Stanley Bank LIQ) 144A | | | 0.47 | | | | 10-1-2055 | | | | 300,000 | | | | 300,000 | |
Rockingham County NC Industrial Facilities & PCFA Innofa USA Project Series 2007 (Industrial Development Revenue, Branch Banking & Trust LOC) | | | 0.50 | | | | 12-1-2026 | | | | 1,750,000 | | | | 1,750,000 | |
| |
| | | | 10,655,000 | |
| | | | | | | | | | | | | | | | |
| | | | |
Ohio: 1.81% | | | | | | | | | | | | | | | | |
| | | | |
| Variable Rate Demand Note ø: 1.81% | | | | | | | | | | | | | | | | |
Ohio Air Quality Development Authority Andersons Marathon Ethanol LLC Project Series 2007 (Resource Recovery Revenue, CoBank LOC) | | | 0.51 | | | | 3-1-2032 | | | | 4,000,000 | | | | 4,000,000 | |
| | | | | | | | | | | | | | | | |
| | | | |
Oklahoma: 1.05% | | | | | | | | | | | | | | | | |
| | | | |
| Variable Rate Demand Notes ø: 1.05% | | | | | | | | | | | | | | | | |
Oklahoma Development Finance Authority Industrial Development Tracker Marine Project (Miscellaneous Revenue, Bank of America NA LOC) | | | 0.66 | | | | 3-1-2018 | | | | 325,000 | | | | 325,000 | |
Oklahoma Turnpike Authority Series F (Transportation Revenue, JPMorgan Chase & Company SPA) | | | 0.37 | | | | 1-1-2028 | | | | 2,000,000 | | | | 2,000,000 | |
| |
| | | | 2,325,000 | |
| | | | | | | | | | | | | | | | |
The accompanying notes are an integral part of these financial statements.
| | | | | | |
| Portfolio of investments—July 31, 2016 (unaudited) | | Wells Fargo Municipal Money Market Fund | | | 11 | |
| | | | | | | | | | | | | | | | |
| Security name | | Interest rate | | | Maturity date | | | Principal | | | Value | |
| | | | | | | | | | | | | | | | |
| | | | |
Oregon: 2.76% | | | | | | | | | | | | | | | | |
| | | | |
| Variable Rate Demand Note ø: 2.76% | | | | | | | | | | | | | | | | |
Port of Portland OR Horizon Air Industries Incorporated Project (Airport Revenue, Bank of America NA LOC) | | | 0.41 | % | | | 6-15-2027 | | | $ | 6,100,000 | | | $ | 6,100,000 | |
| | | | | | | | | | | | | | | | |
| | | | |
Other: 8.12% | | | | | | | | | | | | | | | | |
| | | | |
| Variable Rate Demand Notes ø: 8.12% | | | | | | | | | | | | | | | | |
Clipper Tax-Exempt Certificate Trust Series 2007-19 (Miscellaneous Revenue, State Street Bank & Trust Company LIQ) | | | 0.56 | | | | 9-1-2039 | | | | 1,085,000 | | | | 1,085,000 | |
Clipper Tax-Exempt Certificate Trust Series 2009-32 (Miscellaneous Revenue, State Street Bank & Trust Company LIQ) | | | 0.49 | | | | 1-1-2018 | | | | 5,000,000 | | | | 5,000,000 | |
Clipper Tax-Exempt Certificate Trust Series 2009-54 (Miscellaneous Revenue, State Street Bank & Trust Company LIQ) | | | 0.49 | | | | 2-15-2028 | | | | 2,827,000 | | | | 2,827,000 | |
FHLMC MFHR Series M019 Class A (Housing Revenue, FHLMC LIQ) | | | 0.49 | | | | 5-1-2017 | | | | 2,527,000 | | | | 2,527,000 | |
FHLMC MFHR Series M021 Class A (Housing Revenue, FHLMC LIQ) | | | 0.49 | | | | 6-15-2036 | | | | 4,605,000 | | | | 4,605,000 | |
FHLMC MFHR Series M031 Class A (Housing Revenue, FHLMC LIQ) | | | 0.47 | | | | 12-15-2045 | | | | 1,100,000 | | | | 1,100,000 | |
FHLMC MFHR Series M033 Class A (Housing Revenue, FHLMC LIQ) | | | 0.47 | | | | 12-15-2046 | | | | 800,000 | | | | 800,000 | |
| |
| | | | 17,944,000 | |
| | | | | | | | | | | | | | | | |
| | | | |
Pennsylvania: 0.36% | | | | | | | | | | | | | | | | |
| | | | |
| Variable Rate Demand Note ø: 0.36% | | | | | | | | | | | | | | | | |
Pennsylvania EDFA Series D-7 (Industrial Development Revenue, PNC Bank NA LOC) | | | 0.56 | | | | 8-1-2022 | | | | 800,000 | | | | 800,000 | |
| | | | | | | | | | | | | | | | |
| | | | |
South Carolina: 3.35% | | | | | | | | | | | | | | | | |
| | | | |
| Other Municipal Debt: 3.35% | | | | | | | | | | | | | | | | |
York County SC PCR Series 2000B-1 (Utilities Revenue) | | | 0.54 | | | | 8-1-2016 | | | | 2,600,000 | | | | 2,600,000 | |
York County SC PCR Series 2000B-2 (Utilities Revenue) | | | 0.54 | | | | 8-1-2016 | | | | 2,600,000 | | | | 2,600,000 | |
York County SC PCR Series 2000B-3 (Utilities Revenue) | | | 0.54 | | | | 8-1-2016 | | | | 2,200,000 | | | | 2,200,000 | |
| |
| | | | 7,400,000 | |
| | | | | | | | | | | | | | | | |
| | | | |
Texas: 10.01% | | | | | | | | | | | | | | | | |
| | | | |
| Other Municipal Debt: 0.09% | | | | | | | | | | | | | | | | |
Dallas TX Independent School District Series 2012 (GO Revenue) | | | 4.00 | | | | 8-15-2016 | | | | 200,000 | | | | 200,283 | |
| | | | | | | | | | | | | | | | |
| | | | |
| Variable Rate Demand Notes ø: 9.92% | | | | | | | | | | | | | | | | |
Atascosa County TX PCR San Miguel Electric Cooperative (Utilities Revenue) | | | 0.52 | | | | 6-30-2020 | | | | 1,400,000 | | | | 1,400,000 | |
Brazos River Harbor TX Naval District BASF Corporation Project (Industrial Development Revenue) | | | 0.53 | | | | 5-1-2036 | | | | 500,000 | | | | 500,000 | |
Dallas TX Waterworks & Sewer System Clipper Tax Exempt Certificates Trust Series 2009-52 (Water & Sewer Revenue, State Street Bank & Trust Company LIQ) | | | 0.47 | | | | 10-1-2018 | | | | 2,500,000 | | | | 2,500,000 | |
Gulf Coast Texas Waste Disposal Authority PCR Exxon Project Series 1989 (Industrial Development Revenue) | | | 0.34 | | | | 10-1-2024 | | | | 4,250,000 | | | | 4,250,000 | |
Harris County TX Cultural Educational Facilities Finance Corporation Children’s Hospital Project Series 2015-3 JPMorgan PUTTER Series 5001 (Hospital Revenue, JPMorgan Chase & Company LIQ) 144A | | | 0.39 | | | | 6-1-2019 | | | | 900,000 | | | | 900,000 | |
Lower Neches Valley Authority Texas Industrial Development Corporation Exempt Facilities Revenue Mobil Oil Refining Corporation Project (Industrial Development Revenue) | | | 0.35 | | | | 4-1-2029 | | | | 1,500,000 | | | | 1,500,000 | |
Port Corpus Christi TX Flint Hills Resources Project Series A (Resource Recovery Revenue) | | | 0.55 | | | | 4-1-2028 | | | | 4,000,000 | | | | 4,000,000 | |
The accompanying notes are an integral part of these financial statements.
| | | | |
| 12 | | Wells Fargo Municipal Money Market Fund | | Portfolio of investments—July 31, 2016 (unaudited) |
| | | | | | | | | | | | | | | | |
| Security name | | Interest rate | | | Maturity date | | | Principal | | | Value | |
| | | | | | | | | | | | | | | | |
| | | | |
| Variable Rate Demand Notes ø (continued) | | | | | | | | | | | | | | | | |
Tarrant County TX Cultural Educational Facilities Finance Corporation Methodist Hospitals of Dallas Series A (Health Revenue, TD Bank NA LOC) | | | 0.39 | % | | | 10-1-2041 | | | $ | 1,075,000 | | | $ | 1,075,000 | |
Texas Municipal Gas Acquisition & Supply Corporation Series 2848 (Utilities Revenue, Morgan Stanley Bank LIQ) 144A | | | 0.74 | | | | 12-15-2026 | | | | 5,786,548 | | | | 5,786,548 | |
| |
| | | | 21,911,548 | |
| | | | | | | | | | | | | | | | |
| | | | |
Utah: 0.77% | | | | | | | | | | | | | | | | |
| | | | |
| Variable Rate Demand Notes ø: 0.77% | | | | | | | | | | | | | | | | |
Juab County UT Intermountain Farmers Association Project (Industrial Development Revenue, CoBank LOC) | | | 0.55 | | | | 10-1-2021 | | | | 400,000 | | | | 400,000 | |
Weber County UT Hospital IHC Health Services Series 2000C (Health Revenue, Bank of New York Mellon SPA) | | | 0.38 | | | | 2-15-2035 | | | | 1,300,000 | | | | 1,300,000 | |
| |
| | | | 1,700,000 | |
| | | | | | | | | | | | | | | | |
| | | | |
Virginia: 2.35% | | | | | | | | | | | | | | | | |
| | | | |
| Variable Rate Demand Note ø: 2.35% | | | | | | | | | | | | | | | | |
Norfolk VA EDA Sentara Healthcare Series A (Health Revenue) | | | 0.43 | | | | 11-1-2034 | | | | 5,200,000 | | | | 5,200,000 | |
| | | | | | | | | | | | | | | | |
| | | | |
Washington: 1.90% | | | | | | | | | | | | | | | | |
| | | | |
| Variable Rate Demand Notes ø: 1.90% | | | | | | | | | | | | | | | | |
Squaxin Island Tribe Washington Series 2008-B (Miscellaneous Revenue, Bank of America NA LOC) | | | 0.54 | | | | 5-1-2028 | | | | 830,000 | | | | 830,000 | |
Washington Housing Finance Commission Whisperwood Apartments Project Series A (Housing Revenue, FNMA Insured, FNMA LIQ) | | | 0.52 | | | | 5-15-2035 | | | | 1,590,000 | | | | 1,590,000 | |
Yakima County WA Solid Waste Disposal George Deruyter & Son Project Series 2006 (Resource Recovery Revenue, Northwest Farm Credit LOC) | | | 0.53 | | | | 8-1-2026 | | | | 1,785,000 | | | | 1,785,000 | |
| |
| | | | 4,205,000 | |
| | | | | | | | | | | | | | | | |
| | | | |
Wisconsin: 1.79% | | | | | | | | | | | | | | | | |
| | | | |
| Variable Rate Demand Notes ø: 1.79% | | | | | | | | | | | | | | | | |
Manitowoc WI CDA Regency House Project (Housing Revenue, Bank First National LOC) | | | 0.64 | | | | 11-1-2020 | | | | 1,085,000 | | | | 1,085,000 | |
Sheboygan WI Alaark Manufacturing Corporation Project Series 2000 (Industrial Development Revenue, U.S. Bank NA LOC) | | | 0.71 | | | | 12-1-2021 | | | | 995,000 | | | | 995,000 | |
Sheboygan WI Vortex Liquid Color Project (Industrial Development Revenue, Bank First National LOC) | | | 0.79 | | | | 11-1-2020 | | | | 920,000 | | | | 920,000 | |
Two Rivers WI Riverside Foods Incorporated Project (Industrial Development Revenue, Bank First National LOC) | | | 0.79 | | | | 12-1-2022 | | | | 950,000 | | | | 950,000 | |
| |
| | | | 3,950,000 | |
| | | | | | | | | | | | | | | | |
| |
Total Municipal Obligations (Cost $186,783,138) | | | | 186,783,138 | |
| | | | | | | | | | | | | | | | |
| | | | |
Other: 8.96% | | | | | | | | | | | | | | | | |
Nuveen California Dividend Advantage Municipal Fund Variable Rate Demand Preferred Shares Series 5 (Citibank NA LIQ) 144A±§ | | | 0.55 | | | | 8-1-2040 | | | | 1,800,000 | | | | 1,800,000 | |
Nuveen Enhanced Municipal Credit Opportunities Fund Series 2 (JPMorgan Chase & Company LIQ) 144A±§ | | | 0.57 | | | | 3-1-2040 | | | | 5,000,000 | | | | 5,000,000 | |
Nuveen New Jersey Dividend Advantage Municipal Fund Variable Rate Demand Preferred Shares Series 5 (TD Bank NA LIQ) 144A±§ | | | 0.55 | | | | 8-3-2043 | | | | 3,500,000 | | | | 3,500,000 | |
The accompanying notes are an integral part of these financial statements.
| | | | | | |
| Portfolio of investments—July 31, 2016 (unaudited) | | Wells Fargo Municipal Money Market Fund | | | 13 | |
| | | | | | | | | | | | | | | | |
| Security name | | Interest rate | | | Maturity date | | | Principal | | | Value | |
| | | | | | | | | | | | | | | | |
| | | | |
Other (continued) | | | | | | | | | | | | | | | | |
Western Asset Intermediate Municipal Fund Incorporated Variable Rate Demand Preferred Shares Series 1 (Citibank NA LIQ) 144A±§ | | | 0.53 | % | | | 2-25-2045 | | | $ | 3,500,000 | | | $ | 3,500,000 | |
Western Asset Managed Municipal Fund Incorporated Variable Rate Demand Preferred Shares Series 1 (Citibank NA LIQ) 144A±§ | | | 0.53 | | | | 3-4-2045 | | | | 6,000,000 | | | | 6,000,000 | |
| |
Total Other (Cost $19,800,000) | | | | 19,800,000 | |
| | | | | | | | | | | | | | | | |
| | | | |
Repurchase Agreements: 3.62% | | | | | | | | | | | | | | | | |
Societe Generale, dated 7-29-2016, maturity value $8,000,220 ^^ | | | 0.33 | | | | 8-1-2016 | | | | 8,000,000 | | | | 8,000,000 | |
| | | | | | | | | | | | | | | | |
| |
Total Repurchase Agreements (Cost $8,000,000) | | | | 8,000,000 | |
| | | | | | | | | | | | | | | | |
| | | | | | | | |
| Total investments in securities (Cost $214,583,138) * | | | 97.15 | % | | | 214,583,138 | |
Other assets and liabilities, net | | | 2.85 | | | | 6,293,385 | |
| | | | | | | | |
| Total net assets | | | 100.00 | % | | $ | 220,876,523 | |
| | | | | | | | |
| ø | Variable rate demand notes are subject to a demand feature which reduces the effective maturity. The maturity date shown represents the final maturity date of the security. The interest rate is determined and reset by the issuer daily, weekly, or monthly depending upon the terms of the security. The rate shown is the rate in effect at period end. |
| 144A | The security may be resold in transactions exempt from registration, normally to qualified institutional buyers, pursuant to Rule 144A under the Securities Act of 1933. |
| ± | Variable rate investment. The rate shown is the rate in effect at period end. |
| § | The security is subject to a demand feature which reduces the effective maturity. |
| ^^ | Collateralized by U.S. government securities, 0.00% to 8.13%, 7-31-2016 to 8-15-2045, fair value including accrued interest is $8,160,000. |
| * | Cost for federal income tax purposes is substantially the same as for financial reporting purposes. |
The accompanying notes are an integral part of these financial statements.
| | | | |
| 14 | | Wells Fargo Municipal Money Market Fund | | Statement of assets and liabilities—July 31, 2016 (unaudited) |
| | | | |
| | | | |
| |
Assets | | | | |
Investments in unaffiliated securities, at amortized cost | | $ | 214,583,138 | |
Cash | | | 77,775 | |
Receivable for investments sold | | | 6,507,842 | |
Receivable for Fund shares sold | | | 179,004 | |
Receivable for interest | | | 140,726 | |
Receivable from manager | | | 6,877 | |
Prepaid expenses and other assets | | | 86,270 | |
| | | | |
Total assets | | | 221,581,632 | |
| | | | |
| |
Liabilities | | | | |
Dividends payable | | | 8,666 | |
Payable for Fund shares redeemed | | | 440,548 | |
Distribution fee payable | | | 248 | |
Administration fees payable | | | 35,525 | |
Trustees’ fees and expenses payable | | | 73,897 | |
Shareholder servicing fees payable | | | 50,092 | |
Accrued expenses and other liabilities | | | 96,133 | |
| | | | |
Total liabilities | | | 705,109 | |
| | | | |
Total net assets | | $ | 220,876,523 | |
| | | | |
| |
NET ASSETS CONSIST OF | | | | |
Paid-in capital | | $ | 220,917,231 | |
Overdistributed net investment income | | | (83,075 | ) |
Accumulated net realized gains on investments | | | 42,367 | |
| | | | |
Total net assets | | $ | 220,876,523 | |
| | | | |
| |
COMPUTATION OF NET ASSET VALUE PER SHARE | | | | |
Net assets – Class A | | $ | 134,727,913 | |
Shares outstanding – Class A1 | | | 134,788,726 | |
Net asset value per share – Class A | | | $1.00 | |
Net assets – Premier Class | | $ | 102,617 | |
Shares outstanding – Premier Class1 | | | 102,663 | |
Net asset value per share – Premier Class | | | $1.00 | |
Net assets – Service Class | | $ | 85,212,484 | |
Shares outstanding – Service Class1 | | | 85,250,874 | |
Net asset value per share – Service Class | | | $1.00 | |
Net assets – Sweep Class | | $ | 833,509 | |
Shares outstanding – Sweep Class1 | | | 833,885 | |
Net asset value per share – Sweep Class | | | $1.00 | |
| 1 | The Fund has an unlimited number of authorized shares. |
The accompanying notes are an integral part of these financial statements.
| | | | | | |
| Statement of operations—six months ended July 31, 2016 (unaudited) | | Wells Fargo Municipal Money Market Fund | | | 15 | |
| | | | |
| | | | |
| |
Investment income | | | | |
Interest | | $ | 509,641 | |
| | | | |
| |
Expenses | | | | |
Management fee | | | 483,902 | |
Administration fees | | | | |
Class A | | | 150,386 | |
Premier Class1 | | | 3,727 | |
Service Class | | | 77,796 | |
Sweep Class | | | 907 | |
Shareholder servicing fees | | | | |
Class A | | | 170,893 | |
Service Class | | | 161,790 | |
Sweep Class | | | 1,031 | |
Distribution fee | | | | |
Sweep Class | | | 1,443 | |
Custody and accounting fees | | | 12,402 | |
Professional fees | | | 25,975 | |
Registration fees | | | 33,876 | |
Shareholder report expenses | | | 13,111 | |
Trustees’ fees and expenses | | | 12,045 | |
Other fees and expenses | | | 5,267 | |
| | | | |
Total expenses | | | 1,154,551 | |
Less: Fee waivers and/or expense reimbursements | | | (669,929 | ) |
| | | | |
Net expenses | | | 484,622 | |
| | | | |
Net investment income | | | 25,019 | |
| | | | |
Net realized gains on investments | | | 8,892 | |
| | | | |
Net increase in net assets resulting from operations | | $ | 33,911 | |
| | | | |
| 1 | Effective April 1, 2016, Institutional Class was renamed Premier Class. |
The accompanying notes are an integral part of these financial statements.
| | | | |
| 16 | | Wells Fargo Municipal Money Market Fund | | Statement of changes in net assets |
| | | | | | | | | | | | | | | | |
| | | Six months ended July 31, 2016 (unaudited) | | | Year ended January 31, 2016 | |
| | | |
Operations | | | | | | | | | | | | |
Net investment income | | | | | | $ | 25,019 | | | | | | | $ | 31,785 | |
Net realized gains on investments | | | | | | | 8,892 | | | | | | | | 50,376 | |
| | | | |
Net increase in net assets resulting from operations | | | | | | | 33,911 | | | | | | | | 82,161 | |
| | | | |
| | | |
Distributions to shareholders from | | | | | | | | | | | | |
Net investment income | | | | | | | | | | | | | | | | |
Class A | | | | | | | (6,857 | ) | | | | | | | (4,586 | ) |
Investor Class | | | | | | | N/A | | | | | | | | (9,498 | )1 |
Premier Class2 | | | | | | | (5,989 | ) | | | | | | | (1,986 | ) |
Service Class | | | | | | | (12,131 | ) | | | | | | | (15,216 | ) |
Sweep Class | | | | | | | (42 | ) | | | | | | | (499 | ) |
Net realized gains | | | | | | | | | | | | | | | | |
Class A | | | | | | | 0 | | | | | | | | (13,147 | ) |
Premier Class2 | | | | | | | 0 | | | | | | | | (3,520 | ) |
Service Class | | | | | | | 0 | | | | | | | | (14,134 | ) |
Sweep Class | | | | | | | 0 | | | | | | | | (86 | ) |
| | | | |
Total distributions to shareholders | | | | | | | (25,019 | ) | | | | | | | (62,672 | ) |
| | | | |
| | | | |
Capital share transactions | | | Shares | | | | | | | | Shares | | | | | |
Proceeds from shares sold | | | | | | | | | | | | | | | | |
Class A | | | 26,682,112 | | | | 26,682,112 | | | | 149,351,709 | | | | 149,351,709 | |
Investor Class | | | N/A | | | | N/A | | | | 28,693,249 | 1 | | | 28,693,249 | 1 |
Premier Class2 | | | 10,106,466 | | | | 10,106,466 | | | | 40,602,180 | | | | 40,602,180 | |
Service Class | | | 118,242,671 | | | | 118,242,671 | | | | 99,758,452 | | | | 99,758,452 | |
Sweep Class | | | 260,537 | | | | 260,537 | | | | 520,450 | | | | 520,450 | |
| | | | |
| | | | | | | 155,291,786 | | | | | | | | 318,926,040 | |
| | | | |
Reinvestment of distributions | | | | | | | | | | | | | | | | |
Class A | | | 6,352 | | | | 6,352 | | | | 16,932 | | | | 16,932 | |
Investor Class | | | N/A | | | | N/A | | | | 8,197 | 1 | | | 8,197 | 1 |
Premier Class2 | | | 5,507 | | | | 5,507 | | | | 5,506 | | | | 5,506 | |
Service Class | | | 2,231 | | | | 2,231 | | | | 4,539 | | | | 4,539 | |
Sweep Class | | | 42 | | | | 42 | | | | 585 | | | | 585 | |
| | | | |
| | | | | | | 14,132 | | | | | | | | 35,759 | |
| | | | |
Payment for shares redeemed | | | | | | | | | | | | | | | | |
Class A | | | (28,793,216 | ) | | | (28,793,216 | ) | | | (22,448,938 | ) | | | (22,448,938 | ) |
Investor Class | | | N/A | | | | N/A | | | | (161,581,345 | )1 | | | (161,581,345 | )1 |
Premier Class2 | | | (29,705,936 | ) | | | (29,705,936 | ) | | | (48,568,433 | ) | | | (48,568,433 | ) |
Service Class | | | (185,882,731 | ) | | | (185,882,731 | ) | | | (87,115,922 | ) | | | (87,115,922 | ) |
Sweep Class | | | (307,250 | ) | | | (307,250 | ) | | | (9,911,141 | ) | | | (9,911,141 | ) |
| | | | |
| | | | | | | (244,689,133 | ) | | | | | | | (329,625,779 | ) |
| | | | |
Net decrease in net assets resulting from capital share transactions | | | | | | | (89,383,215 | ) | | | | | | | (10,663,980 | ) |
| | | | |
Total decrease in net assets | | | | | | | (89,374,323 | ) | | | | | | | (10,644,491 | ) |
| | | | |
| | |
Net assets | | | | | | | | |
Beginning of period | | | | | | | 310,250,846 | | | | | | | | 320,895,337 | |
| | | | |
End of period | | | | | | $ | 220,876,523 | | | | | | | $ | 310,250,846 | |
| | | | |
Overdistributed net investment income | | | | | | $ | (83,075 | ) | | | | | | $ | (83,075 | ) |
| | | | |
| 1 | For the period from February 1, 2015 to October 23, 2015. Effective at the close of business on October 23, 2015, Investor Class shares were converted to Class A shares and are no longer offered by the Fund. |
| 2 | Effective April 1, 2016, Institutional Class was renamed Premier Class. |
The accompanying notes are an integral part of these financial statements.
| | | | | | |
| Financial highlights | | Wells Fargo Municipal Money Market Fund | | | 17 | |
(For a share outstanding throughout each period)
| | | | | | | | | | | | | | | | | | | | | | | | |
| | | Six months ended
July 31, 2016 (unaudited) | | | Year ended January 31 | |
| CLASS A | | | 2016 | | | 2015 | | | 2014 | | | 2013 | | | 2012 | |
Net asset value, beginning of period | | | $1.00 | | | | $1.00 | | | | $1.00 | | | | $1.00 | | | | $1.00 | | | | $1.00 | |
Net investment income | | | 0.00 | 1 | | | 0.00 | 1,2 | | | 0.00 | 1 | | | 0.00 | 1 | | | 0.00 | 1 | | | 0.00 | 1 |
Net realized gains on investments | | | 0.00 | 1 | | | 0.00 | 1 | | | 0.00 | 1 | | | 0.00 | 1 | | | 0.00 | 1 | | | 0.00 | 1 |
| | | | | | | | | | | | | | | | | | | | | | | | |
Total from investment operations | | | 0.00 | 1 | | | 0.00 | 1 | | | 0.00 | 1 | | | 0.00 | 1 | | | 0.00 | 1 | | | 0.00 | 1 |
Distributions to shareholders from | | | | | | | | | | | | | | | | | | | | | | | | |
Net investment income | | | (0.00 | )1 | | | (0.00 | )1 | | | (0.00 | )1 | | | (0.00 | )1 | | | (0.00 | )1 | | | (0.00 | )1 |
Net realized gains | | | 0.00 | | | | (0.00 | )1 | | | (0.00 | )1 | | | (0.00 | )1 | | | (0.00 | )1 | | | (0.00 | )1 |
| | | | | | | | | | | | | | | | | | | | | | | | |
Total distributions to shareholders | | | (0.00 | )1 | | | (0.00 | )1 | | | (0.00 | )1 | | | (0.00 | )1 | | | (0.00 | )1 | | | (0.00 | )1 |
Net asset value, end of period | | | $1.00 | | | | $1.00 | | | | $1.00 | | | | $1.00 | | | | $1.00 | | | | $1.00 | |
Total return3 | | | 0.00 | % | | | 0.02 | % | | | 0.03 | % | | | 0.04 | % | | | 0.03 | % | | | 0.02 | % |
Ratios to average net assets (annualized) | | | | | | | | | | | | | | | | | | | | | | | | |
Gross expenses | | | 0.89 | % | | | 0.84 | % | | | 0.84 | % | | | 0.83 | % | | | 0.83 | % | | | 0.82 | % |
Net expenses | | | 0.37 | % | | | 0.11 | % | | | 0.12 | % | | | 0.18 | % | | | 0.21 | % | | | 0.22 | % |
Net investment income | | | 0.01 | % | | | 0.01 | % | | | 0.01 | % | | | 0.01 | % | | | 0.01 | % | | | 0.01 | % |
Supplemental data | | | | | | | | | | | | | | | | | | | | | | | | |
Net assets, end of period (000s omitted) | | | $134,728 | | | | $136,845 | | | | $9,970 | | | | $14,410 | | | | $158,400 | | | | $102,082 | |
| 1 | Amount is less than $0.005. |
| 2 | Calculated based upon average shares outstanding |
| 3 | Returns for periods of less than one year are not annualized. |
The accompanying notes are an integral part of these financial statements.
| | | | |
| 18 | | Wells Fargo Municipal Money Market Fund | | Financial highlights |
(For a share outstanding throughout each period)
| | | | | | | | | | | | | | | | | | | | | | | | |
| | | Six months ended
July 31, 2016 (unaudited) | | | Year ended January 31 | |
| PREMIER CLASS1 | | | 2016 | | | 2015 | | | 2014 | | | 2013 | | | 2012 | |
Net asset value, beginning of period | | | $1.00 | | | | $1.00 | | | | $1.00 | | | | $1.00 | | | | $1.00 | | | | $1.00 | |
Net investment income | | | 0.00 | 2,3 | | | 0.00 | 2 | | | 0.00 | 2 | | | 0.00 | 2 | | | 0.00 | 2 | | | 0.00 | 2 |
Net realized gains on investments | | | 0.00 | 2 | | | 0.00 | 2 | | | 0.00 | 2 | | | 0.00 | 2 | | | 0.00 | 2 | | | 0.00 | 2 |
| | | | | | | | | | | | | | | | | | | | | | | | |
Total from investment operations | | | 0.00 | 2 | | | 0.00 | 2 | | | 0.00 | 2 | | | 0.00 | 2 | | | 0.00 | 2 | | | 0.00 | 2 |
Distributions to shareholders from | | | | | | | | | | | | | | | | | | | | | | | | |
Net investment income | | | (0.00 | )2 | | | (0.00 | )2 | | | (0.00 | )2 | | | (0.00 | )2 | | | (0.00 | )2 | | | (0.00 | )2 |
Net realized gains | | | 0.00 | | | | (0.00 | )2 | | | (0.00 | )2 | | | (0.00 | )2 | | | (0.00 | )2 | | | (0.00 | )2 |
| | | | | | | | | | | | | | | | | | | | | | | | |
Total distributions to shareholders | | | (0.00 | )2 | | | (0.00 | )2 | | | (0.00 | )2 | | | (0.00 | )2 | | | (0.00 | )2 | | | (0.00 | )2 |
Net asset value, end of period | | | $1.00 | | | | $1.00 | | | | $1.00 | | | | $1.00 | | | | $1.00 | | | | $1.00 | |
Total return4 | | | 0.10 | % | | | 0.02 | % | | | 0.03 | % | | | 0.04 | % | | | 0.07 | % | | | 0.05 | % |
Ratios to average net assets (annualized) | | | | | | | | | | | | | | | | | | | | | | | | |
Gross expenses | | | 0.51 | % | | | 0.48 | % | | | 0.45 | % | | | 0.44 | % | | | 0.44 | % | | | 0.44 | % |
Net expenses | | | 0.17 | % | | | 0.11 | % | | | 0.11 | % | | | 0.14 | % | | | 0.19 | % | | | 0.19 | % |
Net investment income | | | 0.13 | % | | | 0.01 | % | | | 0.01 | % | | | 0.01 | % | | | 0.04 | % | | | 0.06 | % |
Supplemental data | | | | | | | | | | | | | | | | | | | | | | | | |
Net assets, end of period (000s omitted) | | | $103 | | | | $19,683 | | | | $27,644 | | | | $19,814 | | | | $19,709 | | | | $17,896 | |
| 1 | Effective April 1, 2016, Institutional Class was renamed Premier Class. |
| 2 | Amount is less than $0.005. |
| 3 | Calculated based upon average shares outstanding |
| 4 | Returns for periods of less than one year are not annualized. |
The accompanying notes are an integral part of these financial statements.
| | | | | | |
| Financial highlights | | Wells Fargo Municipal Money Market Fund | | | 19 | |
(For a share outstanding throughout each period)
| | | | | | | | | | | | | | | | | | | | | | | | |
| | | Six months ended
July 31, 2016 (unaudited) | | | Year ended January 31 | |
| SERVICE CLASS | | | 2016 | | | 2015 | | | 2014 | | | 2013 | | | 2012 | |
Net asset value, beginning of period | | | $1.00 | | | | $1.00 | | | | $1.00 | | | | $1.00 | | | | $1.00 | | | | $1.00 | |
Net investment income | | | 0.00 | 1 | | | 0.00 | 1 | | | 0.00 | 1 | | | 0.00 | 1 | | | 0.00 | 1 | | | 0.00 | 1 |
Net realized gains on investments | | | 0.00 | 1 | | | 0.00 | 1 | | | 0.00 | 1 | | | 0.00 | 1 | | | 0.00 | 1 | | | 0.00 | 1 |
| | | | | | | | | | | | | | | | | | | | | | | | |
Total from investment operations | | | 0.00 | 1 | | | 0.00 | 1 | | | 0.00 | 1 | | | 0.00 | 1 | | | 0.00 | 1 | | | 0.00 | 1 |
Distributions to shareholders from | | | | | | | | | | | | | | | | | | | | | | | | |
Net investment income | | | (0.00 | )1 | | | (0.00 | )1 | | | (0.00 | )1 | | | (0.00 | )1 | | | (0.00 | )1 | | | (0.00 | )1 |
Net realized gains | | | 0.00 | | | | (0.00 | )1 | | | (0.00 | )1 | | | (0.00 | )1 | | | (0.00 | )1 | | | (0.00 | )1 |
| | | | | | | | | | | | | | | | | | | | | | | | |
Total distributions to shareholders | | | (0.00 | )1 | | | (0.00 | )1 | | | (0.00 | )1 | | | (0.00 | )1 | | | (0.00 | )1 | | | (0.00 | )1 |
Net asset value, end of period | | | $1.00 | | | | $1.00 | | | | $1.00 | | | | $1.00 | | | | $1.00 | | | | $1.00 | |
Total return2 | | | 0.01 | % | | | 0.02 | % | | | 0.03 | % | | | 0.04 | % | | | 0.03 | % | | | 0.02 | % |
Ratios to average net assets (annualized) | | | | | | | | | | | | | | | | | | | | | | | | |
Gross expenses | | | 0.79 | % | | | 0.77 | % | | | 0.74 | % | | | 0.73 | % | | | 0.73 | % | | | 0.72 | % |
Net expenses | | | 0.34 | % | | | 0.11 | % | | | 0.12 | % | | | 0.15 | % | | | 0.22 | % | | | 0.21 | % |
Net investment income | | | 0.02 | % | | | 0.01 | % | | | 0.01 | % | | | 0.01 | % | | | 0.01 | % | | | 0.01 | % |
Supplemental data | | | | | | | | | | | | | | | | | | | | | | | | |
Net assets, end of period (000s omitted) | | | $85,212 | | | | $152,842 | | | | $140,189 | | | | $149,950 | | | | $148,896 | | | | $119,313 | |
| 1 | Amount is less than $0.005. |
| 2 | Returns for periods of less than one year are not annualized. |
The accompanying notes are an integral part of these financial statements.
| | | | |
| 20 | | Wells Fargo Municipal Money Market Fund | | Financial highlights |
(For a share outstanding throughout each period)
| | | | | | | | | | | | | | | | | | | | | | | | |
| | | Six months ended
July 31, 2016 (unaudited) | | | Year ended January 31 | |
| SWEEP CLASS | | | 2016 | | | 2015 | | | 2014 | | | 2013 | | | 2012 | |
Net asset value, beginning of period | | | $1.00 | | | | $1.00 | | | | $1.00 | | | | $1.00 | | | | $1.00 | | | | $1.00 | |
Net investment income | | | 0.00 | 1,2 | | | 0.00 | 1,2 | | | 0.00 | 1,2 | | | 0.00 | 1 | | | 0.00 | 1 | | | 0.00 | 1 |
Net realized gains on investments | | | 0.00 | 1 | | | 0.00 | 1 | | | 0.00 | 1 | | | 0.00 | 1 | | | 0.00 | 1 | | | 0.00 | 1 |
| | | | | | | | | | | | | | | | | | | | | | | | |
Total from investment operations | | | 0.00 | 1 | | | 0.00 | 1 | | | 0.00 | 1 | | | 0.00 | 1 | | | 0.00 | 1 | | | 0.00 | 1 |
Distributions to shareholders from | | | | | | | | | | | | | | | | | | | | | | | | |
Net investment income | | | (0.00 | )1 | | | (0.00 | )1 | | | (0.00 | )1 | | | (0.00 | )1 | | | (0.00 | )1 | | | (0.00 | )1 |
Net realized gains | | | 0.00 | | | | (0.00 | )1 | | | (0.00 | )1 | | | (0.00 | )1 | | | (0.00 | )1 | | | (0.00 | )1 |
| | | | | | | | | | | | | | | | | | | | | | | | |
Total distributions to shareholders | | | (0.00 | )1 | | | (0.00 | )1 | | | (0.00 | )1 | | | (0.00 | )1 | | | (0.00 | )1 | | | (0.00 | )1 |
Net asset value, end of period | | | $1.00 | | | | $1.00 | | | | $1.00 | | | | $1.00 | | | | $1.00 | | | | $1.00 | |
Total return3 | | | 0.00 | % | | | 0.02 | % | | | 0.03 | % | | | 0.04 | % | | | 0.03 | % | | | 0.02 | % |
Ratios to average net assets (annualized) | | | | | | | | | | | | | | | | | | | | | | | | |
Gross expenses | | | 1.24 | % | | | 1.23 | % | | | 1.19 | % | | | 1.18 | % | | | 1.18 | % | | | 1.18 | % |
Net expenses | | | 0.36 | % | | | 0.11 | % | | | 0.12 | % | | | 0.15 | % | | | 0.23 | % | | | 0.23 | % |
Net investment income | | | 0.01 | % | | | 0.01 | % | | | 0.01 | % | | | 0.01 | % | | | 0.01 | % | | | 0.01 | % |
Supplemental data | | | | | | | | | | | | | | | | | | | | | | | | |
Net assets, end of period (000s omitted) | | | $834 | | | | $881 | | | | $10,267 | | | | $283,293 | | | | $444,380 | | | | $920,116 | |
| 1 | Amount is less than $0.005. |
| 2 | Calculated based upon average shares outstanding |
| 3 | Returns for periods of less than one year are not annualized. |
The accompanying notes are an integral part of these financial statements.
| | | | | | |
| Notes to financial statements (unaudited) | | Wells Fargo Municipal Money Market Fund | | | 21 | |
1. ORGANIZATION
Wells Fargo Funds Trust (the “Trust”), a Delaware statutory trust organized on March 10, 1999, is an open-end management investment company registered under the Investment Company Act of 1940, as amended (the “1940 Act”). As an investment company, the Trust follows the accounting and reporting guidance in Financial Accounting Standards Board (“FASB”) Accounting Standards Codification Topic 946, Financial Services – Investment Companies. These financial statements report on the Wells Fargo Municipal Money Market Fund (the “Fund”) which is a diversified series of the Trust.
2. SIGNIFICANT ACCOUNTING POLICIES
The following significant accounting policies, which are consistently followed in the preparation of the financial statements of the Fund, are in conformity with U.S. generally accepted accounting principles which require management to make estimates and assumptions that affect the reported amounts of assets and liabilities, disclosure of contingent assets and liabilities at the date of the financial statements, and the reported amounts of revenues and expenses during the reporting period. Actual results could differ from those estimates.
Securities valuation
As permitted under Rule 2a-7 of the 1940 Act, portfolio securities are valued at amortized cost, which approximates fair value. The amortized cost method involves valuing a security at its cost, plus accretion of discount or minus amortization of premium over the period until maturity.
Investments which are not valued using the method discussed above are valued at their fair value, as determined in good faith by the Board of Trustees of the Fund. The Board of Trustees has established a Valuation Committee comprised of the Trustees and has delegated to it the authority to take any actions regarding the valuation of portfolio securities that the Valuation Committee deems necessary or appropriate, including determining the fair value of portfolio securities, unless the determination has been delegated to the Management Valuation Team of Wells Fargo Funds Management, LLC (“Funds Management”). The Board of Trustees retains the authority to make or ratify any valuation decisions or approve any changes to the Valuation Procedures as it deems appropriate. On a quarterly basis, the Board of Trustees receives reports on any valuation actions taken by the Valuation Committee or the Management Valuation Team which may include items for ratification.
Valuations of fair valued securities are compared to the next actual sales price when available, or other appropriate market values, to assess the continued appropriateness of the fair valuation methodologies used. These securities are fair valued on a day-to-day basis, taking into consideration changes to appropriate market information and any significant changes to the inputs considered in the valuation process until there is a readily available price provided on an exchange or by an independent pricing service. Valuations received from an independent pricing service or independent broker-dealer quotes are periodically validated by comparisons to most recent trades and valuations provided by other independent pricing services in addition to the review of prices by the manager and/or subadviser. Unobservable inputs used in determining fair valuations are identified based on the type of security, taking into consideration factors utilized by market participants in valuing the investment, knowledge about the issuer and the current market environment.
Repurchase agreements
The Fund may invest in repurchase agreements and may participate in pooled repurchase agreement transactions with other funds advised by Funds Management. The repurchase agreements must be fully collateralized based on values that are marked-to-market daily. The collateral may be held by an agent bank under a tri-party agreement. It is the custodian’s responsibility to value collateral daily and to take action to obtain additional collateral as necessary to maintain market value equal to or greater than the resale price. The repurchase agreements are collateralized by instruments such as U.S. Treasury, federal agency, or high-grade corporate obligations. There could be potential loss to the Fund in the event that the Fund is delayed or prevented from exercising its rights to dispose of the collateral, including the risk of a possible decline in the value of the underlying obligations during the period in which the Fund seeks to assert its rights.
When-issued transactions
The Fund may purchase securities on a forward commitment or when-issued basis. The Fund records a when-issued transaction on the trade date and will segregate assets in an amount at least equal in value to the Fund’s commitment to purchase when-issued securities. Securities purchased on a when-issued basis are marked-to-market daily and the Fund begins earning interest on the settlement date. Losses may arise due to changes in the market value of the underlying securities or if the counterparty does not perform under the contract.
| | | | |
| 22 | | Wells Fargo Municipal Money Market Fund | | Notes to financial statements (unaudited) |
Security transactions and income recognition
Securities transactions are recorded on a trade date basis. Realized gains or losses are recorded on the basis of identified cost.
Interest income is accrued daily and bond discounts are accreted and premiums are amortized daily based on the effective interest method. To the extent debt obligations are placed on non-accrual status, any related interest income may be reduced by writing off interest receivables when the collection of all or a portion of interest has become doubtful based on consistently applied procedures. If the issuer subsequently resumes interest payments or when the collectability of interest is reasonably assured, the debt obligation is removed from non-accrual status.
Distributions to shareholders
Distributions to shareholders from net investment income are accrued daily and paid monthly. Distributions from net realized gains, if any, are recorded on the ex-dividend date. Such distributions are determined in conformity with federal income tax regulations, which may differ in amount or character from net investment income and realized gains recognized for purposes of U.S. generally accepted accounting principles.
Federal and other taxes
The Fund intends to continue to qualify as a regulated investment company by distributing substantially all of its investment company taxable and tax-exempt income and any net realized capital gains (after reduction for capital loss carryforwards) sufficient to relieve it from all, or substantially all, federal income taxes. Accordingly, no provision for federal income taxes was required.
The Fund’s income and federal excise tax returns and all financial records supporting those returns for the prior three fiscal years are subject to examination by the federal and Delaware revenue authorities. Management has analyzed the Fund’s tax positions taken on federal, state, and foreign tax returns for all open tax years and does not believe that there are any uncertain tax positions that require recognition of a tax liability.
Class allocations
The separate classes of shares offered by the Fund differ principally in distribution, shareholder servicing, and administration fees. Class specific expenses are charged directly to that share class. Investment income, common expenses, and realized and unrealized gains (losses) on investments are allocated daily to each class of shares based on the relative proportion of net assets of each class.
3. FAIR VALUATION MEASUREMENTS
Fair value measurements of investments are determined within a framework that has established a fair value hierarchy based upon the various data inputs utilized in determining the value of the Fund’s investments. The three-level hierarchy gives the highest priority to unadjusted quoted prices in active markets for identical assets or liabilities (Level 1) and the lowest priority to significant unobservable inputs (Level 3). The Fund’s investments are classified within the fair value hierarchy based on the lowest level of input that is significant to the fair value measurement. The inputs are summarized into three broad levels as follows:
| n | | Level 1 – quoted prices in active markets for identical securities |
| n | | Level 2 – other significant observable inputs (including quoted prices for similar securities, interest rates, prepayment speeds, credit risk, use of amortized cost, etc.) |
| n | | Level 3 – significant unobservable inputs (including the Fund’s own assumptions in determining the fair value of investments) |
The inputs or methodologies used for valuing investments in securities are not necessarily an indication of the risk associated with investing in those securities.
At July 31, 2016, all of the Fund’s investments in securities were valued using Level 2 inputs since the primary inputs include the credit quality of the issuer and short-term interest rates (both of which are observable) in addition to the use of amortized cost.
The Fund recognizes transfers between levels within the fair value hierarchy at the end of the reporting period. At July 31, 2016, the Fund did not have any transfers into/out of Level 1, Level 2, or Level 3.
| | | | | | |
| Notes to financial statements (unaudited) | | Wells Fargo Municipal Money Market Fund | | | 23 | |
4. TRANSACTIONS WITH AFFILIATES
Management fee
Funds Management, an indirect wholly owned subsidiary of Wells Fargo & Company (“Wells Fargo”), is the manager of the Fund and provides advisory and fund-level administrative services under an investment management agreement. Under the investment management agreement, Funds Management is responsible for, among other services, implementing the investment objectives and strategies of the Fund, supervising the subadviser, providing fund-level administrative services in connection with the Fund’s operations, and providing any other fund-level administrative services reasonably necessary for the operation of the Fund. As compensation for its services under the investment management agreement, Funds Management is entitled to receive an annual management fee starting at 0.35% and declining to 0.23% as the average daily net assets of the Fund increase. For the six months ended July 31, 2016, the management fee was equivalent to an annual rate of 0.35% of the Fund’s average daily net assets.
Funds Management has retained the services of a subadviser to provide daily portfolio management to the Fund. The fee for subadvisory services is borne by Funds Management. Wells Capital Management Incorporated, an affiliate of Funds Management and an indirect wholly owned subsidiary of Wells Fargo, is the subadviser to the Fund and is entitled to receive a fee from Funds Management at an annual rate starting at 0.05% and declining to 0.01% as the average daily net assets of the Fund increase.
Administration fees
Under a class-level administration agreement, Funds Management provides class-level administrative services to the Fund, which includes paying fees and expenses for services provided by the transfer agent, sub-transfer agents, omnibus account servicers and record-keepers. As compensation for its services under the class-level administration agreement, Funds Management receives an annual fee which is calculated based on the average daily net assets of each class as follows:
| | | | |
| | | Class-level
administration fee | |
Class A, Sweep Class | | | 0.22 | % |
Premier Class1 | | | 0.08 | |
Service Class | | | 0.12 | |
| | 1 | Effective April 1, 2016, Institutional Class was renamed Premier Class. | |
Funds Management has contractually waived and/or reimbursed management and administration fees to the extent necessary to maintain certain net operating expense ratios for the Fund. Waiver of fees and/or reimbursement of expenses by Funds Management were made first from fund level expenses on a proportionate basis and then from class specific expenses. Funds Management has committed through May 31, 2017 to waive fees and/or reimburse expenses to the extent necessary to cap the Fund’s expenses at 0.64% for Class A shares, 0.20% for Premier Class shares, 0.45% for Service Class shares, and 1.00% for Sweep Class shares. After this time, the cap may be increased or the commitment to maintain the cap may be terminated only with the approval of the Board of Trustees. During the six months ended July 31, 2016, Funds Management voluntarily waived additional expenses to maintain a positive yield.
Distribution fee
The Trust has adopted a distribution plan for Sweep Class shares of the Fund pursuant to Rule 12b-1 under the 1940 Act. A distribution fees is charged to Sweep Class shares and paid to Wells Fargo Funds Distributor, LLC, the principal underwriter, at an annual rate of 0.35% of the average daily net assets of Sweep Class shares.
Shareholder servicing fees
The Trust has entered into contracts with one or more shareholder servicing agents, whereby Class A, Service Class, and Sweep Class of the Fund are charged a fee at an annual rate of 0.25% of the respective average daily net assets of each class.
A portion of these total shareholder servicing fees were paid to affiliates of Wells Fargo.
5. INDEMNIFICATION
Under the Trust’s organizational documents, the officers and Trustees have been granted certain indemnification rights against certain liabilities that may arise out of performance of their duties to the Trust. Additionally, in the normal course of business, the Trust may enter into contracts with service providers that contain a variety of indemnification clauses. The Trust’s maximum exposure under these arrangements is dependent on future claims that may be made against the Fund and, therefore, cannot be estimated.
| | | | |
| 24 | | Wells Fargo Municipal Money Market Fund | | Notes to financial statements (unaudited) |
6. MONEY MARKET FUND REFORM
On July 23, 2014, the Securities and Exchange Commission voted to amend Rule 2a-7 of the 1940 Act which governs the operations of registered money market funds. The amendments to Rule 2a-7 when implemented may, among other things, require the Fund to change the manner in which it values its securities, impose new liquidity fees on redemptions in certain circumstances, and permit the Fund to limit redemptions in certain circumstances. The amendments have staggered compliance dates. Compliance with a majority of these amendments will be required on October 14, 2016. Effective September 1, 2016, the Fund will be offered as a retail money market fund and continue to transact at a stable $1.00 net asset value (NAV).
7. REORGANIZATION
At a regular meeting of the Board of Trustees held on August 9-10, 2016, the Trustees of the Fund approved a Plan of Reorganization (the “Plan”). Under the Plan, Wells Fargo National Tax-Free Money Market Fund will acquire the assets and assume the liabilities of the Fund in exchange for shares of Wells Fargo National Tax-Free Money Market Fund.
A Special Meeting of Shareholders of the Fund will be held on December 8, 2016 to consider and vote on the Plan. In October 2016, materials for this meeting will be mailed to shareholders of record on September 30, 2016. The merger is scheduled to take place on or about January 20, 2017.
| | | | | | |
| Other information (unaudited) | | Wells Fargo Municipal Money Market Fund | | | 25 | |
PROXY VOTING INFORMATION
A description of the policies and procedures that the Fund uses to determine how to vote proxies relating to portfolio securities is available, upon request, by calling 1-800-222-8222, visiting our website at wellsfargofunds.com, or visiting the SEC website at sec.gov. Information regarding how the Fund voted proxies relating to portfolio securities during the most recent 12-month period ended June 30 is available on the Fund’s website at wellsfargofunds.com or by visiting the SEC website at sec.gov.
PORTFOLIO HOLDINGS INFORMATION
The complete portfolio holdings for the Fund are publicly available on the Fund’s website (wellsfargofunds.com) on a 1-day delayed basis. The Fund files its complete schedule of portfolio holdings with the SEC for the first and third quarters of each fiscal year on Form N-Q, which is available by visiting the SEC website at sec.gov. In addition, the Fund’s Form N-Q may be reviewed and copied at the SEC’s Public Reference Room in Washington, DC, and at regional offices in New York City, at 233 Broadway, and in Chicago, at 175 West Jackson Boulevard, Suite 900. Information about the Public Reference Room may be obtained by calling 1-800-SEC-0330.
| | | | |
| 26 | | Wells Fargo Municipal Money Market Fund | | Other information (unaudited) |
BOARD OF TRUSTEES AND OFFICERS
Each of the Trustees and Officers1 listed in the table below acts in identical capacities for each fund in the Wells Fargo family of funds, which consists of 139 mutual funds comprising the Wells Fargo Funds Trust, Wells Fargo Variable Trust, Wells Fargo Master Trust and four closed-end funds (collectively the “Fund Complex”). This table should be read in conjunction with the Prospectus and the Statement of Additional Information2. The mailing address of each Trustee and Officer is 525 Market Street, 12th Floor, San Francisco, CA 94105. Each Trustee and Officer serves an indefinite term, however, each Trustee serves such term until reaching the mandatory retirement age established by the Trustees.
Independent Trustees
| | | | | | |
Name and year of birth | | Position held and length of service* | | Principal occupations during past five years or longer | | Current other public
company or
investment company
directorships |
William R. Ebsworth (Born 1957) | | Trustee, since 2015 | | Retired. From 1984 to 2013, equities analyst, portfolio manager, research director and chief financial officer at Fidelity Management and Research Company in Boston, Tokyo, and Hong Kong and retired in 2013 as Chief Investment Officer of Fidelity Strategic Advisers, Inc. where he lead a team of investment professionals managing client assets. Prior thereto, Board member of Hong Kong Securities Clearing Co., Hong Kong Options Clearing Corp., the Thailand International Fund, Ltd., Fidelity Investments Life Insurance Company, and Empire Fidelity Investments Life Insurance Company. Mr. Ebsworth is a CFA® charterholder and an Adjunct Lecturer, Finance, at Babson College. | | Asset Allocation Trust |
Jane A. Freeman (Born 1953) | | Trustee, since 2015 | | Retired. From 2012 to 2014 and 1999 to 2008, Chief Financial Officer of Scientific Learning Corporation. From 2008 to 2012, Ms. Freeman provided consulting services related to strategic business projects. Prior to 1999, Portfolio Manager at Rockefeller & Co. and Scudder, Stevens & Clark. Board member of the Harding Loevner Funds from 1996 to 2014, serving as both Lead Independent Director and chair of the Audit Committee. Board member of the Russell Exchange Traded Funds Trust from 2011 to 2012 and the chair of the Audit Committee. Ms. Freeman is Chair of Taproot Foundation (non-profit organization), a Board Member of Ruth Bancroft Garden (non-profit organization) and an inactive chartered financial analyst. | | Asset Allocation Trust |
Peter G. Gordon (Born 1942) | | Trustee, since 1998; Chairman, since 2005 | | Co-Founder, Retired Chairman, President and CEO of Crystal Geyser Water Company. Trustee Emeritus, Colby College. | | Asset Allocation Trust |
Isaiah Harris, Jr. (Born 1952) | | Trustee, since 2009 | | Retired. Chairman of the Board of CIGNA Corporation since 2009, and Director since 2005. From 2003 to 2011, Director of Deluxe Corporation. Prior thereto, President and CEO of BellSouth Advertising and Publishing Corp. from 2005 to 2007, President and CEO of BellSouth Enterprises from 2004 to 2005 and President of BellSouth Consumer Services from 2000 to 2003. Emeritus member of the Iowa State University Foundation Board of Governors. Emeritus Member of the Advisory Board of Iowa State University School of Business. Advisory Board Member, Palm Harbor Academy (charter school). Advisory Board Member, Child Evangelism Fellowship (non-profit). Mr. Harris is a certified public accountant (inactive status). | | CIGNA Corporation; Asset Allocation Trust |
Judith M. Johnson (Born 1949) | | Trustee, since 2008; Audit Committee Chairman, since 2008 | | Retired. Prior thereto, Chief Executive Officer and Chief Investment Officer of Minneapolis Employees Retirement Fund from 1996 to 2008. Ms. Johnson is an attorney, certified public accountant and a certified managerial accountant. | | Asset Allocation Trust |
David F. Larcker (Born 1950) | | Trustee, since 2009 | | James Irvin Miller Professor of Accounting at the Graduate School of Business, Stanford University, Director of the Corporate Governance Research Initiative and Senior Faculty of The Rock Center for Corporate Governance since 2006. From 2005 to 2008, Professor of Accounting at the Graduate School of Business, Stanford University. Prior thereto, Ernst & Young Professor of Accounting at The Wharton School, University of Pennsylvania from 1985 to 2005. | | Asset Allocation Trust |
| | | | | | |
| Other information (unaudited) | | Wells Fargo Municipal Money Market Fund | | | 27 | |
| | | | | | |
Name and year of birth | | Position held and length of service* | | Principal occupations during past five years or longer | | Current other public
company or
investment company
directorships |
Olivia S. Mitchell (Born 1953) | | Trustee, since 2006 | | International Foundation of Employee Benefit Plans Professor, Wharton School of the University of Pennsylvania since 1993. Director of Wharton’s Pension Research Council and Boettner Center on Pensions & Retirement Research, and Research Associate at the National Bureau of Economic Research. Previously, Cornell University Professor from 1978 to 1993. | | Asset Allocation Trust |
Timothy J. Penny (Born 1951) | | Trustee, since 1996 | | President and Chief Executive Officer of Southern Minnesota Initiative Foundation, a non-profit organization, since 2007 and Senior Fellow at the Humphrey Institute Policy Forum at the University of Minnesota since 1995. Member of the Board of Trustees of NorthStar Education Finance, Inc., a non-profit organization, since 2007. | | Asset Allocation Trust |
Michael S. Scofield (Born 1943) | | Trustee, since 2010 | | Served on the Investment Company Institute’s Board of Governors and Executive Committee from 2008-2011 as well the Governing Council of the Independent Directors Council from 2006-2011 and the Independent Directors Council Executive Committee from 2008-2011. Chairman of the IDC from 2008-2010. Institutional Investor (Fund Directions) Trustee of Year in 2007. Trustee of the Evergreen Funds complex (and its predecessors) from 1984 to 2010. Chairman of the Evergreen Funds from 2000-2010. Former Trustee of the Mentor Funds. Retired Attorney, Law Offices of Michael S. Scofield. | | Asset Allocation Trust |
| * | Length of service dates reflect the Trustee’s commencement of service with the Trust’s predecessor entities, where applicable. |
Officers
| | | | | | |
Name and year of birth | | Position held and length of service | | Principal occupations during past five years or longer | | |
Karla M. Rabusch (Born 1959) | | President, since 2003 | | Executive Vice President of Wells Fargo Bank, N.A. and President of Wells Fargo Funds Management, LLC since 2003. | | |
Nancy Wiser1 (Born 1967) | | Treasurer, since 2012 | | Executive Vice President of Wells Fargo Funds Management, LLC since 2011. Chief Operating Officer and Chief Compliance Officer at LightBox Capital Management LLC, from 2008 to 2011. | | |
C. David Messman (Born 1960) | | Secretary, since 2000; Chief Legal Officer, since 2003 | | Senior Vice President and Secretary of Wells Fargo Funds Management, LLC since 2001. Assistant General Counsel of Wells Fargo Bank, N.A. since 2013 and Vice President and Managing Counsel of Wells Fargo Bank, N.A. from 1996 to 2013. | | |
Michael Whitaker (Born 1967) | | Chief Compliance Officer, since 2016* | | Executive Vice President of Wells Fargo Funds Management, LLC since 2016. Chief Compliance Officer of Fidelity’s Fixed Income Funds and Asset Allocation Funds from 2008 to 2016, Compliance Officer of FMR Co., Inc. from 2014 to 2016, Fidelity Investments Money Management, Inc. from 2014 to 2016, Fidelity Investments from 2007 to 2016. | | |
David Berardi (Born 1975) | | Assistant Treasurer, since 2009 | | Vice President of Wells Fargo Funds Management, LLC since 2009. Vice President of Evergreen Investment Management Company, LLC from 2008 to 2010. Manager of Fund Reporting and Control for Evergreen Investment Management Company, LLC from 2004 to 2010. | | |
Jeremy DePalma1 (Born 1974) | | Assistant Treasurer, since 2009 | | Senior Vice President of Wells Fargo Funds Management, LLC since 2009. Senior Vice President of Evergreen Investment Management Company, LLC from 2008 to 2010 and head of the Fund Reporting and Control Team within Fund Administration from 2005 to 2010. | | |
| 1 | Nancy Wiser acts as Treasurer of 71 funds in the Fund Complex. Jeremy DePalma acts as Treasurer of 68 funds and Assistant Treasurer of 71 funds in the Fund Complex. |
| 2 | The Statement of Additional Information includes additional information about the Trustees and is available, without charge, upon request, by calling 1-800-222-8222 or by visiting the website at wellsfargofunds.com. |
| * | Michael Whitaker became Chief Compliance Officer effective May 16, 2016. |
| | | | |
| 28 | | Wells Fargo Municipal Money Market Fund | | Other information (unaudited) |
BOARD CONSIDERATION OF INVESTMENT MANAGEMENT AND SUB-ADVISORY AGREEMENTS:
Under the Investment Company Act of 1940 (the “1940 Act”), the Board of Trustees (the “Board”) of Wells Fargo Funds Trust (the “Trust”) must determine annually whether to approve the continuation of the Trust’s investment management and sub-advisory agreements. In this regard, at an in-person meeting held on May 24-25, 2016 (the “Meeting”), the Board, all the members of which have no direct or indirect interest in the investment management and sub-advisory agreements and are not “interested persons” of the Trust, as defined in the 1940 Act (the “Independent Trustees”), reviewed and approved for Wells Fargo Municipal Money Market Fund (the “Fund”): (i) an investment management agreement (the “Management Agreement”) with Wells Fargo Funds Management, LLC (“Funds Management”); and (ii) an investment sub-advisory agreement (the “Sub-Advisory Agreement”) with Wells Capital Management Incorporated (the “Sub-Adviser”), an affiliate of Funds Management. The Management Agreement and the Sub-Advisory Agreement are collectively referred to as the “Advisory Agreements.”
At the Meeting, the Board considered the factors and reached the conclusions described below relating to the selection of Funds Management and the Sub-Adviser and the approval of the Advisory Agreements. Prior to the Meeting, including at an in-person meeting in April 2016, the Trustees conferred extensively among themselves and with representatives of Funds Management about these matters. Also, the Board has adopted a team-based approach, with each team consisting of a sub-set of Trustees, to assist the full Board in the discharge of its duties in reviewing performance and other matters throughout the year. The Independent Trustees were assisted in their evaluation of the Advisory Agreements by independent legal counsel, from whom they received separate legal advice and with whom they met separately.
In providing information to the Board, Funds Management and the Sub-Adviser were guided by a detailed set of requests for information submitted to them by independent legal counsel on behalf of the Independent Trustees at the start of the Board’s annual contract renewal process earlier in 2016. In considering and approving the Advisory Agreements, the Trustees considered the information they believed relevant, including but not limited to the information discussed below. The Board considered not only the specific information presented in connection with the Meeting, but also the knowledge gained over time through interaction with Funds Management and the Sub-Adviser about various topics. In this regard, the Board reviewed reports of Funds Management at each of its quarterly meetings, which included, among other things, portfolio reviews and performance reports. In addition, the Board and the teams mentioned above confer with portfolio managers at various times throughout the year. The Board did not identify any particular information or consideration that was all-important or controlling, and each individual Trustee may have attributed different weights to various factors.
After its deliberations, the Board unanimously approved the continuation of the Advisory Agreements for a one-year term and determined that the compensation payable to Funds Management and the Sub-Adviser under each of the Advisory Agreements was reasonable. The Board considered the approval of the Advisory Agreements for the Fund as part of its consideration of agreements for funds across the complex, but its approvals were made on a fund-by-fund basis. The following summarizes a number of important, but not necessarily all, factors considered by the Board in support of its approvals.
Nature, extent and quality of services
The Board received and considered various information regarding the nature, extent and quality of services provided to the Fund by Funds Management and the Sub-Adviser under the Advisory Agreements. This information included a description of the investment advisory services and Fund-level administrative services covered by the Management Agreement, as well as, among other things, a summary of the background and experience of senior management of Funds Management, and the qualifications, background, tenure and responsibilities of each of the portfolio managers primarily responsible for the day-to-day portfolio management of the Fund.
The Board evaluated the ability of Funds Management and the Sub-Adviser to attract and retain qualified investment professionals, including research, advisory and supervisory personnel. The Board further considered the compliance programs and compliance records of Funds Management and the Sub-Adviser. In addition, the Board took into account the full range of services provided to the Fund by Funds Management and its affiliates.
Fund performance and expenses
The Board considered the performance results for the Fund over various time periods ended December 31, 2015. The Board considered these results in comparison to the performance of funds in a universe that was determined by Broadridge Inc. (“Broadridge”) to be similar to the Fund (the “Universe”) and in comparison to other comparative data. Broadridge is an independent provider of investment company data. The Board received a description of the methodology used by Broadridge to select the mutual funds in the performance Universe. The Board noted that the
| | | | | | |
| Other information (unaudited) | | Wells Fargo Municipal Money Market Fund | | | 29 | |
performance of the Fund (Class A) was higher than or in range of the average performance of the Universe for all periods under review. The Board also noted that the Fund experienced a portfolio management change in 2014.
The Board also received and considered information regarding the Fund’s net operating expense ratios and their various components, including actual management fees, custodian and other non-management fees, and Rule 12b-1 and non-Rule 12b-1 shareholder service fees. The Board considered these ratios in comparison to the median ratios of funds in class-specific expense groups that were determined by Broadridge to be similar to the Fund (the “Groups”). The Board received a description of the methodology used by Broadridge to select the mutual funds in the expense Groups and an explanation of how funds comprising expense groups and their expense ratios may vary from year-to-year. Based on the Broadridge reports, the Board noted that the net operating expense ratios of the Fund were equal to or in range of the median net operating expense ratios of the expense Groups.
The Board took into account the Fund performance and expense information provided to it among the factors considered in deciding to re-approve the Advisory Agreements.
Investment management and sub-advisory fee rates
The Board reviewed and considered the contractual fee rates payable by the Fund to Funds Management under the Management Agreement, as well as the contractual fee rates payable by the Fund to Funds Management for class-level administrative services under a Class-Level Administration Agreement, which include class-level transfer agency and sub-transfer agency costs (collectively, the “Management Rates”). The Board also reviewed and considered the contractual investment sub-advisory fee rates that are payable by Funds Management to the Sub-Adviser for investment sub-advisory services.
Among other information reviewed by the Board was a comparison of the Fund’s Management Rates with the average contractual investment management fee rates of funds in the expense Groups at a common asset level as well as transfer agency costs of the funds in the expense Groups. The Board noted that the Management Rates of the Fund were higher than the sum of these average rates for the Fund’s expense Groups for all share classes except service class. The Board noted that the net operating expense ratios of the Fund were equal to or in range of the median net operating expense ratios of the expense Groups for all share classes.
The Board also received and considered information about the portion of the total management fee that was retained by Funds Management after payment of the fee to the Sub-Adviser for sub-advisory services. In assessing the reasonableness of this amount, the Board received and evaluated information about the nature and extent of responsibilities retained and risks assumed by Funds Management and not delegated to or assumed by the Sub-Adviser, and about Funds Management’s on-going oversight services. However, given the affiliation between Funds Management and the Sub-Adviser, the Board ascribed limited relevance to the allocation of fees between them.
The Board also received and considered information about the nature and extent of services offered and fee rates charged by Funds Management and the Sub-Adviser to other types of clients with investment strategies similar to those of the Fund. In this regard, the Board received information about the significantly greater scope of services, and compliance, reporting and other legal burdens and risks of managing mutual funds compared with those associated with managing assets of non-mutual fund clients such as collective funds or institutional separate accounts.
Based on its consideration of the factors and information it deemed relevant, including those described here, the Board determined that the compensation payable to Funds Management under the Management Agreement and to the Sub-Adviser under the Sub-Advisory Agreement was reasonable, in light of the services covered by the Advisory Agreements.
Profitability
The Board received and considered information concerning the profitability of Funds Management, as well as the profitability of Wells Fargo as a whole, from providing services to the Fund and the fund family as a whole. The Board also received and considered information concerning the profitability of the Sub-Adviser from providing services to the fund family as a whole, noting that the Sub-Adviser’s profitability information with respect to providing services to the Fund was subsumed in the Wells Fargo and Funds Management profitability analysis.
Funds Management reported on the methodologies and estimates used in calculating profitability. Among other things, the Board noted that the levels of profitability reported on a fund-by-fund basis varied widely, depending on factors such as the size and type of fund. Based on its review, the Board did not deem the profits reported by Funds Management or Wells Fargo from its services to the Fund to be at a level that would prevent it from approving the continuation of the Advisory Agreements.
| | | | |
| 30 | | Wells Fargo Municipal Money Market Fund | | Other information (unaudited) |
Economies of scale
With respect to possible economies of scale, the Board noted the existence of breakpoints in the Fund’s management fee structure, which operate generally to reduce the Fund’s expense ratios as the Fund grows in size. It considered that, for a small fund or a fund that shrinks in size, breakpoints conversely can result in higher fee levels. The Board also considered that fee waiver and expense reimbursement arrangements and competitive fee rates at the outset are means of sharing potential economies of scale with shareholders of the Fund and the fund family as a whole. The Board considered Funds Management’s view that any analyses of potential economies of scale in managing a particular fund are inherently limited in light of the joint and common costs and investments that Funds Management incurs across the fund family as a whole.
The Board concluded that the Fund’s fee and expense arrangements, including contractual breakpoints, constituted a reasonable approach to sharing potential economies of scale with the Fund and its shareholders.
Other benefits to Funds Management and the Sub-Adviser
The Board received and considered information regarding potential “fall-out” or ancillary benefits received by Funds Management and its affiliates, including the Sub-Adviser, as a result of their relationships with the Fund. Ancillary benefits could include, among others, benefits directly attributable to other relationships with the Fund and benefits potentially derived from an increase in Funds Management’s and the Sub-Adviser’s business as a result of their relationships with the Fund. The Board noted that various affiliates of Funds Management may receive distribution-related fees, shareholder servicing payments and sub-transfer agency fees in respect of shares sold or held through them and services provided.
The Board also reviewed information about soft dollar credits earned and utilized by the Sub-Adviser, fees earned by Funds Management and the Sub-Adviser from managing a private investment vehicle for the fund family’s securities lending collateral and commissions earned by an affiliated broker from portfolio transactions.
Based on its consideration of the factors and information it deemed relevant, including those described here, the Board did not find that any ancillary benefits received by Funds Management and its affiliates, including the Sub-Adviser, were unreasonable.
Conclusion
At the Meeting, after considering the above-described factors and based on its deliberations and its evaluation of the information described above, the Board unanimously approved the continuation of the Advisory Agreements for a one-year term and determined that the compensation payable to Funds Management and the Sub-Adviser under each of the Advisory Agreements was reasonable.
| | | | | | |
| List of abbreviations | | Wells Fargo Municipal Money Market Fund | | | 31 | |
The following is a list of common abbreviations for terms and entities that may have appeared in this report.
| ACA | — ACA Financial Guaranty Corporation |
| ADR | — American depositary receipt |
| ADS | — American depositary shares |
| AGC | — Assured Guaranty Corporation |
| AGM | — Assured Guaranty Municipal |
| Ambac | — Ambac Financial Group Incorporated |
| AMT | — Alternative minimum tax |
| BAN | — Bond anticipation notes |
| BHAC | — Berkshire Hathaway Assurance Corporation |
| CAB | — Capital appreciation bond |
| CCAB | — Convertible capital appreciation bond |
| CDA | — Community Development Authority |
| CDO | — Collateralized debt obligation |
| DRIVER | — Derivative inverse tax-exempt receipts |
| DW&P | — Department of Water & Power |
| DWR | — Department of Water Resources |
| ECFA | — Educational & Cultural Facilities Authority |
| EDA | — Economic Development Authority |
| EDFA | — Economic Development Finance Authority |
| ETF | — Exchange-traded fund |
| FDIC | — Federal Deposit Insurance Corporation |
| FFCB | — Federal Farm Credit Banks |
| FGIC | — Financial Guaranty Insurance Corporation |
| FHA | — Federal Housing Administration |
| FHLB | — Federal Home Loan Bank |
| FHLMC | — Federal Home Loan Mortgage Corporation |
| FICO | — The Financing Corporation |
| FNMA | — Federal National Mortgage Association |
| GDR | — Global depositary receipt |
| GNMA | — Government National Mortgage Association |
| HCFR | — Healthcare facilities revenue |
| HEFA | — Health & Educational Facilities Authority |
| HEFAR | — Higher education facilities authority revenue |
| HFA | — Housing Finance Authority |
| HFFA | — Health Facilities Financing Authority |
| HUD | — Department of Housing and Urban Development |
| IDA | — Industrial Development Authority |
| IDAG | — Industrial Development Agency |
| KRW | — Republic of Korea won |
| LIBOR | — London Interbank Offered Rate |
| LIFER | — Long Inverse Floating Exempt Receipts |
| LLC | — Limited liability company |
| LLLP | — Limited liability limited partnership |
| LLP | — Limited liability partnership |
| MBIA | — Municipal Bond Insurance Association |
| MFHR | — Multifamily housing revenue |
| MSTR | — Municipal securities trust receipts |
| MUD | — Municipal Utility District |
| National | — National Public Finance Guarantee Corporation |
| PCFA | — Pollution Control Financing Authority |
| PCL | — Public Company Limited |
| PCR | — Pollution control revenue |
| PFA | — Public Finance Authority |
| PFFA | — Public Facilities Financing Authority |
| PFOTER | — Puttable floating option tax-exempt receipts |
| plc | — Public limited company |
| PUTTER | — Puttable tax-exempt receipts |
| R&D | — Research & development |
| Radian | — Radian Asset Assurance |
| RAN | — Revenue anticipation notes |
| RDA | — Redevelopment Authority |
| RDFA | — Redevelopment Finance Authority |
| REIT | — Real estate investment trust |
| ROC | — Reset option certificates |
| SAVRS | — Select auction variable rate securities |
| SBA | — Small Business Authority |
| SDR | — Swedish depositary receipt |
| SFHR | — Single-family housing revenue |
| SFMR | — Single-family mortgage revenue |
| SPA | — Standby purchase agreement |
| SPDR | — Standard & Poor’s Depositary Receipts |
| SPEAR | — Short Puttable Exempt Adjustable Receipts |
| STRIPS | — Separate trading of registered interest and |
| TAN | — Tax anticipation notes |
| TIPS | — Treasury inflation-protected securities |
| TRAN | — Tax revenue anticipation notes |
| TTFA | — Transportation Trust Fund Authority |
| TVA | — Tennessee Valley Authority |
This page is intentionally left blank.

For more information
More information about Wells Fargo Funds is available free upon request. To obtain literature, please write, email, visit the Fund’s website, or call:
Wells Fargo Funds
P.O. Box 8266
Boston, MA 02266-8266
Email: fundservice@wellsfargo.com
Website: wellsfargofunds.com
Individual investors: 1-800-222-8222
Retail investment professionals: 1-888-877-9275
Institutional investment professionals: 1-866-765-0778
This report and the financial statements contained herein are submitted for the general information of the shareholders of the Fund. If this report is used for promotional purposes, distribution of the report must be accompanied or preceded by a current prospectus. Before investing, please consider the investment objectives, risks, charges, and expenses of the investment. For a current prospectus and, if available, a summary prospectus, containing this information, call 1-800-222-8222 or visit the Fund’s website at wellsfargofunds.com. Read the prospectus carefully before you invest or send money.
Wells Fargo Asset Management (WFAM) is a trade name used by the asset management businesses of Wells Fargo & Company. Wells Fargo Funds Management, LLC, a wholly owned subsidiary of Wells Fargo & Company, provides investment advisory and administrative services for Wells Fargo Funds. Other affiliates of Wells Fargo & Company provide subadvisory and other services for the funds. The funds are distributed by Wells Fargo Funds Distributor, LLC, Member FINRA, an affiliate of Wells Fargo & Company.
NOT FDIC INSURED ¡ NO BANK GUARANTEE ¡ MAY LOSE VALUE
© 2016 Wells Fargo Funds Management, LLC. All rights reserved.
| | |
 | | 245337 09-16 SA308/SAR308 07-16 |
Semi-Annual Report
July 31, 2016

Retail Money Market Funds

| n | | Wells Fargo National Tax-Free Money Market Fund |

Reduce clutter. Save trees.
Sign up for electronic delivery of prospectuses and shareholder reports at wellsfargo.com/advantagedelivery
Contents
| * | A complete schedule of portfolio holdings as of the report date may be obtained, free of charge, by accessing the following website: https://www.wellsfargofunds.com/assets/edocs/regulatory/holdings/national-tax-free-money-market-ann.pdf or by calling Wells Fargo Funds at 1-800-222-8222. This complete schedule, filed on Form N-CSRS, is also available on the SEC’s website at sec.gov. |
The views expressed and any forward-looking statements are as of July 31, 2016, unless otherwise noted, and are those of the Fund managers and/or Wells Fargo Funds Management, LLC. Discussions of individual securities, or the markets generally, or any Wells Fargo Fund are not intended as individual recommendations. Future events or results may vary significantly from those expressed in any forward-looking statements. The views expressed are subject to change at any time in response to changing circumstances in the market. Wells Fargo Funds Management, LLC and the Fund disclaim any obligation to publicly update or revise any views expressed or forward-looking statements.
NOT FDIC INSURED ¡ NO BANK GUARANTEE ¡ MAY LOSE VALUE
| | | | |
| 2 | | Wells Fargo National Tax-Free Money Market Fund | | Letter to shareholders (unaudited) |

Karla M. Rabusch
President
Wells Fargo Funds
We do not anticipate broad changes to the way we manage our money market funds at this time in order to meet the new rules because we have always emphasized stability of principal and liquidity.
Dear Valued Shareholder:
We are pleased to offer you this semi-annual report for the Wells Fargo National Tax-free Money Market Fund for the six-month period that ended July 31, 2016. The period was marked by preparation for the new amendments to Rule 2a-7 of the Investment Company Act of 1940 (Rule 2a-7) by the U.S. Securities and Exchange Commission. Meanwhile, the U.S. Federal Reserve (Fed) kept the federal funds target rate between 0.25% and 0.50%.
We are preparing to implement the new money market fund regulations.
The amendments to Rule 2a-7, which governs money market funds, are scheduled to be fully implemented by October 2016. To recap, U.S. Treasury and government money market funds will continue to operate much as they do today, with stable $1.00 net asset values (NAVs). Meanwhile, tax-exempt and prime funds will experience more changes. For starters, these types of funds must separate retail investors, such as individuals, and institutional investors. Second, money market fund boards of directors will have discretion to impose either a liquidity fee of up to 2% on shareholder redemptions or a temporary suspension of redemptions (gate) if a fund’s weekly liquid assets fall below 30% of its total assets and the board determines that the fee or gate is in the best interest of the fund’s shareholders.
| | n | | Retail investors will continue to transact at a stable $1.00 NAV but may be subject to liquidity fees and redemption gates. | |
| | n | | Institutional prime and tax-exempt money market funds will transact at a floating, market-based NAV and may be subject to liquidity fees and redemption gates under special circumstances. Once floating NAVs are implemented, daily share prices will fluctuate along with changes, if any, in the market-based value of the underlying portfolio securities. Our Product Alert titled Wells Fargo Announces Effective Dates for Changes to Certain Money Market Funds featured the intraday price times we will use to continue providing same-day settlement and liquidity to our shareholders. | |
| | n | | Additional requirements included increased disclosure and reporting of fund statistics, such as percentage of liquid assets, shareholder flows, and market-based NAVs. In addition, the new regulations also included tighter diversification requirements and enhanced stress-testing measures. | |
| | n | | We will continue to communicate any changes to our money markets funds with our shareholders. Specifically, Product Alerts can be found at our website: wellsfargofunds.com. Click on Product Information and find them under the Product Alerts tab. | |
While there will be many operational changes ahead, we do not anticipate broad changes to the way we manage our money market funds at this time in order to meet the new rules because we have always emphasized stability of principal and liquidity.
Short-term rates remained steady but low.
The Fed kept the federal funds rate steady. On the growth side of its mandate, U.S. economic activity appeared to maintain a modest pace. Global concerns continued to confront the Fed as it tried to assess future conditions in the U.S. While China’s growth and its markets stabilized post first-quarter downdrafts, it continued to “face considerable challenges,” per Fed Chair Janet Yellen in her
| | | | | | |
| Letter to shareholders (unaudited) | | Wells Fargo National Tax-Free Money Market Fund | | | 3 | |
monetary policy report to Congress. Further, although commodity prices rebounded from first-quarter lows, other worries remained. The strong dollar, which could hamper manufacturing and exports, is one factor. Another is potential fallout from Brexit, the referendum whereby the U.K. voted to leave the European Union. With growth and inflation low, Chair Yellen has argued in her monetary policy report that there is little room to cut rates further but plenty of scope to raise rates if inflation picks up too quickly.
With regard to Brexit, traditional risk assets—such as equities and foreign exchange—experienced volatility and U.S. Treasury securities benefited from a flight to quality. Money markets, however, were relatively immune to this volatility, with both credit spreads and liquidity little changed.
Don’t let short-term uncertainty derail long-term investment goals.
Periods of uncertainty can present challenges, but experience has taught us that maintaining long-term investment goals can be an effective way to plan for the future. To help you create a sound strategy based on your personal goals and risk tolerance, Wells Fargo Funds offers more than 100 mutual funds spanning a wide range of asset classes and investment styles. Although diversification cannot guarantee an investment profit or prevent losses, we believe it can be an effective way to manage investment risk and potentially smooth out overall portfolio performance. We encourage investors to know their investments and to understand that appropriate levels of risk-taking may unlock opportunities.
Thank you for choosing to invest in Wells Fargo Funds. We appreciate your confidence in us and remain committed to helping you meet your financial needs.
Sincerely,

Karla M. Rabusch
President
Wells Fargo Funds
Periods of uncertainty can present challenges, but experience has taught us that maintaining long-term investment goals can be an effective way to plan for the future.
For further information about your Fund, contact your investment professional, visit our website at wellsfargofunds.com, or call us directly at 1-800-222-8222. We are available 24 hours a day, 7 days a week.
| | | | |
| 4 | | Wells Fargo National Tax-Free Money Market Fund | | Performance highlights (unaudited) |
Investment objective
The Fund seeks current income exempt from federal income tax, while preserving capital and liquidity.
Manager
Wells Fargo Funds Management, LLC
Subadviser
Wells Capital Management Incorporated
Portfolio managers
James Randazzo
Jeffrey L. Weaver, CFA®
Average annual total returns (%) as of July 31, 20161
| | | | | | | | | | | | | | | | | | | | | | |
| | | | | | | | Expense ratios2 (%) | |
| | | | | 1 year | | | 5 year | | | 10 year | | | Gross | | | Net3 | |
| Class A (NWMXX) | | 7-28-2003 | | | 0.02 | | | | 0.02 | | | | 0.61 | | | | 0.63 | | | | 0.63 | |
| Administrator Class (WNTXX) | | 4-8-2005 | | | 0.06 | | | | 0.03 | | | | 0.72 | | | | 0.36 | | | | 0.30 | |
| Premier Class (WFNXX)* | | 11-8-1999 | | | 0.10 | | | | 0.04 | | | | 0.77 | | | | 0.24 | | | | 0.20 | |
| Service Class (MMIXX) | | 8-3-1993 | | | 0.02 | | | | 0.02 | | | | 0.66 | | | | 0.53 | | | | 0.45 | |
| Sweep Class** | | 6-30-2010 | | | 0.02 | | | | 0.02 | | | | 0.61 | | | | 0.98 | | | | 0.98 | |
Yield summary (%) as of July 31, 20163
| | | | | | | | | | | | | | | | | | |
| | | Class A | | Administrator
Class | | | Premier Class* | | | Service
Class | | | Sweep Class** | |
| 7-day current yield | | 0.01 | | | 0.16 | | | | 0.26 | | | | 0.01 | | | | 0.01 | |
| 7-day compound yield | | 0.01 | | | 0.16 | | | | 0.26 | | | | 0.01 | | | | 0.01 | |
| 30-day simple yield | | 0.01 | | | 0.14 | | | | 0.24 | | | | 0.01 | | | | 0.01 | |
| 30-day compound yield | | 0.01 | | | 0.14 | | | | 0.24 | | | | 0.01 | | | | 0.01 | |
| * | | Effective April 1, 2016, Institutional Class was renamed Premier Class. |
| ** | | Effective August 30, 2016, Sweep Class shares are no longer offered by the Fund. |
Figures quoted represent past performance, which is no guarantee of future results, and do not reflect taxes that a shareholder may pay on fund distributions or the redemption of fund shares. Investment returns will fluctuate. The Fund’s yield figures more closely reflect the current earnings of the Fund than the total return figures. Current performance may be lower or higher than the performance data quoted, which assumes the reinvestment of dividends and capital gains. Current month-end performance is available on the Fund’s website, wellsfargofunds.com.
Each class is sold without a front-end sales charge or a contingent deferred sales charge.
An investment in a money market fund is not insured or guaranteed by the Federal Deposit Insurance Corporation or any other government agency. Although the Fund seeks to preserve the value of your investment at $1.00 per share, it is possible to lose money by investing in a money market fund. A portion of the Fund’s income may be subject to federal, state, and/or local income taxes or the alternative minimum tax (AMT).
Please see footnotes on page 5.
| | | | | | |
| Performance highlights (unaudited) | | Wells Fargo National Tax-Free Money Market Fund | | | 5 | |
|
| Revenue source distribution as of July 31, 20164 |
|
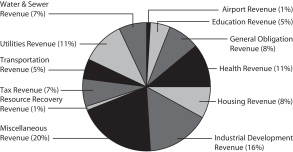 |
|
| Effective maturity distribution as of July 31, 20164 |
|
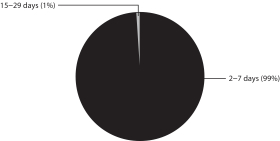 |
|
| Weighted average maturity as of July 31, 20165 |
6 days |
|
|
| Weighted average life as of July 31, 20166 |
6 days |
|
| 1 | Historical performance shown for Sweep Class shares prior to their inception reflects the performance of Class A shares, and has not been adjusted to include the higher expenses applicable to Sweep Class shares. If these expenses had been adjusted, returns would be lower. |
| 2 | Reflects the expense ratios as stated in the most recent prospectuses. The expense ratios shown are subject to change and may differ from the annualized expense ratios shown in the financial highlights of this report. |
| 3 | The manager has contractually committed through May 31, 2017, to waive fees and/or reimburse expenses to the extent necessary to cap the Fund’s Total Annual Fund Operating Expenses After Fee Waiver at 0.65% for Class A, 0.30% for Administrator Class, 0.20% for Premier Class, 0.45% for Service Class, and 1.00% for Sweep Class. After this time, the cap may be increased or the commitment to maintain the cap may be terminated only with the approval of the Board of Trustees. Brokerage commissions, stamp duty fees, interest, taxes, acquired fund fees and expenses, and extraordinary expenses are excluded from the cap. Without this cap, the Fund’s returns would have been lower. Without waived fees and/or reimbursed expenses, the Fund’s 7-day current yield would have been (0.18)%, 0.09%, 0.21%, (0.08)%, and (0.52)% for Class A, Administrator Class, Premier Class, Service Class, and Sweep Class, respectively. |
| 4 | Amounts are calculated based on the total investments of the Fund. These amounts are subject to change and may have changed since the date specified. |
| 5 | Weighted Average Maturity (WAM): WAM is an average of the effective maturities of all securities held in the portfolio, weighted by each security’s percentage of total investments. The maturity of a portfolio security is the period remaining until the date on which the principal amount is unconditionally required to be paid, or in the case of a security called for redemption, the date on which the redemption payment is unconditionally required to be made. WAM calculations allow for the maturities of certain securities with demand features or periodic interest rate resets to be shortened. WAM is a way to measure a fund’s sensitivity to potential interest rate changes. Rule 2a-7 under the Investment Company Act of 1940 requires money market funds to maintain a WAM of 60 calendar days or less. WAM is subject to change and may have changed since the date specified. |
| 6 | Weighted Average Life (WAL): WAL is an average of the final maturities of all securities held in the portfolio, weighted by their percentage of total investments. The maturity of a portfolio security is the period remaining until the date on which the principal amount is unconditionally required to be paid, or in the case of a security called for redemption, the date on which the redemption payment is unconditionally required to be made. In contrast to WAM, the calculation of WAL allows for the maturities of certain securities with demand features to be shortened, but not the periodic interest rate resets. WAL is a way to measure a fund’s potential sensitivity to credit spread changes. Rule 2a-7 under the Investment Company Act of 1940 requires money market funds to maintain a WAL of 120 calendar days or less. WAL is subject to change and may have changed since the date specified. |
| | | | |
| 6 | | Wells Fargo National Tax-Free Money Market Fund | | Fund expenses (unaudited) |
As a shareholder of the Fund, you incur ongoing costs, including management fees, distribution (12b-1) and/or shareholder servicing fees, and other Fund expenses. This example is intended to help you understand your ongoing costs (in dollars) of investing in the Fund and to compare these costs with the ongoing costs of investing in other mutual funds.
The example is based on an investment of $1,000 invested at the beginning of the six-month period and held for the entire period from February 1, 2016 to July 31, 2016.
Actual expenses
The “Actual” line of the table below provides information about actual account values and actual expenses. You may use the information in this line, together with the amount you invested, to estimate the expenses that you paid over the period. Simply divide your account value by $1,000 (for example, an $8,600 account value divided by $1,000 = 8.6), then multiply the result by the number in the “Actual” line under the heading entitled “Expenses paid during period” for your applicable class of shares to estimate the expenses you paid on your account during this period.
Hypothetical example for comparison purposes
The “Hypothetical” line of the table below provides information about hypothetical account values and hypothetical expenses based on the Fund’s actual expense ratio and an assumed rate of return of 5% per year before expenses, which is not the Fund’s actual return. The hypothetical account values and expenses may not be used to estimate the actual ending account balance or expenses you paid for the period. You may use this information to compare the ongoing costs of investing in the Fund and other funds. To do so, compare this 5% hypothetical example with the 5% hypothetical examples that appear in the shareholder reports of the other funds.
Please note that the expenses shown in the table are meant to highlight your ongoing costs only and do not reflect any transactional costs, such as sales charges (loads) and contingent deferred sales charges. Therefore, the “Hypothetical” line of the table is useful in comparing ongoing costs only and will not help you determine the relative total costs of owning different funds. In addition, if these transactional costs were included, your cost would have been higher.
| | | | | | | | | | | | | | | | |
| | | Beginning
account value
2-1-2016 | | | Ending
account value
7-31-2016 | | | Expenses
paid during
the period¹ | | | Annualized net
expense ratio | |
Class A | | | | | | | | | | | | | | | | |
Actual | | $ | 1,000.00 | | | $ | 1,000.05 | | | $ | 1.70 | | | | 0.34 | % |
Hypothetical (5% return before expenses) | | $ | 1,000.00 | | | $ | 1,023.24 | | | $ | 1.72 | | | | 0.34 | % |
Administrator Class | | | | | | | | | | | | | | | | |
Actual | | $ | 1,000.00 | | | $ | 1,000.51 | | | $ | 1.25 | | | | 0.25 | % |
Hypothetical (5% return before expenses) | | $ | 1,000.00 | | | $ | 1,023.68 | | | $ | 1.26 | | | | 0.25 | % |
Premier Class2 | | | | | | | | | | | | | | | | |
Actual | | $ | 1,000.00 | | | $ | 1,000.86 | | | $ | 0.85 | | | | 0.17 | % |
Hypothetical (5% return before expenses) | | $ | 1,000.00 | | | $ | 1,024.08 | | | $ | 0.86 | | | | 0.17 | % |
Service Class | | | | | | | | | | | | | | | | |
Actual | | $ | 1,000.00 | | | $ | 1,000.06 | | | $ | 1.50 | | | | 0.30 | % |
Hypothetical (5% return before expenses) | | $ | 1,000.00 | | | $ | 1,023.44 | | | $ | 1.51 | | | | 0.30 | % |
Sweep Class | | | | | | | | | | | | | | | | |
Actual | | $ | 1,000.00 | | | $ | 1,000.05 | | | $ | 1.70 | | | | 0.34 | % |
Hypothetical (5% return before expenses) | | $ | 1,000.00 | | | $ | 1,023.24 | | | $ | 1.72 | | | | 0.34 | % |
| 1 | Expenses paid is equal to the annualized net expense ratio of each class multiplied by the average account value over the period, multiplied by the number of days in the most recent fiscal half-year divided by the number of days in the fiscal year (to reflect the one-half-year period). |
| 2 | Effective April 1, 2016, Institutional Class was renamed Premier Class. |
| | | | | | |
| Summary portfolio of investments—July 31, 2016 (unaudited) | | Wells Fargo National Tax-Free Money Market Fund | | | 7 | |
The Summary portfolio of investments shows the 50 largest portfolio holdings in unaffiliated issuers and any holdings exceeding 1% of the total net assets as of the report date. The remaining securities held are grouped as “Other securities” in each category.
| | | | | | | | | | | | | | | | | | | | |
| Security name | | Interest rate | | | Maturity date | | | Principal | | | Value | | | Percent of net assets | |
| | | | | |
Municipal Obligations: 92.02% | | | | | | | | | | | | | | | | | | | | |
| | | | | |
Alabama: 1.39% | | | | | | | | | | | | | | | | | | | | |
| | | | | |
| Variable Rate Demand Notes ø: 1.39% | | | | | | | | | | | | | | | | | | | | |
Tuscaloosa County AL IDA Gulf Opportunity Zone Hunt Refining Project Series 2011A (Industrial Development Revenue, Sumitomo Mitsui Banking LOC) | | | 0.43 | % | | | 6-1-2028 | | | $ | 15,500,000 | | | $ | 15,500,000 | | | | 0.73 | % |
Other securities | | | | | | | | | | | | | | | 13,900,000 | | | | 0.66 | |
| | | | | |
| | | | | | | | | | | | | | | 29,400,000 | | | | 1.39 | |
| | | | | | | | | | | | | | | | | | | | |
| | | | | |
Arizona: 1.40% | | | | | | | | | | | | | | | | | | | | |
| | | | | |
| Variable Rate Demand Notes ø: 1.40% | | | | | | | | | | | | | | | | | | | | |
Mesa AZ Utility System Clipper Tax-Exempt Certificates Trust Series 2009-33 (Miscellaneous Revenue, State Street Bank & Trust Company LIQ) | | | 0.47 | | | | 7-1-2024 | | | | 19,455,000 | | | | 19,455,000 | | | | 0.92 | |
Other securities | | | | | | | | | | | | | | | 10,135,000 | | | | 0.48 | |
| | | | | |
| | | | | | | | | | | | | | | 29,590,000 | | | | 1.40 | |
| | | | | | | | | | | | | | | | | | | | |
| | | | | |
California: 4.17% | | | | | | | | | | | | | | | | | | | | |
| | | | | |
| Other Municipal Debt: 0.30% | | | | | | | | | | | | | | | | | | | | |
Other securities | | | | | | | | | | | | | | | 6,400,000 | | | | 0.30 | |
| | | | | | | | | | | | | | | | | | | | |
| | | | | |
| Variable Rate Demand Notes ø: 3.87% | | | | | | | | | | | | | | | | | | | | |
JPMorgan Chase PUTTER/DRIVER Trust Series 3841 (Transportation Revenue, Ambac Insured, JPMorgan Chase & Company LIQ) 144A | | | 0.47 | | | | 7-1-2024 | | | | 22,655,000 | | | | 22,655,000 | | | | 1.07 | |
San Francisco City & County CA RDA Fillmore Center 1999 Issue B1 (Housing Revenue, FHLMC LIQ) | | | 0.47 | | | | 12-1-2017 | | | | 20,000,000 | | | | 20,000,000 | | | | 0.94 | |
Other securities | | | | | | | | | | | | | | | 39,378,845 | | | | 1.86 | |
| | | | | |
| | | | | | | | | | | | | | | 82,033,845 | | | | 3.87 | |
| | | | | | | | | | | | | | | | | | | | |
| | | | | |
Colorado: 1.22% | | | | | | | | | | | | | | | | | | | | |
| | | | | |
| Variable Rate Demand Notes ø: 1.22% | | | | | | | | | | | | | | | | | | | | |
Other securities | | | | | | | | | | | | | | | 25,875,000 | | | | 1.22 | |
| | | | | | | | | | | | | | | | | | | | |
| | | | | |
District of Columbia: 0.17% | | | | | | | | | | | | | | | | | | | | |
| | | | | |
| Variable Rate Demand Notes ø: 0.17% | | | | | | | | | | | | | | | | | | | | |
Other securities | | | | | | | | | | | | | | | 3,600,000 | | | | 0.17 | |
| | | | | | | | | | | | | | | | | | | | |
| | | | | |
Florida: 4.90% | | | | | | | | | | | | | | | | | | | | |
| | | | | |
| Other Municipal Debt: 1.92% | | | | | | | | | | | | | | | | | | | | |
JEA Florida Electric System Series 2000-A & 2008 -C-3 (Utilities Revenue) | | | 0.43-0.44 | | | | 8-3-2016 to 8-15-2016 | | | | 16,765,000 | | | | 16,765,000 | | | | 0.79 | |
JEA Florida Electric System Series 2000-F-1 (Utilities Revenue) | | | 0.45 | | | | 8-4-2016 | | | | 24,000,000 | | | | 24,000,000 | | | | 1.13 | |
| | | | | |
| | | | | | | | | | | | | | | 40,765,000 | | | | 1.92 | |
| | | | | | | | | | | | | | | | | | | | |
The accompanying notes are an integral part of these financial statements.
| | | | |
| 8 | | Wells Fargo National Tax-Free Money Market Fund | | Summary portfolio of investments—July 31, 2016 (unaudited) |
| | | | | | | | | | | | | | | | | | | | |
| Security name | | Interest rate | | | Maturity date | | | Principal | | | Value | | | Percent of net assets | |
| | | | | |
| Variable Rate Demand Notes ø: 2.98% | | | | | | | | | | | | | | | | | | | | |
Miami Dade County FL Special Obligation Juvenile Courthouse Series B (Miscellaneous Revenue, TD Bank NA LOC, Ambac Insured) | | | 0.42 | % | | | 4-1-2043 | | | $ | 25,000,000 | | | $ | 25,000,000 | | | | 1.18 | % |
Palm Beach County FL Pine Crest Preparatory School Incorporated Project Series 2012B (Education Revenue, TD Bank NA LOC) | | | 0.43 | | | | 6-1-2038 | | | | 15,100,000 | | | | 15,100,000 | | | | 0.71 | |
Other securities | | | | | | | | | | | | | | | 23,135,000 | | | | 1.09 | |
| | | | | |
| | | | | | | | | | | | | | | 63,235,000 | | | | 2.98 | |
| | | | | | | | | | | | | | | | | | | | |
| | | | | |
Georgia: 1.85% | | | | | | | | | | | | | | | | | | | | |
| | | | | |
| Variable Rate Demand Notes ø: 1.85% | | | | | | | | | | | | | | | | | | | | |
Other securities | | | | | | | | | | | | | | | 39,295,000 | | | | 1.85 | |
| | | | | | | | | | | | | | | | | | | | |
| | | | | |
Illinois: 1.40% | | | | | | | | | | | | | | | | | | | | |
| | | | | |
| Variable Rate Demand Notes ø: 1.40% | | | | | | | | | | | | | | | | | | | | |
Other securities | | | | | | | | | | | | | | | 29,650,000 | | | | 1.40 | |
| | | | | | | | | | | | | | | | | | | | |
| | | | | |
Indiana: 1.43% | | | | | | | | | | | | | | | | | | | | |
| | | | | |
| Variable Rate Demand Notes ø: 1.43% | | | | | | | | | | | | | | | | | | | | |
Indiana Certificates of Participation Clipper Tax-Exempt Certified Trust Series 2009-34 (Miscellaneous Revenue, State Street Bank & Trust Company LIQ) | | | 0.48 | | | | 7-1-2023 | | | | 22,515,000 | | | | 22,515,000 | | | | 1.06 | |
Other securities | | | | | | | | | | | | | | | 7,900,000 | | | | 0.37 | |
| | | | | |
| | | | | | | | | | | | | | | 30,415,000 | | | | 1.43 | |
| | | | | | | | | | | | | | | | | | | | |
| | | | | |
Iowa: 4.38% | | | | | | | | | | | | | | | | | | | | |
| | | | | |
| Variable Rate Demand Notes ø: 4.38% | | | | | | | | | | | | | | | | | | | | |
Iowa Finance Authority Barclays Residual Interest Bonds Trust Series 1WE (Miscellaneous Revenue, Barclays Bank plc LOC) 144A | | | 0.59 | | | | 1-1-2019 | | | | 32,600,000 | | | | 32,600,000 | | | | 1.53 | |
Iowa Finance Authority Midwestern Cargill Incorporated Project Series 2012-A (Industrial Development Revenue) | | | 0.46 | | | | 6-1-2039 | | | | 58,100,000 | | | | 58,100,000 | | | | 2.74 | |
Other securities | | | | | | | | | | | | | | | 2,280,000 | | | | 0.11 | |
| | | | | |
| | | | | | | | | | | | | | | 92,980,000 | | | | 4.38 | |
| | | | | | | | | | | | | | | | | | | | |
| | | | | |
Kansas: 0.42% | | | | | | | | | | | | | | | | | | | | |
| | | | | |
| Variable Rate Demand Notes ø: 0.42% | | | | | | | | | | | | | | | | | | | | |
Other securities | | | | | | | | | | | | | | | 9,000,000 | | | | 0.42 | |
| | | | | | | | | | | | | | | | | | | | |
| | | | | |
Kentucky: 0.34% | | | | | | | | | | | | | | | | | | | | |
| | | | | |
| Variable Rate Demand Notes ø: 0.34% | | | | | | | | | | | | | | | | | | | | |
Other securities | | | | | | | | | | | | | | | 7,190,000 | | | | 0.34 | |
| | | | | | | | | | | | | | | | | | | | |
| | | | | |
Louisiana: 2.37% | | | | | | | | | | | | | | | | | | | | |
| | | | | |
| Variable Rate Demand Notes ø: 2.37% | | | | | | | | | | | | | | | | | | | | |
Louisiana PFFA Dynamic Fuels LLC Project Series 2008 (Industrial Development Revenue, Bank of America NA LOC) | | | 0.38 | | | | 10-1-2033 | | | | 29,300,000 | | | | 29,300,000 | | | | 1.38 | |
Other securities | | | | | | | | | | | | | | | 20,910,000 | | | | 0.99 | |
| | | | | |
| | | | | | | | | | | | | | | 50,210,000 | | | | 2.37 | |
| | | | | | | | | | | | | | | | | | | | |
The accompanying notes are an integral part of these financial statements.
| | | | | | |
| Summary portfolio of investments—July 31, 2016 (unaudited) | | Wells Fargo National Tax-Free Money Market Fund | | | 9 | |
| | | | | | | | | | | | | | | | | | | | |
| Security name | | Interest rate | | | Maturity date | | | Principal | | | Value | | | Percent of net assets | |
| | | | | |
Maryland: 3.08% | | | | | | | | | | | | | | | | | | | | |
| | | | | |
| Variable Rate Demand Notes ø: 3.08% | | | | | | | | | | | | | | | | | | | | |
Maryland Industrial Development Financing Authority Occidental Pete Corporation Series 2010 (Industrial Development Revenue) | | | 0.62 | % | | | 3-1-2030 | | | $ | 22,925,000 | | | $ | 22,925,000 | | | | 1.08 | % |
Montgomery County MD Housing Opportunity Commission Series 2011 A (Housing Revenue, TD Bank NA LOC, GNMA/FNMA/FHLMC Insured) | | | 0.43 | | | | 1-1-2049 | | | | 27,170,000 | | | | 27,170,000 | | | | 1.28 | |
Other securities | | | | | | | | | | | | | | | 15,200,000 | | | | 0.72 | |
| | | | | |
| | | | | | | | | | | | | | | 65,295,000 | | | | 3.08 | |
| | | | | | | | | | | | | | | | | | | | |
| | | | | |
Massachusetts: 1.98% | | | | | | | | | | | | | | | | | | | | |
| | | | | |
| Variable Rate Demand Notes ø: 1.98% | | | | | | | | | | | | | | | | | | | | |
Massachusetts Development Finance Agency Revenue Partners Healthcare Systems Series M-1 (Health Revenue, U.S. Bank NA LOC) | | | 0.38 | | | | 7-1-2048 | | | | 13,900,000 | | | | 13,900,000 | | | | 0.66 | |
Other securities | | | | | | | | | | | | | | | 28,000,000 | | | | 1.32 | |
| | | | | |
| | | | | | | | | | | | | | | 41,900,000 | | | | 1.98 | |
| | | | | | | | | | | | | | | | | | | | |
| | | | | |
Michigan: 1.38% | | | | | | | | | | | | | | | | | | | | |
| | | | | |
| Variable Rate Demand Notes ø: 1.38% | | | | | | | | | | | | | | | | | | | | |
Eastern Michigan University Barclays Residual Interest Bonds Trust Series 6WE (Miscellaneous Revenue, Barclays Bank plc LOC) 144A | | | 0.59 | | | | 7-1-2018 | | | | 15,105,000 | | | | 15,105,000 | | | | 0.71 | |
Other securities | | | | | | | | | | | | | | | 14,235,000 | | | | 0.67 | |
| | | | | |
| | | | | | | | | | | | | | | 29,340,000 | | | | 1.38 | |
| | | | | | | | | | | | | | | | | | | | |
| | | | | |
Minnesota: 2.79% | | | | | | | | | | | | | | | | | | | | |
| | | | | |
| Variable Rate Demand Notes ø: 2.79% | | | | | | | | | | | | | | | | | | | | |
Other securities | | | | | | | | | | | | | | | 59,135,000 | | | | 2.79 | |
| | | | | | | | | | | | | | | | | | | | |
| | | | | |
Mississippi: 3.75% | | | | | | | | | | | | | | | | | | | | |
| | | | | |
| Variable Rate Demand Notes ø: 3.75% | | | | | | | | | | | | | | | | | | | | |
Mississippi Business Finance Corporation Chevron USA Incorporated Project Series A (Industrial Development Revenue) | | | 0.35 | | | | 12-1-2030 | | | | 29,700,000 | | | | 29,700,000 | | | | 1.40 | |
Mississippi Business Finance Corporation Chevron USA Incorporated Project Series F (Industrial Development Revenue) | | | 0.40 | | | | 12-1-2030 | | | | 12,400,000 | | | | 12,400,000 | | | | 0.59 | |
Mississippi Business Finance Corporation Chevron USA Incorporated Project Series L (Industrial Development Revenue) | | | 0.40 | | | | 11-1-2035 | | | | 14,650,000 | | | | 14,650,000 | | | | 0.69 | |
Mississippi Series A Clipper Tax-Exempt Certificate Trust Series 2009-60 (Miscellaneous Revenue, State Street Bank & Trust Company LIQ) | | | 0.47 | | | | 11-1-2018 | | | | 22,760,000 | | | | 22,760,000 | | | | 1.07 | |
| | | | | |
| | | | | | | | | | | | | | | 79,510,000 | | | | 3.75 | |
| | | | | | | | | | | | | | | | | | | | |
| | | | | |
Missouri: 0.14% | | | | | | | | | | | | | | | | | | | | |
| | | | | |
| Variable Rate Demand Notes ø: 0.14% | | | | | | | | | | | | | | | | | | | | |
Other securities | | | | | | | | | | | | | | | 3,000,000 | | | | 0.14 | |
| | | | | | | | | | | | | | | | | | | | |
The accompanying notes are an integral part of these financial statements.
| | | | |
| 10 | | Wells Fargo National Tax-Free Money Market Fund | | Summary portfolio of investments—July 31, 2016 (unaudited) |
| | | | | | | | | | | | | | | | | | | | |
| Security name | | Interest rate | | | Maturity date | | | Principal | | | Value | | | Percent of net assets | |
| | | | | |
Nebraska: 0.77% | | | | | | | | | | | | | | | | | | | | |
| | | | | |
| Variable Rate Demand Notes ø: 0.77% | | | | | | | | | | | | | | | | | | | | |
Lincoln NE Electric System Series 2900 (Utilities Revenue, Credit Suisse LIQ) | | | 0.53 | % | | | 9-1-2037 | | | $ | 16,348,281 | | | $ | 16,348,281 | | | | 0.77 | % |
| | | | | | | | | | | | | | | | | | | | |
| | | | | |
| | | | | | | | | | | | | | | 16,348,281 | | | | 0.77 | |
| | | | | | | | | | | | | | | | | | | | |
| | | | | |
Nevada: 0.46% | | | | | | | | | | | | | | | | | | | | |
| | | | | |
| Variable Rate Demand Notes ø: 0.46% | | | | | | | | | | | | | | | | | | | | |
Other securities | | | | | | | | | | | | | | | 9,800,000 | | | | 0.46 | |
| | | | | | | | | | | | | | | | | | | | |
| | | | | |
New Hampshire: 0.80% | | | | | | | | | | | | | | | | | | | | |
| | | | | |
| Variable Rate Demand Notes ø: 0.80% | | | | | | | | | | | | | | | | | | | | |
Other securities | | | | | | | | | | | | | | | 17,050,000 | | | | 0.80 | |
| | | | | | | | | | | | | | | | | | | | |
| | | | | |
New Jersey: 0.43% | | | | | | | | | | | | | | | | | | | | |
| | | | | |
| Variable Rate Demand Notes ø: 0.43% | | | | | | | | | | | | | | | | | | | | |
Other securities | | | | | | | | | | | | | | | 9,120,000 | | | | 0.43 | |
| | | | | | | | | | | | | | | | | | | | |
| | | | | |
New York: 11.21% | | | | | | | | | | | | | | | | | | | | |
| | | | | |
| Variable Rate Demand Notes ø: 11.21% | | | | | | | | | | | | | | | | | | | | |
New York City GO Fiscal Sub Series 2012D-3B (GO Revenue, Royal Bank of Canada LOC) | | | 0.38 | | | | 10-1-2039 | | | | 32,300,000 | | | | 32,300,000 | | | | 1.52 | |
New York Dormitory Authority Series 12 Clipper Tax-Exempt Certificate Trust Series 2009-35 (Miscellaneous Revenue, State Street Bank & Trust Company LIQ) | | | 0.47 | | | | 11-15-2026 | | | | 25,000,000 | | | | 25,000,000 | | | | 1.18 | |
New York City NY Transitional Finance Authority (Tax Revenue, Sumitomo Mitsui Banking LOC) | | | 0.39-0.43 | | | | 11-1-2029 to 2-1-2045 | | | | 32,450,000 | | | | 32,450,000 | | | | 1.54 | |
New York NY Various Fiscal Series (GO Revenue, TD Bank NA LOC) | | | 0.38-0.39 | | | | 3-1-2034 to 8-1-2040 | | | | 18,140,000 | | | | 18,140,000 | | | | 0.85 | |
New York NY Fiscal Series 2014I-2 (GO Revenue, JPMorgan Chase & Company LIQ) | | | 0.39 | | | | 3-1-2040 | | | | 19,000,000 | | | | 19,000,000 | | | | 0.89 | |
New York NY Municipal Water Finance Authority Water & Sewer System 2nd Generation Resolution Fiscal 2011 Sub Series FF-1 (Water & Sewer Revenue, Bank of America NA SPA) | | | 0.35 | | | | 6-15-2044 | | | | 13,900,000 | | | | 13,900,000 | | | | 0.65 | |
New York NY Municipal Water Finance Authority Water & Sewer System 2nd Generation Resolution Fiscal 2016 Sub Series AA-2 (Water & Sewer Revenue, PNC Bank NA SPA) | | | 0.39 | | | | 6-15-2048 | | | | 33,500,000 | | | | 33,500,000 | | | | 1.58 | |
New York NY Sub Series L-3 (GO Revenue, Bank of America NA SPA) | | | 0.35 | | | | 4-1-2036 | | | | 13,000,000 | | | | 13,000,000 | | | | 0.61 | |
Other securities | | | | | | | | | | | | | | | 50,600,000 | | | | 2.39 | |
| | | | | |
| | | | | | | | | | | | | | | 237,890,000 | | | | 11.21 | |
| | | | | | | | | | | | | | | | | | | | |
| | | | | |
North Carolina: 2.99% | | | | | | | | | | | | | | | | | | | | |
| | | | | |
| Variable Rate Demand Notes ø: 2.99% | | | | | | | | | | | | | | | | | | | | |
North Carolina Medical Care Commission FirstHealth Carolina Project Series 2008A (Health Revenue, Branch Banking & Trust SPA) | | | 0.48 | | | | 10-1-2028 | | | | 33,650,000 | | | | 33,650,000 | | | | 1.59 | |
The accompanying notes are an integral part of these financial statements.
| | | | | | |
| Summary portfolio of investments—July 31, 2016 (unaudited) | | Wells Fargo National Tax-Free Money Market Fund | | | 11 | |
| | | | | | | | | | | | | | | | | | | | |
| Security name | | Interest rate | | | Maturity date | | | Principal | | | Value | | | Percent of net assets | |
| | | | | |
| Variable Rate Demand Notes ø (continued) | | | | | | | | | | | | | | | | | | | | |
North Carolina Medical Care Commission Hospice Alamance-Caswell Project Series 2008 (Health Revenue, Branch Banking & Trust LOC) | | | 0.45 | % | | | 12-1-2033 | | | $ | 4,200,000 | | | $ | 4,200,000 | | | | 0.20 | % |
Other securities | | | | | | | | | | | | | | | 25,645,500 | | | | 1.20 | |
| | | | | |
| | | | | | | | | | | | | | | 63,495,500 | | | | 2.99 | |
| | | | | | | | | | | | | | | | | | | | |
| | | | | |
Ohio: 0.17% | | | | | | | | | | | | | | | | | | | | |
| | | | | |
| Variable Rate Demand Notes ø: 0.17% | | | | | | | | | | | | | | | | | | | | |
Other securities | | | | | | | | | | | | | | | 3,600,000 | | | | 0.17 | |
| | | | | | | | | | | | | | | | | | | | |
| | | | | |
Oklahoma: 1.27% | | | | | | | | | | | | | | | | | | | | |
| | | | | |
| Variable Rate Demand Notes ø: 1.27% | | | | | | | | | | | | | | | | | | | | |
Oklahoma Turnpike Authority Series F (Transportation Revenue, JPMorgan Chase & Company SPA) | | | 0.37 | | | | 1-1-2028 | | | | 22,000,000 | | | | 22,000,000 | | | | 1.04 | |
Other securities | | | | | | | | | | | | | | | 5,000,000 | | | | 0.23 | |
| | | | | |
| | | | | | | | | | | | | | | 27,000,000 | | | | 1.27 | |
| | | | | | | | | | | | | | | | | | | | |
| | | | | |
Other: 2.94% | | | | | | | | | | | | | | | | | | | | |
| | | | | |
| Variable Rate Demand Notes ø: 2.94% | | | | | | | | | | | | | | | | | | | | |
Clipper Tax-Exempt Certificate Trust Series 2009-54 (Miscellaneous Revenue, State Street Bank & Trust Company LIQ) | | | 0.49 | | | | 2-15-2028 | | | | 31,870,000 | | | | 31,870,000 | | | | 1.50 | |
FHLMC MFHR Series M031 & M033 (Housing Revenue, FHLMC LIQ) | | | 0.47 | | | | 12-15-2045 to 12-15-2046 | | | | 14,855,000 | | | | 14,855,000 | | | | 0.70 | |
FHLMC MFHR Series M027 Class A (Housing Revenue, FHLMC LIQ) | | | 0.47 | | | | 10-15-2029 | | | | 15,685,000 | | | | 15,685,000 | | | | 0.74 | |
| | | | | |
| | | | | | | | | | | | | | | 62,410,000 | | | | 2.94 | |
| | | | | | | | | | | | | | | | | | | | |
| | | | | |
Pennsylvania: 2.02% | | | | | | | | | | | | | | | | | | | | |
| | | | | |
| Variable Rate Demand Notes ø: 2.02% | | | | | | | | | | | | | | | | | | | | |
Philadelphia PA School District Series 2016C (GO Revenue, PNC Bank NA LOC) | | | 0.44 | | | | 9-1-2030 | | | | 15,000,000 | | | | 15,000,000 | | | | 0.71 | |
Other securities | | | | | | | | | | | | | | | 27,750,000 | | | | 1.31 | |
| | | | | |
| | | | | | | | | | | | | | | 42,750,000 | | | | 2.02 | |
| | | | | | | | | | | | | | | | | | | | |
| | | | | |
Rhode Island: 0.47% | | | | | | | | | | | | | | | | | | | | |
| | | | | |
| Variable Rate Demand Notes ø: 0.47% | | | | | | | | | | | | | | | | | | | | |
Other securities | | | | | | | | | | | | | | | 10,000,000 | | | | 0.47 | |
| | | | | | | | | | | | | | | | | | | | |
| | | | | |
South Carolina: 3.60% | | | | | | | | | | | | | | | | | | | | |
| | | | | |
| Other Municipal Debt: 3.01% | | | | | | | | | | | | | | | | | | | | |
York County SC PCR Series 2000B-1 (Utilities Revenue) | | | 0.54 | | | | 8-1-2016 | | | | 22,500,000 | | | | 22,500,000 | | | | 1.06 | |
York County SC PCR Series 2000B-2 (Utilities Revenue) | | | 0.54 | | | | 8-1-2016 | | | | 22,500,000 | | | | 22,500,000 | | | | 1.06 | |
York County SC PCR Series 2000B-3 (Utilities Revenue) | | | 0.54 | | | | 8-1-2016 | | | | 18,900,000 | | | | 18,900,000 | | | | 0.89 | |
| | | | | |
| | | | | | | | | | | | | | | 63,900,000 | | | | 3.01 | |
| | | | | | | | | | | | | | | | | | | | |
The accompanying notes are an integral part of these financial statements.
| | | | |
| 12 | | Wells Fargo National Tax-Free Money Market Fund | | Summary portfolio of investments—July 31, 2016 (unaudited) |
| | | | | | | | | | | | | | | | | | | | |
| Security name | | Interest rate | | | Maturity date | | | Principal | | | Value | | | Percent of net assets | |
| | | | | |
| Variable Rate Demand Notes ø: 0.59% | | | | | | | | | | | | | | | | | | | | |
Other securities | | | | | | | | | | | | | | $ | 12,515,000 | | | | 0.59 | % |
| | | | | | | | | | | | | | | | | | | | |
| | | | | |
South Dakota: 0.31% | | | | | | | | | | | | | | | | | | | | |
| | | | | |
| Variable Rate Demand Notes ø: 0.31% | | | | | | | | | | | | | | | | | | | | |
Other securities | | | | | | | | | | | | | | | 6,495,000 | | | | 0.31 | |
| | | | | | | | | | | | | | | | | | | | |
| | | | | |
Tennessee: 3.71% | | | | | | | | | | | | | | | | | | | | |
| | | | | |
| Variable Rate Demand Notes ø: 3.71% | | | | | | | | | | | | | | | | | | | | |
Montgomery County TN Public Building Authority Series 2008 (Miscellaneous Revenue, Bank of America NA LOC) | | | 0.40 | % | | | 7-1-2038 | | | $ | 26,800,000 | | | | 26,800,000 | | | | 1.26 | |
Sevier County TN Public Building Authority Local Government Public Improvement Series 6-A1 (Miscellaneous Revenue, Branch Banking & Trust SPA) | | | 0.45 | | | | 6-1-2029 | | | | 37,600,000 | | | | 37,600,000 | | | | 1.77 | |
Other securities | | | | | | | | | | | | | | | 14,355,000 | | | | 0.68 | |
| | | | | |
| | | | | | | | | | | | | | | 78,755,000 | | | | 3.71 | |
| | | | | | | | | | | | | | | | | | | | |
| | | | | |
Texas: 12.15% | | | | | | | | | | | | | | | | | | | | |
| | | | | |
| Other Municipal Debt: 0.10% | | | | | | | | | | | | | | | | | | | | |
Other securities | | | | | | | | | | | | | | | 2,102,972 | | | | 0.10 | |
| | | | | | | | | | | | | | | | | | | | |
| | | | | |
| Variable Rate Demand Notes ø: 12.05% | | | | | | | | | | | | | | | | | | | | |
Atascosa County TX PCR San Miguel Electric Cooperative (Utilities Revenue) | | | 0.52 | | | | 6-30-2020 | | | | 13,000,000 | | | | 13,000,000 | | | | 0.61 | |
Dallas TX Waterworks & Sewer System Clipper Tax Exempt Certificates Trust 2009-52 (Water & Sewer Revenue, State Street Bank & Trust Company LIQ) | | | 0.47 | | | | 10-1-2018 | | | | 13,960,000 | | | | 13,960,000 | | | | 0.66 | |
Dickinson TX Independent School District Series SGA 94 (GO Revenue, Societe Generale LIQ) | | | 0.44 | | | | 2-15-2028 | | | | 13,350,000 | | | | 13,350,000 | | | | 0.63 | |
Harris County TX Cultural and Educational Facilities Authority Barclays Residual Interest Bonds Trust Series 5WE (Miscellaneous Revenue, Barclays Bank plc LOC) 144A | | | 0.59 | | | | 7-1-2018 | | | | 50,995,000 | | | | 50,995,000 | | | | 2.40 | |
Port Arthur TX Navigation District Industrial Development Corporation Total Petrochemicals USA Incorporated Project Series 2011 (Industrial Development Revenue) | | | 0.47 | | | | 6-1-2041 | | | | 25,000,000 | | | | 25,000,000 | | | | 1.18 | |
Port Arthur TX Navigation District Industrial Development Corporation Total Petrochemicals USA Incorporated Project Series 2012 (Industrial Development Revenue) | | | 0.47 | | | | 3-1-2042 | | | | 27,500,000 | | | | 27,500,000 | | | | 1.30 | |
Tarrant County TX Cultural Educational Facilities Finance Corporation Methodist Hospitals of Dallas Series A (Health Revenue, TD Bank NA LOC) | | | 0.39 | | | | 10-1-2041 | | | | 13,245,000 | | | | 13,245,000 | | | | 0.62 | |
Texas Municipal Gas Acquisition & Supply Corporation Series 2848 (Utilities Revenue, Morgan Stanley Bank LIQ) 144A | | | 0.74 | | | | 12-15-2026 | | | | 56,621,560 | | | | 56,621,560 | | | | 2.67 | |
Other securities | | | | | | | | | | | | | | | 41,895,000 | | | | 1.98 | |
| | | | | |
| | | | | | | | | | | | | | | 255,566,560 | | | | 12.05 | |
| | | | | | | | | | | | | | | | | | | | |
| | | | | |
Utah: 0.92% | | | | | | | | | | | | | | | | | | | | |
| | | | | |
| Variable Rate Demand Notes ø: 0.92% | | | | | | | | | | | | | | | | | | | | |
Murray UT City Hospital IHC Health Services Incorporated Series C (Health Revenue) | | | 0.35 | | | | 5-15-2036 | | | | 19,440,000 | | | | 19,440,000 | | | | 0.92 | |
| | | | | | | | | | | | | | | | | | | | |
The accompanying notes are an integral part of these financial statements.
| | | | | | |
| Summary portfolio of investments—July 31, 2016 (unaudited) | | Wells Fargo National Tax-Free Money Market Fund | | | 13 | |
| | | | | | | | | | | | | | | | | | | | |
| Security name | | Interest rate | | | Maturity date | | | Principal | | | Value | | | Percent of net assets | |
| | | | | |
Vermont: 0.74% | | | | | | | | | | | | | | | | | | | | |
| | | | | |
| Variable Rate Demand Notes ø: 0.74% | | | | | | | | | | | | | | | | | | | | |
Other securities | | | | | | | | | | | | | | $ | 15,795,000 | | | | 0.74 | % |
| | | | | | | | | | | | | | | | | | | | |
| | | | | |
Virginia: 0.79% | | | | | | | | | | | | | | | | | | | | |
| | | | | |
| Variable Rate Demand Notes ø: 0.79% | | | | | | | | | | | | | | | | | | | | |
University of Virginia Rector & Visitors Series 2008 (Education Revenue, JPMorgan Chase & Company LIQ) 144A | | | 0.47 | % | | | 12-1-2017 | | | $ | 13,600,000 | | | | 13,600,000 | | | | 0.64 | |
Other securities | | | | | | | | | | | | | | | 3,075,000 | | | | 0.15 | |
| | | | | |
| | | | | | | | | | | | | | | 16,675,000 | | | | 0.79 | |
| | | | | | | | | | | | | | | | | | | | |
| | | | | |
Washington: 1.94% | | | | | | | | | | | | | | | | | | | | |
| | | | | |
| Variable Rate Demand Notes ø: 1.94% | | | | | | | | | | | | | | | | | | | | |
University of Washington Solar Eclipse Funding Trust Series 2007-0075 (Miscellaneous Revenue, U.S. Bank NA LOC, U.S. Bank NA LIQ) | | | 0.49 | | | | 6-1-2037 | | | | 17,495,000 | | | | 17,495,000 | | | | 0.83 | |
Other securities | | | | | | | | | | | | | | | 23,621,000 | | | | 1.11 | |
| | | | | |
| | | | | | | | | | | | | | | 41,116,000 | | | | 1.94 | |
| | | | | | | | | | | | | | | | | | | | |
| | | | | |
Wisconsin: 4.98% | | | | | | | | | | | | | | | | | | | | |
| | | | | |
| Variable Rate Demand Notes ø: 4.98% | | | | | | | | | | | | | | | | | | | | |
Appleton WI Recovery Zone Facilities Foremost Farms Project Series 2010 (Industrial Development Revenue, CoBank LOC) | | | 0.44 | | | | 5-1-2037 | | | | 30,000,000 | | | | 30,000,000 | | | | 1.41 | |
Wisconsin Clipper Tax-Exempt Certificate Trust Series 2009-36 (Miscellaneous Revenue, State Street Bank & Trust Company LIQ) | | | 0.47 | | | | 5-1-2020 | | | | 26,755,000 | | | | 26,755,000 | | | | 1.26 | |
Wisconsin HEFA Wheaton Franciscan Healthcare System Morgan Stanley Series 2006-2113 (Health Revenue, Morgan Stanley Bank LIQ) 144A | | | 0.50 | | | | 8-15-2034 | | | | 33,210,740 | | | | 33,210,740 | | | | 1.57 | |
Wisconsin PFA Midwestern Disaster Area Program Series 2011 (Industrial Development Revenue, Farm Credit Services America LOC) | | | 0.44 | | | | 9-1-2036 | | | | 13,780,000 | | | | 13,780,000 | | | | 0.65 | |
Other securities | | | | | | | | | | | | | | | 1,820,000 | | | | 0.09 | |
| | | | | |
| | | | | | | | | | | | | | | 105,565,740 | | | | 4.98 | |
| | | | | | | | | | | | | | | | | | | | |
| | | | | |
Wyoming: 0.79% | | | | | | | | | | | | | | | | | | | | |
| | | | | |
| Variable Rate Demand Notes ø: 0.79% | | | | | | | | | | | | | | | | | | | | |
Lincoln County WY PCR ExxonMobil Project Series 2014 (Resource Recovery Revenue) | | | 0.34 | | | | 10-1-2044 | | | | 16,800,000 | | | | 16,800,000 | | | | 0.79 | |
| | | | | | | | | | | | | | | | | | | | |
| | | | | |
Total Municipal Obligations (Cost $1,952,008,898) | | | | | | | | | | | | | | | 1,952,008,898 | | | | 92.02 | |
| | | | | | | | | | | | | | | | | | | | |
| | | | | |
Repurchase Agreements: 3.77% | | | | | | | | | | | | | | | | | | | | |
Societe Generale, dated 7-29-2016, maturity value $80,000,220 ^^ | | | 0.33 | | | | 8-1-2016 | | | | 80,000,000 | | | | 80,000,000 | | | | 3.77 | |
| | | | | | | | | | | | | | | | | | | | |
| | | | | |
Total Repurchase Agreements (Cost $80,000,000) | | | | | | | | | | | | | | | 80,000,000 | | | | 3.77 | |
| | | | | | | | | | | | | | | | | | | | |
| | | | | |
| Total investments in securities (Cost $2,032,008,898) * | | | | | | | | | | | | | | | 2,032,008,898 | | | | 95.79 | |
Other assets and liabilities, net | | | | | | | | | | | | | | | 89,360,863 | | | | 4.21 | |
| | | | | | | | | | | | | | | | | | | | |
| Total net assets | | | | | | | | | | | | | | $ | 2,121,369,761 | | | | 100.00 | % |
| | | | | | | | | | | | | | | | | | | | |
The accompanying notes are an integral part of these financial statements.
| | | | |
| 14 | | Wells Fargo National Tax-Free Money Market Fund | | Summary portfolio of investments—July 31, 2016 (unaudited) |
| ø | Variable rate demand notes are subject to a demand feature which reduces the effective maturity. The maturity date shown represents the final maturity date of the security. The interest rate is determined and reset by the issuer daily, weekly, or monthly depending upon the terms of the security. The rate shown is the rate in effect at period end. |
| 144A | The security may be resold in transactions exempt from registration, normally to qualified institutional buyers, pursuant to Rule 144A under the Securities Act of 1933. |
| ^^ | Collateralized by U.S. government securities, 0.00% to 8.13%, 7-31-2016 to 8-15-2045, fair value including accrued interest is $81,600,000. |
| * | Cost for federal income tax purposes is substantially the same as for financial reporting purposes. |
The accompanying notes are an integral part of these financial statements.
| | | | | | |
| Statement of assets and liabilities—July 31, 2016 (unaudited) | | Wells Fargo National Tax-Free Money Market Fund | | | 15 | |
| | | | |
| | | | |
| |
Assets | | | | |
Investments in unaffiliated securities, at amortized cost | | $ | 2,032,008,898 | |
Cash | | | 270,538 | |
Receivable for investments sold | | | 88,939,282 | |
Receivable for Fund shares sold | | | 74,076 | |
Receivable for interest | | | 1,172,915 | |
Receivable from manager | | | 94,448 | |
Prepaid expenses and other assets | | | 79,535 | |
| | | | |
Total assets | | | 2,122,639,692 | |
| | | | |
| |
Liabilities | | | | |
Dividends payable | | | 233,096 | |
Payable for Fund shares redeemed | | | 322,652 | |
Distribution fee payable | | | 179,013 | |
Administration fees payable | | | 241,998 | |
Custodian and accounting fees payable | | | 86,093 | |
Shareholder servicing fees payable | | | 188,169 | |
Accrued expenses and other liabilities | | | 18,910 | |
| | | | |
Total liabilities | | | 1,269,931 | |
| | | | |
Total net assets | | $ | 2,121,369,761 | |
| | | | |
| |
NET ASSETS CONSIST OF | | | | |
Paid-in capital | | $ | 2,120,956,150 | |
Undistributed net investment income | | | 293 | |
Accumulated net realized gains on investments | | | 413,318 | |
| | | | |
Total net assets | | $ | 2,121,369,761 | |
| | | | |
| |
COMPUTATION OF NET ASSET VALUE PER SHARE | | | | |
Net assets – Class A | | $ | 154,129,606 | |
Shares outstanding – Class A1 | | | 154,084,777 | |
Net asset value per share – Class A | | | $1.00 | |
Net assets – Administrator Class | | $ | 168,364,558 | |
Shares outstanding – Administrator Class1 | | | 168,315,273 | |
Net asset value per share – Administrator Class | | | $1.00 | |
Net assets – Premier Class | | $ | 1,123,146,235 | |
Shares outstanding – Premier Class1 | | | 1,122,809,833 | |
Net asset value per share – Premier Class | | | $1.00 | |
Net assets – Service Class | | $ | 53,513,668 | |
Shares outstanding – Service Class1 | | | 53,497,258 | |
Net asset value per share – Service Class | | | $1.00 | |
Net assets – Sweep Class | | $ | 622,215,694 | |
Shares outstanding – Sweep Class1 | | | 622,041,449 | |
Net asset value per share – Sweep Class | | | $1.00 | |
| 1 | The Fund has an unlimited number of authorized shares. |
The accompanying notes are an integral part of these financial statements.
| | | | |
| 16 | | Wells Fargo National Tax-Free Money Market Fund | | Statement of operations—six months ended July 31, 2016 (unaudited) |
| | | | |
| | | | |
| |
Investment income | | | | |
Interest | | $ | 4,244,296 | |
| | | | |
| |
Expenses | �� | | | |
Management fee | | | 1,869,940 | |
Administration fees | | | | |
Class A | | | 178,842 | |
Administrator Class | | | 86,874 | |
Premier Class1 | | | 577,926 | |
Service Class | | | 62,147 | |
Sweep Class | | | 669,380 | |
Shareholder servicing fees | | | | |
Class A | | | 203,229 | |
Administrator Class | | | 85,567 | |
Service Class | | | 127,377 | |
Sweep Class | | | 760,659 | |
Distribution fee | | | | |
Sweep Class | | | 1,064,923 | |
Custody and accounting fees | | | 64,770 | |
Professional fees | | | 21,496 | |
Registration fees | | | 40,686 | |
Shareholder report expenses | | | 18,546 | |
Trustees’ fees and expenses | | | 11,026 | |
Other fees and expenses | | | 24,355 | |
| | | | |
Total expenses | | | 5,867,743 | |
Less: Fee waivers and/or expense reimbursements | | | (2,928,142 | ) |
| | | | |
Net expenses | | | 2,939,601 | |
| | | | |
Net investment income | | | 1,304,695 | |
| | | | |
Net realized gains on investments | | | 93,156 | |
| | | | |
Net increase in net assets resulting from operations | | $ | 1,397,851 | |
| | | | |
| 1 | Effective April 1, 2016, Institutional Class was renamed Premier Class. |
The accompanying notes are an integral part of these financial statements.
| | | | | | |
| Statement of changes in net assets | | Wells Fargo National Tax-Free Money Market Fund | | | 17 | |
| | | | | | | | | | | | | | | | |
| | | Six months ended
July 31, 2016 (unaudited) | | | Year ended
January 31, 2016 | |
| | | |
Operations | | | | | | | | | | | | |
Net investment income | | | | | | $ | 1,304,695 | | | | | | | $ | 297,398 | |
Net realized gains on investments | | | | | | | 93,156 | | | | | | | | 517,640 | |
| | | | |
Net increase in net assets resulting from operations | | | | | | | 1,397,851 | | | | | | | | 815,038 | |
| | | | |
| | | |
Distributions to shareholders from | | | | | | | | | | | | |
Net investment income | | | | |
Class A | | | | | | | (8,150 | ) | | | | | | | (15,282 | ) |
Administrator Class | | | | | | | (87,714 | ) | | | | | | | (18,792 | ) |
Premier Class1 | | | | | | | (1,172,684 | ) | | | | | | | (189,990 | ) |
Service Class | | | | | | | (5,644 | ) | | | | | | | (15,245 | ) |
Sweep Class | | | | | | | (30,503 | ) | | | | | | | (58,080 | ) |
Net realized gains | | | | |
Class A | | | | | | | 0 | | | | | | | | (14,089 | ) |
Administrator Class | | | | | | | 0 | | | | | | | | (15,700 | ) |
Premier Class1 | | | | | | | 0 | | | | | | | | (175,944 | ) |
Service Class | | | | | | | 0 | | | | | | | | (11,103 | ) |
Sweep Class | | | | | | | 0 | | | | | | | | (54,176 | ) |
| | | | |
Total distributions to shareholders | | | | | | | (1,304,695 | ) | | | | | | | (568,401 | ) |
| | | | |
| | | | |
Capital share transactions | | | Shares | | | | | | | | Shares | | | | | |
Proceeds from shares sold | | | | |
Class A | | | 95,537,614 | | | | 95,537,614 | | | | 345,360,688 | | | | 345,360,688 | |
Administrator Class | | | 44,556,074 | | | | 44,556,074 | | | | 134,625,938 | | | | 134,625,938 | |
Premier Class1 | | | 2,846,574,919 | | | | 2,846,574,919 | | | | 8,231,106,752 | | | | 8,231,106,752 | |
Service Class | | | 88,594,365 | | | | 88,594,365 | | | | 279,035,075 | | | | 279,035,075 | |
Sweep Class | | | 833,672,913 | | | | 833,672,913 | | | | 1,649,583,801 | | | | 1,649,583,802 | |
| | | | |
| | | | | | | 3,908,935,885 | | | | | | | | 10,639,712,255 | |
| | | | |
Reinvestment of distributions | | | | |
Class A | | | 7,152 | | | | 7,152 | | | | 25,578 | | | | 25,578 | |
Administrator Class | | | 77,093 | | | | 77,093 | | | | 30,423 | | | | 30,423 | |
Premier Class1 | | | 148,766 | | | | 148,766 | | | | 86,696 | | | | 86,696 | |
Service Class | | | 1,505 | | | | 1,505 | | | | 6,394 | | | | 6,394 | |
Sweep Class | | | 30,503 | | | | 30,503 | | | | 112,419 | | | | 112,419 | |
| | | | |
| | | | | | | 265,019 | | | | | | | | 261,510 | |
| | | | |
Payment for shares redeemed | | | | |
Class A | | | (114,159,380 | ) | | | (114,159,380 | ) | | | (296,201,135 | ) | | | (296,201,135 | ) |
Administrator Class | | | (55,456,362 | ) | | | (55,456,362 | ) | | | (147,267,265 | ) | | | (147,267,265 | ) |
Premier Class1 | | | (3,401,316,428 | ) | | | (3,401,316,428 | ) | | | (8,822,783,114 | ) | | | (8,822,783,114 | ) |
Service Class | | | (197,657,499 | ) | | | (197,657,499 | ) | | | (256,379,316 | ) | | | (256,379,316 | ) |
Sweep Class | | | (854,341,782 | ) | | | (854,341,782 | ) | | | (1,575,114,559 | ) | | | (1,575,114,559 | ) |
| | | | |
| | | | | | | (4,622,931,451 | ) | | | | | | | (11,097,745,389 | ) |
| | | | |
Net decrease in net assets resulting from capital share transactions | | | | | | | (713,730,547 | ) | | | | | | | (457,771,624 | ) |
| | | | |
Total decrease in net assets | | | | | | | (713,637,391 | ) | | | | | | | (457,524,987 | ) |
| | | | |
| | |
Net assets | | | | | | | | |
Beginning of period | | | | | | | 2,835,007,152 | | | | | | | | 3,292,532,139 | |
| | | | |
End of period | | | | | | $ | 2,121,369,761 | | | | | | | $ | 2,835,007,152 | |
| | | | |
Undistributed net investment income | | | | | | $ | 293 | | | | | | | $ | 293 | |
| | | | |
| 1 | Effective April 1, 2016, Institutional Class was renamed Premier Class. |
The accompanying notes are an integral part of these financial statements.
| | | | |
| 18 | | Wells Fargo National Tax-Free Money Market Fund | | Financial highlights |
(For a share outstanding throughout each period)
| | | | | | | | | | | | | | | | | | | | | | | | |
| | | Six months ended
July 31, 2016 (unaudited) | | | Year ended January 31 | |
| CLASS A | | | 2016 | | | 2015 | | | 2014 | | | 2013 | | | 2012 | |
Net asset value, beginning of period | | | $1.00 | | | | $1.00 | | | | $1.00 | | | | $1.00 | | | | $1.00 | | | | $1.00 | |
Net investment income | | | 0.00 | 1 | | | 0.00 | 1 | | | 0.00 | 1 | | | 0.00 | 1 | | | 0.00 | 1 | | | 0.00 | 1 |
Net realized gains on investments | | | 0.00 | 1 | | | 0.00 | 1 | | | 0.00 | 1 | | | 0.00 | 1 | | | 0.00 | 1 | | | 0.00 | 1 |
| | | | | | | | | | | | | | | | | | | | | | | | |
Total from investment operations | | | 0.00 | 1 | | | 0.00 | 1 | | | 0.00 | 1 | | | 0.00 | 1 | | | 0.00 | 1 | | | 0.00 | 1 |
Distributions to shareholders from | | | | | | | | | | | | | | | | | | | | | | | | |
Net investment income | | | (0.00 | )1 | | | (0.00 | )1 | | | (0.00 | )1 | | | (0.00 | )1 | | | (0.00 | )1 | | | (0.00 | )1 |
Net realized gains | | | 0.00 | | | | (0.00 | )1 | | | (0.00 | )1 | | | (0.00 | )1 | | | (0.00 | )1 | | | (0.00 | )1 |
| | | | | | | | | | | | | | | | | | | | | | | | |
Total distributions to shareholders | | | (0.00 | )1 | | | (0.00 | )1 | | | (0.00 | )1 | | | (0.00 | )1 | | | (0.00 | )1 | | | (0.00 | )1 |
Net asset value, end of period | | | $1.00 | | | | $1.00 | | | | $1.00 | | | | $1.00 | | | | $1.00 | | | | $1.00 | |
Total return2 | | | 0.00 | % | | | 0.02 | % | | | 0.02 | % | | | 0.02 | % | | | 0.02 | % | | | 0.02 | % |
Ratios to average net assets (annualized) | | | | | | | | | | | | | | | | | | | | | | | | |
Gross expenses | | | 0.63 | % | | | 0.63 | % | | | 0.63 | % | | | 0.63 | % | | | 0.63 | % | | | 0.62 | % |
Net expenses | | | 0.34 | % | | | 0.08 | % | | | 0.08 | % | | | 0.12 | % | | | 0.18 | % | | | 0.19 | % |
Net investment income | | | 0.01 | % | | | 0.01 | % | | | 0.01 | % | | | 0.01 | % | | | 0.01 | % | | | 0.01 | % |
Supplemental data | | | | | | | | | | | | | | | | | | | | | | | | |
Net assets, end of period (000s omitted) | | | $154,130 | | | | $172,725 | | | | $123,525 | | | | $203,609 | | | | $284,041 | | | | $518,949 | |
| 1 | Amount is less than $0.005. |
| 2 | Returns for periods of less than one year are not annualized. |
The accompanying notes are an integral part of these financial statements.
| | | | | | |
| Financial highlights | | Wells Fargo National Tax-Free Money Market Fund | | | 19 | |
(For a share outstanding throughout each period)
| | | | | | | | | | | | | | | | | | | | | | | | |
| | | Six months ended
July 31, 2016 (unaudited) | | | Year ended January 31 | |
| ADMINISTRATOR CLASS | | | 2016 | | | 2015 | | | 2014 | | | 2013 | | | 2012 | |
Net asset value, beginning of period | | | $1.00 | | | | $1.00 | | | | $1.00 | | | | $1.00 | | | | $1.00 | | | | $1.00 | |
Net investment income | | | 0.00 | 1 | | | 0.00 | 1 | | | 0.00 | 1 | | | 0.00 | 1 | | | 0.00 | 1 | | | 0.00 | 1 |
Net realized gains on investments | | | 0.00 | 1 | | | 0.00 | 1 | | | 0.00 | 1 | | | 0.00 | 1 | | | 0.00 | 1 | | | 0.00 | 1 |
| | | | | | | | | | | | | | | | | | | | | | | | |
Total from investment operations | | | 0.00 | 1 | | | 0.00 | 1 | | | 0.00 | 1 | | | 0.00 | 1 | | | 0.00 | 1 | | | 0.00 | 1 |
Distributions to shareholders from | | | | | | | | | | | | | | | | | | | | | | | | |
Net investment income | | | (0.00 | )1 | | | (0.00 | )1 | | | (0.00 | )1 | | | (0.00 | )1 | | | (0.00 | )1 | | | (0.00 | )1 |
Net realized gains | | | 0.00 | | | | (0.00 | )1 | | | (0.00 | )1 | | | (0.00 | )1 | | | (0.00 | )1 | | | (0.00 | )1 |
| | | | | | | | | | | | | | | | | | | | | | | | |
Total distributions to shareholders | | | (0.00 | )1 | | | (0.00 | )1 | | | (0.00 | )1 | | | (0.00 | )1 | | | (0.00 | )1 | | | (0.00 | )1 |
Net asset value, end of period | | | $1.00 | | | | $1.00 | | | | $1.00 | | | | $1.00 | | | | $1.00 | | | | $1.00 | |
Total return2 | | | 0.05 | % | | | 0.02 | % | | | 0.02 | % | | | 0.02 | % | | | 0.02 | % | | | 0.02 | % |
Ratios to average net assets (annualized) | | | | | | | | | | | | | | | | | | | | | | | | |
Gross expenses | | | 0.36 | % | | | 0.36 | % | | | 0.36 | % | | | 0.36 | % | | | 0.36 | % | | | 0.36 | % |
Net expenses | | | 0.25 | % | | | 0.08 | % | | | 0.08 | % | | | 0.11 | % | | | 0.18 | % | | | 0.18 | % |
Net investment income | | | 0.10 | % | | | 0.01 | % | | | 0.01 | % | | | 0.01 | % | | | 0.01 | % | | | 0.01 | % |
Supplemental data | | | | | | | | | | | | | | | | | | | | | | | | |
Net assets, end of period (000s omitted) | | | $168,365 | | | | $179,171 | | | | $191,766 | | | | $214,788 | | | | $226,083 | | | | $281,128 | |
| 1 | Amount is less than $0.005. |
| 2 | Returns for periods of less than one year are not annualized. |
The accompanying notes are an integral part of these financial statements.
| | | | |
| 20 | | Wells Fargo National Tax-Free Money Market Fund | | Financial highlights |
(For a share outstanding throughout each period)
| | | | | | | | | | | | | | | | | | | | | | | | |
| | | Six months ended
July 31, 2016 (unaudited) | | | Year ended January 31 | |
| PREMIER CLASS1 | | | 2016 | | | 2015 | | | 2014 | | | 2013 | | | 2012 | |
Net asset value, beginning of period | | | $1.00 | | | | $1.00 | | | | $1.00 | | | | $1.00 | | | | $1.00 | | | | $1.00 | |
Net investment income | | | 0.00 | 2 | | | 0.00 | 2 | | | 0.00 | 2 | | | 0.00 | 2 | | | 0.00 | 2 | | | 0.00 | 2 |
Net realized gains on investments | | | 0.00 | 2 | | | 0.00 | 2 | | | 0.00 | 2 | | | 0.00 | 2 | | | 0.00 | 2 | | | 0.00 | 2 |
| | | | | | | | | | | | | | | | | | | | | | | | |
Total from investment operations | | | 0.00 | 2 | | | 0.00 | 2 | | | 0.00 | 2 | | | 0.00 | 2 | | | 0.00 | 2 | | | 0.00 | 2 |
Distributions to shareholders from | | | | | | | | | | | | | | | | | | | | | | | | |
Net investment income | | | (0.00 | )2 | | | (0.00 | )2 | | | (0.00 | )2 | | | (0.00 | )2 | | | (0.00 | )2 | | | (0.00 | )2 |
Net realized gains | | | 0.00 | | | | (0.00 | )2 | | | (0.00 | )2 | | | (0.00 | )2 | | | (0.00 | )2 | | | (0.00 | )2 |
| | | | | | | | | | | | | | | | | | | | | | | | |
Total distributions to shareholders | | | (0.00 | )2 | | | (0.00 | )2 | | | (0.00 | )2 | | | (0.00 | )2 | | | (0.00 | )2 | | | (0.00 | )2 |
Net asset value, end of period | | | $1.00 | | | | $1.00 | | | | $1.00 | | | | $1.00 | | | | $1.00 | | | | $1.00 | |
Total return2 | | | 0.09 | % | | | 0.02 | % | | | 0.02 | % | | | 0.02 | % | | | 0.03 | % | | | 0.04 | % |
Ratios to average net assets (annualized) | | | | | | | | | | | | | | | | | | | | | | | | |
Gross expenses | | | 0.24 | % | | | 0.24 | % | | | 0.24 | % | | | 0.24 | % | | | 0.24 | % | | | 0.24 | % |
Net expenses | | | 0.17 | % | | | 0.08 | % | | | 0.08 | % | | | 0.11 | % | | | 0.17 | % | | | 0.16 | % |
Net investment income | | | 0.16 | % | | | 0.01 | % | | | 0.01 | % | | | 0.01 | % | | | 0.02 | % | | | 0.03 | % |
Supplemental data | | | | | | | | | | | | | | | | | | | | | | | | |
Net assets, end of period (000s omitted) | | | $1,123,146 | | | | $1,677,748 | | | | $2,269,187 | | | | $2,292,160 | | | | $2,112,183 | | | | $3,036,275 | |
| 1 | Effective April 1, 2016, Institutional Class was renamed Premier Class. |
| 2 | Amount is less than $0.005. |
| 3 | Returns for periods of less than one year are not annualized. |
The accompanying notes are an integral part of these financial statements.
| | | | | | |
| Financial highlights | | Wells Fargo National Tax-Free Money Market Fund | | | 21 | |
(For a share outstanding throughout each period)
| | | | | | | | | | | | | | | | | | | | | | | | |
| | | Six months ended
July 31, 2016 (unaudited) | | | Year ended January 31 | |
| SERVICE CLASS | | | 2016 | | | 2015 | | | 2014 | | | 2013 | | | 2012 | |
Net asset value, beginning of period | | | $1.00 | | | | $1.00 | | | | $1.00 | | | | $1.00 | | | | $1.00 | | | | $1.00 | |
Net investment income | | | 0.00 | 1 | | | 0.00 | 1 | | | 0.00 | 1 | | | 0.00 | 1 | | | 0.00 | 1 | | | 0.00 | 1 |
Net realized gains on investments | | | 0.00 | 1 | | | 0.00 | 1 | | | 0.00 | 1 | | | 0.00 | 1 | | | 0.00 | 1 | | | 0.00 | 1 |
| | | | | | | | | | | | | | | | | | | | | | | | |
Total from investment operations | | | 0.00 | 1 | | | 0.00 | 1 | | | 0.00 | 1 | | | 0.00 | 1 | | | 0.00 | 1 | | | 0.00 | 1 |
Distributions to shareholders from | | | | | | | | | | | | | | | | | | | | | | | | |
Net investment income | | | (0.00 | )1 | | | (0.00 | )1 | | | (0.00 | )1 | | | (0.00 | )1 | | | (0.00 | )1 | | | (0.00 | )1 |
Net realized gains | | | 0.00 | | | | (0.00 | )1 | | | (0.00 | )1 | | | (0.00 | )1 | | | (0.00 | )1 | | | (0.00 | )1 |
| | | | | | | | | | | | | | | | | | | | | | | | |
Total distributions to shareholders | | | (0.00 | )1 | | | (0.00 | )1 | | | (0.00 | )1 | | | (0.00 | )1 | | | (0.00 | )1 | | | (0.00 | )1 |
Net asset value, end of period | | | $1.00 | | | | $1.00 | | | | $1.00 | | | | $1.00 | | | | $1.00 | | | | $1.00 | |
Total return2 | | | 0.01 | % | | | 0.02 | % | | | 0.02 | % | | | 0.02 | % | | | 0.02 | % | | | 0.02 | % |
Ratios to average net assets (annualized) | | | | | | | | | | | | | | | | | | | | | | | | |
Gross expenses | | | 0.53 | % | | | 0.53 | % | | | 0.52 | % | | | 0.53 | % | | | 0.53 | % | | | 0.53 | % |
Net expenses | | | 0.30 | % | | | 0.08 | % | | | 0.08 | % | | | 0.12 | % | | | 0.18 | % | | | 0.18 | % |
Net investment income | | | 0.01 | % | | | 0.01 | % | | | 0.02 | % | | | 0.01 | % | | | 0.01 | % | | | 0.01 | % |
Supplemental data | | | | | | | | | | | | | | | | | | | | | | | | |
Net assets, end of period (000s omitted) | | | $53,514 | | | | $162,593 | | | | $139,915 | | | | $166,178 | | | | $264,063 | | | | $673,405 | |
| 1 | Amount is less than $0.005. |
| 2 | Returns for periods of less than one year are not annualized. |
The accompanying notes are an integral part of these financial statements.
| | | | |
| 22 | | Wells Fargo National Tax-Free Money Market Fund | | Financial highlights |
(For a share outstanding throughout each period)
| | | | | | | | | | | | | | | | | | | | | | | | |
| | | Six months ended
July 31, 2016 (unaudited) | | | Year ended January 31 | |
| SWEEP CLASS | | | 2016 | | | 2015 | | | 2014 | | | 2013 | | | 2012 | |
Net asset value, beginning of period | | | $1.00 | | | | $1.00 | | | | $1.00 | | | | $1.00 | | | | $1.00 | | | | $1.00 | |
Net investment income | | | 0.00 | 1 | | | 0.00 | 1 | | | 0.00 | 1 | | | 0.00 | 1 | | | 0.00 | 1 | | | 0.00 | 1 |
Net realized gains on investments | | | 0.00 | 1 | | | 0.00 | 1 | | | 0.00 | 1 | | | 0.00 | 1 | | | 0.00 | 1 | | | 0.00 | 1 |
| | | | | | | | | | | | | | | | | | | | | | | | |
Total from investment operations | | | 0.00 | 1 | | | 0.00 | 1 | | | 0.00 | 1 | | | 0.00 | 1 | | | 0.00 | 1 | | | 0.00 | 1 |
Distributions to shareholders from | | | | | | | | | | | | | | | | | | | | | | | | |
Net investment income | | | (0.00 | )1 | | | (0.00 | )1 | | | (0.00 | )1 | | | (0.00 | )1 | | | (0.00 | )1 | | | (0.00 | )1 |
Net realized gains | | | 0.00 | | | | (0.00 | )1 | | | (0.00 | )1 | | | (0.00 | )1 | | | (0.00 | )1 | | | (0.00 | )1 |
| | | | | | | | | | | | | | | | | | | | | | | | |
Total distributions to shareholders | | | (0.00 | )1 | | | (0.00 | )1 | | | (0.00 | )1 | | | (0.00 | )1 | | | (0.00 | )1 | | | (0.00 | )1 |
Net asset value, end of period | | | $1.00 | | | | $1.00 | | | | $1.00 | | | | $1.00 | | | | $1.00 | | | | $1.00 | |
Total return2 | | | 0.00 | % | | | 0.02 | % | | | 0.02 | % | | | 0.02 | % | | | 0.02 | % | | | 0.02 | % |
Ratios to average net assets (annualized) | | | | | | | | | | | | | | | | | | | | | | | | |
Gross expenses | | | 0.98 | % | | | 0.98 | % | | | 0.98 | % | | | 0.98 | % | | | 0.98 | % | | | 0.98 | % |
Net expenses | | | 0.34 | % | | | 0.08 | % | | | 0.08 | % | | | 0.11 | % | | | 0.18 | % | | | 0.14 | % |
Net investment income | | | 0.01 | % | | | 0.01 | % | | | 0.01 | % | | | 0.01 | % | | | 0.01 | % | | | 0.01 | % |
Supplemental data | | | | | | | | | | | | | | | | | | | | | | | | |
Net assets, end of period (000s omitted) | | | $622,216 | | | | $642,770 | | | | $568,139 | | | | $590,518 | | | | $599,523 | | | | $566,501 | |
| 1 | Amount is less than $0.005. |
| 2 | Returns for periods of less than one year are not annualized. |
The accompanying notes are an integral part of these financial statements.
| | | | | | |
| Notes to financial statements (unaudited) | | Wells Fargo National Tax-Free Money Market Fund | | | 23 | |
1. ORGANIZATION
Wells Fargo Funds Trust (the “Trust”), a Delaware statutory trust organized on March 10, 1999, is an open-end management investment company registered under the Investment Company Act of 1940, as amended (the “1940 Act”). As an investment company, the Trust follows the accounting and reporting guidance in Financial Accounting Standards Board (“FASB”) Accounting Standards Codification Topic 946, Financial Services – Investment Companies. These financial statements report on the Wells Fargo National Tax-Free Money Market Fund (the “Fund”) which is a diversified series of the Trust.
2. SIGNIFICANT ACCOUNTING POLICIES
The following significant accounting policies, which are consistently followed in the preparation of the financial statements of the Fund, are in conformity with U.S. generally accepted accounting principles which require management to make estimates and assumptions that affect the reported amounts of assets and liabilities, disclosure of contingent assets and liabilities at the date of the financial statements, and the reported amounts of revenues and expenses during the reporting period. Actual results could differ from those estimates.
Securities valuation
As permitted under Rule 2a-7 of the 1940 Act, portfolio securities are valued at amortized cost, which approximates fair value. The amortized cost method involves valuing a security at its cost, plus accretion of discount or minus amortization of premium over the period until maturity.
Investments which are not valued using the method discussed above are valued at their fair value, as determined in good faith by the Board of Trustees of the Fund. The Board of Trustees has established a Valuation Committee comprised of the Trustees and has delegated to it the authority to take any actions regarding the valuation of portfolio securities that the Valuation Committee deems necessary or appropriate, including determining the fair value of portfolio securities, unless the determination has been delegated to the Management Valuation Team of Wells Fargo Funds Management, LLC (“Funds Management”). The Board of Trustees retains the authority to make or ratify any valuation decisions or approve any changes to the Valuation Procedures as it deems appropriate. On a quarterly basis, the Board of Trustees receives reports on any valuation actions taken by the Valuation Committee or the Management Valuation Team which may include items for ratification.
Valuations of fair valued securities are compared to the next actual sales price when available, or other appropriate market values, to assess the continued appropriateness of the fair valuation methodologies used. These securities are fair valued on a day-to-day basis, taking into consideration changes to appropriate market information and any significant changes to the inputs considered in the valuation process until there is a readily available price provided on an exchange or by an independent pricing service. Valuations received from an independent pricing service or independent broker-dealer quotes are periodically validated by comparisons to most recent trades and valuations provided by other independent pricing services in addition to the review of prices by the manager and/or subadviser. Unobservable inputs used in determining fair valuations are identified based on the type of security, taking into consideration factors utilized by market participants in valuing the investment, knowledge about the issuer and the current market environment.
Repurchase agreements
The Fund may invest in repurchase agreements and may participate in pooled repurchase agreement transactions with other funds advised by Funds Management. The repurchase agreements must be fully collateralized based on values that are marked-to-market daily. The collateral may be held by an agent bank under a tri-party agreement. It is the custodian’s responsibility to value collateral daily and to take action to obtain additional collateral as necessary to maintain market value equal to or greater than the resale price. The repurchase agreements are collateralized by instruments such as U.S. Treasury, federal agency, or high-grade corporate obligations. There could be potential loss to the Fund in the event that the Fund is delayed or prevented from exercising its rights to dispose of the collateral, including the risk of a possible decline in the value of the underlying obligations during the period in which the Fund seeks to assert its rights.
Security transactions and income recognition
Securities transactions are recorded on a trade date basis. Realized gains or losses are recorded on the basis of identified cost.
Interest income is accrued daily and bond discounts are accreted and premiums are amortized daily based on the effective interest method. To the extent debt obligations are placed on non-accrual status, any related interest income may be reduced by writing off interest receivables when the collection of all or a portion of interest has become doubtful based on consistently applied procedures. If the issuer subsequently resumes interest payments or when the collectability of interest is reasonably assured, the debt obligation is removed from non-accrual status.
| | | | |
| 24 | | Wells Fargo National Tax-Free Money Market Fund | | Notes to financial statements (unaudited) |
Distributions to shareholders
Distributions to shareholders from net investment income are accrued daily and paid monthly. Distributions from net realized gains, if any, are recorded on the ex-dividend date. Such distributions are determined in conformity with federal income tax regulations, which may differ in amount or character from net investment income and realized gains recognized for purposes of U.S. generally accepted accounting principles.
Federal and other taxes
The Fund intends to continue to qualify as a regulated investment company by distributing substantially all of its investment company taxable and tax-exempt income and any net realized capital gains (after reduction for capital loss carryforwards) sufficient to relieve it from all, or substantially all, federal income taxes. Accordingly, no provision for federal income taxes was required.
The Fund’s income and federal excise tax returns and all financial records supporting those returns for the prior three fiscal years are subject to examination by the federal and Delaware revenue authorities. Management has analyzed the Fund’s tax positions taken on federal, state, and foreign tax returns for all open tax years and does not believe that there are any uncertain tax positions that require recognition of a tax liability.
Class allocations
The separate classes of shares offered by the Fund differ principally in applicable sales charges, distribution, shareholder servicing, and administration fees. Class specific expenses are charged directly to that share class. Investment income, common expenses, and realized and unrealized gains (losses) on investments are allocated daily to each class of shares based on the relative proportion of net assets of each class.
3. FAIR VALUATION MEASUREMENTS
Fair value measurements of investments are determined within a framework that has established a fair value hierarchy based upon the various data inputs utilized in determining the value of the Fund’s investments. The three-level hierarchy gives the highest priority to unadjusted quoted prices in active markets for identical assets or liabilities (Level 1) and the lowest priority to significant unobservable inputs (Level 3). The Fund’s investments are classified within the fair value hierarchy based on the lowest level of input that is significant to the fair value measurement. The inputs are summarized into three broad levels as follows:
| n | | Level 1 – quoted prices in active markets for identical securities |
| n | | Level 2 – other significant observable inputs (including quoted prices for similar securities, interest rates, prepayment speeds, credit risk, use of amortized cost, etc.) |
| n | | Level 3 – significant unobservable inputs (including the Fund’s own assumptions in determining the fair value of investments) |
The inputs or methodologies used for valuing investments in securities are not necessarily an indication of the risk associated with investing in those securities.
At July 31, 2016, all of the Fund’s investments in securities were valued using Level 2 inputs since the primary inputs include the credit quality of the issuer and short-term interest rates (both of which are observable) in addition to the use of amortized cost.
The Fund recognizes transfers between levels within the fair value hierarchy at the end of the reporting period. At July 31, 2016, the Fund did not have any transfers into/out of Level 1, Level 2, or Level 3.
4. TRANSACTIONS WITH AFFILIATES
Management fee
Funds Management, an indirect wholly owned subsidiary of Wells Fargo & Company (“Wells Fargo”), is the manager of the Fund and provides advisory and fund-level administrative services under an investment management agreement. Under the investment management agreement, Funds Management is responsible for, among other services, implementing the investment objectives and strategies of the Fund, supervising the subadviser, providing fund-level administrative services in connection with the Fund’s operations, and providing any other fund-level administrative services reasonably necessary for the operation of the Fund. As compensation for its services under the investment management agreement, Funds Management is entitled to receive an annual management fee starting at 0.15% and declining to 0.13% as the average daily net assets of the Fund increase. For the six months ended July 31, 2016, the management fee was equivalent to an annual rate of 0.15% of the Fund’s average daily net assets.
| | | | | | |
| Notes to financial statements (unaudited) | | Wells Fargo National Tax-Free Money Market Fund | | | 25 | |
Funds Management has retained the services of a subadviser to provide daily portfolio management to the Fund. The fee for subadvisory services is borne by Funds Management. Wells Capital Management Incorporated, an affiliate of Funds Management and an indirect wholly owned subsidiary of Wells Fargo, is the subadviser to the Fund and is entitled to receive a fee from Funds Management at an annual rate starting at 0.05% and declining to 0.01% as the average daily net assets of the Fund increase.
Administration fees
Under a class-level administration agreement, Funds Management provides class-level administrative services to the Fund, which includes paying fees and expenses for services provided by the transfer agent, sub-transfer agents, omnibus account servicers and record-keepers. As compensation for its services under the class-level administration agreement, Funds Management receives an annual fee which is calculated based on the average daily net assets of each class as follows:
| | | | |
| | | Class-level
administration fee | |
Class A, Sweep Class | | | 0.22 | % |
Administrator Class | | | 0.10 | |
Premier Class1 | | | 0.08 | |
Service Class | | | 0.12 | |
| 1 | Effective April 1, 2016, Institutional Class was renamed Premier Class. |
Funds Management has contractually waived and/or reimbursed management and administration fees to the extent necessary to maintain certain net operating expense ratios for the Fund. Waiver of fees and/or reimbursement of expenses by Funds Management were made first from fund level expenses on a proportionate basis and then from class specific expenses. Funds Management has committed through May 31, 2017 to waive fees and/or reimburse expenses to the extent necessary to cap the Fund’s expenses at 0.65% for Class A shares, 0.30% for Administrator Class shares, 0.20% for Premier Class shares, 0.45% for Service Class shares, and 1.00% for Sweep Class shares. After this time, the cap may be increased or the commitment to maintain the cap may be terminated only with the approval of the Board of Trustees. During the six months ended July 31, 2016, Funds Management voluntarily waived additional expenses to maintain a positive yield.
Distribution fee
The Trust has adopted a distribution plan for Sweep Class shares of the Fund pursuant to Rule 12b-1 under the 1940 Act. A distribution fee is charged to Sweep Class shares and paid to Wells Fargo Funds Distributor, LLC, the principal underwriter, at an annual rate of 0.35% of the average daily net assets of Sweep Class shares.
Shareholder servicing fees
The Trust has entered into contracts with one or more shareholder servicing agents, whereby Class A, Service Class, and Sweep Class of the Fund are charged a fee at an annual rate of 0.25% of the respective average daily net assets of each class. Administrator Class is charged a fee at an annual rate of 0.10% of its average daily net assets.
A portion of these total shareholder servicing fees were paid to affiliates of Wells Fargo.
5. INDEMNIFICATION
Under the Trust’s organizational documents, the officers and Trustees have been granted certain indemnification rights against certain liabilities that may arise out of performance of their duties to the Trust. Additionally, in the normal course of business, the Trust may enter into contracts with service providers that contain a variety of indemnification clauses. The Trust’s maximum exposure under these arrangements is dependent on future claims that may be made against the Fund and, therefore, cannot be estimated.
6. MONEY MARKET FUND REFORM
On July 23, 2014, the Securities and Exchange Commission voted to amend Rule 2a-7 of the 1940 Act which governs the operations of registered money market funds. The amendments to Rule 2a-7 when implemented may, among other things, require the Fund to change the manner in which it values its securities, impose new liquidity fees on redemptions in certain circumstances, and permit the Fund to limit redemptions in certain circumstances. The amendments have staggered compliance dates. Compliance with a majority of these amendments will be required on October 14, 2016. Effective September 1, 2016, the Fund will be offered as a retail money market fund and continue to transact at a stable $1.00 net asset value (NAV).
| | | | |
| 26 | | Wells Fargo National Tax-Free Money Market Fund | | Other information (unaudited) |
PROXY VOTING INFORMATION
A description of the policies and procedures that the Fund uses to determine how to vote proxies relating to portfolio securities is available, upon request, by calling 1-800-222-8222, visiting our website at wellsfargofunds.com, or visiting the SEC website at sec.gov. Information regarding how the Fund voted proxies relating to portfolio securities during the most recent 12-month period ended June 30 is available on the Fund’s website at wellsfargofunds.com or by visiting the SEC website at sec.gov.
PORTFOLIO HOLDINGS INFORMATION
The complete portfolio holdings for the Fund are publicly available on the Fund’s website (wellsfargofunds.com) on a 1-day delayed basis. The Fund files its complete schedule of portfolio holdings with the SEC for the first and third quarters of each fiscal year on Form N-Q, which is available by visiting the SEC website at sec.gov. In addition, the Fund’s Form N-Q may be reviewed and copied at the SEC’s Public Reference Room in Washington, DC, and at regional offices in New York City, at 233 Broadway, and in Chicago, at 175 West Jackson Boulevard, Suite 900. Information about the Public Reference Room may be obtained by calling 1-800-SEC-0330.
| | | | | | |
| Other information (unaudited) | | Wells Fargo National Tax-Free Money Market Fund | | | 27 | |
BOARD OF TRUSTEES AND OFFICERS
Each of the Trustees and Officers1 listed in the table below acts in identical capacities for each fund in the Wells Fargo family of funds, which consists of 139 mutual funds comprising the Wells Fargo Funds Trust, Wells Fargo Variable Trust, Wells Fargo Master Trust and four closed-end funds (collectively the “Fund Complex”). This table should be read in conjunction with the Prospectus and the Statement of Additional Information2. The mailing address of each Trustee and Officer is 525 Market Street, 12th Floor, San Francisco, CA 94105. Each Trustee and Officer serves an indefinite term, however, each Trustee serves such term until reaching the mandatory retirement age established by the Trustees.
Independent Trustees
| | | | | | |
Name and year of birth | | Position held and length of service* | | Principal occupations during past five years or longer | | Current other public company or investment company directorships |
| William R. Ebsworth (Born 1957) | | Trustee, since 2015 | | Retired. From 1984 to 2013, equities analyst, portfolio manager, research director and chief financial officer at Fidelity Management and Research Company in Boston, Tokyo, and Hong Kong and retired in 2013 as Chief Investment Officer of Fidelity Strategic Advisers, Inc. where he lead a team of investment professionals managing client assets. Prior thereto, Board member of Hong Kong Securities Clearing Co., Hong Kong Options Clearing Corp., the Thailand International Fund, Ltd., Fidelity Investments Life Insurance Company, and Empire Fidelity Investments Life Insurance Company. Mr. Ebsworth is a CFA® charterholder and an Adjunct Lecturer, Finance, at Babson College. | | Asset Allocation Trust |
| Jane A. Freeman (Born 1953) | | Trustee, since 2015 | | Retired. From 2012 to 2014 and 1999 to 2008, Chief Financial Officer of Scientific Learning Corporation. From 2008 to 2012, Ms. Freeman provided consulting services related to strategic business projects. Prior to 1999, Portfolio Manager at Rockefeller & Co. and Scudder, Stevens & Clark. Board member of the Harding Loevner Funds from 1996 to 2014, serving as both Lead Independent Director and chair of the Audit Committee. Board member of the Russell Exchange Traded Funds Trust from 2011 to 2012 and the chair of the Audit Committee. Ms. Freeman is Chair of Taproot Foundation (non-profit organization), a Board Member of Ruth Bancroft Garden (non-profit organization) and an inactive chartered financial analyst. | | Asset Allocation Trust |
| Peter G. Gordon (Born 1942) | | Trustee, since 1998; Chairman, since 2005 | | Co-Founder, Retired Chairman, President and CEO of Crystal Geyser Water Company. Trustee Emeritus, Colby College. | | Asset Allocation Trust |
Isaiah Harris, Jr. (Born 1952) | | Trustee, since 2009 | | Retired. Chairman of the Board of CIGNA Corporation since 2009, and Director since 2005. From 2003 to 2011, Director of Deluxe Corporation. Prior thereto, President and CEO of BellSouth Advertising and Publishing Corp. from 2005 to 2007, President and CEO of BellSouth Enterprises from 2004 to 2005 and President of BellSouth Consumer Services from 2000 to 2003. Emeritus member of the Iowa State University Foundation Board of Governors. Emeritus Member of the Advisory Board of Iowa State University School of Business. Advisory Board Member, Palm Harbor Academy (charter school). Advisory Board Member, Child Evangelism Fellowship (non-profit). Mr. Harris is a certified public accountant (inactive status). | | CIGNA Corporation; Asset Allocation Trust |
| Judith M. Johnson (Born 1949) | | Trustee, since 2008; Audit Committee Chairman, since 2008 | | Retired. Prior thereto, Chief Executive Officer and Chief Investment Officer of Minneapolis Employees Retirement Fund from 1996 to 2008. Ms. Johnson is an attorney, certified public accountant and a certified managerial accountant. | | Asset Allocation Trust |
| David F. Larcker (Born 1950) | | Trustee, since 2009 | | James Irvin Miller Professor of Accounting at the Graduate School of Business, Stanford University, Director of the Corporate Governance Research Initiative and Senior Faculty of The Rock Center for Corporate Governance since 2006. From 2005 to 2008, Professor of Accounting at the Graduate School of Business, Stanford University. Prior thereto, Ernst & Young Professor of Accounting at The Wharton School, University of Pennsylvania from 1985 to 2005. | | Asset Allocation Trust |
| | | | |
| 28 | | Wells Fargo National Tax-Free Money Market Fund | | Other information (unaudited) |
| | | | | | |
Name and year of birth | | Position held and length of service* | | Principal occupations during past five years or longer | | Current other public company or investment company directorships |
| Olivia S. Mitchell (Born 1953) | | Trustee, since 2006 | | International Foundation of Employee Benefit Plans Professor, Wharton School of the University of Pennsylvania since 1993. Director of Wharton’s Pension Research Council and Boettner Center on Pensions & Retirement Research, and Research Associate at the National Bureau of Economic Research. Previously, Cornell University Professor from 1978 to 1993. | | Asset Allocation Trust |
| Timothy J. Penny (Born 1951) | | Trustee, since 1996 | | President and Chief Executive Officer of Southern Minnesota Initiative Foundation, a non-profit organization, since 2007 and Senior Fellow at the Humphrey Institute Policy Forum at the University of Minnesota since 1995. Member of the Board of Trustees of NorthStar Education Finance, Inc., a non-profit organization, since 2007. | | Asset Allocation Trust |
| Michael S. Scofield (Born 1943) | | Trustee, since 2010 | | Served on the Investment Company Institute’s Board of Governors and Executive Committee from 2008-2011 as well the Governing Council of the Independent Directors Council from 2006-2011 and the Independent Directors Council Executive Committee from 2008-2011. Chairman of the IDC from 2008-2010. Institutional Investor (Fund Directions) Trustee of Year in 2007. Trustee of the Evergreen Funds complex (and its predecessors) from 1984 to 2010. Chairman of the Evergreen Funds from 2000-2010. Former Trustee of the Mentor Funds. Retired Attorney, Law Offices of Michael S. Scofield. | | Asset Allocation Trust |
| * | Length of service dates reflect the Trustee’s commencement of service with the Trust’s predecessor entities, where applicable. |
Officers
| | | | | | |
Name and year of birth | | Position held and
length of service | | Principal occupations during past five years or longer | | |
Karla M. Rabusch (Born 1959) | | President, since 2003 | | Executive Vice President of Wells Fargo Bank, N.A. and President of Wells Fargo Funds Management, LLC since 2003. | | |
| Nancy Wiser1 (Born 1967) | | Treasurer, since 2012 | | Executive Vice President of Wells Fargo Funds Management, LLC since 2011. Chief Operating Officer and Chief Compliance Officer at LightBox Capital Management LLC, from 2008 to 2011. | | |
C. David Messman (Born 1960) | | Secretary, since 2000; Chief Legal Officer, since 2003 | | Senior Vice President and Secretary of Wells Fargo Funds Management, LLC since 2001. Assistant General Counsel of Wells Fargo Bank, N.A. since 2013 and Vice President and Managing Counsel of Wells Fargo Bank, N.A. from 1996 to 2013. | | |
Michael Whitaker (Born 1967) | | Chief Compliance Officer, since 2016* | | Executive Vice President of Wells Fargo Funds Management, LLC since 2016. Chief Compliance Officer of Fidelity’s Fixed Income Funds and Asset Allocation Funds from 2008 to 2016, Compliance Officer of FMR Co., Inc. from 2014 to 2016, Fidelity Investments Money Management, Inc. from 2014 to 2016, Fidelity Investments from 2007 to 2016. | | |
| David Berardi (Born 1975) | | Assistant Treasurer, since 2009 | | Vice President of Wells Fargo Funds Management, LLC since 2009. Vice President of Evergreen Investment Management Company, LLC from 2008 to 2010. Manager of Fund Reporting and Control for Evergreen Investment Management Company, LLC from 2004 to 2010. | | |
Jeremy DePalma1 (Born 1974) | | Assistant Treasurer, since 2009 | | Senior Vice President of Wells Fargo Funds Management, LLC since 2009. Senior Vice President of Evergreen Investment Management Company, LLC from 2008 to 2010 and head of the Fund Reporting and Control Team within Fund Administration from 2005 to 2010. | | |
| 1 | Nancy Wiser acts as Treasurer of 71 funds in the Fund Complex. Jeremy DePalma acts as Treasurer of 68 funds and Assistant Treasurer of 71 funds in the Fund Complex. |
| 2 | The Statement of Additional Information includes additional information about the Trustees and is available, without charge, upon request, by calling 1-800-222-8222 or by visiting the website at wellsfargofunds.com. |
| * | Michael Whitaker became Chief Compliance Officer effective May 16, 2016. |
| | | | | | |
| Other information (unaudited) | | Wells Fargo National Tax-Free Money Market Fund | | | 29 | |
BOARD CONSIDERATION OF INVESTMENT MANAGEMENT AND SUB-ADVISORY AGREEMENTS:
Under the Investment Company Act of 1940 (the “1940 Act”), the Board of Trustees (the “Board”) of Wells Fargo Funds Trust (the “Trust”) must determine annually whether to approve the continuation of the Trust’s investment management and sub-advisory agreements. In this regard, at an in-person meeting held on May 24-25, 2016 (the “Meeting”), the Board, all the members of which have no direct or indirect interest in the investment management and sub-advisory agreements and are not “interested persons” of the Trust, as defined in the 1940 Act (the “Independent Trustees”), reviewed and approved for Wells Fargo National Tax-Free Money Market Fund (the “Fund”): (i) an investment management agreement (the “Management Agreement”) with Wells Fargo Funds Management, LLC (“Funds Management”); and (ii) an investment sub-advisory agreement (the “Sub-Advisory Agreement”) with Wells Capital Management Incorporated (the “Sub-Adviser”), an affiliate of Funds Management. The Management Agreement and the Sub-Advisory Agreement are collectively referred to as the “Advisory Agreements.”
At the Meeting, the Board considered the factors and reached the conclusions described below relating to the selection of Funds Management and the Sub-Adviser and the approval of the Advisory Agreements. Prior to the Meeting, including at an in-person meeting in April 2016, the Trustees conferred extensively among themselves and with representatives of Funds Management about these matters. Also, the Board has adopted a team-based approach, with each team consisting of a sub-set of Trustees, to assist the full Board in the discharge of its duties in reviewing performance and other matters throughout the year. The Independent Trustees were assisted in their evaluation of the Advisory Agreements by independent legal counsel, from whom they received separate legal advice and with whom they met separately.
In providing information to the Board, Funds Management and the Sub-Adviser were guided by a detailed set of requests for information submitted to them by independent legal counsel on behalf of the Independent Trustees at the start of the Board’s annual contract renewal process earlier in 2016. In considering and approving the Advisory Agreements, the Trustees considered the information they believed relevant, including but not limited to the information discussed below. The Board considered not only the specific information presented in connection with the Meeting, but also the knowledge gained over time through interaction with Funds Management and the Sub-Adviser about various topics. In this regard, the Board reviewed reports of Funds Management at each of its quarterly meetings, which included, among other things, portfolio reviews and performance reports. In addition, the Board and the teams mentioned above confer with portfolio managers at various times throughout the year. The Board did not identify any particular information or consideration that was all-important or controlling, and each individual Trustee may have attributed different weights to various factors.
After its deliberations, the Board unanimously approved the continuation of the Advisory Agreements for a one-year term and determined that the compensation payable to Funds Management and the Sub-Adviser under each of the Advisory Agreements was reasonable. The Board considered the approval of the Advisory Agreements for the Fund as part of its consideration of agreements for funds across the complex, but its approvals were made on a fund-by-fund basis. The following summarizes a number of important, but not necessarily all, factors considered by the Board in support of its approvals.
Nature, extent and quality of services
The Board received and considered various information regarding the nature, extent and quality of services provided to the Fund by Funds Management and the Sub-Adviser under the Advisory Agreements. This information included a description of the investment advisory services and Fund-level administrative services covered by the Management Agreement, as well as, among other things, a summary of the background and experience of senior management of Funds Management, and the qualifications, background, tenure and responsibilities of each of the portfolio managers primarily responsible for the day-to-day portfolio management of the Fund.
The Board evaluated the ability of Funds Management and the Sub-Adviser to attract and retain qualified investment professionals, including research, advisory and supervisory personnel. The Board further considered the compliance programs and compliance records of Funds Management and the Sub-Adviser. In addition, the Board took into account the full range of services provided to the Fund by Funds Management and its affiliates.
Fund performance and expenses
The Board considered the performance results for the Fund over various time periods ended December 31, 2015. The Board considered these results in comparison to the performance of funds in a universe that was determined by Broadridge Inc. (“Broadridge”) to be similar to the Fund (the “Universe”) and in comparison to other comparative data. Broadridge is an independent provider of investment company data. The Board received a description of the methodology used by Broadridge to select the mutual funds in the performance Universe. The Board noted that the
| | | | |
| 30 | | Wells Fargo National Tax-Free Money Market Fund | | Other information (unaudited) |
performance of the Fund (Administrator Class) was higher than or equal to the average performance of the Universe for all periods under review. The Board noted that the Fund experienced a portfolio manager change in 2014.
The Board also received and considered information regarding the Fund’s net operating expense ratios and their various components, including actual management fees, custodian and other non-management fees, and Rule 12b-1 and non-Rule 12b-1 shareholder service fees. The Board considered these ratios in comparison to the median ratios of funds in class-specific expense groups that were determined by Broadridge to be similar to the Fund (the “Groups”). The Board received a description of the methodology used by Broadridge to select the mutual funds in the expense Groups and an explanation of how funds comprising expense groups and their expense ratios may vary from year-to-year. Based on the Broadridge reports, the Board noted that the net operating expense ratios of the Fund were lower than or equal to the median net operating expense ratios of the expense Groups.
The Board took into account the Fund performance and expense information provided to it among the factors considered in deciding to re-approve the Advisory Agreements.
Investment management and sub-advisory fee rates
The Board reviewed and considered the contractual fee rates payable by the Fund to Funds Management under the Management Agreement, as well as the contractual fee rates payable by the Fund to Funds Management for class-level administrative services under a Class-Level Administration Agreement, which include class-level transfer agency and sub-transfer agency costs (collectively, the “Management Rates”). The Board also reviewed and considered the contractual investment sub-advisory fee rates that are payable by Funds Management to the Sub-Adviser for investment sub-advisory services.
Among other information reviewed by the Board was a comparison of the Fund’s Management Rates with the average contractual investment management fee rates of funds in the expense Groups at a common asset level as well as transfer agency costs of the funds in the expense Groups. The Board noted that the Management Rates of the Fund were lower than or in range of the sum of these average rates for the Fund’s expense Groups for all share classes.
The Board also received and considered information about the portion of the total management fee that was retained by Funds Management after payment of the fee to the Sub-Adviser for sub-advisory services. In assessing the reasonableness of this amount, the Board received and evaluated information about the nature and extent of responsibilities retained and risks assumed by Funds Management and not delegated to or assumed by the Sub-Adviser, and about Funds Management’s on-going oversight services. However, given the affiliation between Funds Management and the Sub-Adviser, the Board ascribed limited relevance to the allocation of fees between them.
The Board also received and considered information about the nature and extent of services offered and fee rates charged by Funds Management and the Sub-Adviser to other types of clients with investment strategies similar to those of the Fund. In this regard, the Board received information about the significantly greater scope of services, and compliance, reporting and other legal burdens and risks of managing mutual funds compared with those associated with managing assets of non-mutual fund clients such as collective funds or institutional separate accounts.
Based on its consideration of the factors and information it deemed relevant, including those described here, the Board determined that the compensation payable to Funds Management under the Management Agreement and to the Sub-Adviser under the Sub-Advisory Agreement was reasonable, in light of the services covered by the Advisory Agreements.
Profitability
The Board received and considered information concerning the profitability of Funds Management, as well as the profitability of Wells Fargo as a whole, from providing services to the Fund and the fund family as a whole. The Board also received and considered information concerning the profitability of the Sub-Adviser from providing services to the fund family as a whole, noting that the Sub-Adviser’s profitability information with respect to providing services to the Fund was subsumed in the Wells Fargo and Funds Management profitability analysis.
Funds Management reported on the methodologies and estimates used in calculating profitability. Among other things, the Board noted that the levels of profitability reported on a fund-by-fund basis varied widely, depending on factors such as the size and type of fund. Based on its review, the Board did not deem the profits reported by Funds Management or Wells Fargo from its services to the Fund to be at a level that would prevent it from approving the continuation of the Advisory Agreements.
| | | | | | |
| Other information (unaudited) | | Wells Fargo National Tax-Free Money Market Fund | | | 31 | |
Economies of scale
With respect to possible economies of scale, the Board noted the existence of breakpoints in the Fund’s management fee structure, which operate generally to reduce the Fund’s expense ratios as the Fund grows in size. It considered that, for a small fund or a fund that shrinks in size, breakpoints conversely can result in higher fee levels. The Board also considered that fee waiver and expense reimbursement arrangements and competitive fee rates at the outset are means of sharing potential economies of scale with shareholders of the Fund and the fund family as a whole. The Board considered Funds Management’s view that any analyses of potential economies of scale in managing a particular fund are inherently limited in light of the joint and common costs and investments that Funds Management incurs across the fund family as a whole.
The Board concluded that the Fund’s fee and expense arrangements, including contractual breakpoints, constituted a reasonable approach to sharing potential economies of scale with the Fund and its shareholders.
Other benefits to Funds Management and the Sub-Adviser
The Board received and considered information regarding potential “fall-out” or ancillary benefits received by Funds Management and its affiliates, including the Sub-Adviser, as a result of their relationships with the Fund. Ancillary benefits could include, among others, benefits directly attributable to other relationships with the Fund and benefits potentially derived from an increase in Funds Management’s and the Sub-Adviser’s business as a result of their relationships with the Fund. The Board noted that various affiliates of Funds Management may receive distribution-related fees, shareholder servicing payments and sub-transfer agency fees in respect of shares sold or held through them and services provided.
The Board also reviewed information about soft dollar credits earned and utilized by the Sub-Adviser, fees earned by Funds Management and the Sub-Adviser from managing a private investment vehicle for the fund family’s securities lending collateral and commissions earned by an affiliated broker from portfolio transactions.
Based on its consideration of the factors and information it deemed relevant, including those described here, the Board did not find that any ancillary benefits received by Funds Management and its affiliates, including the Sub-Adviser, were unreasonable.
Conclusion
At the Meeting, after considering the above-described factors and based on its deliberations and its evaluation of the information described above, the Board unanimously approved the continuation of the Advisory Agreements for a one-year term and determined that the compensation payable to Funds Management and the Sub-Adviser under each of the Advisory Agreements was reasonable.
| | | | |
| 32 | | Wells Fargo National Tax-Free Money Market Fund | | List of abbreviations |
The following is a list of common abbreviations for terms and entities that may have appeared in this report.
| ACA | — ACA Financial Guaranty Corporation |
| ADR | — American depositary receipt |
| ADS | — American depositary shares |
| AGC | — Assured Guaranty Corporation |
| AGM | — Assured Guaranty Municipal |
| Ambac | — Ambac Financial Group Incorporated |
| AMT | — Alternative minimum tax |
| BAN | — Bond anticipation notes |
| BHAC | — Berkshire Hathaway Assurance Corporation |
| CAB | — Capital appreciation bond |
| CCAB | — Convertible capital appreciation bond |
| CDA | — Community Development Authority |
| CDO | — Collateralized debt obligation |
| DRIVER | — Derivative inverse tax-exempt receipts |
| DW&P | — Department of Water & Power |
| DWR | — Department of Water Resources |
| ECFA | — Educational & Cultural Facilities Authority |
| EDA | — Economic Development Authority |
| EDFA | — Economic Development Finance Authority |
| ETF | — Exchange-traded fund |
| FDIC | — Federal Deposit Insurance Corporation |
| FFCB | — Federal Farm Credit Banks |
| FGIC | — Financial Guaranty Insurance Corporation |
| FHA | — Federal Housing Administration |
| FHLB | — Federal Home Loan Bank |
| FHLMC | — Federal Home Loan Mortgage Corporation |
| FICO | — The Financing Corporation |
| FNMA | — Federal National Mortgage Association |
| GDR | — Global depositary receipt |
| GNMA | — Government National Mortgage Association |
| HCFR | — Healthcare facilities revenue |
| HEFA | — Health & Educational Facilities Authority |
| HEFAR | — Higher education facilities authority revenue |
| HFA | — Housing Finance Authority |
| HFFA | — Health Facilities Financing Authority |
| HUD | — Department of Housing and Urban Development |
| IDA | — Industrial Development Authority |
| IDAG | — Industrial Development Agency |
| KRW | — Republic of Korea won |
| LIBOR | — London Interbank Offered Rate |
| LIFER | — Long Inverse Floating Exempt Receipts |
| LLC | — Limited liability company |
| LLLP | — Limited liability limited partnership |
| LLP | — Limited liability partnership |
| MBIA | — Municipal Bond Insurance Association |
| MFHR | — Multifamily housing revenue |
| MSTR | — Municipal securities trust receipts |
| MUD | — Municipal Utility District |
| National | — National Public Finance Guarantee Corporation |
| PCFA | — Pollution Control Financing Authority |
| PCL | — Public Company Limited |
| PCR | — Pollution control revenue |
| PFA | — Public Finance Authority |
| PFFA | — Public Facilities Financing Authority |
| PFOTER | — Puttable floating option tax-exempt receipts |
| plc | — Public limited company |
| PUTTER | — Puttable tax-exempt receipts |
| R&D | — Research & development |
| Radian | — Radian Asset Assurance |
| RAN | — Revenue anticipation notes |
| RDA | — Redevelopment Authority |
| RDFA | — Redevelopment Finance Authority |
| REIT | — Real estate investment trust |
| ROC | — Reset option certificates |
| SAVRS | — Select auction variable rate securities |
| SBA | — Small Business Authority |
| SDR | — Swedish depositary receipt |
| SFHR | — Single-family housing revenue |
| SFMR | — Single-family mortgage revenue |
| SPA | — Standby purchase agreement |
| SPDR | — Standard & Poor’s Depositary Receipts |
| SPEAR | — Short Puttable Exempt Adjustable Receipts |
| STRIPS | — Separate trading of registered interest and |
| TAN | — Tax anticipation notes |
| TIPS | — Treasury inflation-protected securities |
| TRAN | — Tax revenue anticipation notes |
| TTFA | — Transportation Trust Fund Authority |
| TVA | — Tennessee Valley Authority |

For more information
More information about Wells Fargo Funds is available free upon request. To obtain literature, please write, email, visit the Fund’s website, or call:
Wells Fargo Funds
P.O. Box 8266
Boston, MA 02266-8266
Email: fundservice@wellsfargo.com
Website: wellsfargofunds.com
Individual investors: 1-800-222-8222
Retail investment professionals: 1-888-877-9275
Institutional investment professionals: 1-866-765-0778
This report and the financial statements contained herein are submitted for the general information of the shareholders of the Fund. If this report is used for promotional purposes, distribution of the report must be accompanied or preceded by a current prospectus. Before investing, please consider the investment objectives, risks, charges, and expenses of the investment. For a current prospectus and, if available, a summary prospectus, containing this information, call 1-800-222-8222 or visit the Fund’s website at wellsfargofunds.com. Read the prospectus carefully before you invest or send money.
Wells Fargo Asset Management (WFAM) is a trade name used by the asset management businesses of Wells Fargo & Company. Wells Fargo Funds Management, LLC, a wholly owned subsidiary of Wells Fargo & Company, provides investment advisory and administrative services for Wells Fargo Funds. Other affiliates of Wells Fargo & Company provide subadvisory and other services for the funds. The funds are distributed by Wells Fargo Funds Distributor, LLC, Member FINRA, an affiliate of Wells Fargo & Company.
NOT FDIC INSURED ¡ NO BANK GUARANTEE ¡ MAY LOSE VALUE
© 2016 Wells Fargo Funds Management, LLC. All rights reserved.
| | |
 | | 245338 09-16 SA309/SAR309 07-16 |
Semi-Annual Report
July 31, 2016

Institutional Money Market Funds

| n | | Wells Fargo Cash Investment Money Market Fund |

Reduce clutter. Save trees.
Sign up for electronic delivery of prospectuses and shareholder reports at wellsfargo.com/advantagedelivery
Contents
The views expressed and any forward-looking statements are as of July 31, 2016, unless otherwise noted, and are those of the Fund managers and/or Wells Fargo Funds Management, LLC. Discussions of individual securities, or the markets generally, or any Wells Fargo Fund are not intended as individual recommendations. Future events or results may vary significantly from those expressed in any forward-looking statements. The views expressed are subject to change at any time in response to changing circumstances in the market. Wells Fargo Funds Management, LLC and the Fund disclaim any obligation to publicly update or revise any views expressed or forward-looking statements.
NOT FDIC INSURED ¡ NO BANK GUARANTEE ¡ MAY LOSE VALUE
| | | | |
| 2 | | Wells Fargo Cash Investment Money Market Fund | | Letter to shareholders (unaudited) |

Karla M. Rabusch
President
Wells Fargo Funds
We do not anticipate broad changes to the way we manage our money market funds at this time in order to meet the new rules because we have always emphasized stability of principal and liquidity.
Dear Valued Shareholder:
We are pleased to offer you this semi-annual report for the Wells Fargo Cash Investment Money Market Fund for the six-month period that ended July 31, 2016. The period was marked by preparation for the new amendments to Rule 2a-7 of the Investment Company Act of 1940 (Rule 2a-7) by the U.S. Securities and Exchange Commission. Meanwhile, the U.S. Federal Reserve (Fed) kept the federal funds target rate between 0.25% and 0.50%.
We are preparing to implement the new money market fund regulations.
The amendments to Rule 2a-7, which governs money market funds, are scheduled to be fully implemented by October 2016. To recap, U.S. Treasury and government money market funds will continue to operate much as they do today, with stable $1.00 net asset values (NAVs). Meanwhile, tax-exempt and prime funds will experience more changes. For starters, these types of funds must separate retail investors, such as individuals, and institutional investors. Second, money market fund boards of directors will have discretion to impose either a liquidity fee of up to 2% on shareholder redemptions or a temporary suspension of redemptions (gate) if a fund’s weekly liquid assets fall below 30% of its total assets and the board determines that the fee or gate is in the best interest of the fund’s shareholders.
| | n | | Retail investors will continue to transact at a stable $1.00 NAV but may be subject to liquidity fees and redemption gates. | |
| | n | | Institutional prime and tax-exempt money market funds will transact at a floating, market-based NAV and may be subject to liquidity fees and redemption gates under special circumstances. Once floating NAVs are implemented, daily share prices will fluctuate along with changes, if any, in the market-based value of the underlying portfolio securities. Our Product Alert titled Wells Fargo Announces Effective Dates for Changes to Certain Money Market Funds featured the intraday price times we will use to continue providing same-day settlement and liquidity to our shareholders. | |
| | n | | Additional requirements included increased disclosure and reporting of fund statistics, such as percentage of liquid assets, shareholder flows, and market-based NAVs. In addition, the new regulations also included tighter diversification requirements and enhanced stress-testing measures. | |
| | n | | We will continue to communicate any changes to our money markets funds with our shareholders. Specifically, Product Alerts can be found at our website: wellsfargofunds.com. Click on Product Information and find them under the Product Alerts tab. | |
While there will be many operational changes ahead, we do not anticipate broad changes to the way we manage our money market funds at this time in order to meet the new rules because we have always emphasized stability of principal and liquidity.
Short-term rates remained steady but low.
The Fed kept the federal funds rate steady. On the growth side of its mandate, U.S. economic activity appeared to maintain a modest pace. Global concerns continued to confront the Fed as it tried to assess future conditions in the U.S. While China’s growth and its markets stabilized post first-quarter downdrafts, it continued to “face considerable challenges,” per Fed Chair Janet Yellen in her
| | | | | | |
| Letter to shareholders (unaudited) | | Wells Fargo Cash Investment Money Market Fund | | | 3 | |
monetary policy report to Congress. Further, although commodity prices rebounded from first-quarter lows, other worries remained. The strong dollar, which could hamper manufacturing and exports, is one factor. Another is potential fallout from Brexit, the referendum whereby the U.K. voted to leave the European Union. With growth and inflation low, Chair Yellen has argued in her monetary policy report that there is little room to cut rates further but plenty of scope to raise rates if inflation picks up too quickly.
With regard to Brexit, traditional risk assets—such as equities and foreign exchange—experienced volatility and U.S. Treasury securities benefited from a flight to quality. Money markets, however, were relatively immune to this volatility, with both credit spreads and liquidity little changed.
Don’t let short-term uncertainty derail long-term investment goals.
Periods of uncertainty can present challenges, but experience has taught us that maintaining long-term investment goals can be an effective way to plan for the future. To help you create a sound strategy based on your personal goals and risk tolerance, Wells Fargo Funds offers more than 100 mutual funds spanning a wide range of asset classes and investment styles. Although diversification cannot guarantee an investment profit or prevent losses, we believe it can be an effective way to manage investment risk and potentially smooth out overall portfolio performance. We encourage investors to know their investments and to understand that appropriate levels of risk-taking may unlock opportunities.
Thank you for choosing to invest in Wells Fargo Funds. We appreciate your confidence in us and remain committed to helping you meet your financial needs.
Sincerely,

Karla M. Rabusch
President
Wells Fargo Funds
Periods of uncertainty can present challenges, but experience has taught us that maintaining long-term investment goals can be an effective way to plan for the future.
Notice to shareholders
Effective on or before October 5 , 2016 (the “Effective Date”), the Fund will no longer maintain a stable $1.00 net asset value (“NAV”) and will instead transact at its market-based NAV, rounded to four decimal places. As of the Effective Date, the Fund will implement the following multiple intraday price times in order to continue providing same-day settlement and intraday liquidity. We will calculate the NAV at the following times each business day:
| | |
| Same-day settle (ET) | | Next-day settle (ET) |
9 a.m., 12 p.m., and 3 p.m. | | 5 p.m.* |
| * | | Next-day settlement only; daily dividends calculated using 5 p.m. NAV. |
As of the Effective Date, the Fund will also no longer support the following features:
| | n | | National Securities Clearing Corporation (NSCC) trading | |
| | n | | Automated Clearing House (ACH) trading | |
For further information about your Fund, contact your investment professional, visit our website at wellsfargofunds.com, or call us directly at 1-800-222-8222. We are available 24 hours a day, 7 days a week.
| | | | |
| 4 | | Wells Fargo Cash Investment Money Market Fund | | Performance highlights (unaudited) |
Investment objective
The Fund seeks current income, while preserving capital and liquidity.
Manager
Wells Fargo Funds Management, LLC
Subadvisers
Wells Capital Management Incorporated
Wells Capital Management Singapore
Portfolio managers
Michael C. Bird, CFA®
Jeffrey L. Weaver, CFA®
Laurie White
Average annual total returns (%) as of July 31, 20161
| | | | | | | | | | | | | | | | | | | | | | |
| | | | | | | | Expense ratios2 (%) | |
| | | Inception date | | 1 year | | | 5 year | | | 10 year | | | Gross | | | Net3 | |
| Administrator Class (WFAXX) | | 7-31-2003 | | | 0.14 | | | | 0.04 | | | | 1.04 | | | | 0.35 | | | | 0.35 | |
| Institutional Class (WFIXX) | | 10-14-1987 | | | 0.25 | | | | 0.08 | | | | 1.12 | | | | 0.23 | | | | 0.20 | |
| Select Class (WFQXX) | | 6-29-2007 | | | 0.32 | | | | 0.15 | | | | 1.19 | | | | 0.19 | | | | 0.13 | |
| Service Class (NWIXX) | | 10-14-1987 | | | 0.03 | | | | 0.01 | | | | 0.97 | | | | 0.52 | | | | 0.50 | |
Yield summary (%) as of July 31, 20163
| | | | | | | | | | | | | | |
| | | Administrator
Class | | Institutional
Class | | | Select
Class | | | Service
Class | |
| 7-day current yield | | 0.20 | | | 0.33 | | | | 0.40 | | | | 0.03 | |
| 7-day compound yield | | 0.20 | | | 0.33 | | | | 0.40 | | | | 0.03 | |
| 30-day simple yield | | 0.21 | | | 0.34 | | | | 0.41 | | | | 0.04 | |
| 30-day compound yield | | 0.21 | | | 0.34 | | | | 0.41 | | | | 0.04 | |
Figures quoted represent past performance, which is no guarantee of future results, and do not reflect taxes that a shareholder may pay on fund distributions or the redemption of fund shares. Investment returns will fluctuate. The Fund’s yield figures more closely reflect the current earnings of the Fund than the total return figures. Current performance may be lower or higher than the performance data quoted, which assumes the reinvestment of dividends and capital gains. Current month-end performance is available on the Fund’s website, wellsfargofunds.com.
Each class is sold without a front-end sales charge or contingent deferred sales charge.
An investment in a money market fund is not insured or guaranteed by the Federal Deposit Insurance Corporation or any other government agency. Although the Fund seeks to preserve the value of your investment at $1.00 per share, it is possible to lose money by investing in a money market fund.
Please see footnotes on page 5.
| | | | | | |
| Performance highlights (unaudited) | | Wells Fargo Cash Investment Money Market Fund | | | 5 | |
|
| Portfolio composition as of July 31, 20164 |
|
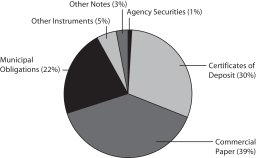 |
|
| Effective maturity distribution as of July 31, 20164 |
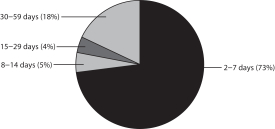 |
|
| Weighted average maturity as of July 31, 20165 |
10 days |
|
|
| Weighted average life as of July 31, 20166 |
14 days |
|
| 1 | Historical performance shown for Select Class shares prior to their inception reflects the performance of Institutional Class shares, and includes the higher expenses applicable to Institutional Class shares. If these expenses had not been included, returns would be higher. |
| 2 | Reflects the expense ratios as stated in the most recent prospectuses. The expense ratios shown are subject to change and may differ from the annualized expense ratios shown in the financial highlights of this report. |
| 3 | The manager has contractually committed through May 31, 2017, to waive fees and/or reimburse expenses to the extent necessary to cap the Fund’s Total Annual Fund Operating Expenses After Fee Waiver at the amounts shown. After this time, the cap may be increased or the commitment to maintain the cap may be terminated only with the approval of the Board of Trustees. Brokerage commissions, stamp duty fees, interest, taxes, acquired fund fees and expenses, and extraordinary expenses are excluded from the cap. Without this cap, the Fund’s returns would have been lower. Without waived fees and/or reimbursed expenses, the Fund’s 7-day current yield would have been 0.17%, 0.29%, 0.33%, and 0.00% for Administrator Class, Institutional Class, Select Class, and Service Class, respectively. |
| 4 | Amounts are calculated based on the total investments of the Fund. These amounts are subject to change and may have changed since the date specified. |
| 5 | Weighted Average Maturity (WAM): WAM is an average of the effective maturities of all securities held in the portfolio, weighted by each security’s percentage of total investments. The maturity of a portfolio security is the period remaining until the date on which the principal amount is unconditionally required to be paid, or in the case of a security called for redemption, the date on which the redemption payment is unconditionally required to be made. WAM calculations allow for the maturities of certain securities with demand features or periodic interest rate resets to be shortened. WAM is a way to measure a fund’s sensitivity to potential interest rate changes. Rule 2a-7 under the Investment Company Act of 1940 requires money market funds to maintain a WAM of 60 calendar days or less. WAM is subject to change and may have changed since the date specified. |
| 6 | Weighted Average Life (WAL): WAL is an average of the final maturities of all securities held in the portfolio, weighted by their percentage of total investments. The maturity of a portfolio security is the period remaining until the date on which the principal amount is unconditionally required to be paid, or in the case of a security called for redemption, the date on which the redemption payment is unconditionally required to be made. In contrast to WAM, the calculation of WAL allows for the maturities of certain securities with demand features to be shortened, but not the periodic interest rate resets. WAL is a way to measure a fund’s potential sensitivity to credit spread changes. Rule 2a-7 under the Investment Company Act of 1940 requires money market funds to maintain a WAL of 120 calendar days or less. WAL is subject to change and may have changed since the date specified. |
| | | | |
| 6 | | Wells Fargo Cash Investment Money Market Fund | | Fund expenses (unaudited) |
As a shareholder of the Fund, you incur ongoing costs, including management fees, shareholder servicing fees, and other Fund expenses. This example is intended to help you understand your ongoing costs (in dollars) of investing in the Fund and to compare these costs with the ongoing costs of investing in other mutual funds.
The example is based on an investment of $1,000 invested at the beginning of the six-month period and held for the entire period from February 1, 2016 to July 31, 2016.
Actual expenses
The “Actual” line of the table below provides information about actual account values and actual expenses. You may use the information in this line, together with the amount you invested, to estimate the expenses that you paid over the period. Simply divide your account value by $1,000 (for example, an $8,600 account value divided by $1,000 = 8.6), then multiply the result by the number in the “Actual” line under the heading entitled “Expenses paid during period” for your applicable class of shares to estimate the expenses you paid on your account during this period.
Hypothetical example for comparison purposes
The “Hypothetical” line of the table below provides information about hypothetical account values and hypothetical expenses based on the Fund’s actual expense ratio and an assumed rate of return of 5% per year before expenses, which is not the Fund’s actual return. The hypothetical account values and expenses may not be used to estimate the actual ending account balance or expenses you paid for the period. You may use this information to compare the ongoing costs of investing in the Fund and other funds. To do so, compare this 5% hypothetical example with the 5% hypothetical examples that appear in the shareholder reports of the other funds.
Please note that the expenses shown in the table are meant to highlight your ongoing costs only and do not reflect any transactional costs, such as sales charges (loads) and contingent deferred sales charges. Therefore, the “Hypothetical” line of the table is useful in comparing ongoing costs only and will not help you determine the relative total costs of owning different funds. In addition, if these transactional costs were included, your cost would have been higher.
| | | | | | | | | | | | | | | | |
| | | Beginning
account value
2-1-2016 | | | Ending
account value
7-31-2016 | | | Expenses
paid during
the period¹ | | | Annualized net
expense ratio | |
Administrator Class | | | | | | | | | | | | | | | | |
Actual | | $ | 1,000.00 | | | $ | 1,001.13 | | | $ | 1.65 | | | | 0.33 | % |
Hypothetical (5% return before expenses) | | $ | 1,000.00 | | | $ | 1,023.29 | | | $ | 1.66 | | | | 0.33 | % |
Institutional Class | | | | | | | | | | | | | | | | |
Actual | | $ | 1,000.00 | | | $ | 1,001.77 | | | $ | 1.00 | | | | 0.20 | % |
Hypothetical (5% return before expenses) | | $ | 1,000.00 | | | $ | 1,023.93 | | | $ | 1.01 | | | | 0.20 | % |
Select Class | | | | | | | | | | | | | | | | |
Actual | | $ | 1,000.00 | | | $ | 1,002.12 | | | $ | 0.65 | | | | 0.13 | % |
Hypothetical (5% return before expenses) | | $ | 1,000.00 | | | $ | 1,024.28 | | | $ | 0.66 | | | | 0.13 | % |
Service Class | | | | | | | | | | | | | | | | |
Actual | | $ | 1,000.00 | | | $ | 1,000.28 | | | $ | 2.49 | | | | 0.50 | % |
Hypothetical (5% return before expenses) | | $ | 1,000.00 | | | $ | 1,022.44 | | | $ | 2.52 | | | | 0.50 | % |
| 1 | Expenses paid is equal to the annualized net expense ratio of each class multiplied by the average account value over the period, multiplied by the number of days in the most recent fiscal half-year divided by the number of days in the fiscal year (to reflect the one-half-year period). |
| | | | | | |
| Portfolio of investments—July 31, 2016 (unaudited) | | Wells Fargo Cash Investment Money Market Fund | | | 7 | |
| | | | | | | | | | | | | | | | |
| Security name | | Interest rate | | | Maturity date | | | Principal | | | Value | |
| | | | |
Agency Securities: 1.37% | | | | | | | | | | | | | | | | |
FHLB (z) | | | 0.41 | % | | | 8-3-2016 | | | $ | 72,108,000 | | | $ | 72,106,353 | |
FHLMC Series M006 Class A ±§ | | | 0.54 | | | | 10-15-2045 | | | | 19,404,853 | | | | 19,404,853 | |
FHLMC Series M017 Class A 144A | | | 0.52 | | | | 9-15-2050 | | | | 20,000,000 | | | | 20,000,000 | |
| | | | |
Total Agency Securities (Cost $111,511,206) | | | | | | | | | | | | | | | 111,511,206 | |
| | | | | | | | | | | | | | | | |
| | | | |
Certificates of Deposit: 25.82% | | | | | | | | | | | | | | | | |
ABN AMRO Funding LLC | | | 0.40 | | | | 8-1-2016 | | | | 70,000,000 | | | | 70,000,000 | |
Australia & New Zealand Banking Group | | | 0.30 | | | | 8-1-2016 | | | | 101,000,000 | | | | 101,000,000 | |
Bank of Montreal | | | 0.44 | | | | 8-1-2016 | | | | 81,000,000 | | | | 81,000,000 | |
Bank of Montreal | | | 0.44 | | | | 8-2-2016 | | | | 85,000,000 | | | | 85,000,000 | |
Barclays Bank plc (z)144A | | | 0.68 | | | | 8-1-2016 | | | | 40,000,000 | | | | 40,000,000 | |
Barclays Bank plc (z)144A | | | 0.68 | | | | 8-5-2016 | | | | 19,000,000 | | | | 18,998,564 | |
Citibank (New York) | | | 0.55 | | | | 8-26-2016 | | | | 35,000,000 | | | | 35,000,000 | |
Cooperatieve Centrale ± | | | 0.82 | | | | 9-7-2016 | | | | 30,000,000 | | | | 30,000,000 | |
Credit Agricole SA | | | 0.32 | | | | 8-1-2016 | | | | 157,000,000 | | | | 157,000,000 | |
DG Bank (New York) | | | 0.62 | | | | 9-16-2016 | | | | 5,000,000 | | | | 4,999,489 | |
DG Bank (New York) | | | 0.65 | | | | 8-8-2016 | | | | 30,000,000 | | | | 30,000,000 | |
DNB Nor Bank ASA | | | 0.30 | | | | 8-1-2016 | | | | 175,000,000 | | | | 175,000,000 | |
HSBC Bank plc | | | 0.35 | | | | 8-1-2016 | | | | 160,000,000 | | | | 160,000,000 | |
HSBC Bank plc ± | | | 0.80 | | | | 8-1-2016 | | | | 25,000,000 | | | | 25,000,000 | |
KBC Bank | | | 0.32 | | | | 8-1-2016 | | | | 142,000,000 | | | | 142,000,000 | |
Mizuho Corporate Bank (z) | | | 0.50 | | | | 8-4-2016 | | | | 25,000,000 | | | | 24,998,959 | |
Mizuho Corporate Bank (z) | | | 0.72 | | | | 8-3-2016 | | | | 35,000,000 | | | | 34,998,603 | |
Mizuho Corporate Bank (z) | | | 0.75 | | | | 9-9-2016 | | | | 15,000,000 | | | | 14,987,835 | |
National Bank of Kuwait | | | 0.33 | | | | 8-1-2016 | | | | 105,000,000 | | | | 105,000,000 | |
National Bank of Canada | | | 0.30 | | | | 8-1-2016 | | | | 90,000,000 | | | | 90,000,000 | |
Natixis Corporation | | | 0.30 | | | | 8-1-2016 | | | | 77,000,000 | | | | 77,000,000 | |
NBAD Americas NV | | | 0.37 | | | | 8-1-2016 | | | | 134,000,000 | | | | 134,000,000 | |
Norinchukin Bank | | | 0.64 | | | | 9-15-2016 | | | | 20,000,000 | | | | 19,999,998 | |
Royal Bank of Canada | | | 0.35 | | | | 8-1-2016 | | | | 87,000,000 | | | | 87,000,000 | |
Standard Chartered Bank | | | 0.65 | | | | 8-22-2016 | | | | 15,000,000 | | | | 15,000,000 | |
State Street Bank & Trust Company ± | | | 0.82 | | | | 9-2-2016 | | | | 30,000,000 | | | | 30,000,000 | |
Sumitomo Mitsui Banking Corporation | | | 0.55 | | | | 9-7-2016 | | | | 20,000,000 | | | | 19,999,589 | |
Sumitomo Mitsui Banking Corporation | | | 0.62 | | | | 8-5-2016 | | | | 30,000,000 | | | | 30,000,000 | |
Sumitomo Mitsui Banking Corporation | | | 0.65 | | | | 8-10-2016 | | | | 20,000,000 | | | | 20,000,746 | |
Sumitomo Trust & Banking Corporation | | | 0.46 | | | | 8-1-2016 | | | | 70,000,000 | | | | 70,000,000 | |
Sumitomo Trust & Banking Corporation | | | 0.65 | | | | 9-23-2016 | | | | 30,000,000 | | | | 30,000,000 | |
Swedbank | | | 0.30 | | | | 8-1-2016 | | | | 143,000,000 | | | | 143,000,000 | |
| | | | |
Total Certificates of Deposit (Cost $2,100,983,783) | | | | | | | | | | | | | | | 2,100,983,783 | |
| | | | | | | | | | | | | | | | |
| | | | |
Commercial Paper: 33.88% | | | | | | | | | | | | | | | | |
| | | | |
| Asset-Backed Commercial Paper: 19.42% | | | | | | | | | | | | | | | | |
Alpine Securitization Limited (z)144A | | | 0.55 | | | | 8-8-2016 | | | | 10,000,000 | | | | 9,998,931 | |
Alpine Securitization Limited (z)144A | | | 0.57 | | | | 8-11-2016 | | | | 18,000,000 | | | | 17,997,150 | |
Alpine Securitization Limited (z)144A | | | 0.57 | | | | 8-12-2016 | | | | 13,000,000 | | | | 12,997,736 | |
Anglesea Funding LLC (z)144A | | | 0.50 | | | | 8-1-2016 | | | | 10,000,000 | | | | 10,000,000 | |
Anglesea Funding LLC 144A± | | | 0.62 | | | | 8-10-2016 | | | | 20,000,000 | | | | 20,000,000 | |
Anglesea Funding LLC 144A± | | | 0.62 | | | | 9-7-2016 | | | | 45,000,000 | | | | 45,000,000 | |
Anglesea Funding LLC 144A± | | | 0.63 | | | | 9-19-2016 | | | | 31,000,000 | | | | 31,000,000 | |
The accompanying notes are an integral part of these financial statements.
| | | | |
| 8 | | Wells Fargo Cash Investment Money Market Fund | | Portfolio of investments—July 31, 2016 (unaudited) |
| | | | | | | | | | | | | | | | |
| Security name | | Interest rate | | | Maturity date | | | Principal | | | Value | |
| | | | |
| Asset-Backed Commercial Paper (continued) | | | | | | | | | | | | | | | | |
Anglesea Funding LLC 144A± | | | 0.64 | % | | | 9-29-2016 | | | $ | 40,000,000 | | | $ | 40,000,000 | |
Anglesea Funding LLC 144A± | | | 0.65 | | | | 8-2-2016 | | | | 45,000,000 | | | | 45,000,000 | |
Antalis SA (z)144A | | | 0.70 | | | | 9-6-2016 | | | | 7,000,000 | | | | 6,995,100 | |
Antalis SA (z)144A | | | 0.70 | | | | 9-9-2016 | | | | 6,000,000 | | | | 5,995,450 | |
Atlantic Asset Securitization Corporation 144A± | | | 0.63 | | | | 12-5-2016 | | | | 40,000,000 | | | | 39,999,907 | |
Atlantic Asset Securitization Corporation 144A± | | | 0.63 | | | | 12-9-2016 | | | | 40,000,000 | | | | 39,999,774 | |
Atlantic Asset Securitization Corporation 144A± | | | 0.64 | | | | 12-16-2016 | | | | 40,000,000 | | | | 39,999,849 | |
Barton Capital Corporation (z)144A | | | 0.64 | | | | 9-7-2016 | | | | 20,000,000 | | | | 19,986,844 | |
Bedford Row Funding Corporation 144A± | | | 0.82 | | | | 8-1-2016 | | | | 30,000,000 | | | | 30,000,000 | |
Bennington Stark Capital Company LLC (z)144A | | | 0.50 | | | | 8-2-2016 | | | | 50,000,000 | | | | 49,999,306 | |
Bennington Stark Capital Company LLC (z)144A | | | 0.50 | | | | 8-3-2016 | | | | 10,000,000 | | | | 9,999,722 | |
Caisse D’amortissement De La D (z)144A | | | 0.68 | | | | 9-19-2016 | | | | 60,000,000 | | | | 59,944,875 | |
Cancara Asset Security Limited (z) | | | 0.56 | | | | 8-26-2016 | | | | 10,000,000 | | | | 9,996,111 | |
Chesham Finance Limited (z)144A | | | 0.50 | | | | 8-1-2016 | | | | 40,000,000 | | | | 40,000,000 | |
Concord Minutemen Capital Company (z)144A | | | 0.47 | | | | 8-4-2016 | | | | 30,000,000 | | | | 29,998,825 | |
Crown Point Capital Company LLC 144A± | | | 0.64 | | | | 8-22-2016 | | | | 21,000,000 | | | | 21,000,000 | |
Crown Point Capital Company LLC 144A± | | | 0.67 | | | | 11-7-2016 | | | | 50,000,000 | | | | 50,000,000 | |
Crown Point Capital Company LLC 144A± | | | 0.69 | | | | 10-25-2016 | | | | 50,000,000 | | | | 50,000,000 | |
DCAT LLC (z) | | | 0.65 | | | | 8-2-2016 | | | | 4,000,000 | | | | 3,999,928 | |
DCAT LLC (z) | | | 0.70 | | | | 8-22-2016 | | | | 4,000,000 | | | | 3,998,367 | |
Gotham Funding Corporation (z)144A | | | 0.54 | | | | 8-4-2016 | | | | 10,000,000 | | | | 9,999,550 | |
Gotham Funding Corporation (z)144A | | | 0.57 | | | | 8-10-2016 | | | | 12,000,000 | | | | 11,998,290 | |
Gotham Funding Corporation (z)144A | | | 0.58 | | | | 8-29-2016 | | | | 20,000,000 | | | | 19,990,978 | |
Gotham Funding Corporation (z)144A | | | 0.60 | | | | 8-26-2016 | | | | 16,000,000 | | | | 15,993,333 | |
Halkin Finance LLC (z)144A | | | 0.53 | | | | 8-1-2016 | | | | 25,000,000 | | | | 25,000,000 | |
Halkin Finance LLC (z)144A | | | 0.55 | | | | 8-3-2016 | | | | 20,000,000 | | | | 19,999,389 | |
Institutional Secured Funding LLC (z)144A | | | 0.55 | | | | 8-1-2016 | | | | 65,000,000 | | | | 65,000,000 | |
Institutional Secured Funding LLC (z)144A | | | 0.65 | | | | 8-12-2016 | | | | 10,000,000 | | | | 9,998,014 | |
Institutional Secured Funding LLC (z)144A | | | 0.65 | | | | 8-16-2016 | | | | 5,000,000 | | | | 4,998,646 | |
Institutional Secured Funding LLC (z)144A | | | 0.69 | | | | 9-1-2016 | | | | 30,000,000 | | | | 29,982,175 | |
Kells Funding LLC (z)144A | | | 0.59 | | | | 8-9-2016 | | | | 22,000,000 | | | | 21,997,116 | |
Kells Funding LLC (z)144A | | | 0.64 | | | | 9-20-2016 | | | | 10,000,000 | | | | 9,991,111 | |
Kells Funding LLC (z)144A | | | 0.64 | | | | 9-22-2016 | | | | 10,000,000 | | | | 9,990,756 | |
Lexington Parker Capital Company LLC (z)144A | | | 0.47 | | | | 8-1-2016 | | | | 25,000,000 | | | | 25,000,000 | |
Lexington Parker Capital Company LLC (z)144A | | | 0.47 | | | | 8-4-2016 | | | | 15,000,000 | | | | 14,999,413 | |
LMA Americas LLC (z)144A | | | 0.55 | | | | 9-2-2016 | | | | 16,000,000 | | | | 15,992,178 | |
LMA Americas LLC (z)144A | | | 0.56 | | | | 8-11-2016 | | | | 13,000,000 | | | | 12,997,978 | |
Manhattan Asset Funding Company LLC (z)144A | | | 0.54 | | | | 8-3-2016 | | | | 21,000,000 | | | | 20,999,370 | |
Matchpoint Finance plc (z)144A | | | 0.45 | | | | 8-1-2016 | | | | 11,000,000 | | | | 11,000,000 | |
Matchpoint Finance plc (z)144A | | | 0.68 | | | | 9-1-2016 | | | | 5,000,000 | | | | 4,997,072 | |
Mountcliff Funding LLC (z)144A | | | 0.51 | | | | 8-1-2016 | | | | 39,000,000 | | | | 39,000,000 | |
Nieuw Amsterdam Receivable (z)144A | | | 0.56 | | | | 8-17-2016 | | | | 5,000,000 | | | | 4,998,756 | |
Nieuw Amsterdam Receivable (z)144A | | | 0.70 | | | | 8-8-2016 | | | | 20,000,000 | | | | 19,997,278 | |
Nieuw Amsterdam Receivable (z)144A | | | 0.70 | | | | 8-22-2016 | | | | 22,000,000 | | | | 21,991,017 | |
Regency Markets No.1 LLC (z)144A | | | 0.55 | | | | 8-12-2016 | | | | 25,000,000 | | | | 24,995,799 | |
Regency Markets No.1 LLC (z)144A | | | 0.55 | | | | 8-31-2016 | | | | 25,000,000 | | | | 24,988,542 | |
Ridgefield Funding Company LLC 144A± | | | 0.68 | | | | 9-23-2016 | | | | 30,000,000 | | | | 30,000,000 | |
Sheffield Receivable (z)144A | | | 0.65 | | | | 8-4-2016 | | | | 38,000,000 | | | | 37,997,942 | |
Starbird Funding Corporation (z)144A | | | 0.63 | | | | 8-1-2016 | | | | 22,000,000 | | | | 22,000,000 | |
Starbird Funding Corporation (z)144A | | | 0.63 | | | | 8-2-2016 | | | | 10,000,000 | | | | 9,999,825 | |
The accompanying notes are an integral part of these financial statements.
| | | | | | |
| Portfolio of investments—July 31, 2016 (unaudited) | | Wells Fargo Cash Investment Money Market Fund | | | 9 | |
| | | | | | | | | | | | | | | | |
| Security name | | Interest rate | | | Maturity date | | | Principal | | | Value | |
| | | | |
| Asset-Backed Commercial Paper (continued) | | | | | | | | | | | | | | | | |
Starbird Funding Corporation (z)144A | | | 0.63 | % | | | 8-3-2016 | | | $ | 14,000,000 | | | $ | 13,999,510 | |
Starbird Funding Corporation (z)144A | | | 0.64 | | | | 8-10-2016 | | | | 19,000,000 | | | | 18,996,960 | |
Starbird Funding Corporation 144A± | | | 0.64 | | | | 9-16-2016 | | | | 32,000,000 | | | | 32,000,000 | |
Starbird Funding Corporation (z)144A | | | 0.68 | | | | 9-1-2016 | | | | 5,000,000 | | | | 4,997,072 | |
Versailles Commercial Paper LLC 144A± | | | 0.63 | | | | 12-8-2016 | | | | 30,000,000 | | | | 30,000,000 | |
Versailles Commercial Paper LLC (z)144A | | | 0.70 | | | | 8-1-2016 | | | | 30,000,000 | | | | 30,000,000 | |
Victory Receivables (z)144A | | | 0.54 | | | | 8-2-2016 | | | | 6,000,000 | | | | 5,999,910 | |
Victory Receivables (z)144A | | | 0.57 | | | | 8-22-2016 | | | | 14,000,000 | | | | 13,995,345 | |
Victory Receivables (z)144A | | | 0.58 | | | | 8-30-2016 | | | | 20,000,000 | | | | 19,990,656 | |
Victory Receivables (z)144A | | | 0.60 | | | | 8-25-2016 | | | | 14,000,000 | | | | 13,994,400 | |
Victory Receivables (z)144A | | | 0.60 | | | | 8-26-2016 | | | | 20,000,000 | | | | 19,991,667 | |
Victory Receivables (z)144A | | | 0.60 | | | | 9-7-2016 | | | | 15,000,000 | | | | 14,990,750 | |
Working Capital Management Company (z)144A | | | 0.58 | | | | 8-1-2016 | | | | 20,000,000 | | | | 20,000,000 | |
| | | | |
| | | | | | | | | | | | | | | 1,579,758,673 | |
| | | | | | | | | | | | | | | | |
| | | | |
| Financial Company Commercial Paper: 10.96% | | | | | | | | | | | | | | | | |
ANZ Banking Group Limited (z)144A | | | 0.57 | | | | 8-2-2016 | | | | 20,000,000 | | | | 19,999,683 | |
ANZ Banking Group Limited (z)144A | | | 0.65 | | | | 8-22-2016 | | | | 20,000,000 | | | | 19,992,417 | |
ANZ Banking Group Limited (z)144A | | | 0.65 | | | | 8-26-2016 | | | | 20,000,000 | | | | 19,990,972 | |
ANZ Banking Group Limited (z)144A | | | 0.65 | | | | 9-2-2016 | | | | 24,000,000 | | | | 23,986,133 | |
Banco de Credito e Inversiones (z)144A | | | 0.85 | | | | 8-29-2016 | | | | 30,000,000 | | | | 29,980,167 | |
Banco de Credito e Inversiones (z)144A | | | 0.85 | | | | 8-30-2016 | | | | 5,000,000 | | | | 4,996,576 | |
Bank of Nova Scotia (z)144A | | | 0.60 | | | | 9-21-2016 | | | | 15,000,000 | | | | 14,987,250 | |
Banque et Caisse d’Epargne de l’Etat (z) | | | 0.66 | | | | 9-1-2016 | | | | 20,000,000 | | | | 19,988,633 | |
BNP Paribas (New York) (z) | | | 0.78 | | | | 8-15-2016 | | | | 6,000,000 | | | | 5,998,180 | |
Caisse Centrale Desjardins du Quebec (z)144A | | | 0.40 | | | | 8-2-2016 | | | | 42,000,000 | | | | 41,999,533 | |
Caisse Centrale Desjardins du Quebec (z)144A | | | 0.52 | | | | 8-9-2016 | | | | 20,000,000 | | | | 19,997,689 | |
Caisse Centrale Desjardins du Quebec (z)144A | | | 0.55 | | | | 8-8-2016 | | | | 50,000,000 | | | | 49,994,633 | |
Caisse Centrale Desjardins du Quebec (z)144A | | | 0.63 | | | | 9-15-2016 | | | | 20,000,000 | | | | 19,984,250 | |
Caisse Centrale Desjardins du Quebec (z)144A | | | 0.65 | | | | 9-12-2016 | | | | 17,000,000 | | | | 16,987,108 | |
Caisse Centrale Desjardins du Quebec (z)144A | | | 0.67 | | | | 9-29-2016 | | | | 10,000,000 | | | | 9,989,019 | |
Commonwealth Bank of Australia (z)144A | | | 0.62 | | | | 9-6-2016 | | | | 12,000,000 | | | | 11,992,560 | |
Commonwealth Bank of Australia 144A± | | | 0.83 | | | | 8-17-2016 | | | | 30,000,000 | | | | 30,000,000 | |
Dexia Credit Local (z) | | | 0.65 | | | | 9-12-2016 | | | | 20,000,000 | | | | 19,984,833 | |
HSBC Bank plc (z)144A | | | 0.63 | | | | 9-9-2016 | | | | 14,000,000 | | | | 13,990,445 | |
Macquarie Bank Limited (z)144A | | | 0.55 | | | | 8-1-2016 | | | | 35,000,000 | | | | 35,000,000 | |
Macquarie Bank Limited (z)144A | | | 0.55 | | | | 8-18-2016 | | | | 15,000,000 | | | | 14,996,104 | |
Macquarie Bank Limited (z)144A | | | 0.55 | | | | 8-19-2016 | | | | 20,000,000 | | | | 19,994,500 | |
Macquarie Bank Limited (z)144A | | | 0.62 | | | | 9-6-2016 | | | | 42,000,000 | | | | 41,973,960 | |
Macquarie Bank Limited (z)144A | | | 0.64 | | | | 9-1-2016 | | | | 10,000,000 | | | | 9,994,489 | |
Macquarie Bank Limited (z)144A | | | 0.65 | | | | 9-7-2016 | | | | 20,000,000 | | | | 19,986,742 | |
National Australia Bank Limited 144A± | | | 0.80 | | | | 8-4-2016 | | | | 40,000,000 | | | | 40,000,000 | |
National Securities Clearing Corporation (z)144A | | | 0.50 | | | | 8-8-2016 | | | | 5,000,000 | | | | 4,999,514 | |
Nationwide Building Society (z)144A | | | 0.64 | | | | 8-15-2016 | | | | 15,000,000 | | | | 14,996,267 | |
Nationwide Building Society (z)144A | | | 0.70 | | | | 9-2-2016 | | | | 26,000,000 | | | | 25,983,822 | |
Nederlandse Waterschapsbank NV (z)144A | | | 0.56 | | | | 8-8-2016 | | | | 44,000,000 | | | | 43,995,209 | |
Nederlandse Waterschapsbank NV (z)144A | | | 0.63 | | | | 9-1-2016 | | | | 43,000,000 | | | | 42,976,858 | |
NRW Bank (z)144A | | | 0.44 | | | | 8-2-2016 | | | | 32,000,000 | | | | 31,999,609 | |
NRW Bank (z)144A | | | 0.61 | | | | 9-16-2016 | | | | 25,000,000 | | | | 24,980,514 | |
NV Bank Nederlandse Gemeenten (z)144A | | | 0.63 | | | | 8-31-2016 | | | | 45,000,000 | | | | 44,976,375 | |
The accompanying notes are an integral part of these financial statements.
| | | | |
| 10 | | Wells Fargo Cash Investment Money Market Fund | | Portfolio of investments—July 31, 2016 (unaudited) |
| | | | | | | | | | | | | | | | |
| Security name | | Interest rate | | | Maturity date | | | Principal | | | Value | |
| | | | |
| Financial Company Commercial Paper (continued) | | | | | | | | | | | | | | | | |
Ontario Teachers Finance Trust (z)144A | | | 0.66 | % | | | 9-21-2016 | | | $ | 13,000,000 | | | $ | 12,987,845 | |
PSP Capital Incorporated (z)144A | | | 0.60 | | | | 9-14-2016 | | | | 2,000,000 | | | | 1,998,533 | |
PSP Capital Incorporated (z)144A | | | 0.60 | | | | 9-19-2016 | | | | 7,000,000 | | | | 6,994,283 | |
Shagang South Asia Trading Company (z) | | | 1.00 | | | | 8-4-2016 | | | | 35,000,000 | | | | 34,997,083 | |
Suncorp Group Limited (z)144A | | | 0.74 | | | | 9-6-2016 | | | | 12,000,000 | | | | 11,991,120 | |
Suncorp Group Limited (z)144A | | | 0.75 | | | | 9-12-2016 | | | | 11,000,000 | | | | 10,990,375 | |
| | | | |
| | | | | | | | | | | | | | | 891,653,283 | |
| | | | | | | | | | | | | | | | |
| | | | |
| Other Commercial Paper: 3.50% | | | | | | | | | | | | | | | | |
Caisse Des Depots et Consignations (z)144A | | | 0.49 | | | | 8-2-2016 | | | | 15,000,000 | | | | 14,999,796 | |
China International Marine Containers (z) | | | 1.00 | | | | 8-2-2016 | | | | 40,000,000 | | | | 39,998,889 | |
China International Marine Containers (z) | | | 1.00 | | | | 8-3-2016 | | | | 12,000,000 | | | | 11,999,333 | |
China Power International Development (z) | | | 1.00 | | | | 8-3-2016 | | | | 10,000,000 | | | | 9,999,444 | |
China Shipping Container Lines (z) | | | 1.00 | | | | 8-1-2016 | | | | 80,000,000 | | | | 80,000,000 | |
Erste Abwicklungsanstalt (z)144A | | | 0.66 | | | | 8-17-2016 | | | | 10,000,000 | | | | 9,997,067 | |
Erste Abwicklungsanstalt (z)144A | | | 0.66 | | | | 8-22-2016 | | | | 18,000,000 | | | | 17,993,070 | |
Sinochem Capital Company Limited (z) | | | 0.47 | | | | 8-1-2016 | | | | 30,000,000 | | | | 30,000,000 | |
Sinochem Capital Company Limited (z) | | | 0.47 | | | | 8-9-2016 | | | | 30,000,000 | | | | 29,996,867 | |
Toyota Motor Credit Corporation (z) | | | 0.60 | | | | 8-3-2016 | | | | 40,000,000 | | | | 39,998,667 | |
| | | | |
| | | | | | | | | | | | | | | 284,983,133 | |
| | | | | | | | | | | | | | | | |
| | | | |
Total Commercial Paper (Cost $2,756,395,089) | | | | | | | | | | | | | | | 2,756,395,089 | |
| | | | | | | | | | | | | | | | |
| | | | |
Municipal Obligations: 18.60% | | | | | | | | | | | | | | | | |
| | | | |
Alabama: 0.09% | | | | | | | | | | | | | | | | |
| | | | |
| Variable Rate Demand Note ø: 0.09% | | | | | | | | | | | | | | | | |
Tuscaloosa County AL IDA Gulf Opportunity Zone Hunt Refining Project Series J (Industrial Development Revenue, Bank of Nova Scotia LOC) | | | 0.46 | | | | 4-1-2028 | | | | 7,000,000 | | | | 7,000,000 | |
| | | | | | | | | | | | | | | | |
| | | | |
Arizona: 0.35% | | | | | | | | | | | | | | | | |
| | | | |
| Other Municipal Debt: 0.21% | | | | | | | | | | | | | | | | |
Salt River Project Agricultural Improvement & Power District Series D1 (Utilities Revenue) (z) | | | 0.52 | | | | 8-10-2016 | | | | 12,000,000 | | | | 11,998,440 | |
Salt River Project Agricultural Improvement & Power District Series D1 (Utilities Revenue) (z) | | | 0.52 | | | | 8-11-2016 | | | | 5,000,000 | | | | 4,999,278 | |
| | | | |
| | | | | | | | | | | | | | | 16,997,718 | |
| | | | | | | | | | | | | | | | |
| | | | |
| Variable Rate Demand Note ø: 0.14% | | | | | | | | | | | | | | | | |
Phoenix AZ IDA Del Mar Terrace Series A (Housing Revenue, FHLMC LIQ) | | | 0.45 | | | | 10-1-2029 | | | | 11,520,000 | | | | 11,520,000 | |
| | | | | | | | | | | | | | | | |
| | | | |
Arkansas: 0.24% | | | | | | | | | | | | | | | | |
| | | | |
| Variable Rate Demand Note ø: 0.24% | | | | | | | | | | | | | | | | |
Maumelle AR Taxable Variable Kimberly Clark Corporation (Industrial Development Revenue) 144A | | | 0.47 | | | | 8-1-2045 | | | | 19,700,000 | | | | 19,700,000 | |
| | | | | | | | | | | | | | | | |
| | | | |
California: 0.95% | | | | | | | | | | | | | | | | |
| | | | |
| Variable Rate Demand Notes ø: 0.95% | | | | | | | | | | | | | | | | |
Puttable Floating Option Taxable Series PT-4699 (Health Revenue, National Insured, Bank of America NA LIQ) 144A | | | 0.61 | | | | 9-1-2028 | | | | 16,610,000 | | | | 16,610,000 | |
The accompanying notes are an integral part of these financial statements.
| | | | | | |
| Portfolio of investments—July 31, 2016 (unaudited) | | Wells Fargo Cash Investment Money Market Fund | | | 11 | |
| | | | | | | | | | | | | | | | |
| Security name | | Interest rate | | | Maturity date | | | Principal | | | Value | |
| | | | |
| Variable Rate Demand Notes ø (continued) | | | | | | | | | | | | | | | | |
San Diego County CA Regional Transportation Community Limited Tax Series B (Tax Revenue, JPMorgan Chase & Company SPA) | | | 0.43 | % | | | 4-1-2038 | | | $ | 15,000,000 | | | $ | 15,000,000 | |
San Diego County CA Water Authority (Water & Sewer Revenue) | | | 0.44 | | | | 9-8-2016 | | | | 5,000,000 | | | | 4,999,140 | |
San Francisco CA City & County Airports Commission Variable Reference Second Series A-1 (Airport Revenue, Bank of America NA LOC) | | | 0.44 | | | | 5-1-2030 | | | | 30,000,000 | | | | 30,000,000 | |
San Francisco CA City & County Airports Commission Variable Reference Second Series A-2 (Airport Revenue, Bank of America NA LOC) | | | 0.44 | | | | 5-1-2030 | | | | 8,965,000 | | | | 8,965,000 | |
San Francisco CA City & County Certificate of Participation Series B001 (Miscellaneous Revenue, Morgan Stanley Bank LIQ) 144A | | | 0.54 | | | | 11-1-2041 | | | | 2,000,000 | | | | 2,000,000 | |
| | | | |
| | | | | | | | | | | | | | | 77,574,140 | |
| | | | | | | | | | | | | | | | |
| | | | |
Colorado: 0.80% | | | | | | | | | | | | | | | | |
| | | | |
| Variable Rate Demand Notes ø: 0.80% | | | | | | | | | | | | | | | | |
Colorado HFA Catholic Health Initiatives Series 7WE (Health Revenue, Barclays Bank plc LOC) 144A | | | 0.59 | | | | 8-1-2018 | | | | 32,290,000 | | | | 32,290,000 | |
Colorado HFA MFHR Project B-2 (Housing Revenue, FHLB SPA) | | | 0.48 | | | | 5-1-2052 | | | | 32,740,000 | | | | 32,740,000 | |
| | | | |
| | | | | | | | | | | | | | | 65,030,000 | |
| | | | | | | | | | | | | | | | |
| | | | |
Connecticut: 2.65% | | | | | | | | | | | | | | | | |
| | | | |
| Variable Rate Demand Notes ø: 2.65% | | | | | | | | | | | | | | | | |
Connecticut Series C (GO Revenue, Bank of America NA SPA) | | | 0.45 | | | | 5-15-2034 | | | | 26,000,000 | | | | 26,000,000 | |
Puttable Floating Option Taxable Series TNP-1013 (Miscellaneous Revenue, Bank of America NA LIQ) 144A | | | 0.55 | | | | 4-15-2046 | | | | 189,560,000 | | | | 189,560,000 | |
| | | | |
| | | | | | | | | | | | | | | 215,560,000 | |
| | | | | | | | | | | | | | | | |
| | | | |
District of Columbia: 1.61% | | | | | | | | | | | | | | | | |
| | | | |
| Variable Rate Demand Notes ø: 1.61% | | | | | | | | | | | | | | | | |
Howard University (Education Revenue) | | | 0.54 | | | | 8-1-2031 | | | | 120,000,000 | | | | 120,000,000 | |
Metropolitan Washington District of Columbia Airports Sub Series A-1 (Airport Revenue, Royal Bank of Canada LOC) | | | 0.46 | | | | 10-1-2039 | | | | 11,000,000 | | | | 11,000,000 | |
| | | | |
| | | | | | | | | | | | | | | 131,000,000 | |
| | | | | | | | | | | | | | | | |
| | | | |
Florida: 0.23% | | | | | | | | | | | | | | | | |
| | | | |
| Variable Rate Demand Notes ø: 0.23% | | | | | | | | | | | | | | | | |
Manatee County FL HFA Village at Cortez Apartments Series A (Housing Revenue, FNMA Insured, FNMA LIQ) | | | 0.47 | | | | 1-15-2037 | | | | 10,200,000 | | | | 10,200,000 | |
West Palm Beach FL Utilities Systems Series C (Water & Sewer Revenue, AGC Insured, JPMorgan Chase & Company SPA) | | | 0.47 | | | | 10-1-2038 | | | | 8,300,000 | | | | 8,300,000 | |
| | | | |
| | | | | | | | | | | | | | | 18,500,000 | |
| | | | | | | | | | | | | | | | |
| | | | |
Georgia: 0.35% | | | | | | | | | | | | | | | | |
| | | | |
| Other Municipal Debt: 0.09% | | | | | | | | | | | | | | | | |
Georgia Municipal Electricity Authority (Utilities Revenue) | | | 0.52 | | | | 8-12-2016 | | | | 7,000,000 | | | | 7,000,000 | |
| | | | | | | | | | | | | | | | |
| | | | |
| Variable Rate Demand Note ø: 0.26% | | | | | | | | | | | | | | | | |
Columbus GA Housing Development Authority Puttable Floating Option Taxable Notes Series TN-024 (Housing Revenue, ACA Insured, Bank of America NA LIQ) 144A | | | 0.74 | | | | 10-1-2039 | | | | 21,570,000 | | | | 21,570,000 | |
| | | | | | | | | | | | | | | | |
The accompanying notes are an integral part of these financial statements.
| | | | |
| 12 | | Wells Fargo Cash Investment Money Market Fund | | Portfolio of investments—July 31, 2016 (unaudited) |
| | | | | | | | | | | | | | | | |
| Security name | | Interest rate | | | Maturity date | | | Principal | | | Value | |
| | | | |
Idaho: 0.17% | | | | | | | | | | | | | | | | |
| | | | |
| Other Municipal Debt: 0.17% | | | | | | | | | | | | | | | | |
Idaho HFA (Housing Revenue) (z) | | | 0.64 | % | | | 8-5-2016 | | | $ | 13,500,000 | | | $ | 13,499,036 | |
| | | | | | | | | | | | | | | | |
| | | | |
Illinois: 1.36% | | | | | | | | | | | | | | | | |
| | | | |
| Variable Rate Demand Note ø: 1.36% | | | | | | | | | | | | | | | | |
Cook County IL Taxable Variable Series D (GO Revenue, Barclays Bank plc LOC) | | | 0.54 | | | | 11-1-2030 | | | | 100,000,000 | | | | 100,000,000 | |
IIllinois Education Facility Authority (Education Revenue, PNC Bank NA LOC) | | | 0.45 | | | | 9-1-2042 | | | | 10,400,000 | | | | 10,400,000 | |
| | | | |
| | | | | | | | | | | | | | | 110,400,000 | |
| | | | | | | | | | | | | | | | |
| | | | |
Louisiana: 1.08% | | | | | | | | | | | | | | | | |
| | | | |
| Variable Rate Demand Note ø: 1.08% | | | | | | | | | | | | | | | | |
Puttable Floating Option Taxable Series TNP-1014 (Miscellaneous Revenue, Bank of America NA LIQ) 144A | | | 0.55 | | | | 6-1-2045 | | | | 88,120,000 | | | | 88,120,000 | |
| | | | | | | | | | | | | | | | |
| | | | |
Maryland: 0.89% | | | | | | | | | | | | | | | | |
| | | | |
| Variable Rate Demand Notes ø: 0.89% | | | | | | | | | | | | | | | | |
Maryland CDA Housing & Community Residential Series B (Housing Revenue, TD Bank NA SPA) | | | 0.47 | | | | 9-1-2033 | | | | 40,000,000 | | | | 40,000,000 | |
Maryland CDA Housing & Community Residential Series F (Housing Revenue, State Street Bank & Trust Company SPA) | | | 0.47 | | | | 9-1-2044 | | | | 22,590,000 | | | | 22,590,000 | |
Maryland CDA Housing & Community Residential Series M (Housing Revenue, TD Bank NA SPA) | | | 0.43 | | | | 9-1-2043 | | | | 9,750,000 | | | | 9,750,000 | |
| | | | |
| | | | | | | | | | | | | | | 72,340,000 | |
| | | | | | | | | | | | | | | | |
| | | | |
Massachusetts: 0.64% | | | | | | | | | | | | | | | | |
| | | | |
| Variable Rate Demand Notes ø: 0.64% | | | | | | | | | | | | | | | | |
Massachusetts Department of Transportation Series A6 (Transportation Revenue, TD Bank NA SPA) | | | 0.46 | | | | 1-1-2029 | | | | 37,425,000 | | | | 37,425,000 | |
Massachusetts Department of Transportation Series A7 (Transportation Revenue, Sumitomo Mitsui Banking SPA) | | | 0.49 | | | | 1-1-2039 | | | | 15,000,000 | | | | 15,000,000 | |
| | | | |
| | | | | | | | | | | | | | | 52,425,000 | |
| | | | | | | | | | | | | | | | |
| | | | |
Michigan: 0.06% | | | | | | | | | | | | | | | | |
| | | | |
| Variable Rate Demand Note ø: 0.06% | | | | | | | | | | | | | | | | |
Michigan Housing Development Authority Series D (Housing Revenue, Bank of Tokyo-Mitsubishi SPA) | | | 0.51 | | | | 10-1-2039 | | | | 5,000,000 | | | | 5,000,000 | |
| | | | | | | | | | | | | | | | |
| | | | |
Minnesota: 0.27% | | | | | | | | | | | | | | | | |
| | | | |
| Variable Rate Demand Notes ø: 0.27% | | | | | | | | | | | | | | | | |
NorthStar Student Loan Trust II (Education Revenue, Royal Bank of Canada LOC) | | | 0.45 | | | | 10-1-2042 | | | | 11,397,000 | | | | 11,397,000 | |
RBC Municipal Products Incorporated Trust Floater CTFS Series E-69 (Housing Revenue, Royal Bank of Canada LOC) 144A | | | 0.48 | | | | 5-31-2018 | | | | 10,250,000 | | | | 10,250,000 | |
| | | | |
| | | | | | | | | | | | | | | 21,647,000 | |
| | | | | | | | | | | | | | | | |
| | | | |
Missouri: 0.13% | | | | | | | | | | | | | | | | |
| | | | |
| Variable Rate Demand Note ø: 0.13% | | | | | | | | | | | | | | | | |
Puttable Floating Option Taxable Series TN-044 (Education Revenue, Bank of America NA LIQ) 144A | | | 0.65 | | | | 11-26-2032 | | | | 10,615,000 | | | | 10,615,000 | |
| | | | | | | | | | | | | | | | |
The accompanying notes are an integral part of these financial statements.
| | | | | | |
| Portfolio of investments—July 31, 2016 (unaudited) | | Wells Fargo Cash Investment Money Market Fund | | | 13 | |
| | | | | | | | | | | | | | | | |
| Security name | | Interest rate | | | Maturity date | | | Principal | | | Value | |
| | | | |
New York: 1.66% | | | | | | | | | | | | | | | | |
| | | | |
| Variable Rate Demand Notes ø: 1.66% | | | | | | | | | | | | | | | | |
New York Dormitory Authority Debt City University Consolidated 5th General Resolution Series E (Education Revenue, TD Bank NA LOC) | | | 0.43 | % | | | 7-1-2031 | | | $ | 5,000,000 | | | $ | 5,000,000 | |
New York HFA 605 West 42 Street Series B (Housing Revenue, Bank of China LOC) | | | 0.83 | | | | 5-1-2048 | | | | 35,000,000 | | | | 35,000,000 | |
New York HFA Manhattan West Residential Housing Series B-2 (Housing Revenue, Bank of China LOC) | | | 1.05 | | | | 11-1-2049 | | | | 8,000,000 | | | | 8,000,000 | |
New York HFA Biltmore Tower (Housing Revenue, FNMA Insured, FNMA LIQ) | | | 0.48 | | | | 5-15-2034 | | | | 12,000,000 | | | | 12,000,000 | |
New York HFA Taxable Variable 222 East 44TH Street Series B (Housing Revenue, Bank of China LOC) | | | 0.84 | | | | 5-1-2050 | | | | 25,000,000 | | | | 25,000,000 | |
New York Metropolitan Transportation Authority Sub Series G-2 (Transportation Revenue, TD Bank NA LOC) | | | 0.49 | | | | 11-1-2032 | | | | 20,000,000 | | | | 20,000,000 | |
New York Municipal Water Finance Authority Series T-30001-I (Water & Sewer Revenue, Citibank NA LIQ) 144A | | | 0.48 | | | | 6-15-2044 | | | | 15,000,000 | | | | 15,000,000 | |
RBC Municipal Products Incorporated Trust Series E-51 for Invesco Van Kampen New York Value Income Trust (Miscellaneous Revenue, Royal Bank of Canada LOC) 144A(i) | | | 0.94 | | | | 7-1-2017 | | | | 15,000,000 | | | | 15,000,000 | |
| | | | |
| | | | | | | | | | | | | | | 135,000,000 | |
| | | | | | | | | | | | | | | | |
| | | | |
North Carolina: 0.08% | | | | | | | | | | | | | | | | |
| | | | |
| Variable Rate Demand Note ø: 0.08% | | | | | | | | | | | | | | | | |
Roanoke Rapids NC Music & Entertainment District Project (Tax Revenue, Bank of America NA LOC) | | | 0.45 | | | | 7-1-2027 | | | | 6,565,000 | | | | 6,565,000 | |
| | | | | | | | | | | | | | | | |
| | | | |
North Dakota: 0.22% | | | | | | | | | | | | | | | | |
| | | | |
| Variable Rate Demand Note ø: 0.22% | | | | | | | | | | | | | | | | |
North Dakota HFA Mortgage Finance Program Series F (Housing Revenue, FHLB SPA) | | | 0.46 | | | | 1-1-2047 | | | | 18,000,000 | | | | 18,000,000 | |
| | | | | | | | | | | | | | | | |
| | | | |
Ohio: 1.03% | | | | | | | | | | | | | | | | |
| | | | |
| Variable Rate Demand Notes ø: 1.03% | | | | | | | | | | | | | | | | |
Ohio HFA Residential Management Series J (Housing Revenue, JPMorgan Chase & Company SPA) | | | 0.45 | | | | 9-1-2035 | | | | 25,795,000 | | | | 25,795,000 | |
Ohio University Hospital Health System Series C (Health Revenue, Barclays Bank plc LOC) | | | 0.53 | | | | 1-15-2050 | | | | 57,750,000 | | | | 57,750,000 | |
| | | | |
| | | | | | | | | | | | | | | 83,545,000 | |
| | | | | | | | | | | | | | | | |
| | | | |
Oklahoma: 0.45% | | | | | | | | | | | | | | | | |
| | | | |
| Variable Rate Demand Note ø: 0.45% | | | | | | | | | | | | | | | | |
Oklahoma Grand River Dam Authority Series C (Utilities Revenue, Barclays Bank plc LOC) | | | 0.53 | | | | 6-1-2039 | | | | 37,000,000 | | | | 37,000,000 | |
| | | | | | | | | | | | | | | | |
| | | | |
Oregon: 0.12% | | | | | | | | | | | | | | | | |
| | | | |
| Variable Rate Demand Note ø: 0.12% | | | | | | | | | | | | | | | | |
Puttable Floating Option Taxable Series TN-011 (Miscellaneous Revenue, Bank of America NA LIQ) 144A | | | 0.74 | | | | 5-1-2035 | | | | 10,000,000 | | | | 10,000,000 | |
| | | | | | | | | | | | | | | | |
| | | | |
Other: 0.90% | | | | | | | | | | | | | | | | |
| | | | |
| Variable Rate Demand Notes ø: 0.90% | | | | | | | | | | | | | | | | |
Clipper Tax-Exempt Certificate Trust Series 2009-54 (Miscellaneous Revenue, State Street Bank & Trust Company LIQ) | | | 0.49 | | | | 2-15-2028 | | | | 41,800,000 | | | | 41,800,000 | |
The accompanying notes are an integral part of these financial statements.
| | | | |
| 14 | | Wells Fargo Cash Investment Money Market Fund | | Portfolio of investments—July 31, 2016 (unaudited) |
| | | | | | | | | | | | | | | | |
| Security name | | Interest rate | | | Maturity date | | | Principal | | | Value | |
| | | | |
| Variable Rate Demand Notes ø (continued) | | | | | | | | | | | | | | | | |
PFOTER Series TNP-1012 (Miscellaneous Revenue, Bank of America NA LIQ) 144A | | | 0.55 | % | | | 12-1-2038 | | | $ | 31,695,000 | | | $ | 31,695,000 | |
| | | | |
| | | | | | | | | | | | | | | 73,495,000 | |
| | | | | | | | | | | | | | | | |
| | | | |
Pennsylvania: 0.12% | | | | | | | | | | | | | | | | |
| | | | |
| Other Municipal Debt: 0.12% | | | | | | | | | | | | | | | | |
Philadelphia PA Series CC-2 (Miscellaneous Revenue) | | | 0.70 | | | | 8-1-2016 | | | | 10,000,000 | | | | 10,000,000 | |
| | | | | | | | | | | | | | | | |
| | | | |
South Carolina: 0.10% | | | | | | | | | | | | | | | | |
| | | | |
| Other Municipal Debt: 0.10% | | | | | | | | | | | | | | | | |
South Carolina Public Service (Utilities Revenue) | | | 0.53 | | | | 8-30-2016 | | | | 8,000,000 | | | | 8,000,000 | |
| | | | | | | | | | | | | | | | |
| | | | |
Texas: 1.70% | | | | | | | | | | | | | | | | |
| | | | |
| Variable Rate Demand Notes ø: 1.70% | | | | | | | | | | | | | | | | |
Austin TX Water & Wastewater System (Water & Sewer Revenue, Citibank NA LOC) | | | 0.45 | | | | 5-15-2031 | | | | 8,600,000 | | | | 8,600,000 | |
Brazos Harbor TX Industrial Development Corporation (Industrial Development Revenue) | | | 0.53 | | | | 10-1-2036 | | | | 20,700,000 | | | | 20,700,000 | |
Houston TX Adjustable Refunding First Lien B3 (Water & Sewer Revenue, Sumitomo Mitsui Banking LOC) | | | 0.45 | | | | 5-15-2034 | | | | 10,000,000 | | | | 10,000,000 | |
Pasadena TX Independent School District Series B (GO Revenue, AGM Insured, JPMorgan Chase & Company SPA) | | | 0.46 | | | | 2-1-2035 | | | | 69,900,000 | | | | 69,900,000 | |
Port Arthur TX Navigation District Daily Fina Oil and Chemical Company Project (Industrial Development Revenue) | | | 0.55 | | | | 5-1-2033 | | | | 14,825,000 | | | | 14,825,000 | |
Port Arthur TX Navigation District of Jefferson County Total Petrochemicals Project (Resource Recovery Revenue) | | | 0.46 | | | | 3-1-2039 | | | | 9,000,000 | | | | 9,000,000 | |
Texas Department of Housing & Community Affairs Series A (Housing Revenue, GNMA/FNMA/FHLMC Insured, Texas State Treasurer SPA) | | | 0.50 | | | | 9-1-2038 | | | | 5,000,000 | | | | 5,000,000 | |
| | | | |
| | | | | | | | | | | | | | | 138,025,000 | |
| | | | | | | | | | | | | | | | |
| | | | |
Utah: 0.14% | | | | | | | | | | | | | | | | |
| | | | |
| Variable Rate Demand Note ø: 0.14% | | | | | | | | | | | | | | | | |
Utah Water Finance Agency Series B-1 (Water & Sewer Revenue, JPMorgan Chase & Company SPA) | | | 0.48 | | | | 10-1-2037 | | | | 11,000,000 | | | | 11,000,000 | |
| | | | | | | | | | | | | | | | |
| | | | |
Washington: 0.15% | | | | | | | | | | | | | | | | |
| | | | |
| Variable Rate Demand Note ø: 0.15% | | | | | | | | | | | | | | | | |
Washington Housing Finance Commission MFHR Series A (Housing Revenue, FHLMC LIQ) | | | 0.46 | | | | 8-1-2044 | | | | 12,630,000 | | | | 12,630,000 | |
| | | | | | | | | | | | | | | | |
| | | | |
West Virginia: 0.06% | | | | | | | | | | | | | | | | |
| | | | |
| Variable Rate Demand Note ø: 0.06% | | | | | | | | | | | | | | | | |
Cabell County WV University Facilities Variable Provident Group (Education Revenue, Bank of America NA LOC) | | | 0.48 | | | | 7-1-2039 | | | | 5,000,000 | | | | 5,000,000 | |
| | | | | | | | | | | | | | | | |
| | | | |
Total Municipal Obligations (Cost $1,513,757,894) | | | | | | | | | | | | | | | 1,513,757,894 | |
| | | | | | | | | | | | | | | | |
The accompanying notes are an integral part of these financial statements.
| | | | | | |
| Portfolio of investments—July 31, 2016 (unaudited) | | Wells Fargo Cash Investment Money Market Fund | | | 15 | |
| | | | | | | | | | | | | | | | |
| Security name | | Interest rate | | | Maturity date | | | Principal | | | Value | |
| | | | |
Other: 0.24% | | | | | | | | | | | | | | | | |
Nuveen California Dividend Advantage Municipal Fund Variable Rate Demand Preferred Shares Series 6 (Citibank NA LIQ) ±§144A | | | 0.55 | % | | | 8-1-2040 | | | $ | 6,000,000 | | | $ | 6,000,000 | |
Nuveen Enhanced Municipal Credit Opportunities Fund Series 1 ±§144A | | | 0.57 | | | | 3-1-2040 | | | | 13,200,000 | | | | 13,200,000 | |
| | | | |
Total Other (Cost $19,200,000) | | | | | | | | | | | | | | | 19,200,000 | |
| | | | | | | | | | | | | | | | |
| | | | |
Other Instruments: 4.06% | | | | | | | | | | | | | | | | |
DBS Bank Limited Pooled Bank Deposit Product | | | 0.50 | | | | 8-1-2016 | | | | 235,000,000 | | | | 235,000,000 | |
Oversea-Chinese Banking Corporation Pooled Bank Deposit Product | | | 0.45 | | | | 8-1-2016 | | | | 95,000,000 | | | | 95,000,000 | |
| | | | |
Total Other Instruments (Cost $330,000,000) | | | | | | | | | | | | | | | 330,000,000 | |
| | | | | | | | | | | | | | | | |
| | | | |
Other Notes: 2.91% | | | | | | | | | | | | | | | | |
| | | | |
| Corporate Bonds and Notes: 2.91% | | | | | | | | | | | | | | | | |
ACTS Retirement Life Communities Incorporated ±§ | | | 0.47 | | | | 11-15-2029 | | | | 14,805,000 | | | | 14,805,000 | |
Providence Health & Services ±§ | | | 0.50 | | | | 10-1-2042 | | | | 13,675,000 | | | | 13,675,000 | |
Racetrac Capital LLC ±§ | | | 0.44 | | | | 9-1-2020 | | | | 12,000,000 | | | | 12,000,000 | |
SSAB AB Series A ±§ | | | 0.47 | | | | 6-1-2035 | | | | 3,500,000 | | | | 3,500,000 | |
Steadfast Crestvilla LLC ±§ | | | 0.46 | | | | 2-1-2056 | | | | 3,000,000 | | | | 3,000,000 | |
United Overseas Bank Limited | | | 0.49 | | | | 8-1-2016 | | | | 190,000,000 | | | | 190,000,000 | |
| | | | |
Total Other Notes (Cost $236,980,000) | | | | | | | | | | | | | | | 236,980,000 | |
| | | | | | | | | | | | | | | | |
| | | | |
Repurchase Agreements ^^: 14.09% | | | | | | | | | | | | | | | | |
Bank of America Corporation, dated 7-29-2016, maturity value $166,004,842 (1) | | | 0.35 | | | | 8-1-2016 | | | | 166,000,000 | | | | 166,000,000 | |
Bank of Nova Scotia, dated 7-29-2016, maturity value $81,002,295 (2) | | | 0.34 | | | | 8-1-2016 | | | | 81,000,000 | | | | 81,000,000 | |
Deutsche Bank Securities, dated 7-29-2016, maturity value $101,003,283 (3) | | | 0.39 | | | | 8-1-2016 | | | | 101,000,000 | | | | 101,000,000 | |
Goldman Sachs & Company, dated 7-1-2016, maturity value $61,040,667 (4) ±§(i)¢ | | | 0.40 | | | | 8-30-2016 | | | | 61,000,000 | | | | 61,000,000 | |
GX Clarke & Company, dated 7-29-2016, maturity value $222,447,165 (5) | | | 0.40 | | | | 8-1-2016 | | | | 222,439,750 | | | | 222,439,750 | |
JPMorgan Securities, dated 7-1-2016 maturity value $42,013,743 (6) ±§¢ | | | 0.38 | | | | 8-1-2016 | | | | 42,000,000 | | | | 42,000,000 | |
JPMorgan Securities, dated 7-1-2016, maturity value $63,064,783 (7) ±§(i)¢ | | | 0.59 | | | | 9-2-2016 | | | | 63,000,000 | | | | 63,000,000 | |
Merrill Lynch Pierce Fenner & Smith Incorporated, dated 7-29-2016, maturity value $90,202,631 (8) | | | 0.35 | | | | 8-1-2016 | | | | 90,200,000 | | | | 90,200,000 | |
Normura, dated 7-29-2016 maturity value $320,011,467 (9) | | | 0.43 | | | | 8-1-2016 | | | | 320,000,000 | | | | 320,000,000 | |
| | | | |
Total Repurchase Agreements (Cost $1,146,639,750) | | | | | | | | | | | | | | | 1,146,639,750 | |
| | | | | | | | | | | | | | | | |
| | | | | | | | |
| Total investments in securities (Cost $8,215,467,722) * | | | 100.97 | % | | | 8,215,467,722 | |
Other assets and liabilities, net | | | (0.97 | ) | | | (78,871,350 | ) |
| | | | | | | | |
| Total net assets | | | 100.00 | % | | $ | 8,136,596,372 | |
| | | | | | | | |
The accompanying notes are an integral part of these financial statements.
| | | | |
| 16 | | Wells Fargo Cash Investment Money Market Fund | | Portfolio of investments—July 31, 2016 (unaudited) |
| (z) | Zero coupon security. The rate represents the current yield to maturity. |
| § | The security is subject to a demand feature which reduces the effective maturity. |
| 144A | The security may be resold in transactions exempt from registration, normally to qualified institutional buyers, pursuant to Rule 144A under the Securities Act of 1933. |
| ± | Variable rate investment. The rate shown is the rate in effect at period end. |
| ø | Variable rate demand notes are subject to a demand feature which reduces the effective maturity. The maturity date shown represents the final maturity date of the security. The interest rate is determined and reset by the issuer daily, weekly, or monthly depending upon the terms of the security. The rate shown is the rate in effect at period end. |
| | (1) | U.S. government securities, 3.00% to 3.50%, 2-1-2043 to 9-1-2045, fair value including accrued interest is $170,980,000. |
| | (2) | U.S. government securities, 1.79% to 7.00%, 1-1-2020 to 7-1-2046, fair value including accrued interest is $83,430,000. |
| | (3) | U.S. government securities, 0.75% to 4.75%, 11-30-2016 to 8-15-2040, fair value including accrued interest is $103,020,004. |
| | (4) | U.S. government securities, 0.00%, 8-2-2016 to 3-7-2017, fair value is $62,220,000. |
| | (5) | U.S. government securities, 1.50% to 9.50%, 11-15-2016 to 5-20-2046, fair value including accrued interest is $229,112,961. |
| | (6) | U.S. government securities, 2.39% to 9.00%, 12-1-2020 to 2-1-2048, fair value including accrued interest is $43,260,785. |
| | (7) | U.S. government securities, 0.00% to 4.30%, 8-1-2016 to 8-1-2046, fair value including accrued interest is $64,452,374. |
| | (8) | U.S. government securities, 4.00%, 12-20-2045, fair value including accrued interest is $92,906,001. |
| | (9) | U.S. government securities, 0.13% to 3.88%, 11-30-2016 to 4-15-2029, fair value including accrued interest is $326,400,063. |
| ¢ | The security represents a long-dated and extendible repurchase agreement which automatically renews on previously set terms. The maturity date represents the next put date. |
| * | Cost for federal income tax purposes is substantially the same as for financial reporting purposes. |
The accompanying notes are an integral part of these financial statements.
| | | | | | |
| Statement of assets and liabilities—July 31, 2016 (unaudited) | | Wells Fargo Cash Investment Money Market Fund | | | 17 | |
| | | | |
| | | | |
| |
Assets | | | | |
Investments | | | | |
In unaffiliated securities, at amortized cost | | $ | 7,068,827,972 | |
In repurchase agreements, at amortized cost | | | 1,146,639,750 | |
| | | | |
Total investments, at amortized cost | | | 8,215,467,722 | |
Cash | | | 60,479 | |
Receivable for Fund shares sold | | | 1,515,057 | |
Receivable for interest | | | 1,729,301 | |
Prepaid expenses and other assets | | | 169,383 | |
| | | | |
Total assets | | | 8,218,941,942 | |
| | | | |
| |
Liabilities | | | | |
Dividends payable | | | 436,068 | |
Payable for investments purchased | | | 77,439,635 | |
Payable for Fund shares redeemed | | | 2,630,749 | |
Management fee payable | | | 727,824 | |
Administration fees payable | | | 496,040 | |
Accrued expenses and other liabilities | | | 615,254 | |
| | | | |
Total liabilities | | | 82,345,570 | |
| | | | |
Total net assets | | $ | 8,136,596,372 | |
| | | | |
| |
NET ASSETS CONSIST OF | | | | |
Paid-in capital | | $ | 8,138,870,679 | |
Overdistributed net investment income | | | (125 | ) |
Accumulated net realized losses on investments | | | (2,274,182 | ) |
| | | | |
Total net assets | | $ | 8,136,596,372 | |
| | | | |
| |
COMPUTATION OF NET ASSET VALUE PER SHARE | | | | |
Net assets – Administrator Class | | $ | 192,716,763 | |
Shares outstanding – Administrator Class1 | | | 192,682,152 | |
Net asset value per share – Administrator Class | | | $1.00 | |
Net assets – Institutional Class | | $ | 3,836,085,853 | |
Shares outstanding – Institutional Class1 | | | 3,835,627,680 | |
Net asset value per share – Institutional Class | | | $1.00 | |
Net assets – Select Class | | $ | 3,453,594,462 | |
Shares outstanding – Select Class1 | | | 3,453,200,314 | |
Net asset value per share – Select Class | | | $1.00 | |
Net assets – Service Class | | $ | 654,199,294 | |
Shares outstanding – Service Class1 | | | 654,122,968 | |
Net asset value per share – Service Class | | | $1.00 | |
| 1 | The Fund has an unlimited number of authorized shares. |
The accompanying notes are an integral part of these financial statements.
| | | | |
| 18 | | Wells Fargo Cash Investment Money Market Fund | | Statement of operations—six months ended July 31, 2016 (unaudited) |
| | | | |
| | | | |
| |
Investment income | | | | |
Interest | | $ | 31,283,237 | |
| | | | |
| |
Expenses | | | | |
Management fee | | | 8,026,846 | |
Administration fees | | | | |
Administrator Class | | | 141,272 | |
Institutional Class | | | 1,931,666 | |
Select Class | | | 1,009,646 | |
Service Class | | | 639,325 | |
Shareholder servicing fees | | | | |
Administrator Class | | | 141,272 | |
Service Class | | | 1,331,273 | |
Custody and accounting fees | | | 289,333 | |
Professional fees | | | 20,943 | |
Registration fees | | | 18,240 | |
Shareholder report expenses | | | 17,350 | |
Trustees’ fees and expenses | | | 5,846 | |
Other fees and expenses | | | 68,347 | |
| | | | |
Total expenses | | | 13,641,359 | |
Less: Fee waivers and/or expense reimbursements | | | (2,400,610 | ) |
| | | | |
Net expenses | | | 11,240,749 | |
| | | | |
Net investment income | | | 20,042,488 | |
| | | | |
Net realized gains on investments | | | 8,817 | |
| | | | |
Net increase in net assets resulting from operations | | $ | 20,051,305 | |
| | | | |
The accompanying notes are an integral part of these financial statements.
| | | | | | |
| Statement of changes in net assets | | Wells Fargo Cash Investment Money Market Fund | | | 19 | |
| | | | | | | | | | | | | | | | |
| | | Six months ended
July 31, 2016
(unaudited) | | | Year ended
January 31, 2016 | |
| | | |
Operations | | | | | | | | | | | | |
Net investment income | | | | | | $ | 20,042,488 | | | | | | | $ | 13,841,135 | |
Net realized gains on investments | | | | | | | 8,817 | | | | | | | | 10,433 | |
| | | | |
Net increase in net assets resulting from operations | | | | | | | 20,051,305 | | | | | | | | 13,851,568 | |
| | | | |
| | | |
Distributions to shareholders from | | | | | | | | | | | | |
Net investment income | | | | | | | | | | | | | | | | |
Administrator Class | | | | | | | (321,259 | ) | | | | | | | (91,605 | ) |
Institutional Class | | | | | | | (8,624,343 | ) | | | | | | | (4,409,426 | ) |
Select Class | | | | | | | (10,789,967 | ) | | | | | | | (9,195,148 | ) |
Service Class | | | | | | | (306,919 | ) | | | | | | | (144,956 | ) |
| | | | |
Total distributions to shareholders | | | | | | | (20,042,488 | ) | | | | | | | (13,841,135 | ) |
| | | | |
| | | | |
Capital share transactions | | | Shares | | | | | | | | Shares | | | | | |
Proceeds from shares sold | | | | | | | | | | | | | | | | |
Administrator Class | | | 267,544,665 | | | | 267,544,665 | | | | 645,846,405 | | | | 645,846,405 | |
Institutional Class | | | 12,906,998,494 | | | | 12,906,998,494 | | | | 27,914,859,441 | | | | 27,914,859,441 | |
Select Class | | | 32,482,328,465 | | | | 32,482,328,465 | | | | 72,307,425,692 | | | | 72,307,425,692 | |
Service Class | | | 1,951,058,314 | | | | 1,951,058,314 | | | | 5,421,993,054 | | | | 5,421,993,054 | |
| | | | |
| | | | | | | 47,607,929,938 | | | | | | | | 106,290,124,592 | |
| | | | |
Reinvestment of distributions | | | | | | | | | | | | | | | | |
Administrator Class | | | 228,442 | | | | 228,442 | | | | 67,458 | | | | 67,458 | |
Institutional Class | | | 5,746,764 | | | | 5,746,764 | | | | 2,435,991 | | | | 2,435,991 | |
Select Class | | | 8,650,167 | | | | 8,650,167 | | | | 7,672,917 | | | | 7,672,917 | |
Service Class | | | 144,608 | | | | 144,608 | | | | 67,355 | | | | 67,355 | |
| | | | |
| | | | | | | 14,769,981 | | | | | | | | 10,243,721 | |
| | | | |
Payment for shares redeemed | | | | | | | | | | | | | | | | |
Administrator Class | | | (372,455,176 | ) | | | (372,445,176 | ) | | | (744,857,486 | ) | | | (744,857,486 | ) |
Institutional Class | | | (14,103,860,973 | ) | | | (14,103,860,973 | ) | | | (27,210,565,293 | ) | | | (27,210,565,293 | ) |
Select Class | | | (34,633,047,281 | ) | | | (34,633,047,281 | ) | | | (72,609,180,413 | ) | | | (72,609,180,413 | ) |
Service Class | | | (2,533,997,634 | ) | | | (2,533,997,634 | ) | | | (5,623,383,040 | ) | | | (5,623,383,040 | ) |
| | | | |
| | | | | | | (51,643,351,064 | ) | | | | | | | (106,187,986,232 | ) |
| | | | |
Net increase (decrease) in net assets resulting from capital share transactions | | | | | | | (4,020,651,145 | ) | | | | | | | 112,382,081 | |
| | | | |
Total increase (decrease) in net assets | | | | | | | (4,020,642,328 | ) | | | | | | | 112,392,514 | |
| | | | |
| | |
Net assets | | | | | | | | |
Beginning of period | | | | | | | 12,157,238,700 | | | | | | | | 12,044,846,186 | |
| | | | |
End of period | | | | | | $ | 8,136,596,372 | | | | | | | $ | 12,157,238,700 | |
| | | | |
Overdistributed net investment income | | | | | | $ | (125 | ) | | | | | | $ | (125 | ) |
| | | | |
The accompanying notes are an integral part of these financial statements.
| | | | |
| 20 | | Wells Fargo Cash Investment Money Market Fund | | Financial highlights |
(For a share outstanding throughout each period)
| | | | | | | | | | | | | | | | | | | | | | | | |
| | | Six months ended
July 31, 2016 (unaudited) | | | Year ended January 31 | |
| ADMINISTRATOR CLASS | | | 2016 | | | 2015 | | | 2014 | | | 2013 | | | 2012 | |
Net asset value, beginning of period | | | $1.00 | | | | $1.00 | | | | $1.00 | | | | $1.00 | | | | $1.00 | | | | $1.00 | |
Net investment income | | | 0.00 | 1 | | | 0.00 | 1 | | | 0.00 | 1 | | | 0.00 | 1 | | | 0.00 | 1 | | | 0.00 | 1 |
Net realized gains on investments | | | 0.00 | 1 | | | 0.00 | 1 | | | 0.00 | 1 | | | 0.00 | 1 | | | 0.00 | 1 | | | 0.00 | 1 |
| | | | | | | | | | | | | | | | | | | | | | | | |
Total from investment operations | | | 0.00 | 1 | | | 0.00 | 1 | | | 0.00 | 1 | | | 0.00 | 1 | | | 0.00 | 1 | | | 0.00 | 1 |
Distributions to shareholders from | | | | | | | | | | | | | | | | | | | | | | | | |
Net investment income | | | (0.00 | )1 | | | (0.00 | )1 | | | (0.00 | )1 | | | (0.00 | )1 | | | (0.00 | )1 | | | (0.00 | )1 |
Net realized gains | | | 0.00 | | | | 0.00 | | | | 0.00 | | | | 0.00 | | | | 0.00 | | | | (0.00 | )1 |
| | | | | | | | | | | | | | | | | | | | | | | | |
Total distributions to shareholders | | | (0.00 | )1 | | | (0.00 | )1 | | | (0.00 | )1 | | | (0.00 | )1 | | | (0.00 | )1 | | | (0.00 | )1 |
Net asset value, end of period | | | $1.00 | | | | $1.00 | | | | $1.00 | | | | $1.00 | | | | $1.00 | | | | $1.00 | |
Total return2 | | | 0.11 | % | | | 0.03 | % | | | 0.01 | % | | | 0.01 | % | | | 0.01 | % | | | 0.01 | % |
Ratios to average net assets (annualized) | | | | | | | | | | | | | | | | | | | | | | | | |
Gross expenses | | | 0.35 | % | | | 0.35 | % | | | 0.35 | % | | | 0.35 | % | | | 0.34 | % | | | 0.35 | % |
Net expenses | | | 0.33 | % | | | 0.26 | % | | | 0.19 | % | | | 0.22 | % | | | 0.26 | % | | | 0.25 | % |
Net investment income | | | 0.22 | % | | | 0.03 | % | | | 0.01 | % | | | 0.01 | % | | | 0.01 | % | | | 0.01 | % |
Supplemental data | | | | | | | | | | | | | | | | | | | | | | | | |
Net assets, end of period (000s omitted) | | | $192,717 | | | | $297,396 | | | | $396,339 | | | | $493,087 | | | | $549,744 | | | | $600,737 | |
| 1 | Amount is less than $0.005. |
| 2 | Returns for periods of less than one year are not annualized. |
The accompanying notes are an integral part of these financial statements.
| | | | | | |
| Financial highlights | | Wells Fargo Cash Investment Money Market Fund | | | 21 | |
(For a share outstanding throughout each period)
| | | | | | | | | | | | | | | | | | | | | | | | |
| | | Six months ended
July 31, 2016 (unaudited) | | | Year ended January 31 | |
| INSTITUTIONAL CLASS | | | 2016 | | | 2015 | | | 2014 | | | 2013 | | | 2012 | |
Net asset value, beginning of period | | | $1.00 | | | | $1.00 | | | | $1.00 | | | | $1.00 | | | | $1.00 | | | | $1.00 | |
Net investment income | | | 0.00 | 1 | | | 0.00 | 1 | | | 0.00 | 1 | | | 0.00 | 1 | | | 0.00 | 1 | | | 0.00 | 1 |
Net realized gains on investments | | | 0.00 | 1 | | | 0.00 | 1 | | | 0.00 | 1 | | | 0.00 | 1 | | | 0.00 | 1 | | | 0.00 | 1 |
| | | | | | | | | | | | | | | | | | | | | | | | |
Total from investment operations | | | 0.00 | 1 | | | 0.00 | 1 | | | 0.00 | 1 | | | 0.00 | 1 | | | 0.00 | 1 | | | 0.00 | 1 |
Distributions to shareholders from | | | | | | | | | | | | | | | | | | | | | | | | |
Net investment income | | | (0.00 | )1 | | | (0.00 | )1 | | | (0.00 | )1 | | | (0.00 | )1 | | | (0.00 | )1 | | | (0.00 | )1 |
Net realized gains | | | 0.00 | | | | 0.00 | | | | 0.00 | | | | 0.00 | | | | 0.00 | | | | (0.00 | )1 |
| | | | | | | | | | | | | | | | | | | | | | | | |
Total distributions to shareholders | | | (0.00 | )1 | | | (0.00 | )1 | | | (0.00 | )1 | | | (0.00 | )1 | | | (0.00 | )1 | | | (0.00 | )1 |
Net asset value, end of period | | | $1.00 | | | | $1.00 | | | | $1.00 | | | | $1.00 | | | | $1.00 | | | | $1.00 | |
Total return2 | | | 0.18 | % | | | 0.09 | % | | | 0.01 | % | | | 0.03 | % | | | 0.07 | % | | | 0.06 | % |
Ratios to average net assets (annualized) | | | | | | | | | | | | | | | | | | | | | | | | |
Gross expenses | | | 0.23 | % | | | 0.23 | % | | | 0.23 | % | | | 0.23 | % | | | 0.23 | % | | | 0.23 | % |
Net expenses | | | 0.20 | % | | | 0.20 | % | | | 0.19 | % | | | 0.20 | % | | | 0.20 | % | | | 0.20 | % |
Net investment income | | | 0.36 | % | | | 0.10 | % | | | 0.01 | % | | | 0.03 | % | | | 0.07 | % | | | 0.06 | % |
Supplemental data | | | | | | | | | | | | | | | | | | | | | | | | |
Net assets, end of period (000s omitted) | | | $3,836,086 | | | | $5,027,125 | | | | $4,320,392 | | | | $5,127,034 | | | | $7,186,632 | | | | $6,246,114 | |
| 1 | Amount is less than $0.005. |
| 2 | Returns for periods of less than one year are not annualized. |
The accompanying notes are an integral part of these financial statements.
| | | | |
| 22 | | Wells Fargo Cash Investment Money Market Fund | | Financial highlights |
(For a share outstanding throughout each period)
| | | | | | | | | | | | | | | | | | | | | | | | |
| | | Six months ended
July 31, 2016 (unaudited) | | | Year ended January 31 | |
| SELECT CLASS | | | 2016 | | | 2015 | | | 2014 | | | 2013 | | | 2012 | |
Net asset value, beginning of period | | | $1.00 | | | | $1.00 | | | | $1.00 | | | | $1.00 | | | | $1.00 | | | | $1.00 | |
Net investment income | | | 0.00 | 1 | | | 0.00 | 1 | | | 0.00 | 1 | | | 0.00 | 1 | | | 0.00 | 1 | | | 0.00 | 1 |
Net realized gains on investments | | | 0.00 | 1 | | | 0.00 | 1 | | | 0.00 | 1 | | | 0.00 | 1 | | | 0.00 | 1 | | | 0.00 | 1 |
| | | | | | | | | | | | | | | | | | | | | | | | |
Total from investment operations | | | 0.00 | 1 | | | 0.00 | 1 | | | 0.00 | 1 | | | 0.00 | 1 | | | 0.00 | 1 | | | 0.00 | 1 |
Distributions to shareholders from | | | | | | | | | | | | | | | | | | | | | | | | |
Net investment income | | | (0.00 | )1 | | | (0.00 | )1 | | | (0.00 | )1 | | | (0.00 | )1 | | | (0.00 | )1 | | | (0.00 | )1 |
Net realized gains | | | 0.00 | | | | 0.00 | | | | 0.00 | | | | 0.00 | | | | 0.00 | | | | (0.00 | )1 |
| | | | | | | | | | | | | | | | | | | | | | | | |
Total distributions to shareholders | | | (0.00 | )1 | | | (0.00 | )1 | | | (0.00 | )1 | | | (0.00 | )1 | | | (0.00 | )1 | | | (0.00 | )1 |
Net asset value, end of period | | | $1.00 | | | | $1.00 | | | | $1.00 | | | | $1.00 | | | | $1.00 | | | | $1.00 | |
Total return2 | | | 0.21 | % | | | 0.16 | % | | | 0.07 | % | | | 0.10 | % | | | 0.14 | % | | | 0.13 | % |
Ratios to average net assets (annualized) | | | | | | | | | | | | | | | | | | | | | | | | |
Gross expenses | | | 0.19 | % | | | 0.19 | % | | | 0.19 | % | | | 0.19 | % | | | 0.19 | % | | | 0.19 | % |
Net expenses | | | 0.13 | % | | | 0.13 | % | | | 0.13 | % | | | 0.13 | % | | | 0.13 | % | | | 0.13 | % |
Net investment income | | | 0.43 | % | | | 0.16 | % | | | 0.07 | % | | | 0.10 | % | | | 0.14 | % | | | 0.13 | % |
Supplemental data | | | | | | | | | | | | | | | | | | | | | | | | |
Net assets, end of period (000s omitted) | | | $3,453,594 | | | | $5,595,704 | | | | $5,889,779 | | | | $7,650,810 | | | | $6,407,032 | | | | $5,325,713 | |
| 1 | Amount is less than $0.005. |
| 2 | Returns for periods of less than one year are not annualized. |
The accompanying notes are an integral part of these financial statements.
| | | | | | |
| Financial highlights | | Wells Fargo Cash Investment Money Market Fund | | | 23 | |
(For a share outstanding throughout each period)
| | | | | | | | | | | | | | | | | | | | | | | | |
| | | Six months ended
July 31, 2016 (unaudited) | | | Year ended January 31 | |
| SERVICE CLASS | | | 2016 | | | 2015 | | | 2014 | | | 2013 | | | 2012 | |
Net asset value, beginning of period | | | $1.00 | | | | $1.00 | | | | $1.00 | | | | $1.00 | | | | $1.00 | | | | $1.00 | |
Net investment income | | | 0.00 | 1 | | | 0.00 | 1 | | | 0.00 | 1 | | | 0.00 | 1 | | | 0.00 | 1 | | | 0.00 | 1 |
Net realized gains on investments | | | 0.00 | 1 | | | 0.00 | 1 | | | 0.00 | 1 | | | 0.00 | 1 | | | 0.00 | 1 | | | 0.00 | 1 |
| | | | | | | | | | | | | | | | | | | | | | | | |
Total from investment operations | | | 0.00 | 1 | | | 0.00 | 1 | | | 0.00 | | | | 0.00 | 1 | | | 0.00 | 1 | | | 0.00 | 1 |
Distributions to shareholders from | | | | | | | | | | | | | | | | | | | | | | | | |
Net investment income | | | 0.00 | 1 | | | (0.00 | )1 | | | (0.00 | )1 | | | (0.00 | )1 | | | (0.00 | )1 | | | (0.00 | )1 |
Net realized gains | | | 0.00 | | | | 0.00 | | | | 0.00 | | | | 0.00 | | | | 0.00 | | | | (0.00 | )1 |
| | | | | | | | | | | | | | | | | | | | | | | | |
Total distributions to shareholders | | | 0.00 | 1 | | | (0.00 | )1 | | | (0.00 | )1 | | | (0.00 | )1 | | | (0.00 | )1 | | | (0.00 | )1 |
Net asset value, end of period | | | $1.00 | | | | $1.00 | | | | $1.00 | | | | $1.00 | | | | $1.00 | | | | $1.00 | |
Total return2 | | | 0.03 | % | | | 0.01 | % | | | 0.01 | % | | | 0.01 | % | | | 0.01 | % | | | 0.01 | % |
Ratios to average net assets (annualized) | | | | | | | | | | | | | | | | | | | | | | | | |
Gross expenses | | | 0.52 | % | | | 0.52 | % | | | 0.52 | % | | | 0.52 | % | | | 0.52 | % | | | 0.52 | % |
Net expenses | | | 0.50 | % | | | 0.28 | % | | | 0.19 | % | | | 0.22 | % | | | 0.26 | % | | | 0.25 | % |
Net investment income | | | 0.06 | % | | | 0.01 | % | | | 0.01 | % | | | 0.01 | % | | | 0.01 | % | | | 0.01 | % |
Supplemental data | | | | | | | | | | | | | | | | | | | | | | | | |
Net assets, end of period (000s omitted) | | | $654,199 | | | | $1,237,014 | | | | $1,438,336 | | | | $1,448,713 | | | | $1,594,389 | | | | $2,000,296 | |
| 1 | Amount is less than $0.005. |
| 2 | Returns for periods of less than one year are not annualized. |
The accompanying notes are an integral part of these financial statements.
| | | | |
| 24 | | Wells Fargo Cash Investment Money Market Fund | | Notes to financial statements (unaudited) |
1. ORGANIZATION
Wells Fargo Funds Trust (the “Trust”), a Delaware statutory trust organized on March 10, 1999, is an open-end management investment company registered under the Investment Company Act of 1940, as amended (the “1940 Act”). As an investment company, the Trust follows the accounting and reporting guidance in Financial Accounting Standards Board (“FASB”) Accounting Standards Codification Topic 946, Financial Services – Investment Companies. These financial statements report on the Wells Fargo Cash Investment Money Market Fund (the “Fund”) which is a diversified series of the Trust.
2. SIGNIFICANT ACCOUNTING POLICIES
The following significant accounting policies, which are consistently followed in the preparation of the financial statements of the Fund, are in conformity with U.S. generally accepted accounting principles which require management to make estimates and assumptions that affect the reported amounts of assets and liabilities, disclosure of contingent assets and liabilities at the date of the financial statements, and the reported amounts of revenues and expenses during the reporting period. Actual results could differ from those estimates.
Securities valuation
As permitted under Rule 2a-7 of the 1940 Act, portfolio securities are valued at amortized cost, which approximates fair value. The amortized cost method involves valuing a security at its cost, plus accretion of discount or minus amortization of premium over the period until maturity.
Investments which are not valued using the method discussed above are valued at their fair value, as determined in good faith by the Board of Trustees of the Fund. The Board of Trustees has established a Valuation Committee comprised of the Trustees and has delegated to it the authority to take any actions regarding the valuation of portfolio securities that the Valuation Committee deems necessary or appropriate, including determining the fair value of portfolio securities, unless the determination has been delegated to the Management Valuation Team of Wells Fargo Funds Management, LLC (“Funds Management”). The Board of Trustees retains the authority to make or ratify any valuation decisions or approve any changes to the Valuation Procedures as it deems appropriate. On a quarterly basis, the Board of Trustees receives reports on any valuation actions taken by the Valuation Committee or the Management Valuation Team which may include items for ratification.
Valuations of fair valued securities are compared to the next actual sales price when available, or other appropriate market values, to assess the continued appropriateness of the fair valuation methodologies used. These securities are fair valued on a day-to-day basis, taking into consideration changes to appropriate market information and any significant changes to the inputs considered in the valuation process until there is a readily available price provided on an exchange or by an independent pricing service. Valuations received from an independent pricing service or independent broker-dealer quotes are periodically validated by comparisons to most recent trades and valuations provided by other independent pricing services in addition to the review of prices by the manager and/or subadvisers. Unobservable inputs used in determining fair valuations are identified based on the type of security, taking into consideration factors utilized by market participants in valuing the investment, knowledge about the issuer and the current market environment.
Repurchase agreements
The Fund may invest in repurchase agreements and may participate in pooled repurchase agreement transactions with other funds advised by Funds Management. The repurchase agreements must be fully collateralized based on values that are marked-to-market daily. The collateral may be held by an agent bank under a tri-party agreement. It is the custodian’s responsibility to value collateral daily and to take action to obtain additional collateral as necessary to maintain market value equal to or greater than the resale price. The repurchase agreements are collateralized by instruments such as U.S. Treasury, federal agency, or high-grade corporate obligations. There could be potential loss to the Fund in the event that the Fund is delayed or prevented from exercising its rights to dispose of the collateral, including the risk of a possible decline in the value of the underlying obligations during the period in which the Fund seeks to assert its rights.
When-issued transactions
The Fund may purchase securities on a forward commitment or when-issued basis. The Fund records a when-issued transaction on the trade date and will segregate assets in an amount at least equal in value to the Fund’s commitment to purchase when-issued securities. Securities purchased on a when-issued basis are marked-to-market daily and the Fund begins earning interest on the settlement date. Losses may arise due to changes in the market value of the underlying securities or if the counterparty does not perform under the contract.
| | | | | | |
| Notes to financial statements (unaudited) | | Wells Fargo Cash Investment Money Market Fund | | | 25 | |
Security transactions and income recognition
Securities transactions are recorded on a trade date basis. Realized gains or losses are recorded on the basis of identified cost.
Interest income is accrued daily and bond discounts are accreted and premiums are amortized daily based on the effective interest method. To the extent debt obligations are placed on non-accrual status, any related interest income may be reduced by writing off interest receivables when the collection of all or a portion of interest has become doubtful based on consistently applied procedures. If the issuer subsequently resumes interest payments or when the collectability of interest is reasonably assured, the debt obligation is removed from non-accrual status.
Distributions to shareholders
Distributions to shareholders from net investment income are accrued daily and paid monthly. Distributions from net realized gains, if any, are recorded on the ex-dividend date. Such distributions are determined in conformity with federal income tax regulations, which may differ in amount or character from net investment income and realized gains recognized for purposes of U.S. generally accepted accounting principles.
Federal and other taxes
The Fund intends to continue to qualify as a regulated investment company by distributing substantially all of its investment company taxable income and any net realized capital gains (after reduction for capital loss carryforwards) sufficient to relieve it from all, or substantially all, federal income taxes. Accordingly, no provision for federal income taxes was required.
The Fund’s income and federal excise tax returns and all financial records supporting those returns for the prior three fiscal years are subject to examination by the federal and Delaware revenue authorities. Management has analyzed the Fund’s tax positions taken on federal, state, and foreign tax returns for all open tax years and does not believe that there are any uncertain tax positions that require recognition of a tax liability.
As of January 31, 2016, the Fund had capital loss carryforwards available to offset future net realized capital gains in the amount of $2,282,999 expiring in 2018.
Class allocations
The separate classes of shares offered by the Fund differ principally in shareholder servicing and administration fees. Class specific expenses are charged directly to that share class. Investment income, common expenses, and realized and unrealized gains (losses) on investments are allocated daily to each class of shares based on the relative proportion of net assets of each class.
3. FAIR VALUATION MEASUREMENTS
Fair value measurements of investments are determined within a framework that has established a fair value hierarchy based upon the various data inputs utilized in determining the value of the Fund’s investments. The three-level hierarchy gives the highest priority to unadjusted quoted prices in active markets for identical assets or liabilities (Level 1) and the lowest priority to significant unobservable inputs (Level 3). The Fund’s investments are classified within the fair value hierarchy based on the lowest level of input that is significant to the fair value measurement. The inputs are summarized into three broad levels as follows:
| n | | Level 1 – quoted prices in active markets for identical securities |
| n | | Level 2 – other significant observable inputs (including quoted prices for similar securities, interest rates, prepayment speeds, credit risk, use of amortized cost, etc.) |
| n | | Level 3 – significant unobservable inputs (including the Fund’s own assumptions in determining the fair value of investments) |
The inputs or methodologies used for valuing investments in securities are not necessarily an indication of the risk associated with investing in those securities.
At July 31, 2016, all of the Fund’s investments in securities were valued using Level 2 inputs since the primary inputs include the credit quality of the issuer and short-term interest rates (both of which are observable) in addition to the use of amortized cost.
The Fund recognizes transfers between levels within the fair value hierarchy at the end of the reporting period. At July 31, 2016, the Fund did not have any transfers into/out of Level 1, Level 2, or Level 3.
| | | | |
| 26 | | Wells Fargo Cash Investment Money Market Fund | | Notes to financial statements (unaudited) |
4. TRANSACTIONS WITH AFFILIATES
Management fee
Funds Management, an indirect wholly owned subsidiary of Wells Fargo & Company (“Wells Fargo”), is the manager of the Fund and provides advisory and fund-level administrative services under an investment management agreement. Under the investment management agreement, Funds Management is responsible for, among other services, implementing the investment objectives and strategies of the Fund, supervising the subadvisers, providing fund-level administrative services in connection with the Fund’s operations, and providing any other fund-level administrative services reasonably necessary for the operation of the Fund. As compensation for its services under the investment management agreement, Funds Management is entitled to receive an annual management fee starting at 0.15% and declining to 0.13% as the average daily net assets of the Fund increase. For the six months ended July 31, 2016, the management fee was equivalent to an annual rate of 0.14% of the Fund’s average daily net assets.
Funds Management has retained the services of certain subadvisers to provide daily portfolio management to the Fund. Wells Capital Management Incorporated (“WellsCap”), an affiliate of Funds Management and an indirect wholly owned subsidiary of Wells Fargo, is a subadviser to the Fund and is entitled to receive a fee from Funds Management at an annual rate starting at 0.05% and declining to 0.01% as the average daily net assets of the Fund increase. Wells Capital Management Singapore, a separately identifiable department of Wells Fargo Bank, N.A., an affiliate of Funds Management and wholly owned subsidiary of Wells Fargo, is also a subadviser to the Fund and is entitled to receive a fee from WellsCap at an annual rate starting at 0.0025% and declining to 0.0005% as the average daily net assets of the Fund increase.
Administration fees
Under a class-level administration agreement, Funds Management provides class-level administrative services to the Fund, which includes paying fees and expenses for services provided by the transfer agent, sub-transfer agents, omnibus account servicers and record-keepers. As compensation for its services under the class-level administration agreement, Funds Management receives an annual fee which is calculated based on the average daily net assets of each class as follows:
| | | | |
| | | Class-level
administration fee | |
Administrator Class | | | 0.10 | % |
Institutional Class | | | 0.08 | |
Select Class | | | 0.04 | |
Service Class | | | 0.12 | |
Funds Management has contractually waived and/or reimbursed management and administration fees to the extent necessary to maintain certain net operating expense ratios for the Fund. Waiver of fees and/or reimbursement of expenses by Funds Management were made first from fund level expenses on a proportionate basis and then from class specific expenses. Funds Management has committed through May 31, 2017 to waive fees and/or reimburse expenses to the extent necessary to cap the Fund’s expenses at 0.35% for Administrator Class shares, 0.20% for Institutional Class shares, 0.13% for Select Class shares, and 0.50% for Service Class shares. After this time, the cap may be increased or the commitment to maintain the cap may be terminated only with the approval of the Board of Trustees. During the six months ended July 31, 2016, Funds Management voluntarily waived additional expenses to maintain a positive yield.
Shareholder servicing fees
The Trust has entered into contracts with one or more shareholder servicing agents. Administrator Class and Service Class of the Fund are each charged a fee at an annual rate of 0.10% and 0.25%, respectively, of their average daily net assets.
A portion of these total shareholder servicing fees were paid to affiliates of Wells Fargo.
5. INDEMNIFICATION
Under the Trust’s organizational documents, the officers and Trustees have been granted certain indemnification rights against certain liabilities that may arise out of performance of their duties to the Trust. Additionally, in the normal course of business, the Trust may enter into contracts with service providers that contain a variety of indemnification clauses. The Trust’s maximum exposure under these arrangements is dependent on future claims that may be made against the Fund and, therefore, cannot be estimated.
| | | | | | |
| Notes to financial statements (unaudited) | | Wells Fargo Cash Investment Money Market Fund | | | 27 | |
6. MONEY MARKET FUND REFORM
On July 23, 2014, the Securities and Exchange Commission voted to amend Rule 2a-7 of the 1940 Act which governs the operations of registered money market funds. The amendments to Rule 2a-7 when implemented may, among other things, require the Fund to change the manner in which it values its securities, impose new liquidity fees on redemptions in certain circumstances, and permit the Fund to limit redemptions in certain circumstances. The amendments have staggered compliance dates. Compliance with a majority of these amendments will be required on October 14, 2016. Effective on or before October 5, 2016, the Fund will no longer maintain a stable $1.00 net asset values (NAV) and instead will be offered as a floating, market-based NAV.
| | | | |
| 28 | | Wells Fargo Cash Investment Money Market Fund | | Other information (unaudited) |
PROXY VOTING INFORMATION
A description of the policies and procedures that the Fund uses to determine how to vote proxies relating to portfolio securities is available, upon request, by calling 1-800-222-8222, visiting our website at wellsfargofunds.com, or visiting the SEC website at sec.gov. Information regarding how the Fund voted proxies relating to portfolio securities during the most recent 12-month period ended June 30 is available on the Fund’s website at wellsfargofunds.com or by visiting the SEC website at sec.gov.
PORTFOLIO HOLDINGS INFORMATION
The complete portfolio holdings for the Fund are publicly available on the Fund’s website (wellsfargofunds.com) on a 1-day delayed basis. The Fund files its complete schedule of portfolio holdings with the SEC for the first and third quarters of each fiscal year on Form N-Q, which is available by visiting the SEC website at sec.gov. In addition, the Fund’s Form N-Q may be reviewed and copied at the SEC’s Public Reference Room in Washington, DC, and at regional offices in New York City, at 233 Broadway, and in Chicago, at 175 West Jackson Boulevard, Suite 900. Information about the Public Reference Room may be obtained by calling 1-800-SEC-0330.
| | | | | | |
| Other information (unaudited) | | Wells Fargo Cash Investment Money Market Fund | | | 29 | |
BOARD OF TRUSTEES AND OFFICERS
Each of the Trustees and Officers1 listed in the table below acts in identical capacities for each fund in the Wells Fargo family of funds, which consists of 139 mutual funds comprising the Wells Fargo Funds Trust, Wells Fargo Variable Trust, Wells Fargo Master Trust and four closed-end funds (collectively the “Fund Complex”). This table should be read in conjunction with the Prospectus and the Statement of Additional Information2. The mailing address of each Trustee and Officer is 525 Market Street, 12th Floor, San Francisco, CA 94105. Each Trustee and Officer serves an indefinite term, however, each Trustee serves such term until reaching the mandatory retirement age established by the Trustees.
Independent Trustees
| | | | | | |
Name and
year of birth | | Position held and length of service* | | Principal occupations during past five years or longer | | Current other public company or investment company
directorships |
| William R. Ebsworth (Born 1957) | | Trustee, since 2015 | | Retired. From 1984 to 2013, equities analyst, portfolio manager, research director and chief financial officer at Fidelity Management and Research Company in Boston, Tokyo, and Hong Kong and retired in 2013 as Chief Investment Officer of Fidelity Strategic Advisers, Inc. where he lead a team of investment professionals managing client assets. Prior thereto, Board member of Hong Kong Securities Clearing Co., Hong Kong Options Clearing Corp., the Thailand International Fund, Ltd., Fidelity Investments Life Insurance Company, and Empire Fidelity Investments Life Insurance Company. Mr. Ebsworth is a CFA® charterholder and an Adjunct Lecturer, Finance, at Babson College. | | Asset Allocation Trust |
| Jane A. Freeman (Born 1953) | | Trustee, since 2015 | | Retired. From 2012 to 2014 and 1999 to 2008, Chief Financial Officer of Scientific Learning Corporation. From 2008 to 2012, Ms. Freeman provided consulting services related to strategic business projects. Prior to 1999, Portfolio Manager at Rockefeller & Co. and Scudder, Stevens & Clark. Board member of the Harding Loevner Funds from 1996 to 2014, serving as both Lead Independent Director and chair of the Audit Committee. Board member of the Russell Exchange Traded Funds Trust from 2011 to 2012 and the chair of the Audit Committee. Ms. Freeman is Chair of Taproot Foundation (non-profit organization), a Board Member of Ruth Bancroft Garden (non-profit organization) and an inactive chartered financial analyst. | | Asset Allocation Trust |
| Peter G. Gordon (Born 1942) | | Trustee, since 1998; Chairman, since 2005 | | Co-Founder, Retired Chairman, President and CEO of Crystal Geyser Water Company. Trustee Emeritus, Colby College. | | Asset Allocation Trust |
| Isaiah Harris, Jr. (Born 1952) | | Trustee, since 2009 | | Retired. Chairman of the Board of CIGNA Corporation since 2009, and Director since 2005. From 2003 to 2011, Director of Deluxe Corporation. Prior thereto, President and CEO of BellSouth Advertising and Publishing Corp. from 2005 to 2007, President and CEO of BellSouth Enterprises from 2004 to 2005 and President of BellSouth Consumer Services from 2000 to 2003. Emeritus member of the Iowa State University Foundation Board of Governors. Emeritus Member of the Advisory Board of Iowa State University School of Business. Advisory Board Member, Palm Harbor Academy (charter school). Advisory Board Member, Child Evangelism Fellowship (non-profit). Mr. Harris is a certified public accountant (inactive status). | | CIGNA Corporation; Asset Allocation Trust |
| Judith M. Johnson (Born 1949) | | Trustee, since 2008; Audit Committee Chairman, since 2008 | | Retired. Prior thereto, Chief Executive Officer and Chief Investment Officer of Minneapolis Employees Retirement Fund from 1996 to 2008. Ms. Johnson is an attorney, certified public accountant and a certified managerial accountant. | | Asset Allocation Trust |
| David F. Larcker (Born 1950) | | Trustee, since 2009 | | James Irvin Miller Professor of Accounting at the Graduate School of Business, Stanford University, Director of the Corporate Governance Research Initiative and Senior Faculty of The Rock Center for Corporate Governance since 2006. From 2005 to 2008, Professor of Accounting at the Graduate School of Business, Stanford University. Prior thereto, Ernst & Young Professor of Accounting at The Wharton School, University of Pennsylvania from 1985 to 2005. | | Asset Allocation Trust |
| | | | |
| 30 | | Wells Fargo Cash Investment Money Market Fund | | Other information (unaudited) |
| | | | | | |
Name and
year of birth | | Position held and length of service* | | Principal occupations during past five years or longer | | Current other public company or investment company directorships |
| Olivia S. Mitchell (Born 1953) | | Trustee, since 2006 | | International Foundation of Employee Benefit Plans Professor, Wharton School of the University of Pennsylvania since 1993. Director of Wharton’s Pension Research Council and Boettner Center on Pensions & Retirement Research, and Research Associate at the National Bureau of Economic Research. Previously, Cornell University Professor from 1978 to 1993. | | Asset Allocation Trust |
| Timothy J. Penny (Born 1951) | | Trustee, since 1996 | | President and Chief Executive Officer of Southern Minnesota Initiative Foundation, a non-profit organization, since 2007 and Senior Fellow at the Humphrey Institute Policy Forum at the University of Minnesota since 1995. Member of the Board of Trustees of NorthStar Education Finance, Inc., a non-profit organization, since 2007. | | Asset Allocation Trust |
| Michael S. Scofield (Born 1943) | | Trustee, since 2010 | | Served on the Investment Company Institute’s Board of Governors and Executive Committee from 2008-2011 as well the Governing Council of the Independent Directors Council from 2006-2011 and the Independent Directors Council Executive Committee from 2008-2011. Chairman of the IDC from 2008-2010. Institutional Investor (Fund Directions) Trustee of Year in 2007. Trustee of the Evergreen Funds complex (and its predecessors) from 1984 to 2010. Chairman of the Evergreen Funds from 2000-2010. Former Trustee of the Mentor Funds. Retired Attorney, Law Offices of Michael S. Scofield. | | Asset Allocation Trust |
| * | Length of service dates reflect the Trustee’s commencement of service with the Trust’s predecessor entities, where applicable. |
Officers
| | | | | | |
Name and
year of birth | | Position held and
length of service | | Principal occupations during past five years or longer | | |
Karla M. Rabusch
(Born 1959) | | President, since 2003 | | Executive Vice President of Wells Fargo Bank, N.A. and President of Wells Fargo Funds Management, LLC since 2003. | | |
Nancy Wiser1
(Born 1967) | | Treasurer, since 2012 | | Executive Vice President of Wells Fargo Funds Management, LLC since 2011. Chief Operating Officer and Chief Compliance Officer at LightBox Capital Management LLC, from 2008 to 2011. | | |
C. David Messman
(Born 1960) | | Secretary, since 2000; Chief Legal Officer, since 2003 | | Senior Vice President and Secretary of Wells Fargo Funds Management, LLC since 2001. Assistant General Counsel of Wells Fargo Bank, N.A. since 2013 and Vice President and Managing Counsel of Wells Fargo Bank, N.A. from 1996 to 2013. | | |
Michael Whitaker
(Born 1967) | | Chief Compliance Officer, since 2016* | | Executive Vice President of Wells Fargo Funds Management, LLC since 2016. Chief Compliance Officer of Fidelity’s Fixed Income Funds and Asset Allocation Funds from 2008 to 2016, Compliance Officer of FMR Co., Inc. from 2014 to 2016, Fidelity Investments Money Management, Inc. from 2014 to 2016, Fidelity Investments from 2007 to 2016. | | |
David Berardi
(Born 1975) | | Assistant Treasurer, since 2009 | | Vice President of Wells Fargo Funds Management, LLC since 2009. Vice President of Evergreen Investment Management Company, LLC from 2008 to 2010. Manager of Fund Reporting and Control for Evergreen Investment Management Company, LLC from 2004 to 2010. | | |
Jeremy DePalma1
(Born 1974) | | Assistant Treasurer, since 2009 | | Senior Vice President of Wells Fargo Funds Management, LLC since 2009. Senior Vice President of Evergreen Investment Management Company, LLC from 2008 to 2010 and head of the Fund Reporting and Control Team within Fund Administration from 2005 to 2010. | | |
| 1 | Nancy Wiser acts as Treasurer of 71 funds in the Fund Complex. Jeremy DePalma acts as Treasurer of 68 funds and Assistant Treasurer of 71 funds in the Fund Complex. |
| 2 | The Statement of Additional Information includes additional information about the Trustees and is available, without charge, upon request, by calling 1-800-222-8222 or by visiting the website at wellsfargofunds.com. |
| * | Michael Whitaker became Chief Compliance Officer effective May 16, 2016. |
| | | | | | |
| Other information (unaudited) | | Wells Fargo Cash Investment Money Market Fund | | | 31 | |
BOARD CONSIDERATION OF INVESTMENT MANAGEMENT AND SUB-ADVISORY AGREEMENTS:
Under the Investment Company Act of 1940 (the “1940 Act”), the Board of Trustees (the “Board”) of Wells Fargo Funds Trust (the “Trust”) must determine annually whether to approve the continuation of the Trust’s investment management and sub-advisory agreements. In this regard, at an in-person meeting held on May 24-25, 2016 (the “Meeting”), the Board, all the members of which have no direct or indirect interest in the investment management and sub-advisory agreements and are not “interested persons” of the Trust, as defined in the 1940 Act (the “Independent Trustees”), reviewed and approved for Wells Fargo Cash Investment Money Market Fund (the “Fund”): (i) an investment management agreement (the “Management Agreement”) with Wells Fargo Funds Management, LLC (“Funds Management”); (ii) an investment sub-advisory agreement with Wells Capital Management Incorporated (“WellsCap”), an affiliate of Funds Management; and (iii) an investment sub-advisory agreement with the WellsCap and Wells Fargo Bank, N.A. d/b/a Wells Capital Management Singapore (“WellsCap Singapore”), an affiliate of Funds Management. The sub-advisory agreements with WellsCap and WellsCap Singapore (the “Sub-Advisers”) are collectively referred to as the Sub-Advisory Agreements, and the Management Agreement and the Sub-Advisory Agreements are collectively referred to as the “Advisory Agreements.”
At the Meeting, the Board considered the factors and reached the conclusions described below relating to the selection of Funds Management and the Sub-Advisers and the approval of the Advisory Agreements. Prior to the Meeting, including at an in-person meeting in April 2016, the Trustees conferred extensively among themselves and with representatives of Funds Management about these matters. Also, the Board has adopted a team-based approach, with each team consisting of a sub-set of Trustees, to assist the full Board in the discharge of its duties in reviewing performance and other matters throughout the year. The Independent Trustees were assisted in their evaluation of the Advisory Agreements by independent legal counsel, from whom they received separate legal advice and with whom they met separately.
In providing information to the Board, Funds Management and the Sub-Advisers were guided by a detailed set of requests for information submitted to them by independent legal counsel on behalf of the Independent Trustees at the start of the Board’s annual contract renewal process earlier in 2016. In considering and approving the Advisory Agreements, the Trustees considered the information they believed relevant, including but not limited to the information discussed below. The Board considered not only the specific information presented in connection with the Meeting, but also the knowledge gained over time through interaction with Funds Management and the Sub-Advisers about various topics. In this regard, the Board reviewed reports of Funds Management at each of its quarterly meetings, which included, among other things, portfolio reviews and performance reports. In addition, the Board and the teams mentioned above confer with portfolio managers at various times throughout the year. The Board did not identify any particular information or consideration that was all-important or controlling, and each individual Trustee may have attributed different weights to various factors.
After its deliberations, the Board unanimously approved the continuation of the Advisory Agreements for a one-year term and determined that the compensation payable to Funds Management and the Sub-Advisers under each of the Advisory Agreements was reasonable. The Board considered the approval of the Advisory Agreements for the Fund as part of its consideration of agreements for funds across the complex, but its approvals were made on a fund-by-fund basis. The following summarizes a number of important, but not necessarily all, factors considered by the Board in support of its approvals.
Nature, extent and quality of services
The Board received and considered various information regarding the nature, extent and quality of services provided to the Fund by Funds Management and the Sub-Adviser under the Advisory Agreements. This information included a description of the investment advisory services and Fund-level administrative services covered by the Management Agreement, as well as, among other things, a summary of the background and experience of senior management of Funds Management, and the qualifications, background, tenure and responsibilities of each of the portfolio managers primarily responsible for the day-to-day portfolio management of the Fund.
The Board evaluated the ability of Funds Management and the Sub-Advisers to attract and retain qualified investment professionals, including research, advisory and supervisory personnel. The Board further considered the compliance programs and compliance records of Funds Management and the Sub-Advisers. In addition, the Board took into account the full range of services provided to the Fund by Funds Management and its affiliates.
Fund performance and expenses
The Board considered the performance results for the Fund over various time periods ended December 31, 2015. The Board considered these results in comparison to the performance of funds in a universe that was determined by
| | | | |
| 32 | | Wells Fargo Cash Investment Money Market Fund | | Other information (unaudited) |
Broadridge Inc. (“Broadridge”) to be similar to the Fund (the “Universe”), and in comparison to other comparative data. Broadridge is an independent provider of investment company data. The Board received a description of the methodology used by Broadridge to select the mutual funds in the performance Universe. The Board noted that the performance of the Fund (Administrator Class) was equal to or in range of the average performance of the Universe for all periods under review. The Board noted that the Fund experienced a portfolio manager change in 2014.
The Board also received and considered information regarding the Fund’s net operating expense ratios and their various components, including actual management fees, custodian and other non-management fees, and Rule 12b-1 and non-Rule 12b-1 shareholder service fees. The Board considered these ratios in comparison to the median ratios of funds in class-specific expense groups that were determined by Broadridge to be similar to the Fund (the “Groups”). The Board received a description of the methodology used by Broadridge to select the mutual funds in the expense Groups and an explanation of how funds comprising expense groups and their expense ratios may vary from year-to-year. Based on the Broadridge reports, the Board noted that the net operating expense ratios of the Fund were lower than or in range of the median net operating expense ratios of the expense Groups.
The Board took into account the Fund performance and expense information provided to it among the factors considered in deciding to re-approve the Advisory Agreements.
Investment management and sub-advisory fee rates
The Board reviewed and considered the contractual fee rates payable by the Fund to Funds Management under the Management Agreement, as well as the contractual fee rates payable by the Fund to Funds Management for class-level administrative services under a Class-Level Administration Agreement, which include class-level transfer agency and sub-transfer agency costs (collectively, the “Management Rates”). The Board also reviewed and considered the contractual investment sub-advisory fee rates that are payable by Funds Management to the Sub-Adviser for investment sub-advisory services.
Among other information reviewed by the Board was a comparison of the Fund’s Management Rates with the average contractual investment management fee rates of funds in the expense Groups at a common asset level as well as transfer agency costs of the funds in the expense Groups. The Board noted that the Management Rates of the Fund were lower than or in range of the sum of these average rates for the Fund’s expense Groups for all share classes.
The Board also received and considered information about the portion of the total management fee that was retained by Funds Management after payment of the fee to the Sub-Adviser for sub-advisory services. In assessing the reasonableness of this amount, the Board received and evaluated information about the nature and extent of responsibilities retained and risks assumed by Funds Management and not delegated to or assumed by the Sub-Advisers, and about Funds Management’s on-going oversight services. However, given the affiliation between Funds Management and the Sub-Advisers, the Board ascribed limited relevance to the allocation of fees between them.
The Board also received and considered information about the nature and extent of services offered and fee rates charged by Funds Management and the Sub-Advisers to other types of clients with investment strategies similar to those of the Fund. In this regard, the Board received information about the significantly greater scope of services, and compliance, reporting and other legal burdens and risks of managing mutual funds compared with those associated with managing assets of non-mutual fund clients such as collective funds or institutional separate accounts.
Based on its consideration of the factors and information it deemed relevant, including those described here, the Board determined that the compensation payable to Funds Management under the Management Agreement and to the Sub-Advisers under the Sub-Advisory Agreements was reasonable, in light of the services covered by the Advisory Agreements.
Profitability
The Board received and considered information concerning the profitability of Funds Management, as well as the profitability of Wells Fargo as a whole, from providing services to the Fund and the fund family as a whole. The Board also received and considered information concerning the profitability of the Sub-Advisers from providing services to the fund family as a whole, noting that the Sub-Advisers’ profitability information with respect to providing services to the Fund was subsumed in the Wells Fargo and Funds Management profitability analysis.
Funds Management reported on the methodologies and estimates used in calculating profitability. Among other things, the Board noted that the levels of profitability reported on a fund-by-fund basis varied widely, depending on factors such as the size and type of fund. Based on its review, the Board did not deem the profits reported by Funds Management or Wells Fargo from its services to the Fund to be at a level that would prevent it from approving the continuation of the Advisory Agreements.
| | | | | | |
| Other information (unaudited) | | Wells Fargo Cash Investment Money Market Fund | | | 33 | |
Economies of scale
With respect to possible economies of scale, the Board noted the existence of breakpoints in the Fund’s management fee structure, which operate generally to reduce the Fund’s expense ratios as the Fund grows in size. It considered that, for a small fund or a fund that shrinks in size, breakpoints conversely can result in higher fee levels. The Board also considered that fee waiver and expense reimbursement arrangements and competitive fee rates at the outset are means of sharing potential economies of scale with shareholders of the Fund and the fund family as a whole. The Board considered Funds Management’s view that any analyses of potential economies of scale in managing a particular fund are inherently limited in light of the joint and common costs and investments that Funds Management incurs across the fund family as a whole.
The Board concluded that the Fund’s fee and expense arrangements, including contractual breakpoints, constituted a reasonable approach to sharing potential economies of scale with the Fund and its shareholders.
Other benefits to Funds Management and the Sub-Advisers
The Board received and considered information regarding potential “fall-out” or ancillary benefits received by Funds Management and its affiliates, including the Sub-Advisers, as a result of their relationships with the Fund. Ancillary benefits could include, among others, benefits directly attributable to other relationships with the Fund and benefits potentially derived from an increase in Funds Management’s and the Sub-Advisers’ business as a result of their relationships with the Fund. The Board noted that various affiliates of Funds Management may receive distribution-related fees, shareholder servicing payments and sub-transfer agency fees in respect of shares sold or held through them and services provided.
The Board also reviewed information about soft dollar credits earned and utilized by the Sub-Advisers, fees earned by Funds Management and the Sub-Advisers from managing a private investment vehicle for the fund family’s securities lending collateral and commissions earned by an affiliated broker from portfolio transactions.
Based on its consideration of the factors and information it deemed relevant, including those described here, the Board did not find that any ancillary benefits received by Funds Management and its affiliates, including the Sub-Advisers, were unreasonable.
Conclusion
At the Meeting, after considering the above-described factors and based on its deliberations and its evaluation of the information described above, the Board unanimously approved the continuation of the Advisory Agreements for a one-year term and determined that the compensation payable to Funds Management and the Sub-Advisers under each of the Advisory Agreements was reasonable.
| | | | |
| 34 | | Wells Fargo Cash Investment Money Market Fund | | List of abbreviations |
The following is a list of common abbreviations for terms and entities that may have appeared in this report.
| ACA | — ACA Financial Guaranty Corporation |
| ADR | — American depositary receipt |
| ADS | — American depositary shares |
| AGC | — Assured Guaranty Corporation |
| AGM | — Assured Guaranty Municipal |
| Ambac | — Ambac Financial Group Incorporated |
| AMT | — Alternative minimum tax |
| BAN | — Bond anticipation notes |
| BHAC | — Berkshire Hathaway Assurance Corporation |
| CAB | — Capital appreciation bond |
| CCAB | — Convertible capital appreciation bond |
| CDA | — Community Development Authority |
| CDO | — Collateralized debt obligation |
| DRIVER | — Derivative inverse tax-exempt receipts |
| DW&P | — Department of Water & Power |
| DWR | — Department of Water Resources |
| ECFA | — Educational & Cultural Facilities Authority |
| EDA | — Economic Development Authority |
| EDFA | — Economic Development Finance Authority |
| ETF | — Exchange-traded fund |
| FDIC | — Federal Deposit Insurance Corporation |
| FFCB | — Federal Farm Credit Banks |
| FGIC | — Financial Guaranty Insurance Corporation |
| FHA | — Federal Housing Administration |
| FHLB | — Federal Home Loan Bank |
| FHLMC | — Federal Home Loan Mortgage Corporation |
| FICO | — The Financing Corporation |
| FNMA | — Federal National Mortgage Association |
| GDR | — Global depositary receipt |
| GNMA | — Government National Mortgage Association |
| HCFR | — Healthcare facilities revenue |
| HEFA | — Health & Educational Facilities Authority |
| HEFAR | — Higher education facilities authority revenue |
| HFA | — Housing Finance Authority |
| HFFA | — Health Facilities Financing Authority |
| HUD | — Department of Housing and Urban Development |
| IDA | — Industrial Development Authority |
| IDAG | — Industrial Development Agency |
| KRW | — Republic of Korea won |
| LIBOR | — London Interbank Offered Rate |
| LIFER | — Long Inverse Floating Exempt Receipts |
| LLC | — Limited liability company |
| LLLP | — Limited liability limited partnership |
| LLP | — Limited liability partnership |
| MBIA | — Municipal Bond Insurance Association |
| MFHR | — Multifamily housing revenue |
| MSTR | — Municipal securities trust receipts |
| MUD | — Municipal Utility District |
| National | — National Public Finance Guarantee Corporation |
| PCFA | — Pollution Control Financing Authority |
| PCL | — Public Company Limited |
| PCR | — Pollution control revenue |
| PFA | — Public Finance Authority |
| PFFA | — Public Facilities Financing Authority |
| PFOTER | — Puttable floating option tax-exempt receipts |
| plc | — Public limited company |
| PUTTER | — Puttable tax-exempt receipts |
| R&D | — Research & development |
| Radian | — Radian Asset Assurance |
| RAN | — Revenue anticipation notes |
| RDA | — Redevelopment Authority |
| RDFA | — Redevelopment Finance Authority |
| REIT | — Real estate investment trust |
| ROC | — Reset option certificates |
| SAVRS | — Select auction variable rate securities |
| SBA | — Small Business Authority |
| SDR | — Swedish depositary receipt |
| SFHR | — Single-family housing revenue |
| SFMR | — Single-family mortgage revenue |
| SPA | — Standby purchase agreement |
| SPDR | — Standard & Poor’s Depositary Receipts |
| SPEAR | — Short Puttable Exempt Adjustable Receipts |
| STRIPS | — Separate trading of registered interest and |
| TAN | — Tax anticipation notes |
| TIPS | — Treasury inflation-protected securities |
| TRAN | — Tax revenue anticipation notes |
| TTFA | — Transportation Trust Fund Authority |
| TVA | — Tennessee Valley Authority |
This page is intentionally left blank.
This page is intentionally left blank.

For more information
More information about Wells Fargo Funds is available free upon request. To obtain literature, please write, email, visit the Fund’s website, or call:
Wells Fargo Funds
P.O. Box 8266
Boston, MA 02266-8266
Email: fundservice@wellsfargo.com
Website: wellsfargofunds.com
Individual investors: 1-800-222-8222
Retail investment professionals: 1-888-877-9275
Institutional investment professionals: 1-866-765-0778
This report and the financial statements contained herein are submitted for the general information of the shareholders of the Fund. If this report is used for promotional purposes, distribution of the report must be accompanied or preceded by a current prospectus. Before investing, please consider the investment objectives, risks, charges, and expenses of the investment. For a current prospectus and, if available, a summary prospectus, containing this information, call 1-800-222-8222 or visit the Fund’s website at wellsfargofunds.com. Read the prospectus carefully before you invest or send money.
Wells Fargo Asset Management (WFAM) is a trade name used by the asset management businesses of Wells Fargo & Company. Wells Fargo Funds Management, LLC, a wholly owned subsidiary of Wells Fargo & Company, provides investment advisory and administrative services for Wells Fargo Funds. Other affiliates of Wells Fargo & Company provide subadvisory and other services for the funds. The funds are distributed by Wells Fargo Funds Distributor, LLC, Member FINRA, an affiliate of Wells Fargo & Company.
NOT FDIC INSURED ¡ NO BANK GUARANTEE ¡ MAY LOSE VALUE
© 2016 Wells Fargo Funds Management, LLC. All rights reserved.
| | |
 | | 245332 09-16 SA302/SAR302 07-16 |
Semi-Annual Report
July 31, 2016

Institutional Money Market Funds

| n | | Wells Fargo Heritage Money Market Fund |

Reduce clutter. Save trees.
Sign up for electronic delivery of prospectuses and shareholder reports at wellsfargo.com/advantagedelivery
Contents
The views expressed and any forward-looking statements are as of July 31, 2016, unless otherwise noted, and are those of the Fund managers and/or Wells Fargo Funds Management, LLC. Discussions of individual securities, or the markets generally, or any Wells Fargo Fund are not intended as individual recommendations. Future events or results may vary significantly from those expressed in any forward-looking statements. The views expressed are subject to change at any time in response to changing circumstances in the market. Wells Fargo Funds Management, LLC and the Fund disclaim any obligation to publicly update or revise any views expressed or forward-looking statements.
NOT FDIC INSURED ¡ NO BANK GUARANTEE ¡ MAY LOSE VALUE
| | | | |
| 2 | | Wells Fargo Heritage Money Market Fund | | Letter to shareholders (unaudited) |

Karla M. Rabusch
President
Wells Fargo Funds
We do not anticipate broad changes to the way we manage our money market funds at this time in order to meet the new rules because we have always emphasized stability of principal and liquidity.
Dear Valued Shareholder:
We are pleased to offer you this semi-annual report for the Wells Fargo Heritage Money Market Fund for the six-month period that ended July 31, 2016. The period was marked by preparation for the new amendments to Rule 2a-7 of the Investment Company Act of 1940 (Rule 2a-7) by the U.S. Securities and Exchange Commission. Meanwhile, the U.S. Federal Reserve (Fed) kept the federal funds target rate between 0.25% and 0.50%.
We are preparing to implement the new money market fund regulations.
The amendments to Rule 2a-7, which governs money market funds, are scheduled to be fully implemented by October 2016. To recap, U.S. Treasury and government money market funds will continue to operate much as they do today, with stable $1.00 net asset values (NAVs). Meanwhile, tax-exempt and prime funds will experience more changes. For starters, these types of funds must separate retail investors, such as individuals, and institutional investors. Second, money market fund boards of directors will have discretion to impose either a liquidity fee of up to 2% on shareholder redemptions or a temporary suspension of redemptions (gate) if a fund’s weekly liquid assets fall below 30% of its total assets and the board determines that the fee or gate is in the best interest of the fund’s shareholders.
| | n | | Retail investors will continue to transact at a stable $1.00 NAV but may be subject to liquidity fees and redemption gates. | |
| | n | | Institutional prime and tax-exempt money market funds will transact at a floating, market-based NAV and may be subject to liquidity fees and redemption gates under special circumstances. Once floating NAVs are implemented, daily share prices will fluctuate along with changes, if any, in the market-based value of the underlying portfolio securities. Our Product Alert titled Wells Fargo Announces Effective Dates for Changes to Certain Money Market Funds featured the intraday price times we will use to continue providing same-day settlement and liquidity to our shareholders. | |
| | n | | Additional requirements included increased disclosure and reporting of fund statistics, such as percentage of liquid assets, shareholder flows, and market-based NAVs. In addition, the new regulations also included tighter diversification requirements and enhanced stress-testing measures. | |
| | n | | We will continue to communicate any changes to our money markets funds with our shareholders. Specifically, Product Alerts can be found at our website: wellsfargofunds.com. Click on Product Information and find them under the Product Alerts tab. | |
While there will be many operational changes ahead, we do not anticipate broad changes to the way we manage our money market funds at this time in order to meet the new rules because we have always emphasized stability of principal and liquidity.
Short-term rates remained steady but low.
The Fed kept the federal funds rate steady. On the growth side of its mandate, U.S. economic activity appeared to maintain a modest pace. Global concerns continued to confront the Fed as it tried to assess future conditions in the U.S. While China’s growth and its markets stabilized post first-quarter downdrafts, it continued to “face considerable challenges,” per Fed Chair Janet Yellen in her
| | | | | | |
| Letter to shareholders (unaudited) | | Wells Fargo Heritage Money Market Fund | | | 3 | |
monetary policy report to Congress. Further, although commodity prices rebounded from first-quarter lows, other worries remained. The strong dollar, which could hamper manufacturing and exports, is one factor. Another is potential fallout from Brexit, the referendum whereby the U.K. voted to leave the European Union. With growth and inflation low, Chair Yellen has argued in her monetary policy report that there is little room to cut rates further but plenty of scope to raise rates if inflation picks up too quickly.
With regard to Brexit, traditional risk assets—such as equities and foreign exchange—experienced volatility and U.S. Treasury securities benefited from a flight to quality. Money markets, however, were relatively immune to this volatility, with both credit spreads and liquidity little changed.
Don’t let short-term uncertainty derail long-term investment goals.
Periods of uncertainty can present challenges, but experience has taught us that maintaining long-term investment goals can be an effective way to plan for the future. To help you create a sound strategy based on your personal goals and risk tolerance, Wells Fargo Funds offers more than 100 mutual funds spanning a wide range of asset classes and investment styles. Although diversification cannot guarantee an investment profit or prevent losses, we believe it can be an effective way to manage investment risk and potentially smooth out overall portfolio performance. We encourage investors to know their investments and to understand that appropriate levels of risk-taking may unlock opportunities.
Thank you for choosing to invest in Wells Fargo Funds. We appreciate your confidence in us and remain committed to helping you meet your financial needs.
Sincerely,

Karla M. Rabusch
President
Wells Fargo Funds
Periods of uncertainty can present challenges, but experience has taught us that maintaining long-term investment goals can be an effective way to plan for the future.
Notice to shareholders
Effective on or before October 5 , 2016 (the “Effective Date”), the Fund will no longer maintain a stable $1.00 net asset value (“NAV”) and will instead transact at its market-based NAV, rounded to four decimal places. As of the Effective Date, the Fund will implement the following multiple intraday price times in order to continue providing same-day settlement and intraday liquidity. We will calculate the NAV at the following times each business day:
| | |
| Same-day settle (ET) | | Next-day settle (ET) |
9 a.m., 12 p.m., and 3 p.m. | | 5 p.m.* |
| | * | Next-day settlement only; daily dividends calculated using 5 p.m. NAV. |
As of the Effective Date, the Fund will also no longer support the following features:
| | n | | National Securities Clearing Corporation (NSCC) trading | |
| | n | | Automated Clearing House (ACH) trading | |
For further information about your Fund, contact your investment professional, visit our website at wellsfargofunds.com, or call us directly at 1-800-222-8222. We are available 24 hours a day, 7 days a week.
| | | | |
| 4 | | Wells Fargo Heritage Money Market Fund | | Performance highlights (unaudited) |
Investment objective
The Fund seeks current income, while preserving capital and liquidity.
Manager
Wells Fargo Funds Management, LLC
Subadvisers
Wells Capital Management Incorporated
Wells Capital Management Singapore
Portfolio managers
Michael C. Bird, CFA®
Jeffrey L. Weaver, CFA®
Laurie White
Average annual total returns (%) as of July 31, 20161
| | | | | | | | | | | | | | | | | | | | | | |
| | | | | | | | | | | | | | Expense ratios2 (%) | |
| | | Inception date | | 1 year | | | 5 year | | | 10 year | | | Gross | | | Net3 | |
| Administrator Class (SHMXX) | | 6-29-1995 | | | 0.13 | | | | 0.03 | | | | 1.03 | | | | 0.34 | | | | 0.34 | |
| Institutional Class (SHIXX) | | 3-31-2000 | | | 0.24 | | | | 0.07 | | | | 1.11 | | | | 0.22 | | | | 0.20 | |
| Select Class (WFJXX) | | 6-29-2007 | | | 0.31 | | | | 0.14 | | | | 1.17 | | | | 0.18 | | | | 0.13 | |
| Service Class (WHTXX) | | 6-30-2010 | | | 0.07 | | | | 0.02 | | | | 1.02 | | | | 0.51 | | | | 0.43 | |
Yield summary (%) as of July 31, 20163
| | | | | | | | | | | | | | |
| | | Administrator
Class | | Institutional
Class | | | Select
Class | | | Service
Class | |
| 7-day current yield | | 0.20 | | | 0.33 | | | | 0.39 | | | | 0.10 | |
| 7-day compound yield | | 0.20 | | | 0.33 | | | | 0.40 | | | | 0.10 | |
| 30-day simple yield | | 0.21 | | | 0.34 | | | | 0.41 | | | | 0.11 | |
| 30-day compound yield | | 0.21 | | | 0.34 | | | | 0.41 | | | | 0.11 | |
Figures quoted represent past performance, which is no guarantee of future results, and do not reflect taxes that a shareholder may pay on fund distributions or the redemption of fund shares. Investment returns will fluctuate. The Fund’s yield figures more closely reflect the current earnings of the Fund than the total return figures. Current performance may be lower or higher than the performance data quoted, which assumes the reinvestment of dividends and capital gains. Current month-end performance is available on the Fund’s website, wellsfargofunds.com.
Each class is sold without a front-end sales charge or contingent deferred sales charge.
An investment in a money market fund is not insured or guaranteed by the Federal Deposit Insurance Corporation or any other government agency. Although the Fund seeks to preserve the value of your investment at $1.00 per share, it is possible to lose money by investing in a money market fund.
Please see footnotes on page 5.
| | | | | | |
| Performance highlights (unaudited) | | Wells Fargo Heritage Money Market Fund | | | 5 | |
|
| Portfolio composition as of July 31, 20164 |
|
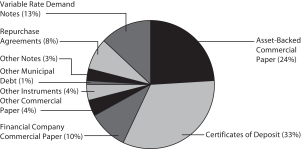 |
|
| Weighted average maturity as of July 31, 20165 |
10 days |
|
| Weighted average life as of July 31, 20166 |
14 days |
|
| Effective maturity distribution as of July 31, 20164 |
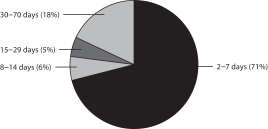 |
| 1 | Historical performance shown for Select Class shares prior to their inception reflects the performance of Institutional Class shares, and includes the higher expenses applicable to Institutional Class shares. If these expenses had not been included, returns would be higher. Historical performance shown for Service Class shares prior to their inception reflects the performance of Administrator Class shares and has not been adjusted to reflect the higher expenses applicable to Service Class shares. If these expenses had been adjusted, returns would be lower. |
| 2 | Reflects the expense ratios as stated in the most recent prospectuses. The expense ratios shown are subject to change and may differ from the annualized expense ratios shown in the financial highlights of this report. |
| 3 | The manager has contractually committed through May 31, 2017, to waive fees and/or reimburse expenses to the extent necessary to cap the Fund’s Total Annual Fund Operating Expenses After Fee Waiver at 0.35% for Administrator Class, 0.20% for Institutional Class, 0.13% for Select Class, and 0.43% for Service Class. After this time, the cap may be increased or the commitment to maintain the cap may be terminated only with the approval of the Board of Trustees. Brokerage commissions, stamp duty fees, interest, taxes, acquired fund fees and expenses, and extraordinary expenses are excluded from the cap. Without this cap, the Fund’s returns would have been lower. Without waived fees and/or reimbursed expenses, the Fund’s 7-day current yield would have been 0.18%, 0.30%, 0.34%, 0.01% for Administrator Class, Institutional Class, Select Class, and Service Class, respectively. |
| 4 | Amounts are calculated based on the total investments of the Fund. These amounts are subject to change and may have changed since the date specified. |
| 5 | Weighted Average Maturity (WAM): WAM is an average of the effective maturities of all securities held in the portfolio, weighted by each security’s percentage of total investments. The maturity of a portfolio security is the period remaining until the date on which the principal amount is unconditionally required to be paid, or in the case of a security called for redemption, the date on which the redemption payment is unconditionally required to be made. WAM calculations allow for the maturities of certain securities with demand features or periodic interest rate resets to be shortened. WAM is a way to measure a fund’s sensitivity to potential interest rate changes. Rule 2a-7 under the Investment Company Act of 1940 requires money market funds to maintain a WAM of 60 calendar days or less. WAM is subject to change and may have changed since the date specified. |
| 6 | Weighted Average Life (WAL): WAL is an average of the final maturities of all securities held in the portfolio, weighted by their percentage of total investments. The maturity of a portfolio security is the period remaining until the date on which the principal amount is unconditionally required to be paid, or in the case of a security called for redemption, the date on which the redemption payment is unconditionally required to be made. In contrast to WAM, the calculation of WAL allows for the maturities of certain securities with demand features to be shortened, but not the periodic interest rate resets. WAL is a way to measure a fund’s potential sensitivity to credit spread changes. Rule 2a-7 under the Investment Company Act of 1940 requires money market funds to maintain a WAL of 120 calendar days or less. WAL is subject to change and may have changed since the date specified. |
| | | | |
| 6 | | Wells Fargo Heritage Money Market Fund | | Fund expenses (unaudited) |
As a shareholder of the Fund, you incur ongoing costs, including management fees, shareholder servicing fees, and other Fund expenses. This example is intended to help you understand your ongoing costs (in dollars) of investing in the Fund and to compare these costs with the ongoing costs of investing in other mutual funds.
The example is based on an investment of $1,000 invested at the beginning of the six-month period and held for the entire period from February 1, 2016 to July 31, 2016.
Actual expenses
The “Actual” line of the table below provides information about actual account values and actual expenses. You may use the information in this line, together with the amount you invested, to estimate the expenses that you paid over the period. Simply divide your account value by $1,000 (for example, an $8,600 account value divided by $1,000 = 8.6), then multiply the result by the number in the “Actual” line under the heading entitled “Expenses paid during period” for your applicable class of shares to estimate the expenses you paid on your account during this period.
Hypothetical example for comparison purposes
The “Hypothetical” line of the table below provides information about hypothetical account values and hypothetical expenses based on the Fund’s actual expense ratio and an assumed rate of return of 5% per year before expenses, which is not the Fund’s actual return. The hypothetical account values and expenses may not be used to estimate the actual ending account balance or expenses you paid for the period. You may use this information to compare the ongoing costs of investing in the Fund and other funds. To do so, compare this 5% hypothetical example with the 5% hypothetical examples that appear in the shareholder reports of the other funds.
Please note that the expenses shown in the table are meant to highlight your ongoing costs only and do not reflect any transactional costs, such as sales charges (loads) and contingent deferred sales charges. Therefore, the “Hypothetical” line of the table is useful in comparing ongoing costs only and will not help you determine the relative total costs of owning different funds. In addition, if these transactional costs were included, your cost would have been higher.
| | | | | | | | | | | | | | | | |
| | | Beginning
account value
2-1-2016 | | | Ending
account value
7-31-2016 | | | Expenses
paid during
the period¹ | | | Annualized net
expense ratio | |
Administrator Class | | | | | | | | | | | | | | | | |
Actual | | $ | 1,000.00 | | | $ | 1,001.11 | | | $ | 1.65 | | | | 0.33 | % |
Hypothetical (5% return before expenses) | | $ | 1,000.00 | | | $ | 1,023.29 | | | $ | 1.66 | | | | 0.33 | % |
Institutional Class | | | | | | | | | | | | | | | | |
Actual | | $ | 1,000.00 | | | $ | 1,001.76 | | | $ | 1.00 | | | | 0.20 | % |
Hypothetical (5% return before expenses) | | $ | 1,000.00 | | | $ | 1,023.93 | | | $ | 1.01 | | | | 0.20 | % |
Select Class | | | | | | | | | | | | | | | | |
Actual | | $ | 1,000.00 | | | $ | 1,002.10 | | | $ | 0.65 | | | | 0.13 | % |
Hypothetical (5% return before expenses) | | $ | 1,000.00 | | | $ | 1,024.28 | | | $ | 0.66 | | | | 0.13 | % |
Service Class | | | | | | | | | | | | | | | | |
Actual | | $ | 1,000.00 | | | $ | 1,000.61 | | | $ | 2.14 | | | | 0.43 | % |
Hypothetical (5% return before expenses) | | $ | 1,000.00 | | | $ | 1,022.79 | | | $ | 2.17 | | | | 0.43 | % |
| 1 | Expenses paid is equal to the annualized net expense ratio of each class multiplied by the average account value over the period, multiplied by the number of days in the most recent fiscal half-year divided by the number of days in the fiscal year (to reflect the one-half-year period). |
| | | | | | |
| Portfolio of investments—July 31, 2016 (unaudited) | | Wells Fargo Heritage Money Market Fund | | | 7 | |
| | | | | | | | | | | | | | | | |
| Security name | | Interest rate | | | Maturity date | | | Principal | | | Value | |
| | | | |
Certificates of Deposit: 33.24% | | | | | | | | | | | | | | | | |
ABN AMRO Funding LLC | | | 0.40 | % | | | 8-1-2016 | | | $ | 302,000,000 | | | $ | 302,000,000 | |
Australia & New Zealand Banking Group | | | 0.30 | | | | 8-1-2016 | | | | 551,000,000 | | | | 551,000,000 | |
Bank of Montreal | | | 0.44 | | | | 8-1-2016 | | | | 350,000,000 | | | | 350,000,000 | |
Bank of Montreal | | | 0.44 | | | | 8-2-2016 | | | | 306,000,000 | | | | 306,000,000 | |
Citibank (New York) | | | 0.53 | | | | 8-2-2016 | | | | 41,000,000 | | | | 41,000,000 | |
Citibank (New York) | | | 0.55 | | | | 8-26-2016 | | | | 109,000,000 | | | | 109,000,000 | |
Cooperatieve Centrale ± | | | 0.82 | | | | 9-7-2016 | | | | 114,000,000 | | | | 114,000,000 | |
Credit Agricole SA | | | 0.32 | | | | 8-1-2016 | | | | 856,000,000 | | | | 856,000,000 | |
DG Bank (New York) | | | 0.62 | | | | 9-16-2016 | | | | 15,000,000 | | | | 14,998,466 | |
DG Bank (New York) | | | 0.65 | | | | 8-8-2016 | | | | 163,000,000 | | | | 163,000,000 | |
DG Bank (New York) | | | 0.65 | | | | 8-8-2016 | | | | 91,000,000 | | | | 91,001,757 | |
DNB Nor Bank ASA | | | 0.30 | | | | 8-1-2016 | | | | 754,000,000 | | | | 754,000,000 | |
HSBC Bank plc | | | 0.35 | | | | 8-1-2016 | | | | 878,000,000 | | | | 878,000,000 | |
HSBC Bank plc ± | | | 0.80 | | | | 8-1-2016 | | | | 166,000,000 | | | | 166,000,000 | |
KBC Bank | | | 0.32 | | | | 8-1-2016 | | | | 774,000,000 | | | | 774,000,000 | |
Mitsubishi Trust & Bank | | | 0.64 | | | | 8-5-2016 | | | | 193,000,000 | | | | 193,000,000 | |
Mizuho Corporate Bank (z) | | | 0.50 | | | | 8-4-2016 | | | | 270,000,000 | | | | 269,988,753 | |
Mizuho Corporate Bank (z) | | | 0.72 | | | | 8-3-2016 | | | | 154,000,000 | | | | 153,993,851 | |
Mizuho Corporate Bank (z) | | | 0.75 | | | | 9-9-2016 | | | | 77,000,000 | | | | 76,937,552 | |
National Bank of Canada | | | 0.30 | | | | 8-1-2016 | | | | 386,000,000 | | | | 386,000,000 | |
National Bank of Kuwait | | | 0.33 | | | | 8-1-2016 | | | | 542,200,000 | | | | 542,200,000 | |
Natixis (Cayman Islands) | | | 0.30 | | | | 8-1-2016 | | | | 408,600,000 | | | | 408,600,000 | |
NBAD Americas NV | | | 0.37 | | | | 8-1-2016 | | | | 735,000,000 | | | | 735,000,000 | |
Norinchukin Bank | | | 0.53 | | | | 8-5-2016 | | | | 191,000,000 | | | | 191,000,000 | |
Norinchukin Bank | | | 0.64 | | | | 9-15-2016 | | | | 71,000,000 | | | | 70,999,993 | |
Royal Bank of Canada | | | 0.35 | | | | 8-1-2016 | | | | 413,000,000 | | | | 413,000,000 | |
Standard Chartered Bank | | | 0.65 | | | | 8-15-2016 | | | | 95,000,000 | | | | 95,000,000 | |
Standard Chartered Bank | | | 0.65 | | | | 8-22-2016 | | | | 53,000,000 | | | | 53,000,000 | |
State Street Bank & Trust Company ± | | | 0.82 | | | | 9-2-2016 | | | | 114,000,000 | | | | 114,000,000 | |
Sumitomo Mitsui Banking Corporation | | | 0.55 | | | | 9-7-2016 | | | | 113,000,000 | | | | 112,997,679 | |
Sumitomo Mitsui Banking Corporation | | | 0.62 | | | | 8-5-2016 | | | | 208,000,000 | | | | 208,000,000 | |
Sumitomo Mitsui Banking Corporation | | | 0.65 | | | | 8-10-2016 | | | | 77,000,000 | | | | 77,002,871 | |
Sumitomo Trust & Banking Corporation | | | 0.46 | | | | 8-1-2016 | | | | 385,000,000 | | | | 385,000,000 | |
Sumitomo Trust & Banking Corporation | | | 0.65 | | | | 9-23-2016 | | | | 152,000,000 | | | | 152,000,000 | |
Swedbank | | | 0.30 | | | | 8-1-2016 | | | | 619,000,000 | | | | 619,000,000 | |
| | | | |
Total Certificates of Deposit (Cost $10,726,720,922) | | | | | | | | | | | | | | | 10,726,720,922 | |
| | | | | | | | | | | | | | | | |
| | | | |
Commercial Paper: 38.62% | | | | | | | | | | | | | | | | |
| | | | |
| Asset-Backed Commercial Paper: 23.51% | | | | | | | | | | | | | | | | |
Alpine Securitization Limited 144A(z) | | | 0.55 | | | | 8-8-2016 | | | | 54,000,000 | | | | 53,994,216 | |
Alpine Securitization Limited 144A(z) | | | 0.57 | | | | 8-11-2016 | | | | 76,000,000 | | | | 75,987,967 | |
Alpine Securitization Limited 144A(z) | | | 0.57 | | | | 8-12-2016 | | | | 75,000,000 | | | | 74,986,938 | |
Anglesea Funding LLC 144A± | | | 0.62 | | | | 9-7-2016 | | | | 100,000,000 | | | | 100,000,000 | |
Anglesea Funding LLC 144A(z) | | | 0.50 | | | | 8-1-2016 | | | | 147,000,000 | | | | 147,000,000 | |
Anglesea Funding LLC 144A± | | | 0.62 | | | | 9-7-2016 | | | | 48,000,000 | | | | 48,000,000 | |
Anglesea Funding LLC 144A± | | | 0.62 | | | | 8-10-2016 | | | | 70,000,000 | | | | 70,000,000 | |
Anglesea Funding LLC 144A± | | | 0.63 | | | | 9-19-2016 | | | | 113,000,000 | | | | 113,000,000 | |
Anglesea Funding LLC 144A± | | | 0.64 | | | | 9-29-2016 | | | | 58,000,000 | | | | 58,000,000 | |
Anglesea Funding LLC 144A± | | | 0.65 | | | | 8-2-2016 | | | | 225,000,000 | | | | 225,000,000 | |
The accompanying notes are an integral part of these financial statements.
| | | | |
| 8 | | Wells Fargo Heritage Money Market Fund | | Portfolio of investments—July 31, 2016 (unaudited) |
| | | | | | | | | | | | | | | | |
| Security name | | Interest rate | | | Maturity date | | | Principal | | | Value | |
| | | | |
| Asset-Backed Commercial Paper (continued) | | | | | | | | | | | | | | | | |
Antalis SA 144A(z) | | | 0.67 | % | | | 8-8-2016 | | | $ | 24,060,000 | | | $ | 24,056,866 | |
Antalis SA 144A(z) | | | 0.67 | | | | 8-9-2016 | | | | 36,000,000 | | | | 35,994,640 | |
Antalis SA 144A(z) | | | 0.70 | | | | 9-6-2016 | | | | 35,210,000 | | | | 35,185,353 | |
Antalis SA 144A(z) | | | 0.70 | | | | 9-9-2016 | | | | 22,000,000 | | | | 21,983,317 | |
Atlantic Asset Securitization Corporation 144A± | | | 0.63 | | | | 12-5-2016 | | | | 136,000,000 | | | | 135,999,683 | |
Atlantic Asset Securitization Corporation 144A± | | | 0.63 | | | | 12-9-2016 | | | | 141,000,000 | | | | 140,999,203 | |
Atlantic Asset Securitization Corporation 144A± | | | 0.64 | | | | 12-16-2016 | | | | 150,000,000 | | | | 149,999,433 | |
Barton Capital Corporation 144A(z) | | | 0.55 | | | | 8-5-2016 | | | | 20,000,000 | | | | 19,998,778 | |
Barton Capital Corporation 144A(z) | | | 0.62 | | | | 8-1-2016 | | | | 31,000,000 | | | | 31,000,000 | |
Barton Capital Corporation 144A(z) | | | 0.64 | | | | 9-7-2016 | | | | 75,000,000 | | | | 74,950,667 | |
Bedford Row Funding Corporation 144A± | | | 0.82 | | | | 8-1-2016 | | | | 114,000,000 | | | | 114,000,000 | |
Bennington Stark Capital Company LLC 144A(z) | | | 0.50 | | | | 8-1-2016 | | | | 140,000,000 | | | | 140,000,000 | |
Bennington Stark Capital Company LLC 144A(z) | | | 0.50 | | | | 8-2-2016 | | | | 190,000,000 | | | | 189,997,361 | |
Bennington Stark Capital Company LLC 144A(z) | | | 0.50 | | | | 8-3-2016 | | | | 78,000,000 | | | | 77,997,833 | |
Bennington Stark Capital Company LLC 144A(z) | | | 0.50 | | | | 8-8-2016 | | | | 49,000,000 | | | | 48,995,236 | |
Cancara Asset Securitization Limited (z) | | | 0.56 | | | | 8-26-2016 | | | | 36,000,000 | | | | 35,986,000 | |
Chesham Finance Limited 144A(z) | | | 0.50 | | | | 8-1-2016 | | | | 201,000,000 | | | | 201,000,000 | |
Concord Minutemen Capital Company 144A(z) | | | 0.47 | | | | 8-2-2016 | | | | 89,000,000 | | | | 88,998,838 | |
Concord Minutemen Capital Company 144A(z) | | | 0.47 | | | | 8-3-2016 | | | | 94,000,000 | | | | 93,997,546 | |
Concord Minutemen Capital Company 144A(z) | | | 0.47 | | | | 8-4-2016 | | | | 156,000,000 | | | | 155,993,890 | |
Concord Minutemen Capital Company 144A(z) | | | 0.47 | | | | 8-5-2016 | | | | 100,000,000 | | | | 99,994,778 | |
Crown Point Capital Company LLC 144A± | | | 0.64 | | | | 8-22-2016 | | | | 72,000,000 | | | | 72,000,000 | |
Crown Point Capital Company LLC 144A± | | | 0.67 | | | | 11-7-2016 | | | | 192,000,000 | | | | 192,000,000 | |
Crown Point Capital Company LLC 144A± | | | 0.69 | | | | 10-25-2016 | | | | 187,000,000 | | | | 187,000,000 | |
DCAT LLC (z) | | | 0.65 | | | | 8-2-2016 | | | | 14,000,000 | | | | 13,999,747 | |
DCAT LLC (z) | | | 0.67 | | | | 8-8-2016 | | | | 19,000,000 | | | | 18,997,525 | |
DCAT LLC (z) | | | 0.70 | | | | 8-22-2016 | | | | 24,280,000 | | | | 24,270,086 | |
Gotham Funding Corporation 144A(z) | | | 0.54 | | | | 8-4-2016 | | | | 116,200,000 | | | | 116,194,771 | |
Gotham Funding Corporation 144A(z) | | | 0.57 | | | | 8-10-2016 | | | | 80,000,000 | | | | 79,988,600 | |
Gotham Funding Corporation 144A(z) | | | 0.58 | | | | 8-29-2016 | | | | 91,000,000 | | | | 90,958,949 | |
Gotham Funding Corporation 144A(z) | | | 0.60 | | | | 8-26-2016 | | | | 63,000,000 | | | | 62,973,750 | |
Halkin Finance LLC 144A(z) | | | 0.53 | | | | 8-1-2016 | | | | 45,000,000 | | | | 45,000,000 | |
Halkin Finance LLC 144A(z) | | | 0.55 | | | | 8-3-2016 | | | | 97,000,000 | | | | 96,997,036 | |
Institutional Secured Funding LLC 144A(z) | | | 0.55 | | | | 8-1-2016 | | | | 261,000,000 | | | | 261,000,000 | |
Institutional Secured Funding LLC 144A(z) | | | 0.65 | | | | 8-12-2016 | | | | 37,000,000 | | | | 36,992,651 | |
Institutional Secured Funding LLC 144A(z) | | | 0.65 | | | | 8-16-2016 | | | | 63,000,000 | | | | 62,982,938 | |
Institutional Secured Funding LLC 144A(z) | | | 0.65 | | | | 8-18-2016 | | | | 50,000,000 | | | | 49,984,653 | |
Institutional Secured Funding LLC 144A(z) | | | 0.69 | | | | 9-1-2016 | | | | 213,000,000 | | | | 212,873,443 | |
Kells Funding LLC 144A(z) | | | 0.59 | | | | 8-9-2016 | | | | 74,000,000 | | | | 73,990,298 | |
Kells Funding LLC 144A(z) | | | 0.59 | | | | 8-23-2016 | | | | 96,000,000 | | | | 95,965,387 | |
Kells Funding LLC 144A(z) | | | 0.64 | | | | 9-20-2016 | | | | 42,000,000 | | | | 41,962,667 | |
Kells Funding LLC 144A(z) | | | 0.64 | | | | 9-22-2016 | | | | 36,000,000 | | | | 35,966,720 | |
Legacy Capital Company 144A(z) | | | 0.50 | | | | 8-1-2016 | | | | 80,000,000 | | | | 80,000,000 | |
Lexington Parker Capital Company LLC 144A(z) | | | 0.47 | | | | 8-1-2016 | | | | 165,000,000 | | | | 165,000,000 | |
Lexington Parker Capital Company LLC 144A(z) | | | 0.47 | | | | 8-2-2016 | | | | 87,000,000 | | | | 86,998,864 | |
Lexington Parker Capital Company LLC 144A(z) | | | 0.47 | | | | 8-3-2016 | | | | 94,000,000 | | | | 93,997,546 | |
Lexington Parker Capital Company LLC 144A(z) | | | 0.47 | | | | 8-4-2016 | | | | 60,000,000 | | | | 59,997,650 | |
LMA Americas LLC 144A(z) | | | 0.55 | | | | 9-2-2016 | | | | 60,000,000 | | | | 59,970,667 | |
LMA Americas LLC 144A(z) | | | 0.56 | | | | 8-11-2016 | | | | 34,000,000 | | | | 33,994,711 | |
Manhattan Asset Funding Company LLC 144A(z) | | | 0.54 | | | | 8-3-2016 | | | | 169,000,000 | | | | 168,994,930 | |
Matchpoint Finance plc 144A(z) | | | 0.45 | | | | 8-1-2016 | | | | 60,000,000 | | | | 60,000,000 | |
The accompanying notes are an integral part of these financial statements.
| | | | | | |
| Portfolio of investments—July 31, 2016 (unaudited) | | Wells Fargo Heritage Money Market Fund | | | 9 | |
| | | | | | | | | | | | | | | | |
| Security name | | Interest rate | | | Maturity date | | | Principal | | | Value | |
| | | | |
| Asset-Backed Commercial Paper (continued) | | | | | | | | | | | | | | | | |
Matchpoint Finance plc 144A(z) | | | 0.68 | % | | | 9-1-2016 | | | $ | 41,000,000 | | | $ | 40,975,992 | |
Mountcliff Funding LLC 144A(z) | | | 0.49 | | | | 8-1-2016 | | �� | | 327,000,000 | | | | 327,000,000 | |
Nieuw Amsterdam Receivable 144A(z) | | | 0.56 | | | | 8-17-2016 | | | | 40,000,000 | | | | 39,990,044 | |
Nieuw Amsterdam Receivable 144A(z) | | | 0.70 | | | | 8-8-2016 | | | | 74,000,000 | | | | 73,989,928 | |
Regency Markets No.1 LLC 144A(z) | | | 0.55 | | | | 8-12-2016 | | | | 110,627,000 | | | | 110,608,409 | |
Regency Markets No.1 LLC 144A(z) | | | 0.55 | | | | 8-15-2016 | | | | 32,000,000 | | | | 31,993,156 | |
Regency Markets No.1 LLC 144A(z) | | | 0.55 | | | | 8-31-2016 | | | | 117,773,000 | | | | 117,719,021 | |
Ridgefield Funding Company LLC 144A± | | | 0.68 | | | | 9-23-2016 | | | | 193,000,000 | | | | 193,000,000 | |
Starbird Funding Corporation 144A(z) | | | 0.63 | | | | 8-1-2016 | | | | 70,000,000 | | | | 70,000,000 | |
Starbird Funding Corporation 144A(z) | | | 0.63 | | | | 8-2-2016 | | | | 37,000,000 | | | | 36,999,353 | |
Starbird Funding Corporation 144A(z) | | | 0.63 | | | | 8-3-2016 | | | | 53,000,000 | | | | 52,998,145 | |
Starbird Funding Corporation 144A(z) | | | 0.64 | | | | 8-10-2016 | | | | 60,000,000 | | | | 59,990,400 | |
Starbird Funding Corporation 144A± | | | 0.64 | | | | 9-16-2016 | | | | 112,000,000 | | | | 112,000,000 | |
Starbird Funding Corporation 144A(z) | | | 0.68 | | | | 9-1-2016 | | | | 39,000,000 | | | | 38,977,163 | |
Versailles Commercial Paper LLC 144A± | | | 0.63 | | | | 12-8-2016 | | | | 107,000,000 | | | | 107,000,000 | |
Versailles Commercial Paper LLC 144A(z) | | | 0.70 | | | | 8-1-2016 | | | | 60,000,000 | | | | 60,000,000 | |
Victory Receivables 144A(z) | | | 0.54 | | | | 8-2-2016 | | | | 40,000,000 | | | | 39,999,400 | |
Victory Receivables 144A(z) | | | 0.55 | | | | 8-8-2016 | | | | 36,500,000 | | | | 36,496,097 | |
Victory Receivables 144A(z) | | | 0.57 | | | | 8-22-2016 | | | | 64,000,000 | | | | 63,978,720 | |
Victory Receivables 144A(z) | | | 0.58 | | | | 8-30-2016 | | | | 125,000,000 | | | | 124,941,597 | |
Victory Receivables 144A(z) | | | 0.60 | | | | 8-25-2016 | | | | 25,000,000 | | | | 24,990,000 | |
Victory Receivables 144A(z) | | | 0.60 | | | | 8-26-2016 | | | | 112,000,000 | | | | 111,953,334 | |
Victory Receivables 144A(z) | | | 0.60 | | | | 9-7-2016 | | | | 74,000,000 | | | | 73,954,367 | |
Working Capital Management Company 144A(z) | | | 0.58 | | | | 8-1-2016 | | | | 72,000,000 | | | | 72,000,000 | |
| | | | |
| | | | | | | | | | | | | | | 7,585,707,258 | |
| | | | | | | | | | | | | | | | |
| | | | |
| Financial Company Commercial Paper: 11.41% | | | | | | | | | | | | | | | | |
ANZ Banking Group Limited 144A(z) | | | 0.57 | | | | 8-2-2016 | | | | 73,000,000 | | | | 72,998,844 | |
ANZ Banking Group Limited 144A(z) | | | 0.65 | | | | 8-22-2016 | | | | 75,000,000 | | | | 74,971,563 | |
ANZ Banking Group Limited 144A(z) | | | 0.65 | | | | 8-26-2016 | | | | 75,000,000 | | | | 74,966,146 | |
ANZ Banking Group Limited 144A(z) | | | 0.65 | | | | 9-2-2016 | | | | 74,000,000 | | | | 73,957,244 | |
Banco De Credito E Inversiones 144A(z) | | | 0.85 | | | | 8-29-2016 | | | | 110,000,000 | | | | 109,927,278 | |
Banco De Credito e Inversiones 144A(z) | | | 0.85 | | | | 8-30-2016 | | | | 26,600,000 | | | | 26,581,786 | |
Bank of Nova Scotia 144A(z) | | | 0.60 | | | | 9-21-2016 | | | | 68,000,000 | | | | 67,942,200 | |
Banque et Caisse d’Epargne de l’Etat (z) | | | 0.66 | | | | 9-1-2016 | | | | 75,000,000 | | | | 74,957,375 | |
BNP Paribas (New York) (z) | | | 0.78 | | | | 8-15-2016 | | | | 19,000,000 | | | | 18,994,237 | |
Caisse Centrale Desjardins du Quebec 144A(z) | | | 0.40 | | | | 8-2-2016 | | | | 206,000,000 | | | | 205,997,711 | |
Caisse Centrale Desjardins du Quebec 144A(z) | | | 0.52 | | | | 8-9-2016 | | | | 71,000,000 | | | | 70,991,796 | |
Caisse Centrale Desjardins du Quebec 144A(z) | | | 0.54 | | | | 8-8-2016 | | | | 97,000,000 | | | | 96,989,888 | |
Caisse Centrale Desjardins du Quebec 144A(z) | | | 0.63 | | | | 9-15-2016 | | | | 69,000,000 | | | | 68,945,663 | |
Caisse Centrale Desjardins du Quebec 144A(z) | | | 0.65 | | | | 9-12-2016 | | | | 74,000,000 | | | | 73,943,883 | |
Caisse Centrale Desjardins du Quebec 144A(z) | | | 0.67 | | | | 9-29-2016 | | | | 35,000,000 | | | | 34,961,568 | |
CDP Financial Incorporated 144A(z) | | | 0.57 | | | | 9-15-2016 | | | | 20,000,000 | | | | 19,985,750 | |
CDP Financial Incorporated 144A(z) | | | 0.58 | | | | 8-11-2016 | | | | 33,500,000 | | | | 33,494,603 | |
Commonwealth Bank of Australia 144A(z) | | | 0.62 | | | | 9-6-2016 | | | | 77,000,000 | | | | 76,952,260 | |
Commonwealth Bank of Australia 144A± | | | 0.83 | | | | 8-17-2016 | | | | 112,000,000 | | | | 112,000,000 | |
Dexia Credit Local (z) | | | 0.65 | | | | 9-12-2016 | | | | 216,000,000 | | | | 215,836,200 | |
HSBC Bank plc 144A(z) | | | 0.63 | | | | 9-9-2016 | | | | 54,000,000 | | | | 53,963,145 | |
Macquarie Bank Limited 144A(z) | | | 0.55 | | | | 8-1-2016 | | | | 150,000,000 | | | | 150,000,000 | |
Macquarie Bank Limited 144A(z) | | | 0.55 | | | | 8-18-2016 | | | | 75,000,000 | | | | 74,980,521 | |
Macquarie Bank Limited 144A(z) | | | 0.55 | | | | 8-19-2016 | | | | 117,000,000 | | | | 116,967,825 | |
The accompanying notes are an integral part of these financial statements.
| | | | |
| 10 | | Wells Fargo Heritage Money Market Fund | | Portfolio of investments—July 31, 2016 (unaudited) |
| | | | | | | | | | | | | | | | |
| Security name | | Interest rate | | | Maturity date | | | Principal | | | Value | |
| | | | |
| Financial Company Commercial Paper (continued) | | | | | | | | | | | | | | | | |
Macquarie Bank Limited 144A(z) | | | 0.62 | % | | | 9-6-2016 | | | $ | 200,000,000 | | | $ | 199,876,000 | |
Macquarie Bank Limited 144A(z) | | | 0.64 | | | | 9-1-2016 | | | | 36,000,000 | | | | 35,980,160 | |
Macquarie Bank Limited 144A(z) | | | 0.65 | | | | 9-7-2016 | | | | 72,000,000 | | | | 71,952,270 | |
National Australia Bank Limited 144A± | | | 0.80 | | | | 8-4-2016 | | | | 151,000,000 | | | | 151,000,000 | |
National Securities Clearing Corporation 144A(z) | | | 0.50 | | | | 8-8-2016 | | | | 22,000,000 | | | | 21,997,861 | |
Nationwide Building Society 144A(z) | | | 0.64 | | | | 8-15-2016 | | | | 127,000,000 | | | | 126,968,391 | |
Nationwide Building Society 144A(z) | | | 0.70 | | | | 9-2-2016 | | | | 66,000,000 | | | | 65,958,933 | |
Nederlandse Waterschapsbank NV 144A(z) | | | 0.56 | | | | 8-8-2016 | | | | 141,000,000 | | | | 140,984,647 | |
Nederlandse Waterschapsbank NV 144A(z) | | | 0.63 | | | | 9-1-2016 | | | | 145,000,000 | | | | 144,921,962 | |
NRW Bank 144A(z) | | | 0.44 | | | | 8-2-2016 | | | | 149,000,000 | | | | 148,998,179 | |
NRW Bank 144A(z) | | | 0.61 | | | | 9-16-2016 | | | | 118,000,000 | | | | 117,908,026 | |
NV Bank Nederlandse Gemeenten 144A(z) | | | 0.63 | | | | 8-31-2016 | | | | 141,000,000 | | | | 140,925,975 | |
Ontario Teachers Finance Trust 144A(z) | | | 0.66 | | | | 9-21-2016 | | | | 54,000,000 | | | | 53,949,510 | |
PSP Capital Incorporated 144A(z) | | | 0.60 | | | | 9-14-2016 | | | | 8,000,000 | | | | 7,994,133 | |
PSP Capital Incorporated 144A(z) | | | 0.60 | | | | 9-19-2016 | | | | 23,000,000 | | | | 22,981,217 | |
Shagang South Asia Trading Company (z) | | | 1.00 | | | | 8-4-2016 | | | | 24,000,000 | | | | 23,998,000 | |
Suncorp Group Limited 144A(z) | | | 0.74 | | | | 9-6-2016 | | | | 77,000,000 | | | | 76,943,020 | |
Suncorp Group Limited 144A(z) | | | 0.75 | | | | 9-8-2016 | | | | 103,000,000 | | | | 102,918,458 | |
Suncorp Group Limited 144A(z) | | | 0.83 | | | | 9-29-2016 | | | | 25,000,000 | | | | 24,965,993 | |
| | | | |
| | | | | | | | | | | | | | | 3,682,530,221 | |
| | | | | | | | | | | | | | | | |
| | | | |
| Other Commercial Paper: 3.70% | | | | | | | | | | | | | | | | |
Caisse Des Depots et Consignations 144A(z) | | | 0.49 | | | | 8-2-2016 | | | | 55,000,000 | | | | 54,999,251 | |
China International Marine Containers (z) | | | 1.00 | | | | 8-2-2016 | | | | 259,000,000 | | | | 258,992,806 | |
China International Marine Containers (z) | | | 1.00 | | | | 8-3-2016 | | | | 84,000,000 | | | | 83,995,333 | |
China Power International Development (z) | | | 1.00 | | | | 8-4-2016 | | | | 65,000,000 | | | | 64,994,583 | |
China Power International Development (z) | | | 1.00 | | | | 8-3-2016 | | | | 83,000,000 | | | | 82,995,389 | |
China Shipping Container Lines (z) | | | 1.00 | | | | 8-4-2016 | | | | 100,000,000 | | | | 99,991,667 | |
China Shipping Container Lines (z) | | | 1.00 | | | | 8-1-2016 | | | | 134,000,000 | | | | 134,000,000 | |
Erste Abwicklungsanstalt 144A(z) | | | 0.66 | | | | 8-17-2016 | | | | 20,000,000 | | | | 19,994,133 | |
Erste Abwicklungsanstalt 144A(z) | | | 0.66 | | | | 8-22-2016 | | | | 78,000,000 | | | | 77,969,970 | |
Sinochem Capital Company Limited (z) | | | 0.47 | | | | 8-1-2016 | | | | 114,000,000 | | | | 114,000,000 | |
Sinochem Capital Company Limited (z) | | | 0.47 | | | | 8-9-2016 | | | | 106,000,000 | | | | 105,988,929 | |
Toyota Motor Credit Corporation (z) | | | 0.60 | | | | 8-3-2016 | | | | 94,000,000 | | | | 93,996,867 | |
| | | | |
| | | | | | | | | | | | | | | 1,191,918,928 | |
| | | | | | | | | | | | | | | | |
| | | | |
Total Commercial Paper (Cost $12,460,156,407) | | | | | | | | | | | | | | | 12,460,156,407 | |
| | | | | | | | | | | | | | | | |
| | | | |
Municipal Obligations: 12.99% | | | | | | | | | | | | | | | | |
| | | | |
Alabama: 0.09% | | | | | | | | | | | | | | | | |
| | | | |
| Variable Rate Demand Note ø: 0.09% | | | | | | | | | | | | | | | | |
Tuscaloosa County AL IDA Gulf Opportunity Zone Hunt Refining Project Series J (Industrial Development Revenue, Bank of Nova Scotia LOC) | | | 0.46 | | | | 4-1-2028 | | | | 30,000,000 | | | | 30,000,000 | |
| | | | | | | | | | | | | | | | |
| | | | |
California: 1.05% | | | | | | | | | | | | | | | | |
| | | | |
| Other Municipal Debt: 0.06% | | | | | | | | | | | | | | | | |
Los Angeles CA Metropolitan Transportation (Transportation Revenue) | | | 0.52 | | | | 8-2-2016 | | | | 20,000,000 | | | | 20,000,000 | |
| | | | | | | | | | | | | | | | |
The accompanying notes are an integral part of these financial statements.
| | | | | | |
| Portfolio of investments—July 31, 2016 (unaudited) | | Wells Fargo Heritage Money Market Fund | | | 11 | |
| | | | | | | | | | | | | | | | |
| Security name | | Interest rate | | | Maturity date | | | Principal | | | Value | |
| | | | |
| Variable Rate Demand Notes ø: 0.99% | | | | | | | | | | | | | | | | |
California CDA Sutter Health Series C (Health Revenue, AGM Insured, Citibank NA LIQ) 144A | | | 0.46 | % | | | 8-15-2032 | | | $ | 12,825,000 | | | $ | 12,825,000 | |
Irvine CA Unified School District 09-1B (Tax Revenue, Sumitomo Mitsui Banking LOC) | | | 0.43 | | | | 9-1-2051 | | | | 13,225,000 | | | | 13,225,000 | |
Modesto CA Water Certificate of Participation Sereis A (Water & Sewer Revenue, JPMorgan Chase & Company LOC, AGC Insured) | | | 0.43 | | | | 10-1-2036 | | | | 30,255,000 | | | | 30,255,000 | |
Orange County CA Water District Series A (Water Revenue, Lloyds TSB Bank plc LOC) (Water & Sewer Revenue, Citibank NA LOC) | | | 0.43 | | | | 8-1-2042 | | | | 37,765,000 | | | | 37,765,000 | |
RBC Municipal Products Incorporated Trust Water District Series E (Water & Sewer Revenue, Royal Bank of Canada LOC) 144A | | | 0.48 | | | | 4-5-2019 | | | | 50,000,000 | | | | 50,000,000 | |
Sacramento County CA Housing Authority Shadowood Apartments Project Issue A (Housing Revenue, FHLMC LIQ) | | | 0.46 | | | | 12-1-2022 | | | | 18,500,000 | | | | 18,500,000 | |
San Bernardino County CA Housing Evergreen Apartments Series A (Housing Revenue, FNMA Insured, FNMA LIQ) | | | 0.44 | | | | 5-15-2029 | | | | 16,600,000 | | | | 16,600,000 | |
San Diego County CA Regional Transportation Community Limited Tax Series B (Tax Revenue, JPMorgan Chase & Company SPA) | | | 0.43 | | | | 4-1-2038 | | | | 34,230,000 | | | | 34,230,000 | |
San Diego County CA Water Authority (Water & Sewer Revenue) | | | 0.44 | | | | 9-8-2016 | | | | 20,000,000 | | | | 19,996,562 | |
San Francisco City & County CA Airports Commission Variable Reference second Series A-1 (Airport Revenue, Bank of America NA LOC) | | | 0.44 | | | | 5-1-2030 | | | | 22,720,000 | | | | 22,720,000 | |
San Francisco City & County CA Airports Commission Variable Reference second Series A-2 (Airport Revenue, Bank of America NA LOC) | | | 0.44 | | | | 5-1-2030 | | | | 20,000,000 | | | | 20,000,000 | |
San Francisco City & County CA Certificate of Participation Series B001 (Miscellaneous Revenue, Morgan Stanley Bank LIQ) 144A | | | 0.54 | | | | 11-1-2041 | | | | 6,000,000 | | | | 6,000,000 | |
Santa Clara Valley California Transportation Authority Series 2008A (Tax Revenue, State Street Bank & Trust Company SPA) | | | 0.43 | | | | 6-1-2026 | | | | 36,500,000 | | | | 36,500,000 | |
| | | | |
| | | | | | | | | | | | | | | 318,616,562 | |
| | | | | | | | | | | | | | | | |
| | | | |
Colorado: 1.27% | | | | | | | | | | | | | | | | |
| | | | |
| Variable Rate Demand Notes ø: 1.27% | | | | | | | | | | | | | | | | |
Avon CO Traer Creek Metropolitan District Refunding Series 2014 (GO Revenue, BNP Paribas LOC) | | | 0.48 | | | | 10-1-2030 | | | | 19,163,000 | | | | 19,163,000 | |
Colorado HFA Class I Series A-1 (Housing Revenue, FHLB SPA) | | | 0.50 | | | | 10-1-2034 | | | | 33,680,000 | | | | 33,680,000 | |
Colorado HFA Class I Series B-1 (Housing Revenue, FHLB LIQ) | | | 0.50 | | | | 10-1-2038 | | | | 14,000,000 | | | | 14,000,000 | |
Colorado HFA Class II Series A-2 (Housing Revenue, FHLB SPA) | | | 0.44 | | | | 10-1-2033 | | | | 6,320,000 | | | | 6,320,000 | |
Colorado HFA MFHR Class I Series A-1 (Housing Revenue, FHLB LIQ) | | | 0.44 | | | | 10-1-2036 | | | | 24,620,000 | | | | 24,620,000 | |
Colorado HFA MFHR Class I Series A-1 (Housing Revenue, FHLB SPA) | | | 0.50 | | | | 4-1-2036 | | | | 20,180,000 | | | | 20,180,000 | |
Colorado HFA MFHR Class I Series A-1 (Housing Revenue, FHLB SPA) | | | 0.44 | | | | 10-1-2033 | | | | 15,145,000 | | | | 15,145,000 | |
Colorado HFA MFHR Project B-2 (Housing Revenue, FHLB SPA) | | | 0.48 | | | | 5-1-2052 | | | | 106,695,000 | | | | 106,695,000 | |
Colorado Southern Ute Indian Tribe Reservation Series 2001 (Industrial Development Revenue) | | | 0.45 | | | | 11-1-2031 | | | | 24,000,000 | | | | 24,000,000 | |
Colorado Southern Ute Indian Tribe Reservation Series 2007 (Miscellaneous Revenue) | | | 0.53 | | | | 1-1-2027 | | | | 46,430,000 | | | | 46,430,000 | |
Colorado Springs CO Utilities Series A (Utilities Revenue, Bank of America NA SPA) | | | 0.45 | | | | 11-1-2023 | | | | 56,500,000 | | | | 56,500,000 | |
Colorado Springs CO Utilities Series C (Utilities Revenue, Royal Bank of Canada SPA) | | | 0.45 | | | | 11-1-2028 | | | | 41,955,000 | | | | 41,955,000 | |
| | | | |
| | | | | | | | | | | | | | | 408,688,000 | |
| | | | | | | | | | | | | | | | |
| | | | |
Connecticut: 0.31% | | | | | | | | | | | | | | | | |
| | | | |
| Variable Rate Demand Note ø: 0.31% | | | | | | | | | | | | | | | | |
Connecticut Series C (GO Revenue, Bank of America NA SPA) | | | 0.45 | | | | 5-15-2034 | | | | 101,000,000 | | | | 101,000,000 | |
| | | | | | | | | | | | | | | | |
The accompanying notes are an integral part of these financial statements.
| | | | |
| 12 | | Wells Fargo Heritage Money Market Fund | | Portfolio of investments—July 31, 2016 (unaudited) |
| | | | | | | | | | | | | | | | |
| Security name | | Interest rate | | | Maturity date | | | Principal | | | Value | |
| | | | |
District of Columbia: 0.20% | | | | | | | | | | | | | | | | |
| | | | |
| Variable Rate Demand Notes ø: 0.20% | | | | | | | | | | | | | | | | |
District of Columbia University Revenue American University Series A (Education Revenue, Royal Bank of Canada LOC) | | | 0.44 | % | | | 10-1-2036 | | | $ | 25,000,000 | | | $ | 25,000,000 | |
Metropolitan Washington District of Columbia Airports Sub Series A-1 (Airport Revenue, Royal Bank of Canada LOC) | | | 0.46 | | | | 10-1-2039 | | | | 41,000,000 | | | | 41,000,000 | |
| | | | |
| | | | | | | | | | | | | | | 66,000,000 | |
| | | | | | | | | | | | | | | | |
| | | | |
Florida: 0.66% | | | | | | | | | | | | | | | | |
| | | | |
| Variable Rate Demand Notes ø: 0.66% | | | | | | | | | | | | | | | | |
Jacksonville FL Capital Projects Series 2008-A (Utilities Revenue, Bank of America NA LOC) | | | 0.47 | | | | 10-1-2034 | | | | 31,665,000 | | | | 31,665,000 | |
Miami Dade County FL Special Obligation Juvenile Courthouse Series B (Miscellaneous Revenue, TD Bank NA LOC, Ambac Insured) | | | 0.42 | | | | 4-1-2043 | | | | 17,000,000 | | | | 17,000,000 | |
Orlando FL Utilities Commission Series 1 (Utilities Revenue, JPMorgan Chase & Company SPA) | | | 0.44 | | | | 10-1-2033 | | | | 65,435,000 | | | | 65,435,000 | |
Orlando FL Utilities Commission System Series 2015B (Utilities Revenue, TD Bank NA SPA) | | | 0.43 | | | | 10-1-2039 | | | | 51,830,000 | | | | 51,830,000 | |
Tender Option Bond Trust Receipts/Certificates Broward County Airport (Airport Revenue, Royal Bank of Canada LOC, Royal Bank of Canada LIQ) 144A | | | 0.48 | | | | 10-1-2020 | | | | 47,025,000 | | | | 47,025,000 | |
| | | | |
| | | | | | | | | | | | | | | 212,955,000 | |
| | | | | | | | | | | | | | | | |
| | | | |
Georgia: 0.41% | | | | | | | | | | | | | | | | |
| | | | |
| Other Municipal Debt: 0.06% | | | | | | | | | | | | | | | | |
Municipal Electricity Authority of Georgia (Utilities Revenue) | | | 0.52 | | | | 8-12-2016 | | | | 17,587,000 | | | | 17,587,000 | |
| | | | | | | | | | | | | | | | |
| | | | |
| Variable Rate Demand Notes ø: 0.35% | | | | | | | | | | | | | | | | |
JP Morgan Chase PUTTER/DRIVER Trust Series (Miscellaneous Revenue, Societe Generale LOC, National/FGIC Insured, Societe Generale LIQ) 144A | | | 0.50 | | | | 1-1-2035 | | | | 33,650,000 | | | | 33,650,000 | |
Macon-Bibb County GA Industrial Authority Development Kumho Tire Georgia Incorporated Series A (Industrial Development Revenue, Korea Development Bank LOC) | | | 0.65 | | | | 12-1-2022 | | | | 30,000,000 | | | | 30,000,000 | |
Macon-Bibb County GA Industrial Authority Development Kumho Tire Georgia Incorporated Series A (Industrial Development Revenue, Korea Development Bank LOC) | | | 0.65 | | | | 12-1-2022 | | | | 50,000,000 | | | | 50,000,000 | |
| | | | |
| | | | | | | | | | | | | | | 113,650,000 | |
| | | | | | | | | | | | | | | | |
| | | | |
Illinois: 0.53% | | | | | | | | | | | | | | | | |
| | | | |
| Variable Rate Demand Notes ø: 0.53% | | | | | | | | | | | | | | | | |
Illinois Development Finance Authority Francis W Parker School Project (Education Revenue, BMO Harris Bank NA LOC) | | | 0.46 | | | | 4-1-2029 | | | | 23,700,000 | | | | 23,700,000 | |
Illinois Development Finance Authority Lyric Opera Chicago Project (Miscellaneous Revenue, Northern Trust Company LOC) | | | 0.45 | | | | 12-1-2028 | | | | 40,800,000 | | | | 40,800,000 | |
Illinois Housing Development Foxview I & II Apartments (Housing Revenue, FHLMC LIQ) | | | 0.44 | | | | 1-1-2041 | | | | 29,000,000 | | | | 29,000,000 | |
Illinois Toll Highway Authority Series A1 (Transportation Revenue, AGM Insured, JPMorgan Chase & Company SPA) | | | 0.46 | | | | 1-1-2031 | | | | 77,445,000 | | | | 77,445,000 | |
| | | | |
| | | | | | | | | | | | | | | 170,945,000 | |
| | | | | | | | | | | | | | | | |
The accompanying notes are an integral part of these financial statements.
| | | | | | |
| Portfolio of investments—July 31, 2016 (unaudited) | | Wells Fargo Heritage Money Market Fund | | | 13 | |
| | | | | | | | | | | | | | | | |
| Security name | | Interest rate | | | Maturity date | | | Principal | | | Value | |
| | | | |
Louisiana: 0.09% | | | | | | | | | | | | | | | | |
| | | | |
| Variable Rate Demand Notes ø: 0.09% | | | | | | | | | | | | | | | | |
East Baton Rouge Parish LA Sewerage Commission Revenue Series B005 (Water & Sewer Revenue, Morgan Stanley Bank LIQ) 144A | | | 0.54 | % | | | 2-1-2045 | | | $ | 16,280,000 | | | $ | 16,280,000 | |
Louisiana PFA Coca Cola Bottling Company Project (Industrial Development Revenue, U.S. Bank NA LOC) | | | 0.44 | | | | 4-2-2023 | | | | 12,125,000 | | | | 12,125,000 | |
| | | | |
| | | | | | | | | | | | | | | 28,405,000 | |
| | | | | | | | | | | | | | | | |
| | | | |
Maine: 0.51% | | | | | | | | | | | | | | | | |
| | | | |
| Variable Rate Demand Notes ø: 0.51% | | | | | | | | | | | | | | | | |
Maine Housing Authority Series B-2 (Housing Revenue, State Street Bank & Trust Company SPA) | | | 0.45 | | | | 11-15-2037 | | | | 28,000,000 | | | | 28,000,000 | |
Maine Housing Authority Series D (Housing Revenue, Royal Bank of Canada SPA) | | | 0.45 | | | | 11-15-2039 | | | | 55,000,000 | | | | 55,000,000 | |
Maine Housing Authority Series E-3 (Housing Revenue, Citibank NA SPA) | | | 0.45 | | | | 11-15-2038 | | | | 15,000,000 | | | | 15,000,000 | |
Maine Housing Authority Series F (Housing Revenue, Citibank NA LIQ) | | | 0.45 | | | | 11-15-2032 | | | | 39,585,000 | | | | 39,585,000 | |
Portland ME Pension Bonds (GO Revenue, Sumitomo Mitsui Banking SPA) | | | 0.49 | | | | 6-1-2026 | | | | 28,075,000 | | | | 28,075,000 | |
| | | | |
| | | | | | | | | | | | | | | 165,660,000 | |
| | | | | | | | | | | | | | | | |
| | | | |
Massachusetts: 0.59% | | | | | | | | | | | | | | | | |
| | | | |
| Variable Rate Demand Notes ø: 0.59% | | | | | | | | | | | | | | | | |
Massachusetts Department of Transportation Series A6 (Transportation Revenue, TD Bank NA SPA) | | | 0.00 | | | | 1-1-2029 | | | | 45,000,000 | | | | 45,000,000 | |
Massachusetts Department of Transportation Series A7 (Transportation Revenue, Sumitomo Mitsui Banking SPA) | | | 0.46 | | | | 1-1-2039 | | | | 71,745,000 | | | | 71,745,000 | |
Massachusetts Department of Transportation Serries A1 (Transportation Revenue, Citibank NA LOC) | | | 0.43 | | | | 1-1-2037 | | | | 24,500,000 | | | | 24,500,000 | |
Massachusetts Water Resources Authority Series E (Water & Sewer Revenue, JPMorgan Chase & Company SPA) | | | 0.47 | | | | 8-1-2037 | | | | 49,180,000 | | | | 49,180,000 | |
| | | | |
| | | | | | | | | | | | | | | 190,425,000 | |
| | | | | | | | | | | | | | | | |
| | | | |
Michigan: 0.35% | | | | | | | | | | | | | | | | |
| | | | |
| Variable Rate Demand Notes ø: 0.35% | | | | | | | | | | | | | | | | |
Jackson County MI Hospital Finance Authority Allegiance Health Series A (Health Revenue, JPMorgan Chase & Company LOC) | | | 0.47 | | | | 6-1-2036 | | | | 31,350,000 | | | | 31,350,000 | |
Michigan Finance Authority Series A (Miscellaneous Revenue, JPMorgan Chase & Company LOC) | | | 0.48 | | | | 9-1-2053 | | | | 49,760,000 | | | | 49,760,000 | |
Michigan Housing Development Authority Series A (Housing Revenue, AGM Insured, Fortis Bank SA SPA) | | | 0.59 | | | | 4-1-2042 | | | | 2,690,000 | | | | 2,690,000 | |
Michigan Housing Development Authority Series D (Housing Revenue, Bank of Tokyo-Mitsubishi SPA) | | | 0.51 | | | | 10-1-2039 | | | | 29,000,000 | | | | 29,000,000 | |
| | | | |
| | | | | | | | | | | | | | | 112,800,000 | |
| | | | | | | | | | | | | | | | |
| | | | |
Minnesota: 0.11% | | | | | | | | | | | | | | | | |
| | | | |
| Variable Rate Demand Notes ø: 0.11% | | | | | | | | | | | | | | | | |
Minnesota Office of Higher Education Student A (Education Revenue, U.S. Bank NA LOC) | | | 0.45 | | | | 12-1-2043 | | | | 12,225,000 | | | | 12,225,000 | |
NorthStar Student Loan Trust II (Education Revenue, Royal Bank of Canada LOC) | | | 0.45 | | | | 10-1-2042 | | | | 22,758,000 | | | | 22,758,000 | |
| | | | |
| | | | | | | | | | | | | | | 34,983,000 | |
| | | | | | | | | | | | | | | | |
The accompanying notes are an integral part of these financial statements.
| | | | |
| 14 | | Wells Fargo Heritage Money Market Fund | | Portfolio of investments—July 31, 2016 (unaudited) |
| | | | | | | | | | | | | | | | |
| Security name | | Interest rate | | | Maturity date | | | Principal | | | Value | |
| | | | |
Mississippi: 0.12% | | | | | | | | | | | | | | | | |
| | | | |
| Variable Rate Demand Note ø: 0.12% | | | | | | | | | | | | | | | | |
Mississippi Business Finance Commisision Gulf Opportunity Zone Chevron USA Incorporated (Industrial Development Revenue) | | | 0.44 | % | | | 12-1-2030 | | | $ | 37,000,000 | | | $ | 37,000,000 | |
| | | | | | | | | | | | | | | | |
| | | | |
Nebraska: 0.15% | | | | | | | | | | | | | | | | |
| | | | |
| Variable Rate Demand Notes ø: 0.15% | | | | | | | | | | | | | | | | |
Nebraska Investment Finance Authority Single Family Housing Series B (Housing Revenue, FHLB SPA) | | | 0.46 | | | | 9-1-2038 | | | | 25,400,000 | | | | 25,400,000 | |
Nebraska Investment Finance Authority Single Family Housing Seriies F (Housing Revenue, GNMA/FNMA/FHLMC Insured, FHLB SPA) | | | 0.46 | | | | 3-1-2038 | | | | 21,875,000 | | | | 21,875,000 | |
| | | | |
| | | | | | | | | | | | | | | 47,275,000 | |
| | | | | | | | | | | | | | | | |
| | | | |
Nevada: 0.38% | | | | | | | | | | | | | | | | |
| | | | |
| Variable Rate Demand Note ø: 0.38% | | | | | | | | | | | | | | | | |
Clark County NV Airport Lien Series C-1 (Airport Revenue, JPMorgan Chase & Company LOC) | | | 0.45 | | | | 7-1-2040 | | | | 122,900,000 | | | | 122,900,000 | |
| | | | | | | | | | | | | | | | |
| | | | |
New Hampshire: 0.03% | | | | | | | | | | | | | | | | |
| | | | |
| Variable Rate Demand Note ø: 0.03% | | | | | | | | | | | | | | | | |
New Hampshire HEFA Tilton School Issue Series 2006 (Education Revenue, TD Bank NA LOC) | | | 0.43 | | | | 2-1-2036 | | | | 11,000,000 | | | | 11,000,000 | |
| | | | | | | | | | | | | | | | |
| | | | |
New York: 3.22% | | | | | | | | | | | | | | | | |
| | | | |
| Variable Rate Demand Notes ø: 3.22% | | | | | | | | | | | | | | | | |
New York Dormitory Authority Secondary Issues Floater Series B-4 (Tax Revenue, Morgan Stanley Bank LIQ) 144A | | | 0.54 | | | | 3-15-2040 | | | | 16,000,000 | | | | 16,000,000 | |
New York Dormitory Authority Debt City University Consolidated 5th General Resolution Series E (Education Revenue, TD Bank NA LOC) | | | 0.43 | | | | 7-1-2031 | | | | 35,620,000 | | | | 35,620,000 | |
New York Dormitory Authority Series A (Health Revenue, FNMA Insured, FNMA LIQ) | | | 0.44 | | | | 11-15-2036 | | | | 11,280,000 | | | | 11,280,000 | |
New York HFA 20 River Terrace Series A (Housing Revenue, FNMA Insured, FNMA LIQ) | | | 0.45 | | | | 5-15-2034 | | | | 2,500,000 | | | | 2,500,000 | |
New York HFA 605 West 42 Street Series B (Housing Revenue, Bank of China LOC) | | | 0.83 | | | | 5-1-2048 | | | | 216,550,000 | | | | 216,550,000 | |
New York HFA Biltmore Tower (Housing Revenue, FNMA Insured, FNMA LIQ) | | | 0.48 | | | | 5-15-2034 | | | | 37,300,000 | | | | 37,300,000 | |
New York HFA Manhattan West Residential Housing Series B-2 (Housing Revenue, Bank of China LOC) | | | 1.05 | | | | 11-1-2049 | | | | 32,200,000 | | | | 32,200,000 | |
New York HFA Series A (Housing Revenue, FHLMC LIQ) | | | 0.42 | | | | 11-1-2037 | | | | 22,600,000 | | | | 22,600,000 | |
New York HFA Series A (Housing Revenue, FNMA Insured, FNMA LIQ) | | | 0.45 | | | | 11-15-2036 | | | | 16,800,000 | | | | 16,800,000 | |
New York HFA 625 57Th Street Series A-2 (Housing Revenue, Bank of New York Mellon LOC) | | | 0.43 | | | | 5-1-2049 | | | | 31,650,000 | | | | 31,650,000 | |
New York HFA 625 W 57TH Street Series A (Housing Revenue, Bank of New York Mellon LOC) | | | 0.45 | | | | 5-1-2049 | | | | 30,000,000 | | | | 30,000,000 | |
New York HFA Shore Hill Series A (Housing Revenue, FHLMC LIQ) | | | 0.45 | | | | 5-1-2045 | | | | 19,500,000 | | | | 19,500,000 | |
New York HFA Taxable Variable 222 East 44TH Street Series B (Housing Revenue, Bank of China LOC) | | | 0.84 | | | | 5-1-2050 | | | | 8,000,000 | | | | 8,000,000 | |
New York HFA Riverside Center 2 Series A-2 (Housing Revenue, Bank of America NA LOC) | | | 0.45 | | | | 11-1-2046 | | | | 26,000,000 | | | | 26,000,000 | |
New York Metropolitan Transportation Authority Sub Series G-2 (Transportation Revenue, TD Bank NA LOC) | | | 0.00 | | | | 11-1-2032 | | | | 48,090,000 | | | | 48,090,000 | |
The accompanying notes are an integral part of these financial statements.
| | | | | | |
| Portfolio of investments—July 31, 2016 (unaudited) | | Wells Fargo Heritage Money Market Fund | | | 15 | |
| | | | | | | | | | | | | | | | |
| Security name | | Interest rate | | | Maturity date | | | Principal | | | Value | |
| | | | |
| Variable Rate Demand Notes ø (continued) | | | | | | | | | | | | | | | | |
New York NY Health & Hospital Corporation Series C (Health Revenue, TD Bank NA LOC) | | | 0.42 | % | | | 2-15-2031 | | | $ | 20,000,000 | | | $ | 20,000,000 | |
New York NY Housing Development Corporation 201 Pearl Street Development Series A (Housing Revenue, FNMA Insured, FNMA LIQ) | | | 0.45 | | | | 10-15-2041 | | | | 9,000,000 | | | | 9,000,000 | |
New York NY Subseries A-4 (GO Revenue, Sumitomo Bank Limited LOC) | | | 0.43 | | | | 10-1-2041 | | | | 29,910,000 | | | | 29,910,000 | |
New York Taxable Trust Floater Series Yeshiva University (Education Revenue, Citibank NA LIQ) 144A | | | 0.54 | | | | 9-1-2024 | | | | 39,000,000 | | | | 39,000,000 | |
New York Taxable Trust Floater Series Yeshiva University (Education Revenue, Citibank NA LIQ) 144A | | | 0.54 | | | | 9-1-2024 | | | | 80,500,000 | | | | 80,500,000 | |
New York Urban Development Corporate Series A3A (Tax Revenue, JPMorgan Chase & Company SPA) | | | 0.46 | | | | 3-15-2033 | | | | 63,525,000 | | | | 63,525,000 | |
New York Urban Development Corporate Series A3C (Tax Revenue, JPMorgan Chase & Company SPA) | | | 0.46 | | | | 3-15-2033 | | | | 64,015,000 | | | | 64,015,000 | |
New York Urban Development Corporation Series A3D (Tax Revenue, JPMorgan Chase & Company SPA) | | | 0.46 | | | | 3-15-2033 | | | | 70,515,000 | | | | 70,515,000 | |
RBC Municipal Products Incorporated Trust Series E-51 for Invesco Van Kampen New York Value Income Trust (Miscellaneous Revenue, Royal Bank of Canada
LOC) 144A(i) | | | 0.94 | | | | 7-1-2017 | | | | 69,395,000 | | | | 69,395,000 | |
Syracuse NY IDAG University Series A (Education Revenue, U.S. Bank NA LOC) | | | 0.44 | | | | 12-1-2035 | | | | 39,800,000 | | | | 39,800,000 | |
| | | | |
| | | | | | | | | | | | | | | 1,039,750,000 | |
| | | | | | | | | | | | | | | | |
| | | | |
North Carolina: 0.11% | | | | | | | | | | | | | | | | |
| | | | |
| Variable Rate Demand Notes ø: 0.11% | | | | | | | | | | | | | | | | |
Charlotte Mecklenburg NC Hospital Authority Carolinas Health Care System Series 2007E (Health Revenue, TD Bank NA LOC, AGM Insured) | | | 0.43 | | | | 1-15-2044 | | | | 30,120,000 | | | | 30,120,000 | |
Roanoke Rapids NC Music & Entertainment District Project (Tax Revenue, Bank of America NA LOC) | | | 0.45 | | | | 7-1-2027 | | | | 6,540,000 | | | | 6,540,000 | |
| | | | |
| | | | | | | | | | | | | | | 36,660,000 | |
| | | | | | | | | | | | | | | | |
| | | | |
Ohio: 0.16% | | | | | | | | | | | | | | | | |
| | | | |
| Variable Rate Demand Notes ø: 0.16% | | | | | | | | | | | | | | | | |
Cleveland-Cuyahoga County OH Carnagie 89th Garage & Service Center LLC Project Series 2007 (Health Revenue, JPMorgan Chase & Company LOC) | | | 0.43 | | | | 1-1-2037 | | | | 28,340,000 | | | | 28,340,000 | |
Ohio Air Quality Development Authority Andersons Marathon Ethanol LLC Project Series 2007 (Resource Recovery Revenue, CoBank LOC) | | | 0.51 | | | | 3-1-2032 | | | | 23,800,000 | | | | 23,800,000 | |
| | | | |
| | | | | | | | | | | | | | | 52,140,000 | |
| | | | | | | | | | | | | | | | |
| | | | |
Other: 0.40% | | | | | | | | | | | | | | | | |
| | | | |
| Variable Rate Demand Notes ø: 0.40% | | | | | | | | | | | | | | | | |
FHLMC MFHR Series M004 Class A (Housing Revenue, FHLMC LIQ) | | | 0.50 | | | | 1-15-2042 | | | | 42,815,675 | | | | 42,815,675 | |
FHLMC MFHR Series M011 Class A (Housing Revenue, FHLMC LIQ) | | | 0.54 | | | | 8-15-2021 | | | | 865,000 | | | | 865,000 | |
FHLMC MFHR Series M017 Class A (Housing Revenue, FHLMC LIQ) | | | 0.52 | | | | 8-15-2016 | | | | 71,677,000 | | | | 71,677,000 | |
FHLMC MFHR Series M021 Class A (Housing Revenue, FHLMC LIQ) | | | 0.49 | | | | 6-15-2036 | | | | 11,940,000 | | | | 11,940,000 | |
| | | | |
| | | | | | | | | | | | | | | 127,297,675 | |
| | | | | | | | | | | | | | | | |
| | | | |
Pennsylvania: 0.38% | | | | | | | | | | | | | | | | |
| | | | |
| Other Municipal Debt: 0.05% | | | | | | | | | | | | | | | | |
Philadelphia PA Series CC-2 (Miscellaneous Revenue) | | | 0.70 | | | | 8-1-2016 | | | | 17,000,000 | | | | 17,000,000 | |
| | | | | | | | | | | | | | | | |
The accompanying notes are an integral part of these financial statements.
| | | | |
| 16 | | Wells Fargo Heritage Money Market Fund | | Portfolio of investments—July 31, 2016 (unaudited) |
| | | | | | | | | | | | | | | | |
| Security name | | Interest rate | | | Maturity date | | | Principal | | | Value | |
| | | | |
| Variable Rate Demand Notes ø: 0.33% | | | | | | | | | | | | | | | | |
Pennsylvania HFA Series 88-B (Housing Revenue, TD Bank NA SPA) | | | 0.44 | % | | | 10-1-2036 | | | $ | 13,075,000 | | | $ | 13,075,000 | |
Philadelphia PA Gas Works Company Series D (Utilities Revenue, Royal Bank of Canada LOC) | | | 0.44 | | | | 8-1-2031 | | | | 31,100,000 | | | | 31,100,000 | |
Philadelphia PA School District Series A (GO Revenue, Bank of America NA LOC) | | | 0.45 | | | | 6-1-2026 | | | | 41,520,000 | | | | 41,520,000 | |
Pittsburgh PA Water & Sewer Auhority 1st Lien Series B2 (Water & Sewer Revenue, Royal Bank of Canada LOC) | | | 0.44 | | | | 9-1-2039 | | | | 21,045,000 | | | | 21,045,000 | |
| | | | |
| | | | | | | | | | | | | | | 106,740,000 | |
| | | | | | | | | | | | | | | | |
| | | | |
South Carolina: 0.16% | | | | | | | | | | | | | | | | |
| | | | |
| Other Municipal Debt: 0.13% | | | | | | | | | | | | | | | | |
South Carolina Public Service Authority (Utilities Revenue) | | | 0.52 | | | | 8-23-2016 | | | | 1,436,000 | | | | 1,436,000 | |
South Carolina Public Service Authority (Utilities Revenue) | | | 0.52 | | | | 8-23-2016 | | | | 14,000,000 | | | | 14,000,000 | |
South Carolina Public Service Authority (Utilities Revenue) | | | 0.53 | | | | 8-30-2016 | | | | 26,678,000 | | | | 26,678,000 | |
| | | | |
| | | | | | | | | | | | | | | 42,114,000 | |
| | | | | | | | | | | | | | | | |
| | | | |
| Variable Rate Demand Note ø: 0.03% | | | | | | | | | | | | | | | | |
South Carolina Jobs EDA South Carolina Generating Company Incorporated Project (Industrial Development Revenue, TD Bank NA LOC) | | | 0.46 | | | | 12-1-2038 | | | | 9,200,000 | | | | 9,200,000 | |
| | | | | | | | | | | | | | | | |
| | | | |
Tennessee: 0.27% | | | | | | | | | | | | | | | | |
| | | | |
| Variable Rate Demand Notes ø: 0.27% | | | | | | | | | | | | | | | | |
Montgomery County TN Industrial Development Bonds Hankook Tire Manufacturing Project Series A (Industrial Development Revenue, Kookmin Bank LOC) | | | 0.60 | | | | 12-1-2024 | | | | 60,000,000 | | | | 60,000,000 | |
Montgomery County TN Industrial Development Hankook Bonds Tire Manufacturing Project Series A (Industrial Development Revenue, Kookmin Bank LOC) | | | 0.60 | | | | 12-1-2024 | | | | 26,700,000 | | | | 26,700,000 | |
| | | | |
| | | | | | | | | | | | | | | 86,700,000 | |
| | | | | | | | | | | | | | | | |
| | | | |
Texas: 0.65% | | | | | | | | | | | | | | | | |
| | | | |
| Variable Rate Demand Notes ø: 0.65% | | | | | | | | | | | | | | | | |
Austin TX Sub Series B (Tax Revenue, JPMorgan Chase & Company LOC) | | | 0.46 | | | | 11-15-2029 | | | | 21,550,000 | | | | 21,550,000 | |
Austin TX Water & Wastewater System (Water & Sewer Revenue, Citibank NA LOC) | | | 0.45 | | | | 5-15-2031 | | | | 28,500,000 | | | | 28,500,000 | |
Houston TX Adjustable Refunding First Lien B3 (Water & Sewer Revenue, Sumitomo Mitsui Banking LOC) | | | 0.45 | | | | 5-15-2034 | | | | 29,150,000 | | | | 29,150,000 | |
Houston TX Higher Educatuion Finance Corporation Rice University Project Series B (Education Revenue) | | | 0.45 | | | | 5-15-2048 | | | | 21,365,000 | | | | 21,365,000 | |
Texas Department of Housing & Community Affairs Foundation Asmara (Housing Revenue, FHLMC LIQ) | | | 0.44 | | | | 7-1-2033 | | | | 8,800,000 | | | | 8,800,000 | |
Texas Department of Housing & Community Affairs Series A (Housing Revenue, GNMA/FNMA/FHLMC Insured, Texas State Treasurer SPA) | | | 0.50 | | | | 9-1-2038 | | | | 24,000,000 | | | | 24,000,000 | |
Texas Department of Housing & Community Affairs Series C (Housing Revenue, Texas State Treasurer LIQ) | | | 0.55 | | | | 9-1-2017 | | | | 3,090,000 | | | | 3,090,000 | |
Texas Tollway Authortiy Series D (Transportation Revenue, Royal Bank of Canada LOC) | | | 0.45 | | | | 1-1-2049 | | | | 37,500,000 | | | | 37,500,000 | |
Waco TX Educational Finance Corporation Baylor University Series A (Education Revenue, Bank of New York Mellon LOC) | | | 0.45 | | | | 2-1-2032 | | | | 36,565,000 | | | | 36,565,000 | |
| | | | |
| | | | | | | | | | | | | | | 210,520,000 | |
| | | | | | | | | | | | | | | | |
The accompanying notes are an integral part of these financial statements.
| | | | | | |
| Portfolio of investments—July 31, 2016 (unaudited) | | Wells Fargo Heritage Money Market Fund | | | 17 | |
| | | | | | | | | | | | | | | | |
| Security name | | Interest rate | | | Maturity date | | | Principal | | | Value | |
| | | | |
Utah: 0.14% | | | | | | | | | | | | | | | | |
| | | | |
| Variable Rate Demand Notes ø: 0.14% | | | | | | | | | | | | | | | | |
Utah County Hospital Revenue Series C (Health Revenue, U.S. Bank NA SPA) | | | 0.43 | % | | | 5-15-2035 | | | $ | 5,775,000 | | | $ | 5,775,000 | |
Utah Water Finance Agency Series B-1 (Water & Sewer Revenue, JPMorgan Chase & Company SPA) | | | 0.48 | | | | 10-1-2037 | | | | 39,665,000 | | | | 39,665,000 | |
| | | | |
| | | | | | | | | | | | | | | 45,440,000 | |
| | | | | | | | | | | | | | | | |
| | | | |
Virginia: 0.07% | | | | | | | | | | | | | | | | |
| | | | |
| Variable Rate Demand Notes ø: 0.07% | | | | | | | | | | | | | | | | |
Fairfax County VA EDA Smithsonian Institution Series A (Miscellaneous Revenue, Northern Trust Company SPA) | | | 0.44 | | | | 12-1-2033 | | | | 10,600,000 | | | | 10,600,000 | |
Hanover County VA EDA Bon Secours Health System Incorporated Series 2008D-2 (Health Revenue, U.S. Bank NA LOC) | | | 0.43 | | | | 11-1-2025 | | | | 11,340,000 | | | | 11,340,000 | |
| | | | |
| | | | | | | | | | | | | | | 21,940,000 | |
| | | | | | | | | | | | | | | | |
| | | | |
Washington: 0.13% | | | | | | | | | | | | | | | | |
| | | | |
| Other Municipal Debt: 0.04% | | | | | | | | | | | | | | | | |
Port of Seattle WA Series B (Port Authority Revenue) | | | 0.50 | | | | 8-2-2016 | | | | 14,000,000 | | | | 14,000,000 | |
| | | | | | | | | | | | | | | | |
| | | | |
| Variable Rate Demand Note ø: 0.09% | | | | | | | | | | | | | | | | |
Washington Housing Finance Commission Kitts Corner Apartments Project (Housing Revenue, FHLB LOC) | | | 0.46 | | | | 9-1-2049 | | | | 27,500,000 | | | | 27,500,000 | |
| | | | | | | | | | | | | | | | |
| | | | |
West Virginia: 0.11% | | | | | | | | | | | | | | | | |
| | | | |
| Variable Rate Demand Note ø: 0.11% | | | | | | | | | | | | | | | | |
Cabell County WV University Facilities Variable Provident Group (Education Revenue, Bank of America NA LOC) | | | 0.48 | | | | 7-1-2039 | | | | 36,440,000 | | | | 36,440,000 | |
| | | | | | | | | | | | | | | | |
| | | | |
Wisconsin: 0.34% | | | | | | | | | | | | | | | | |
| | | | |
| Variable Rate Demand Notes ø: 0.34% | | | | | | | | | | | | | | | | |
Wisconsin Housing & EDA Series E (Housing Revenue, FHLB SPA) | | | 0.48 | | | | 9-1-2035 | | | | 13,500,000 | | | | 13,500,000 | |
Wisconsin Housing & EDA Series F (Housing Revenue, JPMorgan Chase & Company SPA) | | | 0.55 | | | | 5-1-2030 | | | | 32,765,000 | | | | 32,765,000 | |
Wisconsin Housing & EDA Series F (Housing Revenue, JPMorgan Chase & Company SPA) | | | 0.55 | | | | 11-1-2030 | | | | 26,175,000 | | | | 26,175,000 | |
Wisconsin PFA Cleveland State University Housing Project LLC (Housing Revenue, Bank of America NA LOC) | | | 0.43 | | | | 1-1-2042 | | | | 4,965,000 | | | | 4,965,000 | |
Wisconsin PFA Multifamily Housing Affinity Covington Project (Housing Revenue, FHLB LOC) | | | 0.44 | | | | 12-1-2047 | | | | 10,000,000 | | | | 10,000,000 | |
Wisconsin PFA Multifamily Housing Affinity Wells Branch Project (Housing Revenue, FHLB LOC) | | | 0.44 | | | | 11-1-2047 | | | | 21,775,000 | | | | 21,775,000 | |
| | | | |
| | | | | | | | | | | | | | | 109,180,000 | |
| | | | | | | | | | | | | | | | |
| | | | |
Total Municipal Obligations (Cost $4,192,511,237) | | | | | | | | | | | | | | | 4,192,511,237 | |
| | | | | | | | | | | | | | | | |
| | | | |
Other: 0.35% | | | | | | | | | | | | | | | | |
Nuveen California Dividend Advantage Municipal Fund Variable Rate Demand Preferred Shares Series 6 (Citibank NA LIQ) ±144A§ | | | 0.55 | | | | 8-1-2040 | | | | 25,200,000 | | | | 25,200,000 | |
Nuveen Enhanced Municipal Credit Opportunities Fund Series 1 (JPMorgan Chase & Company LIQ) ±144A§ | | | 0.57 | | | | 3-1-2040 | | | | 72,200,000 | | | | 72,200,000 | |
The accompanying notes are an integral part of these financial statements.
| | | | |
| 18 | | Wells Fargo Heritage Money Market Fund | | Portfolio of investments—July 31, 2016 (unaudited) |
| | | | | | | | | | | | | | | | |
| Security name | | Interest rate | | | Maturity date | | | Principal | | | Value | |
| | | | |
Other (continued) | | | | | | | | | | | | | | | | |
Nuveen Enhanced Municipal Credit Opportunities Fund Series 2 (JPMorgan Chase & Company LIQ) ±144A§ | | | 0.57 | % | | | 3-1-2040 | | | $ | 14,800,000 | | | $ | 14,800,000 | |
| | | | |
Total Other (Cost $112,200,000) | | | | | | | | | | | | | | | 112,200,000 | |
| | | | | | | | | | | | | | | | |
| | | | |
Other Instruments: 3.66% | | | | | | | | | | | | | | | | |
DBS Bank Limited Pooled Bank Deposit Product | | | 0.50 | | | | 8-1-2016 | | | | 705,000,000 | | | | 705,000,000 | |
Oversea-Chinese Banking Corporation Pooled Bank Deposit Product | | | 0.45 | | | | 8-1-2016 | | | | 395,000,000 | | | | 395,000,000 | |
Salt River Project Agricultural Improvement & Power District Series D1 (z) | | | 0.52 | | | | 8-8-2016 | | | | 32,000,000 | | | | 31,996,764 | |
Salt River Project Agricultural Improvement & Power District Series D1 (z) | | | 0.52 | | | | 8-10-2016 | | | | 30,000,000 | | | | 29,996,100 | |
Salt River Project Agricultural Improvement & Power District Series D1 (z) | | | 0.52 | | | | 8-11-2016 | | | | 17,500,000 | | | | 17,497,472 | |
| | | | |
Total Other Instruments (Cost $1,179,490,336) | | | | | | | | | | | | | | | 1,179,490,336 | |
| | | | | | | | | | | | | | | | |
| | | | |
Other Notes: 3.29% | | | | | | | | | | | | | | | | |
| | | | |
| Corporate Bonds and Notes: 3.29% | | | | | | | | | | | | | | | | |
Ballenisles Country Club Notes ±§ | | | 0.80 | | | | 12-1-2022 | | | | 12,460,000 | | | | 12,460,000 | |
Hartford Healthcare Corporation ±§ | | | 0.47 | | | | 7-1-2049 | | | | 50,000,000 | | | | 50,000,000 | |
Jets Stadium Development Bonds 144A±§ | | | 0.47 | | | | 4-1-2047 | | | | 35,800,000 | | | | 35,800,000 | |
Jets Stadium Finance Secured Bond 144A±§ | | | 0.47 | | | | 4-1-2047 | | | | 22,930,000 | | | | 22,930,000 | |
Keep Memory Alive ±§ | | | 0.42 | | | | 5-1-2037 | | | | 33,110,000 | | | | 33,110,000 | |
Providence Health & Services ±§ | | | 0.50 | | | | 10-1-2042 | | | | 54,190,000 | | | | 54,190,000 | |
Racetrac Capital LLC ±§ | | | 0.44 | | | | 9-1-2020 | | | | 14,000,000 | | | | 14,000,000 | |
SSAB AB Series A ±§ | | | 0.47 | | | | 6-1-2035 | | | | 15,000,000 | | | | 15,000,000 | |
SSAB AB Series B ±§ | | | 0.47 | | | | 8-1-2035 | | | | 20,000,000 | | | | 20,000,000 | |
Steadfast Crestvilla LLC Series A ±§ | | | 0.46 | | | | 2-1-2056 | | | | 5,640,000 | | | | 5,640,000 | |
Steadfast Crestvilla LLC Series B ±§ | | | 0.46 | | | | 2-1-2056 | | | | 3,760,000 | | | | 3,760,000 | |
Studio Sixty LLC Secured ±§ | | | 0.45 | | | | 2-1-2056 | | | | 14,200,000 | | | | 14,200,000 | |
United Overseas Bank Limited ±§ | | | 0.49 | | | | 1-1-2050 | | | | 770,000,000 | | | | 770,000,000 | |
World Wildlife Fund ±§ | | | 0.49 | | | | 7-1-2030 | | | | 10,885,000 | | | | 10,885,000 | |
| | | | |
Total Other Notes (Cost $1,061,975,000) | | | | | | | | | | | | | | | 1,061,975,000 | |
| | | | | | | | | | | | | | | | |
| | | | |
Repurchase Agreements ^^: 8.36% | | | | | | | | | | | | | | | | |
Bank of America Corporation, dated 7-29-2016, maturity value $727,021,204 (1) | | | 0.35 | | | | 8-1-2016 | | | | 727,000,000 | | | | 727,000,000 | |
Bank of Nova Scotia, dated 7-29-2016, maturity value $364,761,365 (2) | | | 0.34 | | | | 8-1-2016 | | | | 364,751,031 | | | | 364,751,031 | |
BNP Paribas Securities Corporation, dated 7-29-2016, maturity value $473,413,019 (3) | | | 0.33 | | | | 8-1-2016 | | | | 473,400,000 | | | | 473,400,000 | |
Deutsche Bank Securities, dated 7-29-2016, maturity value $370,012,025 (4) | | | 0.39 | | | | 8-1-2016 | | | | 370,000,000 | | | | 370,000,000 | |
Goldman Sachs & Company, dated 7-1-2016, maturity value $300,200,000 (5)±§¢(i) | | | 0.40 | | | | 8-30-2016 | | | | 300,000,000 | | | | 300,000,000 | |
JPMorgan Securities, dated 7-1-2016, maturity value $151,049,411 (6)±¢ | | | 0.38 | | | | 8-1-2016 | | | | 151,000,000 | | | | 151,000,000 | |
JPMorgan Securities, dated 7-1-2016, maturity value $302,311,815 (7)±§¢(i) | | | 0.59 | | | | 9-2-2016 | | | | 302,000,000 | | | | 302,000,000 | |
Merrill Lynch Pierce Fenner & Smith Incorporated, dated 7-29-2016, maturity value $9,800,286 (8) | | | 0.35 | | | | 8-1-2016 | | | | 9,800,000 | | | | 9,800,000 | |
| | | | |
Total Repurchase Agreements (Cost $2,697,951,031) | | | | | | | | | | | | | | | 2,697,951,031 | |
| | | | | | | | | | | | | | | | |
| | | | | | | | |
| Total investments in securities (Cost $32,431,004,933) * | | | 100.51 | % | | | 32,431,004,933 | |
Other assets and liabilities, net | | | (0.51 | ) | | | (164,823,142 | ) |
| | | | | | | | |
| Total net assets | | | 100.00 | % | | $ | 32,266,181,791 | |
| | | | | | | | |
The accompanying notes are an integral part of these financial statements.
| | | | | | |
| Portfolio of investments—July 31, 2016 (unaudited) | | Wells Fargo Heritage Money Market Fund | | | 19 | |
| ± | Variable rate investment. The rate shown is the rate in effect at period end. |
| (z) | Zero coupon security. The rate represents the current yield to maturity. |
| 144A | The security may be resold in transactions exempt from registration, normally to qualified institutional buyers, pursuant to Rule 144A under the Securities Act of 1933. |
| ø | Variable rate demand notes are subject to a demand feature which reduces the effective maturity. The maturity date shown represents the final maturity date of the security. The interest rate is determined and reset by the issuer daily, weekly, or monthly depending upon the terms of the security. The rate shown is the rate in effect at period end. |
| § | The security is subject to a demand feature which reduces the effective maturity. |
| ¢ | The security represents a long-dated and extendible repurchase agreement which automatically renews on previously set terms. The maturity date represents the next put date. |
| | (1) | U.S. government securities, 3.00% to 3.50%, 2-1-2043 to 9-1-2045, fair value including accrued interest is $748,810,000. |
| | (2) | U.S. government securities, 1.79% to 7.00%, 1-1-2020 to 7-1-2046, fair value including accrued interest is $375,693,562. |
| | (3) | U.S. government securities, 0.00% to 8.88%, 10-13-2016 to 11-15-2045, fair value including accrued interest is $482,869,529. |
| | (4) | U.S. government securities, 0.75% to 4.75%, 11-30-2016 to 8-15-2040, fair value including accrued interest is $377,400,016. |
| | (5) | U.S. government securities, 0.00%, 8-2-2016 to 3-7-2017, fair value is $306,000,000. |
| | (6) | U.S. government securities, 2.39% to 9.00%, 12-1-2020 to 2-1-2048, fair value including accrued interest is $155,532,824. |
| | (7) | U.S. government securities, 0.00% to 4.30%, 8-1-2016 to 8-1-2046, fair value including accrued interest is $308,962,172. |
| | (8) | U.S. government security, 4.00%, 12-20-2045, fair value including accrued interest is $10,094,000. |
| * | Cost for federal income tax purposes is substantially the same as for financial reporting purposes. |
The accompanying notes are an integral part of these financial statements.
| | | | |
| 20 | | Wells Fargo Heritage Money Market Fund | | Statement of assets and liabilities—July 31, 2016 (unaudited) |
| | | | |
| | | | |
| |
Assets | | | | |
Investments in unaffiliated securities, at amortized cost | | $ | 32,431,004,933 | |
Cash | | | 2,754,465 | |
Receivable for Fund shares sold | | | 347,706 | |
Receivable for interest | | | 6,811,040 | |
Prepaid expenses and other assets | | | 345,795 | |
| | | | |
Total assets | | | 32,441,263,939 | |
| | | | |
| |
Liabilities | | | | |
Dividends payable | | | 4,267,898 | |
Payable for investments purchased | | | 164,787,280 | |
Payable for Fund shares redeemed | | | 375,806 | |
Management fee payable | | | 2,383,235 | |
Administration fees payable | | | 1,393,981 | |
Accrued expenses and other liabilities | | | 1,873,948 | |
| | | | |
Total liabilities | | | 175,082,148 | |
| | | | |
Total net assets | | $ | 32,266,181,791 | |
| | | | |
| |
NET ASSETS CONSIST OF | | | | |
Paid-in capital | | $ | 32,273,101,934 | |
Overdistributed net investment income | | | (422,433 | ) |
Accumulated net realized losses on investments | | | (6,497,710 | ) |
| | | | |
Total net assets | | $ | 32,266,181,791 | |
| | | | |
| |
COMPUTATION OF NET ASSET VALUE PER SHARE | | | | |
Net assets – Administrator Class | | $ | 261,274,332 | |
Shares outstanding – Administrator Class1 | | | 261,261,420 | |
Net asset value per share – Administrator Class | | | $1.00 | |
Net assets – Institutional Class | | $ | 5,585,305,570 | |
Shares outstanding – Institutional Class1 | | | 5,584,970,036 | |
Net asset value per share – Institutional Class | | | $1.00 | |
Net assets – Select Class | | $ | 26,011,805,369 | |
Shares outstanding – Select Class1 | | | 26,010,680,935 | |
Net asset value per share – Select Class | | | $1.00 | |
Net assets – Service Class | | $ | 407,796,520 | |
Shares outstanding – Service Class1 | | | 407,771,270 | |
Net asset value per share – Service Class | | | $1.00 | |
| 1 | The Fund has an unlimited number of authorized shares. |
The accompanying notes are an integral part of these financial statements.
| | | | | | |
| Statement of operations—six months ended July 31, 2016 (unaudited) | | Wells Fargo Heritage Money Market Fund | | | 21 | |
| | | | |
| | | | |
| |
Investment income | | | | |
Interest | | $ | 110,538,210 | |
| | | | |
| |
Expenses | | | | |
Management fee | | | 26,728,442 | |
Administration fees | | | | |
Administrator Class | | | 152,648 | |
Institutional Class | | | 3,237,888 | |
Select Class | | | 6,158,990 | |
Service Class | | | 466,905 | |
Shareholder servicing fees | | | | |
Administrator Class | | | 152,648 | |
Service Class | | | 968,772 | |
Custody and accounting fees | | | 1,225,984 | |
Professional fees | | | 32,271 | |
Registration fees | | | 291,407 | |
Shareholder report expenses | | | 39,492 | |
Trustees’ fees and expenses | | | 8,603 | |
Other fees and expenses | | | 307,424 | |
| | | | |
Total expenses | | | 39,771,474 | |
Less: Fee waivers and/or expense reimbursements | | | (9,482,732 | ) |
| | | | |
Net expenses | | | 30,288,742 | |
| | | | |
Net investment income | | | 80,249,468 | |
| | | | |
Net realized gains on investments | | | 75,522 | |
| | | | |
Net increase in net assets resulting from operations | | $ | 80,324,990 | |
| | | | |
The accompanying notes are an integral part of these financial statements.
| | | | |
| 22 | | Wells Fargo Heritage Money Market Fund | | Statement of changes in net assets |
| | | | | | | | | | | | | | | | |
| | | Six months ended July 31, 2016 (unaudited) | | | Year ended January 31, 2016 | |
| | | | |
Operations | | | | | | | | | | | | | | | | |
Net investment income | | | | | | $ | 80,249,468 | | | | | | | $ | 57,918,622 | |
Net realized gains on investments | | | | | | | 75,522 | | | | | | | | 44,104 | |
| | | | |
Net increase in net assets resulting from operations | | | | | | | 80,324,990 | | | | | | | | 57,962,726 | |
| | | | |
| | | | |
Distributions to shareholders from | | | | | | | | | | | | | | | | |
Net investment income | | | | | | | | | | | | | | | | |
Administrator Class | | | | | | | (340,853 | ) | | | | | | | (82,844 | ) |
Institutional Class | | | | | | | (14,304,630 | ) | | | | | | | (6,964,106 | ) |
Select Class | | | | | | | (65,121,595 | ) | | | | | | | (50,705,296 | ) |
Service Class | | | | | | | (482,390 | ) | | | | | | | (166,376 | ) |
| | | | |
Total distributions to shareholders | | | | | | | (80,249,468 | ) | | | | | | | (57,918,622 | ) |
| | | | |
| | | | |
Capital share transactions | | | Shares | | | | | | | | Shares | | | | | |
Proceeds from shares sold | | | | | | | | | | | | | | | | |
Administrator Class | | | 385,302,201 | | | | 385,302,201 | | | | 859,971,672 | | | | 859,971,672 | |
Institutional Class | | | 24,656,274,842 | | | | 24,656,274,842 | | | | 48,495,724,190 | | | | 48,495,724,190 | |
Select Class | | | 212,344,417,383 | | | | 212,344,417,383 | | | | 454,724,848,158 | | | | 454,724,848,158 | |
Service Class | | | 8,966,025,323 | | | | 8,966,025,323 | | | | 25,397,956,170 | | | | 25,397,956,170 | |
| | | | |
| | | | | | | 246,352,019,749 | | | | | | | | 529,478,500,190 | |
| | | | |
Reinvestment of distributions | | | | | | | | | | | | | | | | |
Administrator Class | | | 170,211 | | | | 170,211 | | | | 33,087 | | | | 33,087 | |
Institutional Class | | | 3,820,109 | | | | 3,820,109 | | | | 1,709,633 | | | | 1,709,633 | |
Select Class | | | 38,779,831 | | | | 38,779,831 | | | | 27,982,825 | | | | 27,982,825 | |
Service Class | | | 71,028 | | | | 71,028 | | | | 19,446 | | | | 19,446 | |
| | | | |
| | | | | | | 42,841,179 | | | | | | | | 29,744,991 | |
| | | | |
Payment for shares redeemed | | | | | | | | | | | | | | | | |
Administrator Class | | | (382,352,460 | ) | | | (382,352,460 | ) | | | (914,600,653 | ) | | | (914,600,653 | ) |
Institutional Class | | | (27,327,414,777 | ) | | | (27,327,414,777 | ) | | | (49,641,942,181 | ) | | | (49,641,942,181 | ) |
Select Class | | | (223,590,857,420 | ) | | | (223,590,857,420 | ) | | | (452,780,915,187 | ) | | | (452,780,915,187 | ) |
Service Class | | | (9,456,573,845 | ) | | | (9,456,573,845 | ) | | | (25,624,163,521 | ) | | | (25,624,163,521 | ) |
| | | | |
| | | | | | | (260,757,198,502 | ) | | | | | | | (528,961,621,542 | ) |
| | | | |
Net increase (decrease) in net assets resulting from capital share transactions | | | | | | | (14,362,337,574 | ) | | | | | | | 546,623,639 | |
| | | | |
Total increase (decrease) in net assets | | | | | | | (14,362,262,052 | ) | | | | | | | 546,667,743 | |
| | | | |
| | | | |
Net assets | | | | | | | | | | | | | | | | |
Beginning of period | | | | | | | 46,628,443,843 | | | | | | | | 46,081,776,100 | |
| | | | |
End of period | | | | | | $ | 32,266,181,791 | | | | | | | $ | 46,628,443,843 | |
| | | | |
Overdistributed net investment income | | | | | | $ | (422,433 | ) | | | | | | $ | (422,433 | ) |
| | | | |
The accompanying notes are an integral part of these financial statements.
| | | | | | |
| Financial highlights | | Wells Fargo Heritage Money Market Fund | | | 23 | |
(For a share outstanding throughout each period)
| | | | | | | | | | | | | | | | | | | | | | | | |
| | | Six months ended
July 31, 2016 (unaudited) | | | Year ended January 31 | |
| ADMINISTRATOR CLASS | | | 2016 | | | 2015 | | | 2014 | | | 2013 | | | 2012 | |
Net asset value, beginning of period | | | $1.00 | | | | $1.00 | | | | $1.00 | | | | $1.00 | | | | $1.00 | | | | $1.00 | |
Net investment income | | | 0.00 | 1 | | | 0.00 | 1 | | | 0.00 | 1 | | | 0.00 | 1 | | | 0.00 | 1 | | | 0.00 | 1 |
Net realized gains on investments | | | 0.00 | 1 | | | 0.00 | 1 | | | 0.00 | 1 | | | 0.00 | 1 | | | 0.00 | 1 | | | 0.00 | 1 |
| | | | | | | | | | | | | | | | | | | | | | | | |
Total from investment operations | | | 0.00 | 1 | | | 0.00 | 1 | | | 0.00 | 1 | | | 0.00 | 1 | | | 0.00 | 1 | | | 0.00 | 1 |
Distributions to shareholders from | | | | | | | | | | | | | | | | | | | | | | | | |
Net investment income | | | (0.00 | )1 | | | (0.00 | )1 | | | (0.00 | )1 | | | (0.00 | )1 | | | (0.00 | )1 | | | (0.00 | )1 |
Net realized gains | | | 0.00 | | | | 0.00 | | | | 0.00 | | | | 0.00 | | | | 0.00 | | | | (0.00 | )1 |
| | | | | | | | | | | | | | | | | | | | | | | | |
Total distributions to shareholders | | | (0.00 | )1 | | | (0.00 | )1 | | | (0.00 | )1 | | | (0.00 | )1 | | | (0.00 | )1 | | | (0.00 | )1 |
Net asset value, end of period | | | $1.00 | | | | $1.00 | | | | $1.00 | | | | $1.00 | | | | $1.00 | | | | $1.00 | |
Total return2 | | | 0.11 | % | | | 0.03 | % | | | 0.01 | % | | | 0.01 | % | | | 0.01 | % | | | 0.01 | % |
Ratios to average net assets (annualized) | | | | | | | | | | | | | | | | | | | | | | | | |
Gross expenses | | | 0.34 | % | | | 0.34 | % | | | 0.34 | % | | | 0.34 | % | | | 0.34 | % | | | 0.34 | % |
Net expenses | | | 0.33 | % | | | 0.25 | % | | | 0.19 | % | | | 0.20 | % | | | 0.24 | % | | | 0.24 | % |
Net investment income | | | 0.22 | % | | | 0.03 | % | | | 0.01 | % | | | 0.01 | % | | | 0.01 | % | | | 0.01 | % |
Supplemental data | | | | | | | | | | | | | | | | | | | | | | | | |
Net assets, end of period (000s omitted) | | | $261,274 | | | | $258,152 | | | | $312,748 | | | | $286,618 | | | | $278,541 | | | | $374,371 | |
| 1 | Amount is less than $0.005. |
| 2 | Returns for periods of less than one year are not annualized. |
The accompanying notes are an integral part of these financial statements.
| | | | |
| 24 | | Wells Fargo Heritage Money Market Fund | | Financial highlights |
(For a share outstanding throughout each period)
| | | | | | | | | | | | | | | | | | | | | | | | |
| | | Six months ended
July 31, 2016 (unaudited) | | | Year ended January 31 | |
| INSTITUTIONAL CLASS | | | 2016 | | | 2015 | | | 2014 | | | 2013 | | | 2012 | |
Net asset value, beginning of period | | | $1.00 | | | | $1.00 | | | | $1.00 | | | | $1.00 | | | | $1.00 | | | | $1.00 | |
Net investment income | | | 0.00 | 1 | | | 0.00 | 1 | | | 0.00 | 1 | | | 0.00 | 1 | | | 0.00 | 1 | | | 0.00 | 1 |
Net realized gains on investments | | | 0.00 | 1 | | | 0.00 | 1 | | | 0.00 | 1 | | | 0.00 | 1 | | | 0.00 | 1 | | | 0.00 | 1 |
| | | | | | | | | | | | | | | | | | | | | | | | |
Total from investment operations | | | 0.00 | 1 | | | 0.00 | 1 | | | 0.00 | 1 | | | 0.00 | 1 | | | 0.00 | 1 | | | 0.00 | 1 |
Distributions to shareholders from | | | | | | | | | | | | | | | | | | | | | | | | |
Net investment income | | | (0.00 | )1 | | | (0.00 | )1 | | | (0.00 | )1 | | | (0.00 | )1 | | | (0.00 | )1 | | | (0.00 | )1 |
Net realized gains | | | 0.00 | | | | 0.00 | | | | 0.00 | | | | 0.00 | | | | 0.00 | | | | (0.00 | )1 |
| | | | | | | | | | | | | | | | | | | | | | | | |
Total distributions to shareholders | | | (0.00 | )1 | | | (0.00 | )1 | | | (0.00 | )1 | | | (0.00 | )1 | | | (0.00 | )1 | | | (0.00 | )1 |
Net asset value, end of period | | | $1.00 | | | | $1.00 | | | | $1.00 | | | | $1.00 | | | | $1.00 | | | | $1.00 | |
Total return2 | | | 0.18 | % | | | 0.08 | % | | | 0.01 | % | | | 0.02 | % | | | 0.05 | % | | | 0.05 | % |
Ratios to average net assets (annualized) | | | | | | | | | | | | | | | | | | | | | | | | |
Gross expenses | | | 0.22 | % | | | 0.22 | % | | | 0.22 | % | | | 0.22 | % | | | 0.22 | % | | | 0.22 | % |
Net expenses | | | 0.20 | % | | | 0.20 | % | | | 0.19 | % | | | 0.19 | % | | | 0.20 | % | | | 0.20 | % |
Net investment income | | | 0.35 | % | | | 0.08 | % | | | 0.01 | % | | | 0.02 | % | | | 0.05 | % | | | 0.05 | % |
Supplemental data | | | | | | | | | | | | | | | | | | | | | | | | |
Net assets, end of period (000s omitted) | | | $5,585,306 | | | | $8,252,614 | | | | $9,397,113 | | | | $10,473,476 | | | | $7,815,293 | | | | $11,089,557 | |
| 1 | Amount is less than $0.005. |
| 2 | Returns for periods of less than one year are not annualized. |
The accompanying notes are an integral part of these financial statements.
| | | | | | |
| Financial highlights | | Wells Fargo Heritage Money Market Fund | | | 25 | |
(For a share outstanding throughout each period)
| | | | | | | | | | | | | | | | | | | | | | | | |
| | | Six months ended
July 31, 2016 (unaudited) | | | Year ended January 31 | |
| SELECT CLASS | | | 2016 | | | 2015 | | | 2014 | | | 2013 | | | 2012 | |
Net asset value, beginning of period | | | $1.00 | | | | $1.00 | | | | $1.00 | | | | $1.00 | | | | $1.00 | | | | $1.00 | |
Net investment income | | | 0.00 | 1 | | | 0.00 | 1 | | | 0.00 | 1 | | | 0.00 | 1 | | | 0.00 | 1 | | | 0.00 | 1 |
Net realized gains on investments | | | 0.00 | 1 | | | 0.00 | 1 | | | 0.00 | 1 | | | 0.00 | 1 | | | 0.00 | 1 | | | 0.00 | 1 |
| | | | | | | | | | | | | | | | | | | | | | | | |
Total from investment operations | | | 0.00 | 1 | | | 0.00 | 1 | | | 0.00 | 1 | | | 0.00 | 1 | | | 0.00 | 1 | | | 0.00 | 1 |
Distributions to shareholders from | | | | | | | | | | | | | | | | | | | | | | | | |
Net investment income | | | (0.00 | )1 | | | (0.00 | )1 | | | (0.00 | )1 | | | (0.00 | )1 | | | (0.00 | )1 | | | (0.00 | )1 |
Net realized gains | | | 0.00 | | | | 0.00 | | | | 0.00 | | | | 0.00 | | | | 0.00 | | | | (0.00 | )1 |
| | | | | | | | | | | | | | | | | | | | | | | | |
Total distributions to shareholders | | | (0.00 | )1 | | | (0.00 | )1 | | | (0.00 | )1 | | | (0.00 | )1 | | | (0.00 | )1 | | | (0.00 | )1 |
Net asset value, end of period | | | $1.00 | | | | $1.00 | | | | $1.00 | | | | $1.00 | | | | $1.00 | | | | $1.00 | |
Total return2 | | | 0.21 | % | | | 0.15 | % | | | 0.07 | % | | | 0.09 | % | | | 0.12 | % | | | 0.12 | % |
Ratios to average net assets (annualized) | | | | | | | | | | | | | | | | | | | | | | | | |
Gross expenses | | | 0.18 | % | | | 0.18 | % | | | 0.18 | % | | | 0.18 | % | | | 0.18 | % | | | 0.18 | % |
Net expenses | | | 0.13 | % | | | 0.13 | % | | | 0.13 | % | | | 0.13 | % | | | 0.13 | % | | | 0.13 | % |
Net investment income | | | 0.42 | % | | | 0.16 | % | | | 0.07 | % | | | 0.08 | % | | | 0.12 | % | | | 0.12 | % |
Supplemental data | | | | | | | | | | | | | | | | | | | | | | | | |
Net assets, end of period (000s omitted) | | | $26,011,805 | | | | $37,219,390 | | | | $35,247,440 | | | | $30,569,838 | | | | $27,354,255 | | | | $15,353,756 | |
| 1 | Amount is less than $0.005. |
| 2 | Returns for periods of less than one year are not annualized. |
The accompanying notes are an integral part of these financial statements.
| | | | |
| 26 | | Wells Fargo Heritage Money Market Fund | | Financial highlights |
(For a share outstanding throughout each period)
| | | | | | | | | | | | | | | | | | | | | | | | |
| | | Six months ended
July 31, 2016 (unaudited) | | | Year ended January 31 | |
| SERVICE CLASS | | | 2016 | | | 2015 | | | 2014 | | | 2013 | | | 2012 | |
Net asset value, beginning of period | | | $1.00 | | | | $1.00 | | | | $1.00 | | | | $1.00 | | | | $1.00 | | | | $1.00 | |
Net investment income | | | 0.00 | 1 | | | 0.00 | 1 | | | 0.00 | 1 | | | 0.00 | 1 | | | 0.00 | 1 | | | 0.00 | 1 |
Net realized gains on investments | | | 0.00 | 1 | | | 0.00 | 1 | | | 0.00 | 1 | | | 0.00 | 1 | | | 0.00 | 1 | | | 0.00 | 1 |
| | | | | | | | | | | | | | | | | | | | | | | | |
Total from investment operations | | | 0.00 | | | | 0.00 | | | | 0.00 | | | | 0.00 | | | | 0.00 | | | | 0.00 | |
Distributions to shareholders from | | | | | | | | | | | | | | | | | | | | | | | | |
Net investment income | | | (0.00 | )1 | | | (0.00 | )1 | | | (0.00 | )1 | | | (0.00 | )1 | | | (0.00 | )1 | | | (0.00 | )1 |
Net realized gains | | | 0.00 | | | | 0.00 | | | | 0.00 | | | | 0.00 | | | | 0.00 | | | | (0.00 | )1 |
| | | | | | | | | | | | | | | | | | | | | | | | |
Total distributions to shareholders | | | (0.00 | )1 | | | (0.00 | )1 | | | (0.00 | )1 | | | (0.00 | )1 | | | (0.00 | )1 | | | (0.00 | )1 |
Net asset value, end of period | | | $1.00 | | | | $1.00 | | | | $1.00 | | | | $1.00 | | | | $1.00 | | | | $1.00 | |
Total return2 | | | 0.06 | % | | | 0.02 | % | | | 0.01 | % | | | 0.01 | % | | | 0.01 | % | | | 0.01 | % |
Ratios to average net assets (annualized) | | | | | | | | | | | | | | | | | | | | | | | | |
Gross expenses | | | 0.51 | % | | | 0.51 | % | | | 0.50 | % | | | 0.50 | % | | | 0.50 | % | | | 0.51 | % |
Net expenses | | | 0.43 | % | | | 0.27 | % | | | 0.19 | % | | | 0.20 | % | | | 0.24 | % | | | 0.24 | % |
Net investment income | | | 0.12 | % | | | 0.02 | % | | | 0.01 | % | | | 0.01 | % | | | 0.01 | % | | | 0.01 | % |
Supplemental data | | | | | | | | | | | | | | | | | | | | | | | | |
Net assets, end of period (000s omitted) | | | $407,797 | | | | $898,288 | | | | $1,124,475 | | | | $1,064,804 | | | | $662,253 | | | | $993,333 | |
| 1 | Amount is less than $0.005. |
| 2 | Returns for periods of less than one year are not annualized. |
The accompanying notes are an integral part of these financial statements.
| | | | | | |
| Notes to financial statements (unaudited) | | Wells Fargo Heritage Money Market Fund | | | 27 | |
1. ORGANIZATION
Wells Fargo Funds Trust (the “Trust”), a Delaware statutory trust organized on March 10, 1999, is an open-end management investment company registered under the Investment Company Act of 1940, as amended (the “1940 Act”). As an investment company, the Trust follows the accounting and reporting guidance in Financial Accounting Standards Board (“FASB”) Accounting Standards Codification Topic 946, Financial Services – Investment Companies. These financial statements report on the Wells Fargo Heritage Money Market Fund (the “Fund”) which is a diversified series of the Trust.
2. SIGNIFICANT ACCOUNTING POLICIES
The following significant accounting policies, which are consistently followed in the preparation of the financial statements of the Fund, are in conformity with U.S. generally accepted accounting principles which require management to make estimates and assumptions that affect the reported amounts of assets and liabilities, disclosure of contingent assets and liabilities at the date of the financial statements, and the reported amounts of revenues and expenses during the reporting period. Actual results could differ from those estimates.
Securities valuation
As permitted under Rule 2a-7 of the 1940 Act, portfolio securities are valued at amortized cost, which approximates fair value. The amortized cost method involves valuing a security at its cost, plus accretion of discount or minus amortization of premium over the period until maturity.
Investments which are not valued using the method discussed above are valued at their fair value, as determined in good faith by the Board of Trustees of the Funds. The Board of Trustees has established a Valuation Committee comprised of the Trustees and has delegated to it the authority to take any actions regarding the valuation of portfolio securities that the Valuation Committee deems necessary or appropriate, including determining the fair value of portfolio securities, unless the determination has been delegated to the Management Valuation Team of Wells Fargo Funds Management, LLC (“Funds Management”). The Board of Trustees retains the authority to make or ratify any valuation decisions or approve any changes to the Valuation Procedures as it deems appropriate. On a quarterly basis, the Board of Trustees receives reports on any valuation actions taken by the Valuation Committee or the Management Valuation Team which may include items for ratification.
Valuations of fair valued securities are compared to the next actual sales price when available, or other appropriate market values, to assess the continued appropriateness of the fair valuation methodologies used. These securities are fair valued on a day-to-day basis, taking into consideration changes to appropriate market information and any significant changes to the inputs considered in the valuation process until there is a readily available price provided on an exchange or by an independent pricing service. Valuations received from an independent pricing service or independent broker-dealer quotes are periodically validated by comparisons to most recent trades and valuations provided by other independent pricing services in addition to the review of prices by the manager and/or subadvisers. Unobservable inputs used in determining fair valuations are identified based on the type of security, taking into consideration factors utilized by market participants in valuing the investment, knowledge about the issuer and the current market environment.
Repurchase agreements
The Fund may invest in repurchase agreements and may participate in pooled repurchase agreement transactions with other funds advised by Funds Management. The repurchase agreements must be fully collateralized based on values that are marked-to-market daily. The collateral may be held by an agent bank under a tri-party agreement. It is the custodian’s responsibility to value collateral daily and to take action to obtain additional collateral as necessary to maintain market value equal to or greater than the resale price. The repurchase agreements are collateralized by instruments such as U.S. Treasury, federal agency, or high-grade corporate obligations. There could be potential loss to the Fund in the event that the Fund is delayed or prevented from exercising its rights to dispose of the collateral, including the risk of a possible decline in the value of the underlying obligations during the period in which the Fund seeks to assert its rights.
When-issued transactions
The Fund may purchase securities on a forward commitment or when-issued basis. The Fund records a when-issued transaction on the trade date and will segregate assets in an amount at least equal in value to the Fund’s commitment to purchase when-issued securities. Securities purchased on a when-issued basis are marked-to-market daily and the Fund begins earning interest on the settlement date. Losses may arise due to changes in the market value of the underlying securities or if the counterparty does not perform under the contract.
| | | | |
| 28 | | Wells Fargo Heritage Money Market Fund | | Notes to financial statements (unaudited) |
Security transactions and income recognition
Securities transactions are recorded on a trade date basis. Realized gains or losses are recorded on the basis of identified cost.
Interest income is accrued daily and bond discounts are accreted and premiums are amortized daily based on the effective interest method. To the extent debt obligations are placed on non-accrual status, any related interest income may be reduced by writing off interest receivables when the collection of all or a portion of interest has become doubtful based on consistently applied procedures. If the issuer subsequently resumes interest payments or when the collectability of interest is reasonably assured, the debt obligation is removed from non-accrual status.
Distributions to shareholders
Distributions to shareholders from net investment income are accrued daily and paid monthly. Distributions from net realized gains, if any, are recorded on the ex-dividend date. Such distributions are determined in conformity with federal income tax regulations, which may differ in amount or character from net investment income and realized gains recognized for purposes of U.S. generally accepted accounting principles.
Federal and other taxes
The Fund intends to continue to qualify as a regulated investment company by distributing substantially all of its investment company taxable income and any net realized capital gains (after reduction for capital loss carryforwards) sufficient to relieve it from all, or substantially all, federal income taxes. Accordingly, no provision for federal income taxes was required.
The Fund’s income and federal excise tax returns and all financial records supporting those returns for the prior three fiscal years are subject to examination by the federal and Delaware revenue authorities. Management has analyzed the Fund’s tax positions taken on federal, state, and foreign tax returns for all open tax years and does not believe that there are any uncertain tax positions that require recognition of a tax liability.
As of January 31, 2016, the Fund had capital loss carryforwards available to offset future net realized capital gains in the amount of $$6,573,232 expiring in 2017.
Class allocations
The separate classes of shares offered by the Fund differ principally in shareholder servicing and administration fees. Class specific expenses are charged directly to that share class. Investment income, common expenses, and realized and unrealized gains (losses) on investments are allocated daily to each class of shares based on the relative proportion of net assets of each class.
3. FAIR VALUATION MEASUREMENTS
Fair value measurements of investments are determined within a framework that has established a fair value hierarchy based upon the various data inputs utilized in determining the value of the Fund’s investments. The three-level hierarchy gives the highest priority to unadjusted quoted prices in active markets for identical assets or liabilities (Level 1) and the lowest priority to significant unobservable inputs (Level 3). The Fund’s investments are classified within the fair value hierarchy based on the lowest level of input that is significant to the fair value measurement. The inputs are summarized into three broad levels as follows:
| n | | Level 1 – quoted prices in active markets for identical securities |
| n | | Level 2 – other significant observable inputs (including quoted prices for similar securities, interest rates, prepayment speeds, credit risk, use of amortized cost, etc.) |
| n | | Level 3 – significant unobservable inputs (including the Fund’s own assumptions in determining the fair value of investments) |
The inputs or methodologies used for valuing investments in securities are not necessarily an indication of the risk associated with investing in those securities.
At July 31, 2016, all of the Fund’s investments in securities were valued using Level 2 inputs since the primary inputs include the credit quality of the issuer and short-term interest rates (both of which are observable) in addition to the use of amortized cost.
The Fund recognizes transfers between levels within the fair value hierarchy at the end of the reporting period. At July 31, 2016, the Fund did not have any transfers into/out of Level 1, Level 2, or Level 3.
| | | | | | |
| Notes to financial statements (unaudited) | | Wells Fargo Heritage Money Market Fund | | | 29 | |
4. TRANSACTIONS WITH AFFILIATES
Management fee
Funds Management, an indirect wholly owned subsidiary of Wells Fargo & Company (“Wells Fargo”), is the manager of the Fund and provides advisory and fund-level administrative services under an investment management agreement. Under the investment management agreement, Funds Management is responsible for, among other services, implementing the investment objectives and strategies of the Fund, supervising the subadvisers, providing fund-level administrative services in connection with the Fund’s operations, and providing any other fund-level administrative services reasonably necessary for the operation of the Fund. As compensation for its services under the investment management agreement, Funds Management is entitled to receive an annual management fee starting at 0.15% and declining to 0.13% as the average daily net assets of the Fund increase. For the six months ended July 31, 2016, the management fee was equivalent to an annual rate of 0.13% of the Fund’s average daily net assets.
Funds Management has retained the services of certain subadvisers to provide daily portfolio management to the Fund. Wells Capital Management Incorporated (“WellsCap”), an affiliate of Funds Management and an indirect wholly owned subsidiary of Wells Fargo, is a subadviser to the Fund and is entitled to receive a fee from Funds Management at an annual rate starting at 0.05% and declining to 0.01% as the average daily net assets of the Fund increase. Wells Capital Management Singapore a separately identifiable department of Wells Fargo Bank, N.A., an affiliate of Funds Management and wholly owned subsidiary of Wells Fargo, is also a subadviser to the Fund and is entitled to receive a fee from WellsCap at an annual rate starting at 0.0025% and declining to 0.0005% as the average daily net assets of the Fund increase.
Administration fees
Under a class-level administration agreement, Funds Management provides class-level administrative services to the Fund, which includes paying fees and expenses for services provided by the transfer agent, sub-transfer agents, omnibus account servicers and record-keepers. As compensation for its services under the class-level administration agreement, Funds Management receives an annual fee which is calculated based on the average daily net assets of each class as follows:
| | | | |
| | | Class-level
administration fee | |
Administrator Class | | | 0.10 | % |
Institutional Class | | | 0.08 | |
Select Class | | | 0.04 | |
Service Class | | | 0.12 | |
Funds Management has contractually waived and/or reimbursed management and administration fees to the extent necessary to maintain certain net operating expense ratios for the Fund. Waiver of fees and/or reimbursement of expenses by Funds Management were made first from fund level expenses on a proportionate basis and then from class specific expenses. Funds Management has committed through May 31, 2017 to waive fees and/or reimburse expenses to the extent necessary to cap the Fund’s expenses at 0.35% for Administrator Class shares, 0.20% for Institutional Class shares, 0.13% for Select Class shares, and 0.43% for Service Class shares. After this time, the cap may be increased or the commitment to maintain the cap may be terminated only with the approval of the Board of Trustees. During the six months ended July 31, 2016, Funds Management voluntarily waived additional class specific expenses to maintain a positive yield.
Shareholder servicing fees
The Trust has entered into contracts with one or more shareholder servicing agents, whereby Administrator Class and Service Class of the Fund are charged a fee at an annual rate of 0.10 % and 0.25%, respectively, of their average daily net assets.
A portion of these total shareholder servicing fees were paid to affiliates of Wells Fargo.
5. INDEMNIFICATION
Under the Trust’s organizational documents, the officers and Trustees have been granted certain indemnification rights against certain liabilities that may arise out of performance of their duties to the Trust. Additionally, in the normal course of business, the Trust may enter into contracts with service providers that contain a variety of indemnification clauses. The Trust’s maximum exposure under these arrangements is dependent on future claims that may be made against the Fund and, therefore, cannot be estimated.
| | | | |
| 30 | | Wells Fargo Heritage Money Market Fund | | Notes to financial statements (unaudited) |
6. MONEY MARKET FUND REFORM
On July 23, 2014, the Securities and Exchange Commission voted to amend Rule 2a-7 of the 1940 Act which governs the operations of registered money market funds. The amendments to Rule 2a-7 when implemented may, among other things, require the Fund to change the manner in which it values its securities, impose new liquidity fees on redemptions in certain circumstances, and permit the Fund to limit redemptions in certain circumstances. The amendments have staggered compliance dates. Compliance with a majority of these amendments will be required on October 14, 2016. Effective on or before October 5, 2016, the Fund will no longer maintain a stable $1.00 net asset value (NAV) and instead will be offered as a floating, market-based NAV.
| | | | | | |
| Other information (unaudited) | | Wells Fargo Heritage Money Market Fund | | | 31 | |
PROXY VOTING INFORMATION
A description of the policies and procedures that the Fund uses to determine how to vote proxies relating to portfolio securities is available, upon request, by calling 1-800-222-8222, visiting our website at wellsfargofunds.com, or visiting the SEC website at sec.gov. Information regarding how the Fund voted proxies relating to portfolio securities during the most recent 12-month period ended June 30 is available on the Fund’s website at wellsfargofunds.com or by visiting the SEC website at sec.gov.
PORTFOLIO HOLDINGS INFORMATION
The complete portfolio holdings for the Fund are publicly available on the Fund’s website (wellsfargofunds.com) on a 1-day delayed basis. The Fund files its complete schedule of portfolio holdings with the SEC for the first and third quarters of each fiscal year on Form N-Q, which is available by visiting the SEC website at sec.gov. In addition, the Fund’s Form N-Q may be reviewed and copied at the SEC’s Public Reference Room in Washington, DC, and at regional offices in New York City, at 233 Broadway, and in Chicago, at 175 West Jackson Boulevard, Suite 900. Information about the Public Reference Room may be obtained by calling 1-800-SEC-0330.
| | | | |
| 32 | | Wells Fargo Heritage Money Market Fund | | Other information (unaudited) |
BOARD OF TRUSTEES AND OFFICERS
Each of the Trustees and Officers1 listed in the table below acts in identical capacities for each fund in the Wells Fargo family of funds, which consists of 139 mutual funds comprising the Wells Fargo Funds Trust, Wells Fargo Variable Trust, Wells Fargo Master Trust and four closed-end funds (collectively the “Fund Complex”). This table should be read in conjunction with the Prospectus and the Statement of Additional Information2. The mailing address of each Trustee and Officer is 525 Market Street, 12th Floor, San Francisco, CA 94105. Each Trustee and Officer serves an indefinite term, however, each Trustee serves such term until reaching the mandatory retirement age established by the Trustees.
Independent Trustees
| | | | | | |
Name and
year of birth | | Position held and
length of service* | | Principal occupations during past five years or longer | | Current other public
company or
investment company
directorships |
William R. Ebsworth
(Born 1957) | | Trustee, since 2015 | | Retired. From 1984 to 2013, equities analyst, portfolio manager, research director and chief financial officer at Fidelity Management and Research Company in Boston, Tokyo, and Hong Kong and retired in 2013 as Chief Investment Officer of Fidelity Strategic Advisers, Inc. where he lead a team of investment professionals managing client assets. Prior thereto, Board member of Hong Kong Securities Clearing Co., Hong Kong Options Clearing Corp., the Thailand International Fund, Ltd., Fidelity Investments Life Insurance Company, and Empire Fidelity Investments Life Insurance Company. Mr. Ebsworth is a CFA® charterholder and an Adjunct Lecturer, Finance, at Babson College. | | Asset Allocation Trust |
Jane A. Freeman
(Born 1953) | | Trustee, since 2015 | | Retired. From 2012 to 2014 and 1999 to 2008, Chief Financial Officer of Scientific Learning Corporation. From 2008 to 2012, Ms. Freeman provided consulting services related to strategic business projects. Prior to 1999, Portfolio Manager at Rockefeller & Co. and Scudder, Stevens & Clark. Board member of the Harding Loevner Funds from 1996 to 2014, serving as both Lead Independent Director and chair of the Audit Committee. Board member of the Russell Exchange Traded Funds Trust from 2011 to 2012 and the chair of the Audit Committee. Ms. Freeman is Chair of Taproot Foundation (non-profit organization), a Board Member of Ruth Bancroft Garden (non-profit organization) and an inactive chartered financial analyst. | | Asset Allocation Trust |
Peter G. Gordon
(Born 1942) | | Trustee, since 1998; Chairman, since 2005 | | Co-Founder, Retired Chairman, President and CEO of Crystal Geyser Water Company. Trustee Emeritus, Colby College. | | Asset Allocation Trust |
Isaiah Harris, Jr.
(Born 1952) | | Trustee, since 2009 | | Retired. Chairman of the Board of CIGNA Corporation since 2009, and Director since 2005. From 2003 to 2011, Director of Deluxe Corporation. Prior thereto, President and CEO of BellSouth Advertising and Publishing Corp. from 2005 to 2007, President and CEO of BellSouth Enterprises from 2004 to 2005 and President of BellSouth Consumer Services from 2000 to 2003. Emeritus member of the Iowa State University Foundation Board of Governors. Emeritus Member of the Advisory Board of Iowa State University School of Business. Advisory Board Member, Palm Harbor Academy (charter school). Advisory Board Member, Child Evangelism Fellowship (non-profit). Mr. Harris is a certified public accountant (inactive status). | | CIGNA Corporation; Asset Allocation Trust |
Judith M. Johnson
(Born 1949) | | Trustee, since 2008; Audit Committee Chairman, since 2008 | | Retired. Prior thereto, Chief Executive Officer and Chief Investment Officer of Minneapolis Employees Retirement Fund from 1996 to 2008. Ms. Johnson is an attorney, certified public accountant and a certified managerial accountant. | | Asset Allocation Trust |
David F. Larcker
(Born 1950) | | Trustee, since 2009 | | James Irvin Miller Professor of Accounting at the Graduate School of Business, Stanford University, Director of the Corporate Governance Research Initiative and Senior Faculty of The Rock Center for Corporate Governance since 2006. From 2005 to 2008, Professor of Accounting at the Graduate School of Business, Stanford University. Prior thereto, Ernst & Young Professor of Accounting at The Wharton School, University of Pennsylvania from 1985 to 2005. | | Asset Allocation Trust |
| | | | | | |
| Other information (unaudited) | | Wells Fargo Heritage Money Market Fund | | | 33 | |
| | | | | | |
Name and
year of birth | | Position held and
length of service* | | Principal occupations during past five years or longer | | Current other public
company or
investment company
directorships |
Olivia S. Mitchell
(Born 1953) | | Trustee, since 2006 | | International Foundation of Employee Benefit Plans Professor, Wharton School of the University of Pennsylvania since 1993. Director of Wharton’s Pension Research Council and Boettner Center on Pensions & Retirement Research, and Research Associate at the National Bureau of Economic Research. Previously, Cornell University Professor from 1978 to 1993. | | Asset Allocation Trust |
Timothy J. Penny
(Born 1951) | | Trustee, since 1996 | | President and Chief Executive Officer of Southern Minnesota Initiative Foundation, a non-profit organization, since 2007 and Senior Fellow at the Humphrey Institute Policy Forum at the University of Minnesota since 1995. Member of the Board of Trustees of NorthStar Education Finance, Inc., a non-profit organization, since 2007. | | Asset Allocation Trust |
Michael S. Scofield
(Born 1943) | | Trustee, since 2010 | | Served on the Investment Company Institute’s Board of Governors and Executive Committee from 2008-2011 as well the Governing Council of the Independent Directors Council from 2006-2011 and the Independent Directors Council Executive Committee from 2008-2011. Chairman of the IDC from 2008-2010. Institutional Investor (Fund Directions) Trustee of Year in 2007. Trustee of the Evergreen Funds complex (and its predecessors) from 1984 to 2010. Chairman of the Evergreen Funds from 2000-2010. Former Trustee of the Mentor Funds. Retired Attorney, Law Offices of Michael S. Scofield. | | Asset Allocation Trust |
| * | Length of service dates reflect the Trustee’s commencement of service with the Trust’s predecessor entities, where applicable. |
Officers
| | | | | | |
Name and year of birth | | Position held and
length of service | | Principal occupations during past five years or longer | | |
Karla M. Rabusch
(Born 1959) | | President, since 2003 | | Executive Vice President of Wells Fargo Bank, N.A. and President of Wells Fargo Funds Management, LLC since 2003. | | |
Nancy Wiser1
(Born 1967) | | Treasurer, since 2012 | | Executive Vice President of Wells Fargo Funds Management, LLC since 2011. Chief Operating Officer and Chief Compliance Officer at LightBox Capital Management LLC, from 2008 to 2011. | | |
C. David Messman
(Born 1960) | | Secretary, since 2000; Chief Legal Officer, since 2003 | | Senior Vice President and Secretary of Wells Fargo Funds Management, LLC since 2001. Assistant General Counsel of Wells Fargo Bank, N.A. since 2013 and Vice President and Managing Counsel of Wells Fargo Bank, N.A. from 1996 to 2013. | | |
Michael Whitaker
(Born 1967) | | Chief Compliance Officer, since 2016* | | Executive Vice President of Wells Fargo Funds Management, LLC since 2016. Chief Compliance Officer of Fidelity’s Fixed Income Funds and Asset Allocation Funds from 2008 to 2016, Compliance Officer of FMR Co., Inc. from 2014 to 2016, Fidelity Investments Money Management, Inc. from 2014 to 2016, Fidelity Investments from 2007 to 2016. | | |
David Berardi
(Born 1975) | | Assistant Treasurer, since 2009 | | Vice President of Wells Fargo Funds Management, LLC since 2009. Vice President of Evergreen Investment Management Company, LLC from 2008 to 2010. Manager of Fund Reporting and Control for Evergreen Investment Management Company, LLC from 2004 to 2010. | | |
Jeremy DePalma1
(Born 1974) | | Assistant Treasurer, since 2009 | | Senior Vice President of Wells Fargo Funds Management, LLC since 2009. Senior Vice President of Evergreen Investment Management Company, LLC from 2008 to 2010 and head of the Fund Reporting and Control Team within Fund Administration from 2005 to 2010. | | |
| 1 | Nancy Wiser acts as Treasurer of 71 funds in the Fund Complex. Jeremy DePalma acts as Treasurer of 68 funds and Assistant Treasurer of 71 funds in the Fund Complex. |
| 2 | The Statement of Additional Information includes additional information about the Trustees and is available, without charge, upon request, by calling 1-800-222-8222 or by visiting the website at wellsfargofunds.com. |
| * | Michael Whitaker became Chief Compliance Officer effective May 16, 2016. |
| | | | |
| 34 | | Wells Fargo Heritage Money Market Fund | | Other information (unaudited) |
BOARD CONSIDERATION OF INVESTMENT MANAGEMENT AND SUB-ADVISORY AGREEMENTS:
Under the Investment Company Act of 1940 (the “1940 Act”), the Board of Trustees (the “Board”) of Wells Fargo Funds Trust (the “Trust”) must determine annually whether to approve the continuation of the Trust’s investment management and sub-advisory agreements. In this regard, at an in-person meeting held on May 24-25, 2016 (the “Meeting”), the Board, all the members of which have no direct or indirect interest in the investment management and sub-advisory agreements and are not “interested persons” of the Trust, as defined in the 1940 Act (the “Independent Trustees”), reviewed and approved for Wells Fargo Heritage Money Market Fund (the “Fund”): (i) an investment management agreement (the “Management Agreement”) with Wells Fargo Funds Management, LLC (“Funds Management”); (ii) an investment sub-advisory agreement with Wells Capital Management Incorporated (“WellsCap”), an affiliate of Funds Management; and (iii) an investment sub-advisory agreement with the WellsCap and Wells Fargo Bank, N.A. d/b/a Wells Capital Management Singapore (“WellsCap Singapore”), an affiliate of Funds Management. The sub-advisory agreements with WellsCap and WellsCap Singapore (the “Sub-Advisers”) are collectively referred to as the Sub-Advisory Agreements, and the Management Agreement and the Sub-Advisory Agreements are collectively referred to as the “Advisory Agreements.”
At the Meeting, the Board considered the factors and reached the conclusions described below relating to the selection of Funds Management and the Sub-Advisers and the approval of the Advisory Agreements. Prior to the Meeting, including at an in-person meeting in April 2016, the Trustees conferred extensively among themselves and with representatives of Funds Management about these matters. Also, the Board has adopted a team-based approach, with each team consisting of a sub-set of Trustees, to assist the full Board in the discharge of its duties in reviewing performance and other matters throughout the year. The Independent Trustees were assisted in their evaluation of the Advisory Agreements by independent legal counsel, from whom they received separate legal advice and with whom they met separately.
In providing information to the Board, Funds Management and the Sub-Advisers were guided by a detailed set of requests for information submitted to them by independent legal counsel on behalf of the Independent Trustees at the start of the Board’s annual contract renewal process earlier in 2016. In considering and approving the Advisory Agreements, the Trustees considered the information they believed relevant, including but not limited to the information discussed below. The Board considered not only the specific information presented in connection with the Meeting, but also the knowledge gained over time through interaction with Funds Management and the Sub-Advisers about various topics. In this regard, the Board reviewed reports of Funds Management at each of its quarterly meetings, which included, among other things, portfolio reviews and performance reports. In addition, the Board and the teams mentioned above confer with portfolio managers at various times throughout the year. The Board did not identify any particular information or consideration that was all-important or controlling, and each individual Trustee may have attributed different weights to various factors.
After its deliberations, the Board unanimously approved the continuation of the Advisory Agreements for a one-year term and determined that the compensation payable to Funds Management and the Sub-Advisers under each of the Advisory Agreements was reasonable. The Board considered the approval of the Advisory Agreements for the Fund as part of its consideration of agreements for funds across the complex, but its approvals were made on a fund-by-fund basis. The following summarizes a number of important, but not necessarily all, factors considered by the Board in support of its approvals.
Nature, extent and quality of services
The Board received and considered various information regarding the nature, extent and quality of services provided to the Fund by Funds Management and the Sub-Adviser under the Advisory Agreements. This information included a description of the investment advisory services and Fund-level administrative services covered by the Management Agreement, as well as, among other things, a summary of the background and experience of senior management of Funds Management, and the qualifications, background, tenure and responsibilities of each of the portfolio managers primarily responsible for the day-to-day portfolio management of the Fund.
The Board evaluated the ability of Funds Management and the Sub-Advisers to attract and retain qualified investment professionals, including research, advisory and supervisory personnel. The Board further considered the compliance programs and compliance records of Funds Management and the Sub-Advisers. In addition, the Board took into account the full range of services provided to the Fund by Funds Management and its affiliates.
| | | | | | |
| Other information (unaudited) | | Wells Fargo Heritage Money Market Fund | | | 35 | |
Fund performance and expenses
The Board considered the performance results for the Fund over various time periods ended December 31, 2015. The Board considered these results in comparison to the performance of funds in a universe that was determined by Broadridge Inc. (“Broadridge”) to be similar to the Fund (the “Universe”), and in comparison to other comparative data. Broadridge is an independent provider of investment company data. The Board received a description of the methodology used by Broadridge to select the mutual funds in the performance Universe. The Board noted that the performance of the Fund (Administrator Class) was in range of the average performance of the Universe for all periods under review. The Board noted that the Fund experienced a portfolio manager change in 2014.
The Board also received and considered information regarding the Fund’s net operating expense ratios and their various components, including actual management fees, custodian and other non-management fees, and Rule 12b-1 and non-Rule 12b-1 shareholder service fees. The Board considered these ratios in comparison to the median ratios of funds in class-specific expense groups that were determined by Broadridge to be similar to the Fund (the “Groups”). The Board received a description of the methodology used by Broadridge to select the mutual funds in the expense Groups and an explanation of how funds comprising expense groups and their expense ratios may vary from year-to-year. Based on the Broadridge reports, the Board noted that the net operating expense ratios of the Fund were lower than or in range of the median net operating expense ratios of the expense Groups.
The Board took into account the Fund performance and expense information provided to it among the factors considered in deciding to re-approve the Advisory Agreements.
Investment management and sub-advisory fee rates
The Board reviewed and considered the contractual fee rates payable by the Fund to Funds Management under the Management Agreement, as well as the contractual fee rates payable by the Fund to Funds Management for class-level administrative services under a Class-Level Administration Agreement, which include class-level transfer agency and sub-transfer agency costs (collectively, the “Management Rates”). The Board also reviewed and considered the contractual investment sub-advisory fee rates that are payable by Funds Management to the Sub-Adviser for investment sub-advisory services.
Among other information reviewed by the Board was a comparison of the Fund’s Management Rates with the average contractual investment management fee rates of funds in the expense Groups at a common asset level as well as transfer agency costs of the funds in the expense Groups. The Board noted that the Management Rates of the Fund were lower than or in range of the sum of these average rates for the Fund’s expense Groups for all share classes.
The Board also received and considered information about the portion of the total management fee that was retained by Funds Management after payment of the fee to the Sub-Adviser for sub-advisory services. In assessing the reasonableness of this amount, the Board received and evaluated information about the nature and extent of responsibilities retained and risks assumed by Funds Management and not delegated to or assumed by the Sub-Advisers, and about Funds Management’s on-going oversight services. However, given the affiliation between Funds Management and the Sub-Advisers, the Board ascribed limited relevance to the allocation of fees between them.
The Board also received and considered information about the nature and extent of services offered and fee rates charged by Funds Management and the Sub-Advisers to other types of clients with investment strategies similar to those of the Fund. In this regard, the Board received information about the significantly greater scope of services, and compliance, reporting and other legal burdens and risks of managing mutual funds compared with those associated with managing assets of non-mutual fund clients such as collective funds or institutional separate accounts.
Based on its consideration of the factors and information it deemed relevant, including those described here, the Board determined that the compensation payable to Funds Management under the Management Agreement and to the Sub-Advisers under the Sub-Advisory Agreements was reasonable, in light of the services covered by the Advisory Agreements.
Profitability
The Board received and considered information concerning the profitability of Funds Management, as well as the profitability of Wells Fargo as a whole, from providing services to the Fund and the fund family as a whole. The Board also received and considered information concerning the profitability of the Sub-Advisers from providing services to the fund family as a whole, noting that the Sub-Advisers’ profitability information with respect to providing services to the Fund was subsumed in the Wells Fargo and Funds Management profitability analysis.
| | | | |
| 36 | | Wells Fargo Heritage Money Market Fund | | Other information (unaudited) |
Funds Management reported on the methodologies and estimates used in calculating profitability. Among other things, the Board noted that the levels of profitability reported on a fund-by-fund basis varied widely, depending on factors such as the size and type of fund. Based on its review, the Board did not deem the profits reported by Funds Management or Wells Fargo from its services to the Fund to be at a level that would prevent it from approving the continuation of the Advisory Agreements.
Economies of scale
With respect to possible economies of scale, the Board noted the existence of breakpoints in the Fund’s management fee structure, which operate generally to reduce the Fund’s expense ratios as the Fund grows in size. It considered that, for a small fund or a fund that shrinks in size, breakpoints conversely can result in higher fee levels. The Board also considered that fee waiver and expense reimbursement arrangements and competitive fee rates at the outset are means of sharing potential economies of scale with shareholders of the Fund and the fund family as a whole. The Board considered Funds Management’s view that any analyses of potential economies of scale in managing a particular fund are inherently limited in light of the joint and common costs and investments that Funds Management incurs across the fund family as a whole.
The Board concluded that the Fund’s fee and expense arrangements, including contractual breakpoints, constituted a reasonable approach to sharing potential economies of scale with the Fund and its shareholders.
Other benefits to Funds Management and the Sub-Advisers
The Board received and considered information regarding potential “fall-out” or ancillary benefits received by Funds Management and its affiliates, including the Sub-Advisers, as a result of their relationships with the Fund. Ancillary benefits could include, among others, benefits directly attributable to other relationships with the Fund and benefits potentially derived from an increase in Funds Management’s and the Sub-Advisers’ business as a result of their relationships with the Fund. The Board noted that various affiliates of Funds Management may receive distribution-related fees, shareholder servicing payments and sub-transfer agency fees in respect of shares sold or held through them and services provided.
The Board also reviewed information about soft dollar credits earned and utilized by the Sub-Advisers, fees earned by Funds Management and the Sub-Advisers from managing a private investment vehicle for the fund family’s securities lending collateral and commissions earned by an affiliated broker from portfolio transactions.
Based on its consideration of the factors and information it deemed relevant, including those described here, the Board did not find that any ancillary benefits received by Funds Management and its affiliates, including the Sub-Advisers, were unreasonable.
Conclusion
At the Meeting, after considering the above-described factors and based on its deliberations and its evaluation of the information described above, the Board unanimously approved the continuation of the Advisory Agreements for a one-year term and determined that the compensation payable to Funds Management and the Sub-Advisers under each of the Advisory Agreements was reasonable.
| | | | | | |
| List of abbreviations | | Wells Fargo Heritage Money Market Fund | | | 37 | |
The following is a list of common abbreviations for terms and entities that may have appeared in this report.
| ACA | — ACA Financial Guaranty Corporation |
| ADR | — American depositary receipt |
| ADS | — American depositary shares |
| AGC | — Assured Guaranty Corporation |
| AGM | — Assured Guaranty Municipal |
| Ambac | — Ambac Financial Group Incorporated |
| AMT | — Alternative minimum tax |
| BAN | — Bond anticipation notes |
| BHAC | — Berkshire Hathaway Assurance Corporation |
| CAB | — Capital appreciation bond |
| CCAB | — Convertible capital appreciation bond |
| CDA | — Community Development Authority |
| CDO | — Collateralized debt obligation |
| DRIVER | — Derivative inverse tax-exempt receipts |
| DW&P | — Department of Water & Power |
| DWR | — Department of Water Resources |
| ECFA | — Educational & Cultural Facilities Authority |
| EDA | — Economic Development Authority |
| EDFA | — Economic Development Finance Authority |
| ETF | — Exchange-traded fund |
| FDIC | — Federal Deposit Insurance Corporation |
| FFCB | — Federal Farm Credit Banks |
| FGIC | — Financial Guaranty Insurance Corporation |
| FHA | — Federal Housing Administration |
| FHLB | — Federal Home Loan Bank |
| FHLMC | — Federal Home Loan Mortgage Corporation |
| FICO | — The Financing Corporation |
| FNMA | — Federal National Mortgage Association |
| GDR | — Global depositary receipt |
| GNMA | — Government National Mortgage Association |
| HCFR | — Healthcare facilities revenue |
| HEFA | — Health & Educational Facilities Authority |
| HEFAR | — Higher education facilities authority revenue |
| HFA | — Housing Finance Authority |
| HFFA | — Health Facilities Financing Authority |
| HUD | — Department of Housing and Urban Development |
| IDA | — Industrial Development Authority |
| IDAG | — Industrial Development Agency |
| KRW | — Republic of Korea won |
| LIBOR | — London Interbank Offered Rate |
| LIFER | — Long Inverse Floating Exempt Receipts |
| LLC | — Limited liability company |
| LLLP | — Limited liability limited partnership |
| LLP | — Limited liability partnership |
| MBIA | — Municipal Bond Insurance Association |
| MFHR | — Multifamily housing revenue |
| MSTR | — Municipal securities trust receipts |
| MUD | — Municipal Utility District |
| National | — National Public Finance Guarantee Corporation |
| PCFA | — Pollution Control Financing Authority |
| PCL | — Public Company Limited |
| PCR | — Pollution control revenue |
| PFA | — Public Finance Authority |
| PFFA | — Public Facilities Financing Authority |
| PFOTER | — Puttable floating option tax-exempt receipts |
| plc | — Public limited company |
| PUTTER | — Puttable tax-exempt receipts |
| R&D | — Research & development |
| Radian | — Radian Asset Assurance |
| RAN | — Revenue anticipation notes |
| RDA | — Redevelopment Authority |
| RDFA | — Redevelopment Finance Authority |
| REIT | — Real estate investment trust |
| ROC | — Reset option certificates |
| SAVRS | — Select auction variable rate securities |
| SBA | — Small Business Authority |
| SDR | — Swedish depositary receipt |
| SFHR | — Single-family housing revenue |
| SFMR | — Single-family mortgage revenue |
| SPA | — Standby purchase agreement |
| SPDR | — Standard & Poor’s Depositary Receipts |
| SPEAR | — Short Puttable Exempt Adjustable Receipts |
| STRIPS | — Separate trading of registered interest and |
| TAN | — Tax anticipation notes |
| TIPS | — Treasury inflation-protected securities |
| TRAN | — Tax revenue anticipation notes |
| TTFA | — Transportation Trust Fund Authority |
| TVA | — Tennessee Valley Authority |
This page is intentionally left blank.
This page is intentionally left blank.
This page is intentionally left blank.

For more information
More information about Wells Fargo Funds is available free upon request. To obtain literature, please write, email, visit the Fund’s website, or call:
Wells Fargo Funds
P.O. Box 8266
Boston, MA 02266-8266
Email: fundservice@wellsfargo.com
Website: wellsfargofunds.com
Individual investors: 1-800-222-8222
Retail investment professionals: 1-888-877-9275
Institutional investment professionals: 1-866-765-0778
This report and the financial statements contained herein are submitted for the general information of the shareholders of the Fund. If this report is used for promotional purposes, distribution of the report must be accompanied or preceded by a current prospectus. Before investing, please consider the investment objectives, risks, charges, and expenses of the investment. For a current prospectus and, if available, a summary prospectus, containing this information, call 1-800-222-8222 or visit the Fund’s website at wellsfargofunds.com. Read the prospectus carefully before you invest or send money.
Wells Fargo Asset Management (WFAM) is a trade name used by the asset management businesses of Wells Fargo & Company. Wells Fargo Funds Management, LLC, a wholly owned subsidiary of Wells Fargo & Company, provides investment advisory and administrative services for Wells Fargo Funds. Other affiliates of Wells Fargo & Company provide subadvisory and other services for the funds. The funds are distributed by Wells Fargo Funds Distributor, LLC, Member FINRA, an affiliate of Wells Fargo & Company.
NOT FDIC INSURED ¡ NO BANK GUARANTEE ¡ MAY LOSE VALUE
© 2016 Wells Fargo Funds Management, LLC. All rights reserved.
| | |
 | | 245334 09-16 SA304/SAR304 07-16 |
Semi-Annual Report
July 31, 2016

Institutional Money Market Funds

| n | | Wells Fargo Municipal Cash Management Money Market Fund |

Reduce clutter. Save trees.
Sign up for electronic delivery of prospectuses and shareholder reports at wellsfargo.com/advantagedelivery
Contents
The views expressed and any forward-looking statements are as of July 31, 2016, unless otherwise noted, and are those of the Fund managers and/or Wells Fargo Funds Management, LLC. Discussions of individual securities, or the markets generally, or any Wells Fargo Fund are not intended as individual recommendations. Future events or results may vary significantly from those expressed in any forward-looking statements. The views expressed are subject to change at any time in response to changing circumstances in the market. Wells Fargo Funds Management, LLC and the Fund disclaim any obligation to publicly update or revise any views expressed or forward-looking statements.
NOT FDIC INSURED ¡ NO BANK GUARANTEE ¡ MAY LOSE VALUE
| | | | |
| 2 | | Wells Fargo Municipal Cash Management Money Market Fund | | Letter to shareholders (unaudited) |

Karla M. Rabusch
President
Wells Fargo Funds
We do not anticipate broad changes to the way we manage our money market funds at this time in order to meet the new rules because we have always emphasized stability of principal and liquidity.
Dear Valued Shareholder:
We are pleased to offer you this semi-annual report for the Wells Fargo Municipal Cash Management Money Market Fund for the six-month period that ended July 31, 2016. The period was marked by preparation for the new amendments to Rule 2a-7 of the Investment Company Act of 1940 (Rule 2a-7) by the U.S. Securities and Exchange Commission. Meanwhile, the U.S. Federal Reserve (Fed) kept the federal funds target rate between 0.25% and 0.50%.
We are preparing to implement the new money market fund regulations.
The amendments to Rule 2a-7, which governs money market funds, are scheduled to be fully implemented by October 2016. To recap, U.S. Treasury and government money market funds will continue to operate much as they do today, with stable $1.00 net asset values (NAVs). Meanwhile, tax-exempt and prime funds will experience more changes. For starters, these types of funds must separate retail investors, such as individuals, and institutional investors. Second, money market fund boards of directors will have discretion to impose either a liquidity fee of up to 2% on shareholder redemptions or a temporary suspension of redemptions (gate) if a fund’s weekly liquid assets fall below 30% of its total assets and the board determines that the fee or gate is in the best interest of the fund’s shareholders.
| | n | | Retail investors will continue to transact at a stable $1.00 NAV but may be subject to liquidity fees and redemption gates. | |
| | n | | Institutional prime and tax-exempt money market funds will transact at a floating, market-based NAV and may be subject to liquidity fees and redemption gates under special circumstances. Once floating NAVs are implemented, daily share prices will fluctuate along with changes, if any, in the market-based value of the underlying portfolio securities. Our Product Alert titled Wells Fargo Announces Effective Dates for Changes to Certain Money Market Funds featured the intraday price times we will use to continue providing same-day settlement and liquidity to our shareholders. | |
| | n | | Additional requirements included increased disclosure and reporting of fund statistics, such as percentage of liquid assets, shareholder flows, and market-based NAVs. In addition, the new regulations also included tighter diversification requirements and enhanced stress-testing measures. | |
| | n | | We will continue to communicate any changes to our money markets funds with our shareholders. Specifically, Product Alerts can be found at our website: wellsfargofunds.com. Click on Product Information and find them under the Product Alerts tab. | |
While there will be many operational changes ahead, we do not anticipate broad changes to the way we manage our money market funds at this time in order to meet the new rules because we have always emphasized stability of principal and liquidity.
Short-term rates remained steady but low.
The Fed kept the federal funds rate steady. On the growth side of its mandate, U.S. economic activity appeared to maintain a modest pace. Global concerns continued to confront the Fed as it tried to assess future conditions in the U.S. While China’s growth and its markets stabilized post first-quarter downdrafts, it continued to “face considerable challenges,” per Fed Chair Janet Yellen in her
| | | | | | |
| Letter to shareholders (unaudited) | | Wells Fargo Municipal Cash Management Money Market Fund | | | 3 | |
monetary policy report to Congress. Further, although commodity prices rebounded from first-quarter lows, other worries remained. The strong dollar, which could hamper manufacturing and exports, is one factor. Another is potential fallout from Brexit, the referendum whereby the U.K. voted to leave the European Union. With growth and inflation low, Chair Yellen has argued in her monetary policy report that there is little room to cut rates further but plenty of scope to raise rates if inflation picks up too quickly.
With regard to Brexit, traditional risk assets—such as equities and foreign exchange—experienced volatility and U.S. Treasury securities benefited from a flight to quality. Money markets, however, were relatively immune to this volatility, with both credit spreads and liquidity little changed.
Don’t let short-term uncertainty derail long-term investment goals.
Periods of uncertainty can present challenges, but experience has taught us that maintaining long-term investment goals can be an effective way to plan for the future. To help you create a sound strategy based on your personal goals and risk tolerance, Wells Fargo Funds offers more than 100 mutual funds spanning a wide range of asset classes and investment styles. Although diversification cannot guarantee an investment profit or prevent losses, we believe it can be an effective way to manage investment risk and potentially smooth out overall portfolio performance. We encourage investors to know their investments and to understand that appropriate levels of risk-taking may unlock opportunities.
Thank you for choosing to invest in Wells Fargo Funds. We appreciate your confidence in us and remain committed to helping you meet your financial needs.
Sincerely,

Karla M. Rabusch
President
Wells Fargo Funds
Periods of uncertainty can present challenges, but experience has taught us that maintaining long-term investment goals can be an effective way to plan for the future.
Notice to shareholders
Effective on or before October 5 , 2016 (the “Effective Date”), the Fund will no longer maintain a stable $1.00 net asset value (“NAV”) and will instead transact at its market-based NAV, rounded to four decimal places. As of the Effective Date, the Fund will implement the following multiple intraday price times in order to continue providing same-day settlement and intraday liquidity. We will calculate the NAV at the following times each business day:
| | |
| Same-day settle (ET) | | Next-day settle (ET) |
9 a.m., 12 p.m. | | 5 p.m.* |
| | * | Next-day settlement only; daily dividends calculated using 5 p.m. NAV. |
As of the Effective Date, the Fund will also no longer support the following features:
| | n | | National Securities Clearing Corporation (NSCC) trading | |
| | n | | Automated Clearing House (ACH) trading | |
For further information about your Fund, contact your investment professional, visit our website at wellsfargofunds.com, or call us directly at 1-800-222-8222. We are available 24 hours a day, 7 days a week.
| | | | |
| 4 | | Wells Fargo Municipal Cash Management Money Market Fund | | Performance highlights (unaudited) |
Investment objective
The Fund seeks current income exempt from regular income tax, while preserving capital and liquidity.
Manager
Wells Fargo Funds Management, LLC
Subadviser
Wells Capital Management Incorporated
Portfolio managers
James Randazzo
Jeffrey L. Weaver, CFA®
Average annual total returns (%) as of July 31, 20161
| | | | | | | | | | | | | | | | | | | | | | |
| | | | | | | | | | | | | | Expense ratios2 (%) | |
| | | Inception date | | 1 year | | | 5 year | | | 10 year | | | Gross | | | Net3 | |
| Administrator Class (WUCXX) | | 7-9-2010 | | | 0.07 | | | | 0.04 | | | | 0.83 | | | | 0.37 | | | | 0.30 | |
| Institutional Class (EMMXX) | | 11-20-1996 | | | 0.11 | | | | 0.05 | | | | 0.85 | | | | 0.25 | | | | 0.20 | |
| Service Class (EISXX) | | 11-25-1996 | | | 0.03 | | | | 0.03 | | | | 0.74 | | | | 0.54 | | | | 0.45 | |
Yield summary (%) as of July 31, 20163
| | | | | | | | | | |
| | | Administrator
Class | | Institutional
Class | | | Service
Class | |
| 7-day current yield | | 0.19 | | | 0.29 | | | | 0.12 | |
| 7-day compound yield | | 0.19 | | | 0.29 | | | | 0.12 | |
| 30-day simple yield | | 0.16 | | | 0.26 | | | | 0.06 | |
| 30-day compound yield | | 0.16 | | | 0.26 | | | | 0.06 | |
Figures quoted represent past performance, which is no guarantee of future results, and do not reflect taxes that a shareholder may pay on fund distributions or the redemption of fund shares. Investment returns will fluctuate. The Fund’s yield figures more closely reflect the current earnings of the Fund than the total return figures. Current performance may be lower or higher than the performance data quoted, which assumes the reinvestment of dividends and capital gains. Current month-end performance is available on the Fund’s website, wellsfargofunds.com.
Each class is sold without a front-end sales charge or a contingent deferred sales charge.
An investment in a money market fund is not insured or guaranteed by the Federal Deposit Insurance Corporation or any other government agency. Although the Fund seeks to preserve the value of your investment at $1.00 per share, it is possible to lose money by investing in a money market fund. A portion of the Fund’s income may be subject to federal, state, and/or local income taxes or the alternative minimum tax (AMT).
Please see footnotes on page 5.
| | | | | | |
| Performance highlights (unaudited) | | Wells Fargo Municipal Cash Management Money Market Fund | | | 5 | |
|
| Portfolio composition as of July 31, 20164 |
|
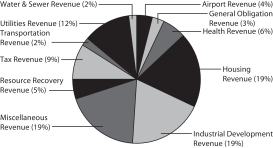 |
|
| Effective maturity distribution as of July 31, 20164 |
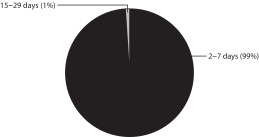 |
| | | | |
| Weighted average maturity as of July 31, 20165 | |
6 days | | | | |
| | | | |
| Weighted average life as of July 31, 20166 | | | |
6 days | | | | |
| 1 | Historical performance shown for Administrator Class shares prior to their inception reflects the performance of Institutional Class shares, and has not been adjusted to include the higher expenses applicable to Administrator Class shares. If these expenses had been adjusted, returns would be lower. Historical performance shown for all classes of the Fund prior to July 12, 2010, is based on the performance of the Fund’s predecessor, Evergreen Institutional Municipal Money Market Fund. |
| 2 | Reflects the expense ratios as stated in the most recent prospectuses. The expense ratios shown are subject to change and may differ from the annualized expense ratios shown in the financial highlights of this report. |
| 3 | The manager has contractually committed through May 31, 2017, to waive fees and/or reimburse expenses to the extent necessary to cap the Fund’s Total Annual Fund Operating Expenses After Fee Waiver at the amounts shown. After this time, the cap may be increased or the commitment to maintain the cap may be terminated only with the approval of the Board of Trustees. Brokerage commissions, stamp duty fees, interest, taxes, acquired fund fees and expenses, and extraordinary expenses are excluded from the cap. Without this cap, the Fund’s returns would have been lower. Without waived fees and/or reimbursed expenses, the Fund’s 7-day current yield would have been 0.11%, 0.23%, and 0.12% for Administrator Class, Institutional Class, and Service Class, respectively. |
| 4 | Amounts are calculated based on the total investments of the Fund. These amounts are subject to change and may have changed since the date specified. |
| 5 | Weighted Average Maturity (WAM): WAM is an average of the effective maturities of all securities held in the portfolio, weighted by each security’s percentage of total investments. The maturity of a portfolio security is the period remaining until the date on which the principal amount is unconditionally required to be paid, or in the case of a security called for redemption, the date on which the redemption payment is unconditionally required to be made. WAM calculations allow for the maturities of certain securities with demand features or periodic interest rate resets to be shortened. WAM is a way to measure a fund’s sensitivity to potential interest rate changes. Rule 2a-7 under the Investment Company Act of 1940 requires money market funds to maintain a WAM of 60 calendar days or less. WAM is subject to change and may have changed since the date specified. |
| 6 | Weighted Average Life (WAL): WAL is an average of the final maturities of all securities held in the portfolio, weighted by their percentage of total investments. The maturity of a portfolio security is the period remaining until the date on which the principal amount is unconditionally required to be paid, or in the case of a security called for redemption, the date on which the redemption payment is unconditionally required to be made. In contrast to WAM, the calculation of WAL allows for the maturities of certain securities with demand features to be shortened, but not the periodic interest rate resets. WAL is a way to measure a fund’s potential sensitivity to credit spread changes. Rule 2a-7 under the Investment Company Act of 1940 requires money market funds to maintain a WAL of 120 calendar days or less. WAL is subject to change and may have changed since the date specified. |
| | | | |
| 6 | | Wells Fargo Municipal Cash Management Money Market Fund | | Fund expenses (unaudited) |
As a shareholder of the Fund, you incur ongoing costs, including management fees, shareholder servicing fees, and other Fund expenses. This example is intended to help you understand your ongoing costs (in dollars) of investing in the Fund and to compare these costs with the ongoing costs of investing in other mutual funds.
The example is based on an investment of $1,000 invested at the beginning of the six-month period and held for the entire period from February 1, 2016 to July 31, 2016.
Actual expenses
The “Actual” line of the table below provides information about actual account values and actual expenses. You may use the information in this line, together with the amount you invested, to estimate the expenses that you paid over the period. Simply divide your account value by $1,000 (for example, an $8,600 account value divided by $1,000 = 8.6), then multiply the result by the number in the “Actual” line under the heading entitled “Expenses paid during period” for your applicable class of shares to estimate the expenses you paid on your account during this period.
Hypothetical example for comparison purposes
The “Hypothetical” line of the table below provides information about hypothetical account values and hypothetical expenses based on the Fund’s actual expense ratio and an assumed rate of return of 5% per year before expenses, which is not the Fund’s actual return. The hypothetical account values and expenses may not be used to estimate the actual ending account balance or expenses you paid for the period. You may use this information to compare the ongoing costs of investing in the Fund and other funds. To do so, compare this 5% hypothetical example with the 5% hypothetical examples that appear in the shareholder reports of the other funds.
Please note that the expenses shown in the table are meant to highlight your ongoing costs only and do not reflect any transactional costs, such as sales charges (loads) and contingent deferred sales charges. Therefore, the “Hypothetical” line of the table is useful in comparing ongoing costs only and will not help you determine the relative total costs of owning different funds. In addition, if these transactional costs were included, your cost would have been higher.
| | | | | | | | | | | | | | | | |
| | | Beginning
account value
2-1-2016 | | | Ending
account value
7-31-2016 | | | Expenses
paid during
the period¹ | | | Annualized net
expense ratio | |
Administrator Class | | | | | | | | | | | | | | | | |
Actual | | $ | 1,000.00 | | | $ | 1,000.57 | | | $ | 1.10 | | | | 0.22 | % |
Hypothetical (5% return before expenses) | | $ | 1,000.00 | | | $ | 1,023.83 | | | $ | 1.11 | | | | 0.22 | % |
Institutional Class | | | | | | | | | | | | | | | | |
Actual | | $ | 1,000.00 | | | $ | 1,000.93 | | | $ | 0.90 | | | | 0.18 | % |
Hypothetical (5% return before expenses) | | $ | 1,000.00 | | | $ | 1,024.03 | | | $ | 0.91 | | | | 0.18 | % |
Service Class | | | | | | | | | | | | | | | | |
Actual | | $ | 1,000.00 | | | $ | 1,000.16 | | | $ | 1.55 | | | | 0.31 | % |
Hypothetical (5% return before expenses) | | $ | 1,000.00 | | | $ | 1,023.39 | | | $ | 1.56 | | | | 0.31 | % |
| 1 | Expenses paid is equal to the annualized net expense ratio of each class multiplied by the average account value over the period, multiplied by the number of days in the most recent fiscal half-year divided by the number of days in the fiscal year (to reflect the one-half-year period). |
| | | | | | |
| Portfolio of investments—July 31, 2016 (unaudited) | | Wells Fargo Municipal Cash Management Money Market Fund | | | 7 | |
| | | | | | | | | | | | | | | | |
| Security name | | Interest rate | | | Maturity date | | | Principal | | | Value | |
| | | | |
Municipal Obligations: 85.17% | | | | | | | | | | | | | | | | |
| | | | |
Alabama: 0.65% | | | | | | | | | | | | | | | | |
| | | | |
| Variable Rate Demand Note ø: 0.65% | | | | | | | | | | | | | | | | |
Chatom AL IDA Board Gulf Opportunity Zone PowerSouth Energy Cooperative Projects Series 2011 (Utilities Revenue) | | | 0.62 | % | | | 8-1-2041 | | | $ | 4,500,000 | | | $ | 4,500,000 | |
| | | | | | | | | | | | | | | | |
| | | | |
Arizona: 3.68% | | | | | | | | | | | | | | | | |
| | | | |
| Variable Rate Demand Notes ø: 3.68% | | | | | | | | | | | | | | | | |
Maricopa County AZ IDA Solid Waste Disposal Ambian Dairy LLC Project Series 2008 (Resource Recovery Revenue, Farm Credit Services America LOC) | | | 0.51 | | | | 11-1-2033 | | | | 3,600,000 | | | | 3,600,000 | |
Maricopa County AZ IDA Solid Waste Disposal Series 2006 (Resource Recovery Revenue, Farm Credit Services America LOC) | | | 0.51 | | | | 8-1-2026 | | | | 2,500,000 | | | | 2,500,000 | |
Mesa AZ Utility System Clipper Tax-Exempt Certificates Trust Series 2009-33 (Miscellaneous Revenue, State Street Bank & Trust Company LIQ) | | | 0.47 | | | | 7-1-2024 | | | | 15,600,000 | | | | 15,600,000 | |
Pinal County AZ IDA Shamrock Farms Project (Resource Recovery Revenue, Farm Credit Services America LOC) | | | 0.50 | | | | 8-1-2022 | | | | 3,700,000 | | | | 3,700,000 | |
| | | | |
| | | | | | | | | | | | | | | 25,400,000 | |
| | | | | | | | | | | | | | | | |
| | | | |
California: 1.18% | | | | | | | | | | | | | | | | |
| | | | |
| Other Municipal Debt: 0.42% | | | | | | | | | | | | | | | | |
California GO Series A2 (GO Revenue) | | | 0.43 | | | | 8-3-2016 | | | | 2,900,000 | | | | 2,900,000 | |
| | | | | | | | | | | | | | | | |
| | | | |
| Variable Rate Demand Note ø: 0.76% | | | | | | | | | | | | | | | | |
California CDA Oakmont Senior Living Series Y (Housing Revenue, FNMA Insured, FNMA LIQ) | | | 0.46 | | | | 8-1-2031 | | | | 5,240,000 | | | | 5,240,000 | |
| | | | | | | | | | | | | | | | |
| | | | |
Colorado: 2.20% | | | | | | | | | | | | | | | | |
| | | | |
| Variable Rate Demand Notes ø: 2.20% | | | | | | | | | | | | | | | | |
Arapahoe County CO Cottrell Printing Project (Industrial Development Revenue, U.S. Bank NA LOC) | | | 0.56 | | | | 10-1-2019 | | | | 1,230,000 | | | | 1,230,000 | |
Colorado Agricultural Development Authority Hunter Ridge Dairy Project (Resource Recovery Revenue, CoBank LOC) | | | 0.50 | | | | 11-1-2042 | | | | 4,750,000 | | | | 4,750,000 | |
Colorado Health Facilities Authority Catholic Health Initiatives Series 2013-3364 (Health Revenue, Morgan Stanley Bank LIQ) 144A | | | 0.58 | | | | 10-1-2037 | | | | 3,000,000 | | | | 3,000,000 | |
Colorado MidCities Metropolitan District #1 Series 2004-B (Tax Revenue, BNP Paribas LOC) | | | 0.48 | | | | 12-1-2031 | | | | 2,760,000 | | | | 2,760,000 | |
Denver CO City & County Airport System Series 2006-A (Airport Revenue, FGIC Insured, Morgan Stanley Bank LIQ) 144A | | | 0.52 | | | | 11-15-2025 | | | | 3,400,000 | | | | 3,400,000 | |
| | | | |
| | | | | | | | | | | | | | | 15,140,000 | |
| | | | | | | | | | | | | | | | |
| | | | |
Florida: 4.75% | | | | | | | | | | | | | | | | |
| | | | |
| Other Municipal Debt: 2.58% | | | | | | | | | | | | | | | | |
JEA Florida Electric System Series 2000-A (Utilities Revenue) | | | 0.43 | | | | 8-15-2016 | | | | 3,900,000 | | | | 3,900,000 | |
JEA Florida Electric System Series 2000-F-1 (Utilities Revenue) | | | 0.45 | | | | 8-4-2016 | | | | 10,500,000 | | | | 10,500,000 | |
JEA Florida Electric System Series 2008-C-3 (Utilities Revenue) | | | 0.44 | | | | 8-3-2016 | | | | 3,400,000 | | | | 3,400,000 | |
| | | | |
| | | | | | | | | | | | | | | 17,800,000 | |
| | | | | | | | | | | | | | | | |
The accompanying notes are an integral part of these financial statements.
| | | | |
| 8 | | Wells Fargo Municipal Cash Management Money Market Fund | | Portfolio of investments—July 31, 2016 (unaudited) |
| | | | | | | | | | | | | | | | |
| Security name | | Interest rate | | | Maturity date | | | Principal | | | Value | |
| | | | |
| Variable Rate Demand Notes ø: 2.17% | | | | | | | | | | | | | | | | |
Florida Tender Option Bond Trust Receipts/Certificates (Housing Revenue, GNMA/FNMA/FHLMC Insured, Bank of America NA LIQ) | | | 0.59 | % | | | 7-1-2032 | | | $ | 1,915,000 | | | $ | 1,915,000 | |
Florida Tender Option Bond Trust Receipts/Certificates Series 2016 XL0027 (Airport Revenue, AGC Insured, JPMorgan Chase & Company LIQ) 144A | | | 0.64 | | | | 10-1-2030 | | | | 4,995,000 | | | | 4,995,000 | |
Florida Tender Option Bond Trust Receipts/Certificates Series 2016 XM0300 (Tax Revenue, Royal Bank of Canada LIQ) 144A | | | 0.47 | | | | 1-1-2020 | | | | 1,515,000 | | | | 1,515,000 | |
Hillsborough County FL Aviation Authority Tender Option Bond Trust Receipts/Certificates Series 2016 ZF0286 (Airport Revenue, AGC Insured, TD Bank NA LIQ) 144A | | | 0.54 | | | | 10-1-2038 | | | | 6,510,000 | | | | 6,510,000 | |
| | | | |
| | | | | | | | | | | | | | | 14,935,000 | |
| | | | | | | | | | | | | | | | |
| | | | |
Georgia: 1.57% | | | | | | | | | | | | | | | | |
| | | | |
| Other Municipal Debt: 0.37% | | | | | | | | | | | | | | | | |
Stephens County GA Development Authority Caterpillar Incorporated Project (Industrial Development Revenue) | | | 0.74 | | | | 8-1-2016 | | | | 2,520,000 | | | | 2,520,000 | |
| | | | | | | | | | | | | | | | |
| | | | |
| Variable Rate Demand Notes ø: 1.20% | | | | | | | | | | | | | | | | |
Gwinnett County GA Housing Lehman Municipal Trust Receipts Series 06-K72 (Housing Revenue, FNMA Insured, Citibank NA LIQ) | | | 0.74 | | | | 3-1-2037 | | | | 6,310,000 | | | | 6,310,000 | |
Main Street Natural Gas Incorporated Sub Series A2 (Utilities Revenue, Royal Bank of Canada SPA) | | | 0.54 | | | | 8-1-2040 | | | | 1,985,000 | | | | 1,985,000 | |
| | | | |
| | | | | | | | | | | | | | | 8,295,000 | |
| | | | | | | | | | | | | | | | |
| | | | |
Hawaii: 0.97% | | | | | | | | | | | | | | | | |
| | | | |
| Variable Rate Demand Note ø: 0.97% | | | | | | | | | | | | | | | | |
Hawaii Tender Option Bond Trust Receipts/Certificates Series 2016 XM0302 (GO Revenue, Royal Bank of Canada LIQ) 144A | | | 0.47 | | | | 11-1-2020 | | | | 6,665,000 | | | | 6,665,000 | |
| | | | | | | | | | | | | | | | |
| | | | |
Illinois: 3.11% | | | | | | | | | | | | | | | | |
| | | | |
| Variable Rate Demand Notes ø: 3.11% | | | | | | | | | | | | | | | | |
Chicago IL Enterprise Center Project Series IX (Industrial Development Revenue, Bank of America NA LOC) | | | 0.64 | | | | 6-1-2022 | | | | 3,146,000 | | | | 3,146,000 | |
Chicago IL Enterprise Center Project Series X (Industrial Development Revenue, Bank of America NA LOC) | | | 0.64 | | | | 6-1-2022 | | | | 4,300,000 | | | | 4,300,000 | |
Illinois Tender Option Bond Trust Receipts/Certificates Series XF0107 (Housing Revenue, JPMorgan Chase & Company LIQ) 144A | | | 0.54 | | | | 2-1-2033 | | | | 1,275,000 | | | | 1,275,000 | |
Illinois Tender Option Bond Trust Receipts/Certificates Series XF2202 (Transportation Revenue, Citibank NA LIQ) 144A | | | 0.46 | | | | 7-1-2023 | | | | 1,140,000 | | | | 1,140,000 | |
Joliet IL Regional Port District Exxon Project Series 1989 (Industrial Development Revenue) | | | 0.34 | | | | 10-1-2024 | | | | 5,700,000 | | | | 5,700,000 | |
Lake County IL Northpoint Association (Industrial Development Revenue, Northern Trust Company LOC) | | | 0.50 | | | | 7-1-2029 | | | | 2,600,000 | | | | 2,600,000 | |
Peoria County IL Caterpillar Incorporated Project (Industrial Development Revenue) | | | 0.64 | | | | 2-1-2030 | | | | 3,300,000 | | | | 3,300,000 | |
| | | | |
| | | | | | | | | | | | | | | 21,461,000 | |
| | | | | | | | | | | | | | | | |
| | | | |
Indiana: 0.83% | | | | | | | | | | | | | | | | |
| | | | |
| Variable Rate Demand Notes ø: 0.83% | | | | | | | | | | | | | | | | |
Jeffersonville IN Economic Development Eagle Steel Products Incorporated Project (Industrial Development Revenue, Bank of America NA LOC) | | | 0.55 | | | | 12-1-2027 | | | | 3,420,000 | | | | 3,420,000 | |
The accompanying notes are an integral part of these financial statements.
| | | | | | |
| Portfolio of investments—July 31, 2016 (unaudited) | | Wells Fargo Municipal Cash Management Money Market Fund | | | 9 | |
| | | | | | | | | | | | | | | | |
| Security name | | Interest rate | | | Maturity date | | | Principal | | | Value | |
| | | | |
| Variable Rate Demand Notes ø (continued) | | | | | | | | | | | | | | | | |
Noblesville IN Greystone Apartments Project Series B (Housing Revenue, FHLB LOC) | | | 0.55 | % | | | 3-1-2041 | | | $ | 1,430,000 | | | $ | 1,430,000 | |
Saint Joseph County IN Grace Christian Schools Project (Miscellaneous Revenue, JPMorgan Chase & Company LOC) | | | 0.64 | | | | 12-1-2016 | | | | 200,000 | | | | 200,000 | |
Spencer County IN American Iron Oxide Company Project Series 1999 (Industrial Development Revenue, Bank of Tokyo-Mitsubishi LOC) | | | 0.58 | | | | 9-1-2018 | | | | 700,000 | | | | 700,000 | |
| | | | |
| | | | | | | | | | | | | | | 5,750,000 | |
| | | | | | | | | | | | | | | | |
| | | | |
Iowa: 2.88% | | | | | | | | | | | | | | | | |
| | | | |
| Variable Rate Demand Notes ø: 2.88% | | | | | | | | | | | | | | | | |
Iowa Finance Authority Barclays Residual Interest Bonds Trust Series 1WE (Miscellaneous Revenue, Barclays Bank plc LOC) 144A | | | 0.59 | | | | 1-1-2019 | | | | 13,400,000 | | | | 13,400,000 | |
Iowa Finance Authority John Maassen & Sons Project (Industrial Development Revenue, Farm Credit Services America LOC) | | | 0.53 | | | | 11-1-2035 | | | | 2,075,000 | | | | 2,075,000 | |
Iowa Finance Authority Midwestern Cargill Incorporated Project Series 2012-A (Industrial Development Revenue) | | | 0.46 | | | | 6-1-2039 | | | | 4,400,000 | | | | 4,400,000 | |
| | | | |
| | | | | | | | | | | | | | | 19,875,000 | |
| | | | | | | | | | | | | | | | |
| | | | |
Kansas: 0.20% | | | | | | | | | | | | | | | | |
| | | | |
| Variable Rate Demand Note ø: 0.20% | | | | | | | | | | | | | | | | |
Nemaha County KS Midwest AG Services LLC Project (Industrial Development Revenue, CoBank LOC) | | | 0.50 | | | | 11-1-2020 | | | | 1,405,000 | | | | 1,405,000 | |
| | | | | | | | | | | | | | | | |
| | | | |
Kentucky: 0.97% | | | | | | | | | | | | | | | | |
| | | | |
| Variable Rate Demand Note ø: 0.97% | | | | | | | | | | | | | | | | |
Louisville & Jefferson County KY Norton Healthcare Series B (Health Revenue, PNC Bank NA LOC) | | | 0.37 | | | | 10-1-2039 | | | | 6,665,000 | | | | 6,665,000 | |
| | | | | | | | | | | | | | | | |
| | | | |
Louisiana: 2.03% | | | | | | | | | | | | | | | | |
| | | | |
| Variable Rate Demand Notes ø: 2.03% | | | | | | | | | | | | | | | | |
Louisiana BAN Series 2016-A JPMorgan PUTTER Series 5006 (GO Revenue, JPMorgan Chase & Company LOC, JPMorgan Chase & Company LIQ) 144A | | | 0.39 | | | | 8-15-2016 | | | | 4,000,000 | | | | 4,000,000 | |
Louisiana PFFA Dynamic Fuels LLC Project Series 2008 (Industrial Development Revenue, Bank of America NA LOC) | | | 0.38 | | | | 10-1-2033 | | | | 10,000,000 | | | | 10,000,000 | |
| | | | |
| | | | | | | | | | | | | | | 14,000,000 | |
| | | | | | | | | | | | | | | | |
| | | | |
Maryland: 2.45% | | | | | | | | | | | | | | | | |
| | | | |
| Variable Rate Demand Note ø: 2.45% | | | | | | | | | | | | | | | | |
Maryland Industrial Development Financing Authority Occidental Pete Corporation Series 2010 (Industrial Development Revenue) | | | 0.62 | | | | 3-1-2030 | | | | 16,900,000 | | | | 16,900,000 | |
| | | | | | | | | | | | | | | | |
| | | | |
Massachusetts: 2.00% | | | | | | | | | | | | | | | | |
| | | | |
| Variable Rate Demand Notes ø: 2.00% | | | | | | | | | | | | | | | | |
Clipper Tax-Exempt Certificate Trust Series 2009-69 (Tax Revenue, State Street Bank & Trust Company LIQ) | | | 0.48 | | | | 7-1-2027 | | | | 7,100,000 | | | | 7,100,000 | |
Massachusetts Industrial Finance Agency Constitution Project (Miscellaneous Revenue, TD Bank NA LOC) | | | 0.65 | | | | 6-1-2018 | | | | 700,000 | | | | 700,000 | |
Massachusetts JPMorgan Chase PUTTER/DRIVER Trust Series 5004 (GO Revenue, JPMorgan Chase & Company LOC, JPMorgan Chase & Company LIQ) 144A | | | 0.39 | | | | 9-1-2017 | | | | 3,000,000 | | | | 3,000,000 | |
The accompanying notes are an integral part of these financial statements.
| | | | |
| 10 | | Wells Fargo Municipal Cash Management Money Market Fund | | Portfolio of investments—July 31, 2016 (unaudited) |
| | | | | | | | | | | | | | | | |
| Security name | | Interest rate | | | Maturity date | | | Principal | | | Value | |
| | | | |
| Variable Rate Demand Notes ø (continued) | | | | | | | | | | | | | | | | |
Massachusetts JPMorgan Chase PUTTER/DRIVER Trust Series 5005 (GO Revenue, JPMorgan Chase & Company LOC, JPMorgan Chase & Company LIQ) 144A | | | 0.39 | % | | | 6-1-2018 | | | $ | 3,000,000 | | | $ | 3,000,000 | |
| | | | |
| | | | | | | | | | | | | | | 13,800,000 | |
| | | | | | | | | | | | | | | | |
| | | | |
Michigan: 5.05% | | | | | | | | | | | | | | | | |
| | | | |
| Variable Rate Demand Notes ø: 5.05% | | | | | | | | | | | | | | | | |
Eastern Michigan University Barclays Residual Interest Bonds Trust Series 6WE (Miscellaneous Revenue, Barclays Bank plc LOC) 144A | | | 0.59 | | | | 7-1-2018 | | | | 16,400,000 | | | | 16,400,000 | |
Green Lake Township MI Economic Development Corporation Interlochen Center Arts Project Series 2004 (Miscellaneous Revenue, BMO Harris Bank NA LOC) | | | 0.37 | | | | 6-1-2034 | | | | 290,000 | | | | 290,000 | |
Michigan Housing Development Authority Series A (Housing Revenue, AGM Insured, Fortis Bank SA SPA) | | | 0.59 | | | | 4-1-2042 | | | | 9,235,000 | | | | 9,235,000 | |
Michigan Housing Development Authority Series D (Housing Revenue, Bank of Tokyo-Mitsubishi SPA) | | | 0.66 | | | | 12-1-2038 | | | | 8,870,000 | | | | 8,870,000 | |
| | | | |
| | | | | | | | | | | | | | | 34,795,000 | |
| | | | | | | | | | | | | | | | |
| | | | |
Minnesota: 4.42% | | | | | | | | | | | | | | | | |
| | | | |
| Variable Rate Demand Notes ø: 4.42% | | | | | | | | | | | | | | | | |
Dakota County MN CDA View Pointe Apartments Project Series 2007-A (Housing Revenue, FNMA Insured, FNMA LIQ) | | | 0.55 | | | | 1-15-2038 | | | | 16,865,000 | | | | 16,865,000 | |
Forest Lake MN Kilkenny Court Apartments Project Series 2008 (Housing Revenue, FNMA Insured, FNMA LIQ) | | | 0.53 | | | | 8-15-2038 | | | | 750,000 | | | | 750,000 | |
Minneapolis & St. Paul MN Housing & RDA Allina Health Systems Series B-1 (Health Revenue, JPMorgan Chase & Company LOC) | | | 0.39 | | | | 11-15-2035 | | | | 10,915,000 | | | | 10,915,000 | |
Minnesota Bond Securitization Trust Certificate Series S-1 (Miscellaneous Revenue, PNC Bank NA LOC) | | | 0.67 | | | | 2-1-2027 | | | | 1,225,000 | | | | 1,225,000 | |
St. Paul MN Housing & RDA Hampden Square Apartments Series A (Housing Revenue, FNMA Insured, FNMA LIQ) | | | 0.55 | | | | 6-1-2032 | | | | 700,000 | | | | 700,000 | |
| | | | |
| | | | | | | | | | | | | | | 30,455,000 | |
| | | | | | | | | | | | | | | | |
| | | | |
Mississippi: 2.92% | | | | | | | | | | | | | | | | |
| | | | |
| Variable Rate Demand Notes ø: 2.92% | | | | | | | | | | | | | | | | |
Mississippi Business Finance Corporation Gulf Opportunity Chevron USA Incorporated Project Series H (Industrial Development Revenue) | | | 0.40 | | | | 11-1-2035 | | | | 11,840,000 | | | | 11,840,000 | |
Mississippi Series A Clipper Tax-Exempt Certificate Trust Series 2009-60 (Miscellaneous Revenue, State Street Bank & Trust Company LIQ) | | | 0.47 | | | | 11-1-2018 | | | | 8,300,000 | | | | 8,300,000 | |
| | | | |
| | | | | | | | | | | | | | | 20,140,000 | |
| | | | | | | | | | | | | | | | |
| | | | |
Missouri: 0.68% | | | | | | | | | | | | | | | | |
| | | | |
| Variable Rate Demand Notes ø: 0.68% | | | | | | | | | | | | | | | | |
Missouri Tender Option Bond Trust Receipts/Certificates Series XF2198 (Water & Sewer Revenue, Citibank NA LIQ) 144A | | | 0.46 | | | | 5-1-2023 | | | | 2,670,000 | | | | 2,670,000 | |
St. Louis County MO Sewer District Wastewater System Series 2013B (Water & Sewer Revenue, Morgan Stanley Bank LIQ) 144A | | | 0.47 | | | | 5-1-2043 | | | | 2,000,000 | | | | 2,000,000 | |
| | | | |
| | | | | | | | | | | | | | | 4,670,000 | |
| | | | | | | | | | | | | | | | |
The accompanying notes are an integral part of these financial statements.
| | | | | | |
| Portfolio of investments—July 31, 2016 (unaudited) | | Wells Fargo Municipal Cash Management Money Market Fund | | | 11 | |
| | | | | | | | | | | | | | | | |
| Security name | | Interest rate | | | Maturity date | | | Principal | | | Value | |
| | | | |
Nebraska: 1.72% | | | | | | | | | | | | | | | | |
| | | | |
| Variable Rate Demand Notes ø: 1.72% | | | | | | | | | | | | | | | | |
Lincoln NE Electric System Series 2900 (Utilities Revenue, Credit Suisse LIQ) | | | 0.53 | % | | | 9-1-2037 | | | $ | 5,674,412 | | | $ | 5,674,412 | |
Nebraska Investment Finance Authority Apple Creek Associates Project Series 1985-A (Housing Revenue, Northern Trust Company LOC) | | | 0.44 | | | | 9-1-2031 | | | | 6,190,000 | | | | 6,190,000 | |
| | | | |
| | | | | | | | | | | | | | | 11,864,412 | |
| | | | | | | | | | | | | | | | |
| | | | |
New Hampshire: 0.00% | | | | | | | | | | | | | | | | |
| | | | |
| Variable Rate Demand Note ø: 0.00% | | | | | | | | | | | | | | | | |
New Hampshire HEFA Dartmouth College Project Series 3069 (Education Revenue, Credit Suisse LIQ) 144A | | | 0.48 | | | | 6-1-2039 | | | | 139 | | | | 139 | |
| | | | | | | | | | | | | | | | |
| | | | |
New Jersey: 0.34% | | | | | | | | | | | | | | | | |
| | | | |
| Variable Rate Demand Note ø: 0.34% | | | | | | | | | | | | | | | | |
New Jersey Tender Option Bond Trust Receipts/Certificates Series 2015 XF0015 (Housing Revenue, JPMorgan Chase & Company LIQ) 144A | | | 0.54 | | | | 4-1-2023 | | | | 2,350,000 | | | | 2,350,000 | |
| | | | | | | | | | | | | | | | |
| | | | |
New York: 2.09% | | | | | | | | | | | | | | | | |
| | | | |
| Variable Rate Demand Notes ø: 2.09% | | | | | | | | | | | | | | | | |
New York NY Fiscal Series 2004-H-1 (GO Revenue, Bank of New York Mellon LOC) | | | 0.38 | | | | 3-1-2034 | | | | 1,745,000 | | | | 1,745,000 | |
New York NY Municipal Water Finance Authority Water & Sewer System 2nd Generation Resolution Fiscal 2016 Sub Series AA-2 (Water & Sewer Revenue, PNC Bank NA SPA) | | | 0.39 | | | | 6-15-2048 | | | | 5,450,000 | | | | 5,450,000 | |
New York NY Sub Series D-4 (GO Revenue, TD Bank NA LOC) | | | 0.39 | | | | 8-1-2040 | | | | 320,000 | | | | 320,000 | |
New York NY Transitional Finance Authority Sub Series 2003A-4 (Tax Revenue, TD Bank NA SPA) | | | 0.39 | | | | 11-1-2029 | | | | 100,000 | | | | 100,000 | |
New York NY Transitional Finance Authority Sub Series A-5 (Tax Revenue, U.S. Bank NA SPA) | | | 0.40 | | | | 8-1-2039 | | | | 5,100,000 | | | | 5,100,000 | |
New York Tender Option Bond Trust Receipts/Certificates Series 2014 XF0001 (Airport Revenue, JPMorgan Chase & Company LIQ) 144A | | | 0.52 | | | | 5-1-2017 | | | | 1,710,000 | | | | 1,710,000 | |
| | | | |
| | | | | | | | | | | | | | | 14,425,000 | |
| | | | | | | | | | | | | | | | |
| | | | |
North Carolina: 0.42% | | | | | | | | | | | | | | | | |
| | | | |
| Variable Rate Demand Notes ø: 0.42% | | | | | | | | | | | | | | | | |
North Carolina HFA Home Ownership Series 15-C (Housing Revenue, AGM Insured, TD Bank NA SPA) | | | 0.44 | | | | 7-1-2032 | | | | 1,600,000 | | | | 1,600,000 | |
North Carolina HFA Home Ownership Series 16-C (Housing Revenue, TD Bank NA SPA) | | | 0.44 | | | | 7-1-2032 | | | | 1,300,000 | | | | 1,300,000 | |
| | | | |
| | | | | | | | | | | | | | | 2,900,000 | |
| | | | | | | | | | | | | | | | |
| | | | |
North Dakota: 0.20% | | | | | | | | | | | | | | | | |
| | | | |
| Variable Rate Demand Note ø: 0.20% | | | | | | | | | | | | | | | | |
Mandan ND IDA Cloverdale Foods Company Project (Industrial Development Revenue, BNC National Bank LOC) | | | 0.62 | | | | 12-1-2022 | | | | 1,375,000 | | | | 1,375,000 | |
| | | | | | | | | | | | | | | | |
| | | | |
Ohio: 1.79% | | | | | | | | | | | | | | | | |
| | | | |
| Variable Rate Demand Notes ø: 1.79% | | | | | | | | | | | | | | | | |
Allen County OH Catholic Healthcare Series C (Health Revenue, Union Bank NA LOC) | | | 0.42 | | | | 6-1-2034 | | | | 10,660,000 | | | | 10,660,000 | |
The accompanying notes are an integral part of these financial statements.
| | | | |
| 12 | | Wells Fargo Municipal Cash Management Money Market Fund | | Portfolio of investments—July 31, 2016 (unaudited) |
| | | | | | | | | | | | | | | | |
| Security name | | Interest rate | | | Maturity date | | | Principal | | | Value | |
| | | | |
| Variable Rate Demand Notes ø (continued) | | | | | | | | | | | | | | | | |
Ohio Air Quality Development Authority Andersons Marathon Ethanol LLC Project Series 2007 (Resource Recovery Revenue, CoBank LOC) | | | 0.51 | % | | | 3-1-2032 | | | $ | 1,700,000 | | | $ | 1,700,000 | |
| | | | |
| | | | | | | | | | | | | | | 12,360,000 | |
| | | | | | | | | | | | | | | | |
| | | | |
Oklahoma: 1.60% | | | | | | | | | | | | | | | | |
| | | | |
| Variable Rate Demand Note ø: 1.60% | | | | | | | | | | | | | | | | |
Oklahoma Turnpike Authority Series F (Transportation Revenue, JPMorgan Chase & Company SPA) | | | 0.37 | | | | 1-1-2028 | | | | 11,000,000 | | | | 11,000,000 | |
| | | | | | | | | | | | | | | | |
| | | | |
Oregon: 1.62% | | | | | | | | | | | | | | | | |
| | | | |
| Variable Rate Demand Note ø: 1.62% | | | | | | | | | | | | | | | | |
Port of Portland OR Horizon Air Industries Incorporated Project (Airport Revenue, Bank of America NA LOC) | | | 0.41 | | | | 6-15-2027 | | | | 11,200,000 | | | | 11,200,000 | |
| | | | | | | | | | | | | | | | |
| | | | |
Other: 9.30% | | | | | | | | | | | | | | | | |
| | | | |
| Variable Rate Demand Notes ø: 7.16% | | | | | | | | | | | | | | | | |
Clipper Tax-Exempt Certified Trust Series 2005-30 (Miscellaneous Revenue, State Street Bank & Trust Company LIQ) | | | 0.50 | | | | 6-1-2038 | | | | 1,310,000 | | | | 1,310,000 | |
Clipper Tax-Exempt Certified Trust Series 2007-19 (Miscellaneous Revenue, State Street Bank & Trust Company LIQ) | | | 0.56 | | | | 9-1-2039 | | | | 1,000,000 | | | | 1,000,000 | |
Clipper Tax-Exempt Certified Trust Series 2009-32 (Miscellaneous Revenue, State Street Bank & Trust Company LIQ) | | | 0.49 | | | | 1-1-2018 | | | | 595,000 | | | | 595,000 | |
Clipper Tax-Exempt Certified Trust Series 2009-54 (Miscellaneous Revenue, State Street Bank & Trust Company LIQ) | | | 0.49 | | | | 2-15-2028 | | | | 10,088,000 | | | | 10,088,000 | |
FHLMC MFHR Series M019 Class A (Housing Revenue, FHLMC LIQ) | | | 0.49 | | | | 1-15-2047 | | | | 12,328,000 | | | | 12,328,000 | |
FHLMC MFHR Series M020 Class A (Housing Revenue, FHLMC LIQ) | | | 0.49 | | | | 11-15-2036 | | | | 18,860,000 | | | | 18,860,000 | |
FHLMC MFHR Series M021 Class A (Housing Revenue, FHLMC LIQ) | | | 0.49 | | | | 6-15-2036 | | | | 14,725,000 | | | | 14,725,000 | |
FHLMC MFHR Series M031 Class A (Housing Revenue, FHLMC LIQ) | | | 0.47 | | | | 12-15-2045 | | | | 2,470,000 | | | | 2,470,000 | |
FHLMC MFHR Series M033 Class A (Housing Revenue, FHLMC LIQ) | | | 0.47 | | | | 3-15-2049 | | | | 2,700,000 | | | | 2,700,000 | |
| | | | |
| | | | | | | | | | | | | | | 64,076,000 | |
| | | | | | | | | | | | | | | | |
| | | | |
Pennsylvania: 0.89% | | | | | | | | | | | | | | | | |
| | | | |
| Variable Rate Demand Notes ø: 0.89% | | | | | | | | | | | | | | | | |
Bucks County PA Industrial Development Authority Grand View Hospital Series A (Health Revenue, TD Bank NA LOC) | | | 0.43 | | | | 7-1-2034 | | | | 1,535,000 | | | | 1,535,000 | |
Central Bradford Progress Authority Pennsylvania Robert Packer Hospital Royal Bank of Canada Municipal Products Incorporated Trust Certificates Series 2011-C-14 (Health Revenue, Royal Bank of Canada LOC) 144A | | | 0.47 | | | | 6-1-2035 | | | | 100,000 | | | | 100,000 | |
Pennsylvania EDFA Series G10 (Miscellaneous Revenue, PNC Bank NA LOC) | | | 0.56 | | | | 12-1-2025 | | | | 2,000,000 | | | | 2,000,000 | |
Southcentral Pennsylvania General Authority WellSpan Health Obliged Group Series 2014A Tender Option Bond Trust Receipts/Certificates Series 2015 ZM0081 (Health Revenue, Morgan Stanley Bank LIQ) 144A | | | 0.47 | | | | 6-1-2044 | | | | 200,000 | | | | 200,000 | |
Tender Option Bond Trust Receipts/Certificates Series 2016 ZF0281 (Housing Revenue, TD Bank NA LIQ) 144A | | | 0.49 | | | | 4-1-2029 | | | | 2,325,000 | | | | 2,325,000 | |
| | | | |
| | | | | | | | | | | | | | | 6,160,000 | |
| | | | | | | | | | | | | | | | |
The accompanying notes are an integral part of these financial statements.
| | | | | | |
| Portfolio of investments—July 31, 2016 (unaudited) | | Wells Fargo Municipal Cash Management Money Market Fund | | | 13 | |
| | | | | | | | | | | | | | | | |
| Security name | | Interest rate | | | Maturity date | | | Principal | | | Value | |
| | | | |
South Carolina: 4.79% | | | | | | | | | | | | | | | | |
| | | | |
| Other Municipal Debt: 4.06% | | | | | | | | | | | | | | | | |
York County SC PCR Series 2000B-1 (Utilities Revenue) | | | 0.54 | % | | | 8-1-2016 | | | $ | 9,900,000 | | | $ | 9,900,000 | |
York County SC PCR Series 2000B-2 (Utilities Revenue) | | | 0.54 | | | | 8-1-2016 | | | | 9,900,000 | | | | 9,900,000 | |
York County SC PCR Series 2000B-3 (Utilities Revenue) | | | 0.54 | | | | 8-1-2016 | | | | 8,200,000 | | | | 8,200,000 | |
| | | | |
| | | | | | | | | | | | | | | 28,000,000 | |
| | | | | | | | | | | | | | | | |
| | | | |
| Variable Rate Demand Note ø: 0.73% | | | | | | | | | | | | | | | | |
South Carolina Jobs EDA Blue Ridge Log Cabins LLC Series 2007 (Industrial Development Revenue, Branch Banking & Trust LOC) | | | 0.50 | | | | 3-1-2032 | | | | 4,995,000 | | | | 4,995,000 | |
| | | | | | | | | | | | | | | | |
| | | | |
South Dakota: 0.23% | | | | | | | | | | | | | | | | |
| | | | |
| Variable Rate Demand Note ø: 0.23% | | | | | | | | | | | | | | | | |
Grant County SD Mill Valley LLC Project (Industrial Development Revenue, Farm Credit Services America LOC) | | | 0.51 | | | | 7-1-2037 | | | | 1,600,000 | | | | 1,600,000 | |
| | | | | | | | | | | | | | | | |
| | | | |
Texas: 13.03% | | | | | | | | | | | | | | | | |
| | | | |
| Other Municipal Debt: 0.10% | | | | | | | | | | | | | | | | |
Dallas TX Independent School District Series 2012 (GO Revenue) | | | 4.00 | | | | 8-15-2016 | | | | 700,000 | | | | 700,991 | |
| | | | | | | | | | | | | | | | |
| | | | |
| Variable Rate Demand Notes ø: 12.93% | | | | | | | | | | | | | | | | |
Atascosa County TX PCR San Miguel Electric Cooperative (Utilities Revenue) | | | 0.52 | | | | 6-30-2020 | | | | 4,500,000 | | | | 4,500,000 | |
Dallam County TX Industrial Development Corporation Dalhart Jersey Ranch Incorporated Series 2008 (Resource Recovery Revenue) | | | 0.53 | | | | 8-1-2039 | | | | 1,700,000 | | | | 1,700,000 | |
Harris County TX Cultural and Educational Facilities Authority Barclays Residual Interest Bonds Trust Series 5WE (Miscellaneous Revenue, Barclays Bank plc LOC) 144A | | | 0.59 | | | | 7-1-2018 | | | | 10,000,000 | | | | 10,000,000 | |
Lower Neches Valley TX Authority Industrial Development Corporation ExxonMobil Project Series 2010 (Industrial Development Revenue) | | | 0.34 | | | | 11-1-2038 | | | | 8,480,000 | | | | 8,480,000 | |
Lower Neches Valley TX Authority Industrial Development Corporation ExxonMobil Project Series 2011 (Industrial Development Revenue) | | | 0.34 | | | | 11-1-2051 | | | | 2,000,000 | | | | 2,000,000 | |
Port Arthur TX Navigation District Environmental Facilities BASF Corporation Project Class A (Industrial Development Revenue) | | | 0.53 | | | | 4-1-2037 | | | | 15,000,000 | | | | 15,000,000 | |
Port Arthur TX Navigation District Industrial Development Corporation Total Petrochemicals USA Incorporated Project Series 2012 (Industrial Development Revenue) | | | 0.46 | | | | 3-1-2042 | | | | 7,500,000 | | | | 7,500,000 | |
Port Arthur TX Navigation District Jefferson County Total Petrochemicals USA Incorporated Project Series 2003-C (Industrial Development Revenue) | | | 0.46 | | | | 4-1-2027 | | | | 3,000,000 | | | | 3,000,000 | |
Port Corpus Christi TX Flint Hills Resources Project Series A (Resource Recovery Revenue) | | | 0.51 | | | | 4-1-2028 | | | | 15,500,000 | | | | 15,500,000 | |
Texas Municipal Gas Acquisition & Supply Corporation Series 2848 (Utilities Revenue, Morgan Stanley Bank LIQ) 144A | | | 0.74 | | | | 12-15-2026 | | | | 16,041,892 | | | | 16,041,892 | |
Texas Tender Option Bond Trust Receipts/Certificates Series 2016 XM0343 (Water & Sewer Revenue, National Insured, Bank of America NA LIQ) 144A | | | 0.50 | | | | 12-1-2023 | | | | 5,400,000 | | | | 5,400,000 | |
| | | | |
| | | | | | | | | | | | | | | 89,121,892 | |
| | | | | | | | | | | | | | | | |
| | | | |
Utah: 0.73% | | | | | | | | | | | | | | | | |
| | | | |
| Variable Rate Demand Note ø: 0.73% | | | | | | | | | | | | | | | | |
Weber County UT Hospital IHC Health Services Series 2000C (Health Revenue, Bank of New York Mellon SPA) | | | 0.38 | | | | 2-15-2035 | | | | 5,000,000 | | | | 5,000,000 | |
| | | | | | | | | | | | | | | | |
The accompanying notes are an integral part of these financial statements.
| | | | |
| 14 | | Wells Fargo Municipal Cash Management Money Market Fund | | Portfolio of investments—July 31, 2016 (unaudited) |
| | | | | | | | | | | | | | | | |
| Security name | | Interest rate | | | Maturity date | | | Principal | | | Value | |
| | | | |
Vermont: 1.41% | | | | | | | | | | | | | | | | |
| | | | |
| Variable Rate Demand Notes ø: 1.41% | | | | | | | | | | | | | | | | |
Vermont HFA Series A (Housing Revenue, AGM Insured, Bank of New York Mellon SPA) | | | 0.48 | % | | | 5-1-2037 | | | $ | 4,200,000 | | | $ | 4,200,000 | |
Vermont HFA Series C (Housing Revenue, AGM Insured, Bank of New York Mellon SPA) | | | 0.48 | | | | 11-1-2037 | | | | 5,500,000 | | | | 5,500,000 | |
| | | | |
| | | | | | | | | | | | | | | 9,700,000 | |
| | | | | | | | | | | | | | | | |
| | | | |
Virginia: 0.28% | | | | | | | | | | | | | | | | |
| | | | |
| Variable Rate Demand Note ø: 0.28% | | | | | | | | | | | | | | | | |
Chesterfield County VA IDA Super Radiator Coils Project Series A (Industrial Development Revenue, Marshall & Ilsley Bank LOC) | | | 0.52 | | | | 4-1-2026 | | | | 1,900,000 | | | | 1,900,000 | |
| | | | | | | | | | | | | | | | |
| | | | |
Washington: 0.66% | | | | | | | | | | | | | | | | |
| | | | |
| Variable Rate Demand Notes ø: 0.66% | | | | | | | | | | | | | | | | |
Squaxin Island Tribe Washington Series 2008-B (Miscellaneous Revenue, Bank of America NA LOC) | | | 0.54 | | | | 5-1-2028 | | | | 1,240,000 | | | | 1,240,000 | |
Washington Finance Authority Smith Brothers Farms Incorporated Series 2001 (Industrial Development Revenue, Northwest Farm Credit LOC) | | | 0.50 | | | | 9-1-2021 | | | | 3,300,000 | | | | 3,300,000 | |
| | | | |
| | | | | | | | | | | | | | | 4,540,000 | |
| | | | | | | | | | | | | | | | |
| | | | |
West Virginia: 0.97% | | | | | | | | | | | | | | | | |
| | | | |
| Variable Rate Demand Notes ø: 0.97% | | | | | | | | | | | | | | | | |
West Virginia EDA Collins Hardwood Company LLC (Miscellaneous Revenue, CoBank LOC) | | | 0.50 | | | | 10-1-2017 | | | | 4,000,000 | | | | 4,000,000 | |
West Virginia EDA Collins Hardwood Company LLC (Industrial Development Revenue, American AgCredit LOC) | | | 0.50 | | | | 10-1-2031 | | | | 2,700,000 | | | | 2,700,000 | |
| | | | |
| | | | | | | | | | | | | | | 6,700,000 | |
| | | | | | | | | | | | | | | | |
| | | | |
Wisconsin: 0.56% | | | | | | | | | | | | | | | | |
| | | | |
| Variable Rate Demand Notes ø: 0.56% | | | | | | | | | | | | | | | | |
West Bend WI Bestech Tool Corporation Project Series A (Industrial Development Revenue, U.S. Bank NA LOC) | | | 0.70 | | | | 9-1-2019 | | | | 330,000 | | | | 330,000 | |
Wisconsin HEFA University of Wisconsin Medical Foundation (Health Revenue, JPMorgan Chase & Company LOC) | | | 0.50 | | | | 5-1-2030 | | | | 3,500,000 | | | | 3,500,000 | |
| | | | |
| | | | | | | | | | | | | | | 3,830,000 | |
| | | | | | | | | | | | | | | | |
| | | | |
Total Municipal Obligations (Cost $587,109,434) | | | | | | | | | | | | | | | 587,109,434 | |
| | | | | | | | | | | | | | | | |
| | | | |
Other: 8.47% | | | | | | | | | | | | | | | | |
Nuveen California Dividend Advantage Municipal Fund Variable Rate Demand Preferred Shares Series 3 (Deutsche Bank LIQ) 144A§± | | | 0.56 | | | | 3-1-2040 | | | | 3,000,000 | | | | 3,000,000 | |
Nuveen California Dividend Advantage Municipal Fund Variable Rate Demand Preferred Shares Series 5 (Citibank NA LIQ) 144A§± | | | 0.55 | | | | 8-1-2040 | | | | 3,700,000 | | | | 3,700,000 | |
Nuveen Enhanced Municipal Credit Opportunities Fund Series 2 (JPMorgan Chase & Company LIQ) 144A§± | | | 0.57 | | | | 3-1-2040 | | | | 15,000,000 | | | | 15,000,000 | |
Nuveen New Jersey Dividend Advantage Municipal Fund Variable Rate Demand Preferred Shares Series 5 (TD Bank NA LIQ) 144A§± | | | 0.55 | | | | 8-3-2043 | | | | 13,500,000 | | | | 13,500,000 | |
The accompanying notes are an integral part of these financial statements.
| | | | | | |
| Portfolio of investments—July 31, 2016 (unaudited) | | Wells Fargo Municipal Cash Management Money Market Fund | | | 15 | |
| | | | | | | | | | | | | | | | |
| Security name | | Interest rate | | | Maturity date | | | Principal | | | Value | |
| | | | |
Other (continued) | | | | | | | | | | | | | | | | |
Western Asset Intermediate Municipal Fund Incorporated Variable Rate Demand Preferred Shares Series 1 (Citibank NA LIQ) 144A§± | | | 0.53 | % | | | 2-25-2045 | | | $ | 3,500,000 | | | $ | 3,500,000 | |
Western Asset Managed Municipal Fund Incorporated Variable Rate Demand Preferred Shares Series 1 (Citibank NA LIQ) 144A§± | | | 0.53 | | | | 3-4-2045 | | | | 16,000,000 | | | | 16,000,000 | |
Western Asset Municipal Partners Incorporated Variable Rate Demand Preferred Shares Series 1 (Citibank NA LIQ) 144A§± | | | 0.53 | | | | 3-11-2045 | | | | 3,700,000 | | | | 3,700,000 | |
| | | | |
Total Other (Cost $58,400,000) | | | | | | | | | | | | | | | 58,400,000 | |
| | | | | | | | | | | | | | | | |
| | | | |
Repurchase Agreements: 3.63% | | | | | | | | | | | | | | | | |
Societe Generale, dated 7-29-2016, maturity value $25,000,688 ^^ | | | 0.33 | | | | 8-1-2016 | | | | 25,000,000 | | | | 25,000,000 | |
| | | | | | | | | | | | | | | | |
| | | | |
Total Repurchase Agreements (Cost $25,000,000) | | | | | | | | | | | | | | | 25,000,000 | |
| | | | | | | | | | | | | | | | |
| | | | | | | | |
| Total investments in securities (Cost $670,509,434) * | | | 97.27 | % | | | 670,509,434 | |
Other assets and liabilities, net | | | 2.73 | | | | 18,807,391 | |
| | | | | | | | |
| Total net assets | | | 100.00 | % | | $ | 689,316,825 | |
| | | | | | | | |
| ø | Variable rate demand notes are subject to a demand feature which reduces the effective maturity. The maturity date shown represents the final maturity date of the security. The interest rate is determined and reset by the issuer daily, weekly, or monthly depending upon the terms of the security. The rate shown is the rate in effect at period end. |
| 144A | The security may be resold in transactions exempt from registration, normally to qualified institutional buyers, pursuant to Rule 144A under the Securities Act of 1933. |
| § | The security is subject to a demand feature which reduces the effective maturity. |
| ± | Variable rate investment. The rate shown is the rate in effect at period end. |
| ^^ | Collateralized by U.S. government securities, 0.00% to 8.13%, 7-31-2016 to 8-15-2045, fair value including accrued interest is $25,500,000. |
| * | Cost for federal income tax purposes is substantially the same as for financial reporting purposes. |
The accompanying notes are an integral part of these financial statements.
| | | | |
| 16 | | Wells Fargo Municipal Cash Management Money Market Fund | | Statement of assets and liabilities—July 31, 2016 (unaudited) |
| | | | |
| | | | |
| |
Assets | | | | |
Investments in unaffiliated securities, at amortized cost | | $ | 670,509,434 | |
Cash | | | 67,880 | |
Receivable for investments sold | | | 18,731,252 | |
Receivable for interest | | | 459,959 | |
Prepaid expenses and other assets | | | 67,566 | |
| | | | |
Total assets | | | 689,836,091 | |
| | | | |
| |
Liabilities | | | | |
Dividends payable | | | 113,793 | |
Payable for Fund shares redeemed | | | 2,255 | |
Management fee payable | | | 88,074 | |
Administration fees payable | | | 71,844 | |
Trustees’ fees and expenses payable | | | 137,673 | |
Custodian and accounting fees payable | | | 48,532 | |
Accrued expenses and other liabilities | | | 57,095 | |
| | | | |
Total liabilities | | | 519,266 | |
| | | | |
Total net assets | | $ | 689,316,825 | |
| | | | |
| |
NET ASSETS CONSIST OF | | | | |
Paid-in capital | | $ | 689,307,101 | |
Overdistributed net investment income | | | (140,020 | ) |
Accumulated net realized gains on investments | | | 149,744 | |
| | | | |
Total net assets | | $ | 689,316,825 | |
| | | | |
| |
COMPUTATION OF NET ASSET VALUE PER SHARE1 | | | | |
Net assets – Administrator Class | | $ | 3,214,660 | |
Shares outstanding – Administrator Class1 | | | 3,213,816 | |
Net asset value per share – Administrator Class | | | $1.00 | |
Net assets – Institutional Class | | $ | 616,813,081 | |
Shares outstanding – Institutional Class1 | | | 616,620,383 | |
Net asset value per share – Institutional Class | | | $1.00 | |
Net assets – Service Class | | $ | 69,289,084 | |
Shares outstanding – Service Class1 | | | 69,270,581 | |
Net asset value per share – Service Class | | | $1.00 | |
| 1 | The Fund has an unlimited number of authorized shares. |
The accompanying notes are an integral part of these financial statements.
| | | | | | |
| Statement of operations—six months ended July 31, 2016 (unaudited) | | Wells Fargo Municipal Cash Management Money Market Fund | | | 17 | |
| | | | |
| | | | |
| |
Investment income | | | | |
Interest | | $ | 1,769,287 | |
| | | | |
| |
Expenses | | | | |
Management fee | | | 745,638 | |
Administration fees | | | | |
Administrator Class | | | 1,026 | |
Institutional Class | | | 362,736 | |
Service Class | | | 51,175 | |
Shareholder servicing fees | | | | |
Administrator Class | | | 1,026 | |
Service Class | | | 74,371 | |
Custody and accounting fees | | | 27,293 | |
Professional fees | | | 19,505 | |
Registration fees | | | 39,543 | |
Shareholder report expenses | | | 7,034 | |
Trustees’ fees and expenses | | | 5,961 | |
Other fees and expenses | | | 11,435 | |
| | | | |
Total expenses | | | 1,346,743 | |
Less: Fee waivers and/or expense reimbursements | | | (402,234 | ) |
| | | | |
Net expenses | | | 944,509 | |
| | | | |
Net investment income | | | 824,778 | |
| | | | |
Net realized gains on investments | | | 99,361 | |
| | | | |
Net increase in net assets resulting from operations | | $ | 924,139 | |
| | | | |
The accompanying notes are an integral part of these financial statements.
| | | | |
| 18 | | Wells Fargo Municipal Cash Management Money Market Fund | | Statement of changes in net assets |
| | | | | | | | | | | | | | | | |
| | | Six months ended
July 31, 2016
(unaudited) | | | Year ended
January 31, 2016 | |
| | | | |
Operations | | | | | | | | | | | | | | | | |
Net investment income | | | | | | $ | 824,778 | | | | | | | $ | 100,541 | |
Net realized gains on investments | | | | | | | 99,361 | | | | | | | | 140,400 | |
| | | | |
Net increase in net assets resulting from operations | | | | | | | 924,139 | | | | | | | | 240,941 | |
| | | | |
| | | | |
Distributions to shareholders from | | | | | | | | | | | | | | | | |
Net investment income | | | | | | | | | | | | | | | | |
Administrator Class | | | | | | | (938 | ) | | | | | | | (354 | ) |
Institutional Class | | | | | | | (811,340 | ) | | | | | | | (87,631 | ) |
Service Class | | | | | | | (12,500 | ) | | | | | | | (12,556 | ) |
Net realized gains | | | | | | | | | | | | | | | | |
Administrator Class | | | | | | | 0 | | | | | | | | (436 | ) |
Institutional Class | | | | | | | 0 | | | | | | | | (113,924 | ) |
Service Class | | | | | | | 0 | | | | | | | | (15,231 | ) |
| | | | |
Total distributions to shareholders | | | | | | | (824,778 | ) | | | | | | | (230,132 | ) |
| | | | |
| | | | |
Capital share transactions | | | Shares | | | | | | | | Shares | | | | | |
Proceeds from shares sold | | | | | | | | | | | | | | | | |
Administrator Class | | | 2,075,954 | | | | 2,075,954 | | | | 0 | | | | 0 | |
Institutional Class | | | 6,132,031,067 | | | | 6,132,031,067 | | | | 7,373,318,330 | | | | 7,373,318,330 | |
Service Class | | | 329,385,020 | | | | 329,385,020 | | | | 222,789,154 | | | | 222,789,154 | |
| | | | |
| | | | | | | 6,463,492,041 | | | | | | | | 7,596,107,484 | |
| | | | |
Reinvestment of distributions | | | | | | | | | | | | | | | | |
Administrator Class | | | 938 | | | | 938 | | | | 790 | | | | 790 | |
Institutional Class | | | 207,910 | | | | 207,910 | | | | 22,886 | | | | 22,886 | |
Service Class | | | 8,086 | | | | 8,086 | | | | 11,849 | | | | 11,849 | |
| | | | |
| | | | | | | 216,934 | | | | | | | | 35,525 | |
| | | | |
Payment for shares redeemed | | | | | | | | | | | | | | | | |
Administrator Class | | | (2,400,000 | ) | | | (2,400,000 | ) | | | 0 | | | | 0 | |
Institutional Class | | | (6,468,547,859 | ) | | | (6,468,547,859 | ) | | | (7,428,980,604 | ) | | | (7,428,980,604 | ) |
Service Class | | | (368,601,098 | ) | | | (368,601,098 | ) | | | (254,784,279 | ) | | | (254,784,279 | ) |
| | | | |
| | | | | | | (6,839,548,957 | ) | | | | | | | (7,683,764,883 | ) |
| | | | |
Net decrease in net assets resulting from capital share transactions | | | | | | | (375,839,982 | ) | | | | | | | (87,621,874 | ) |
| | | | |
Total decrease in net assets | | | | | | | (375,740,621 | ) | | | | | | | (87,611,065 | ) |
| | | | |
| | | | |
Net assets | | | | | | | | | | | | | | | | |
Beginning of period | | | | | | | 1,065,057,446 | | | | | | | | 1,152,668,511 | |
| | | | |
End of period | | | | | | $ | 689,316,825 | | | | | | | $ | 1,065,057,446 | |
| | | | |
Overdistributed net investment income | | | | | | $ | (140,020 | ) | | | | | | $ | (140,020 | ) |
| | | | |
The accompanying notes are an integral part of these financial statements.
| | | | | | |
| Financial highlights | | Wells Fargo Municipal Cash Management Money Market Fund | | | 19 | |
(For a share outstanding throughout each period)
| | | | | | | | | | | | | | | | | | | | | | | | |
| | | Six months ended
July 31, 2016 (unaudited) | | | Year ended January 31 | |
| ADMINISTRATOR CLASS | | | 2016 | | | 2015 | | | 2014 | | | 2013 | | | 2012 | |
Net asset value, beginning of period | | | $1.00 | | | | $1.00 | | | | $1.00 | | | | $1.00 | | | | $1.00 | | | | $1.00 | |
Net investment income | | | 0.00 | 1 | | | 0.00 | 1 | | | 0.00 | 1 | | | 0.00 | 1 | | | 0.00 | 1 | | | 0.00 | 1 |
Net realized gains on investments | | | 0.00 | 1 | | | 0.00 | 1 | | | 0.00 | 1 | | | 0.00 | 1 | | | 0.00 | 1 | | | 0.00 | 1 |
| | | | | | | | | | | | | | | | | | | | | | | | |
Total from investment operations | | | 0.00 | 1 | | | 0.00 | 1 | | | 0.00 | 1 | | | 0.00 | 1 | | | 0.00 | 1 | | | 0.00 | 1 |
Distributions to shareholders from | | | | | | | | | | | | | | | | | | | | | | | | |
Net investment income | | | (0.00 | )1 | | | (0.00 | )1 | | | (0.00 | )1 | | | (0.00 | )1 | | | (0.00 | )1 | | | (0.00 | )1 |
Net realized gains | | | 0.00 | | | | (0.00 | )1 | | | (0.00 | )1 | | | (0.00 | )1 | | | (0.00 | )1 | | | 0.00 | |
| | | | | | | | | | | | | | | | | | | | | | | | |
Total distributions to shareholders | | | (0.00 | )1 | | | (0.00 | )1 | | | (0.00 | )1 | | | (0.00 | )1 | | | (0.00 | )1 | | | (0.00 | )1 |
Net asset value, end of period | | | $1.00 | | | | $1.00 | | | | $1.00 | | | | $1.00 | | | | $1.00 | | | | $1.00 | |
Total return2 | | | 0.06 | % | | | 0.02 | % | | | 0.02 | % | | | 0.04 | % | | | 0.05 | % | | | 0.02 | % |
Ratios to average net assets (annualized) | | | | | | | | | | | | | | | | | | | | | | | | |
Gross expenses | | | 0.37 | % | | | 0.37 | % | | | 0.37 | % | | | 0.36 | % | | | 0.36 | % | | | 0.36 | % |
Net expenses | | | 0.22 | % | | | 0.10 | % | | | 0.11 | % | | | 0.15 | % | | | 0.22 | % | | | 0.24 | % |
Net investment income | | | 0.09 | % | | | 0.01 | % | | | 0.01 | % | | | 0.01 | % | | | 0.01 | % | | | 0.01 | % |
Supplemental data | | | | | | | | | | | | | | | | | | | | | | | | |
Net assets, end of period (000s omitted) | | | $3,215 | | | | $3,537 | | | | $3,536 | | | | $3,536 | | | | $3,534 | | | | $3,533 | |
| 1 | Amount is less than $0.005. |
| 2 | Returns for periods of less than one year are not annualized. |
The accompanying notes are an integral part of these financial statements.
| | | | |
| 20 | | Wells Fargo Municipal Cash Management Money Market Fund | | Financial highlights |
(For a share outstanding throughout each period)
| | | | | | | | | | | | | | | | | | | | | | | | |
| | | Six months ended
July 31, 2016 (unaudited) | | | Year ended January 31 | |
| INSTITUTIONAL CLASS | | | 2016 | | | 2015 | | | 2014 | | | 2013 | | | 2012 | |
Net asset value, beginning of period | | | $1.00 | | | | $1.00 | | | | $1.00 | | | | $1.00 | | | | $1.00 | | | | $1.00 | |
Net investment income | | | 0.00 | 1 | | | 0.00 | 1 | | | 0.00 | 1 | | | 0.00 | 1 | | | 0.00 | 1 | | | 0.00 | 1 |
Net realized gains on investments | | | 0.00 | 1 | | | 0.00 | 1 | | | 0.00 | 1 | | | 0.00 | 1 | | | 0.00 | 1 | | | 0.00 | 1 |
| | | | | | | | | | | | | | | | | | | | | | | | |
Total from investment operations | | | 0.00 | 1 | | | 0.00 | 1 | | | 0.00 | 1 | | | 0.00 | 1 | | | 0.00 | 1 | | | 0.00 | 1 |
Distributions to shareholders from | | | | | | | | | | | | | | | | | | | | | | | | |
Net investment income | | | (0.00 | )1 | | | (0.00 | )1 | | | (0.00 | )1 | | | (0.00 | )1 | | | (0.00 | )1 | | | (0.00 | )1 |
Net realized gains | | | 0.00 | | | | (0.00 | )1 | | | (0.00 | )1 | | | (0.00 | )1 | | | (0.00 | )1 | | | 0.00 | |
| | | | | | | | | | | | | | | | | | | | | | | | |
Total distributions to shareholders | | | (0.00 | )1 | | | (0.00 | )1 | | | (0.00 | )1 | | | (0.00 | )1 | | | (0.00 | )1 | | | (0.00 | )1 |
Net asset value, end of period | | | $1.00 | | | | $1.00 | | | | $1.00 | | | | $1.00 | | | | $1.00 | | | | $1.00 | |
Total return2 | | | 0.09 | % | | | 0.02 | % | | | 0.02 | % | | | 0.04 | % | | | 0.08 | % | | | 0.05 | % |
Ratios to average net assets (annualized) | | | | | | | | | | | | | | | | | | | | | | | | |
Gross expenses | | | 0.25 | % | | | 0.25 | % | | | 0.25 | % | | | 0.24 | % | | | 0.24 | % | | | 0.24 | % |
Net expenses | | | 0.18 | % | | | 0.10 | % | | | 0.11 | % | | | 0.15 | % | | | 0.19 | % | | | 0.19 | % |
Net investment income | | | 0.18 | % | | | 0.01 | % | | | 0.01 | % | | | 0.01 | % | | | 0.04 | % | | | 0.06 | % |
Supplemental data | | | | | | | | | | | | | | | | | | | | | | | | |
Net assets, end of period (000s omitted) | | | $616,813 | | | | $953,036 | | | | $1,008,667 | | | | $1,104,686 | | | | $1,566,716 | | | | $2,337,778 | |
| 1 | Amount is less than $0.005. |
| 2 | Returns for periods of less than one year are not annualized. |
The accompanying notes are an integral part of these financial statements.
| | | | | | |
| Financial highlights | | Wells Fargo Municipal Cash Management Money Market Fund | | | 21 | |
(For a share outstanding throughout each period)
| | | | | | | | | | | | | | | | | | | | | | | | |
| | | Six months ended
July 31, 2016 (unaudited) | | | Year ended January 31 | |
| SERVICE CLASS | | | 2016 | | | 2015 | | | 2014 | | | 2013 | | | 2012 | |
Net asset value, beginning of period | | | $1.00 | | | | $1.00 | | | | $1.00 | | | | $1.00 | | | | $1.00 | | | | $1.00 | |
Net investment income (loss) | | | 0.00 | 1 | | | 0.00 | 1 | | | 0.00 | 1 | | | 0.00 | 1 | | | 0.00 | 1 | | | (0.00 | )1 |
Net realized gains on investments | | | 0.00 | 1 | | | 0.00 | 1 | | | 0.00 | 1 | | | 0.00 | 1 | | | 0.00 | 1 | | | 0.00 | 1 |
| | | | | | | | | | | | | | | | | | | | | | | | |
Total from investment operations | | | 0.00 | 1 | | | 0.00 | 1 | | | 0.00 | 1 | | | 0.00 | 1 | | | 0.00 | 1 | | | 0.00 | 1 |
Distributions to shareholders from | | | | | | | | | | | | | | | | | | | | | | | | |
Net investment income | | | (0.00 | )1 | | | (0.00 | )1 | | | (0.00 | )1 | | | (0.00 | )1 | | | (0.00 | )1 | | | (0.00 | )1 |
Net realized gains | | | 0.00 | | | | (0.00 | )1 | | | (0.00 | )1 | | | (0.00 | )1 | | | (0.00 | )1 | | | 0.00 | |
| | | | | | | | | | | | | | | | | | | | | | | | |
Total distributions to shareholders | | | (0.00 | )1 | | | (0.00 | )1 | | | (0.00 | )1 | | | (0.00 | )1 | | | (0.00 | )1 | | | (0.00 | )1 |
Net asset value, end of period | | | $1.00 | | | | $1.00 | | | | $1.00 | | | | $1.00 | | | | $1.00 | | | | $1.00 | |
Total return2 | | | 0.02 | % | | | 0.02 | % | | | 0.02 | % | | | 0.04 | % | | | 0.05 | % | | | 0.01 | % |
Ratios to average net assets (annualized) | | | | | | | | | | | | | | | | | | | | | | | | |
Gross expenses | | | 0.47 | % | | | 0.48 | % | | | 0.47 | % | | | 0.48 | % | | | 0.48 | % | | | 0.50 | % |
Net expenses | | | 0.31 | % | | | 0.10 | % | | | 0.11 | % | | | 0.15 | % | | | 0.22 | % | | | 0.25 | % |
Net investment income (loss) | | | 0.03 | % | | | 0.01 | % | | | 0.01 | % | | | 0.01 | % | | | 0.01 | % | | | (0.01 | )% |
Supplemental data | | | | | | | | | | | | | | | | | | | | | | | | |
Net assets, end of period (000s omitted) | | | $69,289 | | | | $108,484 | | | | $140,465 | | | | $175,358 | | | | $140,313 | | | | $213,380 | |
| 1 | Amount is less than $0.005. |
| 2 | Returns for periods of less than one year are not annualized. |
The accompanying notes are an integral part of these financial statements.
| | | | |
| 22 | | Wells Fargo Municipal Cash Management Money Market Fund | | Notes to financial statements (unaudited) |
1. ORGANIZATION
Wells Fargo Funds Trust (the “Trust”), a Delaware statutory trust organized on March 10, 1999, is an open-end management investment company registered under the Investment Company Act of 1940, as amended (the “1940 Act”). As an investment company, the Trust follows the accounting and reporting guidance in Financial Accounting Standards Board (“FASB”) Accounting Standards Codification Topic 946, Financial Services – Investment Companies. These financial statements report on the Wells Fargo Municipal Cash Management Money Market Fund (the “Fund”) which is a diversified series of the Trust.
2. SIGNIFICANT ACCOUNTING POLICIES
The following significant accounting policies, which are consistently followed in the preparation of the financial statements of the Fund, are in conformity with U.S. generally accepted accounting principles which require management to make estimates and assumptions that affect the reported amounts of assets and liabilities, disclosure of contingent assets and liabilities at the date of the financial statements, and the reported amounts of revenues and expenses during the reporting period. Actual results could differ from those estimates.
Securities valuation
As permitted under Rule 2a-7 of the 1940 Act, portfolio securities are valued at amortized cost, which approximates fair value. The amortized cost method involves valuing a security at its cost, plus accretion of discount or minus amortization of premium over the period until maturity.
Investments which are not valued using the method discussed above are valued at their fair value, as determined in good faith by the Board of Trustees of the Fund. The Board of Trustees has established a Valuation Committee comprised of the Trustees and has delegated to it the authority to take any actions regarding the valuation of portfolio securities that the Valuation Committee deems necessary or appropriate, including determining the fair value of portfolio securities, unless the determination has been delegated to the Management Valuation Team of Wells Fargo Funds Management, LLC (“Funds Management”). The Board of Trustees retains the authority to make or ratify any valuation decisions or approve any changes to the Valuation Procedures as it deems appropriate. On a quarterly basis, the Board of Trustees receives reports on any valuation actions taken by the Valuation Committee or the Management Valuation Team which may include items for ratification.
Valuations of fair valued securities are compared to the next actual sales price when available, or other appropriate market values, to assess the continued appropriateness of the fair valuation methodologies used. These securities are fair valued on a day-to-day basis, taking into consideration changes to appropriate market information and any significant changes to the inputs considered in the valuation process until there is a readily available price provided on an exchange or by an independent pricing service. Valuations received from an independent pricing service or independent broker-dealer quotes are periodically validated by comparisons to most recent trades and valuations provided by other independent pricing services in addition to the review of prices by the manager and/or subadviser. Unobservable inputs used in determining fair valuations are identified based on the type of security, taking into consideration factors utilized by market participants in valuing the investment, knowledge about the issuer and the current market environment.
Repurchase agreements
The Fund may invest in repurchase agreements and may participate in pooled repurchase agreement transactions with other funds advised by Funds Management. The repurchase agreements must be fully collateralized based on values that are marked-to-market daily. The collateral may be held by an agent bank under a tri-party agreement. It is the custodian’s responsibility to value collateral daily and to take action to obtain additional collateral as necessary to maintain market value equal to or greater than the resale price. The repurchase agreements are collateralized by instruments such as U.S. Treasury, federal agency, or high-grade corporate obligations. There could be potential loss to the Fund in the event that the Fund is delayed or prevented from exercising its rights to dispose of the collateral, including the risk of a possible decline in the value of the underlying obligations during the period in which the Fund seeks to assert its rights.
When-issued transactions
The Fund may purchase securities on a forward commitment or when-issued basis. The Fund records a when-issued transaction on the trade date and will segregate assets in an amount at least equal in value to the Fund’s commitment to purchase when-issued securities. Securities purchased on a when-issued basis are marked-to-market daily and the Fund begins earning interest on the settlement date. Losses may arise due to changes in the market value of the underlying securities or if the counterparty does not perform under the contract.
| | | | | | |
| Notes to financial statements (unaudited) | | Wells Fargo Municipal Cash Management Money Market Fund | | | 23 | |
Security transactions and income recognition
Securities transactions are recorded on a trade date basis. Realized gains or losses are recorded on the basis of identified cost.
Interest income is accrued daily and bond discounts are accreted and premiums are amortized daily based on the effective interest method. To the extent debt obligations are placed on non-accrual status, any related interest income may be reduced by writing off interest receivables when the collection of all or a portion of interest has become doubtful based on consistently applied procedures. If the issuer subsequently resumes interest payments or when the collectability of interest is reasonably assured, the debt obligation is removed from non-accrual status.
Distributions to shareholders
Distributions to shareholders from net investment income are accrued daily and paid monthly. Distributions from net realized gains, if any, are recorded on the ex-dividend date. Such distributions are determined in conformity with federal income tax regulations, which may differ in amount or character from net investment income and realized gains recognized for purposes of U.S. generally accepted accounting principles.
Federal and other taxes
The Fund intends to continue to qualify as a regulated investment company by distributing substantially all of its investment company taxable and tax-exempt income and any net realized capital gains (after reduction for capital loss carryforwards) sufficient to relieve it from all, or substantially all, federal income taxes. Accordingly, no provision for federal income taxes was required.
The Fund’s income and federal excise tax returns and all financial records supporting those returns for the prior three fiscal years are subject to examination by the federal and Delaware revenue authorities. Management has analyzed the Fund’s tax positions taken on federal, state, and foreign tax returns for all open tax years and does not believe that there are any uncertain tax positions that require recognition of a tax liability.
Class allocations
The separate classes of shares offered by the Fund differ principally in shareholder servicing and administration fees. Class specific expenses are charged directly to that share class. Investment income, common expenses, and realized and unrealized gains (losses) on investments are allocated daily to each class of shares based on the relative proportion of net assets of each class.
3. FAIR VALUATION MEASUREMENTS
Fair value measurements of investments are determined within a framework that has established a fair value hierarchy based upon the various data inputs utilized in determining the value of the Fund’s investments. The three-level hierarchy gives the highest priority to unadjusted quoted prices in active markets for identical assets or liabilities (Level 1) and the lowest priority to significant unobservable inputs (Level 3). The Fund’s investments are classified within the fair value hierarchy based on the lowest level of input that is significant to the fair value measurement. The inputs are summarized into three broad levels as follows:
| n | | Level 1 – quoted prices in active markets for identical securities |
| n | | Level 2 – other significant observable inputs (including quoted prices for similar securities, interest rates, prepayment speeds, credit risk, use of amortized cost, etc.) |
| n | | Level 3 – significant unobservable inputs (including the Fund’s own assumptions in determining the fair value of investments) |
The inputs or methodologies used for valuing investments in securities are not necessarily an indication of the risk associated with investing in those securities.
At July 31, 2016, all of the Fund’s investments in securities were valued using Level 2 inputs since the primary inputs include the credit quality of the issuer and short-term interest rates (both of which are observable) in addition to the use of amortized cost.
The Fund recognizes transfers between levels within the fair value hierarchy at the end of the reporting period. At July 31, 2016, the Fund did not have any transfers into/out of Level 1, Level 2, or Level 3.
| | | | |
| 24 | | Wells Fargo Municipal Cash Management Money Market Fund | | Notes to financial statements (unaudited) |
4. TRANSACTIONS WITH AFFILIATES
Management fee
Funds Management, an indirect wholly owned subsidiary of Wells Fargo & Company (“Wells Fargo”), is the manager of the Fund and provides advisory and fund-level administrative services under an investment management agreement. Under the investment management agreement, Funds Management is responsible for, among other services, implementing the investment objectives and strategies of the Fund, supervising the subadviser, providing fund-level administrative services in connection with the Fund’s operations, and providing any other fund-level administrative services reasonably necessary for the operation of the Fund. As compensation for its services under the investment management agreement, Funds Management is entitled to receive an annual management fee starting at 0.15% and declining to 0.13% as the average daily net assets of the Fund increase. For the six months ended July 31, 2016, the management fee was equivalent to an annual rate of 0.15% of the Fund’s average daily net assets.
Funds Management has retained the services of a subadviser to provide daily portfolio management to the Fund. The fee for subadvisory services is borne by Funds Management. Wells Capital Management Incorporated, an affiliate of Funds Management and an indirect wholly owned subsidiary of Wells Fargo, is the subadviser to the Fund and is entitled to receive a fee from Funds Management at an annual rate starting at 0.05% and declining to 0.01% as the average daily net assets of the Fund increase.
Administration fees
Under a class-level administration agreement, Funds Management provides class-level administrative services to the Fund, which includes paying fees and expenses for services provided by the transfer agent, sub-transfer agents, omnibus account servicers and record-keepers. As compensation for its services under the class-level administration agreement, Funds Management receives an annual fee which is calculated based on the average daily net assets of each class as follows:
| | | | |
| | | Class-level
administration fee | |
Administrator Class | | | 0.10 | % |
Institutional Class | | | 0.08 | |
Service Class | | | 0.12 | |
Funds Management has contractually waived and/or reimbursed management and administration fees to the extent necessary to maintain certain net operating expense ratios for the Fund. Waiver of fees and/or reimbursement of expenses by Funds Management were made first from fund level expenses on a proportionate basis and then from class specific expenses. Funds Management has committed through May 31, 2017 to waive fees and/or reimburse expenses to the extent necessary to cap the Fund’s expenses at 0.30% for Administrator Class shares, 0.20% for Institutional Class shares and 0.45% for Service Class shares. After this time, the cap may be increased or the commitment to maintain the cap may be terminated only with the approval of the Board of Trustees. During the six months ended July 31, 2016, Funds Management voluntarily waived additional expenses to maintain a positive yield.
Shareholder servicing fees
The Trust has entered into contracts with one or more shareholder servicing agents. Administrator Class and Service Class of the Fund are charged a fee at an annual rate of 0.10% and 0.25%, respectively, of their average daily net assets.
A portion of these total shareholder servicing fees were paid to affiliates of Wells Fargo.
5. INDEMNIFICATION
Under the Trust’s organizational documents, the officers and Trustees have been granted certain indemnification rights against certain liabilities that may arise out of performance of their duties to the Trust. Additionally, in the normal course of business, the Trust may enter into contracts with service providers that contain a variety of indemnification clauses. The Trust’s maximum exposure under these arrangements is dependent on future claims that may be made against the Fund and, therefore, cannot be estimated.
6. MONEY MARKET FUND REFORM
On July 23, 2014, the Securities and Exchange Commission voted to amend Rule 2a-7 of the 1940 Act which governs the operations of registered money market funds. The amendments to Rule 2a-7 when implemented may, among other things, require the Fund to change the manner in which it values its securities, impose new liquidity fees on redemptions in certain circumstances, and permit the Fund to limit redemptions in certain circumstances. The amendments have staggered compliance dates. Compliance with a majority of these amendments will be required on October 14, 2016. Effective on or before October 5, 2016, the Fund will no longer maintain a stable $1.00 net asset value (NAV) and instead will be offered as a floating, market-based NAV.
| | | | | | |
| Other information (unaudited) | | Wells Fargo Municipal Cash Management Money Market Fund | | | 25 | |
PROXY VOTING INFORMATION
A description of the policies and procedures that the Fund uses to determine how to vote proxies relating to portfolio securities is available, upon request, by calling 1-800-222-8222, visiting our website at wellsfargofunds.com, or visiting the SEC website at sec.gov. Information regarding how the Fund voted proxies relating to portfolio securities during the most recent 12-month period ended June 30 is available on the Fund’s website at wellsfargofunds.com or by visiting the SEC website at sec.gov.
PORTFOLIO HOLDINGS INFORMATION
The complete portfolio holdings for the Fund are publicly available on the Fund’s website (wellsfargofunds.com) on a 1-day delayed basis. The Fund files its complete schedule of portfolio holdings with the SEC for the first and third quarters of each fiscal year on Form N-Q, which is available by visiting the SEC website at sec.gov. In addition, the Fund’s Form N-Q may be reviewed and copied at the SEC’s Public Reference Room in Washington, DC, and at regional offices in New York City, at 233 Broadway, and in Chicago, at 175 West Jackson Boulevard, Suite 900. Information about the Public Reference Room may be obtained by calling 1-800-SEC-0330.
| | | | |
| 26 | | Wells Fargo Municipal Cash Management Money Market Fund | | Other information (unaudited) |
BOARD OF TRUSTEES AND OFFICERS
Each of the Trustees and Officers1 listed in the table below acts in identical capacities for each fund in the Wells Fargo family of funds, which consists of 139 mutual funds comprising the Wells Fargo Funds Trust, Wells Fargo Variable Trust, Wells Fargo Master Trust and four closed-end funds (collectively the “Fund Complex”). This table should be read in conjunction with the Prospectus and the Statement of Additional Information2. The mailing address of each Trustee and Officer is 525 Market Street, 12th Floor, San Francisco, CA 94105. Each Trustee and Officer serves an indefinite term, however, each Trustee serves such term until reaching the mandatory retirement age established by the Trustees.
Independent Trustees
| | | | | | |
Name and year of birth | | Position held and length of service* | | Principal occupations during past five years or longer | | Current other public
company or
investment company
directorships |
William R. Ebsworth
(Born 1957) | | Trustee, since 2015 | | Retired. From 1984 to 2013, equities analyst, portfolio manager, research director and chief financial officer at Fidelity Management and Research Company in Boston, Tokyo, and Hong Kong and retired in 2013 as Chief Investment Officer of Fidelity Strategic Advisers, Inc. where he lead a team of investment professionals managing client assets. Prior thereto, Board member of Hong Kong Securities Clearing Co., Hong Kong Options Clearing Corp., the Thailand International Fund, Ltd., Fidelity Investments Life Insurance Company, and Empire Fidelity Investments Life Insurance Company. Mr. Ebsworth is a CFA® charterholder and an Adjunct Lecturer, Finance, at Babson College. | | Asset Allocation Trust |
| Jane A. Freeman (Born 1953) | | Trustee, since 2015 | | Retired. From 2012 to 2014 and 1999 to 2008, Chief Financial Officer of Scientific Learning Corporation. From 2008 to 2012, Ms. Freeman provided consulting services related to strategic business projects. Prior to 1999, Portfolio Manager at Rockefeller & Co. and Scudder, Stevens & Clark. Board member of the Harding Loevner Funds from 1996 to 2014, serving as both Lead Independent Director and chair of the Audit Committee. Board member of the Russell Exchange Traded Funds Trust from 2011 to 2012 and the chair of the Audit Committee. Ms. Freeman is Chair of Taproot Foundation (non-profit organization), a Board Member of Ruth Bancroft Garden (non-profit organization) and an inactive chartered financial analyst. | | Asset Allocation Trust |
| Peter G. Gordon (Born 1942) | | Trustee, since 1998; Chairman, since 2005 | | Co-Founder, Retired Chairman, President and CEO of Crystal Geyser Water Company. Trustee Emeritus, Colby College. | | Asset Allocation Trust |
| Isaiah Harris, Jr. (Born 1952) | | Trustee, since 2009 | | Retired. Chairman of the Board of CIGNA Corporation since 2009, and Director since 2005. From 2003 to 2011, Director of Deluxe Corporation. Prior thereto, President and CEO of BellSouth Advertising and Publishing Corp. from 2005 to 2007, President and CEO of BellSouth Enterprises from 2004 to 2005 and President of BellSouth Consumer Services from 2000 to 2003. Emeritus member of the Iowa State University Foundation Board of Governors. Emeritus Member of the Advisory Board of Iowa State University School of Business. Advisory Board Member, Palm Harbor Academy (charter school). Advisory Board Member, Child Evangelism Fellowship (non-profit). Mr. Harris is a certified public accountant (inactive status). | | CIGNA Corporation; Asset Allocation Trust |
| Judith M. Johnson (Born 1949) | | Trustee, since 2008;
Audit Committee Chairman, since 2008 | | Retired. Prior thereto, Chief Executive Officer and Chief Investment Officer of Minneapolis Employees Retirement Fund from 1996 to 2008. Ms. Johnson is an attorney, certified public accountant and a certified managerial accountant. | | Asset Allocation Trust |
| David F. Larcker (Born 1950) | | Trustee, since 2009 | | James Irvin Miller Professor of Accounting at the Graduate School of Business, Stanford University, Director of the Corporate Governance Research Initiative and Senior Faculty of The Rock Center for Corporate Governance since 2006. From 2005 to 2008, Professor of Accounting at the Graduate School of Business, Stanford University. Prior thereto, Ernst & Young Professor of Accounting at The Wharton School, University of Pennsylvania from 1985 to 2005. | | Asset Allocation Trust |
| | | | | | |
| Other information (unaudited) | | Wells Fargo Municipal Cash Management Money Market Fund | | | 27 | |
| | | | | | |
Name and year of birth | | Position held and length of service* | | Principal occupations during past five years or longer | | Current other public
company or
investment company
directorships |
| Olivia S. Mitchell (Born 1953) | | Trustee, since 2006 | | International Foundation of Employee Benefit Plans Professor, Wharton School of the University of Pennsylvania since 1993. Director of Wharton’s Pension Research Council and Boettner Center on Pensions & Retirement Research, and Research Associate at the National Bureau of Economic Research. Previously, Cornell University Professor from 1978 to 1993. | | Asset Allocation Trust |
| Timothy J. Penny (Born 1951) | | Trustee, since 1996 | | President and Chief Executive Officer of Southern Minnesota Initiative Foundation, a non-profit organization, since 2007 and Senior Fellow at the Humphrey Institute Policy Forum at the University of Minnesota since 1995. Member of the Board of Trustees of NorthStar Education Finance, Inc., a non-profit organization, since 2007. | | Asset Allocation Trust |
| Michael S. Scofield (Born 1943) | | Trustee, since 2010 | | Served on the Investment Company Institute’s Board of Governors and Executive Committee from 2008-2011 as well the Governing Council of the Independent Directors Council from 2006-2011 and the Independent Directors Council Executive Committee from 2008-2011. Chairman of the IDC from 2008-2010. Institutional Investor (Fund Directions) Trustee of Year in 2007. Trustee of the Evergreen Funds complex (and its predecessors) from 1984 to 2010. Chairman of the Evergreen Funds from 2000-2010. Former Trustee of the Mentor Funds. Retired Attorney, Law Offices of Michael S. Scofield. | | Asset Allocation Trust |
| * | Length of service dates reflect the Trustee’s commencement of service with the Trust’s predecessor entities, where applicable. |
Officers
| | | | | | |
Name and year of birth | | Position held and length of service | | Principal occupations during past five years or longer | | |
| Karla M. Rabusch (Born 1959) | | President, since 2003 | | Executive Vice President of Wells Fargo Bank, N.A. and President of Wells Fargo Funds Management, LLC since 2003. | | |
Nancy Wiser1
(Born 1967) | | Treasurer, since 2012 | | Executive Vice President of Wells Fargo Funds Management, LLC since 2011. Chief Operating Officer and Chief Compliance Officer at LightBox Capital Management LLC, from 2008 to 2011. | | |
| C. David Messman (Born 1960) | | Secretary, since 2000; Chief Legal Officer, since 2003 | | Senior Vice President and Secretary of Wells Fargo Funds Management, LLC since 2001. Assistant General Counsel of Wells Fargo Bank, N.A. since 2013 and Vice President and Managing Counsel of Wells Fargo Bank, N.A. from 1996 to 2013. | | |
| Michael Whitaker (Born 1967) | | Chief Compliance Officer, since 2016* | | Executive Vice President of Wells Fargo Funds Management, LLC since 2016. Chief Compliance Officer of Fidelity’s Fixed Income Funds and Asset Allocation Funds from 2008 to 2016, Compliance Officer of FMR Co., Inc. from 2014 to 2016, Fidelity Investments Money Management, Inc. from 2014 to 2016, Fidelity Investments from 2007 to 2016. | | |
David Berardi
(Born 1975) | | Assistant Treasurer, since 2009 | | Vice President of Wells Fargo Funds Management, LLC since 2009. Vice President of Evergreen Investment Management Company, LLC from 2008 to 2010. Manager of Fund Reporting and Control for Evergreen Investment Management Company, LLC from 2004 to 2010. | | |
| Jeremy DePalma1 (Born 1974) | | Assistant Treasurer, since 2009 | | Senior Vice President of Wells Fargo Funds Management, LLC since 2009. Senior Vice President of Evergreen Investment Management Company, LLC from 2008 to 2010 and head of the Fund Reporting and Control Team within Fund Administration from 2005 to 2010. | | |
| 1 | Nancy Wiser acts as Treasurer of 71 funds in the Fund Complex. Jeremy DePalma acts as Treasurer of 68 funds and Assistant Treasurer of 71 funds in the Fund Complex. |
| 2 | The Statement of Additional Information includes additional information about the Trustees and is available, without charge, upon request, by calling 1-800-222-8222 or by visiting the website at wellsfargofunds.com. |
| * | Michael Whitaker became Chief Compliance Officer effective May 16, 2016. |
| | | | |
| 28 | | Wells Fargo Municipal Cash Management Money Market Fund | | Other information (unaudited) |
BOARD CONSIDERATION OF INVESTMENT MANAGEMENT AND SUB-ADVISORY AGREEMENTS:
Under the Investment Company Act of 1940 (the “1940 Act”), the Board of Trustees (the “Board”) of Wells Fargo Funds Trust (the “Trust”) must determine annually whether to approve the continuation of the Trust’s investment management and sub-advisory agreements. In this regard, at an in-person meeting held on May 24-25, 2016 (the “Meeting”), the Board, all the members of which have no direct or indirect interest in the investment management and sub-advisory agreements and are not “interested persons” of the Trust, as defined in the 1940 Act (the “Independent Trustees”), reviewed and approved for Wells Fargo Municipal Cash Management Money Market Fund (the “Fund”): (i) an investment management agreement (the “Management Agreement”) with Wells Fargo Funds Management, LLC (“Funds Management”); and (ii) an investment sub-advisory agreement (the “Sub-Advisory Agreement”) with Wells Capital Management Incorporated (the “Sub-Adviser”), an affiliate of Funds Management. The Management Agreement and the Sub-Advisory Agreement are collectively referred to as the “Advisory Agreements.”
At the Meeting, the Board considered the factors and reached the conclusions described below relating to the selection of Funds Management and the Sub-Adviser and the approval of the Advisory Agreements. Prior to the Meeting, including at an in-person meeting in April 2016, the Trustees conferred extensively among themselves and with representatives of Funds Management about these matters. Also, the Board has adopted a team-based approach, with each team consisting of a sub-set of Trustees, to assist the full Board in the discharge of its duties in reviewing performance and other matters throughout the year. The Independent Trustees were assisted in their evaluation of the Advisory Agreements by independent legal counsel, from whom they received separate legal advice and with whom they met separately.
In providing information to the Board, Funds Management and the Sub-Adviser were guided by a detailed set of requests for information submitted to them by independent legal counsel on behalf of the Independent Trustees at the start of the Board’s annual contract renewal process earlier in 2016. In considering and approving the Advisory Agreements, the Trustees considered the information they believed relevant, including but not limited to the information discussed below. The Board considered not only the specific information presented in connection with the Meeting, but also the knowledge gained over time through interaction with Funds Management and the Sub-Adviser about various topics. In this regard, the Board reviewed reports of Funds Management at each of its quarterly meetings, which included, among other things, portfolio reviews and performance reports. In addition, the Board and the teams mentioned above confer with portfolio managers at various times throughout the year. The Board did not identify any particular information or consideration that was all-important or controlling, and each individual Trustee may have attributed different weights to various factors.
After its deliberations, the Board unanimously approved the continuation of the Advisory Agreements for a one-year term and determined that the compensation payable to Funds Management and the Sub-Adviser under each of the Advisory Agreements was reasonable. The Board considered the approval of the Advisory Agreements for the Fund as part of its
consideration of agreements for funds across the complex, but its approvals were made on a fund-by-fund basis. The following summarizes a number of important, but not necessarily all, factors considered by the Board in support of its approvals.
Nature, extent and quality of services
The Board received and considered various information regarding the nature, extent and quality of services provided to the Fund by Funds Management and the Sub-Adviser under the Advisory Agreements. This information included a description of the investment advisory services and Fund-level administrative services covered by the Management Agreement, as well as, among other things, a summary of the background and experience of senior management of Funds Management, and the qualifications, background, tenure and responsibilities of each of the portfolio managers primarily responsible for the day-to-day portfolio management of the Fund.
The Board evaluated the ability of Funds Management and the Sub-Adviser to attract and retain qualified investment professionals, including research, advisory and supervisory personnel. The Board further considered the compliance programs and compliance records of Funds Management and the Sub-Adviser. In addition, the Board took into account the full range of services provided to the Fund by Funds Management and its affiliates.
Fund performance and expenses
The Board considered the performance results for the Fund over various time periods ended December 31, 2015. The Board considered these results in comparison to the performance of funds in a universe that was determined by Broadridge Inc. (“Broadridge”) to be similar to the Fund (the “Universe”), and in comparison to other comparative data. Broadridge is an independent provider of investment company data. The Board received a description of the methodology used by Broadridge to select the mutual funds in the performance Universe. The Board noted that the
| | | | | | |
| Other information (unaudited) | | Wells Fargo Municipal Cash Management Money Market Fund | | | 29 | |
performance of the Fund (Institutional Class) was higher than or equal to the average performance of the Universe for all periods under review. The Board noted that the Fund experienced a portfolio manager change in 2014.
The Board also received and considered information regarding the Fund’s net operating expense ratios and their various components, including actual management fees, custodian and other non-management fees, and Rule 12b-1 and non-Rule 12b-1 shareholder service fees. The Board considered these ratios in comparison to the median ratios of funds in class-specific expense groups that were determined by Broadridge to be similar to the Fund (the “Groups”). The Board received a description of the methodology used by Broadridge to select the mutual funds in the expense Groups and an explanation of how funds comprising expense groups and their expense ratios may vary from year-to-year. Based on the Broadridge reports, the Board noted that the net operating expense ratios of the Fund were equal to or in range of the median net operating expense ratios of the expense Groups.
The Board took into account the Fund performance and expense information provided to it among the factors considered in deciding to re-approve the Advisory Agreements.
Investment management and sub-advisory fee rates
The Board reviewed and considered the contractual fee rates payable by the Fund to Funds Management under the Management Agreement, as well as the contractual fee rates payable by the Fund to Funds Management for class-level administrative services under a Class-Level Administration Agreement, which include class-level transfer agency and sub-transfer agency costs (collectively, the “Management Rates”). The Board also reviewed and considered the contractual investment sub-advisory fee rates that are payable by Funds Management to the Sub-Adviser for investment sub-advisory services.
Among other information reviewed by the Board was a comparison of the Fund’s Management Rates with the average contractual investment management fee rates of funds in the expense Groups at a common asset level as well as transfer agency costs of the funds in the expense Groups. The Board noted that the Management Rates of the Fund were lower than or in range of the sum of these average rates for the Fund’s expense Groups for all share classes.
The Board also received and considered information about the portion of the total management fee that was retained by Funds Management after payment of the fee to the Sub-Adviser for sub-advisory services. In assessing the reasonableness of this amount, the Board received and evaluated information about the nature and extent of responsibilities retained and risks assumed by Funds Management and not delegated to or assumed by the Sub-Adviser, and about Funds Management’s on-going oversight services. However, given the affiliation between Funds Management and the Sub-Adviser, the Board ascribed limited relevance to the allocation of fees between them.
The Board also received and considered information about the nature and extent of services offered and fee rates charged by Funds Management and the Sub-Adviser to other types of clients with investment strategies similar to those of the Fund. In this regard, the Board received information about the significantly greater scope of services, and compliance, reporting and other legal burdens and risks of managing mutual funds compared with those associated with managing assets of non-mutual fund clients such as collective funds or institutional separate accounts.
Based on its consideration of the factors and information it deemed relevant, including those described here, the Board determined that the compensation payable to Funds Management under the Management Agreement and to the Sub-Adviser under the Sub-Advisory Agreement was reasonable, in light of the services covered by the Advisory Agreements.
Profitability
The Board received and considered information concerning the profitability of Funds Management, as well as the profitability of Wells Fargo as a whole, from providing services to the Fund and the fund family as a whole. The Board also received and considered information concerning the profitability of the Sub-Adviser from providing services to the fund family as a whole, noting that the Sub-Adviser’s profitability information with respect to providing services to the Fund was subsumed in the Wells Fargo and Funds Management profitability analysis.
Funds Management reported on the methodologies and estimates used in calculating profitability. Among other things, the Board noted that the levels of profitability reported on a fund-by-fund basis varied widely, depending on factors such as the size and type of fund. Based on its review, the Board did not deem the profits reported by Funds Management or Wells Fargo from its services to the Fund to be at a level that would prevent it from approving the continuation of the Advisory Agreements.
| | | | |
| 30 | | Wells Fargo Municipal Cash Management Money Market Fund | | Other information (unaudited) |
Economies of scale
With respect to possible economies of scale, the Board noted the existence of breakpoints in the Fund’s management fee structure, which operate generally to reduce the Fund’s expense ratios as the Fund grows in size. It considered that, for a small fund or a fund that shrinks in size, breakpoints conversely can result in higher fee levels. The Board also considered that fee waiver and expense reimbursement arrangements and competitive fee rates at the outset are means of sharing potential economies of scale with shareholders of the Fund and the fund family as a whole. The Board considered Funds Management’s view that any analyses of potential economies of scale in managing a particular fund are inherently limited in light of the joint and common costs and investments that Funds Management incurs across the fund family as a whole.
The Board concluded that the Fund’s fee and expense arrangements, including contractual breakpoints, constituted a reasonable approach to sharing potential economies of scale with the Fund and its shareholders.
Other benefits to Funds Management and the Sub-Adviser
The Board received and considered information regarding potential “fall-out” or ancillary benefits received by Funds Management and its affiliates, including the Sub-Adviser, as a result of their relationships with the Fund. Ancillary benefits could include, among others, benefits directly attributable to other relationships with the Fund and benefits potentially derived from an increase in Funds Management’s and the Sub-Adviser’s business as a result of their relationships with the Fund. The Board noted that various affiliates of Funds Management may receive distribution-related fees, shareholder servicing payments and sub-transfer agency fees in respect of shares sold or held through them and services provided.
The Board also reviewed information about soft dollar credits earned and utilized by the Sub-Adviser, fees earned by Funds Management and the Sub-Adviser from managing a private investment vehicle for the fund family’s securities lending collateral and commissions earned by an affiliated broker from portfolio transactions.
Based on its consideration of the factors and information it deemed relevant, including those described here, the Board did not find that any ancillary benefits received by Funds Management and its affiliates, including the Sub-Adviser, were unreasonable.
Conclusion
At the Meeting, after considering the above-described factors and based on its deliberations and its evaluation of the information described above, the Board unanimously approved the continuation of the Advisory Agreements for a one-year term and determined that the compensation payable to Funds Management and the Sub-Adviser under each of the Advisory Agreements was reasonable.
| | | | | | |
| List of abbreviations | | Wells Fargo Municipal Cash Management Money Market Fund | | | 31 | |
The following is a list of common abbreviations for terms and entities that may have appeared in this report.
| ACA | — ACA Financial Guaranty Corporation |
| ADR | — American depositary receipt |
| ADS | — American depositary shares |
| AGC | — Assured Guaranty Corporation |
| AGM | — Assured Guaranty Municipal |
| Ambac | — Ambac Financial Group Incorporated |
| AMT | — Alternative minimum tax |
| BAN | — Bond anticipation notes |
| BHAC | — Berkshire Hathaway Assurance Corporation |
| CAB | — Capital appreciation bond |
| CCAB | — Convertible capital appreciation bond |
| CDA | — Community Development Authority |
| CDO | — Collateralized debt obligation |
| DRIVER | — Derivative inverse tax-exempt receipts |
| DW&P | — Department of Water & Power |
| DWR | — Department of Water Resources |
| ECFA | — Educational & Cultural Facilities Authority |
| EDA | — Economic Development Authority |
| EDFA | — Economic Development Finance Authority |
| ETF | — Exchange-traded fund |
| FDIC | — Federal Deposit Insurance Corporation |
| FFCB | — Federal Farm Credit Banks |
| FGIC | — Financial Guaranty Insurance Corporation |
| FHA | — Federal Housing Administration |
| FHLB | — Federal Home Loan Bank |
| FHLMC | — Federal Home Loan Mortgage Corporation |
| FICO | — The Financing Corporation |
| FNMA | — Federal National Mortgage Association |
| GDR | — Global depositary receipt |
| GNMA | — Government National Mortgage Association |
| HCFR | — Healthcare facilities revenue |
| HEFA | — Health & Educational Facilities Authority |
| HEFAR | — Higher education facilities authority revenue |
| HFA | — Housing Finance Authority |
| HFFA | — Health Facilities Financing Authority |
| HUD | — Department of Housing and Urban Development |
| IDA | — Industrial Development Authority |
| IDAG | — Industrial Development Agency |
| KRW | — Republic of Korea won |
| LIBOR | — London Interbank Offered Rate |
| LIFER | — Long Inverse Floating Exempt Receipts |
| LLC | — Limited liability company |
| LLLP | — Limited liability limited partnership |
| LLP | — Limited liability partnership |
| MBIA | — Municipal Bond Insurance Association |
| MFHR | — Multifamily housing revenue |
| MSTR | — Municipal securities trust receipts |
| MUD | — Municipal Utility District |
| National | — National Public Finance Guarantee Corporation |
| PCFA | — Pollution Control Financing Authority |
| PCL | — Public Company Limited |
| PCR | — Pollution control revenue |
| PFA | — Public Finance Authority |
| PFFA | — Public Facilities Financing Authority |
| PFOTER | — Puttable floating option tax-exempt receipts |
| plc | — Public limited company |
| PUTTER | — Puttable tax-exempt receipts |
| R&D | — Research & development |
| Radian | — Radian Asset Assurance |
| RAN | — Revenue anticipation notes |
| RDA | — Redevelopment Authority |
| RDFA | — Redevelopment Finance Authority |
| REIT | — Real estate investment trust |
| ROC | — Reset option certificates |
| SAVRS | — Select auction variable rate securities |
| SBA | — Small Business Authority |
| SDR | — Swedish depositary receipt |
| SFHR | — Single-family housing revenue |
| SFMR | — Single-family mortgage revenue |
| SPA | — Standby purchase agreement |
| SPDR | — Standard & Poor’s Depositary Receipts |
| SPEAR | — Short Puttable Exempt Adjustable Receipts |
| STRIPS | — Separate trading of registered interest and |
| TAN | — Tax anticipation notes |
| TIPS | — Treasury inflation-protected securities |
| TRAN | — Tax revenue anticipation notes |
| TTFA | — Transportation Trust Fund Authority |
| TVA | — Tennessee Valley Authority |
This page is intentionally left blank.

For more information
More information about Wells Fargo Funds is available free upon request. To obtain literature, please write, email, visit the Fund’s website, or call:
Wells Fargo Funds
P.O. Box 8266
Boston, MA 02266-8266
Email: fundservice@wellsfargo.com
Website: wellsfargofunds.com
Individual investors: 1-800-222-8222
Retail investment professionals: 1-888-877-9275
Institutional investment professionals: 1-866-765-0778
This report and the financial statements contained herein are submitted for the general information of the shareholders of the Fund. If this report is used for promotional purposes, distribution of the report must be accompanied or preceded by a current prospectus. Before investing, please consider the investment objectives, risks, charges, and expenses of the investment. For a current prospectus and, if available, a summary prospectus, containing this information, call 1-800-222-8222 or visit the Fund’s website at wellsfargofunds.com. Read the prospectus carefully before you invest or send money.
Wells Fargo Asset Management (WFAM) is a trade name used by the asset management businesses of Wells Fargo & Company. Wells Fargo Funds Management, LLC, a wholly owned subsidiary of Wells Fargo & Company, provides investment advisory and administrative services for Wells Fargo Funds. Other affiliates of Wells Fargo & Company provide subadvisory and other services for the funds. The funds are distributed by Wells Fargo Funds Distributor, LLC, Member FINRA, an affiliate of Wells Fargo & Company.
NOT FDIC INSURED ¡ NO BANK GUARANTEE ¡ MAY LOSE VALUE
© 2016 Wells Fargo Funds Management, LLC. All rights reserved.
| | |
 | | 245336 09-16 SA307/SAR307 07-16 |
Semi-Annual Report
July 31, 2016

Government Money Market Funds

| n | | Wells Fargo Government Money Market Fund |

Reduce clutter. Save trees.
Sign up for electronic delivery of prospectuses and shareholder reports at wellsfargo.com/advantagedelivery
Contents
The views expressed and any forward-looking statements are as of July 31, 2016, unless otherwise noted, and are those of the Fund managers and/or Wells Fargo Funds Management, LLC. Discussions of individual securities, or the markets generally, or any Wells Fargo Fund are not intended as individual recommendations. Future events or results may vary significantly from those expressed in any forward-looking statements. The views expressed are subject to change at any time in response to changing circumstances in the market. Wells Fargo Funds Management, LLC and the Fund disclaim any obligation to publicly update or revise any views expressed or forward-looking statements.
NOT FDIC INSURED ¡ NO BANK GUARANTEE ¡ MAY LOSE VALUE
| | | | |
| 2 | | Wells Fargo Government Money Market Fund | | Letter to shareholders (unaudited) |

Karla M. Rabusch
President
Wells Fargo Funds
We do not anticipate broad changes to the way we manage our money market funds at this time in order to meet the new rules because we have always emphasized stability of principal and liquidity.
Dear Valued Shareholder:
We are pleased to offer you this semi-annual report for the Wells Fargo Government Money Market Fund for the six-month period that ended July 31, 2016. The period was marked by preparation for the new amendments to Rule 2a-7 of the Investment Company Act of 1940 (Rule 2a-7) by the U.S. Securities and Exchange Commission. Meanwhile, the U.S. Federal Reserve (Fed) kept the federal funds target rate between 0.25% and 0.50%.
We are preparing to implement the new money market fund regulations.
The amendments to Rule 2a-7, which governs money market funds, are scheduled to be fully implemented by October 2016. To recap, U.S. Treasury and government money market funds will continue to operate much as they do today, with stable $1.00 net asset values (NAVs). Meanwhile, tax-exempt and prime funds will experience more changes. For starters, these types of funds must separate retail investors, such as individuals, and institutional investors. Second, money market fund boards of directors will have discretion to impose either a liquidity fee of up to 2% on shareholder redemptions or a temporary suspension of redemptions (gate) if a fund’s weekly liquid assets fall below 30% of its total assets and the board determines that the fee or gate is in the best interest of the fund’s shareholders.
| | n | | Retail investors will continue to transact at a stable $1.00 NAV but may be subject to liquidity fees and redemption gates. | |
| | n | | Institutional prime and tax-exempt money market funds will transact at a floating, market-based NAV and may be subject to liquidity fees and redemption gates under special circumstances. Once floating NAVs are implemented, daily share prices will fluctuate along with changes, if any, in the market-based value of the underlying portfolio securities. Our Product Alert titled Wells Fargo Announces Effective Dates for Changes to Certain Money Market Funds featured the intraday price times we will use to continue providing same-day settlement and liquidity to our shareholders. | |
| | n | | Additional requirements included increased disclosure and reporting of fund statistics, such as percentage of liquid assets, shareholder flows, and market-based NAVs. In addition, the new regulations also included tighter diversification requirements and enhanced stress-testing measures. | |
| | n | | We will continue to communicate any changes to our money markets funds with our shareholders. Specifically, Product Alerts can be found at our website: wellsfargofunds.com. Click on Product Information and find them under the Product Alerts tab. | |
While there will be many operational changes ahead, we do not anticipate broad changes to the way we manage our money market funds at this time in order to meet the new rules because we have always emphasized stability of principal and liquidity.
Short-term rates remained steady but low.
The Fed kept the federal funds rate steady. On the growth side of its mandate, U.S. economic activity appeared to maintain a modest pace. Global concerns continued to confront the Fed as it tried to assess future conditions in the U.S. While China’s growth and its markets stabilized post first-quarter downdrafts, it continued to “face considerable challenges,” per Fed Chair Janet Yellen in her
| | | | | | |
| Letter to shareholders (unaudited) | | Wells Fargo Government Money Market Fund | | | 3 | |
monetary policy report to Congress. Further, although commodity prices rebounded from first-quarter lows, other worries remained. The strong dollar, which could hamper manufacturing and exports, is one factor. Another is potential fallout from Brexit, the referendum whereby the U.K. voted to leave the European Union. With growth and inflation low, Chair Yellen has argued in her monetary policy report that there is little room to cut rates further but plenty of scope to raise rates if inflation picks up too quickly.
With regard to Brexit, traditional risk assets—such as equities and foreign exchange—experienced volatility and U.S. Treasury securities benefited from a flight to quality. Money markets, however, were relatively immune to this volatility, with both credit spreads and liquidity little changed.
Don’t let short-term uncertainty derail long-term investment goals.
Periods of uncertainty can present challenges, but experience has taught us that maintaining long-term investment goals can be an effective way to plan for the future. To help you create a sound strategy based on your personal goals and risk tolerance, Wells Fargo Funds offers more than 100 mutual funds spanning a wide range of asset classes and investment styles. Although diversification cannot guarantee an investment profit or prevent losses, we believe it can be an effective way to manage investment risk and potentially smooth out overall portfolio performance. We encourage investors to know their investments and to understand that appropriate levels of risk-taking may unlock opportunities.
Thank you for choosing to invest in Wells Fargo Funds. We appreciate your confidence in us and remain committed to helping you meet your financial needs.
Sincerely,

Karla M. Rabusch
President
Wells Fargo Funds
Periods of uncertainty can present challenges, but experience has taught us that maintaining long-term investment goals can be an effective way to plan for the future.
For further information about your Fund, contact your investment professional, visit our website at wellsfargofunds.com, or call us directly at 1-800-222-8222. We are available 24 hours a day, 7 days a week.
| | | | |
| 4 | | Wells Fargo Government Money Market Fund | | Performance highlights (unaudited) |
Investment objective
The Fund seeks current income, while preserving capital and liquidity.
Manager
Wells Fargo Funds Management, LLC
Subadviser
Wells Capital Management Incorporated
Portfolio managers
Michael C. Bird, CFA®
Jeffrey L. Weaver, CFA®
Laurie White
Average annual total returns (%) as of July 31, 20161
| | | | | | | | | | | | | | | | | | | | | | |
| | | | | | | | Expense ratios2 (%) | |
| | | Inception date | | 1 year | | | 5 year | | | 10 year | | | Gross | | | Net3 | |
| Class A (WFGXX) | | 11-8-1999 | | | 0.01 | | | | 0.01 | | | | 0.83 | | | | 0.61 | | | | 0.61 | |
| Administrator Class (WGAXX) | | 7-31-2003 | | | 0.03 | | | | 0.01 | | | | 0.91 | | | | 0.34 | | | | 0.34 | |
| Institutional Class (GVIXX) | | 7-28-2003 | | | 0.11 | | | | 0.03 | | | | 0.96 | | | | 0.22 | | | | 0.20 | |
| Select Class (WFFXX) | | 6-30-2015 | | | 0.16 | | | | 0.04 | | | | 0.97 | | | | 0.18 | | | | 0.16 | |
| Service Class (NWGXX) | | 11-16-1987 | | | 0.01 | | | | 0.01 | | | | 0.87 | | | | 0.51 | | | | 0.50 | |
| Sweep Class | | 6-30-2010 | | | 0.01 | | | | 0.01 | | | | 0.87 | | | | 0.96 | | | | 0.96 | |
Yield summary (%) as of July 31, 20163
| | | | | | | | | | | | | | | | | | | | | | |
| | | Class A | | Administrator Class | | | Institutional Class | | | Select Class | | | Service Class | | | Sweep Class | |
| 7-day current yield | | 0.01 | | | 0.13 | | | | 0.26 | | | | 0.32 | | | | 0.01 | | | | 0.01 | |
| 7-day compound yield | | 0.01 | | | 0.13 | | | | 0.26 | | | | 0.32 | | | | 0.01 | | | | 0.01 | |
| 30-day simple yield | | 0.01 | | | 0.11 | | | | 0.25 | | | | 0.31 | | | | 0.01 | | | | 0.01 | |
| 30-day compound yield | | 0.01 | | | 0.11 | | | | 0.25 | | | | 0.31 | | | | 0.01 | | | | 0.01 | |
Figures quoted represent past performance, which is no guarantee of future results, and do not reflect taxes that a shareholder may pay on fund distributions or the redemption of fund shares. Investment returns will fluctuate. The Fund’s yield figures more closely reflect the current earnings of the Fund than the total return figures. Current performance may be lower or higher than the performance data quoted, which assumes the reinvestment of dividends and capital gains. Current month-end performance is available on the Fund’s website, wellsfargofunds.com.
Each class is sold without a front-end sales charge or contingent deferred sales charge.
An investment in a money market fund is not insured or guaranteed by the Federal Deposit Insurance Corporation or any other government agency. Although the Fund seeks to preserve the value of your investment at $1.00 per share, it is possible to lose money by investing in a money market fund. The U.S. government guarantee applies to certain underlying securities and not to shares of the Fund.
Please see footnotes on page 5.
| | | | | | |
| Performance highlights (unaudited) | | Wells Fargo Government Money Market Fund | | | 5 | |
|
| Portfolio composition as of July 31, 20164 |
|
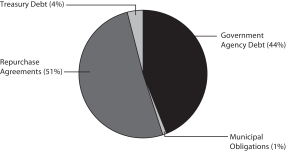 |
|
| Effective maturity distribution as of July 31, 20164 |
|
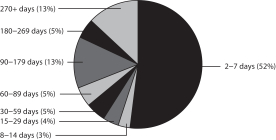 |
|
| Weighted average maturity as of July 31, 20165 |
46 days |
|
| Weighted average life as of July 31, 20166 |
92 days |
| 1 | Historical performance shown for the Select Class shares prior to their inception reflects the performance of Institutional Class shares, and has not been adjusted to reflect the higher expenses applicable to Institutional Class shares. If these expenses had been adjusted, returns would be higher. Historical performance shown for Sweep Class shares prior to their inception reflects the performance of Service Class shares, and has not been adjusted to reflect the higher expenses applicable to Sweep Class shares. If these expenses had been adjusted, returns would be lower. |
| 2 | Reflects the expense ratios as stated in the most recent prospectuses. The expense ratios shown are subject to change and may differ from the annualized expense ratios shown in the financial highlights of this report. |
| 3 | The manager has contractually committed through May 31, 2017, to waive fees and/or reimburse expenses to the extent necessary to cap the Fund’s Total Annual Fund Operating Expenses After Fee Waiver at 0.65% for Class A, 0.35% for Administrator Class, 0.20% for Institutional Class, 0.16% for Select Class, 0.50% for Service Class, and 1.00% for the Sweep Class. After this time, the cap may be increased or the commitment to maintain the cap may be terminated only with the approval of the Board of Trustees. Brokerage commissions, stamp duty fees, interest, taxes, acquired fund fees and expenses, and extraordinary expenses are excluded from the cap. Without this cap, the Fund’s returns would have been lower. Without waived fees and/or reimbursed expenses, the Fund’s 7-day current yield would have been (0.20)%, 0.07%, 0.19%, 0.23%, (0.10)%, and (0.55)% for Class A, Administrator Class, Institutional Class, Select Class, Service Class, and Sweep Class, respectively. |
| 4 | Amounts are calculated based on the total investments of the Fund. These amounts are subject to change and may have changed since the date specified. |
| 5 | Weighted Average Maturity (WAM): WAM is an average of the effective maturities of all securities held in the portfolio, weighted by each security’s percentage of total investments. The maturity of a portfolio security is the period remaining until the date on which the principal amount is unconditionally required to be paid, or in the case of a security called for redemption, the date on which the redemption payment is unconditionally required to be made. WAM calculations allow for the maturities of certain securities with demand features or periodic interest rate resets to be shortened. WAM is a way to measure a fund’s sensitivity to potential interest rate changes. Rule 2a-7 under the Investment Company Act of 1940 requires money market funds to maintain a WAM of 60 calendar days or less. WAM is subject to change and may have changed since the date specified. |
| 6 | Weighted Average Life (WAL): WAL is an average of the final maturities of all securities held in the portfolio, weighted by their percentage of total investments. The maturity of a portfolio security is the period remaining until the date on which the principal amount is unconditionally required to be paid, or in the case of a security called for redemption, the date on which the redemption payment is unconditionally required to be made. In contrast to WAM, the calculation of WAL allows for the maturities of certain securities with demand features to be shortened, but not the periodic interest rate resets. WAL is a way to measure a fund’s potential sensitivity to credit spread changes. Rule 2a-7 under the Investment Company Act of 1940 requires money market funds to maintain a WAL of 120 calendar days or less. WAL is subject to change and may have changed since the date specified. |
| | | | |
| 6 | | Wells Fargo Government Money Market Fund | | Fund expenses (unaudited) |
As a shareholder of the Fund, you incur ongoing costs, including management fees, distribution (12b-1) and/or shareholder servicing fees, and other Fund expenses. This example is intended to help you understand your ongoing costs (in dollars) of investing in the Fund and to compare these costs with the ongoing costs of investing in other mutual funds.
The example is based on an investment of $1,000 invested at the beginning of the six-month period and held for the entire period from February 1, 2016 to July 31, 2016.
Actual expenses
The “Actual” line of the table below provides information about actual account values and actual expenses. You may use the information in this line, together with the amount you invested, to estimate the expenses that you paid over the period. Simply divide your account value by $1,000 (for example, an $8,600 account value divided by $1,000 = 8.6), then multiply the result by the number in the “Actual” line under the heading entitled “Expenses paid during period” for your applicable class of shares to estimate the expenses you paid on your account during this period.
Hypothetical example for comparison purposes
The “Hypothetical” line of the table below provides information about hypothetical account values and hypothetical expenses based on the Fund’s actual expense ratio and an assumed rate of return of 5% per year before expenses, which is not the Fund’s actual return. The hypothetical account values and expenses may not be used to estimate the actual ending account balance or expenses you paid for the period. You may use this information to compare the ongoing costs of investing in the Fund and other funds. To do so, compare this 5% hypothetical example with the 5% hypothetical examples that appear in the shareholder reports of the other funds.
Please note that the expenses shown in the table are meant to highlight your ongoing costs only and do not reflect any transactional costs, such as sales charges (loads) and contingent deferred sales charges. Therefore, the “Hypothetical” line of the table is useful in comparing ongoing costs only and will not help you determine the relative total costs of owning different funds. In addition, if these transactional costs were included, your cost would have been higher.
| | | | | | | | | | | | | | | | |
| | | Beginning account value 2-1-2016 | | | Ending account value 7-31-2016 | | | Expenses paid during the period¹ | | | Annualized net expense ratio | |
Class A | | | | | | | | | | | | | | | | |
Actual | | $ | 1,000.00 | | | $ | 1,000.05 | | | $ | 1.84 | | | | 0.37 | % |
Hypothetical (5% return before expenses) | | $ | 1,000.00 | | | $ | 1,023.09 | | | $ | 1.87 | | | | 0.37 | % |
Administrator Class | | | | | | | | | | | | | | | | |
Actual | | $ | 1,000.00 | | | $ | 1,000.23 | | | $ | 1.65 | | | | 0.33 | % |
Hypothetical (5% return before expenses) | | $ | 1,000.00 | | | $ | 1,023.29 | | | $ | 1.66 | | | | 0.33 | % |
Institutional Class | | | | | | | | | | | | | | | | |
Actual | | $ | 1,000.00 | | | $ | 1,000.94 | | | $ | 0.95 | | | | 0.19 | % |
Hypothetical (5% return before expenses) | | $ | 1,000.00 | | | $ | 1,023.98 | | | $ | 0.96 | | | | 0.19 | % |
Select Class | | | | | | | | | | | | | | | | |
Actual | | $ | 1,000.00 | | | $ | 1,001.24 | | | $ | 0.65 | | | | 0.13 | % |
Hypothetical (5% return before expenses) | | $ | 1,000.00 | | | $ | 1,024.28 | | | $ | 0.66 | | | | 0.13 | % |
Service Class | | | | | | | | | | | | | | | | |
Actual | | $ | 1,000.00 | | | $ | 1,000.05 | | | $ | 1.84 | | | | 0.37 | % |
Hypothetical (5% return before expenses) | | $ | 1,000.00 | | | $ | 1,023.09 | | | $ | 1.87 | | | | 0.37 | % |
Sweep Class | | | | | | | | | | | | | | | | |
Actual | | $ | 1,000.00 | | | $ | 1,000.05 | | | $ | 1.84 | | | | 0.37 | % |
Hypothetical (5% return before expenses) | | $ | 1,000.00 | | | $ | 1,023.09 | | | $ | 1.87 | | | | 0.37 | % |
| 1 | Expenses paid is equal to the annualized net expense ratio of each class multiplied by the average account value over the period, multiplied by the number of days in the most recent fiscal half-year divided by the number of days in the fiscal year (to reflect the one-half-year period). |
| | | | | | |
| Portfolio of investments—July 31, 2016 (unaudited) | | Wells Fargo Government Money Market Fund | | | 7 | |
| | | | | | | | | | | | | | | | |
| Security name | | Interest rate | | | Maturity date | | | Principal | | | Value | |
| | | | |
Government Agency Debt: 43.99% | | | | | | | | | | | | | | | | |
FFCB (z) | | | 0.43 | % | | | 11-17-2016 | | | $ | 25,000,000 | | | $ | 24,967,750 | |
FFCB (z) | | | 0.45 | | | | 11-3-2016 | | | | 5,000,000 | | | | 4,994,125 | |
FFCB (z) | | | 0.45 | | | | 11-7-2016 | | | | 10,000,000 | | | | 9,987,750 | |
FFCB (z) | | | 0.45 | | | | 11-29-2016 | | | | 25,000,000 | | | | 24,962,500 | |
FFCB (z) | | | 0.46 | | | | 8-16-2016 | | | | 20,000,000 | | | | 19,996,167 | |
FFCB (z) | | | 0.46 | | | | 8-23-2016 | | | | 25,000,000 | | | | 24,992,972 | |
FFCB ± | | | 0.46 | | | | 9-23-2016 | | | | 97,000,000 | | | | 96,998,983 | |
FFCB (z) | | | 0.46 | | | | 2-2-2017 | | | | 15,000,000 | | | | 14,964,542 | |
FFCB (z) | | | 0.47 | | | | 2-23-2017 | | | | 35,000,000 | | | | 34,905,869 | |
FFCB ± | | | 0.48 | | | | 9-25-2017 | | | | 80,000,000 | | | | 79,984,462 | |
FFCB (z) | | | 0.48 | | | | 12-14-2016 | | | | 25,000,000 | | | | 24,955,000 | |
FFCB ± | | | 0.49 | | | | 2-23-2017 | | | | 100,000,000 | | | | 99,988,540 | |
FFCB (z) | | | 0.50 | | | | 3-6-2017 | | | | 20,000,000 | | | | 19,939,722 | |
FFCB ± | | | 0.51 | | | | 8-26-2016 | | | | 10,000,000 | | | | 10,000,525 | |
FFCB ± | | | 0.51 | | | | 12-8-2017 | | | | 35,000,000 | | | | 34,983,308 | |
FFCB (z) | | | 0.51 | | | | 3-30-2017 | | | | 35,000,000 | | | | 34,880,504 | |
FFCB (z) | | | 0.51 | | | | 4-13-2017 | | | | 125,000,000 | | | | 124,548,438 | |
FFCB ± | | | 0.51 | | | | 5-15-2017 | | | | 50,000,000 | | | | 50,011,089 | |
FFCB ± | | | 0.52 | | | | 3-29-2017 | | | | 35,000,000 | | | | 35,010,572 | |
FFCB ± | | | 0.52 | | | | 7-25-2017 | | | | 84,000,000 | | | | 84,027,400 | |
FFCB ± | | | 0.52 | | | | 7-26-2017 | | | | 35,000,000 | | | | 34,996,482 | |
FFCB ± | | | 0.52 | | | | 2-26-2018 | | | | 137,735,000 | | | | 137,490,653 | |
FFCB (z) | | | 0.52 | | | | 4-28-2017 | | | | 50,000,000 | | | | 49,805,000 | |
FFCB ± | | | 0.52 | | | | 9-15-2017 | | | | 150,000,000 | | | | 149,985,062 | |
FFCB (z) | | | 0.54 | | | | 1-24-2017 | | | | 10,000,000 | | | | 9,973,600 | |
FFCB (z) | | | 0.54 | | | | 2-3-2017 | | | | 50,000,000 | | | | 49,860,500 | |
FFCB ± | | | 0.54 | | | | 2-8-2017 | | | | 100,000,000 | | | | 100,000,000 | |
FFCB ± | | | 0.54 | | | | 6-19-2017 | | | | 200,000,000 | | | | 199,990,441 | |
FFCB (z) | | | 0.55 | | | | 1-27-2017 | | | | 5,000,000 | | | | 4,986,326 | |
FFCB ± | | | 0.55 | | | | 8-31-2016 | | | | 175,000,000 | | | | 174,999,266 | |
FFCB ± | | | 0.56 | | | | 9-9-2016 | | | | 25,000,000 | | | | 24,999,858 | |
FFCB (z) | | | 0.56 | | | | 3-8-2017 | | | | 25,000,000 | | | | 24,914,833 | |
FFCB (z) | | | 0.56 | | | | 3-10-2017 | | | | 25,000,000 | | | | 24,914,056 | |
FFCB ± | | | 0.58 | | | | 10-10-2017 | | | | 100,000,000 | | | | 99,948,654 | |
FFCB ± | | | 0.59 | | | | 5-4-2018 | | | | 250,000,000 | | | | 249,986,961 | |
FFCB ± | | | 0.59 | | | | 1-29-2018 | | | | 150,000,000 | | | | 149,967,950 | |
FFCB (z) | | | 0.59 | | | | 12-22-2016 | | | | 10,000,000 | | | | 9,976,564 | |
FFCB (z) | | | 0.59 | | | | 4-3-2017 | | | | 25,000,000 | | | | 24,899,618 | |
FFCB (z) | | | 0.60 | | | | 1-3-2017 | | | | 10,000,000 | | | | 9,974,167 | |
FFCB ± | | | 0.60 | | | | 12-4-2017 | | | | 100,000,000 | | | | 100,000,000 | |
FFCB ± | | | 0.61 | | | | 5-25-2018 | | | | 50,000,000 | | | | 49,996,534 | |
FFCB ± | | | 0.61 | | | | 6-20-2018 | | | | 150,000,000 | | | | 150,000,000 | |
FFCB (z) | | | 0.61 | | | | 4-4-2017 | | | | 50,000,000 | | | | 49,791,583 | |
FFCB (z) | | | 0.62 | | | | 1-19-2017 | | | | 25,000,000 | | | | 24,926,375 | |
FFCB ± | | | 0.62 | | | | 11-30-2016 | | | | 50,000,000 | | | | 50,000,000 | |
FFCB ± | | | 0.63 | | | | 7-21-2017 | | | | 40,000,000 | | | | 39,999,940 | |
FFCB ± | | | 0.63 | | | | 4-9-2018 | | | | 15,000,000 | | | | 14,986,542 | |
FFCB ± | | | 0.64 | | | | 10-28-2016 | | | | 50,000,000 | | | | 49,999,707 | |
FFCB | | | 0.65 | | | | 5-8-2017 | | | | 8,000,000 | | | | 8,002,556 | |
FFCB (z) | | | 0.67 | | | | 3-24-2017 | | | | 100,000,000 | | | | 99,562,639 | |
The accompanying notes are an integral part of these financial statements.
| | | | |
| 8 | | Wells Fargo Government Money Market Fund | | Portfolio of investments—July 31, 2016 (unaudited) |
| | | | | | | | | | | | | | | | |
| Security name | | Interest rate | | | Maturity date | | | Principal | | | Value | |
| | | | |
Government Agency Debt (continued) | | | | | | | | | | | | | | | | |
FFCB ± | | | 0.67 | % | | | 4-23-2018 | | | $ | 100,000,000 | | | $ | 100,035,660 | |
FFCB | | | 0.70 | | | | 2-23-2017 | | | | 16,074,000 | | | | 16,074,625 | |
FFCB (z) | | | 0.73 | | | | 5-4-2017 | | | | 100,000,000 | | | | 99,448,000 | |
FFCB | | | 4.88 | | | | 1-17-2017 | | | | 19,825,000 | | | | 20,218,757 | |
FHLB ± | | | 0.00 | | | | 5-1-2017 | | | | 100,000,000 | | | | 100,000,000 | |
FHLB (z) | | | 0.31 | | | | 8-4-2016 | | | | 300,000,000 | | | | 299,992,250 | |
FHLB (z) | | | 0.33 | | | | 8-22-2016 | | | | 100,000,000 | | | | 99,980,750 | |
FHLB (z) | | | 0.33 | | | | 8-3-2016 | | | | 162,705,000 | | | | 162,702,028 | |
FHLB (z) | | | 0.33 | | | | 8-5-2016 | | | | 50,000,000 | | | | 49,998,161 | |
FHLB (z) | | | 0.33 | | | | 9-1-2016 | | | | 200,000,000 | | | | 199,943,167 | |
FHLB (z) | | | 0.38 | | | | 10-12-2016 | | | | 150,000,000 | | | | 149,886,300 | |
FHLB (z) | | | 0.38 | | | | 10-19-2016 | | | | 200,000,000 | | | | 199,834,100 | |
FHLB (z) | | | 0.38 | | | | 10-7-2016 | | | | 250,000,000 | | | | 249,825,242 | |
FHLB (z) | | | 0.38 | | | | 10-21-2016 | | | | 200,000,000 | | | | 199,829,451 | |
FHLB (z) | | | 0.39 | | | | 10-5-2016 | | | | 275,000,000 | | | | 274,806,805 | |
FHLB (z) | | | 0.39 | | | | 8-26-2016 | | | | 100,000,000 | | | | 99,972,917 | |
FHLB (z) | | | 0.39 | | | | 9-7-2016 | | | | 300,000,000 | | | | 299,879,750 | |
FHLB (z) | | | 0.39 | | | | 9-22-2016 | | | | 100,000,000 | | | | 99,943,667 | |
FHLB (z) | | | 0.40 | | | | 8-12-2016 | | | | 100,000,000 | | | | 99,987,717 | |
FHLB (z) | | | 0.40 | | | | 9-12-2016 | | | | 100,000,000 | | | | 99,953,917 | |
FHLB (z) | | | 0.40 | | | | 9-9-2016 | | | | 200,000,000 | | | | 199,913,766 | |
FHLB (z) | | | 0.40 | | | | 9-16-2016 | | | | 100,000,000 | | | | 99,948,889 | |
FHLB (z) | | | 0.40 | | | | 10-3-2016 | | | | 100,000,000 | | | | 99,930,000 | |
FHLB | | | 0.41 | | | | 8-5-2016 | | | | 23,090,000 | | | | 23,089,960 | |
FHLB (z) | | | 0.41 | | | | 8-10-2016 | | | | 100,000,000 | | | | 99,989,763 | |
FHLB (z) | | | 0.41 | | | | 8-17-2016 | | | | 100,000,000 | | | | 99,981,778 | |
FHLB (z) | | | 0.41 | | | | 9-14-2016 | | | | 50,000,000 | | | | 49,975,250 | |
FHLB (z) | | | 0.41 | | | | 9-21-2016 | | | | 100,000,000 | | | | 99,941,917 | |
FHLB (z) | | | 0.42 | | | | 9-30-2016 | | | | 192,120,000 | | | | 191,986,897 | |
FHLB | | | 0.43 | | | | 1-11-2017 | | | | 117,500,000 | | | | 117,475,876 | |
FHLB (z) | | | 0.43 | | | | 1-4-2017 | | | | 100,000,000 | | | | 99,814,100 | |
FHLB (z) | | | 0.43 | | | | 8-19-2016 | | | | 25,000,000 | | | | 24,994,638 | |
FHLB (z) | | | 0.43 | | | | 10-28-2016 | | | | 222,000,000 | | | | 221,767,514 | |
FHLB (z) | | | 0.44 | | | | 9-2-2016 | | | | 325,000,000 | | | | 324,873,333 | |
FHLB (z) | | | 0.45 | | | | 11-9-2016 | | | | 150,000,000 | | | | 149,814,583 | |
FHLB (z) | | | 0.45 | | | | 11-14-2016 | | | | 200,000,000 | | | | 199,738,666 | |
FHLB (z) | | | 0.45 | | | | 1-13-2017 | | | | 42,000,000 | | | | 41,913,375 | |
FHLB ± | | | 0.45 | | | | 2-7-2017 | | | | 150,000,000 | | | | 149,984,233 | |
FHLB (z) | | | 0.46 | | | | 8-24-2016 | | | | 154,000,000 | | | | 153,954,840 | |
FHLB | | | 0.46 | | | | 8-19-2016 | | | | 50,000,000 | | | | 49,999,248 | |
FHLB | | | 0.46 | | | | 1-20-2017 | | | | 150,000,000 | | | | 149,962,471 | |
FHLB (z) | | | 0.46 | | | | 11-4-2016 | | | | 150,000,000 | | | | 149,817,917 | |
FHLB (z) | | | 0.47 | | | | 1-18-2017 | | | | 50,000,000 | | | | 49,890,208 | |
FHLB (z) | | | 0.47 | | | | 12-16-2016 | | | | 50,000,000 | | | | 49,910,950 | |
FHLB | | | 0.47 | | | | 11-9-2016 | | | | 100,000,000 | | | | 99,994,398 | |
FHLB | | | 0.47 | | | | 11-28-2016 | | | | 100,000,000 | | | | 99,986,758 | |
FHLB | | | 0.47 | | | | 1-20-2017 | | | | 135,000,000 | | | | 134,974,126 | |
FHLB (z) | | | 0.47 | | | | 8-31-2016 | | | | 175,000,000 | | | | 174,931,480 | |
FHLB (z) | | | 0.48 | | | | 11-2-2016 | | | | 200,000,000 | | | | 199,754,583 | |
FHLB | | | 0.48 | | | | 10-21-2016 | | | | 100,000,000 | | | | 99,996,016 | |
The accompanying notes are an integral part of these financial statements.
| | | | | | |
| Portfolio of investments—July 31, 2016 (unaudited) | | Wells Fargo Government Money Market Fund | | | 9 | |
| | | | | | | | | | | | | | | | |
| Security name | | Interest rate | | | Maturity date | | | Principal | | | Value | |
| | | | |
Government Agency Debt (continued) | | | | | | | | | | | | | | | | |
FHLB (z) | | | 0.48 | % | | | 11-23-2016 | | | $ | 13,425,000 | | | $ | 13,404,594 | |
FHLB (z) | | | 0.48 | | | | 1-27-2017 | | | | 100,000,000 | | | | 99,761,334 | |
FHLB ± | | | 0.48 | | | | 3-17-2017 | | | | 50,000,000 | | | | 49,998,418 | |
FHLB | | | 0.49 | | | | 1-27-2017 | | | | 45,000,000 | | | | 44,995,364 | |
FHLB ± | | | 0.49 | | | | 2-14-2017 | | | | 135,000,000 | | | | 134,980,388 | |
FHLB ± | | | 0.49 | | | | 2-17-2017 | | | | 63,250,000 | | | | 63,233,498 | |
FHLB ± | | | 0.49 | | | | 2-17-2017 | | | | 32,000,000 | | | | 31,986,545 | |
FHLB (z) | | | 0.49 | | | | 11-16-2016 | | | | 147,800,000 | | | | 147,583,783 | |
FHLB | | | 0.50 | | | | 9-28-2016 | | | | 42,720,000 | | | | 42,724,227 | |
FHLB ± | | | 0.50 | | | | 11-25-2016 | | | | 150,000,000 | | | | 150,000,000 | |
FHLB (z) | | | 0.50 | | | | 12-9-2016 | | | | 150,000,000 | | | | 149,729,167 | |
FHLB (z) | | | 0.50 | | | | 12-12-2016 | | | | 100,000,000 | | | | 99,815,278 | |
FHLB (z) | | | 0.50 | | | | 12-14-2016 | | | | 75,000,000 | | | | 74,859,375 | |
FHLB (z) | | | 0.50 | | | | 12-21-2016 | | | | 100,000,000 | | | | 99,802,778 | |
FHLB | | | 0.51 | | | | 11-4-2016 | | | | 15,000,000 | | | | 14,995,939 | |
FHLB | | | 0.52 | | | | 9-9-2016 | | | | 69,875,000 | | | | 69,873,392 | |
FHLB ± | | | 0.54 | | | | 10-26-2016 | | | | 30,000,000 | | | | 29,999,659 | |
FHLB ± | | | 0.54 | | | | 11-10-2017 | | | | 100,000,000 | | | | 100,000,000 | |
FHLB (z) | | | 0.54 | | | | 11-7-2016 | | | | 50,000,000 | | | | 49,926,500 | |
FHLB ± | | | 0.54 | | | | 11-6-2017 | | | | 14,400,000 | | | | 14,399,190 | |
FHLB ± | | | 0.55 | | | | 4-28-2017 | | | | 150,000,000 | | | | 150,000,000 | |
FHLB (z) | | | 0.55 | | | | 11-18-2016 | | | | 50,000,000 | | | | 49,917,039 | |
FHLB ± | | | 0.55 | | | | 12-23-2016 | | | | 106,900,000 | | | | 106,920,561 | |
FHLB ± | | | 0.57 | | | | 2-10-2017 | | | | 50,000,000 | | | | 49,998,674 | |
FHLB | | | 0.57 | | | | 4-21-2017 | | | | 100,000,000 | | | | 99,965,282 | |
FHLB ± | | | 0.57 | | | | 2-8-2017 | | | | 50,000,000 | | | | 49,998,738 | |
FHLB (z) | | | 0.58 | | | | 11-25-2016 | | | | 100,000,000 | | | | 99,813,755 | |
FHLB | | | 0.58 | | | | 12-1-2016 | | | | 150,000,000 | | | | 149,985,000 | |
FHLB | | | 0.58 | | | | 4-25-2017 | | | | 70,000,000 | | | | 69,977,845 | |
FHLB ± | | | 0.59 | | | | 8-25-2017 | | | | 21,000,000 | | | | 20,983,548 | |
FHLB (z) | | | 0.59 | | | | 12-2-2016 | | | | 150,000,000 | | | | 149,700,188 | |
FHLB ± | | | 0.59 | | | | 10-12-2016 | | | | 50,000,000 | | | | 49,998,883 | |
FHLB (z) | | | 0.60 | | | | 11-30-2016 | | | | 100,000,000 | | | | 99,799,006 | |
FHLB ± | | | 0.61 | | | | 11-25-2016 | | | | 150,000,000 | | | | 150,000,000 | |
FHLB ± | | | 0.62 | | | | 12-7-2017 | | | | 100,000,000 | | | | 100,000,000 | |
FHLB | | | 0.63 | | | | 11-23-2016 | | | | 36,135,000 | | | | 36,159,142 | |
FHLB ± | | | 0.63 | | | | 9-11-2017 | | | | 25,000,000 | | | | 24,998,601 | |
FHLB ± | | | 0.64 | | | | 9-11-2017 | | | | 70,500,000 | | | | 70,491,373 | |
FHLB ± | | | 0.65 | | | | 10-25-2017 | | | | 80,000,000 | | | | 80,000,000 | |
FHLB ± | | | 0.65 | | | | 10-27-2017 | | | | 50,000,000 | | | | 49,995,597 | |
FHLB | | | 0.88 | | | | 3-10-2017 | | | | 10,570,000 | | | | 10,592,276 | |
FHLB | | | 2.00 | | | | 9-9-2016 | | | | 15,000,000 | | | | 15,025,740 | |
FHLMC (z) | | | 0.39 | | | | 11-8-2016 | | | | 50,000,000 | | | | 49,946,375 | |
FHLMC (z) | | | 0.40 | | | | 12-21-2016 | | | | 100,000,000 | | | | 99,842,222 | |
FHLMC (z) | | | 0.42 | | | | 11-10-2016 | | | | 100,000,000 | | | | 99,883,569 | |
FHLMC (z) | | | 0.42 | | | | 10-19-2016 | | | | 100,000,000 | | | | 99,907,833 | |
FHLMC ± | | | 0.43 | | | | 8-17-2016 | | | | 100,000,000 | | | | 100,000,000 | |
FHLMC (z) | | | 0.43 | | | | 9-12-2016 | | | | 100,000,000 | | | | 99,949,833 | |
FHLMC (z) | | | 0.44 | | | | 11-2-2016 | | | | 150,000,000 | | | | 149,829,500 | |
FHLMC ± | | | 0.44 | | | | 8-24-2016 | | | | 200,000,000 | | | | 200,000,000 | |
The accompanying notes are an integral part of these financial statements.
| | | | |
| 10 | | Wells Fargo Government Money Market Fund | | Portfolio of investments—July 31, 2016 (unaudited) |
| | | | | | | | | | | | | | | | |
| Security name | | Interest rate | | | Maturity date | | | Principal | | | Value | |
| | | | |
Government Agency Debt (continued) | | | | | | | | | | | | | | | | |
FHLMC (z) | | | 0.45 | % | | | 8-4-2016 | | | $ | 100,000,000 | | | $ | 99,996,250 | |
FHLMC (z) | | | 0.45 | | | | 8-15-2016 | | | | 50,000,000 | | | | 49,991,250 | |
FHLMC (z) | | | 0.46 | | | | 8-12-2016 | | | | 100,000,000 | | | | 99,986,097 | |
FHLMC ± | | | 0.47 | | | | 9-16-2016 | | | | 75,000,000 | | | | 75,000,000 | |
FHLMC ± | | | 0.48 | | | | 1-13-2017 | | | | 150,000,000 | | | | 149,993,091 | |
FHLMC ± | | | 0.49 | | | | 4-20-2017 | | | | 100,000,000 | | | | 99,989,022 | |
FHLMC | | | 0.50 | | | | 1-27-2017 | | | | 25,000,000 | | | | 25,006,235 | |
FHLMC (z) | | | 0.51 | | | | 12-7-2016 | | | | 200,000,000 | | | | 199,637,333 | |
FHLMC ± | | | 0.52 | | | | 11-14-2016 | | | | 100,000,000 | | | | 99,995,555 | |
FHLMC ± | | | 0.53 | | | | 4-27-2017 | | | | 150,000,000 | | | | 149,977,492 | |
FHLMC ± | | | 0.56 | | | | 12-21-2017 | | | | 50,000,000 | | | | 50,000,000 | |
FHLMC ± | | | 0.62 | | | | 7-21-2017 | | | | 150,000,000 | | | | 149,985,024 | |
FHLMC ± | | | 0.63 | | | | 1-8-2018 | | | | 150,000,000 | | | | 150,000,000 | |
FHLMC | | | 0.65 | | | | 9-29-2016 | | | | 6,500,000 | | | | 6,502,796 | |
FHLMC | | | 0.75 | | | | 7-14-2017 | | | | 99,525,000 | | | | 99,619,084 | |
FHLMC | | | 0.88 | | | | 2-22-2017 | | | | 26,835,000 | | | | 26,881,352 | |
FHLMC | | | 1.00 | | | | 3-8-2017 | | | | 118,700,000 | | | | 119,000,671 | |
FHLMC | | | 1.00 | | | | 6-29-2017 | | | | 8,300,000 | | | | 8,331,784 | |
FHLMC | | | 1.00 | | | | 7-25-2017 | | | | 5,175,000 | | | | 5,190,191 | |
FHLMC | | | 1.00 | | | | 7-28-2017 | | | | 19,321,000 | | | | 19,378,485 | |
FHLMC | | | 1.25 | | | | 5-12-2017 | | | | 23,920,000 | | | | 24,044,596 | |
FHLMC | | | 2.00 | | | | 8-25-2016 | | | | 24,323,000 | | | | 24,349,509 | |
FHLMC | | | 5.00 | | | | 2-16-2017 | | | | 30,025,000 | | | | 30,752,696 | |
FNMA (z) | | | 0.42 | | | | 1-3-2017 | | | | 50,000,000 | | | | 49,909,583 | |
FNMA (z) | | | 0.44 | | | | 11-2-2016 | | | | 50,000,000 | | | | 49,943,167 | |
FNMA ± | | | 0.48 | | | | 9-8-2017 | | | | 100,000,000 | | | | 99,988,847 | |
FNMA ± | | | 0.48 | | | | 10-5-2017 | | | | 130,000,000 | | | | 129,976,617 | |
FNMA ± | | | 0.51 | | | | 8-26-2016 | | | | 30,000,000 | | | | 30,001,571 | |
FNMA (z) | | | 0.51 | | | | 12-1-2016 | | | | 100,000,000 | | | | 99,827,167 | |
FNMA ± | | | 0.51 | | | | 1-26-2017 | | | | 193,000,000 | | | | 193,008,366 | |
FNMA ± | | | 0.51 | | | | 7-20-2017 | | | | 50,000,000 | | | | 49,997,514 | |
FNMA (z) | | | 0.53 | | | | 1-5-2017 | | | | 200,000,000 | | | | 199,537,722 | |
FNMA ± | | | 0.59 | | | | 10-21-2016 | | | | 200,000,000 | | | | 199,998,328 | |
FNMA ± | | | 0.59 | | | | 3-21-2018 | | | | 150,000,000 | | | | 150,010,062 | |
FNMA ± | | | 0.60 | | | | 12-20-2017 | | | | 250,000,000 | | | | 249,950,130 | |
FNMA | | | 0.63 | | | | 8-26-2016 | | | | 13,172,000 | | | | 13,174,853 | |
FNMA ± | | | 0.63 | | | | 1-11-2018 | | | | 175,000,000 | | | | 175,000,000 | |
FNMA | | | 0.75 | | | | 4-20-2017 | | | | 88,313,000 | | | | 88,402,449 | |
FNMA ± | | | 0.80 | | | | 11-21-2016 | | | | 19,250,000 | | | | 19,269,427 | |
FNMA | | | 1.13 | | | | 4-27-2017 | | | | 292,646,000 | | | | 293,648,856 | |
FNMA | | | 1.25 | | | | 9-28-2016 | | | | 7,156,000 | | | | 7,164,608 | |
FNMA | | | 1.38 | | | | 11-15-2016 | | | | 60,838,000 | | | | 60,960,297 | |
FNMA | | | 5.00 | | | | 2-13-2017 | | | | 20,700,000 | | | | 21,195,540 | |
FNMA | | | 5.00 | | | | 5-11-2017 | | | | 35,006,000 | | | | 36,213,762 | |
FNMA | | | 5.25 | | | | 9-15-2016 | | | | 14,550,000 | | | | 14,633,230 | |
FNMA | | | 5.38 | | | | 6-12-2017 | | | | 134,235,000 | | | | 139,777,366 | |
National Credit Union Administration Guaranteed Notes Program Series A3 | | | 2.35 | | | | 6-12-2017 | | | | 25,030,000 | | | | 25,371,761 | |
Overseas Private Investment Corporation ±§ | | | 0.36 | | | | 11-15-2033 | | | | 28,444,445 | | | | 28,444,445 | |
Overseas Private Investment Corporation ±§ | | | 0.36 | | | | 6-15-2034 | | | | 21,408,120 | | | | 21,408,120 | |
Overseas Private Investment Corporation ±§ | | | 0.41 | | | | 8-15-2019 | | | | 26,000,000 | | | | 26,000,000 | |
The accompanying notes are an integral part of these financial statements.
| | | | | | |
| Portfolio of investments—July 31, 2016 (unaudited) | | Wells Fargo Government Money Market Fund | | | 11 | |
| | | | | | | | | | | | | | | | |
| Security name | | Interest rate | | | Maturity date | | | Principal | | | Value | |
| | | | |
Government Agency Debt (continued) | | | | | | | | | | | | | | | | |
Overseas Private Investment Corporation ±§ | | | 0.41 | % | | | 11-15-2022 | | | $ | 21,700,000 | | | $ | 21,700,000 | |
Overseas Private Investment Corporation ±§ | | | 0.41 | | | | 10-15-2027 | | | | 94,000,000 | | | | 94,000,000 | |
Overseas Private Investment Corporation ±§ | | | 0.41 | | | | 6-28-2028 | | | | 7,272,000 | | | | 7,272,000 | |
Overseas Private Investment Corporation ±§ | | | 0.41 | | | | 9-30-2031 | | | | 12,415,520 | | | | 12,415,520 | |
Overseas Private Investment Corporation ±§ | | | 0.41 | | | | 5-15-2033 | | | | 5,809,338 | | | | 5,809,338 | |
Overseas Private Investment Corporation ±§ | | | 0.41 | | | | 10-15-2033 | | | | 11,000,000 | | | | 11,000,000 | |
Overseas Private Investment Corporation ±§ | | | 0.43 | | | | 11-20-2019 | | | | 8,750,000 | | | | 8,750,000 | |
Overseas Private Investment Corporation ±§ | | | 0.43 | | | | 9-20-2022 | | | | 11,000,000 | | | | 11,000,000 | |
Overseas Private Investment Corporation ±§ | | | 0.43 | | | | 7-9-2026 | | | | 93,935,000 | | | | 93,935,000 | |
Overseas Private Investment Corporation ±§ | | | 0.48 | | | | 12-15-2019 | | | | 38,808,000 | | | | 38,808,000 | |
Overseas Private Investment Corporation Series 1 ±§ | | | 0.40 | | | | 8-15-2026 | | | | 17,600,000 | | | | 17,600,000 | |
Overseas Private Investment Corporation Series 1 ±§ | | | 0.41 | | | | 9-30-2031 | | | | 4,888,000 | | | | 4,888,000 | |
Overseas Private Investment Corporation Series 2 ±§ | | | 0.41 | | | | 10-10-2025 | | | | 8,798,220 | | | | 8,798,220 | |
Overseas Private Investment Corporation Series 2 ±§ | | | 0.41 | | | | 9-30-2031 | | | | 11,437,920 | | | | 11,437,920 | |
Overseas Private Investment Corporation Series 2 ±§ | | | 0.43 | | | | 1-15-2021 | | | | 12,422,307 | | | | 12,422,307 | |
Overseas Private Investment Corporation Series 3 ±§ | | | 0.41 | | | | 10-10-2025 | | | | 11,437,686 | | | | 11,437,686 | |
Overseas Private Investment Corporation Series 3 ±§ | | | 0.41 | | | | 7-15-2026 | | | | 6,600,000 | | | | 6,600,000 | |
Overseas Private Investment Corporation Series 4 ±§ | | | 0.41 | | | | 9-30-2031 | | | | 6,647,680 | | | | 6,647,680 | |
Overseas Private Investment Corporation Series 4 ±§ | | | 0.43 | | | | 1-15-2021 | | | | 9,923,200 | | | | 9,923,200 | |
Overseas Private Investment Corporation Series 5 ±§ | | | 0.41 | | | | 9-30-2031 | | | | 6,843,200 | | | | 6,843,200 | |
Overseas Private Investment Corporation Series 6 ±§ | | | 0.41 | | | | 9-30-2031 | | | | 6,843,200 | | | | 6,843,200 | |
Overseas Private Investment Corporation Series 7 ±§ | | | 0.41 | | | | 9-30-2031 | | | | 3,910,400 | | | | 3,910,400 | |
Overseas Private Investment Corporation Series 8 ±§ | | | 0.41 | | | | 9-30-2031 | | | | 14,664,000 | | | | 14,664,000 | |
Overseas Private Investment Corporation Series 9 ±§ | | | 0.36 | | | | 5-15-2030 | | | | 30,328,000 | | | | 30,328,000 | |
Overseas Private Investment Corporation Series 9 ±§ | | | 0.41 | | | | 9-30-2031 | | | | 4,594,720 | | | | 4,594,720 | |
| | | | |
Total Government Agency Debt (Cost $18,418,457,583) | | | | | | | | | | | | | | | 18,418,457,583 | |
| | | | | | | | | | | | | | | | |
| | | | |
Municipal Obligations: 1.41% | | | | | | | | | | | | | | | | |
| | | | |
Arizona: 0.03% | | | | | | | | | | | | | | | | |
| | | | |
| Variable Rate Demand Note ø: 0.03% | | | | | | | | | | | | | | | | |
Maricopa County AZ IDA Christian Care Retirement Apartments Project (Housing Revenue, FNMA Insured, FNMA LIQ) | | | 0.44 | | | | 9-15-2035 | | | | 10,775,000 | | | | 10,775,000 | |
| | | | | | | | | | | | | | | | |
| | | | |
California: 0.07% | | | | | | | | | | | | | | | | |
| | | | |
| Variable Rate Demand Notes ø: 0.07% | | | | | | | | | | | | | | | | |
Association of Bay Area Governments California Finance Authority Housing Gaia Building Series A (Housing Revenue, FNMA Insured, FNMA LIQ) | | | 0.50 | | | | 9-15-2032 | | | | 260,000 | | | | 260,000 | |
California CDA Sunrise of Danville Project Series A (Housing Revenue, FNMA Insured, FNMA LIQ) | | | 0.50 | | | | 5-1-2027 | | | | 6,165,000 | | | | 6,165,000 | |
California Municipal Finance Authority Copper Square Apartments Series A2 (Housing Revenue, East West Bank LOC) | | | 0.46 | | | | 2-1-2046 | | | | 3,000,000 | | | | 3,000,000 | |
California Statewide CDA Grande Apartments Series TT (Housing Revenue, FNMA Insured, FNMA LIQ) | | | 0.47 | | | | 12-15-2034 | | | | 1,925,000 | | | | 1,925,000 | |
California Statewide CDA Valley Palms Apartments Series C (Housing Revenue, FNMA Insured, FNMA LIQ) | | | 0.47 | | | | 5-15-2035 | | | | 1,200,000 | | | | 1,200,000 | |
Martinez CA Muirwood Garden Apartments Series A (Housing Revenue, FNMA Insured, FNMA LIQ) | | | 0.44 | | | | 12-15-2033 | | | | 6,800,000 | | | | 6,800,000 | |
Oxnard CA Housing Authority SeaWind Senior Apartments Project Series A (Housing Revenue, FNMA Insured, FNMA LIQ) | | | 0.46 | | | | 12-1-2020 | | | | 3,175,000 | | | | 3,175,000 | |
The accompanying notes are an integral part of these financial statements.
| | | | |
| 12 | | Wells Fargo Government Money Market Fund | | Portfolio of investments—July 31, 2016 (unaudited) |
| | | | | | | | | | | | | | | | |
| Security name | | Interest rate | | | Maturity date | | | Principal | | | Value | |
| | | | |
| Variable Rate Demand Notes ø (continued) | | | | | | | | | | | | | | | | |
San Francisco CA Redevelopment Agency Mercy Terrace Project Series A (Housing Revenue, FNMA Insured, FNMA LIQ) | | | 0.43 | % | | | 6-15-2035 | | | $ | 8,900,000 | | | $ | 8,900,000 | |
| | | | |
| | | | | | | | | | | | | | | 31,425,000 | |
| | | | | | | | | | | | | | | | |
| | | | |
Colorado: 0.03% | | | | | | | | | | | | | | | | |
| | | | |
| Variable Rate Demand Note ø: 0.03% | | | | | | | | | | | | | | | | |
Adams County CO Housing Authority Semper Village Apartments Project Series A (Education Revenue, FNMA Insured, FNMA LIQ) | | | 0.46 | | | | 7-15-2037 | | | | 14,000,000 | | | | 14,000,000 | |
| | | | | | | | | | | | | | | | |
| | | | |
Florida: 0.00% | | | | | | | | | | | | | | | | |
| | | | |
| Variable Rate Demand Note ø: 0.00% | | | | | | | | | | | | | | | | |
Orange County FL HFA Glenn Apartments Series D (Housing Revenue, FNMA LOC) | | | 0.47 | | | | 7-15-2034 | | | | 240,000 | | | | 240,000 | |
| | | | | | | | | | | | | | | | |
| | | | |
Hawaii: 0.02% | | | | | | | | | | | | | | | | |
| | | | |
| Variable Rate Demand Note ø: 0.02% | | | | | | | | | | | | | | | | |
Hawaii Housing Finance & Development Corporation Lokahi Kau Series 2008 (Housing Revenue, FHLMC LIQ) | | | 0.44 | | | | 12-1-2041 | | | | 9,830,000 | | | | 9,830,000 | |
| | | | | | | | | | | | | | | | |
| | | | |
Indiana: 0.02% | | | | | | | | | | | | | | | | |
| | | | |
| Variable Rate Demand Note ø: 0.02% | | | | | | | | | | | | | | | | |
Indianapolis IN Capital Place Covington Project (Housing Revenue, FNMA Insured, FNMA LIQ) | | | 0.44 | | | | 5-15-2038 | | | | 10,350,000 | | | | 10,350,000 | |
| | | | | | | | | | | | | | | | |
| | | | |
Louisiana: 0.04% | | | | | | | | | | | | | | | | |
| | | | |
| Variable Rate Demand Note ø: 0.04% | | | | | | | | | | | | | | | | |
Louisiana HFA Canterbury House Apartments (Housing Revenue, FNMA LOC) | | | 0.44 | | | | 9-15-2040 | | | | 15,470,000 | | | | 15,470,000 | |
| | | | | | | | | | | | | | | | |
| | | | |
Minnesota: 0.04% | | | | | | | | | | | | | | | | |
| | | | |
| Variable Rate Demand Note ø: 0.04% | | | | | | | | | | | | | | | | |
Oak Park Heights MN Boutwells Landing Project Series 2005 (Housing Revenue, FHLMC LIQ) | | | 0.44 | | | | 11-1-2035 | | | | 16,335,000 | | | | 16,335,000 | |
| | | | | | | | | | | | | | | | |
| | | | |
New York: 0.83% | | | | | | | | | | | | | | | | |
| | | | |
| Variable Rate Demand Notes ø: 0.83% | | | | | | | | | | | | | | | | |
New York Dormitory Authority Series A (Health Revenue, FNMA Insured, FNMA LIQ) | | | 0.44 | | | | 11-15-2036 | | | | 19,995,000 | | | | 19,995,000 | |
New York HFA 10 Barclay Street Series A (Housing Revenue, FNMA Insured, FNMA LIQ) | | | 0.46 | | | | 11-15-2037 | | | | 66,500,000 | | | | 66,500,000 | |
New York HFA 101 West End Avenue Series A (Housing Revenue, FNMA Insured, FNMA LIQ) | | | 0.44 | | | | 5-15-2031 | | | | 4,600,000 | | | | 4,600,000 | |
New York HFA 150 East 44th Street Series A (Housing Revenue, FNMA LIQ) | | | 0.44 | | | | 5-15-2032 | | | | 7,600,000 | | | | 7,600,000 | |
New York HFA 150 East 44th Street Series A (Housing Revenue, FNMA Insured, FNMA LIQ) | | | 0.44 | | | | 5-15-2032 | | | | 11,000,000 | | | | 11,000,000 | |
New York HFA 20 River Terrace Series A (Housing Revenue, FNMA Insured, FNMA LIQ) | | | 0.45 | | | | 5-15-2034 | | | | 9,700,000 | | | | 9,700,000 | |
New York HFA 316 11th Avenue Housing Series A (Housing Revenue, FNMA Insured, FNMA LIQ) | | | 0.45 | | | | 5-15-2041 | | | | 25,000,000 | | | | 25,000,000 | |
New York HFA 363 West 30th Street Series A (Housing Revenue, FHLMC LIQ) | | | 0.46 | | | | 11-1-2032 | | | | 10,150,000 | | | | 10,150,000 | |
New York HFA 38th Street Series B (Housing Revenue, FNMA LIQ) | | | 0.44 | | | | 5-15-2033 | | | | 5,000,000 | | | | 5,000,000 | |
The accompanying notes are an integral part of these financial statements.
| | | | | | |
| Portfolio of investments—July 31, 2016 (unaudited) | | Wells Fargo Government Money Market Fund | | | 13 | |
| | | | | | | | | | | | | | | | |
| Security name | | Interest rate | | | Maturity date | | | Principal | | | Value | |
| | | | |
| Variable Rate Demand Notes ø (continued) | | | | | | | | | | | | | | | | |
New York HFA Chelsea Apartments Series A (Housing Revenue, FNMA Insured, FNMA LIQ) | | | 0.47 | % | | | 11-15-2036 | | | $ | 60,500,000 | | | $ | 60,500,000 | |
New York HFA Series A (Housing Revenue, FHLMC LIQ) | | | 0.42 | | | | 11-1-2037 | | | | 26,850,000 | | | | 26,850,000 | |
New York HFA Series A (Housing Revenue, FNMA Insured, FNMA LIQ) | | | 0.45 | | | | 11-15-2036 | | | | 10,400,000 | | | | 10,400,000 | |
New York HFA West 17th Street (Housing Revenue, FNMA Insured, FNMA LIQ) | | | 0.46 | | | | 5-15-2039 | | | | 20,000,000 | | | | 20,000,000 | |
New York NY HFA 1500 Lex Avenue Series A (Housing Revenue, FNMA Insured, FNMA LIQ) | | | 0.47 | | | | 5-15-2034 | | | | 15,000,000 | | | | 15,000,000 | |
New York NY Housing Development Corporation 2 Gold Street Series A (Housing Revenue, FNMA Insured, FNMA LIQ) | | | 0.45 | | | | 4-15-2036 | | | | 11,300,000 | | | | 11,300,000 | |
New York NY Housing Development Corporation 201 Pearl Street Development Series A (Housing Revenue, FNMA Insured, FNMA LIQ) | | | 0.45 | | | | 10-15-2041 | | | | 8,600,000 | | | | 8,600,000 | |
New York NY Housing Development Corporation Atlantic Court Apartments Series A (Housing Revenue, FHLMC LIQ) | | | 0.46 | | | | 12-1-2035 | | | | 10,900,000 | | | | 10,900,000 | |
New York NY Housing Development Corporation Brittany Development Series A (Housing Revenue, FNMA Insured, FNMA LIQ) | | | 0.46 | | | | 6-15-2029 | | | | 7,300,000 | | | | 7,300,000 | |
New York NY Housing Development Corporation Queenswood Apartments Series A (Housing Revenue, FHLMC LIQ) | | | 0.44 | | | | 4-1-2031 | | | | 9,500,000 | | | | 9,500,000 | |
New York NY Housing Development Corporation West 48th Street Development Series A (Housing Revenue, FNMA Insured, FNMA LIQ) | | | 0.46 | | | | 1-15-2034 | | | | 6,000,000 | | | | 6,000,000 | |
| | | | |
| | | | | | | | | | | | | | | 345,895,000 | |
| | | | | | | | | | | | | | | | |
| | | | |
Texas: 0.02% | | | | | | | | | | | | | | | | |
| | | | |
| Variable Rate Demand Note ø: 0.02% | | | | | | | | | | | | | | | | |
Harris County TX Housing Finance Corporation Lafayette Village Apartments (Housing Revenue, FNMA Insured, FNMA LIQ) | | | 0.46 | | | | 6-15-2038 | | | | 6,300,000 | | | | 6,300,000 | |
| | | | | | | | | | | | | | | | |
| | | | |
Virginia: 0.06% | | | | | | | | | | | | | | | | |
| | | | |
| Variable Rate Demand Notes ø: 0.06% | | | | | | | | | | | | | | | | |
Alexandria VA Redevelopment & Housing Authority Fairfield Village Square Project Series A (Housing Revenue, FNMA Insured, FNMA LIQ) | | | 0.46 | | | | 1-15-2039 | | | | 21,720,000 | | | | 21,720,000 | |
Harrisonburg VA RDA Woodman West Apartments Project (Housing Revenue, FNMA Insured, FNMA LIQ) | | | 0.45 | | | | 6-15-2043 | | | | 1,950,000 | | | | 1,950,000 | |
| | | | |
| | | | | | | | | | | | | | | 23,670,000 | |
| | | | | | | | | | | | | | | | |
| | | | |
Washington: 0.18% | | | | | | | | | | | | | | | | |
| | | | |
| Variable Rate Demand Notes ø: 0.18% | | | | | | | | | | | | | | | | |
Washington Housing Finance Commission Artspace Everett Lofts Series B (Housing Revenue, FHLMC LIQ) | | | 0.46 | | | | 12-1-2041 | | | | 3,200,000 | | | | 3,200,000 | |
Washington Housing Finance Commission Brittany Park Project Series B (Housing Revenue, FNMA Insured, FNMA LIQ) | | | 0.47 | | | | 11-1-2021 | | | | 870,000 | | | | 870,000 | |
Washington Housing Finance Commission Eagles Landing Apartments Project Series A (Housing Revenue, FNMA Insured, FNMA LIQ) | | | 0.46 | | | | 8-15-2039 | | | | 6,365,000 | | | | 6,365,000 | |
Washington Housing Finance Commission Eagles Landing Apartments Project Series A (Housing Revenue, FNMA Insured, FNMA LIQ) | | | 0.47 | | | | 12-15-2036 | | | | 2,575,000 | | | | 2,575,000 | |
Washington Housing Finance Commission Highland Park Apartments Project Series B (Housing Revenue, FNMA Insured, FNMA LIQ) | | | 0.50 | | | | 7-15-2038 | | | | 820,000 | | | | 820,000 | |
Washington Housing Finance Commission Inglenook Court Project (Housing Revenue, FHLMC LIQ) | | | 0.49 | | | | 7-1-2025 | | | | 8,300,000 | | | | 8,300,000 | |
Washington Housing Finance Commission Interurban Senior Living Apartments Project (Housing Revenue, FHLMC LOC, FHLMC LIQ) | | | 0.46 | | | | 7-1-2052 | | | | 14,640,000 | | | | 14,640,000 | |
The accompanying notes are an integral part of these financial statements.
| | | | |
| 14 | | Wells Fargo Government Money Market Fund | | Portfolio of investments—July 31, 2016 (unaudited) |
| | | | | | | | | | | | | | | | |
| Security name | | Interest rate | | | Maturity date | | | Principal | | | Value | |
| | | | |
| Variable Rate Demand Notes ø (continued) | | | | | | | | | | | | | | | | |
Washington Housing Finance Commission Lake City Senior Apartments Project Series 2009 (Housing Revenue, FHLMC LIQ) | | | 0.45 | % | | | 7-1-2044 | | | $ | 8,250,000 | | | $ | 8,250,000 | |
Washington Housing Finance Commission New Haven Apartments (Housing Revenue, FNMA Insured, FNMA LIQ) | | | 0.45 | | | | 12-15-2044 | | | | 8,900,000 | | | | 8,900,000 | |
Washington Housing Finance Commission Rolling Hills Apartments Project Series B (Housing Revenue, FNMA Insured, FNMA LIQ) | | | 0.47 | | | | 6-15-2037 | | | | 1,080,000 | | | | 1,080,000 | |
Washington Housing Finance Commission The Cambridge Apartments Series 2009A (Housing Revenue, FNMA Insured, FNMA LIQ) | | | 0.45 | | | | 12-15-2044 | | | | 12,650,000 | | | | 12,650,000 | |
Washington Housing Finance Commission Washington Terrace Senior Apartments Series 2010 (Housing Revenue, FNMA LIQ) | | | 0.45 | | | | 2-15-2043 | | | | 7,500,000 | | | | 7,500,000 | |
| | | | |
| | | | | | | | | | | | | | | 75,150,000 | |
| | | | | | | | | | | | | | | | |
| | | | |
Wisconsin: 0.07% | | | | | | | | | | | | | | | | |
| | | | |
| Variable Rate Demand Notes ø: 0.07% | | | | | | | | | | | | | | | | |
Wisconsin PFA Affinity At Monterrey Project (Housing Revenue, East West Bank LOC) | | | 0.44 | | | | 8-1-2048 | | | | 17,900,000 | | | | 17,900,000 | |
Wisconsin PFA Multifamily Housing Affinity Covington Project (Housing Revenue, FHLB LOC) | | | 0.44 | | | | 12-1-2047 | | | | 12,500,000 | | | | 12,500,000 | |
| | | | |
| | | | | | | | | | | | | | | 30,400,000 | |
| | | | | | | | | | | | | | | | |
| | | | |
Total Municipal Obligations (Cost $589,840,000) | | | | | | | | | | | | | | | 589,840,000 | |
| | | | | | | | | | | | | | | | |
| | | | |
Repurchase Agreements ^^: 50.88% | | | | | | | | | | | | | | | | |
Bank of America Corporation, dated 7-29-2016, maturity value $460,013,417 (1) | | | 0.35 | | | | 8-1-2016 | | | | 460,000,000 | | | | 460,000,000 | |
Bank of Nova Scotia, dated 7-29-2016, maturity value $525,014,438 (2) | | | 0.33 | | | | 8-1-2016 | | | | 525,000,000 | | | | 525,000,000 | |
Bank of Nova Scotia, dated 7-29-2016, maturity value $740,020,967 (3) | | | 0.34 | | | | 8-1-2016 | | | | 740,000,000 | | | | 740,000,000 | |
BNP Paribas Securities Corporation, dated 7-29-2016, maturity value $1,950,056,875 (4) | | | 0.35 | | | | 8-1-2016 | | | | 1,950,000,000 | | | | 1,950,000,000 | |
BNP Paribas Securities Corporation, dated 7-29-2016, maturity value $100,002,833 (5) | | | 0.34 | | | | 8-1-2016 | | | | 100,000,000 | | | | 100,000,000 | |
BNP Paribas Securities Corporation, dated 7-29-2016, maturity value $624,767,181 (6) | | | 0.33 | | | | 8-1-2016 | | | | 624,750,000 | | | | 624,750,000 | |
Citibank NA, dated 7-28-2016, maturity value $250,016,042 (7) | | | 0.33 | | | | 8-4-2016 | | | | 250,000,000 | | | | 250,000,000 | |
Citibank NA, dated 7-29-2016, maturity value $250,007,292 (8) | | | 0.35 | | | | 8-1-2016 | | | | 250,000,000 | | | | 250,000,000 | |
Citigroup Global Markets Incorporated, dated 7-26-2016, maturity value $250,016,042 (9) | | | 0.33 | | | | 8-2-2016 | | | | 250,000,000 | | | | 250,000,000 | |
Citigroup Global Markets Incorporated, dated 7-29-2016, maturity value $500,014,583 (10) | | | 0.35 | | | | 8-1-2016 | | | | 500,000,000 | | | | 500,000,000 | |
Credit Agricole SA, dated 7-26-2016, maturity value $500,032,083 (11) | | | 0.33 | | | | 8-2-2016 | | | | 500,000,000 | | | | 500,000,000 | |
Credit Agricole SA, dated 7-27-2016, maturity value $1,000,064,167 (12) | | | 0.33 | | | | 8-3-2016 | | | | 1,000,000,000 | | | | 1,000,000,000 | |
Credit Agricole SA, dated 7-27-2016, maturity value $300,018,667 (13) | | | 0.32 | | | | 8-3-2016 | | | | 300,000,000 | | | | 300,000,000 | |
Credit Agricole SA, dated 7-29-2016, maturity value $1,000,029,167 (14) | | | 0.35 | | | | 8-1-2016 | | | | 1,000,000,000 | | | | 1,000,000,000 | |
Credit Agricole SA, dated 7-29-2016, maturity value $300,008,000 (15) | | | 0.32 | | | | 8-1-2016 | | | | 300,000,000 | | | | 300,000,000 | |
Credit Suisse Securities, dated 7-26-2016, maturity value $250,017,500 (16) | | | 0.36 | | | | 8-2-2016 | | | | 250,000,000 | | | | 250,000,000 | |
Deutsche Bank Securities, dated 7-29-2016, maturity value $450,014,625 (17) | | | 0.39 | | | | 8-1-2016 | | | | 450,000,000 | | | | 450,000,000 | |
Deutsche Bank Securities, dated 7-29-2016, maturity value $550,017,417 (18) | | | 0.38 | | | | 8-1-2016 | | | | 550,000,000 | | | | 550,000,000 | |
Federal Reserve Bank of New York, dated 7-29-2016, maturity value $3,900,081,250 (19) | | | 0.25 | | | | 8-1-2016 | | | | 3,900,000,000 | | | | 3,900,000,000 | |
Goldman Sachs & Company, dated 7-29-2016, maturity value $100,002,667 (20) | | | 0.32 | | | | 8-1-2016 | | | | 100,000,000 | | | | 100,000,000 | |
The accompanying notes are an integral part of these financial statements.
| | | | | | |
| Portfolio of investments—July 31, 2016 (unaudited) | | Wells Fargo Government Money Market Fund | | | 15 | |
| | | | | | | | | | | | | | | | |
| Security name | | Interest rate | | | Maturity date | | | Principal | | | Value | |
| | | | |
Repurchase Agreements ^^ (continued) | | | | | | | | | | | | | | | | |
HSBC Securities, dated 7-29-2016, maturity value $150,003,875 (21) | | | 0.31 | % | | | 8-1-2016 | | | $ | 150,000,000 | | | $ | 150,000,000 | |
HSBC Securities, dated 7-29-2016, maturity value $300,008,250 (22) | | | 0.33 | | | | 8-1-2016 | | | | 300,000,000 | | | | 300,000,000 | |
JPMorgan Securities, dated 7-29-2016, maturity value $250,007,292 (23) | | | 0.35 | | | | 8-1-2016 | | | | 250,000,000 | | | | 250,000,000 | |
JPMorgan Securities, dated 7-29-2016, maturity value $750,021,250 (24) | | | 0.34 | | | | 8-1-2016 | | | | 750,000,000 | | | | 750,000,000 | |
Merrill Lynch Pierce Fenner Smith Incorporated, dated
7-29-2016, maturity value $450,012,375 (25) | | | 0.33 | | | | 8-1-2016 | | | | 450,000,000 | | | | 450,000,000 | |
Mizuho Bank, dated 7-29-2016, maturity value $500,015,000 (26) | | | 0.36 | | | | 8-1-2016 | | | | 500,000,000 | | | | 500,000,000 | |
Prudential, dated 7-29-2016, maturity value $347,980,359 (27) | | | 0.34 | | | | 8-1-2016 | | | | 347,970,500 | | | | 347,970,500 | |
RBC Capital Markets, dated 6-29-2016, maturity value $250,139,792 (28)§ | | | 0.33 | | | | 8-29-2016 | | | | 250,000,000 | | | | 250,000,000 | |
RBC Capital Markets, dated 7-08-2016, maturity value $500,296,528 (29)§ | | | 0.35 | | | | 9-7-2016 | | | | 500,000,000 | | | | 500,000,000 | |
RBC Capital Markets, dated 7-29-2016, maturity value $500,012,917 (30) | | | 0.31 | | | | 8-1-2016 | | | | 500,000,000 | | | | 500,000,000 | |
RBC Capital Markets, dated 7-29-2016, maturity value $600,016,000 (31) | | | 0.32 | | | | 8-1-2016 | | | | 600,000,000 | | | | 600,000,000 | |
Societe Generale, dated 7-01-2016, maturity value $250,087,083 (32) | | | 0.38 | | | | 8-3-2016 | | | | 250,000,000 | | | | 250,000,000 | |
Societe Generale, dated 7-06-2016, maturity value $250,084,792 (33)(i) | | | 0.37 | | | | 8-8-2016 | | | | 250,000,000 | | | | 250,000,000 | |
Societe Generale, dated 7-06-2016, maturity value $250,089,375 (34)(i) | | | 0.39 | | | | 8-8-2016 | | | | 250,000,000 | | | | 250,000,000 | |
Societe Generale, dated 7-14-2016, maturity value $250,082,500 (35)(i) | | | 0.36 | | | | 8-16-2016 | | | | 250,000,000 | | | | 250,000,000 | |
Societe Generale, dated 7-21-2016, maturity value $250,077,778 (36)(i) | | | 0.35 | | | | 8-22-2016 | | | | 250,000,000 | | | | 250,000,000 | |
Societe Generale, dated 7-26-2016, maturity value $300,018,667 (37) | | | 0.32 | | | | 8-2-2016 | | | | 300,000,000 | | | | 300,000,000 | |
Societe Generale, dated 7-27-2016, maturity value $100,006,222 (38) | | | 0.32 | | | | 8-3-2016 | | | | 100,000,000 | | | | 100,000,000 | |
Societe Generale, dated 7-29-2016, maturity value $150,009,917 (39) | | | 0.34 | | | | 8-5-2016 | | | | 150,000,000 | | | | 150,000,000 | |
Societe Generale, dated 7-29-2016, maturity value $350,010,208 (40) | | | 0.35 | | | | 8-1-2016 | | | | 350,000,000 | | | | 350,000,000 | |
TD Securities, dated 7-29-2016, maturity value $550,016,042 (41) | | | 0.35 | | | | 8-1-2016 | | | | 550,000,000 | | | | 550,000,000 | |
| | | | |
Total Repurchase Agreements (Cost $21,297,720,500) | | | | | | | | | | | | | | | 21,297,720,500 | |
| | | | | | | | | | | | | | | | |
| | | | |
Treasury Debt: 3.83% | | | | | | | | | | | | | | | | |
U.S. Treasury Bond | | | 7.50 | | | | 11-15-2016 | | | | 27,000,000 | | | | 27,545,421 | |
U.S. Treasury Bond | | | 8.75 | | | | 5-15-2017 | | | | 251,509,000 | | | | 267,686,263 | |
U.S. Treasury Note | | | 0.50 | | | | 2-28-2017 | | | | 30,000,000 | | | | 29,984,197 | |
U.S. Treasury Note | | | 0.50 | | | | 4-30-2017 | | | | 90,000,000 | | | | 89,981,497 | |
U.S. Treasury Note | | | 0.63 | | | | 5-31-2017 | | | | 145,000,000 | | | | 145,071,531 | |
U.S. Treasury Note | | | 0.75 | | | | 3-15-2017 | | | | 100,000,000 | | | | 100,101,254 | |
U.S. Treasury Note | | | 0.88 | | | | 11-30-2016 | | | | 120,000,000 | | | | 120,199,485 | |
U.S. Treasury Note | | | 0.88 | | | | 2-28-2017 | | | | 80,000,000 | | | | 80,192,411 | |
U.S. Treasury Note | | | 0.88 | | | | 4-30-2017 | | | | 275,552,000 | | | | 276,271,340 | |
U.S. Treasury Note | | | 0.88 | | | | 5-15-2017 | | | | 100,000,000 | | | | 100,301,521 | |
U.S. Treasury Note | | | 2.75 | | | | 11-30-2016 | | | | 145,000,000 | | | | 146,131,399 | |
U.S. Treasury Note | | | 2.75 | | | | 5-31-2017 | | | | 9,891,000 | | | | 10,062,613 | |
U.S. Treasury Note | | | 3.13 | | | | 10-31-2016 | | | | 80,000,000 | | | | 80,554,602 | |
U.S. Treasury Note | | | 3.25 | | | | 12-31-2016 | | | | 49,934,000 | | | | 50,511,270 | |
U.S. Treasury Note | | | 4.63 | | | | 11-15-2016 | | | | 78,000,000 | | | | 78,930,702 | |
| | | | |
Total Treasury Debt (Cost $1,603,525,506) | | | | | | | | | | | | | | | 1,603,525,506 | |
| | | | | | | | | | | | | | | | |
| | | | | | | | |
| Total investments in securities (Cost $41,909,543,589) * | | | 100.11 | % | | | 41,909,543,589 | |
Other assets and liabilities, net | | | (0.11 | ) | | | (47,805,348 | ) |
| | | | | | | | |
| Total net assets | | | 100.00 | % | | $ | 41,861,738,241 | |
| | | | | | | | |
The accompanying notes are an integral part of these financial statements.
| | | | |
| 16 | | Wells Fargo Government Money Market Fund | | Portfolio of investments—July 31, 2016 (unaudited) |
| (z) | Zero coupon security. The rate represents the current yield to maturity. |
| ± | Variable rate investment. The rate shown is the rate in effect at period end. |
| § | The security is subject to a demand feature which reduces the effective maturity. |
| ø | Variable rate demand notes are subject to a demand feature which reduces the effective maturity. The maturity date shown represents the final maturity date of the security. The interest rate is determined and reset by the issuer daily, weekly, or monthly depending upon the terms of the security. The rate shown is the rate in effect at period end. |
| | (1) | U.S. government securities, 3.00% to 3.50%, 2-1-2043 to 9-1-2045, fair value including accrued interest is $473,800,000. |
| | (2) | U.S. government securities, 0.00% to 6.75%, 8-8-2016 to 5-15-2045, fair value including accrued interest is $535,500,000. |
| | (3) | U.S. government securities, 1.79% to 7.00%, 1-1-2020 to 7-1-2046, fair value including accrued interest is $762,200,000. |
| | (4) | U.S. government securities, 0.00% to 8.88%, 10-13-2016 to 11-15-2045, fair value including accrued interest is $2,003,124,487. |
| | (5) | U.S. government securities, 0.00% to 6.00%, 11-14-2012 to 9-15-2042, fair value including accrued interest is $102,000,000. |
| | (6) | U.S. government securities, 0.00% to 8.88%, 10-13-2016 to 11-15-2045, fair value including accrued interest is $637,247,018. |
| | (7) | U.S. government securities, 0.00% to 5.50%, 1-31-2018 to 2-1-2043, fair value including accrued interest is $255,001,700. |
| | (8) | U.S. government securities, 0.00% to 8.88%, 11-15-2016 to 2-1-2046, fair value including accrued interest is $255,000,029. |
| | (9) | U.S. government securities, 0.00% to 6.75%, 8-15-2016 to 7-1-2046, fair value including accrued interest is $255,027,333. |
| | (10) | U.S. government securities, 0.00% to 9.00%, 8-15-2016 to 11-1-2047, fair value including accrued interest is $514,968,385. |
| | (11) | U.S. government securities, 0.13% to 4.00%, 4-15-2017 to 1-1-2046, fair value including accrued interest is $511,846,804. |
| | (12) | U.S. government securities, 2.00% to 5.38%, 7-31-2022 to 2-15-2031, fair value including accrued interest is $1,020,000,018. |
| | (13) | U.S. government securities, 1.38% to 3.13%, 2-28-2018 to 5-15-2021, fair value including accrued interest is $306,000,079. |
| | (14) | U.S. government securities, 3.00% to 4.50%, 1-1-2031 to 7-20-2046, fair value including accrued interest is $1,030,000,001. |
| | (15) | U.S. government securities, 0.13% to 6.88%, 3-31-2017 to 2-15-2045, fair value including accrued interest is $306,000,043. |
| | (16) | U.S. government securities, 3.00% to 6.00%, 4-15-2018 to 7-20-2046, fair value including accrued interest is $257,500,004. |
| | (17) | U.S. government securities, 0.75% to 4.75%, 11-30-2016 to 8-15-2040, fair value including accrued interest is $459,000,078. |
| | (18) | U.S. government securities, 0.00% to 4.25%, 9-1-2016 to 11-15-2025, fair value including accrued interest is $561,000,098. |
| | (19) | U.S. government securities, 1.38% to 8.00%, 12-31-2018 to 11-15-2023, fair value including accrued interest is $3,900,081,308. |
| | (20) | U.S. government securities, 2.44% to 4.5%, 9-1-2029 to 2-1-2046, fair value including accrued interest is $103,000,001. |
| | (21) | U.S. government securities, 0.63% to 6.25%, 9-30-2016 to 8-15-2045, fair value including accrued interest is $153,001,095. |
| | (22) | U.S. government securities, 3.50% to 4.50%, 5-1-2027 to 9-1-2042, fair value including accrued interest is $309,004,326. |
| | (23) | U.S. government securities, 2.17% to 4.00%, 9-1-2029 to 12-1-2045, fair value including accrued interest is $257,504,831. |
| | (24) | U.S. government securities, 0.00% to 9.38%, 8-5-2016 to 4-1-2056, fair value including accrued interest is $765,006,414. |
| | (25) | U.S. government securities, 1.38% to 2.00%, 5-31-2021 to 2-15-2025, fair value including accrued interest is $459,000,005. |
| | (26) | U.S. government securities, 0.00% to 2.38%, 8-15-2024 to 2-15-2046, fair value including accrued interest is $510,000,063. |
| | (27) | U.S. government securities, 0.00% to 5.50%, 5-15-2018 to 8-15-2045, fair value including accrued interest is $354,929,910. |
| | (28) | U.S. government securities, 0.00% to 8.88%, 9-1-2016 to 5-15-2045, fair value including accrued interest is $255,000,020. |
| | (29) | U.S. government securities, 3.50%, 8-20-2042 to 9-20-2042, fair value including accrued interest is $511,971,793. |
| | (30) | U.S. government securities, 0.00% to 7.13%, 7-31-2016 to 2-15-2046, fair value including accrued interest is $510,000,014. |
| | (31) | U.S. government securities, 0.00% to 8.50%, 8-31-2016 to 7-20-2046, fair value including accrued interest is $617,671,389. |
| | (32) | U.S. government securities, 0.00% to 3.88%, 8-18-2016 to 2-15-2041, fair value including accrued interest is $255,000,000. |
| | (33) | U.S. government securities, 1.75% to 2.25%, 5-15-2022 to 11-15-2024, fair value including accrued interest is $255,000,021. |
| | (34) | U.S. government securities, 0.87% to 4.00%, 5-31-2021 to 6-20-2046, fair value including accrued interest is $257,118,032. |
| | (35) | U.S. government securities, 1.00% to 5.55%, 2-15-2018 to 8-15-2028, fair value including accrued interest is $255,000,015. |
| | (36) | U.S. government securities, 0.00% to 7.88%, 8-8-2016 to 7-15-2025, fair value including accrued interest is $255,000,082. |
| | (37) | U.S. government securities, 0.00% to 6.00%, 8-18-2016 to 5-15-2041, fair value including accrued interest is $306,000,000. |
| | (38) | U.S. government securities, 0.00% to 2.13%, 10-13-2016 to 2-15-2041, fair value including accrued interest is $102,000,000. |
| | (39) | U.S. government securities, 2.25% to 3.75%, 11-15-2024 to 11-15-2024, fair value including accrued interest is $153,000,027. |
| | (40) | U.S. government securities, 0.25% to 4.00%, 3-1-2024 to 4-1-2046, fair value including accrued interest is $360,461,247. |
| | (41) | U.S. government securities, 2.50% to 4.00%, 9-1-2027 to 10-1-2041, fair value including accrued interest is $566,500,001. |
| * | Cost for federal income tax purposes is substantially the same as for financial reporting purposes. |
The accompanying notes are an integral part of these financial statements.
| | | | | | |
| Statement of assets and liabilities—July 31, 2016 (unaudited) | | Wells Fargo Government Money Market Fund | | | 17 | |
| | | | |
| | | | |
| |
Assets | | | | |
Investments | | | | |
In unaffiliated securities, at amortized cost | | $ | 20,611,823,089 | |
In repurchase agreements, at amortized cost | | | 21,297,720,500 | |
| | | | |
Total investments, at amortized cost | | | 41,909,543,589 | |
Cash | | | 26,418 | |
Receivable for investments sold | | | 45,754,200 | |
Receivable for interest | | | 20,326,198 | |
Prepaid expenses and other assets | | | 351,116 | |
| | | | |
Total assets | | | 41,976,001,521 | |
| | | | |
| |
Liabilities | | | | |
Dividends payable | | | 3,437,939 | |
Payable for investments purchased | | | 100,000,000 | |
Payable for Fund shares redeemed | | | 4,724,528 | |
Management fee payable | | | 2,007,241 | |
Distribution fee payable | | | 730 | |
Administration fees payable | | | 2,183,271 | |
Accrued expenses and other liabilities | | | 1,909,571 | |
| | | | |
Total liabilities | | | 114,263,280 | |
| | | | |
Total net assets | | $ | 41,861,738,241 | |
| | | | |
| |
NET ASSETS CONSIST OF | | | | |
Paid-in capital | | $ | 41,861,812,514 | |
Overdistributed net investment income | | | (32,091 | ) |
Accumulated net realized losses on investments | | | (42,182 | ) |
| | | | |
Total net assets | | $ | 41,861,738,241 | |
| | | | |
| |
COMPUTATION OF NET ASSET VALUE PER SHARE | | | | |
Net assets – Class A | | $ | 261,921,391 | |
Shares outstanding – Class A1 | | | 261,922,432 | |
Net asset value per share – Class A | | | $1.00 | |
Net assets – Administrator Class | | $ | 358,227,080 | |
Shares outstanding – Administrator Class1 | | | 358,229,076 | |
Net asset value per share – Administrator Class | | | $1.00 | |
Net assets – Institutional Class | | $ | 16,807,232,842 | |
Shares outstanding – Institutional Class1 | | | 16,807,291,347 | |
Net asset value per share – Institutional Class | | | $1.00 | |
Net assets – Select Class | | $ | 21,120,475,291 | |
Shares outstanding – Select Class1 | | | 21,120,540,210 | |
Net asset value per share – Select Class | | | $1.00 | |
Net assets – Service Class | | $ | 3,311,584,175 | |
Shares outstanding – Service Class1 | | | 3,311,593,881 | |
Net asset value per share – Service Class | | | $1.00 | |
Net assets – Sweep Class | | $ | 2,297,462 | |
Shares outstanding – Sweep Class1 | | | 2,297,472 | |
Net asset value per share – Sweep Class | | | $1.00 | |
| 1 | The Fund has an unlimited number of authorized shares. |
The accompanying notes are an integral part of these financial statements.
| | | | |
| 18 | | Wells Fargo Government Money Market Fund | | Statement of operations—six months ended July 31, 2016 (unaudited) |
| | | | |
| | | | |
| |
Investment income | | | | |
Interest | | $ | 55,742,988 | |
| | | | |
| |
Expenses | | | | |
Management fee | | | 19,576,286 | |
Administration fees | | | | |
Class A | | | 285,717 | |
Administrator Class | | | 180,655 | |
Institutional Class | | | 5,695,727 | |
Select Class | | | 2,204,042 | |
Service Class | | | 1,851,911 | |
Sweep Class | | | 2,996 | |
Shareholder servicing fees | | | | |
Class A | | | 324,679 | |
Administrator Class | | | 180,655 | |
Service Class | | | 3,857,038 | |
Sweep Class | | | 3,404 | |
Distribution fee | | | | |
Sweep Class | | | 4,766 | |
Custody and accounting fees | | | 658,293 | |
Professional fees | | | 30,181 | |
Registration fees | | | 59,102 | |
Shareholder report expenses | | | 1,098 | |
Trustees’ fees and expenses | | | 10,739 | |
Other fees and expenses | | | 320,183 | |
| | | | |
Total expenses | | | 35,247,472 | |
Less: Fee waivers and/or expense reimbursements | | | (7,757,233 | ) |
| | | | |
Net expenses | | | 27,490,239 | |
| | | | |
Net investment income | | | 28,252,749 | |
| | | | |
Net increase in net assets resulting from operations | | $ | 28,252,749 | |
| | | | |
The accompanying notes are an integral part of these financial statements.
| | | | | | |
| Statement of changes in net assets | | Wells Fargo Government Money Market Fund | | | 19 | |
| | | | | | | | | | | | | | | | |
| | | Six months ended July 31, 2016 (unaudited) | | | Year ended January 31, 2016 | |
| | | |
Operations | | | | | | | | | | | | |
Net investment income | | | | | | $ | 28,252,749 | | | | | | | $ | 8,705,632 | |
Net realized gains on investments | | | | | | | 0 | | | | | | | | 1,271 | |
| | | | |
Net increase in net assets resulting from operations | | | | | | | 28,252,749 | | | | | | | | 8,706,903 | |
| | | | |
| | | |
Distributions to shareholders from | | | | | | | | | | | | |
Net investment income | | | | | | | | | | | | | | | | |
Class A | | | | | | | (13,023 | ) | | | | | | | (27,431 | ) |
Administrator Class | | | | | | | (83,434 | ) | | | | | | | (53,198 | ) |
Institutional Class | | | | | | | (13,489,210 | ) | | | | | | | (3,198,417 | ) |
Select Class | | | | | | | (14,512,196 | ) | | | | | | | (5,085,173 | )1 |
Service Class | | | | | | | (154,749 | ) | | | | | | | (341,037 | ) |
Sweep Class | | | | | | | (137 | ) | | | | | | | (376 | ) |
| | | | |
Total distributions to shareholders | | | | | | | (28,252,749 | ) | | | | | | | (8,705,632 | ) |
| | | | |
| | | | |
Capital share transactions | | | Shares | | | | | | | | Shares | | | | | |
Proceeds from shares sold | | | | | | | | | | | | | | | | |
Class A | | | 188,255,853 | | | | 188,255,853 | | | | 248,950,357 | | | | 248,950,357 | |
Administrator Class | | | 1,132,252,967 | | | | 1,132,252,967 | | | | 4,397,439,331 | | | | 4,397,439,331 | |
Institutional Class | | | 50,684,304,069 | | | | 50,684,304,069 | | | | 151,089,559,572 | | | | 151,089,559,572 | |
Select Class | | | 57,248,114,682 | | | | 57,248,114,682 | | | | 59,808,370,340 | 1 | | | 59,808,370,340 | 1 |
Service Class | | | 13,711,892,740 | | | | 13,711,892,740 | | | | 31,369,915,464 | | | | 31,369,915,464 | |
Sweep Class | | | 11,646,734 | | | | 11,646,734 | | | | 34,030,574 | | | | 34,030,574 | |
| | | | |
| | | | | | | 122,976,467,045 | | | | | | | | 246,948,265,638 | |
| | | | |
Reinvestment of distributions | | | | | | | | | | | | | | | | |
Class A | | | 12,929 | | | | 12,929 | | | | 27,387 | | | | 27,387 | |
Administrator Class | | | 37,763 | | | | 37,763 | | | | 25,615 | | | | 25,615 | |
Institutional Class | | | 4,791,927 | | | | 4,791,927 | | | | 1,169,804 | | | | 1,169,804 | |
Select Class | | | 10,582,030 | | | | 10,582,030 | | | | 4,499,399 | 1 | | | 4,499,399 | 1 |
Service Class | | | 21,174 | | | | 21,174 | | | | 36,353 | | | | 36,353 | |
Sweep Class | | | 137 | | | | 137 | | | | 376 | | | | 376 | |
| | | | |
| | | | | | | 15,445,960 | | | | | | | | 5,758,934 | |
| | | | |
Payment for shares redeemed | | | | | | | | | | | | | | | | |
Class A | | | (191,467,358 | ) | | | (191,467,358 | ) | | | (292,616,308 | ) | | | (292,616,308 | ) |
Administrator Class | | | (1,156,107,421 | ) | | | (1,156,107,421 | ) | | | (4,660,088,416 | ) | | | (4,660,088,416 | ) |
Institutional Class | | | (48,094,897,157 | ) | | | (48,094,897,157 | ) | | | (154,387,439,459 | ) | | | (154,387,439,459 | ) |
Select Class | | | (44,123,351,803 | ) | | | (44,123,351,803 | ) | | | (51,827,674,438 | )1 | | | (51,827,674,438 | )1 |
Service Class | | | (13,364,160,073 | ) | | | (13,364,160,073 | ) | | | (32,535,951,352 | ) | | | (32,535,951,352 | ) |
Sweep Class | | | (12,326,018 | ) | | | (12,326,018 | ) | | | (37,668,958 | ) | | | (37,668,958 | ) |
| | | | |
| | | | | | | (106,942,309,830 | ) | | | | | | | (243,741,438,931 | ) |
| | | | |
Net increase in net assets resulting from capital share transactions | | | | | | | 16,049,603,175 | | | | | | | | 3,212,585,641 | |
| | | | |
Total increase in net assets | | | | | | | 16,049,603,175 | | | | | | | | 3,212,586,912 | |
| | | | |
| | |
Net assets | | | | | | | | |
Beginning of period | | | | | | | 25,812,135,066 | | | | | | | | 22,599,548,154 | |
| | | | |
End of period | | | | | | $ | 41,861,738,241 | | | | | | | $ | 25,812,135,066 | |
| | | | |
Overdistributed net investment income | | | | | | $ | (32,091 | ) | | | | | | $ | (32,091 | ) |
| | | | |
| 1 | For the period from June 30, 2015 (commencement of class operations) to January 31, 2016 |
The accompanying notes are an integral part of these financial statements.
| | | | |
| 20 | | Wells Fargo Government Money Market Fund | | Financial highlights |
(For a share outstanding throughout each period)
| | | | | | | | | | | | | | | | | | | | | | | | |
| | | Six months ended July 31, 2016 (unaudited) | | | Year ended January 31 | |
| CLASS A | | | 2016 | | | 2015 | | | 2014 | | | 2013 | | | 2012 | |
Net asset value, beginning of period | | | $1.00 | | | | $1.00 | | | | $1.00 | | | | $1.00 | | | | $1.00 | | | | $1.00 | |
Net investment income | | | 0.00 | 1 | | | 0.00 | 1 | | | 0.00 | 1 | | | 0.00 | 1 | | | 0.00 | 1 | | | 0.00 | 1 |
Net realized gains (losses) on investments | | | 0.00 | | | | 0.00 | 1 | | | (0.00 | )1 | | | 0.00 | 1 | | | 0.00 | | | | 0.00 | 1 |
| | | | | | | | | | | | | | | | | | | | | | | | |
Total from investment operations | | | 0.00 | 1 | | | 0.00 | 1 | | | 0.00 | 1 | | | 0.00 | 1 | | | 0.00 | 1 | | | 0.00 | 1 |
Distributions to shareholders from | | | | | | | | | | | | | | | | | | | | | | | | |
Net investment income | | | (0.00 | )1 | | | (0.00 | )1 | | | (0.00 | )1 | | | (0.00 | )1 | | | (0.00 | )1 | | | (0.00 | )1 |
Net realized gains | | | 0.00 | | | | 0.00 | | | | (0.00 | )1 | | | (0.00 | )1 | | | 0.00 | | | | (0.00 | )1 |
| | | | | | | | | | | | | | | | | | | | | | | | |
Total distributions to shareholders | | | (0.00 | )1 | | | (0.00 | )1 | | | (0.00 | )1 | | | (0.00 | )1 | | | (0.00 | )1 | | | (0.00 | )1 |
Net asset value, end of period | | | $1.00 | | | | $1.00 | | | | $1.00 | | | | $1.00 | | | | $1.00 | | | | $1.00 | |
Total return2 | | | 0.00 | % | | | 0.01 | % | | | 0.01 | % | | | 0.01 | % | | | 0.01 | % | | | 0.01 | % |
Ratios to average net assets (annualized) | | | | | | | | | | | | | | | | | | | | | | | | |
Gross expenses | | | 0.61 | % | | | 0.61 | % | | | 0.61 | % | | | 0.61 | % | | | 0.61 | % | | | 0.60 | % |
Net expenses | | | 0.37 | % | | | 0.13 | % | | | 0.09 | % | | | 0.10 | % | | | 0.17 | % | | | 0.12 | % |
Net investment income | | | 0.01 | % | | | 0.01 | % | | | 0.01 | % | | | 0.01 | % | | | 0.01 | % | | | 0.01 | % |
Supplemental data | | | | | | | | | | | | | | | | | | | | | | | | |
Net assets, end of period (000s omitted) | | | $261,921 | | | | $265,119 | | | | $308,757 | | | | $406,489 | | | | $564,676 | | | | $937,172 | |
| 1 | Amount is less than $0.005. |
| 2 | Returns for periods of less than one year are not annualized. |
The accompanying notes are an integral part of these financial statements.
| | | | | | |
| Financial highlights | | Wells Fargo Government Money Market Fund | | | 21 | |
(For a share outstanding throughout each period)
| | | | | | | | | | | | | | | | | | | | | | | | |
| | | Six months ended July 31, 2016 (unaudited) | | | Year ended January 31 | |
| ADMINISTRATOR CLASS | | | 2016 | | | 2015 | | | 2014 | | | 2013 | | | 2012 | |
Net asset value, beginning of period | | | $1.00 | | | | $1.00 | | | | $1.00 | | | | $1.00 | | | | $1.00 | | | | $1.00 | |
Net investment income | | | 0.00 | 1 | | | 0.00 | 1 | | | 0.00 | 1 | | | 0.00 | 1 | | | 0.00 | 1 | | | 0.00 | 1 |
Net realized gains on investments | | | 0.00 | | | | 0.00 | 1 | | | (0.00 | )1 | | | 0.00 | 1 | | | 0.00 | | | | 0.00 | 1 |
| | | | | | | | | | | | | | | | | | | | | | | | |
Total from investment operations | | | 0.00 | 1 | | | 0.00 | 1 | | | 0.00 | 1 | | | 0.00 | 1 | | | 0.00 | 1 | | | 0.00 | 1 |
Distributions to shareholders from | | | | | | | | | | | | | | | | | | | | | | | | |
Net investment income | | | (0.00 | )1 | | | (0.00 | )1 | | | (0.00 | )1 | | | (0.00 | )1 | | | (0.00 | )1 | | | (0.00 | )1 |
Net realized gains | | | 0.00 | | | | 0.00 | | | | (0.00 | )1 | | | (0.00 | )1 | | | 0.00 | | | | (0.00 | )1 |
| | | | | | | | | | | | | | | | | | | | | | | | |
Total distributions to shareholders | | | (0.00 | )1 | | | (0.00 | )1 | | | (0.00 | )1 | | | (0.00 | )1 | | | (0.00 | )1 | | | (0.00 | )1 |
Net asset value, end of period | | | $1.00 | | | | $1.00 | | | | $1.00 | | | | $1.00 | | | | $1.00 | | | | $1.00 | |
Total return2 | | | 0.02 | % | | | 0.01 | % | | | 0.01 | % | | | 0.01 | % | | | 0.01 | % | | | 0.01 | % |
Ratios to average net assets (annualized) | | | | | | | | | | | | | | | | | | | | | | | | |
Gross expenses | | | 0.34 | % | | | 0.34 | % | | | 0.34 | % | | | 0.34 | % | | | 0.34 | % | | | 0.34 | % |
Net expenses | | | 0.33 | % | | | 0.12 | % | | | 0.09 | % | | | 0.09 | % | | | 0.17 | % | | | 0.12 | % |
Net investment income | | | 0.05 | % | | | 0.01 | % | | | 0.01 | % | | | 0.01 | % | | | 0.01 | % | | | 0.01 | % |
Supplemental data | | | | | | | | | | | | | | | | | | | | | | | | |
Net assets, end of period (000s omitted) | | | $358,227 | | | | $382,043 | | | | $644,666 | | | | $596,022 | | | | $408,411 | | | | $608,948 | |
| 1 | Amount is less than $0.005. |
| 2 | Returns for periods of less than one year are not annualized. |
The accompanying notes are an integral part of these financial statements.
| | | | |
| 22 | | Wells Fargo Government Money Market Fund | | Financial highlights |
(For a share outstanding throughout each period)
| | | | | | | | | | | | | | | | | | | | | | | | |
| | | Six months ended July 31, 2016 (unaudited) | | | Year ended January 31 | |
| INSTITUTIONAL CLASS | | | 2016 | | | 2015 | | | 2014 | | | 2013 | | | 2012 | |
Net asset value, beginning of period | | | $1.00 | | | | $1.00 | | | | $1.00 | | | | $1.00 | | | | $1.00 | | | | $1.00 | |
Net investment income | | | 0.00 | 1 | | | 0.00 | 1 | | | 0.00 | 1 | | | 0.00 | 1 | | | 0.00 | 1 | | | 0.00 | 1 |
Net realized gains on investments | | | 0.00 | | | | 0.00 | 1 | | | (0.00 | )1 | | | 0.00 | 1 | | | 0.00 | | | | 0.00 | 1 |
| | | | | | | | | | | | | | | | | | | | | | | | |
Total from investment operations | | | 0.00 | 1 | | | 0.00 | 1 | | | 0.00 | 1 | | | 0.00 | 1 | | | 0.00 | 1 | | | 0.00 | 1 |
Distributions to shareholders from | | | | | | | | | | | | | | | | | | | | | | | | |
Net investment income | | | (0.00 | )1 | | | (0.00 | )1 | | | (0.00 | )1 | | | (0.00 | )1 | | | (0.00 | )1 | | | (0.00 | )1 |
Net realized gains | | | 0.00 | | | | 0.00 | | | | (0.00 | )1 | | | (0.00 | )1 | | | 0.00 | | | | (0.00 | )1 |
| | | | | | | | | | | | | | | | | | | | | | | | |
Total distributions to shareholders | | | (0.00 | )1 | | | (0.00 | )1 | | | (0.00 | )1 | | | (0.00 | )1 | | | (0.00 | )1 | | | (0.00 | )1 |
Net asset value, end of period | | | $1.00 | | | | $1.00 | | | | $1.00 | | | | $1.00 | | | | $1.00 | | | | $1.00 | |
Total return2 | | | 0.09 | % | | | 0.02 | % | | | 0.01 | % | | | 0.01 | % | | | 0.01 | % | | | 0.01 | % |
Ratios to average net assets (annualized) | | | | | | | | | | | | | | | | | | | | | | | | |
Gross expenses | | | 0.22 | % | | | 0.22 | % | | | 0.22 | % | | | 0.22 | % | | | 0.22 | % | | | 0.22 | % |
Net expenses | | | 0.19 | % | | | 0.12 | % | | | 0.09 | % | | | 0.10 | % | | | 0.17 | % | | | 0.12 | % |
Net investment income | | | 0.19 | % | | | 0.02 | % | | | 0.01 | % | | | 0.01 | % | | | 0.01 | % | | | 0.01 | % |
Supplemental data | | | | | | | | | | | | | | | | | | | | | | | | |
Net assets, end of period (000s omitted) | | | $16,807,233 | | | | $14,212,988 | | | | $17,509,698 | | | | $20,793,077 | | | | $22,762,489 | | | | $26,412,568 | |
| 1 | Amount is less than $0.005. |
| 2 | Returns for periods of less than one year are not annualized. |
The accompanying notes are an integral part of these financial statements.
| | | | | | |
| Financial highlights | | Wells Fargo Government Money Market Fund | | | 23 | |
(For a share outstanding throughout each period)
| | | | | | | | |
| SELECT CLASS | | Six months ended July 31, 2016
(unaudited) | | | Year ended January 31, 20161 | |
Net asset value, beginning of period | | | $1.00 | | | | $1.00 | |
Net investment income | | | 0.00 | 2 | | | 0.00 | 2 |
Net realized gains on investments | | | 0.00 | | | | 0.00 | 2 |
| | | | | | | | |
Total from investment operations | | | 0.00 | 2 | | | 0.00 | 2 |
Distributions to shareholders from net investment income | | | (0.00 | )2 | | | (0.00 | )2 |
Net asset value, end of period | | | $1.00 | | | | $1.00 | |
Total return3 | | | 0.12 | % | | | 0.04 | % |
Ratios to average net assets (annualized) | | | | | | | | |
Gross expenses | | | 0.18 | % | | | 0.18 | % |
Net expenses | | | 0.13 | % | | | 0.10 | % |
Net investment income | | | 0.26 | % | | | 0.08 | % |
Supplemental data | | | | | | | | |
Net assets, end of period (000s omitted) | | | $21,120,475 | | | | $7,985,195 | |
| 1 | For the period from June 30, 2015 (commencement of class operations) to January 31, 2016 |
| 2 | Amount is less than $0.005. |
| 3 | Returns for periods of less than one year are not annualized. |
The accompanying notes are an integral part of these financial statements.
| | | | |
| 24 | | Wells Fargo Government Money Market Fund | | Financial highlights |
(For a share outstanding throughout each period)
| | | | | | | | | | | | | | | | | | | | | | | | |
| | | Six months ended
July 31, 2016 (unaudited) | | | Year ended January 31 | |
| SERVICE CLASS | | | 2016 | | | 2015 | | | 2014 | | | 2013 | | | 2012 | |
Net asset value, beginning of period | | | $1.00 | | | | $1.00 | | | | $1.00 | | | | $1.00 | | | | $1.00 | | | | $1.00 | |
Net investment income | | | 0.00 | 1 | | | 0.00 | 1 | | | 0.00 | 1 | | | 0.00 | 1 | | | 0.00 | 1 | | | 0.00 | 1 |
Net realized gains on investments | | | 0.00 | | | | 0.00 | 1 | | | (0.00 | )1 | | | 0.00 | 1 | | | 0.00 | | | | 0.00 | 1 |
| | | | | | | | | | | | | | | | | | | | | | | | |
Total from investment operations | | | 0.00 | 1 | | | 0.00 | 1 | | | 0.00 | 1 | | | 0.00 | 1 | | | 0.00 | 1 | | | 0.00 | 1 |
Distributions to shareholders from | | | | | | | | | | | | | | | | | | | | | | | | |
Net investment income | | | (0.00 | )1 | | | (0.00 | )1 | | | (0.00 | )1 | | | (0.00 | )1 | | | (0.00 | )1 | | | (0.00 | )1 |
Net realized gains | | | 0.00 | | | | 0.00 | | | | (0.00 | )1 | | | (0.00 | )1 | | | 0.00 | | | | (0.00 | )1 |
| | | | | | | | | | | | | | | | | | | | | | | | |
Total distributions to shareholders | | | (0.00 | )1 | | | (0.00 | )1 | | | (0.00 | )1 | | | (0.00 | )1 | | | (0.00 | )1 | | | (0.00 | )1 |
Net asset value, end of period | | | $1.00 | | | | $1.00 | | | | $1.00 | | | | $1.00 | | | | $1.00 | | | | $1.00 | |
Total return2 | | | 0.00 | % | | | 0.01 | % | | | 0.01 | % | | | 0.01 | % | | | 0.01 | % | | | 0.01 | % |
Ratios to average net assets (annualized) | | | | | | | | | | | | | | | | | | | | | | | | |
Gross expenses | | | 0.51 | % | | | 0.51 | % | | | 0.51 | % | | | 0.51 | % | | | 0.51 | % | | | 0.51 | % |
Net expenses | | | 0.37 | % | | | 0.13 | % | | | 0.09 | % | | | 0.10 | % | | | 0.17 | % | | | 0.12 | % |
Net investment income | | | 0.01 | % | | | 0.01 | % | | | 0.01 | % | | | 0.01 | % | | | 0.01 | % | | | 0.01 | % |
Supplemental data | | | | | | | | | | | | | | | | | | | | | | | | |
Net assets, end of period (000s omitted) | | | $3,311,584 | | | | $2,963,813 | | | | $4,129,813 | | | | $4,140,419 | | | | $6,440,560 | | | | $5,256,816 | |
| 1 | Amount is less than $0.005. |
| 2 | Returns for periods of less than one year are not annualized. |
The accompanying notes are an integral part of these financial statements.
| | | | | | |
| Financial highlights | | Wells Fargo Government Money Market Fund | | | 25 | |
(For a share outstanding throughout each period)
| | | | | | | | | | | | | | | | | | | | | | | | |
| | | Six months ended
July 31, 2016 (unaudited) | | | Year ended January 31 | |
| SWEEP CLASS | | | 2016 | | | 2015 | | | 2014 | | | 2013 | | | 2012 | |
Net asset value, beginning of period | | | $1.00 | | | | $1.00 | | | | $1.00 | | | | $1.00 | | | | $1.00 | | | | $1.00 | |
Net investment income | | | 0.00 | 1 | | | 0.00 | 1 | | | 0.00 | 1 | | | 0.00 | 1 | | | 0.00 | 1 | | | 0.00 | 1 |
Net realized gains on investments | | | 0.00 | | | | 0.00 | 1 | | | (0.00 | )1 | | | 0.00 | 1 | | | 0.00 | | | | 0.00 | 1 |
| | | | | | | | | | | | | | | | | | | | | | | | |
Total from investment operations | | | 0.00 | 1 | | | 0.00 | 1 | | | 0.00 | 1 | | | 0.00 | 1 | | | 0.00 | 1 | | | 0.00 | 1 |
Distributions to shareholders from | | | | | | | | | | | | | | | | | | | | | | | | |
Net investment income | | | (0.00 | )1 | | | (0.00 | )1 | | | (0.00 | )1 | | | (0.00 | )1 | | | (0.00 | )1 | | | (0.00 | )1 |
Net realized gains | | | 0.00 | | | | 0.00 | | | | (0.00 | )1 | | | (0.00 | )1 | | | 0.00 | | | | (0.00 | )1 |
| | | | | | | | | | | | | | | | | | | | | | | | |
Total distributions to shareholders | | | (0.00 | )1 | | | (0.00 | )1 | | | (0.00 | )1 | | | (0.00 | )1 | | | (0.00 | )1 | | | (0.00 | )1 |
Net asset value, end of period | | | $1.00 | | | | $1.00 | | | | $1.00 | | | | $1.00 | | | | $1.00 | | | | $1.00 | |
Total return2 | | | 0.00 | % | | | 0.01 | % | | | 0.01 | % | | | 0.01 | % | | | 0.01 | % | | | 0.01 | % |
Ratios to average net assets (annualized) | | | | | | | | | | | | | | | | | | | | | | | | |
Gross expenses | | | 0.96 | % | | | 0.96 | % | | | 0.96 | % | | | 0.96 | % | | | 0.96 | % | | | 0.96 | % |
Net expenses | | | 0.37 | % | | | 0.13 | % | | | 0.09 | % | | | 0.10 | % | | | 0.17 | % | | | 0.12 | % |
Net investment income | | | 0.01 | % | | | 0.01 | % | | | 0.01 | % | | | 0.01 | % | | | 0.01 | % | | | 0.01 | % |
Supplemental data | | | | | | | | | | | | | | | | | | | | | | | | |
Net assets, end of period (000s omitted) | | | $2,297 | | | | $2,977 | | | | $6,615 | | | | $18,244 | | | | $22,998 | | | | $101,911 | |
| 1 | Amount is less than $0.005. |
| 2 | Returns for periods of less than one year are not annualized. |
The accompanying notes are an integral part of these financial statements.
| | | | |
| 26 | | Wells Fargo Government Money Market Fund | | Notes to financial statements (unaudited) |
1. ORGANIZATION
Wells Fargo Funds Trust (the “Trust”), a Delaware statutory trust organized on March 10, 1999, is an open-end management investment company registered under the Investment Company Act of 1940, as amended (the “1940 Act”). As an investment company, the Trust follows the accounting and reporting guidance in Financial Accounting Standards Board (“FASB”) Accounting Standards Codification Topic 946, Financial Services – Investment Companies. These financial statements report on the Wells Fargo Government Money Market Fund (the “Fund”) which is a diversified series of the Trust.
2. SIGNIFICANT ACCOUNTING POLICIES
The following significant accounting policies, which are consistently followed in the preparation of the financial statements of the Fund, are in conformity with U.S. generally accepted accounting principles which require management to make estimates and assumptions that affect the reported amounts of assets and liabilities, disclosure of contingent assets and liabilities at the date of the financial statements, and the reported amounts of revenues and expenses during the reporting period. Actual results could differ from those estimates.
Securities valuation
As permitted under Rule 2a-7 of the 1940 Act, portfolio securities are valued at amortized cost, which approximates fair value. The amortized cost method involves valuing a security at its cost, plus accretion of discount or minus amortization of premium over the period until maturity.
Investments which are not valued using the method discussed above are valued at their fair value, as determined in good faith by the Board of Trustees of the Fund. The Board of Trustees has established a Valuation Committee comprised of the Trustees and has delegated to it the authority to take any actions regarding the valuation of portfolio securities that the Valuation Committee deems necessary or appropriate, including determining the fair value of portfolio securities, unless the determination has been delegated to the Management Valuation Team of Wells Fargo Funds Management, LLC (“Funds Management”). The Board of Trustees retains the authority to make or ratify any valuation decisions or approve any changes to the Valuation Procedures as it deems appropriate. On a quarterly basis, the Board of Trustees receives reports on any valuation actions taken by the Valuation Committee or the Management Valuation Team which may include items for ratification.
Valuations of fair valued securities are compared to the next actual sales price when available, or other appropriate market values, to assess the continued appropriateness of the fair valuation methodologies used. These securities are fair valued on a day-to-day basis, taking into consideration changes to appropriate market information and any significant changes to the inputs considered in the valuation process until there is a readily available price provided on an exchange or by an independent pricing service. Valuations received from an independent pricing service or independent broker-dealer quotes are periodically validated by comparisons to most recent trades and valuations provided by other independent pricing services in addition to the review of prices by the manager and/or subadviser. Unobservable inputs used in determining fair valuations are identified based on the type of security, taking into consideration factors utilized by market participants in valuing the investment, knowledge about the issuer and the current market environment.
Repurchase agreements
The Fund may invest in repurchase agreements and may participate in pooled repurchase agreement transactions with other funds advised by Funds Management. The repurchase agreements must be fully collateralized based on values that are marked-to-market daily. The collateral may be held by an agent bank under a tri-party agreement. It is the custodian’s responsibility to value collateral daily and to take action to obtain additional collateral as necessary to maintain market value equal to or greater than the resale price. The repurchase agreements are collateralized by instruments such as U.S. Treasury, federal agency, or high-grade corporate obligations. There could be potential loss to the Fund in the event that the Fund is delayed or prevented from exercising its rights to dispose of the collateral, including the risk of a possible decline in the value of the underlying obligations during the period in which the Fund seeks to assert its rights.
Security transactions and income recognition
Securities transactions are recorded on a trade date basis. Realized gains or losses are recorded on the basis of identified cost.
Interest income is accrued daily and bond discounts are accreted and premiums are amortized daily based on the effective interest method. To the extent debt obligations are placed on non-accrual status, any related interest income may be reduced by writing off interest receivables when the collection of all or a portion of interest has become doubtful based
| | | | | | |
| Notes to financial statements (unaudited) | | Wells Fargo Government Money Market Fund | | | 27 | |
on consistently applied procedures. If the issuer subsequently resumes interest payments or when the collectability of interest is reasonably assured, the debt obligation is removed from non-accrual status.
Distributions to shareholders
Distributions to shareholders from net investment income are accrued daily and paid monthly. Distributions from net realized gains, if any, are recorded on the ex-dividend date. Such distributions are determined in conformity with federal income tax regulations, which may differ in amount or character from net investment income and realized gains recognized for purposes of U.S. generally accepted accounting principles.
Federal and other taxes
The Fund intends to continue to qualify as a regulated investment company by distributing substantially all of its investment company taxable income and any net realized capital gains (after reduction for capital loss carryforwards) sufficient to relieve it from all, or substantially all, federal income taxes. Accordingly, no provision for federal income taxes was required.
The Fund’s income and federal excise tax returns and all financial records supporting those returns for the prior three fiscal years are subject to examination by the federal and Delaware revenue authorities. Management has analyzed the Fund’s tax positions taken on federal, state, and foreign tax returns for all open tax years and does not believe that there are any uncertain tax positions that require recognition of a tax liability.
As of January 31, 2016, the Fund had capital loss carryforwards which consist of $42,182 in short-term capital losses.
Class allocations
The separate classes of shares offered by the Fund differ principally in distribution, shareholder servicing, and administration fees. Class specific expenses are charged directly to that share class. Investment income, common expenses, and realized and unrealized gains (losses) on investments are allocated daily to each class of shares based on the relative proportion of net assets of each class.
3. FAIR VALUATION MEASUREMENTS
Fair value measurements of investments are determined within a framework that has established a fair value hierarchy based upon the various data inputs utilized in determining the value of the Fund’s investments. The three-level hierarchy gives the highest priority to unadjusted quoted prices in active markets for identical assets or liabilities (Level 1) and the lowest priority to significant unobservable inputs (Level 3). The Fund’s investments are classified within the fair value hierarchy based on the lowest level of input that is significant to the fair value measurement. The inputs are summarized into three broad levels as follows:
| n | | Level 1 – quoted prices in active markets for identical securities |
| n | | Level 2 – other significant observable inputs (including quoted prices for similar securities, interest rates, prepayment speeds, credit risk, use of amortized cost, etc.) |
| n | | Level 3 – significant unobservable inputs (including the Fund’s own assumptions in determining the fair value of investments) |
The inputs or methodologies used for valuing investments in securities are not necessarily an indication of the risk associated with investing in those securities.
At July 31, 2016, all of the Fund’s investments in securities were valued using Level 2 inputs since the primary inputs include the credit quality of the issuer and short-term interest rates (both of which are observable) in addition to the use of amortized cost.
The Fund recognizes transfers between levels within the fair value hierarchy at the end of the reporting period. At July 31, 2016, the Fund did not have any transfers into/out of Level 1, Level 2, or Level 3.
4. TRANSACTIONS WITH AFFILIATES
Management fee
Funds Management, an indirect wholly owned subsidiary of Wells Fargo & Company (“Wells Fargo”), is the manager of the Fund and provides advisory and fund-level administrative services under an investment management agreement. Under the investment management agreement, Funds Management is responsible for, among other services, implementing the
| | | | |
| 28 | | Wells Fargo Government Money Market Fund | | Notes to financial statements (unaudited) |
investment objectives and strategies of the Fund, supervising the subadviser, providing fund-level administrative services in connection with the Fund’s operations, and providing any other fund-level administrative services reasonably necessary for the operation of the Fund. As compensation for its services under the investment management agreement, Funds Management is entitled to receive an annual management fee starting at 0.15% and declining to 0.13% as the average daily net assets of the Fund increase. For the six months ended July 31, 2016, the management fee was equivalent to an annual rate of 0.14% of the Fund’s average daily net assets.
Funds Management has retained the services of a subadviser to provide daily portfolio management to the Fund. The fee for subadvisory services is borne by Funds Management. Wells Capital Management Incorporated, an affiliate of Funds Management and an indirect wholly owned subsidiary of Wells Fargo, is the subadviser to the Fund and is entitled to receive a fee from Funds Management at an annual rate starting at 0.05% and declining to 0.01% as the average daily net assets of the Fund increase.
Administration fees
Under a class-level administration agreement, Funds Management provides class-level administrative services to the Fund, which includes paying fees and expenses for services provided by the transfer agent, sub-transfer agents, omnibus account servicers and record-keepers. As compensation for its services under the class-level administration agreement, Funds Management receives an annual fee which is calculated based on the average daily net assets of each class as follows:
| | | | |
| | | Class level administration fee | |
Class A, Sweep Class | | | 0.22 | % |
Administrator Class | | | 0.10 | |
Institutional Class | | | 0.08 | |
Select Class | | | 0.04 | |
Service Class | | | 0.12 | |
Funds Management has contractually waived and/or reimbursed management and administration fees to the extent necessary to maintain certain net operating expense ratios for the Fund. Waiver of fees and/or reimbursement of expenses by Funds Management were made first from fund level expenses on a proportionate basis and then from class specific expenses. Funds Management has committed through May 31, 2017 to waive fees and/or reimburse expenses to the extent necessary to cap the Fund’s expenses at 0.65% for Class A shares, 0.35% for Administrator Class shares, 0.20% for Institutional Class shares, 0.16% for Select Class shares, 0.50% for Service Class shares, and 1.00% for Sweep Class shares. After this time, the cap may be increased or the commitment to maintain the cap may be terminated only with the approval of the Board of Trustees. During the six months ended July 31, 2016, Funds Management voluntarily waived additional expenses to maintain a positive yield.
Distribution fee
The Trust has adopted a distribution plan for Sweep Class shares of the Fund pursuant to Rule 12b-1 under the 1940 Act. A distribution fee is charged to Sweep Class shares and paid to Wells Fargo Funds Distributor, LLC, the principal underwriter, at an annual rate of 0.35% of the average daily net assets of Sweep Class shares.
Shareholder servicing fees
The Trust has entered into contracts with one or more shareholder servicing agents, whereby Class A, Service Class, and Sweep Class of the Fund are charged a fee at an annual rate of 0.25% of the respective average daily net assets of each class. Administrator Class is charged a fee at an annual rate of 0.10% of its average daily net assets.
A portion of these total shareholder servicing fees were paid to affiliates of Wells Fargo.
5. INDEMNIFICATION
Under the Trust’s organizational documents, the officers and Trustees have been granted certain indemnification rights against certain liabilities that may arise out of performance of their duties to the Trust. Additionally, in the normal course of business, the Trust may enter into contracts with service providers that contain a variety of indemnification clauses. The Trust’s maximum exposure under these arrangements is dependent on future claims that may be made against the Fund and, therefore, cannot be estimated.
| | | | | | |
| Notes to financial statements (unaudited) | | Wells Fargo Government Money Market Fund | | | 29 | |
6. MONEY MARKET FUND REFORM
On July 23, 2014, the Securities and Exchange Commission voted to amend Rule 2a-7 of the 1940 Act which governs the operations of registered money market funds. The amendments to Rule 2a-7 when implemented may, among other things, require the Fund to change the manner in which it values its securities, impose new liquidity fees on redemptions in certain circumstances, and permit the Fund to limit redemptions in certain circumstances. The amendments have staggered compliance dates. Compliance with a majority of these amendments will be required on October 14, 2016. The Fund will continue to be offered to retail and institutional investors and transact at a stable $1.00 net asset value (NAV).
| | | | |
| 30 | | Wells Fargo Government Money Market Fund | | Other information (unaudited) |
PROXY VOTING INFORMATION
A description of the policies and procedures that the Fund uses to determine how to vote proxies relating to portfolio securities is available, upon request, by calling 1-800-222-8222, visiting our website at wellsfargofunds.com, or visiting the SEC website at sec.gov. Information regarding how the Fund voted proxies relating to portfolio securities during the most recent 12-month period ended June 30 is available on the Fund’s website at wellsfargofunds.com or by visiting the SEC website at sec.gov.
PORTFOLIO HOLDINGS INFORMATION
The complete portfolio holdings for the Fund are publicly available on the Fund’s website (wellsfargofunds.com) on a 1-day delayed basis. The Fund files its complete schedule of portfolio holdings with the SEC for the first and third quarters of each fiscal year on Form N-Q, which is available by visiting the SEC website at sec.gov. In addition, the Fund’s Form N-Q may be reviewed and copied at the SEC’s Public Reference Room in Washington, DC, and at regional offices in New York City, at 233 Broadway, and in Chicago, at 175 West Jackson Boulevard, Suite 900. Information about the Public Reference Room may be obtained by calling 1-800-SEC-0330.
| | | | | | |
| Other information (unaudited) | | Wells Fargo Government Money Market Fund | | | 31 | |
BOARD OF TRUSTEES AND OFFICERS
Each of the Trustees and Officers1 listed in the table below acts in identical capacities for each fund in the Wells Fargo family of funds, which consists of 139 mutual funds comprising the Wells Fargo Funds Trust, Wells Fargo Variable Trust, Wells Fargo Master Trust and four closed-end funds (collectively the “Fund Complex”). This table should be read in conjunction with the Prospectus and the Statement of Additional Information2. The mailing address of each Trustee and Officer is 525 Market Street, 12th Floor, San Francisco, CA 94105. Each Trustee and Officer serves an indefinite term, however, each Trustee serves such term until reaching the mandatory retirement age established by the Trustees.
Independent Trustees
| | | | | | |
Name and year of birth | | Position held and length of service* | | Principal occupations during past five years or longer | | Current other public company or investment company directorships |
William R. Ebsworth
(Born 1957) | | Trustee, since 2015 | | Retired. From 1984 to 2013, equities analyst, portfolio manager, research director and chief financial officer at Fidelity Management and Research Company in Boston, Tokyo, and Hong Kong and retired in 2013 as Chief Investment Officer of Fidelity Strategic Advisers, Inc. where he lead a team of investment professionals managing client assets. Prior thereto, Board member of Hong Kong Securities Clearing Co., Hong Kong Options Clearing Corp., the Thailand International Fund, Ltd., Fidelity Investments Life Insurance Company, and Empire Fidelity Investments Life Insurance Company. Mr. Ebsworth is a CFA® charterholder and an Adjunct Lecturer, Finance, at Babson College. | | Asset Allocation Trust |
Jane A. Freeman
(Born 1953) | | Trustee, since 2015 | | Retired. From 2012 to 2014 and 1999 to 2008, Chief Financial Officer of Scientific Learning Corporation. From 2008 to 2012, Ms. Freeman provided consulting services related to strategic business projects. Prior to 1999, Portfolio Manager at Rockefeller & Co. and Scudder, Stevens & Clark. Board member of the Harding Loevner Funds from 1996 to 2014, serving as both Lead Independent Director and chair of the Audit Committee. Board member of the Russell Exchange Traded Funds Trust from 2011 to 2012 and the chair of the Audit Committee. Ms. Freeman is Chair of Taproot Foundation (non-profit organization), a Board Member of Ruth Bancroft Garden (non-profit organization) and an inactive chartered financial analyst. | | Asset Allocation Trust |
Peter G. Gordon
(Born 1942) | | Trustee, since 1998; Chairman, since 2005 | | Co-Founder, Retired Chairman, President and CEO of Crystal Geyser Water Company. Trustee Emeritus, Colby College. | | Asset Allocation Trust |
Isaiah Harris, Jr.
(Born 1952) | | Trustee, since 2009 | | Retired. Chairman of the Board of CIGNA Corporation since 2009, and Director since 2005. From 2003 to 2011, Director of Deluxe Corporation. Prior thereto, President and CEO of BellSouth Advertising and Publishing Corp. from 2005 to 2007, President and CEO of BellSouth Enterprises from 2004 to 2005 and President of BellSouth Consumer Services from 2000 to 2003. Emeritus member of the Iowa State University Foundation Board of Governors. Emeritus Member of the Advisory Board of Iowa State University School of Business. Advisory Board Member, Palm Harbor Academy (charter school). Advisory Board Member, Child Evangelism Fellowship (non-profit). Mr. Harris is a certified public accountant (inactive status). | | CIGNA Corporation; Asset Allocation Trust |
Judith M. Johnson
(Born 1949) | | Trustee, since 2008; Audit Committee Chairman, since 2008 | | Retired. Prior thereto, Chief Executive Officer and Chief Investment Officer of Minneapolis Employees Retirement Fund from 1996 to 2008. Ms. Johnson is an attorney, certified public accountant and a certified managerial accountant. | | Asset Allocation Trust |
| David F. Larcker (Born 1950) | | Trustee, since 2009 | | James Irvin Miller Professor of Accounting at the Graduate School of Business, Stanford University, Director of the Corporate Governance Research Initiative and Senior Faculty of The Rock Center for Corporate Governance since 2006. From 2005 to 2008, Professor of Accounting at the Graduate School of Business, Stanford University. Prior thereto, Ernst & Young Professor of Accounting at The Wharton School, University of Pennsylvania from 1985 to 2005. | | Asset Allocation Trust |
| | | | |
| 32 | | Wells Fargo Government Money Market Fund | | Other information (unaudited) |
| | | | | | |
Name and year of birth | | Position held and length of service* | | Principal occupations during past five years or longer | | Current other public company or investment company directorships |
Olivia S. Mitchell
(Born 1953) | | Trustee, since 2006 | | International Foundation of Employee Benefit Plans Professor, Wharton School of the University of Pennsylvania since 1993. Director of Wharton’s Pension Research Council and Boettner Center on Pensions & Retirement Research, and Research Associate at the National Bureau of Economic Research. Previously, Cornell University Professor from 1978 to 1993. | | Asset Allocation Trust |
Timothy J. Penny
(Born 1951) | | Trustee, since 1996 | | President and Chief Executive Officer of Southern Minnesota Initiative Foundation, a non-profit organization, since 2007 and Senior Fellow at the Humphrey Institute Policy Forum at the University of Minnesota since 1995. Member of the Board of Trustees of NorthStar Education Finance, Inc., a non-profit organization, since 2007. | | Asset Allocation Trust |
Michael S. Scofield
(Born 1943) | | Trustee, since 2010 | | Served on the Investment Company Institute’s Board of Governors and Executive Committee from 2008-2011 as well the Governing Council of the Independent Directors Council from 2006-2011 and the Independent Directors Council Executive Committee from 2008-2011. Chairman of the IDC from 2008-2010. Institutional Investor (Fund Directions) Trustee of Year in 2007. Trustee of the Evergreen Funds complex (and its predecessors) from 1984 to 2010. Chairman of the Evergreen Funds from 2000-2010. Former Trustee of the Mentor Funds. Retired Attorney, Law Offices of Michael S. Scofield. | | Asset Allocation Trust |
| * | Length of service dates reflect the Trustee’s commencement of service with the Trust’s predecessor entities, where applicable. |
Officers
| | | | | | |
Name and year of birth | | Position held and length of service | | Principal occupations during past five years or longer | | |
Karla M. Rabusch
(Born 1959) | | President, since 2003 | | Executive Vice President of Wells Fargo Bank, N.A. and President of Wells Fargo Funds Management, LLC since 2003. | | |
Nancy Wiser1
(Born 1967) | | Treasurer, since 2012 | | Executive Vice President of Wells Fargo Funds Management, LLC since 2011. Chief Operating Officer and Chief Compliance Officer at LightBox Capital Management LLC, from 2008 to 2011. | | |
C. David Messman
(Born 1960) | | Secretary, since 2000; Chief Legal Officer, since 2003 | | Senior Vice President and Secretary of Wells Fargo Funds Management, LLC since 2001. Assistant General Counsel of Wells Fargo Bank, N.A. since 2013 and Vice President and Managing Counsel of Wells Fargo Bank, N.A. from 1996 to 2013. | | |
Michael Whitaker
(Born 1967) | | Chief Compliance Officer, since 2016* | | Executive Vice President of Wells Fargo Funds Management, LLC since 2016. Chief Compliance Officer of Fidelity’s Fixed Income Funds and Asset Allocation Funds from 2008 to 2016, Compliance Officer of FMR Co., Inc. from 2014 to 2016, Fidelity Investments Money Management, Inc. from 2014 to 2016, Fidelity Investments from 2007 to 2016. | | |
David Berardi
(Born 1975) | | Assistant Treasurer, since 2009 | | Vice President of Wells Fargo Funds Management, LLC since 2009. Vice President of Evergreen Investment Management Company, LLC from 2008 to 2010. Manager of Fund Reporting and Control for Evergreen Investment Management Company, LLC from 2004 to 2010. | | |
Jeremy DePalma1
(Born 1974) | | Assistant Treasurer, since 2009 | | Senior Vice President of Wells Fargo Funds Management, LLC since 2009. Senior Vice President of Evergreen Investment Management Company, LLC from 2008 to 2010 and head of the Fund Reporting and Control Team within Fund Administration from 2005 to 2010. | | |
| 1 | Nancy Wiser acts as Treasurer of 71 funds in the Fund Complex. Jeremy DePalma acts as Treasurer of 68 funds and Assistant Treasurer of 71 funds in the Fund Complex. |
| 2 | The Statement of Additional Information includes additional information about the Trustees and is available, without charge, upon request, by calling
1-800-222-8222 or by visiting the website at wellsfargofunds.com. |
| * | Michael Whitaker became Chief Compliance Officer effective May 16, 2016. |
| | | | | | |
| Other information (unaudited) | | Wells Fargo Government Money Market Fund | | | 33 | |
BOARD CONSIDERATION OF INVESTMENT MANAGEMENT AND SUB-ADVISORY AGREEMENTS:
Under the Investment Company Act of 1940 (the “1940 Act”), the Board of Trustees (the “Board”) of Wells Fargo Funds Trust (the “Trust”) must determine annually whether to approve the continuation of the Trust’s investment management and sub-advisory agreements. In this regard, at an in-person meeting held on May 24-25, 2016 (the “Meeting”), the Board, all the members of which have no direct or indirect interest in the investment management and sub-advisory agreements and are not “interested persons” of the Trust, as defined in the 1940 Act (the “Independent Trustees”), reviewed and approved for Wells Fargo Government Money Market Fund (the “Fund”): (i) an investment management agreement (the “Management Agreement”) with Wells Fargo Funds Management, LLC (“Funds Management”); and (ii) an investment sub-advisory agreement (the “Sub-Advisory Agreement”) with Wells Capital Management Incorporated (the “Sub-Adviser”), an affiliate of Funds Management. The Management Agreement and the Sub-Advisory Agreement are collectively referred to as the “Advisory Agreements.”
At the Meeting, the Board considered the factors and reached the conclusions described below relating to the selection of Funds Management and the Sub-Adviser and the approval of the Advisory Agreements. Prior to the Meeting, including at an in-person meeting in April 2016, the Trustees conferred extensively among themselves and with representatives of Funds Management about these matters. Also, the Board has adopted a team-based approach, with each team consisting of a sub-set of Trustees, to assist the full Board in the discharge of its duties in reviewing performance and other matters throughout the year. The Independent Trustees were assisted in their evaluation of the Advisory Agreements by independent legal counsel, from whom they received separate legal advice and with whom they met separately.
In providing information to the Board, Funds Management and the Sub-Adviser were guided by a detailed set of requests for information submitted to them by independent legal counsel on behalf of the Independent Trustees at the start of the Board’s annual contract renewal process earlier in 2016. In considering and approving the Advisory Agreements, the Trustees considered the information they believed relevant, including but not limited to the information discussed below. The Board considered not only the specific information presented in connection with the Meeting, but also the knowledge gained over time through interaction with Funds Management and the Sub-Adviser about various topics. In this regard, the Board reviewed reports of Funds Management at each of its quarterly meetings, which included, among other things, portfolio reviews and performance reports. In addition, the Board and the teams mentioned above confer with portfolio managers at various times throughout the year. The Board did not identify any particular information or consideration that was all-important or controlling, and each individual Trustee may have attributed different weights to various factors.
After its deliberations, the Board unanimously approved the continuation of the Advisory Agreements for a one-year term and determined that the compensation payable to Funds Management and the Sub-Adviser under each of the Advisory Agreements was reasonable. The Board considered the approval of the Advisory Agreements for the Fund as part of its consideration of agreements for funds across the complex, but its approvals were made on a fund-by-fund basis. The following summarizes a number of important, but not necessarily all, factors considered by the Board in support of its approvals.
Nature, extent and quality of services
The Board received and considered various information regarding the nature, extent and quality of services provided to the Fund by Funds Management and the Sub-Adviser under the Advisory Agreements. This information included a description of the investment advisory services and Fund-level administrative services covered by the Management Agreement, as well as, among other things, a summary of the background and experience of senior management of Funds Management, and the qualifications, background, tenure and responsibilities of each of the portfolio managers primarily responsible for the day-to-day portfolio management of the Fund.
The Board evaluated the ability of Funds Management and the Sub-Adviser to attract and retain qualified investment professionals, including research, advisory and supervisory personnel. The Board further considered the compliance programs and compliance records of Funds Management and the Sub-Adviser. In addition, the Board took into account the full range of services provided to the Fund by Funds Management and its affiliates.
Fund performance and expenses
The Board considered the performance results for the Fund over various time periods ended December 31, 2015. The Board considered these results in comparison to the performance of funds in a universe that was determined by Broadridge Inc. (“Broadridge”) to be similar to the Fund (the “Universe”), and in comparison to other comparative data. Broadridge is an independent provider of investment company data. The Board received a description of the methodology used by Broadridge to select the mutual funds in the performance Universe. The Board noted that the performance of the Fund
| | | | |
| 34 | | Wells Fargo Government Money Market Fund | | Other information (unaudited) |
(Administrator Class) was equal to or in range of the average performance of the Universe for all periods under review. The Board noted that the Fund experienced a portfolio manager change in 2014.
The Board also received and considered information regarding the Fund’s net operating expense ratios and their various components, including actual management fees, custodian and other non-management fees, and Rule 12b-1 and non-Rule 12b-1 shareholder service fees. The Board considered these ratios in comparison to the median ratios of funds in class-specific expense groups that were determined by Broadridge to be similar to the Fund (the “Groups”). The Board received a description of the methodology used by Broadridge to select the mutual funds in the expense Groups and an explanation of how funds comprising expense groups and their expense ratios may vary from year-to-year. Based on the Broadridge reports, the Board noted that the net operating expense ratios of the Fund were equal to or in range of the median net operating expense ratios of the expense Groups.
The Board took into account the Fund performance and expense information provided to it among the factors considered in deciding to re-approve the Advisory Agreements.
Investment management and sub-advisory fee rates
The Board reviewed and considered the contractual fee rates payable by the Fund to Funds Management under the Management Agreement, as well as the contractual fee rates payable by the Fund to Funds Management for class-level administrative services under a Class-Level Administration Agreement, which include class-level transfer agency and sub-transfer agency costs (collectively, the “Management Rates”). The Board also reviewed and considered the contractual investment sub-advisory fee rates that are payable by Funds Management to the Sub-Adviser for investment sub-advisory services.
Among other information reviewed by the Board was a comparison of the Fund’s Management Rates with the average contractual investment management fee rates of funds in the expense Groups at a common asset level as well as transfer agency costs of the funds in the expense Groups. The Board noted that the Management Rates of the Fund were lower than or in range of the sum of these average rates for the Fund’s expense Groups for all share classes.
The Board also received and considered information about the portion of the total advisory fee that was retained by Funds Management after payment of the fee to the Sub-Adviser for sub-advisory services. In assessing the reasonableness of this amount, the Board received and evaluated information about the nature and extent of responsibilities retained and risks assumed by Funds Management and not delegated to or assumed by the Sub-Adviser, and about Funds Management’s on-going oversight services. However, given the affiliation between Funds Management and the Sub-Adviser, the Board ascribed limited relevance to the allocation of fees between them.
The Board also received and considered information about the nature and extent of services offered and fee rates charged by Funds Management and the Sub-Adviser to other types of clients with investment strategies similar to those of the Fund. In this regard, the Board received information about the significantly greater scope of services, and compliance, reporting and other legal burdens and risks of managing mutual funds compared with those associated with managing assets of non-mutual fund clients such as collective funds or institutional separate accounts.
Based on its consideration of the factors and information it deemed relevant, including those described here, the Board determined that the compensation payable to Funds Management under the Management Agreement and to the Sub-Adviser under the Sub-Advisory Agreement was reasonable, in light of the services covered by the Advisory Agreements.
Profitability
The Board received and considered information concerning the profitability of Funds Management, as well as the profitability of Wells Fargo as a whole, from providing services to the Fund and the fund family as a whole. The Board also received and considered information concerning the profitability of the Sub-Adviser from providing services to the fund family as a whole, noting that the Sub-Adviser’s profitability information with respect to providing services to the Fund was subsumed in the Wells Fargo and Funds Management profitability analysis.
Funds Management reported on the methodologies and estimates used in calculating profitability. Among other things, the Board noted that the levels of profitability reported on a fund-by-fund basis varied widely, depending on factors such as the size and type of fund. Based on its review, the Board did not deem the profits reported by Funds Management or Wells Fargo from its services to the Fund to be at a level that would prevent it from approving the continuation of the Advisory Agreements.
Economies of scale
With respect to possible economies of scale, the Board noted the existence of breakpoints in the Fund’s management fee structure, which operate generally to reduce the Fund’s expense ratios as the Fund grows in size. It considered that, for a
| | | | | | |
| Other information (unaudited) | | Wells Fargo Government Money Market Fund | | | 35 | |
small fund or a fund that shrinks in size, breakpoints conversely can result in higher fee levels. The Board also considered that fee waiver and expense reimbursement arrangements and competitive fee rates at the outset are means of sharing potential economies of scale with shareholders of the Fund and the fund family as a whole. The Board considered Funds Management’s view that any analyses of potential economies of scale in managing a particular fund are inherently limited in light of the joint and common costs and investments that Funds Management incurs across the fund family as a whole.
The Board concluded that the Fund’s fee and expense arrangements, including contractual breakpoints, constituted a reasonable approach to sharing potential economies of scale with the Fund and its shareholders.
Other benefits to Funds Management and the Sub-Adviser
The Board received and considered information regarding potential “fall-out” or ancillary benefits received by Funds Management and its affiliates, including the Sub-Adviser, as a result of their relationships with the Fund. Ancillary benefits could include, among others, benefits directly attributable to other relationships with the Fund and benefits potentially derived from an increase in Funds Management’s and the Sub-Adviser’s business as a result of their relationships with the Fund. The Board noted that various affiliates of Funds Management may receive distribution-related fees, shareholder servicing payments and sub-transfer agency fees in respect of shares sold or held through them and services provided.
The Board also reviewed information about soft dollar credits earned and utilized by the Sub-Adviser, fees earned by Funds Management and the Sub-Adviser from managing a private investment vehicle for the fund family’s securities lending collateral and commissions earned by an affiliated broker from portfolio transactions.
Based on its consideration of the factors and information it deemed relevant, including those described here, the Board did not find that any ancillary benefits received by Funds Management and its affiliates, including the Sub-Adviser, were unreasonable.
Conclusion
At the Meeting, after considering the above-described factors and based on its deliberations and its evaluation of the information described above, the Board unanimously approved the continuation of the Advisory Agreements for a one-year term and determined that the compensation payable to Funds Management and the Sub-Adviser under each of the Advisory Agreements was reasonable.
| | | | |
| 36 | | Wells Fargo Government Money Market Fund | | List of abbreviations |
The following is a list of common abbreviations for terms and entities that may have appeared in this report.
| ACA | — ACA Financial Guaranty Corporation |
| ADR | — American depositary receipt |
| ADS | — American depositary shares |
| AGC | — Assured Guaranty Corporation |
| AGM | — Assured Guaranty Municipal |
| Ambac | — Ambac Financial Group Incorporated |
| AMT | — Alternative minimum tax |
| BAN | — Bond anticipation notes |
| BHAC | — Berkshire Hathaway Assurance Corporation |
| CAB | — Capital appreciation bond |
| CCAB | — Convertible capital appreciation bond |
| CDA | — Community Development Authority |
| CDO | — Collateralized debt obligation |
| DRIVER | — Derivative inverse tax-exempt receipts |
| DW&P | — Department of Water & Power |
| DWR | — Department of Water Resources |
| ECFA | — Educational & Cultural Facilities Authority |
| EDA | — Economic Development Authority |
| EDFA | — Economic Development Finance Authority |
| ETF | — Exchange-traded fund |
| FDIC | — Federal Deposit Insurance Corporation |
| FFCB | — Federal Farm Credit Banks |
| FGIC | — Financial Guaranty Insurance Corporation |
| FHA | — Federal Housing Administration |
| FHLB | — Federal Home Loan Bank |
| FHLMC | — Federal Home Loan Mortgage Corporation |
| FICO | — The Financing Corporation |
| FNMA | — Federal National Mortgage Association |
| GDR | — Global depositary receipt |
| GNMA | — Government National Mortgage Association |
| HCFR | — Healthcare facilities revenue |
| HEFA | — Health & Educational Facilities Authority |
| HEFAR | — Higher education facilities authority revenue |
| HFA | — Housing Finance Authority |
| HFFA | — Health Facilities Financing Authority |
| HUD | — Department of Housing and Urban Development |
| IDA | — Industrial Development Authority |
| IDAG | — Industrial Development Agency |
| KRW | — Republic of Korea won |
| LIBOR | — London Interbank Offered Rate |
| LIFER | — Long Inverse Floating Exempt Receipts |
| LLC | — Limited liability company |
| LLLP | — Limited liability limited partnership |
| LLP | — Limited liability partnership |
| MBIA | — Municipal Bond Insurance Association |
| MFHR | — Multifamily housing revenue |
| MSTR | — Municipal securities trust receipts |
| MUD | — Municipal Utility District |
| National | — National Public Finance Guarantee Corporation |
| PCFA | — Pollution Control Financing Authority |
| PCL | — Public Company Limited |
| PCR | — Pollution control revenue |
| PFA | — Public Finance Authority |
| PFFA | — Public Facilities Financing Authority |
| PFOTER | — Puttable floating option tax-exempt receipts |
| plc | — Public limited company |
| PUTTER | — Puttable tax-exempt receipts |
| R&D | — Research & development |
| Radian | — Radian Asset Assurance |
| RAN | — Revenue anticipation notes |
| RDA | — Redevelopment Authority |
| RDFA | — Redevelopment Finance Authority |
| REIT | — Real estate investment trust |
| ROC | — Reset option certificates |
| SAVRS | — Select auction variable rate securities |
| SBA | — Small Business Authority |
| SDR | — Swedish depositary receipt |
| SFHR | — Single-family housing revenue |
| SFMR | — Single-family mortgage revenue |
| SPA | — Standby purchase agreement |
| SPDR | — Standard & Poor’s Depositary Receipts |
| SPEAR | — Short Puttable Exempt Adjustable Receipts |
| STRIPS | — Separate trading of registered interest and |
| TAN | — Tax anticipation notes |
| TIPS | — Treasury inflation-protected securities |
| TRAN | — Tax revenue anticipation notes |
| TTFA | — Transportation Trust Fund Authority |
| TVA | — Tennessee Valley Authority |

For more information
More information about Wells Fargo Funds is available free upon request. To obtain literature, please write, email, visit the Fund’s website, or call:
Wells Fargo Funds
P.O. Box 8266
Boston, MA 02266-8266
Email: fundservice@wellsfargo.com
Website: wellsfargofunds.com
Individual investors: 1-800-222-8222
Retail investment professionals: 1-888-877-9275
Institutional investment professionals: 1-866-765-0778
This report and the financial statements contained herein are submitted for the general information of the shareholders of the Fund. If this report is used for promotional purposes, distribution of the report must be accompanied or preceded by a current prospectus. Before investing, please consider the investment objectives, risks, charges, and expenses of the investment. For a current prospectus and, if available, a summary prospectus, containing this information, call
1-800-222-8222 or visit the Fund’s website at wellsfargofunds.com. Read the prospectus carefully before you invest or send money.
Wells Fargo Asset Management (WFAM) is a trade name used by the asset management businesses of Wells Fargo & Company. Wells Fargo Funds Management, LLC, a wholly owned subsidiary of Wells Fargo & Company, provides investment advisory and administrative services for Wells Fargo Funds. Other affiliates of Wells Fargo & Company provide subadvisory and other services for the funds. The funds are distributed by Wells Fargo Funds Distributor, LLC, Member FINRA, an affiliate of Wells Fargo & Company.
NOT FDIC INSURED ¡ NO BANK GUARANTEE ¡ MAY LOSE VALUE
© 2016 Wells Fargo Funds Management, LLC. All rights reserved.
| | |
 | | 245333 09-16 SA303/SAR303 07-16 |
Semi-Annual Report
July 31, 2016

Government Money Market Funds

| n | | Wells Fargo 100% Treasury Money Market Fund |

Reduce clutter. Save trees.
Sign up for electronic delivery of prospectuses and shareholder reports at wellsfargo.com/advantagedelivery
Contents
The views expressed and any forward-looking statements are as of July 31, 2016, unless otherwise noted, and are those of the Fund managers and/or Wells Fargo Funds Management, LLC. Discussions of individual securities, or the markets generally, or any Wells Fargo Fund are not intended as individual recommendations. Future events or results may vary significantly from those expressed in any forward-looking statements. The views expressed are subject to change at any time in response to changing circumstances in the market. Wells Fargo Funds Management, LLC and the Fund disclaim any obligation to publicly update or revise any views expressed or forward-looking statements.
NOT FDIC INSURED ¡ NO BANK GUARANTEE ¡ MAY LOSE VALUE
| | | | |
| 2 | | Wells Fargo 100% Treasury Money Market Fund | | Letter to shareholders (unaudited) |

Karla M. Rabusch
President
Wells Fargo Funds
We do not anticipate broad changes to the way we manage our money market funds at this time in order to meet the new rules because we have always emphasized stability of principal and liquidity.
Dear Valued Shareholder:
We are pleased to offer you this semi-annual report for the Wells Fargo 100% Treasury Money Market Fund for the six-month period that ended July 31, 2016. The period was marked by preparation for the new amendments to Rule 2a-7 of the Investment Company Act of 1940 (Rule 2a-7) by the U.S. Securities and Exchange Commission. Meanwhile, the U.S. Federal Reserve (Fed) kept the federal funds target rate between 0.25% and 0.50%.
We are preparing to implement the new money market fund regulations.
The amendments to Rule 2a-7, which governs money market funds, are scheduled to be fully implemented by October 2016. To recap, U.S. Treasury and government money market funds will continue to operate much as they do today, with stable $1.00 net asset values (NAVs). Meanwhile, tax-exempt and prime funds will experience more changes. For starters, these types of funds must separate retail investors, such as individuals, and institutional investors. Second, money market fund boards of directors will have discretion to impose either a liquidity fee of up to 2% on shareholder redemptions or a temporary suspension of redemptions (gate) if a fund’s weekly liquid assets fall below 30% of its total assets and the board determines that the fee or gate is in the best interest of the fund’s shareholders.
| | n | | Retail investors will continue to transact at a stable $1.00 NAV but may be subject to liquidity fees and redemption gates. | |
| | n | | Institutional prime and tax-exempt money market funds will transact at a floating, market-based NAV and may be subject to liquidity fees and redemption gates under special circumstances. Once floating NAVs are implemented, daily share prices will fluctuate along with changes, if any, in the market-based value of the underlying portfolio securities. Our Product Alert titled Wells Fargo Announces Effective Dates for Changes to Certain Money Market Funds featured the intraday price times we will use to continue providing same-day settlement and liquidity to our shareholders. | |
| | n | | Additional requirements included increased disclosure and reporting of fund statistics, such as percentage of liquid assets, shareholder flows, and market-based NAVs. In addition, the new regulations also included tighter diversification requirements and enhanced stress-testing measures. | |
| | n | | We will continue to communicate any changes to our money markets funds with our shareholders. Specifically, Product Alerts can be found at our website: wellsfargofunds.com. Click on Product Information and find them under the Product Alerts tab. | |
While there will be many operational changes ahead, we do not anticipate broad changes to the way we manage our money market funds at this time in order to meet the new rules because we have always emphasized stability of principal and liquidity.
Short-term rates remained steady but low.
The Fed kept the federal funds rate steady. On the growth side of its mandate, U.S. economic activity appeared to maintain a modest pace. Global concerns continued to confront the Fed as it tried to assess future conditions in the U.S. While China’s growth and its markets stabilized post first-quarter downdrafts, it continued to “face considerable challenges,” per Fed Chair Janet Yellen in her
| | | | | | |
| Letter to shareholders (unaudited) | | Wells Fargo 100% Treasury Money Market Fund | | | 3 | |
monetary policy report to Congress. Further, although commodity prices rebounded from first-quarter lows, other worries remained. The strong dollar, which could hamper manufacturing and exports, is one factor. Another is potential fallout from Brexit, the referendum whereby the U.K. voted to leave the European Union. With growth and inflation low, Chair Yellen has argued in her monetary policy report that there is little room to cut rates further but plenty of scope to raise rates if inflation picks up too quickly.
With regard to Brexit, traditional risk assets—such as equities and foreign exchange—experienced volatility and U.S. Treasury securities benefited from a flight to quality. Money markets, however, were relatively immune to this volatility, with both credit spreads and liquidity little changed.
Don’t let short-term uncertainty derail long-term investment goals.
Periods of uncertainty can present challenges, but experience has taught us that maintaining long-term investment goals can be an effective way to plan for the future. To help you create a sound strategy based on your personal goals and risk tolerance, Wells Fargo Funds offers more than 100 mutual funds spanning a wide range of asset classes and investment styles. Although diversification cannot guarantee an investment profit or prevent losses, we believe it can be an effective way to manage investment risk and potentially smooth out overall portfolio performance. We encourage investors to know their investments and to understand that appropriate levels of risk-taking may unlock opportunities.
Thank you for choosing to invest in Wells Fargo Funds. We appreciate your confidence in us and remain committed to helping you meet your financial needs.
Sincerely,

Karla M. Rabusch
President
Wells Fargo Funds
Periods of uncertainty can present challenges, but experience has taught us that maintaining long-term investment goals can be an effective way to plan for the future.
For further information about your Fund, contact your investment professional, visit our website at wellsfargofunds.com, or call us directly at 1-800-222-8222. We are available 24 hours a day, 7 days a week.
| | | | |
| 4 | | Wells Fargo 100% Treasury Money Market Fund | | Performance highlights (unaudited) |
Investment objective
The Fund seeks current income exempt from most state and local individual income taxes, while preserving capital and liquidity.
Manager
Wells Fargo Funds Management, LLC
Subadviser
Wells Capital Management Incorporated
Portfolio managers
Michael C. Bird, CFA®
Jeffrey L. Weaver, CFA®
Laurie White
Average annual total returns (%) as of July 31, 20161
| | | | | | | | | | | | | | | | | | | | | | |
| | | | | | | | | | | | | | Expense ratios2 (%) | |
| | | Inception date | | 1 year | | | 5 year | | | 10 year | | | Gross | | | Net3 | |
| Class A (WFTXX) | | 11-8-1999 | | | 0.00 | | | | 0.00 | | | | 0.71 | | | | 0.79 | | | | 0.65 | |
| Administrator Class (WTRXX) | | 6-30-2010 | | | 0.01 | | | | 0.01 | | | | 0.75 | | | | 0.52 | | | | 0.30 | |
| Institutional Class (WOTXX) | | 10-31-2014 | | | 0.07 | | | | 0.02 | | | | 0.75 | | | | 0.40 | | | | 0.20 | |
| Service Class (NWTXX) | | 12-3-1990 | | | 0.00 | | | | 0.00 | | | | 0.74 | | | | 0.69 | | | | 0.50 | |
| Sweep Class | | 6-30-2010 | | | 0.00 | | | | 0.00 | | | | 0.74 | | | | 1.14 | | | | 1.00 | |
Yield summary (%) as of July 31, 20163
| | | | | | | | | | | | | | | | | | |
| | | Class A | | Administrator
Class | | | Institutional
Class | | | Service
Class | | | Sweep
Class | |
| 7-day current yield | | 0.00 | | | 0.04 | | | | 0.14 | | | | 0.00 | | | | 0.00 | |
| 7-day compound yield | | 0.00 | | | 0.04 | | | | 0.14 | | | | 0.00 | | | | 0.00 | |
| 30-day simple yield | | 0.00 | | | 0.04 | | | | 0.14 | | | | 0.00 | | | | 0.00 | |
| 30-day compound yield | | 0.00 | | | 0.04 | | | | 0.14 | | | | 0.00 | | | | 0.00 | |
Figures quoted represent past performance, which is no guarantee of future results, and do not reflect taxes that a shareholder may pay on fund distributions or the redemption of fund shares. Investment returns will fluctuate. The Fund’s yield figures more closely reflect the current earnings of the Fund than the total return figures. Current performance may be lower or higher than the performance data quoted, which assumes the reinvestment of dividends and capital gains. Current month-end performance is available on the Fund’s website, wellsfargofunds.com.
Each class is sold without a front-end sales charge or contingent deferred sales charge.
An investment in a money market fund is not insured or guaranteed by the Federal Deposit Insurance Corporation or any other government agency. Although the Fund seeks to preserve the value of your investment at $1.00 per share, it is possible to lose money by investing in a money market fund. The U.S. government guarantee applies to certain underlying securities and not to shares of the Fund.
Please see footnotes on page 5.
| | | | | | |
| Performance highlights (unaudited) | | Wells Fargo 100% Treasury Money Market Fund | | | 5 | |
|
| Portfolio composition as of July 31, 20164 |
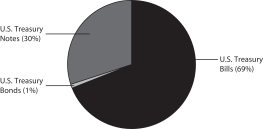 |
| | | | |
| Weighted average maturity as of July 31, 20165 | |
46 days | | | | |
| | |
| Weighted average life as of July 31, 20166 |
89 days | | |
|
| Effective maturity distribution as of July 31, 20164 |
|
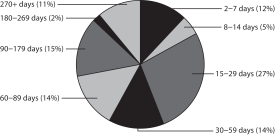
|
| 1 | Historical performance shown for Administrator Class shares prior to their inception reflects the performance of Service Class shares, and includes the higher expenses applicable to Service Class shares. If these expenses had not been included, returns would be higher. Historical performance shown for Institutional Class shares prior to their inception reflects the performance of Administrator Class shares, and includes the higher expenses applicable to Administrator Class shares. If these expenses had not been included, returns would be higher. Historical performance shown for Sweep Class shares prior to their inception reflects the performance of Service Class shares, and has not been adjusted to reflect the higher expenses applicable to Sweep Class shares. If these expenses had been adjusted, returns would be lower. |
| 2 | Reflects the expense ratios as stated in the most recent prospectuses. The expense ratios shown are subject to change and may differ from the annualized expense ratios shown in the financial highlights of this report. |
| 3 | The manager has contractually committed through May 31, 2017, to waive fees and/or reimburse expenses to the extent necessary to cap the Fund’s Total Annual Fund Operating Expenses After Fee Waiver at the amounts shown. After this time, the cap may be increased or the commitment to maintain the cap may be terminated only with the approval of the Board of Trustees. Brokerage commissions, stamp duty fees, interest, taxes, acquired fund fees and expenses, and extraordinary expenses are excluded from the cap. Without this cap, the Fund’s returns would have been lower. Without waived fees and/or reimbursed expenses, the Fund’s 7-day current yield would have been (0.45)%, (0.18)%, (0.06)%, (0.35)%, and (0.80)% for Class A, Administrator Class, Institutional Class, Service Class, and Sweep Class, respectively. |
| 4 | Amounts are calculated based on the total investments of the Fund. These amounts are subject to change and may have changed since the date specified. |
| 5 | Weighted Average Maturity (WAM): WAM is an average of the effective maturities of all securities held in the portfolio, weighted by each security’s percentage of total investments. The maturity of a portfolio security is the period remaining until the date on which the principal amount is unconditionally required to be paid, or in the case of a security called for redemption, the date on which the redemption payment is unconditionally required to be made. WAM calculations allow for the maturities of certain securities with demand features or periodic interest rate resets to be shortened. WAM is a way to measure a fund’s sensitivity to potential interest rate changes. Rule 2a-7 under the Investment Company Act of 1940 requires money market funds to maintain a WAM of 60 calendar days or less. WAM is subject to change and may have changed since the date specified. |
| 6 | Weighted Average Life (WAL): WAL is an average of the final maturities of all securities held in the portfolio, weighted by their percentage of total investments. The maturity of a portfolio security is the period remaining until the date on which the principal amount is unconditionally required to be paid, or in the case of a security called for redemption, the date on which the redemption payment is unconditionally required to be made. In contrast to WAM, the calculation of WAL allows for the maturities of certain securities with demand features to be shortened, but not the periodic interest rate resets. WAL is a way to measure a fund’s potential sensitivity to credit spread changes. Rule 2a-7 under the Investment Company Act of 1940 requires money market funds to maintain a WAL of 120 calendar days or less. WAL is subject to change and may have changed since the date specified. |
| | | | |
| 6 | | Wells Fargo 100% Treasury Money Market Fund | | Fund expenses (unaudited) |
As a shareholder of the Fund, you incur ongoing costs, including management fees, distribution (12b-1) and/or shareholder servicing fees, and other Fund expenses. This example is intended to help you understand your ongoing costs (in dollars) of investing in the Fund and to compare these costs with the ongoing costs of investing in other mutual funds.
The example is based on an investment of $1,000 invested at the beginning of the six-month period and held for the
entire period from February 1, 2016 to July 31, 2016.
Actual expenses
The “Actual” line of the table below provides information about actual account values and actual expenses. You may use the information in this line, together with the amount you invested, to estimate the expenses that you paid over the period. Simply divide your account value by $1,000 (for example, an $8,600 account value divided by $1,000 = 8.6), then multiply the result by the number in the “Actual” line under the heading entitled “Expenses paid during period” for your applicable class of shares to estimate the expenses you paid on your account during this period.
Hypothetical example for comparison purposes
The “Hypothetical” line of the table below provides information about hypothetical account values and hypothetical expenses based on the Fund’s actual expense ratio and an assumed rate of return of 5% per year before expenses, which is not the Fund’s actual return. The hypothetical account values and expenses may not be used to estimate the actual ending account balance or expenses you paid for the period. You may use this information to compare the ongoing costs of investing in the Fund and other funds. To do so, compare this 5% hypothetical example with the 5% hypothetical examples that appear in the shareholder reports of the other funds.
Please note that the expenses shown in the table are meant to highlight your ongoing costs only and do not reflect any transactional costs, such as sales charges (loads) and contingent deferred sales charges. Therefore, the “Hypothetical” line of the table is useful in comparing ongoing costs only and will not help you determine the relative total costs of owning different funds. In addition, if these transactional costs were included, your cost would have been higher.
| | | | | | | | | | | | | | | | |
| | | Beginning
account value
2-1-2016 | | | Ending
account value
7-31-2016 | | | Expenses
paid during
the period¹ | | | Annualized net
expense ratio | |
Class A | | | | | | | | | | | | | | | | |
Actual | | $ | 1,000.00 | | | $ | 1,000.00 | | | $ | 1.65 | | | | 0.33 | % |
Hypothetical (5% return before expenses) | | $ | 1,000.00 | | | $ | 1,023.29 | | | $ | 1.66 | | | | 0.33 | % |
Administrator Class | | | | | | | | | | | | | | | | |
Actual | | $ | 1,000.00 | | | $ | 1,000.13 | | | $ | 1.50 | | | | 0.30 | % |
Hypothetical (5% return before expenses) | | $ | 1,000.00 | | | $ | 1,023.44 | | | $ | 1.51 | | | | 0.30 | % |
Institutional Class | | | | | | | | | | | | | | | | |
Actual | | $ | 1,000.00 | | | $ | 1,000.63 | | | $ | 1.00 | | | | 0.20 | % |
Hypothetical (5% return before expenses) | | $ | 1,000.00 | | | $ | 1,023.93 | | | $ | 1.01 | | | | 0.20 | % |
Service Class | | | | | | | | | | | | | | | | |
Actual | | $ | 1,000.00 | | | $ | 1,000.00 | | | $ | 1.65 | | | | 0.33 | % |
Hypothetical (5% return before expenses) | | $ | 1,000.00 | | | $ | 1,023.29 | | | $ | 1.66 | | | | 0.33 | % |
Sweep Class | | | | | | | | | | | | | | | | |
Actual | | $ | 1,000.00 | | | $ | 1,000.00 | | | $ | 1.65 | | | | 0.33 | % |
Hypothetical (5% return before expenses) | | $ | 1,000.00 | | | $ | 1,023.29 | | | $ | 1.66 | | | | 0.33 | % |
| 1 | Expenses paid is equal to the annualized net expense ratio of each class multiplied by the average account value over the period, multiplied by the number of days in the most recent fiscal half-year divided by the number of days in the fiscal year (to reflect the one-half-year period). |
| | | | | | |
| Portfolio of investments—July 31, 2016 (unaudited) | | Wells Fargo 100% Treasury Money Market Fund | | | 7 | |
| | | | | | | | | | | | | | | | |
| Security name | | Interest rate | | | Maturity date | | | Principal | | | Value | |
| | | | |
Treasury Debt: 91.51% | | | | | | | | | | | | | | | | |
U.S. Treasury Bill (z) | | | 0.21 | % | | | 8-4-2016 | | | $ | 540,070,000 | | | $ | 540,059,718 | |
U.S. Treasury Bill (z) | | | 0.21 | | | | 8-11-2016 | | | | 467,655,000 | | | | 467,623,751 | |
U.S. Treasury Bill (z) | | | 0.26 | | | | 8-18-2016 | | | | 1,089,380,000 | | | | 1,089,244,363 | |
U.S. Treasury Bill (z) | | | 0.27 | | | | 9-22-2016 | | | | 100,000,000 | | | | 99,961,000 | |
U.S. Treasury Bill (z) | | | 0.27 | | | | 9-29-2016 | | | | 100,000,000 | | | | 99,956,569 | |
U.S. Treasury Bill (z) | | | 0.27 | | | | 10-6-2016 | | | | 300,000,000 | | | | 299,854,250 | |
U.S. Treasury Bill (z) | | | 0.29 | | | | 9-8-2016 | | | | 50,000,000 | | | | 49,984,958 | |
U.S. Treasury Bill (z) | | | 0.31 | | | | 10-13-2016 | | | | 100,000,000 | | | | 99,937,747 | |
U.S. Treasury Bill (z) | | | 0.32 | | | | 10-20-2016 | | | | 500,000,000 | | | | 499,647,222 | |
U.S. Treasury Bill (z) | | | 0.32 | | | | 10-27-2016 | | | | 500,000,000 | | | | 499,619,375 | |
U.S. Treasury Bill (z) | | | 0.33 | | | | 8-25-2016 | | | | 1,100,000,000 | | | | 1,099,760,667 | |
U.S. Treasury Bill (z) | | | 0.34 | | | | 9-1-2016 | | | | 750,000,000 | | | | 749,783,431 | |
U.S. Treasury Bond | | | 7.50 | | | | 11-15-2016 | | | | 20,000,000 | | | | 20,406,306 | |
U.S. Treasury Bond | | | 8.75 | | | | 5-15-2017 | | | | 20,000,000 | | | | 21,295,303 | |
U.S. Treasury Note ± | | | 0.37 | | | | 10-31-2016 | | | | 200,000,000 | | | | 199,976,904 | |
U.S. Treasury Note ± | | | 0.39 | | | | 4-30-2017 | | | | 100,000,000 | | | | 99,999,547 | |
U.S. Treasury Note ± | | | 0.40 | | | | 7-31-2017 | | | | 210,000,000 | | | | 209,953,852 | |
U.S. Treasury Note ± | | | 0.49 | | | | 10-31-2017 | | | | 200,000,000 | | | | 199,854,528 | |
U.S. Treasury Note ± | | | 0.49 | | | | 7-31-2018 | | | | 30,000,000 | | | | 29,999,395 | |
U.S. Treasury Note | | | 0.50 | | | | 4-30-2017 | | | | 30,000,000 | | | | 29,990,822 | |
U.S. Treasury Note ± | | | 0.51 | | | | 4-30-2018 | | | | 110,000,000 | | | | 110,004,120 | |
U.S. Treasury Note ± | | | 0.59 | | | | 1-31-2018 | | | | 180,000,000 | | | | 180,065,174 | |
U.S. Treasury Note | | | 0.63 | | | | 8-15-2016 | | | | 130,000,000 | | | | 130,013,741 | |
U.S. Treasury Note | | | 0.63 | | | | 10-15-2016 | | | | 196,000,000 | | | | 196,089,087 | |
U.S. Treasury Note | | | 0.63 | | | | 11-15-2016 | | | | 80,000,000 | | | | 80,027,038 | |
U.S. Treasury Note | | | 0.63 | | | | 12-15-2016 | | | | 50,000,000 | | | | 50,030,102 | |
U.S. Treasury Note | | | 0.63 | | | | 12-31-2016 | | | | 60,000,000 | | | | 60,034,665 | |
U.S. Treasury Note | | | 0.63 | | | | 2-15-2017 | | | | 45,000,000 | | | | 45,009,431 | |
U.S. Treasury Note | | | 0.63 | | | | 5-31-2017 | | | | 10,000,000 | | | | 10,005,531 | |
U.S. Treasury Note | | | 0.88 | | | | 9-15-2016 | | | | 250,000,000 | | | | 250,173,410 | |
U.S. Treasury Note | | | 0.88 | | | | 11-30-2016 | | | | 60,000,000 | | | | 60,087,480 | |
U.S. Treasury Note | | | 0.88 | | | | 12-31-2016 | | | | 30,000,000 | | | | 30,044,497 | |
U.S. Treasury Note | | | 0.88 | | | | 2-28-2017 | | | | 55,000,000 | | | | 55,092,977 | |
U.S. Treasury Note | | | 0.88 | | | | 4-30-2017 | | | | 50,000,000 | | | | 50,131,855 | |
U.S. Treasury Note | | | 0.88 | | | | 5-15-2017 | | | | 20,000,000 | | | | 20,060,304 | |
U.S. Treasury Note | | | 1.00 | | | | 3-31-2017 | | | | 10,000,000 | | | | 10,026,625 | |
U.S. Treasury Note | | | 2.75 | | | | 11-30-2016 | | | | 120,000,000 | | | | 120,916,759 | |
U.S. Treasury Note | | | 3.00 | | | | 8-31-2016 | | | | 50,000,000 | | | | 50,096,918 | |
U.S. Treasury Note | | | 3.13 | | | | 10-31-2016 | | | | 115,000,000 | | | | 115,780,029 | |
U.S. Treasury Note | | | 4.63 | | | | 11-15-2016 | | | | 50,000,000 | | | | 50,611,190 | |
U.S. Treasury Note | | | 4.63 | | | | 2-15-2017 | | | | 50,000,000 | | | | 51,104,785 | |
| | | | |
Total Treasury Debt (Cost $8,132,315,426) | | | | | | | | | | | | | | | 8,132,315,426 | |
| | | | | | | | | | | | | | | | |
| | | | | | | | |
| Total investments in securities (Cost $8,132,315,426) * | | | 91.51 | % | | | 8,132,315,426 | |
Other assets and liabilities, net | | | 8.49 | | | | 754,929,237 | |
| | | | | | | | |
| Total net assets | | | 100.00 | % | | $ | 8,887,244,663 | |
| | | | | �� | | | |
The accompanying notes are an integral part of these financial statements.
| | | | |
| 8 | | Wells Fargo 100% Treasury Money Market Fund | | Portfolio of investments—July 31, 2016 (unaudited) |
| (z) | Zero coupon security. The rate represents the current yield to maturity. |
| ± | Variable rate investment. The rate shown is the rate in effect at period end. |
| * | Cost for federal income tax purposes is substantially the same as for financial reporting purposes. |
The accompanying notes are an integral part of these financial statements.
| | | | | | |
| Statement of assets and liabilities—July 31, 2016 (unaudited) | | Wells Fargo 100% Treasury Money Market Fund | | | 9 | |
| | | | |
| | | | |
| |
Assets | | | | |
Investments in unaffiliated securities, at amortized cost | | $ | 8,132,315,426 | |
Cash | | | 2,099 | |
Receivable for investments sold | | | 974,004,929 | |
Receivable for Fund shares sold | | | 3,349,355 | |
Receivable for interest | | | 12,436,216 | |
Receivable from manager | | | 200,313 | |
Prepaid expenses and other assets | | | 236,402 | |
| | | | |
Total assets | | | 9,122,544,740 | |
| | | | |
| |
Liabilities | | | | |
Dividends payable | | | 71,205 | |
Payable for investments purchased | | | 229,995,196 | |
Payable for Fund shares redeemed | | | 2,522,084 | |
Distribution fee payable | | | 234,065 | |
Administration fees payable | | | 895,379 | |
Accrued expenses and other liabilities | | | 1,582,148 | |
| | | | |
Total liabilities | | | 235,300,077 | |
| | | | |
Total net assets | | $ | 8,887,244,663 | |
| | | | |
| |
NET ASSETS CONSIST OF | | | | |
Paid-in capital | | $ | 8,886,916,343 | |
Undistributed net investment income | | | 3,315 | |
Accumulated net realized gains on investments | | | 325,005 | |
| | | | |
Total net assets | | $ | 8,887,244,663 | |
| | | | |
| |
COMPUTATION OF NET ASSET VALUE PER SHARE | | | | |
Net assets – Class A | | $ | 366,063,582 | |
Shares outstanding – Class A1 | | | 366,032,378 | |
Net asset value per share – Class A | | | $1.00 | |
Net assets – Administrator Class | | $ | 1,823,874,243 | |
Shares outstanding – Administrator Class1 | | | 1,823,680,573 | |
Net asset value per share – Administrator Class | | | $1.00 | |
Net assets – Institutional Class | | $ | 2,069,094,343 | |
Shares outstanding – Institutional Class1 | | | 2,068,897,126 | |
Net asset value per share – Institutional Class | | | $1.00 | |
Net assets – Service Class | | $ | 3,852,597,742 | |
Shares outstanding – Service Class1 | | | 3,852,247,269 | |
Net asset value per share – Service Class | | | $1.00 | |
Net assets – Sweep Class | | $ | 775,614,753 | |
Shares outstanding – Sweep Class1 | | | 775,548,545 | |
Net asset value per share – Sweep Class | | | $1.00 | |
| 1 | The Fund has an unlimited number of authorized shares. |
The accompanying notes are an integral part of these financial statements.
| | | | |
| 10 | | Wells Fargo 100% Treasury Money Market Fund | | Statement of operations—six months ended July 31, 2016 (unaudited) |
| | | | |
| | | | |
| |
Investment income | | | | |
Interest | | $ | 15,052,641 | |
| | | | |
| |
Expenses | | | | |
Management fee | | | 14,362,764 | |
Administration fees | |
Class A | | | 429,727 | |
Administrator Class | | | 955,467 | |
Institutional Class | | | 701,864 | |
Service Class | | | 2,642,696 | |
Sweep Class | | | 835,213 | |
Shareholder servicing fees | |
Class A | | | 488,326 | |
Administrator Class | | | 909,750 | |
Service Class | | | 5,472,609 | |
Sweep Class | | | 949,106 | |
Distribution fee | |
Sweep Class | | | 1,328,748 | |
Custody and accounting fees | | | 225,505 | |
Professional fees | | | 26,366 | |
Registration fees | | | 158,726 | |
Shareholder report expenses | | | 78,931 | |
Trustees’ fees and expenses | | | 6,998 | |
Other fees and expenses | | | 64,728 | |
| | | | |
Total expenses | | | 29,637,524 | |
Less: Fee waivers and/or expense reimbursements | | | (15,959,871 | ) |
| | | | |
Net expenses | | | 13,677,653 | |
| | | | |
Net investment income | | | 1,374,988 | |
| | | | |
Net realized gains on investments | | | 372,290 | |
| | | | |
Net increase in net assets resulting from operations | | $ | 1,747,278 | |
| | | | |
The accompanying notes are an integral part of these financial statements.
| | | | | | |
| Statement of changes in net assets | | Wells Fargo 100% Treasury Money Market Fund | | | 11 | |
| | | | | | | | | | | | | | | | |
| | | Six months ended July 31, 2016 (unaudited) | | | Year ended
January 31, 2016 | |
| | | | |
Operations | | | | | | | | | | | | | | | | |
Net investment income | | | | | | $ | 1,374,988 | | | | | | | $ | 99,433 | |
Net realized gains (losses) on investments | | | | | | | 372,290 | | | | | | | | (107,610 | ) |
| | | | |
Net increase (decrease) in net assets resulting from operations | | | | | | | 1,747,278 | | | | | | | | (8,177 | ) |
| | | | |
| | | | |
Distributions to shareholders from | | | | | | | | | | | | | | | | |
Net investment income | | | | | | | | | | | | | | | | |
Class A | | | | | | | (74 | ) | | | | | | | (277 | ) |
Administrator Class | | | | | | | (252,188 | ) | | | | | | | (1,368 | ) |
Institutional Class | | | | | | | (1,111,340 | ) | | | | | | | (38,488 | ) |
Service Class | | | | | | | (863 | ) | | | | | | | (2,109 | ) |
Sweep Class | | | | | | | (129 | ) | | | | | | | (178 | ) |
Net realized gains | | | | | | | | | | | | | | | | |
Class A | | | | | | | 0 | | | | | | | | (1,925 | ) |
Administrator Class | | | | | | | 0 | | | | | | | | (8,547 | ) |
Institutional Class | | | | | | | 0 | | | | | | | | (1,259 | ) |
Service Class | | | | | | | 0 | | | | | | | | (22,628 | ) |
Sweep Class | | | | | | | 0 | | | | | | | | (1,852 | ) |
| | | | |
Total distributions to shareholders | | | | | | | (1,364,594 | ) | | | | | | | (78,631 | ) |
| | | | |
| | | | |
Capital share transactions | | | Shares | | | | | | | | Shares | | | | | |
Proceeds from shares sold | | | | | | | | | | | | | | | | |
Class A | | | 719,613,730 | | | | 719,613,730 | | | | 1,901,446,024 | | | | 1,901,446,024 | |
Administrator Class | | | 2,083,971,454 | | | | 2,083,971,454 | | | | 6,440,523,252 | | | | 6,440,523,252 | |
Institutional Class | | | 3,494,014,503 | | | | 3,494,014,503 | | | | 1,469,373,290 | | | | 1,469,373,290 | |
Service Class | | | 10,621,301,837 | | | | 10,621,301,837 | | | | 25,698,628,836 | | | | 25,698,628,836 | |
Sweep Class | | | 2,535,086,342 | | | | 2,535,086,342 | | | | 3,327,666,111 | | | | 3,327,666,111 | |
| | | | |
| | | | | | | 19,453,987,866 | | | | | | | | 38,837,637,513 | |
| | | | |
Reinvestment of distributions | | | | | | | | | | | | | | | | |
Class A | | | 70 | | | | 70 | | | | 2,185 | | | | 2,185 | |
Administrator Class | | | 114,195 | | | | 114,195 | | | | 4,720 | | | | 4,720 | |
Institutional Class | | | 1,003,671 | | | | 1,003,671 | | | | 34,826 | | | | 34,826 | |
Service Class | | | 227 | | | | 227 | | | | 7,952 | | | | 7,952 | |
Sweep Class | | | 129 | | | | 129 | | | | 2,030 | | | | 2,030 | |
| | | | |
| | | | | | | 1,118,292 | | | | | | | | 51,713 | |
| | | | |
Payment for shares redeemed | | | | | | | | | | | | | | | | |
Class A | | | (817,749,486 | ) | | | (817,749,486 | ) | | | (2,446,890,666 | ) | | | (2,446,890,666 | ) |
Administrator Class | | | (2,206,298,503 | ) | | | (2,206,298,503 | ) | | | (7,151,322,142 | ) | | | (7,151,322,142 | ) |
Institutional Class | | | (2,058,388,459 | ) | | | (2,058,388,459 | ) | | | (837,240,706 | ) | | | (837,240,706 | ) |
Service Class | | | (12,383,142,918 | ) | | | (12,383,142,918 | ) | | | (27,046,883,461 | ) | | | (27,046,883,461 | ) |
Sweep Class | | | (2,232,765,886 | ) | | | (2,232,765,886 | ) | | | (3,282,195,419 | ) | | | (3,282,195,419 | ) |
| | | | |
| | | | | | | (19,698,345,252 | ) | | | | | | | (40,764,532,394 | ) |
| | | | |
Net decrease in net assets resulting from capital share transactions | | | | | | | (243,239,094 | ) | | | | | | | (1,926,843,168 | ) |
| | | | |
Total decrease in net assets | | | | | | | (242,856,410 | ) | | | | | | | (1,926,929,976 | ) |
| | | | |
| | | | |
Net assets | | | | | | | | | | | | | | | | |
Beginning of period | | | | | | | 9,130,101,073 | | | | | | | | 11,057,031,049 | |
| | | | |
End of period | | | | | | $ | 8,887,244,663 | | | | | | | $ | 9,130,101,073 | |
| | | | |
Undistributed (overdistributed) net investment income | | | | | | $ | 3,315 | | | | | | | $ | (7,079 | ) |
| | | | |
The accompanying notes are an integral part of these financial statements.
| | | | |
| 12 | | Wells Fargo 100% Treasury Money Market Fund | | Financial highlights |
(For a share outstanding throughout each period)
| | | | | | | | | | | | | | | | | | | | | | | | |
| | | Six months ended
July 31, 2016 (unaudited) | | | Year ended January 31 | |
| CLASS A | | | 2016 | | | 2015 | | | 2014 | | | 2013 | | | 2012 | |
Net asset value, beginning of period | | | $1.00 | | | | $1.00 | | | | $1.00 | | | | $1.00 | | | | $1.00 | | | | $1.00 | |
Net investment income (loss) | | | 0.00 | 1,2 | | | 0.00 | 1,2 | | | (0.00 | )1,2 | | | 0.00 | 1 | | | 0.00 | | | | 0.00 | 1 |
Net realized gains (losses) on investments | | | 0.00 | 1 | | | (0.00 | )1 | | | 0.00 | 1 | | | 0.00 | 1 | | | 0.00 | 1 | | | 0.00 | 1 |
| | | | | | | | | | | | | | | | | | | | | | | | |
Total from investment operations | | | 0.00 | 1 | | | (0.00 | )1 | | | 0.00 | 1 | | | 0.00 | 1 | | | 0.00 | 1 | | | 0.00 | 1 |
Distributions to shareholders from | | | | | | | | | | | | | | | | | | | | | | | | |
Net investment income | | | (0.00 | )1 | | | (0.00 | )1 | | | (0.00 | )1 | | | (0.00 | )1 | | | 0.00 | | | | (0.00 | )1 |
Net realized gains | | | 0.00 | | | | (0.00 | )1 | | | (0.00 | )1 | | | (0.00 | )1 | | | (0.00 | )1 | | | (0.00 | )1 |
| | | | | | | | | | | | | | | | | | | | | | | | |
Total distributions to shareholders | | | (0.00 | )1 | | | (0.00 | )1 | | | (0.00 | )1 | | | (0.00 | )1 | | | (0.00 | )1 | | | (0.00 | )1 |
Net asset value, end of period | | | $1.00 | | | | $1.00 | | | | $1.00 | | | | $1.00 | | | | $1.00 | | | | $1.00 | |
Total return3 | | | 0.00 | % | | | 0.00 | % | | | 0.00 | % | | | 0.00 | % | | | 0.00 | % | | | 0.02 | % |
Ratios to average net assets (annualized) | | | | | | | | | | | | | | | | | | | | | | | | |
Gross expenses | | | 0.79 | % | | | 0.79 | % | | | 0.79 | % | | | 0.79 | % | | | 0.77 | % | | | 0.69 | % |
Net expenses | | | 0.33 | % | | | 0.08 | % | | | 0.04 | % | | | 0.06 | % | | | 0.09 | % | | | 0.05 | % |
Net investment income (loss) | | | 0.00 | % | | | 0.00 | % | | | (0.00 | )% | | | 0.00 | % | | | 0.00 | % | | | 0.01 | % |
Supplemental data | | | | | | | | | | | | | | | | | | | | | | | | |
Net assets, end of period (000s omitted) | | | $366,064 | | | | $464,176 | | | | $1,009,623 | | | | $932,956 | | | | $290,743 | | | | $230,582 | |
| 1 | Amount is less than $0.005. |
| 2 | Calculated based upon average shares outstanding |
| 3 | Returns for periods of less than one year are not annualized. |
The accompanying notes are an integral part of these financial statements.
| | | | | | |
| Financial highlights | | Wells Fargo 100% Treasury Money Market Fund | | | 13 | |
(For a share outstanding throughout each period)
| | | | | | | | | | | | | | | | | | | | | | | | |
| | | Six months ended
July 31, 2016 (unaudited) | | | Year ended January 31 | |
| ADMINISTRATOR CLASS | | | 2016 | | | 2015 | | | 2014 | | | 2013 | | | 2012 | |
Net asset value, beginning of period | | | $1.00 | | | | $1.00 | | | | $1.00 | | | | $1.00 | | | | $1.00 | | | | $1.00 | |
Net investment income (loss) | | | 0.00 | 1 | | | 0.00 | 1 | | | (0.00 | )1,2 | | | 0.00 | 1 | | | 0.00 | | | | 0.00 | 1 |
Net realized gains (losses) on investments | | | 0.00 | 1 | | | (0.00 | )1 | | | 0.00 | 1 | | | 0.00 | 1 | | | 0.00 | 1 | | | 0.00 | 1 |
| | | | | | | | | | | | | | | | | | | | | | | | |
Total from investment operations | | | 0.00 | 1 | | | (0.00 | )1 | | | 0.00 | 1 | | | 0.00 | 1 | | | 0.00 | 1 | | | 0.00 | 1 |
Distributions to shareholders from | | | | | | | | | | | | | | | | | | | | | | | | |
Net investment income | | | (0.00 | )1 | | | (0.00 | )1 | | | (0.00 | )1 | | | (0.00 | )1 | | | (0.00 | )1 | | | (0.00 | )1 |
Net realized gains | | | 0.00 | | | | (0.00 | )1 | | | (0.00 | )1 | | | (0.00 | )1 | | | (0.00 | )1 | | | (0.00 | )1 |
| | | | | | | | | | | | | | | | | | | | | | | | |
Total distributions to shareholders | | | (0.00 | )1 | | | (0.00 | )1 | | | (0.00 | )1 | | | (0.00 | )1 | | | (0.00 | )1 | | | (0.00 | )1 |
Net asset value, end of period | | | $1.00 | | | | $1.00 | | | | $1.00 | | | | $1.00 | | | | $1.00 | | | | $1.00 | |
Total return3 | | | 0.01 | % | | | 0.00 | % | | | 0.00 | % | | | 0.00 | % | | | 0.00 | % | | | 0.02 | % |
Ratios to average net assets (annualized) | | | | | | | | | | | | | | | | | | | | | | | | |
Gross expenses | | | 0.52 | % | | | 0.51 | % | | | 0.51 | % | | | 0.51 | % | | | 0.52 | % | | | 0.51 | % |
Net expenses | | | 0.30 | % | | | 0.08 | % | | | 0.04 | % | | | 0.06 | % | | | 0.09 | % | | | 0.04 | % |
Net investment income (loss) | | | 0.03 | % | | | 0.00 | % | | | (0.00 | )% | | | 0.00 | % | | | 0.00 | % | | | 0.01 | % |
Supplemental data | | | | | | | | | | | | | | | | | | | | | | | | |
Net assets, end of period (000s omitted) | | | $1,823,874 | | | | $1,945,991 | | | | $2,656,805 | | | | $2,754,138 | | | | $2,632,074 | | | | $1,636,769 | |
| 1 | Amount is less than $0.005. |
| 2 | Calculated based upon average shares outstanding |
| 3 | Returns for periods of less than one year are not annualized. |
The accompanying notes are an integral part of these financial statements.
| | | | |
| 14 | | Wells Fargo 100% Treasury Money Market Fund | | Financial highlights |
(For a share outstanding throughout each period)
| | | | | | | | | | | | |
| | | Six months ended July 31, 2016 (unaudited) | | | Year ended January 31 | |
| INSTITUTIONAL CLASS | | | 2016 | | | 20151 | |
Net asset value, beginning of period | | | $1.00 | | | | $1.00 | | | | $1.00 | |
Net investment income (loss) | | | 0.00 | 2 | | | 0.00 | 2 | | | (0.00 | )2,3 |
Net realized gains (losses) on investments | | | 0.00 | 2 | | | (0.00 | )2 | | | 0.00 | 2 |
| | | | | | | | | | | | |
Total from investment operations | | | 0.00 | 2 | | | 0.00 | 2 | | | 0.00 | 2 |
Distributions to shareholders from | | | | | | | | | | | | |
Net investment income | | | (0.00 | )2 | | | (0.00 | )2 | | | (0.00 | )2 |
Net realized gains | | | 0.00 | | | | (0.00 | )2 | | | (0.00 | )2 |
| | | | | | | | | | | | |
Total distributions to shareholders | | | (0.00 | )2 | | | (0.00 | )2 | | | (0.00 | )2 |
Net asset value, end of period | | | $1.00 | | | | $1.00 | | | | $1.00 | |
Total return4 | | | 0.06 | % | | | 0.01 | % | | | 0.00 | % |
Ratios to average net assets (annualized) | | | | | | | | | | | | |
Gross expenses | | | 0.40 | % | | | 0.40 | % | | | 0.39 | % |
Net expenses | | | 0.20 | % | | | 0.11 | % | | | 0.04 | % |
Net investment income (loss) | | | 0.13 | % | | | 0.01 | % | | | (0.00 | )% |
Supplemental data | | | | | | | | | | | | |
Net assets, end of period (000s omitted) | | | $2,069,094 | | | | $632,263 | | | | $100 | |
| 1 | For the period from October 31, 2014 (commencement of operations) to January 31, 2015 |
| 2 | Amount is less than $0.005. |
| 3 | Calculated based upon average shares outstanding. |
| 4 | Returns for periods of less than one year are not annualized. |
The accompanying notes are an integral part of these financial statements.
| | | | | | |
| Financial highlights | | Wells Fargo 100% Treasury Money Market Fund | | | 15 | |
(For a share outstanding throughout each period)
| | | | | | | | | | | | | | | | | | | | | | | | |
| | | Six months ended
July 31, 2016 (unaudited) | | | Year ended January 31 | |
| SERVICE CLASS | | | 2016 | | | 2015 | | | 2014 | | | 2013 | | | 2012 | |
Net asset value, beginning of period | | | $1.00 | | | | $1.00 | | | | $1.00 | | | | $1.00 | | | | $1.00 | | | | $1.00 | |
Net investment income (loss) | | | 0.00 | 1 | | | 0.00 | 1 | | | (0.00 | )1,2 | | | 0.00 | 1 | | | 0.00 | | | | 0.00 | 1 |
Net realized gains (losses) on investments | | | 0.00 | 1 | | | (0.00 | )1 | | | 0.00 | 1 | | | 0.00 | 1 | | | 0.00 | 1 | | | 0.00 | 1 |
| | | | | | | | | | | | | | | | | | | | | | | | |
Total from investment operations | | | 0.00 | 1 | | | (0.00 | )1 | | | 0.00 | 1 | | | 0.00 | 1 | | | 0.00 | 1 | | | 0.00 | 1 |
Distributions to shareholders from | | | | | | | | | | | | | | | | | | | | | | | | |
Net investment income | | | (0.00 | )1 | | | (0.00 | )1 | | | (0.00 | )1 | | | (0.00 | )1 | | | (0.00 | )1 | | | (0.00 | )1 |
Net realized gains | | | 0.00 | 1 | | | (0.00 | )1 | | | (0.00 | )1 | | | (0.00 | )1 | | | (0.00 | )1 | | | (0.00 | )1 |
| | | | | | | | | | | | | | | | | | | | | | | | |
Total distributions to shareholders | | | (0.00 | )1 | | | (0.00 | )1 | | | (0.00 | )1 | | | (0.00 | )1 | | | (0.00 | )1 | | | (0.00 | )1 |
Net asset value, end of period | | | $1.00 | | | | $1.00 | | | | $1.00 | | | | $1.00 | | | | $1.00 | | | | $1.00 | |
Total return3 | | | 0.00 | % | | | 0.00 | % | | | 0.00 | % | | | 0.00 | % | | | 0.00 | % | | | 0.02 | % |
Ratios to average net assets (annualized) | | | | | | | | | | | | | | | | | | | | | | | | |
Gross expenses | | | 0.69 | % | | | 0.69 | % | | | 0.68 | % | | | 0.68 | % | | | 0.69 | % | | | 0.68 | % |
Net expenses | | | 0.33 | % | | | 0.09 | % | | | 0.05 | % | | | 0.07 | % | | | 0.09 | % | | | 0.05 | % |
Net investment income (loss) | | | 0.00 | % | | | 0.00 | % | | | (0.00 | )% | | | 0.00 | % | | | 0.00 | % | | | 0.01 | % |
Supplemental data | | | | | | | | | | | | | | | | | | | | | | | | |
Net assets, end of period (000s omitted) | | | $3,852,598 | | | | $5,614,425 | | | | $6,962,725 | | | | $7,491,653 | | | | $7,802,468 | | | | $8,502,741 | |
| 1 | Amount is less than $0.005. |
| 2 | Calculated based upon average shares outstanding. |
| 3 | Returns for periods of less than one year are not annualized. |
The accompanying notes are an integral part of these financial statements.
| | | | |
| 16 | | Wells Fargo 100% Treasury Money Market Fund | | Financial highlights |
(For a share outstanding throughout each period)
| | | | | | | | | | | | | | | | | | | | | | | | |
| | | Six months ended
July 31, 2016 (unaudited) | | | Year ended January 31 | |
| SWEEP CLASS | | | 2016 | | | 2015 | | | 2014 | | | 2013 | | | 2012 | |
Net asset value, beginning of period | | | $1.00 | | | | $1.00 | | | | $1.00 | | | | $1.00 | | | | $1.00 | | | | $1.00 | |
Net investment income (loss) | | | 0.00 | 1 | | | 0.00 | 1 | | | (0.00 | )1,2 | | | 0.00 | 1 | | | 0.00 | | | | 0.00 | 1 |
Net realized gains (losses) on investments | | | 0.00 | 1 | | | (0.00 | )1 | | | 0.00 | 1 | | | 0.00 | 1 | | | 0.00 | 1 | | | 0.00 | 1 |
| | | | | | | | | | | | | | | | | | | | | | | | |
Total from investment operations | | | 0.00 | 1 | | | (0.00 | )1 | | | 0.00 | 1 | | | 0.00 | 1 | | | 0.00 | 1 | | | 0.00 | 1 |
Distributions to shareholders from | | | | | | | | | | | | | | | | | | | | | | | | |
Net investment income | | | (0.00 | )1 | | | (0.00 | )1 | | | (0.00 | )1 | | | (0.00 | )1 | | | (0.00 | )1 | | | (0.00 | )1 |
Net realized gains | | | 0.00 | | | | (0.00 | )1 | | | (0.00 | )1 | | | (0.00 | )1 | | | (0.00 | )1 | | | (0.00 | )1 |
| | | | | | | | | | | | | | | | | | | | | | | | |
Total distributions to shareholders | | | (0.00 | )1 | | | (0.00 | )1 | | | (0.00 | )1 | | | (0.00 | )1 | | | (0.00 | )1 | | | (0.00 | )1 |
Net asset value, end of period | | | $1.00 | | | | $1.00 | | | | $1.00 | | | | $1.00 | | | | $1.00 | | | | $1.00 | |
Total return3 | | | 0.00 | % | | | 0.00 | % | | | 0.00 | % | | | 0.00 | % | | | 0.00 | % | | | 0.02 | % |
Ratios to average net assets (annualized) | | | | | | | | | | | | | | | | | | | | | | | | |
Gross expenses | | | 1.14 | % | | | 1.14 | % | | | 1.14 | % | | | 1.14 | % | | | 1.14 | % | | | 1.14 | % |
Net expenses | | | 0.33 | % | | | 0.09 | % | | | 0.04 | % | | | 0.06 | % | | | 0.09 | % | | | 0.04 | % |
Net investment income (loss) | | | 0.00 | % | | | 0.00 | % | | | (0.00 | )% | | | 0.00 | % | | | 0.00 | % | | | 0.01 | % |
Supplemental data | | | | | | | | | | | | | | | | | | | | | | | | |
Net assets, end of period (000s omitted) | | | $775,615 | | | | $473,246 | | | | $427,778 | | | | $390,560 | | | | $447,234 | | | | $309,270 | |
| 1 | Amount is less than $0.005. |
| 2 | Calculated based upon average shares outstanding. |
| 3 | Returns for periods of less than one year are not annualized. |
The accompanying notes are an integral part of these financial statements.
| | | | | | |
| Notes to financial statements (unaudited) | | Wells Fargo 100% Treasury Money Market Fund | | | 17 | |
1. ORGANIZATION
Wells Fargo Funds Trust (the “Trust”), a Delaware statutory trust organized on March 10, 1999, is an open-end management investment company registered under the Investment Company Act of 1940, as amended (the “1940 Act”). As an investment company, the Trust follows the accounting and reporting guidance in Financial Accounting Standards Board (“FASB”) Accounting Standards Codification Topic 946, Financial Services – Investment Companies. These financial statements report on the Wells Fargo 100% Treasury Money Market Fund (the “Fund”) which is a diversified series of the Trust.
2. SIGNIFICANT ACCOUNTING POLICIES
The following significant accounting policies, which are consistently followed in the preparation of the financial statements of the Fund, are in conformity with U.S. generally accepted accounting principles which require management to make estimates and assumptions that affect the reported amounts of assets and liabilities, disclosure of contingent assets and liabilities at the date of the financial statements, and the reported amounts of revenues and expenses during the reporting period. Actual results could differ from those estimates.
Securities valuation
As permitted under Rule 2a-7 of the 1940 Act, portfolio securities are valued at amortized cost, which approximates fair value. The amortized cost method involves valuing a security at its cost, plus accretion of discount or minus amortization of premium over the period until maturity.
Investments which are not valued using the method discussed above are valued at their fair value, as determined in good faith by the Board of Trustees of the Fund. The Board of Trustees has established a Valuation Committee comprised of the Trustees and has delegated to it the authority to take any actions regarding the valuation of portfolio securities that the Valuation Committee deems necessary or appropriate, including determining the fair value of portfolio securities, unless the determination has been delegated to the Management Valuation Team of Wells Fargo Funds Management, LLC (“Funds Management”). The Board of Trustees retains the authority to make or ratify any valuation decisions or approve any changes to the Valuation Procedures as it deems appropriate. On a quarterly basis, the Board of Trustees receives reports on any valuation actions taken by the Valuation Committee or the Management Valuation Team which may include items for ratification.
Valuations of fair valued securities are compared to the next actual sales price when available, or other appropriate market values, to assess the continued appropriateness of the fair valuation methodologies used. These securities are fair valued on a day-to-day basis, taking into consideration changes to appropriate market information and any significant changes to the inputs considered in the valuation process until there is a readily available price provided on an exchange or by an independent pricing service. Valuations received from an independent pricing service or independent broker-dealer quotes are periodically validated by comparisons to most recent trades and valuations provided by other independent pricing services in addition to the review of prices by the manager and/or subadviser. Unobservable inputs used in determining fair valuations are identified based on the type of security, taking into consideration factors utilized by market participants in valuing the investment, knowledge about the issuer and the current market environment.
When-issued transactions
The Fund may purchase securities on a forward commitment or when-issued basis. The Fund records a when-issued transaction on the trade date and will segregate assets in an amount at least equal in value to the Fund’s commitment to purchase when-issued securities. Securities purchased on a when-issued basis are marked-to-market daily and the Fund begins earning interest on the settlement date. Losses may arise due to changes in the market value of the underlying securities or if the counterparty does not perform under the contract.
Security transactions and income recognition
Securities transactions are recorded on a trade date basis. Realized gains or losses are recorded on the basis of identified cost.
Interest income is accrued daily and bond discounts are accreted and premiums are amortized daily based on the effective interest method. To the extent debt obligations are placed on non-accrual status, any related interest income may be reduced by writing off interest receivables when the collection of all or a portion of interest has become doubtful based on consistently applied procedures. If the issuer subsequently resumes interest payments or when the collectability of interest is reasonably assured, the debt obligation is removed from non-accrual status.
| | | | |
| 18 | | Wells Fargo 100% Treasury Money Market Fund | | Notes to financial statements (unaudited) |
Distributions to shareholders
Distributions to shareholders from net investment income are accrued daily and paid monthly. Distributions from net realized gains, if any, are recorded on the ex-dividend date. Such distributions are determined in conformity with federal income tax regulations, which may differ in amount or character from net investment income and realized gains recognized for purposes of U.S. generally accepted accounting principles.
Federal and other taxes
The Fund intends to continue to qualify as a regulated investment company by distributing substantially all of its investment company taxable income and any net realized capital gains (after reduction for capital loss carryforwards) sufficient to relieve it from all, or substantially all, federal income taxes. Accordingly, no provision for federal income taxes was required.
The Fund’s income and federal excise tax returns and all financial records supporting those returns for the prior three fiscal years are subject to examination by the federal and Delaware revenue authorities. Management has analyzed the Fund’s tax positions taken on federal, state, and foreign tax returns for all open tax years and does not believe that there are any uncertain tax positions that require recognition of a tax liability
As of January 31, 2016, the Fund had capital loss carryforwards which consist of $43,766 in short-term capital losses.
As of January 31, 2016, the Fund had current year deferred post-October capital losses consisting of $3,519 in short-term losses which was recognized on the first day of the current fiscal year.
Class allocations
The separate classes of shares offered by the Fund differ principally in distribution, shareholder servicing, and administration fees. Class specific expenses are charged directly to that share class. Investment income, common expenses, and realized and unrealized gains (losses) on investments are allocated daily to each class of shares based on the relative proportion of net assets of each class.
3. FAIR VALUATION MEASUREMENTS
Fair value measurements of investments are determined within a framework that has established a fair value hierarchy based upon the various data inputs utilized in determining the value of the Fund’s investments. The three-level hierarchy gives the highest priority to unadjusted quoted prices in active markets for identical assets or liabilities (Level 1) and the lowest priority to significant unobservable inputs (Level 3). The Fund’s investments are classified within the fair value hierarchy based on the lowest level of input that is significant to the fair value measurement. The inputs are summarized into three broad levels as follows:
| n | | Level 1 – quoted prices in active markets for identical securities |
| n | | Level 2 – other significant observable inputs (including quoted prices for similar securities, interest rates, prepayment speeds, credit risk, use of amortized cost, etc.) |
| n | | Level 3 – significant unobservable inputs (including the Fund’s own assumptions in determining the fair value of investments) |
The inputs or methodologies used for valuing investments in securities are not necessarily an indication of the risk associated with investing in those securities.
At July 31, 2016, all of the Fund’s investments in securities were valued using Level 2 inputs since the primary inputs include the credit quality of the issuer and short-term interest rates (both of which are observable) in addition to the use of amortized cost.
The Fund recognizes transfers between levels within the fair value hierarchy at the end of the reporting period. At July 31, 2016, the Fund did not have any transfers into/out of Level 1, Level 2, or Level 3.
4. TRANSACTIONS WITH AFFILIATES
Management fee
Funds Management, an indirect wholly owned subsidiary of Wells Fargo & Company (“Wells Fargo”), is the manager of the Fund and provides advisory and fund-level administrative services under an investment management agreement. Under the investment management agreement, Funds Management is responsible for, among other services, implementing the investment objectives and strategies of the Fund, supervising the subadviser, providing fund-level
| | | | | | |
| Notes to financial statements (unaudited) | | Wells Fargo 100% Treasury Money Market Fund | | | 19 | |
administrative services in connection with the Fund’s operations, and providing any other fund-level administrative services reasonably necessary for the operation of the Fund. As compensation for its services under the investment management agreement, Funds Management is entitled to receive an annual management fee starting at 0.35% and declining to 0.23% as the average daily net assets of the Fund increase. For the six months ended July 31, 2016, the management fee was equivalent to an annual rate of 0.31% of the Fund’s average daily net assets.
Funds Management has retained the services of a subadviser to provide daily portfolio management to the Fund. The fee for subadvisory services is borne by Funds Management. Wells Capital Management Incorporated, an affiliate of Funds Management and an indirect wholly owned subsidiary of Wells Fargo, is the subadviser to the Fund and is entitled to receive a fee from Funds Management at an annual rate starting at 0.05% and declining to 0.01% as the average daily net assets of the Fund increase.
Administration fees
Under a class-level administration agreement, Funds Management provides class-level administrative services to the Fund, which includes paying fees and expenses for services provided by the transfer agent, sub-transfer agents, omnibus account servicers and record-keepers. As compensation for its services under the class-level administration agreement, Funds Management receives an annual fee which is calculated based on the average daily net assets of each class as follows:
| | | | |
| | | Class-level
administration fee | |
Class A, Sweep Class | | | 0.22 | % |
Administrator Class | | | 0.10 | |
Institutional Class | | | 0.08 | |
Service Class | | | 0.12 | |
Funds Management has contractually waived and/or reimbursed management and administration fees to the extent necessary to maintain certain net operating expense ratios for the Fund. Waiver of fees and/or reimbursement of expenses by Funds Management were made first from fund level expenses on a proportionate basis and then from class specific expenses. Funds Management has committed through May 31, 2017 to waive fees and/or reimburse expenses to the extent necessary to cap the Fund’s expenses at 0.65% for Class A shares, 0.30% for Administrator Class shares, 0.20% for Institutional Class shares, 0.50% for Service Class shares, and 1.00% for Sweep Class shares. After this time, the cap may be increased or the commitment to maintain the cap may be terminated only with the approval of the Board of Trustees. During the six months ended July 31, 2016, Funds Management voluntarily waived additional expenses to maintain a positive yield.
Distribution fee
The Trust has adopted a distribution plan for Sweep Class shares of the Fund pursuant to Rule 12b-1 under the 1940 Act. A distribution fees is charged to Sweep Class shares and paid to Wells Fargo Funds Distributor, LLC, the principal underwriter, at an annual rate of 0.35% of the average daily net assets of Sweep Class shares.
Shareholder servicing fees
The Trust has entered into contracts with one or more shareholder servicing agents, whereby Class A, Service Class, and Sweep Class of the Fund are charged a fee at an annual rate of 0.25% of the respective average daily net assets of each class. Administrator Class is charged a fee at an annual rate of 0.10% of its average daily net assets.
A portion of these total shareholder servicing fees were paid to affiliates of Wells Fargo.
5. INDEMNIFICATION
Under the Trust’s organizational documents, the officers and Trustees have been granted certain indemnification rights against certain liabilities that may arise out of performance of their duties to the Trust. Additionally, in the normal course of business, the Trust may enter into contracts with service providers that contain a variety of indemnification clauses. The Trust’s maximum exposure under these arrangements is dependent on future claims that may be made against the Fund and, therefore, cannot be estimated.
| | | | |
| 20 | | Wells Fargo 100% Treasury Money Market Fund | | Notes to financial statements (unaudited) |
6. MONEY MARKET FUND REFORM
On July 23, 2014, the Securities and Exchange Commission voted to amend Rule 2a-7 of the 1940 Act which governs the operations of registered money market funds. The amendments to Rule 2a-7 when implemented may, among other things, require the Fund to change the manner in which it values its securities, impose new liquidity fees on redemptions in certain circumstances, and permit the Fund to limit redemptions in certain circumstances. The amendments have staggered compliance dates. Compliance with a majority of these amendments will be required on October 14, 2016. The Fund will continue to be offered to retail and institutional investors and transact at a stable $1.00 net asset value (NAV).
| | | | | | |
| Other information (unaudited) | | Wells Fargo 100% Treasury Money Market Fund | | | 21 | |
PROXY VOTING INFORMATION
A description of the policies and procedures that the Fund uses to determine how to vote proxies relating to portfolio securities is available, upon request, by calling 1-800-222-8222, visiting our website at wellsfargofunds.com, or visiting the SEC website at sec.gov. Information regarding how the Fund voted proxies relating to portfolio securities during the most recent 12-month period ended June 30 is available on the Fund’s website at wellsfargofunds.com or by visiting the SEC website at sec.gov.
PORTFOLIO HOLDINGS INFORMATION
The complete portfolio holdings for the Fund are publicly available on the Fund’s website (wellsfargofunds.com) on a 1-day delayed basis. The Fund files its complete schedule of portfolio holdings with the SEC for the first and third quarters of each fiscal year on Form N-Q, which is available by visiting the SEC website at sec.gov. In addition, the Fund’s Form N-Q may be reviewed and copied at the SEC’s Public Reference Room in Washington, DC, and at regional offices in New York City, at 233 Broadway, and in Chicago, at 175 West Jackson Boulevard, Suite 900. Information about the Public Reference Room may be obtained by calling 1-800-SEC-0330.
| | | | |
| 22 | | Wells Fargo 100% Treasury Money Market Fund | | Other information (unaudited) |
BOARD OF TRUSTEES AND OFFICERS
Each of the Trustees and Officers1 listed in the table below acts in identical capacities for each fund in the Wells Fargo family of funds, which consists of 139 mutual funds comprising the Wells Fargo Funds Trust, Wells Fargo Variable Trust, Wells Fargo Master Trust and four closed-end funds (collectively the “Fund Complex”). This table should be read in conjunction with the Prospectus and the Statement of Additional Information2. The mailing address of each Trustee and Officer is 525 Market Street, 12th Floor, San Francisco, CA 94105. Each Trustee and Officer serves an indefinite term, however, each Trustee serves such term until reaching the mandatory retirement age established by the Trustees.
Independent Trustees
| | | | | | |
Name and year of birth | | Position held and length of service* | | Principal occupations during past five years or longer | | Current other public company or investment company directorships |
William R. Ebsworth (Born 1957) | | Trustee, since 2015 | | Retired. From 1984 to 2013, equities analyst, portfolio manager, research director and chief financial officer at Fidelity Management and Research Company in Boston, Tokyo, and Hong Kong and retired in 2013 as Chief Investment Officer of Fidelity Strategic Advisers, Inc. where he lead a team of investment professionals managing client assets. Prior thereto, Board member of Hong Kong Securities Clearing Co., Hong Kong Options Clearing Corp., the Thailand International Fund, Ltd., Fidelity Investments Life Insurance Company, and Empire Fidelity Investments Life Insurance Company. Mr. Ebsworth is a CFA® charterholder and an Adjunct Lecturer, Finance, at Babson College. | | Asset Allocation Trust |
Jane A. Freeman (Born 1953) | | Trustee, since 2015 | | Retired. From 2012 to 2014 and 1999 to 2008, Chief Financial Officer of Scientific Learning Corporation. From 2008 to 2012, Ms. Freeman provided consulting services related to strategic business projects. Prior to 1999, Portfolio Manager at Rockefeller & Co. and Scudder, Stevens & Clark. Board member of the Harding Loevner Funds from 1996 to 2014, serving as both Lead Independent Director and chair of the Audit Committee. Board member of the Russell Exchange Traded Funds Trust from 2011 to 2012 and the chair of the Audit Committee. Ms. Freeman is Chair of Taproot Foundation (non-profit organization), a Board Member of Ruth Bancroft Garden (non-profit organization) and an inactive chartered financial analyst. | | Asset Allocation Trust |
Peter G. Gordon (Born 1942) | | Trustee, since 1998; Chairman, since 2005 | | Co-Founder, Retired Chairman, President and CEO of Crystal Geyser Water Company. Trustee Emeritus, Colby College. | | Asset Allocation Trust |
Isaiah Harris, Jr. (Born 1952) | | Trustee, since 2009 | | Retired. Chairman of the Board of CIGNA Corporation since 2009, and Director since 2005. From 2003 to 2011, Director of Deluxe Corporation. Prior thereto, President and CEO of BellSouth Advertising and Publishing Corp. from 2005 to 2007, President and CEO of BellSouth Enterprises from 2004 to 2005 and President of BellSouth Consumer Services from 2000 to 2003. Emeritus member of the Iowa State University Foundation Board of Governors. Emeritus Member of the Advisory Board of Iowa State University School of Business. Advisory Board Member, Palm Harbor Academy (charter school). Advisory Board Member, Child Evangelism Fellowship (non-profit). Mr. Harris is a certified public accountant (inactive status). | | CIGNA Corporation; Asset Allocation Trust |
Judith M. Johnson (Born 1949) | | Trustee, since 2008; Audit Committee Chairman, since 2008 | | Retired. Prior thereto, Chief Executive Officer and Chief Investment Officer of Minneapolis Employees Retirement Fund from 1996 to 2008. Ms. Johnson is an attorney, certified public accountant and a certified managerial accountant. | | Asset Allocation Trust |
David F. Larcker (Born 1950) | | Trustee, since 2009 | | James Irvin Miller Professor of Accounting at the Graduate School of Business, Stanford University, Director of the Corporate Governance Research Initiative and Senior Faculty of The Rock Center for Corporate Governance since 2006. From 2005 to 2008, Professor of Accounting at the Graduate School of Business, Stanford University. Prior thereto, Ernst & Young Professor of Accounting at The Wharton School, University of Pennsylvania from 1985 to 2005. | | Asset Allocation Trust |
| | | | | | |
| Other information (unaudited) | | Wells Fargo 100% Treasury Money Market Fund | | | 23 | |
| | | | | | |
Name and year of birth | | Position held and length of service* | | Principal occupations during past five years or longer | | Current other public company or investment company directorships |
Olivia S. Mitchell (Born 1953) | | Trustee, since 2006 | | International Foundation of Employee Benefit Plans Professor, Wharton School of the University of Pennsylvania since 1993. Director of Wharton’s Pension Research Council and Boettner Center on Pensions & Retirement Research, and Research Associate at the National Bureau of Economic Research. Previously, Cornell University Professor from 1978 to 1993. | | Asset Allocation Trust |
Timothy J. Penny (Born 1951) | | Trustee, since 1996 | | President and Chief Executive Officer of Southern Minnesota Initiative Foundation, a non-profit organization, since 2007 and Senior Fellow at the Humphrey Institute Policy Forum at the University of Minnesota since 1995. Member of the Board of Trustees of NorthStar Education Finance, Inc., a non-profit organization, since 2007. | | Asset Allocation Trust |
Michael S. Scofield (Born 1943) | | Trustee, since 2010 | | Served on the Investment Company Institute’s Board of Governors and Executive Committee from 2008-2011 as well the Governing Council of the Independent Directors Council from 2006-2011 and the Independent Directors Council Executive Committee from 2008-2011. Chairman of the IDC from 2008-2010. Institutional Investor (Fund Directions) Trustee of Year in 2007. Trustee of the Evergreen Funds complex (and its predecessors) from 1984 to 2010. Chairman of the Evergreen Funds from 2000-2010. Former Trustee of the Mentor Funds. Retired Attorney, Law Offices of Michael S. Scofield. | | Asset Allocation Trust |
| * | Length of service dates reflect the Trustee’s commencement of service with the Trust’s predecessor entities, where applicable. |
Officers
| | | | | | |
Name and year of birth | | Position held and length of service | | Principal occupations during past five years or longer | | |
Karla M. Rabusch
(Born 1959) | | President, since 2003 | | Executive Vice President of Wells Fargo Bank, N.A. and President of Wells Fargo Funds Management, LLC since 2003. | | |
Nancy Wiser1
(Born 1967) | | Treasurer, since 2012 | | Executive Vice President of Wells Fargo Funds Management, LLC since 2011. Chief Operating Officer and Chief Compliance Officer at LightBox Capital Management LLC, from 2008 to 2011. | | |
C. David Messman
(Born 1960) | | Secretary, since 2000; Chief Legal Officer, since 2003 | | Senior Vice President and Secretary of Wells Fargo Funds Management, LLC since 2001. Assistant General Counsel of Wells Fargo Bank, N.A. since 2013 and Vice President and Managing Counsel of Wells Fargo Bank, N.A. from 1996 to 2013. | | |
Michael Whitaker (Born 1967) | | Chief Compliance Officer, since 2016* | | Executive Vice President of Wells Fargo Funds Management, LLC since 2016. Chief Compliance Officer of Fidelity’s Fixed Income Funds and Asset Allocation Funds from 2008 to 2016, Compliance Officer of FMR Co., Inc. from 2014 to 2016, Fidelity Investments Money Management, Inc. from 2014 to 2016, Fidelity Investments from 2007 to 2016. | | |
David Berardi (Born 1975) | | Assistant Treasurer, since 2009 | | Vice President of Wells Fargo Funds Management, LLC since 2009. Vice President of Evergreen Investment Management Company, LLC from 2008 to 2010. Manager of Fund Reporting and Control for Evergreen Investment Management Company, LLC from 2004 to 2010. | | |
Jeremy DePalma1 (Born 1974) | | Assistant Treasurer, since 2009 | | Senior Vice President of Wells Fargo Funds Management, LLC since 2009. Senior Vice President of Evergreen Investment Management Company, LLC from 2008 to 2010 and head of the Fund Reporting and Control Team within Fund Administration from 2005 to 2010. | | |
| 1 | Nancy Wiser acts as Treasurer of 71 funds in the Fund Complex. Jeremy DePalma acts as Treasurer of 68 funds and Assistant Treasurer of 71 funds in the Fund Complex. |
| 2 | The Statement of Additional Information includes additional information about the Trustees and is available, without charge, upon request, by calling 1-800-222-8222 or by visiting the website at wellsfargofunds.com. |
| * | Michael Whitaker became Chief Compliance Officer effective May 16, 2016. |
| | | | |
| 24 | | Wells Fargo 100% Treasury Money Market Fund | | Other information (unaudited) |
BOARD CONSIDERATION OF INVESTMENT MANAGEMENT AND SUB-ADVISORY AGREEMENTS:
Under the Investment Company Act of 1940 (the “1940 Act”), the Board of Trustees (the “Board”) of Wells Fargo Funds Trust (the “Trust”) must determine annually whether to approve the continuation of the Trust’s investment management and sub-advisory agreements. In this regard, at an in-person meeting held on May 24-25, 2016 (the “Meeting”), the Board, all the members of which have no direct or indirect interest in the investment management and sub-advisory agreements and are not “interested persons” of the Trust, as defined in the 1940 Act (the “Independent Trustees”), reviewed and approved for Wells Fargo 100% Treasury Money Market Fund (the “Fund”): (i) an investment management agreement (the “Management Agreement”) with Wells Fargo Funds Management, LLC (“Funds Management”); and (ii) an investment sub-advisory agreement (the “Sub-Advisory Agreement”) with Wells Capital Management Incorporated (the “Sub-Adviser”), an affiliate of Funds Management. The Management Agreement and the Sub-Advisory Agreement are collectively referred to as the “Advisory Agreements.”
At the Meeting, the Board considered the factors and reached the conclusions described below relating to the selection of Funds Management and the Sub-Adviser and the approval of the Advisory Agreements. Prior to the Meeting, including at an in-person meeting in April 2016, the Trustees conferred extensively among themselves and with representatives of Funds Management about these matters. Also, the Board has adopted a team-based approach, with each team consisting of a sub-set of Trustees, to assist the full Board in the discharge of its duties in reviewing performance and other matters throughout the year. The Independent Trustees were assisted in their evaluation of the Advisory Agreements by independent legal counsel, from whom they received separate legal advice and with whom they met separately.
In providing information to the Board, Funds Management and the Sub-Adviser were guided by a detailed set of requests for information submitted to them by independent legal counsel on behalf of the Independent Trustees at the start of the Board’s annual contract renewal process earlier in 2016. In considering and approving the Advisory Agreements, the Trustees considered the information they believed relevant, including but not limited to the information discussed below. The Board considered not only the specific information presented in connection with the Meeting, but also the knowledge gained over time through interaction with Funds Management and the Sub-Adviser about various topics. In this regard, the Board reviewed reports of Funds Management at each of its quarterly meetings, which included, among other things, portfolio reviews and performance reports. In addition, the Board and the teams mentioned above confer with portfolio managers at various times throughout the year. The Board did not identify any particular information or consideration that was all-important or controlling, and each individual Trustee may have attributed different weights to various factors.
After its deliberations, the Board unanimously approved the continuation of the Advisory Agreements for a one-year term and determined that the compensation payable to Funds Management and the Sub-Adviser under each of the Advisory Agreements was reasonable. The Board considered the approval of the Advisory Agreements for the Fund as part of its consideration of agreements for funds across the complex, but its approvals were made on a fund-by-fund basis. The following summarizes a number of important, but not necessarily all, factors considered by the Board in support of its approvals.
Nature, extent and quality of services
The Board received and considered various information regarding the nature, extent and quality of services provided to the Fund by Funds Management and the Sub-Adviser under the Advisory Agreements. This information included a description of the investment advisory services and Fund-level administrative services covered by the Management Agreement, as well as, among other things, a summary of the background and experience of senior management of Funds Management, and the qualifications, background, tenure and responsibilities of each of the portfolio managers primarily responsible for the day-to-day portfolio management of the Fund.
The Board evaluated the ability of Funds Management and the Sub-Adviser to attract and retain qualified investment professionals, including research, advisory and supervisory personnel. The Board further considered the compliance programs and compliance records of Funds Management and the Sub-Adviser. In addition, the Board took into account the full range of services provided to the Fund by Funds Management and its affiliates.
Fund performance and expenses
The Board considered the performance results for the Fund over various time periods ended December 31, 2015. The Board considered these results in comparison to the performance of funds in a universe that was determined by Broadridge Inc. (“Broadridge”) to be similar to the Fund (the “Universe”), and in comparison to other comparative data. Broadridge is an independent provider of investment company data. The Board received a description of the methodology used by Broadridge to select the mutual funds in the performance Universe. The Board noted that the
| | | | | | |
| Other information (unaudited) | | Wells Fargo 100% Treasury Money Market Fund | | | 25 | |
performance of the Fund (Service Class) was higher than or in range of the average performance of the Universe for all periods under review. The Board noted that the Fund experienced a portfolio manager change in 2014.
The Board also received and considered information regarding the Fund’s net operating expense ratios and their various components, including actual management fees, custodian and other non-management fees, and Rule 12b-1 and non-Rule 12b-1 shareholder service fees. The Board considered these ratios in comparison to the median ratios of funds in class-specific expense groups that were determined by Broadridge to be similar to the Fund (the “Groups”). The Board received a description of the methodology used by Broadridge to select the mutual funds in the expense Groups and an explanation of how funds comprising expense groups and their expense ratios may vary from year-to-year. Based on the Broadridge reports, the Board noted that the net operating expense ratios of the Fund were equal to or in range of the median net operating expense ratios of the expense Groups.
The Board took into account the Fund performance and expense information provided to it among the factors considered in deciding to re-approve the Advisory Agreements.
Investment management and sub-advisory fee rates
The Board reviewed and considered the contractual fee rates payable by the Fund to Funds Management under the Management Agreement, as well as the contractual fee rates payable by the Fund to Funds Management for class-level administrative services under a Class-Level Administration Agreement, which include class-level transfer agency and sub-transfer agency costs (collectively, the “Management Rates”). The Board also reviewed and considered the contractual investment sub-advisory fee rates that are payable by Funds Management to the Sub-Adviser for investment sub-advisory services.
Among other information reviewed by the Board was a comparison of the Fund’s Management Rates with the average contractual investment management fee rates of funds in the expense Groups at a common asset level as well as transfer agency costs of the funds in the expense Groups. The Board noted that the Management Rates of the Fund were higher than the sum of these average rates for the Fund’s expense Groups for all share classes.
The Board also received and considered information about the portion of the total management fee that was retained by Funds Management after payment of the fee to the Sub-Adviser for sub-advisory services. In assessing the reasonableness of this amount, the Board received and evaluated information about the nature and extent of responsibilities retained and risks assumed by Funds Management and not delegated to or assumed by the Sub-Adviser, and about Funds Management’s on-going oversight services. However, given the affiliation between Funds Management and the Sub-Adviser, the Board ascribed limited relevance to the allocation of fees between them.
The Board also received and considered information about the nature and extent of services offered and fee rates charged by Funds Management and the Sub-Adviser to other types of clients with investment strategies similar to those of the Fund. In this regard, the Board received information about the significantly greater scope of services, and compliance, reporting and other legal burdens and risks of managing mutual funds compared with those associated with managing assets of non-mutual fund clients such as collective funds or institutional separate accounts.
Based on its consideration of the factors and information it deemed relevant, including those described here, the Board determined that the compensation payable to Funds Management under the Management Agreement and to the Sub-Adviser under the Sub-Advisory Agreement was reasonable, in light of the services covered by the Advisory Agreements.
Profitability
The Board received and considered information concerning the profitability of Funds Management, as well as the profitability of Wells Fargo as a whole, from providing services to the Fund and the fund family as a whole. The Board also received and considered information concerning the profitability of the Sub-Adviser from providing services to the fund family as a whole, noting that the Sub-Adviser’s profitability information with respect to providing services to the Fund was subsumed in the Wells Fargo and Funds Management profitability analysis.
Funds Management reported on the methodologies and estimates used in calculating profitability. Among other things, the Board noted that the levels of profitability reported on a fund-by-fund basis varied widely, depending on factors such as the size and type of fund. Based on its review, the Board did not deem the profits reported by Funds Management or Wells Fargo from its services to the Fund to be at a level that would prevent it from approving the continuation of the Advisory Agreements.
| | | | |
| 26 | | Wells Fargo 100% Treasury Money Market Fund | | Other information (unaudited) |
Economies of scale
With respect to possible economies of scale, the Board noted the existence of breakpoints in the Fund’s management fee structure, which operate generally to reduce the Fund’s expense ratios as the Fund grows in size. It considered that, for a small fund or a fund that shrinks in size, breakpoints conversely can result in higher fee levels. The Board also considered that fee waiver and expense reimbursement arrangements and competitive fee rates at the outset are means of sharing potential economies of scale with shareholders of the Fund and the fund family as a whole. The Board considered Funds Management’s view that any analyses of potential economies of scale in managing a particular fund are inherently limited in light of the joint and common costs and investments that Funds Management incurs across the fund family as a whole.
The Board concluded that the Fund’s fee and expense arrangements, including contractual breakpoints, constituted a reasonable approach to sharing potential economies of scale with the Fund and its shareholders.
Other benefits to Funds Management and the Sub-Adviser
The Board received and considered information regarding potential “fall-out” or ancillary benefits received by Funds Management and its affiliates, including the Sub-Adviser, as a result of their relationships with the Fund. Ancillary benefits could include, among others, benefits directly attributable to other relationships with the Fund and benefits potentially derived from an increase in Funds Management’s and the Sub-Adviser’s business as a result of their relationships with the Fund. The Board noted that various affiliates of Funds Management may receive distribution-related fees, shareholder servicing payments and sub-transfer agency fees in respect of shares sold or held through them and services provided.
The Board also reviewed information about soft dollar credits earned and utilized by the Sub-Adviser, fees earned by Funds Management and the Sub-Adviser from managing a private investment vehicle for the fund family’s securities lending collateral and commissions earned by an affiliated broker from portfolio transactions.
Based on its consideration of the factors and information it deemed relevant, including those described here, the Board did not find that any ancillary benefits received by Funds Management and its affiliates, including the Sub-Adviser, were unreasonable.
Conclusion
At the Meeting, after considering the above-described factors and based on its deliberations and its evaluation of the information described above, the Board unanimously approved the continuation of the Advisory Agreements for a one-year term and determined that the compensation payable to Funds Management and the Sub-Adviser under each of the Advisory Agreements was reasonable.
| | | | | | |
| List of abbreviations | | Wells Fargo 100% Treasury Money Market Fund | | | 27 | |
The following is a list of common abbreviations for terms and entities that may have appeared in this report.
| ACA | — ACA Financial Guaranty Corporation |
| ADR | — American depositary receipt |
| ADS | — American depositary shares |
| AGC | — Assured Guaranty Corporation |
| AGM | — Assured Guaranty Municipal |
| Ambac | — Ambac Financial Group Incorporated |
| AMT | — Alternative minimum tax |
| BAN | — Bond anticipation notes |
| BHAC | — Berkshire Hathaway Assurance Corporation |
| CAB | — Capital appreciation bond |
| CCAB | — Convertible capital appreciation bond |
| CDA | — Community Development Authority |
| CDO | — Collateralized debt obligation |
| DRIVER | — Derivative inverse tax-exempt receipts |
| DW&P | — Department of Water & Power |
| DWR | — Department of Water Resources |
| ECFA | — Educational & Cultural Facilities Authority |
| EDA | — Economic Development Authority |
| EDFA | — Economic Development Finance Authority |
| ETF | — Exchange-traded fund |
| FDIC | — Federal Deposit Insurance Corporation |
| FFCB | — Federal Farm Credit Banks |
| FGIC | — Financial Guaranty Insurance Corporation |
| FHA | — Federal Housing Administration |
| FHLB | — Federal Home Loan Bank |
| FHLMC | — Federal Home Loan Mortgage Corporation |
| FICO | — The Financing Corporation |
| FNMA | — Federal National Mortgage Association |
| GDR | — Global depositary receipt |
| GNMA | — Government National Mortgage Association |
| HCFR | — Healthcare facilities revenue |
| HEFA | — Health & Educational Facilities Authority |
| HEFAR | — Higher education facilities authority revenue |
| HFA | — Housing Finance Authority |
| HFFA | — Health Facilities Financing Authority |
| HUD | — Department of Housing and Urban Development |
| IDA | — Industrial Development Authority |
| IDAG | — Industrial Development Agency |
| KRW | — Republic of Korea won |
| LIBOR | — London Interbank Offered Rate |
| LIFER | — Long Inverse Floating Exempt Receipts |
| LLC | — Limited liability company |
| LLLP | — Limited liability limited partnership |
| LLP | — Limited liability partnership |
| MBIA | — Municipal Bond Insurance Association |
| MFHR | — Multifamily housing revenue |
| MSTR | — Municipal securities trust receipts |
| MUD | — Municipal Utility District |
| National | — National Public Finance Guarantee Corporation |
| PCFA | — Pollution Control Financing Authority |
| PCL | — Public Company Limited |
| PCR | — Pollution control revenue |
| PFA | — Public Finance Authority |
| PFFA | — Public Facilities Financing Authority |
| PFOTER | — Puttable floating option tax-exempt receipts |
| plc | — Public limited company |
| PUTTER | — Puttable tax-exempt receipts |
| R&D | — Research & development |
| Radian | — Radian Asset Assurance |
| RAN | — Revenue anticipation notes |
| RDA | — Redevelopment Authority |
| RDFA | — Redevelopment Finance Authority |
| REIT | — Real estate investment trust |
| ROC | — Reset option certificates |
| SAVRS | — Select auction variable rate securities |
| SBA | — Small Business Authority |
| SDR | — Swedish depositary receipt |
| SFHR | — Single-family housing revenue |
| SFMR | — Single-family mortgage revenue |
| SPA | — Standby purchase agreement |
| SPDR | — Standard & Poor’s Depositary Receipts |
| SPEAR | — Short Puttable Exempt Adjustable Receipts |
| STRIPS | — Separate trading of registered interest and |
| TAN | — Tax anticipation notes |
| TIPS | — Treasury inflation-protected securities |
| TRAN | — Tax revenue anticipation notes |
| TTFA | — Transportation Trust Fund Authority |
| TVA | — Tennessee Valley Authority |
This page is intentionally left blank.

For more information
More information about Wells Fargo Funds is available free upon request. To obtain literature, please write, email, visit the Fund’s website, or call:
Wells Fargo Funds
P.O. Box 8266
Boston, MA 02266-8266
Email: fundservice@wellsfargo.com
Website: wellsfargofunds.com
Individual investors: 1-800-222-8222
Retail investment professionals: 1-888-877-9275
Institutional investment professionals: 1-866-765-0778
This report and the financial statements contained herein are submitted for the general information of the shareholders of the Fund. If this report is used for promotional purposes, distribution of the report must be accompanied or preceded by a current prospectus. Before investing, please consider the investment objectives, risks, charges, and expenses of the investment. For a current prospectus and, if available, a summary prospectus, containing this information, call 1-800-222-8222 or visit the Fund’s website at wellsfargofunds.com. Read the prospectus carefully before you invest or send money.
Wells Fargo Asset Management (WFAM) is a trade name used by the asset management businesses of Wells Fargo & Company. Wells Fargo Funds Management, LLC, a wholly owned subsidiary of Wells Fargo & Company, provides investment advisory and administrative services for Wells Fargo Funds. Other affiliates of Wells Fargo & Company provide subadvisory and other services for the funds. The funds are distributed by Wells Fargo Funds Distributor, LLC, Member FINRA, an affiliate of Wells Fargo & Company.
NOT FDIC INSURED ¡ NO BANK GUARANTEE ¡ MAY LOSE VALUE
© 2016 Wells Fargo Funds Management, LLC. All rights reserved.
| | |
 | | 245330 09-16 SA300/SAR300 07-16 |
Semi-Annual Report
July 31, 2016

Government Money Market Funds

| n | | Wells Fargo Treasury Plus Money Market Fund |

Reduce clutter. Save trees.
Sign up for electronic delivery of prospectuses and shareholder reports at wellsfargo.com/advantagedelivery
Contents
The views expressed and any forward-looking statements are as of July 31, 2016, unless otherwise noted, and are those of the Fund managers and/or Wells Fargo Funds Management, LLC. Discussions of individual securities, or the markets generally, or any Wells Fargo Fund are not intended as individual recommendations. Future events or results may vary significantly from those expressed in any forward-looking statements. The views expressed are subject to change at any time in response to changing circumstances in the market. Wells Fargo Funds Management, LLC and the Fund disclaim any obligation to publicly update or revise any views expressed or forward-looking statements.
NOT FDIC INSURED ¡ NO BANK GUARANTEE ¡ MAY LOSE VALUE
| | | | |
| 2 | | Wells Fargo Treasury Plus Money Market Fund | | Letter to shareholders (unaudited) |

Karla M. Rabusch
President
Wells Fargo Funds
We do not anticipate broad changes to the way we manage our money market funds at this time in order to meet the new rules because we have always emphasized stability of principal and liquidity.
Dear Valued Shareholder:
We are pleased to offer you this semi-annual report for the Wells Fargo Treasury Plus Money Market Fund for the six-month period that ended July 31, 2016. The period was marked by preparation for the new amendments to Rule 2a-7 of the Investment Company Act of 1940 (Rule 2a-7) by the U.S. Securities and Exchange Commission. Meanwhile, the U.S. Federal Reserve (Fed) kept the federal funds target rate between 0.25% and 0.50%.
We are preparing to implement the new money market fund regulations.
The amendments to Rule 2a-7, which governs money market funds, are scheduled to be fully implemented by October 2016. To recap, U.S. Treasury and government money market funds will continue to operate much as they do today, with stable $1.00 net asset values (NAVs). Meanwhile, tax-exempt and prime funds will experience more changes. For starters, these types of funds must separate retail investors, such as individuals, and institutional investors. Second, money market fund boards of directors will have discretion to impose either a liquidity fee of up to 2% on shareholder redemptions or a temporary suspension of redemptions (gate) if a fund’s weekly liquid assets fall below 30% of its total assets and the board determines that the fee or gate is in the best interest of the fund’s shareholders.
| | n | | Retail investors will continue to transact at a stable $1.00 NAV but may be subject to liquidity fees and redemption gates. | |
| | n | | Institutional prime and tax-exempt money market funds will transact at a floating, market-based NAV and may be subject to liquidity fees and redemption gates under special circumstances. Once floating NAVs are implemented, daily share prices will fluctuate along with changes, if any, in the market-based value of the underlying portfolio securities. Our Product Alert titled Wells Fargo Announces Effective Dates for Changes to Certain Money Market Funds featured the intraday price times we will use to continue providing same-day settlement and liquidity to our shareholders. | |
| | n | | Additional requirements included increased disclosure and reporting of fund statistics, such as percentage of liquid assets, shareholder flows, and market-based NAVs. In addition, the new regulations also included tighter diversification requirements and enhanced stress-testing measures. | |
| | n | | We will continue to communicate any changes to our money markets funds with our shareholders. Specifically, Product Alerts can be found at our website: wellsfargofunds.com. Click on Product Information and find them under the Product Alerts tab. | |
While there will be many operational changes ahead, we do not anticipate broad changes to the way we manage our money market funds at this time in order to meet the new rules because we have always emphasized stability of principal and liquidity.
Short-term rates remained steady but low.
The Fed kept the federal funds rate steady. On the growth side of its mandate, U.S. economic activity appeared to maintain a modest pace. Global concerns continued to confront the Fed as it tried to assess future conditions in the U.S. While China’s growth and its markets stabilized post first-quarter downdrafts, it continued to “face considerable challenges,” per Fed Chair Janet Yellen in her
| | | | | | |
| Letter to shareholders (unaudited) | | Wells Fargo Treasury Plus Money Market Fund | | | 3 | |
monetary policy report to Congress. Further, although commodity prices rebounded from first-quarter lows, other worries remained. The strong dollar, which could hamper manufacturing and exports, is one factor. Another is potential fallout from Brexit, the referendum whereby the U.K. voted to leave the European Union. With growth and inflation low, Chair Yellen has argued in her monetary policy report that there is little room to cut rates further but plenty of scope to raise rates if inflation picks up too quickly.
With regard to Brexit, traditional risk assets—such as equities and foreign exchange—experienced volatility and U.S. Treasury securities benefited from a flight to quality. Money markets, however, were relatively immune to this volatility, with both credit spreads and liquidity little changed.
Don’t let short-term uncertainty derail long-term investment goals.
Periods of uncertainty can present challenges, but experience has taught us that maintaining long-term investment goals can be an effective way to plan for the future. To help you create a sound strategy based on your personal goals and risk tolerance, Wells Fargo Funds offers more than 100 mutual funds spanning a wide range of asset classes and investment styles. Although diversification cannot guarantee an investment profit or prevent losses, we believe it can be an effective way to manage investment risk and potentially smooth out overall portfolio performance. We encourage investors to know their investments and to understand that appropriate levels of risk-taking may unlock opportunities.
Thank you for choosing to invest in Wells Fargo Funds. We appreciate your confidence in us and remain committed to helping you meet your financial needs.
Sincerely,

Karla M. Rabusch
President
Wells Fargo Funds
Periods of uncertainty can present challenges, but experience has taught us that maintaining long-term investment goals can be an effective way to plan for the future.
For further information about your Fund, contact your investment professional, visit our website at wellsfargofunds.com, or call us directly at 1-800-222-8222. We are available 24 hours a day, 7 days a week.
| | | | |
| 4 | | Wells Fargo Treasury Plus Money Market Fund | | Performance highlights (unaudited) |
Investment objective
The Fund seeks current income, while preserving capital and liquidity.
Manager
Wells Fargo Funds Management, LLC
Subadviser
Wells Capital Management Incorporated
Portfolio managers
Michael C. Bird, CFA®
Jeffrey L. Weaver, CFA®
Laurie White
Average annual total returns (%) as of July 31, 20161
| | | | | | | | | | | | | | | | | | | | | | |
| | | | | | | | Expense ratios2 (%) | |
| | | | | 1 year | | | 5 year | | | 10 year | | | Gross | | | Net3 | |
| Class A (PIVXX) | | 7-28-2003 | | | 0.01 | | | | 0.01 | | | | 0.75 | | | | 0.62 | | | | 0.62 | |
| Administrator Class (WTPXX) | | 3-31-2008 | | | 0.02 | | | | 0.01 | | | | 0.81 | | | | 0.35 | | | | 0.35 | |
| Institutional Class (PISXX) | | 8-11-1995 | | | 0.09 | | | | 0.03 | | | | 0.86 | | | | 0.23 | | | | 0.20 | |
| Service Class (PRVXX) | | 10-1-1985 | | | 0.01 | | | | 0.01 | | | | 0.78 | | | | 0.52 | | | | 0.45 | |
| Sweep Class | | 6-30-2010 | | | 0.01 | | | | 0.01 | | | | 0.75 | | | | 0.97 | | | | 0.97 | |
Yield summary (%) as of July 31, 20163
| | | | | | | | | | | | | | | | | | |
| | | Class A | | Administrator
Class | | | Institutional
Class | | | Service
Class | | | Sweep
Class | |
| 7-day current yield | | 0.01 | | | 0.04 | | | | 0.18 | | | | 0.01 | | | | 0.01 | |
| 7-day compound yield | | 0.01 | | | 0.04 | | | | 0.18 | | | | 0.01 | | | | 0.01 | |
| 30-day simple yield | | 0.01 | | | 0.04 | | | | 0.19 | | | | 0.01 | | | | 0.01 | |
| 30-day compound yield | | 0.01 | | | 0.04 | | | | 0.19 | | | | 0.01 | | | | 0.01 | |
Figures quoted represent past performance, which is no guarantee of future results, and do not reflect taxes that a shareholder may pay on fund distributions or the redemption of fund shares. Investment returns will fluctuate. The Fund’s yield figures more closely reflect the current earnings of the Fund than the total return figures. Current performance may be lower or higher than the performance data quoted, which assumes the reinvestment of dividends and capital gains. Current month-end performance is available on the Fund’s website, wellsfargofunds.com.
Each class is sold without a front-end sales charge or a contingent deferred sales charge.
An investment in a money market fund is not insured or guaranteed by the Federal Deposit Insurance Corporation or any other government agency. Although the Fund seeks to preserve the value of your investment at $1.00 per share, it is possible to lose money by investing in a money market fund. The U.S. government guarantee applies to certain underlying securities and not to shares of the Fund.
Please see footnotes on page 5.
| | | | | | |
| Performance highlights (unaudited) | | Wells Fargo Treasury Plus Money Market Fund | | | 5 | |
|
| Portfolio composition as of July 31, 20164 |
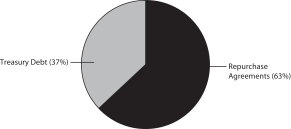 |
|
| Effective maturity distribution as of July 31, 20164 |
|
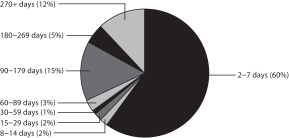 |
| | | | |
| Weighted average maturity as of July 31, 20165 | |
46 days | | | | |
| | | | |
| Weighted average life as of July 31, 20166 | |
89 days | | | | |
| 1 | Historical performance shown for Administrator Class shares prior to their inception reflects the performance of Institutional Class shares, adjusted to reflect the higher expenses applicable to Administrator Class shares. Historical performance shown for Sweep Class shares prior to their inception reflects the performance of Class A shares, and has not been adjusted to include the higher expenses applicable to Sweep Class shares. If these expenses had been adjusted, returns would be lower. |
| 2 | Reflects the expense ratios as stated in the most recent prospectuses. The expense ratios shown are subject to change and may differ from the annualized expense ratios shown in the financial highlights of this report. |
| 3 | The manager has contractually committed through May 31, 2017, to waive fees and/or reimburse expenses to the extent necessary to cap the Fund’s Total Annual Fund Operating Expenses After Fee Waiver at 0.65% for Class A, 0.35% for Administrator Class, 0.20% for Institutional Class, 0.45% for Service Class, and 1.00% for Sweep Class. After this time, the cap may be increased or the commitment to maintain the cap may be terminated only with the approval of the Board of Trustees. Brokerage commissions, stamp duty fees, interest, taxes, acquired fund fees and expenses, and extraordinary expenses are excluded from the cap. Without this cap, the Fund’s returns would have been lower. Without waived fees and/or reimbursed expenses, the Fund’s 7-day current yield would have been (0.23)%, 0.04%, 0.16%, (0.13)%, and (0.58)% for Class A, Administrator Class, Institutional Class, Service Class, and Sweep Class, respectively. |
| 4 | Amounts are calculated based on the total investments of the Fund. These amounts are subject to change and may have changed since the date specified. |
| 5 | Weighted Average Maturity (WAM): WAM is an average of the effective maturities of all securities held in the portfolio, weighted by each security’s percentage of total investments. The maturity of a portfolio security is the period remaining until the date on which the principal amount is unconditionally required to be paid, or in the case of a security called for redemption, the date on which the redemption payment is unconditionally required to be made. WAM calculations allow for the maturities of certain securities with demand features or periodic interest rate resets to be shortened. WAM is a way to measure a fund’s sensitivity to potential interest rate changes. Rule 2a-7 under the Investment Company Act of 1940 requires money market funds to maintain a WAM of 60 calendar days or less. WAM is subject to change and may have changed since the date specified. |
| 6 | Weighted Average Life (WAL): WAL is an average of the final maturities of all securities held in the portfolio, weighted by their percentage of total investments. The maturity of a portfolio security is the period remaining until the date on which the principal amount is unconditionally required to be paid, or in the case of a security called for redemption, the date on which the redemption payment is unconditionally required to be made. In contrast to WAM, the calculation of WAL allows for the maturities of certain securities with demand features to be shortened, but not the periodic interest rate resets. WAL is a way to measure a fund’s potential sensitivity to credit spread changes. Rule 2a-7 under the Investment Company Act of 1940 requires money market funds to maintain a WAL of 120 calendar days or less. WAL is subject to change and may have changed since the date specified. |
| | | | |
| 6 | | Wells Fargo Treasury Plus Money Market Fund | | Fund expenses (unaudited) |
As a shareholder of the Fund, you incur ongoing costs, including management fees, distribution (12b-1) and/or shareholder servicing fees, and other Fund expenses. This example is intended to help you understand your ongoing costs (in dollars) of investing in the Fund and to compare these costs with the ongoing costs of investing in other mutual funds.
The example is based on an investment of $1,000 invested at the beginning of the six-month period and held for the entire period from February 1, 2016 to July 31, 2016.
Actual expenses
The “Actual” line of the table below provides information about actual account values and actual expenses. You may use the information in this line, together with the amount you invested, to estimate the expenses that you paid over the period. Simply divide your account value by $1,000 (for example, an $8,600 account value divided by $1,000 = 8.6), then multiply the result by the number in the “Actual” line under the heading entitled “Expenses paid during period” for your applicable class of shares to estimate the expenses you paid on your account during this period.
Hypothetical example for comparison purposes
The “Hypothetical” line of the table below provides information about hypothetical account values and hypothetical expenses based on the Fund’s actual expense ratio and an assumed rate of return of 5% per year before expenses, which is not the Fund’s actual return. The hypothetical account values and expenses may not be used to estimate the actual ending account balance or expenses you paid for the period. You may use this information to compare the ongoing costs of investing in the Fund and other funds. To do so, compare this 5% hypothetical example with the 5% hypothetical examples that appear in the shareholder reports of the other funds.
Please note that the expenses shown in the table are meant to highlight your ongoing costs only and do not reflect any transactional costs, such as sales charges (loads) and contingent deferred sales charges. Therefore, the “Hypothetical” line of the table is useful in comparing ongoing costs only and will not help you determine the relative total costs of owning different funds. In addition, if these transactional costs were included, your cost would have been higher.
| | | | | | | | | | | | | | | | |
| | | Beginning
account value
2-1-2016 | | | Ending
account value
7-31-2016 | | | Expenses
paid during
the period¹ | | | Annualized net
expense ratio | |
Class A | | | | | | | | | | | | | | | | |
Actual | | $ | 1,000.00 | | | $ | 1,000.05 | | | $ | 1.70 | | | | 0.34 | % |
Hypothetical (5% return before expenses) | | $ | 1,000.00 | | | $ | 1,023.24 | | | $ | 1.72 | | | | 0.34 | % |
Administrator Class | | | | | | | | | | | | | | | | |
Actual | | $ | 1,000.00 | | | $ | 1,000.11 | | | $ | 1.65 | | | | 0.33 | % |
Hypothetical (5% return before expenses) | | $ | 1,000.00 | | | $ | 1,023.29 | | | $ | 1.66 | | | | 0.33 | % |
Institutional Class | | | | | | | | | | | | | | | | |
Actual | | $ | 1,000.00 | | | $ | 1,000.76 | | | $ | 1.00 | | | | 0.20 | % |
Hypothetical (5% return before expenses) | | $ | 1,000.00 | | | $ | 1,023.93 | | | $ | 1.01 | | | | 0.20 | % |
Service Class | | | | | | | | | | | | | | | | |
Actual | | $ | 1,000.00 | | | $ | 1,000.05 | | | $ | 1.70 | | | | 0.34 | % |
Hypothetical (5% return before expenses) | | $ | 1,000.00 | | | $ | 1,023.24 | | | $ | 1.72 | | | | 0.34 | % |
Sweep Class | | | | | | | | | | | | | | | | |
Actual | | $ | 1,000.00 | | | $ | 1,000.05 | | | $ | 1.70 | | | | 0.34 | % |
Hypothetical (5% return before expenses) | | $ | 1,000.00 | | | $ | 1,023.24 | | | $ | 1.72 | | | | 0.34 | % |
| 1 | Expenses paid is equal to the annualized net expense ratio of each class multiplied by the average account value over the period, multiplied by the number of days in the most recent fiscal half-year divided by the number of days in the fiscal year (to reflect the one-half-year period). |
| | | | | | |
| Portfolio of investments—July 31, 2016 (unaudited) | | Wells Fargo Treasury Plus Money Market Fund | | | 7 | |
| | | | | | | | | | | | | | | | |
| Security name | | Interest rate | | | Maturity date | | | Principal | | | Value | |
| | | | |
Repurchase Agreements ^^: 62.03% | | | | | | | | | | | | | | | | |
Bank of Montreal, dated 7-29-2016, maturity value $100,002,500 (1) | | | 0.30 | % | | | 8-1-2016 | | | $ | 100,000,000 | | | $ | 100,000,000 | |
Bank of Nova Scotia NY, dated 7-29-2016, maturity value $275,007,563 (2) | | | 0.33 | | | | 8-1-2016 | | | | 275,000,000 | | | | 275,000,000 | |
Barclays Capital Incorporated, dated 7-29-2016, maturity value $250,007,083 (3) | | | 0.34 | | | | 8-1-2016 | | | | 250,000,000 | | | | 250,000,000 | |
BNP Paribas, dated 7-29-2016, maturity value $2,101,907,801 (4) | | | 0.33 | | | | 8-1-2016 | | | | 2,101,850,000 | | | | 2,101,850,000 | |
Citigroup Global Markets Incorporated, dated 7-28-2016, maturity value $250,015,069 (5) | | | 0.31 | | | | 8-4-2016 | | | | 250,000,000 | | | | 250,000,000 | |
Credit Agricole, dated 7-27-2016, maturity value $500,031,111 (6) | | | 0.32 | | | | 8-3-2016 | | | | 500,000,000 | | | | 500,000,000 | |
Credit Agricole, dated 7-29-2016, maturity value $1,200,032,000 (7) | | | 0.32 | | | | 8-1-2016 | | | | 1,200,000,000 | | | | 1,200,000,000 | |
Credit Suisse Securities USA, dated 7-29-2016, maturity value $500,014,583 (8) | | | 0.35 | | | | 8-1-2016 | | | | 500,000,000 | | | | 500,000,000 | |
Deutsche Bank Securities, dated 7-29-2016, maturity value $200,006,333 (9) | | | 0.38 | | | | 8-1-2016 | | | | 200,000,000 | | | | 200,000,000 | |
Federal Reserve Bank of New York, dated 7-29-2016, maturity value $800,016,667 (10) | | | 0.25 | | | | 8-1-2016 | | | | 800,000,000 | | | | 800,000,000 | |
JPMorgan Securities, dated 7-1-2016, maturity value $550,156,292 (11)¢±§ | | | 0.33 | | | | 8-1-2016 | | | | 550,000,000 | | | | 550,000,000 | |
JPMorgan Securities, dated 7-29-2016, maturity value $625,017,188 (12) | | | 0.33 | | | | 8-1-2016 | | | | 625,000,000 | | | | 625,000,000 | |
Merrill Lynch Pierce Fenner Smith Incorporated, dated 7-29-2016, maturity value $125,003,438 (13) | | | 0.33 | | | | 8-1-2016 | | | | 125,000,000 | | | | 125,000,000 | |
Prudential, dated 7-29-2016, maturity value $461,213,192 (14) | | | 0.34 | | | | 8-1-2016 | | | | 461,200,125 | | | | 461,200,125 | |
RBC Capital Markets, dated 6-29-2016, maturity value $250,139,792 (15)¢±§ | | | 0.33 | | | | 8-29-2016 | | | | 250,000,000 | | | | 250,000,000 | |
Societe Generale NY, dated 7-11-2016, maturity value $250,079,653 (16)¢±§(i) | | | 0.37 | | | | 8-11-2016 | | | | 250,000,000 | | | | 250,000,000 | |
Societe Generale NY, dated 7-13-2016, maturity value $250,082,500 (17)¢±§(i) | | | 0.36 | | | | 8-15-2016 | | | | 250,000,000 | | | | 250,000,000 | |
Societe Generale NY, dated 7-27-2016, maturity value $100,006,222 (18) | | | 0.32 | | | | 8-3-2016 | | | | 100,000,000 | | | | 100,000,000 | |
Societe Generale NY, dated 7-29-2016, maturity value $250,006,875 (19) | | | 0.33 | | | | 8-1-2016 | | | | 250,000,000 | | | | 250,000,000 | |
Toronto Dominion Bank, dated 7-29-2016, maturity value $200,005,500 (20) | | | 0.33 | | | | 8-1-2016 | | | | 200,000,000 | | | | 200,000,000 | |
| | | | |
Total Repurchase Agreements (Cost $9,238,050,125) | | | | | | | | | | | | | | | 9,238,050,125 | |
| | | | | | | | | | | | | | | | |
| | | | |
Treasury Debt: 36.41% | | | | | | | | | | | | | | | | |
U.S. Treasury Bill (z) | | | 0.39 | | | | 11-10-2016 | | | | 50,000,000 | | | | 49,945,292 | |
U.S. Treasury Bill (z) | | | 0.43 | | | | 1-19-2017 | | | | 100,000,000 | | | | 99,794,800 | |
U.S. Treasury Bond | | | 4.63 | | | | 2-15-2017 | | | | 233,700,000 | | | | 238,861,174 | |
U.S. Treasury Bond | | | 7.50 | | | | 11-15-2016 | | | | 82,268,000 | | | | 83,937,111 | |
U.S. Treasury Bond | | | 8.75 | | | | 5-15-2017 | | | | 120,000,000 | | | | 127,747,087 | |
U.S. Treasury Note ±%% | | | 0.48 | | | | 7-31-2018 | | | | 70,000,000 | | | | 69,998,589 | |
U.S. Treasury Note ± | | | 0.49 | | | | 10-31-2017 | | | | 550,000,000 | | | | 549,657,415 | |
U.S. Treasury Note | | | 0.50 | | | | 9-30-2016 | | | | 100,000,000 | | | | 100,007,382 | |
U.S. Treasury Note | | | 0.50 | | | | 2-28-2017 | | | | 29,000,000 | | | | 28,984,724 | |
U.S. Treasury Note | | | 0.50 | | | | 4-30-2017 | | | | 130,000,000 | | | | 129,961,231 | |
U.S. Treasury Note ± | | | 0.51 | | | | 4-30-2018 | | | | 186,851,000 | | | | 186,875,298 | |
U.S. Treasury Note ± | | | 0.59 | | | | 1-31-2018 | | | | 400,000,000 | | | | 400,149,707 | |
U.S. Treasury Note | | | 0.63 | | | | 8-15-2016 | | | | 60,000,000 | | | | 60,005,208 | |
U.S. Treasury Note | | | 0.63 | | | | 10-15-2016 | | | | 320,000,000 | | | | 320,113,299 | |
U.S. Treasury Note | | | 0.63 | | | | 11-15-2016 | | | | 220,000,000 | | | | 220,094,545 | |
U.S. Treasury Note | | | 0.63 | | | | 12-15-2016 | | | | 100,000,000 | | | | 100,060,203 | |
U.S. Treasury Note | | | 0.63 | | | | 12-31-2016 | | | | 290,000,000 | | | | 290,161,216 | |
U.S. Treasury Note | | | 0.63 | | | | 2-15-2017 | | | | 130,000,000 | | | | 130,017,495 | |
U.S. Treasury Note | | | 0.63 | | | | 5-31-2017 | | | | 70,000,000 | | | | 70,038,716 | |
U.S. Treasury Note | | | 0.75 | | | | 3-15-2017 | | | | 100,000,000 | | | | 100,101,254 | |
U.S. Treasury Note | | | 0.88 | | | | 11-30-2016 | | | | 180,000,000 | | | | 180,262,438 | |
U.S. Treasury Note | | | 0.88 | | | | 12-31-2016 | | | | 120,000,000 | | | | 120,177,988 | |
U.S. Treasury Note | | | 0.88 | | | | 2-28-2017 | | | | 175,000,000 | | | | 175,336,673 | |
U.S. Treasury Note | | | 0.88 | | | | 4-30-2017 | | | | 220,000,000 | | | | 220,582,125 | |
The accompanying notes are an integral part of these financial statements.
| | | | |
| 8 | | Wells Fargo Treasury Plus Money Market Fund | | Portfolio of investments—July 31, 2016 (unaudited) |
| | | | | | | | | | | | | | | | |
| Security name | | Interest rate | | | Maturity date | | | Principal | | | Value | |
| | | | |
Treasury Debt (continued) | | | | | | | | | | | | | | | | |
U.S. Treasury Note ## | | | 0.88 | % | | | 5-15-2017 | | | $ | 80,000,000 | | | $ | 80,241,217 | |
U.S. Treasury Note | | | 1.00 | | | | 9-30-2016 | | | | 100,000,000 | | | | 100,100,661 | |
U.S. Treasury Note | | | 1.00 | | | | 10-31-2016 | | | | 150,000,000 | | | | 150,235,186 | |
U.S. Treasury Note | | | 1.00 | | | | 3-31-2017 | | | | 50,000,000 | | | | 50,133,126 | |
U.S. Treasury Note | | | 2.75 | | | | 11-30-2016 | | | | 387,000,000 | | | | 389,943,180 | |
U.S. Treasury Note | | | 2.75 | | | | 5-31-2017 | | | | 10,000,000 | | | | 10,173,504 | |
U.S. Treasury Note | | | 3.00 | | | | 8-31-2016 | | | | 50,000,000 | | | | 50,096,918 | |
U.S. Treasury Note | | | 3.13 | | | | 10-31-2016 | | | | 305,000,000 | | | | 307,050,949 | |
U.S. Treasury Note | | | 4.63 | | | | 11-15-2016 | | | | 229,000,000 | | | | 231,736,190 | |
| | | | |
Total Treasury Debt (Cost $5,422,581,901) | | | | | | | | | | | | | | | 5,422,581,901 | |
| | | | | | | | | | | | | | | | |
| | | | | | | | |
| Total investments in securities (Cost $14,660,632,026) * | | | 98.44 | % | | | 14,660,632,026 | |
Other assets and liabilities, net | | | 1.56 | | | | 232,015,771 | |
| | | | | | | | |
| Total net assets | | | 100.00 | % | | $ | 14,892,647,797 | |
| | | | | | | | |
| | (1) | U.S. government securities, 0.13% to 4.75%, 7-31-2019 to 11-15-2045, fair value including accrued interest is $102,000,051. |
| | (2) | U.S. government securities, 0.00% to 6.75%, 8-8-2016 to 5-15-2045, fair value including accrued interest is $280,500,000. |
| | (3) | U.S. government securities, 2.50% to 4.00%, 5-1-2027 to 9-1-2042, fair value including accrued interest is $255,000,069. |
| | (4) | U.S. government securities, 0.00% to 8.88%, 10-13-2016 to 11-15-2045, fair value including accrued interest is $2,143,893,791. |
| | (5) | U.S. government securities, 1.00% to 1.38%, 3-15-2018 to 1-31-2021, fair value including accrued interest is $255,000,048. |
| | (6) | U.S. government securities, 0.63% to 4.63%, 9-30-2016 to 2-15-2044, fair value including accrued interest is $510,000,118. |
| | (7) | U.S. government securities, 0.00% to 8.88%, 7-31-2016 to 2-15-2046, fair value including accrued interest is $1,224,000,093. |
| | (8) | U.S. government securities, 0.50% to 2.25%, 7-31-2017 to 10-31-2018, fair value including accrued interest is $510,000,111. |
| | (9) | U.S. government securities, 0.00% to 2.75%, 9-1-2016 to 2-15-2024, fair value including accrued interest is $204,000,008. |
| | (10) | U.S. government securities, 2.75% to 8.00%, 11-15-2021 to 2-15-2024, fair value including accrued interest is $800,016,672. |
| | (11) | U.S. government securities, 0.13% to 3.88%, 5-31-2021 to 2-15-2046, fair value including accrued interest is $561,002,423. |
| | (12) | U.S. government securities, 0.13% to 6.75%, 7-31-2016 to 2-15-2045, fair value including accrued interest is $637,507,680. |
| | (13) | U.S. government securities, 3.00%, 11-15-2045, fair value including accrued interest is $127,500,076. |
| | (14) | U.S. government securities, 0.00% to 8.00%, 6-15-2017 to 5-15-2045, fair value including accrued interest is $470,424,128. |
| | (15) | U.S. government securities, 0.00% to 8.88%, 9-1-2016 to 5-15-2045, fair value including accrued interest is $255,000,020. |
| | (16) | U.S. government securities, 0.00% to 9.13%, 8-18-2016 to 2-15-2045, fair value including accrued interest is $255,000,000. |
| | (17) | U.S. government securities, 0.00% to 8.75%, 8-18-2016 to 5-15-2024, fair value including accrued interest is $255,000,038. |
| | (18) | U.S. government securities, 0.00% to 2.13%, 10-13-2016 to 2-15-2041, fair value including accrued interest is $102,000,000. |
| | (19) | U.S. government securities, 0.00% to 8.13%, 5-1-2027 to 9-1-2042, fair value including accrued interest is $255,000,000. |
| | (20) | U.S. government securities, 0.63% to 6.25%, 9-30-2016 to 2-15-2046, fair value including accrued interest is $204,000,030. |
| ¢ | The security represents a long-dated and extendible repurchase agreement which automatically renews on previously set terms. The maturity date represents the next put date. |
| ± | Variable rate investment. The rate shown is the rate in effect at period end. |
| § | The security is subject to a demand feature which reduces the effective maturity. |
| (z) | Zero coupon security. The rate represents the current yield to maturity. |
| ## | All or a portion of this security is segregated for when-issued securities. |
| %% | The security is issued on a when-issued basis. |
| * | Cost for federal income tax purposes is substantially the same as for financial reporting purposes. |
The accompanying notes are an integral part of these financial statements.
| | | | | | |
| Statement of assets and liabilities—July 31, 2016 (unaudited) | | Wells Fargo Treasury Plus Money Market Fund | | | 9 | |
| | | | |
| | | | |
| |
Assets | | | | |
Investments | | | | |
In repurchase agreements, at amortized cost | | $ | 9,238,050,125 | |
In unaffiliated securities, at amortized cost | | | 5,422,581,901 | |
| | | | |
Total investments, at amortized cost | | | 14,660,632,026 | |
Cash | | | 7,045 | |
Receivable for investments sold | | | 280,000,000 | |
Receivable for Fund shares sold | | | 830,314 | |
Receivable for interest | | | 26,014,580 | |
Prepaid expenses and other assets | | | 373,851 | |
| | | | |
Total assets | | | 14,967,857,816 | |
| | | | |
| |
Liabilities | | | | |
Dividends payable | | | 984,964 | |
Payable for investments purchased | | | 69,999,551 | |
Payable for Fund shares redeemed | | | 567,571 | |
Management fee payable | | | 1,000,253 | |
Distribution fee payable | | | 463 | |
Administration fees payable | | | 1,216,580 | |
Accrued expenses and other liabilities | | | 1,440,637 | |
| | | | |
Total liabilities | | | 75,210,019 | |
| | | | |
Total net assets | | $ | 14,892,647,797 | |
| | | | |
| |
NET ASSETS CONSIST OF | | | | |
Paid-in capital | | $ | 14,892,956,456 | |
Overdistributed net investment income | | | (318,193 | ) |
Accumulated net realized gains on investments | | | 9,534 | |
| | | | |
Total net assets | | $ | 14,892,647,797 | |
| | | | |
| |
COMPUTATION OF NET ASSET VALUE PER SHARE | | | | |
Net assets – Class A | | $ | 1,457,278,167 | |
Shares outstanding – Class A1 | | | 1,457,094,980 | |
Net asset value per share – Class A | | | $1.00 | |
Net assets – Administrator Class | | $ | 74,152,684 | |
Shares outstanding – Administrator Class1 | | | 74,142,461 | |
Net asset value per share – Administrator Class | | | $1.00 | |
Net assets – Institutional Class | | $ | 11,846,378,968 | |
Shares outstanding – Institutional Class1 | | | 11,844,950,432 | |
Net asset value per share – Institutional Class | | | $1.00 | |
Net assets – Service Class | | $ | 1,514,184,380 | |
Shares outstanding – Service Class1 | | | 1,513,996,548 | |
Net asset value per share – Service Class | | | $1.00 | |
Net assets – Sweep Class | | $ | 653,598 | |
Shares outstanding – Sweep Class1 | | | 653,437 | |
Net asset value per share – Sweep Class | | | $1.00 | |
| 1 | The Fund has an unlimited number of authorized shares. |
The accompanying notes are an integral part of these financial statements.
| | | | |
| 10 | | Wells Fargo Treasury Plus Money Market Fund | | Statement of operations—six months ended July 31, 2016 (unaudited) |
| | | | |
| | | | |
| |
Investment income | | | | |
Interest | | $ | 25,777,446 | |
| | | | |
| |
Expenses | | | | |
Management fee | | | 10,247,663 | |
Administration fees | | | | |
Class A | | | 1,829,642 | |
Administrator Class | | | 57,226 | |
Institutional Class | | | 4,623,973 | |
Service Class | | | 766,797 | |
Sweep Class | | | 2,643 | |
Shareholder servicing fees | | | | |
Class A | | | 2,079,138 | |
Administrator Class | | | 55,961 | |
Service Class | | | 1,590,013 | |
Sweep Class | | | 3,003 | |
Distribution fee | | | | |
Sweep Class | | | 4,205 | |
Custody and accounting fees | | | 344,975 | |
Professional fees | | | 24,714 | |
Registration fees | | | 45,402 | |
Shareholder report expenses | | | 20,179 | |
Trustees’ fees and expenses | | | 3,158 | |
Other fees and expenses | | | 30,030 | |
| | | | |
Total expenses | | | 21,728,722 | |
Less: Fee waivers and/or expense reimbursements | | | (4,940,326 | ) |
| | | | |
Net expenses | | | 16,788,396 | |
| | | | |
Net investment income | | | 8,989,050 | |
| | | | |
Net realized gains on investments | | | 13,854 | |
| | | | |
Net increase in net assets resulting from operations | | $ | 9,002,904 | |
| | | | |
The accompanying notes are an integral part of these financial statements.
| | | | | | |
| Statement of changes in net assets | | Wells Fargo Treasury Plus Money Market Fund | | | 11 | |
| | | | | | | | | | | | | | | | |
| | | Six months ended July 31, 2016 (unaudited) | | | Year ended
January 31, 2016 | |
| | | | |
Operations | | | | | | | | | | | | | | | | |
Net investment income | | | | | | $ | 8,989,050 | | | | | | | $ | 3,092,239 | |
Net realized gains on investments | | | | | | | 13,854 | | | | | | | | 1,750 | |
| | | | |
Net increase in net assets resulting from operations | | | | | | | 9,002,904 | | | | | | | | 3,093,989 | |
| | | | |
| | | | |
Distributions to shareholders from | | | | | | | | | | | | | | | | |
Net investment income | | | | | | | | | | | | | | | | |
Class A | | | | | | | (83,382 | ) | | | | | | | (185,550 | ) |
Administrator Class | | | | | | | (11,385 | ) | | | | | | | (11,187 | ) |
Institutional Class | | | | | | | (8,830,032 | ) | | | | | | | (2,738,718 | ) |
Service Class | | | | | | | (64,131 | ) | | | | | | | (156,479 | ) |
Sweep Class | | | | | | | (120 | ) | | | | | | | (305 | ) |
| | | | |
Total distributions to shareholders | | | | | | | (8,989,050 | ) | | | | | | | (3,092,239 | ) |
| | | | |
| | | | |
Capital share transactions | | | Shares | | | | | | | | Shares | | | | | |
Proceeds from shares sold | | | | | | | | | | | | | | | | |
Class A | | | 4,748,065,064 | | | | 4,748,065,064 | | | | 9,695,234,245 | | | | 9,695,234,245 | |
Administrator Class | | | 221,886,998 | | | | 221,886,998 | | | | 1,485,239,239 | | | | 1,485,239,239 | |
Institutional Class | | | 51,783,663,169 | | | | 51,783,663,169 | | | | 92,509,317,999 | | | | 92,509,317,999 | |
Service Class | | | 3,596,268,595 | | | | 3,596,268,595 | | | | 6,667,123,211 | | | | 6,667,123,211 | |
Sweep Class | | | 3,063,857 | | | | 3,063,857 | | | | 7,264,570 | | | | 7,264,570 | |
| | | | |
| | | | | | | 60,352,947,683 | | | | | | | | 110,364,179,264 | |
| | | | |
Reinvestment of distributions | | | | | | | | | | | | | | | | |
Class A | | | 27,247 | | | | 27,247 | | | | 60,846 | | | | 60,846 | |
Administrator Class | | | 11,385 | | | | 11,385 | | | | 9,295 | | | | 9,295 | |
Institutional Class | | | 3,986,218 | | | | 3,986,218 | | | | 1,058,693 | | | | 1,058,693 | |
Service Class | | | 6,049 | | | | 6,049 | | | | 10,293 | | | | 10,293 | |
Sweep Class | | | 120 | | | | 120 | | | | 305 | | | | 305 | |
| | | | |
| | | | | | | 4,031,019 | | | | | | | | 1,139,432 | |
| | | | |
Payment for shares redeemed | | | | | | | | | | | | | | | | |
Class A | | | (5,247,368,670 | ) | | | (5,247,368,670 | ) | | | (9,471,777,216 | ) | | | (9,471,777,216 | ) |
Administrator Class | | | (249,176,096 | ) | | | (249,176,096 | ) | | | (1,489,995,863 | ) | | | (1,489,995,863 | ) |
Institutional Class | | | (52,558,539,055 | ) | | | (52,558,539,055 | ) | | | (91,084,112,215 | ) | | | (91,084,112,215 | ) |
Service Class | | | (3,421,955,936 | ) | | | (3,421,955,936 | ) | | | (7,172,613,690 | ) | | | (7,172,613,690 | ) |
Sweep Class | | | (5,555,605 | ) | | | (5,555,605 | ) | | | (7,173,689 | ) | | | (7,173,689 | ) |
| | | | |
| | | | | | | (61,482,595,362 | ) | | | | | | | (109,225,672,673 | ) |
| | | | |
Net increase (decrease) in net assets resulting from capital share transactions | | | | | | | (1,125,616,660 | ) | | | | | | | 1,139,646,023 | |
| | | | |
Total increase (decrease) in net assets | | | | | | | (1,125,602,806 | ) | | | | | | | 1,139,647,773 | |
| | | | |
| | | | |
Net assets | | | | | | | | | | | | | | | | |
Beginning of period | | | | | | | 16,018,250,603 | | | | | | | | 14,878,602,830 | |
| | | | |
End of period | | | | | | $ | 14,892,647,797 | | | | | | | $ | 16,018,250,603 | |
| | | | |
Overdistributed net investment income | | | | | | $ | (318,193 | ) | | | | | | $ | (318,193 | ) |
| | | | |
The accompanying notes are an integral part of these financial statements.
| | | | |
| 12 | | Wells Fargo Treasury Plus Money Market Fund | | Financial highlights |
(For a share outstanding throughout each period)
| | | | | | | | | | | | | | | | | | | | | | | | |
| | | Six months ended
July 31, 2016
(unaudited) | | | Year ended January 31 | |
| CLASS A | | | 2016 | | | 2015 | | | 2014 | | | 2013 | | | 2012 | |
Net asset value, beginning of period | | | $1.00 | | | | $1.00 | | | | $1.00 | | | | $1.00 | | | | $1.00 | | | | $1.00 | |
Net investment income | | | 0.00 | 1 | | | 0.00 | 1 | | | 0.00 | 1 | | | 0.00 | 1 | | | 0.00 | 1 | | | 0.00 | 1 |
Net realized gains (losses) on investments | | | 0.00 | 1 | | | 0.00 | 1 | | | (0.00 | )1 | | | 0.00 | 1 | | | 0.00 | 1 | | | 0.00 | 1 |
| | | | | | | | | | | | | | | | | | | | | | | | |
Total from investment operations | | | 0.00 | 1 | | | 0.00 | 1 | | | 0.00 | 1 | | | 0.00 | 1 | | | 0.00 | 1 | | | 0.00 | 1 |
Distributions to shareholders from | | | | | | | | | | | | | | | | | | | | | | | | |
Net investment income | | | (0.00 | )1 | | | (0.00 | )1 | | | (0.00 | )1 | | | (0.00 | )1 | | | (0.00 | )1 | | | (0.00 | )1 |
Net realized gains | | | 0.00 | | | | 0.00 | | | | (0.00 | )1 | | | (0.00 | )1 | | | 0.00 | | | | 0.00 | |
| | | | | | | | | | | | | | | | | | | | | | | | |
Total distributions to shareholders | | | (0.00 | )1 | | | (0.00 | )1 | | | (0.00 | )1 | | | (0.00 | )1 | | | (0.00 | )1 | | | (0.00 | )1 |
Net asset value, end of period | | | $1.00 | | | | $1.00 | | | | $1.00 | | | | $1.00 | | | | $1.00 | | | | $1.00 | |
Total return2 | | | 0.00 | % | | | 0.01 | % | | | 0.01 | % | | | 0.01 | % | | | 0.01 | % | | | 0.01 | % |
Ratios to average net assets (annualized) | | | | | | | | | | | | | | | | | | | | | | | | |
Gross expenses | | | 0.62 | % | | | 0.62 | % | | | 0.62 | % | | | 0.62 | % | | | 0.62 | % | | | 0.62 | % |
Net expenses | | | 0.34 | % | | | 0.11 | % | | | 0.06 | % | | | 0.06 | % | | | 0.12 | % | | | 0.06 | % |
Net investment income | | | 0.01 | % | | | 0.01 | % | | | 0.01 | % | | | 0.01 | % | | | 0.01 | % | | | 0.01 | % |
Supplemental data | | | | | | | | | | | | | | | | | | | | | | | | |
Net assets, end of period (000s omitted) | | | $1,457,278 | | | | $1,956,626 | | | | $1,733,107 | | | | $1,998,010 | | | | $1,589,730 | | | | $1,692,131 | |
| 1 | Amount is less than $0.005. |
| 2 | Returns for periods of less than one year are not annualized. |
The accompanying notes are an integral part of these financial statements.
| | | | | | |
| Financial highlights | | Wells Fargo Treasury Plus Money Market Fund | | | 13 | |
(For a share outstanding throughout each period)
| | | | | | | | | | | | | | | | | | | | | | | | |
| | | Six months ended
July 31, 2016 (unaudited) | | | Year ended January 31 | |
| ADMINISTRATOR CLASS | | | 2016 | | | 2015 | | | 2014 | | | 2013 | | | 2012 | |
Net asset value, beginning of period | | | $1.00 | | | | $1.00 | | | | $1.00 | | | | $1.00 | | | | $1.00 | | | | $1.00 | |
Net investment income | | | 0.00 | 1 | | | 0.00 | 1 | | | 0.00 | 1 | | | 0.00 | 1 | | | 0.00 | 1 | | | 0.00 | 1 |
Net realized gains (losses) on investments | | | 0.00 | 1 | | | 0.00 | 1 | | | (0.00 | )1 | | | 0.00 | 1 | | | 0.00 | 1 | | | 0.00 | 1 |
| | | | | | | | | | | | | | | | | | | | | | | | |
Total from investment operations | | | 0.00 | 1 | | | 0.00 | 1 | | | 0.00 | 1 | | | 0.00 | 1 | | | 0.00 | 1 | | | 0.00 | 1 |
Distributions to shareholders from | | | | | | | | | | | | | | | | | | | | | | | | |
Net investment income | | | (0.00 | )1 | | | (0.00 | )1 | | | (0.00 | )1 | | | (0.00 | )1 | | | (0.00 | )1 | | | (0.00 | )1 |
Net realized gains | | | 0.00 | | | | 0.00 | | | | (0.00 | )1 | | | (0.00 | )1 | | | 0.00 | | | | 0.00 | |
| | | | | | | | | | | | | | | | | | | | | | | | |
Total distributions to shareholders | | | (0.00 | )1 | | | (0.00 | )1 | | | (0.00 | )1 | | | (0.00 | )1 | | | (0.00 | )1 | | | (0.00 | )1 |
Net asset value, end of period | | | $1.00 | | | | $1.00 | | | | $1.00 | | | | $1.00 | | | | $1.00 | | | | $1.00 | |
Total return2 | | | 0.01 | % | | | 0.01 | % | | | 0.01 | % | | | 0.01 | % | | | 0.01 | % | | | 0.01 | % |
Ratios to average net assets (annualized) | | | | | | | | | | | | | | | | | | | | | | | | |
Gross expenses | | | 0.34 | % | | | 0.34 | % | | | 0.34 | % | | | 0.34 | % | | | 0.35 | % | | | 0.35 | % |
Net expenses | | | 0.33 | % | | | 0.10 | % | | | 0.06 | % | | | 0.07 | % | | | 0.13 | % | | | 0.05 | % |
Net investment income | | | 0.02 | % | | | 0.01 | % | | | 0.01 | % | | | 0.01 | % | | | 0.01 | % | | | 0.01 | % |
Supplemental data | | | | | | | | | | | | | | | | | | | | | | | | |
Net assets, end of period (000s omitted) | | | $74,153 | | | | $101,432 | | | | $106,179 | | | | $98,633 | | | | $204,264 | | | | $209,513 | |
| 1 | Amount is less than $0.005. |
| 2 | Returns for periods of less than one year are not annualized. |
The accompanying notes are an integral part of these financial statements.
| | | | |
| 14 | | Wells Fargo Treasury Plus Money Market Fund | | Financial highlights |
(For a share outstanding throughout each period)
| | | | | | | | | | | | | | | | | | | | | | | | |
| | | Six months ended
July 31, 2016 (unaudited) | | | Year ended January 31 | |
| INSTITUTIONAL CLASS | | | 2016 | | | 2015 | | | 2014 | | | 2013 | | | 2012 | |
Net asset value, beginning of period | | | $1.00 | | | | $1.00 | | | | $1.00 | | | | $1.00 | | | | $1.00 | | | | $1.00 | |
Net investment income | | | 0.00 | 1 | | | 0.00 | 1 | | | 0.00 | 1 | | | 0.00 | 1 | | | 0.00 | 1 | | | 0.00 | 1 |
Net realized gains (losses) on investments | | | 0.00 | 1 | | | 0.00 | 1 | | | (0.00 | )1 | | | 0.00 | 1 | | | 0.00 | 1 | | | 0.00 | 1 |
| | | | | | | | | | | | | | | | | | | | | | | | |
Total from investment operations | | | 0.00 | 1 | | | 0.00 | 1 | | | 0.00 | 1 | | | 0.00 | 1 | | | 0.00 | 1 | | | 0.00 | 1 |
Distributions to shareholders from | | | | | | | | | | | | | | | | | | | | | | | | |
Net investment income | | | (0.00 | )1 | | | (0.00 | )1 | | | (0.00 | )1 | | | (0.00 | )1 | | | (0.00 | )1 | | | (0.00 | )1 |
Net realized gains | | | 0.00 | | | | 0.00 | | | | (0.00 | )1 | | | (0.00 | )1 | | | 0.00 | | | | 0.00 | |
| | | | | | | | | | | | | | | | | | | | | | | | |
Total distributions to shareholders | | | (0.00 | )1 | | | (0.00 | )1 | | | (0.00 | )1 | | | (0.00 | )1 | | | (0.00 | )1 | | | (0.00 | )1 |
Net asset value, end of period | | | $1.00 | | | | $1.00 | | | | $1.00 | | | | $1.00 | | | | $1.00 | | | | $1.00 | |
Total return2 | | | 0.08 | % | | | 0.02 | % | | | 0.01 | % | | | 0.01 | % | | | 0.01 | % | | | 0.01 | % |
Ratios to average net assets (annualized) | | | | | | | | | | | | | | | | | | | | | | | | |
Gross expenses | | | 0.23 | % | | | 0.23 | % | | | 0.23 | % | | | 0.23 | % | | | 0.23 | % | | | 0.23 | % |
Net expenses | | | 0.20 | % | | | 0.10 | % | | | 0.06 | % | | | 0.06 | % | | | 0.12 | % | | | 0.06 | % |
Net investment income | | | 0.15 | % | | | 0.02 | % | | | 0.01 | % | | | 0.01 | % | | | 0.01 | % | | | 0.01 | % |
Supplemental data | | | | | | | | | | | | | | | | | | | | | | | | |
Net assets, end of period (000s omitted) | | | $11,846,379 | | | | $12,617,153 | | | | $11,190,887 | | | | $9,522,210 | | | | $7,557,137 | | | | $6,393,891 | |
| 1 | Amount is less than $0.005. |
| 2 | Returns for periods of less than one year are not annualized. |
The accompanying notes are an integral part of these financial statements.
| | | | | | |
| Financial highlights | | Wells Fargo Treasury Plus Money Market Fund | | | 15 | |
(For a share outstanding throughout each period)
| | | | | | | | | | | | | | | | | | | | | | | | |
| | | Six months ended
July 31, 2016 (unaudited) | | | Year ended January 31 | |
| SERVICE CLASS | | | 2016 | | | 2015 | | | 2014 | | | 2013 | | | 2012 | |
Net asset value, beginning of period | | | $1.00 | | | | $1.00 | | | | $1.00 | | | | $1.00 | | | | $1.00 | | | | $1.00 | |
Net investment income | | | 0.00 | 1 | | | 0.00 | 1 | | | 0.00 | 1 | | | 0.00 | 1 | | | 0.00 | 1 | | | 0.00 | 1 |
Net realized gains (losses) on investments | | | 0.00 | 1 | | | 0.00 | 1 | | | (0.00 | )1 | | | 0.00 | 1 | | | 0.00 | 1 | | | 0.00 | 1 |
| | | | | | | | | | | | | | | | | | | | | | | | |
Total from investment operations | | | 0.00 | 1 | | | 0.00 | 1 | | | 0.00 | 1 | | | 0.00 | 1 | | | 0.00 | 1 | | | 0.00 | 1 |
Distributions to shareholders from | | | | | | | | | | | | | | | | | | | | | | | | |
Net investment income | | | (0.00 | )1 | | | (0.00 | )1 | | | (0.00 | )1 | | | (0.00 | )1 | | | (0.00 | )1 | | | (0.00 | )1 |
Net realized gains | | | 0.00 | | | | 0.00 | | | | (0.00 | )1 | | | (0.00 | )1 | | | 0.00 | | | | 0.00 | |
| | | | | | | | | | | | | | | | | | | | | | | | |
Total distributions to shareholders | | | (0.00 | )1 | | | (0.00 | )1 | | | (0.00 | )1 | | | (0.00 | )1 | | | (0.00 | )1 | | | (0.00 | )1 |
Net asset value, end of period | | | $1.00 | | | | $1.00 | | | | $1.00 | | | | $1.00 | | | | $1.00 | | | | $1.00 | |
Total return2 | | | 0.00 | % | | | 0.01 | % | | | 0.01 | % | | | 0.01 | % | | | 0.01 | % | | | 0.01 | % |
Ratios to average net assets (annualized) | | | | | | | | | | | | | | | | | | | | | | | | |
Gross expenses | | | 0.52 | % | | | 0.52 | % | | | 0.52 | % | | | 0.52 | % | | | 0.52 | % | | | 0.52 | % |
Net expenses | | | 0.34 | % | | | 0.11 | % | | | 0.06 | % | | | 0.06 | % | | | 0.12 | % | | | 0.06 | % |
Net investment income | | | 0.01 | % | | | 0.01 | % | | | 0.01 | % | | | 0.01 | % | | | 0.01 | % | | | 0.01 | % |
Supplemental data | | | | | | | | | | | | | | | | | | | | | | | | |
Net assets, end of period (000s omitted) | | | $1,514,184 | | | | $1,339,895 | | | | $1,845,375 | | | | $1,589,951 | | | | $1,932,680 | | | | $1,885,503 | |
| 1 | Amount is less than $0.005. |
| 2 | Returns for periods of less than one year are not annualized. |
The accompanying notes are an integral part of these financial statements.
| | | | |
| 16 | | Wells Fargo Treasury Plus Money Market Fund | | Financial highlights |
(For a share outstanding throughout each period)
| | | | | | | | | | | | | | | | | | | | | | | | |
| | | Six months ended
July 31, 2016 (unaudited) | | | Year ended January 31 | |
| SWEEP CLASS | | | 2016 | | | 2015 | | | 2014 | | | 2013 | | | 2012 | |
Net asset value, beginning of period | | | $1.00 | | | | $1.00 | | | | $1.00 | | | | $1.00 | | | | $1.00 | | | | $1.00 | |
Net investment income | | | 0.00 | 1 | | | 0.00 | 1 | | | 0.00 | 1 | | | 0.00 | 1 | | | 0.00 | 1 | | | 0.00 | 1 |
Net realized gains (losses) on investments | | | 0.00 | 1 | | | 0.00 | 1 | | | (0.00 | )1 | | | 0.00 | 1 | | | 0.00 | 1 | | | 0.00 | 1 |
| | | | | | | | | | | | | | | | | | | | | | | | |
Total from investment operations | | | 0.00 | 1 | | | 0.00 | 1 | | | 0.00 | 1 | | | 0.00 | 1 | | | 0.00 | 1 | | | 0.00 | 1 |
Distributions to shareholders from | | | | | | | | | | | | | | | | | | | | | | | | |
Net investment income | | | (0.00 | )1 | | | (0.00 | )1 | | | (0.00 | )1 | | | (0.00 | )1 | | | (0.00 | )1 | | | (0.00 | )1 |
Net realized gains | | | 0.00 | | | | 0.00 | | | | (0.00 | )1 | | | (0.00 | )1 | | | 0.00 | | | | 0.00 | |
| | | | | | | | | | | | | | | | | | | | | | | | |
Total distributions to shareholders | | | (0.00 | )1 | | | (0.00 | )1 | | | (0.00 | )1 | | | (0.00 | )1 | | | (0.00 | )1 | | | (0.00 | )1 |
Net asset value, end of period | | | $1.00 | | | | $1.00 | | | | $1.00 | | | | $1.00 | | | | $1.00 | | | | $1.00 | |
Total return2 | | | 0.00 | % | | | 0.01 | % | | | 0.01 | % | | | 0.01 | % | | | 0.01 | % | | | 0.01 | % |
Ratios to average net assets (annualized) | | | | | | | | | | | | | | | | | | | | | | | | |
Gross expenses | | | 0.97 | % | | | 0.97 | % | | | 0.97 | % | | | 0.97 | % | | | 0.97 | % | | | 0.97 | % |
Net expenses | | | 0.34 | % | | | 0.11 | % | | | 0.06 | % | | | 0.06 | % | | | 0.12 | % | | | 0.07 | % |
Net investment income | | | 0.01 | % | | | 0.01 | % | | | 0.01 | % | | | 0.01 | % | | | 0.01 | % | | | 0.01 | % |
Supplemental data | | | | | | | | | | | | | | | | | | | | | | | | |
Net assets, end of period (000s omitted) | | | $654 | | | | $3,145 | | | | $3,054 | | | | $20,122 | | | | $27,152 | | | | $42,861 | |
| 1 | Amount is less than $0.005. |
| 2 | Returns for periods of less than one year are not annualized. |
The accompanying notes are an integral part of these financial statements.
| | | | | | |
| Notes to financial statements (unaudited) | | Wells Fargo Treasury Plus Money Market Fund | | | 17 | |
1. ORGANIZATION
Wells Fargo Funds Trust (the “Trust”), a Delaware statutory trust organized on March 10, 1999, is an open-end management investment company registered under the Investment Company Act of 1940, as amended (the “1940 Act”). As an investment company, the Trust follows the accounting and reporting guidance in Financial Accounting Standards Board (“FASB”) Accounting Standards Codification Topic 946, Financial Services – Investment Companies. These financial statements report on the Wells Fargo Treasury Plus Money Market Fund (the “Fund”) which is a diversified series of the Trust.
2. SIGNIFICANT ACCOUNTING POLICIES
The following significant accounting policies, which are consistently followed in the preparation of the financial statements of the Fund, are in conformity with U.S. generally accepted accounting principles which require management to make estimates and assumptions that affect the reported amounts of assets and liabilities, disclosure of contingent assets and liabilities at the date of the financial statements, and the reported amounts of revenues and expenses during the reporting period. Actual results could differ from those estimates.
Securities valuation
As permitted under Rule 2a-7 of the 1940 Act, portfolio securities are valued at amortized cost, which approximates fair value. The amortized cost method involves valuing a security at its cost, plus accretion of discount or minus amortization of premium over the period until maturity.
Investments which are not valued using the method discussed above are valued at their fair value, as determined in good faith by the Board of Trustees of the Fund. The Board of Trustees has established a Valuation Committee comprised of the Trustees and has delegated to it the authority to take any actions regarding the valuation of portfolio securities that the Valuation Committee deems necessary or appropriate, including determining the fair value of portfolio securities, unless the determination has been delegated to the Management Valuation Team of Wells Fargo Funds Management, LLC (“Funds Management”). The Board of Trustees retains the authority to make or ratify any valuation decisions or approve any changes to the Valuation Procedures as it deems appropriate. On a quarterly basis, the Board of Trustees receives reports on any valuation actions taken by the Valuation Committee or the Management Valuation Team which may include items for ratification.
Valuations of fair valued securities are compared to the next actual sales price when available, or other appropriate market values, to assess the continued appropriateness of the fair valuation methodologies used. These securities are fair valued on a day-to-day basis, taking into consideration changes to appropriate market information and any significant changes to the inputs considered in the valuation process until there is a readily available price provided on an exchange or by an independent pricing service. Valuations received from an independent pricing service or independent broker-dealer quotes are periodically validated by comparisons to most recent trades and valuations provided by other independent pricing services in addition to the review of prices by the manager and/or subadviser. Unobservable inputs used in determining fair valuations are identified based on the type of security, taking into consideration factors utilized by market participants in valuing the investment, knowledge about the issuer and the current market environment.
Repurchase agreements
The Fund may invest in repurchase agreements and may participate in pooled repurchase agreement transactions with other funds advised by Funds Management. The repurchase agreements must be fully collateralized based on values that are marked-to-market daily. The collateral may be held by an agent bank under a tri-party agreement. It is the custodian’s responsibility to value collateral daily and to take action to obtain additional collateral as necessary to maintain market value equal to or greater than the resale price. The repurchase agreements are collateralized by instruments such as U.S. Treasury, federal agency, or high-grade corporate obligations. There could be potential loss to the Fund in the event that the Fund is delayed or prevented from exercising its rights to dispose of the collateral, including the risk of a possible decline in the value of the underlying obligations during the period in which the Fund seeks to assert its rights.
When-issued transactions
The Fund may purchase securities on a forward commitment or when-issued basis. The Fund records a when-issued transaction on the trade date and will segregate assets in an amount at least equal in value to the Fund’s commitment to purchase when-issued securities. Securities purchased on a when-issued basis are marked-to-market daily and the Fund begins earning interest on the settlement date. Losses may arise due to changes in the market value of the underlying securities or if the counterparty does not perform under the contract.
Security transactions and income recognition
Securities transactions are recorded on a trade date basis. Realized gains or losses are recorded on the basis of identified cost.
| | | | |
| 18 | | Wells Fargo Treasury Plus Money Market Fund | | Notes to financial statements (unaudited) |
Interest income is accrued daily and bond discounts are accreted and premiums are amortized daily based on the effective interest method. To the extent debt obligations are placed on non-accrual status, any related interest income may be reduced by writing off interest receivables when the collection of all or a portion of interest has become doubtful based on consistently applied procedures. If the issuer subsequently resumes interest payments or when the collectability of interest is reasonably assured, the debt obligation is removed from non-accrual status.
Distributions to shareholders
Distributions to shareholders from net investment income are accrued daily and paid monthly. Distributions from net realized gains, if any, are recorded on the ex-dividend date. Such distributions are determined in conformity with federal income tax regulations, which may differ in amount or character from net investment income and realized gains recognized for purposes of U.S. generally accepted accounting principles.
Federal and other taxes
The Fund intends to continue to qualify as a regulated investment company by distributing substantially all of its investment company taxable income and any net realized capital gains (after reduction for capital loss carryforwards) sufficient to relieve it from all, or substantially all, federal income taxes. Accordingly, no provision for federal income taxes was required.
The Fund’s income and federal excise tax returns and all financial records supporting those returns for the prior three fiscal years are subject to examination by the federal and Delaware revenue authorities. Management has analyzed the Fund’s tax positions taken on federal, state, and foreign tax returns for all open tax years and does not believe that there are any uncertain tax positions that require recognition of a tax liability.
As of January 31, 2016, the Fund had capital loss carryforwards which consist of $4,320 in short-term capital losses.
Class allocations
The separate classes of shares offered by the Fund differ principally in distribution, shareholder servicing, and administration fees. Class specific expenses are charged directly to that share class. Investment income, common expenses, and realized and unrealized gains (losses) on investments are allocated daily to each class of shares based on the relative proportion of net assets of each class.
3. FAIR VALUATION MEASUREMENTS
Fair value measurements of investments are determined within a framework that has established a fair value hierarchy based upon the various data inputs utilized in determining the value of the Fund’s investments. The three-level hierarchy gives the highest priority to unadjusted quoted prices in active markets for identical assets or liabilities (Level 1) and the lowest priority to significant unobservable inputs (Level 3). The Fund’s investments are classified within the fair value hierarchy based on the lowest level of input that is significant to the fair value measurement. The inputs are summarized into three broad levels as follows:
| n | | Level 1 – quoted prices in active markets for identical securities |
| n | | Level 2 – other significant observable inputs (including quoted prices for similar securities, interest rates, prepayment speeds, credit risk, use of amortized cost, etc.) |
| n | | Level 3 – significant unobservable inputs (including the Fund’s own assumptions in determining the fair value of investments) |
The inputs or methodologies used for valuing investments in securities are not necessarily an indication of the risk associated with investing in those securities.
At July 31, 2016, all of the Fund’s investments in securities were valued using Level 2 inputs since the primary inputs include the credit quality of the issuer and short-term interest rates (both of which are observable) in addition to the use of amortized cost.
The Fund recognizes transfers between levels within the fair value hierarchy at the end of the reporting period. At July 31, 2016, the Fund did not have any transfers into/out of Level 1, Level 2, or Level 3.
4. TRANSACTIONS WITH AFFILIATES
Management fee
Funds Management, an indirect wholly owned subsidiary of Wells Fargo & Company (“Wells Fargo”), is the manager of the Fund and provides advisory and fund-level administrative services under an investment management agreement.
| | | | | | |
| Notes to financial statements (unaudited) | | Wells Fargo Treasury Plus Money Market Fund | | | 19 | |
Under the investment management agreement, Funds Management is responsible for, among other services, implementing the investment objectives and strategies of the Fund, supervising the subadviser, providing fund-level administrative services in connection with the Fund’s operations, and providing any other fund-level administrative services reasonably necessary for the operation of the Fund. As compensation for its services under the investment management agreement, Funds Management is entitled to receive an annual management fee starting at 0.15% and declining to 0.13% as the average daily net assets of the Fund increase. For the six months ended July 31, 2016, the management fee was equivalent to an annual rate of 0.14% of the Fund’s average daily net assets.
Funds Management has retained the services of a subadviser to provide daily portfolio management to the Fund. The fee for subadvisory services is borne by Funds Management. Wells Capital Management Incorporated, an affiliate of Funds Management and an indirect wholly owned subsidiary of Wells Fargo, is the subadviser to the Fund and is entitled to receive a fee from Funds Management at an annual rate starting at 0.05% and declining to 0.01% as the average daily net assets of the Fund increase.
Administration fees
Under a class-level administration agreement, Funds Management provides class-level administrative services to the Fund, which includes paying fees and expenses for services provided by the transfer agent, sub-transfer agents, omnibus account servicers and record-keepers. As compensation for its services under the class-level administration agreement, Funds Management receives an annual fee which is calculated based on the average daily net assets of each class as follows:
| | | | |
| | | Class-level
administration fee | |
Class A, Sweep Class | | | 0.22 | % |
Administrator Class | | | 0.10 | |
Institutional Class | | | 0.08 | |
Service Class | | | 0.12 | |
Funds Management has contractually waived and/or reimbursed management and administration fees to the extent necessary to maintain certain net operating expense ratios for the Fund. Waiver of fees and/or reimbursement of expenses by Funds Management were made first from fund level expenses on a proportionate basis and then from class specific expenses. Funds Management has committed through May 31, 2017 to waive fees and/or reimburse expenses to the extent necessary to cap the Fund’s expenses at 0.65% for Class A shares, 0.35% for Administrator Class shares, 0.20% for Institutional Class shares, 0.45% for Service Class shares, and 1.00% for Sweep Class shares. After this time, the cap may be increased or the commitment to maintain the cap may be terminated only with the approval of the Board of Trustees. During the six months ended July 31, 2016, Funds Management voluntarily waived additional expenses to maintain a positive yield.
Distribution fee
The Trust has adopted a distribution plan for Sweep Class shares of the Fund pursuant to Rule 12b-1 under the 1940 Act. A distribution fee is charged to Sweep Class shares and paid to Wells Fargo Funds Distributor, LLC, the principal underwriter, at an annual rate of 0.35% of the average daily net assets of Sweep Class shares.
Shareholder servicing fees
The Trust has entered into contracts with one or more shareholder servicing agents, whereby Class A, Service Class, and Sweep Class of the Fund are charged a fee at an annual rate of 0.25% of the respective average daily net assets of each class. Administrator Class is charged a fee at an annual rate of 0.10% of its average daily net assets.
A portion of these total shareholder servicing fees were paid to affiliates of Wells Fargo.
5. INDEMNIFICATION
Under the Trust’s organizational documents, the officers and Trustees have been granted certain indemnification rights against certain liabilities that may arise out of performance of their duties to the Trust. Additionally, in the normal course of business, the Trust may enter into contracts with service providers that contain a variety of indemnification clauses. The Trust’s maximum exposure under these arrangements is dependent on future claims that may be made against the Fund and, therefore, cannot be estimated.
| | | | |
| 20 | | Wells Fargo Treasury Plus Money Market Fund | | Notes to financial statements (unaudited) |
6. MONEY MARKET FUND REFORM
On July 23, 2014, the Securities and Exchange Commission voted to amend Rule 2a-7 of the 1940 Act which governs the operations of registered money market funds. The amendments to Rule 2a-7 when implemented may, among other things, require the Fund to change the manner in which it values its securities, impose new liquidity fees on redemptions in certain circumstances, and permit the Fund to limit redemptions in certain circumstances. The amendments have staggered compliance dates. Compliance with a majority of these amendments will be required on October 14, 2016. The Fund will continue to be offered to retail and institutional investors and transact at a stable $1.00 net asset value (NAV).
| | | | | | |
| Other information (unaudited) | | Wells Fargo Treasury Plus Money Market Fund | | | 21 | |
PROXY VOTING INFORMATION
A description of the policies and procedures that the Fund uses to determine how to vote proxies relating to portfolio securities is available, upon request, by calling 1-800-222-8222, visiting our website at wellsfargofunds.com, or visiting the SEC website at sec.gov. Information regarding how the Fund voted proxies relating to portfolio securities during the most recent 12-month period ended June 30 is available on the Fund’s website at wellsfargofunds.com or by visiting the SEC website at sec.gov.
PORTFOLIO HOLDINGS INFORMATION
The complete portfolio holdings for the Fund are publicly available on the Fund’s website (wellsfargofunds.com) on a 1-day delayed basis. The Fund files its complete schedule of portfolio holdings with the SEC for the first and third quarters of each fiscal year on Form N-Q, which is available by visiting the SEC website at sec.gov. In addition, the Fund’s Form N-Q may be reviewed and copied at the SEC’s Public Reference Room in Washington, DC, and at regional offices in New York City, at 233 Broadway, and in Chicago, at 175 West Jackson Boulevard, Suite 900. Information about the Public Reference Room may be obtained by calling 1-800-SEC-0330.
| | | | |
| 22 | | Wells Fargo Treasury Plus Money Market Fund | | Other information (unaudited) |
BOARD OF TRUSTEES AND OFFICERS
Each of the Trustees and Officers1 listed in the table below acts in identical capacities for each fund in the Wells Fargo family of funds, which consists of 139 mutual funds comprising the Wells Fargo Funds Trust, Wells Fargo Variable Trust, Wells Fargo Master Trust and four closed-end funds (collectively the “Fund Complex”). This table should be read in conjunction with the Prospectus and the Statement of Additional Information2. The mailing address of each Trustee and Officer is 525 Market Street, 12th Floor, San Francisco, CA 94105. Each Trustee and Officer serves an indefinite term, however, each Trustee serves such term until reaching the mandatory retirement age established by the Trustees.
Independent Trustees
| | | | | | |
Name and year of birth | | Position held and length of service* | | Principal occupations during past five years or longer | | Current other public
company or
investment company
directorships |
| William R. Ebsworth (Born 1957) | | Trustee, since 2015 | | Retired. From 1984 to 2013, equities analyst, portfolio manager, research director and chief financial officer at Fidelity Management and Research Company in Boston, Tokyo, and Hong Kong and retired in 2013 as Chief Investment Officer of Fidelity Strategic Advisers, Inc. where he lead a team of investment professionals managing client assets. Prior thereto, Board member of Hong Kong Securities Clearing Co., Hong Kong Options Clearing Corp., the Thailand International Fund, Ltd., Fidelity Investments Life Insurance Company, and Empire Fidelity Investments Life Insurance Company. Mr. Ebsworth is a CFA® charterholder and an Adjunct Lecturer, Finance, at Babson College. | | Asset Allocation Trust |
Jane A. Freeman (Born 1953) | | Trustee, since 2015 | | Retired. From 2012 to 2014 and 1999 to 2008, Chief Financial Officer of Scientific Learning Corporation. From 2008 to 2012, Ms. Freeman provided consulting services related to strategic business projects. Prior to 1999, Portfolio Manager at Rockefeller & Co. and Scudder, Stevens & Clark. Board member of the Harding Loevner Funds from 1996 to 2014, serving as both Lead Independent Director and chair of the Audit Committee. Board member of the Russell Exchange Traded Funds Trust from 2011 to 2012 and the chair of the Audit Committee. Ms. Freeman is Chair of Taproot Foundation (non-profit organization), a Board Member of Ruth Bancroft Garden (non-profit organization) and an inactive chartered financial analyst. | | Asset Allocation Trust |
Peter G. Gordon (Born 1942) | | Trustee, since 1998; Chairman, since 2005 | | Co-Founder, Retired Chairman, President and CEO of Crystal Geyser Water Company. Trustee Emeritus, Colby College. | | Asset Allocation Trust |
Isaiah Harris, Jr. (Born 1952) | | Trustee, since 2009 | | Retired. Chairman of the Board of CIGNA Corporation since 2009, and Director since 2005. From 2003 to 2011, Director of Deluxe Corporation. Prior thereto, President and CEO of BellSouth Advertising and Publishing Corp. from 2005 to 2007, President and CEO of BellSouth Enterprises from 2004 to 2005 and President of BellSouth Consumer Services from 2000 to 2003. Emeritus member of the Iowa State University Foundation Board of Governors. Emeritus Member of the Advisory Board of Iowa State University School of Business. Advisory Board Member, Palm Harbor Academy (charter school). Advisory Board Member, Child Evangelism Fellowship (non-profit). Mr. Harris is a certified public accountant (inactive status). | | CIGNA Corporation; Asset Allocation Trust |
Judith M. Johnson (Born 1949) | | Trustee, since 2008; Audit Committee Chairman, since 2008 | | Retired. Prior thereto, Chief Executive Officer and Chief Investment Officer of Minneapolis Employees Retirement Fund from 1996 to 2008. Ms. Johnson is an attorney, certified public accountant and a certified managerial accountant. | | Asset Allocation Trust |
David F. Larcker (Born 1950) | | Trustee, since 2009 | | James Irvin Miller Professor of Accounting at the Graduate School of Business, Stanford University, Director of the Corporate Governance Research Initiative and Senior Faculty of The Rock Center for Corporate Governance since 2006. From 2005 to 2008, Professor of Accounting at the Graduate School of Business, Stanford University. Prior thereto, Ernst & Young Professor of Accounting at The Wharton School, University of Pennsylvania from 1985 to 2005. | | Asset Allocation Trust |
| | | | | | |
| Other information (unaudited) | | Wells Fargo Treasury Plus Money Market Fund | | | 23 | |
| | | | | | |
Name and year of birth | | Position held and length of service* | | Principal occupations during past five years or longer | | Current other public
company or
investment company
directorships |
| Olivia S. Mitchell (Born 1953) | | Trustee, since 2006 | | International Foundation of Employee Benefit Plans Professor, Wharton School of the University of Pennsylvania since 1993. Director of Wharton’s Pension Research Council and Boettner Center on Pensions & Retirement Research, and Research Associate at the National Bureau of Economic Research. Previously, Cornell University Professor from 1978 to 1993. | | Asset Allocation Trust |
| Timothy J. Penny (Born 1951) | | Trustee, since 1996 | | President and Chief Executive Officer of Southern Minnesota Initiative Foundation, a non-profit organization, since 2007 and Senior Fellow at the Humphrey Institute Policy Forum at the University of Minnesota since 1995. Member of the Board of Trustees of NorthStar Education Finance, Inc., a non-profit organization, since 2007. | | Asset Allocation Trust |
| Michael S. Scofield (Born 1943) | | Trustee, since 2010 | | Served on the Investment Company Institute’s Board of Governors and Executive Committee from 2008-2011 as well the Governing Council of the Independent Directors Council from 2006-2011 and the Independent Directors Council Executive Committee from 2008-2011. Chairman of the IDC from 2008-2010. Institutional Investor (Fund Directions) Trustee of Year in 2007. Trustee of the Evergreen Funds complex (and its predecessors) from 1984 to 2010. Chairman of the Evergreen Funds from 2000-2010. Former Trustee of the Mentor Funds. Retired Attorney, Law Offices of Michael S. Scofield. | | Asset Allocation Trust |
| * | Length of service dates reflect the Trustee’s commencement of service with the Trust’s predecessor entities, where applicable. |
Officers
| | | | | | |
Name and year of birth | | Position held and
length of service | | Principal occupations during past five years or longer | | |
Karla M. Rabusch (Born 1959) | | President, since 2003 | | Executive Vice President of Wells Fargo Bank, N.A. and President of Wells Fargo Funds Management, LLC since 2003. | | |
Nancy Wiser1 (Born 1967) | | Treasurer, since 2012 | | Executive Vice President of Wells Fargo Funds Management, LLC since 2011. Chief Operating Officer and Chief Compliance Officer at LightBox Capital Management LLC, from 2008 to 2011. | | |
C. David Messman (Born 1960) | | Secretary, since 2000; Chief Legal Officer, since 2003 | | Senior Vice President and Secretary of Wells Fargo Funds Management, LLC since 2001. Assistant General Counsel of Wells Fargo Bank, N.A. since 2013 and Vice President and Managing Counsel of Wells Fargo Bank, N.A. from 1996 to 2013. | | |
Michael Whitaker (Born 1967) | | Chief Compliance Officer, since 2016* | | Executive Vice President of Wells Fargo Funds Management, LLC since 2016. Chief Compliance Officer of Fidelity’s Fixed Income Funds and Asset Allocation Funds from 2008 to 2016, Compliance Officer of FMR Co., Inc. from 2014 to 2016, Fidelity Investments Money Management, Inc. from 2014 to 2016, Fidelity Investments from 2007 to 2016. | | |
David Berardi (Born 1975) | | Assistant Treasurer, since 2009 | | Vice President of Wells Fargo Funds Management, LLC since 2009. Vice President of Evergreen Investment Management Company, LLC from 2008 to 2010. Manager of Fund Reporting and Control for Evergreen Investment Management Company, LLC from 2004 to 2010. | | |
Jeremy DePalma1 (Born 1974) | | Assistant Treasurer, since 2009 | | Senior Vice President of Wells Fargo Funds Management, LLC since 2009. Senior Vice President of Evergreen Investment Management Company, LLC from 2008 to 2010 and head of the Fund Reporting and Control Team within Fund Administration from 2005 to 2010. | | |
| 1 | Nancy Wiser acts as Treasurer of 71 funds in the Fund Complex. Jeremy DePalma acts as Treasurer of 68 funds and Assistant Treasurer of 71 funds in the Fund Complex. |
| 2 | The Statement of Additional Information includes additional information about the Trustees and is available, without charge, upon request, by calling 1-800-222-8222 or by visiting the website at wellsfargofunds.com. |
| * | Michael Whitaker became Chief Compliance Officer effective May 16, 2016. |
| | | | |
| 24 | | Wells Fargo Treasury Plus Money Market Fund | | Other information (unaudited) |
BOARD CONSIDERATION OF INVESTMENT MANAGEMENT AND SUB-ADVISORY AGREEMENTS:
Under the Investment Company Act of 1940 (the “1940 Act”), the Board of Trustees (the “Board”) of Wells Fargo Funds Trust (the “Trust”) must determine annually whether to approve the continuation of the Trust’s investment management and sub-advisory agreements. In this regard, at an in-person meeting held on May 24-25, 2016 (the “Meeting”), the Board, all the members of which have no direct or indirect interest in the investment management and sub-advisory agreements and are not “interested persons” of the Trust, as defined in the 1940 Act (the “Independent Trustees”), reviewed and approved for Wells Fargo Treasury Plus Money Market Fund (the “Fund”): (i) an investment management agreement (the “Management Agreement”) with Wells Fargo Funds Management, LLC (“Funds Management”); and (ii) an investment sub-advisory agreement (the “Sub-Advisory Agreement”) with Wells Capital Management Incorporated (the “Sub-Adviser”), an affiliate of Funds Management. The Management Agreement and the Sub-Advisory Agreement are collectively referred to as the “Advisory Agreements.”
At the Meeting, the Board considered the factors and reached the conclusions described below relating to the selection of Funds Management and the Sub-Adviser and the approval of the Advisory Agreements. Prior to the Meeting, including at an in-person meeting in April 2016, the Trustees conferred extensively among themselves and with representatives of Funds Management about these matters. Also, the Board has adopted a team-based approach, with each team consisting of a sub-set of Trustees, to assist the full Board in the discharge of its duties in reviewing performance and other matters throughout the year. The Independent Trustees were assisted in their evaluation of the Advisory Agreements by independent legal counsel, from whom they received separate legal advice and with whom they met separately.
In providing information to the Board, Funds Management and the Sub-Adviser were guided by a detailed set of requests for information submitted to them by independent legal counsel on behalf of the Independent Trustees at the start of the Board’s annual contract renewal process earlier in 2016. In considering and approving the Advisory Agreements, the Trustees considered the information they believed relevant, including but not limited to the information discussed below. The Board considered not only the specific information presented in connection with the Meeting, but also the knowledge gained over time through interaction with Funds Management and the Sub-Adviser about various topics. In this regard, the Board reviewed reports of Funds Management at each of its quarterly meetings, which included, among other things, portfolio reviews and performance reports. In addition, the Board and the teams mentioned above confer with portfolio managers at various times throughout the year. The Board did not identify any particular information or consideration that was all-important or controlling, and each individual Trustee may have attributed different weights to various factors.
After its deliberations, the Board unanimously approved the continuation of the Advisory Agreements for a one-year term and determined that the compensation payable to Funds Management and the Sub-Adviser under each of the Advisory Agreements was reasonable. The Board considered the approval of the Advisory Agreements for the Fund as part of its consideration of agreements for funds across the complex, but its approvals were made on a fund-by-fund basis. The following summarizes a number of important, but not necessarily all, factors considered by the Board in support of its approvals.
Nature, extent and quality of services
The Board received and considered various information regarding the nature, extent and quality of services provided to the Fund by Funds Management and the Sub-Adviser under the Advisory Agreements. This information included a description of the investment advisory services and Fund-level administrative services covered by the Management Agreement, as well as, among other things, a summary of the background and experience of senior management of Funds Management, and the qualifications, background, tenure and responsibilities of each of the portfolio managers primarily responsible for the day-to-day portfolio management of the Fund.
The Board evaluated the ability of Funds Management and the Sub-Adviser to attract and retain qualified investment professionals, including research, advisory and supervisory personnel. The Board further considered the compliance programs and compliance records of Funds Management and the Sub-Adviser. In addition, the Board took into account the full range of services provided to the Fund by Funds Management and its affiliates.
Fund performance and expenses
The Board considered the performance results for the Fund over various time periods ended December 31, 2015. The Board considered these results in comparison to the performance of funds in a universe that was determined by Broadridge Inc. (“Broadridge”) to be similar to the Fund (the “Universe”), and in comparison to other comparative data. Broadridge is an independent provider of investment company data. The Board received a description of the methodology used by Broadridge to select the mutual funds in the performance Universe. The Board noted that the performance of the Fund (Institutional Class) was higher than or equal to the average performance of the Universe for all periods under review. The Board noted that the Fund experienced a portfolio manager change in 2014.
| | | | | | |
| Other information (unaudited) | | Wells Fargo Treasury Plus Money Market Fund | | | 25 | |
The Board also received and considered information regarding the Fund’s net operating expense ratios and their various components, including actual management fees, custodian and other non-management fees, and Rule 12b-1 and non-Rule 12b-1 shareholder service fees. The Board considered these ratios in comparison to the median ratios of funds in class-specific expense groups that were determined by Broadridge to be similar to the Fund (the “Groups”). The Board received a description of the methodology used by Broadridge to select the mutual funds in the expense Groups and an explanation of how funds comprising expense groups and their expense ratios may vary from year-to-year. Based on the Broadridge reports, the Board noted that the net operating expense ratios of the Fund were in range of the median net operating expense ratios of the expense Groups.
The Board took into account the Fund performance and expense information provided to it among the factors considered in deciding to re-approve the Advisory Agreements.
Investment management and sub-advisory fee rates
The Board reviewed and considered the contractual fee rates payable by the Fund to Funds Management under the Management Agreement, as well as the contractual fee rates payable by the Fund to Funds Management for class-level administrative services under a Class-Level Administration Agreement, which include class-level transfer agency and sub-transfer agency costs (collectively, the “Management Rates”). The Board also reviewed and considered the contractual investment sub-advisory fee rates that are payable by Funds Management to the Sub-Adviser for investment sub-advisory services.
Among other information reviewed by the Board was a comparison of the Fund’s Management Rates with the average contractual investment management fee rates of funds in the expense Groups at a common asset level as well as transfer agency costs of the funds in the expense Groups. The Board noted that the Management Rates of the Fund were lower than or in range of the sum of these average rates for the Fund’s expense Groups for all share classes.
The Board also received and considered information about the portion of the total management fee that was retained by Funds Management after payment of the fee to the Sub-Adviser for sub-advisory services. In assessing the reasonableness of this amount, the Board received and evaluated information about the nature and extent of responsibilities retained and risks assumed by Funds Management and not delegated to or assumed by the Sub-Adviser, and about Funds Management’s on-going oversight services. However, given the affiliation between Funds Management and the Sub-Adviser, the Board ascribed limited relevance to the allocation of fees between them.
The Board also received and considered information about the nature and extent of services offered and fee rates charged by Funds Management and the Sub-Adviser to other types of clients with investment strategies similar to those of the Fund. In this regard, the Board received information about the significantly greater scope of services, and compliance, reporting and other legal burdens and risks of managing mutual funds compared with those associated with managing assets of non-mutual fund clients such as collective funds or institutional separate accounts.
Based on its consideration of the factors and information it deemed relevant, including those described here, the Board determined that the compensation payable to Funds Management under the Management Agreement and to the Sub-Adviser under the Sub-Advisory Agreement was reasonable, in light of the services covered by the Advisory Agreements.
Profitability
The Board received and considered information concerning the profitability of Funds Management, as well as the profitability of Wells Fargo as a whole, from providing services to the Fund and the fund family as a whole. The Board also received and considered information concerning the profitability of the Sub-Adviser from providing services to the fund family as a whole, noting that the Sub-Adviser’s profitability information with respect to providing services to the Fund was subsumed in the Wells Fargo and Funds Management profitability analysis.
Funds Management reported on the methodologies and estimates used in calculating profitability. Among other things, the Board noted that the levels of profitability reported on a fund-by-fund basis varied widely, depending on factors such as the size and type of fund. Based on its review, the Board did not deem the profits reported by Funds Management or Wells Fargo from its services to the Fund to be at a level that would prevent it from approving the continuation of the Advisory Agreements.
Economies of scale
With respect to possible economies of scale, the Board noted the existence of breakpoints in the Fund’s management fee structure, which operate generally to reduce the Fund’s expense ratios as the Fund grows in size. It considered that, for a small fund or a fund that shrinks in size, breakpoints conversely can result in higher fee levels. The Board also considered that fee waiver and expense reimbursement arrangements and competitive fee rates at the outset are means of sharing
| | | | |
| 26 | | Wells Fargo Treasury Plus Money Market Fund | | Other information (unaudited) |
potential economies of scale with shareholders of the Fund and the fund family as a whole. The Board considered Funds Management’s view that any analyses of potential economies of scale in managing a particular fund are inherently limited in light of the joint and common costs and investments that Funds Management incurs across the fund family as a whole.
The Board concluded that the Fund’s fee and expense arrangements, including contractual breakpoints, constituted a reasonable approach to sharing potential economies of scale with the Fund and its shareholders.
Other benefits to Funds Management and the Sub-Adviser
The Board received and considered information regarding potential “fall-out” or ancillary benefits received by Funds Management and its affiliates, including the Sub-Adviser, as a result of their relationships with the Fund. Ancillary benefits could include, among others, benefits directly attributable to other relationships with the Fund and benefits potentially derived from an increase in Funds Management’s and the Sub-Adviser’s business as a result of their relationships with the Fund. The Board noted that various affiliates of Funds Management may receive distribution-related fees, shareholder servicing payments and sub-transfer agency fees in respect of shares sold or held through them and services provided.
The Board also reviewed information about soft dollar credits earned and utilized by the Sub-Adviser, fees earned by Funds Management and the Sub-Adviser from managing a private investment vehicle for the fund family’s securities lending collateral and commissions earned by an affiliated broker from portfolio transactions.
Based on its consideration of the factors and information it deemed relevant, including those described here, the Board did not find that any ancillary benefits received by Funds Management and its affiliates, including the Sub-Adviser, were unreasonable.
Conclusion
At the Meeting, after considering the above-described factors and based on its deliberations and its evaluation of the information described above, the Board unanimously approved the continuation of the Advisory Agreements for a one-year term and determined that the compensation payable to Funds Management and the Sub-Adviser under each of the Advisory Agreements was reasonable.
| | | | | | |
| List of abbreviations | | Wells Fargo Treasury Plus Money Market Fund | | | 27 | |
The following is a list of common abbreviations for terms and entities that may have appeared in this report.
| ACA | — ACA Financial Guaranty Corporation |
| ADR | — American depositary receipt |
| ADS | — American depositary shares |
| AGC | — Assured Guaranty Corporation |
| AGM | — Assured Guaranty Municipal |
| Ambac | — Ambac Financial Group Incorporated |
| AMT | — Alternative minimum tax |
| BAN | — Bond anticipation notes |
| BHAC | — Berkshire Hathaway Assurance Corporation |
| CAB | — Capital appreciation bond |
| CCAB | — Convertible capital appreciation bond |
| CDA | — Community Development Authority |
| CDO | — Collateralized debt obligation |
| DRIVER | — Derivative inverse tax-exempt receipts |
| DW&P | — Department of Water & Power |
| DWR | — Department of Water Resources |
| ECFA | — Educational & Cultural Facilities Authority |
| EDA | — Economic Development Authority |
| EDFA | — Economic Development Finance Authority |
| ETF | — Exchange-traded fund |
| FDIC | — Federal Deposit Insurance Corporation |
| FFCB | — Federal Farm Credit Banks |
| FGIC | — Financial Guaranty Insurance Corporation |
| FHA | — Federal Housing Administration |
| FHLB | — Federal Home Loan Bank |
| FHLMC | — Federal Home Loan Mortgage Corporation |
| FICO | — The Financing Corporation |
| FNMA | — Federal National Mortgage Association |
| GDR | — Global depositary receipt |
| GNMA | — Government National Mortgage Association |
| HCFR | — Healthcare facilities revenue |
| HEFA | — Health & Educational Facilities Authority |
| HEFAR | — Higher education facilities authority revenue |
| HFA | — Housing Finance Authority |
| HFFA | — Health Facilities Financing Authority |
| HUD | — Department of Housing and Urban Development |
| IDA | — Industrial Development Authority |
| IDAG | — Industrial Development Agency |
| KRW | — Republic of Korea won |
| LIBOR | — London Interbank Offered Rate |
| LIFER | — Long Inverse Floating Exempt Receipts |
| LLC | — Limited liability company |
| LLLP | — Limited liability limited partnership |
| LLP | — Limited liability partnership |
| MBIA | — Municipal Bond Insurance Association |
| MFHR | — Multifamily housing revenue |
| MSTR | — Municipal securities trust receipts |
| MUD | — Municipal Utility District |
| National | — National Public Finance Guarantee Corporation |
| PCFA | — Pollution Control Financing Authority |
| PCL | — Public Company Limited |
| PCR | — Pollution control revenue |
| PFA | — Public Finance Authority |
| PFFA | — Public Facilities Financing Authority |
| PFOTER | — Puttable floating option tax-exempt receipts |
| plc | — Public limited company |
| PUTTER | — Puttable tax-exempt receipts |
| R&D | — Research & development |
| Radian | — Radian Asset Assurance |
| RAN | — Revenue anticipation notes |
| RDA | — Redevelopment Authority |
| RDFA | — Redevelopment Finance Authority |
| REIT | — Real estate investment trust |
| ROC | — Reset option certificates |
| SAVRS | — Select auction variable rate securities |
| SBA | — Small Business Authority |
| SDR | — Swedish depositary receipt |
| SFHR | — Single-family housing revenue |
| SFMR | — Single-family mortgage revenue |
| SPA | — Standby purchase agreement |
| SPDR | — Standard & Poor’s Depositary Receipts |
| SPEAR | — Short Puttable Exempt Adjustable Receipts |
| STRIPS | — Separate trading of registered interest and |
| TAN | — Tax anticipation notes |
| TIPS | — Treasury inflation-protected securities |
| TRAN | — Tax revenue anticipation notes |
| TTFA | — Transportation Trust Fund Authority |
| TVA | — Tennessee Valley Authority |
This page is intentionally left blank.

For more information
More information about Wells Fargo Funds is available free upon request. To obtain literature, please write, email, visit the Fund’s website, or call:
Wells Fargo Funds
P.O. Box 8266
Boston, MA 02266-8266
Email: fundservice@wellsfargo.com
Website: wellsfargofunds.com
Individual investors: 1-800-222-8222
Retail investment professionals: 1-888-877-9275
Institutional investment professionals: 1-866-765-0778
This report and the financial statements contained herein are submitted for the general information of the shareholders of the Fund. If this report is used for promotional purposes, distribution of the report must be accompanied or preceded by a current prospectus. Before investing, please consider the investment objectives, risks, charges, and expenses of the investment. For a current prospectus and, if available, a summary prospectus, containing this information, call 1-800-222-8222 or visit the Fund’s website at wellsfargofunds.com. Read the prospectus carefully before you invest or send money.
Wells Fargo Asset Management (WFAM) is a trade name used by the asset management businesses of Wells Fargo & Company. Wells Fargo Funds Management, LLC, a wholly owned subsidiary of Wells Fargo & Company, provides investment advisory and administrative services for Wells Fargo Funds. Other affiliates of Wells Fargo & Company provide subadvisory and other services for the funds. The funds are distributed by Wells Fargo Funds Distributor, LLC, Member FINRA, an affiliate of Wells Fargo & Company.
NOT FDIC INSURED ¡ NO BANK GUARANTEE ¡ MAY LOSE VALUE
© 2016 Wells Fargo Funds Management, LLC. All rights reserved.
| | |
 | | 245339 09-16 SA314/SAR314 07-16 |
Not applicable.
| ITEM 3. | AUDIT COMMITTEE FINANCIAL EXPERT |
Not applicable.
| ITEM 4. | PRINCIPAL ACCOUNTANT FEES AND SERVICES |
Not applicable.
| ITEM 5. | AUDIT COMMITTEE OF LISTED REGISTRANTS |
Not applicable.
Wells Fargo Money Market Fund and Wells Fargo National Tax-Free Money Market Fund included a Summary Portfolio of Investments under Item 1. A Portfolio of Investments for each of Wells Fargo Money Market Fund and Wells Fargo National Tax-Free Money Market Fund are filed under this Item.
| | | | | | |
| Portfolio of investments—July 31, 2016 (unaudited) | | Wells Fargo Money Market Fund | | | 1 | |
| | | | | | | | | | | | | | | | |
| Security name | | Interest rate | | | Maturity date | | | Principal | | | Value | |
| | | | |
Agency Securities: 0.63% | | | | | | | | | | | | | | | | |
FHLB (z) | | | 0.41 | % | | | 8-3-2016 | | | $ | 10,000,000 | | | $ | 9,999,772 | |
| | | | | | | | | | | | | | | | |
| | | | |
Total Agency Securities (Cost $9,999,772) | | | | | | | | | | | | | | | 9,999,772 | |
| | | | | | | | | | | | | | | | |
| | | | |
Certificates of Deposit: 21.39% | | | | | | | | | | | | | | | | |
ABN AMRO Funding LLC | | | 0.40 | | | | 8-1-2016 | | | | 13,000,000 | | | | 13,000,000 | |
Australia & New Zealand Banking Group | | | 0.30 | | | | 8-1-2016 | | | | 20,000,000 | | | | 20,000,000 | |
Bank of Montreal | | | 0.44 | | | | 8-1-2016 | | | | 14,000,000 | | | | 14,000,000 | |
Bank of Montreal | | | 0.44 | | | | 8-2-2016 | | | | 7,000,000 | | | | 7,000,000 | |
Barclays Bank plc 144A(z) | | | 0.68 | | | | 8-1-2016 | | | | 7,000,000 | | | | 7,000,000 | |
Barclays Bank plc 144A(z) | | | 0.68 | | | | 8-5-2016 | | | | 3,000,000 | | | | 2,999,773 | |
Citibank (New York) | | | 0.53 | | | | 8-2-2016 | | | | 3,000,000 | | | | 3,000,000 | |
Citibank (New York) | | | 0.55 | | | | 8-26-2016 | | | | 3,000,000 | | | | 3,000,000 | |
Cooperatieve Centrale ± | | | 0.82 | | | | 9-7-2016 | | | | 2,000,000 | | | | 2,000,000 | |
Credit Agricole SA | | | 0.32 | | | | 8-1-2016 | | | | 32,000,000 | | | | 32,000,000 | |
DG Bank (New York) | | | 0.65 | | | | 8-8-2016 | | | | 8,000,000 | | | | 8,000,058 | |
DNB Nor Bank ASA | | | 0.30 | | | | 8-1-2016 | | | | 33,000,000 | | | | 33,000,000 | |
HSBC Bank plc | | | 0.35 | | | | 8-1-2016 | | | | 32,000,000 | | | | 32,000,000 | |
HSBC Bank plc ± | | | 0.80 | | | | 8-1-2016 | | | | 3,000,000 | | | | 3,000,000 | |
KBC Bank | | | 0.32 | | | | 8-1-2016 | | | | 29,000,000 | | | | 29,000,000 | |
Mitsubishi Trust & Bank | | | 0.64 | | | | 8-5-2016 | | | | 4,000,000 | | | | 4,000,000 | |
Mizuho Corporate Bank (z) | | | 0.72 | | | | 8-3-2016 | | | | 5,000,000 | | | | 4,999,800 | |
Mizuho Corporate Bank (z) | | | 0.75 | | | | 9-9-2016 | | | | 4,000,000 | | | | 3,996,756 | |
National Bank of Canada | | | 0.30 | | | | 8-1-2016 | | | | 17,000,000 | | | | 17,000,000 | |
NBAD Americas NV | | | 0.37 | | | | 8-1-2016 | | | | 27,000,000 | | | | 27,000,000 | |
Norinchukin Bank | | | 0.53 | | | | 8-5-2016 | | | | 5,000,000 | | | | 5,000,000 | |
Norinchukin Bank | | | 0.64 | | | | 9-15-2016 | | | | 4,000,000 | | | | 4,000,000 | |
Standard Chartered Bank | | | 0.65 | | | | 8-15-2016 | | | | 4,000,000 | | | | 4,000,000 | |
Standard Chartered Bank | | | 0.65 | | | | 8-22-2016 | | | | 3,000,000 | | | | 3,000,000 | |
State Street Bank & Trust Company ± | | | 0.82 | | | | 9-2-2016 | | | | 2,000,000 | | | | 2,000,000 | |
Sumitomo Mitsui Banking Corporation | | | 0.62 | | | | 8-5-2016 | | | | 8,000,000 | | | | 8,000,000 | |
Sumitomo Mitsui Banking Corporation | | | 0.65 | | | | 8-10-2016 | | | | 2,000,000 | | | | 2,000,075 | |
Sumitomo Trust & Banking Corporation | | | 0.46 | | | | 8-1-2016 | | | | 20,000,000 | | | | 20,000,000 | |
Swedbank | | | 0.30 | | | | 8-1-2016 | | | | 27,000,000 | | | | 27,000,000 | |
| | | | |
Total Certificates of Deposit (Cost $340,996,462) | | | | | | | | | | | | | | | 340,996,462 | |
| | | | | | | | | | | | | | | | |
| | | | |
Commercial Paper: 28.26% | | | | | | | | | | | | | | | | |
| | | | |
| Asset-Backed Commercial Paper: 16.70% | | | | | | | | | | | | | | | | |
Alpine Securitization Limited 144A(z) | | | 0.55 | | | | 8-8-2016 | | | | 9,000,000 | | | | 8,999,038 | |
Alpine Securitization Limited 144A(z) | | | 0.57 | | | | 8-11-2016 | | | | 3,000,000 | | | | 2,999,525 | |
Alpine Securitization Limited 144A(z) | | | 0.57 | | | | 8-12-2016 | | | | 5,000,000 | | | | 4,999,129 | |
Anglesea Funding LLC 144A(z) | | | 0.50 | | | | 8-1-2016 | | | | 10,000,000 | | | | 10,000,000 | |
Anglesea Funding LLC 144A± | | | 0.62 | | | | 9-7-2016 | | | | 5,000,000 | | | | 5,000,000 | |
Anglesea Funding LLC 144A± | | | 0.62 | | | | 8-10-2016 | | | | 5,000,000 | | | | 5,000,000 | |
Antalis SA 144A(z) | | | 0.67 | | | | 8-9-2016 | | | | 3,000,000 | | | | 2,999,553 | |
Antalis SA 144A(z) | | | 0.70 | | | | 9-6-2016 | | | | 2,000,000 | | | | 1,998,600 | |
Antalis SA 144A(z) | | | 0.70 | | | | 9-9-2016 | | | | 1,000,000 | | | | 999,242 | |
Atlantic Asset Securitization Corporation 144A± | | | 0.63 | | | | 12-5-2016 | | | | 3,000,000 | | | | 2,999,993 | |
Atlantic Asset Securitization Corporation 144A± | | | 0.63 | | | | 12-9-2016 | | | | 3,000,000 | | | | 2,999,983 | |
Atlantic Asset Securitization Corporation 144A± | | | 0.64 | | | | 12-16-2016 | | | | 4,000,000 | | | | 3,999,985 | |
| | | | |
| 2 | | Wells Fargo Money Market Fund | | Portfolio of investments—July 31, 2016 (unaudited) |
| | | | | | | | | | | | | | | | |
| Security name | | Interest rate | | | Maturity date | | | Principal | | | Value | |
| | | | |
| Asset-Backed Commercial Paper (continued) | | | | | | | | | | | | | | | | |
Barton Capital Corporation 144A(z) | | | 0.62 | % | | | 8-1-2016 | | | $ | 1,000,000 | | | $ | 1,000,000 | |
Bedford Row Funding Corporation 144A± | | | 0.82 | | | | 8-1-2016 | | | | 2,000,000 | | | | 2,000,000 | |
Bennington Stark Capital Company LLC 144A(z) | | | 0.50 | | | | 8-2-2016 | | | | 15,000,000 | | | | 14,999,792 | |
Bennington Stark Capital Company LLC 144A(z) | | | 0.50 | | | | 8-3-2016 | | | | 3,000,000 | | | | 2,999,917 | |
Caisse D’amortissement de la Dette Sociale 144A(z) | | | 0.68 | | | | 9-19-2016 | | | | 9,600,000 | | | | 9,591,180 | |
Cancara Asset Security Limited (z) | | | 0.56 | | | | 8-26-2016 | | | | 2,000,000 | | | | 1,999,222 | |
Chesham Finance Limited 144A(z) | | | 0.50 | | | | 8-1-2016 | | | | 7,000,000 | | | | 7,000,000 | |
Concord Minutemen Capital Company 144A(z) | | | 0.47 | | | | 8-2-2016 | | | | 6,000,000 | | | | 5,999,922 | |
Concord Minutemen Capital Company 144A(z) | | | 0.47 | | | | 8-4-2016 | | | | 8,000,000 | | | | 7,999,687 | |
Crown Point Capital Company LLC 144A± | | | 0.64 | | | | 8-22-2016 | | | | 5,000,000 | | | | 5,000,000 | |
Crown Point Capital Company LLC 144A±%% | | | 0.67 | | | | 11-7-2016 | | | | 5,000,000 | | | | 5,000,000 | |
Crown Point Capital Company LLC 144A± | | | 0.69 | | | | 10-25-2016 | | | | 5,000,000 | | | | 5,000,000 | |
Gotham Funding Corporation 144A(z) | | | 0.57 | | | | 8-10-2016 | | | | 4,000,000 | | | | 3,999,430 | |
Gotham Funding Corporation 144A(z) | | | 0.60 | | | | 8-26-2016 | | | | 3,000,000 | | | | 2,998,750 | |
Halkin Finance LLC 144A(z) | | | 0.53 | | | | 8-1-2016 | | | | 4,000,000 | | | | 4,000,000 | |
Institutional Secured Funding LLC 144A(z) | | | 0.55 | | | | 8-1-2016 | | | | 20,000,000 | | | | 20,000,000 | |
Institutional Secured Funding LLC 144A(z) | | | 0.65 | | | | 8-12-2016 | | | | 2,000,000 | | | | 1,999,603 | |
Kells Funding LLC 144A(z) | | | 0.59 | | | | 8-9-2016 | | | | 2,000,000 | | | | 1,999,738 | |
Kells Funding LLC 144A(z) | | | 0.59 | | | | 8-23-2016 | | | | 3,000,000 | | | | 2,998,918 | |
Kells Funding LLC 144A(z) | | | 0.64 | | | | 9-20-2016 | | | | 1,000,000 | | | | 999,111 | |
Kells Funding LLC 144A(z) | | | 0.64 | | | | 9-22-2016 | | | | 2,000,000 | | | | 1,998,151 | |
Lexington Parker Capital Company LLC 144A(z) | | | 0.47 | | | | 8-2-2016 | | | | 6,000,000 | | | | 5,999,922 | |
Lexington Parker Capital Company LLC 144A(z) | | | 0.47 | | | | 8-1-2016 | | | | 8,000,000 | | | | 8,000,000 | |
Lexington Parker Capital Company LLC 144A(z) | | | 0.47 | | | | 8-4-2016 | | | | 4,000,000 | | | | 3,999,843 | |
LMA Americas LLC 144A(z) | | | 0.55 | | | | 9-2-2016 | | | | 3,000,000 | | | | 2,998,533 | |
LMA Americas LLC 144A(z) | | | 0.56 | | | | 8-11-2016 | | | | 2,000,000 | | | | 1,999,689 | |
Matchpoint Finance plc 144A(z) | | | 0.45 | | | | 8-1-2016 | | | | 2,632,000 | | | | 2,632,000 | |
Matchpoint Finance plc 144A(z) | | | 0.68 | | | | 9-1-2016 | | | | 2,000,000 | | | | 1,998,829 | |
Mountcliff Funding LLC 144A(z) | | | 0.51 | | | | 8-1-2016 | | | | 9,000,000 | | | | 9,000,000 | |
Nieuw Amsterdam Receivable 144A(z) | | | 0.56 | | | | 8-17-2016 | | | | 2,000,000 | | | | 1,999,502 | |
Nieuw Amsterdam Receivable 144A(z) | | | 0.70 | | | | 8-8-2016 | | | | 2,000,000 | | | | 1,999,728 | |
Nieuw Amsterdam Receivable 144A(z) | | | 0.70 | | | | 8-22-2016 | | | | 2,000,000 | | | | 1,999,183 | |
Regency Markets No.1 LLC (z) | | | 0.55 | | | | 8-12-2016 | | | | 1,000,000 | | | | 999,832 | |
Sheffield Receivable 144A(z) | | | 0.65 | | | | 8-4-2016 | | | | 8,000,000 | | | | 7,999,567 | |
Starbird Funding Corporation 144A(z) | | | 0.63 | | | | 8-1-2016 | | | | 4,000,000 | | | | 4,000,000 | |
Starbird Funding Corporation 144A(z) | | | 0.63 | | | | 8-2-2016 | | | | 2,000,000 | | | | 1,999,965 | |
Starbird Funding Corporation 144A(z) | | | 0.63 | | | | 8-3-2016 | | | | 4,000,000 | | | | 3,999,860 | |
Starbird Funding Corporation 144A(z) | | | 0.64 | | | | 8-10-2016 | | | | 4,000,000 | | | | 3,999,360 | |
Starbird Funding Corporation 144A± | | | 0.64 | | | | 9-16-2016 | | | | 2,000,000 | | | | 2,000,000 | |
Starbird Funding Corporation 144A(z) | | | 0.68 | | | | 9-1-2016 | | | | 3,000,000 | | | | 2,998,243 | |
Versailles Commercial Paper LLC 144A± | | | 0.63 | | | | 12-8-2016 | | | | 7,000,000 | | | | 7,000,000 | |
Versailles Commercial Paper LLC 144A(z) | | | 0.70 | | | | 8-1-2016 | | | | 5,000,000 | | | | 5,000,000 | |
Victory Receivables 144A(z) | | | 0.57 | | | | 8-22-2016 | | | | 3,000,000 | | | | 2,999,003 | |
Victory Receivables 144A(z) | | | 0.58 | | | | 8-30-2016 | | | | 3,000,000 | | | | 2,998,598 | |
Victory Receivables 144A(z) | | | 0.60 | | | | 8-25-2016 | | | | 3,000,000 | | | | 2,998,800 | |
Victory Receivables 144A(z) | | | 0.60 | | | | 8-26-2016 | | | | 3,000,000 | | | | 2,998,750 | |
Victory Receivables 144A(z) | | | 0.60 | | | | 9-7-2016 | | | | 5,000,000 | | | | 4,996,917 | |
Working Capital Management Company 144A(z) | | | 0.58 | | | | 8-1-2016 | | | | 4,000,000 | | | | 4,000,000 | |
| | | | |
| | | | | | | | | | | | | | | 266,194,593 | |
| | | | | | | | | | | | | | | | |
| | | | | | |
| Portfolio of investments—July 31, 2016 (unaudited) | | Wells Fargo Money Market Fund | | | 3 | |
| | | | | | | | | | | | | | | | |
| Security name | | Interest rate | | | Maturity date | | | Principal | | | Value | |
| | | | |
| Financial Company Commercial Paper: 9.68% | | | | | | | | | | | | | | | | |
ANZ Banking Group Limited 144A(z) | | | 0.57 | % | | | 8-2-2016 | | | $ | 4,000,000 | | | $ | 3,999,937 | |
ANZ Banking Group Limited 144A(z) | | | 0.65 | | | | 8-22-2016 | | | | 4,000,000 | | | | 3,998,483 | |
ANZ Banking Group Limited 144A(z) | | | 0.65 | | | | 8-26-2016 | | | | 4,000,000 | | | | 3,998,194 | |
Banco de Credito e Inversiones 144A(z) | | | 0.85 | | | | 8-29-2016 | | | | 5,000,000 | | | | 4,996,694 | |
Banco de Credito e Inversiones 144A(z) | | | 0.85 | | | | 8-30-2016 | | | | 3,000,000 | | | | 2,997,946 | |
Bank of Nova Scotia 144A(z) | | | 0.60 | | | | 9-21-2016 | | | | 3,000,000 | | | | 2,997,450 | |
Banque et Caisse d’Epargne de l’Etat (z) | | | 0.66 | | | | 9-1-2016 | | | | 4,000,000 | | | | 3,997,727 | |
Caisse Centrale Desjardins du Quebec 144A(z) | | | 0.52 | | | | 8-9-2016 | | | | 5,000,000 | | | | 4,999,422 | |
Caisse Centrale Desjardins du Quebec 144A(z) | | | 0.55 | | | | 8-8-2016 | | | | 8,200,000 | | | | 8,199,127 | |
Caisse Centrale Desjardins du Quebec 144A(z) | | | 0.63 | | | | 9-15-2016 | | | | 3,000,000 | | | | 2,997,638 | |
Caisse Centrale Desjardins du Quebec 144A(z) | | | 0.65 | | | | 9-12-2016 | | | | 4,000,000 | | | | 3,996,967 | |
Caisse Centrale Desjardins du Quebec 144A(z) | | | 0.67 | | | | 9-29-2016 | | | | 2,000,000 | | | | 1,997,804 | |
Commonwealth Bank of Australia 144A(z) | | | 0.62 | | | | 9-6-2016 | | | | 6,000,000 | | | | 5,996,280 | |
Commonwealth Bank of Australia 144A± | | | 0.83 | | | | 8-17-2016 | | | | 7,000,000 | | | | 7,000,000 | |
Dexia Credit Local (z) | | | 0.65 | | | | 9-12-2016 | | | | 8,000,000 | | | | 7,993,933 | |
HSBC Bank plc 144A(z) | | | 0.63 | | | | 9-9-2016 | | | | 3,000,000 | | | | 2,997,953 | |
Macquarie Bank Limited 144A(z) | | | 0.55 | | | | 8-1-2016 | | | | 7,000,000 | | | | 7,000,000 | |
Macquarie Bank Limited 144A(z) | | | 0.55 | | | | 8-18-2016 | | | | 4,000,000 | | | | 3,998,961 | |
Macquarie Bank Limited 144A(z) | | | 0.55 | | | | 8-19-2016 | | | | 4,000,000 | | | | 3,998,900 | |
Macquarie Bank Limited 144A(z) | | | 0.64 | | | | 9-1-2016 | | | | 2,000,000 | | | | 1,998,898 | |
Macquarie Bank Limited 144A(z) | | | 0.65 | | | | 9-7-2016 | | | | 4,000,000 | | | | 3,997,348 | |
National Australia Bank Limited 144A± | | | 0.80 | | | | 8-4-2016 | | | | 3,000,000 | | | | 3,000,000 | |
National Securities Clearing Corporation 144A(z) | | | 0.50 | | | | 8-8-2016 | | | | 2,000,000 | | | | 1,999,806 | |
Nationwide Building Society 144A(z) | | | 0.64 | | | | 8-15-2016 | | | | 4,000,000 | | | | 3,999,004 | |
Nationwide Building Society 144A(z) | | | 0.70 | | | | 9-2-2016 | | | | 4,000,000 | | | | 3,997,511 | |
Nederlandse Waterschapsbank NV 144A(z) | | | 0.56 | | | | 8-8-2016 | | | | 8,000,000 | | | | 7,999,129 | |
Nederlandse Waterschapsbank NV 144A(z) | | | 0.63 | | | | 9-1-2016 | | | | 6,000,000 | | | | 5,996,771 | |
NRW Bank 144A(z) | | | 0.44 | | | | 8-2-2016 | | | | 10,000,000 | | | | 9,999,878 | |
NRW Bank 144A(z) | | | 0.61 | | | | 9-16-2016 | | | | 3,000,000 | | | | 2,997,662 | |
NV Bank Nederlandse Gemeenten 144A(z) | | | 0.63 | | | | 8-31-2016 | | | | 8,000,000 | | | | 7,995,800 | |
Ontario Teachers Finance Trust 144A(z) | | | 0.66 | | | | 9-21-2016 | | | | 2,000,000 | | | | 1,998,130 | |
Suncorp Group Limited 144A(z) | | | 0.74 | | | | 9-6-2016 | | | | 6,000,000 | | | | 5,995,560 | |
Suncorp Group Limited 144A(z) | | | 0.75 | | | | 9-8-2016 | | | | 4,200,000 | | | | 4,196,675 | |
| | | | |
| | | | | | | | | | | | | | | 154,335,588 | |
| | | | | | | | | | | | | | | | |
| | | | |
| Other Commercial Paper: 1.88% | | | | | | | | | | | | | | | | |
Caisse des Depots et Consignations 144A(z) | | | 0.49 | | | | 8-2-2016 | | | | 2,000,000 | | | | 1,999,973 | |
China Shipping Container Lines (z) | | | 1.00 | | | | 8-1-2016 | | | | 14,000,000 | | | | 14,000,000 | |
Erste Abwicklungsanstalt 144A(z) | | | 0.66 | | | | 8-22-2016 | | | | 3,000,000 | | | | 2,998,845 | |
Sinochem Capital Company Limited (z) | | | 0.47 | | | | 8-1-2016 | | | | 4,000,000 | | | | 4,000,000 | |
Toyota Motor Credit Corporation (z) | | | 0.60 | | | | 8-3-2016 | | | | 7,000,000 | | | | 6,999,763 | |
| | | | |
| | | | | | | | | | | | | | | 29,998,581 | |
| | | | | | | | | | | | | | | | |
| | | | |
Total Commercial Paper (Cost $450,528,762) | | | | | | | | | | | | | | | 450,528,762 | |
| | | | | | | | | | | | | | | | |
| | | | |
Municipal Obligations: 18.31% | | | | | | | | | | | | | | | | |
| | | | |
Alabama: 0.13% | | | | | | | | | | | | | | | | |
| | | | |
| Variable Rate Demand Note ø: 0.13% | | | | | | | | | | | | | | | | |
Tuscaloosa County AL IDA Gulf Opportunity Zone Hunt Refining Project Series J (Industrial Development Revenue, Bank of Nova Scotia LOC) | | | 0.46 | | | | 4-1-2028 | | | | 2,000,000 | | | | 2,000,000 | |
| | | | | | | | | | | | | | | | |
| | | | |
| 4 | | Wells Fargo Money Market Fund | | Portfolio of investments—July 31, 2016 (unaudited) |
| | | | | | | | | | | | | | | | |
| Security name | | Interest rate | | | Maturity date | | | Principal | | | Value | |
| | | | |
Arizona: 0.38% | | | | | | | | | | | | | | | | |
| | | | |
| Other Municipal Debt: 0.38% | | | | | | | | | | | | | | | | |
Salt River Project Agricultural Improvement & Power District Series D1 (Utilities Revenue) (z) | | | 0.52 | % | | | 8-8-2016 | | | $ | 4,000,000 | | | $ | 3,999,596 | |
Salt River Project Agricultural Improvement & Power District Series D1 (Utilities Revenue) (z) | | | 0.52 | | | | 8-10-2016 | | | | 2,000,000 | | | | 1,999,740 | |
| | | | |
| | | | | | | | | | | | | | | 5,999,336 | |
| | | | | | | | | | | | | | | | |
| | | | |
Arkansas: 0.13% | | | | | | | | | | | | | | | | |
| | | | |
| Variable Rate Demand Note ø: 0.13% | | | | | | | | | | | | | | | | |
Maumelle AR Taxable Variable Kimberly Clark Corporation (Industrial Development Revenue) 144A | | | 0.47 | | | | 8-1-2045 | | | | 2,000,000 | | | | 2,000,000 | |
| | | | | | | | | | | | | | | | |
| | | | |
California: 0.56% | | | | | | | | | | | | | | | | |
| | | | |
| Variable Rate Demand Notes ø: 0.56% | | | | | | | | | | | | | | | | |
Modesto CA Water Certificate of Participation Sereis A (Water & Sewer Revenue, JPMorgan Chase & Company LOC, AGC Insured) | | | 0.43 | | | | 10-1-2036 | | | | 2,000,000 | | | | 2,000,000 | |
Puttable Floating Option Taxable Series PT-4699 (Health Revenue, National Insured, Bank of America NA LIQ) 144A | | | 0.61 | | | | 9-1-2028 | | | | 2,000,000 | | | | 2,000,000 | |
San Francisco City & County CA Airports Commission Variable Reference second Series A-1 (Airport Revenue, Bank of America NA LOC) | | | 0.44 | | | | 5-1-2030 | | | | 5,000,000 | | | | 5,000,000 | |
| | | | |
| | | | | | | | | | | | | | | 9,000,000 | |
| | | | | | | | | | | | | | | | |
| | | | |
Colorado: 1.48% | | | | | | | | | | | | | | | | |
| | | | |
| Variable Rate Demand Notes ø: 1.48% | | | | | | | | | | | | | | | | |
Colorado HFA Catholic Health Initiatives Series 7WE (Health Revenue, Barclays Bank plc LOC) 144A | | | 0.59 | | | | 8-1-2018 | | | | 5,000,000 | | | | 5,000,000 | |
Colorado HFA Series A-1 Class I (Housing Revenue, FHLB SPA) | | | 0.50 | | | | 10-1-2034 | | | | 2,000,000 | | | | 2,000,000 | |
Colorado HFA MFHR Project B-2 (Housing Revenue, FHLB SPA) | | | 0.48 | | | | 5-1-2052 | | | | 14,675,000 | | | | 14,675,000 | |
Colorado Southern Ute Indian Tribe Reservation Series 2007 (Miscellaneous Revenue) | | | 0.53 | | | | 1-1-2027 | | | | 2,000,000 | | | | 2,000,000 | |
| | | | |
| | | | | | | | | | | | | | | 23,675,000 | |
| | | | | | | | | | | | | | | | |
| | | | |
Connecticut: 2.49% | | | | | | | | | | | | | | | | |
| | | | |
| Variable Rate Demand Notes ø: 2.49% | | | | | | | | | | | | | | | | |
Connecticut Series C (GO Revenue, Bank of America NA SPA) | | | 0.45 | | | | 5-15-2034 | | | | 6,000,000 | | | | 6,000,000 | |
Puttable Floating Option Taxable Series TNP-1013 (Miscellaneous Revenue, Bank of America NA LIQ) 144A | | | 0.55 | | | | 4-15-2046 | | | | 33,645,000 | | | | 33,645,000 | |
| | | | |
| | | | | | | | | | | | | | | 39,645,000 | |
| | | | | | | | | | | | | | | | |
| | | | |
District of Columbia: 1.88% | | | | | | | | | | | | | | | | |
| | | | |
| Variable Rate Demand Notes ø: 1.88% | | | | | | | | | | | | | | | | |
Howard University (Education Revenue) ± | | | 0.54 | | | | 8-1-2031 | | | | 28,000,000 | | | | 28,000,000 | |
Metropolitan Washington District of Columbia Airports Sub Series A-1 (Airport Revenue, Royal Bank of Canada LOC) | | | 0.46 | | | | 10-1-2039 | | | | 2,000,000 | | | | 2,000,000 | |
| | | | |
| | | | | | | | | | | | | | | 30,000,000 | |
| | | | | | | | | | | | | | | | |
| | | | | | |
| Portfolio of investments—July 31, 2016 (unaudited) | | Wells Fargo Money Market Fund | | | 5 | |
| | | | | | | | | | | | | | | | |
| Security name | | Interest rate | | | Maturity date | | | Principal | | | Value | |
| | | | |
Georgia: 0.31% | | | | | | | | | | | | | | | | |
| | | | |
| Variable Rate Demand Note ø: 0.31% | | | | | | | | | | | | | | | | |
Columbus GA Housing Development Authority Puttable Floating Option Taxable Notes Series TN-024 (Housing Revenue, ACA Insured, Bank of America NA LIQ) 144A | | | 0.74 | % | | | 10-1-2039 | | | $ | 4,935,000 | | | $ | 4,935,000 | |
| | | | | | | | | | | | | | | | |
| | | | |
Idaho: 0.13% | | | | | | | | | | | | | | | | |
| | | | |
| Other Municipal Debt: 0.13% | | | | | | | | | | | | | | | | |
Idaho HFA (Housing Revenue) (z) | | | 0.64 | | | | 8-5-2016 | | | | 2,000,000 | | | | 1,999,857 | |
| | | | | | | | | | | | | | | | |
| | | | |
Illinois: 0.63% | | | | | | | | | | | | | | | | |
| | | | |
| Variable Rate Demand Notes ø: 0.63% | | | | | | | | | | | | | | | | |
Cook County IL Taxable Variable Series D (GO Revenue, Barclays Bank plc LOC) | | | 0.54 | | | | 11-1-2030 | | | | 5,000,000 | | | | 5,000,000 | |
Illinois Toll Highway Authority Series A1 (Transportation Revenue, AGM Insured, JPMorgan Chase & Company SPA) | | | 0.46 | | | | 1-1-2031 | | | | 5,000,000 | | | | 5,000,000 | |
| | | | |
| | | | | | | | | | | | | | | 10,000,000 | |
| | | | | | | | | | | | | | | | |
| | | | |
Louisiana: 1.42% | | | | | | | | | | | | | | | | |
| | | | |
| Variable Rate Demand Note ø: 1.42% | | | | | | | | | | | | | | | | |
Puttable Floating Option Taxable Series TNP-1014 (Miscellaneous Revenue, Bank of America NA LIQ) 144A | | | 0.55 | | | | 6-1-2045 | | | | 22,625,000 | | | | 22,625,000 | |
| | | | | | | | | | | | | | | | |
| | | | |
Maryland: 0.31% | | | | | | | | | | | | | | | | |
| | | | |
| Variable Rate Demand Notes ø: 0.31% | | | | | | | | | | | | | | | | |
Maryland CDA Housing & Community Residential Series B (Housing Revenue, TD Bank NA SPA) | | | 0.47 | | | | 9-1-2033 | | | | 3,000,000 | | | | 3,000,000 | |
Maryland CDA Housing & Community Residential Series F (Housing Revenue, State Street Bank & Trust Company SPA) | | | 0.47 | | | | 9-1-2044 | | | | 1,965,000 | | | | 1,965,000 | |
| | | | |
| | | | | | | | | | | | | | | 4,965,000 | |
| | | | | | | | | | | | | | | | |
| | | | |
Massachusetts: 0.31% | | | | | | | | | | | | | | | | |
| | | | |
| Variable Rate Demand Notes ø: 0.31% | | | | | | | | | | | | | | | | |
Massachusetts Department of Transportation Series A7 (Transportation Revenue, Sumitomo Mitsui Banking SPA) | | | 0.46 | | | | 1-1-2039 | | | | 3,000,000 | | | | 3,000,000 | |
Massachusetts Water Resources Authority Series E (Water & Sewer Revenue, JPMorgan Chase & Company SPA) | | | 0.47 | | | | 8-1-2037 | | | | 2,000,000 | | | | 2,000,000 | |
| | | | |
| | | | | | | | | | | | | | | 5,000,000 | |
| | | | | | | | | | | | | | | | |
| | | | |
Michigan: 0.25% | | | | | | | | | | | | | | | | |
| | | | |
| Variable Rate Demand Note ø: 0.25% | | | | | | | | | | | | | | | | |
Michigan Housing Development Authority Series D (Housing Revenue, Bank of Tokyo-Mitsubishi SPA) | | | 0.51 | | | | 10-1-2039 | | | | 4,000,000 | | | | 4,000,000 | |
| | | | | | | | | | | | | | | | |
| | | | |
Minnesota: 0.07% | | | | | | | | | | | | | | | | |
| | | | |
| Variable Rate Demand Note ø: 0.07% | | | | | | | | | | | | | | | | |
RBC Municipal Products Incorporated Trust Floater CTFS Series E-69 (Housing Revenue, Royal Bank of Canada LOC) 144A | | | 0.48 | | | | 5-31-2018 | | | | 1,110,000 | | | | 1,110,000 | |
| | | | | | | | | | | | | | | | |
| | | | |
| 6 | | Wells Fargo Money Market Fund | | Portfolio of investments—July 31, 2016 (unaudited) |
| | | | | | | | | | | | | | | | |
| Security name | | Interest rate | | | Maturity date | | | Principal | | | Value | |
| | | | |
Missouri: 0.34% | | | | | | | | | | | | | | | | |
| | | | |
| Variable Rate Demand Note ø: 0.34% | | | | | | | | | | | | | | | | |
Puttable Floating Option Taxable Series TN-044 (Education Revenue, Bank of America NA LIQ) 144A | | | 0.65 | % | | | 11-26-2032 | | | $ | 5,500,000 | | | $ | 5,500,000 | |
| | | | | | | | | | | | | | | | |
| | | | |
New York: 1.86% | | | | | | | | | | | | | | | | |
| | | | |
| Variable Rate Demand Notes ø: 1.86% | | | | | | | | | | | | | | | | |
New York HFA 20 River Terrace Series A (Housing Revenue, FNMA Insured, FNMA LIQ) | | | 0.45 | | | | 5-15-2034 | | | | 5,700,000 | | | | 5,700,000 | |
New York HFA 605 West 42 Street Series B (Housing Revenue, Bank of China LOC) | | | 0.83 | | | | 5-1-2048 | | | | 10,000,000 | | | | 10,000,000 | |
New York HFA Biltmore Tower (Housing Revenue, FNMA Insured, FNMA LIQ) | | | 0.48 | | | | 5-15-2034 | | | | 4,000,000 | | | | 4,000,000 | |
New York HFA Riverside Center 2 Series A-2 (Housing Revenue, Bank of America NA LOC) | | | 0.45 | | | | 11-1-2046 | | | | 2,000,000 | | | | 2,000,000 | |
New York Metropolitan Transportation Authority Sub Series G-2 (Transportation Revenue, TD Bank NA LOC) | | | 0.00 | | | | 11-1-2032 | | | | 3,000,000 | | | | 3,000,000 | |
New York Municipal Water Finance Authority Series T-30001-I (Water & Sewer Revenue, Citibank NA LIQ) 144A | | | 0.48 | | | | 6-15-2044 | | | | 1,000,000 | | | | 1,000,000 | |
RBC Municipal Products Incorporated Trust Series E-51 for Invesco Van Kampen New York Value Income Trust (Miscellaneous Revenue, Royal Bank of Canada LOC) 144A(i) | | | 0.94 | | | | 7-1-2017 | | | | 4,000,000 | | | | 4,000,000 | |
| | | | |
| | | | | | | | | | | | | | | 29,700,000 | |
| | | | | | | | | | | | | | | | |
| | | | |
North Carolina: 0.15% | | | | | | | | | | | | | | | | |
| | | | |
| Variable Rate Demand Note ø: 0.15% | | | | | | | | | | | | | | | | |
Roanoke Rapids NC Music & Entertainment District Project (Tax Revenue, Bank of America NA LOC) | | | 0.45 | | | | 7-1-2027 | | | | 2,465,000 | | | | 2,465,000 | |
| | | | | | | | | | | | | | | | |
| | | | |
North Dakota: 0.31% | | | | | | | | | | | | | | | | |
| | | | |
| Variable Rate Demand Note ø: 0.31% | | | | | | | | | | | | | | | | |
North Dakota HFA Mortgage Finance Program Series F (Housing Revenue, FHLB SPA) | | | 0.46 | | | | 1-1-2047 | | | | 5,000,000 | | | | 5,000,000 | |
| | | | | | | | | | | | | | | | |
| | | | |
Ohio: 1.07% | | | | | | | | | | | | | | | | |
| | | | |
| Variable Rate Demand Notes ø: 1.07% | | | | | | | | | | | | | | | | |
Ohio HFA Residential Management Series J (Housing Revenue, JPMorgan Chase & Company SPA) | | | 0.45 | | | | 9-1-2035 | | | | 5,000,000 | | | | 5,000,000 | |
Ohio University Hospital Health System Series C (Health Revenue, Barclays Bank plc LOC) | | | 0.53 | | | | 1-15-2050 | | | | 12,000,000 | | | | 12,000,000 | |
| | | | |
| | | | | | | | | | | | | | | 17,000,000 | |
| | | | | | | | | | | | | | | | |
| | | | |
Oklahoma: 0.50% | | | | | | | | | | | | | | | | |
| | | | |
| Variable Rate Demand Note ø: 0.50% | | | | | | | | | | | | | | | | |
Oklahoma Grand River Dam Authority Series C (Utilities Revenue, Barclays Bank plc LOC) | | | 0.53 | | | | 6-1-2039 | | | | 8,000,000 | | | | 8,000,000 | |
| | | | | | | | | | | | | | | | |
| | | | |
Oregon: 0.31% | | | | | | | | | | | | | | | | |
| | | | |
| Variable Rate Demand Note ø: 0.31% | | | | | | | | | | | | | | | | |
Puttable Floating Option Taxable Series TN-011 (Miscellaneous Revenue, Bank of America NA LIQ) 144A | | | 0.74 | | | | 5-1-2035 | | | | 5,000,000 | | | | 5,000,000 | |
| | | | | | | | | | | | | | | | |
| | | | | | |
| Portfolio of investments—July 31, 2016 (unaudited) | | Wells Fargo Money Market Fund | | | 7 | |
| | | | | | | | | | | | | | | | |
| Security name | | Interest rate | | | Maturity date | | | Principal | | | Value | |
| | | | |
Other: 0.48% | | | | | | | | | | | | | | | | |
| | | | |
| Variable Rate Demand Notes ø: 0.48% | | | | | | | | | | | | | | | | |
Clipper Tax-Exempt Certified Trust Series 2009-54 (Miscellaneous Revenue, State Street Bank & Trust Company LIQ) | | | 0.49 | % | | | 2-15-2028 | | | $ | 4,100,000 | | | $ | 4,100,000 | |
PFOTER Series TNP-1012 (Miscellaneous Revenue, Bank of America NA LIQ) 144A | | | 0.55 | | | | 12-1-2038 | | | | 3,575,000 | | | | 3,575,000 | |
| | | | |
| | | | | | | | | | | | | | | 7,675,000 | |
| | | | | | | | | | | | | | | | |
| | | | |
Pennsylvania: 0.13% | | | | | | | | | | | | | | | | |
| | | | |
| Other Municipal Debt: 0.13% | | | | | | | | | | | | | | | | |
Philadelphia PA Series CC-2 (Miscellaneous Revenue) | | | 0.70 | | | | 8-1-2016 | | | | 2,000,000 | | | | 2,000,000 | |
| | | | | | | | | | | | | | | | |
| | | | |
South Carolina: 0.06% | | | | | | | | | | | | | | | | |
| | | | |
| Other Municipal Debt: 0.06% | | | | | | | | | | | | | | | | |
South Carolina Public Service (Utilities Revenue) | | | 0.53 | | | | 8-30-2016 | | | | 1,000,000 | | | | 1,000,000 | |
| | | | | | | | | | | | | | | | |
| | | | |
Texas: 1.50% | | | | | | | | | | | | | | | | |
| | | | |
| Variable Rate Demand Notes ø: 1.50% | | | | | | | | | | | | | | | | |
Brazos Harbor TX Industrial Development Corporation (Industrial Development Revenue) | | | 0.55 | | | | 10-1-2036 | | | | 15,000,000 | | | | 15,000,000 | |
Houston TX Adjustable Refunding First Lien B3 (Water & Sewer Revenue, Sumitomo Mitsui Banking LOC) | | | 0.45 | | | | 5-15-2034 | | | | 2,000,000 | | | | 2,000,000 | |
Pasadena TX Independent School District Series B (GO Revenue, AGM Insured, JPMorgan Chase & Company SPA) | | | 0.46 | | | | 2-1-2035 | | | | 5,000,000 | | | | 5,000,000 | |
Port Arthur TX Navigation District Daily Fina Oil and Chemical Company Project (Industrial Development Revenue) | | | 0.55 | | | | 5-1-2033 | | | | 2,000,000 | | | | 2,000,000 | |
| | | | |
| | | | | | | | | | | | | | | 24,000,000 | |
| | | | | | | | | | | | | | | | |
| | | | |
Utah: 0.13% | | | | | | | | | | | | | | | | |
| | | | |
| Variable Rate Demand Note ø: 0.13% | | | | | | | | | | | | | | | | |
Utah Water Finance Agency Series B-1 (Water & Sewer Revenue, JPMorgan Chase & Company SPA) | | | 0.48 | | | | 10-1-2037 | | | | 2,000,000 | | | | 2,000,000 | |
| | | | | | | | | | | | | | | | |
| | | | |
Washington: 0.13% | | | | | | | | | | | | | | | | |
| | | | |
| Other Municipal Debt: 0.13% | | | | | | | | | | | | | | | | |
Port of Seattle WA Series B (Port Authority Revenue) | | | 0.50 | | | | 8-2-2016 | | | | 2,000,000 | | | | 2,000,000 | |
| | | | | | | | | | | | | | | | |
| | | | |
Wisconsin: 0.86% | | | | | | | | | | | | | | | | |
| | | | |
| Variable Rate Demand Note ø: 0.86% | | | | | | | | | | | | | | | | |
Wisconsin PFA Cleveland State University Housing Project LLC (Housing Revenue, Bank of America NA LOC) | | | 0.43 | | | | 1-1-2042 | | | | 13,680,000 | | | | 13,680,000 | |
| | | | | | | | | | | | | | | | |
| | | | |
Total Municipal Obligations (Cost $291,974,193) | | | | | | | | | | | | | | | 291,974,193 | |
| | | | | | | | | | | | | | | | |
| | | | |
Other: 0.31% | | | | | | | | | | | | | | | | |
Nuveen California Dividend Advantage Municipal Fund Variable Rate Demand Preferred Shares Series 6 (Citibank NA LIQ) ±§144A | | | 0.55 | | | | 8-1-2040 | | | | 1,000,000 | | | | 1,000,000 | |
Nuveen Enhanced Municipal Credit Opportunities Fund Series 1 ±§144A | | | 0.57 | | | | 3-1-2040 | | | | 4,000,000 | | | | 4,000,000 | |
| | | | |
Total Other (Cost $5,000,000) | | | | | | | | | | | | | | | 5,000,000 | |
| | | | | | | | | | | | | | | | |
| | | | |
| 8 | | Wells Fargo Money Market Fund | | Portfolio of investments—July 31, 2016 (unaudited) |
| | | | | | | | | | | | | | | | |
| Security name | | Interest rate | | | Maturity date | | | Principal | | | Value | |
| | | | |
Other Instruments: 4.64% | | | | | | | | | | | | | | | | |
DBS Bank Limited Pooled Bank Deposit Product § | | | 0.50 | % | | | 1-1-2050 | | | $ | 60,000,000 | | | $ | 60,000,000 | |
FHLMC MFHR Series M017 Class A (FHLMC LIQ) 144A± | | | 0.73 | | | | 9-15-2050 | | | | 4,000,000 | | | | 4,000,000 | |
Oversea-Chinese Banking Corporation Pooled Bank Deposit Product § | | | 0.45 | | | | 1-1-2050 | | | | 10,000,000 | | | | 10,000,000 | |
| | | | |
Total Other Instruments (Cost $74,000,000) | | | | | | | | | | | | | | | 74,000,000 | |
| | | | | | | | | | | | | | | | |
| | | | |
Other Notes: 3.21% | | | | | | | | | | | | | | | | |
| | | | |
| Corporate Bonds and Notes: 3.21% | | | | | | | | | | | | | | | | |
Providence Health & Services ±§ | | | 0.50 | | | | 10-1-2042 | | | | 5,840,000 | | | | 5,840,000 | |
Racetrac Capital LLC ±§ | | | 0.44 | | | | 9-1-2020 | | | | 4,250,000 | | | | 4,250,000 | |
SSAB AB Series A ±§ | | | 0.47 | | | | 6-1-2035 | | | | 1,000,000 | | | | 1,000,000 | |
United Overseas Bank Limited § | | | 0.49 | | | | 1-1-2050 | | | | 40,000,000 | | | | 40,000,000 | |
| | | | |
Total Other Notes (Cost $51,090,000) | | | | | | | | | | | | | | | 51,090,000 | |
| | | | | | | | | | | | | | | | |
| | | | |
Repurchase Agreements ^^: 23.81% | | | | | | | | | | | | | | | | |
Bank of America Corporation, dated 7-29-2016, maturity value $73,002,129 (1) | | | 0.35 | | | | 8-1-2016 | | | | 73,000,000 | | | | 73,000,000 | |
Bank of Nova Scotia, dated 7-29-2016, maturity value $36,675,336 (2) | | | 0.34 | | | | 8-1-2016 | | | | 36,674,297 | | | | 36,674,297 | |
Deutsche Bank Securities, dated 7-29-2016, maturity value $23,000,748 (3) | | | 0.39 | | | | 8-1-2016 | | | | 23,000,000 | | | | 23,000,000 | |
Goldman Sachs & Company, dated 7-1-2016, maturity value $10,006,667 (4)§(i)¢± | | | 0.40 | | | | 8-30-2016 | | | | 10,000,000 | | | | 10,000,000 | |
GX Clarke & Company, dated 7-29-2016, maturity value $42,001,400 (5) | | | 0.40 | | | | 8-1-2016 | | | | 42,000,000 | | | | 42,000,000 | |
JPMorgan Securities, dated 7-1-2016, maturity value $10,010,325 (6)§(i)¢± | | | 0.59 | | | | 9-2-2016 | | | | 10,000,000 | | | | 10,000,000 | |
JPMorgan Securities, dated 7-1-2016, maturity value $5,001,636 (7)§¢± | | | 0.38 | | | | 8-1-2016 | | | | 5,000,000 | | | | 5,000,000 | |
Normura, dated 7-29-2016 maturity value $180,006,450 (8) | | | 0.43 | | | | 8-1-2016 | | | | 180,000,000 | | | | 180,000,000 | |
| | | | |
Total Repurchase Agreements (Cost $379,674,297) | | | | | | | | | | | | | | | 379,674,297 | |
| | | | | | | | | | | | | | | | |
| | | | | | | | |
| Total investments in securities (Cost $1,603,263,486) * | | | 100.56 | % | | | 1,603,263,486 | |
Other assets and liabilities, net | | | (0.56 | ) | | | (8,876,938 | ) |
| | | | | | | | |
| Total net assets | | | 100.00 | % | | $ | 1,594,386,548 | |
| | | | | | | | |
| (z) | Zero coupon security. The rate represents the current yield to maturity. |
| 144A | The security may be resold in transactions exempt from registration, normally to qualified institutional buyers, pursuant to Rule 144A under the Securities Act of 1933. |
| ± | Variable rate investment. The rate shown is the rate in effect at period end. |
| %% | The security is issued on a when-issued basis. |
| ø | Variable rate demand notes are subject to a demand feature which reduces the effective maturity. The maturity date shown represents the final maturity date of the security. The interest rate is determined and reset by the issuer daily, weekly, or monthly depending upon the terms of the security. The rate shown is the rate in effect at period end. |
| § | The security is subject to a demand feature which reduces the effective maturity. |
| ¢ | The security represents a long-dated and extendible repurchase agreement which automatically renews on previously set terms. The maturity date represents the next put date. |
| | (1) | U.S. government securities, 3.00% to 3.50%, 2-1-2043 to 9-1-2045, fair value including accrued interest is $75,190,000. |
| | (2) | U.S. government securities, 1.79% to 7.00%, 1-1-2020 to 7-1-2046, fair value including accrued interest is $37,774,526. |
| | (3) | U.S. government securities, 0.75% to 4.75%, 11-30-2016 to 8-15-2040, fair value including accrued interest is $23,460,001. |
| | (4) | U.S. government securities, 0.00% to 4.30%, 8-1-2016 to 8-1-2046, fair value including accrued interest is $10,230,535. |
| | (5) | U.S. government securities, 1.50% to 9.50%, 11-15-2016 to 5-20-2046, fair value including accrued interest is $43,260,005. |
| | (6) | U.S. government securities, 0.00%, 8-2-2016 to 3-7-2017, fair value is $10,200,000. |
| | (7) | U.S. government securities, 2.39% to 9.00%, 12-1-2020 to 2-1-2048, fair value including accrued interest is $5,150,093. |
| | (8) | U.S. government securities, 0.13% to 3.88%, 11-30-2016 to 4-15-2029, fair value including accrued interest is $183,600,035. |
| * | Cost for federal income tax purposes is substantially the same as for financial reporting purposes. |
| | | | | | |
| Portfolio of investments—July 31, 2016 (unaudited) | | Wells Fargo National Tax-Free Money Market Fund | | | 1 | |
| | | | | | | | | | | | | | | | |
| Security name | | Interest rate | | | Maturity date | | | Principal | | | Value | |
| | | | |
Municipal Obligations: 92.02% | | | | | | | | | | | | | | | | |
| | | | |
Alabama: 1.39% | | | | | | | | | | | | | | | | |
| | | | |
| Variable Rate Demand Notes ø: 1.39% | | | | | | | | | | | | | | | | |
Chatom AL IDA Board Gulf Opportunity Zone PowerSouth Energy Cooperative Projects Series 2011 (Utilities Revenue) | | | 0.62 | % | | | 8-1-2041 | | | $ | 7,900,000 | | | $ | 7,900,000 | |
Mobile AL IDA Board High Providence LLC Project Series 2006 (Industrial Development Revenue, Whitney National Bank LOC) | | | 0.48 | | | | 8-1-2031 | | | | 6,000,000 | | | | 6,000,000 | |
Tuscaloosa County AL IDA Gulf Opportunity Zone Hunt Refining Project Series 2011A (Industrial Development Revenue, Sumitomo Mitsui Banking LOC) | | | 0.43 | | | | 6-1-2028 | | | | 15,500,000 | | | | 15,500,000 | |
| | | | |
| | | | | | | | | | | | | | | 29,400,000 | |
| | | | | | | | | | | | | | | | |
| | | | |
Arizona: 1.40% | | | | | | | | | | | | | | | | |
| | | | |
| Variable Rate Demand Notes ø: 1.40% | | | | | | | | | | | | | | | | |
Arizona Tender Option Bond Trust Receipts/Certiifcates Series 2016-XM0304 (Tax Revenue, Royal Bank of Canada LIQ) 144A | | | 0.51 | | | | 7-1-2020 | | | | 10,135,000 | | | | 10,135,000 | |
Mesa AZ Utility System Clipper Tax-Exempt Certificates Trust Series 2009-33 (Miscellaneous Revenue, State Street Bank & Trust Company LIQ) | | | 0.47 | | | | 7-1-2024 | | | | 19,455,000 | | | | 19,455,000 | |
| | | | |
| | | | | | | | | | | | | | | 29,590,000 | |
| | | | | | | | | | | | | | | | |
| | | | |
California: 4.17% | | | | | | | | | | | | | | | | |
| | | | |
| Other Municipal Debt: 0.30% | | | | | | | | | | | | | | | | |
California GO Series A2 (GO Revenue) | | | 0.43 | | | | 8-3-2016 | | | | 6,400,000 | | | | 6,400,000 | |
| | | | | | | | | | | | | | | | |
| | | | |
| Variable Rate Demand Notes ø: 3.87% | | | | | | | | | | | | | | | | |
California Statewide CDA Morgan Stanley Series 3102 Sutter Health Series 2005A, 2005B & 2008C (Health Revenue, Credit Suisse LIQ) 144A | | | 0.47 | | | | 11-15-2048 | | | | 9,543,345 | | | | 9,543,345 | |
Chino Basin California Regional Financing Authority Inland Empire Utility Series B (Water & Sewer Revenue, Sumitomo Mitsui Banking LOC) | | | 0.43 | | | | 6-1-2032 | | | | 7,300,000 | | | | 7,300,000 | |
Irvine CA Limited Obligation Improvement Bonds Series A (Miscellaneous Revenue, State Street Bank & Trust Company LOC) | | | 0.35 | | | | 9-2-2026 | | | | 600,000 | | | | 600,000 | |
JPMorgan Chase PUTTER/DRIVER Trust Series 3841 (Transportation Revenue, Ambac Insured, JPMorgan Chase & Company LIQ) 144A | | | 0.47 | | | | 7-1-2024 | | | | 22,655,000 | | | | 22,655,000 | |
San Diego County CA Regional Transportation Community Limited Tax Series 2008-C (Tax Revenue, Mizuho Corporate Bank SPA) | | | 0.43 | | | | 4-1-2038 | | | | 500,000 | | | | 500,000 | |
San Francisco CA Tender Option Bond Trust Receipts/Certificates Series XM0237 (Water & Sewer Revenue, Bank of America NA LIQ) 144A | | | 0.46 | | | | 11-1-2036 | | | | 10,160,000 | | | | 10,160,000 | |
San Francisco City & County CA Public Utilities Commission Series 3153X (Water & Sewer Revenue, Morgan Stanley Bank LIQ) 144A | | | 0.47 | | | | 11-1-2039 | | | | 680,500 | | | | 680,500 | |
San Francisco City & County CA RDA Fillmore Center 1999 Issue B1 (Housing Revenue, FHLMC LIQ) | | | 0.47 | | | | 12-1-2017 | | | | 20,000,000 | | | | 20,000,000 | |
Southern California Public Power Authority Magnolia Power Project Series 1A (Utilities Revenue, U.S. Bank NA LOC) | | | 0.43 | | | | 7-1-2036 | | | | 10,595,000 | | | | 10,595,000 | |
| | | | |
| | | | | | | | | | | | | | | 82,033,845 | |
| | | | | | | | | | | | | | | | |
| | | | |
Colorado: 1.22% | | | | | | | | | | | | | | | | |
| | | | |
| Variable Rate Demand Notes ø: 1.22% | | | | | | | | | | | | | | | | |
Colorado Health Facilities Authority Catholic Health Initiatives Series 2013-3364 (Health Revenue, Morgan Stanley Bank LIQ) 144A | | | 0.58 | | | | 10-1-2037 | | | | 6,250,000 | | | | 6,250,000 | |
Colorado MidCities Metropolitan District #1 Series 2004-B (Tax Revenue, BNP Paribas LOC) | | | 0.48 | | | | 12-1-2031 | | | | 9,470,000 | | | | 9,470,000 | |
| | | | |
| 2 | | Wells Fargo National Tax-Free Money Market Fund | | Portfolio of investments—July 31, 2016 (unaudited) |
| | | | | | | | | | | | | | | | |
| Security name | | Interest rate | | | Maturity date | | | Principal | | | Value | |
| | | | |
| Variable Rate Demand Notes ø (continued) | | | | | | | | | | | | | | | | |
Denver CO City & County Airport System Series 2006-A (Airport Revenue, FGIC Insured, Morgan Stanley Bank LIQ) 144A | | | 0.52 | % | | | 11-15-2025 | | | $ | 10,155,000 | | | $ | 10,155,000 | |
| | | | |
| | | | | | | | | | | | | | | 25,875,000 | |
| | | | | | | | | | | | | | | | |
| | | | |
District of Columbia: 0.17% | | | | | | | | | | | | | | | | |
| | | | |
| Variable Rate Demand Note ø: 0.17% | | | | | | | | | | | | | | | | |
District of Columbia Community Connection Real Estate Foundation Issue Series 2007A (Miscellaneous Revenue, Manufacturers & Traders LOC) | | | 0.49 | | | | 7-1-2032 | | | | 3,600,000 | | | | 3,600,000 | |
| | | | | | | | | | | | | | | | |
| | | | |
Florida: 4.90% | | | | | | | | | | | | | | | | |
| | | | |
| Other Municipal Debt: 1.92% | | | | | | | | | | | | | | | | |
JEA Florida Electric System Series 2000-A (Utilities Revenue) | | | 0.43 | | | | 8-15-2016 | | | | 9,065,000 | | | | 9,065,000 | |
JEA Florida Electric System Series 2000-F-1 (Utilities Revenue) | | | 0.45 | | | | 8-4-2016 | | | | 24,000,000 | | | | 24,000,000 | |
JEA Florida Electric System Series 2008-C-3 (Utilities Revenue) | | | 0.44 | | | | 8-3-2016 | | | | 7,700,000 | | | | 7,700,000 | |
| | | | |
| | | | | | | | | | | | | | | 40,765,000 | |
| | | | | | | | | | | | | | | | |
| | | | |
| Variable Rate Demand Notes ø: 2.98% | | | | | | | | | | | | | | | | |
Broward County FL Educational Facilities Authority Nova Southeastern University Project Series 2008A (Education Revenue, Bank of America NA LOC) | | | 0.38 | | | | 4-1-2038 | | | | 500,000 | | | | 500,000 | |
Florida Tender Option Bond Trust Receipts/Certificates Series 2016 XM0300 (Tax Revenue, Royal Bank of Canada LIQ) 144A | | | 0.47 | | | | 1-1-2020 | | | | 5,915,000 | | | | 5,915,000 | |
Highlands County FL Health Facilities Authority Adventist Health System Sunbelt Obligated Group Series 2012 I-2 (Health Revenue) | | | 0.43 | | | | 11-15-2032 | | | | 1,700,000 | | | | 1,700,000 | |
Miami Dade County FL Special Obligation Juvenile Courthouse Series B (Miscellaneous Revenue, TD Bank NA LOC, Ambac Insured) | | | 0.42 | | | | 4-1-2043 | | | | 25,000,000 | | | | 25,000,000 | |
Orange County FL School Board Certificate of Participation Series 2009A (Miscellaneous Revenue, AGC Insured, Morgan Stanley Bank LIQ) 144A | | | 0.52 | | | | 8-1-2034 | | | | 3,300,000 | | | | 3,300,000 | |
Palm Beach County FL Pine Crest Preparatory School Incorporated Project Series 2012B (Education Revenue, TD Bank NA LOC) | | | 0.43 | | | | 6-1-2038 | | | | 15,100,000 | | | | 15,100,000 | |
Pinellas County FL IDA Neighborly Care Network Project Series 2008 (Miscellaneous Revenue, Branch Banking & Trust LOC) | | | 0.45 | | | | 8-1-2028 | | | | 3,730,000 | | | | 3,730,000 | |
Sarasota County FL Planned Parenthood Incorporated Project Series 2007 (Health Revenue, BMO Harris Bank NA LOC) | | | 0.42 | | | | 10-1-2041 | | | | 5,990,000 | | | | 5,990,000 | |
West Palm Beach FL Utilities Systems Series C (Water & Sewer Revenue, AGC Insured, JPMorgan Chase & Company SPA) | | | 0.47 | | | | 10-1-2038 | | | | 2,000,000 | | | | 2,000,000 | |
| | | | |
| | | | | | | | | | | | | | | 63,235,000 | |
| | | | | | | | | | | | | | | | |
| | | | |
Georgia: 1.85% | | | | | | | | | | | | | | | | |
| | | | |
| Variable Rate Demand Notes ø: 1.85% | | | | | | | | | | | | | | | | |
Atlanta GA Development Authority Perkins Will Incorporated Project Series 2010 (Industrial Development Revenue, Harris NA LOC) | | | 0.44 | | | | 11-1-2030 | | | | 6,650,000 | | | | 6,650,000 | |
Dekalb County GA Series 2006-B ROC RR-II-R-11900 (Water & Sewer Revenue, AGM Insured, Citibank NA LIQ) 144A | | | 0.47 | | | | 4-1-2023 | | | | 9,600,000 | | | | 9,600,000 | |
Georgia Tender Option Bond Trust Receipts/Certificates Series 2016-XM0330 (Tax Revenue, AGM Insured, JPMorgan Chase & Company LIQ) 144A | | | 0.54 | | | | 1-1-2017 | | | | 5,000,000 | | | | 5,000,000 | |
Main Street Natural Gas Incorporated Sub Series A2 (Utilities Revenue, Royal Bank of Canada SPA) | | | 0.54 | | | | 8-1-2040 | | | | 12,280,000 | | | | 12,280,000 | |
Metropolitan Atlanta GA Rapid Transit Authority Series P (Tax Revenue, Societe Generale LOC, Ambac Insured) 144A | | | 0.46 | | | | 7-1-2020 | | | | 5,765,000 | | | | 5,765,000 | |
| | | | |
| | | | | | | | | | | | | | | 39,295,000 | |
| | | | | | | | | | | | | | | | |
| | | | | | |
| Portfolio of investments—July 31, 2016 (unaudited) | | Wells Fargo National Tax-Free Money Market Fund | | | 3 | |
| | | | | | | | | | | | | | | | |
| Security name | | Interest rate | | | Maturity date | | | Principal | | | Value | |
| | | | |
Illinois: 1.40% | | | | | | | | | | | | | | | | |
| | | | |
| Variable Rate Demand Notes ø: 1.40% | | | | | | | | | | | | | | | | |
Chicago IL Education Marine Project Series 1984 (Industrial Development Revenue, FHLB LOC) | | | 0.80 | % | | | 7-1-2023 | | | $ | 4,200,000 | | | $ | 4,200,000 | |
Illinois Development Finance Authority Cook Communications Ministries Project Series 2002 (Miscellaneous Revenue, Bank of America NA LOC) | | | 0.61 | | | | 3-1-2017 | | | | 4,500,000 | | | | 4,500,000 | |
Illinois Tender Option Bond Trust Receipts/Certificates Series XM0078 (Transportation Revenue, Royal Bank of Canada LIQ) 144A | | | 0.48 | | | | 7-1-2023 | | | | 10,365,000 | | | | 10,365,000 | |
Illinois Tender Option Bond Trust Receipts/Certificates Series ZM0120 (Transportation Revenue, Royal Bank of Canada LIQ) 144A | | | 0.48 | | | | 7-1-2023 | | | | 3,100,000 | | | | 3,100,000 | |
Illinois Toll Highway Authority Series 2014D Tender Option Bond Trust Series 2015-XM0031 (Transportation Revenue, Royal Bank of Canada LIQ) 144A | | | 0.48 | | | | 1-1-2022 | | | | 4,165,000 | | | | 4,165,000 | |
Yorkville Kendall County IL Special Service Area #2003-101 Windett Ridge Project JPMorgan PUTTER Series 4380 (Tax Revenue, JPMorgan Chase & Company LIQ) 144A | | | 0.66 | | | | 3-1-2023 | | | | 3,320,000 | | | | 3,320,000 | |
| | | | |
| | | | | | | | | | | | | | | 29,650,000 | |
| | | | | | | | | | | | | | | | |
| | | | |
Indiana: 1.43% | | | | | | | | | | | | | | | | |
| | | | |
| Variable Rate Demand Notes ø: 1.43% | | | | | | | | | | | | | | | | |
Indiana Certificates of Participation Clipper Tax-Exempt Certified Trust Series 2009-34 (Miscellaneous Revenue, State Street Bank & Trust Company LIQ) | | | 0.48 | | | | 7-1-2023 | | | | 22,515,000 | | | | 22,515,000 | |
Spencer County IN American Iron Oxide Company Project Series 1999 (Industrial Development Revenue, Bank of Tokyo-Mitsubishi LOC) | | | 0.58 | | | | 9-1-2018 | | | | 7,900,000 | | | | 7,900,000 | |
| | | | |
| | | | | | | | | | | | | | | 30,415,000 | |
| | | | | | | | | | | | | | | | |
| | | | |
Iowa: 4.38% | | | | | | | | | | | | | | | | |
| | | | |
| Variable Rate Demand Notes ø: 4.38% | | | | | | | | | | | | | | | | |
Iowa Finance Authority Barclays Residual Interest Bonds Trust Series 1WE (Miscellaneous Revenue, Barclays Bank plc LOC) 144A | | | 0.59 | | | | 1-1-2019 | | | | 32,600,000 | | | | 32,600,000 | |
Iowa Finance Authority Midwestern Cargill Incorporated Project Series 2012-A (Industrial Development Revenue) | | | 0.46 | | | | 6-1-2039 | | | | 58,100,000 | | | | 58,100,000 | |
Iowa Finance Authority Multifamily Housing Series 2006 A Trust Receipts Series 2016-XF0386 (Housing Revenue, Bank of America NA LIQ) 144A | | | 0.49 | | | | 7-1-2041 | | | | 2,280,000 | | | | 2,280,000 | |
| | | | |
| | | | | | | | | | | | | | | 92,980,000 | |
| | | | | | | | | | | | | | | | |
| | | | |
Kansas: 0.42% | | | | | | | | | | | | | | | | |
| | | | |
| Variable Rate Demand Note ø: 0.42% | | | | | | | | | | | | | | | | |
Kansas Tender Option Bond Trust Receipt/Certificates Series 2016-XM0292 (Health Revenue, Royal Bank of Canada LIQ) 144A | | | 0.47 | | | | 11-15-2038 | | | | 9,000,000 | | | | 9,000,000 | |
| | | | | | | | | | | | | | | | |
| | | | |
Kentucky: 0.34% | | | | | | | | | | | | | | | | |
| | | | |
| Variable Rate Demand Note ø: 0.34% | | | | | | | | | | | | | | | | |
Kentucky Infrastructure Authority Wastewater & Drinking Water Revolving Fund Series 2015A Morgan Stanley Series 2015-XF2109 (Water & Sewer Revenue, Morgan Stanley Bank LIQ) 144A | | | 0.50 | | | | 2-1-2026 | | | | 7,190,000 | | | | 7,190,000 | |
| | | | | | | | | | | | | | | | |
| | | | |
Louisiana: 2.37% | | | | | | | | | | | | | | | | |
| | | | |
| Variable Rate Demand Notes ø: 2.37% | | | | | | | | | | | | | | | | |
Louisiana BAN Series 2016-A JPMorgan PUTTER Series 5006 (GO Revenue, JPMorgan Chase & Company LOC, JPMorgan Chase & Company LIQ) 144A | | | 0.39 | | | | 8-15-2016 | | | | 10,000,000 | | | | 10,000,000 | |
Louisiana HFA The Reserve at Jefferson Crossing Series 2008 (Housing Revenue, FHLMC LOC) | | | 0.47 | | | | 7-1-2040 | | | | 4,095,000 | | | | 4,095,000 | |
| | | | |
| 4 | | Wells Fargo National Tax-Free Money Market Fund | | Portfolio of investments—July 31, 2016 (unaudited) |
| | | | | | | | | | | | | | | | |
| Security name | | Interest rate | | | Maturity date | | | Principal | | | Value | |
| | | | |
| Variable Rate Demand Notes ø (continued) | | | | | | | | | | | | | | | | |
Louisiana PFA Pollution Control Allied Signal Incorporated Project Series 1992 (Industrial Development Revenue) | | | 0.47 | % | | | 8-1-2017 | | | $ | 6,815,000 | | | $ | 6,815,000 | |
Louisiana PFFA Dynamic Fuels LLC Project Series 2008 (Industrial Development Revenue, Bank of America NA LOC) | | | 0.38 | | | | 10-1-2033 | | | | 29,300,000 | | | | 29,300,000 | |
| | | | |
| | | | | | | | | | | | | | | 50,210,000 | |
| | | | | | | | | | | | | | | | |
| | | | |
Maryland: 3.08% | | | | | | | | | | | | | | | | |
| | | | |
| Variable Rate Demand Notes ø: 3.08% | | | | | | | | | | | | | | | | |
Maryland HEFA University of Maryland Medical System Series-D (Health Revenue, TD Bank NA LOC) | | | 0.39 | | | | 7-1-2041 | | | | 6,200,000 | | | | 6,200,000 | |
Maryland Industrial Development Financing Authority Occidental Pete Corporation Series 2010 (Industrial Development Revenue) | | | 0.62 | | | | 3-1-2030 | | | | 22,925,000 | | | | 22,925,000 | |
Maryland Transportation Authority Facilities Project Series 2008 Tender Option Bond Trust Receipts Series 2016-XF0278 (Transportation Revenue, AGM Insured, Bank of America NA LIQ) 144A | | | 0.49 | | | | 7-1-2041 | | | | 9,000,000 | | | | 9,000,000 | |
Montgomery County MD Housing Opportunity Commission Series 2011-A (Housing Revenue, TD Bank NA LOC, GNMA/FNMA/FHLMC Insured) | | | 0.43 | | | | 1-1-2049 | | | | 27,170,000 | | | | 27,170,000 | |
| | | | |
| | | | | | | | | | | | | | | 65,295,000 | |
| | | | | | | | | | | | | | | | |
| | | | |
Massachusetts: 1.98% | | | | | | | | | | | | | | | | |
| | | | |
| Variable Rate Demand Notes ø: 1.98% | | | | | | | | | | | | | | | | |
Clipper Tax-Exempt Certificate Trust Series 2009-69 (Tax Revenue, State Street Bank & Trust Company LIQ) | | | 0.48 | | | | 7-1-2027 | | | | 10,000,000 | | | | 10,000,000 | |
Massachusetts Development Finance Agency Revenue Partners Healthcare Systems Series M-1 (Health Revenue, U.S. Bank NA LOC) | | | 0.38 | | | | 7-1-2048 | | | | 13,900,000 | | | | 13,900,000 | |
Massachusetts JPMorgan Chase PUTTER/DRIVER Trust Series 5004 (GO Revenue, JPMorgan Chase & Company LOC, JPMorgan Chase & Company LIQ) 144A | | | 0.39 | | | | 9-1-2017 | | | | 9,000,000 | | | | 9,000,000 | |
Massachusetts JPMorgan Chase PUTTER/DRIVER Trust Series 5005 (GO Revenue, JPMorgan Chase & Company LOC, JPMorgan Chase & Company LIQ) 144A | | | 0.39 | | | | 6-1-2018 | | | | 9,000,000 | | | | 9,000,000 | |
| | | | |
| | | | | | | | | | | | | | | 41,900,000 | |
| | | | | | | | | | | | | | | | |
| | | | |
Michigan: 1.38% | | | | | | | | | | | | | | | | |
| | | | |
| Variable Rate Demand Notes ø: 1.38% | | | | | | | | | | | | | | | | |
Eastern Michigan University Barclays Residual Interest Bonds Trust Series 6WE (Miscellaneous Revenue, Barclays Bank plc LOC) 144A | | | 0.59 | | | | 7-1-2018 | | | | 15,105,000 | | | | 15,105,000 | |
Green Lake Township MI Economic Development Corporation Interlochen Center Arts Project Series 2004 (Miscellaneous Revenue, BMO Harris Bank NA LOC) | | | 0.37 | | | | 6-1-2034 | | | | 2,235,000 | | | | 2,235,000 | |
St. Joseph MI Hospital Finance Authority Lakeland Hospital Niles & St. Joseph Obligated Group Series 2002 (Health Revenue, AGM Insured, JPMorgan Chase & Company SPA) | | | 0.51 | | | | 1-1-2032 | | | | 12,000,000 | | | | 12,000,000 | |
| | | | |
| | | | | | | | | | | | | | | 29,340,000 | |
| | | | | | | | | | | | | | | | |
| | | | |
Minnesota: 2.79% | | | | | | | | | | | | | | | | |
| | | | |
| Variable Rate Demand Notes ø: 2.79% | | | | | | | | | | | | | | | | |
Bloomington MN Bristol Village Apartments Project Series 2002A-1 (Housing Revenue, FNMA Insured, FNMA LIQ) | | | 0.53 | | | | 11-15-2032 | | | | 10,905,000 | | | | 10,905,000 | |
Burnsville MN Bridgeway Apartments Project Series 2003 (Housing Revenue, FNMA Insured, FNMA LIQ) | | | 0.52 | | | | 10-15-2033 | | | | 1,750,000 | | | | 1,750,000 | |
Eden Prairie MN Eden Glen Apartments Project Series 2001 (Housing Revenue, FNMA Insured, FNMA LIQ) | | | 0.53 | | | | 2-15-2031 | | | | 2,390,000 | | | | 2,390,000 | |
| | | | | | |
| Portfolio of investments—July 31, 2016 (unaudited) | | Wells Fargo National Tax-Free Money Market Fund | | | 5 | |
| | | | | | | | | | | | | | | | |
| Security name | | Interest rate | | | Maturity date | | | Principal | | | Value | |
| | | | |
| Variable Rate Demand Notes ø (continued) | | | | | | | | | | | | | | | | |
Forest Lake MN Kilkenny Court Apartments Project Series 2008 (Housing Revenue, FNMA Insured, FNMA LIQ) | | | 0.53 | % | | | 8-15-2038 | | | $ | 4,100,000 | | | $ | 4,100,000 | |
Inver Grove Heights MN Inver Grove Incorporated Project Series 2005 (Housing Revenue, FNMA Insured, FNMA LIQ) | | | 0.44 | | | | 5-15-2035 | | | | 8,735,000 | | | | 8,735,000 | |
Maple Grove MN MFHR Basswood Trails Apartment Project Series 2002 (Housing Revenue, FHLMC LIQ) | | | 0.52 | | | | 3-1-2029 | | | | 2,340,000 | | | | 2,340,000 | |
Minneapolis & St. Paul MN Metropolitan Airport Commission Morgan Stanley Series 3200 (Airport Revenue, Morgan Stanley Bank LIQ) 144A | | | 0.47 | | | | 1-1-2035 | | | | 6,000,000 | | | | 6,000,000 | |
Minnesota HEFAR Concordia University Series P-1 (Education Revenue, U.S. Bank NA LOC) | | | 0.38 | | | | 4-1-2027 | | | | 1,885,000 | | | | 1,885,000 | |
Plymouth MN Lancaster Village Apartments Project Series 2001 (Housing Revenue, FNMA Insured, FNMA LIQ) | | | 0.52 | | | | 9-15-2031 | | | | 2,865,000 | | | | 2,865,000 | |
St. Louis Park MN Knollwood Place Apartment Project Series 2005 (Housing Revenue, FHLMC LIQ) | | | 0.52 | | | | 10-1-2035 | | | | 12,300,000 | | | | 12,300,000 | |
St. Louis Park MN MFHR Parkshore Senior Campus Project Series 2004 (Housing Revenue, FHLMC LIQ) | | | 0.52 | | | | 8-1-2034 | | | | 5,865,000 | | | | 5,865,000 | |
| | | | |
| | | | | | | | | | | | | | | 59,135,000 | |
| | | | | | | | | | | | | | | | |
| | | | |
Mississippi: 3.75% | | | | | | | | | | | | | | | | |
| | | | |
| Variable Rate Demand Notes ø: 3.75% | | | | | | | | | | | | | | | | |
Mississippi Business Finance Corporation Gulf Opportunity Chevron USA Incorporated Project Series A (Industrial Development Revenue) | | | 0.35 | | | | 12-1-2030 | | | | 29,700,000 | | | | 29,700,000 | |
Mississippi Business Finance Corporation Gulf Opportunity Chevron USA Incorporated Project Series F (Industrial Development Revenue) | | | 0.40 | | | | 12-1-2030 | | | | 12,400,000 | | | | 12,400,000 | |
Mississippi Business Finance Corporation Gulf Opportunity Chevron USA Incorporated Project Series L (Industrial Development Revenue) | | | 0.40 | | | | 11-1-2035 | | | | 14,650,000 | | | | 14,650,000 | |
Mississippi Series A Clipper Tax-Exempt Certificate Trust Series 2009-60 (Miscellaneous Revenue, State Street Bank & Trust Company LIQ) | | | 0.47 | | | | 11-1-2018 | | | | 22,760,000 | | | | 22,760,000 | |
| | | | |
| | | | | | | | | | | | | | | 79,510,000 | |
| | | | | | | | | | | | | | | | |
| | | | |
Missouri: 0.14% | | | | | | | | | | | | | | | | |
| | | | |
| Variable Rate Demand Note ø: 0.14% | | | | | | | | | | | | | | | | |
St. Louis County MO Sewer District Wastewater System Series 2013-B (Water & Sewer Revenue, Morgan Stanley Bank LIQ) 144A | | | 0.47 | | | | 5-1-2043 | | | | 3,000,000 | | | | 3,000,000 | |
| | | | | | | | | | | | | | | | |
| | | | |
Nebraska: 0.77% | | | | | | | | | | | | | | | | |
| | | | |
| Variable Rate Demand Note ø: 0.77% | | | | | | | | | | | | | | | | |
Lincoln NE Electric System Series 2900 (Utilities Revenue, Credit Suisse LIQ) | | | 0.53 | | | | 9-1-2037 | | | | 16,348,281 | | | | 16,348,281 | |
| | | | | | | | | | | | | | | | |
| | | | |
Nevada: 0.46% | | | | | | | | | | | | | | | | |
| | | | |
| Variable Rate Demand Note ø: 0.46% | | | | | | | | | | | | | | | | |
Reno NV Senior Lien Transportation Rail Access Corridor Project Series 2008-A (Tax Revenue, Bank of New York Mellon LOC) | | | 0.45 | | | | 6-1-2042 | | | | 9,800,000 | | | | 9,800,000 | |
| | | | | | | | | | | | | | | | |
| | | | |
New Hampshire: 0.80% | | | | | | | | | | | | | | | | |
| | | | |
| Variable Rate Demand Notes ø: 0.80% | | | | | | | | | | | | | | | | |
New Hampshire HEFA Dartmouth College Project Series 3069 (Education Revenue, Credit Suisse LIQ) 144A | | | 0.48 | | | | 6-1-2039 | | | | 6,280,000 | | | | 6,280,000 | |
New Hampshire HEFA FHA Insured Mortgage Revenue Series 2009 PUTTER Series 2015-XF0037 (Health Revenue, FHA Insured, TD Bank NA LIQ) 144A | | | 0.47 | | | | 10-1-2017 | | | | 10,770,000 | | | | 10,770,000 | |
| | | | |
| | | | | | | | | | | | | | | 17,050,000 | |
| | | | | | | | | | | | | | | | |
| | | | |
| 6 | | Wells Fargo National Tax-Free Money Market Fund | | Portfolio of investments—July 31, 2016 (unaudited) |
| | | | | | | | | | | | | | | | |
| Security name | | Interest rate | | | Maturity date | | | Principal | | | Value | |
| | | | |
New Jersey: 0.43% | | | | | | | | | | | | | | | | |
| | | | |
| Variable Rate Demand Notes ø: 0.43% | | | | | | | | | | | | | | | | |
New Jersey Tender Option Bond Trust Receipt/Certificates Series 2016-XM0226 (Miscellaneous Revenue, BHAC/National Insured, Bank of America NA LIQ) 144A | | | 0.54 | % | | | 7-1-2026 | | | $ | 3,370,000 | | | $ | 3,370,000 | |
New Jersey TTFA Clipper Tax-Exempt Certificates Trust Series 2009-70 (Transportation Revenue, State Street Bank & Trust Company LIQ) | | | 0.47 | | | | 12-15-2023 | | | | 5,750,000 | | | | 5,750,000 | |
| | | | |
| | | | | | | | | | | | | | | 9,120,000 | |
| | | | | | | | | | | | | | | | |
| | | | |
New York: 11.21% | | | | | | | | | | | | | | | | |
| | | | |
| Variable Rate Demand Notes ø: 11.21% | | | | | | | | | | | | | | | | |
New York City GO Fiscal Sub Series 2012D-3B (GO Revenue, Royal Bank of Canada LOC) | | | 0.38 | | | | 10-1-2039 | | | | 32,300,000 | | | | 32,300,000 | |
New York Dormitory Authority Series 12 Clipper Tax-Exempt Certificate Trust Series 2009-35 (Miscellaneous Revenue, State Street Bank & Trust Company LIQ) | | | 0.47 | | | | 11-15-2026 | | | | 25,000,000 | | | | 25,000,000 | |
New York Metropolitan Transportation Authority Dedicated Tax Series 2008A-1 (Tax Revenue, Royal Bank of Canada LOC) | | | 0.38 | | | | 11-1-2031 | | | | 5,500,000 | | | | 5,500,000 | |
New York Metropolitan Transportation Authority Sub Series E-4 (Transportation Revenue, Bank of the West LOC) | | | 0.48 | | | | 11-15-2045 | | | | 7,000,000 | | | | 7,000,000 | |
New York Metropolitan Transportation Authority Sub Series E-5 (Transportation Revenue, U.S. Bank NA LOC) | | | 0.40 | | | | 11-15-2045 | | | | 10,000,000 | | | | 10,000,000 | |
New York Metropolitan Transportation Authority Sub Series G-2 (Transportation Revenue, TD Bank NA LOC) | | | 0.43 | | | | 11-1-2032 | | | | 1,850,000 | | | | 1,850,000 | |
New York NY City Municipal Water Finance Authority (Water & Sewer Revenue, U.S. Bank NA SPA) | | | 0.40 | | | | 6-15-2043 | | | | 5,000,000 | | | | 5,000,000 | |
New York NY City Transitional Finance Authority Fiscal 2016 Sub Series E-4 (Tax Revenue, JPMorgan Chase & Company SPA) | | | 0.39 | | | | 2-1-2045 | | | | 11,800,000 | | | | 11,800,000 | |
New York NY Fiscal Series 2004-H-1 (GO Revenue, Bank of New York Mellon LOC) | | | 0.38 | | | | 3-1-2034 | | | | 6,900,000 | | | | 6,900,000 | |
New York NY Fiscal Series 2006I-5 (GO Revenue, Bank of New York Mellon LOC) | | | 0.38 | | | | 4-1-2036 | | | | 4,900,000 | | | | 4,900,000 | |
New York NY Fiscal Series 2014I-2 (GO Revenue, JPMorgan Chase & Company LIQ) | | | 0.39 | | | | 3-1-2040 | | | | 19,000,000 | | | | 19,000,000 | |
New York NY GO Fiscal Series 2004H-4 (GO Revenue, Bank of New York Mellon LOC) | | | 0.38 | | | | 3-1-2034 | | | | 4,400,000 | | | | 4,400,000 | |
New York NY Municipal Water and Sewer Finance Authority 2nd General Resolution Fiscal 2011 Sub Series DD-1 (Water & Sewer Revenue, TD Bank NA SPA) | | | 0.39 | | | | 6-15-2043 | | | | 1,300,000 | | | | 1,300,000 | |
New York NY Municipal Water Finance Authority Water & Sewer System 2nd Generation Resolution Fiscal 2011 Sub Series FF-1 (Water & Sewer Revenue, Bank of America NA SPA) | | | 0.35 | | | | 6-15-2044 | | | | 13,900,000 | | | | 13,900,000 | |
New York NY Municipal Water Finance Authority Water & Sewer System 2nd Generation Resolution Fiscal 2016 Sub Series AA-2 (Water & Sewer Revenue, PNC Bank NA SPA) | | | 0.39 | | | | 6-15-2048 | | | | 33,500,000 | | | | 33,500,000 | |
New York NY Sub Series D-4 (GO Revenue, TD Bank NA LOC) | | | 0.39 | | | | 8-1-2040 | | | | 1,940,000 | | | | 1,940,000 | |
New York NY Sub Series L-3 (GO Revenue, Bank of America NA SPA) | | | 0.35 | | | | 4-1-2036 | | | | 13,000,000 | | | | 13,000,000 | |
New York NY Transitional Finance Authority Fiscal 2013 Sub Series 2013A-4 (Tax Revenue, Northern Trust Company SPA) | | | 0.39 | | | | 8-1-2039 | | | | 100,000 | | | | 100,000 | |
New York NY Transitional Finance Authority Fiscal 2016 Sub Series A-5 (Tax Revenue, Royal Bank of Canada SPA) | | | 0.38 | | | | 8-1-2041 | | | | 12,000,000 | | | | 12,000,000 | |
New York NY Transitional Finance Authority JPMorgan Chase PUTTER/DRIVER Trust Series 4043 (Tax Revenue, JPMorgan Chase & Company LIQ) 144A | | | 0.47 | | | | 11-1-2020 | | | | 2,600,000 | | | | 2,600,000 | |
New York NY Transitional Finance Authority Sub Series 2003A-4 (Tax Revenue, TD Bank NA SPA) | | | 0.39 | | | | 11-1-2029 | | | | 2,700,000 | | | | 2,700,000 | |
New York NY Transitional Finance Authority Sub Series A-5 (Tax Revenue, U.S. Bank NA SPA) | | | 0.40 | | | | 8-1-2039 | | | | 8,200,000 | | | | 8,200,000 | |
New York NY Transitional Finance Authority Sub Series C-5 (Tax Revenue, Sumitomo Mitsui Banking LOC) | | | 0.43 | | | | 11-1-2041 | | | | 9,750,000 | | | | 9,750,000 | |
| | | | | | |
| Portfolio of investments—July 31, 2016 (unaudited) | | Wells Fargo National Tax-Free Money Market Fund | | | 7 | |
| | | | | | | | | | | | | | | | |
| Security name | | Interest rate | | | Maturity date | | | Principal | | | Value | |
| | | | |
| Variable Rate Demand Notes ø (continued) | | | | | | | | | | | | | | | | |
New York Sales Tax Asset Receivable Corporation Fiscal Series 2015A Tender Option Bond Trust Receipts/Certificates Series 2015-ZF0209 (Tax Revenue, JPMorgan Chase & Company LIQ) 144A | | | 0.47 | % | | | 10-15-2031 | | | $ | 5,250,000 | | | $ | 5,250,000 | |
| | | | |
| | | | | | | | | | | | | | | 237,890,000 | |
| | | | | | | | | | | | | | | | |
| | | | |
North Carolina: 2.99% | | | | | | | | | | | | | | | | |
| | | | |
| Variable Rate Demand Notes ø: 2.99% | | | | | | | | | | | | | | | | |
North Carolina Capital Facilities Finance Agency Duke University Project Series 2015B Tender Option Bond Trust Receipts/Certificates Series 2015-ZM0105 (Education Revenue, Morgan Stanley Bank LIQ) 144A | | | 0.47 | | | | 10-1-2055 | | | | 2,250,500 | | | | 2,250,500 | |
North Carolina Capital Facilities Finance Agency Educational Guilford College Project Series 2008 (Education Revenue, Branch Banking & Trust LOC) | | | 0.45 | | | | 5-1-2024 | | | | 2,315,000 | | | | 2,315,000 | |
North Carolina Capital Facilities Finance Agency Educational Hill Center Project Series 2008 (Education Revenue, Branch Banking & Trust LOC) | | | 0.45 | | | | 7-1-2028 | | | | 3,830,000 | | | | 3,830,000 | |
North Carolina Medical Care Commission FirstHealth Carolina Project Series 2008-A (Health Revenue, Branch Banking & Trust SPA) | | | 0.48 | | | | 10-1-2028 | | | | 33,650,000 | | | | 33,650,000 | |
North Carolina Medical Care Commission Hospice Alamance-Caswell Project Series 2008 (Health Revenue, Branch Banking & Trust LOC) | | | 0.45 | | | | 12-1-2033 | | | | 4,200,000 | | | | 4,200,000 | |
North Carolina Tender Option Bond Trust Receipts/Certificates Series XF2165 (Education Revenue, Morgan Stanley Bank LIQ) 144A | | | 0.47 | | | | 10-1-2055 | | | | 8,085,000 | | | | 8,085,000 | |
University of North Carolina Chapel Hill Series 2009- A (Education Revenue, TD Bank NA SPA) | | | 0.43 | | | | 2-1-2024 | | | | 9,165,000 | | | | 9,165,000 | |
| | | | |
| | | | | | | | | | | | | | | 63,495,500 | |
| | | | | | | | | | | | | | | | |
| | | | |
Ohio: 0.17% | | | | | | | | | | | | | | | | |
| | | | |
| Variable Rate Demand Note ø: 0.17% | | | | | | | | | | | | | | | | |
Allen County OH Catholic Healthcare Series C (Health Revenue, Union Bank NA LOC) | | | 0.42 | | | | 6-1-2034 | | | | 3,600,000 | | | | 3,600,000 | |
| | | | | | | | | | | | | | | | |
| | | | |
Oklahoma: 1.27% | | | | | | | | | | | | | | | | |
| | | | |
| Variable Rate Demand Notes ø: 1.27% | | | | | | | | | | | | | | | | |
Oklahoma City OK Water Utilities Trust Water & Sewer System Series 2015 Morgan Stanley Series 2015-ZF2080 (Water & Sewer Revenue, Morgan Stanley Bank LIQ) 144A | | | 0.47 | | | | 7-1-2045 | | | | 5,000,000 | | | | 5,000,000 | |
Oklahoma Turnpike Authority Series F (Transportation Revenue, JPMorgan Chase & Company SPA) | | | 0.37 | | | | 1-1-2028 | | | | 22,000,000 | | | | 22,000,000 | |
| | | | |
| | | | | | | | | | | | | | | 27,000,000 | |
| | | | | | | | | | | | | | | | |
| | | | |
Other: 2.94% | | | | | | | | | | | | | | | | |
| | | | |
| Variable Rate Demand Notes ø: 2.94% | | | | | | | | | | | | | | | | |
Clipper Tax-Exempt Certificate Trust Series 2009-54 (Miscellaneous Revenue, State Street Bank & Trust Company LIQ) | | | 0.49 | | | | 2-15-2028 | | | | 31,870,000 | | | | 31,870,000 | |
FHLMC MFHR Series M027 Class A (Housing Revenue, FHLMC LIQ) | | | 0.47 | | | | 10-15-2029 | | | | 15,685,000 | | | | 15,685,000 | |
FHLMC MFHR Series M031 Class A (Housing Revenue, FHLMC LIQ) | | | 0.47 | | | | 12-15-2045 | | | | 7,820,000 | | | | 7,820,000 | |
FHLMC MFHR Series M033 Class A (Housing Revenue, FHLMC LIQ) | | | 0.47 | | | | 12-15-2046 | | | | 7,035,000 | | | | 7,035,000 | |
| | | | |
| | | | | | | | | | | | | | | 62,410,000 | |
| | | | | | | | | | | | | | | | |
| | | | |
Pennsylvania: 2.02% | | | | | | | | | | | | | | | | |
| | | | |
| Variable Rate Demand Notes ø: 2.02% | | | | | | | | | | | | | | | | |
Bucks County PA Industrial Development Authority Grand View Hospital Series A (Health Revenue, TD Bank NA LOC) | | | 0.43 | | | | 7-1-2034 | | | | 8,140,000 | | | | 8,140,000 | |
| | | | |
| 8 | | Wells Fargo National Tax-Free Money Market Fund | | Portfolio of investments—July 31, 2016 (unaudited) |
| | | | | | | | | | | | | | | | |
| Security name | | Interest rate | | | Maturity date | | | Principal | | | Value | |
| | | | |
| Variable Rate Demand Notes ø (continued) | | | | | | | | | | | | | | | | |
Central Bradford Progress Authority Pennsylvania Robert Packer Hospital Royal Bank of Canada Municipal Products Incorporated Trust Certificates Series 2011-C-14 (Health Revenue, Royal Bank of Canada LOC) 144A | | | 0.47 | % | | | 6-1-2035 | | | $ | 7,405,000 | | | $ | 7,405,000 | |
Philadelphia PA IDA Series B-2 (Miscellaneous Revenue, TD Bank NA LOC) | | | 0.43 | | | | 10-1-2030 | | | | 9,405,000 | | | | 9,405,000 | |
Philadelphia PA School District Series 2016C (GO Revenue, PNC Bank NA LOC) | | | 0.44 | | | | 9-1-2030 | | | | 15,000,000 | | | | 15,000,000 | |
Southcentral Pennsylvania General Authority WellSpan Health Obliged Group Series 2014A Tender Option Bond Trust Receipts/Certificates Series 2015-ZM0081 (Health Revenue, Morgan Stanley Bank LIQ) 144A | | | 0.47 | | | | 6-1-2044 | | | | 2,800,000 | | | | 2,800,000 | |
| | | | |
| | | | | | | | | | | | | | | 42,750,000 | |
| | | | | | | | | | | | | | | | |
| | | | |
Rhode Island: 0.47% | | | | | | | | | | | | | | | | |
| | | | |
| Variable Rate Demand Note ø: 0.47% | | | | | | | | | | | | | | | | |
Narragansett Bay RI Commission Wastewater System Series 2013A Tender Option Trust Receipts/Certificates Series 2016-XM0140 (Water & Sewer Revenue, Royal Bank of Canada LIQ) 144A | | | 0.48 | | | | 9-1-2020 | | | | 10,000,000 | | | | 10,000,000 | |
| | | | | | | | | | | | | | | | |
| | | | |
South Carolina: 3.60% | | | | | | | | | | | | | | | | |
| | | | |
| Other Municipal Debt: 3.01% | | | | | | | | | | | | | | | | |
York County SC PCR Series 2000B-1 (Utilities Revenue) | | | 0.54 | | | | 8-1-2016 | | | | 22,500,000 | | | | 22,500,000 | |
York County SC PCR Series 2000B-2 (Utilities Revenue) | | | 0.54 | | | | 8-1-2016 | | | | 22,500,000 | | | | 22,500,000 | |
York County SC PCR Series 2000B-3 (Utilities Revenue) | | | 0.54 | | | | 8-1-2016 | | | | 18,900,000 | | | | 18,900,000 | |
| | | | |
| | | | | | | | | | | | | | | 63,900,000 | |
| | | | | | | | | | | | | | | | |
| | | | |
| Variable Rate Demand Notes ø: 0.59% | | | | | | | | | | | | | | | | |
Greenville SC Health System Hospital Series 2014B Tender Option Bond Trust Receipts/Certificates Series 2015-XF0145 (Health Revenue, TD Bank NA LIQ) 144A | | | 0.47 | | | | 5-30-2022 | | | | 8,020,000 | | | | 8,020,000 | |
South Carolina Educational Facilities Authority for Private Non-Profit Institutions Higher Learning Educational Facilities Spartanburg Methodist Series 2005 (Education Revenue, Branch Banking & Trust LOC) | | | 0.47 | | | | 8-1-2025 | | | | 3,025,000 | | | | 3,025,000 | |
South Carolina Jobs EDA Institutional Business & Home Safety Project Series 2009 (Industrial Development Revenue, Branch Banking & Trust LOC) | | | 0.45 | | | | 11-1-2034 | | | | 1,470,000 | | | | 1,470,000 | |
| | | | |
| | | | | | | | | | | | | | | 12,515,000 | |
| | | | | | | | | | | | | | | | |
| | | | |
South Dakota: 0.31% | | | | | | | | | | | | | | | | |
| | | | |
| Variable Rate Demand Note ø: 0.31% | | | | | | | | | | | | | | | | |
South Dakota Housing Development Authority LaCrosse Investment Project Series 2001 (Housing Revenue, FNMA Insured, FNMA LIQ) | | | 0.53 | | | | 2-15-2031 | | | | 6,495,000 | | | | 6,495,000 | |
| | | | | | | | | | | | | | | | |
| | | | |
Tennessee: 3.71% | | | | | | | | | | | | | | | | |
| | | | |
| Variable Rate Demand Notes ø: 3.71% | | | | | | | | | | | | | | | | |
Clarksville TN Public Building Authority Tennessee Municipal Building Fund Series 2004 (Miscellaneous Revenue, Bank of America NA LOC) | | | 0.40 | | | | 7-1-2034 | | | | 2,620,000 | | | | 2,620,000 | |
Franklin County TN HEFA Board University of the South Project Series 1998B (Education Revenue) | | | 0.49 | | | | 9-1-2018 | | | | 3,435,000 | | | | 3,435,000 | |
Montgomery County TN Public Building Authority Series 2008 (Miscellaneous Revenue, Bank of America NA LOC) | | | 0.40 | | | | 7-1-2038 | | | | 26,800,000 | | | | 26,800,000 | |
Sevier County TN Public Building Authority Local Government Public Improvement Series V-B-1 (Water & Sewer Revenue, Branch Banking & Trust LOC) | | | 0.45 | | | | 6-1-2035 | | | | 8,300,000 | | | | 8,300,000 | |
Sevier County TN Public Building Authority Local Government Public Improvement Series 6-A1 (Miscellaneous Revenue, Branch Banking & Trust SPA) | | | 0.45 | | | | 6-1-2029 | | | | 37,600,000 | | | | 37,600,000 | |
| | | | |
| | | | | | | | | | | | | | | 78,755,000 | |
| | | | | | | | | | | | | | | | |
| | | | | | |
| Portfolio of investments—July 31, 2016 (unaudited) | | Wells Fargo National Tax-Free Money Market Fund | | | 9 | |
| | | | | | | | | | | | | | | | |
| Security name | | Interest rate | | | Maturity date | | | Principal | | | Value | |
| | | | |
Texas: 12.15% | | | | | | | | | | | | | | | | |
| | | | |
| Other Municipal Debt: 0.10% | | | | | | | | | | | | | | | | |
Dallas TX Independent School District Series 2012 (GO Revenue) | | | 4.00 | % | | | 8-15-2016 | | | $ | 2,100,000 | | | $ | 2,102,972 | |
| | | | | | | | | | | | | | | | |
| | | | |
| Variable Rate Demand Notes ø: 12.05% | | | | | | | | | | | | | | | | |
Atascosa County TX PCR San Miguel Electric Cooperative (Utilities Revenue) | | | 0.52 | | | | 6-30-2020 | | | | 13,000,000 | | | | 13,000,000 | |
Bexar County TX Housing Finance Corporation Palisades Park Apartments Project Series 2009 (Housing Revenue, FHLMC LIQ) | | | 0.52 | | | | 9-1-2039 | | | | 4,000,000 | | | | 4,000,000 | |
Brazos Harbor TX Industrial Development Corporation BASF Corporation Project Series 2001 (Industrial Development Revenue) | | | 0.48 | | | | 7-1-2022 | | | | 4,900,000 | | | | 4,900,000 | |
Dallas TX Waterworks & Sewer System Clipper Tax Exempt Certificates Trust 2009-52 (Water & Sewer Revenue, State Street Bank & Trust Company LIQ) | | | 0.47 | | | | 10-1-2018 | | | | 13,960,000 | | | | 13,960,000 | |
Dickinson TX Independent School District Series SGA 94 (GO Revenue, Societe Generale LIQ) | | | 0.44 | | | | 2-15-2028 | | | | 13,350,000 | | | | 13,350,000 | |
Galveston County TX Housing Finance Corporation Village By The Sea Apartments Project Series 2004 (Housing Revenue, FNMA Insured, FNMA LIQ) | | | 0.53 | | | | 2-15-2032 | | | | 5,090,000 | | | | 5,090,000 | |
Harris County TX Cultural and Educational Facilities Authority Barclays Residual Interest Bonds Trust Series 5WE (Miscellaneous Revenue, Barclays Bank plc LOC) 144A | | | 0.59 | | | | 7-1-2018 | | | | 50,995,000 | | | | 50,995,000 | |
Harris County TX Cultural Educational Facilities Finance Corporation Children’s Hospital Project Series 2015-3 JPMorgan PUTTER Series 5001 (Hospital Revenue, JPMorgan Chase & Company LIQ) 144A | | | 0.39 | | | | 6-1-2019 | | | | 3,765,000 | | | | 3,765,000 | |
Lower Neches Valley TX Authority Industrial Development Corporation ExxonMobil Project Series 2010 (Industrial Development Revenue) | | | 0.34 | | | | 11-1-2038 | | | | 900,000 | | | | 900,000 | |
North Texas Tollway Authority Series 2008A Morgan Stanley Series 3356 (Miscellaneous Revenue, BHAC Insured, Morgan Stanley Bank LIQ) 144A | | | 0.47 | | | | 1-1-2048 | | | | 4,440,000 | | | | 4,440,000 | |
Port Arthur TX Navigation District Industrial Development Corporation Total Petrochemicals USA Incorporated Project Series 2011 (Industrial Development Revenue) | | | 0.47 | | | | 6-1-2041 | | | | 25,000,000 | | | | 25,000,000 | |
Port Arthur TX Navigation District Industrial Development Corporation Total Petrochemicals USA Incorporated Project Series 2012 (Industrial Development Revenue) | | | 0.47 | | | | 3-1-2042 | | | | 27,500,000 | | | | 27,500,000 | |
Port Corpus Christi TX Solid Waste Disposal Flint Hills Resources Project Series 2002B (Resource Recovery Revenue) | | | 0.53 | | | | 7-1-2029 | | | | 11,700,000 | | | | 11,700,000 | |
Tarrant County TX Cultural Educational Facilities Finance Corporation Methodist Hospitals of Dallas Series A (Health Revenue, TD Bank NA LOC) | | | 0.39 | | | | 10-1-2041 | | | | 13,245,000 | | | | 13,245,000 | |
Texas Municipal Gas Acquisition & Supply Corporation Series 2848 (Utilities Revenue, Morgan Stanley Bank LIQ) 144A | | | 0.74 | | | | 12-15-2026 | | | | 56,621,560 | | | | 56,621,560 | |
Texas Tender Option Bond Trust Receipts/Certificates Series 2016-XM0343 (Water & Sewer Revenue, National Insured, Bank of America NA LIQ) 144A | | | 0.50 | | | | 12-1-2023 | | | | 7,100,000 | | | | 7,100,000 | |
| | | | |
| | | | | | | | | | | | | | | 255,566,560 | |
| | | | | | | | | | | | | | | | |
| | | | |
Utah: 0.92% | | | | | | | | | | | | | | | | |
| | | | |
| Variable Rate Demand Note ø: 0.92% | | | | | | | | | | | | | | | | |
Murray UT City Hospital IHC Health Services Incorporated Series C (Health Revenue) | | | 0.35 | | | | 5-15-2036 | | | | 19,440,000 | | | | 19,440,000 | |
| | | | | | | | | | | | | | | | |
| | | | |
Vermont: 0.74% | | | | | | | | | | | | | | | | |
| | | | |
| Variable Rate Demand Notes ø: 0.74% | | | | | | | | | | | | | | | | |
Vermont Educational & Health Buildings Financing Agency Landmark College Project Series 2008A (Education Revenue, TD Bank NA LOC) | | | 0.39 | | | | 7-1-2033 | | | | 2,895,000 | | | | 2,895,000 | |
Vermont Educational & Health Buildings Financing Agency Norwich University Project Series 2008 (Education Revenue, TD Bank NA LOC) | | | 0.42 | | | | 9-1-2038 | | | | 12,900,000 | | | | 12,900,000 | |
| | | | |
| | | | | | | | | | | | | | | 15,795,000 | |
| | | | | | | | | | | | | | | | |
| | | | |
| 10 | | Wells Fargo National Tax-Free Money Market Fund | | Portfolio of investments—July 31, 2016 (unaudited) |
| | | | | | | | | | | | | | | | |
| Security name | | Interest rate | | | Maturity date | | | Principal | | | Value | |
| | | | |
Virginia: 0.79% | | | | | | | | | | | | | | | | |
| | | | |
| Variable Rate Demand Notes ø: 0.79% | | | | | | | | | | | | | | | | |
Fauquier County VA IDA Highland School Project Series 2008 (Education Revenue, Branch Banking & Trust LOC) | | | 0.45 | % | | | 12-1-2033 | | | $ | 3,075,000 | | | $ | 3,075,000 | |
University of Virginia Rector & Visitors Series 2008 (Education Revenue, JPMorgan Chase & Company LIQ) 144A | | | 0.47 | | | | 12-1-2017 | | | | 13,600,000 | | | | 13,600,000 | |
| | | | |
| | | | | | | | | | | | | | | 16,675,000 | |
| | | | | | | | | | | | | | | | |
| | | | |
Washington: 1.94% | | | | | | | | | | | | | | | | |
| | | | |
| Variable Rate Demand Notes ø: 1.94% | | | | | | | | | | | | | | | | |
King County WA Sewer Revenue Bonds 2007 Morgan Stanley Series 3090 (Water & Sewer Revenue, AGM Insured, Credit Suisse LIQ) 144A | | | 0.47 | | | | 1-1-2039 | | | | 7,361,000 | | | | 7,361,000 | |
Squaxin Island Tribe Washington Series 2008-B (Miscellaneous Revenue, Bank of America NA LOC) | | | 0.54 | | | | 5-1-2028 | | | | 2,170,000 | | | | 2,170,000 | |
University of Washington Solar Eclipse Funding Trust Series 2007-0075 (Miscellaneous Revenue, U.S. Bank NA LOC, U.S. Bank NA LIQ) | | | 0.49 | | | | 6-1-2037 | | | | 17,495,000 | | | | 17,495,000 | |
Washington Central Puget Sound Regional Transit Authority Sales Tax Improvement Series 2015S-26B Green Bonds JPMorgan PUTTER Series 5002 (Tax Revenue, JPMorgan Chase & Company LIQ) 144A | | | 0.39 | | | | 11-1-2017 | | | | 9,190,000 | | | | 9,190,000 | |
Washington Housing Finance Commission Nonprofit Tacoma Art Museum Project Series 2002 (Miscellaneous Revenue, Northern Trust Company LOC) | | | 0.39 | | | | 6-1-2032 | | | | 4,900,000 | | | | 4,900,000 | |
| | | | |
| | | | | | | | | | | | | | | 41,116,000 | |
| | | | | | | | | | | | | | | | |
| | | | |
Wisconsin: 4.98% | | | | | | | | | | | | | | | | |
| | | | |
| Variable Rate Demand Notes ø: 4.98% | | | | | | | | | | | | | | | | |
Appleton WI Recovery Zone Facilities Foremost Farms Project Series 2010 (Industrial Development Revenue, CoBank LOC) | | | 0.44 | | | �� | 5-1-2037 | | | | 30,000,000 | | | | 30,000,000 | |
Hull WI Welcome Dairy Incorporated Project Series 2010B (Industrial Development Revenue, Associated Trust Company NA LOC) | | | 0.64 | | | | 1-1-2027 | | | | 1,820,000 | | | | 1,820,000 | |
Wisconsin Clipper Tax-Exempt Certificate Trust Series 2009-36 (Miscellaneous Revenue, State Street Bank & Trust Company LIQ) | | | 0.47 | | | | 5-1-2020 | | | | 26,755,000 | | | | 26,755,000 | |
Wisconsin HEFA Wheaton Franciscan Healthcare System Morgan Stanley Series 2006-2113 (Health Revenue, Morgan Stanley Bank LIQ) 144A | | | 0.50 | | | | 8-15-2034 | | | | 33,210,740 | | | | 33,210,740 | |
Wisconsin PFA Midwestern Disaster Area Program Series 2011 (Industrial Development Revenue, Farm Credit Services America LOC) | | | 0.44 | | | | 9-1-2036 | | | | 13,780,000 | | | | 13,780,000 | |
| | | | |
| | | | | | | | | | | | | | | 105,565,740 | |
| | | | | | | | | | | | | | | | |
| | | | |
Wyoming: 0.79% | | | | | | | | | | | | | | | | |
| | | | |
| Variable Rate Demand Note ø: 0.79% | | | | | | | | | | | | | | | | |
Lincoln County WY PCR ExxonMobil Project Series 2014 (Resource Recovery Revenue) | | | 0.34 | | | | 10-1-2044 | | | | 16,800,000 | | | | 16,800,000 | |
| | | | | | | | | | | | | | | | |
| | | | |
Total Municipal Obligations (Cost $1,952,008,898) | | | | | | | | | | | | | | | 1,952,008,898 | |
| | | | | | | | | | | | | | | | |
| | | | |
Repurchase Agreements: 3.77% | | | | | | | | | | | | | | | | |
Societe Generale, dated 7-29-2016, maturity value $80,000,220 ^^ | | | 0.33 | | | | 8-1-2016 | | | | 80,000,000 | | | | 80,000,000 | |
| | | | | | | | | | | | | | | | |
| | | | |
Total Repurchase Agreements (Cost $80,000,000) | | | | | | | | | | | | | | | 80,000,000 | |
| | | | | | | | | | | | | | | | |
| | | | | | | | |
| Total investments in securities (Cost $2,032,008,898) * | | | 95.79 | % | | | 2,032,008,898 | |
Other assets and liabilities, net | | | 4.21 | | | | 89,360,863 | |
| | | | | | | | |
| Total net assets | | | 100.00 | % | | $ | 2,121,369,761 | |
| | | | | | | | |
| | | | | | |
| Portfolio of investments—July 31, 2016 (unaudited) | | Wells Fargo National Tax-Free Money Market Fund | | | 11 | |
| Ø | Variable rate demand notes are subject to a demand feature which reduces the effective maturity. The maturity date shown represents the final maturity date of the security. The interest rate is determined and reset by the issuer daily, weekly, or monthly depending upon the terms of the security. The rate shown is the rate in effect at period end. |
| 144A | The security may be resold in transactions exempt from registration, normally to qualified institutional buyers, pursuant to Rule 144A under the Securities Act of 1933. |
| ^^ | Collateralized by U.S. government securities, 0.00% to 8.13%, 7-31-2016 to 8-15-2045, fair value including accrued interest is $81,600,000. |
| * | Cost for federal income tax purposes is substantially the same as for financial reporting purposes. |
| ITEM 7. | DISCLOSURE OF PROXY VOTING POLICIES AND PROCEDURES FOR CLOSED-END MANAGEMENT INVESTMENT COMPANIES |
Not applicable.
| ITEM 8. | PORTFOLIO MANAGERS OF CLOSED-END MANAGEMENT INVESTMENT COMPANIES |
Not applicable.
| ITEM 9. | PURCHASES OF EQUITY SECURITIES BY CLOSED-END MANAGEMEENT INVESTMENT COMPANY AND AFFILIATED PURCHASERS |
Not applicable.
| ITEM 10. | SUBMISSION OF MATTERS TO A VOTE OF SECURITY HOLDERS |
There have been no material changes to the procedures by which shareholders may recommend nominees to the registrant’s Board of Trustees that have been implemented since the registrant’s last provided disclosure in response to the requirements of this Item.
| ITEM 11. | CONTROLS AND PROCEDURES |
(a) The President and Treasurer have concluded that the Wells Fargo Funds Trust (the “Trust”) disclosure controls and procedures (as defined in Rule 30a-3(c) under the Investment Company Act of 1940) provide reasonable assurances that material information relating to the Trust is made known to them by the appropriate persons, based on their evaluation of these controls and procedures as of a date within 90 days of the filing of this report.
(b) There were no significant changes in the Trust’s internal controls over financial reporting (as defined in Rule 30a-3(d) under the Investment Company Act of 1940) that occurred during the second fiscal quarter of the period covered by this report that materially affected, or is reasonably likely to materially affect, the registrant’s internal control over financial reporting.
(a)(1) Not applicable.
(a)(2) Certification pursuant to Rule 30a-2(a) under the Investment Company Act of 1940 (17 CFR 270.30a-2(a)) is filed and attached hereto as Exhibit 99.CERT.
(a)(3) Not applicable.
(b) Certification pursuant to Rule 30a-2(b) under the Investment Company Act of 1940 (17 CFR 270.30a-2(b)) is filed and attached hereto as Exhibit 99.906CERT.
SIGNATURES
Pursuant to the requirements of the Securities Exchange Act of 1934 and the Investment Company Act of 1940, the registrant has duly caused this report to be signed on its behalf by the undersigned, thereunto duly authorized.
| | |
| Wells Fargo Funds Trust |
| |
| By: | | /s/ Karla M. Rabusch |
| |
| | Karla M. Rabusch |
| | President |
| |
| Date: | | September 23, 2016 |
Pursuant to the requirements of the Securities Exchange Act of 1934 and the Investment Company Act of 1940, this report has been signed below by the following persons on behalf of the registrant and in the capacities and on the date indicated.
| | |
| Wells Fargo Funds Trust |
| |
| By: | | /s/ Karla M. Rabusch |
| |
| | Karla M. Rabusch |
| | President |
| | |
| Date: | | September 23, 2016 |
| |
| By: | | /s/ Nancy Wiser |
| |
| | Nancy Wiser |
| | Treasurer |
| |
| Date: | | September 23, 2016 |