
UNITED STATES
SECURITIES AND EXCHANGE COMMISSION
Washington, D.C. 20549
FORM N-CSR
CERTIFIED SHAREHOLDER REPORT OF REGISTERED
MANAGEMENT INVESTMENT COMPANIES
Investment Company Act file number: 811-09253
Wells Fargo Funds Trust
(Exact name of registrant as specified in charter)
525 Market St., San Francisco, CA 94105
(Address of principal executive offices) (Zip code)
C. David Messman
Wells Fargo Funds Management, LLC
525 Market St., San Francisco, CA 94105
(Name and address of agent for service)
Registrant’s telephone number, including area code: 800-222-8222
Date of fiscal year end: September 30
Registrant is making a filing for 11 of its series:
Wells Fargo Diversified Capital Builder Fund, Wells Fargo Diversified Income Builder Fund, Wells Fargo Index Asset Allocation Fund, Wells Fargo International Bond Fund, Wells Fargo Strategic Income Fund, Wells Fargo C&B Mid Cap Value Fund, Wells Fargo Common Stock Fund, Wells Fargo Discovery Fund, Wells Fargo Enterprise Fund, Wells Fargo Opportunity Fund, and Wells Fargo Special Mid Cap Value Fund.
Date of reporting period: September 30, 2017
| ITEM 1. | REPORT TO STOCKHOLDERS |
Annual Report
September 30, 2017

Wells Fargo Diversified Capital Builder Fund


Reduce clutter. Save trees.
Sign up for electronic delivery of prospectuses and shareholder reports at wellsfargo.com/advantagedelivery
Contents
The views expressed and any forward-looking statements are as of September 30, 2017, unless otherwise noted, and are those of the Fund managers and/or Wells Fargo Funds Management, LLC. Discussions of individual securities, or the markets generally, or any Wells Fargo Fund are not intended as individual recommendations. Future events or results may vary significantly from those expressed in any forward-looking statements. The views expressed are subject to change at any time in response to changing circumstances in the market. Wells Fargo Funds Management, LLC and the Fund disclaim any obligation to publicly update or revise any views expressed or forward-looking statements.
NOT FDIC INSURED ◾ NO BANK GUARANTEE ◾ MAY LOSE VALUE
| | | | |
| 2 | | Wells Fargo Diversified Capital Builder Fund | | Letter to shareholders (unaudited) |

Andrew Owen
President
Wells Fargo Funds
Favorable economic news supported stocks, and interest rates moved higher.
Hiring remained strong, and business and consumer sentiment improved.
Dear Shareholder:
We are pleased to offer you this annual report for the Wells Fargo Diversified Capital Builder Fund for the 12-month period that ended September 30, 2017. Despite heightened market volatility at times, global stocks generally delivered double-digit results and bond markets had smaller but positive results as well. U.S. and international stocks returned 18.61% and 19.61%, respectively, for the 12-month period, as measured by the S&P 500 Index1 and the MSCI ACWI ex USA Index (Net),2 respectively; within fixed income, the Bloomberg Barclays U.S. Aggregate Bond Index3 returned 0.07% and the Bloomberg Barclays Municipal Bond Index4 returned 0.87% as interest rates rose from low levels.
Election results and central banks’ policies commanded investor attention as 2016 closed.
During the fourth quarter of 2016, investors appeared intent on the prospective outcomes of elections in the U.S. and central-bank actions globally. Following Donald Trump’s election victory, U.S. stocks rallied. Investors appeared optimistic that the new administration would pursue progrowth policies. Favorable economic news supported stocks, and interest rates moved higher. At their mid-December meeting, U.S. Federal Reserve (Fed) officials raised the target interest rate by a quarter percentage point to a range of 0.50% to 0.75%. The fourth quarter also saw the implementation of the U.S. Securities and Exchange Commission’s new rules for money market funds, which included floating net asset values (NAVs) as well as the possibility of liquidity fees and redemption gates for institutional prime and municipal money market funds. In the year leading up to money market fund reform implementation, nearly $1 trillion in assets moved from money market funds subject to floating NAVs into government money market funds, which continued to transact at a stable $1.00 NAV. Outside of the U.S., the prospects for faster U.S. growth appeared to trigger some acceleration in Europe.
Financial markets gained during the first two quarters of 2017 on positive economic data.
Stocks rallied globally through the first quarter of 2017, supported by signs of improvement in the U.S. and global economies. U.S. economic data released during the quarter reflected a healthy economy. Hiring remained strong, and business and consumer sentiment improved. In March, Fed officials raised their target interest rate by a quarter percentage point to a range of 0.75% to 1.00%. With the Fed’s target interest-rate increase, short-term bond yields rose during the quarter. Meanwhile, longer-term Treasury yields were little changed, leading to positive performance. Investment-grade and high-yield bonds benefited from strong demand. Municipal bond returns were positive in the quarter, helped by strong demand and constrained new-issue supply. Outside of the U.S., stocks in emerging markets generally outperformed stocks in the U.S. and international
| 1 | The S&P 500 Index consists of 500 stocks chosen for market size, liquidity, and industry group representation. It is a market-value-weighted index with each stock’s weight in the index proportionate to its market value. You cannot invest directly in an index. |
| 2 | The Morgan Stanley Capital International (MSCI) All Country World Index (ACWI) ex USA Index (Net) is a free-float-adjusted market-capitalization-weighted index that is designed to measure the equity market performance of developed markets, excluding the United States and Canada. Source: MSCI. MSCI makes no express or implied warranties or representations and shall have no liability whatsoever with respect to any MSCI data contained herein. The MSCI data may not be further redistributed or used as a basis for other indexes or any securities or financial products. This report is not approved, reviewed, or produced by MSCI. You cannot invest directly in an index. |
| 3 | The Bloomberg Barclays U.S. Aggregate Bond Index is a broad-based benchmark that measures the investment-grade, U.S. dollar-denominated, fixed-rate taxable bond market, including Treasuries, government-related and corporate securities, mortgage-backed securities (agency fixed-rate and hybrid adjustable-rate mortgage pass-throughs), asset-backed securities, and commercial mortgage-backed securities. You cannot invest directly in an index. |
| 4 | The Bloomberg Barclays Municipal Bond Index is an unmanaged index composed of long-term tax-exempt bonds with a minimum credit rating of Baa. You cannot invest directly in an index. |
| | | | | | |
| Letter to shareholders (unaudited) | | Wells Fargo Diversified Capital Builder Fund | | | 3 | |
developed markets because they benefited from both global economic growth and recent weakening in the U.S. dollar. Stocks in Asia, Europe, and Latin America also outperformed the U.S. market during the quarter.
Globally, stocks marked continued gains through the second quarter of 2017. Steady, albeit modest, economic growth both in the U.S. and abroad and generally favorable corporate earnings announcements supported higher valuations. U.S. inflation trended lower despite a continued decline in the unemployment rate. Ten-year U.S. Treasury yields declined, resulting in stronger prices for long-term bonds. As was widely expected, the Fed raised the target interest rate in June by a quarter percentage point to a range of 1.00% to 1.25%. In addition, the Fed indicated that it would begin to sell bonds accumulated on its balance sheet during quantitative easing programs conducted since 2008. Later in the third quarter, the Fed confirmed that the initiative to reduce the bonds that it holds likely would begin in October.
Volatility increased during the third quarter of 2017.
Early in July and again in August, volatility expectations increased and then receded—as measured by the CBOE VIX5—amid geopolitical tensions, particularly in Asia, and declining investor optimism following unsuccessful efforts to reform health care laws in the U.S. which suggested to some that President Trump and Congress would be unable to move forward with tax and regulatory reforms.
During the quarter, economic momentum increased in Europe; the European Central Bank held its rates steady at low levels and continued its quantitative easing bond-buying program, which is intended to spark economic activity. The Bank of England suggested it could hike interest rates in November, and the pound gained against other currencies. The Bank of Japan also maintained accommodative policies intended to support business activity and economic growth. In Germany, Angela Merkel was reelected chancellor; in Japan, Prime Minister Shinzo Abe called for snap elections as his popularity increased after North Korea’s aggressive program of missile launches. Both political developments were indicative of the type of political consistency in developed markets that reassure financial markets.
In emerging markets, many countries benefited from stronger currencies versus the U.S. dollar. In addition, commodity prices were on an upward trajectory, which benefited many companies that rely on natural resources for exports.
As the quarter closed, optimism returned as economic growth continued. The second-quarter gross domestic product measure was revised higher from 2.6% annualized to 3.0%. Consumer spending and residential and nonresidential investment increased. While inflation continued to trail the Fed’s targets, expectations remained for an additional short-term interest-rate hike before year-end.
| 5 | The Chicago Board Options Exchange Market Volatility Index (CBOE VIX) is a popular measure of the implied volatility of S&P 500 Index options. It represents one measure of the market’s expectation of stock market volatility over the next 30-day period. You cannot invest directly in an index. |
| | | | |
| 4 | | Wells Fargo Diversified Capital Builder Fund | | Letter to shareholders (unaudited) |
Don’t let short-term uncertainty derail long-term investment goals.
Periods of investment uncertainty can present challenges, but experience has taught us that maintaining long-term investment goals can be an effective way to plan for the future. To help you create a sound strategy based on your personal goals and risk tolerance, Wells Fargo Funds offers more than 100 mutual funds spanning a wide range of asset classes and investment styles. Although diversification cannot guarantee an investment profit or prevent losses, we believe it
can be an effective way to manage investment risk and potentially smooth out overall portfolio performance. We encourage investors to know their investments and to understand that appropriate levels of risk-taking may unlock opportunities.
Thank you for choosing to invest with Wells Fargo Funds. We appreciate your confidence in us and remain committed to helping you meet your financial needs.
Sincerely,

Andrew Owen
President
Wells Fargo Funds
For further information about your Fund, contact your investment professional, visit our website at wellsfargofunds.com, or call us directly at 1-800-222-8222. We are available 24 hours a day, 7 days a week.
This page is intentionally left blank.
| | | | |
| 6 | | Wells Fargo Diversified Capital Builder Fund | | Performance highlights (unaudited) |
Investment objective
The Fund seeks long-term total return, consisting of capital appreciation and current income.
Manager
Wells Fargo Funds Management, LLC
Subadviser
Wells Capital Management Incorporated
Portfolio manager
Margaret Patel
Average annual total returns (%) as of September 30, 20171
| | | | | | | | | | | | | | | | | | | | | | | | | | | | | | | | | | |
| | | | | Including sales charge | | | Excluding sales charge | | | Expense ratios2 (%) | |
| | | Inception date | | 1 year | | | 5 year | | | 10 year | | | 1 year | | | 5 year | | | 10 year | | | Gross | | | Net3 | |
| Class A (EKBAX) | | 1-20-1998 | | | 7.06 | | | | 12.41 | | | | 5.80 | | | | 13.62 | | | | 13.75 | | | | 6.42 | | | | 1.14 | | | | 1.14 | |
| Class C (EKBCX) | | 1-22-1998 | | | 11.85 | | | | 12.89 | | | | 5.63 | | | | 12.85 | | | | 12.89 | | | | 5.63 | | | | 1.89 | | | | 1.89 | |
| Administrator Class (EKBDX) | | 7-30-2010 | | | – | | | | – | | | | – | | | | 13.75 | | | | 13.97 | | | | 6.61 | | | | 1.06 | | | | 1.05 | |
| Institutional Class (EKBYX) | | 1-26-1998 | | | – | | | | – | | | | – | | | | 14.11 | | | | 14.19 | | | | 6.81 | | | | 0.81 | | | | 0.78 | |
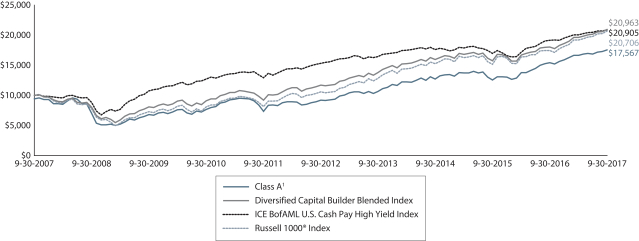
| Diversified Capital Builder Blended Index4 | | – | | | – | | | | – | | | | – | | | | 16.13 | | | | 12.30 | | | | 7.68 | | | | – | | | | – | |
ICE BofAML U.S. Cash Pay High Yield Index5 | | – | | | – | | | | – | | | | – | | | | 9.06 | | | | 6.35 | | | | 7.65 | | | | – | | | | – | |
| Russell 1000® Index6 | | – | | | – | | | | – | | | | – | | | | 18.54 | | | | 14.27 | | | | 7.55 | | | | – | | | | – | |
Figures quoted represent past performance, which is no guarantee of future results, and do not reflect taxes that a shareholder may pay on fund distributions or the redemption of fund shares. Investment return and principal value of an investment will fluctuate so that an investor’s shares, when redeemed, may be worth more or less than their original cost. Performance shown without sales charges would be lower if sales charges were reflected. Current performance may be lower or higher than the performance data quoted, which assumes the reinvestment of dividends and capital gains. Current month-end performance is available on the Fund’s website, wellsfargofunds.com.
Index returns do not include transaction costs associated with buying and selling securities, any mutual fund fees or expenses, or any taxes. It is not possible to invest directly in an index.
For Class A shares, the maximum front-end sales charge is 5.75%. For Class C shares, the maximum contingent deferred sales charge is 1.00%. Performance including a contingent deferred sales charge assumes the sales charge for the corresponding time period. Administrator Class and Institutional Class shares are sold without a front-end sales charge or contingent deferred sales charge.
Balanced funds may invest in stocks and bonds. Stock values fluctuate in response to the activities of individual companies and general market and economic conditions. Bond values fluctuate in response to the financial condition of individual issuers, general market and economic conditions, and changes in interest rates. Changes in market conditions and government policies may lead to periods of heightened volatility in the bond market and reduced liquidity for certain bonds held by the Fund. In general, when interest rates rise, bond values fall and investors may lose principal value. Interest-rate changes and their impact on the Fund and its share price can be sudden and unpredictable. Certain investment strategies tend to increase the total risk of an investment (relative to the broader market). The Fund is exposed to foreign investment risk, high-yield securities risk, and smaller-company securities risk. Consult the Fund’s prospectus for additional information on these and other risks.
Please see footnotes on page 7.
| | | | | | |
| Performance highlights (unaudited) | | Wells Fargo Diversified Capital Builder Fund | | | 7 | |
|
| Growth of $10,000 investment as of September 30, 20177 |
|
|
| 1 | Historical performance shown for Administrator Class shares prior to their inception reflects the performance of Institutional Class shares and has been adjusted to reflect the higher expenses applicable to Administrator Class shares. Historical performance shown for all classes of the Fund prior to July 12, 2010, is based on the performance of the Fund’s predecessor, Evergreen Diversified Capital Builder Fund. |
| 2 | Reflects the expense ratios as stated in the most recent prospectuses. The expense ratios shown are subject to change and may differ from the annualized expense ratios shown in the financial highlights of this report. |
| 3 | The manager has contractually committed through January 31, 2018, to waive fees and/or reimburse expenses to the extent necessary to cap the Fund’s Total Annual Fund Operating Expenses After Fee Waivers at 1.20% for Class A, 1.95% for Class C, 1.05% for Administrator Class, and 0.78% for Institutional Class. After this time, the cap may be increased or the commitment to maintain the cap may be terminated only with the approval of the Board of Trustees. Brokerage commissions, stamp duty fees, interest, taxes, acquired fund fees and expenses, and extraordinary expenses are excluded from the expense cap. Without this cap, the Fund’s returns would have been lower. The expense ratio paid by an investor is the net expense ratio or the Fund’s Total Annual Fund Operating Expenses After Fee Waivers, as stated in the prospectuses. |
| 4 | Source: Wells Fargo Funds Management, LLC. The Diversified Capital Builder Blended Index is composed of the Russell 1000® Index (75%) and the ICE BofAML U.S. Cash Pay High Yield Index (25%). You cannot invest directly in an index. |
| 5 | The ICE BofAML U.S. Cash Pay High Yield Index (formerly known as BofA Merrill Lynch High Yield U.S. Corporates, Cash Pay Index) is an unmanaged market index that provides a broad-based performance measure of the non-investment grade U.S. domestic bond index. You cannot invest directly in an index. |
| 6 | The Russell 1000® Index measures the performance of the 1,000 largest companies in the Russell 3000® Index, which represents approximately 92% of the total market capitalization of the Russell 3000® Index. You cannot invest directly in an index. |
| 7 | The chart compares the performance of Class A shares for the most recent ten years with the Diversified Capital Builder Blended Index, the ICE BofAML U.S. Cash Pay High Yield Index, and the Russell 1000® Index. The chart assumes a hypothetical investment of $10,000 in Class A shares and reflects all operating expenses and assumes the maximum initial sales charge of 5.75%. |
| 8 | The ten largest holdings, excluding cash and cash equivalents, are calculated based on the value of the investments divided by total net assets of the Fund. Holdings are subject to change and may have changed since the date specified. |
| 9 | Amounts are calculated based on the total long-term investments of the Fund. These amounts are subject to change and may have changed since the date specified. |
| * | This security was not held in the Fund at the end of the reporting period. |
| | | | |
| 8 | | Wells Fargo Diversified Capital Builder Fund | | Performance highlights (unaudited) |
MANAGER’S DISCUSSION
Fund highlights
| ∎ | | The Fund underperformed its benchmark, the Diversified Capital Builder Blended Index, for the 12-month period that ended September 30, 2017. |
| ∎ | | The Fund underperformed the benchmark because of a below-benchmark weighting to the financials sector; a relative overweight in the energy sector; and a relative underweight in the information technology (IT) sector, particularly of several large IT companies that make up a significant portion of the sector. |
| ∎ | | In the Fund’s bond portfolio, holdings outperformed the bond portion of the benchmark index, the ICE BofAML U.S. Cash Pay High Yield Index as the portfolio had somewhat longer-than-average duration compared with that bond index. |
Equities advanced with relatively low volatility during the period.
Prices for stocks held up better than high-yield bonds during the period. Equities advanced with relatively low volatility over the course of the period, reflecting continuing, though modest, economic growth. Bond performance was more mixed, with prices of both Treasury and investment-grade corporate bonds declining slightly as their yields rose; in contrast, the high-yield bond sector generally experienced modest price gains as yields for this sector declined.
In the stock market, stocks advanced steadily throughout the period, with only very small short-lived pullbacks before continuing to advance. Many investors were concerned that stock prices would decline if interest rates went up or if economic growth remained very modest or that companies would not be able to maintain their historically high profit margins and profit growth. However, these concerns did not negatively affect the stock market’s advance, as investors focused more on rising profits than they did on the relatively small rise in interest rates. In addition, it became clear that the Federal Reserve was sensitive to market concerns about rising rates and it would attempt to adjust interest rates in a gradual manner, which was judged as unlikely to affect economic growth and stock valuations adversely.
The Fund had outperformance relative to its equity benchmark in the health care, industrials, utilities, and real estate sectors. The Fund also benefitted from one takeover in the industrials sector. Equity detractors were primarily in the energy sector, as well as several health care and IT issues. In the Fund’s equity portfolio, outperformers in the IT sector included Broadcom Limited, Amphenol Corporation, and Adobe Systems Incorporated. In the industrials sector, several defense-focused companies contributed to performance, such as Orbital ATK, Incorporated, which received a takeover bid from Northrop Grumman Corporation*; Raytheon Company; and Huntington Ingalls Industries, Incorporated. Real estate companies contributing were Crown Castle International Corporation and Equinix, Incorporated. Detractors among stock holdings were primarily in the energy sector, including Kinder Morgan, Incorporated, and Plains All American Pipeline, L.P. Also underperforming were health care pharmaceuticals company Allergan plc and IT company QUALCOMM Incorporated.
In the bond market, once again fears of sharply higher interest rates proved overstated as the rate rise in the Treasury market proved modest. To illustrate, the yield to maturity of representative Treasury bonds maturing in 10 years yielded 1.60% at the beginning of the period and had a yield at the end of the period of 2.33%. Investment-grade corporate bonds reflected this gently rising rate trend. Bond prices and yields move in opposite directions.
| | | | |
| Ten largest holdings (%) as of September 30, 20178 | |
Microsoft Corporation | | | 4.27 | |
Broadcom Limited | | | 3.61 | |
Kinder Morgan Incorporated | | | 3.31 | |
Amphenol Corporation Class A | | | 3.24 | |
Alphabet Incorporated Class A | | | 3.10 | |
Leidos Holdings Incorporated | | | 2.89 | |
Adobe Systems Incorporated | | | 2.69 | |
LyondellBasell Industries NV Class A | | | 2.68 | |
Andeavor Logistics LP | | | 2.63 | |
Allergan plc | | | 2.61 | |
High-yield bonds, which are somewhat more sensitive to prospects of future economic growth than are investment-grade bonds, had declines in yield and small increases in prices, with the average yield to maturity declining from 6.25% at the beginning of the period to 5.43% at the end of the period. High-yield bonds benefited not only from their wide yield spread over comparable maturity Treasury bonds—from a difference of about 510 basis points (bps; 100 bps equal 1.00%) in excess of Treasury rates at the beginning of the period to 366 bps at period-end—but also from diminished concerns about the potential for sharp rises in Treasury rates and default rates. Investors’ increased risk appetites caused high-yield bond yields to decline in the face of modestly rising Treasury rates.
Please see footnotes on page 7.
| | | | | | |
| Performance highlights (unaudited) | | Wells Fargo Diversified Capital Builder Fund | | | 9 | |
|
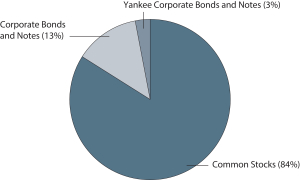
| Portfolio allocation as of September 30, 20179 |
|
|
While intermediate Treasury yields slightly increased in the fiscal year, resulting in drops in prices, yields for high-yield bonds generally declined over the same period, resulting in price gains. Because of our somewhat longer duration, many of our holdings benefited from the drops in yield, allowing prices to rise somewhat. Relative underperformers in the bond portfolio included several energy bonds and select industrials and specialty pharmaceutical bonds. Bonds that outperformed included Tronox Finance plc, Rayonier Advanced Materials Incorporated, and Koppers Holdings Incorporated* in the basic materials sector as well as IT companies Micron Technology, Incorporated, and Seagate Technology plc. Underperformers in the bond
portfolio included energy companies Plains All American Pipeline, L.P.; Tennessee Gas Pipeline Company, LLC; and several general industrials companies, such as TransDigm Group Incorporated.
Our outlook remains one of cautious optimism.
While the pace of economic growth is modest compared with previous recoveries after recessions, the current expansion is one of the longest. We believe the intrinsic dynamism, creativity, and basis strengths of the U.S. economy should provide opportunities for the stock market over the next year. Slow but steady gains in employment should help stimulate demand for goods and services. Furthermore, the expansion of low-cost shale gas and petroleum liquids should continue to provide a boon to both businesses and consumers, improving the competitive positions of U.S. companies and offering some cost relief to consumers for utility and fuel costs.
We are somewhat cautious that the high-yield bond market might not offer the relative outperformance we have seen over the past few years. However, we believe that by concentrating our holdings in companies with above-average credit quality, our holdings may provide enough income above that of risk-free alternatives to compensate for their credit risk.
Please see footnotes on page 7.
| | | | |
| 10 | | Wells Fargo Diversified Capital Builder Fund | | Fund expenses (unaudited) |
As a shareholder of the Fund, you incur two types of costs: (1) transaction costs, including sales charges (loads) on purchase payments and contingent deferred sales charges (if any) on redemptions and (2) ongoing costs, including management fees, distribution (12b-1) and/or shareholder servicing fees, and other Fund expenses. This example is intended to help you understand your ongoing costs (in dollars) of investing in the Fund and to compare these costs with the ongoing costs of investing in other mutual funds.
The example is based on an investment of $1,000 invested at the beginning of the six-month period and held for the entire period from April 1, 2017 to September 30, 2017.
Actual expenses
The “Actual” line of the table below provides information about actual account values and actual expenses. You may use the information in this line, together with the amount you invested, to estimate the expenses that you paid over the period. Simply divide your account value by $1,000 (for example, an $8,600 account value divided by $1,000 = 8.6), then multiply the result by the number in the “Actual” line under the heading entitled “Expenses paid during period” for your applicable class of shares to estimate the expenses you paid on your account during this period.
Hypothetical example for comparison purposes
The “Hypothetical” line of the table below provides information about hypothetical account values and hypothetical expenses based on the Fund’s actual expense ratio and an assumed rate of return of 5% per year before expenses, which is not the Fund’s actual return. The hypothetical account values and expenses may not be used to estimate the actual ending account balance or expenses you paid for the period. You may use this information to compare the ongoing costs of investing in the Fund and other funds. To do so, compare this 5% hypothetical example with the 5% hypothetical examples that appear in the shareholder reports of the other funds.
Please note that the expenses shown in the table are meant to highlight your ongoing costs only and do not reflect any transactional costs, such as sales charges (loads) and contingent deferred sales charges. Therefore, the “Hypothetical” line of the table is useful in comparing ongoing costs only and will not help you determine the relative total costs of owning different funds. In addition, if these transactional costs were included, your costs would have been higher.
| | | | | | | | | | | | | | | | |
| | | Beginning
account value
4-1-2017 | | | Ending
account value
9-30-2017 | | | Expenses
paid during
the period¹ | | | Annualized net
expense ratio | |
Class A | | | | | | | | | | | | | | | | |
Actual | | $ | 1,000.00 | | | $ | 1,052.67 | | | $ | 5.73 | | | | 1.11 | % |
Hypothetical (5% return before expenses) | | $ | 1,000.00 | | | $ | 1,019.49 | | | $ | 5.64 | | | | 1.11 | % |
Class C | | | | | | | | | | | | | | | | |
Actual | | $ | 1,000.00 | | | $ | 1,049.85 | | | $ | 9.58 | | | | 1.86 | % |
Hypothetical (5% return before expenses) | | $ | 1,000.00 | | | $ | 1,015.72 | | | $ | 9.42 | | | | 1.86 | % |
Administrator Class | | | | | | | | | | | | | | | | |
Actual | | $ | 1,000.00 | | | $ | 1,054.75 | | | $ | 5.30 | | | | 1.03 | % |
Hypothetical (5% return before expenses) | | $ | 1,000.00 | | | $ | 1,019.91 | | | $ | 5.21 | | | | 1.03 | % |
Institutional Class | | | | | | | | | | | | | | | | |
Actual | | $ | 1,000.00 | | | $ | 1,056.04 | | | $ | 4.02 | | | | 0.78 | % |
Hypothetical (5% return before expenses) | | $ | 1,000.00 | | | $ | 1,021.16 | | | $ | 3.95 | | | | 0.78 | % |
| 1 | Expenses paid is equal to the annualized net expense ratio of each class multiplied by the average account value over the period, multiplied by the number of days in the most recent fiscal half-year divided by the number of days in the fiscal year (to reflect the one-half-year period). |
| | | | | | |
| Portfolio of investments—September 30, 2017 | | Wells Fargo Diversified Capital Builder Fund | | | 11 | |
| | | | | | | | | | | | | | | | |
| Security name | | | | | | | | Shares | | | Value | |
| | | | |
Common Stocks: 83.11% | | | | | | | | | | | | | | | | |
| | | | |
Consumer Discretionary: 1.27% | | | | | | | | | | | | | | | | |
| | | | |
| Household Durables: 1.27% | | | | | | | | | | | | | | | | |
Leggett & Platt Incorporated | | | | | | | | | | | 250,000 | | | $ | 11,932,500 | |
| | | | | | | | | | | | | | | | |
| | | | |
Consumer Staples: 1.46% | | | | | | | | | | | | | | | | |
| | | | |
| Food & Staples Retailing: 0.63% | | | | | | | | | | | | | | | | |
CVS Health Corporation | | | | | | | | | | | 60,000 | | | | 4,879,200 | |
Sysco Corporation | | | | | | | | | | | 20,000 | | | | 1,079,000 | |
| | | | |
| | | | | | | | | | | | | | | 5,958,200 | |
| | | | | | | | | | | | | | | | |
| | | | |
| Food Products: 0.83% | | | | | | | | | | | | | | | | |
ConAgra Foods Incorporated | | | | | | | | | | | 120,000 | | | | 4,048,800 | |
Lamb Weston Holdings Incorporated | | | | | | | | | | | 80,001 | | | | 3,751,247 | |
| | | | |
| | | | | | | | | | | | | | | 7,800,047 | |
| | | | | | | | | | | | | | | | |
| | | | |
Energy: 12.98% | | | | | | | | | | | | | | | | |
| | | | |
| Oil, Gas & Consumable Fuels: 12.98% | | | | | | | | | | | | | | | | |
Andeavor Logistics LP | | | | | | | | | | | 495,000 | | | | 24,779,700 | |
EOG Resources Incorporated | | | | | | | | | | | 35,000 | | | | 3,385,900 | |
EQT Corporation | | | | | | | | | | | 100,000 | | | | 6,524,000 | |
Kinder Morgan Incorporated | | | | | | | | | | | 1,625,000 | | | | 31,167,500 | |
ONEOK Incorporated | | | | | | | | | | | 150,000 | | | | 8,311,500 | |
Plains All American Pipeline LP | | | | | | | | | | | 1,120,000 | | | | 23,732,800 | |
The Williams Companies Incorporated | | | | | | | | | | | 810,000 | | | | 24,308,100 | |
| | | | |
| | | | | | | | | | | | | | | 122,209,500 | |
| | | | | | | | | | | | | | | | |
| | | | |
Health Care: 13.54% | | | | | | | | | | | | | | | | |
| | | | |
| Health Care Equipment & Supplies: 6.98% | | | | | | | | | | | | | | | | |
Abbott Laboratories | | | | | | | | | | | 380,000 | | | | 20,276,800 | |
Becton Dickinson & Company | | | | | | | | | | | 120,000 | | | | 23,514,000 | |
C.R. Bard Incorporated | | | | | | | | | | | 5,000 | | | | 1,602,500 | |
Teleflex Incorporated | | | | | | | | | | | 80,000 | | | | 19,357,600 | |
West Pharmaceutical Services Incorporated | | | | | | | | | | | 10,000 | | | | 962,600 | |
| | | | |
| | | | | | | | | | | | | | | 65,713,500 | |
| | | | | | | | | | | | | | | | |
| | | | |
| Life Sciences Tools & Services: 3.72% | | | | | | | | | | | | | | | | |
Thermo Fisher Scientific Incorporated | | | | | | | | | | | 100,000 | | | | 18,920,000 | |
Waters Corporation † | | | | | | | | | | | 90,000 | | | | 16,156,800 | |
| | | | |
| | | | | | | | | | | | | | | 35,076,800 | |
| | | | | | | | | | | | | | | | |
| | | | |
| Pharmaceuticals: 2.84% | | | | | | | | | | | | | | | | |
Allergan plc | | | | | | | | | | | 120,000 | | | | 24,594,000 | |
Eli Lilly & Company | | | | | | | | | | | 25,000 | | | | 2,138,500 | |
| | | | |
| | | | | | | | | | | | | | | 26,732,500 | |
| | | | | | | | | | | | | | | | |
The accompanying notes are an integral part of these financial statements.
| | | | |
| 12 | | Wells Fargo Diversified Capital Builder Fund | | Portfolio of investments—September 30, 2017 |
| | | | | | | | | | | | | | | | |
| Security name | | | | | | | | Shares | | | Value | |
| | | | |
Industrials: 12.61% | | | | | | | | | | | | | | | | |
| | | | |
| Aerospace & Defense: 6.66% | | | | | | | | | | | | | | | | |
Curtiss-Wright Corporation | | | | | | | | | | | 130,000 | | | $ | 13,590,200 | |
Huntington Ingalls Industries Incorporated | | | | | | | | | | | 65,000 | | | | 14,718,600 | |
Lockheed Martin Corporation | | | | | | | | | | | 29,000 | | | | 8,998,410 | |
Orbital ATK Incorporated | | | | | | | | | | | 30,000 | | | | 3,994,800 | |
Raytheon Company | | | | | | | | | | | 115,000 | | | | 21,456,700 | |
| | | | |
| | | | | | | | | | | | | | | 62,758,710 | |
| | | | | | | | | | | | | | | | |
| | | | |
| Building Products: 0.46% | | | | | | | | | | | | | | | | |
Apogee Enterprises Incorporated | | | | | | | | | | | 90,000 | | | | 4,343,400 | |
| | | | | | | | | | | | | | | | |
| | | | |
| Electrical Equipment: 1.13% | | | | | | | | | | | | | | | | |
AMETEK Incorporated | | | | | | | | | | | 80,000 | | | | 5,283,200 | |
Eaton Corporation plc | | | | | | | | | | | 70,000 | | | | 5,375,300 | |
| | | | |
| | | | | | | | | | | | | | | 10,658,500 | |
| | | | | | | | | | | | | | | | |
| | | | |
| Industrial Conglomerates: 1.12% | | | | | | | | | | | | | | | | |
Honeywell International Incorporated | | | | | | | | | | | 40,000 | | | | 5,669,600 | |
Roper Industries Incorporated | | | | | | | | | | | 20,000 | | | | 4,868,000 | |
| | | | |
| | | | | | | | | | | | | | | 10,537,600 | |
| | | | | | | | | | | | | | | | |
| | | | |
| Machinery: 3.24% | | | | | | | | | | | | | | | | |
Cummins Incorporated | | | | | | | | | | | 10,000 | | | | 1,680,300 | |
IDEX Corporation | | | | | | | | | | | 95,000 | | | | 11,539,650 | |
John Bean Technologies Corporation | | | | | | | | | | | 130,000 | | | | 13,143,000 | |
Oshkosh Corporation | | | | | | | | | | | 50,000 | | | | 4,127,000 | |
| | | | |
| | | | | | | | | | | | | | | 30,489,950 | |
| | | | | | | | | | | | | | | | |
| | | | |
Information Technology: 31.46% | | | | | | | | | | | | | | | | |
| | | | |
| Communications Equipment: 0.04% | | | | | | | | | | | | | | | | |
CommScope Holdings Incorporated † | | | | | | | | | | | 10,000 | | | | 332,100 | |
| | | | | | | | | | | | | | | | |
| | | | |
| Electronic Equipment, Instruments & Components: 5.90% | | | | | | | | | | | | | | | | |
Amphenol Corporation Class A | | | | | | | | | | | 360,000 | | | | 30,470,400 | |
Corning Incorporated | | | | | | | | | | | 670,000 | | | | 20,046,400 | |
FLIR Systems Incorporated | | | | | | | | | | | 130,000 | | | | 5,058,300 | |
| | | | |
| | | | | | | | | | | | | | | 55,575,100 | |
| | | | | | | | | | | | | | | | |
| | | | |
| Internet Software & Services: 3.10% | | | | | | | | | | | | | | | | |
Alphabet Incorporated Class A † | | | | | | | | | | | 30,000 | | | | 29,211,600 | |
| | | | | | | | | | | | | | | | |
| | | | |
| IT Services: 2.89% | | | | | | | | | | | | | | | | |
Leidos Holdings Incorporated | | | | | | | | | | | 460,000 | | | | 27,241,200 | |
| | | | | | | | | | | | | | | | |
| | | | |
| Semiconductors & Semiconductor Equipment: 10.87% | | | | | | | | | | | | | | | | |
Broadcom Limited | | | | | | | | | | | 140,000 | | | | 33,955,600 | |
Cypress Semiconductor Corporation « | | | | | | | | | | | 600,000 | | | | 9,012,000 | |
Microsemi Corporation † | | | | | | | | | | | 290,000 | | | | 14,929,200 | |
The accompanying notes are an integral part of these financial statements.
| | | | | | |
| Portfolio of investments—September 30, 2017 | | Wells Fargo Diversified Capital Builder Fund | | | 13 | |
| | | | | | | | | | | | | | | | |
| Security name | | | | | | | | Shares | | | Value | |
| | | | |
| Semiconductors & Semiconductor Equipment (continued) | | | | | | | | | | | | | | | | |
QUALCOMM Incorporated | | | | | | | | | | | 70,000 | | | $ | 3,628,800 | |
Texas Instruments Incorporated | | | | | | | | | | | 145,000 | | | | 12,997,800 | |
Versum Materials Incorporated | | | | | | | | | | | 170,000 | | | | 6,599,400 | |
Xilinx Incorporated | | | | | | | | | | | 300,000 | | | | 21,249,000 | |
| | | | |
| | | | | | | | | | | | | | | 102,371,800 | |
| | | | | | | | | | | | | | | | |
| | | | |
| Software: 7.74% | | | | | | | | | | | | | | | | |
Adobe Systems Incorporated † | | | | | | | | | | | 170,000 | | | | 25,360,600 | |
Microsoft Corporation | | | | | | | | | | | 540,000 | | | | 40,224,600 | |
Synopsys Incorporated † | | | | | | | | | | | 90,000 | | | | 7,247,700 | |
| | | | |
| | | | | | | | | | | | | | | 72,832,900 | |
| | | | | | | | | | | | | | | | |
| | | | |
| Technology Hardware, Storage & Peripherals: 0.92% | | | | | | | | | | | | | | | | |
Western Digital Corporation | | | | | | | | | | | 100,000 | | | | 8,640,000 | |
| | | | | | | | | | | | | | | | |
| | | | |
Materials: 6.16% | | | | | | | | | | | | | | | | |
| | | | |
| Chemicals: 4.84% | | | | | | | | | | | | | | | | |
Ashland Global Holdings Incorporated | | | | | | | | | | | 120,000 | | | | 7,846,800 | |
Celanese Corporation Series A | | | | | | | | | | | 45,000 | | | | 4,692,150 | |
DowDuPont Incorporated | | | | | | | | | | | 100,000 | | | | 6,923,000 | |
LyondellBasell Industries NV Class A | | | | | | | | | | | 255,000 | | | | 25,257,750 | |
Olin Corporation | | | | | | | | | | | 25,000 | | | | 856,250 | |
| | | | |
| | | | | | | | | | | | | | | 45,575,950 | |
| | | | | | | | | | | | | | | | |
| | | | |
| Containers & Packaging: 1.32% | | | | | | | | | | | | | | | | |
Sealed Air Corporation | | | | | | | | | | | 290,000 | | | | 12,388,800 | |
| | | | | | | | | | | | | | | | |
| | | | |
Real Estate: 1.85% | | | | | | | | | | | | | | | | |
| | | | |
| Equity REITs: 1.85% | | | | | | | | | | | | | | | | |
Crown Castle International Corporation | | | | | | | | | | | 20,000 | | | | 1,999,600 | |
Equinix Incorporated | | | | | | | | | | | 5,000 | | | | 2,231,500 | |
Sabra Health Care REIT Incorporated | | | | | | | | | | | 250,000 | | | | 5,485,000 | |
Saul Centers Incorporated | | | | | | | | | | | 125,000 | | | | 7,738,750 | |
| | | | |
| | | | | | | | | | | | | | | 17,454,850 | |
| | | | | | | | | | | | | | | | |
| | | | |
Utilities: 1.78% | | | | | | | | | | | | | | | | |
| | | | |
| Gas Utilities: 1.78% | | | | | | | | | | | | | | | | |
Atmos Energy Corporation | | | | | | | | | | | 200,000 | | | | 16,768,000 | |
| | | | | | | | | | | | | | | | |
| | | | |
Total Common Stocks (Cost $666,973,093) | | | | | | | | | | | | | | | 782,603,507 | |
| | | | | | | | | | | | | | | | |
| | | | |
| | | Interest rate | | | Maturity date | | | Principal | | | | |
Corporate Bonds and Notes: 13.30% | | | | | | | | | | | | | | | | |
| | | | |
Consumer Discretionary: 0.64% | | | | | | | | | | | | | | | | |
| | | | |
| Auto Components: 0.06% | | | | | | | | | | | | | | | | |
Dana Holding Corporation | | | 5.50 | % | | | 12-15-2024 | | | $ | 500,000 | | | | 525,000 | |
| | | | | | | | | | | | | | | | |
The accompanying notes are an integral part of these financial statements.
| | | | |
| 14 | | Wells Fargo Diversified Capital Builder Fund | | Portfolio of investments—September 30, 2017 |
| | | | | | | | | | | | | | | | |
| Security name | | Interest rate | | | Maturity date | | | Principal | | | Value | |
| | | | |
| Hotels, Restaurants & Leisure: 0.22% | | | | | | | | | | | | | | | | |
Speedway Motorsports Incorporated | | | 5.13 | % | | | 2-1-2023 | | | $ | 2,000,000 | | | $ | 2,065,000 | |
| | | | | | | | | | | | | | | | |
| | | | |
| Media: 0.31% | | | | | | | | | | | | | | | | |
McGraw-Hill Global Education Holdings LLC 144A« | | | 7.88 | | | | 5-15-2024 | | | | 3,000,000 | | | | 2,958,750 | |
| | | | | | | | | | | | | | | | |
| | | | |
| Specialty Retail: 0.05% | | | | | | | | | | | | | | | | |
Group 1 Automotive Incorporated | | | 5.00 | | | | 6-1-2022 | | | | 500,000 | | | | 518,125 | |
| | | | | | | | | | | | | | | | |
| | | | |
Consumer Staples: 0.11% | | | | | | | | | | | | | | | | |
| | | | |
| Food Products: 0.11% | | | | | | | | | | | | | | | | |
Lamb Weston Holdings Incorporated 144A | | | 4.63 | | | | 11-1-2024 | | | | 1,000,000 | | | | 1,042,500 | |
| | | | | | | | | | | | | | | | |
| | | | |
Energy: 0.72% | | | | | | | | | | | | | | | | |
| | | | |
| Oil, Gas & Consumable Fuels: 0.72% | | | | | | | | | | | | | | | | |
Plains All American Pipeline LP | | | 4.65 | | | | 10-15-2025 | | | | 6,000,000 | | | | 6,176,773 | |
Tennessee Gas Pipeline Company | | | 7.00 | | | | 3-15-2027 | | | | 534,000 | | | | 632,184 | |
| | | | |
| | | | | | | | | | | | | | | 6,808,957 | |
| | | | | | | | | | | | | | | | |
| | | | |
Health Care: 2.61% | | | | | | | | | | | | | | | | |
| | | | |
| Health Care Equipment & Supplies: 0.28% | | | | | | | | | | | | | | | | |
Teleflex Incorporated | | | 4.88 | | | | 6-1-2026 | | | | 2,500,000 | | | | 2,593,750 | |
| | | | | | | | | | | | | | | | |
| | | | |
| Health Care Providers & Services: 2.15% | | | | | | | | | | | | | | | | |
AMN Healthcare Incorporated 144A | | | 5.13 | | | | 10-1-2024 | | | | 10,512,000 | | | | 10,893,060 | |
DaVita HealthCare Partners Incorporated | | | 5.13 | | | | 7-15-2024 | | | | 1,000,000 | | | | 995,625 | |
HealthSouth Corporation | | | 5.13 | | | | 3-15-2023 | | | | 1,000,000 | | | | 1,033,450 | |
West Street Merger Sub Incorporated 144A | | | 6.38 | | | | 9-1-2025 | | | | 7,400,000 | | | | 7,363,000 | |
| | | | |
| | | | | | | | | | | | | | | 20,285,135 | |
| | | | | | | | | | | | | | | | |
| | | | |
| Health Care Technology: 0.18% | | | | | | | | | | | | | | | | |
Quintiles IMS Holdings Incorporated 144A | | | 4.88 | | | | 5-15-2023 | | | | 1,600,000 | | | | 1,664,000 | |
| | | | | | | | | | | | | | | | |
| | | | |
Industrials: 2.04% | | | | | | | | | | | | | | | | |
| | | | |
| Aerospace & Defense: 1.31% | | | | | | | | | | | | | | | | |
Huntington Ingalls Industries Incorporated 144A | | | 5.00 | | | | 11-15-2025 | | | | 5,200,000 | | | | 5,616,000 | |
Moog Incorporated 144A | | | 5.25 | | | | 12-1-2022 | | | | 1,500,000 | | | | 1,568,985 | |
TransDigm Group Incorporated | | | 6.38 | | | | 6-15-2026 | | | | 3,500,000 | | | | 3,585,330 | |
TransDigm Group Incorporated | | | 6.50 | | | | 5-15-2025 | | | | 1,500,000 | | | | 1,545,000 | |
| | | | |
| | | | | | | | | | | | | | | 12,315,315 | |
| | | | | | | | | | | | | | | | |
| | | | |
| Commercial Services & Supplies: 0.17% | | | | | | | | | | | | | | | | |
Acco Brands Corporation 144A | | | 5.25 | | | | 12-15-2024 | | | | 1,500,000 | | | | 1,556,250 | |
| | | | | | | | | | | | | | | | |
| | | | |
| Machinery: 0.34% | | | | | | | | | | | | | | | | |
Oshkosh Corporation | | | 5.38 | | | | 3-1-2025 | | | | 2,000,000 | | | | 2,120,000 | |
SPX FLOW Incorporated 144A | | | 5.88 | | | | 8-15-2026 | | | | 1,000,000 | | | | 1,055,000 | |
| | | | |
| | | | | | | | | | | | | | | 3,175,000 | |
| | | | | | | | | | | | | | | | |
The accompanying notes are an integral part of these financial statements.
| | | | | | |
| Portfolio of investments—September 30, 2017 | | Wells Fargo Diversified Capital Builder Fund | | | 15 | |
| | | | | | | | | | | | | | | | |
| Security name | | Interest rate | | | Maturity date | | | Principal | | | Value | |
| | | | |
| Trading Companies & Distributors: 0.22% | | | | | | | | | | | | | | | | |
Wesco Distribution Incorporated | | | 5.38 | % | | | 6-15-2024 | | | $ | 2,000,000 | | | $ | 2,110,000 | |
| | | | | | | | | | | | | | | | |
| | | | |
Information Technology: 3.64% | | | | | | | | | | | | | | | | |
| | | | |
| Communications Equipment: 0.67% | | | | | | | | | | | | | | | | |
CommScope Incorporated 144A | | | 5.50 | | | | 6-15-2024 | | | | 6,000,000 | | | | 6,277,500 | |
| | | | | | | | | | | | | | | | |
| | | | |
| Electronic Equipment, Instruments & Components: 1.57% | | | | | | | | | | | | | | | | |
Belden Incorporated 144A | | | 5.25 | | | | 7-15-2024 | | | | 3,000,000 | | | | 3,127,500 | |
TTM Technologies Incorporated 144A | | | 5.63 | | | | 10-1-2025 | | | | 11,505,000 | | | | 11,641,620 | |
| | | | |
| | | | | | | | | | | | | | | 14,769,120 | |
| | | | | | | | | | | | | | | | |
| | | | |
| Semiconductors & Semiconductor Equipment: 0.50% | | | | | | | | | | | | | | | | |
Micron Technology Incorporated 144A | | | 5.25 | | | | 8-1-2023 | | | | 1,500,000 | | | | 1,564,500 | |
Versum Materials Incorporated 144A | | | 5.50 | | | | 9-30-2024 | | | | 3,000,000 | | | | 3,180,000 | |
| | | | |
| | | | | | | | | | | | | | | 4,744,500 | |
| | | | | | | | | | | | | | | | |
| | | | |
| Software: 0.79% | | | | | | | | | | | | | | | | |
Nuance Communications Company | | | 6.00 | | | | 7-1-2024 | | | | 2,000,000 | | | | 2,165,600 | |
Symantec Corporation 144A | | | 5.00 | | | | 4-15-2025 | | | | 5,000,000 | | | | 5,228,150 | |
| | | | |
| | | | | | | | | | | | | | | 7,393,750 | |
| | | | | | | | | | | | | | | | |
| | | | |
| Technology Hardware, Storage & Peripherals: 0.11% | | | | | | | | | | | | | | | | |
Diebold Incorporated | | | 8.50 | | | | 4-15-2024 | | | | 1,000,000 | | | | 1,084,020 | |
| | | | | | | | | | | | | | | | |
| | | | |
Materials: 3.15% | | | | | | | | | | | | | | | | |
| | | | |
| Chemicals: 2.80% | | | | | | | | | | | | | | | | |
A. Schulman Incorporated | | | 6.88 | | | | 6-1-2023 | | | | 2,375,000 | | | | 2,464,063 | |
Koppers Incorporated 144A | | | 6.00 | | | | 2-15-2025 | | | | 8,190,000 | | | | 8,804,250 | |
Olin Corporation | | | 5.50 | | | | 8-15-2022 | | | | 6,000,000 | | | | 6,465,000 | |
Rayonier Advanced Materials Products Incorporated 144A | | | 5.50 | | | | 6-1-2024 | | | | 6,835,000 | | | | 6,621,406 | |
Valvoline Incorporated 144A | | | 4.38 | | | | 8-15-2025 | | | | 2,000,000 | | | | 2,035,200 | |
| | | | |
| | | | | | | | | | | | | | | 26,389,919 | |
| | | | | | | | | | | | | | | | |
| | | | |
| Containers & Packaging: 0.35% | | | | | | | | | | | | | | | | |
Berry Plastics Corporation | | | 5.13 | | | | 7-15-2023 | | | | 3,120,000 | | | | 3,260,400 | |
| | | | | | | | | | | | | | | | |
| | | | |
Real Estate: 0.39% | | | | | | | | | | | | | | | | |
| | | | |
| Equity REITs: 0.39% | | | | | | | | | | | | | | | | |
Equinix Incorporated | | | 5.75 | | | | 1-1-2025 | | | | 1,000,000 | | | | 1,076,250 | |
Iron Mountain Incorporated 144A | | | 5.38 | | | | 6-1-2026 | | | | 2,000,000 | | | | 2,095,000 | |
Iron Mountain Incorporated | | | 5.75 | | | | 8-15-2024 | | | | 500,000 | | | | 515,625 | |
| | | | |
| | | | | | | | | | | | | | | 3,686,875 | |
| | | | | | | | | | | | | | | | |
| | | | |
Total Corporate Bonds and Notes (Cost $121,459,495) | | | | | | | | | | | | | | | 125,223,866 | |
| | | | | | | | | | | | | | | | |
| | | | |
Yankee Corporate Bonds and Notes: 2.72% | | | | | | | | | | | | | | | | |
| | | | |
Financials: 0.55% | | | | | | | | | | | | | | | | |
| | | | |
| Diversified Financial Services: 0.55% | | | | | | | | | | | | | | | | |
Tronox Finance plc 144A | | | 5.75 | | | | 10-1-2025 | | | | 5,000,000 | | | | 5,125,000 | |
| | | | | | | | | | | | | | | | |
The accompanying notes are an integral part of these financial statements.
| | | | |
| 16 | | Wells Fargo Diversified Capital Builder Fund | | Portfolio of investments—September 30, 2017 |
| | | | | | | | | | | | | | | | |
| Security name | | Interest rate | | | Maturity date | | | Principal | | | Value | |
| | | | |
Health Care: 0.29% | | | | | | | | | | | | | | | | |
| | | | |
| Pharmaceuticals: 0.29% | | | | | | | | | | | | | | | | |
Mallinckrodt plc 144A« | | | 5.50 | % | | | 4-15-2025 | | | $ | 3,000,000 | | | $ | 2,700,000 | |
| | | | | | | | | | | | | | | | |
| | | | |
Industrials: 0.22% | | | | | | | | | | | | | | | | |
| | | | |
| Electrical Equipment: 0.22% | | | | | | | | | | | | | | | | |
Sensata Technologies BV 144A | | | 4.88 | | | | 10-15-2023 | | | | 2,000,000 | | | | 2,102,500 | |
| | | | | | | | | | | | | | | | |
| | | | |
Information Technology: 1.66% | | | | | | | | | | | | | | | | |
| | | | |
| Technology Hardware, Storage & Peripherals: 1.66% | | | | | | | | | | | | | | | | |
Seagate HDD | | | 4.75 | | | | 6-1-2023 | | | | 9,500,000 | | | | 9,628,630 | |
Seagate HDD | | | 4.88 | | | | 6-1-2027 | | | | 6,396,000 | | | | 6,028,466 | |
| | | | |
| | | | | | | | | | | | | | | 15,657,096 | |
| | | | | | | | | | | | | | | | |
| | | | |
Total Yankee Corporate Bonds and Notes (Cost $24,461,887) | | | | | | | | | | | | | | | 25,584,596 | |
| | | | | | | | | | | | | | | | |
| | | | |
| | | Yield | | | | | | Shares | | | | |
| Short-Term Investments: 1.53% | | | | | | | | | | | | | | | | |
| | | | |
| Investment Companies: 1.53% | | | | | | | | | | | | | | | | |
Securities Lending Cash Investment LLC (l)(r)(u) | | | 1.25 | | | | | | | | 8,312,789 | | | | 8,313,620 | |
Wells Fargo Government Money Market Fund Select Class (l)(u) | | | 0.92 | | | | | | | | 6,114,337 | | | | 6,114,337 | |
| | | | |
Total Short-Term Investments (Cost $14,427,957) | | | | | | | | | | | | | | | 14,427,957 | |
| | | | | | | | | | | | | | | | |
| | | | | | | | |
| Total investments in securities (Cost $827,322,432) | | | 100.66 | % | | | 947,839,926 | |
Other assets and liabilities, net | | | (0.66 | ) | | | (6,242,206 | ) |
| | | | | | | | |
| Total net assets | | | 100.00 | % | | $ | 941,597,720 | |
| | | | | | | | |
| † | Non-income-earning security |
| « | All or a portion of this security is on loan. |
| 144A | The security may be resold in transactions exempt from registration, normally to qualified institutional buyers, pursuant to Rule 144A under the Securities Act of 1933. |
| (l) | The issuer of the security is an affiliated person of the Fund as defined in the Investment Company Act of 1940. |
| (r) | The investment is a non-registered investment company purchased with cash collateral received from securities on loan. |
| (u) | The rate represents the 7-day annualized yield at period end. |
Investments in Affiliates
An affiliated investment is an investment in which the Fund owns at least 5% of the outstanding voting shares of the issuer or as a result of other relationships, such as the Fund and the issuer having the same investment manager. Transactions with issuers that were either affiliated persons of the Fund at the beginning of the period or the end of the period were as follows:
| | | | | | | | | | | | | | | | | | | | | | | | | | | | | | | | | | | | |
| | | Shares,
beginning of
period | | | Shares
purchased | | | Shares
sold | | | Shares,
end of
period | | | Net
realized
gains
(losses) | | | Net change
in
unrealized
gains
(losses) | | | Income
from
affiliated
securities | | | Value,
end
of period | | | % of net assets | |
Short-Term Investments | | | | | | | | | | | | | | | | | | | | | | | | | | | | | | | | | | | | |
| | | | | | | | | |
Investment companies | | | | | | | | | | | | | | | | | | | | | | | | | | | | | | | | | | | | |
Securities Lending Cash Investment LLC | | | 9,035,155 | | | | 128,916,157 | | | | 129,638,523 | | | | 8,312,789 | | | $ | 651 | | | $ | 0 | | | $ | 33,559 | | | $ | 8,313,620 | | | | | |
Wells Fargo Government Money Market Fund Select Class | | | 3,773,354 | | | | 310,875,081 | | | | 308,534,098 | | | | 6,114,337 | | | | 0 | | | | 0 | | | | 60,110 | | | | 6,114,337 | | | | | |
| | | | | | | | | | | | | | | | | | | | | | | | | | | | | | | | | | | | |
| | | | | | | | | | | | | | | | | | $ | 651 | | | $ | 0 | | | $ | 93,669 | | | $ | 14,427,957 | | | | 1.53 | % |
| | | | | | | | | | | | | | | | | | | | | | | | | | | | | | | | | | | | |
The accompanying notes are an integral part of these financial statements.
| | | | | | |
| Statement of assets and liabilities—September 30, 2017 | | Wells Fargo Diversified Capital Builder Fund | | | 17 | |
| | | | |
| | | | |
| |
Assets | | | | |
Investments in unaffiliated securities, (including $8,191,683 of securities on loan) at value (cost $812,894,475) | | $ | 933,411,969 | |
Investments in affiliated securities, at value (cost $14,427,957) | | | 14,427,957 | |
Receivable for Fund shares sold | | | 998,316 | |
Receivable for dividends and interest | | | 2,454,652 | |
Receivable for securities lending income | | | 1,825 | |
Prepaid expenses and other assets | | | 184,018 | |
| | | | |
Total assets | | | 951,478,737 | |
| | | | |
| |
Liabilities | | | | |
Payable upon receipt of securities loaned | | | 8,312,132 | |
Payable for Fund shares redeemed | | | 620,032 | |
Management fee payable | | | 495,373 | |
Administration fees payable | | | 147,828 | |
Distribution fees payable | | | 73,734 | |
Accrued expenses and other liabilities | | | 231,918 | |
| | | | |
Total liabilities | | | 9,881,017 | |
| | | | |
Total net assets | | $ | 941,597,720 | |
| | | | |
| |
NET ASSETS CONSIST OF | | | | |
Paid-in capital | | $ | 775,456,065 | |
Overdistributed net investment income | | | (26,224 | ) |
Accumulated net realized gains on investments | | | 45,650,385 | |
Net unrealized gains on investments | | | 120,517,494 | |
| | | | |
Total net assets | | $ | 941,597,720 | |
| | | | |
| |
COMPUTATION OF NET ASSET VALUE AND OFFERING PRICE PER SHARE | | | | |
Net assets – Class A | | $ | 551,272,488 | |
Shares outstanding – Class A1 | | | 53,501,424 | |
Net asset value per share – Class A | | | $10.30 | |
Maximum offering price per share – Class A2 | | | $10.93 | |
Net assets – Class C | | $ | 117,346,204 | |
Shares outstanding – Class C1 | | | 11,413,694 | |
Net asset value per share – Class C | | | $10.28 | |
Net assets – Administrator Class | | $ | 10,224,786 | |
Shares outstanding – Administrator Class1 | | | 991,106 | |
Net asset value per share – Administrator Class | | | $10.32 | |
Net assets – Institutional Class | | $ | 262,754,242 | |
Shares outstanding – Institutional Class1 | | | 25,642,399 | |
Net asset value per share – Institutional Class | | | $10.25 | |
| 1 | The Fund has an unlimited number of authorized shares. |
| 2 | Maximum offering price is computed as 100/94.25 of net asset value. On investments of $50,000 or more, the offering price is reduced. |
The accompanying notes are an integral part of these financial statements.
| | | | |
| 18 | | Wells Fargo Diversified Capital Builder Fund | | Statement of operations—year ended September 30, 2017 |
| | | | |
| | | | |
| |
Investment income | | | | |
Dividends | | $ | 11,686,948 | |
Interest | | | 9,030,608 | |
Income from affiliated securities | | | 93,669 | |
| | | | |
Total investment income | | | 20,811,225 | |
| | | | |
| |
Expenses | | | | |
Management fee | | | 5,177,214 | |
Administration fees | | | | |
Class A | | | 1,089,132 | |
Class B | | | 1,234 | 1 |
Class C | | | 196,491 | |
Administrator Class | | | 22,832 | |
Institutional Class | | | 248,254 | |
Shareholder servicing fees | | | | |
Class A | | | 1,296,585 | |
Class B | | | 1,469 | 1 |
Class C | | | 233,918 | |
Administrator Class | | | 43,619 | |
Distribution fees | | | | |
Class B | | | 4,406 | 1 |
Class C | | | 701,755 | |
Custody and accounting fees | | | 40,126 | |
Professional fees | | | 45,984 | |
Registration fees | | | 64,461 | |
Shareholder report expenses | | | 50,534 | |
Trustees’ fees and expenses | | | 20,118 | |
Other fees and expenses | | | 5,198 | |
| | | | |
Total expenses | | | 9,243,330 | |
Less: Fee waivers and/or expense reimbursements | | | (14,870 | ) |
| | | | |
Net expenses | | | 9,228,460 | |
| | | | |
Net investment income | | | 11,582,765 | |
| | | | |
| |
REALIZED AND UNREALIZED GAINS (LOSSES) ON INVESTMENTS | | | | |
| |
Net realized gains on: | | | | |
Unaffiliated securities | | | 45,194,556 | |
Affiliated securities | | | 651 | |
| | | | |
Net realized gains on investments | | | 45,195,207 | |
Net change in unrealized gains (losses) on investments | | | 48,014,577 | |
| | | | |
Net realized and unrealized gains (losses) on investments | | | 93,209,784 | |
| | | | |
Net increase in net assets resulting from operations | | $ | 104,792,549 | |
| | | | |
| 1 | For the period from October 1, 2016 to May 5, 2017. Effective at the close of business on May 5, 2017, Class B shares were converted to Class A shares and are no longer offered by the Fund. |
The accompanying notes are an integral part of these financial statements.
| | | | | | |
| Statement of changes in net assets | | Wells Fargo Diversified Capital Builder Fund | | | 19 | |
| | | | | | | | | | | | | | | | |
| | | Year ended
September 30, 2017 | | | Year ended
September 30, 2016 | |
| | | | |
Operations | | | | | | | | | | | | | | | | |
Net investment income | | | | | | $ | 11,582,765 | | | | | | | $ | 10,579,137 | |
Net realized gains on investments | | | | | | | 45,195,207 | | | | | | | | 56,562,113 | |
Net change in unrealized gains (losses) on investments | | | | | | | 48,014,577 | | | | | | | | 57,125,458 | |
| | | | |
Net increase in net assets resulting from operations | | | | | | | 104,792,549 | | | | | | | | 124,266,708 | |
| | | | |
| | | | |
Distributions to shareholders from | | | | | | | | | | | | | | | | |
Net investment income | | | | | | | | | | | | | | | | |
Class A | | | | | | | (7,661,442 | ) | | | | | | | (7,154,781 | ) |
Class B | | | | | | | (3,723 | )1 | | | | | | | (13,202 | ) |
Class C | | | | | | | (923,064 | ) | | | | | | | (576,356 | ) |
Administrator Class | | | | | | | (276,788 | ) | | | | | | | (281,790 | ) |
Institutional Class | | | | | | | (3,377,945 | ) | | | | | | | (2,192,889 | ) |
Net realized gains | | | | | | | | | | | | | | | | |
Class A | | | | | | | (37,599,086 | ) | | | | | | | (38,200,806 | ) |
Class B | | | | | | | (82,941 | )1 | | | | | | | (258,301 | ) |
Class C | | | | | | | (5,700,242 | ) | | | | | | | (5,148,475 | ) |
Administrator Class | | | | | | | (1,444,857 | ) | | | | | | | (504,792 | ) |
Institutional Class | | | | | | | (11,035,158 | ) | | | | | | | (9,439,938 | ) |
| | | | |
Total distributions to shareholders | | | | | | | (68,105,246 | ) | | | | | | | (63,771,330 | ) |
| | | | |
| | | | |
Capital share transactions | | | Shares | | | | | | | | Shares | | | | | |
Proceeds from shares sold | | | | | | | | | | | | | | | | |
Class A | | | 10,742,727 | | | | 105,549,123 | | | | 3,675,778 | | | | 34,640,601 | |
Class B | | | 8,989 | 1 | | | 89,544 | 1 | | | 6,490 | | | | 57,479 | |
Class C | | | 6,100,806 | | | | 60,045,789 | | | | 1,407,777 | | | | 13,010,103 | |
Administrator Class | | | 1,150,741 | | | | 11,315,314 | | | | 1,842,765 | | | | 16,600,389 | |
Institutional Class | | | 15,573,690 | | | | 152,910,373 | | | | 2,616,107 | | | | 24,432,480 | |
| | | | |
| | | | | | | 329,910,143 | | | | | | | | 88,741,052 | |
| | | | |
Reinvestment of distributions | | | | | | | | | | | | | | | | |
Class A | | | 4,536,323 | | | | 43,125,024 | | | | 5,090,728 | | | | 43,117,960 | |
Class B | | | 7,409 | 1 | | | 70,848 | 1 | | | 25,632 | | | | 216,784 | |
Class C | | | 629,617 | | | | 5,974,204 | | | | 606,197 | | | | 5,111,831 | |
Administrator Class | | | 179,684 | | | | 1,707,679 | | | | 89,236 | | | | 775,222 | |
Institutional Class | | | 1,417,203 | | | | 13,422,904 | | | | 1,260,658 | | | | 10,654,067 | |
| | | | |
| | | | | | | 64,300,659 | | | | | | | | 59,875,864 | |
| | | | |
Payment for shares redeemed | | | | | | | | | | | | | | | | |
Class A | | | (8,712,586 | ) | | | (86,111,676 | ) | | | (5,956,354 | ) | | | (54,335,024 | ) |
Class B | | | (166,895 | )1 | | | (1,667,192 | )1 | | | (212,484 | ) | | | (1,934,449 | ) |
Class C | | | (2,103,704 | ) | | | (20,778,345 | ) | | | (1,077,109 | ) | | | (9,826,218 | ) |
Administrator Class | | | (2,486,279 | ) | | | (24,695,561 | ) | | | (650,695 | ) | | | (5,982,660 | ) |
Institutional Class | | | (3,745,131 | ) | | | (36,861,266 | ) | | | (2,203,621 | ) | | | (20,087,169 | ) |
| | | | |
| | | | | | | (170,114,040 | ) | | | | | | | (92,165,520 | ) |
| | | | |
Net increase in net assets resulting from capital share transactions | | | | | | | 224,096,762 | | | | | | | | 56,451,396 | |
| | | | |
Total increase in net assets | | | | | | | 260,784,065 | | | | | | | | 116,946,774 | |
| | | | |
| | | | |
Net assets | | | | | | | | | | | | | | | | |
Beginning of period | | | | | | �� | 680,813,655 | | | | | | | | 563,866,881 | |
| | | | |
End of period | | | | | | $ | 941,597,720 | | | | | | | $ | 680,813,655 | |
| | | | |
Undistributed (overdistributed) net investment income | | | | | | $ | (26,224 | ) | | | | | | $ | 422,976 | |
| | | | |
| 1 | For the period from October 1, 2016 to May 5, 2017. Effective at the close of business on May 5, 2017, Class B shares were converted to Class A shares and are no longer offered by the Fund. |
The accompanying notes are an integral part of these financial statements.
| | | | |
| 20 | | Wells Fargo Diversified Capital Builder Fund | | Financial highlights |
(For a share outstanding throughout each period)
| | | | | | | | | | | | | | | | | | | | |
| | | Year ended September 30 | |
| CLASS A | | 2017 | | | 2016 | | | 2015 | | | 2014 | | | 2013 | |
Net asset value, beginning of period | | | $9.96 | | | | $9.12 | | | | $9.31 | | | | $7.89 | | | | $6.93 | |
Net investment income | | | 0.14 | 1 | | | 0.17 | | | | 0.11 | | | | 0.09 | | | | 0.12 | |
Net realized and unrealized gains (losses) on investments | | | 1.12 | | | | 1.71 | | | | (0.20 | ) | | | 1.41 | | | | 0.96 | |
| | | | | | | | | | | | | | | | | | | | |
Total from investment operations | | | 1.26 | | | | 1.88 | | | | (0.09 | ) | | | 1.50 | | | | 1.08 | |
Distributions to shareholders from | | | | | | | | | | | | | | | | | | | | |
Net investment income | | | (0.14 | ) | | | (0.15 | ) | | | (0.10 | ) | | | (0.08 | ) | | | (0.12 | ) |
Net realized gains | | | (0.78 | ) | | | (0.89 | ) | | | 0.00 | | | | 0.00 | | | | 0.00 | |
| | | | | | | | | | | | | | | | | | | | |
Total distributions to shareholders | | | (0.92 | ) | | | (1.04 | ) | | | (0.10 | ) | | | (0.08 | ) | | | (0.12 | ) |
Net asset value, end of period | | | $10.30 | | | | $9.96 | | | | $9.12 | | | | $9.31 | | | | $7.89 | |
Total return2 | | | 13.62 | % | | | 22.85 | % | | | (1.05 | )% | | | 19.10 | % | | | 15.75 | % |
Ratios to average net assets (annualized) | | | | | | | | | | | | | | | | | | | | |
Gross expenses | | | 1.12 | % | | | 1.14 | % | | | 1.19 | % | | | 1.21 | % | | | 1.20 | % |
Net expenses | | | 1.12 | % | | | 1.14 | % | | | 1.19 | % | | | 1.20 | % | | | 1.20 | % |
Net investment income | | | 1.43 | % | | | 1.77 | % | | | 1.17 | % | | | 1.09 | % | | | 1.66 | % |
Supplemental data | | | | | | | | | | | | | | | | | | | | |
Portfolio turnover rate | | | 54 | % | | | 73 | % | | | 69 | % | | | 82 | % | | | 70 | % |
Net assets, end of period (000s omitted) | | | $551,272 | | | | $467,503 | | | | $402,303 | | | | $431,388 | | | | $399,535 | |
| 1 | Calculated based upon average shares outstanding. |
| 2 | Total return calculations do not include any sales charges. |
The accompanying notes are an integral part of these financial statements.
| | | | | | |
| Financial highlights | | Wells Fargo Diversified Capital Builder Fund | | | 21 | |
(For a share outstanding throughout each period)
| | | | | | | | | | | | | | | | | | | | |
| | | Year ended September 30 | |
| CLASS C | | 2017 | | | 2016 | | | 2015 | | | 2014 | | | 2013 | |
Net asset value, beginning of period | | | $9.96 | | | | $9.12 | | | | $9.32 | | | | $7.90 | | | | $6.94 | |
Net investment income | | | 0.08 | | | | 0.10 | | | | 0.05 | | | | 0.03 | | | | 0.07 | |
Net realized and unrealized gains (losses) on investments | | | 1.11 | | | | 1.72 | | | | (0.22 | ) | | | 1.41 | | | | 0.96 | |
| | | | | | | | | | | | | | | | | | | | |
Total from investment operations | | | 1.19 | | | | 1.82 | | | | (0.17 | ) | | | 1.44 | | | | 1.03 | |
Distributions to shareholders from | | | | | | | | | | | | | | | | | | | | |
Net investment income | | | (0.09 | ) | | | (0.09 | ) | | | (0.03 | ) | | | (0.02 | ) | | | (0.07 | ) |
Net realized gains | | | (0.78 | ) | | | (0.89 | ) | | | 0.00 | | | | 0.00 | | | | 0.00 | |
| | | | | | | | | | | | | | | | | | | | |
Total distributions to shareholders | | | (0.87 | ) | | | (0.98 | ) | | | (0.03 | ) | | | (0.02 | ) | | | (0.07 | ) |
Net asset value, end of period | | | $10.28 | | | | $9.96 | | | | $9.12 | | | | $9.32 | | | | $7.90 | |
Total return1 | | | 12.85 | % | | | 21.96 | % | | | (1.88 | )% | | | 18.21 | % | | | 14.86 | % |
Ratios to average net assets (annualized) | | | | | | | | | | | | | | | | | | | | |
Gross expenses | | | 1.87 | % | | | 1.89 | % | | | 1.94 | % | | | 1.96 | % | | | 1.95 | % |
Net expenses | | | 1.87 | % | | | 1.89 | % | | | 1.94 | % | | | 1.95 | % | | | 1.95 | % |
Net investment income | | | 0.65 | % | | | 1.03 | % | | | 0.41 | % | | | 0.34 | % | | | 0.91 | % |
Supplemental data | | | | | | | | | | | | | | | | | | | | |
Portfolio turnover rate | | | 54 | % | | | 73 | % | | | 69 | % | | | 82 | % | | | 70 | % |
Net assets, end of period (000s omitted) | | | $117,346 | | | | $67,630 | | | | $53,373 | | | | $45,670 | | | | $39,758 | |
| 1 | Total return calculations do not include any sales charges. |
The accompanying notes are an integral part of these financial statements.
| | | | |
| 22 | | Wells Fargo Diversified Capital Builder Fund | | Financial highlights |
(For a share outstanding throughout each period)
| | | | | | | | | | | | | | | | | | | | |
| | | Year ended September 30 | |
| ADMINISTRATOR CLASS | | 2017 | | | 2016 | | | 2015 | | | 2014 | | | 2013 | |
Net asset value, beginning of period | | | $9.97 | | | | $9.12 | | | | $9.32 | | | | $7.90 | | | | $6.94 | |
Net investment income | | | 0.16 | 1 | | | 0.18 | 1 | | | 0.14 | 1 | | | 0.12 | 1 | | | 0.14 | 1 |
Net realized and unrealized gains (losses) on investments | | | 1.12 | | | | 1.73 | | | | (0.22 | ) | | | 1.41 | | | | 0.96 | |
| | | | | | | | | | | | | | | | | | | | |
Total from investment operations | | | 1.28 | | | | 1.91 | | | | (0.08 | ) | | | 1.53 | | | | 1.10 | |
Distributions to shareholders from | | | | | | | | | | | | | | | | | | | | |
Net investment income | | | (0.15 | ) | | | (0.17 | ) | | | (0.12 | ) | | | (0.11 | ) | | | (0.14 | ) |
Net realized gains | | | (0.78 | ) | | | (0.89 | ) | | | 0.00 | | | | 0.00 | | | | 0.00 | |
| | | | | | | | | | | | | | | | | | | | |
Total distributions to shareholders | | | (0.93 | ) | | | (1.06 | ) | | | (0.12 | ) | | | (0.11 | ) | | | (0.14 | ) |
Net asset value, end of period | | | $10.32 | | | | $9.97 | | | | $9.12 | | | | $9.32 | | | | $7.90 | |
Total return | | | 13.75 | % | | | 23.14 | % | | | (0.92 | )% | | | 19.39 | % | | | 16.06 | % |
Ratios to average net assets (annualized) | | | | | | | | | | | | | | | | | | | | |
Gross expenses | | | 1.04 | % | | | 1.06 | % | | | 1.05 | % | | | 1.04 | % | | | 1.04 | % |
Net expenses | | | 1.04 | % | | | 1.03 | % | | | 0.95 | % | | | 0.95 | % | | | 0.95 | % |
Net investment income | | | 1.58 | % | | | 1.89 | % | | | 1.41 | % | | | 1.33 | % | | | 1.84 | % |
Supplemental data | | | | | | | | | | | | | | | | | | | | |
Portfolio turnover rate | | | 54 | % | | | 73 | % | | | 69 | % | | | 82 | % | | | 70 | % |
Net assets, end of period (000s omitted) | | | $10,225 | | | | $21,398 | | | | $7,898 | | | | $9,411 | | | | $6,836 | |
| 1 | Calculated based upon average shares outstanding. |
The accompanying notes are an integral part of these financial statements.
| | | | | | |
| Financial highlights | | Wells Fargo Diversified Capital Builder Fund | | | 23 | |
(For a share outstanding throughout each period)
| | | | | | | | | | | | | | | | | | | | |
| | | Year ended September 30 | |
| INSTITUTIONAL CLASS | | 2017 | | | 2016 | | | 2015 | | | 2014 | | | 2013 | |
Net asset value, beginning of period | | | $9.90 | | | | $9.07 | | | | $9.27 | | | | $7.85 | | | | $6.90 | |
Net investment income | | | 0.19 | | | | 0.20 | | | | 0.15 | | | | 0.13 | 1 | | | 0.15 | |
Net realized and unrealized gains (losses) on investments | | | 1.11 | | | | 1.71 | | | | (0.21 | ) | | | 1.41 | | | | 0.95 | |
| | | | | | | | | | | | | | | | | | | | |
Total from investment operations | | | 1.30 | | | | 1.91 | | | | (0.06 | ) | | | 1.54 | | | | 1.10 | |
Distributions to shareholders from | | | | | | | | | | | | | | | | | | | | |
Net investment income | | | (0.17 | ) | | | (0.19 | ) | | | (0.14 | ) | | | (0.12 | ) | | | (0.15 | ) |
Net realized gains | | | (0.78 | ) | | | (0.89 | ) | | | 0.00 | | | | 0.00 | | | | 0.00 | |
| | | | | | | | | | | | | | | | | | | | |
Total distributions to shareholders | | | (0.95 | ) | | | (1.08 | ) | | | (0.14 | ) | | | (0.12 | ) | | | (0.15 | ) |
Net asset value, end of period | | | $10.25 | | | | $9.90 | | | | $9.07 | | | | $9.27 | | | | $7.85 | |
Total return | | | 14.11 | % | | | 23.28 | % | | | (0.75 | )% | | | 19.68 | % | | | 16.17 | % |
Ratios to average net assets (annualized) | | | | | | | | | | | | | | | | | | | | |
Gross expenses | | | 0.79 | % | | | 0.81 | % | | | 0.79 | % | | | 0.78 | % | | | 0.77 | % |
Net expenses | | | 0.78 | % | | | 0.78 | % | | | 0.77 | % | | | 0.78 | % | | | 0.77 | % |
Net investment income | | | 1.71 | % | | | 2.14 | % | | | 1.58 | % | | | 1.52 | % | | | 2.08 | % |
Supplemental data | | | | | | | | | | | | | | | | | | | | |
Portfolio turnover rate | | | 54 | % | | | 73 | % | | | 69 | % | | | 82 | % | | | 70 | % |
Net assets, end of period (000s omitted) | | | $262,754 | | | | $122,769 | | | | $97,251 | | | | $100,160 | | | | $149,790 | |
| 1 | Calculated based upon average shares outstanding. |
The accompanying notes are an integral part of these financial statements.
| | | | |
| 24 | | Wells Fargo Diversified Capital Builder Fund | | Notes to financial statements |
1. ORGANIZATION
Wells Fargo Funds Trust (the “Trust”), a Delaware statutory trust organized on March 10, 1999, is an open-end management investment company registered under the Investment Company Act of 1940, as amended (the “1940 Act”). As an investment company, the Trust follows the accounting and reporting guidance in Financial Accounting Standards Board Accounting Standards Codification Topic 946, Financial Services – Investment Companies. These financial statements report on the Wells Fargo Diversified Capital Builder Fund (the “Fund”) which is a diversified series of the Trust.
Effective at the close of business on May 5, 2017, Class B shares were converted to Class A shares and are no longer offered by the Fund. Information for Class B shares reflected in the financial statements represents activity through May 5, 2017.
2. SIGNIFICANT ACCOUNTING POLICIES
The following significant accounting policies, which are consistently followed in the preparation of the financial statements of the Fund, are in conformity with U.S. generally accepted accounting principles which require management to make estimates and assumptions that affect the reported amounts of assets and liabilities, disclosure of contingent assets and liabilities at the date of the financial statements, and the reported amounts of revenues and expenses during the reporting period. Actual results could differ from those estimates.
Securities valuation
All investments are valued each business day as of the close of regular trading on the New York Stock Exchange (generally 4 p.m. Eastern Time), although the Fund may deviate from this calculation time under unusual or unexpected circumstances.
Equity securities that are listed on a foreign or domestic exchange or market are valued at the official closing price or, if none, the last sales price. If no sale occurs on the principal exchange or market that day, a fair value price will be determined in accordance with the Fund’s Valuation Procedures.
Debt securities are valued at the evaluated bid price provided by an independent pricing service or, if a reliable price is not available, the quoted bid price from an independent broker-dealer.
Investments in registered open-end investment companies are valued at net asset value. Interests in non-registered investment companies that are redeemable at net asset value are fair valued normally at net asset value.
Investments which are not valued using any of the methods discussed above are valued at their fair value, as determined in good faith by the Board of Trustees of the Fund. The Board of Trustees has established a Valuation Committee comprised of the Trustees and has delegated to it the authority to take any actions regarding the valuation of portfolio securities that the Valuation Committee deems necessary or appropriate, including determining the fair value of portfolio securities, unless the determination has been delegated to the Management Valuation Team of Wells Fargo Funds Management, LLC (“Funds Management”). The Board of Trustees retains the authority to make or ratify any valuation decisions or approve any changes to the Valuation Procedures as it deems appropriate. On a quarterly basis, the Board of Trustees receives reports on any valuation actions taken by the Valuation Committee or the Management Valuation Team which may include items for ratification.
Valuations of fair valued securities are compared to the next actual sales price when available, or other appropriate market values, to assess the continued appropriateness of the fair valuation methodologies used. These securities are fair valued on a day-to-day basis, taking into consideration changes to appropriate market information and any significant changes to the inputs considered in the valuation process until there is a readily available price provided on an exchange or by an independent pricing service. Valuations received from an independent pricing service or independent broker-dealer quotes are periodically validated by comparisons to most recent trades and valuations provided by other independent pricing services in addition to the review of prices by the manager and/or subadviser. Unobservable inputs used in determining fair valuations are identified based on the type of security, taking into consideration factors utilized by market participants in valuing the investment, knowledge about the issuer and the current market environment.
Security loans
The Fund may lend its securities from time to time in order to earn additional income in the form of fees or interest on securities received as collateral or the investment of any cash received as collateral. The Fund continues to receive interest or dividends on the securities loaned. The Fund receives collateral in the form of cash or securities with a value at least equal to the value of the securities on loan. The value of the loaned securities is determined at the close of each business day and any additional required collateral is delivered to the Fund on the next business day. In a securities lending transaction, the net asset value of the Fund will be affected by an increase or decrease in the value of the securities loaned and by an increase or decrease in the value of the instrument in which collateral is invested. The amount of securities lending activity undertaken by the Fund fluctuates from time to time. In the event of default or bankruptcy
| | | | | | |
| Notes to financial statements | | Wells Fargo Diversified Capital Builder Fund | | | 25 | |
by the borrower, the Fund may be prevented from recovering the loaned securities or gaining access to the collateral or may experience delays or costs in doing so. In addition, the investment of any cash collateral received may lose all or part of its value. The Fund has the right under the lending agreement to recover the securities from the borrower on demand.
The Fund lends its securities through an unaffiliated securities lending agent. Cash collateral received in connection with its securities lending transactions is invested in Securities Lending Cash Investments, LLC (the “Securities Lending Fund”). The Securities Lending Fund is exempt from registration under Section 3(c)(7) of the 1940 Act and is managed by Funds Management and is subadvised by Wells Capital Management Incorporated (“WellsCap”), an affiliate of Funds Management and an indirect wholly owned subsidiary of Wells Fargo & Company (“Wells Fargo”). Funds Management receives an advisory fee starting at 0.05% and declining to 0.01% as the average daily net assets of the Securities Lending Fund increase. All of the fees received by Funds Management are paid to WellsCap for its services as subadviser. The Securities Lending Fund seeks to provide a positive return compared to the daily Fed Funds Open Rate by investing in high-quality, U.S. dollar-denominated short-term money market instruments. Securities Lending Fund investments are valued at the evaluated bid price provided by an independent pricing service. Income earned from investment in the Securities Lending Fund is included in income from affiliates securities on the Statement of Operations.
Security transactions and income recognition
Securities transactions are recorded on a trade date basis. Realized gains or losses are recorded on the basis of identified cost.
Dividend income is recognized on the ex-dividend date.
Interest income is accrued daily and bond discounts are accreted and premiums are amortized daily based on the effective interest method. To the extent debt obligations are placed on non-accrual status, any related interest income may be reduced by writing off interest receivables when the collection of all or a portion of interest has been determined to be doubtful based on consistently applied procedures and the fair value has decreased. If the issuer subsequently resumes interest payments or when the collectability of interest is reasonably assured, the debt obligation is removed from non-accrual status.
Distributions to shareholders
Distributions to shareholders from net investment income and net realized gains, if any, are recorded on the ex-dividend date. Such distributions are determined in accordance with income tax regulations and may differ from U.S. generally accepted accounting principles. Dividend sources are estimated at the time of declaration. The tax character of distributions is determined as of the Fund’s fiscal year end. Therefore, a portion of the Fund’s distributions made prior to the Fund’s fiscal year end may be categorized as a tax return of capital.
Federal and other taxes
The Fund intends to continue to qualify as a regulated investment company by distributing substantially all of its investment company taxable income and any net realized capital gains (after reduction for capital loss carryforwards) sufficient to relieve it from all, or substantially all, federal income taxes. Accordingly, no provision for federal income taxes was required.
The Fund’s income and federal excise tax returns and all financial records supporting those returns for the prior three fiscal years are subject to examination by the federal and Delaware revenue authorities. Management has analyzed the Fund’s tax positions taken on federal, state, and foreign tax returns for all open tax years and does not believe that there are any uncertain tax positions that require recognition of a tax liability.
As of September 30, 2017, the aggregate cost of all investments for federal income tax purposes was $826,765,179 and the unrealized gains (losses) consisted of:
| | | | |
Gross unrealized gains | | $ | 136,370,748 | |
Gross unrealized losses | | | (15,296,001 | ) |
Net unrealized gains | | $ | 121,074,747 | |
Reclassifications are made to the Fund’s capital accounts for permanent tax differences to reflect income and gains available for distribution (or available capital loss carryforwards) under federal income tax regulations. U.S. generally accepted accounting principles require that certain components of net assets be adjusted to reflect permanent differences between financial and tax reporting. These reclassifications have no effect on net assets or net asset values per share. The primary permanent difference
| | | | |
| 26 | | Wells Fargo Diversified Capital Builder Fund | | Notes to financial statements |
causing such reclassifications is due to recognition of partnership income. At September 30, 2017, as a result of permanent book-to-tax differences, the following reclassification adjustments were made on the Statement of Assets and Liabilities:
| | | | |
| Paid-in capital | | Overdistributed net
investment income | | Accumulated net
realized gains
on investments |
| $(5,808) | | $210,997 | | $(205,189) |
Class allocations
The separate classes of shares offered by the Fund differ principally in applicable sales charges, distribution, shareholder servicing, and administration fees. Class specific expenses are charged directly to that share class. Investment income, common expenses, and realized and unrealized gains (losses) on investments are allocated daily to each class of shares based on the relative proportion of net assets of each class.
3. FAIR VALUATION MEASUREMENTS
Fair value measurements of investments are determined within a framework that has established a fair value hierarchy based upon the various data inputs utilized in determining the value of the Fund’s investments. The three-level hierarchy gives the highest priority to unadjusted quoted prices in active markets for identical assets or liabilities (Level 1) and the lowest priority to unobservable inputs (Level 3). The Fund’s investments are classified within the fair value hierarchy based on the lowest level of input that is significant to the fair value measurement. The inputs are summarized into three broad levels as follows:
| ∎ | | Level 1 – quoted prices in active markets for identical securities |
| ∎ | | Level 2 – other significant observable inputs (including quoted prices for similar securities, interest rates, prepayment speeds, credit risk, etc.) |
| ∎ | | Level 3 – significant unobservable inputs (including the Fund’s own assumptions in determining the fair value of investments) |
The inputs or methodologies used for valuing investments in securities are not necessarily an indication of the risk associated with investing in those securities.
The following is a summary of the inputs used in valuing the Fund’s assets and liabilities as of September 30, 2017:
| | | | | | | | | | | | | | | | |
| | | Quoted prices
(Level 1) | | | Other significant
observable inputs (Level 2) | | | Significant
unobservable inputs (Level 3) | | | Total | |
Assets | | | | | | | | | | | | | | | | |
Investments in: | | | | | | | | | | | | | | | | |
| | | | |
Common Stocks | | | | | | | | | | | | | | | | |
Consumer discretionary | | $ | 11,932,500 | | | $ | 0 | | | $ | 0 | | | $ | 11,932,500 | |
Consumer staples | | | 13,758,247 | | | | 0 | | | | 0 | | | | 13,758,247 | |
Energy | | | 122,209,500 | | | | 0 | | | | 0 | | | | 122,209,500 | |
Health care | | | 127,522,800 | | | | 0 | | | | 0 | | | | 127,522,800 | |
Industrials | | | 118,788,160 | | | | 0 | | | | 0 | | | | 118,788,160 | |
Information technology | | | 296,204,700 | | | | 0 | | | | 0 | | | | 296,204,700 | |
Materials | | | 57,964,750 | | | | 0 | | | | 0 | | | | 57,964,750 | |
Real estate | | | 17,454,850 | | | | 0 | | | | 0 | | | | 17,454,850 | |
Utilities | | | 16,768,000 | | | | 0 | | | | 0 | | | | 16,768,000 | |
| | | | |
Corporate bonds and notes | | | 0 | | | | 125,223,866 | | | | 0 | | | | 125,223,866 | |
| | | | |
Yankee corporate bonds and notes | | | 0 | | | | 25,584,596 | | | | 0 | | | | 25,584,596 | |
| | | | |
Short-term investments | | | | | | | | | | | | | | | | |
Investment companies | | | 6,114,337 | | | | 0 | | | | 0 | | | | 6,114,337 | |
Investments measured at net asset value* | | | | | | | | | | | | | | | 8,313,620 | |
Total assets | | $ | 788,717,844 | | | $ | 150,808,462 | | | $ | 0 | | | $ | 947,839,926 | |
| * | Investments that are measured at fair value using the net asset value per share (or its equivalent) as a practical expedient have not been categorized in the fair value hierarchy. The fair value amount presented in the table is intended to permit reconciliation of the fair value hierarchy to the amounts presented in the Statement of Assets and Liabilities. The Fund’s investment in Securities Lending Cash Investments, LLC valued at $8,313,620 does not have a redemption period notice, can be redeemed daily and does not have any unfunded commitments. |
| | | | | | |
| Notes to financial statements | | Wells Fargo Diversified Capital Builder Fund | | | 27 | |
The Fund recognizes transfers between levels within the fair value hierarchy at the end of the reporting period. At September 30, 2017, the Fund did not have any transfers into/out of Level 1, Level 2, or Level 3.
4. TRANSACTIONS WITH AFFILIATES AND OTHER EXPENSES
Management fee
Funds Management, an indirect wholly owned subsidiary of Wells Fargo, is the manager of the Fund and provides advisory and fund-level administrative services under an investment management agreement. Under the investment management agreement, Funds Management is responsible for, among other services, implementing the investment objectives and strategies of the Fund, supervising the subadviser, providing fund-level administrative services in connection with the Fund’s operations, and providing any other fund-level administrative services reasonably necessary for the operation of the Fund. As compensation for its services under the investment management agreement, Funds Management is entitled to receive an annual management fee starting at 0.65% and declining to 0.48% as the average daily net assets of the Fund increase. For the year ended September 30, 2017, the management fee was equivalent to an annual rate of 0.63% of the Fund’s average daily net assets.
Funds Management has retained the services of a subadviser to provide daily portfolio management to the Fund. The fee for subadvisory services is borne by Funds Management. WellsCap is the subadviser to the Fund and is entitled to receive a fee from Funds Management at an annual rate starting at 0.35% and declining to 0.20% as the average daily net assets of the Fund increase.
Administration fees
Under a class-level administration agreement, Funds Management provides class-level administrative services to the Fund, which includes paying fees and expenses for services provided by the transfer agent, sub-transfer agents, omnibus account servicers and record-keepers. As compensation for its services under the class-level administration agreement, Funds Management receives an annual fee which is calculated based on the average daily net assets of each class as follows:
| | | | |
| | | Class-level
administration fee | |
Class A, Class B, Class C | | | 0.21 | % |
Administrator Class, Insitutional Class | | | 0.13 | |
Funds Management has contractually waived and/or reimbursed management and administration fees to the extent necessary to maintain certain net operating expense ratios for the Fund. Waiver of fees and/or reimbursement of expenses by Funds Management were made first from fund level expenses on a proportionate basis and then from class specific expenses. Funds Management has committed through January 31, 2018 to waive fees and/or reimburse expenses to the extent necessary to cap the Fund’s expenses at 1.20% for Class A shares, 1.95% for Class C shares, 1.05% for Administrator Class shares and 0.78% for Institutional Class shares. After this time, the cap may be increased or the commitment to maintain the cap may be terminated only with the approval of the Board of Trustees.
During the year ended September 30, 2017, State Street Bank and Trust Company (“State Street”), the Fund’s custodian, reimbursed the Fund $6,540 for certain out-of-pocket expenses that were billed to the Fund in error from 1998-2015. This amount is included in dividend income on the Statement of Operations. In addition, Funds Management was also reimbursed $14,537 by State Street for waivers/reimbursements it made to the Fund to limit Fund expenses during the period the Fund was erroneously billed.
Distribution fees
The Trust has adopted a distribution plan for Class B and Class C shares of the Fund pursuant to Rule 12b-1 under the 1940 Act. Distribution fees are charged to Class B and Class C shares and paid to Wells Fargo Funds Distributor, LLC (“Funds Distributor”), the principal underwriter, at an annual rate of 0.75% of the average daily net assets of Class B and Class C shares.
In addition, Funds Distributor is entitled to receive the front-end sales charge from the purchase of Class A shares and a contingent deferred sales charge on the redemption of certain Class A shares. Funds Distributor is also entitled to receive the contingent deferred sales charges from redemptions of Class B and Class C shares. For the year ended September 30, 2017, Funds Distributor received $112,883 from the sale of Class A shares and $123 in contingent deferred sales charges from redemptions of Class C shares. No contingent deferred sales charges were incurred by Class A and Class B shares for the year ended September 30, 2017.
| | | | |
| 28 | | Wells Fargo Diversified Capital Builder Fund | | Notes to financial statements |
Shareholder servicing fees
The Trust has entered into contracts with one or more shareholder servicing agents, whereby Class A, Class B, Class C, and Administrator Class of the Fund are charged a fee at an annual rate of 0.25% of the average daily net assets of each respective class.
A portion of these total shareholder servicing fees were paid to affiliates of Wells Fargo.
Interfund transactions
The Fund may purchase or sell portfolio investment securities to certain other Wells Fargo affiliates pursuant to Rule 17a-7 of the 1940 Act and under procedures adopted by the Board of Trustees. The procedures have been designed to ensure that these interfund transactions, which do not incur broker commissions, are effected at current market prices. Pursuant to these procedures, the Fund had $3,803,750 and $11,316,753 in interfund purchases and sales, respectively, during the year ended September 30, 2017.
5. INVESTMENT PORTFOLIO TRANSACTIONS
Purchases and sales of investments, excluding U.S. government obligations (if any) and short-term securities, for the year ended September 30, 2017 were $606,528,579 and $437,100,098, respectively.
6. BANK BORROWINGS
The Trust (excluding the money market funds and certain other funds) and Wells Fargo Variable Trust are parties to a $280,000,000 revolving credit agreement whereby the Fund is permitted to use bank borrowings for temporary or emergency purposes, such as to fund shareholder redemption requests. Interest under the credit agreement is charged to the Fund based on a borrowing rate equal to the higher of the Federal Funds rate in effect on that day plus 1.25% or the overnight LIBOR rate in effect on that day plus 1.25%. In addition, an annual commitment fee equal to 0.25% of the unused balance is allocated to each participating fund. Prior to August 29, 2017, the revolving credit agreement amount was $250,000,000.
For the year ended September 30, 2017, there were no borrowings by the Fund under the agreement.
7. DISTRIBUTIONS TO SHAREHOLDERS
The tax character of distributions paid during the years ended September 30, 2017 and September 30, 2016 were as follows:
| | | | | | | | |
| | | Year ended September 30 | |
| | | 2017 | | | 2016 | |
Ordinary income | | $ | 12,701,986 | | | $ | 10,219,018 | |
Long-term capital gain | | | 55,403,260 | | | | 53,552,312 | |
As of September 30, 2017, the components of distributable earnings on a tax basis were as follows:
| | | | |
Undistributed ordinary income | | Undistributed long-term gain | | Unrealized gains |
| $16,354,603 | | $28,819,449 | | $121,074,747 |
8. INDEMNIFICATION
Under the Trust’s organizational documents, the officers and Trustees have been granted certain indemnification rights against certain liabilities that may arise out of performance of their duties to the Trust. Additionally, in the normal course of business, the Trust may enter into contracts with service providers that contain a variety of indemnification clauses. The Trust’s maximum exposure under these arrangements is dependent on future claims that may be made against the Fund and, therefore, cannot be estimated.
| | | | | | |
| Report of independent registered public accounting firm | | Wells Fargo Diversified Capital Builder Fund | | | 29 | |
BOARD OF TRUSTEES AND SHAREHOLDERS OF WELLS FARGO FUNDS TRUST:
We have audited the accompanying statement of assets and liabilities, including the portfolio of investments, of the Wells Fargo Diversified Capital Builder Fund (the “Fund”), one of the funds constituting the Wells Fargo Funds Trust, as of September 30, 2017, and the related statement of operations for the year then ended, the statements of changes in net assets for each of the years in the two-year period then ended, and the financial highlights for each of the years in the five-year period then ended. These financial statements and financial highlights are the responsibility of the Fund’s management. Our responsibility is to express an opinion on these financial statements and financial highlights based on our audits.
We conducted our audits in accordance with the standards of the Public Company Accounting Oversight Board (United States). Those standards require that we plan and perform the audit to obtain reasonable assurance about whether the financial statements and financial highlights are free of material misstatement. An audit includes examining, on a test basis, evidence supporting the amounts and disclosures in the financial statements. Our procedures included confirmation of securities owned as of September 30, 2017, by correspondence with the custodian and brokers, or by other appropriate auditing procedures. An audit also includes assessing the accounting principles used and significant estimates made by management, as well as evaluating the overall financial statement presentation. We believe that our audits provide a reasonable basis for our opinion.
In our opinion, the financial statements and financial highlights referred to above present fairly, in all material respects, the financial position of the Wells Fargo Diversified Capital Builder Fund as of September 30, 2017, the results of its operations for the year then ended, changes in its net assets for each of the years in the two-year period then ended, and the financial highlights for each of the years in the five-year period then ended, in conformity with U.S. generally accepted accounting principles.

Boston, Massachusetts
November 22, 2017
| | | | |
| 30 | | Wells Fargo Diversified Capital Builder Fund | | Other information (unaudited) |
TAX INFORMATION
For corporate shareholders, pursuant to Section 854 of the Internal Revenue Code, 35.19% of ordinary income dividends qualify for the corporate dividends-received deduction for the fiscal year ended September 30, 2017.
Pursuant to Section 852 of the Internal Revenue Code, $55,403,260 was designated as a 20% rate gain distribution for the fiscal year ended September 30, 2017.
Pursuant to Section 854 of the Internal Revenue Code, $4,777,789 of income dividends paid during the fiscal year ended September 30, 2017 has been designated as qualified dividend income (QDI).
For the fiscal year ended September 30, 2017, $5,440,051 has been designated as interest-related dividends for nonresident alien shareholders pursuant to Section 871 of the Internal Revenue Code.
For the fiscal year ended September 30, 2017, $459,024 has been designated as short-term capital gain dividends for nonresident alien shareholders pursuant to Section 871 of the Internal Revenue Code.
PROXY VOTING INFORMATION
A description of the policies and procedures that the Fund uses to determine how to vote proxies relating to portfolio securities is available, upon request, by calling 1-800-222-8222, visiting our website at wellsfargofunds.com, or visiting the SEC website at sec.gov. Information regarding how the Fund voted proxies relating to portfolio securities during the most recent 12-month period ended June 30 is available on the Fund’s website at wellsfargofunds.com or by visiting the SEC website at sec.gov.
PORTFOLIO HOLDINGS INFORMATION
The complete portfolio holdings for the Fund are publicly available monthly on the Fund’s website (wellsfargofunds.com), on a one-month delayed basis. In addition, top ten holdings information (excluding derivative positions) for the Fund is publicly available on the Fund’s website on a monthly, seven-day or more delayed basis. The Fund files its complete schedule of portfolio holdings with the SEC for the first and third quarters of each fiscal year on Form N-Q, which is available by visiting the SEC website at sec.gov. In addition, the Fund’s Form N-Q may be reviewed and copied at the SEC’s Public Reference Room in Washington, DC, and at regional offices in New York City, at 233 Broadway, and in Chicago, at 175 West Jackson Boulevard, Suite 900. Information about the Public Reference Room may be obtained by calling 1-800-SEC-0330.
| | | | | | |
| Other information (unaudited) | | Wells Fargo Diversified Capital Builder Fund | | | 31 | |
BOARD OF TRUSTEES AND OFFICERS
Each of the Trustees and Officers1 listed in the table below acts in identical capacities for each fund in the Wells Fargo family of funds, which consists of 152 mutual funds comprising the Wells Fargo Funds Trust, Wells Fargo Variable Trust, Wells Fargo Master Trust and four closed-end funds (collectively the “Fund Complex”). This table should be read in conjunction with the Prospectus and the Statement of Additional Information2. The mailing address of each Trustee and Officer is 525 Market Street, 12th Floor, San Francisco, CA 94105. Each Trustee and Officer serves an indefinite term, however, each Trustee serves such term until reaching the mandatory retirement age established by the Trustees.
Independent Trustees
| | | | | | |
Name and year of birth | | Position held and length of service* | | Principal occupations during past five years or longer | | Current other public company or investment company
directorships |
| William R. Ebsworth (Born 1957) | | Trustee, since 2015 | | Retired. From 1984 to 2013, equities analyst, portfolio manager, research director and chief investment officer at Fidelity Management and Research Company in Boston, Tokyo, and Hong Kong and retired in 2013 as Chief Investment Officer of Fidelity Strategic Advisers, Inc. where he led a team of investment professionals managing client assets. Prior thereto, Board member of Hong Kong Securities Clearing Co., Hong Kong Options Clearing Corp., the Thailand International Fund, Ltd., Fidelity Investments Life Insurance Company, and Empire Fidelity Investments Life Insurance Company. Board member of the Forté Foundation (non-profit organization) and the Vincent Memorial Hospital Endowment (non-profit organization), where he serves on the Investment Committee and as a Chair of the Audit Committee. Mr. Ebsworth is a CFA® charterholder. | | Asset Allocation Trust |
| Jane A. Freeman (Born 1953) | | Trustee, since 2015 | | Retired. From 2012 to 2014 and 1999 to 2008, Chief Financial Officer of Scientific Learning Corporation. From 2008 to 2012, Ms. Freeman provided consulting services related to strategic business projects. Prior to 1999, Portfolio Manager at Rockefeller & Co. and Scudder, Stevens & Clark. Board member of the Harding Loevner Funds from 1996 to 2014, serving as both Lead Independent Director and chair of the Audit Committee. Board member of the Russell Exchange Traded Funds Trust from 2011 to 2012 and the chair of the Audit Committee. Ms. Freeman is a Board Member of Ruth Bancroft Garden (non-profit organization) and an inactive chartered financial analyst. | | Asset Allocation Trust |
| Peter G. Gordon** (Born 1942) | | Trustee, since 1998; Chairman, since 2005 | | Co-Founder, Retired Chairman, President and CEO of Crystal Geyser Water Company. Trustee Emeritus, Colby College. | | Asset Allocation Trust |
Isaiah Harris, Jr. (Born 1952) | | Trustee, since 2009 | | Retired. Chairman of the Board of CIGNA Corporation since 2009, and Director since 2005. From 2003 to 2011, Director of Deluxe Corporation. Prior thereto, President and CEO of BellSouth Advertising and Publishing Corp. from 2005 to 2007, President and CEO of BellSouth Enterprises from 2004 to 2005 and President of BellSouth Consumer Services from 2000 to 2003. Emeritus member of the Iowa State University Foundation Board of Governors. Emeritus Member of the Advisory Board of Iowa State University School of Business. Advisory Board Member, Palm Harbor Academy (charter school). Advisory Board Member, Child Evangelism Fellowship (non-profit). Mr. Harris is a certified public accountant (inactive status). | | CIGNA Corporation; Asset Allocation Trust |
| Judith M. Johnson (Born 1949) | | Trustee, since 2008; Audit Committee Chairman, since 2008 | | Retired. Prior thereto, Chief Executive Officer and Chief Investment Officer of Minneapolis Employees Retirement Fund from 1996 to 2008. Ms. Johnson is an attorney, certified public accountant and a certified managerial accountant. | | Asset Allocation Trust |
David F. Larcker (Born 1950) | | Trustee, since 2009 | | James Irvin Miller Professor of Accounting at the Graduate School of Business, Stanford University, Director of the Corporate Governance Research Initiative and Senior Faculty of The Rock Center for Corporate Governance since 2006. From 2005 to 2008, Professor of Accounting at the Graduate School of Business, Stanford University. Prior thereto, Ernst & Young Professor of Accounting at The Wharton School, University of Pennsylvania from 1985 to 2005. | | Asset Allocation Trust |
| | | | |
| 32 | | Wells Fargo Diversified Capital Builder Fund | | Other information (unaudited) |
| | | | | | |
Name and year of birth | | Position held and length of service* | | Principal occupations during past five years or longer | | Current other public company or investment company
directorships |
Olivia S. Mitchell (Born 1953) | | Trustee, since 2006 | | International Foundation of Employee Benefit Plans Professor, Wharton School of the University of Pennsylvania since 1993. Director of Wharton’s Pension Research Council and Boettner Center on Pensions & Retirement Research, and Research Associate at the National Bureau of Economic Research. Previously, Cornell University Professor from 1978 to 1993. | | Asset Allocation Trust |
| Timothy J. Penny (Born 1951) | | Trustee, since 1996: Vice Chairman, since 2017 | | President and Chief Executive Officer of Southern Minnesota Initiative Foundation, a non-profit organization, since 2007 and Senior Fellow at the Humphrey Institute Policy Forum at the University of Minnesota since 1995. Member of the Board of Trustees of NorthStar Education Finance, Inc., a non-profit organization, since 2007. | | Asset Allocation Trust |
| Michael S. Scofield (Born 1943) | | Trustee, since 2010 | | Served on the Investment Company Institute’s Board of Governors and Executive Committee from 2008-2011 as well the Governing Council of the Independent Directors Council from 2006-2011 and the Independent Directors Council Executive Committee from 2008-2011. Chairman of the IDC from 2008-2010. Trustee of the Evergreen Funds complex (and its predecessors) from 1984 to 2010. Chairman of the Evergreen Funds from 2000-2010. Former Trustee of the Mentor Funds. Retired Attorney, Law Offices of Michael S. Scofield. | | Asset Allocation Trust |
| * | Length of service dates reflect the Trustee’s commencement of service with the Trust’s predecessor entities, where applicable. |
| ** | Peter Gordon is expected to retire on December 31, 2017. |
Advisory Board Members
| | | | | | |
Name and year of birth | | Position held and length of service | | Principal occupations during past five years or longer | | Current other public company or
investment company
directorships |
| James G. Polisson (Born 1959) | | Advisory Board Member, since 2017 | | Retired. Chief Marketing Officer, Source (ETF) UK Services, Ltd, from 2015 to 2017. From 2012 to 2015, Principal of The Polisson Group, LLC, a management consulting, corporate advisory and principal investing company. Chief Executive Officer and Managing Director at Russell Investments, Global Exchange Traded Funds from 2010 to 2012. Managing Director of Barclays Global Investors from 1998 to 2010 and Global Chief Marketing Officer for iShares and Barclays Global Investors from 2000 to 2010. Prior thereto, Vice President, Fidelity Retail Mutual Fund Group from 1996 to 1998 and Risk Management Practice Manager, Fidelity Consulting from 1995 to 1996. Board member of the Russell Exchange Traded Fund Trust from 2011 to 2012. Director of Barclays Global Investors Holdings Deutschland GmbH from 2006 to 2009. Mr. Polisson is an attorney and has a retired status with the Massachusetts and District of Columbia Bar Associations. | | None |
| Pamela Wheelock (Born 1959) | | Advisory Board Member, since 2017 | | Chief Operating Officer, Twin Cities Habitat for Humanity, since January, 2017. Vice President of University Services, University of Minnesota from 2012 to 2017. Prior thereto, Interim President and Chief Executive Officer of Blue Cross Blue Shield of Minnesota from 2010 to 2011, Chairman of the Board from 2009 to 2011 and Board Director from 2003 to 2015. Vice President, Leadership and Community Engagement, Bush Foundation, Saint Paul, Minnesota (a private foundation) from 2009 to 2011. Executive Vice President and Chief Financial Officer, Minnesota Sports and Entertainment from 2004 to 2009 and Senior Vice President from 2002 to 2004. Commissioner of Finance, State of Minnesota, from 1999 to 2002. Currently on the Board of Directors, Governance Committee and Finance Committee, for the Minnesota Philanthropy Partners (Saint Paul Foundation) since 2012 and Board Chair of the Minnesota Wild Foundation since 2010. | | None |
| | | | | | |
| Other information (unaudited) | | Wells Fargo Diversified Capital Builder Fund | | | 33 | |
Officers
| | | | | | |
Name and year of birth | | Position held and length of service | | Principal occupations during past five years or longer | | |
Andrew Owen (Born 1960) | | President, since 2017 | | Executive Vice President of Wells Fargo & Company and Head of Affiliated Managers, Wells Fargo Asset Management, since 2014. In addition, Mr. Owen is currently President, Chief Executive Officer and Director of Wells Fargo Funds Management, LLC since 2017. Prior thereto, Executive Vice President responsible for marketing, investments and product development for Wells Fargo Funds Management, LLC, from 2009 to 2014. | | |
| Jeremy DePalma1 (Born 1974) | | Treasurer, since 2012 | | Senior Vice President of Wells Fargo Funds Management, LLC since 2009. Senior Vice President of Evergreen Investment Management Company, LLC from 2008 to 2010 and head of the Fund Reporting and Control Team within Fund Administration from 2005 to 2010. | | |
C. David Messman (Born 1960) | | Secretary, since 2000; Chief Legal Officer, since 2003 | | Senior Vice President and Secretary of Wells Fargo Funds Management, LLC since 2001. Assistant General Counsel of Wells Fargo Bank, N.A. since 2013 and Vice President and Managing Counsel of Wells Fargo Bank, N.A. from 1996 to 2013. | | |
Michael H. Whitaker (Born 1967) | | Chief Compliance Officer, since 2016 | | Senior Vice President and Chief Compliance Officer since 2016. Senior Vice President and Chief Compliance Officer for Fidelity Investments from 2007 to 2016. | | |
David Berardi (Born 1975) | | Assistant Treasurer, since 2009 | | Vice President of Wells Fargo Funds Management, LLC since 2009. Vice President of Evergreen Investment Management Company, LLC from 2008 to 2010. Manager of Fund Reporting and Control for Evergreen Investment Management Company, LLC from 2004 to 2010. | | |
| 1 | Jeremy DePalma acts as Treasurer of 76 funds and Assistant Treasurer of 76 funds in the Fund Complex. |
| 2 | The Statement of Additional Information includes additional information about the Trustees and is available, without charge, upon request, by calling 1-800-222-8222 or by visiting the website at wellsfargofunds.com. |
| | | | |
| 34 | | Wells Fargo Diversified Capital Builder Fund | | Other information (unaudited) |
BOARD CONSIDERATION OF INVESTMENT MANAGEMENT AND SUB-ADVISORY AGREEMENTS:
Under the Investment Company Act of 1940 (the “1940 Act”), the Board of Trustees (the “Board”) of Wells Fargo Funds Trust (the “Trust”) must determine annually whether to approve the continuation of the Trust’s investment management and sub-advisory agreements. In this regard, at an in-person meeting held on May 16-17, 2017 (the “Meeting”), the Board, all the members of which have no direct or indirect interest in the investment management and sub-advisory agreements and are not “interested persons” of the Trust, as defined in the 1940 Act (the “Independent Trustees”), reviewed and approved for Wells Fargo Diversified Capital Builder Fund (the “Fund”): (i) an investment management agreement (the “Management Agreement”) with Wells Fargo Funds Management, LLC (“Funds Management”); and (ii) an investment sub-advisory agreement (the “Sub-Advisory Agreement”) with Wells Capital Management Incorporated (the “Sub-Adviser”), an affiliate of Funds Management. The Management Agreement and the Sub-Advisory Agreement are collectively referred to as the “Advisory Agreements.”
At the Meeting, the Board considered the factors and reached the conclusions described below relating to the selection of Funds Management and the Sub-Adviser and the approval of the Advisory Agreements. Prior to the Meeting, including at an in-person meeting in April 2017, the Trustees conferred extensively among themselves and with representatives of Funds Management about these matters. Also, the Board has adopted a team-based approach, with each team consisting of a sub-set of Trustees, to assist the full Board in the discharge of its duties in reviewing performance and other matters throughout the year. The Independent Trustees were assisted in their evaluation of the Advisory Agreements by independent legal counsel, from whom they received separate legal advice and with whom they met separately.
In providing information to the Board, Funds Management and the Sub-Adviser were guided by a detailed set of requests for information submitted to them by independent legal counsel on behalf of the Independent Trustees at the start of the Board’s annual contract renewal process earlier in 2017. In considering and approving the Advisory Agreements, the Trustees considered the information they believed relevant, including but not limited to the information discussed below. The Board considered not only the specific information presented in connection with the Meeting, but also the knowledge gained over time through interaction with Funds Management and the Sub-Adviser about various topics. In this regard, the Board reviewed reports of Funds Management at each of its quarterly meetings, which included, among other things, portfolio reviews and performance reports. In addition, the Board and the teams mentioned above confer with portfolio managers at various times throughout the year. The Board did not identify any particular information or consideration that was all-important or controlling, and each individual Trustee may have attributed different weights to various factors.
After its deliberations, the Board unanimously approved the continuation of the Advisory Agreements for a one-year term and determined that the compensation payable to Funds Management and the Sub-Adviser under each of the Advisory Agreements was reasonable. The Board considered the approval of the Advisory Agreements for the Fund as part of its consideration of agreements for funds across the complex, but its approvals were made on a fund-by-fund basis. The following summarizes a number of important, but not necessarily all, factors considered by the Board in support of its approvals.
Nature, extent and quality of services
The Board received and considered various information regarding the nature, extent and quality of services provided to the Fund by Funds Management and the Sub-Adviser under the Advisory Agreements. This information included a description of the investment advisory services and Fund-level administrative services covered by the Management Agreement, as well as, among other things, a summary of the background and experience of senior management of Funds Management, a summary of certain organizational and personnel changes involving Funds Management and the Sub-Adviser, and a description of Funds Management’s and the Sub-Adviser’s business continuity planning programs and of their approaches to data privacy and cybersecurity. The Board also considered the qualifications, background, tenure and responsibilities of each of the portfolio managers primarily responsible for the day-to-day portfolio management of the Fund.
The Board evaluated the ability of Funds Management and the Sub-Adviser to attract and retain qualified investment professionals, including research, advisory and supervisory personnel. The Board further considered the compliance programs and compliance records of Funds Management and the Sub-Adviser. In addition, the Board took into account the full range of services provided to the Fund by Funds Management and its affiliates.
Fund performance and expenses
The Board considered the performance results for the Fund over various time periods ended December 31, 2016. The Board considered these results in comparison to the performance of funds in a universe that was determined by
| | | | | | |
| Other information (unaudited) | | Wells Fargo Diversified Capital Builder Fund | | | 35 | |
Broadridge Inc. (“Broadridge”) to be similar to the Fund (the “Universe”), and in comparison to the Fund’s benchmark index and to other comparative data. Broadridge is an independent provider of investment company data. The Board received a description of the methodology used by Broadridge to select the mutual funds in the performance Universe. The Board noted that the performance of the Fund (Class A) was higher than the average performance of the Universe for all periods under review. The Board also noted that the performance of the Fund was higher than its benchmark, the Diversified Capital Builder Blended Index, for all periods under review except the ten-year period.
The Board also received and considered information regarding the Fund’s net operating expense ratios and their various components, including actual management fees, custodian and other non-management fees, and Rule 12b-1 and non-Rule 12b-1 shareholder service fees. The Board considered these ratios in comparison to the median ratios of funds in class-specific expense groups that were determined by Broadridge to be similar to the Fund (the “Groups”). The Board received a description of the methodology used by Broadridge to select the mutual funds in the expense Groups and an explanation of how funds comprising expense groups and their expense ratios may vary from year-to-year. Based on the Broadridge reports, the Board noted that the net operating expense ratios of the Fund were lower than or in range of the median net operating expense ratios of the expense Groups for all share classes.
The Board took into account the Fund performance and expense information provided to it among the factors considered in deciding to re-approve the Advisory Agreements.
Investment management and sub-advisory fee rates
The Board reviewed and considered the contractual fee rates payable by the Fund to Funds Management under the Management Agreement, as well as the contractual fee rates payable by the Fund to Funds Management for class-level administrative services under a Class-Level Administration Agreement, which include, among other things, class-level transfer agency and sub-transfer agency costs (collectively, the “Management Rates”). The Board also reviewed and considered the contractual investment sub-advisory fee rates that are payable by Funds Management to the Sub-Adviser for investment sub-advisory services.
Among other information reviewed by the Board was a comparison of the Fund’s Management Rates with the average contractual investment management fee rates of funds in the expense Groups at a common asset level as well as transfer agency costs of the funds in the expense Groups. The Board noted that the Management Rates of the Fund were in range of the sum of these average rates for the Fund’s expense Groups for all share classes.
The Board also received and considered information about the portion of the total management fee that was retained by Funds Management after payment of the fee to the Sub-Adviser for sub-advisory services. In assessing the reasonableness of this amount, the Board received and evaluated information about the nature and extent of responsibilities retained and risks assumed by Funds Management and not delegated to or assumed by the Sub-Adviser, and about Funds Management’s on-going oversight services. Given the affiliation between Funds Management and the Sub-Adviser, the Board ascribed limited relevance to the allocation of fees between them.
Based on its consideration of the factors and information it deemed relevant, including those described here, the Board determined that the compensation payable to Funds Management under the Management Agreement and to the Sub-Adviser under the Sub-Advisory Agreement was reasonable.
Profitability
The Board received and considered information concerning the profitability of Funds Management, as well as the profitability of Wells Fargo as a whole, from providing services to the Fund and the fund family as a whole. The Board also received and considered information concerning the profitability of the Sub-Adviser from providing services to the fund family as a whole, noting that the Sub-Adviser’s profitability information with respect to providing services to the Fund was subsumed in the Wells Fargo and Funds Management profitability analysis.
Funds Management reported on the methodologies and estimates used in calculating profitability, including a description of the methodology used to allocate certain expenses. Among other things, the Board noted that the levels of profitability reported on a fund-by-fund basis varied widely, depending on factors such as the size and type of fund. Based on its review, the Board did not deem the profits reported by Funds Management or Wells Fargo from its services to the Fund to be at a level that would prevent it from approving the continuation of the Advisory Agreements.
Economies of scale
With respect to possible economies of scale, the Board noted the existence of breakpoints in the Fund’s management fee structure, which operate generally to reduce the Fund’s expense ratios as the Fund grows in size. It considered that, for a small fund or a fund that shrinks in size, breakpoints conversely can result in higher fee levels. The Board also considered that
| | | | |
| 36 | | Wells Fargo Diversified Capital Builder Fund | | Other information (unaudited) |
in addition to management fee breakpoints, competitive management fee rates set at the outset without regard to breakpoints and fee waiver and expense reimbursement arrangements are means of sharing potential economies of scale with shareholders of the Fund. The Board considered Funds Management’s view, which Funds Management indicated was supported by independent third-party industry studies which were summarized for the Board, that any analyses of potential economies of scale in managing a particular fund are inherently limited in light of the joint and common costs and investments that Funds Management incurs across the fund family as a whole.
The Board concluded that the Fund’s fee and expense arrangements, including contractual breakpoints, constituted a reasonable approach to sharing potential economies of scale with the Fund and its shareholders.
Other benefits to Funds Management and the Sub-Adviser
The Board received and considered information regarding potential “fall-out” or ancillary benefits received by Funds Management and its affiliates, including the Sub-Adviser, as a result of their relationships with the Fund. Ancillary benefits could include, among others, benefits directly attributable to other relationships with the Fund and benefits potentially derived from an increase in Funds Management’s and the Sub-Adviser’s business as a result of their relationships with the Fund. The Board noted that various affiliates of Funds Management may receive distribution-related fees, shareholder servicing payments and sub-transfer agency fees in respect of shares sold or held through them and services provided.
The Board also reviewed information about soft dollar credits earned and utilized by the Sub-Adviser, fees earned by Funds Management and the Sub-Adviser from managing a private investment vehicle for the fund family’s securities lending collateral and commissions earned by an affiliated broker from portfolio transactions.
Based on its consideration of the factors and information it deemed relevant, including those described here, the Board did not find that any ancillary benefits received by Funds Management and its affiliates, including the Sub-Adviser, were unreasonable.
Conclusion
At the Meeting, after considering the above-described factors and based on its deliberations and its evaluation of the information described above, the Board unanimously approved the continuation of the Advisory Agreements for a one-year term and determined that the compensation payable to Funds Management and the Sub-Adviser under each of the Advisory Agreements was reasonable.
| | | | | | |
| List of abbreviations | | Wells Fargo Diversified Capital Builder Fund | | | 37 | |
The following is a list of common abbreviations for terms and entities that may have appeared in this report.
| ACA | — ACA Financial Guaranty Corporation |
| ADR | — American depositary receipt |
| ADS | — American depositary shares |
| AGC | — Assured Guaranty Corporation |
| AGM | — Assured Guaranty Municipal |
| Ambac | — Ambac Financial Group Incorporated |
| AMT | — Alternative minimum tax |
| BAN | — Bond anticipation notes |
| BHAC | — Berkshire Hathaway Assurance Corporation |
| CAB | — Capital appreciation bond |
| CCAB | — Convertible capital appreciation bond |
| CDA | — Community Development Authority |
| CDO | — Collateralized debt obligation |
| CLO | — Collateralized loan obligation |
| DRIVER | — Derivative inverse tax-exempt receipts |
| DW&P | — Department of Water & Power |
| DWR | — Department of Water Resources |
| ECFA | — Educational & Cultural Facilities Authority |
| EDA | — Economic Development Authority |
| EDFA | — Economic Development Finance Authority |
| ETF | — Exchange-traded fund |
| FDIC | — Federal Deposit Insurance Corporation |
| FFCB | — Federal Farm Credit Banks |
| FGIC | — Financial Guaranty Insurance Corporation |
| FHA | — Federal Housing Administration |
| FHLB | — Federal Home Loan Bank |
| FHLMC | — Federal Home Loan Mortgage Corporation |
| FICO | — The Financing Corporation |
| FNMA | — Federal National Mortgage Association |
| GDR | — Global depositary receipt |
| GNMA | — Government National Mortgage Association |
| HCFR | — Healthcare facilities revenue |
| HEFA | — Health & Educational Facilities Authority |
| HEFAR | — Higher education facilities authority revenue |
| HFA | — Housing Finance Authority |
| HFFA | — Health Facilities Financing Authority |
| HUD | — Department of Housing and Urban Development |
| IDA | — Industrial Development Authority |
| IDAG | — Industrial Development Agency |
| KRW | — Republic of Korea won |
| LIBOR | — London Interbank Offered Rate |
| LIFER | — Long Inverse Floating Exempt Receipts |
| LLC | — Limited liability company |
| LLLP | — Limited liability limited partnership |
| LLP | — Limited liability partnership |
| MBIA | — Municipal Bond Insurance Association |
| MFHR | — Multifamily housing revenue |
| MSTR | — Municipal securities trust receipts |
| MUD | — Municipal Utility District |
| National | — National Public Finance Guarantee Corporation |
| PCFA | — Pollution Control Financing Authority |
| PCL | — Public Company Limited |
| PCR | — Pollution control revenue |
| PFA | — Public Finance Authority |
| PFFA | — Public Facilities Financing Authority |
| PFOTER | — Puttable floating option tax-exempt receipts |
| PJSC | — Public Joint Stock Company |
| plc | — Public limited company |
| PUTTER | — Puttable tax-exempt receipts |
| R&D | — Research & development |
| Radian | — Radian Asset Assurance |
| RAN | — Revenue anticipation notes |
| RDA | — Redevelopment Authority |
| RDFA | — Redevelopment Finance Authority |
| REIT | — Real estate investment trust |
| ROC | — Reset option certificates |
| SAVRS | — Select auction variable rate securities |
| SBA | — Small Business Authority |
| SDR | — Swedish depositary receipt |
| SFHR | — Single-family housing revenue |
| SFMR | — Single-family mortgage revenue |
| SPA | — Standby purchase agreement |
| SPDR | — Standard & Poor’s Depositary Receipts |
| SPEAR | — Short Puttable Exempt Adjustable Receipts |
| STRIPS | — Separate trading of registered interest and |
| TAN | — Tax anticipation notes |
| TIPS | — Treasury inflation-protected securities |
| TRAN | — Tax revenue anticipation notes |
| TTFA | — Transportation Trust Fund Authority |
| TVA | — Tennessee Valley Authority |
This page is intentionally left blank.
This page is intentionally left blank.
This page is intentionally left blank.

For more information
More information about Wells Fargo Funds is available free upon request. To obtain literature, please write, email, visit the Fund’s website, or call:
Wells Fargo Funds
P.O. Box 8266
Boston, MA 02266-8266
Email: fundservice@wellsfargo.com
Website: wellsfargofunds.com
Individual investors: 1-800-222-8222
Retail investment professionals: 1-888-877-9275
Institutional investment professionals:
1-866-765-0778
This report and the financial statements contained herein are submitted for the general information of the shareholders of the Fund. If this report is used for promotional purposes, distribution of the report must be accompanied or preceded by a current prospectus. Before investing, please consider the investment objectives, risks, charges, and expenses of the investment. For a current prospectus and, if available, a summary prospectus, containing this information, call 1-800-222-8222 or visit the Fund’s website at wellsfargofunds.com. Read the prospectus carefully before you invest or send money.
Wells Fargo Asset Management (WFAM) is a trade name used by the asset management businesses of Wells Fargo & Company. Wells Fargo Funds Management, LLC, a wholly owned subsidiary of Wells Fargo & Company, provides investment advisory and administrative services for Wells Fargo Funds. Other affiliates of Wells Fargo & Company provide subadvisory and other services for the funds. The funds are distributed by Wells Fargo Funds Distributor, LLC, Member FINRA, an affiliate of Wells Fargo & Company. Neither Wells Fargo Funds Distributor nor Wells Fargo Funds Management holds fund shareholder accounts or assets. This material is for general informational and educational purposes only and is NOT intended to provide investment advice or a recommendation of any kind—including a recommendation for any specific investment, strategy, or plan.
NOT FDIC INSURED ◾ NO BANK GUARANTEE ◾ MAY LOSE VALUE
© 2017 Wells Fargo Funds Management, LLC. All rights reserved.
| | |
 | | 306429 11-17 A225/AR225 09-17 |
Annual Report
September 30, 2017

Wells Fargo Diversified Income Builder Fund


Reduce clutter. Save trees.
Sign up for electronic delivery of prospectuses and shareholder reports at wellsfargo.com/advantagedelivery
Contents
The views expressed and any forward-looking statements are as of September 30, 2017, unless otherwise noted, and are those of the Fund managers and/or Wells Fargo Funds Management, LLC. Discussions of individual securities, or the markets generally, or any Wells Fargo Fund are not intended as individual recommendations. Future events or results may vary significantly from those expressed in any forward-looking statements. The views expressed are subject to change at any time in response to changing circumstances in the market. Wells Fargo Funds Management, LLC and the Fund disclaim any obligation to publicly update or revise any views expressed or forward-looking statements.
NOT FDIC INSURED ◾ NO BANK GUARANTEE ◾ MAY LOSE VALUE
| | | | |
| 2 | | Wells Fargo Diversified Income Builder Fund | | Letter to shareholders (unaudited) |

Andrew Owen
President
Wells Fargo Funds
Favorable economic news supported stocks, and interest rates moved higher.
Hiring remained strong, and business and consumer sentiment improved.
Dear Shareholder:
We are pleased to offer you this annual report for the Wells Fargo Diversified Income Builder Fund for the 12-month period that ended September 30, 2017. Despite heightened market volatility at times, global stocks generally delivered double-digit results and bond markets had smaller but positive results as well. U.S. and international stocks returned 18.61% and 19.61%, respectively, for the 12-month period, as measured by the S&P 500 Index1 and the MSCI ACWI ex USA Index (Net),2 respectively; within fixed income, the Bloomberg Barclays U.S. Aggregate Bond Index3 returned 0.07% and the Bloomberg Barclays Municipal Bond Index4 returned 0.87% as interest rates rose from low levels.
Election results and central banks’ policies commanded investor attention as 2016 closed.
During the fourth quarter of 2016, investors appeared intent on the prospective outcomes of elections in the U.S. and central-bank actions globally. Following Donald Trump’s election victory, U.S. stocks rallied. Investors appeared optimistic that the new administration would pursue progrowth policies. Favorable economic news supported stocks, and interest rates moved higher. At their mid-December meeting, U.S. Federal Reserve (Fed) officials raised the target interest rate by a quarter percentage point to a range of 0.50% to 0.75%. The fourth quarter also saw the implementation of the U.S. Securities and Exchange Commission’s new rules for money market funds, which included floating net asset values (NAVs) as well as the possibility of liquidity fees and redemption gates for institutional prime and municipal money market funds. In the year leading up to money market fund reform implementation, nearly $1 trillion in assets moved from money market funds subject to floating NAVs into government money market funds, which continued to transact at a stable $1.00 NAV. Outside of the U.S., the prospects for faster U.S. growth appeared to trigger some acceleration in Europe.
Financial markets gained during the first two quarters of 2017 on positive economic data.
Stocks rallied globally through the first quarter of 2017, supported by signs of improvement in the U.S. and global economies. U.S. economic data released during the quarter reflected a healthy economy. Hiring remained strong, and business and consumer sentiment improved. In March, Fed officials raised their target interest rate by a quarter percentage point to a range of 0.75% to 1.00%. With the Fed’s target interest-rate increase, short-term bond yields rose during the quarter. Meanwhile, longer-term Treasury yields were little changed, leading to positive performance. Investment-grade and high-yield bonds benefited from strong demand. Municipal bond returns were positive in the quarter, helped by strong demand and constrained new-issue supply. Outside of the U.S., stocks in emerging markets generally outperformed stocks in the U.S. and international
| 1 | The S&P 500 Index consists of 500 stocks chosen for market size, liquidity, and industry group representation. It is a market-value-weighted index with each stock’s weight in the index proportionate to its market value. You cannot invest directly in an index. |
| 2 | The Morgan Stanley Capital International (MSCI) All Country World Index (ACWI) ex USA Index (Net) is a free-float-adjusted market-capitalization-weighted index that is designed to measure the equity market performance of developed markets, excluding the United States and Canada. Source: MSCI. MSCI makes no express or implied warranties or representations and shall have no liability whatsoever with respect to any MSCI data contained herein. The MSCI data may not be further redistributed or used as a basis for other indexes or any securities or financial products. This report is not approved, reviewed, or produced by MSCI. You cannot invest directly in an index. |
| 3 | The Bloomberg Barclays U.S. Aggregate Bond Index is a broad-based benchmark that measures the investment-grade, U.S. dollar-denominated, fixed-rate taxable bond market, including Treasuries, government-related and corporate securities, mortgage-backed securities (agency fixed-rate and hybrid adjustable-rate mortgage pass-throughs), asset-backed securities, and commercial mortgage-backed securities. You cannot invest directly in an index. |
| 4 | The Bloomberg Barclays Municipal Bond Index is an unmanaged index composed of long-term tax-exempt bonds with a minimum credit rating of Baa. You cannot invest directly in an index. |
| | | | | | |
| Letter to shareholders (unaudited) | | Wells Fargo Diversified Income Builder Fund | | | 3 | |
developed markets because they benefited from both global economic growth and recent weakening in the U.S. dollar. Stocks in Asia, Europe, and Latin America also outperformed the U.S. market during the quarter.
Globally, stocks marked continued gains through the second quarter of 2017. Steady, albeit modest, economic growth both in the U.S. and abroad and generally favorable corporate earnings announcements supported higher valuations. U.S. inflation trended lower despite a continued decline in the unemployment rate. Ten-year U.S. Treasury yields declined, resulting in stronger prices for long-term bonds. As was widely expected, the Fed raised the target interest rate in June by a quarter percentage point to a range of 1.00% to 1.25%. In addition, the Fed indicated that it would begin to sell bonds accumulated on its balance sheet during quantitative easing programs conducted since 2008. Later in the third quarter, the Fed confirmed that the initiative to reduce the bonds that it holds likely would begin in October.
Volatility increased during the third quarter of 2017.
Early in July and again in August, volatility expectations increased and then receded—as measured by the CBOE VIX5—amid geopolitical tensions, particularly in Asia, and declining investor optimism following unsuccessful efforts to reform health care laws in the U.S. which suggested to some that President Trump and Congress would be unable to move forward with tax and regulatory reforms.
During the quarter, economic momentum increased in Europe; the European Central Bank held its rates steady at low levels and continued its quantitative easing bond-buying program, which is intended to spark economic activity. The Bank of England suggested it could hike interest rates in November, and the pound gained against other currencies. The Bank of Japan also maintained accommodative policies intended to support business activity and economic growth. In Germany, Angela Merkel was reelected chancellor; in Japan, Prime Minister Shinzo Abe called for snap elections as his popularity increased after North Korea’s aggressive program of missile launches. Both political developments were indicative of the type of political consistency in developed markets that reassure financial markets.
In emerging markets, many countries benefited from stronger currencies versus the U.S. dollar. In addition, commodity prices were on an upward trajectory, which benefited many companies that rely on natural resources for exports.
As the quarter closed, optimism returned as economic growth continued. The second-quarter gross domestic product measure was revised higher from 2.6% annualized to 3.0%. Consumer spending and residential and nonresidential investment increased. While inflation continued to trail the Fed’s targets, expectations remained for an additional short-term interest-rate hike before year-end.
| 5 | The Chicago Board Options Exchange Market Volatility Index (CBOE VIX) is a popular measure of the implied volatility of S&P 500 Index options. It represents one measure of the market’s expectation of stock market volatility over the next 30-day period. You cannot invest directly in an index. |
| | | | |
| 4 | | Wells Fargo Diversified Income Builder Fund | | Letter to shareholders (unaudited) |
Don’t let short-term uncertainty derail long-term investment goals.
Periods of investment uncertainty can present challenges, but experience has taught us that maintaining long-term investment goals can be an effective way to plan for the future. To help you create a sound strategy based on your personal goals and risk tolerance, Wells Fargo Funds offers more than 100 mutual funds spanning a wide range of asset classes and investment styles. Although diversification cannot guarantee an investment profit or prevent losses, we believe it can be an effective way to manage investment risk and potentially smooth out overall portfolio performance. We encourage investors to know their investments and to understand that appropriate levels of risk-taking may unlock opportunities.
Thank you for choosing to invest with Wells Fargo Funds. We appreciate your confidence in us and remain committed to helping you meet your financial needs.
Sincerely,

Andrew Owen
President
Wells Fargo Funds
Notice to Shareholders
At a meeting held on November 9-10, 2017, the Board of Trustees of the Fund approved the following changes to the Fund’s strategy, to be effective January 2, 2018:
| | ∎ | | The Fund’s target allocation will be adjusted to 60% to 90% of total assets in debt securities and 10% to 40% in equity securities. Currently, the Fund’s target allocation is 70% to 90% of total assets in debt securities and 10% to 30% in equity securities. | |
| | ∎ | | The Fund’s principal investment strategy will be amended to include investment in master limited partnerships, real estate investment trusts, bank loans, municipal securities, and government debt; as well as equity and interest-rate futures and swaps. | |
| | ∎ | | Up to 20% of the Fund’s total assets may be invested using a passive investment strategy by investing in a manner that attempts to replicate the performance of indexes. | |
Further information regarding these and other related changes can be found in the Product Alert dated November 13, 2017 and posted to the Fund’s website at wellsfargofunds.com
For further information about your Fund, contact your investment professional, visit our website at wellsfargofunds.com, or call us directly at 1-800-222-8222. We are available 24 hours a day, 7 days a week.
This page is intentionally left blank.
| | | | |
| 6 | | Wells Fargo Diversified Income Builder Fund | | Performance highlights (unaudited) |
Investment objective
The Fund seeks long-term total return, consisting of capital appreciation and current income.
Manager
Wells Fargo Funds Management, LLC
Subadviser
Wells Capital Management Incorporated
Portfolio manager
Margaret Patel
Average annual total returns (%) as of September 30, 20171
| | | | | | | | | | | | | | | | | | | | | | | | | | | | | | | | | | |
| | | | | Including sales charge | | | Excluding sales charge | | | Expense ratios2 (%) | |
| | | Inception date | | 1 year | | | 5 year | | | 10 year | | | 1 year | | | 5 year | | | 10 year | | | Gross | | | Net3 | |
| Class A (EKSAX) | | 4-14-1987 | | | 2.95 | | | | 6.39 | | | | 5.40 | | | | 9.16 | | | | 7.67 | | | | 6.02 | | | | 1.08 | | | | 1.08 | |
| Class C (EKSCX) | | 2-1-1993 | | | 7.51 | | | | 6.90 | | | | 5.24 | | | | 8.51 | | | | 6.90 | | | | 5.24 | | | | 1.83 | | | | 1.83 | |
| Administrator Class (EKSDX) | | 7-30-2010 | | | – | | | | – | | | | – | | | | 9.45 | | | | 7.87 | | | | 6.16 | | | | 1.00 | | | | 0.90 | |
| Institutional Class (EKSYX) | | 1-13-1997 | | | – | | | | – | | | | – | | | | 9.49 | | | | 8.09 | | | | 6.35 | | | | 0.75 | | | | 0.71 | |
| Diversified Income Builder Blended Index4 | | – | | | – | | | | – | | | | – | | | | 11.39 | | | | 8.34 | | | | 7.73 | | | | – | | | | – | |
ICE BofAML U.S. Cash Pay High Yield Index5 | | – | | | – | | | | – | | | | – | | | | 9.06 | | | | 6.35 | | | | 7.65 | | | | – | | | | – | |
| Russell 1000® Index6 | | – | | | – | | | | – | | | | – | | | | 18.54 | | | | 14.27 | | | | 7.55 | | | | – | | | | – | |
Figures quoted represent past performance, which is no guarantee of future results, and do not reflect taxes that a shareholder may pay on fund distributions or the redemption of fund shares. Investment return and principal value of an investment will fluctuate so that an investor’s shares, when redeemed, may be worth more or less than their original cost. Performance shown without sales charges would be lower if sales charges were reflected. Current performance may be lower or higher than the performance data quoted, which assumes the reinvestment of dividends and capital gains. Current month-end performance is available on the Fund’s website, wellsfargofunds.com.
Index returns do not include transaction costs associated with buying and selling securities, any mutual fund fees or expenses, or any taxes. It is not possible to invest directly in an index.
For Class A shares, the maximum front-end sales charge is 5.75%. For Class C shares, the maximum contingent deferred sales charge is 1.00%. Performance including a contingent deferred sales charge assumes the sales charge for the corresponding time period. Administrator Class and Institutional Class shares are sold without a front-end sales charge or contingent deferred sales charge.
Balanced funds may invest in stocks and bonds. Stock values fluctuate in response to the activities of individual companies and general market and economic conditions. Bond values fluctuate in response to the financial condition of individual issuers, general market and economic conditions, and changes in interest rates. Changes in market conditions and government policies may lead to periods of heightened volatility in the bond market and reduced liquidity for certain bonds held by the Fund. In general, when interest rates rise, bond values fall and investors may lose principal value. Interest-rate changes and their impact on the Fund and its share price can be sudden and unpredictable. Certain investment strategies tend to increase the total risk of an investment (relative to the broader market). The Fund is exposed to foreign investment risk, high-yield securities risk, and smaller-company securities risk. Consult the Fund’s prospectus for additional information on these and other risks.
Please see footnotes on page 7.
| | | | | | |
| Performance highlights (unaudited) | | Wells Fargo Diversified Income Builder Fund | | | 7 | |
|
| Growth of $10,000 investment as of September 30, 20177 |
|
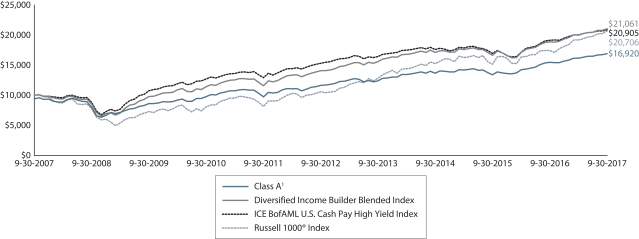 |
| 1 | Historical performance shown for the Administrator Class shares prior to their inception reflects the performance of the Institutional Class shares, adjusted to reflect the higher expenses applicable to the Administrator Class shares. Historical performance shown for all classes of the Fund prior to July 12, 2010 is based on the performance of the Fund’s predecessor, Evergreen Diversified Income Builder Fund. |
| 2 | Reflects the expense ratios as stated in the most recent prospectuses. The expense ratios shown are subject to change and may differ from the annualized expense ratios shown in the financial highlights of this report. |
| 3 | The manager has contractually committed through January 31, 2018, to waive fees and/or reimburse expenses to the extent necessary to cap the Fund’s Total Annual Fund Operating Expenses After Fee Waivers at the amounts shown. After this time, the cap may be increased or the commitment to maintain the cap may be terminated only with the approval of the Board of Trustees. Brokerage commissions, stamp duty fees, interest, taxes, acquired fund fees and expenses, and extraordinary expenses are excluded from the expense cap. Without this cap, the Fund’s returns would have been lower. The expense ratio paid by an investor is the net expense ratio or the Fund’s Total Annual Fund Operating Expenses After Fee Waivers, as stated in the prospectuses. |
| 4 | Source: Wells Fargo Funds Management, LLC. The Diversified Income Builder Blended Index is composed of the ICE BofAML U.S. Cash Pay High Yield Index (75%) and the Russell 1000® Index (25%). You cannot invest directly in an index. |
| 5 | The ICE BofAML U.S. Cash Pay High Yield Index (formerly known as BofA Merrill Lynch High Yield U.S. Corporates, Cash Pay Index) is an unmanaged market index that provides a broad-based performance measure of the non-investment grade U.S. domestic bond index. You cannot invest directly in an index. |
| 6 | The Russell 1000® Index measures the performance of the 1,000 largest companies in the Russell 3000® Index, which represents approximately 92% of the total market capitalization of the Russell 3000® Index. You cannot invest directly in an index. |
| 7 | The chart compares the performance of Class A shares for the most recent ten years with the Diversified Income Builder Blended Index, the ICE BofAML U.S. Cash Pay High Yield Index, and the Russell 1000® Index. The chart assumes a hypothetical investment of $10,000 in Class A shares and reflects all operating expenses and assumes the maximum initial sales charge of 5.75%. |
| 8 | The ten largest holdings, excluding cash and cash equivalents, are calculated based on the value of the investments divided by total net assets of the Fund. Holdings are subject to change and may have changed since the date specified. |
| 9 | Amounts are calculated based on the total long-term investments of the Fund. These amounts are subject to change and may have changed since the date specified. |
| * | This security was not held in the Fund at the end of the reporting period. |
| | | | |
| 8 | | Wells Fargo Diversified Income Builder Fund | | Performance highlights (unaudited) |
MANAGER’S DISCUSSION
Fund highlights
| ∎ | | The Fund underperformed its benchmark, the Diversified Income Builder Blended Index, for the 12-month period that ended September 30, 2017. |
| ∎ | | The Fund’s bond portfolio holdings slightly underperformed bonds in the index; the portfolio was weighted to above-average quality, and lower-quality issues outperformed the index as investors aggressively bid up prices of lower-quality bonds. |
| ∎ | | The Fund benefited from equity holdings in the information technology (IT), basic materials, and industrials sectors. The Fund benefited from one defense-related takeover in the industrials group. Detractors to performance were several energy issues and select health care and IT companies. |
High-yield bond yields declined as investors’ risk appetites increased.
In the bond market, once again fears of sharply higher interest rates proved overstated as the rate rise in the Treasury market was modest. To illustrate, the yield to maturity of representative Treasury bonds maturing in 10 years yielded 1.60% at the beginning of the period and had a yield at the end of the period of 2.33%. Investment-grade corporate bonds reflected this gently rising rate trend. Bond prices and yields move in opposite directions.
While intermediate Treasury yields slightly increased in the fiscal year, resulting in drops in prices, yields for high-yield bonds generally declined over the same period, resulting in price gains. Because of our somewhat longer portfolio duration, many of our holdings benefited from the drops in yield, allowing prices to rise somewhat. In the Fund’s bond portfolio, holdings in the basic materials and IT sectors were outperformers. Outperformers in the basic materials sector included Tronox Finance plc, Olin Corporation, and Rayonier Advanced Materials Incorporated. Contributing to performance in the IT sector were bonds of Micron Technology, Incorporated, and Seagate Technology plc. Detractors from bond performance included several industrial bonds, issues of energy companies, and specialty pharmaceuticals companies. Underperformers included bonds of cyclical Hertz Global Holdings, Incorporated*, and energy company Tennessee Gas Pipeline Company, LLC.
| | | | |
| Ten largest holdings (%) as of September 30, 20178 | |
Cheniere Corpus Christi Holdings LLC, 5.13%, 6-30-2027 | | | 3.40 | |
AMN Healthcare Incorporated, 5.13%, 10-1-2024 | | | 3.28 | |
Versum Materials Incorporated, 5.50%, 9-30-2024 | | | 1.97 | |
Tronox Finance plc, 5.75%, 10-1-2025 | | | 1.93 | |
Koppers Incorporated, 6.00%, 2-15-2025 | | | 1.90 | |
Lamb Weston Holdings Incorporated, 4.63%, 11-1-2024 | | | 1.82 | |
National Fuel Gas Company, 4.90%, 12-1-2021 | | | 1.71 | |
Microsoft Corporation | | | 1.65 | |
HD Supply Incorporated, 5.75%, 4-15-2024 | | | 1.65 | |
Iron Mountain Incorporated, 4.88%, 9-15-2027 | | | 1.64 | |
High-yield bonds, which are somewhat more sensitive to prospects of future economic growth than are investment-grade bonds, had declines in yield and small increases in prices, with the average yield to maturity declining from 6.25% at the beginning of the period to 5.43% at period-end. High-yield bonds benefited not only from their wide yield spread over comparable maturity Treasury bonds—from a difference of about 510 basis points (bps; 100 bps equal 1.00%) in excess of Treasury rates at the beginning of the period to 366 bps at period-end—but also from diminished concerns about the potential for sharp rises in Treasury rates and default rates. Investors’ increased risk appetites caused high-yield bond yields to decline in the face of modestly rising Treasury rates.
In the stock market, stocks advanced steadily throughout the period, with only small short-lived pullbacks before continuing to advance again. Many investors were concerned that stock prices would decline if interest rates went up or if economic growth remained very modest or that companies would not be able to maintain their historically high profit margins and profit growth. However, these concerns did not negatively affect the stock market’s advance, as investors focused more on rising profits than they did on the relatively small rise in interest rates. In addition, it became clear that the Federal Reserve was sensitive to market concerns about rising rates and it would attempt to adjust interest rates in a gradual manner, which was judged as unlikely to affect economic growth and stock valuations adversely.
Please see footnotes on page 7.
| | | | | | |
| Performance highlights (unaudited) | | Wells Fargo Diversified Income Builder Fund | | | 9 | |
|
| Portfolio allocation as of September 30, 20179 |
|
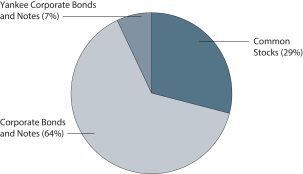 |
In the Fund’s equity portfolio, outperformers in the IT sector included Broadcom Limited, Amphenol Corporation, and Adobe Systems Incorporated. In the industrials sector, several defense-focused companies contributed to performance, such as Orbital ATK, Incorporated, which received a takeover bid from Northrop Grumman Corporation; Raytheon Company; and Huntington Ingalls Industries, Incorporated. Real estate companies contributing were Crown Castle International Corporation and Equinix, Incorporated. Equity detractors were energy companies Kinder Morgan, Incorporated, and Plains All American Pipeline, L.P. Also underperforming were health care pharmaceuticals company Allergan plc and IT company QUALCOMM Incorporated.
Our outlook remains one of cautious optimism.
While the pace of economic growth is modest compared with previous recoveries after recessions, the current expansion is one of the longest. We believe the intrinsic dynamism, creativity, and basic strengths of the U.S. economy should provide opportunities for the stock market over the next year. Slow but steady gains in employment should help stimulate demand for goods and services. Furthermore, the expansion of low-cost shale gas and petroleum liquids should continue to provide a boon to both businesses and consumers, improving the competitive positions of U.S. companies and offering some cost relief to consumers for utility and fuel costs.
We are somewhat cautious that the high-yield bond market might not offer the relative outperformance we have seen over the past few years. However, we believe that by concentrating our holdings in companies with above-average credit quality, our holdings may provide enough income above that of risk-free alternatives to compensate for their credit risk.
Please see footnotes on page 7.
| | | | |
| 10 | | Wells Fargo Diversified Income Builder Fund | | Fund expenses (unaudited) |
As a shareholder of the Fund, you incur two types of costs: (1) transaction costs, including sales charges (loads) on purchase payments and contingent deferred sales charges (if any) on redemptions and (2) ongoing costs, including management fees, distribution (12b-1) and/or shareholder servicing fees, and other Fund expenses. This example is intended to help you understand your ongoing costs (in dollars) of investing in the Fund and to compare these costs with the ongoing costs of investing in other mutual funds.
The example is based on an investment of $1,000 invested at the beginning of the six-month period and held for the entire period from April 1, 2017 to September 30, 2017.
Actual expenses
The “Actual” line of the table below provides information about actual account values and actual expenses. You may use the information in this line, together with the amount you invested, to estimate the expenses that you paid over the period. Simply divide your account value by $1,000 (for example, an $8,600 account value divided by $1,000 = 8.6), then multiply the result by the number in the “Actual” line under the heading entitled “Expenses paid during period” for your applicable class of shares to estimate the expenses you paid on your account during this period.
Hypothetical example for comparison purposes
The “Hypothetical” line of the table below provides information about hypothetical account values and hypothetical expenses based on the Fund’s actual expense ratio and an assumed rate of return of 5% per year before expenses, which is not the Fund’s actual return. The hypothetical account values and expenses may not be used to estimate the actual ending account balance or expenses you paid for the period. You may use this information to compare the ongoing costs of investing in the Fund and other funds. To do so, compare this 5% hypothetical example with the 5% hypothetical examples that appear in the shareholder reports of the other funds.
Please note that the expenses shown in the table are meant to highlight your ongoing costs only and do not reflect any transactional costs, such as sales charges (loads) and contingent deferred sales charges. Therefore, the “Hypothetical” line of the table is useful in comparing ongoing costs only and will not help you determine the relative total costs of owning different funds. In addition, if these transactional costs were included, your costs would have been higher.
| | | | | | | | | | | | | | | | |
| | | Beginning
account value
4-1-2017 | | | Ending
account value
9-30-2017 | | | Expenses
paid during
the period¹ | | | Annualized net
expense ratio | |
Class A | | | | | | | | | | | | | | | | |
Actual | | $ | 1,000.00 | | | $ | 1,046.25 | | | $ | 5.35 | | | | 1.04 | % |
Hypothetical (5% return before expenses) | | $ | 1,000.00 | | | $ | 1,019.84 | | | $ | 5.28 | | | | 1.04 | % |
Class C | | | | | | | | | | | | | | | | |
Actual | | $ | 1,000.00 | | | $ | 1,042.26 | | | $ | 9.18 | | | | 1.79 | % |
Hypothetical (5% return before expenses) | | $ | 1,000.00 | | | $ | 1,016.08 | | | $ | 9.07 | | | | 1.79 | % |
Administrator Class | | | | | | | | | | | | | | | | |
Actual | | $ | 1,000.00 | | | $ | 1,047.64 | | | $ | 4.62 | | | | 0.90 | % |
Hypothetical (5% return before expenses) | | $ | 1,000.00 | | | $ | 1,020.56 | | | $ | 4.56 | | | | 0.90 | % |
Institutional Class | | | | | | | | | | | | | | | | |
Actual | | $ | 1,000.00 | | | $ | 1,046.96 | | | $ | 3.64 | | | | 0.71 | % |
Hypothetical (5% return before expenses) | | $ | 1,000.00 | | | $ | 1,021.51 | | | $ | 3.60 | | | | 0.71 | % |
| 1 | Expenses paid is equal to the annualized net expense ratio of each class multiplied by the average account value over the period, multiplied by the number of days in the most recent fiscal half-year divided by the number of days in the fiscal year (to reflect the one-half-year period). |
| | | | | | |
| Portfolio of investments—September 30, 2017 | | Wells Fargo Diversified Income Builder Fund | | | 11 | |
| | | | | | | | | | | | | | | | |
| Security name | | | | | | | | Shares | | | Value | |
| | | | |
Common Stocks: 27.69% | | | | | | | | | | | | | | | | |
| | | | |
Consumer Discretionary: 0.42% | | | | | | | | | | | | | | | | |
| | | | |
| Household Durables: 0.42% | | | | | | | | | | | | | | | | |
Leggett & Platt Incorporated | | | | | | | | | | | 65,000 | | | $ | 3,102,450 | |
| | | | | | | | | | | | | | | | |
| | | | |
Consumer Staples: 0.52% | | | | | | | | | | | | | | | | |
| | | | |
| Food & Staples Retailing: 0.24% | | | | | | | | | | | | | | | | |
CVS Health Corporation | | | | | | | | | | | 15,000 | | | | 1,219,800 | |
Sysco Corporation | | | | | | | | | | | 10,000 | | | | 539,500 | |
| | | | |
| | | | | | | | | | | | | | | 1,759,300 | |
| | | | | | | | | | | | | | | | |
| | | | |
| Food Products: 0.28% | | | | | | | | | | | | | | | | |
ConAgra Foods Incorporated | | | | | | | | | | | 35,000 | | | | 1,180,900 | |
Lamb Weston Holdings Incorporated | | | | | | | | | | | 20,000 | | | | 937,800 | |
| | | | |
| | | | | | | | | | | | | | | 2,118,700 | |
| | | | | | | | | | | | | | | | |
| | | | |
Energy: 4.59% | | | | | | | | | | | | | | | | |
| | | | |
| Oil, Gas & Consumable Fuels: 4.59% | | | | | | | | | | | | | | | | |
Andeavor Logistics LP | | | | | | | | | | | 145,000 | | | | 7,258,700 | |
EOG Resources Incorporated | | | | | | | | | | | 10,000 | | | | 967,400 | |
EQT Corporation | | | | | | | | | | | 30,000 | | | | 1,957,200 | |
Kinder Morgan Incorporated | | | | | | | | | | | 460,000 | | | | 8,822,800 | |
ONEOK Incorporated | | | | | | | | | | | 60,000 | | | | 3,324,600 | |
Plains All American Pipeline LP | | | | | | | | | | | 330,000 | | | | 6,992,700 | |
The Williams Companies Incorporated | | | | | | | | | | | 160,000 | | | | 4,801,600 | |
| | | | |
| | | | | | | | | | | | | | | 34,125,000 | |
| | | | | | | | | | | | | | | | |
| | | | |
Health Care: 4.55% | | | | | | | | | | | | | | | | |
| | | | |
| Health Care Equipment & Supplies: 2.75% | | | | | | | | | | | | | | | | |
Abbott Laboratories | | | | | | | | | | | 110,000 | | | | 5,869,600 | |
Becton Dickinson & Company | | | | | | | | | | | 35,000 | | | | 6,858,250 | |
Teleflex Incorporated | | | | | | | | | | | 30,000 | | | | 7,259,100 | |
West Pharmaceutical Services Incorporated | | | | | | | | | | | 5,000 | | | | 481,300 | |
| | | | |
| | | | | | | | | | | | | | | 20,468,250 | |
| | | | | | | | | | | | | | | | |
| | | | |
| Life Sciences Tools & Services: 1.25% | | | | | | | | | | | | | | | | |
Thermo Fisher Scientific Incorporated | | | | | | | | | | | 30,000 | | | | 5,676,000 | |
Waters Corporation † | | | | | | | | | | | 20,000 | | | | 3,590,400 | |
| | | | |
| | | | | | | | | | | | | | | 9,266,400 | |
| | | | | | | | | | | | | | | | |
| | | | |
| Pharmaceuticals: 0.55% | | | | | | | | | | | | | | | | |
Allergan plc | | | | | | | | | | | 20,000 | | | | 4,099,000 | |
| | | | | | | | | | | | | | | | |
| | | | |
Industrials: 3.59% | | | | | | | | | | | | | | | | |
| | | | |
| Aerospace & Defense: 2.20% | | | | | | | | | | | | | | | | |
Curtiss-Wright Corporation | | | | | | | | | | | 40,000 | | | | 4,181,600 | |
Huntington Ingalls Industries Incorporated | | | | | | | | | | | 20,000 | | | | 4,528,800 | |
The accompanying notes are an integral part of these financial statements.
| | | | |
| 12 | | Wells Fargo Diversified Income Builder Fund | | Portfolio of investments—September 30, 2017 |
| | | | | | | | | | | | | | | | |
| Security name | | | | | | | | Shares | | | Value | |
| | | | |
| Aerospace & Defense (continued) | | | | | | | | | | | | | | | | |
Lockheed Martin Corporation | | | | | | | | | | | 1,000 | | | $ | 310,290 | |
Orbital ATK Incorporated | | | | | | | | | | | 20,000 | | | | 2,663,200 | |
Raytheon Company | | | | | | | | | | | 25,000 | | | | 4,664,500 | |
| | | | |
| | | | | | | | | | | | | | | 16,348,390 | |
| | | | | | | | | | | | | | | | |
| | | | |
| Building Products: 0.13% | | | | | | | | | | | | | | | | |
Apogee Enterprises Incorporated | | | | | | | | | | | 20,000 | | | | 965,200 | |
| | | | | | | | | | | | | | | | |
| | | | |
| Electrical Equipment: 0.26% | | | | | | | | | | | | | | | | |
Eaton Corporation PLC | | | | | | | | | | | 25,000 | | | | 1,919,750 | |
| | | | | | | | | | | | | | | | |
| | | | |
| Industrial Conglomerates: 0.57% | | | | | | | | | | | | | | | | |
Honeywell International Incorporated | | | | | | | | | | | 30,000 | | | | 4,252,200 | |
| | | | | | | | | | | | | | | | |
| | | | |
| Machinery: 0.43% | | | | | | | | | | | | | | | | |
Cummins Incorporated | | | | | | | | | | | 2,000 | | | | 336,060 | |
John Bean Technologies Corporation | | | | | | | | | | | 20,000 | | | | 2,022,000 | |
Oshkosh Corporation | | | | | | | | | | | 10,000 | | | | 825,400 | |
| | | | |
| | | | | | | | | | | | | | | 3,183,460 | |
| | | | | | | | | | | | | | | | |
| | | | |
Information Technology: 10.30% | | | | | | | | | | | | | | | | |
| | | | |
| Electronic Equipment, Instruments & Components: 1.75% | | | | | | | | | | | | | | | | |
Amphenol Corporation Class A | | | | | | | | | | | 70,000 | | | | 5,924,800 | |
Corning Incorporated | | | | | | | | | | | 165,000 | | | | 4,936,800 | |
FLIR Systems Incorporated | | | | | | | | | | | 55,000 | | | | 2,140,050 | |
| | | | |
| | | | | | | | | | | | | | | 13,001,650 | |
| | | | | | | | | | | | | | | | |
| | | | |
| Internet Software & Services: 0.92% | | | | | | | | | | | | | | | | |
Alphabet Incorporated Class A † | | | | | | | | | | | 7,000 | | | | 6,816,040 | |
| | | | | | | | | | | | | | | | |
| | | | |
| IT Services: 0.88% | | | | | | | | | | | | | | | | |
Leidos Holdings Incorporated | | | | | | | | | | | 110,000 | | | | 6,514,200 | |
| | | | | | | | | | | | | | | | |
| | | | |
| Semiconductors & Semiconductor Equipment: 3.70% | | | | | | | | | | | | | | | | |
Broadcom Limited | | | | | | | | | | | 45,000 | | | | 10,914,300 | |
Cypress Semiconductor Corporation « | | | | | | | | | | | 100,000 | | | | 1,502,000 | |
Microsemi Corporation † | | | | | | | | | | | 80,000 | | | | 4,118,400 | |
QUALCOMM Incorporated | | | | | | | | | | | 20,000 | | | | 1,036,800 | |
Texas Instruments Incorporated | | | | | | | | | | | 35,000 | | | | 3,137,400 | |
Versum Materials Incorporated | | | | | | | | | | | 30,000 | | | | 1,164,600 | |
Xilinx Incorporated | | | | | | | | | | | 80,000 | | | | 5,666,400 | |
| | | | |
| | | | | | | | | | | | | | | 27,539,900 | |
| | | | | | | | | | | | | | | | |
| | | | |
| Software: 2.82% | | | | | | | | | | | | | | | | |
Adobe Systems Incorporated † | | | | | | | | | | | 45,000 | | | | 6,713,100 | |
Microsoft Corporation | | | | | | | | | | | 165,000 | | | | 12,290,850 | |
Synopsys Incorporated † | | | | | | | | | | | 25,000 | | | | 2,013,250 | |
| | | | |
| | | | | | | | | | | | | | | 21,017,200 | |
| | | | | | | | | | | | | | | | |
The accompanying notes are an integral part of these financial statements.
| | | | | | |
| Portfolio of investments—September 30, 2017 | | Wells Fargo Diversified Income Builder Fund | | | 13 | |
| | | | | | | | | | | | | | | | |
| Security name | | | | | | | | Shares | | | Value | |
| | | | |
| Technology Hardware, Storage & Peripherals: 0.23% | | | | | | | | | | | | | | | | |
Western Digital Corporation | | | | | | | | | | | 20,000 | | | $ | 1,728,000 | |
| | | | | | | | | | | | | | | | |
| | | | |
Materials: 2.07% | | | | | | | | | | | | | | | | |
| | | | |
| Chemicals: 1.84% | | | | | | | | | | | | | | | | |
Ashland Global Holdings Incorporated | | | | | | | | | | | 30,000 | | | | 1,961,700 | |
Celanese Corporation Series A | | | | | | | | | | | 10,000 | | | | 1,042,700 | |
DowDupont Incorporated | | | | | | | | | | | 40,000 | | | | 2,769,200 | |
LyondellBasell Industries NV Class A | | | | | | | | | | | 80,000 | | | | 7,924,000 | |
| | | | |
| | | | | | | | | | | | | | | 13,697,600 | |
| | | | | | | | | | | | | | | | |
| | | | |
| Containers & Packaging: 0.23% | | | | | | | | | | | | | | | | |
Sealed Air Corporation | | | | | | | | | | | 40,000 | | | | 1,708,800 | |
| | | | | | | | | | | | | | | | |
| | | | |
Real Estate: 0.75% | | | | | | | | | | | | | | | | |
| | | | |
| Equity REITs: 0.75% | | | | | | | | | | | | | | | | |
Crown Castle International Corporation | | | | | | | | | | | 10,000 | | | | 999,800 | |
Equinix Incorporated | | | | | | | | | | | 4,000 | | | | 1,785,200 | |
Sabra Health Care REIT Incorporated | | | | | | | | | | | 30,000 | | | | 658,200 | |
Saul Centers Incorporated | | | | | | | | | | | 35,000 | | | | 2,166,850 | |
| | | | |
| | | | | | | | | | | | | | | 5,610,050 | |
| | | | | | | | | | | | | | | | |
| | | | |
Utilities: 0.90% | | | | | | | | | | | | | | | | |
| | | | |
| Gas Utilities: 0.90% | | | | | | | | | | | | | | | | |
Atmos Energy Corporation | | | | | | | | | | | 80,000 | | | | 6,707,200 | |
| | | | | | | | | | | | | | | | |
| | | | |
Total Common Stocks (Cost $181,721,700) | | | | | | | | | | | | | | | 205,948,740 | |
| | | | | | | | | | | | | | | | |
| | | | |
| | | Interest rate | | | Maturity date | | | Principal | | | | |
| Corporate Bonds and Notes: 62.52% | | | | | | | | | | | | | | | | |
| | | | |
Consumer Discretionary: 5.47% | | | | | | | | | | | | | | | | |
| | | | |
| Auto Components: 1.56% | | | | | | | | | | | | | | | | |
Dana Holding Corporation | | | 5.50 | % | | | 12-15-2024 | | | $ | 3,925,000 | | | | 4,121,250 | |
Tenneco Incorporated | | | 5.00 | | | | 7-15-2026 | | | | 7,250,000 | | | | 7,431,250 | |
| | | | |
| | | | | | | | | | | | | | | 11,552,500 | |
| | | | | | | | | | | | | | | | |
| | | | |
| Hotels, Restaurants & Leisure: 0.65% | | | | | | | | | | | | | | | | |
Speedway Motorsports Incorporated | | | 5.13 | | | | 2-1-2023 | | | | 4,700,000 | | | | 4,852,750 | |
| | | | | | | | | | | | | | | | |
| | | | |
| Media: 1.14% | | | | | | | | | | | | | | | | |
McGraw-Hill Global Education Holdings LLC «144A | | | 7.88 | | | | 5-15-2024 | | | | 8,598,000 | | | | 8,479,778 | |
| | | | | | | | | | | | | | | | |
| | | | |
| Specialty Retail: 2.12% | | | | | | | | | | | | | | | | |
Group 1 Automotive Incorporated | | | 5.00 | | | | 6-1-2022 | | | | 4,453,000 | | | | 4,614,421 | |
Penske Auto Group Incorporated | | | 5.75 | | | | 10-1-2022 | | | | 10,813,000 | | | | 11,165,504 | |
| | | | |
| | | | | | | | | | | | | | | 15,779,925 | |
| | | | | | | | | | | | | | | | |
The accompanying notes are an integral part of these financial statements.
| | | | |
| 14 | | Wells Fargo Diversified Income Builder Fund | | Portfolio of investments—September 30, 2017 |
| | | | | | | | | | | | | | | | |
| | | | |
| Security name | | Interest rate | | | Maturity date | | | Principal | | | Value | |
| | | | |
Consumer Staples: 2.09% | | | | | | | | | | | | | | | | |
| | | | |
| Food Products: 2.09% | | | | | | | | | | | | | | | | |
Lamb Weston Holdings Incorporated 144A | | | 4.63 | % | | | 11-1-2024 | | | $ | 13,000,000 | | | $ | 13,552,500 | |
Post Holdings Incorporated 144A | | | 5.00 | | | | 8-15-2026 | | | | 2,000,000 | | | | 1,996,250 | |
| | | | |
| | | | | | | | | | | | | | | 15,548,750 | |
| | | | | | | | | | | | | | | | |
| | | | |
Energy: 5.21% | | | | | | | | | | | | | | | | |
| | | | |
| Oil, Gas & Consumable Fuels: 5.21% | | | | | | | | | | | | | | | | |
Cheniere Corpus Christi Holdings LLC 144A | | | 5.13 | | | | 6-30-2027 | | | | 24,500,000 | | | | 25,296,250 | |
Kinder Morgan Energy Partners LP | | | 4.30 | | | | 6-1-2025 | | | | 3,500,000 | | | | 3,665,082 | |
ONEOK Incorporated | | | 4.25 | | | | 2-1-2022 | | | | 3,737,000 | | | | 3,883,905 | |
Plains All American Pipeline LP | | | 3.85 | | | | 10-15-2023 | | | | 2,345,000 | | | | 2,353,170 | |
Tennessee Gas Pipeline Company | | | 7.00 | | | | 3-15-2027 | | | | 3,000,000 | | | | 3,551,587 | |
| | | | |
| | | | | | | | | | | | | | | 38,749,994 | |
| | | | | | | | | | | | | | | | |
| | | | |
Health Care: 9.39% | | | | | | | | | | | | | | | | |
| | | | |
| Health Care Equipment & Supplies: 0.98% | | | | | | | | | | | | | | | | |
Halyard Health Incorporated | | | 6.25 | | | | 10-15-2022 | | | | 1,000,000 | | | | 1,043,750 | |
Teleflex Incorporated | | | 4.88 | | | | 6-1-2026 | | | | 6,000,000 | | | | 6,225,000 | |
| | | | |
| | | | | | | | | | | | | | | 7,268,750 | |
| | | | | | | | | | | | | | | | |
| | | | |
| Health Care Providers & Services: 7.29% | | | | | | | | | | | | | | | | |
AMN Healthcare Incorporated 144A | | | 5.13 | | | | 10-1-2024 | | | | 23,535,000 | | | | 24,388,144 | |
DaVita HealthCare Partners Incorporated | | | 5.13 | | | | 7-15-2024 | | | | 3,000,000 | | | | 2,986,875 | |
HCA Incorporated | | | 5.25 | | | | 6-15-2026 | | | | 7,000,000 | | | | 7,542,500 | |
HCA Incorporated | | | 5.38 | | | | 2-1-2025 | | | | 11,000,000 | | | | 11,591,250 | |
HealthSouth Corporation | | | 5.13 | | | | 3-15-2023 | | | | 2,000,000 | | | | 2,066,900 | |
West Street Merger Sub Incorporated 144A | | | 6.38 | | | | 9-1-2025 | | | | 5,700,000 | | | | 5,671,500 | |
| | | | |
| | | | | | | | | | | | | | | 54,247,169 | |
| | | | | | | | | | | | | | | | |
| | | | |
| Health Care Technology: 1.12% | | | | | | | | | | | | | | | | |
Quintiles IMS Holdings Incorporated 144A | | | 4.88 | | | | 5-15-2023 | | | | 7,000,000 | | | | 7,280,000 | |
Quintiles IMS Holdings Incorporated 144A | | | 5.00 | | | | 10-15-2026 | | | | 1,000,000 | | | | 1,060,000 | |
| | | | |
| | | | | | | | | | | | | | | 8,340,000 | |
| | | | | | | | | | | | | | | | |
| | | | |
Industrials: 11.61% | | | | | | | | | | | | | | | | |
| | | | |
| Aerospace & Defense: 5.64% | | | | | | | | | | | | | | | | |
Huntington Ingalls Industries Incorporated 144A | | | 5.00 | | | | 11-15-2025 | | | | 8,000,000 | | | | 8,640,000 | |
Moog Incorporated 144A | | | 5.25 | | | | 12-1-2022 | | | | 5,500,000 | | | | 5,752,945 | |
Orbital ATK Incorporated | | | 5.50 | | | | 10-1-2023 | | | | 10,640,000 | | | | 11,371,500 | |
TransDigm Group Incorporated | | | 6.38 | | | | 6-15-2026 | | | | 11,800,000 | | | | 12,087,684 | |
TransDigm Group Incorporated | | | 6.50 | | | | 5-15-2025 | | | | 4,000,000 | | | | 4,120,000 | |
| | | | |
| | | | | | | | | | | | | | | 41,972,129 | |
| | | | | | | | | | | | | | | | |
| | | | |
| Commercial Services & Supplies: 0.70% | | | | | | | | | | | | | | | | |
Acco Brands Corporation 144A | | | 5.25 | | | | 12-15-2024 | | | | 5,000,000 | | | | 5,187,500 | |
| | | | | | | | | | | | | | | | |
| | | | |
| Construction & Engineering: 0.28% | | | | | | | | | | | | | | | | |
Aecom Company | | | 5.13 | | | | 3-15-2027 | | | | 2,000,000 | | | | 2,067,500 | |
| | | | | | | | | | | | | | | | |
The accompanying notes are an integral part of these financial statements.
| | | | | | |
| Portfolio of investments—September 30, 2017 | | Wells Fargo Diversified Income Builder Fund | | | 15 | |
| | | | | | | | | | | | | | | | |
| | | | |
| Security name | | Interest rate | | | Maturity date | | | Principal | | | Value | |
| | | | |
| Machinery: 2.07% | | | | | | | | | | | | | | | | |
Actuant Corporation | | | 5.63 | % | | | 6-15-2022 | | | $ | 1,165,000 | | | $ | 1,195,581 | |
Oshkosh Corporation | | | 5.38 | | | | 3-1-2025 | | | | 3,675,000 | | | | 3,895,500 | |
SPX FLOW Incorporated 144A | | | 5.63 | | | | 8-15-2024 | | | | 4,500,000 | | | | 4,713,750 | |
SPX FLOW Incorporated 144A | | | 5.88 | | | | 8-15-2026 | | | | 5,328,000 | | | | 5,621,040 | |
| | | | |
| | | | | | | | | | | | | | | 15,425,871 | |
| | | | | | | | | | | | | | | | |
| | | | |
| Trading Companies & Distributors: 2.92% | | | | | | | | | | | | | | | | |
HD Supply Incorporated 144A | | | 5.75 | | | | 4-15-2024 | | | | 11,450,000 | | | | 12,251,500 | |
Wesco Distribution Incorporated | | | 5.38 | | | | 6-15-2024 | | | | 8,974,000 | | | | 9,467,570 | |
| | | | |
| | | | | | | | | | | | | | | 21,719,070 | |
| | | | | | | | | | | | | | | | |
| | | | |
Information Technology: 10.96% | | | | | | | | | | | | | | | | |
| | | | |
| Communications Equipment: 2.21% | | | | | | | | | | | | | | | | |
CommScope Incorporated 144A | | | 5.50 | | | | 6-15-2024 | | | | 9,479,000 | | | | 9,917,404 | |
CommScope Technologies Finance LLC 144A | | | 5.00 | | | | 3-15-2027 | | | | 6,500,000 | | | | 6,516,250 | |
| | | | |
| | | | | | | | | | | | | | | 16,433,654 | |
| | | | | | | | | | | | | | | | |
| | | | |
| Electronic Equipment, Instruments & Components: 1.82% | | | | | | | | | | | | | | | | |
Anixter International Incorporated | | | 5.13 | | | | 10-1-2021 | | | | 4,000,000 | | | | 4,300,000 | |
Belden Incorporated 144A | | | 5.25 | | | | 7-15-2024 | | | | 3,485,000 | | | | 3,633,113 | |
TTM Technologies Incorporated 144A | | | 5.63 | | | | 10-1-2025 | | | | 5,495,000 | | | | 5,560,253 | |
| | | | |
| | | | | | | | | | | | | | | 13,493,366 | |
| | | | | | | | | | | | | | | | |
| | | | |
| IT Services: 0.28% | | | | | | | | | | | | | | | | |
Gartner Incorporated 144A | | | 5.13 | | | | 4-1-2025 | | | | 2,000,000 | | | | 2,110,000 | |
| | | | | | | | | | | | | | | | |
| | | | |
| Semiconductors & Semiconductor Equipment: 4.03% | | | | | | | | | | | | | | | | |
Micron Technology Incorporated 144A | | | 5.25 | | | | 8-1-2023 | | | | 3,700,000 | | | | 3,859,100 | |
Micron Technology Incorporated 144A | | | 5.25 | | | | 1-15-2024 | | | | 3,000,000 | | | | 3,164,730 | |
Micron Technology Incorporated | | | 5.50 | | | | 2-1-2025 | | | | 6,750,000 | | | | 7,197,188 | |
Micron Technology Incorporated | | | 7.50 | | | | 9-15-2023 | | | | 1,000,000 | | | | 1,111,250 | |
Versum Materials Incorporated 144A | | | 5.50 | | | | 9-30-2024 | | | | 13,834,000 | | | | 14,664,040 | |
| | | | |
| | | | | | | | | | | | | | | 29,996,308 | |
| | | | | | | | | | | | | | | | |
| | | | |
| Software: 1.23% | | | | | | | | | | | | | | | | |
Nuance Communications Company | | | 6.00 | | | | 7-1-2024 | | | | 2,000,000 | | | | 2,165,600 | |
Symantec Corporation 144A | | | 5.00 | | | | 4-15-2025 | | | | 6,705,000 | | | | 7,010,949 | |
| | | | |
| | | | | | | | | | | | | | | 9,176,549 | |
| | | | | | | | | | | | | | | | |
| | | | |
| Technology Hardware, Storage & Peripherals: 1.39% | | | | | | | | | | | | | | | | |
Diebold Incorporated | | | 8.50 | | | | 4-15-2024 | | | | 8,500,000 | | | | 9,214,170 | |
Western Digital Corporation 144A | | | 7.38 | | | | 4-1-2023 | | | | 1,000,000 | | | | 1,095,500 | |
| | | | |
| | | | | | | | | | | | | | | 10,309,670 | |
| | | | | | | | | | | | | | | | |
| | | | |
Materials: 11.82% | | | | | | | | | | | | | | | | |
| | | | |
| Chemicals: 9.47% | | | | | | | | | | | | | | | | |
A. Schulman Incorporated | | | 6.88 | | | | 6-1-2023 | | | | 11,500,000 | | | | 11,931,250 | |
Koppers Incorporated 144A | | | 6.00 | | | | 2-15-2025 | | | | 13,150,000 | | | | 14,136,250 | |
The accompanying notes are an integral part of these financial statements.
| | | | |
| 16 | | Wells Fargo Diversified Income Builder Fund | | Portfolio of investments—September 30, 2017 |
| | | | | | | | | | | | | | | | |
| | | | |
| Security name | | Interest rate | | | Maturity date | | | Principal | | | Value | |
| | | | |
| Chemicals (continued) | | | | | | | | | | | | | | | | |
Olin Corporation | | | 5.13 | % | | | 9-15-2027 | | | $ | 5,000,000 | | | $ | 5,225,000 | |
Olin Corporation | | | 5.50 | | | | 8-15-2022 | | | | 8,500,000 | | | | 9,158,750 | |
Rayonier Advanced Materials Products Incorporated 144A | | | 5.50 | | | | 6-1-2024 | | | | 8,945,000 | | | | 8,665,469 | |
Scotts Miracle-Gro Company | | | 5.25 | | | | 12-15-2026 | | | | 4,000,000 | | | | 4,220,000 | |
Scotts Miracle-Gro Company | | | 6.00 | | | | 10-15-2023 | | | | 6,000,000 | | | | 6,405,000 | |
Valvoline Incorporated 144A | | | 4.38 | | | | 8-15-2025 | | | | 10,000,000 | | | | 10,176,000 | |
Valvoline Incorporated 144A | | | 5.50 | | | | 7-15-2024 | | | | 500,000 | | | | 533,750 | |
| | | | |
| | | | | | | | | | | | | | | 70,451,469 | |
| | | | | | | | | | | | | | | | |
| | | | |
| Containers & Packaging: 2.05% | | | | | | | | | | | | | | | | |
Ball Corporation | | | 5.00 | | | | 3-15-2022 | | | | 2,500,000 | | | | 2,706,250 | |
Berry Plastics Corporation | | | 5.13 | | | | 7-15-2023 | | | | 2,500,000 | | | | 2,612,500 | |
Berry Plastics Corporation | | | 6.00 | | | | 10-15-2022 | | | | 4,100,000 | | | | 4,351,125 | |
Sealed Air Corporation 144A | | | 5.25 | | | | 4-1-2023 | | | | 4,650,000 | | | | 5,010,375 | |
Sealed Air Corporation 144A | | | 5.50 | | | | 9-15-2025 | | | | 500,000 | | | | 550,000 | |
| | | | |
| | | | | | | | | | | | | | | 15,230,250 | |
| | | | | | | | | | | | | | | | |
| | | | |
| Metals & Mining: 0.30% | | | | | | | | | | | | | | | | |
Commercial Metals Company | | | 4.88 | | | | 5-15-2023 | | | | 2,150,000 | | | | 2,246,750 | |
| | | | | | | | | | | | | | | | |
| | | | |
Real Estate: 4.26% | | | | | | | | | | | | | | | | |
| | | | |
| Equity REITs: 4.26% | | | | | | | | | | | | | | | | |
Equinix Incorporated | | | 5.38 | | | | 5-15-2027 | | | | 5,000,000 | | | | 5,437,500 | |
Equinix Incorporated | | | 5.75 | | | | 1-1-2025 | | | | 1,500,000 | | | | 1,614,375 | |
Iron Mountain Incorporated 144A | | | 4.88 | | | | 9-15-2027 | | | | 12,000,000 | | | | 12,225,000 | |
Iron Mountain Incorporated 144A | | | 5.38 | | | | 6-1-2026 | | | | 6,500,000 | | | | 6,808,750 | |
Iron Mountain Incorporated | | | 5.75 | | | | 8-15-2024 | | | | 3,927,000 | | | | 4,049,719 | |
Sabra Health Care REIT Incorporated | | | 5.38 | | | | 6-1-2023 | | | | 1,500,000 | | | | 1,548,750 | |
| | | | |
| | | | | | | | | | | | | | | 31,684,094 | |
| | | | | | | | | | | | | | | | |
| | | | |
Utilities: 1.71% | | | | | | | | | | | | | | | | |
| | | | |
| Gas Utilities: 1.71% | | | | | | | | | | | | | | | | |
National Fuel Gas Company | | | 4.90 | | | | 12-1-2021 | | | | 12,000,000 | | | | 12,732,449 | |
| | | | | | | | | | | | | | | | |
| | | | |
Total Corporate Bonds and Notes (Cost $449,915,163) | | | | | | | | | | | | | | | 465,056,245 | |
| | | | | | | | | | | | | | | | |
| | | | |
Yankee Corporate Bonds and Notes: 6.97% | | | | | | | | | | | | | | | | |
| | | | |
Financials: 1.93% | | | | | | | | | | | | | | | | |
| | | | |
| Diversified Financial Services: 1.93% | | | | | | | | | | | | | | | | |
Tronox Finance plc 144A | | | 5.75 | | | | 10-1-2025 | | | | 14,000,000 | | | | 14,350,000 | |
| | | | | | | | | | | | | | | | |
| | | | |
Health Care: 1.37% | | | | | | | | | | | | | | | | |
| | | | |
| Pharmaceuticals: 1.37% | | | | | | | | | | | | | | | | |
Mallinckrodt plc 144A | | | 5.50 | | | | 4-15-2025 | | | | 5,655,000 | | | | 5,089,500 | |
Mallinckrodt plc «144A | | | 5.63 | | | | 10-15-2023 | | | | 5,500,000 | | | | 5,121,874 | |
| | | | |
| | | | | | | | | | | | | | | 10,211,374 | |
| | | | | | | | | | | | | | | | |
The accompanying notes are an integral part of these financial statements.
| | | | | | |
| Portfolio of investments—September 30, 2017 | | Wells Fargo Diversified Income Builder Fund | | | 17 | |
| | | | | | | | | | | | | | | | |
| | | | |
| Security name | | Interest rate | | | Maturity date | | | Principal | | | Value | |
| | | | |
Industrials: 1.50% | | | | | | | | | | | | | | | | |
| | | | |
| Electrical Equipment: 1.50% | | | | | | | | | | | | | | | | |
Sensata Technologies BV 144A | | | 4.88 | % | | | 10-15-2023 | | | $ | 6,700,000 | | | $ | 7,043,375 | |
Sensata Technologies BV 144A | | | 5.63 | | | | 11-1-2024 | | | | 3,750,000 | | | | 4,129,688 | |
| | | | |
| | | | | | | | | | | | | | | 11,173,063 | |
| | | | | | | | | | | | | | | | |
| | | | |
Information Technology: 2.17% | | | | | | | | | | | | | | | | |
| | | | |
| Technology Hardware, Storage & Peripherals: 2.17% | | | | | | | | | | | | | | | | |
Seagate HDD | | | 4.75 | | | | 6-1-2023 | | | | 8,500,000 | | | | 8,615,090 | |
Seagate HDD | | | 4.88 | | | | 6-1-2027 | | | | 8,000,000 | | | | 7,540,295 | |
| | | | |
| | | | | | | | | | | | | | | 16,155,385 | |
| | | | | | | | | | | | | | | | |
| | | | |
Total Yankee Corporate Bonds and Notes (Cost $51,039,486) | | | | | | | | | | | | | | | 51,889,822 | |
| | | | | | | | | | | | | | | | |
| | | | |
| | | Yield | | | | | | Shares | | | | |
| Short-Term Investments: 3.01% | |
| | | | |
| Investment Companies: 3.01% | | | | | | | | | | | | | | | | |
Securities Lending Cash Investment LLC (l)(r)(u) | | | 1.25 | | | | | | | | 11,166,995 | | | | 11,168,112 | |
Wells Fargo Government Money Market Fund Select Class (l)(u) | | | 0.92 | | | | | | | | 11,243,453 | | | | 11,243,453 | |
| | | | |
Total Short-Term Investments (Cost $22,410,956) | | | | | | | | | | | | | | | 22,411,565 | |
| | | | | | | | | | | | | | | | |
| | | | | | | | |
| Total investments in securities (Cost $705,087,305) | | | 100.19 | % | | | 745,306,372 | |
Other assets and liabilities, net | | | (0.19 | ) | | | (1,428,962 | ) |
| | | | | | | | |
| Total net assets | | | 100.00 | % | | $ | 743,877,410 | |
| | | | | | | | |
| † | Non-income-earning security |
| « | All or a portion of this security is on loan. |
| 144A | The security may be resold in transactions exempt from registration, normally to qualified institutional buyers, pursuant to Rule 144A under the Securities Act of 1933. |
| (l) | The issuer of the security is an affiliated person of the Fund as defined in the Investment Company Act of 1940. |
| (r) | The investment is a non-registered investment company purchased with cash collateral received from securities on loan. |
| (u) | The rate represents the 7-day annualized yield at period end. |
Investments in Affiliates
An affiliated investment is an investment in which the Fund owns at least 5% of the outstanding voting shares of the issuer or as a result of other relationships, such as the Fund and the issuer having the same investment manager. Transactions with issuers that were either affiliated persons of the Fund at the beginning of the period or the end of the period were as follows:
| | | | | | | | | | | | | | | | | | | | | | | | | | | | | | | | | | | | |
| | | Shares,
beginning of
period | | | Shares
purchased | | | Shares
sold | | | Shares,
end of
period | | | Net
realized
gains
(losses) | | | Net change
in
unrealized
gains
(losses) | | | Income
from
affiliated
securities | | | Value,
end
of period | | | % of
net
assets | |
Short-Term Investments | | | | | | | | | | | | | | | | | | | | | | | | | | | | | | | | | | | | |
| | | | | | | | | |
Investment companies | | | | | | | | | | | | | | | | | | | | | | | | | | | | | | | | | | | | |
Securities Lending Cash Investment LLC | | | 6,023,805 | | | | 125,194,270 | | | | 120,051,080 | | | | 11,166,995 | | | $ | 5 | | | $ | 609 | | | $ | 115,002 | | | $ | 11,168,112 | | | | | |
Wells Fargo Government Money Market Fund Select Class | | | 3,232,384 | | | | 239,886,658 | | | | 231,875,589 | | | | 11,243,453 | | | | 0 | | | | 0 | | | | 63,627 | | | | 11,243,453 | | | | | |
| | | | | | | | | | | | | | | | | | | | | | | | | | | | | | | | | | | | |
| | | | | | | | | | | | | | | | | | $ | 5 | | | $ | 609 | | | $ | 178,629 | | | $ | 22,411,565 | | | | 3.01 | % |
| | | | | | | | | | | | | | | | | | | | | | | | | | | | | | | | | | | | |
The accompanying notes are an integral part of these financial statements.
| | | | |
| 18 | | Wells Fargo Diversified Income Builder Fund | | Statement of assets and liabilities—September 30, 2017 |
| | | | |
| | | | |
| |
Assets | | | | |
Investments in unaffiliated securities (including $10,855,356 of securities loaned), at value (cost $682,676,349) | | $ | 722,894,807 | |
Investments in affiliated securities, at value (cost $22,410,956) | | | 22,411,565 | |
Receivable for Fund shares sold | | | 3,837,457 | |
Receivable for dividends and interest | | | 8,154,510 | |
Receivable for securities lending income | | | 5,591 | |
Prepaid expenses and other assets | | | 142,944 | |
| | | | |
Total assets | | | 757,446,874 | |
| | | | |
| |
Liabilities | | | | |
Dividends payable | | | 252,894 | |
Payable for Fund shares redeemed | | | 1,510,757 | |
Payable upon receipt of securities loaned | | | 11,167,498 | |
Management fee payable | | | 333,941 | |
Administration fees payable | | | 106,479 | |
Distribution fees payable | | | 104,307 | |
Accrued expenses and other liabilities | | | 93,588 | |
| | | | |
Total liabilities | | | 13,569,464 | |
| | | | |
Total net assets | | $ | 743,877,410 | |
| | | | |
| |
NET ASSETS CONSIST OF | | | | |
Paid-in capital | | $ | 691,847,883 | |
Overdistributed net investment income | | | (265,880 | ) |
Accumulated net realized gains on investments | | | 12,076,340 | |
Net unrealized gains on investments | | | 40,219,067 | |
| | | | |
Total net assets | | $ | 743,877,410 | |
| | | | |
| |
COMPUTATION OF NET ASSET VALUE AND OFFERING PRICE PER SHARE | | | | |
Net assets – Class A | | $ | 220,976,546 | |
Shares outstanding – Class A1 | | | 34,411,885 | |
Net asset value per share – Class A | | | $6.42 | |
Maximum offering price per share – Class A2 | | | $6.81 | |
Net assets – Class C | | $ | 165,512,627 | |
Shares outstanding – Class C1 | | | 25,715,914 | |
Net asset value per share – Class C | | | $6.44 | |
Net assets – Administrator Class | | $ | 41,974,804 | |
Shares outstanding – Administrator Class1 | | | 6,674,018 | |
Net asset value per share – Administrator Class | | | $6.29 | |
Net assets – Institutional Class | | $ | 315,413,433 | |
Shares outstanding – Institutional Class1 | | | 50,198,270 | |
Net asset value per share – Institutional Class | | | $6.28 | |
| 1 | The Fund has an unlimited number of authorized shares. |
| 2 | Maximum offering price is computed as 100/94.25 of net asset value. On investments of $50,000 or more, the offering price is reduced. |
The accompanying notes are an integral part of these financial statements.
| | | | | | |
| Statement of operations—year ended September 30, 2017 | | Wells Fargo Diversified Income Builder Fund | | | 19 | |
| | | | |
| | | | |
| |
Investment income | | | | |
Interest | | $ | 22,716,293 | |
Dividends | | | 3,248,794 | |
Income from affiliated securities | | | 178,629 | |
| | | | |
Total investment income | | | 26,143,716 | |
| | | | |
| |
Expenses | | | | |
Management fee | | | 3,290,320 | |
Administration fees | | | | |
Class A | | | 392,926 | |
Class B | | | 444 | 1 |
Class C | | | 308,469 | |
Administrator Class | | | 59,916 | |
Institutional Class | | | 289,669 | |
Shareholder servicing fees | | | | |
Class A | | | 467,769 | |
Class B | | | 528 | 1 |
Class C | | | 367,225 | |
Administrator Class | | | 114,946 | |
Distribution fees | | | | |
Class B | | | 1,584 | 1 |
Class C | | | 1,101,675 | |
Custody and accounting fees | | | 35,094 | |
Professional fees | | | 57,901 | |
Registration fees | | | 103,199 | |
Shareholder report expenses | | | 46,461 | |
Trustees’ fees and expenses | | | 20,117 | |
Other fees and expenses | | | 10,949 | |
| | | | |
Total expenses | | | 6,669,192 | |
Less: Fee waivers and/or expense reimbursements | | | (57,258 | ) |
| | | | |
Net expenses | | | 6,611,934 | |
| | | | |
Net investment income | | | 19,531,782 | |
| | | | |
| |
REALIZED AND UNREALIZED GAINS (LOSSES) ON INVESTMENTS | | | | |
| |
Net realized gains on: | | | | |
Unaffiliated securities | | | 12,945,397 | |
Affiliated securities | | | 5 | |
| | | | |
Net realized gains on investments | | | 12,945,402 | |
| | | | |
| |
Net change in unrealized gains (losses) on: | | | | |
Unaffiliated securities | | | 21,283,246 | |
Affiiliated securities | | | 609 | |
| | | | |
Net change in unrealized gains (losses) on investments | | | 21,283,855 | |
| | | | |
Net realized and unrealized gains (losses) on investments | | | 34,229,257 | |
| | | | |
Net increase in net assets resulting from operations | | $ | 53,761,039 | |
| | | | |
| 1 | For the period from October 1, 2016 to May 5, 2017. Effective at the close of business on May 5, 2017, Class B shares were converted to Class A shares and no longer offered by the Fund. |
The accompanying notes are an integral part of these financial statements.
| | | | |
| 20 | | Wells Fargo Diversified Income Builder Fund | | Statement of changes in net assets |
| | | | | | | | | | | | | | | | |
| | | Year ended
September 30, 2017 | | | Year ended
September 30, 2016 | |
| | | | |
Operations | | | | | | | | | | | | | | | | |
Net investment income | | | | | | $ | 19,531,782 | | | | | | | $ | 13,285,487 | |
Net realized gains on investments | | | | | | | 12,945,402 | | | | | | | | 3,608,586 | |
Net change in unrealized gains (losses) on investments | | | | | | | 21,283,855 | | | | | | | | 38,971,424 | |
| | | | |
Net increase in net assets resulting from operations | | | | | | | 53,761,039 | | | | | | | | 55,865,497 | |
| | | | |
| | | | |
Distributions to shareholders from | | | | | | | | | | | | | | | | |
Net investment income | | | | | | | | | | | | | | | | |
Class A | | | | | | | (6,500,003 | ) | | | | | | | (4,830,169 | ) |
Class B | | | | | | | (5,875 | )1 | | | | | | | (26,929 | ) |
Class C | | | | | | | (4,004,743 | ) | | | | | | | (3,170,739 | ) |
Administrator Class | | | | | | | (1,700,100 | ) | | | | | | | (1,702,969 | ) |
Institutional Class | | | | | | | (8,456,717 | ) | | | | | | | (3,550,714 | ) |
Net realized gains | | | | | | | | | | | | | | | | |
Class A | | | | | | | (1,136,812 | ) | | | | | | | (4,558,034 | ) |
Class B | | | | | | | (2,604 | )1 | | | | | | | (41,594 | ) |
Class C | | | | | | | (905,222 | ) | | | | | | | (3,924,833 | ) |
Administrator Class | | | | | | | (289,153 | ) | | | | | | | (1,131,639 | ) |
Institutional Class | | | | | | | (1,137,209 | ) | | | | | | | (2,810,835 | ) |
| | | | |
Total distributions to shareholders | | | | | | | (24,138,438 | ) | | | | | | | (25,748,455 | ) |
| | | | |
| | | | |
Capital share transactions | | | Shares | | | | | | | | Shares | | | | | |
Proceeds from shares sold | | | | | | | | | | | | | | | | |
Class A | | | 18,433,357 | | | | 114,970,196 | | | | 7,444,175 | | | | 43,402,347 | |
Class B | | | 790 | 1 | | | 4,856 | 1 | | | 9,699 | | | | 56,089 | |
Class C | | | 9,920,574 | | | | 62,050,326 | | | | 5,591,017 | | | | 32,728,412 | |
Administrator Class | | | 4,611,695 | | | | 28,032,068 | | | | 10,156,014 | | | | 57,752,782 | |
Institutional Class | | | 37,928,512 | | | | 231,275,398 | | | | 12,005,792 | | | | 68,220,100 | |
| | | | |
| | | | | | | 436,332,844 | | | | | | | | 202,159,730 | |
| | | | |
Reinvestment of distributions | | | | | | | | | | | | | | | | |
Class A | | | 1,145,568 | | | | 7,148,903 | | | | 1,540,577 | | | | 8,715,930 | |
Class B | | | 1,045 | 1 | | | 6,448 | 1 | | | 8,851 | | | | 49,757 | |
Class C | | | 687,580 | | | | 4,297,275 | | | | 1,039,282 | | | | 5,870,456 | |
Administrator Class | | | 309,869 | | | | 1,885,882 | | | | 501,237 | | | | 2,803,982 | |
Institutional Class | | | 1,308,141 | | | | 8,015,673 | | | | 916,214 | | | | 5,097,329 | |
| | | | |
| | | | | | | 21,354,181 | | | | | | | | 22,537,454 | |
| | | | |
Payment for shares redeemed | | | | | | | | | | | | | | | | |
Class A | | | (10,383,064 | ) | | | (65,031,893 | ) | | | (6,057,888 | ) | | | (35,108,089 | ) |
Class B | | | (77,635 | )1 | | | (486,950 | )1 | | | (186,708 | ) | | | (1,095,883 | ) |
Class C | | | (6,040,064 | ) | | | (37,818,153 | ) | | | (4,790,025 | ) | | | (27,491,552 | ) |
Administrator Class | | | (9,917,933 | ) | | | (59,608,201 | ) | | | (4,588,670 | ) | | | (25,939,656 | ) |
Institutional Class | | | (9,738,100 | ) | | | (59,471,981 | ) | | | (6,093,878 | ) | | | (34,215,881 | ) |
| | | | |
| | | | | | | (222,417,178 | ) | | | | | | | (123,851,061 | ) |
| | | | |
Net increase in net assets resulting from capital share transactions | | | | | | | 235,269,847 | | | | | | | | 100,846,123 | |
| | | | |
Total increase in net assets | | | | | | | 264,892,448 | | | | | | | | 130,963,165 | |
| | | | |
| | | | |
Net assets | | | | | | | | | | | | | | | | |
Beginning of period | | | | | | | 478,984,962 | | | | | | | | 348,021,797 | |
| | | | |
End of period | | | | | | $ | 743,877,410 | | | | | | | $ | 478,984,962 | |
| | | | |
Overdistributed net investment income | | | | | | $ | (265,880 | ) | | | | | | $ | (168,444 | ) |
| | | | |
| 1 | For the period from October 1, 2016 to May 5, 2017. Effective at the close of business on May 5, 2017, Class B shares were converted to Class A shares and no longer offered by the Fund. |
The accompanying notes are an integral part of these financial statements.
| | | | | | |
| Financial highlights | | Wells Fargo Diversified Income Builder Fund | | | 21 | |
(For a share outstanding throughout each period)
| | | | | | | | | | | | | | | | | | | | |
| | | Year ended September 30 | |
| CLASS A | | 2017 | | | 2016 | | | 2015 | | | 2014 | | | 2013 | |
Net asset value, beginning of period | | | $6.13 | | | | $5.71 | | | | $6.37 | | | | $6.13 | | | | $6.00 | |
Net investment income | | | 0.20 | | | | 0.20 | | | | 0.21 | | | | 0.23 | | | | 0.25 | |
Net realized and unrealized gains (losses) on investments | | | 0.35 | | | | 0.64 | | | | (0.31 | ) | | | 0.38 | | | | 0.13 | |
| | | | | | | | | | | | | | | | | | | | |
Total from investment operations | | | 0.55 | | | | 0.84 | | | | (0.10 | ) | | | 0.61 | | | | 0.38 | |
Distributions to shareholders from | | | | | | | | | | | | | | | | | | | | |
Net investment income | | | (0.22 | ) | | | (0.21 | ) | | | (0.21 | ) | | | (0.23 | ) | | | (0.25 | ) |
Net realized gains | | | (0.04 | ) | | | (0.21 | ) | | | (0.35 | ) | | | (0.14 | ) | | | 0.00 | |
| | | | | | | | | | | | | | | | | | | | |
Total distributions to shareholders | | | (0.26 | ) | | | (0.42 | ) | | | (0.56 | ) | | | (0.37 | ) | | | (0.25 | ) |
Net asset value, end of period | | | $6.42 | | | | $6.13 | | | | $5.71 | | | | $6.37 | | | | $6.13 | |
Total return1 | | | 9.16 | % | | | 15.39 | % | | | (1.92 | )% | | | 10.13 | % | | | 6.37 | % |
Ratios to average net assets (annualized) | | | | | | | | | | | | | | | | | | | | |
Gross expenses | | | 1.05 | % | | | 1.08 | % | | | 1.11 | % | | | 1.13 | % | | | 1.12 | % |
Net expenses | | | 1.05 | % | | | 1.08 | % | | | 1.08 | % | | | 1.08 | % | | | 1.08 | % |
Net investment income | | | 3.29 | % | | | 3.55 | % | | | 3.38 | % | | | 3.60 | % | | | 4.03 | % |
Supplemental data | | | | | | | | | | | | | | | | | | | | |
Portfolio turnover rate | | | 29 | % | | | 38 | % | | | 63 | % | | | 52 | % | | | 60 | % |
Net assets, end of period (000s omitted) | | | $220,977 | | | | $154,496 | | | | $127,242 | | | | $143,062 | | | | $159,229 | |
| 1 | Total return calculations do not include any sales charges. |
The accompanying notes are an integral part of these financial statements.
| | | | |
| 22 | | Wells Fargo Diversified Income Builder Fund | | Financial highlights |
(For a share outstanding throughout each period)
| | | | | | | | | | | | | | | | | | | | |
| | | Year ended September 30 | |
| CLASS C | | 2017 | | | 2016 | | | 2015 | | | 2014 | | | 2013 | |
Net asset value, beginning of period | | | $6.14 | | | | $5.72 | | | | $6.39 | | | | $6.14 | | | | $6.01 | |
Net investment income | | | 0.16 | | | | 0.16 | 1 | | | 0.16 | 1 | | | 0.18 | | | | 0.20 | |
Net realized and unrealized gains (losses) on investments | | | 0.35 | | | | 0.63 | | | | (0.32 | ) | | | 0.39 | | | | 0.13 | |
| | | | | | | | | | | | | | | | | | | | |
Total from investment operations | | | 0.51 | | | | 0.79 | | | | (0.16 | ) | | | 0.57 | | | | 0.33 | |
Distributions to shareholders from | | | | | | | | | | | | | | | | | | | | |
Net investment income | | | (0.17 | ) | | | (0.16 | ) | | | (0.16 | ) | | | (0.18 | ) | | | (0.20 | ) |
Net realized gains | | | (0.04 | ) | | | (0.21 | ) | | | (0.35 | ) | | | (0.14 | ) | | | 0.00 | |
| | | | | | | | | | | | | | | | | | | | |
Total distributions to shareholders | | | (0.21 | ) | | | (0.37 | ) | | | (0.51 | ) | | | (0.32 | ) | | | (0.20 | ) |
Net asset value, end of period | | | $6.44 | | | | $6.14 | | | | $5.72 | | | | $6.39 | | | | $6.14 | |
Total return2 | | | 8.51 | % | | | 14.51 | % | | | (2.81 | )% | | | 9.47 | % | | | 5.58 | % |
Ratios to average net assets (annualized) | | | | | | | | | | | | | | | | | | | | |
Gross expenses | | | 1.80 | % | | | 1.83 | % | | | 1.86 | % | | | 1.88 | % | | | 1.87 | % |
Net expenses | | | 1.80 | % | | | 1.83 | % | | | 1.83 | % | | | 1.83 | % | | | 1.83 | % |
Net investment income | | | 2.54 | % | | | 2.80 | % | | | 2.62 | % | | | 2.85 | % | | | 3.29 | % |
Supplemental data | | | | | | | | | | | | | | | | | | | | |
Portfolio turnover rate | | | 29 | % | | | 38 | % | | | 63 | % | | | 52 | % | | | 60 | % |
Net assets, end of period (000s omitted) | | | $165,513 | | | | $129,856 | | | | $110,457 | | | | $111,045 | | | | $112,113 | |
| 1 | Calculated based upon average shares outstanding |
| 2 | Total return calculations do not include any sales charges. |
The accompanying notes are an integral part of these financial statements.
| | | | | | |
| Financial highlights | | Wells Fargo Diversified Income Builder Fund | | | 23 | |
(For a share outstanding throughout each period)
| | | | | | | | | | | | | | | | | | | | |
| | | Year ended September 30 | |
| ADMINISTRATOR CLASS | | 2017 | | | 2016 | | | 2015 | | | 2014 | | | 2013 | |
Net asset value, beginning of period | | | $6.00 | | | | $5.60 | | | | $6.25 | | | | $6.01 | | | | $5.89 | |
Net investment income | | | 0.21 | 1 | | | 0.21 | 1 | | | 0.21 | 1 | | | 0.24 | | | | 0.26 | |
Net realized and unrealized gains (losses) on investments | | | 0.34 | | | | 0.61 | | | | (0.30 | ) | | | 0.38 | | | | 0.12 | |
| | | | | | | | | | | | | | | | | | | | |
Total from investment operations | | | 0.55 | | | | 0.82 | | | | (0.09 | ) | | | 0.62 | | | | 0.38 | |
Distributions to shareholders from | | | | | | | | | | | | | | | | | | | | |
Net investment income | | | (0.22 | ) | | | (0.21 | ) | | | (0.21 | ) | | | (0.24 | ) | | | (0.26 | ) |
Net realized gains | | | (0.04 | ) | | | (0.21 | ) | | | (0.35 | ) | | | (0.14 | ) | | | 0.00 | |
| | | | | | | | | | | | | | | | | | | | |
Total distributions to shareholders | | | (0.26 | ) | | | (0.42 | ) | | | (0.56 | ) | | | (0.38 | ) | | | (0.26 | ) |
Net asset value, end of period | | | $6.29 | | | | $6.00 | | | | $5.60 | | | | $6.25 | | | | $6.01 | |
Total return | | | 9.45 | % | | | 15.45 | % | | | (1.69 | )% | | | 10.46 | % | | | 6.43 | % |
Ratios to average net assets (annualized) | | | | | | | | | | | | | | | | | | | | |
Gross expenses | | | 0.97 | % | | | 1.00 | % | | | 0.97 | % | | | 0.96 | % | | | 0.96 | % |
Net expenses | | | 0.90 | % | | | 0.90 | % | | | 0.90 | % | | | 0.90 | % | | | 0.90 | % |
Net investment income | | | 3.51 | % | | | 3.72 | % | | | 3.56 | % | | | 3.77 | % | | | 4.21 | % |
Supplemental data | | | | | | | | | | | | | | | | | | | | |
Portfolio turnover rate | | | 29 | % | | | 38 | % | | | 63 | % | | | 52 | % | | | 60 | % |
Net assets, end of period (000s omitted) | | | $41,975 | | | | $70,051 | | | | $31,367 | | | | $48,690 | | | | $43,135 | |
| 1 | Calculated based upon average shares outstanding |
The accompanying notes are an integral part of these financial statements.
| | | | |
| 24 | | Wells Fargo Diversified Income Builder Fund | | Financial highlights |
(For a share outstanding throughout each period)
| | | | | | | | | | | | | | | | | | | | |
| | | Year ended September 30 | |
| INSTITUTIONAL CLASS | | 2017 | | | 2016 | | | 2015 | | | 2014 | | | 2013 | |
Net asset value, beginning of period | | | $6.00 | | | | $5.59 | | | | $6.25 | | | | $6.01 | | | | $5.88 | |
Net investment income | | | 0.24 | | | | 0.23 | | | | 0.24 | | | | 0.25 | 1 | | | 0.27 | 1 |
Net realized and unrealized gains (losses) on investments | | | 0.31 | | | | 0.61 | | | | (0.32 | ) | | | 0.38 | | | | 0.13 | |
| | | | | | | | | | | | | | | | | | | | |
Total from investment operations | | | 0.55 | | | | 0.84 | | | | (0.08 | ) | | | 0.63 | | | | 0.40 | |
Distributions to shareholders from | | | | | | | | | | | | | | | | | | | | |
Net investment income | | | (0.23 | ) | | | (0.22 | ) | | | (0.23 | ) | | | (0.25 | ) | | | (0.27 | ) |
Net realized gains | | | (0.04 | ) | | | (0.21 | ) | | | (0.35 | ) | | | (0.14 | ) | | | 0.00 | |
| | | | | | | | | | | | | | | | | | | | |
Total distributions to shareholders | | | (0.27 | ) | | | (0.43 | ) | | | (0.58 | ) | | | (0.39 | ) | | | (0.27 | ) |
Net asset value, end of period | | | $6.28 | | | | $6.00 | | | | $5.59 | | | | $6.25 | | | | $6.01 | |
Total return | | | 9.49 | % | | | 15.88 | % | | | (1.65 | )% | | | 10.68 | % | | | 6.83 | % |
Ratios to average net assets (annualized) | | | | | | | | | | | | | | | | | | | | |
Gross expenses | | | 0.72 | % | | | 0.75 | % | | | 0.71 | % | | | 0.70 | % | | | 0.69 | % |
Net expenses | | | 0.71 | % | | | 0.71 | % | | | 0.69 | % | | | 0.70 | % | | | 0.69 | % |
Net investment income | | | 3.60 | % | | | 3.92 | % | | | 3.76 | % | | | 3.98 | % | | | 4.43 | % |
Supplemental data | | | | | | | | | | | | | | | | | | | | |
Portfolio turnover rate | | | 29 | % | | | 38 | % | | | 63 | % | | | 52 | % | | | 60 | % |
Net assets, end of period (000s omitted) | | | $315,413 | | | | $124,116 | | | | $77,558 | | | | $61,133 | | | | $49,807 | |
| 1 | Calculated based upon average shares outstanding |
The accompanying notes are an integral part of these financial statements.
| | | | | | |
| Notes to financial statements | | Wells Fargo Diversified Income Builder Fund | | | 25 | |
1. ORGANIZATION
Wells Fargo Funds Trust (the “Trust”), a Delaware statutory trust organized on March 10, 1999, is an open-end management investment company registered under the Investment Company Act of 1940, as amended (the “1940 Act”). As an investment company, the Trust follows the accounting and reporting guidance in Financial Accounting Standards Board Accounting Standards Codification Topic 946, Financial Services – Investment Companies. These financial statements report on the Wells Fargo Diversified Income Builder Fund (the “Fund”) which is a diversified series of the Trust.
Effective at the close of business on May 5, 2017, Class B shares were converted to Class A shares and are no longer offered by the Fund. Information for Class B shares reflected in the financial statements represents activity through May 5, 2017.
2. SIGNIFICANT ACCOUNTING POLICIES
The following significant accounting policies, which are consistently followed in the preparation of the financial statements of the Fund, are in conformity with U.S. generally accepted accounting principles which require management to make estimates and assumptions that affect the reported amounts of assets and liabilities, disclosure of contingent assets and liabilities at the date of the financial statements, and the reported amounts of revenues and expenses during the reporting period. Actual results could differ from those estimates.
Securities valuation
All investments are valued each business day as of the close of regular trading on the New York Stock Exchange (generally 4 p.m. Eastern Time), although the Fund may deviate from this calculation time under unusual or unexpected circumstances.
Debt securities are valued at the evaluated bid price provided by an independent pricing service or, if a reliable price is not available, the quoted bid price from an independent broker-dealer.
Equity securities that are listed on a foreign or domestic exchange or market are valued at the official closing price or, if none, the last sales price. If no sale occurs on the principal exchange or market that day, a fair value price will be determined in accordance with the Fund’s Valuation Procedures.
Investments in registered open-end investment companies are valued at net asset value. Interests in non-registered investment companies that are redeemable at net asset value are fair valued normally at net asset value.
Investments which are not valued using any of the methods discussed above are valued at their fair value, as determined in good faith by the Board of Trustees of the Fund. The Board of Trustees has established a Valuation Committee comprised of the Trustees and has delegated to it the authority to take any actions regarding the valuation of portfolio securities that the Valuation Committee deems necessary or appropriate, including determining the fair value of portfolio securities, unless the determination has been delegated to the Management Valuation Team of Wells Fargo Funds Management, LLC (“Funds Management”). The Board of Trustees retains the authority to make or ratify any valuation decisions or approve any changes to the Valuation Procedures as it deems appropriate. On a quarterly basis, the Board of Trustees receives reports on any valuation actions taken by the Valuation Committee or the Management Valuation Team which may include items for ratification.
Valuations of fair valued securities are compared to the next actual sales price when available, or other appropriate market values, to assess the continued appropriateness of the fair valuation methodologies used. These securities are fair valued on a day-to-day basis, taking into consideration changes to appropriate market information and any significant changes to the inputs considered in the valuation process until there is a readily available price provided on an exchange or by an independent pricing service. Valuations received from an independent pricing service or independent broker-dealer quotes are periodically validated by comparisons to most recent trades and valuations provided by other independent pricing services in addition to the review of prices by the manager and/or subadviser. Unobservable inputs used in determining fair valuations are identified based on the type of security, taking into consideration factors utilized by market participants in valuing the investment, knowledge about the issuer and the current market environment.
Security loans
The Fund may lend its securities from time to time in order to earn additional income in the form of fees or interest on securities received as collateral or the investment of any cash received as collateral. The Fund continues to receive interest or dividends on the securities loaned. The Fund receives collateral in the form of cash or securities with a value at least equal to the value of the securities on loan. The value of the loaned securities is determined at the close of each business day and any additional required collateral is delivered to the Fund on the next business day. In a securities lending transaction, the net asset value of the Fund will be affected by an increase or decrease in the value of the securities loaned and by an increase or decrease in the value of the instrument in which collateral is invested. The amount of securities lending activity undertaken by the Fund fluctuates from time to time. In the event of default or bankruptcy by the borrower, the Fund may be prevented from recovering the loaned securities or gaining access to the collateral or may experience delays or costs in doing so. In addition, the investment of any cash collateral received may lose all or part of its value. The Fund has the right under the lending agreement to recover the securities from the borrower on demand.
| | | | |
| 26 | | Wells Fargo Diversified Income Builder Fund | | Notes to financial statements |
The Fund lends its securities through an unaffiliated securities lending agent. Cash collateral received in connection with its securities lending transactions is invested in Securities Lending Cash Investments, LLC (the “Securities Lending Fund”). The Securities Lending Fund is exempt from registration under Section 3(c)(7) of the 1940 Act and is managed by Funds Management and is subadvised by Wells Capital Management Incorporated (“WellsCap”), an affiliate of Funds Management and an indirect wholly owned subsidiary of Wells Fargo & Company (“Wells Fargo”). Funds Management receives an advisory fee starting at 0.05% and declining to 0.01% as the average daily net assets of the Securities Lending Fund increase. All of the fees received by Funds Management are paid to WellsCap for its services as subadviser. The Securities Lending Fund seeks to provide a positive return compared to the daily Fed Funds Open Rate by investing in high-quality, U.S. dollar-denominated short-term money market instruments. Securities Lending Fund investments are valued at the evaluated bid price provided by an independent pricing service. Income earned from investment in the Securities Lending Fund is included in income from affiliates securities on the Statement of Operations.
When-issued transactions
The Fund may purchase securities on a forward commitment or when-issued basis. The Fund records a when-issued transaction on the trade date and will segregate assets in an amount at least equal in value to the Fund’s commitment to purchase when-issued securities. Securities purchased on a when-issued basis are marked-to-market daily and the Fund begins earning interest on the settlement date. Losses may arise due to changes in the market value of the underlying securities or if the counterparty does not perform under the contract.
Security transactions and income recognition
Securities transactions are recorded on a trade date basis. Realized gains or losses are recorded on the basis of identified cost.
Interest income is accrued daily and bond discounts are accreted and premiums are amortized daily based on the effective interest method. To the extent debt obligations are placed on non-accrual status, any related interest income may be reduced by writing off interest receivables when the collection of all or a portion of interest has been determined to be doubtful based on consistently applied procedures and the fair value has decreased. If the issuer subsequently resumes interest payments or when the collectability of interest is reasonably assured, the debt obligation is removed from non-accrual status.
Dividend income is recognized on the ex-dividend date.
Distributions to shareholders
Distributions to shareholders from net investment income are accrued daily and paid monthly. Distributions from net realized gains, if any, are recorded on the ex-dividend date. Such distributions are determined in accordance with income tax regulations and may differ from U.S. generally accepted accounting principles. Dividend sources are estimated at the time of declaration. The tax character of distributions is determined as of the Fund’s fiscal year end. Therefore, a portion of the Fund’s distributions made prior to the Fund’s fiscal year end may be categorized as a tax return of capital.
Federal and other taxes
The Fund intends to continue to qualify as a regulated investment company by distributing substantially all of its investment company taxable income and any net realized capital gains (after reduction for capital loss carryforwards) sufficient to relieve it from all, or substantially all, federal income taxes. Accordingly, no provision for federal income taxes was required.
The Fund’s income and federal excise tax returns and all financial records supporting those returns for the prior three fiscal years are subject to examination by the federal and Delaware revenue authorities. Management has analyzed the Fund’s tax positions taken on federal, state, and foreign tax returns for all open tax years and does not believe that there are any uncertain tax positions that require recognition of a tax liability.
As of September 30, 2017, the aggregate cost of all investments for federal income tax purposes was $704,922,497 and the unrealized gains (losses) consisted of:
| | | | |
Gross unrealized gains | | $ | 46,341,164 | |
Gross unrealized losses | | | (5,957,289 | ) |
Net unrealized gains | | $ | 40,383,875 | |
Reclassifications are made to the Fund’s capital accounts for permanent tax differences to reflect income and gains available for distribution (or available capital loss carryforwards) under federal income tax regulations. U.S. generally accepted accounting principles require that certain components of net assets be adjusted to reflect permanent differences between financial and tax reporting. These reclassifications have no effect on net assets or net asset values per share. The primary permanent difference causing such reclassifications is due to certain distributions paid. At
| | | | | | |
| Notes to financial statements | | Wells Fargo Diversified Income Builder Fund | | | 27 | |
September 30, 2017, as a result of permanent book-to-tax differences, the following reclassification adjustments were made on the Statement of Assets and Liabilities:
| | | | |
| Paid-in capital | | Overdistributed net
investment income | | Accumulated net
realized gains
on investments |
| $(169,584) | | $1,038,220 | | $(868,636) |
Class allocations
The separate classes of shares offered by the Fund differ principally in applicable sales charges, distribution, shareholder servicing, and administration fees. Class specific expenses are charged directly to that share class. Investment income, common expenses, and realized and unrealized gains (losses) on investments are allocated daily to each class of shares based on the relative proportion of net assets of each class.
3. FAIR VALUATION MEASUREMENTS
Fair value measurements of investments are determined within a framework that has established a fair value hierarchy based upon the various data inputs utilized in determining the value of the Fund’s investments. The three-level hierarchy gives the highest priority to unadjusted quoted prices in active markets for identical assets or liabilities (Level 1) and the lowest priority to unobservable inputs (Level 3). The Fund’s investments are classified within the fair value hierarchy based on the lowest level of input that is significant to the fair value measurement. The inputs are summarized into three broad levels as follows:
| ∎ | | Level 1 – quoted prices in active markets for identical securities |
| ∎ | | Level 2 – other significant observable inputs (including quoted prices for similar securities, interest rates, prepayment speeds, credit risk, etc.) |
| ∎ | | Level 3 – significant unobservable inputs (including the Fund’s own assumptions in determining the fair value of investments) |
The inputs or methodologies used for valuing investments in securities are not necessarily an indication of the risk associated with investing in those securities.
The following is a summary of the inputs used in valuing the Fund’s assets and liabilities as of September 30, 2017:
| | | | | | | | | | | | | | | | |
| | | Quoted prices
(Level 1) | | | Other significant
observable inputs (Level 2) | | | Significant
unobservable inputs (Level 3) | | | Total | |
Assets | | | | | | | | | | | | | | | | |
Investments in: | | | | | | | | | | | | | | | | |
| | | | |
Common stocks | | | | | | | | | | | | | | | | |
Consumer discretionary | | $ | 3,102,450 | | | $ | 0 | | | $ | 0 | | | $ | 3,102,450 | |
Consumer staples | | | 3,878,000 | | | | 0 | | | | 0 | | | | 3,878,000 | |
Energy | | | 34,125,000 | | | | 0 | | | | 0 | | | | 34,125,000 | |
Health care | | | 33,833,650 | | | | 0 | | | | 0 | | | | 33,833,650 | |
Industrials | | | 26,669,000 | | | | 0 | | | | 0 | | | | 26,669,000 | |
Information technology | | | 76,616,990 | | | | 0 | | | | 0 | | | | 76,616,990 | |
Materials | | | 15,406,400 | | | | 0 | | | | 0 | | | | 15,406,400 | |
Real estate | | | 5,610,050 | | | | 0 | | | | 0 | | | | 5,610,050 | |
Utilities | | | 6,707,200 | | | | 0 | | | | 0 | | | | 6,707,200 | |
| | | | |
Corporate bonds and notes | | | 0 | | | | 465,056,245 | | | | 0 | | | | 465,056,245 | |
| | | | |
Yankee corporate bonds and notes | | | 0 | | | | 51,889,822 | | | | 0 | | | | 51,889,822 | |
| | | | |
Short-term investments | | | | | | | | | | | | | | | | |
Investment companies | | | 11,243,453 | | | | 0 | | | | 0 | | | | 11,243,453 | |
Investments measured at net asset value* | | | | | | | | | | | | | | | 11,168,112 | |
Total assets | | $ | 217,192,193 | | | $ | 516,946,067 | | | $ | 0 | | | $ | 745,306,372 | |
| * | Investments that are measured at fair value using the net asset value per share (or its equivalent) as a practical expedient have not been categorized in the fair value hierarchy. The fair value amount presented in the table is intended to permit reconciliation of the fair value hierarchy to the amounts presented in the Statement of Assets and Liabilities. The Fund’s investment in Securities Lending Cash Investments, LLC valued at $11,168,112 does not have a redemption period notice, can be redeemed daily and does not have any unfunded commitments. |
| | | | |
| 28 | | Wells Fargo Diversified Income Builder Fund | | Notes to financial statements |
The Fund recognizes transfers between levels within the fair value hierarchy at the end of the reporting period. At September 30, 2017, the Fund did not have any transfers into/out of Level 1, Level 2, or Level 3.
4. TRANSACTIONS WITH AFFILIATES AND OTHER EXPENSES
Management fee
Funds Management, an indirect wholly owned subsidiary of Wells Fargo, is the manager of the Fund and provides advisory and fund-level administrative services under an investment management agreement. Under the investment management agreement, Funds Management is responsible for, among other services, implementing the investment objectives and strategies of the Fund, supervising the subadviser, providing fund-level administrative services in connection with the Fund’s operations, and providing any other fund-level administrative services reasonably necessary for the operation of the Fund. As compensation for its services under the investment management agreement, Funds Management is entitled to receive an annual management fee starting at 0.55% and declining to 0.43% as the average daily net assets of the Fund increase. For the year ended September 30, 2017, the management fee was equivalent to an annual rate of 0.55% of the Fund’s average daily net assets.
Funds Management has retained the services of a subadviser to provide daily portfolio management to the Fund. The fee for subadvisory services is borne by Funds Management. WellsCap is the subadviser to the Fund and is entitled to receive a fee from Funds Management at an annual rate starting at 0.35% and declining to 0.20% as the average daily net assets of the Fund increase.
Administration fees
Under a class-level administration agreement, Funds Management provides class-level administrative services to the Fund, which includes paying fees and expenses for services provided by the transfer agent, sub-transfer agents, omnibus account servicers and record-keepers. As compensation for its services under the class-level administration agreement, Funds Management receives an annual fee which is calculated based on the average daily net assets of each class as follows:
| | | | |
| | | Class-level
administration fee | |
Class A, Class B, Class C | | | 0.21 | % |
Administrator Class, Institutional Class | | | 0.13 | |
Funds Management has contractually waived and/or reimbursed management and administration fees to the extent necessary to maintain certain net operating expense ratios for the Fund. Waiver of fees and/or reimbursement of expenses by Funds Management were made first from fund level expenses on a proportionate basis and then from class specific expenses. Funds Management has committed through January 31, 2018 to waive fees and/or reimburse expenses to the extent necessary to cap the Fund’s expenses at 1.08% for Class A shares, 1.83% for Class C shares, 0.90% for Administrator Class shares, and 0.71% for Institutional Class shares. After this time, the cap may be increased or the commitment to maintain the cap may be terminated only with the approval of the Board of Trustees.
During the year ended September 30, 2017, State Street Bank and Trust Company (“State Street”), the Fund’s custodian, reimbursed the Fund $13,663 for certain out-of-pocket expenses that were billed to the Fund in error from 1998-2015. This amount is included in interest income on the Statement of Operations. In addition, Funds Management was also reimbursed $10,871 by State Street for waivers/reimbursements it made to the Fund to limit Fund expenses during the period the Fund was erroneously billed.
Distribution fees
The Trust has adopted a distribution plan for Class B and Class C shares of the Fund pursuant to Rule 12b-1 under the 1940 Act. Distribution fees are charged to Class B and Class C shares and paid to Wells Fargo Funds Distributor, LLC (“Funds Distributor”), the principal underwriter, at an annual rate of 0.75% of the average daily net assets of Class B and Class C shares.
In addition, Funds Distributor is entitled to receive the front-end sales charge from the purchase of Class A shares and a contingent deferred sales charge on the redemption of certain Class A shares. Funds Distributor is also entitled to receive the contingent deferred sales charges from redemptions of Class B and Class C shares. For the year ended September 30, 2017, Funds Distributor received $125,213 from the sale of Class A shares and $556 in contingent deferred sales charges from redemptions of Class C shares. No contingent deferred sales charges were incurred by Class A and Class B shares for the year ended September 30, 2017.
| | | | | | |
| Notes to financial statements | | Wells Fargo Diversified Income Builder Fund | | | 29 | |
Shareholder servicing fees
The Trust has entered into contracts with one or more shareholder servicing agents, whereby Class A, Class B, Class C, and Administrator Class of the Fund are charged a fee at an annual rate of 0.25% of the average daily net assets of each respective class.
A portion of these total shareholder servicing fees were paid to affiliates of Wells Fargo.
Interfund transactions
The Fund may purchase or sell portfolio investment securities to certain other Wells Fargo affiliates pursuant to Rule 17a-7 of the 1940 Act and under procedures adopted by the Board of Trustees. The procedures have been designed to ensure that these interfund transactions, which do not incur broker commissions, are effected at current market prices. Pursuant to these procedures, the Fund had $24,547,153 in interfund purchases during the year ended September 30, 2017.
5. INVESTMENT PORTFOLIO TRANSACTIONS
Purchases and sales of investments, excluding U.S. government obligations (if any) and short-term securities, for the year ended September 30, 2017 were $389,395,300 and $170,026,906, respectively.
6. BANK BORROWINGS
The Trust (excluding the money market funds and certain other funds) and Wells Fargo Variable Trust are parties to a $280,000,000 revolving credit agreement whereby the Fund is permitted to use bank borrowings for temporary or emergency purposes, such as to fund shareholder redemption requests. Interest under the credit agreement is charged to the Fund based on a borrowing rate equal to the higher of the Federal Funds rate in effect on that day plus 1.25% or the overnight LIBOR rate in effect on that day plus 1.25%. In addition, an annual commitment fee equal to 0.25% of the unused balance is allocated to each participating fund. Prior to August 29, 2017, the revolving credit agreement amount was $250,000,000.
For the year ended September 30, 2017, there were no borrowings by the Fund under the agreement.
7. DISTRIBUTIONS TO SHAREHOLDERS
The tax character of distributions paid during the years ended September 30, 2017 and September 30, 2016 were as follows:
| | | | | | | | |
| | | Year ended September 30 | |
| | | 2017 | | | 2016 | |
Ordinary income | | $ | 20,667,438 | | | $ | 15,910,256 | |
Long-term capital gain | | | 3,471,000 | | | | 9,838,199 | |
As of September 30, 2017, the components of distributable earnings on a tax basis were as follows:
| | | | |
Undistributed
ordinary
income | | Undistributed
long-term
gain | | Unrealized
gains |
| $4,123,692 | | $7,787,840 | | $40,383,875 |
8. INDEMNIFICATION
Under the Trust’s organizational documents, the officers and Trustees have been granted certain indemnification rights against certain liabilities that may arise out of performance of their duties to the Trust. Additionally, in the normal course of business, the Trust may enter into contracts with service providers that contain a variety of indemnification clauses. The Trust’s maximum exposure under these arrangements is dependent on future claims that may be made against the Fund and, therefore, cannot be estimated.
| | | | |
| 30 | | Wells Fargo Diversified Income Builder Fund | | Report of independent registered public accounting firm |
BOARD OF TRUSTEES AND SHAREHOLDERS OF WELLS FARGO FUNDS TRUST:
We have audited the accompanying statement of assets and liabilities, including the portfolio of investments, of the Wells Fargo Diversified Income Builder Fund (the “Fund”), one of the funds constituting the Wells Fargo Funds Trust, as of September 30, 2017, and the related statement of operations for the year then ended, the statements of changes in net assets for each of the years in the two-year period then ended, and the financial highlights for each of the years in the five-year period then ended. These financial statements and financial highlights are the responsibility of the Fund’s management. Our responsibility is to express an opinion on these financial statements and financial highlights based on our audits.
We conducted our audits in accordance with the standards of the Public Company Accounting Oversight Board (United States). Those standards require that we plan and perform the audit to obtain reasonable assurance about whether the financial statements and financial highlights are free of material misstatement. An audit includes examining, on a test basis, evidence supporting the amounts and disclosures in the financial statements. Our procedures included confirmation of securities owned as of September 30, 2017, by correspondence with the custodian and brokers, or by other appropriate auditing procedures. An audit also includes assessing the accounting principles used and significant estimates made by management, as well as evaluating the overall financial statement presentation. We believe that our audits provide a reasonable basis for our opinion.
In our opinion, the financial statements and financial highlights referred to above present fairly, in all material respects, the financial position of the Wells Fargo Diversified Income Builder Fund as of September 30, 2017, the results of its operations for the year then ended, changes in its net assets for each of the years in the two-year period then ended, and the financial highlights for each of the years in the five-year period then ended, in conformity with U.S. generally accepted accounting principles.

Boston, Massachusetts
November 22, 2017
| | | | | | |
| Other information (unaudited) | | Wells Fargo Diversified Income Builder Fund | | | 31 | |
TAX INFORMATION
For corporate shareholders, pursuant to Section 854 of the Internal Revenue Code, 9.61% of ordinary income dividends qualify for the corporate dividends-received deduction for the fiscal year ended September 30, 2017.
Pursuant to Section 852 of the Internal Revenue Code, $3,471,000 was designated as a 20% rate gain distribution for the fiscal year ended September 30, 2017.
Pursuant to Section 854 of the Internal Revenue Code, $2,174,629 of income dividends paid during the fiscal year ended September 30, 2017 has been designated as qualified dividend income (QDI).
For the fiscal year ended September 30, 2017, $15,309,271 has been designated as interest-related dividends for nonresident alien shareholders pursuant to Section 871 of the Internal Revenue Code.
For the fiscal year ended September 30, 2017, $1,124,719 has been designated as short-term capital gain dividends for nonresident alien shareholders pursuant to Section 871 of the Internal Revenue Code.
PROXY VOTING INFORMATION
A description of the policies and procedures that the Fund uses to determine how to vote proxies relating to portfolio securities is available, upon request, by calling 1-800-222-8222, visiting our website at wellsfargofunds.com, or visiting the SEC website at sec.gov. Information regarding how the Fund voted proxies relating to portfolio securities during the most recent 12-month period ended June 30 is available on the Fund’s website at wellsfargofunds.com or by visiting the SEC website at sec.gov.
PORTFOLIO HOLDINGS INFORMATION
The complete portfolio holdings for the Fund are publicly available monthly on the Fund’s website (wellsfargofunds.com), on a one-month delayed basis. In addition, top ten holdings information (excluding derivative positions) for the Fund is publicly available on the Fund’s website on a monthly, seven-day or more delayed basis. The Fund files its complete schedule of portfolio holdings with the SEC for the first and third quarters of each fiscal year on Form N-Q, which is available by visiting the SEC website at sec.gov. In addition, the Fund’s Form N-Q may be reviewed and copied at the SEC’s Public Reference Room in Washington, DC, and at regional offices in New York City, at 233 Broadway, and in Chicago, at 175 West Jackson Boulevard, Suite 900. Information about the Public Reference Room may be obtained by calling 1-800-SEC-0330.
| | | | |
| 32 | | Wells Fargo Diversified Income Builder Fund | | Other information (unaudited) |
BOARD OF TRUSTEES AND OFFICERS
Each of the Trustees and Officers1 listed in the table below acts in identical capacities for each fund in the Wells Fargo family of funds, which consists of 152 mutual funds comprising the Wells Fargo Funds Trust, Wells Fargo Variable Trust, Wells Fargo Master Trust and four closed-end funds (collectively the “Fund Complex”). This table should be read in conjunction with the Prospectus and the Statement of Additional Information2. The mailing address of each Trustee and Officer is 525 Market Street, 12th Floor, San Francisco, CA 94105. Each Trustee and Officer serves an indefinite term, however, each Trustee serves such term until reaching the mandatory retirement age established by the Trustees.
Independent Trustees
| | | | | | |
Name and
year of birth | | Position held and
length of service* | | Principal occupations during past five years or longer | | Current other
public company or
investment company
directorships |
William R. Ebsworth (Born 1957) | | Trustee, since 2015 | | Retired. From 1984 to 2013, equities analyst, portfolio manager, research director and chief investment officer at Fidelity Management and Research Company in Boston, Tokyo, and Hong Kong and retired in 2013 as Chief Investment Officer of Fidelity Strategic Advisers, Inc. where he led a team of investment professionals managing client assets. Prior thereto, Board member of Hong Kong Securities Clearing Co., Hong Kong Options Clearing Corp., the Thailand International Fund, Ltd., Fidelity Investments Life Insurance Company, and Empire Fidelity Investments Life Insurance Company. Board member of the Forté Foundation (non-profit organization) and the Vincent Memorial Hospital Endowment (non-profit organization), where he serves on the Investment Committee and as a Chair of the Audit Committee. Mr. Ebsworth is a CFA® charterholder. | | Asset Allocation Trust |
Jane A. Freeman (Born 1953) | | Trustee, since 2015 | | Retired. From 2012 to 2014 and 1999 to 2008, Chief Financial Officer of Scientific Learning Corporation. From 2008 to 2012, Ms. Freeman provided consulting services related to strategic business projects. Prior to 1999, Portfolio Manager at Rockefeller & Co. and Scudder, Stevens & Clark. Board member of the Harding Loevner Funds from 1996 to 2014, serving as both Lead Independent Director and chair of the Audit Committee. Board member of the Russell Exchange Traded Funds Trust from 2011 to 2012 and the chair of the Audit Committee. Ms. Freeman is a Board Member of Ruth Bancroft Garden (non-profit organization) and an inactive chartered financial analyst. | | Asset Allocation Trust |
Peter G. Gordon** (Born 1942) | | Trustee, since 1998; Chairman, since 2005 | | Co-Founder, Retired Chairman, President and CEO of Crystal Geyser Water Company. Trustee Emeritus, Colby College. | | Asset Allocation Trust |
Isaiah Harris, Jr. (Born 1952) | | Trustee, since 2009 | | Retired. Chairman of the Board of CIGNA Corporation since 2009, and Director since 2005. From 2003 to 2011, Director of Deluxe Corporation. Prior thereto, President and CEO of BellSouth Advertising and Publishing Corp. from 2005 to 2007, President and CEO of BellSouth Enterprises from 2004 to 2005 and President of BellSouth Consumer Services from 2000 to 2003. Emeritus member of the Iowa State University Foundation Board of Governors. Emeritus Member of the Advisory Board of Iowa State University School of Business. Advisory Board Member, Palm Harbor Academy (charter school). Advisory Board Member, Child Evangelism Fellowship (non-profit). Mr. Harris is a certified public accountant (inactive status). | | CIGNA Corporation; Asset Allocation Trust |
Judith M. Johnson (Born 1949) | | Trustee, since 2008; Audit Committee Chairman, since 2008 | | Retired. Prior thereto, Chief Executive Officer and Chief Investment Officer of Minneapolis Employees Retirement Fund from 1996 to 2008. Ms. Johnson is an attorney, certified public accountant and a certified managerial accountant. | | Asset Allocation Trust |
David F. Larcker (Born 1950) | | Trustee, since 2009 | | James Irvin Miller Professor of Accounting at the Graduate School of Business, Stanford University, Director of the Corporate Governance Research Initiative and Senior Faculty of The Rock Center for Corporate Governance since 2006. From 2005 to 2008, Professor of Accounting at the Graduate School of Business, Stanford University. Prior thereto, Ernst & Young Professor of Accounting at The Wharton School, University of Pennsylvania from 1985 to 2005. | | Asset Allocation Trust |
| | | | | | |
| Other information (unaudited) | | Wells Fargo Diversified Income Builder Fund | | | 33 | |
| | | | | | |
Name and
year of birth | | Position held and
length of service* | | Principal occupations during past five years or longer | | Current other
public company or
investment company
directorships |
Olivia S. Mitchell (Born 1953) | | Trustee, since 2006 | | International Foundation of Employee Benefit Plans Professor, Wharton School of the University of Pennsylvania since 1993. Director of Wharton’s Pension Research Council and Boettner Center on Pensions & Retirement Research, and Research Associate at the National Bureau of Economic Research. Previously, Cornell University Professor from 1978 to 1993. | | Asset Allocation Trust |
Timothy J. Penny (Born 1951) | | Trustee, since 1996: Vice Chairman, since 2017 | | President and Chief Executive Officer of Southern Minnesota Initiative Foundation, a non-profit organization, since 2007 and Senior Fellow at the Humphrey Institute Policy Forum at the University of Minnesota since 1995. Member of the Board of Trustees of NorthStar Education Finance, Inc., a non-profit organization, since 2007. | | Asset Allocation Trust |
Michael S. Scofield (Born 1943) | | Trustee, since 2010 | | Served on the Investment Company Institute’s Board of Governors and Executive Committee from 2008-2011 as well the Governing Council of the Independent Directors Council from 2006-2011 and the Independent Directors Council Executive Committee from 2008-2011. Chairman of the IDC from 2008-2010. Trustee of the Evergreen Funds complex (and its predecessors) from 1984 to 2010. Chairman of the Evergreen Funds from 2000-2010. Former Trustee of the Mentor Funds. Retired Attorney, Law Offices of Michael S. Scofield. | | Asset Allocation Trust |
| * | Length of service dates reflect the Trustee’s commencement of service with the Trust’s predecessor entities, where applicable. |
| ** | Peter Gordon is expected to retire on December 31, 2017. |
Advisory Board Members
| | | | | | |
Name and
year of birth | | Position held and
length of service | | Principal occupations during past five years or longer | | Current other
public company or
investment company
directorships |
James G. Polisson (Born 1959) | | Advisory Board Member, since 2017 | | Retired. Chief Marketing Officer, Source (ETF) UK Services, Ltd, from 2015 to 2017. From 2012 to 2015, Principal of The Polisson Group, LLC, a management consulting, corporate advisory and principal investing company. Chief Executive Officer and Managing Director at Russell Investments, Global Exchange Traded Funds from 2010 to 2012. Managing Director of Barclays Global Investors from 1998 to 2010 and Global Chief Marketing Officer for iShares and Barclays Global Investors from 2000 to 2010. Prior thereto, Vice President, Fidelity Retail Mutual Fund Group from 1996 to 1998 and Risk Management Practice Manager, Fidelity Consulting from 1995 to 1996. Board member of the Russell Exchange Traded Fund Trust from 2011 to 2012. Director of Barclays Global Investors Holdings Deutschland GmbH from 2006 to 2009. Mr. Polisson is an attorney and has a retired status with the Massachusetts and District of Columbia Bar Associations. | | None |
Pamela Wheelock (Born 1959) | | Advisory Board Member, since 2017 | | Chief Operating Officer, Twin Cities Habitat for Humanity, since January, 2017. Vice President of University Services, University of Minnesota from 2012 to 2017. Prior thereto, Interim President and Chief Executive Officer of Blue Cross Blue Shield of Minnesota from 2010 to 2011, Chairman of the Board from 2009 to 2011 and Board Director from 2003 to 2015. Vice President, Leadership and Community Engagement, Bush Foundation, Saint Paul, Minnesota (a private foundation) from 2009 to 2011. Executive Vice President and Chief Financial Officer, Minnesota Sports and Entertainment from 2004 to 2009 and Senior Vice President from 2002 to 2004. Commissioner of Finance, State of Minnesota, from 1999 to 2002. Currently on the Board of Directors, Governance Committee and Finance Committee, for the Minnesota Philanthropy Partners (Saint Paul Foundation) since 2012 and Board Chair of the Minnesota Wild Foundation since 2010. | | None |
| | | | |
| 34 | | Wells Fargo Diversified Income Builder Fund | | Other information (unaudited) |
Officers
| | | | | | |
Name and
year of birth | | Position held and
length of service | | Principal occupations during past five years or longer | | |
Andrew Owen (Born 1960) | | President, since 2017 | | Executive Vice President of Wells Fargo & Company and Head of Affiliated Managers, Wells Fargo Asset Management, since 2014. In addition, Mr. Owen is currently President, Chief Executive Officer and Director of Wells Fargo Funds Management, LLC since 2017. Prior thereto, Executive Vice President responsible for marketing, investments and product development for Wells Fargo Funds Management, LLC, from 2009 to 2014. | | |
Jeremy DePalma1 (Born 1974) | | Treasurer, since 2012 | | Senior Vice President of Wells Fargo Funds Management, LLC since 2009. Senior Vice President of Evergreen Investment Management Company, LLC from 2008 to 2010 and head of the Fund Reporting and Control Team within Fund Administration from 2005 to 2010. | | |
C. David Messman (Born 1960) | | Secretary, since 2000; Chief Legal Officer, since 2003 | | Senior Vice President and Secretary of Wells Fargo Funds Management, LLC since 2001. Assistant General Counsel of Wells Fargo Bank, N.A. since 2013 and Vice President and Managing Counsel of Wells Fargo Bank, N.A. from 1996 to 2013. | | |
Michael H. Whitaker (Born 1967) | | Chief Compliance Officer, since 2016 | | Senior Vice President and Chief Compliance Officer since 2016. Senior Vice President and Chief Compliance Officer for Fidelity Investments from 2007 to 2016. | | |
David Berardi (Born 1975) | | Assistant Treasurer, since 2009 | | Vice President of Wells Fargo Funds Management, LLC since 2009. Vice President of Evergreen Investment Management Company, LLC from 2008 to 2010. Manager of Fund Reporting and Control for Evergreen Investment Management Company, LLC from 2004 to 2010. | | |
| 1 | Jeremy DePalma acts as Treasurer of 76 funds and Assistant Treasurer of 76 funds in the Fund Complex. |
| 2 | The Statement of Additional Information includes additional information about the Trustees and is available, without charge, upon request, by calling 1-800-222-8222 or by visiting the website at wellsfargofunds.com. |
| | | | | | |
| Other information (unaudited) | | Wells Fargo Diversified Income Builder Fund | | | 35 | |
BOARD CONSIDERATION OF INVESTMENT MANAGEMENT AND SUB-ADVISORY AGREEMENTS:
Under the Investment Company Act of 1940 (the “1940 Act”), the Board of Trustees (the “Board”) of Wells Fargo Funds Trust (the “Trust”) must determine annually whether to approve the continuation of the Trust’s investment management and sub-advisory agreements. In this regard, at an in-person meeting held on May 16-17, 2017 (the “Meeting”), the Board, all the members of which have no direct or indirect interest in the investment management and sub-advisory agreements and are not “interested persons” of the Trust, as defined in the 1940 Act (the “Independent Trustees”), reviewed and approved for Wells Fargo Diversified Income Builder Fund (the “Fund”): (i) an investment management agreement (the “Management Agreement”) with Wells Fargo Funds Management, LLC (“Funds Management”); and (ii) an investment sub-advisory agreement (the “Sub-Advisory Agreement”) with Wells Capital Management Incorporated (the “Sub-Adviser”), an affiliate of Funds Management. The Management Agreement and the Sub-Advisory Agreement are collectively referred to as the “Advisory Agreements.”
At the Meeting, the Board considered the factors and reached the conclusions described below relating to the selection of Funds Management and the Sub-Adviser and the approval of the Advisory Agreements. Prior to the Meeting, including at an in-person meeting in April 2017, the Trustees conferred extensively among themselves and with representatives of Funds Management about these matters. Also, the Board has adopted a team-based approach, with each team consisting of a sub-set of Trustees, to assist the full Board in the discharge of its duties in reviewing performance and other matters throughout the year. The Independent Trustees were assisted in their evaluation of the Advisory Agreements by independent legal counsel, from whom they received separate legal advice and with whom they met separately.
In providing information to the Board, Funds Management and the Sub-Adviser were guided by a detailed set of requests for information submitted to them by independent legal counsel on behalf of the Independent Trustees at the start of the Board’s annual contract renewal process earlier in 2017. In considering and approving the Advisory Agreements, the Trustees considered the information they believed relevant, including but not limited to the information discussed below. The Board considered not only the specific information presented in connection with the Meeting, but also the knowledge gained over time through interaction with Funds Management and the Sub-Adviser about various topics. In this regard, the Board reviewed reports of Funds Management at each of its quarterly meetings, which included, among other things, portfolio reviews and performance reports. In addition, the Board and the teams mentioned above confer with portfolio managers at various times throughout the year. The Board did not identify any particular information or consideration that was all-important or controlling, and each individual Trustee may have attributed different weights to various factors.
After its deliberations, the Board unanimously approved the continuation of the Advisory Agreements for a one-year term and determined that the compensation payable to Funds Management and the Sub-Adviser under each of the Advisory Agreements was reasonable. The Board considered the approval of the Advisory Agreements for the Fund as part of its consideration of agreements for funds across the complex, but its approvals were made on a fund-by-fund basis. The following summarizes a number of important, but not necessarily all, factors considered by the Board in support of its approvals.
Nature, extent and quality of services
The Board received and considered various information regarding the nature, extent and quality of services provided to the Fund by Funds Management and the Sub-Adviser under the Advisory Agreements. This information included a description of the investment advisory services and Fund-level administrative services covered by the Management Agreement, as well as, among other things, a summary of the background and experience of senior management of Funds Management, a summary of certain organizational and personnel changes involving Funds Management and the Sub-Adviser, and a description of Funds Management’s and the Sub-Adviser’s business continuity planning programs and of their approaches to data privacy and cybersecurity. The Board also considered the qualifications, background, tenure and responsibilities of each of the portfolio managers primarily responsible for the day-to-day portfolio management of the Fund.
The Board evaluated the ability of Funds Management and the Sub-Adviser to attract and retain qualified investment professionals, including research, advisory and supervisory personnel. The Board further considered the compliance programs and compliance records of Funds Management and the Sub-Adviser. In addition, the Board took into account the full range of services provided to the Fund by Funds Management and its affiliates.
Fund performance and expenses
The Board considered the performance results for the Fund over various time periods ended December 31, 2016. The Board considered these results in comparison to the performance of funds in a universe that was determined by Broadridge Inc. (“Broadridge”) to be similar to the Fund (the “Universe”), and in comparison to the Fund’s benchmark index and to other comparative data. Broadridge is an independent provider of investment company data. The Board
| | | | |
| 36 | | Wells Fargo Diversified Income Builder Fund | | Other information (unaudited) |
received a description of the methodology used by Broadridge to select the mutual funds in the performance Universe. The Board noted that the performance of the Fund (Class A) was higher than the average performance of the Universe for all periods under review. The Board also noted that the performance of the Fund was higher than its benchmark, the Diversified Income Builder Blended Index, for the three-year period under review, but lower than its benchmark for the all other periods under review.
The Board also received and considered information regarding the Fund’s net operating expense ratios and their various components, including actual management fees, custodian and other non-management fees, and Rule 12b-1 and non-Rule 12b-1 shareholder service fees. The Board considered these ratios in comparison to the median ratios of funds in class-specific expense groups that were determined by Broadridge to be similar to the Fund (the “Groups”). The Board received a description of the methodology used by Broadridge to select the mutual funds in the expense Groups and an explanation of how funds comprising expense groups and their expense ratios may vary from year-to-year. Based on the Broadridge reports, the Board noted that the net operating expense ratios of the Fund were lower than or in range of the median net operating expense ratios of the expense Groups for all share classes.
The Board took into account the Fund performance and expense information provided to it among the factors considered in deciding to re-approve the Advisory Agreements.
Investment management and sub-advisory fee rates
The Board reviewed and considered the contractual fee rates payable by the Fund to Funds Management under the Management Agreement, as well as the contractual fee rates payable by the Fund to Funds Management for class-level administrative services under a Class-Level Administration Agreement, which include, among other things, class-level transfer agency and sub-transfer agency costs (collectively, the “Management Rates”). The Board also reviewed and considered the contractual investment sub-advisory fee rates that are payable by Funds Management to the Sub-Adviser for investment sub-advisory services.
Among other information reviewed by the Board was a comparison of the Fund’s Management Rates with the average contractual investment management fee rates of funds in the expense Groups at a common asset level as well as transfer agency costs of the funds in the expense Groups. The Board noted that the Management Rates of the Fund were lower than or in range of the sum of these average rates for the Fund’s expense Groups for all share classes.
The Board also received and considered information about the portion of the total management fee that was retained by Funds Management after payment of the fee to the Sub-Adviser for sub-advisory services. In assessing the reasonableness of this amount, the Board received and evaluated information about the nature and extent of responsibilities retained and risks assumed by Funds Management and not delegated to or assumed by the Sub-Adviser, and about Funds Management’s on-going oversight services. However, given the affiliation between Funds Management and the Sub-Adviser, the Board ascribed limited relevance to the allocation of fees between them.
Based on its consideration of the factors and information it deemed relevant, including those described here, the Board determined that the compensation payable to Funds Management under the Management Agreement and to the Sub-Adviser under the Sub-Advisory Agreement was reasonable.
Profitability
The Board received and considered information concerning the profitability of Funds Management, as well as the profitability of Wells Fargo as a whole, from providing services to the Fund and the fund family as a whole. The Board also received and considered information concerning the profitability of the Sub-Adviser from providing services to the fund family as a whole, noting that the Sub-Adviser’s profitability information with respect to providing services to the Fund was subsumed in the Wells Fargo and Funds Management profitability analysis.
Funds Management reported on the methodologies and estimates used in calculating profitability, including a description of the methodology used to allocate certain expenses. Among other things, the Board noted that the levels of profitability reported on a fund-by-fund basis varied widely, depending on factors such as the size and type of fund. Based on its review, the Board did not deem the profits reported by Funds Management or Wells Fargo from its services to the Fund to be at a level that would prevent it from approving the continuation of the Advisory Agreements.
Economies of scale
With respect to possible economies of scale, the Board noted the existence of breakpoints in the Fund’s management fee structure, which operate generally to reduce the Fund’s expense ratios as the Fund grows in size. It considered that, for a small fund or a fund that shrinks in size, breakpoints conversely can result in higher fee levels. The Board also considered that in addition to management fee breakpoints, competitive management fee rates set at the outset without regard to
| | | | | | |
| Other information (unaudited) | | Wells Fargo Diversified Income Builder Fund | | | 37 | |
breakpoints and fee waiver and expense reimbursement arrangements are means of sharing potential economies of scale with shareholders of the Fund. The Board considered Funds Management’s view, which Funds Management indicated was supported by independent third-party industry studies which were summarized for the Board, that any analyses of potential economies of scale in managing a particular fund are inherently limited in light of the joint and common costs and investments that Funds Management incurs across the fund family as a whole.
The Board concluded that the Fund’s fee and expense arrangements, including contractual breakpoints, constituted a reasonable approach to sharing potential economies of scale with the Fund and its shareholders.
Other benefits to Funds Management and the Sub-Adviser
The Board received and considered information regarding potential “fall-out” or ancillary benefits received by Funds Management and its affiliates, including the Sub-Adviser, as a result of their relationships with the Fund. Ancillary benefits could include, among others, benefits directly attributable to other relationships with the Fund and benefits potentially derived from an increase in Funds Management’s and the Sub-Adviser’s business as a result of their relationships with the Fund. The Board noted that various affiliates of Funds Management may receive distribution-related fees, shareholder servicing payments and sub-transfer agency fees in respect of shares sold or held through them and services provided.
The Board also reviewed information about soft dollar credits earned and utilized by the Sub-Adviser, fees earned by Funds Management and the Sub-Adviser from managing a private investment vehicle for the fund family’s securities lending collateral and commissions earned by an affiliated broker from portfolio transactions.
Based on its consideration of the factors and information it deemed relevant, including those described here, the Board did not find that any ancillary benefits received by Funds Management and its affiliates, including the Sub-Adviser, were unreasonable.
Conclusion
At the Meeting, after considering the above-described factors and based on its deliberations and its evaluation of the information described above, the Board unanimously approved the continuation of the Advisory Agreements for a one-year term and determined that the compensation payable to Funds Management and the Sub-Adviser under each of the Advisory Agreements was reasonable.
| | | | |
| 38 | | Wells Fargo Diversified Income Builder Fund | | List of abbreviations |
The following is a list of common abbreviations for terms and entities that may have appeared in this report.
| ACA | — ACA Financial Guaranty Corporation |
| ADR | — American depositary receipt |
| ADS | — American depositary shares |
| AGC | — Assured Guaranty Corporation |
| AGM | — Assured Guaranty Municipal |
| Ambac | — Ambac Financial Group Incorporated |
| AMT | — Alternative minimum tax |
| BAN | — Bond anticipation notes |
| BHAC | — Berkshire Hathaway Assurance Corporation |
| CAB | — Capital appreciation bond |
| CCAB | — Convertible capital appreciation bond |
| CDA | — Community Development Authority |
| CDO | — Collateralized debt obligation |
| CLO | — Collateralized loan obligation |
| DRIVER | — Derivative inverse tax-exempt receipts |
| DW&P | — Department of Water & Power |
| DWR | — Department of Water Resources |
| ECFA | — Educational & Cultural Facilities Authority |
| EDA | — Economic Development Authority |
| EDFA | — Economic Development Finance Authority |
| ETF | — Exchange-traded fund |
| FDIC | — Federal Deposit Insurance Corporation |
| FFCB | — Federal Farm Credit Banks |
| FGIC | — Financial Guaranty Insurance Corporation |
| FHA | — Federal Housing Administration |
| FHLB | — Federal Home Loan Bank |
| FHLMC | — Federal Home Loan Mortgage Corporation |
| FICO | — The Financing Corporation |
| FNMA | — Federal National Mortgage Association |
| GDR | — Global depositary receipt |
| GNMA | — Government National Mortgage Association |
| HCFR | — Healthcare facilities revenue |
| HEFA | — Health & Educational Facilities Authority |
| HEFAR | — Higher education facilities authority revenue |
| HFA | — Housing Finance Authority |
| HFFA | — Health Facilities Financing Authority |
| HUD | — Department of Housing and Urban Development |
| IDA | — Industrial Development Authority |
| IDAG | — Industrial Development Agency |
| KRW | — Republic of Korea won |
| LIBOR | — London Interbank Offered Rate |
| LIFER | — Long Inverse Floating Exempt Receipts |
| LLC | — Limited liability company |
| LLLP | — Limited liability limited partnership |
| LLP | — Limited liability partnership |
| MBIA | — Municipal Bond Insurance Association |
| MFHR | — Multifamily housing revenue |
| MSTR | — Municipal securities trust receipts |
| MUD | — Municipal Utility District |
| National | — National Public Finance Guarantee Corporation |
| PCFA | — Pollution Control Financing Authority |
| PCL | — Public Company Limited |
| PCR | — Pollution control revenue |
| PFA | — Public Finance Authority |
| PFFA | — Public Facilities Financing Authority |
| PFOTER | — Puttable floating option tax-exempt receipts |
| PJSC | — Public Joint Stock Company |
| plc | — Public limited company |
| PUTTER | — Puttable tax-exempt receipts |
| R&D | — Research & development |
| Radian | — Radian Asset Assurance |
| RAN | — Revenue anticipation notes |
| RDA | — Redevelopment Authority |
| RDFA | — Redevelopment Finance Authority |
| REIT | — Real estate investment trust |
| ROC | — Reset option certificates |
| SAVRS | — Select auction variable rate securities |
| SBA | — Small Business Authority |
| SDR | — Swedish depositary receipt |
| SFHR | — Single-family housing revenue |
| SFMR | — Single-family mortgage revenue |
| SPA | — Standby purchase agreement |
| SPDR | — Standard & Poor’s Depositary Receipts |
| SPEAR | — Short Puttable Exempt Adjustable Receipts |
| STRIPS | — Separate trading of registered interest and |
| TAN | — Tax anticipation notes |
| TIPS | — Treasury inflation-protected securities |
| TRAN | — Tax revenue anticipation notes |
| TTFA | — Transportation Trust Fund Authority |
| TVA | — Tennessee Valley Authority |
This page is intentionally left blank.
This page is intentionally left blank.

For more information
More information about Wells Fargo Funds is available free upon request. To obtain literature, please write, email, visit the Fund’s website, or call:
Wells Fargo Funds
P.O. Box 8266
Boston, MA 02266-8266
Email: fundservice@wellsfargo.com
Website: wellsfargofunds.com
Individual investors: 1-800-222-8222
Retail investment professionals: 1-888-877-9275
Institutional investment professionals:
1-866-765-0778
This report and the financial statements contained herein are submitted for the general information of the shareholders of the Fund. If this report is used for promotional purposes, distribution of the report must be accompanied or preceded by a current prospectus. Before investing, please consider the investment objectives, risks, charges, and expenses of the investment. For a current prospectus and, if available, a summary prospectus, containing this information, call 1-800-222-8222 or visit the Fund’s website at wellsfargofunds.com. Read the prospectus carefully before you invest or send money.
Wells Fargo Asset Management (WFAM) is a trade name used by the asset management businesses of Wells Fargo & Company. Wells Fargo Funds Management, LLC, a wholly owned subsidiary of Wells Fargo & Company, provides investment advisory and administrative services for Wells Fargo Funds. Other affiliates of Wells Fargo & Company provide subadvisory and other services for the funds. The funds are distributed by Wells Fargo Funds Distributor, LLC, Member FINRA, an affiliate of Wells Fargo & Company. Neither Wells Fargo Funds Distributor nor Wells Fargo Funds Management holds fund shareholder accounts or assets. This material is for general informational and educational purposes only and is NOT intended to provide investment advice or a recommendation of any kind—including a recommendation for any specific investment, strategy, or plan.
NOT FDIC INSURED ◾ NO BANK GUARANTEE ◾ MAY LOSE VALUE
© 2017 Wells Fargo Funds Management, LLC. All rights reserved.
| | |
 | | 306430 11-17 A226/AR226 09-17 |
Annual Report
September 30, 2017

Wells Fargo Index Asset Allocation Fund


Reduce clutter. Save trees.
Sign up for electronic delivery of prospectuses and shareholder reports at wellsfargo.com/advantagedelivery
Contents
The views expressed and any forward-looking statements are as of September 30, 2017, unless otherwise noted, and are those of the Fund managers and/or Wells Fargo Funds Management, LLC. Discussions of individual securities, or the markets generally, or any Wells Fargo Fund are not intended as individual recommendations. Future events or results may vary significantly from those expressed in any forward-looking statements. The views expressed are subject to change at any time in response to changing circumstances in the market. Wells Fargo Funds Management, LLC and the Fund disclaim any obligation to publicly update or revise any views expressed or forward-looking statements.
NOT FDIC INSURED ◾ NO BANK GUARANTEE ◾ MAY LOSE VALUE
| | | | |
| 2 | | Wells Fargo Index Asset Allocation Fund | | Letter to shareholders (unaudited) |

Andrew Owen
President
Wells Fargo Funds
Favorable economic news supported stocks, and interest rates moved higher.
Hiring remained strong, and business and consumer sentiment improved.
Dear Shareholder:
We are pleased to offer you this annual report for the Wells Fargo Index Asset Allocation Fund for the 12-month period that ended September 30, 2017. Despite heightened market volatility at times, global stocks generally delivered double-digit results and bond markets had smaller but positive results as well. U.S. and international stocks returned 18.61% and 19.61%, respectively, for the 12-month period, as measured by the S&P 500 Index1 and the MSCI ACWI ex USA Index (Net),2 respectively; within fixed income, the Bloomberg Barclays U.S. Aggregate Bond Index3 returned 0.07% and the Bloomberg Barclays Municipal Bond Index4 returned 0.87% as interest rates rose from low levels.
Election results and central banks’ policies commanded investor attention as 2016 closed.
During the fourth quarter of 2016, investors appeared intent on the prospective outcomes of elections in the U.S. and central-bank actions globally. Following Donald Trump’s election victory, U.S. stocks rallied. Investors appeared optimistic that the new administration would pursue progrowth policies. Favorable economic news supported stocks, and interest rates moved higher. At their mid-December meeting, U.S. Federal Reserve (Fed) officials raised the target interest rate by a quarter percentage point to a range of 0.50% to 0.75%. The fourth quarter also saw the implementation of the U.S. Securities and Exchange Commission’s new rules for money market funds, which included floating net asset values (NAVs) as well as the possibility of liquidity fees and redemption gates for institutional prime and municipal money market funds. In the year leading up to money market fund reform implementation, nearly $1 trillion in assets moved from money market funds subject to floating NAVs into government money market funds, which continued to transact at a stable $1.00 NAV. Outside of the U.S., the prospects for faster U.S. growth appeared to trigger some acceleration in Europe.
Financial markets gained during the first two quarters of 2017 on positive economic data.
Stocks rallied globally through the first quarter of 2017, supported by signs of improvement in the U.S. and global economies. U.S. economic data released during the quarter reflected a healthy economy. Hiring remained strong, and business and consumer sentiment improved. In March, Fed officials raised their target interest rate by a quarter percentage point to a range of 0.75% to 1.00%. With the Fed’s target interest-rate increase, short-term bond yields rose during the quarter. Meanwhile, longer-term Treasury yields were little changed, leading to positive performance. Investment-grade and high-yield bonds benefited from strong demand. Municipal bond returns were positive in the quarter, helped by strong demand and constrained new-issue supply. Outside of the U.S., stocks in emerging markets generally outperformed stocks in the U.S. and international
| 1 | The S&P 500 Index consists of 500 stocks chosen for market size, liquidity, and industry group representation. It is a market-value-weighted index with each stock’s weight in the index proportionate to its market value. You cannot invest directly in an index. |
| 2 | The Morgan Stanley Capital International (MSCI) All Country World Index (ACWI) ex USA Index (Net) is a free-float-adjusted market-capitalization-weighted index that is designed to measure the equity market performance of developed markets, excluding the United States and Canada. Source: MSCI. MSCI makes no express or implied warranties or representations and shall have no liability whatsoever with respect to any MSCI data contained herein. The MSCI data may not be further redistributed or used as a basis for other indexes or any securities or financial products. This report is not approved, reviewed, or produced by MSCI. You cannot invest directly in an index. |
| 3 | The Bloomberg Barclays U.S. Aggregate Bond Index is a broad-based benchmark that measures the investment-grade, U.S. dollar-denominated, fixed-rate taxable bond market, including Treasuries, government-related and corporate securities, mortgage-backed securities (agency fixed-rate and hybrid adjustable-rate mortgage pass-throughs), asset-backed securities, and commercial mortgage-backed securities. You cannot invest directly in an index. |
| 4 | The Bloomberg Barclays Municipal Bond Index is an unmanaged index composed of long-term tax-exempt bonds with a minimum credit rating of Baa. You cannot invest directly in an index. |
| | | | | | |
| Letter to shareholders (unaudited) | | Wells Fargo Index Asset Allocation Fund | | | 3 | |
developed markets because they benefited from both global economic growth and recent weakening in the U.S. dollar. Stocks in Asia, Europe, and Latin America also outperformed the U.S. market during the quarter.
Globally, stocks marked continued gains through the second quarter of 2017. Steady, albeit modest, economic growth both in the U.S. and abroad and generally favorable corporate earnings announcements supported higher valuations. U.S. inflation trended lower despite a continued decline in the unemployment rate. Ten-year U.S. Treasury yields declined, resulting in stronger prices for long-term bonds. As was widely expected, the Fed raised the target interest rate in June by a quarter percentage point to a range of 1.00% to 1.25%. In addition, the Fed indicated that it would begin to sell bonds accumulated on its balance sheet during quantitative easing programs conducted since 2008. Later in the third quarter, the Fed confirmed that the initiative to reduce the bonds that it holds likely would begin in October.
Volatility increased during the third quarter of 2017.
Early in July and again in August, volatility expectations increased and then receded—as measured by the CBOE VIX5—amid geopolitical tensions, particularly in Asia, and declining investor optimism following unsuccessful efforts to reform health care laws in the U.S. which suggested to some that President Trump and Congress would be unable to move forward with tax and regulatory reforms.
During the quarter, economic momentum increased in Europe; the European Central Bank held its rates steady at low levels and continued its quantitative easing bond-buying program, which is intended to spark economic activity. The Bank of England suggested it could hike interest rates in November, and the pound gained against other currencies. The Bank of Japan also maintained accommodative policies intended to support business activity and economic growth. In Germany, Angela Merkel was reelected chancellor; in Japan, Prime Minister Shinzo Abe called for snap elections as his popularity increased after North Korea’s aggressive program of missile launches. Both political developments were indicative of the type of political consistency in developed markets that reassure financial markets.
In emerging markets, many countries benefited from stronger currencies versus the U.S. dollar. In addition, commodity prices were on an upward trajectory, which benefited many companies that rely on natural resources for exports.
As the quarter closed, optimism returned as economic growth continued. The second-quarter gross domestic product measure was revised higher from 2.6% annualized to 3.0%. Consumer spending and residential and nonresidential investment increased. While inflation continued to trail the Fed’s targets, expectations remained for an additional short-term interest-rate hike before year-end.
| 5 | The Chicago Board Options Exchange Market Volatility Index (CBOE VIX) is a popular measure of the implied volatility of S&P 500 Index options. It represents one measure of the market’s expectation of stock market volatility over the next 30-day period. You cannot invest directly in an index. |
| | | | |
| 4 | | Wells Fargo Index Asset Allocation Fund | | Letter to shareholders (unaudited) |
Don’t let short-term uncertainty derail long-term investment goals.
Periods of investment uncertainty can present challenges, but experience has taught us that maintaining long-term investment goals can be an effective way to plan for the future. To help you create a sound strategy based on your personal goals and risk tolerance, Wells Fargo Funds offers more than 100 mutual funds spanning a wide range of asset classes and investment styles. Although diversification cannot guarantee an investment profit or prevent losses, we believe it can be an effective way to manage investment risk and potentially smooth out overall portfolio performance. We encourage investors to know their investments and to understand that appropriate levels of risk-taking may unlock opportunities.
Thank you for choosing to invest with Wells Fargo Funds. We appreciate your confidence in us and remain committed to helping you meet your financial needs.
Sincerely,

Andrew Owen
President
Wells Fargo Funds
For further information about your Fund, contact your investment professional, visit our website at wellsfargofunds.com, or call us directly at 1-800-222-8222. We are available 24 hours a day, 7 days a week.
This page is intentionally left blank.
| | | | |
| 6 | | Wells Fargo Index Asset Allocation Fund | | Performance highlights (unaudited) |
Investment objective
The Fund seeks long-term total return, consisting of capital appreciation and current income.
Manager
Wells Fargo Funds Management, LLC
Subadviser
Wells Capital Management Incorporated
Portfolio managers
Kandarp R. Acharya, CFA®, FRM
Petros Bocray, CFA®, FRM‡
Christian L. Chan, CFA®
Average annual total returns (%) as of September 30, 20171
| | | | | | | | | | | | | | | | | | | | | | | | | | | | | | | | | | |
| | | | | Including sales charge | | | Excluding sales charge | | | Expense ratios2 (%) | |
| | | Inception date | | 1 year | | | 5 year | | | 10 year | | | 1 year | | | 5 year | | | 10 year | | | Gross | | | Net3 | |
| Class A (SFAAX) | | 11-13-1986 | | | 3.65 | | | | 9.05 | | | | 5.47 | | | | 9.99 | | | | 10.35 | | | | 6.09 | | | | 1.10 | | | | 1.10 | |
| Class C (WFALX) | | 4-1-1998 | | | 8.14 | | | | 9.52 | | | | 5.31 | | | | 9.14 | | | | 9.52 | | | | 5.31 | | | | 1.85 | | | | 1.85 | |
| Administrator Class (WFAIX) | | 11-8-1999 | | | – | | | | – | | | | – | | | | 10.20 | | | | 10.60 | | | | 6.35 | | | | 1.02 | | | | 0.90 | |
| Institutional Class (WFATX) | | 10-31-2016 | | | – | | | | – | | | | – | | | | 10.34 | | | | 10.63 | | | | 6.37 | | | | 0.77 | | | | 0.75 | |
| Index Asset Allocation Blended Index4 | | – | | | – | | | | – | | | | – | | | | 10.14 | | | | 9.89 | | | | 7.98 | | | | – | | | | – | |
| Bloomberg Barclays U.S. Treasury Index5 | | – | | | – | | | | – | | | | – | | | | (1.67 | ) | | | 1.24 | | | | 3.71 | | | | – | | | | – | |
| S&P 500 Index6 | | – | | | – | | | | – | | | | – | | | | 18.61 | | | | 14.22 | | | | 7.44 | | | | – | | | | – | |
Figures quoted represent past performance, which is no guarantee of future results, and do not reflect taxes that a shareholder may pay on fund distributions or the redemption of fund shares. Investment return and principal value of an investment will fluctuate so that an investor’s shares, when redeemed, may be worth more or less than their original cost. Performance shown without sales charges would be lower if sales charges were reflected. Current performance may be lower or higher than the performance data quoted, which assumes the reinvestment of dividends and capital gains. Current month-end performance is available on the Fund’s website, wellsfargofunds.com.
Index returns do not include transaction costs associated with buying and selling securities, any mutual fund fees or expenses, or any taxes. It is not possible to invest directly in an index.
For Class A shares, the maximum front-end sales charge is 5.75%. For Class C shares, the maximum contingent deferred sales charge is 1.00%. Performance including a contingent deferred sales charge assumes the sales charge for the corresponding time period. Administrator Class and Institutional Class shares are sold without a front-end sales charge or contingent deferred sales charge.
Balanced funds may invest in stocks and bonds. Stock values fluctuate in response to the activities of individual companies and general market and economic conditions. Bond values fluctuate in response to the financial condition of individual issuers, general market and economic conditions, and changes in interest rates. Changes in market conditions and government policies may lead to periods of heightened volatility in the bond market and reduced liquidity for certain bonds held by the Fund. In general, when interest rates rise, bond values fall and investors may lose principal value. Interest-rate changes and their impact on the Fund and its share price can be sudden and unpredictable. The use of derivatives may reduce returns and/or increase volatility. Consult the Fund’s prospectus for additional information on these and other risks.
Please see footnotes on page 7.
| | | | | | |
| Performance highlights (unaudited) | | Wells Fargo Index Asset Allocation Fund | | | 7 | |
|
| Growth of $10,000 investment as of September 30, 20177 |
|
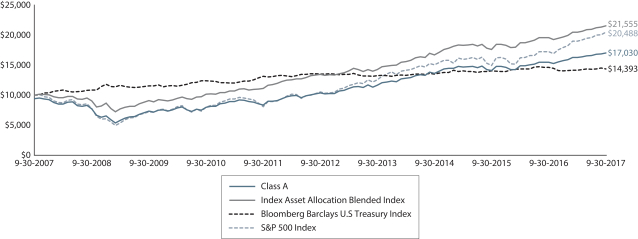 |
| ‡ | Mr. Bocray became a portfolio manager of the Fund on October 1, 2016. |
| 1 | Historical performance shown for the Institutional Class shares prior to their inception reflects the performance of the Administrator Class shares, and is not adjusted to reflect the expenses of the Institutional Class shares. If these expenses had been included, returns for Institutional Class shares would be higher. |
| 2 | Reflects the expense ratios as stated in the most recent prospectuses. The expense ratios shown are subject to change and may differ from the annualized expense ratios shown in the financial highlights of this report. |
| 3 | The manager has contractually committed through January 31, 2018, to waive fees and/or reimburse expenses to the extent necessary to cap the Fund’s Total Annual Fund Operating Expenses After Fee Waivers at 1.15% for Class A, 1.90% for Class C, 0.90% for Administrator Class, and 0.75% for Institutional Class. After this time, the cap may be increased or the commitment to maintain the cap may be terminated only with the approval of the Board of Trustees. Brokerage commissions, stamp duty fees, interest, taxes, acquired fund fees and expenses, and extraordinary expenses are excluded from the expense cap. Without this cap, the Fund’s returns would have been lower. The expense ratio paid by an investor is the net expense ratio or the Fund’s Total Annual Fund Operating Expenses After Fee Waivers, as stated in the prospectuses. |
| 4 | Source: Wells Fargo Funds Management, LLC. Effective April 1, 2015, the Index Asset Allocation Blended Index is weighted 60% in the S&P 500 Index and 40% in the Bloomberg Barclays U.S. Treasury Index. Prior to April 1, 2015, the Index Asset Allocation Blended Index was weighted 60% in the S&P 500 Index and 40% in the Bloomberg Barclays U.S. Treasury 20+ Year Index. You cannot invest directly in an index. |
| 5 | The Bloomberg Barclays U.S. Treasury Index is an unmanaged index of prices of U.S. Treasury bonds with maturities of 1 to 30 years. You cannot invest directly in an index. |
| 6 | The S&P 500 Index consists of 500 stocks chosen for market size, liquidity, and industry group representation. It is a market-value weighted index with each stock’s weight in the index proportionate to its market value. You cannot invest directly in an index. |
| 7 | The chart compares the performance of Class A shares for the most recent ten years with the Index Asset Allocation Blended Index, the Bloomberg Barclays U.S. Treasury Index, and the S&P 500 Index. The chart assumes a hypothetical investment of $10,000 in Class A shares and reflects all operating expenses and assumes the maximum initial sales charge of 5.75%. |
| 8 | The Chicago Board Options Exchange Market Volatility Index (CBOE VIX) is a popular measure of the implied volatility of S&P 500 Index options. It represents one measure of the market’s expectation of stock market volatility over the next 30-day period. You cannot invest directly in an index. |
| 9 | The Morgan Stanley Capital International (MSCI) Europe, Australasia, Far East (EAFE) Index (Net) is a free-float-adjusted market-capitalization-weighted index that is designed to measure the equity market performance of developed markets, excluding the United States and Canada. The MSCI EAFE Index (Net) consists of the following 21 developed markets country indexes: Australia, Austria, Belgium, Denmark, Finland, France, Germany, Hong Kong, Ireland, Israel, Italy, Japan, the Netherlands, New Zealand, Norway, Portugal, Singapore, Spain, Sweden, Switzerland, and the United Kingdom. Source: MSCI. MSCI makes no express or implied warranties or representations and shall have no liability whatsoever with respect to any MSCI data contained herein. The MSCI data may not be further redistributed or used as a basis for other indexes or any securities or financial products. This report is not approved, reviewed, or produced by MSCI. You cannot invest directly in an index. |
| 10 | The MSCI Emerging Markets (EM) Index (Net) is a free-float-adjusted market-capitalization-weighted index that is designed to measure large- and mid-cap equity market performance of emerging markets. The MSCI EM Index (Net) consists of the following 24 emerging markets country indexes: Brazil, Chile, China, Colombia, Czech Republic, Egypt, Greece, Hungary, India, Indonesia, Korea, Malaysia, Mexico, Pakistan, Peru, the Philippines, Poland, Qatar, Russia, South Africa, Taiwan, Thailand, Turkey, and the United Arab Emirates. You cannot invest directly in an index. |
| 11 | The Bloomberg Barclays 20+ Year U.S. Treasury Index is an unmanaged index composed of securities in the U.S. Treasury Index with maturities of 20 years or greater. You cannot invest directly in an index. |
| 12 | The ten largest holdings, excluding cash and cash equivalents, are calculated based on the value of the investments divided by total net assets of the Fund. Holdings are subject to change and may have changed since the date specified. |
| 13 | Amounts are calculated based on the total long-term investments of the Fund. These amounts are subject to change and may have changed since the date specified. |
| 14 | Current target allocation includes the effect of any tactical futures overlay that may be in place. These amounts are subject to change and may have changed since the date specified. |
| | | | |
| 8 | | Wells Fargo Index Asset Allocation Fund | | Performance highlights (unaudited) |
MANAGER’S DISCUSSION
Fund highlights
| ∎ | | The Fund (Class A shares, excluding sales charges) underperformed its benchmark, the Index Asset Allocation Blended Index, for the 12-month period that ended September 30, 2017 after the deduction of the Fund’s fees and expenses. The benchmark does not incur any fees and expenses. |
| ∎ | | The Fund’s stock and bond allocations performed in line with their respective benchmarks (the S&P 500 Index and the Bloomberg Barclay’s U.S. Treasury Index, respectively). |
| ∎ | | The Fund’s tactical asset allocation shifts between stocks and bonds and the bond allocation’s duration management contributed to performance. |
Markets responded dramatically to the election of President Donald Trump.
The 12-month period that ended September 30, 2017, was marked by political surprises and generally low market volatility. With the U.S. election upset in November 2016, equity and fixed-income markets saw large swings in futures prices during and following the election, the peak of volatility for the one-year period. The months following saw record lows for the CBOE VIX8, which fell as low as 9.36 on July 21, 2017.
Economic indicators in international markets firmed during the year. In the European Union (E.U.), growth rates and inflation numbers ticked up as investor appetite for risk increased. The E.U. and developed international markets saw increased fund inflows for the quarter.
For the period as a whole, the S&P 500 Index posted a return of 18.61%. Developed non-U.S. markets, as measured by the MSCI EAFE Index (Net)9, returned 19.10%. Emerging markets, as measured by the MSCI EM Index (Net)10, posted a 22.46% return.
Longer-duration U.S. government bond prices fell during the period as the yield curve steepened. The Bloomberg Barclays U.S. Treasury Index, a broad measure of U.S. Treasury notes and bonds, lost 1.67% during the 12-month period, with the Bloomberg Barclays 20+ Year U.S. Treasury Index11 losing 6.66%.
| | | | |
| Ten largest holdings (%) as of September 30, 201712 | |
Apple Incorporated | | | 2.22 | |
Microsoft Corporation | | | 1.60 | |
Facebook Incorporated Class A | | | 1.13 | |
Amazon.com Incorporated | | | 1.07 | |
Berkshire Hathaway Incorporated Class B | | | 0.99 | |
Johnson & Johnson | | | 0.98 | |
Exxon Mobil Corporation | | | 0.97 | |
JPMorgan Chase & Company | | | 0.94 | |
Alphabet Incorporated Class A | | | 0.81 | |
Alphabet Incorporated Class C | | | 0.81 | |
Duration management and the tactical shifts through the period contributed positively to performance.
The Fund’s stock holdings seek to replicate the holdings of the S&P 500 Index; its bond holdings seek to replicate the holdings of the Bloomberg Barclays U.S. Treasury Index. The Fund’s neutral target allocation is 60% stocks and 40% bonds. As of fiscal year-end, the Fund had an effective target allocation of 60% stocks and 40% bonds.
During the period, the portfolio management team implemented tactical shifts between stocks and bonds in order to adjust the Fund’s effective allocations based on the relative attractiveness of the two asset classes. The allocation changes are implemented as an overlay with
futures used as an alternative to holding the underlying asset. The Fund began the period with a neutral equity allocation and lowered bond duration. During the U.S. elections, the team saw equity futures markets dislocate from fundamentals. Through an overnight trade, the team moved the allocation toward equities. This contributed positively to the Fund’s performance. The tactical shifts in equity and bond allocations that the portfolio management team implemented added value through the period.
The futures positions, which lowered the duration of the Fund’s bond allocation, also contributed positively to the portfolio’s performance. In the aftermath of the election, the U.S. Treasury rose dramatically through the end of November 2016. The team then unwound the duration trades in late November and December at a gain. Subsequently, the team tactically reduced the duration of the Fund in February 2017. Then in March and April, the team further reduced the duration of the portfolio. The reduced exposure to longer-term bonds during this period added to performance as longer-duration bond yields rose and prices fell; bond prices and yields move in opposite directions. In light of the historical lows for bond yields, the team continues to view this as a prudent measure in a rising interest-rate environment.
Please see footnotes on page 7.
| | | | | | |
| Performance highlights (unaudited) | | Wells Fargo Index Asset Allocation Fund | | | 9 | |
|
| Sector distribution as of September 30, 201713 |
|
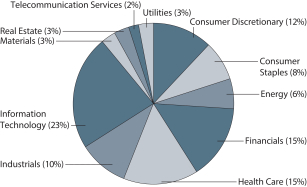 |
|
| Neutral target allocation |
|
 |
|
| Current target allocation as of September 30, 201714 |
|
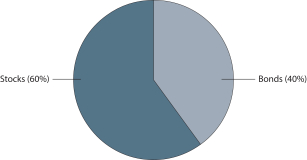 |
Relative to its benchmark, the Fund is neutral toward stocks and bonds.
The Fund’s effective allocation is determined by a combination of inputs from multiple quantitative and qualitative factors. As of the close of the period, the Fund was neutral with regard to stocks relative to bonds and held a lower duration relative to its benchmark. All of the changes to the effective allocation were implemented with futures contracts.
Please see footnotes on page 7.
| | | | |
| 10 | | Wells Fargo Index Asset Allocation Fund | | Fund expenses (unaudited) |
As a shareholder of the Fund, you incur two types of costs: (1) transaction costs, including sales charges (loads) on purchase payments and contingent deferred sales charges (if any) on redemptions and (2) ongoing costs, including management fees, distribution (12b-1) and/or shareholder servicing fees, and other Fund expenses. This example is intended to help you understand your ongoing costs (in dollars) of investing in the Fund and to compare these costs with the ongoing costs of investing in other mutual funds.
The example is based on an investment of $1,000 invested at the beginning of the six-month period and held for the entire period from April 1, 2017 to September 30, 2017.
Actual expenses
The “Actual” line of the table below provides information about actual account values and actual expenses. You may use the information in this line, together with the amount you invested, to estimate the expenses that you paid over the period. Simply divide your account value by $1,000 (for example, an $8,600 account value divided by $1,000 = 8.6), then multiply the result by the number in the “Actual” line under the heading entitled “Expenses paid during period” for your applicable class of shares to estimate the expenses you paid on your account during this period.
Hypothetical example for comparison purposes
The “Hypothetical” line of the table below provides information about hypothetical account values and hypothetical expenses based on the Fund’s actual expense ratio and an assumed rate of return of 5% per year before expenses, which is not the Fund’s actual return. The hypothetical account values and expenses may not be used to estimate the actual ending account balance or expenses you paid for the period. You may use this information to compare the ongoing costs of investing in the Fund and other funds. To do so, compare this 5% hypothetical example with the 5% hypothetical examples that appear in the shareholder reports of the other funds.
Please note that the expenses shown in the table are meant to highlight your ongoing costs only and do not reflect any transactional costs, such as sales charges (loads) and contingent deferred sales charges. Therefore, the “Hypothetical” line of the table is useful in comparing ongoing costs only and will not help you determine the relative total costs of owning different funds. In addition, if these transactional costs were included, your costs would have been higher.
| | | | | | | | | | | | | | | | |
| | | Beginning
account value
4-1-2017 | | | Ending
account value
9-30-2017 | | | Expenses
paid during
the period¹ | | | Annualized net
expense ratio | |
Class A | | | | | | | | | | | | | | | | |
Actual | | $ | 1,000.00 | | | $ | 1,043.91 | | | $ | 5.50 | | | | 1.07 | % |
Hypothetical (5% return before expenses) | | $ | 1,000.00 | | | $ | 1,019.69 | | | $ | 5.43 | | | | 1.07 | % |
Class C | | | | | | | | | | | | | | | | |
Actual | | $ | 1,000.00 | | | $ | 1,039.55 | | | $ | 9.32 | | | | 1.82 | % |
Hypothetical (5% return before expenses) | | $ | 1,000.00 | | | $ | 1,015.93 | | | $ | 9.21 | | | | 1.82 | % |
Administrator Class | | | | | | | | | | | | | | | | |
Actual | | $ | 1,000.00 | | | $ | 1,044.90 | | | $ | 4.61 | | | | 0.90 | % |
Hypothetical (5% return before expenses) | | $ | 1,000.00 | | | $ | 1,020.56 | | | $ | 4.56 | | | | 0.90 | % |
Institutional Class | | | | | | | | | | | | | | | | |
Actual | | $ | 1,000.00 | | | $ | 1,045.40 | | | $ | 3.81 | | | | 0.74 | % |
Hypothetical (5% return before expenses) | | $ | 1,000.00 | | | $ | 1,021.35 | | | $ | 3.76 | | | | 0.74 | % |
| 1 | Expenses paid is equal to the annualized net expense ratio of each class multiplied by the average account value over the period, multiplied by the number of days in the most recent fiscal half-year divided by the number of days in the fiscal year (to reflect the one-half-year period). |
| | | | | | |
| Portfolio of investments—September 30, 2017 | | Wells Fargo Index Asset Allocation Fund | | | 11 | |
| | | | | | | | | | | | | | | | |
| Security name | | Interest rate | | | Maturity date | | | Principal | | | Value | |
| | | | |
Agency Securities: 0.01% | | | | | | | | | | | | | | | | |
FNMA Series 2002-T1 Class A4 | | | 9.50 | % | | | 11-25-2031 | | | $ | 52,285 | | | $ | 62,058 | |
| | | | | | | | | | | | | | | | |
| | | | |
Total Agency Securities (Cost $52,745) | | | | | | | | | | | | | | | 62,058 | |
| | | | | | | | | | | | | | | | |
| | | | |
| | | | | | | | | Shares | | | | |
| Common Stocks: 60.34% | | | | | | | | | | | | | | | | |
| | | | |
Consumer Discretionary: 7.14% | | | | | | | | | | | | | | | | |
| | | | |
| Auto Components: 0.13% | | | | | | | | | | | | | | | | |
BorgWarner Incorporated | | | | | | | | | | | 7,273 | | | | 372,596 | |
Delphi Automotive plc | | | | | | | | | | | 9,761 | | | | 960,482 | |
The Goodyear Tire & Rubber Company | | | | | | | | | | | 9,180 | | | | 305,235 | |
| | | | |
| | | | | | | | | | | | | | | 1,638,313 | |
| | | | | | | | | | | | | | | | |
| | | | |
| Automobiles: 0.30% | | | | | | | | | | | | | | | | |
Ford Motor Company | | | | | | | | | | | 142,488 | | | | 1,705,581 | |
General Motors Company | | | | | | | | | | | 47,769 | | | | 1,928,912 | |
Harley-Davidson Incorporated « | | | | | | | | | | | 6,250 | | | | 301,313 | |
| | | | |
| | | | | | | | | | | | | | | 3,935,806 | |
| | | | | | | | | | | | | | | | |
| | | | |
| Distributors: 0.07% | | | | | | | | | | | | | | | | |
Genuine Parts Company | | | | | | | | | | | 5,365 | | | | 513,162 | |
LKQ Corporation † | | | | | | | | | | | 11,261 | | | | 405,283 | |
| | | | |
| | | | | | | | | | | | | | | 918,445 | |
| | | | | | | | | | | | | | | | |
| | | | |
| Diversified Consumer Services: 0.02% | | | | | | | | | | | | | | | | |
H&R Block Incorporated | | | | | | | | | | | 7,662 | | | | 202,890 | |
| | | | | | | | | | | | | | | | |
| | | | |
| Hotels, Restaurants & Leisure: 1.07% | | | | | | | | | | | | | | | | |
Carnival Corporation | | | | | | | | | | | 14,829 | | | | 957,509 | |
Chipotle Mexican Grill Incorporated † | | | | | | | | | | | 905 | | | | 278,586 | |
Darden Restaurants Incorporated | | | | | | | | | | | 4,570 | | | | 360,025 | |
Hilton Worldwide Holdings Incorporated | | | | | | | | | | | 7,455 | | | | 517,750 | |
Marriott International Incorporated Class A | | | | | | | | | | | 11,398 | | | | 1,256,743 | |
McDonald’s Corporation | | | | | | | | | | | 29,509 | | | | 4,623,470 | |
MGM Resorts International | | | | | | | | | | | 18,743 | | | | 610,834 | |
Royal Caribbean Cruises Limited | | | | | | | | | | | 6,245 | | | | 740,282 | |
Starbucks Corporation | | | | | | | | | | | 52,665 | | | | 2,828,637 | |
Wyndham Worldwide Corporation | | | | | | | | | | | 3,749 | | | | 395,182 | |
Wynn Resorts Limited | | | | | | | | | | | 2,914 | | | | 433,953 | |
Yum! Brands Incorporated | | | | | | | | | | | 12,587 | | | | 926,529 | |
| | | | |
| | | | | | | | | | | | | | | 13,929,500 | |
| | | | | | | | | | | | | | | | |
| | | | |
| Household Durables: 0.26% | | | | | | | | | | | | | | | | |
D.R. Horton Incorporated | | | | | | | | | | | 12,446 | | | | 496,969 | |
Garmin Limited « | | | | | | | | | | | 4,051 | | | | 218,632 | |
Leggett & Platt Incorporated | | | | | | | | | | | 4,820 | | | | 230,059 | |
Lennar Corporation Class A | | | | | | | | | | | 7,419 | | | | 391,723 | |
Mohawk Industries Incorporated † | | | | | | | | | | | 2,301 | | | | 569,521 | |
The accompanying notes are an integral part of these financial statements.
| | | | |
| 12 | | Wells Fargo Index Asset Allocation Fund | | Portfolio of investments—September 30, 2017 |
| | | | | | | | | | | | | | | | |
| Security name | | | | | | | | Shares | | | Value | |
| | | | |
| Household Durables (continued) | | | | | | | | | | | | | | | | |
Newell Rubbermaid Incorporated | | | | | | | | | | | 17,924 | | | $ | 764,817 | |
PulteGroup Incorporated | | | | | | | | | | | 10,138 | | | | 277,072 | |
Whirlpool Corporation | | | | | | | | | | | 2,661 | | | | 490,795 | |
| | | | |
| | | | | | | | | | | | | | | 3,439,588 | |
| | | | | | | | | | | | | | | | |
| | | | |
| Internet & Direct Marketing Retail: 1.60% | | | | | | | | | | | | | | | | |
Amazon.com Incorporated † | | | | | | | | | | | 14,477 | | | | 13,917,464 | |
Expedia Incorporated | | | | | | | | | | | 4,474 | | | | 643,988 | |
Netflix Incorporated † | | | | | | | | | | | 15,805 | | | | 2,866,237 | |
The Priceline Group Incorporated † | | | | | | | | | | | 1,786 | | | | 3,269,845 | |
TripAdvisor Incorporated † | | | | | | | | | | | 3,940 | | | | 159,688 | |
| | | | |
| | | | | | | | | | | | | | | 20,857,222 | |
| | | | | | | | | | | | | | | | |
| | | | |
| Leisure Products: 0.05% | | | | | | | | | | | | | | | | |
Hasbro Incorporated | | | | | | | | | | | 4,147 | | | | 405,037 | |
Mattel Incorporated | | | | | | | | | | | 12,378 | | | | 191,611 | |
| | | | |
| | | | | | | | | | | | | | | 596,648 | |
| | | | | | | | | | | | | | | | |
| | | | |
| Media: 1.72% | | | | | | | | | | | | | | | | |
CBS Corporation Class B | | | | | | | | | | | 13,232 | | | | 767,456 | |
Charter Communications Incorporated Class A † | | | | | | | | | | | 7,344 | | | | 2,668,956 | |
Comcast Corporation Class A | | | | | | | | | | | 172,170 | | | | 6,625,102 | |
Discovery Communications Incorporated Class A † | | | | | | | | | | | 5,591 | | | | 119,032 | |
Discovery Communications Incorporated Class C † | | | | | | | | | | | 7,381 | | | | 149,539 | |
DISH Network Corporation Class A † | | | | | | | | | | | 8,320 | | | | 451,194 | |
Interpublic Group of Companies Incorporated | | | | | | | | | | | 14,348 | | | | 298,295 | |
News Corporation Class A | | | | | | | | | | | 13,966 | | | | 185,189 | |
News Corporation Class B | | | | | | | | | | | 4,449 | | | | 60,729 | |
Omnicom Group Incorporated | | | | | | | | | | | 8,412 | | | | 623,077 | |
Scripps Networks Interactive Incorporated Class A | | | | | | | | | | | 3,499 | | | | 300,529 | |
The Walt Disney Company | | | | | | | | | | | 56,357 | | | | 5,555,109 | |
Time Warner Incorporated | | | | | | | | | | | 28,395 | | | | 2,909,068 | |
Twenty-First Century Fox Incorporated Class A | | | | | | | | | | | 38,305 | | | | 1,010,486 | |
Twenty-First Century Fox Incorporated Class B | | | | | | | | | | | 15,956 | | | | 411,505 | |
Viacom Incorporated Class B | | | | | | | | | | | 12,810 | | | | 356,630 | |
| | | | |
| | | | | | | | | | | | | | | 22,491,896 | |
| | | | | | | | | | | | | | | | |
| | | | |
| Multiline Retail: 0.26% | | | | | | | | | | | | | | | | |
Dollar General Corporation | | | | | | | | | | | 9,448 | | | | 765,760 | |
Dollar Tree Incorporated † | | | | | | | | | | | 8,603 | | | | 746,912 | |
Kohl’s Corporation | | | | | | | | | | | 6,123 | | | | 279,515 | |
Macy’s Incorporated | | | | | | | | | | | 11,003 | | | | 240,085 | |
Nordstrom Incorporated | | | | | | | | | | | 4,232 | | | | 199,539 | |
Target Corporation | | | | | | | | | | | 19,784 | | | | 1,167,454 | |
| | | | |
| | | | | | | | | | | | | | | 3,399,265 | |
| | | | | | | | | | | | | | | | |
The accompanying notes are an integral part of these financial statements.
| | | | | | |
| Portfolio of investments—September 30, 2017 | | Wells Fargo Index Asset Allocation Fund | | | 13 | |
| | | | | | | | | | | | | | | | |
| Security name | | | | | | | | Shares | | | Value | |
| | | | |
| Specialty Retail: 1.28% | | | | | | | | | | | | | | | | |
Advance Auto Parts Incorporated | | | | | | | | | | | 2,676 | | | $ | 265,459 | |
AutoZone Incorporated † | | | | | | | | | | | 1,015 | | | | 604,037 | |
Best Buy Company Incorporated | | | | | | | | | | | 9,643 | | | | 549,265 | |
CarMax Incorporated † | | | | | | | | | | | 6,679 | | | | 506,335 | |
Foot Locker Incorporated | | | | | | | | | | | 4,771 | | | | 168,035 | |
L Brands Incorporated | | | | | | | | | | | 9,031 | | | | 375,780 | |
Lowe’s Companies Incorporated | | | | | | | | | | | 30,753 | | | | 2,458,395 | |
O’Reilly Automotive Incorporated † | | | | | | | | | | | 3,211 | | | | 691,553 | |
Ross Stores Incorporated | | | | | | | | | | | 14,278 | | | | 921,930 | |
Signet Jewelers Limited | | | | | | | | | | | 2,186 | | | | 145,478 | |
The Gap Incorporated | | | | | | | | | | | 7,998 | | | | 236,181 | |
The Home Depot Incorporated | | | | | | | | | | | 42,924 | | | | 7,020,649 | |
The TJX Companies Incorporated | | | | | | | | | | | 23,229 | | | | 1,712,674 | |
Tiffany & Company | | | | | | | | | | | 3,714 | | | | 340,871 | |
Tractor Supply Company | | | | | | | | | | | 4,590 | | | | 290,501 | |
ULTA Beauty Incorporated † | | | | | | | | | | | 2,132 | | | | 481,960 | |
| | | | |
| | | | | | | | | | | | | | | 16,769,103 | |
| | | | | | | | | | | | | | | | |
| | | | |
| Textiles, Apparel & Luxury Goods: 0.38% | | | | | | | | | | | | | | | | |
Coach Incorporated | | | | | | | | | | | 10,293 | | | | 414,602 | |
HanesBrands Incorporated « | | | | | | | | | | | 13,252 | | | | 326,529 | |
Michael Kors Holdings Limited † | | | | | | | | | | | 5,534 | | | | 264,802 | |
Nike Incorporated Class B | | | | | | | | | | | 47,798 | | | | 2,478,326 | |
PVH Corporation | | | | | | | | | | | 2,823 | | | | 355,867 | |
Ralph Lauren Corporation | | | | | | | | | | | 2,018 | | | | 178,169 | |
Under Armour Incorporated Class A Ǡ | | | | | | | | | | | 6,677 | | | | 110,037 | |
Under Armour Incorporated Class C Ǡ | | | | | | | | | | | 6,737 | | | | 101,190 | |
VF Corporation | | | | | | | | | | | 11,912 | | | | 757,246 | |
| | | | |
| | | | | | | | | | | | | | | 4,986,768 | |
| | | | | | | | | | | | | | | | |
| | | | |
Consumer Staples: 4.97% | | | | | | | | | | | | | | | | |
| | | | |
| Beverages: 1.21% | | | | | | | | | | | | | | | | |
Brown-Forman Corporation Class B | | | | | | | | | | | 7,153 | | | | 388,408 | |
Constellation Brands Incorporated Class A | | | | | | | | | | | 6,268 | | | | 1,250,153 | |
Dr Pepper Snapple Group Incorporated | | | | | | | | | | | 6,652 | | | | 588,502 | |
Molson Coors Brewing Company Class B | | | | | | | | | | | 6,725 | | | | 549,029 | |
Monster Beverage Corporation † | | | | | | | | | | | 15,155 | | | | 837,314 | |
PepsiCo Incorporated | | | | | | | | | | | 52,164 | | | | 5,812,635 | |
The Coca-Cola Company | | | | | | | | | | | 140,278 | | | | 6,313,913 | |
| | | | |
| | | | | | | | | | | | | | | 15,739,954 | |
| | | | | | | | | | | | | | | | |
| | | | |
| Food & Staples Retailing: 1.07% | | | | | | | | | | | | | | | | |
Costco Wholesale Corporation | | | | | | | | | | | 15,922 | | | | 2,615,825 | |
CVS Health Corporation | | | | | | | | | | | 37,127 | | | | 3,019,168 | |
Sysco Corporation | | | | | | | | | | | 17,773 | | | | 958,853 | |
The Kroger Company | | | | | | | | | | | 32,698 | | | | 655,922 | |
Wal-Mart Stores Incorporated | | | | | | | | | | | 53,169 | | | | 4,154,626 | |
Walgreens Boots Alliance Incorporated | | | | | | | | | | | 33,479 | | | | 2,585,248 | |
| | | | |
| | | | | | | | | | | | | | | 13,989,642 | |
| | | | | | | | | | | | | | | | |
The accompanying notes are an integral part of these financial statements.
| | | | |
| 14 | | Wells Fargo Index Asset Allocation Fund | | Portfolio of investments—September 30, 2017 |
| | | | | | | | | | | | | | | | |
| Security name | | | | | | | | Shares | | | Value | |
| | | | |
| Food Products: 0.75% | | | | | | | | | | | | | | | | |
Archer Daniels Midland Company | | | | | | | | | | | 20,537 | | | $ | 873,028 | |
Campbell Soup Company | | | | | | | | | | | 7,062 | | | | 330,643 | |
ConAgra Foods Incorporated | | | | | | | | | | | 15,160 | | | | 511,498 | |
General Mills Incorporated | | | | | | | | | | | 21,137 | | | | 1,094,051 | |
Hormel Foods Corporation « | | | | | | | | | | | 9,863 | | | | 316,997 | |
Kellogg Company | | | | | | | | | | | 9,093 | | | | 567,130 | |
McCormick & Company Incorporated | | | | | | | | | | | 4,337 | | | | 445,150 | |
Mondelez International Incorporated Class A | | | | | | | | | | | 54,945 | | | | 2,234,064 | |
The Hershey Company | | | | | | | | | | | 5,156 | | | | 562,881 | |
The J.M. Smucker Company | | | | | | | | | | | 4,159 | | | | 436,404 | |
The Kraft Heinz Company | | | | | | | | | | | 21,812 | | | | 1,691,521 | |
Tyson Foods Incorporated Class A | | | | | | | | | | | 10,586 | | | | 745,784 | |
| | | | |
| | | | | | | | | | | | | | | 9,809,151 | |
| | | | | | | | | | | | | | | | |
| | | | |
| Household Products: 1.03% | | | | | | | | | | | | | | | | |
Church & Dwight Company Incorporated | | | | | | | | | | | 9,138 | | | | 442,736 | |
Colgate-Palmolive Company | | | | | | | | | | | 32,172 | | | | 2,343,730 | |
Kimberly-Clark Corporation | | | | | | | | | | | 12,911 | | | | 1,519,366 | |
The Clorox Company | | | | | | | | | | | 4,711 | | | | 621,428 | |
The Procter & Gamble Company | | | | | | | | | | | 93,029 | | | | 8,463,778 | |
| | | | |
| | | | | | | | | | | | | | | 13,391,038 | |
| | | | | | | | | | | | | | | | |
| | | | |
| Personal Products: 0.09% | | | | | | | | | | | | | | | | |
Coty Incorporated Class A | | | | | | | | | | | 17,263 | | | | 285,357 | |
The Estee Lauder Companies Incorporated Class A | | | | | | | | | | | 8,183 | | | | 882,455 | |
| | | | |
| | | | | | | | | | | | | | | 1,167,812 | |
| | | | | | | | | | | | | | | | |
| | | | |
| Tobacco: 0.82% | | | | | | | | | | | | | | | | |
Altria Group Incorporated | | | | | | | | | | | 70,124 | | | | 4,447,264 | |
Philip Morris International | | | | | | | | | | | 56,806 | | | | 6,306,034 | |
| | | | |
| | | | | | | | | | | | | | | 10,753,298 | |
| | | | | | | | | | | | | | | | |
| | | | |
Energy: 3.68% | | | | | | | | | | | | | | | | |
| | | | |
| Energy Equipment & Services: 0.51% | | | | | | | | | | | | | | | | |
Baker Hughes Incorporated | | | | | | | | | | | 15,665 | | | | 573,652 | |
Halliburton Company | | | | | | | | | | | 31,724 | | | | 1,460,256 | |
Helmerich & Payne Incorporated « | | | | | | | | | | | 3,976 | | | | 207,189 | |
National Oilwell Varco Incorporated | | | | | | | | | | | 13,890 | | | | 496,290 | |
Schlumberger Limited | | | | | | | | | | | 50,869 | | | | 3,548,621 | |
TechnipFMC plc † | | | | | | | | | | | 16,070 | | | | 448,674 | |
| | | | |
| | | | | | | | | | | | | | | 6,734,682 | |
| | | | | | | | | | | | | | | | |
| | | | |
| Oil, Gas & Consumable Fuels: 3.17% | | | | | | | | | | | | | | | | |
Anadarko Petroleum Corporation | | | | | | | | | | | 20,513 | | | | 1,002,060 | |
Andeavor Corporation | | | | | | | | | | | 5,269 | | | | 543,497 | |
Apache Corporation | | | | | | | | | | | 13,916 | | | | 637,353 | |
Cabot Oil & Gas Corporation | | | | | | | | | | | 16,784 | | | | 448,972 | |
Chesapeake Energy Corporation Ǡ | | | | | | | | | | | 33,278 | | | | 143,095 | |
The accompanying notes are an integral part of these financial statements.
| | | | | | |
| Portfolio of investments—September 30, 2017 | | Wells Fargo Index Asset Allocation Fund | | | 15 | |
| | | | | | | | | | | | | | | | |
| Security name | | | | | | | | Shares | | | Value | |
| | | | |
| Oil, Gas & Consumable Fuels (continued) | | | | | | | | | | | | | | | | |
Chevron Corporation | | | | | | | | | | | 69,324 | | | $ | 8,145,570 | |
Cimarex Energy Company | | | | | | | | | | | 3,488 | | | | 396,481 | |
Concho Resources Incorporated † | | | | | | | | | | | 5,442 | | | | 716,820 | |
ConocoPhillips | | | | | | | | | | | 44,508 | | | | 2,227,625 | |
Devon Energy Corporation | | | | | | | | | | | 19,400 | | | | 712,174 | |
EOG Resources Incorporated | | | | | | | | | | | 21,112 | | | | 2,042,375 | |
EQT Corporation | | | | | | | | | | | 6,304 | | | | 411,273 | |
Exxon Mobil Corporation | | | | | | | | | | | 154,876 | | | | 12,696,734 | |
Hess Corporation | | | | | | | | | | | 9,869 | | | | 462,757 | |
Kinder Morgan Incorporated | | | | | | | | | | | 70,120 | | | | 1,344,902 | |
Marathon Oil Corporation | | | | | | | | | | | 31,090 | | | | 421,580 | |
Marathon Petroleum Corporation | | | | | | | | | | | 18,514 | | | | 1,038,265 | |
Newfield Exploration Company † | | | | | | | | | | | 7,323 | | | | 217,273 | |
Noble Energy Incorporated | | | | | | | | | | | 17,782 | | | | 504,298 | |
Occidental Petroleum Corporation | | | | | | | | | | | 27,996 | | | | 1,797,623 | |
ONEOK Incorporated | | | | | | | | | | | 13,858 | | | | 767,872 | |
Phillips 66 Company | | | | | | | | | | | 15,729 | | | | 1,440,934 | |
Pioneer Natural Resources Company | | | | | | | | | | | 6,223 | | | | 918,141 | |
Range Resources Corporation | | | | | | | | | | | 8,330 | | | | 163,018 | |
The Williams Companies Incorporated | | | | | | | | | | | 30,257 | | | | 908,013 | |
Valero Energy Corporation | | | | | | | | | | | 16,156 | | | | 1,242,881 | |
| | | | |
| | | | | | | | | | | | | | | 41,351,586 | |
| | | | | | | | | | | | | | | | |
| | | | |
Financials: 8.83% | | | | | | | | | | | | | | | | |
| | | | |
| Banks: 3.90% | | | | | | | | | | | | | | | | |
Bank of America Corporation | | | | | | | | | | | 358,244 | | | | 9,077,903 | |
BB&T Corporation | | | | | | | | | | | 29,456 | | | | 1,382,665 | |
Citigroup Incorporated | | | | | | | | | | | 99,750 | | | | 7,255,815 | |
Citizens Financial Group Incorporated | | | | | | | | | | | 18,312 | | | | 693,475 | |
Comerica Incorporated | | | | | | | | | | | 6,445 | | | | 491,496 | |
Fifth Third Bancorp | | | | | | | | | | | 26,918 | | | | 753,166 | |
Huntington Bancshares Incorporated | | | | | | | | | | | 39,954 | | | | 557,758 | |
JPMorgan Chase & Company | | | | | | | | | | | 128,650 | | | | 12,287,362 | |
KeyCorp | | | | | | | | | | | 39,762 | | | | 748,321 | |
M&T Bank Corporation | | | | | | | | | | | 5,548 | | | | 893,450 | |
People’s United Financial Incorporated | | | | | | | | | | | 12,570 | | | | 228,020 | |
PNC Financial Services Group Incorporated | | | | | | | | | | | 17,505 | | | | 2,359,149 | |
Regions Financial Corporation | | | | | | | | | | | 43,689 | | | | 665,383 | |
SunTrust Banks Incorporated | | | | | | | | | | | 17,542 | | | | 1,048,485 | |
US Bancorp | | | | | | | | | | | 58,145 | | | | 3,115,991 | |
Wells Fargo & Company (l) | | | | | | | | | | | 164,057 | | | | 9,047,744 | |
Zions Bancorporation | | | | | | | | | | | 7,399 | | | | 349,085 | |
| | | | |
| | | | | | | | | | | | | | | 50,955,268 | |
| | | | | | | | | | | | | | | | |
| | | | |
| Capital Markets: 1.82% | | | | | | | | | | | | | | | | |
Affiliated Managers Group Incorporated | | | | | | | | | | | 2,055 | | | | 390,101 | |
Ameriprise Financial Incorporated | | | | | | | | | | | 5,484 | | | | 814,429 | |
Bank of New York Mellon Corporation | | | | | | | | | | | 37,710 | | | | 1,999,384 | |
BlackRock Incorporated | | | | | | | | | | | 4,524 | | | | 2,022,635 | |
The accompanying notes are an integral part of these financial statements.
| | | | |
| 16 | | Wells Fargo Index Asset Allocation Fund | | Portfolio of investments—September 30, 2017 |
| | | | | | | | | | | | | | | | |
| Security name | | | | | | | | Shares | | | Value | |
| | | | |
| Capital Markets (continued) | | | | | | | | | | | | | | | | |
CBOE Holdings Incorporated | | | | | | | | | | | 4,119 | | | $ | 443,328 | |
CME Group Incorporated | | | | | | | | | | | 12,406 | | | | 1,683,246 | |
E*TRADE Financial Corporation † | | | | | | | | | | | 10,033 | | | | 437,539 | |
Franklin Resources Incorporated | | | | | | | | | | | 12,028 | | | | 535,366 | |
Intercontinental Exchange Incorporated | | | | | | | | | | | 21,512 | | | | 1,477,874 | |
Invesco Limited | | | | | | | | | | | 14,881 | | | | 521,430 | |
Moody’s Corporation | | | | | | | | | | | 6,067 | | | | 844,587 | |
Morgan Stanley | | | | | | | | | | | 51,577 | | | | 2,484,464 | |
Northern Trust Corporation | | | | | | | | | | | 7,846 | | | | 721,283 | |
Raymond James Financial Incorporated | | | | | | | | | | | 4,693 | | | | 395,761 | |
S&P Global Incorporated | | | | | | | | | | | 9,378 | | | | 1,465,875 | |
State Street Corporation | | | | | | | | | | | 13,658 | | | | 1,304,885 | |
T. Rowe Price Group Incorporated | | | | | | | | | | | 8,821 | | | | 799,624 | |
The Charles Schwab Corporation | | | | | | | | | | | 43,435 | | | | 1,899,847 | |
The Goldman Sachs Group Incorporated | | | | | | | | | | | 13,139 | | | | 3,116,439 | |
The NASDAQ OMX Group Incorporated | | | | | | | | | | | 4,267 | | | | 330,991 | |
| | | | |
| | | | | | | | | | | | | | | 23,689,088 | |
| | | | | | | | | | | | | | | | |
| | | | |
| Consumer Finance: 0.45% | | | | | | | | | | | | | | | | |
American Express Company | | | | | | | | | | | 26,893 | | | | 2,432,741 | |
Capital One Financial Corporation | | | | | | | | | | | 17,685 | | | | 1,497,212 | |
Discover Financial Services | | | | | | | | | | | 13,610 | | | | 877,573 | |
Navient Corporation | | | | | | | | | | | 10,010 | | | | 150,350 | |
Synchrony Financial | | | | | | | | | | | 27,389 | | | | 850,428 | |
| | | | |
| | | | | | | | | | | | | | | 5,808,304 | |
| | | | | | | | | | | | | | | | |
| | | | |
| Diversified Financial Services: 1.01% | | | | | | | | | | | | | | | | |
Berkshire Hathaway Incorporated Class B † | | | | | | | | | | | 70,336 | | | | 12,893,996 | |
Leucadia National Corporation | | | | | | | | | | | 11,591 | | | | 292,673 | |
| | | | |
| | | | | | | | | | | | | | | 13,186,669 | |
| | | | | | | | | | | | | | | | |
| | | | |
| Insurance: 1.65% | | | | | | | | | | | | | | | | |
AFLAC Incorporated | | | | | | | | | | | 14,435 | | | | 1,174,865 | |
American International Group Incorporated | | | | | | | | | | | 32,961 | | | | 2,023,476 | |
Aon plc | | | | | | | | | | | 9,307 | | | | 1,359,753 | |
Arthur J. Gallagher & Company | | | | | | | | | | | 6,582 | | | | 405,122 | |
Assurant Incorporated | | | | | | | | | | | 1,966 | | | | 187,792 | |
Brighthouse Financial Incorporated † | | | | | | | | | | | 3,510 | | | | 213,408 | |
Chubb Limited | | | | | | | | | | | 16,994 | | | | 2,422,495 | |
Cincinnati Financial Corporation | | | | | | | | | | | 5,456 | | | | 417,766 | |
Everest Reinsurance Group Limited | | | | | | | | | | | 1,489 | | | | 340,073 | |
Lincoln National Corporation | | | | | | | | | | | 8,104 | | | | 595,482 | |
Loews Corporation | | | | | | | | | | | 10,083 | | | | 482,572 | |
Marsh & McLennan Companies Incorporated | | | | | | | | | | | 18,743 | | | | 1,570,851 | |
MetLife Incorporated | | | | | | | | | | | 38,801 | | | | 2,015,712 | |
Principal Financial Group Incorporated | | | | | | | | | | | 9,805 | | | | 630,854 | |
Prudential Financial Incorporated | | | | | | | | | | | 15,574 | | | | 1,655,828 | |
The Allstate Corporation | | | | | | | | | | | 13,187 | | | | 1,212,017 | |
The Hartford Financial Services Group Incorporated | | | | | | | | | | | 13,302 | | | | 737,330 | |
The accompanying notes are an integral part of these financial statements.
| | | | | | |
| Portfolio of investments—September 30, 2017 | | Wells Fargo Index Asset Allocation Fund | | | 17 | |
| | | | | | | | | | | | | | | | |
| Security name | | | | | | | | Shares | | | Value | |
| | | | |
| Insurance (continued) | | | | | | | | | | | | | | | | |
The Progressive Corporation | | | | | | | | | | | 21,288 | | | $ | 1,030,765 | |
The Travelers Companies Incorporated | | | | | | | | | | | 10,072 | | | | 1,234,021 | |
Torchmark Corporation | | | | | | | | | | | 3,953 | | | | 316,596 | |
Unum Group | | | | | | | | | | | 8,247 | | | | 421,669 | |
Willis Towers Watson plc | | | | | | | | | | | 4,901 | | | | 755,881 | |
XL Group Limited | | | | | | | | | | | 9,398 | | | | 370,751 | |
| | | | |
| | | | | | | | | | | | | | | 21,575,079 | |
| | | | | | | | | | | | | | | | |
| | | | |
Health Care: 8.75% | | | | | | | | | | | | | | | | |
| | | | |
| Biotechnology: 1.92% | | | | | | | | | | | | | | | | |
AbbVie Incorporated | | | | | | | | | | | 57,687 | | | | 5,126,067 | |
Alexion Pharmaceuticals Incorporated † | | | | | | | | | | | 8,074 | | | | 1,132,701 | |
Amgen Incorporated | | | | | | | | | | | 26,577 | | | | 4,955,282 | |
Biogen Incorporated | | | | | | | | | | | 7,691 | | | | 2,408,206 | |
Celgene Corporation † | | | | | | | | | | | 28,634 | | | | 4,175,410 | |
Gilead Sciences Incorporated | | | | | | | | | | | 47,670 | | | | 3,862,223 | |
Incyte Corporation † | | | | | | | | | | | 6,197 | | | | 723,438 | |
Regeneron Pharmaceuticals Incorporated † | | | | | | | | | | | 2,797 | | | | 1,250,595 | |
Vertex Pharmaceuticals Incorporated † | | | | | | | | | | | 9,196 | | | | 1,398,160 | |
| | | | |
| | | | | | | | | | | | | | | 25,032,082 | |
| | | | | | | | | | | | | | | | |
| | | | |
| Health Care Equipment & Supplies: 1.69% | | | | | | | | | | | | | | | | |
Abbott Laboratories | | | | | | | | | | | 63,574 | | | | 3,392,309 | |
Align Technology Incorporated † | | | | | | | | | | | 2,640 | | �� | | 491,753 | |
Baxter International Incorporated | | | | | | | | | | | 18,340 | | | | 1,150,835 | |
Becton Dickinson & Company | | | | | | | | | | | 8,294 | | | | 1,625,209 | |
Boston Scientific Corporation † | | | | | | | | | | | 50,220 | | | | 1,464,917 | |
C.R. Bard Incorporated | | | | | | | | | | | 2,651 | | | | 849,646 | |
Danaher Corporation | | | | | | | | | | | 22,289 | | | | 1,911,950 | |
Dentsply Sirona Incorporated | | | | | | | | | | | 8,394 | | | | 502,045 | |
Edwards Lifesciences Corporation † | | | | | | | | | | | 7,700 | | | | 841,687 | |
Hologic Incorporated † | | | | | | | | | | | 10,200 | | | | 374,238 | |
IDEXX Laboratories Incorporated † | | | | | | | | | | | 3,190 | | | | 496,013 | |
Intuitive Surgical Incorporated † | | | | | | | | | | | 1,363 | | | | 1,425,534 | |
Medtronic plc | | | | | | | | | | | 49,525 | | | | 3,851,559 | |
ResMed Incorporated | | | | | | | | | | | 5,185 | | | | 399,038 | |
Stryker Corporation | | | | | | | | | | | 11,746 | | | | 1,668,167 | |
The Cooper Companies Incorporated | | | | | | | | | | | 1,789 | | | | 424,190 | |
Varian Medical Systems Incorporated | | | | | | | | | | | 3,353 | | | | 335,501 | |
Zimmer Biomet Holdings Incorporated | | | | | | | | | | | 7,388 | | | | 865,061 | |
| | | | |
| | | | | | | | | | | | | | | 22,069,652 | |
| | | | | | | | | | | | | | | | |
| | | | |
| Health Care Providers & Services: 1.64% | | | | | | | | | | | | | | | | |
Aetna Incorporated | | | | | | | | | | | 12,060 | | | | 1,917,661 | |
AmerisourceBergen Corporation | | | | | | | | | | | 5,882 | | | | 486,736 | |
Anthem Incorporated | | | | | | | | | | | 9,555 | | | | 1,814,303 | |
Cardinal Health Incorporated | | | | | | | | | | | 11,512 | | | | 770,383 | |
Centene Corporation † | | | | | | | | | | | 6,284 | | | | 608,103 | |
Cigna Corporation | | | | | | | | | | | 9,181 | | | | 1,716,296 | |
The accompanying notes are an integral part of these financial statements.
| | | | |
| 18 | | Wells Fargo Index Asset Allocation Fund | | Portfolio of investments—September 30, 2017 |
| | | | | | | | | | | | | | | | |
| Security name | | | | | | | | Shares | | | Value | |
| | | | |
| Health Care Providers & Services (continued) | | | | | | | | | | | | | | | | |
DaVita HealthCare Partners Incorporated † | | | | | | | | | | | 5,588 | | | $ | 331,871 | |
Envision Healthcare Corporation † | | | | | | | | | | | 4,405 | | | | 198,005 | |
Express Scripts Holding Company † | | | | | | | | | | | 20,971 | | | | 1,327,884 | |
HCA Holdings Incorporated † | | | | | | | | | | | 10,548 | | | | 839,515 | |
Henry Schein Incorporated † | | | | | | | | | | | 5,768 | | | | 472,918 | |
Humana Incorporated | | | | | | | | | | | 5,270 | | | | 1,283,930 | |
Laboratory Corporation of America Holdings † | | | | | | | | | | | 3,713 | | | | 560,552 | |
McKesson Corporation | | | | | | | | | | | 7,656 | | | | 1,176,038 | |
Patterson Companies Incorporated | | | | | | | | | | | 3,004 | | | | 116,105 | |
Quest Diagnostics Incorporated | | | | | | | | | | | 4,975 | | | | 465,859 | |
UnitedHealth Group Incorporated | | | | | | | | | | | 35,308 | | | | 6,915,072 | |
Universal Health Services Incorporated Class B | | | | | | | | | | | 3,210 | | | | 356,117 | |
| | | | |
| | | | | | | | | | | | | | | 21,357,348 | |
| | | | | | | | | | | | | | | | |
| | | | |
| Health Care Technology: 0.06% | | | | | | | | | | | | | | | | |
Cerner Corporation † | | | | | | | | | | | 11,443 | | | | 816,115 | |
| | | | | | | | | | | | | | | | |
| | | | |
| Life Sciences Tools & Services: 0.50% | | | | | | | | | | | | | | | | |
Agilent Technologies Incorporated | | | | | | | | | | | 11,736 | | | | 753,451 | |
Illumina Incorporated † | | | | | | | | | | | 5,317 | | | | 1,059,146 | |
Mettler-Toledo International Incorporated † | | | | | | | | | | | 939 | | | | 587,964 | |
PerkinElmer Incorporated | | | | | | | | | | | 4,033 | | | | 278,156 | |
Quintiles Transnational Holdings Incorporated † | | | | | | | | | | | 5,533 | | | | 526,022 | |
Thermo Fisher Scientific Incorporated | | | | | | | | | | | 14,633 | | | | 2,768,564 | |
Waters Corporation † | | | | | | | | | | | 2,928 | | | | 525,635 | |
| | | | |
| | | | | | | | | | | | | | | 6,498,938 | |
| | | | | | | | | | | | | | | | |
| | | | |
| Pharmaceuticals: 2.94% | | | | | | | | | | | | | | | | |
Allergan plc | | | | | | | | | | | 12,087 | | | | 2,477,231 | |
Bristol-Myers Squibb Company | | | | | | | | | | | 59,738 | | | | 3,807,700 | |
Eli Lilly & Company | | | | | | | | | | | 35,416 | | | | 3,029,485 | |
Johnson & Johnson | | | | | | | | | | | 98,100 | | | | 12,753,981 | |
Merck & Company Incorporated | | | | | | | | | | | 99,810 | | | | 6,390,834 | |
Mylan NV † | | | | | | | | | | | 19,457 | | | | 610,366 | |
Perrigo Company plc | | | | | | | | | | | 4,830 | | | | 408,860 | |
Pfizer Incorporated | | | | | | | | | | | 218,510 | | | | 7,800,807 | |
Zoetis Incorporated | | | | | | | | | | | 17,918 | | | | 1,142,452 | |
| | | | |
| | | | | | | | | | | | | | | 38,421,716 | |
| | | | | | | | | | | | | | | | |
| | | | |
Industrials: 6.18% | | | | | | | | | | | | | | | | |
| | | | |
| Aerospace & Defense: 1.51% | | | | | | | | | | | | | | | | |
Arconic Incorporated | | | | | | | | | | | 14,167 | | | | 352,475 | |
General Dynamics Corporation | | | | | | | | | | | 10,203 | | | | 2,097,533 | |
L-3 Technologies Incorporated | | | | | | | | | | | 2,874 | | | | 541,548 | |
Lockheed Martin Corporation | | | | | | | | | | | 9,153 | | | | 2,840,084 | |
Northrop Grumman Corporation | | | | | | | | | | | 6,417 | | | | 1,846,299 | |
Raytheon Company | | | | | | | | | | | 10,614 | | | | 1,980,360 | |
Rockwell Collins Incorporated | | | | | | | | | | | 5,923 | | | | 774,195 | |
Textron Incorporated | | | | | | | | | | | 9,698 | | | | 522,528 | |
The accompanying notes are an integral part of these financial statements.
| | | | | | |
| Portfolio of investments—September 30, 2017 | | Wells Fargo Index Asset Allocation Fund | | | 19 | |
| | | | | | | | | | | | | | | | |
| Security name | | | | | | | | Shares | | | Value | |
| | | | |
| Aerospace & Defense (continued) | | | | | | | | | | | | | | | | |
The Boeing Company | | | | | | | | | | | 20,336 | | | $ | 5,169,615 | |
TransDigm Group Incorporated | | | | | | | | | | | 1,779 | | | | 454,801 | |
United Technologies Corporation | | | | | | | | | | | 27,053 | | | | 3,140,312 | |
| | | | |
| | | | | | | | | | | | | | | 19,719,750 | |
| | | | | | | | | | | | | | | | |
| | | | |
| Air Freight & Logistics: 0.45% | | | | | | | | | | | | | | | | |
C.H. Robinson Worldwide Incorporated | | | | | | | | | | | 5,131 | | | | 390,469 | |
Expeditors International of Washington Incorporated | | | | | | | | | | | 6,594 | | | | 394,717 | |
FedEx Corporation | | | | | | | | | | | 8,997 | | | | 2,029,543 | |
United Parcel Service Incorporated Class B | | | | | | | | | | | 25,102 | | | | 3,014,499 | |
| | | | |
| | | | | | | | | | | | | | | 5,829,228 | |
| | | | | | | | | | | | | | | | |
| | | | |
| Airlines: 0.30% | | | | | | | | | | | | | | | | |
Alaska Air Group Incorporated | | | | | | | | | | | 4,489 | | | | 342,376 | |
American Airlines Group Incorporated | | | | | | | | | | | 15,768 | | | | 748,822 | |
Delta Air Lines Incorporated | | | | | | | | | | | 24,282 | | | | 1,170,878 | |
Southwest Airlines Company | | | | | | | | | | | 20,098 | | | | 1,125,086 | |
United Continental Holdings Incorporated † | | | | | | | | | | | 9,369 | | | | 570,385 | |
| | | | |
| | | | | | | | | | | | | | | 3,957,547 | |
| | | | | | | | | | | | | | | | |
| | | | |
| Building Products: 0.22% | | | | | | | | | | | | | | | | |
A.O. Smith Corporation | | | | | | | | | | | 5,340 | | | | 317,356 | |
Allegion plc | | | | | | | | | | | 3,470 | | | | 300,051 | |
Fortune Brands Home & Security Incorporated | | | | | | | | | | | 5,596 | | | | 376,219 | |
Johnson Controls International plc | | | | | | | | | | | 34,054 | | | | 1,372,036 | |
Masco Corporation | | | | | | | | | | | 11,612 | | | | 452,984 | |
| | | | |
| | | | | | | | | | | | | | | 2,818,646 | |
| | | | | | | | | | | | | | | | |
| | | | |
| Commercial Services & Supplies: 0.18% | | | | | | | | | | | | | | | | |
Cintas Corporation | | | | | | | | | | | 3,119 | | | | 450,009 | |
Republic Services Incorporated | | | | | | | | | | | 8,369 | | | | 552,856 | |
Stericycle Incorporated † | | | | | | | | | | | 3,102 | | | | 222,165 | |
Waste Management Incorporated | | | | | | | | | | | 14,780 | | | | 1,156,831 | |
| | | | |
| | | | | | | | | | | | | | | 2,381,861 | |
| | | | | | | | | | | | | | | | |
| | | | |
| Construction & Engineering: 0.05% | | | | | | | | | | | | | | | | |
Fluor Corporation | | | | | | | | | | | 5,102 | | | | 214,794 | |
Jacobs Engineering Group Incorporated | | | | | | | | | | | 4,397 | | | | 256,213 | |
Quanta Services Incorporated † | | | | | | | | | | | 5,510 | | | | 205,909 | |
| | | | |
| | | | | | | | | | | | | | | 676,916 | |
| | | | | | | | | | | | | | | | |
| | | | |
| Electrical Equipment: 0.34% | | | | | | | | | | | | | | | | |
Acuity Brands Incorporated | | | | | | | | | | | 1,529 | | | | 261,887 | |
AMETEK Incorporated | | | | | | | | | | | 8,459 | | | | 558,632 | |
Eaton Corporation plc | | | | | | | | | | | 16,291 | | | | 1,250,986 | |
Emerson Electric Company | | | | | | | | | | | 23,426 | | | | 1,472,090 | |
Rockwell Automation Incorporated | | | | | | | | | | | 4,695 | | | | 836,696 | |
| | | | |
| | | | | | | | | | | | | | | 4,380,291 | |
| | | | | | | | | | | | | | | | |
The accompanying notes are an integral part of these financial statements.
| | | | |
| 20 | | Wells Fargo Index Asset Allocation Fund | | Portfolio of investments—September 30, 2017 |
| | | | | | | | | | | | | | | | |
| Security name | | | | | | | | Shares | | | Value | |
| | | | |
| Industrial Conglomerates: 1.31% | | | | | | | | | | | | | | | | |
3M Company | | | | | | | | | | | 21,803 | | | $ | 4,576,450 | |
General Electric Company | | | | | | | | | | | 317,959 | | | | 7,688,249 | |
Honeywell International Incorporated | | | | | | | | | | | 27,802 | | | | 3,940,655 | |
Roper Industries Incorporated | | | | | | | | | | | 3,733 | | | | 908,612 | |
| | | | |
| | | | | | | | | | | | | | | 17,113,966 | |
| | | | | | | | | | | | | | | | |
| | | | |
| Machinery: 0.99% | | | | | | | | | | | | | | | | |
Caterpillar Incorporated | | | | | | | | | | | 21,615 | | | | 2,695,607 | |
Cummins Incorporated | | | | | | | | | | | 5,743 | | | | 964,996 | |
Deere & Company | | | | | | | | | | | 11,690 | | | | 1,468,147 | |
Dover Corporation | | | | | | | | | | | 5,689 | | | | 519,918 | |
Flowserve Corporation | | | | | | | | | | | 4,766 | | | | 202,984 | |
Fortive Corporation | | | | | | | | | | | 11,162 | | | | 790,158 | |
Illinois Tool Works Incorporated | | | | | | | | | | | 11,334 | | | | 1,676,979 | |
Ingersoll-Rand plc | | | | | | | | | | | 9,291 | | | | 828,478 | |
Paccar Incorporated | | | | | | | | | | | 12,832 | | | | 928,267 | |
Parker-Hannifin Corporation | | | | | | | | | | | 4,884 | | | | 854,798 | |
Pentair plc | | | | | | | | | | | 6,045 | | | | 410,818 | |
Snap-on Incorporated | | | | | | | | | | | 2,102 | | | | 313,219 | |
Stanley Black & Decker Incorporated | | | | | | | | | | | 5,613 | | | | 847,395 | |
Xylem Incorporated | | | | | | | | | | | 6,560 | | | | 410,853 | |
| | | | |
| | | | | | | | | | | | | | | 12,912,617 | |
| | | | | | | | | | | | | | | | |
| | | | |
| Professional Services: 0.17% | | | | | | | | | | | | | | | | |
Equifax Incorporated | | | | | | | | | | | 4,437 | | | | 470,278 | |
IHS Markit Limited † | | | | | | | | | | | 13,265 | | | | 584,721 | |
Nielsen Holdings plc | | | | | | | | | | | 12,304 | | | | 510,001 | |
Robert Half International Incorporated | | | | | | | | | | | 4,619 | | | | 232,520 | |
Verisk Analytics Incorporated † | | | | | | | | | | | 5,683 | | | | 472,769 | |
| | | | |
| | | | | | | | | | | | | | | 2,270,289 | |
| | | | | | | | | | | | | | | | |
| | | | |
| Road & Rail: 0.56% | | | | | | | | | | | | | | | | |
CSX Corporation | | | | | | | | | | | 33,172 | | | | 1,799,913 | |
J.B. Hunt Transport Services Incorporated | | | | | | | | | | | 3,120 | | | | 346,570 | |
Kansas City Southern | | | | | | | | | | | 3,843 | | | | 417,657 | |
Norfolk Southern Corporation | | | | | | | | | | | 10,496 | | | | 1,387,991 | |
Union Pacific Corporation | | | | | | | | | | | 29,114 | | | | 3,376,351 | |
| | | | |
| | | | | | | | | | | | | | | 7,328,482 | |
| | | | | | | | | | | | | | | | |
| | | | |
| Trading Companies & Distributors: 0.10% | | | | | | | | | | | | | | | | |
Fastenal Company | | | | | | | | | | | 10,513 | | | | 479,183 | |
United Rentals Incorporated † | | | | | | | | | | | 3,091 | | | | 428,845 | |
W.W. Grainger Incorporated « | | | | | | | | | | | 1,917 | | | | 344,581 | |
| | | | |
| | | | | | | | | | | | | | | 1,252,609 | |
| | | | | | | | | | | | | | | | |
| | | | |
Information Technology: 14.00% | | | | | | | | | | | | | | | | |
| | | | |
| Communications Equipment: 0.60% | | | | | | | | | | | | | | | | |
Cisco Systems Incorporated | | | | | | | | | | | 182,517 | | | | 6,138,047 | |
F5 Networks Incorporated † | | | | | | | | | | | 2,320 | | | | 279,699 | |
The accompanying notes are an integral part of these financial statements.
| | | | | | |
| Portfolio of investments—September 30, 2017 | | Wells Fargo Index Asset Allocation Fund | | | 21 | |
| | | | | | | | | | | | | | | | |
| Security name | | | | | | | | Shares | | | Value | |
| | | | |
| Communications Equipment (continued) | | | | | | | | | | | | | | | | |
Harris Corporation | | | | | | | | | | | 4,386 | | | $ | 577,548 | |
Juniper Networks Incorporated | | | | | | | | | | | 13,887 | | | | 386,475 | |
Motorola Solutions Incorporated | | | | | | | | | | | 5,937 | | | | 503,873 | |
| | | | |
| | | | | | | | | | | | | | | 7,885,642 | |
| | | | | | | | | | | | | | | | |
| | | | |
| Electronic Equipment, Instruments & Components: 0.25% | | | | | | | | | | | | | | | | |
Amphenol Corporation Class A | | | | | | | | | | | 11,159 | | | | 944,498 | |
Corning Incorporated | | | | | | | | | | | 32,944 | | | | 985,684 | |
FLIR Systems Incorporated | | | | | | | | | | | 5,037 | | | | 195,990 | |
TE Connectivity Limited | | | | | | | | | | | 12,910 | | | | 1,072,305 | |
| | | | |
| | | | | | | | | | | | | | | 3,198,477 | |
| | | | | | | | | | | | | | | | |
| | | | |
| Internet Software & Services: 2.90% | | | | | | | | | | | | | | | | |
Akamai Technologies Incorporated † | | | | | | | | | | | 6,253 | | | | 304,646 | |
Alphabet Incorporated Class A † | | | | | | | | | | | 10,860 | | | | 10,574,599 | |
Alphabet Incorporated Class C † | | | | | | | | | | | 10,999 | | | | 10,549,251 | |
eBay Incorporated † | | | | | | | | | | | 36,315 | | | | 1,396,675 | |
Facebook Incorporated Class A † | | | | | | | | | | | 86,176 | | | | 14,724,893 | |
VeriSign Incorporated Ǡ | | | | | | | | | | | 3,139 | | | | 333,958 | |
| | | | |
| | | | | | | | | | | | | | | 37,884,022 | |
| | | | | | | | | | | | | | | | |
| | | | |
| IT Services: 2.41% | | | | | | | | | | | | | | | | |
Accenture plc Class A | | | | | | | | | | | 22,582 | | | | 3,050,151 | |
Alliance Data Systems Corporation | | | | | | | | | | | 1,757 | | | | 389,263 | |
Automatic Data Processing Incorporated | | | | | | | | | | | 16,222 | | | | 1,773,389 | |
Cognizant Technology Solutions Corporation Class A | | | | | | | | | | | 21,556 | | | | 1,563,672 | |
CSRA Incorporated | | | | | | | | | | | 5,958 | | | | 192,265 | |
DXC Technology Company | | | | | | | | | | | 10,378 | | | | 891,263 | |
Fidelity National Information Services Incorporated | | | | | | | | | | | 12,177 | | | | 1,137,210 | |
Fiserv Incorporated † | | | | | | | | | | | 7,708 | | | | 994,024 | |
Gartner Incorporated † | | | | | | | | | | | 3,316 | | | | 412,544 | |
Global Payments Incorporated | | | | | | | | | | | 5,548 | | | | 527,226 | |
International Business Machines Corporation | | | | | | | | | | | 31,603 | | | | 4,584,963 | |
MasterCard Incorporated Class A | | | | | | | | | | | 34,128 | | | | 4,818,874 | |
Paychex Incorporated | | | | | | | | | | | 11,695 | | | | 701,232 | |
PayPal Holdings Incorporated † | | | | | | | | | | | 41,234 | | | | 2,640,213 | |
The Western Union Company | | | | | | | | | | | 16,997 | | | | 326,342 | |
Total System Services Incorporated | | | | | | | | | | | 6,114 | | | | 400,467 | |
Visa Incorporated Class A | | | | | | | | | | | 66,648 | | | | 7,014,036 | |
| | | | |
| | | | | | | | | | | | | | | 31,417,134 | |
| | | | | | | | | | | | | | | | |
| | | | |
| Semiconductors & Semiconductor Equipment: 2.25% | | | | | | | | | | | | | | | | |
Advanced Micro Devices Incorporated Ǡ | | | | | | | | | | | 29,400 | | | | 374,850 | |
Analog Devices Incorporated | | | | | | | | | | | 13,438 | | | | 1,157,952 | |
Applied Materials Incorporated | | | | | | | | | | | 38,873 | | | | 2,024,895 | |
Broadcom Limited | | | | | | | | | | | 14,810 | | | | 3,592,017 | |
Intel Corporation | | | | | | | | | | | 171,239 | | | | 6,520,781 | |
KLA-Tencor Corporation | | | | | | | | | | | 5,739 | | | | 608,334 | |
Lam Research Corporation | | | | | | | | | | | 5,942 | | | | 1,099,508 | |
The accompanying notes are an integral part of these financial statements.
| | | | |
| 22 | | Wells Fargo Index Asset Allocation Fund | | Portfolio of investments—September 30, 2017 |
| | | | | | | | | | | | | | | | |
| Security name | | | | | | | | Shares | | | Value | |
| | | | |
| Semiconductors & Semiconductor Equipment (continued) | | | | | | | | | | | | | | | | |
Microchip Technology Incorporated « | | | | | | | | | | | 8,506 | | | $ | 763,669 | |
Micron Technology Incorporated † | | | | | | | | | | | 40,634 | | | | 1,598,135 | |
NVIDIA Corporation | | | | | | | | | | | 21,862 | | | | 3,908,270 | |
Qorvo Incorporated † | | | | | | | | | | | 4,599 | | | | 325,057 | |
QUALCOMM Incorporated | | | | | | | | | | | 53,946 | | | | 2,796,561 | |
Skyworks Solutions Incorporated | | | | | | | | | | | 6,634 | | | | 676,005 | |
Texas Instruments Incorporated | | | | | | | | | | | 36,215 | | | | 3,246,313 | |
Xilinx Incorporated | | | | | | | | | | | 9,108 | | | | 645,120 | |
| | | | |
| | | | | | | | | | | | | | | 29,337,467 | |
| | | | | | | | | | | | | | | | |
| | | | |
| Software: 3.06% | | | | | | | | | | | | | | | | |
Activision Blizzard Incorporated | | | | | | | | | | | 27,446 | | | | 1,770,541 | |
Adobe Systems Incorporated † | | | | | | | | | | | 18,031 | | | | 2,689,865 | |
Ansys Incorporated † | | | | | | | | | | | 3,108 | | | | 381,445 | |
Autodesk Incorporated † | | | | | | | | | | | 8,007 | | | | 898,866 | |
CA Incorporated | | | | | | | | | | | 11,520 | | | | 384,538 | |
Cadence Design Systems Incorporated † | | | | | | | | | | | 10,246 | | | | 404,410 | |
Citrix Systems Incorporated | | | | | | | | | | | 5,259 | | | | 403,996 | |
Electronic Arts Incorporated † | | | | | | | | | | | 11,263 | | | | 1,329,710 | |
Intuit Incorporated | | | | | | | | | | | 8,904 | | | | 1,265,615 | |
Microsoft Corporation | | | | | | | | | | | 280,510 | | | | 20,895,190 | |
Oracle Corporation | | | | | | | | | | | 110,060 | | | | 5,321,401 | |
Red Hat Incorporated † | | | | | | | | | | | 6,467 | | | | 716,932 | |
Salesforce.com Incorporated † | | | | | | | | | | | 24,932 | | | | 2,329,147 | |
Symantec Corporation | | | | | | | | | | | 22,544 | | | | 739,669 | |
Synopsys Incorporated † | | | | | | | | | | | 5,488 | | | | 441,949 | |
| | | | |
| | | | | | | | | | | | | | | 39,973,274 | |
| | | | | | | | | | | | | | | | |
| | | | |
| Technology Hardware, Storage & Peripherals: 2.53% | | | | | | | | | | | | | | | | |
Apple Incorporated | | | | | | | | | | | 187,953 | | | | 28,967,316 | |
Hewlett Packard Enterprise Company | | | | | | | | | | | 59,741 | | | | 878,790 | |
HP Incorporated | | | | | | | | | | | 60,977 | | | | 1,217,101 | |
NetApp Incorporated | | | | | | | | | | | 9,841 | | | | 430,642 | |
Seagate Technology plc | | | | | | | | | | | 10,689 | | | | 354,554 | |
Western Digital Corporation | | | | | | | | | | | 10,814 | | | | 934,330 | |
Xerox Corporation | | | | | | | | | | | 7,783 | | | | 259,096 | |
| | | | |
| | | | | | | | | | | | | | | 33,041,829 | |
| | | | | | | | | | | | | | | | |
| | | | |
Materials: 1.80% | | | | | | | | | | | | | | | | |
| | | | |
| Chemicals: 1.34% | | | | | | | | | | | | | | | | |
Air Products & Chemicals Incorporated | | | | | | | | | | | 7,975 | | | | 1,205,980 | |
Albemarle Corporation | | | | | | | | | | | 4,047 | | | | 551,647 | |
CF Industries Holdings Incorporated | | | | | | | | | | | 8,453 | | | | 297,207 | |
DowDupont Incorporated | | | | | | | | | | | 85,057 | | | | 5,888,496 | |
Eastman Chemical Company | | | | | | | | | | | 5,290 | | | | 478,692 | |
Ecolab Incorporated | | | | | | | | | | | 9,498 | | | | 1,221,538 | |
FMC Corporation | | | | | | | | | | | 4,904 | | | | 437,976 | |
International Flavors & Fragrances Incorporated | | | | | | | | | | | 2,885 | | | | 412,295 | |
LyondellBasell Industries NV Class A | | | | | | | | | | | 11,861 | | | | 1,174,832 | |
The accompanying notes are an integral part of these financial statements.
| | | | | | |
| Portfolio of investments—September 30, 2017 | | Wells Fargo Index Asset Allocation Fund | | | 23 | |
| | | | | | | | | | | | | | | | |
| Security name | | | | | | | | Shares | | | Value | |
| | | | |
| Chemicals (continued) | | | | | | | | | | | | | | | | |
Monsanto Company | | | | | | | | | | | 16,057 | | | $ | 1,923,950 | |
PPG Industries Incorporated | | | | | | | | | | | 9,386 | | | | 1,019,883 | |
Praxair Incorporated | | | | | | | | | | | 10,467 | | | | 1,462,659 | |
The Mosaic Company | | | | | | | | | | | 12,719 | | | | 274,603 | |
The Sherwin-Williams Company | | | | | | | | | | | 3,001 | | | | 1,074,478 | |
| | | | |
| | | | | | | | | | | | | | | 17,424,236 | |
| | | | | | | | | | | | | | | | |
| | | | |
| Construction Materials: 0.08% | | | | | | | | | | | | | | | | |
Martin Marietta Materials Incorporated | | | | | | | | | | | 2,290 | | | | 472,267 | |
Vulcan Materials Company | | | | | | | | | | | 4,833 | | | | 578,027 | |
| | | | |
| | | | | | | | | | | | | | | 1,050,294 | |
| | | | | | | | | | | | | | | | |
| | | | |
| Containers & Packaging: 0.22% | | | | | | | | | | | | | | | | |
Avery Dennison Corporation | | | | | | | | | | | 3,235 | | | | 318,130 | |
Ball Corporation | | | | | | | | | | | 12,846 | | | | 530,540 | |
International Paper Company | | | | | | | | | | | 15,111 | | | | 858,607 | |
Packaging Corporation of America | | | | | | | | | | | 3,441 | | | | 394,614 | |
Sealed Air Corporation | | | | | | | | | | | 6,919 | | | | 295,580 | |
WestRock Company | | | | | | | | | | | 9,264 | | | | 525,547 | |
| | | | |
| | | | | | | | | | | | | | | 2,923,018 | |
| | | | | | | | | | | | | | | | |
| | | | |
| Metals & Mining: 0.16% | | | | | | | | | | | | | | | | |
Freeport-McMoRan Incorporated † | | | | | | | | | | | 49,250 | | | | 691,470 | |
Newmont Mining Corporation | | | | | | | | | | | 19,462 | | | | 730,020 | |
Nucor Corporation | | | | | | | | | | | 11,685 | | | | 654,827 | |
| | | | |
| | | | | | | | | | | | | | | 2,076,317 | |
| | | | | | | | | | | | | | | | |
| | | | |
Real Estate: 1.80% | | | | | | | | | | | | | | | | |
| | | | |
| Equity REITs: 1.77% | | | | | | | | | | | | | | | | |
Alexandria Real Estate Equities Incorporated | | | | | | | | | | | 3,416 | | | | 406,402 | |
American Tower Corporation | | | | | | | | | | | 15,633 | | | | 2,136,718 | |
Apartment Investment & Management Company Class A | | | | | | | | | | | 5,742 | | | | 251,844 | |
AvalonBay Communities Incorporated | | | | | | | | | | | 5,040 | | | | 899,237 | |
Boston Properties Incorporated | | | | | | | | | | | 5,630 | | | | 691,814 | |
Crown Castle International Corporation | | | | | | | | | | | 14,793 | | | | 1,479,004 | |
Digital Realty Trust Incorporated | | | | | | | | | | | 7,478 | | | | 884,872 | |
Duke Realty Corporation | | | | | | | | | | | 13,002 | | | | 374,718 | |
Equinix Incorporated | | | | | | | | | | | 2,838 | | | | 1,266,599 | |
Equity Residential | | | | | | | | | | | 13,390 | | | | 882,803 | |
Essex Property Trust Incorporated | | | | | | | | | | | 2,406 | | | | 611,196 | |
Extra Space Storage Incorporated | | | | | | | | | | | 4,607 | | | | 368,191 | |
Federal Realty Investment Trust | | | | | | | | | | | 2,633 | | | | 327,045 | |
GGP Incorporated | | | | | | | | | | | 22,792 | | | | 473,390 | |
HCP Incorporated | | | | | | | | | | | 17,110 | | | | 476,171 | |
Host Hotels & Resorts Incorporated | | | | | | | | | | | 27,028 | | | | 499,748 | |
Iron Mountain Incorporated | | | | | | | | | | | 9,641 | | | | 375,035 | |
Kimco Realty Corporation | | | | | | | | | | | 15,516 | | | | 303,338 | |
Mid-America Apartment Communities Incorporated | | | | | | | | | | | 4,148 | | | | 443,338 | |
The accompanying notes are an integral part of these financial statements.
| | | | |
| 24 | | Wells Fargo Index Asset Allocation Fund | | Portfolio of investments—September 30, 2017 |
| | | | | | | | | | | | | | | | |
| Security name | | | | | | | | Shares | | | Value | |
| | | | |
| Equity REITs (continued) | | | | | | | | | | | | | | | | |
Prologis Incorporated | | | | | | | | | | | 19,435 | | | $ | 1,233,345 | |
Public Storage Incorporated | | | | | | | | | | | 5,465 | | | | 1,169,455 | |
Realty Income Corporation | | | | | | | | | | | 10,004 | | | | 572,129 | |
Regency Centers Corporation | | | | | | | | | | | 5,397 | | | | 334,830 | |
SBA Communications Corporation † | | | | | | | | | | | 4,390 | | | | 632,380 | |
Simon Property Group Incorporated | | | | | | | | | | | 11,309 | | | | 1,820,862 | |
SL Green Realty Corporation | | | | | | | | | | | 3,622 | | | | 366,981 | |
The Macerich Company | | | | | | | | | | | 3,966 | | | | 218,011 | |
UDR Incorporated | | | | | | | | | | | 9,780 | | | | 371,933 | |
Ventas Incorporated | | | | | | | | | | | 13,004 | | | | 846,951 | |
Vornado Realty Trust | | | | | | | | | | | 6,284 | | | | 483,114 | |
Welltower Incorporated | | | | | | | | | | | 13,466 | | | | 946,390 | |
Weyerhaeuser Company | | | | | | | | | | | 27,554 | | | | 937,663 | |
| | | | |
| | | | | | | | | | | | | | | 23,085,507 | |
| | | | | | | | | | | | | | | | |
| | | | |
| Real Estate Management & Development: 0.03% | | | | | | | | | | | | | | | | |
CBRE Group Incorporated Class A † | | | | | | | | | | | 10,984 | | | | 416,074 | |
| | | | | | | | | | | | | | | | |
| | | | |
Telecommunication Services: 1.31% | | | | | | | | | | | | | | | | |
| | | | |
| Diversified Telecommunication Services: 1.31% | | | | | | | | | | | | | | | | |
AT&T Incorporated | | | | | | | | | | | 224,972 | | | | 8,812,153 | |
CenturyLink Incorporated « | | | | | | | | | | | 19,932 | | | | 376,715 | |
Level 3 Communications Incorporated † | | | | | | | | | | | 10,696 | | | | 569,990 | |
Verizon Communications Incorporated | | | | | | | | | | | 149,488 | | | | 7,398,161 | |
| | | | |
| | | | | | | | | | | | | | | 17,157,019 | |
| | | | | | | | | | | | | | | | |
| | | | |
Utilities: 1.88% | | | | | | | | | | | | | | | | |
| | | | |
| Electric Utilities: 1.18% | | | | | | | | | | | | | | | | |
Alliant Energy Corporation | | | | | | | | | | | 8,445 | | | | 351,059 | |
American Electric Power Company Incorporated | | | | | | | | | | | 17,945 | | | | 1,260,457 | |
Duke Energy Corporation | | | | | | | | | | | 25,487 | | | | 2,138,869 | |
Edison International | | | | | | | | | | | 11,917 | | | | 919,635 | |
Entergy Corporation | | | | | | | | | | | 6,553 | | | | 500,387 | |
Eversource Energy | | | | | | | | | | | 11,566 | | | | 699,049 | |
Exelon Corporation | | | | | | | | | | | 35,074 | | | | 1,321,238 | |
FirstEnergy Corporation | | | | | | | | | | | 16,219 | | | | 500,032 | |
NextEra Energy Incorporated | | | | | | | | | | | 17,073 | | | | 2,502,048 | |
PG&E Corporation | | | | | | | | | | | 18,705 | | | | 1,273,623 | |
Pinnacle West Capital Corporation | | | | | | | | | | | 4,075 | | | | 344,582 | |
PPL Corporation | | | | | | | | | | | 24,942 | | | | 946,549 | |
The Southern Company | | | | | | | | | | | 36,402 | | | | 1,788,794 | |
Xcel Energy Incorporated | | | | | | | | | | | 18,521 | | | | 876,414 | |
| | | | |
| | | | | | | | | | | | | | | 15,422,736 | |
| | | | | | | | | | | | | | | | |
| | | | |
| Independent Power & Renewable Electricity Producers: 0.04% | | | | | | | | | | | | | | | | |
AES Corporation | | | | | | | | | | | 24,093 | | | | 265,505 | |
NRG Energy Incorporated | | | | | | | | | | | 11,063 | | | | 283,102 | |
| | | | |
| | | | | | | | | | | | | | | 548,607 | |
| | | | | | | | | | | | | | | | |
The accompanying notes are an integral part of these financial statements.
| | | | | | |
| Portfolio of investments—September 30, 2017 | | Wells Fargo Index Asset Allocation Fund | | | 25 | |
| | | | | | | | | | | | | | | | |
| Security name | | | | | | | | Shares | | | Value | |
| | | | |
| Multi-Utilities: 0.62% | | | | | | | | | | | | | | | | |
Ameren Corporation | | | | | | | | | | | 8,864 | | | $ | 512,694 | |
CenterPoint Energy Incorporated | | | | | | | | | | | 15,707 | | | | 458,801 | |
CMS Energy Corporation | | | | | | | | | | | 10,289 | | | | 476,586 | |
Consolidated Edison Incorporated | | | | | | | | | | | 11,302 | | | | 911,845 | |
Dominion Resources Incorporated | | | | | | | | | | | 23,450 | | | | 1,804,009 | |
DTE Energy Company | | | | | | | | | | | 6,549 | | | | 703,101 | |
NiSource Incorporated | | | | | | | | | | | 11,871 | | | | 303,779 | |
Public Service Enterprise Group Incorporated | | | | | | | | | | | 18,471 | | | | 854,284 | |
SCANA Corporation | | | | | | | | | | | 5,216 | | | | 252,924 | |
Sempra Energy | | | | | | | | | | | 9,159 | | | | 1,045,317 | |
WEC Energy Group Incorporated | | | | | | | | | | | 11,512 | | | | 722,723 | |
| | | | |
| | | | | | | | | | | | | | | 8,046,063 | |
| | | | | | | | | | | | | | | | |
| | | | |
| Water Utilities: 0.04% | | | | | | | | | | | | | | | | |
American Water Works Company Incorporated | | | | | | | | | | | 6,521 | | | | 527,614 | |
| | | | | | | | | | | | | | | | |
| | | | |
Total Common Stocks (Cost $421,677,596) | | | | | | | | | | | | | | | 787,570,398 | |
| | | | | | | | | | | | | | | | |
| | | | |
| | | Interest rate | | | Maturity date | | | Principal | | | | |
| Non-Agency Mortgage-Backed Securities: 0.00% | | | | | | | | | | | | | | | | |
Citigroup Mortgage Loan Trust Incorporated Series 2004-HYB4 Class AA (1 Month LIBOR +0.33%) ± | | | 1.57 | % | | | 12-25-2034 | | | $ | 14,478 | | | | 13,411 | |
| | | | | | | | | | | | | | | | |
| | | | |
Total Non-Agency Mortgage-Backed Securities (Cost $14,478) | | | | | | | | | | | | | | | 13,411 | |
| | | | | | | | | | | | | | | | |
| | | | |
| | | | | | Expiration date | | | Shares | | | | |
| Rights: 0.00% | | | | | | | | | | | | | | | | |
| | | | |
Consumer Staples: 0.00% | | | | | | | | | | | | | | | | |
| | | | |
| Food & Staples Retailing: 0.00% | | | | | | | | | | | | | | | | |
Safeway Casa Ley Contingent Value Rights †(a) | | | | | | | 1-30-2018 | | | | 6,765 | | | | 0 | |
Safeway PDC LLC Contingent Value Rights †(a) | | | | | | | 1-30-2018 | | | | 6,765 | | | | 115 | |
| | | | |
Total Rights (Cost $7,056) | | | | | | | | | | | | | | | 115 | |
| | | | | | | | | | | | | | | | |
| | | | |
| | | | | | Maturity date | | | Principal | | | | |
| U.S. Treasury Securities: 38.72% | | | | | | | | | | | | | | | | |
U.S. Treasury Bond | | | 2.75 | | | | 8-15-2042 | | | $ | 1,340,000 | | | | 1,323,093 | |
U.S. Treasury Bond | | | 2.75 | | | | 11-15-2042 | | | | 1,781,000 | | | | 1,756,929 | |
U.S. Treasury Bond | | | 2.88 | | | | 5-15-2043 | | | | 2,534,000 | | | | 2,552,609 | |
U.S. Treasury Bond | | | 3.00 | | | | 5-15-2042 | | | | 904,000 | | | | 934,545 | |
U.S. Treasury Bond | | | 3.13 | | | | 11-15-2041 | | | | 846,000 | | | | 894,513 | |
U.S. Treasury Bond | | | 3.13 | | | | 2-15-2042 | | | | 1,066,000 | | | | 1,126,754 | |
U.S. Treasury Bond | | | 3.13 | | | | 2-15-2043 | | | | 1,783,000 | | | | 1,880,020 | |
U.S. Treasury Bond | | | 3.38 | | | | 5-15-2044 | | | | 2,936,000 | | | | 3,234,417 | |
U.S. Treasury Bond | | | 3.50 | | | | 2-15-2039 | | | | 731,000 | | | | 824,888 | |
U.S. Treasury Bond | | | 3.63 | | | | 8-15-2043 | | | | 2,200,000 | | | | 2,522,609 | |
U.S. Treasury Bond | | | 3.63 | | | | 2-15-2044 | | | | 2,898,000 | | | | 3,328,059 | |
U.S. Treasury Bond | | | 3.75 | | | | 8-15-2041 | | | | 929,000 | | | | 1,085,152 | |
U.S. Treasury Bond | | | 3.75 | | | | 11-15-2043 | | | | 2,870,000 | | | | 3,361,824 | |
U.S. Treasury Bond | | | 3.88 | | | | 8-15-2040 | | | | 946,000 | | | | 1,124,447 | |
The accompanying notes are an integral part of these financial statements.
| | | | |
| 26 | | Wells Fargo Index Asset Allocation Fund | | Portfolio of investments—September 30, 2017 |
| | | | | | | | | | | | | | | | |
| Security name | | Interest rate | | | Maturity date | | | Principal | | | Value | |
| | | | |
U.S. Treasury Securities (continued) | | | | | | | | | | | | | | | | |
U.S. Treasury Bond | | | 4.25 | % | | | 5-15-2039 | | | $ | 681,000 | | | $ | 851,436 | |
U.S. Treasury Bond | | | 4.25 | | | | 11-15-2040 | | | | 977,000 | | | | 1,225,410 | |
U.S. Treasury Bond | | | 4.38 | | | | 2-15-2038 | | | | 381,000 | | | | 483,900 | |
U.S. Treasury Bond | | | 4.38 | | | | 11-15-2039 | | | | 757,000 | | | | 962,809 | |
U.S. Treasury Bond | | | 4.38 | | | | 5-15-2040 | | | | 1,078,000 | | | | 1,373,313 | |
U.S. Treasury Bond | | | 4.38 | | | | 5-15-2041 | | | | 842,000 | | | | 1,076,346 | |
U.S. Treasury Bond | | | 4.50 | | | | 2-15-2036 | | | | 837,000 | | | | 1,076,003 | |
U.S. Treasury Bond | | | 4.50 | | | | 5-15-2038 | | | | 428,000 | | | | 552,521 | |
U.S. Treasury Bond | | | 4.50 | | | | 8-15-2039 | | | | 721,000 | | | | 931,808 | |
U.S. Treasury Bond | | | 4.63 | | | | 2-15-2040 | | | | 1,276,000 | | | | 1,678,538 | |
U.S. Treasury Bond | | | 4.75 | | | | 2-15-2037 | | | | 264,000 | | | | 350,398 | |
U.S. Treasury Bond | | | 4.75 | | | | 2-15-2041 | | | | 1,084,000 | | | | 1,455,524 | |
U.S. Treasury Bond | | | 5.00 | | | | 5-15-2037 | | | | 375,000 | | | | 512,256 | |
U.S. Treasury Bond | | | 5.25 | | | | 11-15-2028 | | | | 479,000 | | | | 614,093 | |
U.S. Treasury Bond | | | 5.25 | | | | 2-15-2029 | | | | 349,000 | | | | 449,065 | |
U.S. Treasury Bond | | | 5.38 | | | | 2-15-2031 | | | | 752,000 | | | | 1,006,446 | |
U.S. Treasury Bond | | | 5.50 | | | | 8-15-2028 | | | | 369,000 | | | | 480,334 | |
U.S. Treasury Bond | | | 6.13 | | | | 11-15-2027 | | | | 525,000 | | | | 705,694 | |
U.S. Treasury Bond | | | 6.13 | | | | 8-15-2029 | | | | 293,000 | | | | 406,286 | |
U.S. Treasury Bond | | | 6.25 | | | | 5-15-2030 | | | | 478,000 | | | | 678,069 | |
U.S. Treasury Bond | | | 6.38 | | | | 8-15-2027 | | | | 224,000 | | | | 304,675 | |
U.S. Treasury Bond | | | 6.88 | | | | 8-15-2025 | | | | 224,000 | | | | 299,994 | |
U.S. Treasury Note | | | 0.63 | | | | 4-30-2018 | | | | 1,753,000 | | | | 1,746,568 | |
U.S. Treasury Note | | | 0.63 | | | | 6-30-2018 | | | | 1,609,000 | | | | 1,601,144 | |
U.S. Treasury Note | | | 0.75 | | | | 1-31-2018 | | | | 1,502,000 | | | | 1,499,926 | |
U.S. Treasury Note | | | 0.75 | | | | 2-28-2018 | | | | 3,204,000 | | | | 3,198,243 | |
U.S. Treasury Note | | | 0.75 | | | | 3-31-2018 | | | | 1,422,000 | | | | 1,418,778 | |
U.S. Treasury Note | | | 0.75 | | | | 4-15-2018 | | | | 1,350,000 | | | | 1,346,415 | |
U.S. Treasury Note | | | 0.75 | | | | 4-30-2018 | | | | 1,588,000 | | | | 1,583,405 | |
U.S. Treasury Note | | | 0.75 | | | | 7-31-2018 | | | | 1,717,000 | | | | 1,708,952 | |
U.S. Treasury Note | | | 0.75 | | | | 8-31-2018 | | | | 1,718,000 | | | | 1,708,470 | |
U.S. Treasury Note | | | 0.75 | | | | 9-30-2018 | | | | 1,732,000 | | | | 1,721,513 | |
U.S. Treasury Note | | | 0.75 | | | | 10-31-2018 | | | | 1,732,000 | | | | 1,720,295 | |
U.S. Treasury Note | | | 0.75 | | | | 2-15-2019 | | | | 1,392,000 | | | | 1,379,276 | |
U.S. Treasury Note | | | 0.75 | | | | 7-15-2019 | | | | 1,583,000 | | | | 1,563,089 | |
U.S. Treasury Note | | | 0.75 | | | | 8-15-2019 | | | | 1,584,000 | | | | 1,562,963 | |
U.S. Treasury Note | | | 0.88 | | | | 1-31-2018 | | | | 1,231,000 | | | | 1,229,803 | |
U.S. Treasury Note | | | 0.88 | | | | 3-31-2018 | | | | 1,577,000 | | | | 1,574,039 | |
U.S. Treasury Note | | | 0.88 | | | | 5-31-2018 | | | | 1,585,000 | | | | 1,580,976 | |
U.S. Treasury Note | | | 0.88 | | | | 7-15-2018 | | | | 1,294,000 | | | | 1,289,501 | |
U.S. Treasury Note | | | 0.88 | | | | 10-15-2018 | | | | 1,390,000 | | | | 1,382,670 | |
U.S. Treasury Note | | | 0.88 | | | | 4-15-2019 | | | | 1,460,000 | | | | 1,447,453 | |
U.S. Treasury Note | | | 0.88 | | | | 5-15-2019 | | | | 1,466,000 | | | | 1,452,657 | |
U.S. Treasury Note | | | 0.88 | | | | 6-15-2019 | | | | 1,485,000 | | | | 1,470,556 | |
U.S. Treasury Note | | | 0.88 | | | | 7-31-2019 | | | | 811,000 | | | | 802,478 | |
U.S. Treasury Note | | | 0.88 | | | | 9-15-2019 | | | | 1,550,000 | | | | 1,531,896 | |
U.S. Treasury Note | | | 1.00 | | | | 2-15-2018 | | | | 1,336,000 | | | | 1,335,108 | |
U.S. Treasury Note | | | 1.00 | | | | 3-15-2018 | | | | 1,338,000 | | | | 1,336,743 | |
U.S. Treasury Note | | | 1.00 | | | | 5-15-2018 | | | | 1,328,000 | | | | 1,326,133 | |
U.S. Treasury Note | | | 1.00 | | | | 5-31-2018 | | | | 1,878,000 | | | | 1,874,699 | |
The accompanying notes are an integral part of these financial statements.
| | | | | | |
| Portfolio of investments—September 30, 2017 | | Wells Fargo Index Asset Allocation Fund | | | 27 | |
| | | | | | | | | | | | | | | | |
| Security name | | Interest rate | | | Maturity date | | | Principal | | | Value | |
| | | | |
U.S. Treasury Securities (continued) | | | | | | | | | | | | | | | | |
U.S. Treasury Note | | | 1.00 | % | | | 8-15-2018 | | | $ | 1,291,000 | | | $ | 1,287,167 | |
U.S. Treasury Note | | | 1.00 | | | | 9-15-2018 | | | | 1,292,000 | | | | 1,287,458 | |
U.S. Treasury Note | | | 1.00 | | | | 11-30-2018 | | | | 1,540,000 | | | | 1,532,962 | |
U.S. Treasury Note | | | 1.00 | | | | 3-15-2019 | | | | 1,383,000 | | | | 1,374,680 | |
U.S. Treasury Note | | | 1.00 | | | | 6-30-2019 | | | | 622,000 | | | | 617,214 | |
U.S. Treasury Note | | | 1.00 | | | | 8-31-2019 | | | | 1,842,000 | | | | 1,825,739 | |
U.S. Treasury Note | | | 1.00 | | | | 9-30-2019 | | | | 1,695,000 | | | | 1,679,109 | |
U.S. Treasury Note | | | 1.00 | | | | 10-15-2019 | | | | 1,596,000 | | | | 1,580,102 | |
U.S. Treasury Note | | | 1.00 | | | | 11-15-2019 | | | | 1,433,000 | | | | 1,417,830 | |
U.S. Treasury Note | | | 1.00 | | | | 11-30-2019 | | | | 1,985,000 | | | | 1,963,754 | |
U.S. Treasury Note | | | 1.13 | | | | 6-15-2018 | | | | 1,326,000 | | | | 1,324,498 | |
U.S. Treasury Note | | | 1.13 | | | | 1-15-2019 | | | | 1,444,000 | | | | 1,438,641 | |
U.S. Treasury Note | | | 1.13 | | | | 1-31-2019 | | | | 1,783,000 | | | | 1,776,105 | |
U.S. Treasury Note | | | 1.13 | | | | 2-28-2019 | | | | 1,815,000 | | | | 1,807,627 | |
U.S. Treasury Note | | | 1.13 | | | | 5-31-2019 | | | | 690,000 | | | | 686,442 | |
U.S. Treasury Note | | | 1.13 | | | | 12-31-2019 | | | | 1,247,000 | | | | 1,236,186 | |
U.S. Treasury Note | | | 1.13 | | | | 3-31-2020 | | | | 1,987,000 | | | | 1,965,578 | |
U.S. Treasury Note | | | 1.13 | | | | 4-30-2020 | | | | 1,330,000 | | | | 1,315,038 | |
U.S. Treasury Note | | | 1.13 | | | | 2-28-2021 | | | | 3,264,000 | | | | 3,199,485 | |
U.S. Treasury Note | | | 1.13 | | | | 6-30-2021 | | | | 3,343,000 | | | | 3,264,648 | |
U.S. Treasury Note | | | 1.13 | | | | 7-31-2021 | | | | 2,232,000 | | | | 2,176,985 | |
U.S. Treasury Note | | | 1.13 | | | | 8-31-2021 | | | | 2,233,000 | | | | 2,175,692 | |
U.S. Treasury Note | | | 1.13 | | | | 9-30-2021 | | | | 2,188,000 | | | | 2,129,796 | |
U.S. Treasury Note | | | 1.25 | | | | 10-31-2018 | | | | 1,759,000 | | | | 1,756,389 | |
U.S. Treasury Note | | | 1.25 | | | | 11-15-2018 | | | | 1,370,000 | | | | 1,367,592 | |
U.S. Treasury Note | | | 1.25 | | | | 11-30-2018 | | | | 1,654,000 | | | | 1,651,157 | |
U.S. Treasury Note | | | 1.25 | | | | 12-15-2018 | | | | 1,363,000 | | | | 1,360,604 | |
U.S. Treasury Note | | | 1.25 | | | | 12-31-2018 | | | | 1,788,000 | | | | 1,784,648 | |
U.S. Treasury Note | | | 1.25 | | | | 1-31-2019 | | | | 1,335,000 | | | | 1,331,975 | |
U.S. Treasury Note | | | 1.25 | | | | 3-31-2019 | | | | 1,834,000 | | | | 1,829,128 | |
U.S. Treasury Note | | | 1.25 | | | | 4-30-2019 | | | | 586,000 | | | | 584,260 | |
U.S. Treasury Note | | | 1.25 | | | | 5-31-2019 | | | | 1,787,000 | | | | 1,781,276 | |
U.S. Treasury Note | | | 1.25 | | | | 6-30-2019 | | | | 1,790,000 | | | | 1,783,497 | |
U.S. Treasury Note | | | 1.25 | | | | 8-31-2019 | | | | 1,790,000 | | | | 1,782,169 | |
U.S. Treasury Note | | | 1.25 | | | | 10-31-2019 | | | | 804,000 | | | | 799,980 | |
U.S. Treasury Note | | | 1.25 | | | | 1-31-2020 | | | | 3,442,000 | | | | 3,418,605 | |
U.S. Treasury Note | | | 1.25 | | | | 2-29-2020 | | | | 1,745,000 | | | | 1,732,526 | |
U.S. Treasury Note | | | 1.25 | | | | 3-31-2021 | | | | 3,250,000 | | | | 3,196,426 | |
U.S. Treasury Note | | | 1.25 | | | | 10-31-2021 | | | | 2,188,000 | | | | 2,138,428 | |
U.S. Treasury Note | | | 1.25 | | | | 7-31-2023 | | | | 1,829,000 | | | | 1,748,838 | |
U.S. Treasury Note | | | 1.38 | | | | 6-30-2018 | | | | 1,357,000 | | | | 1,357,795 | |
U.S. Treasury Note | | | 1.38 | | | | 7-31-2018 | | | | 1,610,000 | | | | 1,610,503 | |
U.S. Treasury Note | | | 1.38 | | | | 9-30-2018 | | | | 2,875,000 | | | | 2,874,775 | |
U.S. Treasury Note | | | 1.38 | | | | 11-30-2018 | | | | 787,000 | | | | 786,754 | |
U.S. Treasury Note | | | 1.38 | | | | 12-31-2018 | | | | 968,000 | | | | 967,660 | |
U.S. Treasury Note | | | 1.38 | | | | 2-28-2019 | | | | 1,295,000 | | | | 1,294,089 | |
U.S. Treasury Note | | | 1.38 | | | | 7-31-2019 | | | | 1,787,000 | | | | 1,783,929 | |
U.S. Treasury Note | | | 1.38 | | | | 12-15-2019 | | | | 1,651,000 | | | | 1,645,776 | |
U.S. Treasury Note | | | 1.38 | | | | 1-15-2020 | | | | 1,638,000 | | | | 1,632,113 | |
U.S. Treasury Note | | | 1.38 | | | | 1-31-2020 | | | | 2,293,000 | | | | 2,284,491 | |
The accompanying notes are an integral part of these financial statements.
| | | | |
| 28 | | Wells Fargo Index Asset Allocation Fund | | Portfolio of investments—September 30, 2017 |
| | | | | | | | | | | | | | | | |
| Security name | | Interest rate | | | Maturity date | | | Principal | | | Value | |
| | | | |
U.S. Treasury Securities (continued) | | | | | | | | | | | | | | | | |
U.S. Treasury Note | | | 1.38 | % | | | 2-15-2020 | | | $ | 1,667,000 | | | $ | 1,659,967 | |
U.S. Treasury Note | | | 1.38 | | | | 2-29-2020 | | | | 3,442,000 | | | | 3,427,076 | |
U.S. Treasury Note | | | 1.38 | | | | 3-31-2020 | | | | 3,442,000 | | | | 3,425,462 | |
U.S. Treasury Note | | | 1.38 | | | | 4-30-2020 | | | | 3,442,000 | | | | 3,424,118 | |
U.S. Treasury Note | | | 1.38 | | | | 5-31-2020 | | | | 1,380,000 | | | | 1,372,345 | |
U.S. Treasury Note | | | 1.38 | | | | 8-31-2020 | | | | 3,350,000 | | | | 3,326,314 | |
U.S. Treasury Note | | | 1.38 | | | | 9-30-2020 | | | | 3,356,000 | | | | 3,330,437 | |
U.S. Treasury Note | | | 1.38 | | | | 10-31-2020 | | | | 3,178,000 | | | | 3,151,061 | |
U.S. Treasury Note | | | 1.38 | | | | 1-31-2021 | | | | 3,192,000 | | | | 3,157,586 | |
U.S. Treasury Note | | | 1.38 | | | | 4-30-2021 | | | | 3,245,000 | | | | 3,203,170 | |
U.S. Treasury Note | | | 1.38 | | | | 5-31-2021 | | | | 3,248,000 | | | | 3,203,086 | |
U.S. Treasury Note | | | 1.38 | | | | 6-30-2023 | | | | 1,733,000 | | | | 1,670,382 | |
U.S. Treasury Note | | | 1.38 | | | | 8-31-2023 | | | | 1,817,000 | | | | 1,747,656 | |
U.S. Treasury Note | | | 1.38 | | | | 9-30-2023 | | | | 1,778,000 | | | | 1,708,894 | |
U.S. Treasury Note | | | 1.50 | | | | 8-31-2018 | | | | 2,781,000 | | | | 2,784,259 | |
U.S. Treasury Note | | | 1.50 | | | | 12-31-2018 | | | | 1,855,000 | | | | 1,857,029 | |
U.S. Treasury Note | | | 1.50 | | | | 1-31-2019 | | | | 1,716,000 | | | | 1,717,676 | |
U.S. Treasury Note | | | 1.50 | | | | 2-28-2019 | | | | 1,826,000 | | | | 1,827,569 | |
U.S. Treasury Note | | | 1.50 | | | | 3-31-2019 | | | | 645,000 | | | | 645,680 | |
U.S. Treasury Note | | | 1.50 | | | | 5-31-2019 | | | | 2,387,000 | | | | 2,389,145 | |
U.S. Treasury Note | | | 1.50 | | | | 10-31-2019 | | | | 3,442,000 | | | | 3,441,597 | |
U.S. Treasury Note | | | 1.50 | | | | 11-30-2019 | | | | 3,133,000 | | | | 3,132,143 | |
U.S. Treasury Note | | | 1.50 | | | | 4-15-2020 | | | | 1,675,000 | | | | 1,671,729 | |
U.S. Treasury Note | | | 1.50 | | | | 5-15-2020 | | | | 1,678,000 | | | | 1,674,329 | |
U.S. Treasury Note | | | 1.50 | | | | 5-31-2020 | | | | 3,442,000 | | | | 3,433,798 | |
U.S. Treasury Note | | | 1.50 | | | | 6-15-2020 | | | | 1,680,000 | | | | 1,676,063 | |
U.S. Treasury Note | | | 1.50 | | | | 7-15-2020 | | | | 1,683,000 | | | | 1,678,069 | |
U.S. Treasury Note | | | 1.50 | | | | 8-15-2020 | | | | 1,684,000 | | | | 1,678,672 | |
U.S. Treasury Note | | | 1.50 | | | | 1-31-2022 | | | | 1,625,000 | | | | 1,600,117 | |
U.S. Treasury Note | | | 1.50 | | | | 2-28-2023 | | | | 1,635,000 | | | | 1,592,784 | |
U.S. Treasury Note | | | 1.50 | | | | 3-31-2023 | | | | 1,679,000 | | | | 1,633,942 | |
U.S. Treasury Note | | | 1.50 | | | | 8-15-2026 | | | | 4,143,000 | | | | 3,877,751 | |
U.S. Treasury Note | | | 1.63 | | | | 3-31-2019 | | | | 2,104,000 | | | | 2,109,918 | |
U.S. Treasury Note | | | 1.63 | | | | 4-30-2019 | | | | 1,703,000 | | | | 1,707,657 | |
U.S. Treasury Note | | | 1.63 | | | | 6-30-2019 | | | | 2,157,000 | | | | 2,162,898 | |
U.S. Treasury Note | | | 1.63 | | | | 7-31-2019 | | | | 2,128,000 | | | | 2,133,902 | |
U.S. Treasury Note | | | 1.63 | | | | 8-31-2019 | | | | 3,442,000 | | | | 3,451,546 | |
U.S. Treasury Note | | | 1.63 | | | | 12-31-2019 | | | | 3,442,000 | | | | 3,449,260 | |
U.S. Treasury Note | | | 1.63 | | | | 3-15-2020 | | | | 1,667,000 | | | | 1,669,344 | |
U.S. Treasury Note | | | 1.63 | | | | 6-30-2020 | | | | 3,442,000 | | | | 3,444,151 | |
U.S. Treasury Note | | | 1.63 | | | | 7-31-2020 | | | | 3,213,000 | | | | 3,214,004 | |
U.S. Treasury Note | | | 1.63 | | | | 11-30-2020 | | | | 2,166,000 | | | | 2,162,446 | |
U.S. Treasury Note | | | 1.63 | | | | 8-15-2022 | | | | 1,250,000 | | | | 1,233,643 | |
U.S. Treasury Note | | | 1.63 | | | | 8-31-2022 | | | | 2,373,000 | | | | 2,339,630 | |
U.S. Treasury Note | | | 1.63 | | | | 11-15-2022 | | | | 2,108,000 | | | | 2,074,733 | |
U.S. Treasury Note | | | 1.63 | | | | 4-30-2023 | | | | 1,711,000 | | | | 1,675,109 | |
U.S. Treasury Note | | | 1.63 | | | | 5-31-2023 | | | | 1,714,000 | | | | 1,676,372 | |
U.S. Treasury Note | | | 1.63 | | | | 10-31-2023 | | | | 1,824,000 | | | | 1,777,688 | |
U.S. Treasury Note | | | 1.63 | | | | 2-15-2026 | | | | 4,269,000 | | | | 4,056,717 | |
U.S. Treasury Note | | | 1.63 | | | | 5-15-2026 | | | | 4,111,000 | | | | 3,897,581 | |
The accompanying notes are an integral part of these financial statements.
| | | | | | |
| Portfolio of investments—September 30, 2017 | | Wells Fargo Index Asset Allocation Fund | | | 29 | |
| | | | | | | | | | | | | | | | |
| Security name | | Interest rate | | | Maturity date | | | Principal | | | Value | |
| | | | |
U.S. Treasury Securities (continued) | | | | | | | | | | | | | | | | |
U.S. Treasury Note | | | 1.75 | % | | | 10-31-2018 | | | $ | 704,000 | | | $ | 706,640 | |
U.S. Treasury Note | | | 1.75 | | | | 9-30-2019 | | | | 3,441,000 | | | | 3,458,205 | |
U.S. Treasury Note | | | 1.75 | | | | 10-31-2020 | | | | 1,585,000 | | | | 1,589,520 | |
U.S. Treasury Note | | | 1.75 | | | | 12-31-2020 | | | | 3,353,000 | | | | 3,358,501 | |
U.S. Treasury Note | | | 1.75 | | | | 11-30-2021 | | | | 2,003,000 | | | | 1,995,489 | |
U.S. Treasury Note | | | 1.75 | | | | 2-28-2022 | | | | 1,637,000 | | | | 1,628,367 | |
U.S. Treasury Note | | | 1.75 | | | | 3-31-2022 | | | | 1,640,000 | | | | 1,630,198 | |
U.S. Treasury Note | | | 1.75 | | | | 4-30-2022 | | | | 1,612,000 | | | | 1,601,484 | |
U.S. Treasury Note | | | 1.75 | | | | 5-15-2022 | | | | 1,448,000 | | | | 1,439,855 | |
U.S. Treasury Note | | | 1.75 | | | | 5-31-2022 | | | | 2,343,000 | | | | 2,326,892 | |
U.S. Treasury Note | | | 1.75 | | | | 6-30-2022 | | | | 2,347,000 | | | | 2,329,214 | |
U.S. Treasury Note | | | 1.75 | | | | 9-30-2022 | | | | 1,771,000 | | | | 1,754,120 | |
U.S. Treasury Note | | | 1.75 | | | | 1-31-2023 | | | | 1,684,000 | | | | 1,662,950 | |
U.S. Treasury Note | | | 1.75 | | | | 5-15-2023 | | | | 3,117,000 | | | | 3,070,489 | |
U.S. Treasury Note | | | 1.88 | | | | 6-30-2020 | | | | 1,888,000 | | | | 1,902,160 | |
U.S. Treasury Note | | | 1.88 | | | | 11-30-2021 | | | | 1,649,000 | | | | 1,652,027 | |
U.S. Treasury Note | | | 1.88 | | | | 1-31-2022 | | | | 2,358,000 | | | | 2,358,368 | |
U.S. Treasury Note | | | 1.88 | | | | 2-28-2022 | | | | 2,348,000 | | | | 2,347,908 | |
U.S. Treasury Note | | | 1.88 | | | | 3-31-2022 | | | | 2,371,000 | | | | 2,369,333 | |
U.S. Treasury Note | | | 1.88 | | | | 4-30-2022 | | | | 2,376,000 | | | | 2,373,030 | |
U.S. Treasury Note | | | 1.88 | | | | 5-31-2022 | | | | 1,795,000 | | | | 1,792,896 | |
U.S. Treasury Note | | | 1.88 | | | | 7-31-2022 | | | | 2,337,000 | | | | 2,331,158 | |
U.S. Treasury Note | | | 1.88 | | | | 8-31-2022 | | | | 1,754,000 | | | | 1,748,861 | |
U.S. Treasury Note | | | 1.88 | | | | 10-31-2022 | | | | 1,650,000 | | | | 1,643,684 | |
U.S. Treasury Note | | | 1.88 | | | | 8-31-2024 | | | | 1,968,000 | | | | 1,932,099 | |
U.S. Treasury Note | | | 2.00 | | | | 7-31-2020 | | | | 1,306,000 | | | | 1,319,876 | |
U.S. Treasury Note | | | 2.00 | | | | 9-30-2020 | | | | 2,093,000 | | | | 2,114,829 | |
U.S. Treasury Note | | | 2.00 | | | | 11-30-2020 | | | | 2,266,000 | | | | 2,288,483 | |
U.S. Treasury Note | | | 2.00 | | | | 2-28-2021 | | | | 2,421,000 | | | | 2,443,791 | |
U.S. Treasury Note | | | 2.00 | | | | 5-31-2021 | | | | 1,559,000 | | | | 1,572,519 | |
U.S. Treasury Note | | | 2.00 | | | | 8-31-2021 | | | | 1,641,000 | | | | 1,653,500 | |
U.S. Treasury Note | | | 2.00 | | | | 10-31-2021 | | | | 1,649,000 | | | | 1,660,337 | |
U.S. Treasury Note | | | 2.00 | | | | 11-15-2021 | | | | 2,485,000 | | | | 2,503,443 | |
U.S. Treasury Note | | | 2.00 | | | | 12-31-2021 | | | | 2,300,000 | | | | 2,313,477 | |
U.S. Treasury Note | | | 2.00 | | | | 2-15-2022 | | | | 1,679,000 | | | | 1,689,428 | |
U.S. Treasury Note | | | 2.00 | | | | 7-31-2022 | | | | 1,778,000 | | | | 1,784,320 | |
U.S. Treasury Note | | | 2.00 | | | | 11-30-2022 | | | | 1,625,000 | | | | 1,627,539 | |
U.S. Treasury Note | | | 2.00 | | | | 2-15-2023 | | | | 3,077,000 | | | | 3,077,841 | |
U.S. Treasury Note | | | 2.00 | | | | 4-30-2024 | | | | 1,930,000 | | | | 1,914,394 | |
U.S. Treasury Note | | | 2.00 | | | | 5-31-2024 | | | | 1,934,000 | | | | 1,917,304 | |
U.S. Treasury Note | | | 2.00 | | | | 6-30-2024 | | | | 1,939,000 | | | | 1,920,898 | |
U.S. Treasury Note | | | 2.00 | | | | 2-15-2025 | | | | 4,486,000 | | | | 4,422,916 | |
U.S. Treasury Note | | | 2.00 | | | | 8-15-2025 | | | | 4,495,000 | | | | 4,416,162 | |
U.S. Treasury Note | | | 2.00 | | | | 11-15-2026 | | | | 4,255,000 | | | | 4,144,636 | |
U.S. Treasury Note | | | 2.13 | | | | 8-31-2020 | | | | 1,477,000 | | | | 1,497,828 | |
U.S. Treasury Note | | | 2.13 | | | | 1-31-2021 | | | | 1,409,000 | | | | 1,428,264 | |
U.S. Treasury Note | | | 2.13 | | | | 6-30-2021 | | | | 1,516,000 | | | | 1,535,365 | |
U.S. Treasury Note | | | 2.13 | | | | 8-15-2021 | | | | 2,440,000 | | | | 2,470,405 | |
U.S. Treasury Note | | | 2.13 | | | | 9-30-2021 | | | | 1,633,000 | | | | 1,652,328 | |
U.S. Treasury Note | | | 2.13 | | | | 12-31-2021 | | | | 1,626,000 | | | | 1,643,784 | |
The accompanying notes are an integral part of these financial statements.
| | | | |
| 30 | | Wells Fargo Index Asset Allocation Fund | | Portfolio of investments—September 30, 2017 |
| | | | | | | | | | | | | | | | |
| Security name | | Interest rate | | | Maturity date | | | Principal | | | Value | |
| | | | |
U.S. Treasury Securities (continued) | | | | | | | | | | | | | | | | |
U.S. Treasury Note | | | 2.13 | % | | | 6-30-2022 | | | $ | 1,615,000 | | | $ | 1,629,888 | |
U.S. Treasury Note | | | 2.13 | | | | 12-31-2022 | | | | 1,678,000 | | | | 1,689,602 | |
U.S. Treasury Note | | | 2.13 | | | | 11-30-2023 | | | | 1,638,000 | | | | 1,642,415 | |
U.S. Treasury Note | | | 2.13 | | | | 2-29-2024 | | | | 1,960,000 | | | | 1,960,689 | |
U.S. Treasury Note | | | 2.13 | | | | 3-31-2024 | | | | 1,961,000 | | | | 1,960,540 | |
U.S. Treasury Note | | | 2.13 | | | | 7-31-2024 | | | | 1,927,000 | | | | 1,923,161 | |
U.S. Treasury Note | | | 2.13 | | | | 5-15-2025 | | | | 4,466,000 | | | | 4,435,645 | |
U.S. Treasury Note | | | 2.25 | | | | 7-31-2018 | | | | 521,000 | | | | 524,867 | |
U.S. Treasury Note | | | 2.25 | | | | 3-31-2021 | | | | 1,440,000 | | | | 1,465,200 | |
U.S. Treasury Note | | | 2.25 | | | | 4-30-2021 | | | | 1,514,000 | | | | 1,540,377 | |
U.S. Treasury Note | | | 2.25 | | | | 7-31-2021 | | | | 2,618,000 | | | | 2,662,281 | |
U.S. Treasury Note | | | 2.25 | | | | 12-31-2023 | | | | 1,886,000 | | | | 1,902,871 | |
U.S. Treasury Note | | | 2.25 | | | | 1-31-2024 | | | | 1,914,000 | | | | 1,930,075 | |
U.S. Treasury Note | | | 2.25 | | | | 11-15-2024 | | | | 4,492,000 | | | | 4,512,705 | |
U.S. Treasury Note | | | 2.25 | | | | 11-15-2025 | | | | 4,512,000 | | | | 4,509,885 | |
U.S. Treasury Note | | | 2.25 | | | | 2-15-2027 | | | | 3,006,000 | | | | 2,986,508 | |
U.S. Treasury Note | | | 2.25 | | | | 8-15-2027 | | | | 1,586,000 | | | | 1,574,477 | |
U.S. Treasury Note | | | 2.38 | | | | 5-31-2018 | | | | 621,000 | | | | 625,439 | |
U.S. Treasury Note | | | 2.38 | | | | 6-30-2018 | | | | 795,000 | | | | 801,118 | |
U.S. Treasury Note | | | 2.38 | | | | 12-31-2020 | | | | 1,317,000 | | | | 1,345,449 | |
U.S. Treasury Note | | | 2.38 | | | | 8-15-2024 | | | | 4,465,000 | | | | 4,526,219 | |
U.S. Treasury Note | | | 2.38 | | | | 5-15-2027 | | | | 4,355,000 | | | | 4,371,163 | |
U.S. Treasury Note | | | 2.50 | | | | 8-15-2023 | | | | 2,662,000 | | | | 2,729,798 | |
U.S. Treasury Note | | | 2.50 | | | | 5-15-2024 | | | | 4,360,000 | | | | 4,457,589 | |
U.S. Treasury Note | | | 2.63 | | | | 1-31-2018 | | | | 861,000 | | | | 865,089 | |
U.S. Treasury Note | | | 2.63 | | | | 4-30-2018 | | | | 657,000 | | | | 662,158 | |
U.S. Treasury Note | | | 2.63 | | | | 8-15-2020 | | | | 3,367,000 | | | | 3,461,828 | |
U.S. Treasury Note | | | 2.63 | | | | 11-15-2020 | | | | 5,315,000 | | | | 5,469,467 | |
U.S. Treasury Note | | | 2.75 | | | | 2-28-2018 | | | | 756,000 | | | | 760,784 | |
U.S. Treasury Note | | | 2.75 | | | | 2-15-2019 | | | | 1,365,000 | | | | 1,389,527 | |
U.S. Treasury Note | | | 2.75 | | | | 11-15-2023 | | | | 3,936,000 | | | | 4,089,596 | |
U.S. Treasury Note | | | 2.75 | | | | 2-15-2024 | | | | 3,410,000 | | | | 3,540,406 | |
U.S. Treasury Note | | | 2.88 | | | | 3-31-2018 | | | | 858,000 | | | | 864,902 | |
U.S. Treasury Note | | | 3.13 | | | | 5-15-2019 | | | | 1,768,000 | | | | 1,815,653 | |
U.S. Treasury Note | | | 3.13 | | | | 5-15-2021 | | | | 1,657,000 | | | | 1,737,326 | |
U.S. Treasury Note | | | 3.38 | | | | 11-15-2019 | | | | 3,180,000 | | | | 3,303,970 | |
U.S. Treasury Note | | | 3.50 | | | | 2-15-2018 | | | | 1,278,000 | | | | 1,288,885 | |
U.S. Treasury Note | | | 3.50 | | | | 5-15-2020 | | | | 2,864,000 | | | | 3,005,858 | |
U.S. Treasury Note | | | 3.63 | | | | 8-15-2019 | | | | 1,545,000 | | | | 1,606,257 | |
U.S. Treasury Note | | | 3.63 | | | | 2-15-2020 | | | | 2,648,000 | | | | 2,776,159 | |
U.S. Treasury Note | | | 3.63 | | | | 2-15-2021 | | | | 2,765,000 | | | | 2,939,649 | |
U.S. Treasury Note | | | 3.75 | | | | 11-15-2018 | | | | 1,505,000 | | | | 1,544,036 | |
U.S. Treasury Note | | | 3.88 | | | | 5-15-2018 | | | | 689,000 | | | | 700,034 | |
U.S. Treasury Note | | | 4.00 | | | | 8-15-2018 | | | | 788,000 | | | | 805,976 | |
U.S. Treasury Note | | | 6.00 | | | | 2-15-2026 | | | | 445,000 | | | | 573,024 | |
U.S. Treasury Note | | | 6.25 | | | | 8-15-2023 | | | | 378,000 | | | | 465,988 | |
U.S. Treasury Note | | | 6.50 | | | | 11-15-2026 | | | | 296,000 | | | | 399,184 | |
U.S. Treasury Note | | | 6.63 | | | | 2-15-2027 | | | | 215,000 | | | | 293,794 | |
U.S. Treasury Note | | | 6.75 | | | | 8-15-2026 | | | | 221,000 | | | | 301,000 | |
U.S. Treasury Note | | | 7.13 | | | | 2-15-2023 | | | | 260,000 | | | | 328,067 | |
The accompanying notes are an integral part of these financial statements.
| | | | | | |
| Portfolio of investments—September 30, 2017 | | Wells Fargo Index Asset Allocation Fund | | | 31 | |
| | | | | | | | | | | | | | | | |
| Security name | | Interest rate | | | Maturity date | | | Principal | | | Value | |
| | | | |
U.S. Treasury Securities (continued) | | | | | | | | | | | | | | | | |
U.S. Treasury Note | | | 7.25 | % | | | 8-15-2022 | | | $ | 261,000 | | | $ | 325,557 | |
U.S. Treasury Note | | | 7.50 | | | | 11-15-2024 | | | | 240,000 | | | | 325,163 | |
U.S. Treasury Note | | | 7.63 | | | | 11-15-2022 | | | | 140,000 | | | | 178,659 | |
U.S. Treasury Note | | | 7.63 | | | | 2-15-2025 | | | | 216,000 | | | | 296,738 | |
U.S. Treasury Note | | | 7.88 | | | | 2-15-2021 | | | | 180,000 | | | | 216,302 | |
U.S. Treasury Note | | | 8.00 | | | | 11-15-2021 | | | | 511,000 | | | | 636,554 | |
U.S. Treasury Note | | | 8.13 | | | | 8-15-2019 | | | | 307,000 | | | | 344,679 | |
U.S. Treasury Note | | | 8.13 | | | | 5-15-2021 | | | | 181,000 | | | | 221,619 | |
U.S. Treasury Note | | | 8.13 | | | | 8-15-2021 | | | | 175,000 | | | | 216,583 | |
U.S. Treasury Note | | | 8.50 | | | | 2-15-2020 | | | | 162,000 | | | | 188,433 | |
U.S. Treasury Note | | | 8.75 | | | | 5-15-2020 | | | | 130,000 | | | | 154,080 | |
U.S. Treasury Note | | | 8.75 | | | | 8-15-2020 | | | | 288,000 | | | | 345,578 | |
U.S. Treasury Note | | | 8.88 | | | | 2-15-2019 | | | | 306,000 | | | | 337,186 | |
U.S. Treasury Note | | | 9.00 | | | | 11-15-2018 | | | | 193,000 | | | | 209,397 | |
U.S. Treasury Note | | | 9.13 | | | | 5-15-2018 | | | | 169,000 | | | | 177,120 | |
| | | | |
Total U.S. Treasury Securities (Cost $505,544,112) | | | | | | | | | | | | | | | 505,410,491 | |
| | | | | | | | | | | | | | | | |
| | | | |
| | | Yield | | | | | | Shares | | | | |
| Short-Term Investments: 0.98% | | | | | | | | | | | | | | | | |
| | | | |
| Investment Companies: 0.85% | | | | | | | | | | | | | | | | |
Securities Lending Cash Investment LLC (l)(r)(u) | | | 1.25 | | | | | | | | 3,363,101 | | | | 3,363,437 | |
Wells Fargo Government Money Market Fund Select Class (l)(u) | | | 0.92 | | | | | | | | 7,658,402 | | | | 7,658,402 | |
| | | | |
| | | | | | | | | | | | | | | 11,021,839 | |
| | | | | | | | | | | | | | | | |
| | | | |
| | | | | | | | | Principal | | | | |
| U.S. Treasury Securities: 0.13% | | | | | | | | | | | | | | | | |
U.S. Treasury Bill (z)# | | | 0.95 | | | | 11-30-2017 | | | $ | 1,700,000 | | | | 1,697,258 | |
| | | | | | | | | | | | | | | | |
| | | | |
Total Short-Term Investments (Cost $12,719,012) | | | | | | | | | | | | | | | 12,719,097 | �� |
| | | | | | | | | | | | | | | | |
| | | | | | | | |
| Total investments in securities (Cost $940,014,999) | | | 100.05 | % | | | 1,305,775,570 | |
Other assets and liabilities, net | | | (0.05 | ) | | | (614,805 | ) |
| | | | | | | | |
| Total net assets | | | 100.00 | % | | $ | 1,305,160,765 | |
| | | | | | | | |
| « | All or a portion of this security is on loan. |
| † | Non-income-earning security |
| (l) | The issuer of the security is an affiliated person of the Fund as defined in the Investment Company Act of 1940. |
| ± | Variable rate investment. The rate shown is the rate in effect at period end. |
| (a) | The security is fair valued in accordance with procedures approved by the Board of Trustees. |
| (r) | The investment is a non-registered investment company purchased with cash collateral received from securities on loan. |
| (u) | The rate represents the 7-day annualized yield at period end. |
| (z) | Zero coupon security. The rate represents the current yield to maturity. |
| # | All or a portion of this security is segregated as collateral for investments in derivative instruments. |
The accompanying notes are an integral part of these financial statements.
| | | | |
| 32 | | Wells Fargo Index Asset Allocation Fund | | Portfolio of investments—September 30, 2017 |
Futures Contracts
| | | | | | | | | | | | | | | | | | | | | | | | |
| Description | | Number of
contracts | | | Expiration
date | | | Notional cost | | | Notional value | | | Unrealized
gains | | | Unrealized
losses | |
Long | | | | | | | | | | | | | | | | | | | | | | | | |
S&P 500 E-Mini Index | | | 11 | | | | 12-15-2017 | | | $ | 1,361,298 | | | $ | 1,383,855 | | | $ | 22,557 | | | $ | 0 | |
5-Year U.S. Treasury Notes | | | 53 | | | | 12-29-2017 | | | | 6,255,575 | | | | 6,227,500 | | | | 0 | | | | (28,075 | ) |
Short | | | | | | | | | | | | | | | | | | | | | | | | |
10-Year U.S. Treasury Notes | | | 1,152 | | | | 12-19-2017 | | | | 145,758,066 | | | | 144,360,000 | | | | 1,398,066 | | | | 0 | |
Investments in Affiliates
An affiliated investment is an investment in which the Fund owns at least 5% of the outstanding voting shares of the issuer or as a result of other relationships, such as the Fund and the issuer having the same investment manager. Transactions with issuers that were either affiliated persons of the Fund at the beginning of the period or the end of the period were as follows:
| | | | | | | | | | | | | | | | | | | | | | | | | | | | | | | | | | | | |
| | | Shares,
beginning of
period | | | Shares
purchased | | | Shares sold | | | Shares,
end of
period | | | Net
realized
gains
(losses) | | | Net
change in
unrealized
gains
(losses) | | | Income
from
affiliated
securities | | | Value, end
of period | | | % of
net
assets | |
Common Stocks | | | | | | | | | | | | | | | | | | | | | | | | | | | | | | | | | | | | |
Financials | | | | | | | | | | | | | | | | | | | | | | | | | | | | | | | | | | | | |
Banks | | | | | | | | | | | | | | | | | | | | | | | | | | | | | | | | | | | | |
Wells Fargo & Company | | | 168,853 | | | | 2,363 | | | | 7,159 | | | | 164,057 | | | $ | 10,774 | | | $ | 1,838,089 | | | $ | 254,268 | | | $ | 9,047,744 | | | | 0.69 | % |
| | | | | | | | | |
Short-Term Investments | | | | | | | | | | | | | | | | | | | | | | | | | | | | | | | | | | | | |
Investment companies | | | | | | | | | | | | | | | | | | | | | | | | | | | | | | | | | | | | |
Securities Lending Cash Investment LLC | | | 2,850,409 | | | | 50,877,676 | | | | 50,364,984 | | | | 3,363,101 | | | | 265 | | | | 98 | | | | 23,373 | | | | 3,363,437 | | | | | |
Wells Fargo Government Money Market Fund Select Class | | | 12,501,900 | | | | 135,135,323 | | | | 139,978,821 | | | | 7,658,402 | | | | 0 | | | | 0 | | | | 116,841 | | | | 7,658,402 | | | | | |
| | | | | | | | | |
| | | | | | | | | | | | | | | | | | | | | | | | | | | | | | | 11,021,839 | | | | 0.85 | |
| | | | | | | | | | | | | | | | | | | | | | | | | | | | | | | | | | | | |
Affiliated securities no longer held at end of period | | | | | | | | | | | | | | | | | | | 0 | | | | 0 | | | | 0 | | | | 0 | | | | 0.00 | |
| | | | | | | | | | | | | | | | | | | | | | | | | | | | | | | | | | | | |
| | | | | | | | | | | | | | | | | | $ | 11,039 | | | $ | 1,838,187 | | | $ | 394,482 | | | $ | 20,069,583 | | | | 1.54 | % |
| | | | | | | | | | | | | | | | | | | | | | | | | | | | | | | | | | | | |
The accompanying notes are an integral part of these financial statements.
| | | | | | |
| Statement of assets and liabilities—September 30, 2017 | | Wells Fargo Index Asset Allocation Fund | | | 33 | |
| | | | |
| | | | |
| |
Assets | | | | |
Investments in unaffiliated securities (including $3,285,186 of securities loaned), at value (cost $923,452,963) | | $ | 1,285,705,987 | |
Investments in affiliated securities, at value (cost $16,562,036) | | | 20,069,583 | |
Cash | | | 20,836 | |
Receivable for Fund shares sold | | | 1,146,898 | |
Receivable for dividends and interest | | | 3,359,512 | |
Receivable for daily variation margin on open futures contracts | | | 274,265 | |
Receivable for securities lending income | | | 2,152 | |
Prepaid expenses and other assets | | | 354,157 | |
| | | | |
Total assets | | | 1,310,933,390 | |
| | | | |
| |
Liabilities | | | | |
Payable upon receipt of securities loaned | | | 3,363,075 | |
Payable for Fund shares redeemed | | | 1,099,561 | |
Management fee payable | | | 649,415 | |
Administration fees payable | | | 209,425 | |
Distribution fees payable | | | 96,969 | |
Payable for daily variation margin on open futures contracts | | | 8,893 | |
Accrued expenses and other liabilities | | | 345,287 | |
| | | | |
Total liabilities | | | 5,772,625 | |
| | | | |
Total net assets | | $ | 1,305,160,765 | |
| | | | |
| |
NET ASSETS CONSIST OF | | | | |
Paid-in capital | | $ | 957,721,417 | |
Undistributed net investment income | | | 79,910 | |
Accumulated net realized losses on investments | | | (19,793,681 | ) |
Net unrealized gains on investments | | | 367,153,119 | |
| | | | |
Total net assets | | $ | 1,305,160,765 | |
| | | | |
| |
COMPUTATION OF NET ASSET VALUE AND OFFERING PRICE PER SHARE | | | | |
Net assets – Class A | | $ | 822,769,286 | |
Shares outstanding – Class A1 | | | 25,720,705 | |
Net asset value per share – Class A | | | $31.99 | |
Maximum offering price per share – Class A2 | | | $33.94 | |
Net assets – Class C | | $ | 152,819,735 | |
Shares outstanding – Class C1 | | | 7,856,064 | |
Net asset value per share – Class C | | | $19.45 | |
Net assets – Administrator Class | | $ | 268,512,165 | |
Shares outstanding – Administrator Class1 | | | 8,393,110 | |
Net asset value per share – Administrator Class | | | $31.99 | |
Net assets – Institutional Class | | $ | 61,059,579 | |
Shares outstanding – Institutional Class1 | | | 1,910,546 | |
Net asset value per share – Institutional Class | | | $31.96 | |
| 1 | The Fund has an unlimited number of authorized shares. |
| 2 | Maximum offering price is computed as 100/94.25 of net asset value. On investments of $50,000 or more, the offering price is reduced. |
The accompanying notes are an integral part of these financial statements.
| | | | |
| 34 | | Wells Fargo Index Asset Allocation Fund | | Statement of operations—year ended September 30, 2017 |
| | | | |
| | | | |
| |
Investment income | | | | |
Dividends | | $ | 15,691,058 | |
Interest | | | 7,103,767 | |
Income from affiliated securities | | | 394,482 | |
| | | | |
Total investment income | | | 23,189,307 | |
| | | | |
| |
Expenses | | | | |
Management fee | | | 7,552,100 | |
Administration fees | | | | |
Class A | | | 1,719,463 | |
Class B | | | 74 | 1 |
Class C | | | 312,468 | |
Administrator Class | | | 299,199 | |
Institutional Class | | | 51,148 | 2 |
Shareholder servicing fees | | | | |
Class A | | | 2,046,980 | |
Class B | | | 88 | 1 |
Class C | | | 371,985 | |
Administrator Class | | | 573,066 | |
Distribution fees | | | | |
Class B | | | 265 | 1 |
Class C | | | 1,115,956 | |
Custody and accounting fees | | | 47,330 | |
Professional fees | | | 35,480 | |
Registration fees | | | 37,433 | |
Shareholder report expenses | | | 49,510 | |
Trustees’ fees and expenses | | | 21,000 | |
Other fees and expenses | | | 962 | |
| | | | |
Total expenses | | | 14,234,507 | |
Less: Fee waivers and/or expense reimbursements | | | (216,011 | ) |
| | | | |
Net expenses | | | 14,018,496 | |
| | | | |
Net investment income | | | 9,170,811 | |
| | | | |
| |
REALIZED AND UNREALIZED GAINS (LOSSES) ON INVESTMENTS | | | | |
| |
Net realized gains on: | | | | |
Unaffiliated securities | | | 2,605,243 | |
Affiliated securities | | | 11,039 | |
Futures transactions | | | 7,283,681 | |
| | | | |
Net realized gains on investments | | | 9,899,963 | |
| | | | |
| |
Net change in unrealized gains (losses) on: | | | | |
Unaffiliated securities | | | 95,630,481 | |
Affiliated securities | | | 1,838,187 | |
Futures transactions | | | 1,024,296 | |
| | | | |
Net change in unrealized gains (losses) on investments | | | 98,492,964 | |
| | | | |
Net realized and unrealized gains (losses) on investments | | | 108,392,927 | |
| | | | |
Net increase in net assets resulting from operations | | $ | 117,563,738 | |
| | | | |
| 1 | For the period from October 1, 2016 to December 5, 2016. Effective at the close of business on December 5, 2016, Class B shares were converted to Class A shares and are no longer offered by the Fund. |
| 2 | For the period from October 31, 2016 (commencement of class operations) to September 30, 2017 |
The accompanying notes are an integral part of these financial statements.
| | | | | | |
| Statement of changes in net assets | | Wells Fargo Index Asset Allocation Fund | | | 35 | |
| | | | | | | | | | | | | | | | |
| | | Year ended
September 30, 2017 | | | Year ended
September 30, 2016 | |
| | | | |
Operations | | | | | | | | | | | | | | | | |
Net investment income | | | | | | $ | 9,170,811 | | | | | | | $ | 7,739,055 | |
Net realized gains on investments | | | | | | | 9,899,963 | | | | | | | | 9,092,899 | |
Net change in unrealized gains (losses) on investments | | | | | | | 98,492,964 | | | | | | | | 77,072,669 | |
| | | | |
Net increase in net assets resulting from operations | | | | | | | 117,563,738 | | | | | | | | 93,904,623 | |
| | | | |
| | | | |
Distributions to shareholders from | | | | | | | | | | | | | | | | |
Net investment income | | | | | | | | | | | | | | | | |
Class A | | | | | | | (7,312,513 | ) | | | | | | | (5,683,773 | ) |
Class B | | | | | | | 0 | 1 | | | | | | | (266 | ) |
Class C | | | | | | | (70,275 | ) | | | | | | | (93,279 | ) |
Administrator Class | | | | | | | (2,579,847 | ) | | | | | | | (1,345,968 | ) |
Institutional Class | | | | | | | (568,243 | )2 | | | | | | | N/A | |
Net realized gains | | | | | | | | | | | | | | | | |
Class A | | | | | | | (7,379,070 | ) | | | | | | | (40,013,880 | ) |
Class B | | | | | | | 0 | 1 | | | | | | | (8,382 | ) |
Class C | | | | | | | (1,277,133 | ) | | | | | | | (3,781,718 | ) |
Administrator Class | | | | | | | (1,816,976 | ) | | | | | | | (5,677,540 | ) |
Institutional Class | | | | | | | (193,189 | )2 | | | | | | | N/A | |
| | | | |
Total distributions to shareholders | | | | | | | (21,197,246 | ) | | | | | | | (56,604,806 | ) |
| | | | |
| | | | |
Capital share transactions | | | Shares | | | | | | | | Shares | | | | | |
Proceeds from shares sold | | | | | | | | | | | | | | | | |
Class A | | | 2,073,618 | | | | 63,158,800 | | | | 4,200,951 | | | | 120,374,602 | |
Class B | | | 0 | 1 | | | 0 | 1 | | | 15,531 | | | | 269,837 | |
Class C | | | 2,328,600 | | | | 43,112,461 | | | | 4,802,237 | | | | 84,206,499 | |
Administrator Class | | | 4,249,283 | | | | 130,093,840 | | | | 5,938,408 | | | | 170,655,831 | |
Institutional Class | | | 2,337,480 | 2 | | | 71,528,209 | 2 | | | N/A | | | | N/A | |
| | | | |
| | | | | | | 307,893,310 | | | | | | | | 375,506,769 | |
| | | | |
Reinvestment of distributions | | | | | | | | | | | | | | | | |
Class A | | | 472,960 | | | | 14,326,956 | | | | 1,593,398 | | | | 44,672,620 | |
Class B | | | 0 | 1 | | | 0 | 1 | | | 338 | | | | 5,803 | |
Class C | | | 62,398 | | | | 1,135,663 | | | | 192,234 | | | | 3,269,192 | |
Administrator Class | | | 127,144 | | | | 3,867,648 | | | | 187,396 | | | | 5,266,424 | |
Institutional Class | | | 24,813 | 2 | | | 761,237 | 2 | | | N/A | | | | N/A | |
| | | | |
| | | | | | | 20,091,504 | | | | | | | | 53,214,039 | |
| | | | |
Payment for shares redeemed | | | | | | | | | | | | | | | | |
Class A | | | (4,807,553 | ) | | | (146,972,158 | ) | | | (3,450,379 | ) | | | (99,644,371 | ) |
Class B | | | (11,694 | )1 | | | (213,027 | )1 | | | (12,802 | ) | | | (225,638 | ) |
Class C | | | (2,145,127 | ) | | | (40,093,776 | ) | | | (934,641 | ) | | | (16,428,230 | ) |
Administrator Class | | | (2,967,092 | ) | | | (90,263,946 | ) | | | (2,111,814 | ) | | | (61,128,010 | ) |
Institutional Class | | | (451,747 | )2 | | | (14,069,406 | )2 | | | N/A | | | | N/A | |
| | | | |
| | | | | | | (291,612,313 | ) | | | | | | | (177,426,249 | ) |
| | | | |
Net increase in net assets resulting from capital share transactions | | | | | | | 36,372,501 | | | | | | | | 251,294,559 | |
| | | | |
Total increase in net assets | | | | | | | 132,738,993 | | | | | | | | 288,594,376 | |
| | | | |
| | | | |
Net assets | | | | | | | | | | | | | | | | |
Beginning of period | | | | | | | 1,172,421,772 | | | | | | | | 883,827,396 | |
| | | | |
End of period | | | | | | $ | 1,305,160,765 | | | | | | | $ | 1,172,421,772 | |
| | | | |
Undistributed net investment income | | | | | | $ | 79,910 | | | | | | | $ | 1,796,877 | |
| | | | |
| 1 | For the period from October 1, 2016 to December 5, 2016. Effective at the close of business on December 5, 2016, Class B shares were converted to Class A shares and are no longer offered by the Fund. |
| 2 | For the period from October 31, 2016 (commencement of class operations) to September 30, 2017 |
The accompanying notes are an integral part of these financial statements.
| | | | |
| 36 | | Wells Fargo Index Asset Allocation Fund | | Financial highlights |
(For a share outstanding throughout each period)
| | | | | | | | | | | | | | | | | | | | |
| | | Year ended September 30 | |
| CLASS A | | 2017 | | | 2016 | | | 2015 | | | 2014 | | | 2013 | |
Net asset value, beginning of period | | | $29.61 | | | | $28.72 | | | | $28.20 | | | | $24.48 | | | | $22.17 | |
Net investment income | | | 0.25 | | | | 0.22 | | | | 0.27 | | | | 0.38 | | | | 0.34 | |
Net realized and unrealized gains (losses) on investments | | | 2.67 | | | | 2.45 | | | | 0.76 | | | | 3.72 | | | | 2.31 | |
| | | | | | | | | | | | | | | | | | | | |
Total from investment operations | | | 2.92 | | | | 2.67 | | | | 1.03 | | | | 4.10 | | | | 2.65 | |
Distributions to shareholders from | | | | | | | | | | | | | | | | | | | | |
Net investment income | | | (0.27 | ) | | | (0.21 | ) | | | (0.22 | ) | | | (0.38 | ) | | | (0.34 | ) |
Net realized gains | | | (0.27 | ) | | | (1.57 | ) | | | (0.29 | ) | | | 0.00 | | | | 0.00 | |
| | | | | | | | | | | | | | | | | | | | |
Total distributions to shareholders | | | (0.54 | ) | | | (1.78 | ) | | | (0.51 | ) | | | (0.38 | ) | | | (0.34 | ) |
Net asset value, end of period | | | $31.99 | | | | $29.61 | | | | $28.72 | | | | $28.20 | | | | $24.48 | |
Total return1 | | | 9.99 | % | | | 9.68 | % | | | 3.62 | % | | | 16.83 | % | | | 12.02 | % |
Ratios to average net assets (annualized) | | | | | | | | | | | | | | | | | | | | |
Gross expenses | | | 1.09 | % | | | 1.10 | % | | | 1.22 | % | | | 1.20 | % | | | 1.18 | % |
Net expenses | | | 1.09 | % | | | 1.10 | % | | | 1.15 | % | | | 1.15 | % | | | 1.15 | % |
Net investment income | | | 0.79 | % | | | 0.79 | % | | | 0.90 | % | | | 1.42 | % | | | 1.43 | % |
Supplemental data | | | | | | | | | | | | | | | | | | | | |
Portfolio turnover rate | | | 9 | % | | | 8 | % | | | 43 | % | | | 9 | % | | | 11 | % |
Net assets, end of period (000s omitted) | | | $822,769 | | | | $828,421 | | | | $736,276 | | | | $708,873 | | | | $657,702 | |
| 1 | Total return calculations do not include any sales charges. |
The accompanying notes are an integral part of these financial statements.
| | | | | | |
| Financial highlights | | Wells Fargo Index Asset Allocation Fund | | | 37 | |
(For a share outstanding throughout each period)
| | | | | | | | | | | | | | | | | | | | |
| | | Year ended September 30 | |
| CLASS C | | 2017 | | | 2016 | | | 2015 | | | 2014 | | | 2013 | |
Net asset value, beginning of period | | | $17.99 | | | | $17.47 | | | | $17.20 | | | | $14.94 | | | | $13.53 | |
Net investment income | | | 0.01 | | | | 0.01 | 1 | | | 0.05 | | | | 0.11 | | | | 0.10 | |
Net realized and unrealized gains (losses) on investments | | | 1.62 | | | | 1.48 | | | | 0.45 | | | | 2.27 | | | | 1.41 | |
| | | | | | | | | | | | | | | | | | | | |
Total from investment operations | | | 1.63 | | | | 1.49 | | | | 0.50 | | | | 2.38 | | | | 1.51 | |
Distributions to shareholders from | | | | | | | | | | | | | | | | | | | | |
Net investment income | | | (0.01 | ) | | | (0.02 | ) | | | (0.05 | ) | | | (0.12 | ) | | | (0.10 | ) |
Net realized gains | | | (0.16 | ) | | | (0.95 | ) | | | (0.18 | ) | | | 0.00 | | | | 0.00 | |
| | | | | | | | | | | | | | | | | | | | |
Total distributions to shareholders | | | (0.17 | ) | | | (0.97 | ) | | | (0.23 | ) | | | (0.12 | ) | | | (0.10 | ) |
Net asset value, end of period | | | $19.45 | | | | $17.99 | | | | $17.47 | | | | $17.20 | | | | $14.94 | |
Total return2 | | | 9.14 | % | | | 8.86 | % | | | 2.86 | % | | | 15.96 | % | | | 11.20 | % |
Ratios to average net assets (annualized) | | | | | | | | | | | | | | | | | | | | |
Gross expenses | | | 1.84 | % | | | 1.85 | % | | | 1.98 | % | | | 1.95 | % | | | 1.93 | % |
Net expenses | | | 1.84 | % | | | 1.85 | % | | | 1.90 | % | | | 1.90 | % | | | 1.90 | % |
Net investment income | | | 0.04 | % | | | 0.03 | % | | | 0.10 | % | | | 0.67 | % | | | 0.68 | % |
Supplemental data | | | | | | | | | | | | | | | | | | | | |
Portfolio turnover rate | | | 9 | % | | | 8 | % | | | 43 | % | | | 9 | % | | | 11 | % |
Net assets, end of period (000s omitted) | | | $152,820 | | | | $136,881 | | | | $62,019 | | | | $24,093 | | | | $19,164 | |
| 1 | Calculated based upon average shares outstanding |
| 2 | Total return calculations do not include any sales charges. |
The accompanying notes are an integral part of these financial statements.
| | | | |
| 38 | | Wells Fargo Index Asset Allocation Fund | | Financial highlights |
(For a share outstanding throughout each period)
| | | | | | | | | | | | | | | | | | | | |
| | | Year ended September 30 | |
| ADMINISTRATOR CLASS | | 2017 | | | 2016 | | | 2015 | | | 2014 | | | 2013 | |
Net asset value, beginning of period | | | $29.63 | | | | $28.75 | | | | $28.21 | | | | $24.49 | | | | $22.18 | |
Net investment income | | | 0.30 | | | | 0.28 | | | | 0.35 | | | | 0.45 | | | | 0.40 | |
Net realized and unrealized gains (losses) on investments | | | 2.68 | | | | 2.45 | | | | 0.76 | | | | 3.72 | | | | 2.30 | |
| | | | | | | | | | | | | | | | | | | | |
Total from investment operations | | | 2.98 | | | | 2.73 | | | | 1.11 | | | | 4.17 | | | | 2.70 | |
Distributions to shareholders from | | | | | | | | | | | | | | | | | | | | |
Net investment income | | | (0.35 | ) | | | (0.28 | ) | | | (0.28 | ) | | | (0.45 | ) | | | (0.39 | ) |
Net realized gains | | | (0.27 | ) | | | (1.57 | ) | | | (0.29 | ) | | | 0.00 | | | | 0.00 | |
| | | | | | | | | | | | | | | | | | | | |
Total distributions to shareholders | | | (0.62 | ) | | | (1.85 | ) | | | (0.57 | ) | | | (0.45 | ) | | | (0.39 | ) |
Net asset value, end of period | | | $31.99 | | | | $29.63 | | | | $28.75 | | | | $28.21 | | | | $24.49 | |
Total return | | | 10.20 | % | | | 9.91 | % | | | 3.89 | % | | | 17.12 | % | | | 12.31 | % |
Ratios to average net assets (annualized) | | | | | | | | | | | | | | | | | | | | |
Gross expenses | | | 0.99 | % | | | 1.02 | % | | | 1.09 | % | | | 1.04 | % | | | 1.02 | % |
Net expenses | | | 0.90 | % | | | 0.90 | % | | | 0.90 | % | | | 0.90 | % | | | 0.90 | % |
Net investment income | | | 0.96 | % | | | 0.98 | % | | | 1.12 | % | | | 1.68 | % | | | 1.69 | % |
Supplemental data | | | | | | | | | | | | | | | | | | | | |
Portfolio turnover rate | | | 9 | % | | | 8 | % | | | 43 | % | | | 9 | % | | | 11 | % |
Net assets, end of period (000s omitted) | | | $268,512 | | | | $206,908 | | | | $85,380 | | | | $59,783 | | | | $34,536 | |
The accompanying notes are an integral part of these financial statements.
| | | | | | |
| Financial highlights | | Wells Fargo Index Asset Allocation Fund | | | 39 | |
(For a share outstanding throughout the period)
| | | | |
| INSTITUTIONAL CLASS | | Period ended
September 30, 20171 | |
Net asset value, beginning of period | | | $29.27 | |
Net investment income | | | 0.35 | |
Net realized and unrealized gains (losses) on investments | | | 3.03 | |
| | | | |
Total from investment operations | | | 3.38 | |
Distributions to shareholders from | | | | |
Net investment income | | | (0.42 | ) |
Net realized gains | | | (0.27 | ) |
| | | | |
Total distributions to shareholders | | | (0.69 | ) |
Net asset value, end of period | | | $31.96 | |
Total return2 | | | 11.70 | % |
Ratios to average net assets (annualized) | | | | |
Gross expenses | | | 0.74 | % |
Net expenses | | | 0.74 | % |
Net investment income | | | 1.08 | % |
Supplemental data | | | | |
Portfolio turnover rate | | | 9 | % |
Net assets, end of period (000s omitted) | | | $61,060 | |
| 1 | For the period from October 31, 2016 (commencement of class operations) to September 30, 2017 |
| 2 | Returns for periods of less than one year are not annualized. |
The accompanying notes are an integral part of these financial statements.
| | | | |
| 40 | | Wells Fargo Index Asset Allocation Fund | | Notes to financial statements |
1. ORGANIZATION
Wells Fargo Funds Trust (the “Trust”), a Delaware statutory trust organized on March 10, 1999, is an open-end management investment company registered under the Investment Company Act of 1940, as amended (the “1940 Act”). As an investment company, the Trust follows the accounting and reporting guidance in Financial Accounting Standards Board Accounting Standards Codification Topic 946, Financial Services – Investment Companies. These financial statements report on the Wells Fargo Index Asset Allocation Fund (the “Fund”) which is a diversified series of the Trust.
Effective at the close of business on December 5, 2016, Class B shares were converted to Class A shares and are no longer offered by the Fund. Information for Class B shares reflected in the financial statements represents activity through December 5, 2016.
2. SIGNIFICANT ACCOUNTING POLICIES
The following significant accounting policies, which are consistently followed in the preparation of the financial statements of the Fund, are in conformity with U.S. generally accepted accounting principles which require management to make estimates and assumptions that affect the reported amounts of assets and liabilities, disclosure of contingent assets and liabilities at the date of the financial statements, and the reported amounts of revenues and expenses during the reporting period. Actual results could differ from those estimates.
Securities valuation
All investments are valued each business day as of the close of regular trading on the New York Stock Exchange (generally 4 p.m. Eastern Time), although the Fund may deviate from this calculation time under unusual or unexpected circumstances.
Equity securities and futures that are listed on a foreign or domestic exchange or market are valued at the official closing price or, if none, the last sales price. If no sale occurs on the principal exchange or market that day, a fair value price will be determined in accordance with the Fund’s Valuation Procedures.
Debt securities are valued at the evaluated bid price provided by an independent pricing service or, if a reliable price is not available, the quoted bid price from an independent broker-dealer.
Investments in registered open-end investment companies are valued at net asset value. Interests in non-registered investment companies that are redeemable at net asset value are fair valued normally at net asset value.
Investments which are not valued using any of the methods discussed above are valued at their fair value, as determined in good faith by the Board of Trustees of the Fund. The Board of Trustees has established a Valuation Committee comprised of the Trustees and has delegated to it the authority to take any actions regarding the valuation of portfolio securities that the Valuation Committee deems necessary or appropriate, including determining the fair value of portfolio securities, unless the determination has been delegated to the Management Valuation Team of Wells Fargo Funds Management, LLC (“Funds Management”). The Board of Trustees retains the authority to make or ratify any valuation decisions or approve any changes to the Valuation Procedures as it deems appropriate. On a quarterly basis, the Board of Trustees receives reports on any valuation actions taken by the Valuation Committee or the Management Valuation Team which may include items for ratification.
Valuations of fair valued securities are compared to the next actual sales price when available, or other appropriate market values, to assess the continued appropriateness of the fair valuation methodologies used. These securities are fair valued on a day-to-day basis, taking into consideration changes to appropriate market information and any significant changes to the inputs considered in the valuation process until there is a readily available price provided on an exchange or by an independent pricing service. Valuations received from an independent pricing service or independent broker-dealer quotes are periodically validated by comparisons to most recent trades and valuations provided by other independent pricing services in addition to the review of prices by the manager and/or subadviser. Unobservable inputs used in determining fair valuations are identified based on the type of security, taking into consideration factors utilized by market participants in valuing the investment, knowledge about the issuer and the current market environment.
Security loans
The Fund may lend its securities from time to time in order to earn additional income in the form of fees or interest on securities received as collateral or the investment of any cash received as collateral. The Fund continues to receive interest or dividends on the securities loaned. The Fund receives collateral in the form of cash or securities with a value at least equal to the value of the securities on loan. The value of the loaned securities is determined at the close of each business day and any additional required collateral is delivered to the Fund on the next business day. In a securities
| | | | | | |
| Notes to financial statements | | Wells Fargo Index Asset Allocation Fund | | | 41 | |
lending transaction, the net asset value of the Fund will be affected by an increase or decrease in the value of the securities loaned and by an increase or decrease in the value of the instrument in which collateral is invested. The amount of securities lending activity undertaken by the Fund fluctuates from time to time. In the event of default or bankruptcy by the borrower, the Fund may be prevented from recovering the loaned securities or gaining access to the collateral or may experience delays or costs in doing so. In addition, the investment of any cash collateral received may lose all or part of its value. The Fund has the right under the lending agreement to recover the securities from the borrower on demand.
The Fund lends its securities through an unaffiliated securities lending agent. Cash collateral received in connection with its securities lending transactions is invested in Securities Lending Cash Investments, LLC (the “Securities Lending Fund”). The Securities Lending Fund is exempt from registration under Section 3(c)(7) of the 1940 Act and is managed by Funds Management and is subadvised by Wells Capital Management Incorporated (“WellsCap”), an affiliate of Funds Management and an indirect wholly owned subsidiary of Wells Fargo & Company (“Wells Fargo”). Funds Management receives an advisory fee starting at 0.05% and declining to 0.01% as the average daily net assets of the Securities Lending Fund increase. All of the fees received by Funds Management are paid to WellsCap for its services as subadviser. The Securities Lending Fund seeks to provide a positive return compared to the daily Fed Funds Open Rate by investing in high-quality, U.S. dollar-denominated short-term money market instruments. Securities Lending Fund investments are valued at the evaluated bid price provided by an independent pricing service. Income earned from investment in the Securities Lending Fund is included in income from affiliates securities on the Statement of Operations.
Futures contracts
The Fund is subject to interest rate risk and equity price risk in the normal course of pursuing its investment objectives. The Fund may buy and sell futures contracts in order to gain exposure to, or protect against, changes in interest rates and security values. The primary risks associated with the use of futures contracts are the imperfect correlation between changes in market values of securities held by the Fund and the prices of futures contracts, and the possibility of an illiquid market.
The aggregate principal amounts of the contracts are not recorded in the financial statements. Fluctuations in the value of the contracts are recorded in the Statement of Assets and Liabilities as an asset or liability and in the Statement of Operations as unrealized gains or losses until the contracts are closed, at which point they are recorded as net realized gains or losses on futures contracts. With futures contracts, there is minimal counterparty risk to the Fund since futures are exchange traded and the exchange’s clearinghouse, as counterparty to all exchange traded futures, guarantees the futures against default.
Security transactions and income recognition
Securities transactions are recorded on a trade date basis. Realized gains or losses are recorded on the basis of identified cost.
Dividend income is recognized on the ex-dividend date.
Interest income is accrued daily and bond discounts are accreted and premiums are amortized daily based on the effective interest method. To the extent debt obligations are placed on non-accrual status, any related interest income may be reduced by writing off interest receivables when the collection of all or a portion of interest has been determined to be doubtful based on consistently applied procedures and the fair value has decreased. If the issuer subsequently resumes interest payments or when the collectability of interest is reasonably assured, the debt obligation is removed from non-accrual status.
Distributions to shareholders
Distributions to shareholders from net investment income and net realized gains, if any, are recorded on the ex-dividend date. Such distributions are determined in accordance with income tax regulations and may differ from U.S. generally accepted accounting principles. Dividend sources are estimated at the time of declaration. The tax character of distributions is determined as of the Fund’s fiscal year end. Therefore, a portion of the Fund’s distributions made prior to the Fund’s fiscal year end may be categorized as a tax return of capital.
Federal and other taxes
The Fund intends to continue to qualify as a regulated investment company by distributing substantially all of its investment company taxable income and any net realized capital gains (after reduction for capital loss carryforwards) sufficient to relieve it from all, or substantially all, federal income taxes. Accordingly, no provision for federal income taxes was required.
| | | | |
| 42 | | Wells Fargo Index Asset Allocation Fund | | Notes to financial statements |
The Fund’s income and federal excise tax returns and all financial records supporting those returns for the prior three fiscal years are subject to examination by the federal and Delaware revenue authorities. Management has analyzed the Fund’s tax positions taken on federal, state, and foreign tax returns for all open tax years and does not believe that there are any uncertain tax positions that require recognition of a tax liability.
As of September 30, 2017, the aggregate cost of all investments for federal income tax purposes was $966,606,049 and the unrealized gains (losses) consisted of:
| | | | |
Gross unrealized gains | | $ | 351,706,988 | |
Gross unrealized losses | | | (11,144,919 | ) |
Net unrealized gains | | $ | 340,562,069 | |
Reclassifications are made to the Fund’s capital accounts for permanent tax differences to reflect income and gains available for distribution (or available capital loss carryforwards) under federal income tax regulations. U.S. generally accepted accounting principles require that certain components of net assets be adjusted to reflect permanent differences between financial and tax reporting. These reclassifications have no effect on net assets or net asset values per share. At September 30, 2017, as a result of permanent book-to-tax differences, the following reclassification adjustments were made on the Statement of Assets and Liabilities:
| | |
Undistributed net investment income | | Accumulated net realized losses on investments |
| $(356,900) | | $356,900 |
Class allocations
The separate classes of shares offered by the Fund differ principally in applicable sales charges, distribution, shareholder servicing, and administration fees. Class specific expenses are charged directly to that share class. Investment income, common expenses, and realized and unrealized gains (losses) on investments are allocated daily to each class of shares based on the relative proportion of net assets of each class.
3. FAIR VALUATION MEASUREMENTS
Fair value measurements of investments are determined within a framework that has established a fair value hierarchy based upon the various data inputs utilized in determining the value of the Fund’s investments. The three-level hierarchy gives the highest priority to unadjusted quoted prices in active markets for identical assets or liabilities (Level 1) and the lowest priority to unobservable inputs (Level 3). The Fund’s investments are classified within the fair value hierarchy based on the lowest level of input that is significant to the fair value measurement. The inputs are summarized into three broad levels as follows:
| ∎ | | Level 1 – quoted prices in active markets for identical securities |
| ∎ | | Level 2 – other significant observable inputs (including quoted prices for similar securities, interest rates, prepayment speeds, credit risk, etc.) |
| ∎ | | Level 3 – significant unobservable inputs (including the Fund’s own assumptions in determining the fair value of investments) |
The inputs or methodologies used for valuing investments in securities are not necessarily an indication of the risk associated with investing in those securities.
| | | | | | |
| Notes to financial statements | | Wells Fargo Index Asset Allocation Fund | | | 43 | |
The following is a summary of the inputs used in valuing the Fund’s assets and liabilities as of September 30, 2017:
| | | | | | | | | | | | | | | | |
| | | Quoted prices
(Level 1) | | | Other significant
observable inputs
(Level 2) | | | Significant
unobservable inputs
(Level 3) | | | Total | |
Assets | | | | | | | | | | | | | | | | |
Investments in: | | | | | | | | | | | | | | | | |
| | | | |
Agency securities | | $ | 0 | | | $ | 62,058 | | | $ | 0 | | | $ | 62,058 | |
| | | | |
Common stocks | | | | | | | | | | | | | | | | |
Consumer discretionary | | | 93,165,444 | | | | 0 | | | | 0 | | | | 93,165,444 | |
Consumer staples | | | 64,850,895 | | | | 0 | | | | 0 | | | | 64,850,895 | |
Energy | | | 48,086,268 | | | | 0 | | | | 0 | | | | 48,086,268 | |
Financials | | | 115,214,408 | | | | 0 | | | | 0 | | | | 115,214,408 | |
Health care | | | 114,195,851 | | | | 0 | | | | 0 | | | | 114,195,851 | |
Industrials | | | 80,642,202 | | | | 0 | | | | 0 | | | | 80,642,202 | |
Information technology | | | 182,737,845 | | | | 0 | | | | 0 | | | | 182,737,845 | |
Materials | | | 23,473,865 | | | | | | | | | | | | 23,473,865 | |
Real estate | | | 23,501,581 | | | | 0 | | | | 0 | | | | 23,501,581 | |
Telecommunication services | | | 17,157,019 | | | | 0 | | | | 0 | | | | 17,157,019 | |
Utilities | | | 24,545,020 | | | | 0 | | | | 0 | | | | 24,545,020 | |
| | | | |
Rights | | | | | | | | | | | | | | | | |
Consumer staples | | | 0 | | | | 115 | | | | 0 | | | | 115 | |
| | | | |
Non-agency mortgage-backed securities | | | 0 | | | | 13,411 | | | | 0 | | | | 13,411 | |
| | | | |
U.S. Treasury securities | | | 505,410,491 | | | | 0 | | | | 0 | | | | 505,410,491 | |
| | | | |
Short-term investments | | | | | | | | | | | | | | | | |
Investment companies | | | 7,658,402 | | | | 0 | | | | 0 | | | | 7,658,402 | |
U.S. Treasury securities | | | 1,697,258 | | | | 0 | | | | 0 | | | | 1,697,258 | |
Investments measured at net asset value* | | | | | | | | | | | | | | | 3,363,437 | |
| | | 1,302,336,549 | | | | 75,584 | | | | 0 | | | | 1,305,775,570 | |
Futures contracts | | | 274,265 | | | | 0 | | | | 0 | | | | 274,265 | |
Total assets | | $ | 1,302,610,814 | | | $ | 75,584 | | | $ | 0 | | | $ | 1,306,049,835 | |
Liabilities | | | | | | | | | | | | | | | | |
Futures contracts | | $ | 8,893 | | | $ | 0 | | | $ | 0 | | | $ | 8,893 | |
Total liabilities | | $ | 8,893 | | | $ | 0 | | | $ | 0 | | | $ | 8,893 | |
| * | Investments that are measured at fair value using the net asset value per share (or its equivalent) as a practical expedient have not been categorized in the fair value hierarchy. The fair value amount presented in the table is intended to permit reconciliation of the fair value hierarchy to the amounts presented in the Statement of Assets and Liabilities. The Fund’s investment in Securities Lending Cash Investments LLC valued at $3,363,437 does not have a redemption period notice, can be redeemed daily and does not have any unfunded commitments. |
Futures contracts are reported at their variation margin at measurement date, which represents the amount due to/from the Fund at that date. All other assets and liabilities are reported at their market value at measurement date.
The Fund recognizes transfers between levels within the fair value hierarchy at the end of the reporting period. At September 30, 2017, the Fund did not have any transfers into/out of Level 1, Level 2, or Level 3.
4. TRANSACTIONS WITH AFFILIATES AND OTHER EXPENSES
Management fee
Funds Management, an indirect wholly owned subsidiary of Wells Fargo, is the manager of the Fund and provides advisory and fund-level administrative services under an investment management agreement. Under the investment management agreement, Funds Management is responsible for, among other services, implementing the investment objectives and strategies of the Fund, supervising the subadviser, providing fund-level administrative services in connection with the Fund’s operations, and providing any other fund-level administrative services reasonably necessary
| | | | |
| 44 | | Wells Fargo Index Asset Allocation Fund | | Notes to financial statements |
for the operation of the Fund. As compensation for its services under the investment management agreement, Funds Management is entitled to receive an annual management fee starting at 0.65% and declining to 0.48% as the average daily net assets of the Fund increase. For the year ended September 30, 2017, the management fee was equivalent to an annual rate of 0.61% of the Fund’s average daily net assets.
Funds Management has retained the services of a subadviser to provide daily portfolio management to the Fund. The fee for subadvisory services is borne by Funds Management. WellsCap is the subadviser to the Fund and is entitled to receive a fee from Funds Management at an annual rate starting at 0.15% and declining to 0.10% as the average daily net assets of the Fund increase.
Administration fees
Under a class-level administration agreement, Funds Management provides class-level administrative services to the Fund, which includes paying fees and expenses for services provided by the transfer agent, sub-transfer agents, omnibus account servicers and record-keepers. As compensation for its services under the class-level administration agreement, Funds Management receives an annual fee which is calculated based on the average daily net assets of each class as follows:
| | | | |
| | | Class-level
administration fee | |
Class A, Class B, Class C | | | 0.21 | % |
Administrator Class, Institutional Class | | | 0.13 | |
Funds Management has contractually waived and/or reimbursed management and administration fees to the extent necessary to maintain certain net operating expense ratios for the Fund. Waiver of fees and/or reimbursement of expenses by Funds Management were made first from fund level expenses on a proportionate basis and then from class specific expenses. Funds Management has committed through January 31, 2018 to waive fees and/or reimburse expenses to the extent necessary to cap the Fund’s expenses at 1.15% for Class A shares, 1.90% for Class C shares, 0.90% for Administrator Class shares, and 0.75% for Institutional Class shares. After this time, the cap may be increased or the commitment to maintain the cap may be terminated only with the approval of the Board of Trustees.
During the year ended September 30, 2017, State Street Bank and Trust Company (“State Street”), the Fund’s custodian, reimbursed the Fund $1,111 for certain out-of-pocket expenses that were billed to the Fund in error from 1998-2015. This amount is included in dividend income on the Statement of Operations. In addition, Funds Management was also reimbursed $3,063 by State Street for waivers/reimbursements it made to the Fund to limit Fund expenses during the period the Fund was erroneously billed.
Distribution fees
The Trust has adopted a distribution plan for Class B and Class C shares of the Fund pursuant to Rule 12b-1 under the 1940 Act. Distribution fees are charged to Class B and Class C shares and paid to Wells Fargo Funds Distributor, LLC (“Funds Distributor”), the principal underwriter, at an annual rate of 0.75% of the average daily net assets of Class B and Class C shares.
In addition, Funds Distributor is entitled to receive the front-end sales charge from the purchase of Class A shares and a contingent deferred sales charge on the redemption of certain Class A shares. Funds Distributor is also entitled to receive the contingent deferred sales charges from redemptions of Class B and Class C shares. For the year ended September 30, 2017, Funds Distributor received $95,953 from the sale of Class A shares and $2,308 in contingent deferred sales charges from redemptions of Class C shares. No contingent deferred sales charges were incurred by Class A and Class B shares for the year ended September 30, 2017.
Shareholder servicing fees
The Trust has entered into contracts with one or more shareholder servicing agents, whereby Class A, Class B, Class C, and Administrator Class of the Fund are charged a fee at an annual rate of 0.25% of the average daily net assets of each respective class.
A portion of these total shareholder servicing fees were paid to affiliates of Wells Fargo.
Interfund transactions
The Fund may purchase or sell portfolio investment securities to certain other Wells Fargo affiliates pursuant to Rule 17a-7 of the 1940 Act and under procedures adopted by the Board of Trustees. The procedures have been designed to ensure that these interfund transactions, which do not incur broker commissions, are effected at current market prices.
| | | | | | |
| Notes to financial statements | | Wells Fargo Index Asset Allocation Fund | | | 45 | |
5. INVESTMENT PORTFOLIO TRANSACTIONS
Purchases and sales of investments, excluding short-term securities, for the year ended September 30, 2017 were as follows:
| | | | | | |
Purchases at cost | | Sales proceeds |
U.S.
government | | Non-U.S.
government | | U.S.
government | | Non-U.S.
government |
| $123,052,798 | | $26,559,415 | | $62,345,409 | | $43,686,661 |
6. DERIVATIVE TRANSACTIONS
During the year ended September 30, 2017, the Fund entered into futures contracts to manage the duration of the portfolio and to gain market exposure to certain asset classes by implementing tactical asset allocation shifts. The Fund had an average notional amount of $17,995,476 and $102,167,829 in long and short futures contracts respectively, during the year ended September 30, 2017.
A summary of the location of derivative instruments on the financial statements by primary risk exposure is outlined following tables.
The fair value of derivative instruments as of September 30, 2017 was as follows for the Fund:
| | | | | | | | | | | | |
| | | Asset derivatives | | | Liability derivatives | |
| | | Statement of Assets and Liabilities
location | | Fair value | | | Statement of Assets and Liabilities
location | | Fair value | |
Equity risk | | Receivable for daily variation margin on open futures contracts | | $ | 4,265 | * | | Payable for daily variation margin on open futures contracts | | $ | 0 | * |
Interest rate risk | | Receivable for daily variation margin on open futures contracts | | | 270,000 | * | | Payable for daily variation margin on open futures contracts | | | 8,893 | * |
| | | | | $ | 274,265 | | | | | $ | 8,893 | |
| * | Only the current day’s variation margin as of September 30, 2017 is reported separately on the Statement of Assets and Liabilities. |
The effect of derivative instruments on the Statement of Operations for the year ended September 30, 2017 was as follows for the Fund:
| | | | | | | | |
| | | Amount of realized
gains on
derivatives | | | Change in unrealized
gains (losses) on
derivatives | |
Equity risk | | $ | 2,029,822 | | | $ | 3,437 | |
Interest rate risk | | | 5,253,859 | | | | 1,020,859 | |
| | | $ | 7,283,681 | | | $ | 1,024,296 | |
For certain types of derivative transactions, the Fund has entered into International Swaps and Derivatives Association, Inc. master agreements (“ISDA Master Agreements”) or similar agreements with approved counterparties. The ISDA Master Agreements or similar agreements may have requirements to deliver/deposit securities or cash to/with an exchange or broker-dealer as collateral and allows the Fund to offset, with each counterparty, certain derivative financial instrument’s assets and/or liabilities with collateral held or pledged. Collateral requirements differ by type of derivative. Collateral or margin requirements are set by the broker or exchange clearinghouse for exchange traded derivatives while collateral terms are contract specific for over-the-counter traded derivatives. Cash collateral that has been pledged to cover obligations of the Fund under ISDA Master Agreements or similar agreements, if any, are reported separately in the Statement of Assets and Liabilities. Securities pledged as collateral, if any, are noted in the Portfolio of Investments. With respect to balance sheet offsetting, absent an event of default by the counterparty or a termination of the agreement, the reported amounts of financial assets and financial liabilities in the Statement of Assets and Liabilities are not offset across transactions between the Fund and the applicable counterparty. A reconciliation of the gross amounts on the Statement of Assets and Liabilities to the net amounts by derivative type, including any collateral exposure, is as follows:
| | | | | | | | | | | | |
| Counterparty | | Gross amounts
of assets in the
Statement of
Assets and
Liabilities | | Amounts
subject to
netting
agreements | | Collateral
received | | | Net amount
of assets | |
Goldman Sachs | | $274,265 | | $(8,893) | | $ | 0 | | | $ | 265,372 | |
| | | | |
| 46 | | Wells Fargo Index Asset Allocation Fund | | Notes to financial statements |
| | | | | | | | | | | | |
| Counterparty | | Gross amounts
of liabilities in the
Statement of
Assets and
Liabilities | | Amounts
subject to
netting
agreements | | Collateral
pledged | | | Net amount
of liabilities | |
Goldman Sachs | | $8,893 | | $(8,893) | | $ | 0 | | | $ | 0 | |
7. BANK BORROWINGS
The Trust (excluding the money market funds and certain other funds) and Wells Fargo Variable Trust are parties to a $280,000,000 revolving credit agreement whereby the Fund is permitted to use bank borrowings for temporary or emergency purposes, such as to fund shareholder redemption requests. Interest under the credit agreement is charged to the Fund based on a borrowing rate equal to the higher of the Federal Funds rate in effect on that day plus 1.25% or the overnight LIBOR rate in effect on that day plus 1.25%. In addition, an annual commitment fee equal to 0.25% of the unused balance is allocated to each participating fund. Prior to August 29, 2017, the revolving credit agreement amount was $250,000,000.
For the year ended September 30, 2017, there were no borrowings by the Fund under the agreement.
8. DISTRIBUTIONS TO SHAREHOLDERS
The tax character of distributions paid during the years ended September 30, 2017 and September 30, 2016 were as follows:
| | | | | | | | |
| | | Year ended September 30 | |
| | | 2017 | | | 2016 | |
Ordinary income | | $ | 16,158,411 | | | $ | 16,458,803 | |
Long-term capital gain | | | 5,038,835 | | | | 40,146,003 | |
As of September 30, 2017, the components of distributable earnings on a tax basis were as follows:
| | | | |
Undistributed ordinary income | | Undistributed long-term gain | | Unrealized gains |
| $2,614,298 | | $4,262,981 | | $340,562,069 |
9. INDEMNIFICATION
Under the Trust’s organizational documents, the officers and Trustees have been granted certain indemnification rights against certain liabilities that may arise out of performance of their duties to the Trust. Additionally, in the normal course of business, the Trust may enter into contracts with service providers that contain a variety of indemnification clauses. The Trust’s maximum exposure under these arrangements is dependent on future claims that may be made against the Fund and, therefore, cannot be estimated.
| | | | | | |
| Report of independent registered public accounting firm | | Wells Fargo Index Asset Allocation Fund | | | 47 | |
BOARD OF TRUSTEES AND SHAREHOLDERS OF WELLS FARGO FUNDS TRUST:
We have audited the accompanying statement of assets and liabilities, including the portfolio of investments, of the Wells Fargo Index Asset Allocation Fund (the “Fund”), one of the funds constituting the Wells Fargo Funds Trust, as of September 30, 2017, and the related statement of operations for the year then ended, the statements of changes in net assets for each of the years in the two-year period then ended, and the financial highlights for each of the years or periods in the five-year period then ended. These financial statements and financial highlights are the responsibility of the Fund’s management. Our responsibility is to express an opinion on these financial statements and financial highlights based on our audits.
We conducted our audits in accordance with the standards of the Public Company Accounting Oversight Board (United States). Those standards require that we plan and perform the audit to obtain reasonable assurance about whether the financial statements and financial highlights are free of material misstatement. An audit includes examining, on a test basis, evidence supporting the amounts and disclosures in the financial statements. Our procedures included confirmation of securities owned as of September 30, 2017, by correspondence with the custodian and brokers, or by other appropriate auditing procedures. An audit also includes assessing the accounting principles used and significant estimates made by management, as well as evaluating the overall financial statement presentation. We believe that our audits provide a reasonable basis for our opinion.
In our opinion, the financial statements and financial highlights referred to above present fairly, in all material respects, the financial position of the Wells Fargo Index Asset Allocation Fund as of September 30, 2017, the results of its operations for the year then ended, changes in its net assets for each of the years in the two-year period then ended, and the financial highlights for each of the years or periods in the five-year period then ended, in conformity with U.S. generally accepted accounting principles.

Boston, Massachusetts
November 22, 2017
| | | | |
| 48 | | Wells Fargo Index Asset Allocation Fund | | Other information (unaudited) |
TAX INFORMATION
For corporate shareholders, pursuant to Section 854 of the Internal Revenue Code, 96.78% of ordinary income dividends qualify for the corporate dividends-received deduction for the fiscal year ended September 30, 2017.
Pursuant to Section 852 of the Internal Revenue Code, $5,038,835 was designated as a 20% rate gain distribution for the fiscal year ended September 30, 2017.
Pursuant to Section 854 of the Internal Revenue Code, $15,868,441 of income dividends paid during the fiscal year ended September 30, 2017 has been designated as qualified dividend income (QDI).
For the fiscal year ended September 30, 2017, $3,314,795 has been designated as interest-related dividends for nonresident alien shareholders pursuant to Section 871 of the Internal Revenue Code.
For the fiscal year ended September 30, 2017, $5,627,533 has been designated as short-term capital gain dividends for nonresident alien shareholders pursuant to Section 871 of the Internal Revenue Code.
For the fiscal year ended September 30, 2017, 20.25% of the ordinary income distributed was derived from interest on U.S. government.
PROXY VOTING INFORMATION
A description of the policies and procedures that the Fund uses to determine how to vote proxies relating to portfolio securities is available, upon request, by calling 1-800-222-8222, visiting our website at wellsfargofunds.com, or visiting the SEC website at sec.gov. Information regarding how the Fund voted proxies relating to portfolio securities during the most recent 12-month period ended June 30 is available on the Fund’s website at wellsfargofunds.com or by visiting the SEC website at sec.gov.
PORTFOLIO HOLDINGS INFORMATION
The complete portfolio holdings for the Fund are publicly available monthly on the Fund’s website (wellsfargofunds.com), on a one-month delayed basis. In addition, top ten holdings information (excluding derivative positions) for the Fund is publicly available on the Fund’s website on a monthly, seven-day or more delayed basis. The Fund files its complete schedule of portfolio holdings with the SEC for the first and third quarters of each fiscal year on Form N-Q, which is available by visiting the SEC website at sec.gov. In addition, the Fund’s Form N-Q may be reviewed and copied at the SEC’s Public Reference Room in Washington, DC, and at regional offices in New York City, at 233 Broadway, and in Chicago, at 175 West Jackson Boulevard, Suite 900. Information about the Public Reference Room may be obtained by calling 1-800-SEC-0330.
| | | | | | |
| Other information (unaudited) | | Wells Fargo Index Asset Allocation Fund | | | 49 | |
BOARD OF TRUSTEES AND OFFICERS
Each of the Trustees and Officers1 listed in the table below acts in identical capacities for each fund in the Wells Fargo family of funds, which consists of 152 mutual funds comprising the Wells Fargo Funds Trust, Wells Fargo Variable Trust, Wells Fargo Master Trust and four closed-end funds (collectively the “Fund Complex”). This table should be read in conjunction with the Prospectus and the Statement of Additional Information2. The mailing address of each Trustee and Officer is 525 Market Street, 12th Floor, San Francisco, CA 94105. Each Trustee and Officer serves an indefinite term, however, each Trustee serves such term until reaching the mandatory retirement age established by the Trustees.
Independent Trustees
| | | | | | |
Name and year of birth | | Position held and length of service* | | Principal occupations during past five years or longer | | Current other public company or
investment company
directorships |
William R. Ebsworth (Born 1957) | | Trustee, since 2015 | | Retired. From 1984 to 2013, equities analyst, portfolio manager, research director and chief investment officer at Fidelity Management and Research Company in Boston, Tokyo, and Hong Kong and retired in 2013 as Chief Investment Officer of Fidelity Strategic Advisers, Inc. where he led a team of investment professionals managing client assets. Prior thereto, Board member of Hong Kong Securities Clearing Co., Hong Kong Options Clearing Corp., the Thailand International Fund, Ltd., Fidelity Investments Life Insurance Company, and Empire Fidelity Investments Life Insurance Company. Board member of the Forté Foundation (non-profit organization) and the Vincent Memorial Hospital Endowment (non-profit organization), where he serves on the Investment Committee and as a Chair of the Audit Committee. Mr. Ebsworth is a CFA® charterholder. | | Asset Allocation Trust |
Jane A. Freeman (Born 1953) | | Trustee, since 2015 | | Retired. From 2012 to 2014 and 1999 to 2008, Chief Financial Officer of Scientific Learning Corporation. From 2008 to 2012, Ms. Freeman provided consulting services related to strategic business projects. Prior to 1999, Portfolio Manager at Rockefeller & Co. and Scudder, Stevens & Clark. Board member of the Harding Loevner Funds from 1996 to 2014, serving as both Lead Independent Director and chair of the Audit Committee. Board member of the Russell Exchange Traded Funds Trust from 2011 to 2012 and the chair of the Audit Committee. Ms. Freeman is a Board Member of Ruth Bancroft Garden (non-profit organization) and an inactive chartered financial analyst. | | Asset Allocation Trust |
Peter G. Gordon** (Born 1942) | | Trustee, since 1998; Chairman, since 2005 | | Co-Founder, Retired Chairman, President and CEO of Crystal Geyser Water Company. Trustee Emeritus, Colby College. | | Asset Allocation Trust |
Isaiah Harris, Jr. (Born 1952) | | Trustee, since 2009 | | Retired. Chairman of the Board of CIGNA Corporation since 2009, and Director since 2005. From 2003 to 2011, Director of Deluxe Corporation. Prior thereto, President and CEO of BellSouth Advertising and Publishing Corp. from 2005 to 2007, President and CEO of BellSouth Enterprises from 2004 to 2005 and President of BellSouth Consumer Services from 2000 to 2003. Emeritus member of the Iowa State University Foundation Board of Governors. Emeritus Member of the Advisory Board of Iowa State University School of Business. Advisory Board Member, Palm Harbor Academy (charter school). Advisory Board Member, Child Evangelism Fellowship (non-profit). Mr. Harris is a certified public accountant (inactive status). | | CIGNA Corporation; Asset Allocation Trust |
Judith M. Johnson (Born 1949) | | Trustee, since 2008; Audit Committee Chairman, since 2008 | | Retired. Prior thereto, Chief Executive Officer and Chief Investment Officer of Minneapolis Employees Retirement Fund from 1996 to 2008. Ms. Johnson is an attorney, certified public accountant and a certified managerial accountant. | | Asset Allocation Trust |
David F. Larcker (Born 1950) | | Trustee, since 2009 | | James Irvin Miller Professor of Accounting at the Graduate School of Business, Stanford University, Director of the Corporate Governance Research Initiative and Senior Faculty of The Rock Center for Corporate Governance since 2006. From 2005 to 2008, Professor of Accounting at the Graduate School of Business, Stanford University. Prior thereto, Ernst & Young Professor of Accounting at The Wharton School, University of Pennsylvania from 1985 to 2005. | | Asset Allocation Trust |
| | | | |
| 50 | | Wells Fargo Index Asset Allocation Fund | | Other information (unaudited) |
| | | | | | |
Name and year of birth | | Position held and length of service* | | Principal occupations during past five years or longer | | Current other public company or
investment company
directorships |
Olivia S. Mitchell (Born 1953) | | Trustee, since 2006 | | International Foundation of Employee Benefit Plans Professor, Wharton School of the University of Pennsylvania since 1993. Director of Wharton’s Pension Research Council and Boettner Center on Pensions & Retirement Research, and Research Associate at the National Bureau of Economic Research. Previously, Cornell University Professor from 1978 to 1993. | | Asset Allocation Trust |
Timothy J. Penny (Born 1951) | | Trustee, since 1996: Vice Chairman, since 2017 | | President and Chief Executive Officer of Southern Minnesota Initiative Foundation, a non-profit organization, since 2007 and Senior Fellow at the Humphrey Institute Policy Forum at the University of Minnesota since 1995. Member of the Board of Trustees of NorthStar Education Finance, Inc., a non-profit organization, since 2007. | | Asset Allocation Trust |
Michael S. Scofield (Born 1943) | | Trustee, since 2010 | | Served on the Investment Company Institute’s Board of Governors and Executive Committee from 2008-2011 as well the Governing Council of the Independent Directors Council from 2006-2011 and the Independent Directors Council Executive Committee from 2008-2011. Chairman of the IDC from 2008-2010. Trustee of the Evergreen Funds complex (and its predecessors) from 1984 to 2010. Chairman of the Evergreen Funds from 2000-2010. Former Trustee of the Mentor Funds. Retired Attorney, Law Offices of Michael S. Scofield. | | Asset Allocation Trust |
| * | Length of service dates reflect the Trustee’s commencement of service with the Trust’s predecessor entities, where applicable. |
| ** | Peter Gordon is expected to retire on December 31, 2017. |
Advisory Board Members
| | | | | | |
Name and year of birth | | Position held and length of service | | Principal occupations during past five years or longer | | Current other public company or
investment company
directorships |
James G. Polisson (Born 1959) | | Advisory Board Member, since 2017 | | Retired. Chief Marketing Officer, Source (ETF) UK Services, Ltd, from 2015 to 2017. From 2012 to 2015, Principal of The Polisson Group, LLC, a management consulting, corporate advisory and principal investing company. Chief Executive Officer and Managing Director at Russell Investments, Global Exchange Traded Funds from 2010 to 2012. Managing Director of Barclays Global Investors from 1998 to 2010 and Global Chief Marketing Officer for iShares and Barclays Global Investors from 2000 to 2010. Prior thereto, Vice President, Fidelity Retail Mutual Fund Group from 1996 to 1998 and Risk Management Practice Manager, Fidelity Consulting from 1995 to 1996. Board member of the Russell Exchange Traded Fund Trust from 2011 to 2012. Director of Barclays Global Investors Holdings Deutschland GmbH from 2006 to 2009. Mr. Polisson is an attorney and has a retired status with the Massachusetts and District of Columbia Bar Associations. | | None |
Pamela Wheelock (Born 1959) | | Advisory Board Member, since 2017 | | Chief Operating Officer, Twin Cities Habitat for Humanity, since January, 2017. Vice President of University Services, University of Minnesota from 2012 to 2017. Prior thereto, Interim President and Chief Executive Officer of Blue Cross Blue Shield of Minnesota from 2010 to 2011, Chairman of the Board from 2009 to 2011 and Board Director from 2003 to 2015. Vice President, Leadership and Community Engagement, Bush Foundation, Saint Paul, Minnesota (a private foundation) from 2009 to 2011. Executive Vice President and Chief Financial Officer, Minnesota Sports and Entertainment from 2004 to 2009 and Senior Vice President from 2002 to 2004. Commissioner of Finance, State of Minnesota, from 1999 to 2002. Currently on the Board of Directors, Governance Committee and Finance Committee, for the Minnesota Philanthropy Partners (Saint Paul Foundation) since 2012 and Board Chair of the Minnesota Wild Foundation since 2010. | | None |
| | | | | | |
| Other information (unaudited) | | Wells Fargo Index Asset Allocation Fund | | | 51 | |
Officers
| | | | | | |
Name and year of birth | | Position held and
length of service | | Principal occupations during past five years or longer | | |
Andrew Owen (Born 1960) | | President, since 2017 | | Executive Vice President of Wells Fargo & Company and Head of Affiliated Managers, Wells Fargo Asset Management, since 2014. In addition, Mr. Owen is currently President, Chief Executive Officer and Director of Wells Fargo Funds Management, LLC since 2017. Prior thereto, Executive Vice President responsible for marketing, investments and product development for Wells Fargo Funds Management, LLC, from 2009 to 2014. | | |
Jeremy DePalma1 (Born 1974) | | Treasurer, since 2012 | | Senior Vice President of Wells Fargo Funds Management, LLC since 2009. Senior Vice President of Evergreen Investment Management Company, LLC from 2008 to 2010 and head of the Fund Reporting and Control Team within Fund Administration from 2005 to 2010. | | |
C. David Messman (Born 1960) | | Secretary, since 2000; Chief Legal Officer, since 2003 | | Senior Vice President and Secretary of Wells Fargo Funds Management, LLC since 2001. Assistant General Counsel of Wells Fargo Bank, N.A. since 2013 and Vice President and Managing Counsel of Wells Fargo Bank, N.A. from 1996 to 2013. | | |
Michael H. Whitaker (Born 1967) | | Chief Compliance Officer, since 2016 | | Senior Vice President and Chief Compliance Officer since 2016. Senior Vice President and Chief Compliance Officer for Fidelity Investments from 2007 to 2016. | | |
David Berardi (Born 1975) | | Assistant Treasurer, since 2009 | | Vice President of Wells Fargo Funds Management, LLC since 2009. Vice President of Evergreen Investment Management Company, LLC from 2008 to 2010. Manager of Fund Reporting and Control for Evergreen Investment Management Company, LLC from 2004 to 2010. | | |
| 1 | Jeremy DePalma acts as Treasurer of 76 funds and Assistant Treasurer of 76 funds in the Fund Complex. |
| 2 | The Statement of Additional Information includes additional information about the Trustees and is available, without charge, upon request, by calling 1-800-222-8222 or by visiting the website at wellsfargofunds.com. |
| | | | |
| 52 | | Wells Fargo Index Asset Allocation Fund | | Other information (unaudited) |
BOARD CONSIDERATION OF INVESTMENT MANAGEMENT AND SUB-ADVISORY AGREEMENTS:
Under the Investment Company Act of 1940 (the “1940 Act”), the Board of Trustees (the “Board”) of Wells Fargo Funds Trust (the “Trust”) must determine annually whether to approve the continuation of the Trust’s investment management and sub-advisory agreements. In this regard, at an in-person meeting held on May 16-17, 2017 (the “Meeting”), the Board, all the members of which have no direct or indirect interest in the investment management and sub-advisory agreements and are not “interested persons” of the Trust, as defined in the 1940 Act (the “Independent Trustees”), reviewed and approved for Wells Fargo Index Asset Allocation Fund (the “Fund”): (i) an investment management agreement (the “Management Agreement”) with Wells Fargo Funds Management, LLC (“Funds Management”); and (ii) an investment sub-advisory agreement (the “Sub-Advisory Agreement”) with Wells Capital Management Incorporated (the “Sub-Adviser”), an affiliate of Funds Management. The Management Agreement and the Sub-Advisory Agreement are collectively referred to as the “Advisory Agreements.”
At the Meeting, the Board considered the factors and reached the conclusions described below relating to the selection of Funds Management and the Sub-Adviser and the approval of the Advisory Agreements. Prior to the Meeting, including at an in-person meeting in April 2017, the Trustees conferred extensively among themselves and with representatives of Funds Management about these matters. Also, the Board has adopted a team-based approach, with each team consisting of a sub-set of Trustees, to assist the full Board in the discharge of its duties in reviewing performance and other matters throughout the year. The Independent Trustees were assisted in their evaluation of the Advisory Agreements by independent legal counsel, from whom they received separate legal advice and with whom they met separately.
In providing information to the Board, Funds Management and the Sub-Adviser were guided by a detailed set of requests for information submitted to them by independent legal counsel on behalf of the Independent Trustees at the start of the Board’s annual contract renewal process earlier in 2017. In considering and approving the Advisory Agreements, the Trustees considered the information they believed relevant, including but not limited to the information discussed below. The Board considered not only the specific information presented in connection with the Meeting, but also the knowledge gained over time through interaction with Funds Management and the Sub-Adviser about various topics. In this regard, the Board reviewed reports of Funds Management at each of its quarterly meetings, which included, among other things, portfolio reviews and performance reports. In addition, the Board and the teams mentioned above confer with portfolio managers at various times throughout the year. The Board did not identify any particular information or consideration that was all-important or controlling, and each individual Trustee may have attributed different weights to various factors.
After its deliberations, the Board unanimously approved the continuation of the Advisory Agreements for a one-year term and determined that the compensation payable to Funds Management and the Sub-Adviser under each of the Advisory Agreements was reasonable. The Board considered the approval of the Advisory Agreements for the Fund as part of its consideration of agreements for funds across the complex, but its approvals were made on a fund-by-fund basis. The following summarizes a number of important, but not necessarily all, factors considered by the Board in support of its approvals.
Nature, extent and quality of services
The Board received and considered various information regarding the nature, extent and quality of services provided to the Fund by Funds Management and the Sub-Adviser under the Advisory Agreements. This information included a description of the investment advisory services and Fund-level administrative services covered by the Management Agreement, as well as, among other things, a summary of the background and experience of senior management of Funds Management, a summary of certain organizational and personnel changes involving Funds Management and the Sub-Adviser, and a description of Funds Management’s and the Sub-Adviser’s business continuity planning programs and of their approaches to data privacy and cybersecurity. The Board also considered the qualifications, background, tenure and responsibilities of each of the portfolio managers primarily responsible for the day-to-day portfolio management of the Fund.
The Board evaluated the ability of Funds Management and the Sub-Adviser to attract and retain qualified investment professionals, including research, advisory and supervisory personnel. The Board further considered the compliance programs and compliance records of Funds Management and the Sub-Adviser. In addition, the Board took into account the full range of services provided to the Fund by Funds Management and its affiliates.
Fund performance and expenses
The Board considered the performance results for the Fund over various time periods ended December 31, 2016. The Board considered these results in comparison to the performance of funds in a universe that was determined by
| | | | | | |
| Other information (unaudited) | | Wells Fargo Index Asset Allocation Fund | | | 53 | |
Broadridge Inc. (“Broadridge”) to be similar to the Fund (the “Universe”), and in comparison to the Fund’s benchmark index and to other comparative data. Broadridge is an independent provider of investment company data. The Board received a description of the methodology used by Broadridge to select the mutual funds in the performance Universe. The Board noted that the performance of the Fund (Administrator Class) was higher than the average performance of the Universe for all periods under review. The Board also noted that the performance of the Fund was higher than its benchmark, the Index Asset Allocation Blended Index, for the one- and five-year periods under review, but lower than its benchmark for the three- and ten-year periods under review.
The Board also received and considered information regarding the Fund’s net operating expense ratios and their various components, including actual management fees, custodian and other non-management fees, and Rule 12b-1 and non-Rule 12b-1 shareholder service fees. The Board considered these ratios in comparison to the median ratios of funds in class-specific expense groups that were determined by Broadridge to be similar to the Fund (the “Groups”). The Board received a description of the methodology used by Broadridge to select the mutual funds in the expense Groups and to report data with respect to a new share class launched in 2016. The Board also received an explanation of how funds comprising expense groups and their expense ratios may vary from year-to-year. Based on the Broadridge reports, the Board noted that the net operating expense ratios of the Fund were lower than or in range of the median net operating expense ratios of the expense Groups for all share classes.
The Board took into account the Fund performance and expense information provided to it among the factors considered in deciding to re-approve the Advisory Agreements.
Investment management and sub-advisory fee rates
The Board reviewed and considered the contractual fee rates payable by the Fund to Funds Management under the Management Agreement, as well as the contractual fee rates payable by the Fund to Funds Management for class-level administrative services under a Class-Level Administration Agreement, which include, among other things, class-level transfer agency and sub-transfer agency costs (collectively, the “Management Rates”). The Board also reviewed and considered the contractual investment sub-advisory fee rates that are payable by Funds Management to the Sub-Adviser for investment sub-advisory services.
Among other information reviewed by the Board was a comparison of the Fund’s Management Rates with the average contractual investment management fee rates of funds in the expense Groups at a common asset level as well as transfer agency costs of the funds in the expense Groups. The Board noted that the Management Rates of the Fund were lower than, in range of, or equal to the sum of these average rates for the Fund’s expense Groups for all share classes.
The Board also received and considered information about the portion of the total management fee that was retained by Funds Management after payment of the fee to the Sub-Adviser for sub-advisory services. In assessing the reasonableness of this amount, the Board received and evaluated information about the nature and extent of responsibilities retained and risks assumed by Funds Management and not delegated to or assumed by the Sub-Adviser, and about Funds Management’s on-going oversight services. Given the affiliation between Funds Management and the Sub-Adviser, the Board ascribed limited relevance to the allocation of fees between them.
The Board also received and considered information about the nature and extent of services offered and fee rates charged by Funds Management and the Sub-Adviser to other types of clients with investment strategies similar to those of the Fund. In this regard, the Board received information about the significantly greater scope of services, and compliance, reporting and other legal burdens and risks of managing mutual funds compared with those associated with managing assets of non-mutual fund clients such as institutional separate accounts.
Based on its consideration of the factors and information it deemed relevant, including those described here, the Board determined that the compensation payable to Funds Management under the Management Agreement and to the Sub-Adviser under the Sub-Advisory Agreement was reasonable.
Profitability
The Board received and considered information concerning the profitability of Funds Management, as well as the profitability of Wells Fargo as a whole, from providing services to the Fund and the fund family as a whole. The Board also received and considered information concerning the profitability of the Sub-Adviser from providing services to the fund family as a whole, noting that the Sub-Adviser’s profitability information with respect to providing services to the Fund was subsumed in the Wells Fargo and Funds Management profitability analysis.
Funds Management reported on the methodologies and estimates used in calculating profitability, including a description of the methodology used to allocate certain expenses. Among other things, the Board noted that the levels of
| | | | |
| 54 | | Wells Fargo Index Asset Allocation Fund | | Other information (unaudited) |
profitability reported on a fund-by-fund basis varied widely, depending on factors such as the size and type of fund. Based on its review, the Board did not deem the profits reported by Funds Management or Wells Fargo from its services to the Fund to be at a level that would prevent it from approving the continuation of the Advisory Agreements.
Economies of scale
With respect to possible economies of scale, the Board noted the existence of breakpoints in the Fund’s management fee structure, which operate generally to reduce the Fund’s expense ratios as the Fund grows in size. It considered that, for a small fund or a fund that shrinks in size, breakpoints conversely can result in higher fee levels. The Board also considered that in addition to management fee breakpoints, competitive management fee rates set at the outset without regard to breakpoints and fee waiver and expense reimbursement arrangements are means of sharing potential economies of scale with shareholders of the Fund. The Board considered Funds Management’s view, which Funds Management indicated was supported by independent third-party industry studies which were summarized for the Board, that any analyses of potential economies of scale in managing a particular fund are inherently limited in light of the joint and common costs and investments that Funds Management incurs across the fund family as a whole.
The Board concluded that the Fund’s fee and expense arrangements, including contractual breakpoints, constituted a reasonable approach to sharing potential economies of scale with the Fund and its shareholders.
Other benefits to Funds Management and the Sub-Adviser
The Board received and considered information regarding potential “fall-out” or ancillary benefits received by Funds Management and its affiliates, including the Sub-Adviser, as a result of their relationships with the Fund. Ancillary benefits could include, among others, benefits directly attributable to other relationships with the Fund and benefits potentially derived from an increase in Funds Management’s and the Sub-Adviser’s business as a result of their relationships with the Fund. The Board noted that various affiliates of Funds Management may receive distribution-related fees, shareholder servicing payments and sub-transfer agency fees in respect of shares sold or held through them and services provided.
The Board also reviewed information about soft dollar credits earned and utilized by the Sub-Adviser, fees earned by Funds Management and the Sub-Adviser from managing a private investment vehicle for the fund family’s securities lending collateral and commissions earned by an affiliated broker from portfolio transactions.
Based on its consideration of the factors and information it deemed relevant, including those described here, the Board did not find that any ancillary benefits received by Funds Management and its affiliates, including the Sub-Adviser, were unreasonable.
Conclusion
At the Meeting, after considering the above-described factors and based on its deliberations and its evaluation of the information described above, the Board unanimously approved the continuation of the Advisory Agreements for a one-year term and determined that the compensation payable to Funds Management and the Sub-Adviser under each of the Advisory Agreements was reasonable.
| | | | | | |
| List of abbreviations | | Wells Fargo Index Asset Allocation Fund | | | 55 | |
The following is a list of common abbreviations for terms and entities that may have appeared in this report.
| ACA | — ACA Financial Guaranty Corporation |
| ADR | — American depositary receipt |
| ADS | — American depositary shares |
| AGC | — Assured Guaranty Corporation |
| AGM | — Assured Guaranty Municipal |
| Ambac | — Ambac Financial Group Incorporated |
| AMT | — Alternative minimum tax |
| BAN | — Bond anticipation notes |
| BHAC | — Berkshire Hathaway Assurance Corporation |
| CAB | — Capital appreciation bond |
| CCAB | — Convertible capital appreciation bond |
| CDA | — Community Development Authority |
| CDO | — Collateralized debt obligation |
| CLO | — Collateralized loan obligation |
| DRIVER | — Derivative inverse tax-exempt receipts |
| DW&P | — Department of Water & Power |
| DWR | — Department of Water Resources |
| ECFA | — Educational & Cultural Facilities Authority |
| EDA | — Economic Development Authority |
| EDFA | — Economic Development Finance Authority |
| ETF | — Exchange-traded fund |
| FDIC | — Federal Deposit Insurance Corporation |
| FFCB | — Federal Farm Credit Banks |
| FGIC | — Financial Guaranty Insurance Corporation |
| FHA | — Federal Housing Administration |
| FHLB | — Federal Home Loan Bank |
| FHLMC | — Federal Home Loan Mortgage Corporation |
| FICO | — The Financing Corporation |
| FNMA | — Federal National Mortgage Association |
| GDR | — Global depositary receipt |
| GNMA | — Government National Mortgage Association |
| HCFR | — Healthcare facilities revenue |
| HEFA | — Health & Educational Facilities Authority |
| HEFAR | — Higher education facilities authority revenue |
| HFA | — Housing Finance Authority |
| HFFA | — Health Facilities Financing Authority |
| HUD | — Department of Housing and Urban Development |
| IDA | — Industrial Development Authority |
| IDAG | — Industrial Development Agency |
| KRW | — Republic of Korea won |
| LIBOR | — London Interbank Offered Rate |
| LIFER | — Long Inverse Floating Exempt Receipts |
| LLC | — Limited liability company |
| LLLP | — Limited liability limited partnership |
| LLP | — Limited liability partnership |
| MBIA | — Municipal Bond Insurance Association |
| MFHR | — Multifamily housing revenue |
| MSTR | — Municipal securities trust receipts |
| MUD | — Municipal Utility District |
| National | — National Public Finance Guarantee Corporation |
| PCFA | — Pollution Control Financing Authority |
| PCL | — Public Company Limited |
| PCR | — Pollution control revenue |
| PFA | — Public Finance Authority |
| PFFA | — Public Facilities Financing Authority |
| PFOTER | — Puttable floating option tax-exempt receipts |
| PJSC | — Public Joint Stock Company |
| plc | — Public limited company |
| PUTTER | — Puttable tax-exempt receipts |
| R&D | — Research & development |
| Radian | — Radian Asset Assurance |
| RAN | — Revenue anticipation notes |
| RDA | — Redevelopment Authority |
| RDFA | — Redevelopment Finance Authority |
| REIT | — Real estate investment trust |
| ROC | — Reset option certificates |
| SAVRS | — Select auction variable rate securities |
| SBA | — Small Business Authority |
| SDR | — Swedish depositary receipt |
| SFHR | — Single-family housing revenue |
| SFMR | — Single-family mortgage revenue |
| SPA | — Standby purchase agreement |
| SPDR | — Standard & Poor’s Depositary Receipts |
| SPEAR | — Short Puttable Exempt Adjustable Receipts |
| STRIPS | — Separate trading of registered interest and |
| TAN | — Tax anticipation notes |
| TIPS | — Treasury inflation-protected securities |
| TRAN | — Tax revenue anticipation notes |
| TTFA | — Transportation Trust Fund Authority |
| TVA | — Tennessee Valley Authority |
This page is intentionally left blank.

For more information
More information about Wells Fargo Funds is available free upon request. To obtain literature, please write, email, visit the Fund’s website, or call:
Wells Fargo Funds
P.O. Box 8266
Boston, MA 02266-8266
Email: fundservice@wellsfargo.com
Website: wellsfargofunds.com
Individual investors: 1-800-222-8222
Retail investment professionals: 1-888-877-9275
Institutional investment professionals: 1-866-765-0778
This report and the financial statements contained herein are submitted for the general information of the shareholders of the Fund. If this report is used for promotional purposes, distribution of the report must be accompanied or preceded by a current prospectus. Before investing, please consider the investment objectives, risks, charges, and expenses of the investment. For a current prospectus and, if available, a summary prospectus, containing this information, call 1-800-222-8222 or visit the Fund’s website at wellsfargofunds.com. Read the prospectus carefully before you invest or send money.
Wells Fargo Asset Management (WFAM) is a trade name used by the asset management businesses of Wells Fargo & Company. Wells Fargo Funds Management, LLC, a wholly owned subsidiary of Wells Fargo & Company, provides investment advisory and administrative services for Wells Fargo Funds. Other affiliates of Wells Fargo & Company provide subadvisory and other services for the funds. The funds are distributed by Wells Fargo Funds Distributor, LLC, Member FINRA, an affiliate of Wells Fargo & Company. Neither Wells Fargo Funds Distributor nor Wells Fargo Funds Management holds fund shareholder accounts or assets. This material is for general informational and educational purposes only and is NOT intended to provide investment advice or a recommendation of any kind—including a recommendation for any specific investment, strategy, or plan.
NOT FDIC INSURED ◾ NO BANK GUARANTEE ◾ MAY LOSE VALUE
© 2017 Wells Fargo Funds Management, LLC. All rights reserved.
| | |
 | | 306431 11-17 A227/AR227 09-17 |
Annual Report
September 30, 2017

Wells Fargo International Bond Fund


Reduce clutter. Save trees.
Sign up for electronic delivery of prospectuses and shareholder reports at wellsfargo.com/advantagedelivery
Contents
The views expressed and any forward-looking statements are as of September 30, 2017, unless otherwise noted, and are those of the Fund managers and/or Wells Fargo Funds Management, LLC. Discussions of individual securities, or the markets generally, or any Wells Fargo Fund are not intended as individual recommendations. Future events or results may vary significantly from those expressed in any forward-looking statements. The views expressed are subject to change at any time in response to changing circumstances in the market. Wells Fargo Funds Management, LLC and the Fund disclaim any obligation to publicly update or revise any views expressed or forward-looking statements.
NOT FDIC INSURED ◾ NO BANK GUARANTEE ◾ MAY LOSE VALUE
| | | | |
| 2 | | Wells Fargo International Bond Fund | | Letter to shareholders (unaudited) |

Andrew Owen
President
Wells Fargo Funds
Favorable economic news supported stocks, and interest rates moved higher.
Hiring remained strong, and business and consumer sentiment improved.
Dear Shareholder:
We are pleased to offer you this annual report for the Wells Fargo International Bond Fund for the 12-month period that ended September 30, 2017. Despite heightened market volatility at times, global stocks generally delivered double-digit results and bond markets had smaller but positive results as well. U.S. and international stocks returned 18.61% and 19.61%, respectively, for the 12-month period, as measured by the S&P 500 Index1 and the MSCI ACWI ex USA Index (Net),2 respectively; within fixed income, the Bloomberg Barclays U.S. Aggregate Bond Index3 returned 0.07% and the Bloomberg Barclays Municipal Bond Index4 returned 0.87% as interest rates rose from low levels.
Election results and central banks’ policies commanded investor attention as 2016 closed.
During the fourth quarter of 2016, investors appeared intent on the prospective outcomes of elections in the U.S. and central-bank actions globally. Following Donald Trump’s election victory, U.S. stocks rallied. Investors appeared optimistic that the new administration would pursue progrowth policies. Favorable economic news supported stocks, and interest rates moved higher. At their mid-December meeting, U.S. Federal Reserve (Fed) officials raised the target interest rate by a quarter percentage point to a range of 0.50% to 0.75%. The fourth quarter also saw the implementation of the U.S. Securities and Exchange Commission’s new rules for money market funds, which included floating net asset values (NAVs) as well as the possibility of liquidity fees and redemption gates for institutional prime and municipal money market funds. In the year leading up to money market fund reform implementation, nearly $1 trillion in assets moved from money market funds subject to floating NAVs into government money market funds, which continued to transact at a stable $1.00 NAV. Outside of the U.S., the prospects for faster U.S. growth appeared to trigger some acceleration in Europe.
Financial markets gained during the first two quarters of 2017 on positive economic data.
Stocks rallied globally through the first quarter of 2017, supported by signs of improvement in the U.S. and global economies. U.S. economic data released during the quarter reflected a healthy economy. Hiring remained strong, and business and consumer sentiment improved. In March, Fed officials raised their target interest rate by a quarter percentage point to a range of 0.75% to 1.00%. With the Fed’s target interest-rate increase, short-term bond yields rose during the quarter. Meanwhile, longer-term Treasury yields were little changed, leading to positive performance. Investment-grade and high-yield bonds benefited from strong demand. Municipal bond returns were positive in the quarter, helped by strong demand and constrained new-issue supply. Outside of the U.S., stocks in emerging markets generally outperformed stocks in the U.S. and international
| 1 | The S&P 500 Index consists of 500 stocks chosen for market size, liquidity, and industry group representation. It is a market-value-weighted index with each stock’s weight in the index proportionate to its market value. You cannot invest directly in an index. |
| 2 | The Morgan Stanley Capital International (MSCI) All Country World Index (ACWI) ex USA Index (Net) is a free-float-adjusted market-capitalization-weighted index that is designed to measure the equity market performance of developed markets, excluding the United States and Canada. Source: MSCI. MSCI makes no express or implied warranties or representations and shall have no liability whatsoever with respect to any MSCI data contained herein. The MSCI data may not be further redistributed or used as a basis for other indexes or any securities or financial products. This report is not approved, reviewed, or produced by MSCI. You cannot invest directly in an index. |
| 3 | The Bloomberg Barclays U.S. Aggregate Bond Index is a broad-based benchmark that measures the investment-grade, U.S. dollar-denominated, fixed-rate taxable bond market, including Treasuries, government-related and corporate securities, mortgage-backed securities (agency fixed-rate and hybrid adjustable-rate mortgage pass-throughs), asset-backed securities, and commercial mortgage-backed securities. You cannot invest directly in an index. |
| 4 | The Bloomberg Barclays Municipal Bond Index is an unmanaged index composed of long-term tax-exempt bonds with a minimum credit rating of Baa. You cannot invest directly in an index. |
| | | | | | |
| Letter to shareholders (unaudited) | | Wells Fargo International Bond Fund | | | 3 | |
developed markets because they benefited from both global economic growth and recent weakening in the U.S. dollar. Stocks in Asia, Europe, and Latin America also outperformed the U.S. market during the quarter.
Globally, stocks marked continued gains through the second quarter of 2017. Steady, albeit modest, economic growth both in the U.S. and abroad and generally favorable corporate earnings announcements supported higher valuations. U.S. inflation trended lower despite a continued decline in the unemployment rate. Ten-year U.S. Treasury yields declined, resulting in stronger prices for long-term bonds. As was widely expected, the Fed raised the target interest rate in June by a quarter percentage point to a range of 1.00% to 1.25%. In addition, the Fed indicated that it would begin to sell bonds accumulated on its balance sheet during quantitative easing programs conducted since 2008. Later in the third quarter, the Fed confirmed that the initiative to reduce the bonds that it holds likely would begin in October.
Volatility increased during the third quarter of 2017.
Early in July and again in August, volatility expectations increased and then receded—as measured by the CBOE VIX5—amid geopolitical tensions, particularly in Asia, and declining investor optimism following unsuccessful efforts to reform health care laws in the U.S. which suggested to some that President Trump and Congress would be unable to move forward with tax and regulatory reforms.
During the quarter, economic momentum increased in Europe; the European Central Bank held its rates steady at low levels and continued its quantitative easing bond-buying program, which is intended to spark economic activity. The Bank of England suggested it could hike interest rates in November, and the pound gained against other currencies. The Bank of Japan also maintained accommodative policies intended to support business activity and economic growth. In Germany, Angela Merkel was reelected chancellor; in Japan, Prime Minister Shinzo Abe called for snap elections as his popularity increased after North Korea’s aggressive program of missile launches. Both political developments were indicative of the type of political consistency in developed markets that reassure financial markets.
In emerging markets, many countries benefited from stronger currencies versus the U.S. dollar. In addition, commodity prices were on an upward trajectory, which benefited many companies that rely on natural resources for exports.
As the quarter closed, optimism returned as economic growth continued. The second-quarter gross domestic product measure was revised higher from 2.6% annualized to 3.0%. Consumer spending and residential and nonresidential investment increased. While inflation continued to trail the Fed’s targets, expectations remained for an additional short-term interest-rate hike before year-end.
| 5 | The Chicago Board Options Exchange Market Volatility Index (CBOE VIX) is a popular measure of the implied volatility of S&P 500 Index options. It represents one measure of the market’s expectation of stock market volatility over the next 30-day period. You cannot invest directly in an index. |
| | | | |
| 4 | | Wells Fargo International Bond Fund | | Letter to shareholders (unaudited) |
Don’t let short-term uncertainty derail long-term investment goals.
Periods of investment uncertainty can present challenges, but experience has taught us that maintaining long-term investment goals can be an effective way to plan for the future. To help you create a sound strategy based on your personal goals and risk tolerance, Wells Fargo Funds offers more than 100 mutual funds spanning a wide range of asset classes and investment styles. Although diversification cannot guarantee an investment profit or prevent losses, we believe it
can be an effective way to manage investment risk and potentially smooth out overall portfolio performance. We encourage investors to know their investments and to understand that appropriate levels of risk-taking may unlock opportunities.
Thank you for choosing to invest with Wells Fargo Funds. We appreciate your confidence in us and remain committed to helping you meet your financial needs.
Sincerely,

Andrew Owen
President
Wells Fargo Funds
For further information about your Fund, contact your investment professional, visit our website at wellsfargofunds.com, or call us directly at 1-800-222-8222. We are available 24 hours a day, 7 days a week.
This page is intentionally left blank.
| | | | |
| 6 | | Wells Fargo International Bond Fund | | Performance highlights (unaudited) |
Investment objective
The Fund seeks total return, consisting of income and capital appreciation.
Manager
Wells Fargo Funds Management, LLC
Subadviser
First International Advisors, LLC
Portfolio managers
Michael Lee
Tony Norris
Alex Perrin
Christopher Wightman
Peter Wilson
Average annual total returns (%) as of September 30, 20171
| | | | | | | | | | | | | | | | | | | | | | | | | | | | | | | | | | |
| | | | | Including sales charge | | | Excluding sales charge | | | Expense ratios2 (%) | |
| | | Inception date | | 1 year | | | 5 year | | | 10 year | | | 1 year | | | 5 year | | | 10 year | | | Gross | | | Net3 | |
| Class A (ESIYX) | | 9-30-2003 | | | (7.18 | ) | | | (1.90 | ) | | | 2.63 | | | | (2.78 | ) | | | (0.99 | ) | | | 3.10 | | | | 1.08 | | | | 1.03 | |
| Class C (ESIVX) | | 9-30-2003 | | | (4.43 | ) | | | (1.73 | ) | | | 2.34 | | | | (3.43 | ) | | | (1.73 | ) | | | 2.34 | | | | 1.83 | | | | 1.78 | |
| Class R6 (ESIRX) | | 11-30-2012 | | | – | | | | – | | | | – | | | | (2.48 | ) | | | (0.60 | ) | | | 3.45 | | | | 0.70 | | | | 0.65 | |
| Administrator Class (ESIDX) | | 7-30-2010 | | | – | | | | – | | | | – | | | | (2.59 | ) | | | (0.81 | ) | | | 3.28 | | | | 1.02 | | | | 0.85 | |
| Institutional Class (ESICX) | | 12-15-1993 | | | – | | | | – | | | | – | | | | (2.48 | ) | | | (0.66 | ) | | | 3.42 | | | | 0.75 | | | | 0.70 | |
| Bloomberg Barclays Global Aggregate ex-USD Index (unhedged)4 | | – | | | – | | | | – | | | | – | | | | (2.42 | ) | | | (0.73 | ) | | | 2.57 | | | | – | | | | – | |
Figures quoted represent past performance, which is no guarantee of future results, and do not reflect taxes that a shareholder may pay on fund distributions or the redemption of fund shares. Investment return and principal value of an investment will fluctuate so that an investor’s shares, when redeemed, may be worth more or less than their original cost. Performance shown without sales charges would be lower if sales charges were reflected. Current performance may be lower or higher than the performance data quoted, which assumes the reinvestment of dividends and capital gains. Current month-end performance is available on the Fund’s website, wellsfargofunds.com.
Index returns do not include transaction costs associated with buying and selling securities, any mutual fund fees or expenses, or any taxes. It is not possible to invest directly in an index.
For Class A shares, the maximum front-end sales charge is 4.50%. For Class C shares, the maximum contingent deferred sales charge is 1.00%. Performance including a contingent deferred sales charge assumes the sales charge for the corresponding time period. Class R6, Administrator Class, and Institutional Class shares are sold without a front-end sales charge or contingent deferred sales charge.
Bond values fluctuate in response to the financial condition of individual issuers, general market and economic conditions, and changes in interest rates. Changes in market conditions and government policies may lead to periods of heightened volatility in the bond market and reduced liquidity for certain bonds held by the Fund. In general, when interest rates rise, bond values fall and investors may lose principal value. Interest-rate changes and their impact on the fund and its share price can be sudden and unpredictable. Foreign investments are especially volatile and can rise or fall dramatically due to differences in the political and economic conditions of the host country. These risks are generally intensified in emerging markets. The use of derivatives may reduce returns and/or increase volatility. Securities issued by U.S. government agencies or government-sponsored entities may not be guaranteed by the U.S. Treasury. Certain investment strategies tend to increase the total risk of an investment (relative to the broader market). The Fund is exposed to high-yield securities risk and geographic risk. Consult the Fund’s prospectus for additional information on these and other risks.
Please see footnotes on page 7.
| | | | | | |
| Performance highlights (unaudited) | | Wells Fargo International Bond Fund | | | 7 | |
|
| Growth of $10,000 investment as of September 30, 20175 |
|
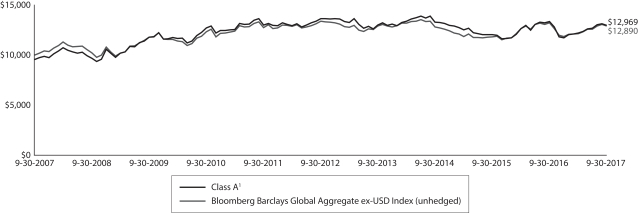 |
| 1 | Historical performance shown for Class R6 shares prior to their inception reflects the performance of Institutional Class shares and includes the higher expenses applicable to Institutional Class shares. If these expenses had not been included, returns for Class R6 shares would be higher. Historical performance shown for Administrator Class shares prior to their inception reflects the performance of Institutional Class shares and has been adjusted to reflect the higher expenses applicable to Administrator Class shares. Historical performance shown for all classes of the Fund prior to July 12, 2010, is based on the performance of the Fund’s predecessor, Evergreen International Bond Fund. |
| 2 | Reflects the expense ratios as stated in the most recent prospectuses. The expense ratios shown are subject to change and may differ from the annualized expense ratios shown in the financial highlights of this report. |
| 3 | The manager has contractually committed through January 31, 2018, to waive fees and/or reimburse expenses to the extent necessary to cap the Fund’s Total Annual Fund Operating Expenses After Fee Waivers at the amounts shown. After this time, the cap may be increased or the commitment to maintain the cap may be terminated only with the approval of the Board of Trustees. Brokerage commissions, stamp duty fees, interest, taxes, acquired fund fees and expenses, and extraordinary expenses are excluded from the expense cap. Without this cap, the Fund’s returns would have been lower. The expense ratio paid by an investor is the net expense ratio or the Fund’s Total Annual Fund Operating Expenses After Fee Waivers, as stated in the prospectuses. |
| 4 | The Bloomberg Barclays Global Aggregate ex-USD Index (unhedged) is an unmanaged index that provides a broad-based measure of the global investment grade fixed income markets excluding the U.S. dollar denominated debt market. You cannot invest directly in an index. |
| 5 | The chart compares the performance of Class A shares for the most recent ten years with the Bloomberg Barclays Global Aggregate ex-USD Index (unhedged). The chart assumes a hypothetical investment of $10,000 in Class A shares and reflects all operating expenses and assumes the maximum initial sales charge of 4.50%. |
| 6 | The ten largest holdings, excluding cash and cash equivalents, are calculated based on the value of the investments divided by total net assets of the Fund. Holdings are subject to change and may have changed since the date specified. |
| 7 | Amounts are calculated based on the total long-term investments of the Fund. These amounts are subject to change and may have changed since the date specified. |
| | | | |
| 8 | | Wells Fargo International Bond Fund | | Performance highlights (unaudited) |
MANAGER’S DISCUSSION
Fund highlights
| ∎ | | The Fund underperformed its benchmark, the Bloomberg Barclays Global Aggregate ex-USD Bond Index (unhedged), in the 12-month period that ended September 30, 2017. |
| ∎ | | Currency positioning was a drag on performance, largely due to an underweight to the euro. This was partly offset by exposure to the Danish krone. An allocation to the Mexican peso performed well. |
| ∎ | | Country allocation added to Fund performance, with overweight positions in higher-yielding and emerging bond markets performing well. In particular, Brazil, Mexico, and South Africa outperformed. |
Political uncertainty drove higher yields and volatility.
Markets in the last quarter of 2016 were significantly different than markets so far in 2017. The fourth quarter of 2016 was marked by widespread higher yields and volatility and a great deal of investor anxiety. The latter largely was driven by uncertainty over the direction of U.S. policy under the new administration and the number of high-profile eurozone elections scheduled for early 2017. The U.S. dollar traded strongly into year-end and has since been losing ground. Bond yields, particularly on longer-dated paper, also peaked around the start of the year and have subsequently been trending lower. Regarding economic growth, it remains positive but below potential in almost all core markets. Wage growth is particularly weak, which has played a role in keeping inflationary pressures muted.
| | | | |
| Ten largest holdings (%) as of September 30, 20176 | |
New Zealand, 4.50%, 4-15-2027 | | | 4.55 | |
Poland, 1.50%, 4-25-2020 | | | 4.43 | |
Mexico, 7.75%, 11-13-2042 | | | 4.31 | |
United States, 1.50%, 8-15-2026 | | | 4.23 | |
Malaysia, 3.96%, 9-15-2025 | | | 3.91 | |
Singapore, 3.00%, 9-1-2024 | | | 2.86 | |
Thailand, 3.85%, 12-12-2025 | | | 2.85 | |
United States, 2.00%, 4-30-2024 | | | 2.59 | |
Colombia, 7.50%, 8-26-2026 | | | 2.53 | |
Italy, 2.20%, 6-1-2027 | | | 2.40 | |
Returns (for Class A shares) for the Fund in the 12-month reporting period were negative (-2.78%) due to a torrid fourth quarter in 2016. The U.S. election created a great deal of uncertainty, and fixed-income and currency markets were highly erratic during that period. 2017 has been marked by significantly better performance across global bond markets, and year to date, the Fund (for Class A shares) has returned +10.90%. At the end of 2016, the Fund was underweight the low-yielding Japanese and core European bond markets in order to fund an overweight to a diversified set of higher-yielding names. Chief among these overweights were the bond markets of the United States and Australia, plus a number of emerging markets, including Brazil, Malaysia, Mexico, and South Africa. At the currency level, the Fund
was overweight the U.S. dollar and underweight the euro and the sterling. Emerging markets currency exposure was light, with several positions hedged.
There was no change to the Fund’s overarching theme over the past year; we are biased to underweight Japan and core Europe in favor of smaller and more dynamic markets. A position in high-quality Danish mortgages was established in the first quarter of 2017, and holdings in South Korea were reduced to zero as geopolitical risk ramped up. The overweight to the U.S. dollar was closed in the first quarter of 2017, and exposure to emerging markets currencies increased. We judged the multiyear U.S. dollar rally as mature and the U.S. dollar as overvalued. Toward the end of third quarter of 2017, the Fund took profits on some of these positions and select emerging markets currency exposure was rehedged (including the South African rand and the Brazilian real).
Please see footnotes on page 7.
| | | | | | |
| Performance highlights (unaudited) | | Wells Fargo International Bond Fund | | | 9 | |
|
| Portfolio allocation as of September 30, 20177 |
|
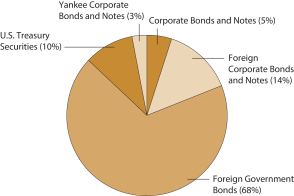 |
Over the past 12 months, country positioning has been a strong value-add for the Fund. Smaller and higher-yielding markets have performed consistently, with positions in Brazil, Mexico, South Africa, and Hungary leading the way. Allocations to the Mexican peso and the Danish krone both added value. The portfolio has run with a below-index duration profile over the reporting period. This largely reflects the Fund’s underweight to Japanese government bonds. In favored markets, such as the U.S. and Mexico, Fund holdings have been in longer-dated paper to take advantage of the flattening of these yield curves.
The underweight to the Japanese bond market has been a modest drag over the 12-month period; the Bank of Japan’s efforts to anchor the yield curve led to the
country’s bonds outperforming in the fourth quarter of 2016. Looking only at 2017, the underweight to Japanese bonds has been a positive. The underweight to the euro also detracted from Fund performance, although exposure to the euro-linked Danish krone and Norwegian krone worked as partial offsets.
We expect smaller economies to continue to outperform.
Looking ahead, we see scope for a further unwind of the multiyear U.S. dollar rally. Non-U.S. investment continues to offer good opportunities. The higher real yields and lower debt levels offered by many smaller economies continue to suggest the outperformance of these markets versus the core developed markets. Within developed markets, we remain underweight Japan and core Europe, where nominal yields are negative and real yields even more so. While excessively loose monetary accommodation is starting to be pared back (or at least talked about), central banks still will broadly provide easy money. Positive but modest economic growth and mild inflationary pressures suggest that the backdrop to fixed-income investing remains fairly benign. Geopolitical risk has been rising and needs to be closely watched, but so far, this is having little impact on longer-term investor positioning.
Please see footnotes on page 7.
| | | | |
| 10 | | Wells Fargo International Bond Fund | | Fund expenses (unaudited) |
As a shareholder of the Fund, you incur two types of costs: (1) transaction costs, including sales charges (loads) on purchase payments and contingent deferred sales charges (if any) on redemptions and (2) ongoing costs, including management fees, distribution (12b-1) and/or shareholder servicing fees, and other Fund expenses. This example is intended to help you understand your ongoing costs (in dollars) of investing in the Fund and to compare these costs with the ongoing costs of investing in other mutual funds.
The example is based on an investment of $1,000 invested at the beginning of the six-month period and held for the entire period from April 1, 2017 to September 30, 2017.
Actual expenses
The “Actual” line of the table below provides information about actual account values and actual expenses. You may use the information in this line, together with the amount you invested, to estimate the expenses that you paid over the period. Simply divide your account value by $1,000 (for example, an $8,600 account value divided by $1,000 = 8.6), then multiply the result by the number in the “Actual” line under the heading entitled “Expenses paid during period” for your applicable class of shares to estimate the expenses you paid on your account during this period.
Hypothetical example for comparison purposes
The “Hypothetical” line of the table below provides information about hypothetical account values and hypothetical expenses based on the Fund’s actual expense ratio and an assumed rate of return of 5% per year before expenses, which is not the Fund’s actual return. The hypothetical account values and expenses may not be used to estimate the actual ending account balance or expenses you paid for the period. You may use this information to compare the ongoing costs of investing in the Fund and other funds. To do so, compare this 5% hypothetical example with the 5% hypothetical examples that appear in the shareholder reports of the other funds.
Please note that the expenses shown in the table are meant to highlight your ongoing costs only and do not reflect any transactional costs, such as sales charges (loads) and contingent deferred sales charges. Therefore, the “Hypothetical” line of the table is useful in comparing ongoing costs only and will not help you determine the relative total costs of owning different funds. In addition, if these transactional costs were included, your costs would have been higher.
| | | | | | | | | | | | | | | | |
| | | Beginning
account value
4-1-2017 | | | Ending
account value
9-30-2017 | | | Expenses
paid during
the period¹ | | | Annualized net
expense ratio | |
Class A | | | | | | | | | | | | | | | | |
Actual | | $ | 1,000.00 | | | $ | 914.65 | | | $ | 4.95 | | | | 1.03 | % |
Hypothetical (5% return before expenses) | | $ | 1,000.00 | | | $ | 1,019.89 | | | $ | 5.23 | | | | 1.03 | % |
Class C | | | | | | | | | | | | | | | | |
Actual | | $ | 1,000.00 | | | $ | 911.63 | | | $ | 8.54 | | | | 1.78 | % |
Hypothetical (5% return before expenses) | | $ | 1,000.00 | | | $ | 1,016.14 | | | $ | 9.00 | | | | 1.78 | % |
Class R6 | | | | | | | | | | | | | | | | |
Actual | | $ | 1,000.00 | | | $ | 916.45 | | | $ | 3.13 | | | | 0.65 | % |
Hypothetical (5% return before expenses) | | $ | 1,000.00 | | | $ | 1,021.80 | | | $ | 3.30 | | | | 0.65 | % |
Administrator Class | | | | | | | | | | | | | | | | |
Actual | | $ | 1,000.00 | | | $ | 914.88 | | | $ | 4.09 | | | | 0.85 | % |
Hypothetical (5% return before expenses) | | $ | 1,000.00 | | | $ | 1,020.79 | | | $ | 4.32 | | | | 0.85 | % |
Institutional Class | | | | | | | | | | | | | | | | |
Actual | | $ | 1,000.00 | | | $ | 915.36 | | | $ | 3.37 | | | | 0.70 | % |
Hypothetical (5% return before expenses) | | $ | 1,000.00 | | | $ | 1,021.55 | | | $ | 3.56 | | | | 0.70 | % |
| 1 | Expenses paid is equal to the annualized net expense ratio of each class multiplied by the average account value over the period, multiplied by the number of days in the most recent fiscal half-year divided by the number of days in the fiscal year (to reflect the one-half-year period). |
| | | | | | |
| Portfolio of investments—September 30, 2017 | | Wells Fargo International Bond Fund | | | 11 | |
| | | | | | | | | | | | | | | | |
| Security name | | Interest rate | | | Maturity date | | | Principal | | | Value | |
| | | | |
Corporate Bonds and Notes: 4.82% | | | | | | | | | | | | | | | | |
| | | | |
| United States: 4.82% | | | | | | | | | | | | | | | | |
AbbVie Incorporated (Health Care, Biotechnology) | | | 3.20 | % | | | 5-14-2026 | | | $ | 900,000 | | | $ | 901,467 | |
Amazon.com Incorporated (Consumer Discretionary, Internet & Direct Marketing Retail) 144A | | | 3.15 | | | | 8-22-2027 | | | | 1,675,000 | | | | 1,681,442 | |
Anheuser-Busch InBev Finance Incorporated (Consumer Staples, Beverages) | | | 3.65 | | | | 2-1-2026 | | | | 1,200,000 | | | | 1,240,950 | |
Apple Incorporated (Information Technology, Technology Hardware, Storage & Peripherals) | | | 2.90 | | | | 9-12-2027 | | | | 2,500,000 | | | | 2,478,035 | |
AT&T Incorporated (Telecommunication Services, Diversified Telecommunication Services) | | | 3.90 | | | | 8-14-2027 | | | | 2,750,000 | | | | 2,753,105 | |
Bat Capital Corporation (Consumer Staples, Tobacco) 144A | | | 3.56 | | | | 8-15-2027 | | | | 2,100,000 | | | | 2,106,390 | |
Discovery Communications Company (Consumer Discretionary, Media) | | | 3.95 | | | | 3-20-2028 | | | | 700,000 | | | | 698,073 | |
Ford Motor Credit Company LLC (Financials, Consumer Finance) | | | 2.46 | | | | 3-27-2020 | | | | 1,500,000 | | | | 1,500,936 | |
Gilead Sciences Incorporated (Health Care, Biotechnology) | | | 2.95 | | | | 3-1-2027 | | | | 2,000,000 | | | | 1,980,573 | |
Goldman Sachs Group Incorporated (Financials, Capital Markets) | | | 3.75 | | | | 2-25-2026 | | | | 1,650,000 | | | | 1,688,518 | |
Johnson & Johnson (Health Care, Pharmaceuticals) | | | 2.95 | | | | 3-3-2027 | | | | 2,000,000 | | | | 2,028,022 | |
JPMorgan Chase & Company (Financials, Banks) | | | 3.30 | | | | 4-1-2026 | | | | 2,575,000 | | | | 2,581,630 | |
Lowe’s Companies Incorporated (Consumer Discretionary, Specialty Retail) | | | 3.10 | | | | 5-3-2027 | | | | 700,000 | | | | 695,739 | |
Microsoft Corporation (Information Technology, Software) | | | 2.40 | | | | 8-8-2026 | | | | 2,000,000 | | | | 1,937,967 | |
Oracle Corporation (Information Technology, Software) | | | 2.65 | | | | 7-15-2026 | | | | 1,900,000 | | | | 1,861,896 | |
Qualcomm Incorporated (Information Technology, Semiconductors & Semiconductor Equipment) | | | 3.25 | | | | 5-20-2027 | | | | 2,250,000 | | | | 2,268,242 | |
| | | | |
Total Corporate Bonds and Notes (Cost $28,488,307) | | | | | | | | | | | | | | | 28,402,985 | |
| | | | | | | | | | | | | | | | |
| | | | |
Foreign Corporate Bonds and Notes @: 13.29% | | | | | | | | | | | | | | | | |
| | | | |
| Australia: 0.19% | | | | | | | | | | | | | | | | |
General Electric Capital Corporation (Financials, Diversified Financial Services, AUD) | | | 6.00 | | | | 3-15-2019 | | | | 1,367,000 | | | | 1,125,557 | |
| | | | | | | | | | | | | | | | |
| | | | |
| Brazil: 0.27% | | | | | | | | | | | | | | | | |
BRF SA (Consumer Staples, Food Products, BRL) 144A | | | 7.75 | | | | 5-22-2018 | | | | 5,137,000 | | | | 1,601,688 | |
| | | | | | | | | | | | | | | | |
| | | | |
| Denmark: 5.96% | | | | | | | | | | | | | | | | |
Nordea Kredit Realkredit (Financials, Thrifts & Mortgage Finance, DKK) | | | 2.00 | | | | 10-1-2047 | | | | 8,087,099 | | | | 1,283,211 | |
Nordea Kredit Realkredit (Financials, Thrifts & Mortgage Finance, DKK) | | | 2.50 | | | | 10-1-2047 | | | | 17,188,865 | | | | 2,829,662 | |
Nykredit Realkredit AS (Financials, Thrifts & Mortgage Finance, DKK) | | | 2.00 | | | | 10-1-2047 | | | | 62,684,281 | | | | 9,942,770 | |
Nykredit Realkredit AS (Financials, Thrifts & Mortgage Finance, DKK) | | | 2.50 | | | | 10-1-2047 | | | | 55,955,099 | | | | 9,202,542 | |
Realkredit Danmark AS (Financials, Thrifts & Mortgage Finance, DKK) | | | 2.00 | | | | 10-1-2047 | | | | 56,837,797 | | | | 9,015,420 | |
Realkredit Danmark AS (Financials, Thrifts & Mortgage Finance, DKK) | | | 2.50 | | | | 10-1-2047 | | | | 17,269,449 | | | | 2,836,756 | |
| | | | |
| | | | | | | | | | | | | | | 35,110,361 | |
| | | | | | | | | | | | | | | | |
| | | | |
| France: 0.18% | | | | | | | | | | | | | | | | |
Casino Guichard Perrachon SA (Consumer Staples, Food & Staples Retailing, EUR) | | | 4.50 | | | | 3-7-2024 | | | | 800,000 | | | | 1,056,311 | |
| | | | | | | | | | | | | | | | |
| | | | |
| Germany: 1.14% | | | | | | | | | | | | | | | | |
HP Pelzer Holding GmbH (Consumer Discretionary, Auto Components, EUR) 144A | | | 4.13 | | | | 4-1-2024 | | | | 550,000 | | | | 670,067 | |
KfW (Financials, Banks, AUD) | | | 5.00 | | | | 3-19-2024 | | | | 6,900,000 | | | | 6,037,265 | |
| | | | |
| | | | | | | | | | | | | | | 6,707,332 | |
| | | | | | | | | | | | | | | | |
| | | | |
| Ireland: 0.27% | | | | | | | | | | | | | | | | |
GE Capital UK Funding Company (Financials, Capital Markets, GBP) | | | 5.13 | | | | 5-24-2023 | | | | 1,000,000 | | | | 1,591,685 | |
| | | | | | | | | | | | | | | | |
The accompanying notes are an integral part of these financial statements.
| | | | |
| 12 | | Wells Fargo International Bond Fund | | Portfolio of investments—September 30, 2017 |
| | | | | | | | | | | | | | | | |
| Security name | | Interest rate | | | Maturity date | | | Principal | | | Value | |
| | | | |
| Mexico: 0.37% | | | | | | | | | | | | | | | | |
America Movil SAB de CV (Telecommunication Services, Wireless Telecommunication Services, MXN) | | | 7.13 | % | | | 12-9-2024 | | | | 7,250,000 | | | $ | 384,525 | |
Nemak SAB de CV (Consumer Discretionary, Auto Components, EUR) | | | 3.25 | | | | 3-15-2024 | | | | 225,000 | | | | 273,618 | |
Petroleos Mexicanos (Energy, Oil, Gas & Consumable Fuels, MXN) 144A | | | 7.19 | | | | 9-12-2024 | | | | 6,532,000 | | | | 327,855 | |
Sigma Alimentos SA de CV (Consumer Discretionary, Food Products, EUR) | | | 2.63 | | | | 2-7-2024 | | | | 950,000 | | | | 1,190,010 | |
| | | | |
| | | | | | | | | | | | | | | 2,176,008 | |
| | | | | | | | | | | | | | | | |
| | | | |
| Netherlands: 0.13% | | | | | | | | | | | | | | | | |
United Group BV (Telecommunication Services, EUR) 144A | | | 4.50 | | | | 7-1-2022 | | | | 625,000 | | | | 757,162 | |
| | | | | | | | | | | | | | | | |
| | | | |
| Norway: 0.98% | | | | | | | | | | | | | | | | |
Kommunalbanken AS (Financials, Banks, AUD) | | | 5.25 | | | | 7-15-2024 | | | | 6,500,000 | | | | 5,755,395 | |
| | | | | | | | | | | | | | | | |
| | | | |
| Philippines: 1.00% | | | | | | | | | | | | | | | | |
Asian Development Bank (Financials, Banks, AUD) | | | 3.75 | | | | 3-12-2025 | | | | 7,231,000 | | | | 5,904,644 | |
| | | | | | | | | | | | | | | | |
| | | | |
| United Kingdom: 1.73% | | | | | | | | | | | | | | | | |
AA Bond Company Limited (Financials, Diversified Financial Services, GBP) | | | 5.50 | | | | 7-31-2043 | | | | 600,000 | | | | 828,120 | |
Adient Global Holdings Company (Consumer Discretionary, Auto Components, EUR) | | | 3.50 | | | | 8-15-2024 | | | | 725,000 | | | | 886,869 | |
CPUK Finance Limited (Consumer Discretionary, Consumer Finance, GBP) | | | 4.25 | | | | 2-28-2047 | | | | 250,000 | | | | 340,826 | |
FirstGroup plc (Industrials, Road & Rail, GBP) | | | 5.25 | | | | 11-29-2022 | | | | 1,300,000 | | | | 2,002,311 | |
Heathrow Funding Limited (Industrials, Transportation Infrastructure, GBP) | | | 7.13 | | | | 2-14-2024 | | | | 1,000,000 | | | | 1,697,999 | |
Mclaren Finance plc (Financials, Consumer Finance, GBP) | | | 5.00 | | | | 8-1-2022 | | | | 800,000 | | | | 1,084,771 | |
Ocado Group plc (Consumer Discretionary, Internet & Direct Marketing Retail, GBP) | | | 4.00 | | | | 6-15-2024 | | | | 550,000 | | | | 731,124 | |
Tesco plc (Consumer Staples, Food & Staples Retailing, GBP) | | | 6.13 | | | | 2-24-2022 | | | | 700,000 | | | | 1,067,595 | |
Twinkle Pizza plc (Consumer Discretionary, Hotels, Restaurants & Leisure, GBP) | | | 6.63 | | | | 8-1-2021 | | | | 700,000 | | | | 891,071 | |
Vodafone Group plc (Telecommunication Services, Wireless Telecommunication Services, EUR) | | | 2.20 | | | | 8-25-2026 | | | | 550,000 | | | | 693,891 | |
| | | | |
| | | | | | | | | | | | | | | 10,224,577 | |
| | | | | | | | | | | | | | | | |
| | | | |
| United States: 1.07% | | | | | | | | | | | | | | | | |
Albemarle Corporation (Materials, Chemicals, EUR) | | | 1.88 | | | | 12-8-2021 | | | | 987,000 | | | | 1,226,524 | |
Cemex Finance LLC (Financials, Consumer Finance, EUR) | | | 4.63 | | | | 6-15-2024 | | | | 900,000 | | | | 1,154,500 | |
Federal-Mogul LLC (Consumer Staples, Auto Components, EUR) | | | 5.00 | | | | 7-15-2024 | | | | 1,125,000 | | | | 1,313,150 | |
Verizon Communications Incorporated (Telecommunication Services, Diversified Telecommunication Services, EUR) | | | 3.25 | | | | 2-17-2026 | | | | 589,000 | | | | 796,127 | |
VF Corporation (Consumer Discretionary, Textiles, Apparel & Luxury Goods, EUR) | | | 0.63 | | | | 9-20-2023 | | | | 1,525,000 | | | | 1,793,537 | |
| | | | |
| | | | | | | | | | | | | | | 6,283,838 | |
| | | | | | | | | | | | | | | | |
| | | | |
Total Foreign Corporate Bonds and Notes (Cost $76,445,654) | | | | | | | | | | | | | | | 78,294,558 | |
| | | | | | | | | | | | | | | | |
| | | | |
Foreign Government Bonds @: 66.04% | | | | | | | | | | | | | | | | |
Australian Government Bond Series 138 (AUD) | | | 3.25 | | | | 4-21-2029 | | | | 17,050,000 | | | | 13,778,648 | |
Australian Government Bond Series 144 (AUD) | | | 3.75 | | | | 4-21-2037 | | | | 6,800,000 | | | | 5,652,637 | |
Australian Government Bond Series 148 (AUD) | | | 2.75 | | | | 11-21-2027 | | | | 9,500,000 | | | | 7,387,400 | |
Brazil (BRL) | | | 10.00 | | | | 1-1-2019 | | | | 17,855,000 | | | | 5,820,899 | |
Brazil (BRL) | | | 10.00 | | | | 1-1-2025 | | | | 38,640,000 | | | | 12,530,188 | |
Canada (CAD) | | | 0.50 | | | | 3-1-2022 | | | | 7,450,000 | | | | 5,659,970 | |
Canada (CAD) | | | 1.00 | | | | 6-1-2027 | | | | 13,410,000 | | | | 9,693,031 | |
Canada 144A (CAD) | | | 2.90 | | | | 6-15-2024 | | | | 11,000,000 | | | | 9,142,056 | |
The accompanying notes are an integral part of these financial statements.
| | | | | | |
| Portfolio of investments—September 30, 2017 | | Wells Fargo International Bond Fund | | | 13 | |
| | | | | | | | | | | | | | | | |
| Security name | | Interest rate | | | Maturity date | | | Principal | | | Value | |
| | | | |
Foreign Government Bonds @ (continued) | | | | | | | | | | | | | | | | |
Colombia (COP) | | | 7.00 | % | | | 5-4-2022 | | | | 12,100,000,000 | | | $ | 4,267,657 | |
Colombia (COP) | | | 7.50 | | | | 8-26-2026 | | | | 41,100,000,000 | | | | 14,884,391 | |
France Government Bond (EUR) | | | 0.25 | | | | 11-25-2026 | | | | 2,100,000 | | | | 2,389,969 | |
France Government Bond (EUR) | | | 1.00 | | | | 5-25-2027 | | | | 900,000 | | | | 1,088,222 | |
Hungary (HUF) | | | 1.75 | | | | 10-26-2022 | | | | 1,885,000,000 | | | | 7,332,053 | |
Hungary (HUF) | | | 7.00 | | | | 6-24-2022 | | | | 1,665,000,000 | | | | 8,003,137 | |
India (INR) | | | 7.80 | | | | 4-11-2021 | | | | 117,000,000 | | | | 1,860,615 | |
Indonesia (IDR) | | | 8.38 | | | | 3-15-2024 | | | | 22,900,000,000 | | | | 1,880,718 | |
Indonesia (IDR) | | | 8.38 | | | | 9-15-2026 | | | | 45,000,000,000 | | | | 3,761,972 | |
Italy Buoni Poliennali del Tesoro (EUR) | | | 2.20 | | | | 6-1-2027 | | | | 11,850,000 | | | | 14,124,959 | |
Italy Buoni Poliennali del Tesoro 144A (EUR) | | | 2.70 | | | | 3-1-2047 | | | | 5,100,000 | | | | 5,388,298 | |
Malaysia (MYR) | | | 3.66 | | | | 10-15-2020 | | | | 7,650,000 | | | | 1,824,791 | |
Malaysia (MYR) | | | 3.90 | | | | 11-30-2026 | | | | 21,550,000 | | | | 5,074,434 | |
Malaysia (MYR) | | | 3.96 | | | | 9-15-2025 | | | | 97,325,000 | | | | 23,011,041 | |
Malaysia (MYR) | | | 4.50 | | | | 4-15-2030 | | | | 8,950,000 | | | | 2,150,893 | |
Mexico (MXN) | | | 5.75 | | | | 3-5-2026 | | | | 57,500,000 | | | | 2,944,246 | |
Mexico (MXN) | | | 7.75 | | | | 11-13-2042 | | | | 437,000,000 | | | | 25,422,073 | |
Mexico (MXN) | | | 8.00 | | | | 11-7-2047 | | | | 32,000,000 | | | | 1,917,399 | |
Mexico (MXN) | | | 10.00 | | | | 12-5-2024 | | | | 10,850,000 | | | | 705,488 | |
New Zealand (NZD) | | | 4.50 | | | | 4-15-2027 | | | | 33,000,000 | | | | 26,812,485 | |
Norway 144A¤ (NOK) | | | 0.00 | | | | 12-20-2017 | | | | 70,040,000 | | | | 8,786,109 | |
Norway 144A (NOK) | | | 1.50 | | | | 2-19-2026 | | | | 29,600,000 | | | | 3,723,434 | |
Norway 144A (NOK) | | | 1.75 | | | | 2-17-2027 | | | | 106,975,000 | | | | 13,621,533 | |
Poland (PLN) | | | 1.50 | | | | 4-25-2020 | | | | 96,500,000 | | | | 26,096,520 | |
Poland (PLN) | | | 2.50 | | | | 7-25-2027 | | | | 14,550,000 | | | | 3,698,706 | |
Province of British Columbia (AUD) | | | 4.25 | | | | 11-27-2024 | | | | 7,590,000 | | | | 6,293,373 | |
Province of Ontario (AUD) | | | 6.25 | | | | 9-29-2020 | | | | 6,000,000 | | | | 5,178,418 | |
Queensland Treasury 144A (AUD) | | | 3.25 | | | | 7-21-2026 | | | | 15,600,000 | | | | 12,272,675 | |
Republic of Peru (PEN) | | | 5.70 | | | | 8-12-2024 | | | | 5,000,000 | | | | 1,625,100 | |
Republic of South Africa (ZAR) | | | 7.75 | | | | 2-28-2023 | | | | 127,231,000 | | | | 9,337,400 | |
Republic of South Africa (ZAR) | | | 8.75 | | | | 2-28-2048 | | | | 48,500,000 | | | | 3,239,698 | |
Republic of South Africa (ZAR) | | | 10.50 | | | | 12-21-2026 | | | | 85,050,000 | | | | 7,049,625 | |
Romania (RON) | | | 5.75 | | | | 4-29-2020 | | | | 22,600,000 | | | | 6,318,136 | |
Singapore (SGD) | | | 2.88 | | | | 9-1-2030 | | | | 12,900,000 | | | | 10,080,725 | |
Singapore (SGD) | | | 3.00 | | | | 9-1-2024 | | | | 21,440,000 | | | | 16,857,061 | |
State of New South Wales Australia (AUD) | | | 5.00 | | | | 8-20-2024 | | | | 11,250,000 | | | | 10,029,898 | |
Thailand (THB) | | | 3.85 | | | | 12-12-2025 | | | | 500,025,000 | | | | 16,815,024 | |
Turkey (TRY) | | | 8.70 | | | | 7-11-2018 | | | | 3,500,000 | | | | 960,426 | |
Turkey (TRY) | | | 9.40 | | | | 7-8-2020 | | | | 3,500,000 | | | | 940,092 | |
Turkey (TRY) | | | 10.70 | | | | 2-17-2021 | | | | 4,000,000 | | | | 1,111,439 | |
Turkey (TRY) | | | 11.00 | | | | 2-24-2027 | | | | 1,900,000 | | | | 543,137 | |
| | | | |
Total Foreign Government Bonds (Cost $375,044,352) | | | | | | | | | | | | | | | 389,088,199 | |
| | | | | | | | | | | | | | | | |
| | | | |
U.S. Treasury Securities: 9.76% | | | | | | | | | | | | | | | | |
U.S. Treasury Bond | | | 3.00 | | | | 11-15-2045 | | | $ | 7,850,000 | | | | 8,073,234 | |
U.S. Treasury Note | | | 1.50 | | | | 8-15-2026 | | | | 26,600,000 | | | | 24,896,977 | |
U.S. Treasury Note | | | 2.00 | | | | 4-30-2024 | | | | 15,400,000 | | | | 15,275,477 | |
U.S. Treasury Note | | | 2.38 | | | | 5-15-2027 | | | | 9,250,000 | | | | 9,284,326 | |
| | | | |
Total U.S. Treasury Securities (Cost $57,948,693) | | | | | | | | | | | | | | | 57,530,014 | |
| | | | | | | | | | | | | | | | |
The accompanying notes are an integral part of these financial statements.
| | | | |
| 14 | | Wells Fargo International Bond Fund | | Portfolio of investments—September 30, 2017 |
| | | | | | | | | | | | | | | | |
| Security name | | Interest rate | | | Maturity date | | | Principal | | | Value | |
| | | | |
Yankee Corporate Bonds and Notes: 2.87% | | | | | | | | | | | | | | | | |
| | | | |
| Cayman Islands: 0.11% | | | | | | | | | | | | | | | | |
UPCB Finance IV Limited (Financials, Diversified Financial Services) 144A | | | 5.38 | % | | | 1-15-2025 | | | $ | 600,000 | | | $ | 624,000 | |
| | | | | | | | | | | | | | | | |
| | | | |
| France: 0.33% | | | | | | | | | | | | | | | | |
Danone SA (Consumer Staples, Food Products) 144A | | | 2.95 | | | | 11-2-2026 | | | | 2,000,000 | | | | 1,940,148 | |
| | | | | | | | | | | | | | | | |
| | | | |
| Ireland: 0.17% | | | | | | | | | | | | | | | | |
Ardagh Packaging Finance plc (Financials, Diversified Financial Services) 144A | | | 4.63 | | | | 5-15-2023 | | | | 1,000,000 | | | | 1,027,200 | |
| | | | | | | | | | | | | | | | |
| | | | |
| Netherlands: 1.03% | | | | | | | | | | | | | | | | |
Mubadala Development Company (Energy, Oil, Gas & Consumable Fuels) | | | 5.50 | | | | 4-20-2021 | | | | 1,700,000 | | | | 1,870,510 | |
Myriad International Holdings BV (Consumer Discretionary, Media) | | | 6.00 | | | | 7-18-2020 | | | | 1,950,000 | | | | 2,103,972 | |
Siemens Financieringsmat Company (Financials, Diversified Financial Services) 144A | | | 2.35 | | | | 10-15-2026 | | | | 2,200,000 | | | | 2,080,232 | |
| | | | |
| | | | | | | | | | | | | | | 6,054,714 | |
| | | | | | | | | | | | | | | | |
| | | | |
| Spain: 0.13% | | | | | | | | | | | | | | | | |
Telefonica Emisiones SAU (Telecommunication Services, Diversified Telecommunication Services) | | | 4.10 | | | | 3-8-2027 | | | | 750,000 | | | | 775,634 | |
| | | | | | | | | | | | | | | | |
| | | | |
| Switzerland: 0.42% | | | | | | | | | | | | | | | | |
Credit Suisse Group Funding Limited (Financials, Diversified Financial Services) | | | 3.80 | | | | 9-15-2022 | | | | 2,400,000 | | | | 2,490,513 | |
| | | | | | | | | | | | | | | | |
| | | | |
| United Kingdom: 0.68% | | | | | | | | | | | | | | | | |
BP Capital Markets plc (Financials, Capital Markets) | | | 3.22 | | | | 4-14-2024 | | | | 1,625,000 | | | | 1,660,580 | |
International Game Technology plc (Consumer Discretionary, Hotels, Restaurants & Leisure) 144A | | | 6.25 | | | | 2-15-2022 | | | | 1,000,000 | | | | 1,105,500 | |
Jaguar Land Rover Automobiles plc (Consumer Discretionary, Automobiles) 144A | | | 3.50 | | | | 3-15-2020 | | | | 1,200,000 | | | | 1,213,500 | |
| | | | |
| | | | | | | | | | | | | | | 3,979,580 | |
| | | | | | | | | | | | | | | | |
| | | | |
Total Yankee Corporate Bonds and Notes (Cost $16,442,981) | | | | | | | | | | | | | | | 16,891,789 | |
| | | | | | | | | | | | | | | | |
| | | | |
| | | Yield | | | | | | Shares | | | | |
| Short-Term Investments: 1.93% | | | | | | | | | | | | | | | | |
| | | | |
| Investment Companies: 1.93% | | | | | | | | | | | | | | | | |
Wells Fargo Government Money Market Fund Select Class (l)(u) | | | 0.92 | | | | | | | | 11,375,401 | | | | 11,375,401 | |
| | | | | | | | | | | | | | | | |
| | | | |
Total Short-Term Investments (Cost $11,375,401) | | | | | | | | | | | | | | | 11,375,401 | |
| | | | | | | | | | | | | | | | |
| | | | | | | | |
| Total investments in securities (Cost $565,745,388) | | | 98.71 | % | | | 581,582,946 | |
Other assets and liabilities, net | | | 1.29 | | | | 7,604,236 | |
| | | | | | | | |
| Total net assets | | | 100.00 | % | | $ | 589,187,182 | |
| | | | | | | | |
| 144A | The security may be resold in transactions exempt from registration, normally to qualified institutional buyers, pursuant to Rule 144A under the Securities Act of 1933. |
| @ | Foreign bond principal is denominated in the local currency of the issuer. |
| ¤ | The security is issued in zero coupon form with no periodic interest payments. |
| (l) | The issuer of the security is an affiliated person of the Fund as defined in the Investment Company Act of 1940. |
| (u) | The rate represents the 7-day annualized yield at period end. |
The accompanying notes are an integral part of these financial statements.
| | | | | | |
| Portfolio of investments—September 30, 2017 | | Wells Fargo International Bond Fund | | | 15 | |
Forward Foreign Currency Contracts
| | | | | | | | | | | | | | |
Currency to be received | | Currency to be delivered | | Counterparty¤¤ | | Settlement date | | Unrealized gains | | | Unrealized losses | |
| 27,141,720 USD | | 37,000,000 SGD | | State Street Bank | | 10-16-2017 | | $ | 0 | | | $ | (139,788 | ) |
| 5,150,000 PLN | | 1,399,312 USD | | State Street Bank | | 10-18-2017 | | | 11,978 | | | | 0 | |
| 1,476,374 USD | | 19,550,000 ZAR | | State Street Bank | | 10-18-2017 | | | 35,896 | | | | 0 | |
| 922,226 USD | | 3,000,000 BRL | | State Street Bank | | 10-18-2017 | | | 0 | | | | (22,969 | ) |
| 32,000,000 THB | | 949,611 USD | | State Street Bank | | 10-19-2017 | | | 10,037 | | | | 0 | |
| 27,800,000 EUR | | 31,910,091 USD | | State Street Bank | | 10-24-2017 | | | 983,562 | | | | 0 | |
| 1,078,872 USD | | 900,000 EUR | | State Street Bank | | 10-24-2017 | | | 13,970 | | | | 0 | |
| 15,285,144 USD | | 200,000,000 ZAR | | State Street Bank | | 11-6-2017 | | | 593,748 | | | | 0 | |
| 14,407,724 USD | | 19,750,000 NZD | | State Street Bank | | 11-14-2017 | | | 154,268 | | | | 0 | |
| 7,150,000,000 JPY | | 65,881,616 USD | | State Street Bank | | 11-15-2017 | | | 0 | | | | (2,218,491 | ) |
| 1,650,000,000 JPY | | 15,247,748 USD | | State Street Bank | | 11-15-2017 | | | 0 | | | | (556,255 | ) |
| 2,960,000,000 JPY | | 27,251,945 USD | | State Street Bank | | 11-15-2017 | | | 0 | | | | (896,296 | ) |
| 13,931,445 USD | | 1,525,000,000 JPY | | State Street Bank | | 11-15-2017 | | | 352,943 | | | | 0 | |
| 65,000,000 THB | | 1,966,307 USD | | State Street Bank | | 11-16-2017 | | | 0 | | | | (16,417 | ) |
| 17,607,276 USD | | 585,000,000 THB | | State Street Bank | | 11-16-2017 | | | 58,273 | | | | 0 | |
| 57,331,918 USD | | 71,500,000 AUD | | State Street Bank | | 11-20-2017 | | | 1,279,146 | | | | 0 | |
| 5,000,000 PLN | | 1,392,873 USD | | State Street Bank | | 11-22-2017 | | | 0 | | | | (22,674 | ) |
| 27,435,219 USD | | 100,000,000 PLN | | State Street Bank | | 11-22-2017 | | | 31,242 | | | | 0 | |
| 13,581,684 USD | | 3,500,000,000 HUF | | State Street Bank | | 11-22-2017 | | | 282,372 | | | | 0 | |
| 31,000,000 EUR | | 36,678,115 USD | | State Street Bank | | 11-24-2017 | | | 61,755 | | | | 0 | |
| 17,279,675 USD | | 14,325,000 EUR | | State Street Bank | | 11-24-2017 | | | 302,299 | | | | 0 | |
| 13,432,043 USD | | 43,000,000 BRL | | State Street Bank | | 11-30-2017 | | | 0 | | | | (38,536 | ) |
| 13,500,000 GBP | | 17,896,680 USD | | State Street Bank | | 12-13-2017 | | | 232,066 | | | | 0 | |
| 1,088,650 USD | | 800,000 GBP | | State Street Bank | | 12-13-2017 | | | 14,354 | | | | 0 | |
| 73,000,000 EUR | | 87,249,527 USD | | State Street Bank | | 12-18-2017 | | | 0 | | | | (606,907 | ) |
| 6,825,000,000 JPY | | 62,060,123 USD | | State Street Bank | | 12-19-2017 | | | 0 | | | | (1,179,992 | ) |
| 14,964,941 USD | | 1,650,000,000 JPY | | State Street Bank | | 12-19-2017 | | | 246,668 | | | | 0 | |
| | | | | | | | | | | | | | |
| | | | | | | | $ | 4,664,577 | | | $ | (5,698,325 | ) |
| | | | | | | | | | | | | | |
| | ¤¤ | Transaction can only be closed with the originating counterparty. |
Investments in Affiliates
An affiliated investment is an investment in which the Fund owns at least 5% of the outstanding voting shares of the issuer or as a result of other relationships, such as the Fund and the issuer having the same investment manager. Transactions with issuers that were either affiliated persons of the Fund at the beginning of the period or the end of the period were as follows:
| | | | | | | | | | | | | | | | | | | | | | | | | | | | | | | | | | | | |
| | | Shares,
beginning of
period | | | Shares
purchased | | | Shares sold | | | Shares,
end of
period | | | Net
realized
gains
(losses) | | | Net change
in
unrealized
gains
(losses) | | | Income
from
affiliated
securities | | | Value, end of period | | | % of
net assets | |
Short-Term Investment | | | | | | | | | | | | | | | | | | | | | | | | | | | | | | | | | | | | |
| | | | | | | | | |
Investment companies | | | | | | | | | | | | | | | | | | | | | | | | | | | | | | | | | | | | |
Wells Fargo Government Money Market Fund Select Class | | | 6,152,065 | | | | 210,250,003 | | | | 205,026,667 | | | | 11,375,401 | | | $ | 0 | | | $ | 0 | | | $ | 67,027 | | | $ | 11,375,401 | | | | 1.93 | % |
Affiliated securities no longer held at end of period | | | | | | | | | | | | | | | | | | | 0 | | | | 0 | | | | 4,599 | | | | 0 | | | | 0.00 | |
| | | | | | | | | | | | | | | | | | | | | | | | | | | | | | | | | | | | |
| | | | | | | | | | | | | | | | | | $ | 0 | | | $ | 0 | | | $ | 71,626 | | | | 11,375,401 | | | | 1.93 | % |
| | | | | | | | | | | | | | | | | | | | | | | | | | | | | | | | | | | | |
The accompanying notes are an integral part of these financial statements.
| | | | |
| 16 | | Wells Fargo International Bond Fund | | Statement of assets and liabilities—September 30, 2017 |
| | | | |
| | | | |
| |
Assets | | | | |
Investments in unaffiliated securities, at value (cost $554,369,987) | | $ | 570,207,545 | |
Investments in affiliated securities, at value (cost $11,375,401) | | | 11,375,401 | |
Cash | | | 13,194 | |
Foreign currency, at value (cost $2,994,300) | | | 2,929,230 | |
Receivable for Fund shares sold | | | 5,849,233 | |
Receivable for interest | | | 5,596,611 | |
Unrealized gains on forward foreign currency contracts | | | 4,664,577 | |
Prepaid expenses and other assets | | | 227,580 | |
| | | | |
Total assets | | | 600,863,371 | |
| | | | |
| |
Liabilities | | | | |
Payable for Fund shares redeemed | | | 5,611,571 | |
Unrealized losses on forward foreign currency contracts | | | 5,698,325 | |
Management fee payable | | | 307,467 | |
Administration fees payable | | | 45,941 | |
Distribution fees payable | | | 2,269 | |
Trustees’ fees and expenses payable | | | 4,653 | |
Accrued expenses and other liabilities | | | 5,963 | |
| | | | |
Total liabilities | | | 11,676,189 | |
| | | | |
Total net assets | | $ | 589,187,182 | |
| | | | |
| |
NET ASSETS CONSIST OF | | | | |
Paid-in capital | | $ | 609,829,453 | |
Overdistributed net investment income | | | (27,790,252 | ) |
Accumulated net realized losses on investments | | | (7,610,060 | ) |
Net unrealized gains on investments | | | 14,758,041 | |
| | | | |
Total net assets | | $ | 589,187,182 | |
| | | | |
| |
COMPUTATION OF NET ASSET VALUE AND OFFERING PRICE PER SHARE1 | | | | |
Net assets – Class A | | $ | 69,885,038 | |
Shares outstanding – Class A1 | | | 6,777,721 | |
Net asset value per share – Class A | | | $10.31 | |
Maximum offering price per share – Class A2 | | | $10.80 | |
Net assets – Class C | | $ | 3,493,346 | |
Shares outstanding – Class C1 | | | 349,497 | |
Net asset value per share – Class C | | | $10.00 | |
Net assets – Class R6 | | $ | 30,876,018 | |
Shares outstanding – Class R61 | | | 2,954,581 | |
Net asset value per share – Class R6 | | | $10.45 | |
Net assets – Administrator Class | | $ | 41,044,987 | |
Shares outstanding – Administrator Class1 | | | 3,963,783 | |
Net asset value per share – Administrator Class | | | $10.36 | |
Net assets – Institutional Class | | $ | 443,887,793 | |
Shares outstanding – Institutional Class1 | | | 42,567,109 | |
Net asset value per share – Institutional Class | | | $10.43 | |
| 1 | The Fund has an unlimited number of authorized shares. |
| 2 | Maximum offering price is computed as 100/95.50 of net asset value. On investments of $50,000 or more, the offering price is reduced. |
The accompanying notes are an integral part of these financial statements.
| | | | | | |
| Statement of operations—year ended September 30, 2017 | | Wells Fargo International Bond Fund | | | 17 | |
| | | | |
| | | | |
| |
Investment income | | | | |
Interest (net of foreign interest withholding taxes of $161,282) | | $ | 21,551,548 | |
Income from affiliated securities | | | 71,626 | |
| | | | |
Total investment income | | | 21,623,174 | |
| | | | |
| |
Expenses | | | | |
Management fee | | | 3,522,284 | |
Administration fees | | | | |
Class A | | | 95,354 | |
Class B | | | 42 | 1 |
Class C | | | 6,566 | |
Class R6 | | | 3,288 | |
Administrator Class | | | 42,731 | |
Institutional Class | | | 378,779 | |
Shareholder servicing fees | | | | |
Class A | | | 148,990 | |
Class B | | | 66 | 1 |
Class C | | | 10,259 | |
Administrator Class | | | 106,572 | |
Distribution fees | | | | |
Class B | | | 198 | 1 |
Class C | | | 30,778 | |
Custody and accounting fees | | | 35,013 | |
Professional fees | | | 66,173 | |
Registration fees | | | 382 | |
Shareholder report expenses | | | 5,459 | |
Trustees’ fees and expenses | | | 25,692 | |
Other fees and expenses | | | 13,139 | |
| | | | |
Total expenses | | | 4,491,765 | |
Less: Fee waivers and/or expense reimbursements | | | (51,736 | ) |
| | | | |
Net expenses | | | 4,440,029 | |
| | | | |
Net investment income | | | 17,183,145 | |
| | | | |
| |
REALIZED AND UNREALIZED GAINS (LOSSES) ON INVESTMENTS | | | | |
| |
Net realized losses on: | | | | |
Unaffiliated securities | | | (9,854,446 | ) |
Forward foreign currency contract transactions | | | (41,197,119 | ) |
| | | | |
Net realized losses on investments | | | (51,051,565 | ) |
| | | | |
| |
Net change in unrealized gains (losses) on: | | | | |
Unaffiliated securities | | | 11,094,128 | |
Forward foreign currency contract transactions | | | 1,754,245 | |
| | | | |
Net change in unrealized gains (losses) on investments | | | 12,848,373 | |
| | | | |
Net realized and unrealized gains (losses) on investments | | | (38,203,192 | ) |
| | | | |
Net decrease in net assets resulting from operations | | $ | (21,020,047 | ) |
| | | | |
| 1 | For the period from October 1, 2016 to December 5, 2016. Effective at the close of business on December 5, 2016, Class B shares were converted to Class A shares and are no longer offered by the Fund. |
The accompanying notes are an integral part of these financial statements.
| | | | |
| 18 | | Wells Fargo International Bond Fund | | Statement of changes in net assets |
| | | | | | | | | | | | | | | | | | | | | | | | |
| | | Year ended
September 30, 2017 | | | Year ended
September 30, 20161 | | | Year ended
October 31, 2015 | |
| | | | | | |
Operations | | | | | | | | | | | | | | | | | | | | | | | | |
Net investment income | | | | | | $ | 17,183,145 | | | | | | | $ | 22,566,834 | | | | | | | $ | 39,938,003 | |
Net realized losses on investments | | | | | | | (51,051,565 | ) | | | | | | | (40,208,825 | ) | | | | | | | (103,876,702 | ) |
Net change in unrealized gains (losses) on investments | | | | | | | 12,848,373 | | | | | | | | 103,284,914 | | | | | | | | (56,804,032 | ) |
| | | | |
Net increase (decrease) in net assets resulting from operations | | | | | | | (21,020,047 | ) | | | | | | | 85,642,923 | | | | | | | | (120,742,731 | ) |
| | | | |
| | | | | | |
Distributions to shareholders from | | | | | | | | | | | | | | | | | | | | | | | | |
Net investment income | | | | | | | | | | | | | | | | | | | | | | | | |
Class A | | | | | | | 0 | | | | | | | | 0 | | | | | | | | (423,572 | ) |
Class R6 | | | | | | | 0 | | | | | | | | 0 | | | | | | | | (48,140 | ) |
Administrator Class | | | | | | | 0 | | | | | | | | 0 | | | | | | | | (1,661,619 | ) |
Institutional Class | | | | | | | 0 | | | | | | | | 0 | | | | | | | | (4,268,266 | ) |
Net realized gains | | | | | | | | | | | | | | | | | | | | | | | | |
Class A | | | | | | | (739,477 | ) | | | | | | | (400,990 | ) | | | | | | | (287,937 | ) |
Class B | | | | | | | 0 | 2 | | | | | | | (2,261 | ) | | | | | | | (2,272 | ) |
Class C | | | | | | | (73,043 | ) | | | | | | | (38,344 | ) | | | | | | | (31,156 | ) |
Class R6 | | | | | | | (164,164 | ) | | | | | | | (83,111 | ) | | | | | | | (18,411 | ) |
Administrator Class | | | | | | | (631,824 | ) | | | | | | | (1,513,668 | ) | | | | | | | (1,004,296 | ) |
Institutional Class | | | | | | | (7,408,479 | ) | | | | | | | (3,929,124 | ) | | | | | | | (2,298,056 | ) |
| | | | |
Total distributions to shareholders | | | | | | | (9,016,987 | ) | | | | | | | (5,967,498 | ) | | | | | | | (10,043,725 | ) |
| | | | |
| | | | | | |
Capital share transactions | | | Shares | | | | | | | | Shares | | | | | | | | Shares | | | | | |
Proceeds from shares sold | | | | | | | | | | | | | | | | | | | | | | | | |
Class A | | | 4,929,121 | | | | 48,322,926 | | | | 1,868,356 | | | | 19,443,142 | | | | 4,376,785 | | | | 44,490,295 | |
Class B | | | 0 | 2 | | | 0 | 2 | | | 0 | | | | 0 | | | | 2 | | | | 19 | |
Class C | | | 13,816 | | | | 133,569 | | | | 23,455 | | | | 236,461 | | | | 29,172 | | | | 297,439 | |
Class R6 | | | 2,528,781 | | | | 26,142,193 | | | | 895,392 | | | | 8,893,640 | | | | 1,089,162 | | | | 11,067,245 | |
Administrator Class | | | 2,445,180 | | | | 24,089,253 | | | | 4,435,890 | | | | 44,153,170 | | | | 7,459,622 | | | | 76,084,803 | |
Institutional Class | | | 11,245,776 | | | | 111,148,970 | | | | 16,131,984 | | | | 163,749,468 | | | | 21,605,888 | | | | 222,681,252 | |
| | | | |
| | | | | | | 209,836,911 | | | | | | | | 236,475,881 | | | | | | | | 354,621,053 | |
| | | | |
Reinvestment of distributions | | | | | | | | | | | | | | | | | | | | | | | | |
Class A | | | 77,736 | | | | 729,940 | | | | 41,796 | | | | 395,809 | | | | 66,631 | | | | 705,372 | |
Class B | | | 0 | 2 | | | 0 | 2 | | | 202 | | | | 1,896 | | | | 185 | | | | 1,968 | |
Class C | | | 7,033 | | | | 64,420 | | | | 3,463 | | | | 32,237 | | | | 2,403 | | | | 25,233 | |
Class R6 | | | 17,299 | | | | 164,164 | | | | 8,721 | | | | 83,111 | | | | 6,273 | | | | 66,551 | |
Administrator Class | | | 66,753 | | | | 628,812 | | | | 158,255 | | | | 1,500,258 | | | | 250,106 | | | | 2,645,484 | |
Institutional Class | | | 690,923 | | | | 6,543,042 | | | | 345,507 | | | | 3,289,229 | | | | 440,841 | | | | 4,675,573 | |
| | | | |
| | | | | | | 8,130,378 | | | | | | | | 5,302,540 | | | | | | | | 8,120,181 | |
| | | | |
Payment for shares redeemed | | | | | | | | | | | | | | | | | | | | | | | | |
Class A | | | (3,279,695 | ) | | | (32,478,821 | ) | | | (5,046,620 | ) | | | (49,633,874 | ) | | | (5,719,183 | ) | | | (57,542,516 | ) |
Class B | | | (16,076 | )2 | | | (153,471 | )2 | | | (25,770 | ) | | | (256,696 | ) | | | (41,312 | ) | | | (422,819 | ) |
Class C | | | (195,882 | ) | | | (1,864,728 | ) | | | (222,003 | ) | | | (2,168,648 | ) | | | (395,376 | ) | | | (3,980,181 | ) |
Class R6 | | | (740,812 | ) | | | (7,302,744 | ) | | | (1,096,795 | ) | | | (11,289,059 | ) | | | (279,791 | ) | | | (2,789,621 | ) |
Administrator Class | | | (3,255,355 | ) | | | (32,370,616 | ) | | | (27,263,086 | ) | | | (278,792,881 | ) | | | (13,481,584 | ) | | | (136,684,425 | ) |
Institutional Class | | | (20,326,950 | ) | | | (201,196,349 | ) | | | (36,026,612 | ) | | | (359,679,067 | ) | | | (28,068,413 | ) | | | (285,845,548 | ) |
| | | | |
| | | | | | | (275,366,729 | ) | | | | | | | (701,820,225 | ) | | | | | | | (487,265,110 | ) |
| | | | |
Net decrease in net assets resulting from capital share transactions | | | | | | | (57,399,440 | ) | | | | | | | (460,041,804 | ) | | | | | | | (124,523,876 | ) |
| | | | |
Total decrease in net assets | | | | | | | (87,436,474 | ) | | | | | | | (380,366,379 | ) | | | | | | | (255,310,332 | ) |
| | | | |
| | | | | | |
Net assets | | | | | | | | | | | | | | | | | | | | | | | | |
Beginning of period | | | | | | | 676,623,656 | | | | | | | | 1,056,990,035 | | | | | | | | 1,312,300,367 | |
| | | | |
End of period | | | | | | $ | 589,187,182 | | | | | | | $ | 676,623,656 | | | | | | | $ | 1,056,990,035 | |
| | | | |
Overdistributed net investment income | | | | | | $ | (27,790,252 | ) | | | | | | $ | (383,143 | ) | | | | | | $ | (48,221,909 | ) |
| | | | |
| 1 | For the eleven months ended September 30, 2016. The Fund changed its fiscal year end from October 31 to September 30, effective September 30, 2016. |
| 2 | For the period from October 1, 2016 to December 5, 2016. Effective at the close of business on December 5, 2016, Class B shares were converted to Class A shares and are no longer offered by the Fund. |
The accompanying notes are an integral part of these financial statements.
| | | | | | |
| Financial highlights | | Wells Fargo International Bond Fund | | | 19 | |
(For a share outstanding throughout each period)
| | | | | | | | | | | | | | | | | | | | | | | | |
| | | Year ended September 30 | | | Year ended October 31 | |
| CLASS A | | 2017 | | | 20161 | | | 2015 | | | 2014 | | | 2013 | | | 2012 | |
Net asset value, beginning of period | | | $10.77 | | | | $9.74 | | | | $10.84 | | | | $11.32 | | | | $11.83 | | | | $11.85 | |
Net investment income | | | 0.26 | 2 | | | 0.24 | 2 | | | 0.31 | 2 | | | 0.37 | 2 | | | 0.36 | 2 | | | 0.33 | 2 |
Net realized and unrealized gains (losses) on investments | | | (0.57 | ) | | | 0.85 | | | | (1.33 | ) | | | (0.34 | ) | | | (0.73 | ) | | | 0.08 | |
| | | | | | | | | | | | | | | | | | | | | | | | |
Total from investment operations | | | (0.31 | ) | | | 1.09 | | | | (1.02 | ) | | | 0.03 | | | | (0.37 | ) | | | 0.41 | |
Distributions to shareholders from | | | | | | | | | | | | | | | | | | | | | | | | |
Net investment income | | | 0.00 | | | | 0.00 | | | | (0.05 | ) | | | (0.12 | ) | | | (0.02 | ) | | | (0.29 | ) |
Net realized gains | | | (0.15 | ) | | | (0.06 | ) | | | (0.03 | ) | | | (0.39 | ) | | | (0.12 | ) | | | (0.14 | ) |
| | | | | | | | | | | | | | | | | | | | | | | | |
Total distributions to shareholders | | | (0.15 | ) | | | (0.06 | ) | | | (0.08 | ) | | | (0.51 | ) | | | (0.14 | ) | | | (0.43 | ) |
Net asset value, end of period | | | $10.31 | | | | $10.77 | | | | $9.74 | | | | $10.84 | | | | $11.32 | | | | $11.83 | |
Total return3 | | | (2.78 | )% | | | 11.24 | % | | | (9.50 | )% | | | 0.26 | % | | | (3.18 | )% | | | 3.66 | % |
Ratios to average net assets (annualized) | | | | | | | | | | | | | | | | | | | | | | | | |
Gross expenses | | | 1.03 | % | | | 1.08 | % | | | 1.06 | % | | | 1.05 | % | | | 1.05 | % | | | 1.04 | % |
Net expenses | | | 1.03 | % | | | 1.03 | % | | | 1.03 | % | | | 1.03 | % | | | 1.03 | % | | | 1.03 | % |
Net investment income | | | 2.61 | % | | | 2.64 | % | | | 3.07 | % | | | 3.29 | % | | | 2.93 | % | | | 2.88 | % |
Supplemental data | | | | | | | | | | | | | | | | | | | | | | | | |
Portfolio turnover rate | | | 68 | % | | | 96 | % | | | 136 | % | | | 103 | % | | | 129 | % | | | 79 | % |
Net assets, end of period (000s omitted) | | | $69,885 | | | | $54,399 | | | | $79,727 | | | | $102,624 | | | | $113,846 | | | | $139,600 | |
| 1 | For the eleven months ended September 30, 2016. The Fund changed its fiscal year end from October 31 to September 30, effective September 30, 2016. |
| 2 | Calculated based upon average shares outstanding |
| 3 | Total return calculations do not include any sales charges. Returns for periods of less than one year are not annualized. |
The accompanying notes are an integral part of these financial statements.
| | | | |
| 20 | | Wells Fargo International Bond Fund | | Financial highlights |
(For a share outstanding throughout each period)
| | | | | | | | | | | | | | | | | | | | | | | | |
| | | Year ended September 30 | | | Year ended October 31 | |
| CLASS C | | 2017 | | | 20161 | | | 2015 | | | 2014 | | | 2013 | | | 2012 | |
Net asset value, beginning of period | | | $10.52 | | | | $9.58 | | | | $10.70 | | | | $11.19 | | | | $11.76 | | | | $11.81 | |
Net investment income | | | 0.18 | 2 | | | 0.17 | 2 | | | 0.23 | 2 | | | 0.28 | 2 | | | 0.26 | 2 | | | 0.24 | 2 |
Net realized and unrealized gains (losses) on investments | | | (0.55 | ) | | | 0.83 | | | | (1.32 | ) | | | (0.34 | ) | | | (0.71 | ) | | | 0.08 | |
| | | | | | | | | | | | | | | | | | | | | | | | |
Total from investment operations | | | (0.37 | ) | | | 1.00 | | | | (1.09 | ) | | | (0.06 | ) | | | (0.45 | ) | | | 0.32 | |
Distributions to shareholders from | | | | | | | | | | | | | | | | | | | | | | | | |
Net investment income | | | 0.00 | | | | 0.00 | | | | 0.00 | | | | (0.04 | ) | | | (0.00 | )3 | | | (0.23 | ) |
Net realized gains | | | (0.15 | ) | | | (0.06 | ) | | | (0.03 | ) | | | (0.39 | ) | | | (0.12 | ) | | | (0.14 | ) |
| | | | | | | | | | | | | | | | | | | | | | | | |
Total distributions to shareholders | | | (0.15 | ) | | | (0.06 | ) | | | (0.03 | ) | | | (0.43 | ) | | | (0.12 | ) | | | (0.37 | ) |
Net asset value, end of period | | | $10.00 | | | | $10.52 | | | | $9.58 | | | | $10.70 | | | | $11.19 | | | | $11.76 | |
Total return4 | | | (3.43 | )% | | | 10.49 | % | | | (10.21 | )% | | | (0.52 | )% | | | (3.84 | )% | | | 2.86 | % |
Ratios to average net assets (annualized) | | | | | | | | | | | | | | | | | | | | | | | | |
Gross expenses | | | 1.78 | % | | | 1.83 | % | | | 1.81 | % | | | 1.80 | % | | | 1.80 | % | | | 1.79 | % |
Net expenses | | | 1.78 | % | | | 1.78 | % | | | 1.78 | % | | | 1.78 | % | | | 1.78 | % | | | 1.78 | % |
Net investment income | | | 1.88 | % | | | 1.86 | % | | | 2.33 | % | | | 2.54 | % | | | 2.15 | % | | | 2.12 | % |
Supplemental data | | | | | | | | | | | | | | | | | | | | | | | | |
Portfolio turnover rate | | | 68 | % | | | 96 | % | | | 136 | % | | | 103 | % | | | 129 | % | | | 79 | % |
Net assets, end of period (000s omitted) | | | $3,493 | | | | $5,520 | | | | $6,895 | | | | $11,597 | | | | $16,097 | | | | $23,448 | |
| 1 | For the eleven months ended September 30, 2016. The Fund changed its fiscal year end from October 31 to September 30, effective September 30, 2016. |
| 2 | Calculated based upon average shares outstanding |
| 3 | Amount is less than $0.005. |
| 4 | Total return calculations do not include any sales charges. Returns for periods of less than one year are not annualized. |
The accompanying notes are an integral part of these financial statements.
| | | | | | |
| Financial highlights | | Wells Fargo International Bond Fund | | | 21 | |
(For a share outstanding throughout each period)
| | | | | | | | | | | | | | | | | | | | |
| | | Year ended September 30 | | | Year ended October 31 | |
| CLASS R6 | | 2017 | | | 20161 | | | 2015 | | | 2014 | | | 20132 | |
Net asset value, beginning of period | | | $10.88 | | | | $9.80 | | | | $10.88 | | | | $11.36 | | | | $11.80 | |
Net investment income | | | 0.30 | 3 | | | 0.28 | 3 | | | 0.35 | 3 | | | 0.42 | 3 | | | 0.39 | 3 |
Net realized and unrealized gains (losses) on investments | | | (0.58 | ) | | | 0.86 | | | | (1.34 | ) | | | (0.35 | ) | | | (0.69 | ) |
| | | | | | | | | | | | | | | | | | | | |
Total from investment operations | | | (0.28 | ) | | | 1.14 | | | | (0.99 | ) | | | 0.07 | | | | (0.30 | ) |
Distributions to shareholders from | | | | | | | | | | | | | | | | | | | | |
Net investment income | | | 0.00 | | | | 0.00 | | | | (0.06 | ) | | | (0.16 | ) | | | (0.02 | ) |
Net realized gains | | | (0.15 | ) | | | (0.06 | ) | | | (0.03 | ) | | | (0.39 | ) | | | (0.12 | ) |
| | | | | | | | | | | | | | | | | | | | |
Total distributions to shareholders | | | (0.15 | ) | | | (0.06 | ) | | | (0.09 | ) | | | (0.55 | ) | | | (0.14 | ) |
Net asset value, end of period | | | $10.45 | | | | $10.88 | | | | $9.80 | | | | $10.88 | | | | $11.36 | |
Total return4 | | | (2.48 | )% | | | 11.69 | % | | | (9.18 | )% | | | 0.60 | % | | | (2.52 | )% |
Ratios to average net assets (annualized) | | | | | | | | | | | | | | | | | | | | |
Gross expenses | | | 0.65 | % | | | 0.70 | % | | | 0.68 | % | | | 0.67 | % | | | 0.68 | % |
Net expenses | | | 0.65 | % | | | 0.65 | % | | | 0.65 | % | | | 0.65 | % | | | 0.65 | % |
Net investment income | | | 3.01 | % | | | 3.00 | % | | | 3.46 | % | | | 3.64 | % | | | 3.70 | % |
Supplemental data | | | | | | | | | | | | | | | | | | | | |
Portfolio turnover rate | | | 68 | % | | | 96 | % | | | 136 | % | | | 103 | % | | | 129 | % |
Net assets, end of period (000s omitted) | | | $30,876 | | | | $12,501 | | | | $13,152 | | | | $5,729 | | | | $2,433 | |
| 1 | For the eleven months ended September 30, 2016. The Fund changed its fiscal year end from October 31 to September 30, effective September 30, 2016. |
| 2 | For the period from November 30, 2012 (commencement of class operations) to October 31, 2013 |
| 3 | Calculated based upon average shares outstanding |
| 4 | Returns for periods of less than one year are not annualized. |
The accompanying notes are an integral part of these financial statements.
| | | | |
| 22 | | Wells Fargo International Bond Fund | | Financial highlights |
(For a share outstanding throughout each period)
| | | | | | | | | | | | | | | | | | | | | | | | |
| | | Year ended September 30 | | | Year ended October 31 | |
| ADMINISTRATOR CLASS | | 2017 | | | 20161 | | | 2015 | | | 2014 | | | 2013 | | | 2012 | |
Net asset value, beginning of period | | | $10.80 | | | | $9.75 | | | | $10.84 | | | | $11.32 | | | | $11.81 | | | | $11.83 | |
Net investment income | | | 0.28 | 2 | | | 0.26 | 2 | | | 0.33 | 2 | | | 0.39 | 2 | | | 0.36 | 2 | | | 0.35 | 2 |
Net realized and unrealized gains (losses) on investments | | | (0.57 | ) | | | 0.85 | | | | (1.34 | ) | | | (0.34 | ) | | | (0.71 | ) | | | 0.08 | |
| | | | | | | | | | | | | | | | | | | | | | | | |
Total from investment operations | | | (0.29 | ) | | | 1.11 | | | | (1.01 | ) | | | 0.05 | | | | (0.35 | ) | | | 0.43 | |
Distributions to shareholders from | | | | | | | | | | | | | | | | | | | | | | | | |
Net investment income | | | 0.00 | | | | 0.00 | | | | (0.05 | ) | | | (0.14 | ) | | | (0.02 | ) | | | (0.31 | ) |
Net realized gains | | | (0.15 | ) | | | (0.06 | ) | | | (0.03 | ) | | | (0.39 | ) | | | (0.12 | ) | | | (0.14 | ) |
| | | | | | | | | | | | | | | | | | | | | | | | |
Total distributions to shareholders | | | (0.15 | ) | | | (0.06 | ) | | | (0.08 | ) | | | (0.53 | ) | | | (0.14 | ) | | | (0.45 | ) |
Net asset value, end of period | | | $10.36 | | | | $10.80 | | | | $9.75 | | | | $10.84 | | | | $11.32 | | | | $11.81 | |
Total return3 | | | (2.59 | )% | | | 11.44 | % | | | (9.36 | )% | | | 0.43 | % | | | (2.98 | )% | | | 3.89 | % |
Ratios to average net assets (annualized) | | | | | | | | | | | | | | | | | | | | | | | | |
Gross expenses | | | 0.97 | % | | | 1.02 | % | | | 0.99 | % | | | 0.99 | % | | | 0.99 | % | | | 0.97 | % |
Net expenses | | | 0.85 | % | | | 0.85 | % | | | 0.85 | % | | | 0.85 | % | | | 0.85 | % | | | 0.85 | % |
Net investment income | | | 2.80 | % | | | 2.85 | % | | | 3.26 | % | | | 3.47 | % | | | 3.15 | % | | | 3.04 | % |
Supplemental data | | | | | | | | | | | | | | | | | | | | | | | | |
Portfolio turnover rate | | | 68 | % | | | 96 | % | | | 136 | % | | | 103 | % | | | 129 | % | | | 79 | % |
Net assets, end of period (000s omitted) | | | $41,045 | | | | $50,825 | | | | $266,849 | | | | $359,383 | | | | $334,778 | | | | $294,330 | |
| 1 | For the eleven months ended September 30, 2016. The Fund changed its fiscal year end from October 31 to September 30, effective September 30, 2016. |
| 2 | Calculated based upon average shares outstanding |
| 3 | Returns for periods of less than one year are not annualized. |
The accompanying notes are an integral part of these financial statements.
| | | | | | |
| Financial highlights | | Wells Fargo International Bond Fund | | | 23 | |
(For a share outstanding throughout each period)
| | | | | | | | | | | | | | | | | | | | | | | | |
| | | Year ended September 30 | | | Year ended October 31 | |
| INSTITUTIONAL CLASS | | 2017 | | | 20161 | | | 2015 | | | 2014 | | | 2013 | | | 2012 | |
Net asset value, beginning of period | | | $10.86 | | | | $9.79 | | | | $10.87 | | | | $11.35 | | | | $11.82 | | | | $11.84 | |
Net investment income | | | 0.29 | 2 | | | 0.27 | 2 | | | 0.35 | 2 | | | 0.41 | 2 | | | 0.37 | | | | 0.36 | |
Net realized and unrealized gains (losses) on investments | | | (0.57 | ) | | | 0.86 | | | | (1.34 | ) | | | (0.35 | ) | | | (0.70 | ) | | | 0.09 | |
| | | | | | | | | | | | | | | | | | | | | | | | |
Total from investment operations | | | (0.28 | ) | | | 1.13 | | | | (0.99 | ) | | | 0.06 | | | | (0.33 | ) | | | 0.45 | |
Distributions to shareholders from | | | | | | | | | | | | | | | | | | | | | | | | |
Net investment income | | | 0.00 | | | | 0.00 | | | | (0.06 | ) | | | (0.15 | ) | | | (0.02 | ) | | | (0.33 | ) |
Net realized gains | | | (0.15 | ) | | | (0.06 | ) | | | (0.03 | ) | | | (0.39 | ) | | | (0.12 | ) | | | (0.14 | ) |
| | | | | | | | | | | | | | | | | | | | | | | | |
Total distributions to shareholders | | | (0.15 | ) | | | (0.06 | ) | | | (0.09 | ) | | | (0.54 | ) | | | (0.14 | ) | | | (0.47 | ) |
Net asset value, end of period | | | $10.43 | | | | $10.86 | | | | $9.79 | | | | $10.87 | | | | $11.35 | | | | $11.82 | |
Total return3 | | | (2.48 | )% | | | 11.60 | % | | | (9.20 | )% | | | 0.55 | % | | | (2.78 | )% | | | 3.99 | % |
Ratios to average net assets (annualized) | | | | | | | | | | | | | | | | | | | | | | | | |
Gross expenses | | | 0.70 | % | | | 0.75 | % | | | 0.73 | % | | | 0.72 | % | | | 0.72 | % | | | 0.71 | % |
Net expenses | | | 0.70 | % | | | 0.70 | % | | | 0.70 | % | | | 0.70 | % | | | 0.70 | % | | | 0.71 | % |
Net investment income | | | 2.96 | % | | | 2.95 | % | | | 3.41 | % | | | 3.62 | % | | | 3.26 | % | | | 3.19 | % |
Supplemental data | | | | | | | | | | | | | | | | | | | | | | | | |
Portfolio turnover rate | | | 68 | % | | | 96 | % | | | 136 | % | | | 103 | % | | | 129 | % | | | 79 | % |
Net assets, end of period (000s omitted) | | | $443,888 | | | | $553,208 | | | | $689,964 | | | | $832,072 | | | | $1,115,163 | | | | $1,270,164 | |
| 1 | For the eleven months ended September 30, 2016. The Fund changed its fiscal year end from October 31 to September 30, effective September 30, 2016. |
| 2 | Calculated based upon average shares outstanding |
| 3 | Returns for periods of less than one year are not annualized. |
The accompanying notes are an integral part of these financial statements.
| | | | |
| 24 | | Wells Fargo International Bond Fund | | Notes to financial statements |
1. ORGANIZATION
Wells Fargo Funds Trust (the “Trust”), a Delaware statutory trust organized on March 10, 1999, is an open-end management investment company registered under the Investment Company Act of 1940, as amended (the “1940 Act”). As an investment company, the Trust follows the accounting and reporting guidance in Financial Accounting Standards Board Accounting Standards Codification Topic 946, Financial Services – Investment Companies. These financial statements report on the Wells Fargo International Bond Fund (the “Fund”) which is a diversified series of the Trust.
Effective at the close of business on December 5, 2016, Class B shares were converted to Class A shares and are no longer offered by the Fund. Information for Class B shares reflected in the financial statements represents activity through December 5, 2016.
2. SIGNIFICANT ACCOUNTING POLICIES
The following significant accounting policies, which are consistently followed in the preparation of the financial statements of the Fund, are in conformity with U.S. generally accepted accounting principles which require management to make estimates and assumptions that affect the reported amounts of assets and liabilities, disclosure of contingent assets and liabilities at the date of the financial statements, and the reported amounts of revenues and expenses during the reporting period. Actual results could differ from those estimates.
Securities valuation
All investments are valued each business day as of the close of regular trading on the New York Stock Exchange (generally 4 p.m. Eastern Time), although the Fund may deviate from this calculation time under unusual or unexpected circumstances.
Debt securities are valued at the evaluated bid price provided by an independent pricing service or, if a reliable price is not available, the quoted bid price from an independent broker-dealer.
The values of securities denominated in foreign currencies are translated into U.S. dollars at rates provided by an independent foreign currency pricing source at a time each business day specified by the Management Valuation Team of Wells Fargo Funds Management, LLC (“Funds Management”).
Investments in registered open-end investment companies are valued at net asset value. Interests in non-registered investment companies that are redeemable at net asset value are fair valued normally at net asset value.
Investments which are not valued using any of the methods discussed above are valued at their fair value, as determined in good faith by the Board of Trustees of the Fund. The Board of Trustees has established a Valuation Committee comprised of the Trustees and has delegated to it the authority to take any actions regarding the valuation of portfolio securities that the Valuation Committee deems necessary or appropriate, including determining the fair value of portfolio securities, unless the determination has been delegated to the Management Valuation Team. The Board of Trustees retains the authority to make or ratify any valuation decisions or approve any changes to the Valuation Procedures as it deems appropriate. On a quarterly basis, the Board of Trustees receives reports on any valuation actions taken by the Valuation Committee or the Management Valuation Team which may include items for ratification.
Valuations of fair valued securities are compared to the next actual sales price when available, or other appropriate market values, to assess the continued appropriateness of the fair valuation methodologies used. These securities are fair valued on a day-to-day basis, taking into consideration changes to appropriate market information and any significant changes to the inputs considered in the valuation process until there is a readily available price provided on an exchange or by an independent pricing service. Valuations received from an independent pricing service or independent broker-dealer quotes are periodically validated by comparisons to most recent trades and valuations provided by other independent pricing services in addition to the review of prices by the manager and/or subadviser. Unobservable inputs used in determining fair valuations are identified based on the type of security, taking into consideration factors utilized by market participants in valuing the investment, knowledge about the issuer and the current market environment.
Foreign currency translation
The accounting records of the Fund are maintained in U.S. dollars. The values of other assets and liabilities denominated in foreign currencies are translated into U.S. dollars at rates provided by an independent foreign currency pricing source at a time each business day specified by the Management Valuation Team. Purchases and sales of securities, and income and expenses are converted at the rate of exchange on the respective dates of such transactions. Net realized foreign exchange gains or losses arise from sales of foreign currencies, currency gains or losses realized between the trade and settlement dates on securities transactions, and the difference between the amounts of dividends, interest and foreign
| | | | | | |
| Notes to financial statements | | Wells Fargo International Bond Fund | | | 25 | |
withholding taxes recorded and the U.S. dollar equivalent of the amounts actually paid or received. Net unrealized foreign exchange gains and losses arise from changes in the fair value of assets and liabilities other than investments in securities resulting from changes in exchange rates. The changes in net assets arising from changes in exchange rates of securities and the changes in net assets resulting from changes in market prices of securities are not separately presented. Such changes are included in net realized and unrealized gains or losses from investments.
Forward foreign currency contracts
The Fund is subject to foreign currency risk in the normal course of pursuing its investment objectives. A forward foreign currency contract is an agreement between two parties to purchase or sell a specific currency for an agreed-upon price at a future date. The Fund enters into forward foreign currency contracts to facilitate transactions in foreign-denominated securities and to attempt to minimize the risk to the Fund from adverse changes in the relationship between currencies. Forward foreign currency contracts are recorded at the forward rate and marked-to-market daily. When the contracts are closed, realized gains and losses arising from such transactions are recorded as realized gains or losses on forward foreign currency contract transactions. The Fund could be exposed to risks if the counterparties to the contracts are unable to meet the terms of their contracts or if the value of the foreign currency changes unfavorably. The Fund’s maximum risk of loss from counterparty credit risk is the unrealized gains on the contracts. This risk may be mitigated if there is a master netting arrangement between the Fund and the counterparty.
Security loans
The Fund may lend its securities from time to time in order to earn additional income in the form of fees or interest on securities received as collateral or the investment of any cash received as collateral. The Fund continues to receive interest or dividends on the securities loaned. The Fund receives collateral in the form of cash or securities with a value at least equal to the value of the securities on loan. The value of the loaned securities is determined at the close of each business day and any additional required collateral is delivered to the Fund on the next business day. In a securities lending transaction, the net asset value of the Fund will be affected by an increase or decrease in the value of the securities loaned and by an increase or decrease in the value of the instrument in which collateral is invested. The amount of securities lending activity undertaken by the Fund fluctuates from time to time. In the event of default or bankruptcy by the borrower, the Fund may be prevented from recovering the loaned securities or gaining access to the collateral or may experience delays or costs in doing so. In addition, the investment of any cash collateral received may lose all or part of its value. The Fund has the right under the lending agreement to recover the securities from the borrower on demand.
The Fund lends its securities through an unaffiliated securities lending agent. Cash collateral received in connection with its securities lending transactions is invested in Securities Lending Cash Investments, LLC (the “Securities Lending Fund”). The Securities Lending Fund is exempt from registration under Section 3(c)(7) of the 1940 Act and is managed by Funds Management and is subadvised by Wells Capital Management Incorporated (“WellsCap”), an affiliate of Funds Management and an indirect wholly owned subsidiary of Wells Fargo & Company (“Wells Fargo”). Funds Management receives an advisory fee starting at 0.05% and declining to 0.01% as the average daily net assets of the Securities Lending Fund increase. All of the fees received by Funds Management are paid to WellsCap for its services as subadviser. The Securities Lending Fund seeks to provide a positive return compared to the daily Fed Funds Open Rate by investing in high-quality, U.S. dollar-denominated short-term money market instruments. Securities Lending Fund investments are valued at the evaluated bid price provided by an independent pricing service. Income earned from investment in the Securities Lending Fund is included in income from affiliated securities on the Statement of Operations.
When-issued transactions
The Fund may purchase securities on a forward commitment or when-issued basis. The Fund records a when-issued transaction on the trade date and will segregate assets in an amount at least equal in value to the Fund’s commitment to purchase when-issued securities. Securities purchased on a when-issued basis are marked-to-market daily and the Fund begins earning interest on the settlement date. Losses may arise due to changes in the market value of the underlying securities or if the counterparty does not perform under the contract.
Security transactions and income recognition
Securities transactions are recorded on a trade date basis. Realized gains or losses are recorded on the basis of identified cost.
Interest income is accrued daily and bond discounts are accreted and premiums are amortized daily based on the effective interest method. To the extent debt obligations are placed on non-accrual status, any related interest income may be reduced by writing off interest receivables when the collection of all or a portion of interest has been determined to be doubtful based on consistently applied procedures and the fair value has decreased. If the issuer subsequently resumes interest payments or when the collectability of interest is reasonably assured, the debt obligation is removed from non-accrual status.
| | | | |
| 26 | | Wells Fargo International Bond Fund | | Notes to financial statements |
Income from foreign securities is recorded net of foreign taxes withheld where recovery of such taxes is not assured.
Distributions to shareholders
Distributions to shareholders from net investment income and net realized gains, if any, are recorded on the ex-dividend date. Such distributions are determined in accordance with income tax regulations and may differ from U.S. generally accepted accounting principles. Dividend sources are estimated at the time of declaration. The tax character of distributions is determined as of the Fund’s fiscal year end. Therefore, a portion of the Fund’s distributions made prior to the Fund’s fiscal year end may be categorized as a tax return of capital.
Federal and other taxes
The Fund intends to continue to qualify as a regulated investment company by distributing substantially all of its investment company taxable and any net realized capital gains (after reduction for capital loss carryforwards) sufficient to relieve it from all, or substantially all, federal income taxes. Accordingly, no provision for federal income taxes was required.
The Fund’s income and federal excise tax returns and all financial records supporting those returns for the prior three fiscal years are subject to examination by the federal and Delaware revenue authorities. Management has analyzed the Fund’s tax positions taken on federal, state, and foreign tax returns for all open tax years and does not believe that there are any uncertain tax positions that require recognition of a tax liability.
As of September 30, 2017, the aggregate cost of all investments for federal income tax purposes was $566,542,883 and the unrealized gains (losses) consisted of:
| | | | |
Gross unrealized gains | | $ | 26,838,290 | |
Gross unrealized losses | | | (12,831,962 | ) |
Net unrealized gains | | $ | 14,006,328 | |
Reclassifications are made to the Fund’s capital accounts for permanent tax differences to reflect income and gains available for distribution (or available capital loss carryforwards) under federal income tax regulations. U.S. generally accepted accounting principles require that certain components of net assets be adjusted to reflect permanent differences between financial and tax reporting. These reclassifications have no effect on net assets or net asset values per share. The primary permanent difference causing such reclassifications is due to foreign currency transactions. At September 30, 2017, as a result of permanent book-to-tax differences, the following reclassification adjustments were made on the Statement of Assets and Liabilities:
| | |
Overdistributed net
investment income | | Accumulated net
realized losses
on investments |
| $(44,590,254) | | $44,590,254 |
As of September 30, 2017, the Fund had capital loss carryforwards which consist of $29,235 in short-term capital losses and $41,293 in long-term capital losses.
As of September 30, 2017, the Fund had current year deferred post-October capital losses and a qualified late-year ordinary loss which will both be recognized on the first day of the following fiscal year in the following amounts:
| | | | |
Deferred post-October
capital losses | | Late-year
ordinary losses
deferred |
| Short-term | | Long-term | |
| $(5,760,133) | | $(1,243,623) | | $(27,514,332) |
Class allocations
The separate classes of shares offered by the Fund differ principally in applicable sales charges, distribution, shareholder servicing, and administration fees. Class specific expenses are charged directly to that share class. Investment income, common expenses, and realized and unrealized gains (losses) on investments are allocated daily to each class of shares based on the relative proportion of net assets of each class.
| | | | | | |
| Notes to financial statements | | Wells Fargo International Bond Fund | | | 27 | |
3. FAIR VALUATION MEASUREMENTS
Fair value measurements of investments are determined within a framework that has established a fair value hierarchy based upon the various data inputs utilized in determining the value of the Fund’s investments. The three-level hierarchy gives the highest priority to unadjusted quoted prices in active markets for identical assets or liabilities (Level 1) and the lowest priority to unobservable inputs (Level 3). The Fund’s investments are classified within the fair value hierarchy based on the lowest level of input that is significant to the fair value measurement. The inputs are summarized into three broad levels as follows:
| ∎ | | Level 1 – quoted prices in active markets for identical securities |
| ∎ | | Level 2 – other significant observable inputs (including quoted prices for similar securities, interest rates, prepayment speeds, credit risk, etc.) |
| ∎ | | Level 3 – significant unobservable inputs (including the Fund’s own assumptions in determining the fair value of investments) |
The inputs or methodologies used for valuing investments in securities are not necessarily an indication of the risk associated with investing in those securities.
The following is a summary of the inputs used in valuing the Fund’s assets and liabilities as of September 30, 2017:
| | | | | | | | | | | | | | | | |
| | | Quoted prices
(Level 1) | | | Other significant
observable inputs
(Level 2) | | | Significant
unobservable inputs (Level 3) | | | Total | |
Assets | | | | | | | | | | | | | | | | |
Investments in: | | | | | | | | | | | | | | | | |
| | | | |
Corporate bonds and notes | | $ | 0 | | | $ | 28,402,985 | | | $ | 0 | | | $ | 28,402,985 | |
| | | | |
Foreign corporate bonds and notes | | | 0 | | | | 78,294,558 | | | | 0 | | | | 78,294,558 | |
| | | | |
Foreign government bonds | | | 0 | | | | 389,088,199 | | | | 0 | | | | 389,088,199 | |
| | | | |
U.S. Treasury securities | | | 57,530,014 | | | | 0 | | | | 0 | | | | 57,530,014 | |
| | | | |
Yankee corporate bonds and notes | | | 0 | | | | 16,891,789 | | | | 0 | | | | 16,891,789 | |
| | | | |
Short-term investments | | | | | | | | | | | | | | | | |
Investment companies | | | 11,375,401 | | | | 0 | | | | 0 | | | | 11,375,401 | |
| | | | |
| | | 68,905,415 | | | | 512,677,531 | | | | 0 | | | | 581,582,946 | |
Forward foreign currency contracts | | | 0 | | | | 4,664,577 | | | | 0 | | | | 4,664,577 | |
Total assets | | $ | 68,905,415 | | | $ | 517,342,108 | | | $ | 0 | | | $ | 586,247,523 | |
Liabilities | | | | | | | | | | | | | | | | |
Forward foreign currency contracts | | $ | 0 | | | $ | 5,698,325 | | | $ | 0 | | | $ | 5,698,325 | |
Total liabilities | | $ | 0 | | | $ | 5,698,325 | | | $ | 0 | | | $ | 5,698,325 | |
Forward foreign currency contracts are reported at their unrealized gains (losses) at measurement date, which represents the change in the contract’s value from trade date. All other assets and liabilities are reported at their market value at measurement date.
The Fund recognizes transfers between levels within the fair value hierarchy at the end of the reporting period. At September 30, 2017, the Fund did not have any transfers into/out of Level 1, Level 2, or Level 3.
4. TRANSACTIONS WITH AFFILIATES AND OTHER EXPENSES
Management fee
Funds Management, an indirect wholly owned subsidiary of Wells Fargo, is the manager of the Fund and provides advisory and fund-level administrative services under an investment management agreement. Under the investment management agreement, Funds Management is responsible for, among other services, implementing the investment objectives and strategies of the Fund, supervising the subadviser, providing fund-level administrative services in connection with the Fund’s operations, and providing any other fund-level administrative services reasonably necessary
| | | | |
| 28 | | Wells Fargo International Bond Fund | | Notes to financial statements |
for the operation of the Fund. As compensation for its services under the investment management agreement, Funds Management is entitled to receive an annual management fee starting at 0.60% and declining to 0.48% as the average daily net assets of the Fund increase. For the year ended September 30, 2017, the management fee was equivalent to an annual rate of 0.60% of the Fund’s average daily net assets.
Funds Management has retained the services of a subadviser to provide daily portfolio management to the Fund. The fee for subadvisory services is borne by Funds Management. First International Advisors, LLC is the subadviser to the Fund and is entitled to receive a fee from Funds Management at an annual rate starting at 0.35% and declining to 0.20% as the average daily net assets of the Fund increase.
Administration fees
Under a class-level administration agreement, Funds Management provides class-level administrative services to the Fund, which includes paying fees and expenses for services provided by the transfer agent, sub-transfer agents, omnibus account servicers and record-keepers. As compensation for its services under the class-level administration agreement, Funds Management receives an annual fee which is calculated based on the average daily net assets of each class as follows:
| | | | |
| | | Class-level
administration fee | |
Class A, Class B, Class C | | | 0.16 | % |
Class R6 | | | 0.03 | |
Administrator Class | | | 0.10 | |
Institutional Class | | | 0.08 | |
Funds Management has contractually waived and/or reimbursed management and administration fees to the extent necessary to maintain certain net operating expense ratios for the Fund. Waiver of fees and/or reimbursement of expenses by Funds Management were made first from fund level expenses on a proportionate basis and then from class specific expenses. Funds Management has committed through January 31, 2018 to waive fees and/or reimburse expenses to the extent necessary to cap the Fund’s expenses at 1.03% for Class A shares, 1.78% for Class C shares, 0.65% for Class R6 shares, 0.85% for Administrator Class shares, and 0.70% for Institutional Class shares. After this time, the cap may be increased or the commitment to maintain the cap may be terminated only with the approval of the Board of Trustees.
During the year ended September 30, 2017, State Street Bank and Trust Company (“State Street”), the Fund’s custodian, reimbursed the Fund $46,421 for certain out-of-pocket expenses that were billed to the Fund in error from 1998-2015. This amount is included in interest income on the Statement of Operations. In addition, Funds Management was also reimbursed $56,652 by State Street for waivers/reimbursements it made to the Fund to limit Fund expenses during the period the Fund was erroneously billed.
Distribution fees
The Trust has adopted a distribution plan for Class B and Class C shares of the Fund pursuant to Rule 12b-1 under the 1940 Act. Distribution fees are charged to Class B and Class C shares and paid to Wells Fargo Funds Distributor, LLC (“Funds Distributor”), the principal underwriter, at an annual rate of 0.75% of the average daily net assets of Class B and Class C shares.
In addition, Funds Distributor is entitled to receive the front-end sales charge from the purchase of Class A shares and a contingent deferred sales charge on the redemption of certain Class A shares. Funds Distributor is also entitled to receive the contingent deferred sales charges from redemptions of Class B and Class C shares. For the year ended September 30, 2017, Funds Distributor received $870 from the sale of Class A shares. No contingent deferred sales charges were incurred by Class A, Class B, and Class C shares for the year ended September 30, 2017.
Shareholder servicing fees
The Trust has entered into contracts with one or more shareholder servicing agents, whereby Class A, Class B, Class C, and Administrator Class of the Fund are charged a fee at an annual rate of 0.25% of the average daily net assets of each respective class.
A portion of these total shareholder servicing fees were paid to affiliates of Wells Fargo.
Interfund transactions
The Fund may purchase or sell portfolio investment securities to certain other Wells Fargo affiliates pursuant to Rule 17a-7 of the 1940 Act and under procedures adopted by the Board of Trustees. The procedures have been designed to ensure that these interfund transactions, which do not incur broker commissions, are effected at current market prices.
| | | | | | |
| Notes to financial statements | | Wells Fargo International Bond Fund | | | 29 | |
5. INVESTMENT PORTFOLIO TRANSACTIONS
Purchases and sales of investments, excluding short-term securities, for the year ended September 30, 2017 were as follows:
| | | | | | |
Purchases at cost | | Sales proceeds |
U.S.
government | | Non-U.S.
government | | U.S.
government | | Non-U.S.
government |
| $41,664,547 | | $352,145,475 | | $42,835,475 | | $426,133,839 |
6. DERIVATIVE TRANSACTIONS
During the year ended September 30, 2017, the Fund entered into forward foreign currency contracts for economic hedging purposes. The Fund had average contract amounts of $364,449,444 and $253,679,671 in forward foreign currency contracts to buy and forward foreign currency contracts to sell, respectively, during the year ended September 30, 2017.
The fair value, realized gains or losses and change in unrealized gains or losses, if any, on derivative instruments are reflected in the corresponding financial statement captions.
For certain types of derivative transactions, the Fund has entered into International Swaps and Derivatives Association, Inc. master agreements (“ISDA Master Agreements”) or similar agreements with approved counterparties. The ISDA Master Agreements or similar agreements may have requirements to deliver/deposit securities or cash to/with an exchange or broker-dealer as collateral and allows the Fund to offset, with each counterparty, certain derivative financial instrument’s assets and/or liabilities with collateral held or pledged. Collateral requirements differ by type of derivative. Collateral or margin requirements are set by the broker or exchange clearinghouse for exchange traded derivatives while collateral terms are contract specific for over-the-counter traded derivatives. Cash collateral that has been pledged to cover obligations of the Fund under ISDA Master Agreements or similar agreements, if any, are reported separately in the Statement of Assets and Liabilities. Securities pledged as collateral, if any, are noted in the Portfolio of Investments. With respect to balance sheet offsetting, absent an event of default by the counterparty or a termination of the agreement, the reported amounts of financial assets and financial liabilities in the Statement of Assets and Liabilities are not offset across transactions between the Fund and the applicable counterparty. A reconciliation of the gross amounts on the Statement of Assets and Liabilities to the net amounts by derivative type, including any collateral exposure, is as follows:
| | | | | | | | | | | | |
| Counterparty | | Gross amounts
of assets in the
Statement of
Assets and
Liabilities | | Amounts
subject to
netting
agreements | | Collateral
received | | | Net amount
of assets | |
State Street Bank | | $4,664,577* | | $(4,664,577) | | $ | 0 | | | $ | 0 | |
| | * | Amount represents net unrealized gains. | |
| | | | | | | | | | | | |
| Counterparty | | Gross amounts
of liabilities in the
Statement of
Assets and
Liabilities | | Amounts
subject to
netting
agreements | | Collateral
pledged | | | Net amount
of liabilities | |
State Street Bank | | $5,698,325** | | $(4,664,577) | | $ | 0 | | | $ | 1,033,748 | |
| | ** | Amount represents net unrealized losses. | |
7. BANK BORROWINGS
The Trust (excluding the money market funds and certain other funds) and Wells Fargo Variable Trust are parties to a $280,000,000 revolving credit agreement whereby the Fund is permitted to use bank borrowings for temporary or emergency purposes, such as to fund shareholder redemption requests. Interest under the credit agreement is charged to the Fund based on a borrowing rate equal to the higher of the Federal Funds rate in effect on that day plus 1.25% or the overnight LIBOR rate in effect on that day plus 1.25%. In addition, an annual commitment fee equal to 0.25% of the unused balance is allocated to each participating fund. Prior to August 29, 2017, the revolving credit agreement amount was $250,000,000.
For the year ended September 30, 2017, there were no borrowings by the Fund under the agreement.
| | | | |
| 30 | | Wells Fargo International Bond Fund | | Notes to financial statements |
8. DISTRIBUTIONS TO SHAREHOLDERS
The tax character of distributions paid during the years ended September 30, 2017 and September 30, 2016 were as follows:
| | | | | | | | | | | | |
| | | Year ended September 30 | | | Year ended
October 31, 2015 | |
| | | 2017 | | | 20161 | | |
Ordinary income | | $ | 758 | | | $ | 0 | | | $ | 10,043,689 | |
Long-term capital gain | | | 9,016,229 | | | | 5,967,498 | | | | 36 | |
| 1 | For the eleven months ended September 30, 2016. The Fund changed its fiscal year end from October 31 to September 30, effective September 30, 2016. |
As of September 30, 2017, the components of distributable earnings on a tax basis were as follows:
| | | | | | |
Unrealized gains | | Late-year ordinary losses deferred | | Post-October capital losses deferred | | Capital loss carryforward |
| $13,960,546 | | $(27,514,332) | | $(7,003,756) | | $(70,528) |
9. INDEMNIFICATION
Under the Trust’s organizational documents, the officers and Trustees have been granted certain indemnification rights against certain liabilities that may arise out of performance of their duties to the Trust. Additionally, in the normal course of business, the Trust may enter into contracts with service providers that contain a variety of indemnification clauses. The Trust’s maximum exposure under these arrangements is dependent on future claims that may be made against the Fund and, therefore, cannot be estimated.
| | | | | | |
| Report of independent registered public accounting firm | | Wells Fargo International Bond Fund | | | 31 | |
BOARD OF TRUSTEES AND SHAREHOLDERS OF WELLS FARGO FUNDS TRUST:
We have audited the accompanying statement of assets and liabilities, including the portfolio of investments, of the Wells Fargo International Bond Fund (the “Fund”), one of the funds constituting the Wells Fargo Funds Trust, as of September 30, 2017, and the related statement of operations for the year then ended, the statements of changes in net assets for the year then ended, for the period ended September 30, 2016, and for the year ended October 31, 2015, and the financial highlights for the year then ended, for the period ended September 30, 2016, and for each of the years or periods in the four-year period ended October 31, 2015. These financial statements and financial highlights are the responsibility of the Fund’s management. Our responsibility is to express an opinion on these financial statements and financial highlights based on our audits.
We conducted our audits in accordance with the standards of the Public Company Accounting Oversight Board (United States). Those standards require that we plan and perform the audit to obtain reasonable assurance about whether the financial statements and financial highlights are free of material misstatement. An audit includes examining, on a test basis, evidence supporting the amounts and disclosures in the financial statements. Our procedures included confirmation of securities owned as of September 30, 2017, by correspondence with the custodian and brokers, or by other appropriate auditing procedures. An audit also includes assessing the accounting principles used and significant estimates made by management, as well as evaluating the overall financial statement presentation. We believe that our audits provide a reasonable basis for our opinion.
In our opinion, the financial statements and financial highlights referred to above present fairly, in all material respects, the financial position of the Wells Fargo International Bond Fund as of September 30, 2017, the results of its operations for the year then ended, the changes in its net assets for the year then ended, for the period ended September 30, 2016, and for the year ended October 31, 2015, and the financial highlights for the year then ended, for the period ended September 30, 2016, and for each of the years or periods in the four-year period ended October 31, 2015, in conformity with U.S. generally accepted accounting principles.

Boston, Massachusetts
November 22, 2017
| | | | |
| 32 | | Wells Fargo International Bond Fund | | Other information (unaudited) |
TAX INFORMATION
Pursuant to Section 852 of the Internal Revenue Code, $9,016,229 was designated as a 20% rate gain distribution for the fiscal year ended September 30, 2017.
PROXY VOTING INFORMATION
A description of the policies and procedures that the Fund uses to determine how to vote proxies relating to portfolio securities is available, upon request, by calling 1-800-222-8222, visiting our website at wellsfargofunds.com, or visiting the SEC website at sec.gov. Information regarding how the Fund voted proxies relating to portfolio securities during the most recent 12-month period ended June 30 is available on the Fund’s website at wellsfargofunds.com or by visiting the SEC website at sec.gov.
PORTFOLIO HOLDINGS INFORMATION
The complete portfolio holdings for the Fund are publicly available monthly on the Fund’s website (wellsfargofunds.com), on a one-month delayed basis. In addition, top ten holdings information (excluding derivative positions) for the Fund is publicly available on the Fund’s website on a monthly, seven-day or more delayed basis. The Fund files its complete schedule of portfolio holdings with the SEC for the first and third quarters of each fiscal year on Form N-Q, which is available by visiting the SEC website at sec.gov. In addition, the Fund’s Form N-Q may be reviewed and copied at the SEC’s Public Reference Room in Washington, DC, and at regional offices in New York City, at 233 Broadway, and in Chicago, at 175 West Jackson Boulevard, Suite 900. Information about the Public Reference Room may be obtained by calling 1-800-SEC-0330.
| | | | | | |
| Other information (unaudited) | | Wells Fargo International Bond Fund | | | 33 | |
BOARD OF TRUSTEES AND OFFICERS
Each of the Trustees and Officers1 listed in the table below acts in identical capacities for each fund in the Wells Fargo family of funds, which consists of 152 mutual funds comprising the Wells Fargo Funds Trust, Wells Fargo Variable Trust, Wells Fargo Master Trust and four closed-end funds (collectively the “Fund Complex”). This table should be read in conjunction with the Prospectus and the Statement of Additional Information2. The mailing address of each Trustee and Officer is 525 Market Street, 12th Floor, San Francisco, CA 94105. Each Trustee and Officer serves an indefinite term, however, each Trustee serves such term until reaching the mandatory retirement age established by the Trustees.
Independent Trustees
| | | | | | |
Name and year of birth | | Position held and length of service* | | Principal occupations during past five years or longer | | Current other public company or investment company directorships |
William R. Ebsworth (Born 1957) | | Trustee, since 2015 | | Retired. From 1984 to 2013, equities analyst, portfolio manager, research director and chief investment officer at Fidelity Management and Research Company in Boston, Tokyo, and Hong Kong and retired in 2013 as Chief Investment Officer of Fidelity Strategic Advisers, Inc. where he led a team of investment professionals managing client assets. Prior thereto, Board member of Hong Kong Securities Clearing Co., Hong Kong Options Clearing Corp., the Thailand International Fund, Ltd., Fidelity Investments Life Insurance Company, and Empire Fidelity Investments Life Insurance Company. Board member of the Forté Foundation (non-profit organization) and the Vincent Memorial Hospital Endowment (non-profit organization), where he serves on the Investment Committee and as a Chair of the Audit Committee. Mr. Ebsworth is a CFA® charterholder. | | Asset Allocation Trust |
Jane A. Freeman (Born 1953) | | Trustee, since 2015 | | Retired. From 2012 to 2014 and 1999 to 2008, Chief Financial Officer of Scientific Learning Corporation. From 2008 to 2012, Ms. Freeman provided consulting services related to strategic business projects. Prior to 1999, Portfolio Manager at Rockefeller & Co. and Scudder, Stevens & Clark. Board member of the Harding Loevner Funds from 1996 to 2014, serving as both Lead Independent Director and chair of the Audit Committee. Board member of the Russell Exchange Traded Funds Trust from 2011 to 2012 and the chair of the Audit Committee. Ms. Freeman is a Board Member of Ruth Bancroft Garden (non-profit organization) and an inactive chartered financial analyst. | | Asset Allocation Trust |
Peter G. Gordon** (Born 1942) | | Trustee, since 1998; Chairman, since 2005 | | Co-Founder, Retired Chairman, President and CEO of Crystal Geyser Water Company. Trustee Emeritus, Colby College. | | Asset Allocation Trust |
Isaiah Harris, Jr. (Born 1952) | | Trustee, since 2009 | | Retired. Chairman of the Board of CIGNA Corporation since 2009, and Director since 2005. From 2003 to 2011, Director of Deluxe Corporation. Prior thereto, President and CEO of BellSouth Advertising and Publishing Corp. from 2005 to 2007, President and CEO of BellSouth Enterprises from 2004 to 2005 and President of BellSouth Consumer Services from 2000 to 2003. Emeritus member of the Iowa State University Foundation Board of Governors. Emeritus Member of the Advisory Board of Iowa State University School of Business. Advisory Board Member, Palm Harbor Academy (charter school). Advisory Board Member, Child Evangelism Fellowship (non-profit). Mr. Harris is a certified public accountant (inactive status). | | CIGNA Corporation; Asset Allocation Trust |
Judith M. Johnson (Born 1949) | | Trustee, since 2008; Audit Committee Chairman, since 2008 | | Retired. Prior thereto, Chief Executive Officer and Chief Investment Officer of Minneapolis Employees Retirement Fund from 1996 to 2008. Ms. Johnson is an attorney, certified public accountant and a certified managerial accountant. | | Asset Allocation Trust |
David F. Larcker (Born 1950) | | Trustee, since 2009 | | James Irvin Miller Professor of Accounting at the Graduate School of Business, Stanford University, Director of the Corporate Governance Research Initiative and Senior Faculty of The Rock Center for Corporate Governance since 2006. From 2005 to 2008, Professor of Accounting at the Graduate School of Business, Stanford University. Prior thereto, Ernst & Young Professor of Accounting at The Wharton School, University of Pennsylvania from 1985 to 2005. | | Asset Allocation Trust |
| | | | |
| 34 | | Wells Fargo International Bond Fund | | Other information (unaudited) |
| | | | | | |
Name and year of birth | | Position held and length of service* | | Principal occupations during past five years or longer | | Current other public company or investment company directorships |
Olivia S. Mitchell (Born 1953) | | Trustee, since 2006 | | International Foundation of Employee Benefit Plans Professor, Wharton School of the University of Pennsylvania since 1993. Director of Wharton’s Pension Research Council and Boettner Center on Pensions & Retirement Research, and Research Associate at the National Bureau of Economic Research. Previously, Cornell University Professor from 1978 to 1993. | | Asset Allocation Trust |
Timothy J. Penny (Born 1951) | | Trustee, since 1996: Vice Chairman, since 2017 | | President and Chief Executive Officer of Southern Minnesota Initiative Foundation, a non-profit organization, since 2007 and Senior Fellow at the Humphrey Institute Policy Forum at the University of Minnesota since 1995. Member of the Board of Trustees of NorthStar Education Finance, Inc., a non-profit organization, since 2007. | | Asset Allocation Trust |
Michael S. Scofield (Born 1943) | | Trustee, since 2010 | | Served on the Investment Company Institute’s Board of Governors and Executive Committee from 2008-2011 as well the Governing Council of the Independent Directors Council from 2006-2011 and the Independent Directors Council Executive Committee from 2008-2011. Chairman of the IDC from 2008-2010. Trustee of the Evergreen Funds complex (and its predecessors) from 1984 to 2010. Chairman of the Evergreen Funds from 2000-2010. Former Trustee of the Mentor Funds. Retired Attorney, Law Offices of Michael S. Scofield. | | Asset Allocation Trust |
| * | Length of service dates reflect the Trustee’s commencement of service with the Trust’s predecessor entities, where applicable. |
| ** | Peter Gordon is expected to retire on December 31, 2017. |
Advisory Board Members
| | | | | | |
Name and year of birth | | Position held and length of service | | Principal occupations during past five years or longer | | Current other public company or investment company directorships |
James G. Polisson (Born 1959) | | Advisory Board Member, since 2017 | | Retired. Chief Marketing Officer, Source (ETF) UK Services, Ltd, from 2015 to 2017. From 2012 to 2015, Principal of The Polisson Group, LLC, a management consulting, corporate advisory and principal investing company. Chief Executive Officer and Managing Director at Russell Investments, Global Exchange Traded Funds from 2010 to 2012. Managing Director of Barclays Global Investors from 1998 to 2010 and Global Chief Marketing Officer for iShares and Barclays Global Investors from 2000 to 2010. Prior thereto, Vice President, Fidelity Retail Mutual Fund Group from 1996 to 1998 and Risk Management Practice Manager, Fidelity Consulting from 1995 to 1996. Board member of the Russell Exchange Traded Fund Trust from 2011 to 2012. Director of Barclays Global Investors Holdings Deutschland GmbH from 2006 to 2009. Mr. Polisson is an attorney and has a retired status with the Massachusetts and District of Columbia Bar Associations. | | None |
Pamela Wheelock (Born 1959) | | Advisory Board Member, since 2017 | | Chief Operating Officer, Twin Cities Habitat for Humanity, since January, 2017. Vice President of University Services, University of Minnesota from 2012 to 2017. Prior thereto, Interim President and Chief Executive Officer of Blue Cross Blue Shield of Minnesota from 2010 to 2011, Chairman of the Board from 2009 to 2011 and Board Director from 2003 to 2015. Vice President, Leadership and Community Engagement, Bush Foundation, Saint Paul, Minnesota (a private foundation) from 2009 to 2011. Executive Vice President and Chief Financial Officer, Minnesota Sports and Entertainment from 2004 to 2009 and Senior Vice President from 2002 to 2004. Commissioner of Finance, State of Minnesota, from 1999 to 2002. Currently on the Board of Directors, Governance Committee and Finance Committee, for the Minnesota Philanthropy Partners (Saint Paul Foundation) since 2012 and Board Chair of the Minnesota Wild Foundation since 2010. | | None |
| | | | | | |
| Other information (unaudited) | | Wells Fargo International Bond Fund | | | 35 | |
Officers
| | | | | | |
Name and year of birth | | Position held and length of service | | Principal occupations during past five years or longer | | |
Andrew Owen (Born 1960) | | President, since 2017 | | Executive Vice President of Wells Fargo & Company and Head of Affiliated Managers, Wells Fargo Asset Management, since 2014. In addition, Mr. Owen is currently President, Chief Executive Officer and Director of Wells Fargo Funds Management, LLC since 2017. Prior thereto, Executive Vice President responsible for marketing, investments and product development for Wells Fargo Funds Management, LLC, from 2009 to 2014. | | |
Nancy Wiser1 (Born 1967) | | Treasurer, since 2012 | | Executive Vice President of Wells Fargo Funds Management, LLC since 2011. Chief Operating Officer and Chief Compliance Officer at LightBox Capital Management LLC, from 2008 to 2011. | | |
C. David Messman (Born 1960) | | Secretary, since 2000; Chief Legal Officer, since 2003 | | Senior Vice President and Secretary of Wells Fargo Funds Management, LLC since 2001. Assistant General Counsel of Wells Fargo Bank, N.A. since 2013 and Vice President and Managing Counsel of Wells Fargo Bank, N.A. from 1996 to 2013. | | |
Michael H. Whitaker (Born 1967) | | Chief Compliance Officer, since 2016 | | Senior Vice President and Chief Compliance Officer since 2016. Senior Vice President and Chief Compliance Officer for Fidelity Investments from 2007 to 2016. | | |
David Berardi (Born 1975) | | Assistant Treasurer, since 2009 | | Vice President of Wells Fargo Funds Management, LLC since 2009. Vice President of Evergreen Investment Management Company, LLC from 2008 to 2010. Manager of Fund Reporting and Control for Evergreen Investment Management Company, LLC from 2004 to 2010. | | |
Jeremy DePalma1 (Born 1974) | | Assistant Treasurer, since 2009 | | Senior Vice President of Wells Fargo Funds Management, LLC since 2009. Senior Vice President of Evergreen Investment Management Company, LLC from 2008 to 2010 and head of the Fund Reporting and Control Team within Fund Administration from 2005 to 2010. | | |
| 1 | Nancy Wiser acts as Treasurer of 76 funds in the Fund Complex. Jeremy DePalma acts as Treasurer of 76 funds and Assistant Treasurer of 76 funds in the Fund Complex. |
| 2 | The Statement of Additional Information includes additional information about the Trustees and is available, without charge, upon request, by calling 1-800-222-8222 or by visiting the website at wellsfargofunds.com. |
| | | | |
| 36 | | Wells Fargo International Bond Fund | | Other information (unaudited) |
BOARD CONSIDERATION OF INVESTMENT MANAGEMENT AND SUB-ADVISORY AGREEMENTS:
Under the Investment Company Act of 1940 (the “1940 Act”), the Board of Trustees (the “Board”) of Wells Fargo Funds Trust (the “Trust”) must determine annually whether to approve the continuation of the Trust’s investment management and sub-advisory agreements. In this regard, at an in-person meeting held on May 16-17, 2017 (the “Meeting”), the Board, all the members of which have no direct or indirect interest in the investment management and sub-advisory agreements and are not “interested persons” of the Trust, as defined in the 1940 Act (the “Independent Trustees”), reviewed and approved for Wells Fargo International Bond Fund (the “Fund”): (i) an investment management agreement (the “Management Agreement”) with Wells Fargo Funds Management, LLC (“Funds Management”); and (ii) an investment sub-advisory agreement (the “Sub-Advisory Agreement”) with First International Advisors, LLC (the “Sub-Adviser”), an affiliate of Funds Management. The Management Agreement and the Sub-Advisory Agreement are collectively referred to as the “Advisory Agreements.”
At the Meeting, the Board considered the factors and reached the conclusions described below relating to the selection of Funds Management and the Sub-Adviser and the approval of the Advisory Agreements. Prior to the Meeting, including at an in-person meeting in April 2017, the Trustees conferred extensively among themselves and with representatives of Funds Management about these matters. Also, the Board has adopted a team-based approach, with each team consisting of a sub-set of Trustees, to assist the full Board in the discharge of its duties in reviewing performance and other matters throughout the year. The Independent Trustees were assisted in their evaluation of the Advisory Agreements by independent legal counsel, from whom they received separate legal advice and with whom they met separately.
In providing information to the Board, Funds Management and the Sub-Adviser were guided by a detailed set of requests for information submitted to them by independent legal counsel on behalf of the Independent Trustees at the start of the Board’s annual contract renewal process earlier in 2017. In considering and approving the Advisory Agreements, the Trustees considered the information they believed relevant, including but not limited to the information discussed below. The Board considered not only the specific information presented in connection with the Meeting, but also the knowledge gained over time through interaction with Funds Management and the Sub-Adviser about various topics. In this regard, the Board reviewed reports of Funds Management at each of its quarterly meetings, which included, among other things, portfolio reviews and performance reports. In addition, the Board and the teams mentioned above confer with portfolio managers at various times throughout the year. The Board did not identify any particular information or consideration that was all-important or controlling, and each individual Trustee may have attributed different weights to various factors.
After its deliberations, the Board unanimously approved the continuation of the Advisory Agreements for a one-year term and determined that the compensation payable to Funds Management and the Sub-Adviser under each of the Advisory Agreements was reasonable. The Board considered the approval of the Advisory Agreements for the Fund as part of its consideration of agreements for funds across the complex, but its approvals were made on a fund-by-fund basis. The following summarizes a number of important, but not necessarily all, factors considered by the Board in support of its approvals.
Nature, extent and quality of services
The Board received and considered various information regarding the nature, extent and quality of services provided to the Fund by Funds Management and the Sub-Adviser under the Advisory Agreements. This information included a description of the investment advisory services and Fund-level administrative services covered by the Management Agreement, as well as, among other things, a summary of the background and experience of senior management of Funds Management, a summary of certain organizational and personnel changes involving Funds Management and the Sub-Adviser, and a description of Funds Management’s and the Sub-Adviser’s business continuity planning programs and of their approaches to data privacy and cybersecurity. The Board also considered the qualifications, background, tenure and responsibilities of each of the portfolio managers primarily responsible for the day-to-day portfolio management of the Fund.
The Board evaluated the ability of Funds Management and the Sub-Adviser to attract and retain qualified investment professionals, including research, advisory and supervisory personnel. The Board further considered the compliance programs and compliance records of Funds Management and the Sub-Adviser. In addition, the Board took into account the full range of services provided to the Fund by Funds Management and its affiliates.
Fund performance and expenses
The Board considered the performance results for the Fund over various time periods ended December 31, 2016. The Board considered these results in comparison to the performance of funds in a universe that was determined by Broadridge Inc.
| | | | | | |
| Other information (unaudited) | | Wells Fargo International Bond Fund | | | 37 | |
(“Broadridge”) to be similar to the Fund (the “Universe”), and in comparison to the Fund’s benchmark index and to other comparative data. Broadridge is an independent provider of investment company data. The Board received a description of the methodology used by Broadridge to select the mutual funds in the performance Universe. The Board noted that the performance of the Fund (Class A) was lower than the average performance of the Universe for all periods under review. The Board also noted that the performance of the Fund was higher than its benchmark, the Bloomberg Barclays Global Aggregate ex USD Index, for the ten-year period under review, but lower than its benchmark for the one-, three- and five-year periods under review.
The Board received information concerning, and discussed factors contributing to, the underperformance of the Fund relative to the Universe and benchmark for the periods identified above. The Board took note of the explanations for the relative underperformance during these periods, including with respect to investment decisions and market factors that affected the Fund’s performance.
The Board also received and considered information regarding the Fund’s net operating expense ratios and their various components, including actual management fees, custodian and other non-management fees, and Rule 12b-1 and non-Rule 12b-1 shareholder service fees. The Board considered these ratios in comparison to the median ratios of funds in class-specific expense groups that were determined by Broadridge to be similar to the Fund (the “Groups”). The Board received a description of the methodology used by Broadridge to select the mutual funds in the expense Groups and an explanation of how funds comprising expense groups and their expense ratios may vary from year-to-year. Based on the Broadridge reports, the Board noted that the net operating expense ratios of the Fund were lower than or in range of the median net operating expense ratios of the expense Groups for all share classes.
The Board took into account the Fund performance and expense information provided to it among the factors considered in deciding to re-approve the Advisory Agreements.
Investment management and sub-advisory fee rates
The Board reviewed and considered the contractual fee rates payable by the Fund to Funds Management under the Management Agreement, as well as the contractual fee rates payable by the Fund to Funds Management for class-level administrative services under a Class-Level Administration Agreement, which include, among other things, class-level transfer agency and sub-transfer agency costs (collectively, the “Management Rates”). The Board also reviewed and considered the contractual investment sub-advisory fee rates that are payable by Funds Management to the Sub-Adviser for investment sub-advisory services.
Among other information reviewed by the Board was a comparison of the Fund’s Management Rates with the average contractual investment management fee rates of funds in the expense Groups at a common asset level as well as transfer agency costs of the funds in the expense Groups. The Board noted that the Management Rates of the Fund were lower than the sum of these average rates for the Fund’s expense Groups for all share classes.
The Board also received and considered information about the portion of the total management fee that was retained by Funds Management after payment of the fee to the Sub-Adviser for sub-advisory services. In assessing the reasonableness of this amount, the Board received and evaluated information about the nature and extent of responsibilities retained and risks assumed by Funds Management and not delegated to or assumed by the Sub-Adviser, and about Funds Management’s on-going oversight services. Given the affiliation between Funds Management and the Sub-Adviser, the Board ascribed limited relevance to the allocation of fees between them.
The Board also received and considered information about the nature and extent of services offered and fee rates charged by Funds Management and the Sub-Adviser to other types of clients with investment strategies similar to those of the Fund. In this regard, the Board received information about the significantly greater scope of services, and compliance, reporting and other legal burdens and risks of managing mutual funds compared with those associated with managing assets of non-mutual fund clients such as institutional separate accounts.
Based on its consideration of the factors and information it deemed relevant, including those described here, the Board determined that the compensation payable to Funds Management under the Management Agreement and to the Sub-Adviser under the Sub-Advisory Agreement was reasonable.
Profitability
The Board received and considered information concerning the profitability of Funds Management, as well as the profitability of Wells Fargo as a whole, from providing services to the Fund and the fund family as a whole. The Board also received and considered information concerning the profitability of the Sub-Adviser from providing services to the fund family as a whole, noting that the Sub-Adviser’s profitability information with respect to providing services to the Fund was subsumed in the Wells Fargo and Funds Management profitability analysis.
| | | | |
| 38 | | Wells Fargo International Bond Fund | | Other information (unaudited) |
Funds Management reported on the methodologies and estimates used in calculating profitability, including a description of the methodology used to allocate certain expenses. Among other things, the Board noted that the levels of profitability reported on a fund-by-fund basis varied widely, depending on factors such as the size and type of fund. Based on its review, the Board did not deem the profits reported by Funds Management or Wells Fargo from its services to the Fund to be at a level that would prevent it from approving the continuation of the Advisory Agreements.
Economies of scale
With respect to possible economies of scale, the Board noted the existence of breakpoints in the Fund’s management fee structure, which operate generally to reduce the Fund’s expense ratios as the Fund grows in size. It considered that, for a small fund or a fund that shrinks in size, breakpoints conversely can result in higher fee levels. The Board also considered that in addition to management fee breakpoints, competitive management fee rates set at the outset without regard to breakpoints and fee waiver and expense reimbursement arrangements are means of sharing potential economies of scale with shareholders of the Fund. The Board considered Funds Management’s view, which Funds Management indicated was supported by independent third-party industry studies which were summarized for the Board, that any analyses of potential economies of scale in managing a particular fund are inherently limited in light of the joint and common costs and investments that Funds Management incurs across the fund family as a whole.
The Board concluded that the Fund’s fee and expense arrangements, including contractual breakpoints, constituted a reasonable approach to sharing potential economies of scale with the Fund and its shareholders.
Other benefits to Funds Management and the Sub-Adviser
The Board received and considered information regarding potential “fall-out” or ancillary benefits received by Funds Management and its affiliates, including the Sub-Adviser, as a result of their relationships with the Fund. Ancillary benefits could include, among others, benefits directly attributable to other relationships with the Fund and benefits potentially derived from an increase in Funds Management’s and the Sub-Adviser’s business as a result of their relationships with the Fund. The Board noted that various affiliates of Funds Management may receive distribution-related fees, shareholder servicing payments and sub-transfer agency fees in respect of shares sold or held through them and services provided.
The Board also reviewed information about soft dollar credits earned and utilized by the Sub-Adviser, fees earned by Funds Management from managing a private investment vehicle for the fund family’s securities lending collateral and commissions earned by an affiliated broker from portfolio transactions.
Based on its consideration of the factors and information it deemed relevant, including those described here, the Board did not find that any ancillary benefits received by Funds Management and its affiliates, including the Sub-Adviser, were unreasonable.
Conclusion
At the Meeting, after considering the above-described factors and based on its deliberations and its evaluation of the information described above, the Board unanimously approved the continuation of the Advisory Agreements for a one-year term and determined that the compensation payable to Funds Management and the Sub-Adviser under each of the Advisory Agreements was reasonable.
| | | | | | |
| List of abbreviations | | Wells Fargo International Bond Fund | | | 39 | |
The following is a list of common abbreviations for terms and entities that may have appeared in this report.
| ACA | — ACA Financial Guaranty Corporation |
| ADR | — American depositary receipt |
| ADS | — American depositary shares |
| AGC | — Assured Guaranty Corporation |
| AGM | — Assured Guaranty Municipal |
| Ambac | — Ambac Financial Group Incorporated |
| AMT | — Alternative minimum tax |
| BAN | — Bond anticipation notes |
| BHAC | — Berkshire Hathaway Assurance Corporation |
| CAB | — Capital appreciation bond |
| CCAB | — Convertible capital appreciation bond |
| CDA | — Community Development Authority |
| CDO | — Collateralized debt obligation |
| CLO | — Collateralized loan obligation |
| DRIVER | — Derivative inverse tax-exempt receipts |
| DW&P | — Department of Water & Power |
| DWR | — Department of Water Resources |
| ECFA | — Educational & Cultural Facilities Authority |
| EDA | — Economic Development Authority |
| EDFA | — Economic Development Finance Authority |
| ETF | — Exchange-traded fund |
| FDIC | — Federal Deposit Insurance Corporation |
| FFCB | — Federal Farm Credit Banks |
| FGIC | — Financial Guaranty Insurance Corporation |
| FHA | — Federal Housing Administration |
| FHLB | — Federal Home Loan Bank |
| FHLMC | — Federal Home Loan Mortgage Corporation |
| FICO | — The Financing Corporation |
| FNMA | — Federal National Mortgage Association |
| GDR | — Global depositary receipt |
| GNMA | — Government National Mortgage Association |
| HCFR | — Healthcare facilities revenue |
| HEFA | — Health & Educational Facilities Authority |
| HEFAR | — Higher education facilities authority revenue |
| HFA | — Housing Finance Authority |
| HFFA | — Health Facilities Financing Authority |
| HUD | — Department of Housing and Urban Development |
| IDA | — Industrial Development Authority |
| IDAG | — Industrial Development Agency |
| KRW | — Republic of Korea won |
| LIBOR | — London Interbank Offered Rate |
| LIFER | — Long Inverse Floating Exempt Receipts |
| LLC | — Limited liability company |
| LLLP | — Limited liability limited partnership |
| LLP | — Limited liability partnership |
| MBIA | — Municipal Bond Insurance Association |
| MFHR | — Multifamily housing revenue |
| MSTR | — Municipal securities trust receipts |
| MUD | — Municipal Utility District |
| National | — National Public Finance Guarantee Corporation |
| PCFA | — Pollution Control Financing Authority |
| PCL | — Public Company Limited |
| PCR | — Pollution control revenue |
| PFA | — Public Finance Authority |
| PFFA | — Public Facilities Financing Authority |
| PFOTER | — Puttable floating option tax-exempt receipts |
| PJSC | — Public Joint Stock Company |
| plc | — Public limited company |
| PUTTER | — Puttable tax-exempt receipts |
| R&D | — Research & development |
| Radian | — Radian Asset Assurance |
| RAN | — Revenue anticipation notes |
| RDA | — Redevelopment Authority |
| RDFA | — Redevelopment Finance Authority |
| REIT | — Real estate investment trust |
| ROC | — Reset option certificates |
| SAVRS | — Select auction variable rate securities |
| SBA | — Small Business Authority |
| SDR | — Swedish depositary receipt |
| SFHR | — Single-family housing revenue |
| SFMR | — Single-family mortgage revenue |
| SPA | — Standby purchase agreement |
| SPDR | — Standard & Poor’s Depositary Receipts |
| SPEAR | — Short Puttable Exempt Adjustable Receipts |
| STRIPS | — Separate trading of registered interest and |
| TAN | — Tax anticipation notes |
| TIPS | — Treasury inflation-protected securities |
| TRAN | — Tax revenue anticipation notes |
| TTFA | — Transportation Trust Fund Authority |
| TVA | — Tennessee Valley Authority |
This page is intentionally left blank.

For more information
More information about Wells Fargo Funds is available free upon request. To obtain literature, please write, email, visit the Fund’s website, or call:
Wells Fargo Funds
P.O. Box 8266
Boston, MA 02266-8266
Email: fundservice@wellsfargo.com
Website: wellsfargofunds.com
Individual investors: 1-800-222-8222
Retail investment professionals: 1-888-877-9275
Institutional investment professionals: 1-866-765-0778
This report and the financial statements contained herein are submitted for the general information of the shareholders of the Fund. If this report is used for promotional purposes, distribution of the report must be accompanied or preceded by a current prospectus. Before investing, please consider the investment objectives, risks, charges, and expenses of the investment. For a current prospectus and, if available, a summary prospectus, containing this information, call 1-800-222-8222 or visit the Fund’s website at wellsfargofunds.com. Read the prospectus carefully before you invest or send money.
Wells Fargo Asset Management (WFAM) is a trade name used by the asset management businesses of Wells Fargo & Company. Wells Fargo Funds Management, LLC, a wholly owned subsidiary of Wells Fargo & Company, provides investment advisory and administrative services for Wells Fargo Funds. Other affiliates of Wells Fargo & Company provide subadvisory and other services for the funds. The funds are distributed by Wells Fargo Funds Distributor, LLC, Member FINRA, an affiliate of Wells Fargo & Company. Neither Wells Fargo Funds Distributor nor Wells Fargo Funds Management holds fund shareholder accounts or assets. This material is for general informational and educational purposes only and is NOT intended to provide investment advice or a recommendation of any kind—including a recommendation for any specific investment, strategy, or plan.
NOT FDIC INSURED ◾ NO BANK GUARANTEE ◾ MAY LOSE VALUE
© 2017 Wells Fargo Funds Management, LLC. All rights reserved.
| | |
 | | 306432 11-17 A235/AR235 09-17 |
Annual Report
September 30, 2017

Wells Fargo Strategic Income Fund


Reduce clutter. Save trees.
Sign up for electronic delivery of prospectuses and shareholder reports at wellsfargo.com/advantagedelivery
Contents
The views expressed and any forward-looking statements are as of September 30, 2017, unless otherwise noted, and are those of the Fund managers and/or Wells Fargo Funds Management, LLC. Discussions of individual securities, or the markets generally, or any Wells Fargo Fund are not intended as individual recommendations. Future events or results may vary significantly from those expressed in any forward-looking statements. The views expressed are subject to change at any time in response to changing circumstances in the market. Wells Fargo Funds Management, LLC and the Fund disclaim any obligation to publicly update or revise any views expressed or forward-looking statements.
NOT FDIC INSURED ◾ NO BANK GUARANTEE ◾ MAY LOSE VALUE
| | | | |
| 2 | | Wells Fargo Strategic Income Fund | | Letter to shareholders (unaudited) |

Andrew Owen
President
Wells Fargo Funds
Favorable economic news supported stocks, and interest rates moved higher.
Hiring remained strong, and business and consumer sentiment improved.
Dear Shareholder:
We are pleased to offer you this annual report for the Wells Fargo Strategic Income Fund for the 12-month period that ended September 30, 2017. Despite heightened market volatility at times, global stocks generally delivered double-digit results and bond markets had smaller but positive results as well. U.S. and international stocks returned 18.61% and 19.61%, respectively, for the 12-month period, as measured by the S&P 500 Index1 and the MSCI ACWI ex USA Index (Net),2 respectively; within fixed income, the Bloomberg Barclays U.S. Aggregate Bond Index3 returned 0.07% and the Bloomberg Barclays Municipal Bond Index4 returned 0.87% as interest rates rose from low levels.
Election results and central banks’ policies commanded investor attention as 2016 closed.
During the fourth quarter of 2016, investors appeared intent on the prospective outcomes of elections in the U.S. and central-bank actions globally. Following Donald Trump’s election victory, U.S. stocks rallied. Investors appeared optimistic that the new administration would pursue progrowth policies. Favorable economic news supported stocks, and interest rates moved higher. At their mid-December meeting, U.S. Federal Reserve (Fed) officials raised the target interest rate by a quarter percentage point to a range of 0.50% to 0.75%. The fourth quarter also saw the implementation of the U.S. Securities and Exchange Commission’s new rules for money market funds, which included floating net asset values (NAVs) as well as the possibility of liquidity fees and redemption gates for institutional prime and municipal money market funds. In the year leading up to money market fund reform implementation, nearly $1 trillion in assets moved from money market funds subject to floating NAVs into government money market funds, which continued to transact at a stable $1.00 NAV. Outside of the U.S., the prospects for faster U.S. growth appeared to trigger some acceleration in Europe.
Financial markets gained during the first two quarters of 2017 on positive economic data.
Stocks rallied globally through the first quarter of 2017, supported by signs of improvement in the U.S. and global economies. U.S. economic data released during the quarter reflected a healthy economy. Hiring remained strong, and business and consumer sentiment improved. In March, Fed officials raised their target interest rate by a quarter percentage point to a range of 0.75% to 1.00%. With the Fed’s target interest-rate increase, short-term bond yields rose during the quarter. Meanwhile, longer-term Treasury yields were little changed, leading to positive performance. Investment-grade and high-yield bonds benefited from strong demand. Municipal bond returns were positive in the quarter, helped by strong demand and constrained new-issue supply. Outside of the U.S., stocks in emerging markets generally outperformed stocks in the U.S. and international
| 1 | The S&P 500 Index consists of 500 stocks chosen for market size, liquidity, and industry group representation. It is a market-value-weighted index with each stock’s weight in the index proportionate to its market value. You cannot invest directly in an index. |
| 2 | The Morgan Stanley Capital International (MSCI) All Country World Index (ACWI) ex USA Index (Net) is a free-float-adjusted market-capitalization-weighted index that is designed to measure the equity market performance of developed markets, excluding the United States and Canada. Source: MSCI. MSCI makes no express or implied warranties or representations and shall have no liability whatsoever with respect to any MSCI data contained herein. The MSCI data may not be further redistributed or used as a basis for other indexes or any securities or financial products. This report is not approved, reviewed, or produced by MSCI. You cannot invest directly in an index. |
| 3 | The Bloomberg Barclays U.S. Aggregate Bond Index is a broad-based benchmark that measures the investment-grade, U.S. dollar-denominated, fixed-rate taxable bond market, including Treasuries, government-related and corporate securities, mortgage-backed securities (agency fixed-rate and hybrid adjustable-rate mortgage pass-throughs), asset-backed securities, and commercial mortgage-backed securities. You cannot invest directly in an index. |
| 4 | The Bloomberg Barclays Municipal Bond Index is an unmanaged index composed of long-term tax-exempt bonds with a minimum credit rating of Baa. You cannot invest directly in an index. |
| | | | | | |
| Letter to shareholders (unaudited) | | Wells Fargo Strategic Income Fund | | | 3 | |
developed markets because they benefited from both global economic growth and recent weakening in the U.S. dollar. Stocks in Asia, Europe, and Latin America also outperformed the U.S. market during the quarter.
Globally, stocks marked continued gains through the second quarter of 2017. Steady, albeit modest, economic growth both in the U.S. and abroad and generally favorable corporate earnings announcements supported higher valuations. U.S. inflation trended lower despite a continued decline in the unemployment rate. Ten-year U.S. Treasury yields declined, resulting in stronger prices for long-term bonds. As was widely expected, the Fed raised the target interest rate in June by a quarter percentage point to a range of 1.00% to 1.25%. In addition, the Fed indicated that it would begin to sell bonds accumulated on its balance sheet during quantitative easing programs conducted since 2008. Later in the third quarter, the Fed confirmed that the initiative to reduce the bonds that it holds likely would begin in October.
Volatility increased during the third quarter of 2017.
Early in July and again in August, volatility expectations increased and then receded—as measured by the CBOE VIX5—amid geopolitical tensions, particularly in Asia, and declining investor optimism following unsuccessful efforts to reform health care laws in the U.S. which suggested to some that President Trump and Congress would be unable to move forward with tax and regulatory reforms.
During the quarter, economic momentum increased in Europe; the European Central Bank held its rates steady at low levels and continued its quantitative easing bond-buying program, which is intended to spark economic activity. The Bank of England suggested it could hike interest rates in November, and the pound gained against other currencies. The Bank of Japan also maintained accommodative policies intended to support business activity and economic growth. In Germany, Angela Merkel was reelected chancellor; in Japan, Prime Minister Shinzo Abe called for snap elections as his popularity increased after North Korea’s aggressive program of missile launches. Both political developments were indicative of the type of political consistency in developed markets that reassure financial markets.
In emerging markets, many countries benefited from stronger currencies versus the U.S. dollar. In addition, commodity prices were on an upward trajectory, which benefited many companies that rely on natural resources for exports.
As the quarter closed, optimism returned as economic growth continued. The second-quarter gross domestic product measure was revised higher from 2.6% annualized to 3.0%. Consumer spending and residential and nonresidential investment increased. While inflation continued to trail the Fed’s targets, expectations remained for an additional short-term interest-rate hike before year-end.
| 5 | The Chicago Board Options Exchange Market Volatility Index (CBOE VIX) is a popular measure of the implied volatility of S&P 500 Index options. It represents one measure of the market’s expectation of stock market volatility over the next 30-day period. You cannot invest directly in an index. |
| | | | |
| 4 | | Wells Fargo Strategic Income Fund | | Letter to shareholders (unaudited) |
Don’t let short-term uncertainty derail long-term investment goals.
Periods of investment uncertainty can present challenges, but experience has taught us that maintaining long-term investment goals can be an effective way to plan for the future. To help you create a sound strategy based on your personal goals and risk tolerance, Wells Fargo Funds offers more than 100 mutual funds spanning a wide range of asset classes and investment styles. Although diversification cannot guarantee an investment profit or prevent losses, we believe it can be an effective way to manage investment risk and potentially smooth out overall portfolio performance. We encourage investors to know their investments and to understand that appropriate levels of risk-taking may unlock opportunities.
Thank you for choosing to invest with Wells Fargo Funds. We appreciate your confidence in us and remain committed to helping you meet your financial needs.
Sincerely,

Andrew Owen
President
Wells Fargo Funds
For further information about your Fund, contact your investment professional, visit our website at wellsfargofunds.com, or call us directly at 1-800-222-8222. We are available 24 hours a day, 7 days a week.
This page is intentionally left blank.
| | | | |
| 6 | | Wells Fargo Strategic Income Fund | | Performance highlights (unaudited) |
Investment objective
The Fund seeks total return, consisting of a high level of current income and capital appreciation.
Manager
Wells Fargo Funds Management, LLC
Subadvisers
First International Advisors, LLC
Wells Capital Management Incorporated
Portfolio managers
Niklas Nordenfelt, CFA®
Tony Norris
Alex Perrin
Thomas M. Price, CFA®
Scott M. Smith, CFA®
Noah Wise, CFA®
Average annual total returns (%) as of September 30, 2017
| | | | | | | | | | | | | | | | | | | | | | | | | | |
| | | | | Including sales charge | | | Excluding sales charge | | | Expense ratios1 (%) | |
| | | Inception date | | 1 year | | | Since
inception | | | 1 year | | | Since
inception | | | Gross | | | Net2 | |
| Class A (WSIAX) | | 1-31-2013 | | | 1.76 | | | | 0.81 | | | | 6.05 | | | | 1.70 | | | | 1.80 | | | | 0.91 | |
| Class C (WSICX) | | 1-31-2013 | | | 4.20 | | | | 0.93 | | | | 5.20 | | | | 0.93 | | | | 2.55 | | | | 1.66 | |
| Administrator Class (WSIDX) | | 1-31-2013 | | | – | | | | – | | | | 5.91 | | | | 1.80 | | | | 1.74 | | | | 0.76 | |
| Institutional Class (WSINX) | | 1-31-2013 | | | – | | | | – | | | | 6.43 | | | | 2.00 | | | | 1.47 | | | | 0.61 | |
| Bloomberg Barclays U.S. Universal Bond Index3 | | – | | | – | | | | – | | | | 0.96 | | | | 2.70 | | | | – | | | | – | |
| ICE BofAML 3-Month LIBOR Constant Maturity Index4 | | – | | | – | | | | – | | | | 1.03 | | | | 0.47 | | | | – | | | | – | |
Figures quoted represent past performance, which is no guarantee of future results, and do not reflect taxes that a shareholder may pay on fund distributions or the redemption of fund shares. Investment return and principal value of an investment will fluctuate so that an investor’s shares, when redeemed, may be worth more or less than their original cost. Performance shown without sales charges would be lower if sales charges were reflected. Current performance may be lower or higher than the performance data quoted, which assumes the reinvestment of dividends and capital gains. Current month-end performance is available on the Fund’s website, wellsfargofunds.com.
Index returns do not include transaction costs associated with buying and selling securities, any mutual fund fees or expenses, or any taxes. It is not possible to invest directly in an index.
For Class A shares, the maximum front-end sales charge is 4.00%. For Class C shares, the maximum contingent deferred sales charge is 1.00%. Performance including a contingent deferred sales charge assumes the sales charge for the corresponding time period. Administrator Class and Institutional Class shares are sold without a front-end sales charge or contingent deferred sales charge.
Bond values fluctuate in response to the financial condition of individual issuers, general market and economic conditions, and changes in interest rates. Changes in market conditions and government policies may lead to periods of heightened volatility in the bond market and reduced liquidity for certain bonds held by the Fund. In general, when interest rates rise, bond values fall and investors may lose principal value. Interest-rate changes and their impact on the Fund and its share price can be sudden and unpredictable. High-yield securities have a greater risk of default and tend to be more volatile than higher-rated debt securities. Loans are subject to risks similar to those associated with other below investment- grade bond investments, such as credit risk (for example, risk of issuer default), below-investment-grade bond risk (for example, risk of greater volatility in value), and risk that the loan may become illiquid or difficult to price. Foreign investments are especially volatile and can rise or fall dramatically due to differences in the political and economic conditions of the host country. These risks are generally intensified in emerging markets. The use of derivatives may reduce returns and/or increase volatility. Certain investment strategies tend to increase the total risk of an investment (relative to the broader market). The Fund is exposed to mortgage- and asset-backed securities risk, regulatory risk, and geographic risk. Consult the Fund’s prospectus for additional information on these and other risks.
Please see footnotes on page 7.
| | | | | | |
| Performance highlights (unaudited) | | Wells Fargo Strategic Income Fund | | | 7 | |
|
| Growth of $10,000 investment as of September 30, 20175 |
|
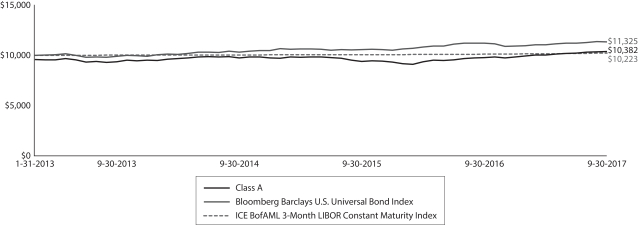 |
| 1 | Reflects the expense ratios as stated in the most recent prospectuses, which include the impact of 0.01% in acquired fund fees and expenses. The expense ratios shown are subject to change and may differ from the annualized expense ratios shown in the financial highlights of this report, which do not include acquired fund fees and expenses. |
| 2 | The manager has contractually committed through January 31, 2018, to waive fees and/or reimburse expenses to the extent necessary to cap the Fund’s Total Annual Fund Operating Expenses After Fee Waivers at 0.90% for Class A, 1.65% for Class C, 0.75% for Administrator class, and 0.60% for Institutional Class. After this time, the cap may be increased or the commitment to maintain the cap may be terminated only with the approval of the Board of Trustees. Brokerage commissions, stamp duty fees, interest, taxes, acquired fund fees and expenses, and extraordinary expenses are excluded from the expense cap. Without this cap, the Fund’s returns would have been lower. The expense ratio paid by an investor is the net expense ratio or the Fund’s Total Annual Fund Operating Expenses After Fee Waivers, as stated in the prospectuses. |
| 3 | The Bloomberg Barclays U.S. Universal Bond Index is an unmanaged market-value-weighted performance benchmark for the U.S. dollar–denominated bond market, which includes investment-grade, high-yield, and emerging markets debt securities with maturities of one year or more. You cannot invest directly in an index. |
| 4 | The ICE BofAML 3-Month LIBOR Constant Maturity Index (formerly known as BofA Merrill Lynch 3-Month U.S. Dollar LIBOR Constant Maturity Index) is based on the assumed purchase of a synthetic instrument having 3 months to maturity and with a coupon equal to the closing quote for 3-Month LIBOR. That issue is sold the following day (priced at a yield equal to the current day closing 3-Month LIBOR rate) and is rolled into a new 3-month instrument. The index, therefore, will always have a constant maturity equal to exactly 3 months. You cannot invest directly in an index. |
| 5 | The chart compares the performance of Class A shares for the most recent ten years with the Bloomberg Barclays U.S. Universal Bond Index and the ICE BofAML 3-Month LIBOR Constant Maturity Index. The chart assumes a hypothetical investment of $10,000 in Class A shares and reflects all operating expenses and assumes the maximum initial sales charge of 4.00%. |
| 6 | The ten largest holdings, excluding cash and cash equivalents, are calculated based on the value of the investments divided by total net assets of the Fund. Holdings are subject to change and may have changed since the date specified. |
| 7 | The Bloomberg Barclays U.S. Credit Index measures the investment-grade, U.S. dollar-denominated, fixed-rate, taxable corporate and government related bond markets. It is composed of the U.S. Corporate Index and a non-corporate component that includes foreign agencies, sovereigns, supranationals and local authorities. You cannot invest directly in an index. |
| 8 | Amounts are calculated based on the total long-term investments of the Fund. These amounts are subject to change and may have changed since the date specified. |
| | | | |
| 8 | | Wells Fargo Strategic Income Fund | | Performance highlights (unaudited) |
MANAGERS’ DISCUSSION
Fund highlights
| ∎ | | The Fund outperformed its benchmarks, the Bloomberg Barclays U.S. Universal Bond Index and the ICE BofAML 3-Month LIBOR Constant Maturity Index, for the 12-month period that ended September 30, 2017. |
| ∎ | | The Fund’s holdings in high-yield, corporate, and emerging markets debt contributed to performance, as did exposures to foreign currencies. |
| ∎ | | The Fund’s shorter duration posture compared with the Bloomberg Barclays U.S. Universal Bond Index also benefited performance, while the longer duration position relative to the ICE BofAML 3-Month LIBOR Constant Maturity Index detracted from performance. |
Moderate economic growth persisted and policy normalization continued.
Over the past four quarters, U.S. gross domestic product (GDP) grew by 2.2% in real terms, which was very close to the post–financial crisis average. Personal consumption growth was a significant source of strength, rising 2.6% for the 12 months that ended June 30, 2017. Business investment was a net contributor to growth, although it failed to keep pace with the consumer sector. International trade was a net detractor from GDP growth, while inventories and government spending were largely neutral factors.
The labor market was generally healthy over the past 12 months. Nonfarm payrolls expanded by an average of 175,000 jobs per month over the period, while the unemployment rate declined to 4.4% from 4.9% a year earlier. Also encouraging was a 0.4% rise in the employment/population ratio since August 2016, reflecting both the fall in unemployment and a modest increase in the labor force participation rate. Wage gains of about 2.5% over the past 12 months were sufficient to support consumption growth without sparking fears of rising inflation. The Consumer Price Index rose 1.7% over the past year, held in check by relatively stable energy prices.
| | | | |
| Ten largest holdings (%) as of September 30, 20176 | |
U.S. Treasury Note, 1.25%, 8-31-2019 | | | 6.47 | |
Avis Budget Rental Car Funding LLC Series 2017-1A Class C, 4.15%, 9-20-2023 | | | 1.33 | |
Hertz Fleet Lease Funding LP Series 2014-1 Class C, 2.39%, 4-10-2028 | | | 1.26 | |
Coinstar Funding LLC Series 2017-1A Class A2, 5.22%, 4-25-2047 | | | 1.09 | |
Longtrain Leasing III LLC Series 2015-1A Class A2, 4.06%, 1-15-2045 | | | 1.07 | |
ACAS CLO Limited Trust Series 2015-1A Class B, 3.40%, 4-18-2027 | | | 1.05 | |
New Jersey EDA Motor Vehicle Surcharge Refunding Subordinated Series, 3.52%, 7-1-2020 | | | 1.04 | |
Republic of Peru, 5.70%, 8-12-2024 | | | 1.03 | |
Malaysia, 3.88%, 3-10-2022 | | | 1.03 | |
Colombia, 7.00%, 9-11-2019 | | | 1.03 | |
The U.S. Federal Reserve’s rate-setting committee, the Federal Open Market Committee (FOMC), raised the federal funds rate three times over the past 12 months by a total of 0.75%. The FOMC’s most recent move on June 14, 2017, was supported by a statement citing a labor market that had “continued to strengthen.” Economic activity was characterized as “rising moderately,” while an inflation rate somewhat below target was expected to “stabilize around the Committee’s 2% objective over the medium term.”
Rates moved higher and spreads narrowed.
In line with the FOMC’s policy moves, interest rates had an upward bias over the past 12 months, particularly in shorter-term maturity instruments. Yields in the one-month to one-year maturity range rose by a little more than 60 basis points (bps; 100 bps equal 1.00%), while intermediate- and long-term bond yields were about 50 bps higher. Credit spreads widened slightly prior to the
November 2016 election but narrowed thereafter, ending the period about 25 bps tighter than where they began, as measured by the Bloomberg Barclays U.S. Credit Index7.
The Fund remained overweight corporate securities but reduced high-yield holdings and increased investment-grade debt.
During the period, the Fund reduced its positions in U.S. and European high-yield corporate bonds while adding to investment-grade holdings. The decreased high-yield allocation followed strong returns for the sector and reflected the diminished relative value available in that space. The increased investment-grade holdings provided flexibility to increase risk when valuations improved while offering a more stable source of income as we wait for that to occur. The Fund also
Please see footnotes on page 7.
| | | | | | |
| Performance highlights (unaudited) | | Wells Fargo Strategic Income Fund | | | 9 | |
increased its exposure to emerging markets securities toward the end of the reporting period, due to improving macroeconomic factors, attractive currency valuations, and relatively favorable local interest rates. We expect the net impact of these changes should reduce total portfolio risk while maintaining attractive income and return potential.
|
| Portfolio allocation as of September 30, 20178 |
|
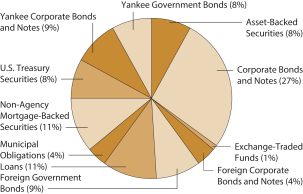
|
We continue to expect a gradual rise in short-term interest rates.
The Fund’s duration, which was shorter than the duration of the Bloomberg Barclays U.S. Universal Bond Index, helped results because longer-term yields increased after the U.S. presidential election that took place at the beginning of the period. The Fund’s duration was reduced following the significant decrease in Treasury rates that occurred later in the reporting period.
The relatively benign economic conditions described above may result in an eventual further increase in short-term interest rates. We believe the FOMC is likely to raise its target rate by 0.75% over the next 12 months, a result that is not reflected in the term structure of interest rates.
As a result, the Fund remains defensively positioned for a larger-than-anticipated increase in short-term Treasury yields. We believe pockets of credit-oriented fixed income and emerging markets are attractive, and we expect to maintain current exposures until fundamentals or valuations change.
Please see footnotes on page 7.
| | | | |
| 10 | | Wells Fargo Strategic Income Fund | | Fund expenses (unaudited) |
As a shareholder of the Fund, you incur two types of costs: (1) transaction costs, including sales charges (loads) on purchase payments and contingent deferred sales charges (if any) on redemptions and (2) ongoing costs, including management fees, distribution (12b-1) and/or shareholder servicing fees, and other Fund expenses. This example is intended to help you understand your ongoing costs (in dollars) of investing in the Fund and to compare these costs with the ongoing costs of investing in other mutual funds.
The example is based on an investment of $1,000 invested at the beginning of the six-month period and held for the entire period from April 1, 2017 to September 30, 2017.
Actual expenses
The “Actual” line of the table below provides information about actual account values and actual expenses. You may use the information in this line, together with the amount you invested, to estimate the expenses that you paid over the period. Simply divide your account value by $1,000 (for example, an $8,600 account value divided by $1,000 = 8.6), then multiply the result by the number in the “Actual” line under the heading entitled “Expenses paid during period” for your applicable class of shares to estimate the expenses you paid on your account during this period.
Hypothetical example for comparison purposes
The “Hypothetical” line of the table below provides information about hypothetical account values and hypothetical expenses based on the Fund’s actual expense ratio and an assumed rate of return of 5% per year before expenses, which is not the Fund’s actual return. The hypothetical account values and expenses may not be used to estimate the actual ending account balance or expenses you paid for the period. You may use this information to compare the ongoing costs of investing in the Fund and other funds. To do so, compare this 5% hypothetical example with the 5% hypothetical examples that appear in the shareholder reports of the other funds.
Please note that the expenses shown in the table are meant to highlight your ongoing costs only and do not reflect any transactional costs, such as sales charges (loads) and contingent deferred sales charges. Therefore, the “Hypothetical” line of the table is useful in comparing ongoing costs only and will not help you determine the relative total costs of owning different funds. In addition, if these transactional costs were included, your costs would have been higher.
| | | | | | | | | | | | | | | | |
| | | Beginning
account value
4-1-2017 | | | Ending
account value
9-30-2017 | | | Expenses
paid during
the period¹ | | | Annualized net
expense ratio | |
Class A | | | | | | | | | | | | | | | | |
Actual | | $ | 1,000.00 | | | $ | 1,025.56 | | | $ | 4.57 | | | | 0.90 | % |
Hypothetical (5% return before expenses) | | $ | 1,000.00 | | | $ | 1,020.56 | | | $ | 4.56 | | | | 0.90 | % |
Class C | | | | | | | | | | | | | | | | |
Actual | | $ | 1,000.00 | | | $ | 1,021.66 | | | $ | 8.36 | | | | 1.65 | % |
Hypothetical (5% return before expenses) | | $ | 1,000.00 | | | $ | 1,016.80 | | | $ | 8.34 | | | | 1.65 | % |
Administrator Class | | | | | | | | | | | | | | | | |
Actual | | $ | 1,000.00 | | | $ | 1,023.38 | | | $ | 3.80 | | | | 0.75 | % |
Hypothetical (5% return before expenses) | | $ | 1,000.00 | | | $ | 1,021.31 | | | $ | 3.80 | | | | 0.75 | % |
Institutional Class | | | | | | | | | | | | | | | | |
Actual | | $ | 1,000.00 | | | $ | 1,027.54 | | | $ | 3.05 | | | | 0.60 | % |
Hypothetical (5% return before expenses) | | $ | 1,000.00 | | | $ | 1,022.06 | | | $ | 3.04 | | | | 0.60 | % |
| 1 | Expenses paid is equal to the annualized net expense ratio of each class multiplied by the average account value over the period, multiplied by the number of days in the most recent fiscal half-year divided by the number of days in the fiscal year (to reflect the one-half-year period). |
| | | | | | |
| Portfolio of investments—September 30, 2017 | | Wells Fargo Strategic Income Fund | | | 11 | |
| | | | | | | | | | | | | | | | |
| Security name | | Interest rate | | | Maturity date | | | Principal | | | Value | |
| | | | |
Asset-Backed Securities: 7.36% | | | | | | | | | | | | | | | | |
AmeriCredit Automobile Receivables Trust Series 2015-4 Class D | | | 3.72 | % | | | 12-8-2021 | | | $ | 300,000 | | | $ | 306,236 | |
Ascentium Equipment Receivables LLC Series 2016-1A Class B 144A | | | 2.85 | | | | 7-10-2020 | | | | 400,000 | | | | 403,642 | |
Avis Budget Rental Car Funding LLC Series 2012-3A Class B 144A | | | 3.04 | | | | 3-20-2019 | | | | 250,000 | | | | 250,682 | |
Avis Budget Rental Car Funding LLC Series 2017-1A Class C 144A | | | 4.15 | | | | 9-20-2023 | | | | 650,000 | | | | 632,580 | |
Coinstar Funding LLC Series 2017-1A Class A2 144A | | | 5.22 | | | | 4-25-2047 | | | | 498,750 | | | | 518,298 | |
Conn Funding II LP Series 2017-A Class A 144A | | | 3.20 | | | | 7-15-2019 | | | | 123,289 | | | | 123,359 | |
Hertz Fleet Lease Funding LP Series 2014-1 Class C (1 Month LIBOR +1.15%) 144A± | | | 2.39 | | | | 4-10-2028 | | | | 600,000 | | | | 599,821 | |
SoFi Consumer Loan Program Trust Series 2016-3A 144A | | | 3.05 | | | | 12-26-2025 | | | | 381,365 | | | | 385,030 | |
SoFi Professional Loan Program LLC Series 2016-A Class A2 144A | | | 2.76 | | | | 12-26-2036 | | | | 289,524 | | | | 292,156 | |
| | | | |
Total Asset-Backed Securities (Cost $3,500,644) | | | | | | | | | | | | | | | 3,511,804 | |
| | | | | | | | | | | | | | | | |
| | | | |
Corporate Bonds and Notes: 24.28% | | | | | | | | | | | | | | | | |
| | | | |
Consumer Discretionary: 6.34% | | | | | | | | | | | | | | | | |
| | | | |
| Auto Components: 0.11% | | | | | | | | | | | | | | | | |
Allison Transmission Incorporated 144A | | | 5.00 | | | | 10-1-2024 | | | | 50,000 | | | | 51,893 | |
| | | | | | | | | | | | | | | | |
| | | | |
| Automobiles: 0.72% | | | | | | | | | | | | | | | | |
Ford Motor Company | | | 7.45 | | | | 7-16-2031 | | | | 265,000 | | | | 343,030 | |
| | | | | | | | | | | | | | | | |
| | | | |
| Distributors: 0.22% | | | | | | | | | | | | | | | | |
LKQ Corporation | | | 4.75 | | | | 5-15-2023 | | | | 100,000 | | | | 103,625 | |
| | | | | | | | | | | | | | | | |
| | | | |
| Media: 3.72% | | | | | | | | | | | | | | | | |
Altice US Finance I Corporation 144A | | | 5.50 | | | | 5-15-2026 | | | | 125,000 | | | | 131,875 | |
CCO Holdings LLC 144A | | | 5.13 | | | | 5-1-2023 | | | | 35,000 | | | | 36,444 | |
CCO Holdings LLC | | | 5.25 | | | | 9-30-2022 | | | | 50,000 | | | | 51,500 | |
CCO Holdings LLC 144A | | | 5.38 | | | | 5-1-2025 | | | | 150,000 | | | | 155,456 | |
Charter Communications Operating LLC | | | 4.91 | | | | 7-23-2025 | | | | 200,000 | | | | 213,731 | |
Discovery Communications LLC | | | 3.80 | | | | 3-13-2024 | | | | 265,000 | | | | 273,029 | |
Gray Television Incorporated 144A | | | 5.13 | | | | 10-15-2024 | | | | 50,000 | | | | 50,250 | |
Gray Television Incorporated 144A | | | 5.88 | | | | 7-15-2026 | | | | 50,000 | | | | 51,500 | |
Interpublic Group Company | | | 4.20 | | | | 4-15-2024 | | | | 250,000 | | | | 262,535 | |
National CineMedia LLC | | | 6.00 | | | | 4-15-2022 | | | | 75,000 | | | | 76,500 | |
Nexstar Broadcasting Group Incorporated 144A | | | 6.13 | | | | 2-15-2022 | | | | 50,000 | | | | 52,125 | |
Nielsen Finance LLC 144A | | | 5.00 | | | | 4-15-2022 | | | | 75,000 | | | | 77,719 | |
Salem Media Group Incorporated 144A | | | 6.75 | | | | 6-1-2024 | | | | 75,000 | | | | 78,000 | |
Time Warner Cable Incorporated | | | 3.80 | | | | 2-15-2027 | | | | 265,000 | | | | 265,031 | |
| | | | |
| | | | | | | | | | | | | | | 1,775,695 | |
| | | | | | | | | | | | | | | | |
| | | | |
| Multiline Retail: 0.94% | | | | | | | | | | | | | | | | |
Macy’s Retail Holdings Incorporated | | | 3.88 | | | | 1-15-2022 | | | | 250,000 | | | | 250,839 | |
Nordstrom Incorporated | | | 5.00 | | | | 1-15-2044 | | | | 200,000 | | | | 196,423 | |
| | | | |
| | | | | | | | | | | | | | | 447,262 | |
| | | | | | | | | | | | | | | | |
| | | | |
| Specialty Retail: 0.53% | | | | | | | | | | | | | | | | |
Asbury Automotive Group Incorporated | | | 6.00 | | | | 12-15-2024 | | | | 75,000 | | | | 78,375 | |
Group 1 Automotive Incorporated | | | 5.00 | | | | 6-1-2022 | | | | 25,000 | | | | 25,906 | |
Lithia Motors Incorporated 144A | | | 5.25 | | | | 8-1-2025 | | | | 25,000 | | | | 26,031 | |
Penske Auto Group Incorporated | | | 5.75 | | | | 10-1-2022 | | | | 50,000 | | | | 51,630 | |
Sonic Automotive Incorporated | | | 5.00 | | | | 5-15-2023 | | | | 75,000 | | | | 73,313 | |
| | | | |
| | | | | | | | | | | | | | | 255,255 | |
| | | | | | | | | | | | | | | | |
The accompanying notes are an integral part of these financial statements.
| | | | |
| 12 | | Wells Fargo Strategic Income Fund | | Portfolio of investments—September 30, 2017 |
| | | | | | | | | | | | | | | | |
| Security name | | Interest rate | | | Maturity date | | | Principal | | | Value | |
| | | | |
| Textiles, Apparel & Luxury Goods: 0.10% | | | | | | | | | | | | | | | | |
Wolverine World Wide Company 144A | | | 5.00 | % | | | 9-1-2026 | | | $ | 50,000 | | | $ | 50,015 | |
| | | | | | | | | | | | | | | | |
| | | | |
Consumer Staples: 0.42% | | | | | | | | | | | | | | | | |
| | | | |
| Tobacco: 0.42% | | | | | | | | | | | | | | | | |
Bat Capital Corporation 144A | | | 3.56 | | | | 8-15-2027 | | | | 200,000 | | | | 200,609 | |
| | | | | | | | | | | | | | | | |
| | | | |
Energy: 3.57% | | | | | | | | | | | | | | | | |
| | | | |
| Energy Equipment & Services: 0.98% | | | | | | | | | | | | | | | | |
Era Group Incorporated | | | 7.75 | | | | 12-15-2022 | | | | 40,000 | | | | 36,400 | |
Hilcorp Energy Company 144A | | | 5.75 | | | | 10-1-2025 | | | | 75,000 | | | | 75,844 | |
Hornbeck Offshore Services Incorporated | | | 1.50 | | | | 9-1-2019 | | | | 25,000 | | | | 19,500 | |
NGPL PipeCo LLC 144A | | | 7.77 | | | | 12-15-2037 | | | | 175,000 | | | | 217,875 | |
PHI Incorporated | | | 5.25 | | | | 3-15-2019 | | | | 120,000 | | | | 116,400 | |
| |
| | | | 466,019 | |
| | | | | | | | | | | | | | | | |
| | | | |
| Oil, Gas & Consumable Fuels: 2.59% | | | | | | | | | | | | | | | | |
Exterran Partners LP | | | 6.00 | | | | 4-1-2021 | | | | 50,000 | | | | 49,000 | |
Murphy Oil Corporation | | | 5.75 | | | | 8-15-2025 | | | | 5,000 | | | | 5,151 | |
Phillips 66 | | | 4.88 | | | | 11-15-2044 | | | | 250,000 | | | | 272,308 | |
Rockies Express Pipeline LLC 144A | | | 6.88 | | | | 4-15-2040 | | | | 200,000 | | | | 222,000 | |
Rose Rock Midstream LP | | | 5.63 | | | | 11-15-2023 | | | | 100,000 | | | | 97,250 | |
Sabine Pass Liquefaction LLC | | | 5.63 | | | | 2-1-2021 | | | | 100,000 | | | | 108,362 | |
Sunoco Logistics Partner LP | | | 5.40 | | | | 10-1-2047 | | | | 250,000 | | | | 254,461 | |
Tallgrass Energy Partners LP 144A | | | 5.50 | | | | 9-15-2024 | | | | 175,000 | | | | 179,813 | |
Ultra Resources Incorporated 144A | | | 6.88 | | | | 4-15-2022 | | | | 25,000 | | | | 25,500 | |
Ultra Resources Incorporated 144A | | | 7.13 | | | | 4-15-2025 | | | | 25,000 | | | | 25,250 | |
| |
| | | | 1,239,095 | |
| | | | | | | | | | | | | | | | |
| | | | |
Financials: 6.32% | | | | | | | | | | | | | | | | |
| | | | |
| Banks: 1.59% | | | | | | | | | | | | | | | | |
Bank of America Corporation (3 Month LIBOR +4.55%) ± | | | 6.30 | | | | 12-29-2049 | | | | 265,000 | | | | 299,450 | |
JPMorgan Chase & Company (3 Month LIBOR +3.30%) ± | | | 6.00 | | | | 12-31-2049 | | | | 180,000 | | | | 195,750 | |
PNC Financial Services (3 Month LIBOR +3.30%) ± | | | 5.00 | | | | 12-29-2049 | | | | 250,000 | | | | 261,875 | |
| |
| | | | 757,075 | |
| | | | | | | | | | | | | | | | |
| | | | |
| Capital Markets: 1.59% | | | | | | | | | | | | | | | | |
Blackstone Holdings Finance Company LLC 144A%% | | | 3.15 | | | | 10-2-2027 | | | | 250,000 | | | | 246,389 | |
Goldman Sachs Group Incorporated | | | 4.25 | | | | 10-21-2025 | | | | 265,000 | | | | 276,173 | |
Morgan Stanley | | | 3.63 | | | | 1-20-2027 | | | | 235,000 | | | | 238,270 | |
| |
| | | | 760,832 | |
| | | | | | | | | | | | | | | | |
| | | | |
| Consumer Finance: 0.82% | | | | | | | | | | | | | | | | |
Arch Capital Finance LLC | | | 4.01 | | | | 12-15-2026 | | | | 125,000 | | | | 129,576 | |
FirstCash Incorporated 144A | | | 5.38 | | | | 6-1-2024 | | | | 25,000 | | | | 26,063 | |
General Motors Financial Company Incorporated | | | 3.20 | | | | 7-6-2021 | | | | 185,000 | | | | 188,208 | |
Springleaf Finance Corporation | | | 8.25 | | | | 10-1-2023 | | | | 40,000 | | | | 45,600 | |
| |
| | | | 389,447 | |
| | | | | | | | | | | | | | | | |
| | | | |
| Diversified Financial Services: 0.81% | | | | | | | | | | | | | | | | |
Brookfield Finance LLC | | | 4.00 | | | | 4-1-2024 | | | | 200,000 | | | | 207,075 | |
LPL Holdings Incorporated 144A | | | 5.75 | | | | 9-15-2025 | | | | 175,000 | | | | 181,563 | |
| |
| | | | 388,638 | |
| | | | | | | | | | | | | | | | |
The accompanying notes are an integral part of these financial statements.
| | | | | | |
| Portfolio of investments—September 30, 2017 | | Wells Fargo Strategic Income Fund | | | 13 | |
| | | | | | | | | | | | | | | | |
| Security name | | Interest rate | | | Maturity date | | | Principal | | | Value | |
| | | | |
| Insurance: 1.51% | | | | | | | | | | | | | | | | |
Guardian Life Insurance Company 144A | | | 4.85 | % | | | 1-24-2077 | | | $ | 200,000 | | | $ | 213,609 | |
Hub Holdings LLC (PIK at 8.88%) 144A¥ | | | 8.13 | | | | 7-15-2019 | | | | 30,000 | | | | 30,075 | |
Hub International Limited 144A | | | 7.88 | | | | 10-1-2021 | | | | 100,000 | | | | 104,125 | |
Lincoln National Corporation | | | 7.00 | | | | 6-15-2040 | | | | 105,000 | | | | 140,251 | |
MetLife Incorporated | | | 6.40 | | | | 12-15-2066 | | | | 200,000 | | | | 230,500 | |
| |
| | | | 718,560 | |
| | | | | | | | | | | | | | | | |
| | | | |
Health Care: 0.68% | | | | | | | | | | | | | | | | |
| | | | |
| Health Care Providers & Services: 0.68% | | | | | | | | | | | | | | | | |
DaVita HealthCare Partners Incorporated | | | 5.00 | | | | 5-1-2025 | | | | 50,000 | | | | 49,313 | |
DaVita HealthCare Partners Incorporated | | | 5.75 | | | | 8-15-2022 | | | | 25,000 | | | | 25,625 | |
Highmark Incorporated 144A | | | 6.13 | | | | 5-15-2041 | | | | 100,000 | | | | 107,259 | |
MPH Acquisition Holdings LLC 144A | | | 7.13 | | | | 6-1-2024 | | | | 25,000 | | | | 26,875 | |
Vizient Incorporated 144A | | | 10.38 | | | | 3-1-2024 | | | | 100,000 | | | | 115,000 | |
| |
| | | | 324,072 | |
| | | | | | | | | | | | | | | | |
| | | | |
Industrials: 0.90% | | | | | | | | | | | | | | | | |
| | | | |
| Airlines: 0.21% | | | | | | | | | | | | | | | | |
American Airlines Incorporated | | | 4.38 | | | | 4-1-2024 | | | | 97,389 | | | | 100,262 | |
| | | | | | | | | | | | | | | | |
| | | | |
| Commercial Services & Supplies: 0.69% | | | | | | | | | | | | | | | | |
Advanced Disposal Services Incorporated 144A | | | 5.63 | | | | 11-15-2024 | | | | 100,000 | | | | 104,500 | |
Covanta Holding Corporation | | | 5.88 | | | | 3-1-2024 | | | | 120,000 | | | | 119,100 | |
KAR Auction Services Incorporated 144A | | | 5.13 | | | | 6-1-2025 | | | | 100,000 | | | | 104,000 | |
| |
| | | | 327,600 | |
| | | | | | | | | | | | | | | | |
| | | | |
Information Technology: 1.77% | | | | | | | | | | | | | | | | |
| | | | |
| Electronic Equipment, Instruments & Components: 0.57% | | | | | | | | | | | | | | | | |
Arrow Electronics Incorporated | | | 3.50 | | | | 4-1-2022 | | | | 165,000 | | | | 168,171 | |
Zebra Technologies Corporation | | | 7.25 | | | | 10-15-2022 | | | | 97,000 | | | | 102,690 | |
| |
| | | | 270,861 | |
| | | | | | | | | | | | | | | | |
| | | | |
| Internet Software & Services: 0.17% | | | | | | | | | | | | | | | | |
Zayo Group LLC | | | 6.38 | | | | 5-15-2025 | | | | 75,000 | | | | 80,822 | |
| | | | | | | | | | | | | | | | |
| | | | |
| IT Services: 0.49% | | | | | | | | | | | | | | | | |
Cardtronics Incorporated | | | 5.13 | | | | 8-1-2022 | | | | 150,000 | | | | 154,875 | |
Gartner Incorporated 144A | | | 5.13 | | | | 4-1-2025 | | | | 75,000 | | | | 79,125 | |
| |
| | | | 234,000 | |
| | | | | | | | | | | | | | | | |
| | | | |
| Technology Hardware, Storage & Peripherals: 0.54% | | | | | | | | | | | | | | | | |
Diamond 1 Finance Corporation 144A | | | 8.35 | | | | 7-15-2046 | | | | 75,000 | | | | 95,810 | |
NCR Corporation | | | 5.88 | | | | 12-15-2021 | | | | 160,000 | | | | 165,320 | |
| |
| | | | 261,130 | |
| | | | | | | | | | | | | | | | |
| | | | |
Materials: 0.12% | | | | | | | | | | | | | | | | |
| | | | |
| Containers & Packaging: 0.12% | | | | | | | | | | | | | | | | |
Owens-Illinois Incorporated 144A | | | 6.38 | | | | 8-15-2025 | | | | 50,000 | | | | 56,563 | |
| | | | | | | | | | | | | | | | |
The accompanying notes are an integral part of these financial statements.
| | | | |
| 14 | | Wells Fargo Strategic Income Fund | | Portfolio of investments—September 30, 2017 |
| | | | | | | | | | | | | | | | |
| Security name | | Interest rate | | | Maturity date | | | Principal | | | Value | |
| | | | |
Real Estate: 0.22% | | | | | | | | | | | | | | | | |
| | | | |
| Equity REITs: 0.22% | | | | | | | | | | | | | | | | |
The Geo Group Incorporated | | | 5.88 | % | | | 10-15-2024 | | | $ | 100,000 | | | $ | 104,250 | |
| | | | | | | | | | | | | | | | |
| | | | |
Telecommunication Services: 1.99% | | | | | | | | | | | | | | | | |
| | | | |
| Diversified Telecommunication Services: 0.97% | | | | | | | | | | | | | | | | |
AT&T Incorporated | | | 5.25 | | | | 3-1-2037 | | | | 135,000 | | | | 141,512 | |
GCI Incorporated | | | 6.75 | | | | 6-1-2021 | | | | 90,000 | | | | 92,250 | |
Verizon Communications | | | 5.50 | | | | 3-16-2047 | | | | 205,000 | | | | 227,456 | |
| | | | |
| | | | | | | | | | | | | | | 461,218 | |
| | | | | | | | | | | | | | | | |
| | | | |
| Wireless Telecommunication Services: 1.02% | | | | | | | | | | | | | | | | |
CC Holdings GS V LLC | | | 3.85 | | | | 4-15-2023 | | | | 265,000 | | | | 277,237 | |
Sprint Communications Incorporated 144A | | | 7.00 | | | | 3-1-2020 | | | | 150,000 | | | | 163,875 | |
T-Mobile USA Incorporated | | | 6.38 | | | �� | 3-1-2025 | | | | 20,000 | | | | 21,534 | |
T-Mobile USA Incorporated | | | 6.84 | | | | 4-28-2023 | | | | 25,000 | | | | 26,406 | |
| | | | |
| | | | | | | | | | | | | | | 489,052 | |
| | | | | | | | | | | | | | | | |
| | | | |
Utilities: 1.95% | | | | | | | | | | | | | | | | |
| | | | |
| Electric Utilities: 0.82% | | | | | | | | | | | | | | | | |
Oglethorpe Power Corporation | | | 4.25 | | | | 4-1-2046 | | | | 400,000 | | | | 390,589 | |
| | | | | | | | | | | | | | | | |
| | | | |
| Independent Power & Renewable Electricity Producers: 0.54% | | | | | | | | | | | | | | | | |
NSG Holdings LLC 144A | | | 7.75 | | | | 12-15-2025 | | | | 92,803 | | | | 100,459 | |
Pattern Energy Group Incorporated 144A | | | 5.88 | | | | 2-1-2024 | | | | 150,000 | | | | 158,250 | |
| | | | |
| | | | | | | | | | | | | | | 258,709 | |
| | | | | | | | | | | | | | | | |
| | | | |
| Multi-Utilities: 0.59% | | | | | | | | | | | | | | | | |
Puget Energy Incorporated | | | 5.63 | | | | 7-15-2022 | | | | 250,000 | | | | 278,882 | |
| | | | | | | | | | | | | | | | |
| | | | |
Total Corporate Bonds and Notes (Cost $11,202,003) | | | | | | | | | | | | | | | 11,585,060 | |
| | | | | | | | | | | | | | | | |
| | | | |
| | | | | | | | | Shares | | | | |
| Exchange-Traded Funds: 0.53% | | | | | | | | | | | | | | | | |
iShares iBoxx $ High Yield Corporate Bond ETF | | | | | | | | | | | 2,836 | | | | 251,723 | |
| | | | | | | | | | | | | | | | |
| | | | |
Total Exchange-Traded Funds (Cost $249,988) | | | | | | | | | | | | | | | 251,723 | |
| | | | | | | | | | | | | | | | |
| | | | |
| | | | | | | | | Principal | | | | |
| Foreign Corporate Bonds and Notes @: 3.77% | | | | | | | | | | | | | | | | |
| | | | |
Consumer Staples: 0.75% | | | | | | | | | | | | | | | | |
| | | | |
| Food Products: 0.75% | | | | | | | | | | | | | | | | |
Kraft Heinz Foods Company (EUR) | | | 2.25 | | | | 5-25-2028 | | | | 300,000 | | | | 360,109 | |
| | | | | | | | | | | | | | | | |
| | | | |
Energy: 0.27% | | | | | | | | | | | | | | | | |
| | | | |
| Oil, Gas & Consumable Fuels: 0.27% | | | | | | | | | | | | | | | | |
TOTAL SA (5 Year Euro Swap Rate +3.78%) ± (EUR) | | | 3.88 | | | | 12-29-2049 | | | | 100,000 | | | | 129,433 | |
| | | | | | | | | | | | | | | | |
The accompanying notes are an integral part of these financial statements.
| | | | | | |
| Portfolio of investments—September 30, 2017 | | Wells Fargo Strategic Income Fund | | | 15 | |
| | | | | | | | | | | | | | | | |
| Security name | | Interest rate | | | Maturity date | | | Principal | | | Value | |
| | | | |
Financials: 2.25% | | | | | | | | | | | | | | | | |
| | | | |
| Banks: 1.24% | | | | | | | | | | | | | | | | |
ATF Netherlands BV (EUR) | | | 1.50 | % | | | 7-15-2024 | | | | 100,000 | | | $ | 117,161 | |
International Finance Corporation (INR) | | | 7.80 | | | | 6-3-2019 | | | | 29,900,000 | | | | 472,353 | |
| | | | |
| | | | | | | | | | | | | | | 589,514 | |
| | | | | | | | | | | | | | | | |
| | | | |
| Diversified Financial Services: 0.52% | | | | | | | | | | | | | | | | |
Ie2 Holdco SA (EUR) | | | 2.88 | | | | 6-1-2026 | | | | 100,000 | | | | 127,001 | |
LYB International Finance Company (EUR) | | | 1.88 | | | | 3-2-2022 | | | | 100,000 | | | | 123,293 | |
| | | | |
| | | | | | | | | | | | | | | 250,294 | |
| | | | | | | | | | | | | | | | |
| | | | |
| Insurance: 0.49% | | | | | | | | | | | | | | | | |
XLIT Limited (3 Month EURIBOR +2.90%) ± (EUR) | | | 3.25 | | | | 6-29-2047 | | | | 200,000 | | | | 231,948 | |
| | | | | | | | | | | | | | | | |
| | | | |
Health Care: 0.25% | | | | | | | | | | | | | | | | |
| | | | |
| Life Sciences Tools & Services: 0.25% | | | | | | | | | | | | | | | | |
Thermo Fisher Scientific (EUR) | | | 1.40 | | | | 1-23-2026 | | | | 100,000 | | | | 118,333 | |
| | | | | | | | | | | | | | | | |
| | | | |
Telecommunication Services: 0.25% | | | | | | | | | | | | | | | | |
| | | | |
| Diversified Telecommunication Services: 0.25% | | | | | | | | | | | | | | | | |
Cellnex Telecom SA (EUR) | | | 2.38 | | | | 1-16-2024 | | | | 100,000 | | | | 121,806 | |
| | | | | | | | | | | | | | | | |
| | | | |
Total Foreign Corporate Bonds and Notes (Cost $1,757,276) | | | | | | | | | | | | | | | 1,801,437 | |
| | | | | | | | | | | | | | | | |
| | | | |
Foreign Government Bonds @: 8.12% | | | | | | | | | | | | | | | | |
Brazil (BRL) | | | 10.00 | | | | 1-1-2021 | | | | 640,000 | | | | 214,631 | |
Brazil (BRL) | | | 10.00 | | | | 1-1-2027 | | | | 865,000 | | | | 278,836 | |
Colombia (COP) | | | 7.00 | | | | 9-11-2019 | | | | 1,400,000,000 | | | | 491,258 | |
Indonesia (IDR) | | | 7.88 | | | | 4-15-2019 | | | | 6,175,000,000 | | | | 474,048 | |
Malaysia (MYR) | | | 3.88 | | | | 3-10-2022 | | | | 2,055,000 | | | | 492,353 | |
Mexico (MXN) | | | 6.50 | | | | 6-9-2022 | | | | 8,760,000 | | | | 476,898 | |
Poland (PLN) | | | 2.50 | | | | 7-25-2027 | | | | 1,905,000 | | | | 484,264 | |
Republic of Peru (PEN) | | | 5.70 | | | | 8-12-2024 | | | | 1,515,000 | | | | 492,405 | |
Republic of South Africa (ZAR) | | | 6.75 | | | | 3-31-2021 | | | | 6,500,000 | | | | 469,205 | |
| | | | |
Total Foreign Government Bonds (Cost $3,904,649) | | | | | | | | | | | | | | | 3,873,898 | |
| | | | | | | | | | | | | | | | |
| | | | |
Loans: 9.71% | | | | | | | | | | | | | | | | |
| | | | |
Consumer Discretionary: 2.47% | | | | | | | | | | | | | | | | |
| | | | |
| Auto Components: 0.18% | | | | | | | | | | | | | | | | |
Allison Transmission Incorporated (1 Month LIBOR +2.00%) ± | | | 3.24 | | | | 9-23-2022 | | | $ | 84,185 | | | | 84,437 | |
| | | | | | | | | | | | | | | | |
| | | | |
| Distributors: 0.64% | | | | | | | | | | | | | | | | |
Spin Holdco Incorporated (2 Month LIBOR +3.75%) ± | | | 5.01 | | | | 11-14-2022 | | | | 306,364 | | | | 307,666 | |
| | | | | | | | | | | | | | | | |
| | | | |
| Hotels, Restaurants & Leisure: 0.87% | | | | | | | | | | | | | | | | |
Belmond Interfin Limited (1 Month LIBOR +2.75%) ± | | | 3.99 | | | | 7-3-2024 | | | | 99,750 | | | | 99,813 | |
CCM Merger Incorporated (1 Month LIBOR +2.75%) ± | | | 3.99 | | | | 8-8-2021 | | | | 216,767 | | | | 217,797 | |
La Quinta Intermediate Holdings LLC (3 Month LIBOR +2.75%) ± | | | 4.05 | | | | 4-14-2021 | | | | 98,737 | | | | 98,984 | |
| | | | |
| | | | | | | | | | | | | | | 416,594 | |
| | | | | | | | | | | | | | | | |
| | | | |
| Household Products: 0.16% | | | | | | | | | | | | | | | | |
Anchor Glass Container Corporation (1 Month LIBOR +2.75%) ± | | | 4.01 | | | | 12-7-2023 | | | | 74,438 | | | | 74,690 | |
| | | | | | | | | | | | | | | | |
The accompanying notes are an integral part of these financial statements.
| | | | |
| 16 | | Wells Fargo Strategic Income Fund | | Portfolio of investments—September 30, 2017 |
| | | | | | | | | | | | | | | | |
| Security name | | Interest rate | | | Maturity date | | | Principal | | | Value | |
| | | | |
| Media: 0.62% | | | | | | | | | | | | | | | | |
Altice US Finance I Corporation (1 Month LIBOR +2.25%) ± | | | 3.49 | % | | | 7-28-2025 | | | $ | 148,876 | | | $ | 148,094 | |
Learfield Communications Incorporated (1 Month LIBOR +3.25%) ± | | | 4.49 | | | | 12-1-2023 | | | | 148,875 | | | | 149,619 | |
| | | | |
| | | | | | | | | | | | | | | 297,713 | |
| | | | | | | | | | | | | | | | |
| | | | |
Energy: 0.58% | | | | | | | | | | | | | | | | |
| | | | |
| Energy Equipment & Services: 0.22% | | | | | | | | | | | | | | | | |
Panda Hummel Station (1 Month LIBOR +6.00%) ± | | | 7.24 | | | | 10-27-2022 | | | | 112,613 | | | | 103,041 | |
| | | | | | | | | | | | | | | | |
| | | | |
| Oil, Gas & Consumable Fuels: 0.36% | | | | | | | | | | | | | | | | |
Ultra Resources Incorporated (3 Month LIBOR +3.00%) ± | | | 4.31 | | | | 4-12-2024 | | | | 50,000 | | | | 49,875 | |
Veresen Midstream LP (1 Month LIBOR +3.50%) ± | | | 4.73 | | | | 3-31-2022 | | | | 123,734 | | | | 124,662 | |
| | | | |
| | | | | | | | | | | | | | | 174,537 | |
| | | | | | | | | | | | | | | | |
| | | | |
Financials: 0.70% | | | | | | | | | | | | | | | | |
| | | | |
| Diversified Financial Services: 0.28% | | | | | | | | | | | | | | | | |
LPL Holdings Incorporated (3 Month LIBOR +2.25%) ± | | | 3.65 | | | | 9-23-2024 | | | | 134,638 | | | | 134,301 | |
| | | | | | | | | | | | | | | | |
| | | | |
| Insurance: 0.42% | | | | | | | | | | | | | | | | |
Alliant Holdings I LLC (3 Month LIBOR +3.25%) ± | | | 4.56 | | | | 8-12-2022 | | | | 198,480 | | | | 199,121 | |
| | | | | | | | | | | | | | | | |
| | | | |
Health Care: 1.56% | | | | | | | | | | | | | | | | |
| | | | |
| Health Care Equipment & Supplies: 0.52% | | | | | | | | | | | | | | | | |
Kinetic Concepts Incorporated (3 Month LIBOR +3.25%) ± | | | 4.58 | | | | 2-2-2024 | | | | 249,375 | | | | 248,363 | |
| | | | | | | | | | | | | | | | |
| | | | |
| Health Care Providers & Services: 0.31% | | | | | | | | | | | | | | | | |
Community Health Systems Incorporated (3 Month LIBOR +3.00%) ± | | | 4.32 | | | | 1-27-2021 | | | | 49,038 | | | | 48,684 | |
TeamHealth Incorporated (1 Month LIBOR +2.75%) ± | | | 3.99 | | | | 2-6-2024 | | | | 99,500 | | | | 97,573 | |
| | | | |
| | | | | | | | | | | | | | | 146,257 | |
| | | | | | | | | | | | | | | | |
| | | | |
| Health Care Technology: 0.52% | | | | | | | | | | | | | | | | |
Change Healthcare Holdings Incorporated (1 Month LIBOR +2.75%) ± | | | 3.99 | | | | 3-1-2024 | | | | 248,750 | | | | 249,310 | |
| | | | | | | | | | | | | | | | |
| | | | |
| Pharmaceuticals: 0.21% | | | | | | | | | | | | | | | | |
Valeant Pharmaceuticals International Incorporated (1 Month LIBOR +4.75%) ± | | | 5.99 | | | | 4-1-2022 | | | | 99,481 | | | | 101,231 | |
| | | | | | | | | | | | | | | | |
| | | | |
Industrials: 0.62% | | | | | | | | | | | | | | | | |
| | | | |
| Aerospace & Defense: 0.21% | | | | | | | | | | | | | | | | |
TransDigm Incorporated (3 Month LIBOR +3.00%) ± | | | 4.33 | | | | 6-4-2021 | | | | 98,725 | | | | 98,934 | |
| | | | | | | | | | | | | | | | |
| | | | |
| Commercial Services & Supplies: 0.39% | | | | | | | | | | | | | | | | |
KAR Auction Services Incorporated (3 Month LIBOR +2.25%) ± | | | 3.63 | | | | 3-11-2021 | | | | 88,070 | | | | 88,427 | |
Sedgwick Claims Management Services Incorporated (1 Month LIBOR +2.75%) ± | | | 3.99 | | | | 3-1-2021 | | | | 98,721 | | | | 98,820 | |
| | | | |
| | | | | | | | | | | | | | | 187,247 | |
| | | | | | | | | | | | | | | | |
| | | | |
| Transportation Infrastructure: 0.02% | | | | | | | | | | | | | | | | |
OSG Bulk Ships Incorporated (3 Month LIBOR +4.25%) ± | | | 5.57 | | | | 8-5-2019 | | | | 11,865 | | | | 11,272 | |
| | | | | | | | | | | | | | | | |
| | | | |
Information Technology: 1.72% | | | | | | | | | | | | | | | | |
| | | | |
| Electronic Equipment, Instruments & Components: 0.84% | | | | | | | | | | | | | | | | |
Dell Incorporated (1 Month LIBOR +2.50%) ± | | | 3.74 | | | | 9-7-2023 | | | | 398,000 | | | | 399,242 | |
| | | | | | | | | | | | | | | | |
The accompanying notes are an integral part of these financial statements.
| | | | | | |
| Portfolio of investments—September 30, 2017 | | Wells Fargo Strategic Income Fund | | | 17 | |
| | | | | | | | | | | | | | | | |
| Security name | | Interest rate | | | Maturity date | | | Principal | | | Value | |
| | | | |
| Internet Software & Services: 0.21% | | | | | | | | | | | | | | | | |
Applied Systems Incorporated (1 Month LIBOR +3.25%) ±< | | | 0.00 | % | | | 9-19-2024 | | | $ | 100,000 | | | $ | 100,969 | |
| | | | | | | | | | | | | | | | |
| | | | |
| IT Services: 0.67% | | | | | | | | | | | | | | | | |
First Data Corporation (1 Month LIBOR +2.25%) ± | | | 3.49 | | | | 7-8-2022 | | | | 320,667 | | | | 321,113 | |
| | | | | | | | | | | | | | | | |
| | | | |
Materials: 0.49% | | | | | | | | | | | | | | | | |
| | | | |
| Containers & Packaging: 0.49% | | | | | | | | | | | | | | | | |
Berry Plastics Corporation (1 Month LIBOR +2.25%) ± | | | 3.49 | | | | 10-1-2022 | | | | 82,454 | | | | 82,660 | |
Reynolds Group Holdings Incorporated (1 Month LIBOR +3.00%) ± | | | 4.24 | | | | 2-5-2023 | | | | 148,503 | | | | 149,037 | |
| | | | |
| | | | | | | | | | | | | | | 231,697 | |
| | | | | | | | | | | | | | | | |
| | | | |
Real Estate: 0.58% | | | | | | | | | | | | | | | | |
| | | | |
| Equity REITs: 0.42% | | | | | | | | | | | | | | | | |
The Geo Group Incorporated (1 Month LIBOR +2.25%) ± | | | 3.49 | | | | 3-22-2024 | | | | 199,000 | | | | 199,165 | |
| | | | | | | | | | | | | | | | |
| | | | |
| Real Estate Management & Development: 0.16% | | | | | | | | | | | | | | | | |
Capital Automotive LP (1 Month LIBOR +3.00%) ± | | | 4.24 | | | | 3-24-2024 | | | | 75,553 | | | | 75,931 | |
| | | | | | | | | | | | | | | | |
| | | | |
Telecommunication Services: 0.99% | | | | | | | | | | | | | | | | |
| | | | |
| Diversified Telecommunication Services: 0.71% | | | | | | | | | | | | | | | | |
Intelsat Jackson Holdings SA (3 Month LIBOR +2.75%) ± | | | 4.07 | | | | 6-30-2019 | | | | 240,332 | | | | 239,455 | |
Level 3 Financing Incorporated (1 Month LIBOR +2.25%) ± | | | 3.49 | | | | 2-22-2024 | | | | 101,410 | | | | 101,331 | |
| | | | |
| | | | | | | | | | | | | | | 340,786 | |
| | | | | | | | | | | | | | | | |
| | | | |
| Wireless Telecommunication Services: 0.28% | | | | | | | | | | | | | | | | |
Syniverse Holdings Incorporated (3 Month LIBOR +3.00%) ± | | | 4.33 | | | | 4-23-2019 | | | | 136,570 | | | | 131,961 | |
| | | | | | | | | | | | | | | | |
| | | | |
Total Loans (Cost $4,650,462) | | | | | | | | | | | | | | | 4,635,578 | |
| | | | | | | | | | | | | | | | |
| | | | |
Municipal Obligations: 3.57% | | | | | | | | | | | | | | | | |
| | | | |
| Illinois: 1.16% | | | | | | | | | | | | | | | | |
Chicago IL Refunding Bonds Taxable Project Series E (GO Revenue) | | | 6.05 | | | | 1-1-2029 | | | | 200,000 | | | | 207,200 | |
Chicago IL Transit Authority Taxable Pension Funding Series A (Tax Revenue) | | | 6.90 | | | | 12-1-2040 | | | | 100,000 | | | | 130,683 | |
Illinois Taxable Pension (GO Revenue) | | | 5.10 | | | | 6-1-2033 | | | | 200,000 | | | | 202,144 | |
Illinois Metropolitan Pier & Exposition Authority CAB McCormick Place Expansion Project Series 2012-B (Tax Revenue) ¤ | | | 0.00 | | | | 12-15-2051 | | | | 85,000 | | | | 11,890 | |
| | | | |
| | | | | | | | | | | | | | | 551,917 | |
| | | | | | | | | | | | | | | | |
| | | | |
| Maryland: 0.21% | | | | | | | | | | | | | | | | |
Maryland Health & HEFAR Green Street Academy Series B (Education Revenue) 144A | | | 6.75 | | | | 7-1-2023 | | | | 100,000 | | | | 99,657 | |
| | | | | | | | | | | | | | | | |
| | | | |
| Michigan: 0.07% | | | | | | | | | | | | | | | | |
Wayne County MI Series 2016 (GO Revenue) | | | 4.25 | | | | 12-1-2018 | | | | 33,000 | | | | 33,244 | |
| | | | | | | | | | | | | | | | |
| | | | |
| New Jersey: 1.04% | | | | | | | | | | | | | | | | |
New Jersey EDA Motor Vehicle Surcharge Refunding Subordinated Series B (Tax Revenue) | | | 3.52 | | | | 7-1-2020 | | | | 500,000 | | | | 498,485 | |
| | | | | | | | | | | | | | | | |
| | | | |
| New York: 0.21% | | | | | | | | | | | | | | | | |
Oyster Bay NY (GO Revenue) | | | 3.25 | | | | 2-1-2018 | | | | 100,000 | | | | 99,966 | |
| | | | | | | | | | | | | | | | |
The accompanying notes are an integral part of these financial statements.
| | | | |
| 18 | | Wells Fargo Strategic Income Fund | | Portfolio of investments—September 30, 2017 |
| | | | | | | | | | | | | | | | |
| Security name | | Interest rate | | | Maturity date | | | Principal | | | Value | |
| | | | |
| Pennsylvania: 0.38% | | | | | | | | | | | | | | | | |
Philadelphia PA IDA Pension Funding Series B (Miscellaneous Revenue, Ambac Insured) ¤ | | | 0.00 | % | | | 4-15-2021 | | | $ | 95,000 | | | $ | 84,061 | |
Quakertown PA General Authority U.S. Department of Agriculture Loan Anticipation Notes Series 2017-B (Health Revenue) | | | 3.80 | | | | 7-1-2021 | | | | 100,000 | | | | 100,065 | |
| | | | |
| | | | | | | | | | | | | | | 184,126 | |
| | | | | | | | | | | | | | | | |
| | | | |
| Texas: 0.50% | | | | | | | | | | | | | | | | |
North Texas Tollway Authority Build America Bonds Subordinate Lien Series B-2 (Transportation Revenue) | | | 8.91 | | | | 2-1-2030 | | | | 210,000 | | | | 238,295 | |
| | | | | | | | | | | | | | | | |
| | | | |
Total Municipal Obligations (Cost $1,697,950) | | | | | | | | | | | | | | | 1,705,690 | |
| | | | | | | | | | | | | | | | |
| | | | |
Non-Agency Mortgage-Backed Securities: 9.51% | | | | | | | | | | | | | | | | |
321 Henderson Receivables LLC Series 2015-2A Class A 144A | | | 3.87 | | | | 3-15-2058 | | | | 429,796 | | | | 442,710 | |
ACAS CLO Limited Trust Series 2015-1A Class B (3 Month LIBOR +2.10%) 144A± | | | 3.40 | | | | 4-18-2027 | | | | 500,000 | | | | 499,994 | |
ALM Loan Funding Series 2015-16A Class A2R (3 Month LIBOR +1.60%) 144A± | | | 2.90 | | | | 7-15-2027 | | | | 410,000 | | | | 411,804 | |
BB-UBS Trust Series 2012-TFT Class C 144A±± | | | 3.58 | | | | 6-5-2030 | | | | 150,000 | | | | 145,879 | |
BCC Funding Corporation Series 2016-1 Class B 144A | | | 2.73 | | | | 4-20-2022 | | | | 400,000 | | | | 396,776 | |
Chicago Skyscraper Trust Series 2017-SKY Class C (1 Month LIBOR +1.25%) 144A± | | | 2.48 | | | | 2-15-2030 | | | | 436,000 | | | | 436,271 | |
Citi Held For Asset Issuance Trust Series 2015-PM3 Class B 144A | | | 4.31 | | | | 5-16-2022 | | | | 327,366 | | | | 329,726 | |
FREMF Mortgage Trust Series 2017-K724 Class B 144A±± | | | 3.60 | | | | 11-25-2023 | | | | 400,000 | | | | 397,531 | |
GS Mortgage Securities Trust Series 2014-GC24 Class D 144A±± | | | 4.66 | | | | 9-10-2047 | | | | 325,000 | | | | 263,690 | |
JPMBB Commercial Mortgage Securities Trust Series 2014-C19 Class D 144A±± | | | 4.82 | | | | 4-15-2047 | | | | 493,000 | | | | 439,306 | |
Longtrain Leasing III LLC Series 2015-1A Class A2 144A | | | 4.06 | | | | 1-15-2045 | | | | 500,000 | | | | 510,087 | |
Textainer Marine Containers Limited Series 2017-1A Class B 144A | | | 4.85 | | | | 5-20-2042 | | | | 163,387 | | | | 165,131 | |
Textainer Marine Containers Limited Series 2017-2A Class B 144A | | | 4.75 | | | | 6-20-2042 | | | | 98,070 | | | | 98,688 | |
| | | | |
Total Non-Agency Mortgage-Backed Securities (Cost $4,520,742) | | | | | | | | | | | | | | | 4,537,593 | |
| | | | | | | | | | | | | | | | |
| | | | |
| | | | | | Expiration date | | | Shares | | | | |
| Rights: 0.01% | | | | | | | | | | | | | | | | |
| | | | |
Utilities: 0.01% | | | | | | | | | | | | | | | | |
| | | | |
| Independent Power & Renewable Electricity Producers: 0.01% | | | | | | | | | | | | | | | | |
Vistra Energy Corporation † | | | | | | | 12-31-2046 | | | | 6,516 | | | | 5,539 | |
| | | | | | | | | | | | | | | | |
| | | | |
Total Rights (Cost $7,168) | | | | | | | | | | | | | | | 5,539 | |
| | | | | | | | | | | | | | | | |
| | | | |
| | | | | | Maturity date | | | Principal | | | | |
| U.S. Treasury Securities: 6.73% | | | | | | | | | | | | | | | | |
U.S. Treasury Note | | | 1.25 | | | | 8-31-2019 | | | $ | 3,100,000 | | | | 3,086,438 | |
U.S. Treasury Note | | | 1.63 | | | | 2-15-2026 | | | | 130,000 | | | | 123,536 | |
| | | | |
Total U.S. Treasury Securities (Cost $3,222,066) | | | | | | | | | | | | | | | 3,209,974 | |
| | | | | | | | | | | | | | | | |
| | | | |
Yankee Corporate Bonds and Notes: 7.61% | | | | | | | | | | | | | | | | |
| | | | |
Energy: 1.13% | | | | | | | | | | | | | | | | |
| | | | |
| Oil, Gas & Consumable Fuels: 1.13% | | | | | | | | | | | | | | | | |
Comision Federal de Electricidad 144A | | | 4.75 | | | | 2-23-2027 | | | | 250,000 | | | | 263,125 | |
Teekay Corporation | | | 8.50 | | | | 1-15-2020 | | | | 75,000 | | | | 76,125 | |
Woodside Finance Limited 144A | | | 3.70 | | | | 3-15-2028 | | | | 200,000 | | | | 198,462 | |
| | | | |
| | | | | | | | | | | | | | | 537,712 | |
| | | | | | | | | | | | | | | | |
The accompanying notes are an integral part of these financial statements.
| | | | | | |
| Portfolio of investments—September 30, 2017 | | Wells Fargo Strategic Income Fund | | | 19 | |
| | | | | | | | | | | | | | | | |
| Security name | | Interest rate | | | Maturity date | | | Principal | | | Value | |
| | | | |
Financials: 5.18% | | | | | | | | | | | | | | | | |
| | | | |
| Banks: 3.60% | | | | | | | | | | | | | | | | |
ABN AMRO Bank NV 144A | | | 4.75 | % | | | 7-28-2025 | | | $ | 200,000 | | | $ | 212,338 | |
Banistmo SA 144A | | | 3.65 | | | | 9-19-2022 | | | | 250,000 | | | | 249,625 | |
BNP Paribas 144A | | | 3.80 | | | | 1-10-2024 | | | | 200,000 | | | | 207,831 | |
BPCE SA 144A | | | 5.15 | | | | 7-21-2024 | | | | 305,000 | | | | 328,692 | |
Credit Agricole SA (5 Year USD Swap Rate +6.19%) 144A± | | | 8.13 | | | | 12-29-2049 | | | | 265,000 | | | | 313,694 | |
Intesa Sanpaolo SpA 144A | | | 5.71 | | | | 1-15-2026 | | | | 135,000 | | | | 142,222 | |
UBS Group Funding Limited 144A | | | 4.13 | | | | 9-24-2025 | | | | 250,000 | | | | 262,881 | |
| | | | |
| | | | | | | | | | | | | | | 1,717,283 | |
| | | | | | | | | | | | | | | | |
| | | | |
| Capital Markets: 0.56% | | | | | | | | | | | | | | | | |
Credit Suisse Group AG 144A | | | 3.57 | | | | 1-9-2023 | | | | 260,000 | | | | 266,184 | |
| | | | | | | | | | | | | | | | |
| | | | |
| Insurance: 1.02% | | | | | | | | | | | | | | | | |
Qatar Reinsurance Company Limited
(5 Year USD Swap Rate +2.79%) ± | | | 4.95 | | | | 12-31-2099 | | | | 200,000 | | | | 199,000 | |
Validus Holdings Limited | | | 8.88 | | | | 1-26-2040 | | | | 200,000 | | | | 289,195 | |
| | | | |
| | | | | | | | | | | | | | | 488,195 | |
| | | | | | | | | | | | | | | | |
| | | | |
Health Care: 0.68% | | | | | | | | | | | | | | | | |
| | | | |
| Pharmaceuticals: 0.68% | | | | | | | | | | | | | | | | |
Teva Pharmaceutical Finance BV | | | 2.20 | | | | 7-21-2021 | | | | 265,000 | | | | 254,851 | |
Valeant Pharmaceuticals International Incorporated 144A | | | 5.50 | | | | 3-1-2023 | | | | 25,000 | | | | 21,938 | |
Valeant Pharmaceuticals International Incorporated 144A | | | 6.13 | | | | 4-15-2025 | | | | 25,000 | | | | 21,938 | |
Valeant Pharmaceuticals International Incorporated 144A | | | 7.00 | | | | 3-15-2024 | | | | 25,000 | | | | 26,625 | |
| | | | |
| | | | | | | | | | | | | | | 325,352 | |
| | | | | | | | | | | | | | | | |
| | | | |
Industrials: 0.44% | | | | | | | | | | | | | | | | |
| | | | |
| Commercial Services & Supplies: 0.22% | | | | | | | | | | | | | | | | |
GFL Environmental Incorporated 144A | | | 5.63 | | | | 5-1-2022 | | | | 25,000 | | | | 26,000 | |
Ritchie Brothers Auctioneers Incorporated 144A | | | 5.38 | | | | 1-15-2025 | | | | 75,000 | | | | 79,313 | |
| | | | |
| | | | | | | | | | | | | | | 105,313 | |
| | | | | | | | | | | | | | | | |
| | | | |
| Professional Services: 0.22% | | | | | | | | | | | | | | | | |
IHS Markit Limited 144A | | | 4.75 | | | | 2-15-2025 | | | | 100,000 | | | | 107,000 | |
| | | | | | | | | | | | | | | | |
| | | | |
Telecommunication Services: 0.18% | | | | | | | | | | | | | | | | |
| | | | |
| Diversified Telecommunication Services: 0.18% | | | | | | | | | | | | | | | | |
Intelsat Jackson Holdings SA | | | 5.50 | | | | 8-1-2023 | | | | 100,000 | | | | 84,750 | |
| | | | | | | | | | | | | | | | |
| | | | |
Total Yankee Corporate Bonds and Notes (Cost $3,501,300) | | | | | | | | | | | | | | | 3,631,789 | |
| | | | | | | | | | | | | | | | |
| | | | |
Yankee Government Bonds: 7.58% | | | | | | | | | | | | | | | | |
Banque Centrale de Tunisie SA | | | 5.75 | | | | 1-30-2025 | | | | 200,000 | | | | 194,545 | |
Bermuda 144A | | | 3.72 | | | | 1-25-2027 | | | | 250,000 | | | | 253,125 | |
Federal Democratic Republic of Ethiopia | | | 6.63 | | | | 12-11-2024 | | | | 200,000 | | | | 205,478 | |
Province of Cordoba 144A | | | 7.13 | | | | 8-1-2027 | | | | 400,000 | | | | 418,976 | |
Province of Santa Fe | | | 7.00 | | | | 3-23-2023 | | | | 200,000 | | | | 212,814 | |
The accompanying notes are an integral part of these financial statements.
| | | | |
| 20 | | Wells Fargo Strategic Income Fund | | Portfolio of investments—September 30, 2017 |
| | | | | | | | | | | | | | | | |
| Security name | | Interest rate | | | Maturity date | | | Principal | | | Value | |
| | | | |
Yankee Government Bonds (continued) | | | | | | | | | | | | | | | | |
Republic of Ghana | | | 9.25 | % | | | 9-15-2022 | | | $ | 400,000 | | | $ | 444,520 | |
Republic of Guatemala | | | 4.38 | | | | 6-5-2027 | | | | 250,000 | | | | 247,500 | |
Republic of Honduras | | | 6.25 | | | | 1-19-2027 | | | | 200,000 | | | | 215,192 | |
Republic of Hungary | | | 5.38 | | | | 3-25-2024 | | | | 250,000 | | | | 285,938 | |
Republic of Kazakhstan | | | 5.13 | | | | 7-21-2025 | | | | 250,000 | | | | 276,825 | |
Republic of Sri Lanka | | | 5.75 | | | | 1-18-2022 | | | | 400,000 | | | | 422,556 | |
Socialist Republic of Vietnam | | | 4.80 | | | | 11-19-2024 | | | | 200,000 | | | | 213,671 | |
The Dominican Republic | | | 6.88 | | | | 1-29-2026 | | | | 200,000 | | | | 228,092 | |
| | | | |
Total Yankee Government Bonds (Cost $3,505,702) | | | | | | | | | | | | | | | 3,619,232 | |
| | | | | | | | | | | | | | | | |
| | | | |
| | | Yield | | | | | | Shares | | | | |
| Short-Term Investments: 10.26% | | | | | | | | | | | | | | | | |
| | | | |
| Investment Companies: 9.82% | | | | | | | | | | | | | | | | |
Wells Fargo Government Money Market Select Class (l)(u)## | | | 0.92 | | | | | | | | 4,686,555 | | | | 4,686,555 | |
| | | | | | | | | | | | | | | | |
| | | | |
| | | | | | | | | Principal | | | | |
| U.S. Treasury Securities: 0.44% | | | | | | | | | | | | | | | | |
U.S. Treasury Bill (z)# | | | 1.00 | | | | 12-14-2017 | | | $ | 210,000 | | | | 209,592 | |
| | | | | | | | | | | | | | | | |
| | | | |
Total Short-Term Investments (Cost $4,896,120) | | | | | | | | | | | | | | | 4,896,147 | |
| | | | | | | | | | | | | | | | |
| | | | | | | | |
| Total investments in securities (Cost $46,616,070) | | | 99.04 | % | | | 47,265,464 | |
Other assets and liabilities, net | | | 0.96 | | | | 457,220 | |
| | | | | | | | |
| Total net assets | | | 100.00 | % | | $ | 47,722,684 | |
| | | | | | | | |
| 144A | The security may be resold in transactions exempt from registration, normally to qualified institutional buyers, pursuant to Rule 144A under the Securities Act of 1933. |
| ± | Variable rate investment. The rate shown is the rate in effect at period end. |
| %% | The security is issued on a when-issued basis. |
| ¥ | A payment-in-kind (PIK) security is a security in which the issuer may make interest or dividend payments in cash or additional securities. These additional securities generally have the same terms as the original holdings. |
| @ | Foreign bond principal is denominated in the local currency of the issuer. |
| < | All or a portion of the position represents an unfunded loan commitment. |
| ¤ | The security is issued in zero coupon form with no periodic interest payments. |
| ±± | The coupon of the security is adjusted based on the principal and interest payments received from the underlying pool of mortgages as well as the credit quality and the actual prepayment speed of the underlying mortgages. |
| † | Non-income-earning security |
| (l) | The issuer of the security is an affiliated person of the Fund as defined in the Investment Company Act of 1940. |
| (u) | The rate represents the 7-day annualized yield at period end. |
| ## | All or a portion of this security is segregated for when-issued securities and unfunded loans. |
| (z) | Zero coupon security. The rate represents the current yield to maturity. |
| # | All or a portion of this security is segregated as collateral for investments in derivative instruments. |
The accompanying notes are an integral part of these financial statements.
| | | | | | |
| Portfolio of investments—September 30, 2017 | | Wells Fargo Strategic Income Fund | | | 21 | |
Futures Contracts
| | | | | | | | | | | | | | | | | | | | | | | | |
| Description | | Number of
contracts | | | Expiration date | | | Notional cost | | | Notional value | | | Unrealized gains | | | Unrealized losses | |
Short | | | | | | | | | | | | | | | | | | | | | | | | |
Euro-Bond Futures | | | 2 | | | | 12-7-2017 | | | $ | 311,403 | | | $ | 310,083 | | | $ | 1,320 | | | $ | 0 | |
Ultra U.S. Treasury Bonds | | | 6 | | | | 12-19-2017 | | | | 1,006,191 | | | | 990,750 | | | | 15,441 | | | | 0 | |
10-Year Ultra U.S. Treasury Notes | | | 9 | | | | 12-19-2017 | | | | 1,216,578 | | | | 1,208,953 | | | | 7,625 | | | | 0 | |
10-Year U.S. Treasury Notes | | | 30 | | | | 12-19-2017 | | | | 3,815,574 | | | | 3,759,375 | | | | 56,199 | | | | 0 | |
2-Year U.S. Treasury Notes | | | 33 | | | | 12-29-2017 | | | | 7,129,932 | | | | 7,118,203 | | | | 11,729 | | | | 0 | |
5-Year U.S. Treasury Notes | | | 45 | | | | 12-29-2017 | | | | 5,329,328 | | | | 5,287,500 | | | | 41,828 | | | | 0 | |
Forward Foreign Currency Contracts
| | | | | | | | | | | | | | |
Currency to be received | | Currency to be delivered | | Counterparty¤¤ | | Settlement date | | Unrealized gains | | | Unrealized losses | |
| 384,536 USD | | 5,000,000 ZAR | | State Street | | 10-16-2017 | | $ | 16,008 | | | $ | 0 | |
| 114,135 USD | | 1,525,000 ZAR | | State Street | | 10-16-2017 | | | 1,734 | | | | 0 | |
| 155,000 CAD | | 125,534 USD | | State Street | | 10-23-2017 | | | 0 | | | | (1,292 | ) |
| 398,276 USD | | 1,275,000 BRL | | State Street | | 11-30-2017 | | | 0 | | | | (1,143 | ) |
| 91,526 USD | | 290,000 BRL | | State Street | | 11-30-2017 | | | 678 | | | | 0 | |
| 1,262,983 USD | | 1,055,000 EUR | | Citibank | | 12-29-2017 | | | 9,901 | | | | 0 | |
| | | | | | | | | | | | | | |
| | | | | | | | $ | 28,321 | | | $ | (2,435 | ) |
| | | | | | | | | | | | | | |
| | ¤¤ | Transaction can only be closed with the originating counterparty. |
Credit Default Swaps
Sell protection
| | | | | | | | | | | | | | | | | | | | | | | | | | | | | | | | | | | | |
| Reference entity | | Fixed rate
received | | | Payment frequency | | | Counterparty°° | | | Maturity date | | | Notional amount | | | Value | | | Upfront payments/ receipts | | | Unrealized gains | | | Unrealized losses | |
Markit CDX Emerging Markets Index | | | 1.00 | % | | | Quarterly | | | | JPMorgan | | | | 6-20-2022 | | | $ | 950,000 | | | $ | (29,636 | ) | | $ | (33,395 | ) | | $ | 3,759 | | | $ | 0 | |
Markit CDX North America Investment Grade Index | | | 1.00 | | | | Quarterly | | | | JPMorgan | | | | 6-20-2022 | | | | 650,000 | | | | 13,883 | | | | 12,917 | | | | 966 | | | | 0 | |
Markit CDX North America High Yield Index | | | 5.00 | | | | Quarterly | | | | JPMorgan | | | | 6-20-2022 | | | | 475,000 | | | | 37,242 | | | | 33,276 | | | | 3,966 | | | | 0 | |
Markit iTraxx Europe Index | | | 1.00 | | | | Quarterly | | | | JPMorgan | | | | 6-20-2022 | | | | 1,025,000 | | | | 29,987 | | | | 22,290 | | | | 7,697 | | | | 0 | |
Markit iTraxx Europe Crossover Index | | | 5.00 | | | | Quarterly | | | | JPMorgan | | | | 6-20-2022 | | | | 50,000 | | | | 7,518 | | | | 6,869 | | | | 649 | | | | 0 | |
| | | | | | | | | | | | | | | | | | | | | | | | | | | | | | | | | | | | |
| | | | | | | | | | | | | | | | | | | | | | | | | | $ | 41,957 | | | $ | 17,037 | | | $ | 0 | |
| | | | | | | | | | | | | | | | | | | | | | | | | | | | | | | | | | | | |
| | °° | Exchange traded or centrally cleared transaction with counterparty |
Investments in Affiliates
An affiliated investment is an investment in which the Fund owns at least 5% of the outstanding voting shares of the issuer or as a result of other relationships, such as the Fund and the issuer having the same investment manager. Transactions with issuers that were either affiliated persons of the Fund at the beginning of the period or the end of the period were as follows:
| | | | | | | | | | | | | | | | | | | | | | | | | | | | | | | | | | | | |
| | | Shares, beginning of period | | | Shares purchased | | | Shares sold | | | Shares, end of period | | | Net realized gains (losses) | | | Net change in unrealized gains (losses) | | | Income from affiliated securities | | | Value, end of period | | | % of
net
assets | |
| | | | | | | | | |
Short-Term Investments | | | | | | | | | | | | | | | | | | | | | | | | | | | | | | | | | | | | |
| | | | | | | | | |
Investment companies | | | | | | | | | | | | | | | | | | | | | | | | | | | | | | | | | | | | |
Wells Fargo Government Money Market Fund Select Class | | | 1,867,108 | | | | 45,996,999 | | | | 43,177,552 | | | | 4,686,555 | | | $ | 0 | | | $ | 0 | | | $ | 21,306 | | | $ | 4,686,555 | | | | 9.82 | % |
Affiliated securities no longer held at end of period | | | | | | | | | | | | | | | | | | | 0 | | | | 0 | | | | 538 | | | | 0 | | | | 0.00 | |
| | | | | | | | | | | | | | | | | | | | | | | | | | | | | | | | | | | | |
| | | | | | | | | | | | | | | | | | $ | 0 | | | $ | 0 | | | $ | 21,844 | | | $ | 4,686,555 | | | | 9.82 | % |
| | | | | | | | | | | | | | | | | | | | | | | | | | | | | | | | | | | | |
The accompanying notes are an integral part of these financial statements.
| | | | |
| 22 | | Wells Fargo Strategic Income Fund | | Statement of assets and liabilities—September 30, 2017 |
| | | | |
| | | | |
| |
Assets | | | | |
Investments in unaffiliated securities, at value (cost $41,929,515) | | $ | 42,578,909 | |
Investments in affiliated securities, at value (cost $4,686,555) | | | 4,686,555 | |
Segregated cash for swaps | | | 221,289 | |
Receivable for investments sold | | | 913,561 | |
Receivable for Fund shares sold | | | 1,815 | |
Receivable for interest | | | 372,401 | |
Receivable for daily variation margin on open futures contracts | | | 20,086 | |
Receivable for securities lending income | | | 94 | |
Unrealized gains on credit default swap transactions | | | 17,037 | |
Premiums paid on credit default swap transactions | | | 75,352 | |
Unrealized gains on forward foreign currency contracts | | | 28,321 | |
Receivable from manager | | | 3,395 | |
Prepaid expenses and other assets | | | 44,200 | |
| | | | |
Total assets | | | 48,963,015 | |
| | | | |
| |
Liabilities | | | | |
Payable for investments purchased | | | 1,122,202 | |
Premiums received on credit default swap transactions | | | 33,395 | |
Administration fees payable | | | 3,214 | |
Payable for daily variation margin on open futures contracts | | | 2,517 | |
Unrealized losses on forward foreign currency contracts | | | 2,435 | |
Payable for Fund shares redeemed | | | 496 | |
Distribution fee payable | | | 256 | |
Due to custodian bank, foreign currency, at value (cost $185) | | | 201 | |
Accrued expenses and other liabilities | | | 75,615 | |
| | | | |
Total liabilities | | | 1,240,331 | |
| | | | |
Total net assets | | $ | 47,722,684 | |
| | | | |
| |
NET ASSETS CONSIST OF | | | | |
Paid-in capital | | $ | 48,386,905 | |
Undistributed net investment income | | | 144,601 | |
Accumulated net realized losses on investments | | | (1,634,283 | ) |
Net unrealized gains on investments | | | 825,461 | |
| | | | |
Total net assets | | $ | 47,722,684 | |
| | | | |
| |
COMPUTATION OF NET ASSET VALUE AND OFFERING PRICE PER SHARE | | | | |
Net assets – Class A | | $ | 896,335 | |
Shares outstanding – Class A1 | | | 93,498 | |
Net asset value per share – Class A | | | $9.59 | |
Maximum offering price per share – Class A2 | | | $9.99 | |
Net assets – Class C | | $ | 402,505 | |
Shares outstanding – Class C1 | | | 42,048 | |
Net asset value per share – Class C | | | $9.57 | |
Net assets – Administrator Class | | $ | 562,146 | |
Shares outstanding – Administrator Class1 | | | 58,512 | |
Net asset value per share – Administrator Class | | | $9.61 | |
Net assets – Institutional Class | | $ | 45,861,698 | |
Shares outstanding – Institutional Class1 | | | 4,786,776 | |
Net asset value per share – Institutional Class | | | $9.58 | |
| 1 | The Fund has an unlimited number of authorized shares. |
| 2 | Maximum offering price is computed as 100/96 of net asset value. On investments of $50,000 or more, the offering price is reduced. |
The accompanying notes are an integral part of these financial statements.
| | | | | | |
| Statement of operations—year ended September 30, 2017 | | Wells Fargo Strategic Income Fund | | | 23 | |
| | | | |
| | | | |
| |
Investment income | | | | |
Interest (net of foreign interest withholding taxes of $7,244) | | $ | 1,459,962 | |
Income from affiliated securities | | | 21,844 | |
Dividends | | | 15,117 | |
| | | | |
Total investment income | | | 1,496,923 | |
| | | | |
| |
Expenses | | | | |
Management fee | | | 182,100 | |
Administration fees | | | | |
Class A | | | 2,067 | |
Class C | | | 896 | |
Administrator Class | | | 506 | |
Institutional Class | | | 25,862 | |
Shareholder servicing fees | | | | |
Class A | | | 3,230 | |
Class C | | | 1,400 | |
Administrator Class | | | 1,265 | |
Distribution fee | | | | |
Class C | | | 4,200 | |
Custody and accounting fees | | | 57,784 | |
Professional fees | | | 62,736 | |
Registration fees | | | 68,444 | |
Shareholder report expenses | | | 50,458 | |
Trustees’ fees and expenses | | | 20,969 | |
Other fees and expenses | | | 15,971 | |
| | | | |
Total expenses | | | 497,888 | |
Less: Fee waivers and/or expense reimbursements | | | (279,259 | ) |
| | | | |
Net expenses | | | 218,629 | |
| | | | |
Net investment income | | | 1,278,294 | |
| | | | |
| |
REALIZED AND UNREALIZED GAINS (LOSSES) ON INVESTMENTS | | | | |
| |
Net realized gains (losses) on: | | | | |
Unaffiliated securities | | | (190,512 | ) |
Futures transactions | | | 87,767 | |
Forward foreign currency contract transactions | | | (163,333 | ) |
Credit default swap transactions | | | 265 | |
| | | | |
Net realized losses on investments | | | (265,813 | ) |
| | | | |
| |
Net change in unrealized gains (losses) on: | | | | |
Unaffiliated securities | | | 909,245 | |
Futures transactions | | | 147,147 | |
Forward foreign currency contract transactions | | | 75,986 | |
Credit default swap transactions | | | 17,037 | |
| | | | |
Net change in unrealized gains (losses) on investments | | | 1,149,415 | |
| | | | |
Net realized and unrealized gains (losses) on investments | | | 883,602 | |
| | | | |
Net increase in net assets resulting from operations | | $ | 2,161,896 | |
| | | | |
The accompanying notes are an integral part of these financial statements.
| | | | |
| 24 | | Wells Fargo Strategic Income Fund | | Statement of changes in net assets |
| | | | | | | | | | | | | | | | | | | | | | | | |
| | | Year ended September 30, 2017 | | | Year ended September 30, 20161 | | | Year ended October 31, 2015 | |
| | | | | | |
Operations | | | | | | | | | | | | | | | | | | | | | | | | |
Net investment income | | | | | | $ | 1,278,294 | | | | | | | $ | 890,629 | | | | | | | $ | 1,317,175 | |
Net realized losses on investments | | | | | | | (265,813 | ) | | | | | | | (919,157 | ) | | | | | | | (1,296,981 | ) |
Net change in unrealized gains (losses) on investments | | | | | | | 1,149,415 | | | | | | | | 988,102 | | | | | | | | (666,689 | ) |
| | | | |
Net increase (decrease) in net assets resulting from operations | | | | | | | 2,161,896 | | | | | | | | 959,574 | | | | | | | | (646,495 | ) |
| | | | |
| | | | | | |
Distributions to shareholders from | | | | | | | | | | | | | | | | | | | | | | | | |
Net investment income | | | | | | | | | | | | | | | | | | | | | | | | |
Class A | | | | | | | (28,157 | ) | | | | | | | (13,014 | ) | | | | | | | (21,334 | ) |
Class C | | | | | | | (9,306 | ) | | | | | | | (6,442 | ) | | | | | | | (14,917 | ) |
Administrator Class | | | | | | | (12,437 | ) | | | | | | | (7,355 | ) | | | | | | | (12,399 | ) |
Institutional Class | | | | | | | (841,651 | ) | | | | | | | (365,738 | ) | | | | | | | (935,496 | ) |
Tax basis return of capital | | | | | | | | | | | | | | | | | | | | | | | | |
Class A | | | | | | | 0 | | | | | | | | (5,130 | ) | | | | | | | (2,416 | ) |
Class C | | | | | | | 0 | | | | | | | | (2,540 | ) | | | | | | | (1,689 | ) |
Administrator Class | | | | | | | 0 | | | | | | | | (2,900 | ) | | | | | | | (1,404 | ) |
Institutional Class | | | | | | | 0 | | | | | | | | (144,185 | ) | | | | | | | (105,941 | ) |
| | | | |
Total distributions to shareholders | | | | | | | (891,551 | ) | | | | | | | (547,304 | ) | | | | | | | (1,095,596 | ) |
| | | | |
| | | | | | |
Capital share transactions | | | Shares | | | | | | | | Shares | | | | | | | | Shares | | | | | |
Proceeds from shares sold | | | | | | | | | | | | | | | | | | | | | | | | |
Class A | | | 321,165 | | | | 2,992,396 | | | | 117,382 | | | | 1,055,716 | | | | 44,768 | | | | 426,513 | |
Class C | | | 13,178 | | | | 122,066 | | | | 12,099 | | | | 109,873 | | | | 5,907 | | | | 55,667 | |
Administrator Class | | | 57,991 | | | | 545,062 | | | | 9,037 | | | | 83,300 | | | | 0 | | | | 0 | |
Institutional Class | | | 2,906,247 | | | | 27,435,661 | | | | 621,194 | | | | 5,533,801 | | | | 190,379 | | | | 1,736,500 | |
| | | | |
| | | | | | | 31,095,185 | | | | | | | | 6,782,690 | | | | | | | | 2,218,680 | |
| | | | |
Reinvestment of distributions | | | | | | | | | | | | | | | | | | | | | | | | |
Class A | | | 2,995 | | | | 27,934 | | | | 1,995 | | | | 17,957 | | | | 2,260 | | | | 21,553 | |
Class C | | | 1,010 | | | | 9,306 | | | | 979 | | | | 8,774 | | | | 1,740 | | | | 16,606 | |
Administrator Class | | | 1,323 | | | | 12,409 | | | | 1,137 | | | | 10,255 | | | | 1,443 | | | | 13,803 | |
Institutional Class | | | 89,616 | | | | 841,651 | | | | 56,806 | | | | 509,923 | | | | 109,213 | | | | 1,041,437 | |
| | | | |
| | | | | | | 891,300 | | | | | | | | 546,909 | | | | | | | | 1,093,399 | |
| | | | |
Payment for shares redeemed | | | | | | | | | | | | | | | | | | | | | | | | |
Class A | | | (343,855 | ) | | | (3,221,808 | ) | | | (107,748 | ) | | | (971,689 | ) | | | (18,900 | ) | | | (178,898 | ) |
Class C | | | (55,235 | ) | | | (514,171 | ) | | | (8,141 | ) | | | (73,072 | ) | | | (15,520 | ) | | | (148,738 | ) |
Administrator Class | | | (65,078 | ) | | | (611,345 | ) | | | (14 | ) | | | (129 | ) | | | (4,192 | ) | | | (39,990 | ) |
Institutional Class | | | (717,532 | ) | | | (6,786,658 | ) | | | (90,476 | ) | | | (795,724 | ) | | | (2,358,709 | ) | | | (22,270,242 | ) |
| | | | |
| | | | | | | (11,133,982 | ) | | | | | | | (1,840,614 | ) | | | | | | | (22,637,868 | ) |
| | | | |
Net increase (decrease) in net assets resulting from capital share transactions | | | | | | | 20,852,503 | | | | | | | | 5,488,985 | | | | | | | | (19,325,789 | ) |
| | | | |
Total increase (decrease) in net assets | | | | | | | 22,122,848 | | | | | | | | 5,901,255 | | | | | | | | (21,067,880 | ) |
| | | | |
| | | | | | |
Net assets | | | | | | | | | | | | | | | | | | | | | | | | |
Beginning of period | | | | | | | 25,599,836 | | | | | | | | 19,698,581 | | | | | | | | 40,766,461 | |
| | | | |
End of period | | | | | | $ | 47,722,684 | | | | | | | $ | 25,599,836 | | | | | | | $ | 19,698,581 | |
| | | | |
Undistributed net investment income | | | | | | $ | 144,601 | | | | | | | $ | 49,038 | | | | | | | $ | 44,882 | |
| | | | |
| 1 | For the eleven months ended September 30, 2016. The Fund changed its fiscal year end from October 31 to September 30, effective September 30, 2016. |
The accompanying notes are an integral part of these financial statements.
| | | | | | |
| Financial highlights | | Wells Fargo Strategic Income Fund | | | 25 | |
(For a share outstanding throughout each period)
| | | | | | | | | | | | | | | | | | | | |
| | | Year ended September 30 | | | Year ended October 31 | |
| CLASS A | | 2017 | | | 20161 | | | 2015 | | | 2014 | | | 20132 | |
Net asset value, beginning of period | | | $9.25 | | | | $9.13 | | | | $9.72 | | | | $9.66 | | | | $10.00 | |
Net investment income | | | 0.33 | 3 | | | 0.31 | | | | 0.34 | | | | 0.37 | | | | 0.27 | |
Net realized and unrealized gains (losses) on investments | | | 0.22 | | | | (0.01 | ) | | | (0.69 | ) | | | (0.05 | ) | | | (0.36 | ) |
| | | | | | | | | | | | | | | | | | | | |
Total from investment operations | | | 0.55 | | | | 0.30 | | | | (0.35 | ) | | | 0.32 | | | | (0.09 | ) |
Distributions to shareholders from | | | | | | | | | | | | | | | | | | | | |
Net investment income | | | (0.21 | ) | | | (0.13 | ) | | | (0.22 | ) | | | (0.26 | ) | | | (0.25 | ) |
Tax basis return of capital | | | 0.00 | | | | (0.05 | ) | | | (0.02 | ) | | | 0.00 | | | | 0.00 | |
| | | | | | | | | | | | | | | | | | | | |
Total distributions to shareholders | | | (0.21 | ) | | | (0.18 | ) | | | (0.24 | ) | | | (0.26 | ) | | | (0.25 | ) |
Net asset value, end of period | | | $9.59 | | | | $9.25 | | | | $9.13 | | | | $9.72 | | | | $9.66 | |
Total return4 | | | 6.05 | % | | | 3.34 | % | | | (3.64 | )% | | | 3.36 | % | | | (0.89 | )% |
Ratios to average net assets (annualized) | | | | | | | | | | | | | | | | | | | | |
Gross expenses | | | 1.78 | % | | | 1.80 | % | | | 1.63 | % | | | 1.51 | % | | | 1.85 | % |
Net expenses | | | 0.90 | % | | | 0.90 | % | | | 0.90 | % | | | 0.90 | % | | | 0.90 | % |
Net investment income | | | 3.47 | % | | | 3.85 | % | | | 3.77 | % | | | 4.02 | % | | | 3.76 | % |
Supplemental data | | | | | | | | | | | | | | | | | | | | |
Portfolio turnover rate | | | 65 | % | | | 52 | % | | | 53 | % | | | 51 | % | | | 39 | % |
Net assets, end of period (000s omitted) | | | $896 | | | | $1,047 | | | | $928 | | | | $714 | | | | $518 | |
| 1 | For the eleven months ended September 30, 2016. The Fund changed its fiscal year end from October 31 to September 30, effective September 30, 2016. |
| 2 | For the period from January 31, 2013 (commencement of class operations) to October 31, 2013 |
| 3 | Calculated based upon average shares outstanding |
| 4 | Total return calculations do not include any sales charges. Returns for periods of less than one year are not annualized. |
The accompanying notes are an integral part of these financial statements.
| | | | |
| 26 | | Wells Fargo Strategic Income Fund | | Financial highlights |
(For a share outstanding throughout each period)
| | | | | | | | | | | | | | | | | | | | |
| | | Year ended September 30 | | | Year ended October 31 | |
| CLASS C | | 2017 | | | 20161 | | | 2015 | | | 2014 | | | 20132 | |
Net asset value, beginning of period | | | $9.22 | | | | $9.10 | | | | $9.71 | | | | $9.65 | | | | $10.00 | |
Net investment income | | | 0.29 | | | | 0.25 | | | | 0.28 | | | | 0.31 | | | | 0.21 | |
Net realized and unrealized gains (losses) on investments | | | 0.18 | | | | (0.02 | ) | | | (0.68 | ) | | | (0.06 | ) | | | (0.37 | ) |
| | | | | | | | | | | | | | | | | | | | |
Total from investment operations | | | 0.47 | | | | 0.23 | | | | (0.40 | ) | | | 0.25 | | | | (0.16 | ) |
Distributions to shareholders from | | | | | | | | | | | | | | | | | | | | |
Net investment income | | | (0.12 | ) | | | (0.08 | ) | | | (0.19 | ) | | | (0.19 | ) | | | (0.19 | ) |
Tax basis return of capital | | | 0.00 | | | | (0.03 | ) | | | (0.02 | ) | | | 0.00 | | | | 0.00 | |
| | | | | | | | | | | | | | | | | | | | |
Total distributions to shareholders | | | (0.12 | ) | | | (0.11 | ) | | | (0.21 | ) | | | (0.19 | ) | | | (0.19 | ) |
Net asset value, end of period | | | $9.57 | | | | $9.22 | | | | $9.10 | | | | $9.71 | | | | $9.65 | |
Total return3 | | | 5.20 | % | | | 2.67 | % | | | (4.35 | )% | | | 2.61 | % | | | (1.51 | )% |
Ratios to average net assets (annualized) | | | | | | | | | | | | | | | | | | | | |
Gross expenses | | | 2.59 | % | | | 2.54 | % | | | 2.37 | % | | | 2.25 | % | | | 2.60 | % |
Net expenses | | | 1.65 | % | | | 1.65 | % | | | 1.65 | % | | | 1.65 | % | | | 1.65 | % |
Net investment income | | | 2.80 | % | | | 3.10 | % | | | 3.02 | % | | | 3.25 | % | | | 3.01 | % |
Supplemental data | | | | | | | | | | | | | | | | | | | | |
Portfolio turnover rate | | | 65 | % | | | 52 | % | | | 53 | % | | | 51 | % | | | 39 | % |
Net assets, end of period (000s omitted) | | | $403 | | | | $766 | | | | $711 | | | | $835 | | | | $518 | |
| 1 | For the eleven months ended September 30, 2016. The Fund changed its fiscal year end from October 31 to September 30, effective September 30, 2016. |
| 2 | For the period from January 31, 2013 (commencement of class operations) to October 31, 2013 |
| 3 | Total return calculations do not include any sales charges. Returns for periods of less than one year are not annualized. |
The accompanying notes are an integral part of these financial statements.
| | | | | | |
| Financial highlights | | Wells Fargo Strategic Income Fund | | | 27 | |
(For a share outstanding throughout each period)
| | | | | | | | | | | | | | | | | | | | |
| | | Year ended September 30 | | | Year ended October 31 | |
| ADMINISTRATOR CLASS | | 2017 | | | 20161 | | | 2015 | | | 2014 | | | 20132 | |
Net asset value, beginning of period | | | $9.29 | | | | $9.16 | | | | $9.74 | | | | $9.66 | | | | $10.00 | |
Net investment income | | | 0.34 | 3 | | | 0.33 | 3 | | | 0.37 | | | | 0.39 | | | | 0.28 | |
Net realized and unrealized gains (losses) on investments | | | 0.20 | | | | (0.01 | ) | | | (0.70 | ) | | | (0.05 | ) | | | (0.37 | ) |
| | | | | | | | | | | | | | | | | | | | |
Total from investment operations | | | 0.54 | | | | 0.32 | | | | (0.33 | ) | | | 0.34 | | | | (0.09 | ) |
Distributions to shareholders from | | | | | | | | | | | | | | | | | | | | |
Net investment income | | | (0.22 | ) | | | (0.14 | ) | | | (0.22 | ) | | | (0.26 | ) | | | (0.25 | ) |
Tax basis return of capital | | | 0.00 | | | | (0.05 | ) | | | (0.03 | ) | | | 0.00 | | | | 0.00 | |
| | | | | | | | | | | | | | | | | | | | |
Total distributions to shareholders | | | (0.22 | ) | | | (0.19 | ) | | | (0.25 | ) | | | (0.26 | ) | | | (0.25 | ) |
Net asset value, end of period | | | $9.61 | | | | $9.29 | | | | $9.16 | | | | $9.74 | | | | $9.66 | |
Total return4 | | | 5.91 | % | | | 3.52 | % | | | (3.51 | )% | | | 3.63 | % | | | (0.85 | )% |
Ratios to average net assets (annualized) | | | | | | | | | | | | | | | | | | | | |
Gross expenses | | | 1.72 | % | | | 1.74 | % | | | 1.56 | % | | | 1.46 | % | | | 1.79 | % |
Net expenses | | | 0.75 | % | | | 0.75 | % | | | 0.75 | % | | | 0.75 | % | | | 0.75 | % |
Net investment income | | | 3.64 | % | | | 4.00 | % | | | 3.92 | % | | | 4.18 | % | | | 3.90 | % |
Supplemental data | | | | | | | | | | | | | | | | | | | | |
Portfolio turnover rate | | | 65 | % | | | 52 | % | | | 53 | % | | | 51 | % | | | 39 | % |
Net assets, end of period (000s omitted) | | | $562 | | | | $597 | | | | $496 | | | | $554 | | | | $496 | |
| 1 | For the eleven months ended September 30, 2016. The Fund changed its fiscal year end from October 31 to September 30, effective September 30, 2016. |
| 2 | For the period from January 31, 2013 (commencement of class operations) to October 31, 2013 |
| 3 | Calculated based upon average shares outstanding |
| 4 | Returns for periods of less than one year are not annualized. |
The accompanying notes are an integral part of these financial statements.
| | | | |
| 28 | | Wells Fargo Strategic Income Fund | | Financial highlights |
(For a share outstanding throughout each period)
| | | | | | | | | | | | | | | | | | | | |
| | | Year ended September 30 | | | Year ended October 31 | |
| INSTITUTIONAL CLASS | | 2017 | | | 20161 | | | 2015 | | | 2014 | | | 20132 | |
Net asset value, beginning of period | | | $9.24 | | | | $9.14 | | | | $9.71 | | | | $9.66 | | | | $10.00 | |
Net investment income | | | 0.35 | 3 | | | 0.34 | | | | 0.40 | | | | 0.41 | 3 | | | 0.29 | |
Net realized and unrealized gains (losses) on investments | | | 0.24 | | | | (0.02 | ) | | | (0.71 | ) | | | (0.07 | ) | | | (0.36 | ) |
| | | | | | | | | | | | | | | | | | | | |
Total from investment operations | | | 0.59 | | | | 0.32 | | | | (0.31 | ) | | | 0.34 | | | | (0.07 | ) |
Distributions to shareholders from | | | | | | | | | | | | | | | | | | | | |
Net investment income | | | (0.25 | ) | | | (0.16 | ) | | | (0.23 | ) | | | (0.29 | ) | | | (0.27 | ) |
Tax basis return of capital | | | 0.00 | | | | (0.06 | ) | | | (0.03 | ) | | | 0.00 | | | | 0.00 | |
| | | | | | | | | | | | | | | | | | | | |
Total distributions to shareholders | | | (0.25 | ) | | | (0.22 | ) | | | (0.26 | ) | | | (0.29 | ) | | | (0.27 | ) |
Net asset value, end of period | | | $9.58 | | | | $9.24 | | | | $9.14 | | | | $9.71 | | | | $9.66 | |
Total return4 | | | 6.43 | % | | | 3.55 | % | | | (3.28 | )% | | | 3.60 | % | | | (0.66 | )% |
Ratios to average net assets (annualized) | | | | | | | | | | | | | | | | | | | | |
Gross expenses | | | 1.40 | % | | | 1.46 | % | | | 1.19 | % | | | 1.14 | % | | | 1.52 | % |
Net expenses | | | 0.60 | % | | | 0.60 | % | | | 0.60 | % | | | 0.60 | % | | | 0.60 | % |
Net investment income | | | 3.71 | % | | | 4.16 | % | | | 4.04 | % | | | 4.25 | % | | | 4.05 | % |
Supplemental data | | | | | | | | | | | | | | | | | | | | |
Portfolio turnover rate | | | 65 | % | | | 52 | % | | | 53 | % | | | 51 | % | | | 39 | % |
Net assets, end of period (000s omitted) | | | $45,862 | | | | $23,190 | | | | $17,564 | | | | $38,664 | | | | $23,338 | |
| 1 | For the eleven months ended September 30, 2016. The Fund changed its fiscal year end from October 31 to September 30, effective September 30, 2016. |
| 2 | For the period from January 31, 2013 (commencement of class operations) to October 31, 2013 |
| 3 | Calculated based upon average shares outstanding |
| 4 | Returns for periods of less than one year are not annualized. |
The accompanying notes are an integral part of these financial statements.
| | | | | | |
| Notes to financial statements | | Wells Fargo Strategic Income Fund | | | 29 | |
1. ORGANIZATION
Wells Fargo Funds Trust (the “Trust”), a Delaware statutory trust organized on March 10, 1999, is an open-end management investment company registered under the Investment Company Act of 1940, as amended (the “1940 Act”). As an investment company, the Trust follows the accounting and reporting guidance in Financial Accounting Standards Board Accounting Standards Codification Topic 946, Financial Services – Investment Companies. These financial statements report on the Wells Fargo Strategic Income Fund (the “Fund”) which is a diversified series of the Trust.
2. SIGNIFICANT ACCOUNTING POLICIES
The following significant accounting policies, which are consistently followed in the preparation of the financial statements of the Fund, are in conformity with U.S. generally accepted accounting principles which require management to make estimates and assumptions that affect the reported amounts of assets and liabilities, disclosure of contingent assets and liabilities at the date of the financial statements, and the reported amounts of revenues and expenses during the reporting period. Actual results could differ from those estimates.
Securities valuation
All investments are valued each business day as of the close of regular trading on the New York Stock Exchange (generally 4 p.m. Eastern Time), although the Fund may deviate from this calculation time under unusual or unexpected circumstances.
Debt securities are valued at the evaluated bid price provided by an independent pricing service or, if a reliable price is not available, the quoted bid price from an independent broker-dealer.
Equity securities and futures that are listed on a foreign or domestic exchange or market are valued at the official closing price or, if none, the last sales price. If no sale occurs on the principal exchange or market that day, a fair value price will be determined in accordance with the Fund’s Valuation Procedures.
Non-listed swaps are valued at the evaluated price provided by an independent pricing service or, if a reliable price is not available, the quoted bid price from an independent broker-dealer.
The values of securities denominated in foreign currencies are translated into U.S. dollars at rates provided by an independent foreign currency pricing source at a time each business day specified by the Management Valuation Team of Wells Fargo Funds Management, LLC (“Funds Management”).
Investments in registered open-end investment companies are valued at net asset value. Interests in non-registered investment companies that are redeemable at net asset value are fair valued normally at net asset value.
Investments which are not valued using any of the methods discussed above are valued at their fair value, as determined in good faith by the Board of Trustees of the Fund. The Board of Trustees has established a Valuation Committee comprised of the Trustees and has delegated to it the authority to take any actions regarding the valuation of portfolio securities that the Valuation Committee deems necessary or appropriate, including determining the fair value of portfolio securities, unless the determination has been delegated to the Management Valuation Team. The Board of Trustees retains the authority to make or ratify any valuation decisions or approve any changes to the Valuation Procedures as it deems appropriate. On a quarterly basis, the Board of Trustees receives reports on any valuation actions taken by the Valuation Committee or the Management Valuation Team which may include items for ratification.
Valuations of fair valued securities are compared to the next actual sales price when available, or other appropriate market values, to assess the continued appropriateness of the fair valuation methodologies used. These securities are fair valued on a day-to-day basis, taking into consideration changes to appropriate market information and any significant changes to the inputs considered in the valuation process until there is a readily available price provided on an exchange or by an independent pricing service. Valuations received from an independent pricing service or independent broker-dealer quotes are periodically validated by comparisons to most recent trades and valuations provided by other independent pricing services in addition to the review of prices by the manager and/or subadviser. Unobservable inputs used in determining fair valuations are identified based on the type of security, taking into consideration factors utilized by market participants in valuing the investment, knowledge about the issuer and the current market environment.
Foreign currency translation
The accounting records of the Fund are maintained in U.S. dollars. The values of other assets and liabilities denominated in foreign currencies are translated into U.S. dollars at rates provided by an independent foreign currency pricing source at a time each business day specified by the Management Valuation Team. Purchases and sales of securities, and income and expenses are converted at the rate of exchange on the respective dates of such transactions. Net realized foreign
| | | | |
| 30 | | Wells Fargo Strategic Income Fund | | Notes to financial statements |
exchange gains or losses arise from sales of foreign currencies, currency gains or losses realized between the trade and settlement dates on securities transactions, and the difference between the amounts of dividends, interest and foreign withholding taxes recorded and the U.S. dollar equivalent of the amounts actually paid or received. Net unrealized foreign exchange gains and losses arise from changes in the fair value of assets and liabilities other than investments in securities resulting from changes in exchange rates. The changes in net assets arising from changes in exchange rates of securities and the changes in net assets resulting from changes in market prices of securities are not separately presented. Such changes are included in net realized and unrealized gains or losses from investments.
Forward foreign currency contracts
The Fund is subject to foreign currency risk in the normal course of pursuing its investment objectives. A forward foreign currency contract is an agreement between two parties to purchase or sell a specific currency for an agreed-upon price at a future date. The Fund enters into forward foreign currency contracts to facilitate transactions in foreign-denominated securities and to attempt to minimize the risk to the Fund from adverse changes in the relationship between currencies. Forward foreign currency contracts are recorded at the forward rate and marked-to-market daily. When the contracts are closed, realized gains and losses arising from such transactions are recorded as realized gains or losses on forward foreign currency contract transactions. The Fund could be exposed to risks if the counterparties to the contracts are unable to meet the terms of their contracts or if the value of the foreign currency changes unfavorably. The Fund’s maximum risk of loss from counterparty credit risk is the unrealized gains on the contracts. This risk may be mitigated if there is a master netting arrangement between the Fund and the counterparty.
Security loans
The Fund may lend its securities from time to time in order to earn additional income in the form of fees or interest on securities received as collateral or the investment of any cash received as collateral. The Fund continues to receive interest or dividends on the securities loaned. The Fund receives collateral in the form of cash or securities with a value at least equal to the value of the securities on loan. The value of the loaned securities is determined at the close of each business day and any additional required collateral is delivered to the Fund on the next business day. In a securities lending transaction, the net asset value of the Fund will be affected by an increase or decrease in the value of the securities loaned and by an increase or decrease in the value of the instrument in which collateral is invested. The amount of securities lending activity undertaken by the Fund fluctuates from time to time. In the event of default or bankruptcy by the borrower, the Fund may be prevented from recovering the loaned securities or gaining access to the collateral or may experience delays or costs in doing so. In addition, the investment of any cash collateral received may lose all or part of its value. The Fund has the right under the lending agreement to recover the securities from the borrower on demand.
The Fund lends its securities through an unaffiliated securities lending agent. Cash collateral received in connection with its securities lending transactions is invested in Securities Lending Cash Investments, LLC (the “Securities Lending Fund”). The Securities Lending Fund is exempt from registration under Section 3(c)(7) of the 1940 Act and is managed by Funds Management and is subadvised by Wells Capital Management Incorporated (“WellsCap”), an affiliate of Funds Management and an indirect wholly owned subsidiary of Wells Fargo & Company (“Wells Fargo”). Funds Management receives an advisory fee starting at 0.05% and declining to 0.01% as the average daily net assets of the Securities Lending Fund increase. All of the fees received by Funds Management are paid to WellsCap for its services as subadviser. The Securities Lending Fund seeks to provide a positive return compared to the daily Fed Funds Open Rate by investing in high-quality, U.S. dollar-denominated short-term money market instruments. Securities Lending Fund investments are valued at the evaluated bid price provided by an independent pricing service. Income earned from investment in the Securities Lending Fund is included in income from affiliates securities on the Statement of Operations.
When-issued transactions
The Fund may purchase securities on a forward commitment or when-issued basis. The Fund records a when-issued transaction on the trade date and will segregate assets in an amount at least equal in value to the Fund’s commitment to purchase when-issued securities. Securities purchased on a when-issued basis are marked-to-market daily and the Fund begins earning interest on the settlement date. Losses may arise due to changes in the market value of the underlying securities or if the counterparty does not perform under the contract.
Loans
The Fund may invest in direct debt instruments which are interests in amounts owed to lenders by corporate or other borrowers. The loans pay interest at rates which are periodically reset by reference to a base lending rate plus a spread. Investments in loans may be in the form of participations in loans or assignments of all or a portion of loans from third parties. When the Fund purchases participations, it generally has no rights to enforce compliance with terms of the loan agreement with the borrower. As a result, the Fund assumes the credit risk of both the borrower and the lender that is
| | | | | | |
| Notes to financial statements | | Wells Fargo Strategic Income Fund | | | 31 | |
selling the participation. When the Fund purchases assignments from lenders, it acquires direct rights against the borrower on the loan and may enforce compliance by the borrower with the terms of the loan agreement. Loans may include fully funded term loans or unfunded loan commitments, which are contractual obligations for future funding.
Futures contracts
The Fund is subject to interest rate risk in the normal course of pursuing its investment objectives. The Fund may buy and sell futures contracts in order to gain exposure to, or protect against, changes in interest rates. The primary risks associated with the use of futures contracts are the imperfect correlation between changes in market values of securities held by the Fund and the prices of futures contracts, and the possibility of an illiquid market.
The aggregate principal amounts of the contracts are not recorded in the financial statements. Fluctuations in the value of the contracts are recorded in the Statement of Assets and Liabilities as an asset or liability and in the Statement of Operations as unrealized gains or losses until the contracts are closed, at which point they are recorded as net realized gains or losses on futures contracts. With futures contracts, there is minimal counterparty risk to the Fund since futures are exchange traded and the exchange’s clearinghouse, as counterparty to all exchange traded futures, guarantees the futures against default.
Credit default swaps
The Fund is subject to credit risk in the normal course of pursuing its investment objectives. The Fund may enter into credit default swap contracts for hedging or speculative purposes to provide or receive a measure of protection against default on a referenced entity, obligation or index or for investment gains. Credit default swaps involve an exchange of a stream of payments for protection against the loss in value of an underlying security or index. Under the terms of the swap, one party acts as a guarantor (referred to as the seller of protection) and receives a periodic stream of payments, provided that there is no credit event, from another party (referred to as the buyer of protection) that is a fixed percentage applied to a notional principal amount over the term of the swap. An index credit default swap references all the names in the index, and if a credit event is triggered, the credit event is settled based on that name’s weight in the index. A credit event includes bankruptcy, failure to pay, obligation default, obligation acceleration, repudiation/moratorium, and restructuring. The Fund may enter into credit default swaps as either the seller of protection or the buyer of protection. As the seller of protection, the Fund is subject to investment exposure on the notional amount of the swap and has assumed the risk of default of the underlying security or index. As the buyer of protection, the Fund could be exposed to risks if the seller of the protection defaults on its obligation to perform, or if there are unfavorable changes in the fluctuation of interest rates. The maximum potential amount of future payments (undiscounted) that the Fund as the seller of protection could be required to make under the credit default swap contract would be an amount equal to the notional amount of the swap contract. The Fund’s maximum risk of loss from counterparty risk, either as the protection seller or as the protection buyer, is the fair value of the contract. This risk is mitigated by having a master netting arrangement between the Fund and the counterparty and by having the counterparty post collateral to cover the Fund’s exposure to the counterparty.
If the Fund is the seller of protection and a credit event occurs, as defined under the terms of that particular swap agreement, the Fund will pay to the buyer of protection the notional amount of the swap and take delivery of the referenced obligation or underlying securities comprising the referenced index. If the Fund is the buyer of protection and a credit event occurs, as defined under the terms of that particular swap agreement, the Fund will receive from the seller of protection the notional amount of the swap and deliver the referenced obligation or underlying securities comprising the referenced index.
Any premiums paid or received on the transactions are recorded as an asset or liability on the Statement of Assets and Liabilities and amortized. The value of the swap contract is marked-to-market daily based on quotations from an independent pricing service or an independent broker-dealer and any change in value is recorded as an unrealized gain or loss. Periodic payments made or received are recorded as realized gains or losses. In addition, payments received or made as a result of a credit event or termination of the contract are recognized as realized gains or losses.
Certain credit default swap contracts entered into by the Fund provide for conditions that result in events of default or termination that enable the counterparty to the agreement to cause an early termination of the transactions under those agreements.
Security transactions and income recognition
Securities transactions are recorded on a trade date basis. Realized gains or losses are recorded on the basis of identified cost.
Dividend income is recognized on the ex-dividend date.
| | | | |
| 32 | | Wells Fargo Strategic Income Fund | | Notes to financial statements |
Interest income is accrued daily and bond discounts are accreted and premiums are amortized daily based on the effective interest method. To the extent debt obligations are placed on non-accrual status, any related interest income may be reduced by writing off interest receivables when the collection of all or a portion of interest has been determined to be doubtful based on consistently applied procedures and the fair value has decreased. If the issuer subsequently resumes interest payments or when the collectability of interest is reasonably assured, the debt obligation is removed from non-accrual status.
Income from foreign securities is recorded net of foreign taxes withheld where recovery of such taxes is not assured.
Distributions to shareholders
Distributions to shareholders from net investment income and net realized gains, if any, are recorded on the ex-dividend date. Such distributions are determined in accordance with income tax regulations and may differ from U.S. generally accepted accounting principles. Dividend sources are estimated at the time of declaration. The tax character of distributions is determined as of the Fund’s fiscal year end. Therefore, a portion of the Fund’s distributions made prior to the Fund’s fiscal year end may be categorized as a tax return of capital.
Federal and other taxes
The Fund intends to continue to qualify as a regulated investment company by distributing substantially all of its investment company taxable income and any net realized capital gains (after reduction for capital loss carryforwards) sufficient to relieve it from all, or substantially all, federal income taxes. Accordingly, no provision for federal income taxes was required.
The Fund’s income and federal excise tax returns and all financial records supporting those returns for the prior three fiscal years are subject to examination by the federal and Delaware revenue authorities. Management has analyzed the Fund’s tax positions taken on federal, state, and foreign tax returns for all open tax years and does not believe that there are any uncertain tax positions that require recognition of a tax liability.
As of September 30, 2017, the aggregate cost of all investments for federal income tax purposes was $46,802,681 and the unrealized gains (losses) consisted of:
| | | | |
Gross unrealized gains | | $ | 903,945 | |
Gross unrealized losses | | | (264,097 | ) |
Net unrealized gains | | $ | 639,848 | |
Reclassifications are made to the Fund’s capital accounts for permanent tax differences to reflect income and gains available for distribution (or available capital loss carryforwards) under federal income tax regulations. U.S. generally accepted accounting principles require that certain components of net assets be adjusted to reflect permanent differences between financial and tax reporting. These reclassifications have no effect on net assets or net asset values per share. The primary permanent difference causing such reclassifications is due to foreign currency transactions. At September 30, 2017, as a result of permanent book-to-tax differences, the following reclassification adjustments were made on the Statement of Assets and Liabilities:
| | |
Undistributed net investment income | | Accumulated net realized losses on investments |
| $(291,180) | | $291,180 |
As of September 30, 2017, the Fund had capital loss carryforwards which consist of $536,005 in short-term capital losses and $881,299 in long-term capital losses.
As of September 30, 2017, the Fund had current year deferred post-October capital losses consisting of $71,469 in short-term losses which will be recognized on the first day of the following fiscal year.
Class allocations
The separate classes of shares offered by the Fund differ principally in applicable sales charges, distribution, shareholder servicing, and administration fees. Class specific expenses are charged directly to that share class. Investment income, common expenses, and realized and unrealized gains (losses) on investments are allocated daily to each class of shares based on the relative proportion of net assets of each class.
| | | | | | |
| Notes to financial statements | | Wells Fargo Strategic Income Fund | | | 33 | |
3. FAIR VALUATION MEASUREMENTS
Fair value measurements of investments are determined within a framework that has established a fair value hierarchy based upon the various data inputs utilized in determining the value of the Fund’s investments. The three-level hierarchy gives the highest priority to unadjusted quoted prices in active markets for identical assets or liabilities (Level 1) and the lowest priority to unobservable inputs (Level 3). The Fund’s investments are classified within the fair value hierarchy based on the lowest level of input that is significant to the fair value measurement. The inputs are summarized into three broad levels as follows:
| ∎ | | Level 1 – quoted prices in active markets for identical securities |
| ∎ | | Level 2 – other significant observable inputs (including quoted prices for similar securities, interest rates, prepayment speeds, credit risk, etc.) |
| ∎ | | Level 3 – significant unobservable inputs (including the Fund’s own assumptions in determining the fair value of investments) |
The inputs or methodologies used for valuing investments in securities are not necessarily an indication of the risk associated with investing in those securities.
The following is a summary of the inputs used in valuing the Fund’s assets and liabilities as of September 30, 2017:
| | | | | | | | | | | | | | | | |
| | | Quoted prices
(Level 1) | | | Other significant
observable inputs
(Level 2) | | | Significant
unobservable inputs (Level 3) | | | Total | |
Assets | | | | | | | | | | | | | | | | |
Investments in: | | | | | | | | | | | | | | | | |
| | | | |
Asset-backed securities | | $ | 0 | | | $ | 3,511,804 | | | $ | 0 | | | $ | 3,511,804 | |
| | | | |
Corporate bonds and notes | | | 0 | | | | 11,585,060 | | | | 0 | | | | 11,585,060 | |
| | | | |
Exchange-traded funds | | | 251,723 | | | | 0 | | | | 0 | | | | 251,723 | |
| | | | |
Foreign corporate bonds and notes | | | 0 | | | | 1,801,437 | | | | 0 | | | | 1,801,437 | |
| | | | |
Foreign government bonds | | | 0 | | | | 3,873,898 | | | | 0 | | | | 3,873,898 | |
| | | | |
Loans | | | 0 | | | | 4,635,578 | | | | 0 | | | | 4,635,578 | |
| | | | |
Municipal obligations | | | 0 | | | | 1,705,690 | | | | 0 | | | | 1,705,690 | |
| | | | |
Non-agency mortgage-backed securities | | | 0 | | | | 4,537,593 | | | | 0 | | | | 4,537,593 | |
| | | | |
Rights | | | | | | | | | | | | | | | | |
Utilities | | | 0 | | | | 5,539 | | | | 0 | | | | 5,539 | |
| | | | |
U.S. Treasury securities | | | 3,209,974 | | | | 0 | | | | 0 | | | | 3,209,974 | |
| | | | |
Yankee corporate bonds and notes | | | 0 | | | | 3,631,789 | | | | 0 | | | | 3,631,789 | |
| | | | |
Yankee government bonds | | | 0 | | | | 3,619,232 | | | | 0 | | | | 3,619,232 | |
| | | | |
Short-term investments | | | | | | | | | | | | | | | | |
Investment companies | | | 4,686,555 | | | | 0 | | | | 0 | | | | 4,686,555 | |
U.S. Treasury securities | | | 209,592 | | | | 0 | | | | 0 | | | | 209,592 | |
| | | 8,357,844 | | | | 38,907,620 | | | | 0 | | | | 47,265,464 | |
Credit default swap contracts | | | 0 | | | | 92,389 | | | | 0 | | | | 92,389 | |
Forward foreign currency contracts | | | 0 | | | | 28,321 | | | | 0 | | | | 28,321 | |
Futures contracts | | | 20,086 | | | | 0 | | | | 0 | | | | 20,086 | |
Total assets | | $ | 8,377,930 | | | $ | 39,028,330 | | | $ | 0 | | | $ | 47,406,260 | |
Liabilities | | | | | | | | | | | | | | | | |
Credit default swap contracts | | $ | 0 | | | $ | 33,395 | | | $ | 0 | | | $ | 33,395 | |
Forward foreign currency contracts | | | 0 | | | | 2,435 | | | | 0 | | | | 2,435 | |
Futures contracts | | | 2,517 | | | | 0 | | | | 0 | | | | 2,517 | |
Total liabilities | | $ | 2,517 | | | $ | 35,830 | | | $ | 0 | | | $ | 38,347 | |
| | | | |
| 34 | | Wells Fargo Strategic Income Fund | | Notes to financial statements |
Forward foreign currency contracts are reported at their unrealized gains (losses) at measurement date, which represents the change in the contract’s value from trade date. Futures contracts are reported at their variation margin at measurement date, which represents the amount due to/from the Fund at that date. Swap contracts consists of unrealized gains (losses) and premiums paid or received on swap contracts, which represents the change in the contract’s value from trade date. All other assets and liabilities are reported at their market value at measurement date.
The Fund recognizes transfers between levels within the fair value hierarchy at the end of the reporting period. At September 30, 2017, the Fund did not have any transfers into/out of Level 1, Level 2, or Level 3.
4. TRANSACTIONS WITH AFFILIATES AND OTHER EXPENSES
Management fee
Funds Management, an indirect wholly owned subsidiary of Wells Fargo, is the manager of the Fund and provides advisory and fund-level administrative services under an investment management agreement. Under the investment management agreement, Funds Management is responsible for, among other services, implementing the investment objectives and strategies of the Fund, supervising the subadvisers, providing fund-level administrative services in connection with the Fund’s operations, and providing any other fund-level administrative services reasonably necessary for the operation of the Fund. As compensation for its services under the investment management agreement, Funds Management is entitled to receive an annual management fee starting at 0.525% and declining to 0.405% as the average daily net assets of the Fund increase. For the year ended September 30, 2017, the management fee was equivalent to an annual rate of 0.525% of the Fund’s average daily net assets.
Funds Management has retained the services of certain subadvisers to provide daily portfolio management to the Fund. The fee for subadvisory services is borne by Funds Management. WellsCap is a subadviser to the Fund and is entitled to receive a fee from Funds Management at an annual rate starting at 0.30% and declining to 0.15% as the average daily net assets of the Fund increase. First International Advisors, LLC, an affiliate of Funds Management and an indirect, wholly owned subsidiary of Wells Fargo, is also a subadviser to the Fund and is entitled to receive a fee from Funds Management at an annual rate starting at 0.35% and declining to 0.20% as the average daily net assets of the Fund increase.
Administration fees
Under a class-level administration agreement, Funds Management provides class-level administrative services to the Fund, which includes paying fees and expenses for services provided by the transfer agent, sub-transfer agents, omnibus account servicers and record-keepers. As compensation for its services under the class-level administration agreement, Funds Management receives an annual fee which is calculated based on the average daily net assets of each class as follows:
| | | | |
| | | Class-level
administration fee | |
Class A, Class C | | | 0.16 | % |
Administrator Class | | | 0.10 | |
Institutional Class | | | 0.08 | |
Funds Management has contractually waived and/or reimbursed management and administration fees to the extent necessary to maintain certain net operating expense ratios for the Fund. Waiver of fees and/or reimbursement of expenses by Funds Management were made first from fund level expenses on a proportionate basis and then from class specific expenses. Funds Management has committed through January 31, 2018 to waive fees and/or reimburse expenses to the extent necessary to cap the Fund’s expenses at 0.90% for Class A shares, 1.65% for Class C shares, 0.75% for Administrator Class shares, and 0.60% for Institutional Class shares. After this time, the cap may be increased or the commitment to maintain the cap may be terminated only with the approval of the Board of Trustees.
During the year ended September 30, 2017, State Street Bank and Trust Company (“State Street’), the Fund’s custodian, reimbursed the Fund $42 for certain out-of-pocket expenses that were billed to the Fund in error from 1998-2015. This amount is included in interest income on the Statement of Operations. In addition, Funds Management was also reimbursed $4,509 by State Street for waivers/reimbursements it made to the Fund to limit Fund expenses during the period the Fund was erroneously billed.
| | | | | | |
| Notes to financial statements | | Wells Fargo Strategic Income Fund | | | 35 | |
Distribution fee
The Trust has adopted a distribution plan for Class C shares of the Fund pursuant to Rule 12b-1 under the 1940 Act. A distribution fee is charged to Class C shares and paid to Wells Fargo Funds Distributor, LLC (“Funds Distributor”), the principal underwriter, at an annual rate of 0.75% of the average daily net assets of Class C shares.
In addition, Funds Distributor is entitled to receive the front-end sales charge from the purchase of Class A shares and a contingent deferred sales charge on the redemption of certain Class A shares. Funds Distributor is also entitled to receive the contingent deferred sales charges from redemptions of Class C shares. For the year ended September 30, 2017, Funds Distributor received $55 from the sale of Class A shares. No contingent deferred sales charges were incurred by Class A and Class C shares for the year ended September 30, 2017.
Shareholder servicing fees
The Trust has entered into contracts with one or more shareholder servicing agents, whereby Class A, Class C, and Administrator Class of the Fund are charged a fee at an annual rate of 0.25% of the average daily net assets of each respective class.
A portion of these total shareholder servicing fees were paid to affiliates of Wells Fargo.
Interfund transactions
The Fund may purchase or sell portfolio investment securities to certain other Wells Fargo affiliates pursuant to Rule 17a-7 of the 1940 Act and under procedures adopted by the Board of Trustees. The procedures have been designed to ensure that these interfund transactions, which do not incur broker commissions, are effected at current market prices. Pursuant to these procedures, the Fund had $430,750 and $1,288,328 in interfund purchases and sales, respectively, during the year ended September 30, 2017.
5. INVESTMENT PORTFOLIO TRANSACTIONS
Purchases and sales of investments, excluding U.S. government obligations (if any) and short-term securities were as follows:
| | | | | | |
Purchases at cost | | Sales proceeds |
U.S.
government | | Non-U.S.
government | | U.S.
government | | Non-U.S.
government |
| $5,991,094 | | $35,052,650 | | $2,891,688 | | $17,113,437 |
As of September 30, 2017, the Fund had unfunded term loan commitments of $100,000.
6. DERIVATIVE TRANSACTIONS
During the year ended September 30, 2017, the Fund entered into futures contracts and forward foreign currency contracts to manage duration exposure and for economic hedging purposes; and credit default swap contracts as a substitute for taking a position in the underlying security or basket of securities or to potentially enhance the Fund’s total return.
The table below discloses the volume of the Fund’s derivative transactions during the year and any segregated cash at September 30, 2017.
| | | | |
Futures contracts | | | | |
Average notional balance on long futures | | $ | 244,527 | |
Average notional balance on short futures | | | 7,628,227 | |
| |
Forward foreign currency contracts | | | | |
Average contract amounts to buy | | $ | 722,452 | |
Average contract amounts to sell | | | 2,384,982 | |
| |
Credit default swaps | | | | |
Average notional balance | | $ | 1,100,274 | |
Segregated cash at September 30, 2017 | | | 221,289 | |
The Fund’s credit default swap may contain provisions for early termination in the event the net assets of the Fund declines below specific levels identified by the counterparty. If these levels are triggered, the counterparty may terminate the transaction and seek payment or request full collateralization of the derivative transactions in net liability positions. On September 30, 2017, the aggregate fair value of credit defaults swap with net asset contingent features that were in a liability position amounted to $29,636.
| | | | |
| 36 | | Wells Fargo Strategic Income Fund | | Notes to financial statements |
A summary of the location of derivative instruments on the financial statements by primary risk exposure is outlined following tables.
The fair value of derivative instruments as of September 30, 2017 was as follows for the Fund:
| | | | | | | | | | | | |
| | | Asset derivatives | | | Liability derivatives | |
| | | Statement of Assets and
Liabilities location | | Fair value | | | Statement of Assets and
Liabilities location | | Fair value | |
Interest rate risk | | Receivable for daily variation margin on open futures contracts | | $ | 20,086 | * | | Payable for daily variation margin on open futures contracts | | $ | 2,517 | * |
Foreign currency risk | | Unrealized gains on forward foreign currency contracts | | | 28,321 | | | Unrealized losses on forward foreign currency contracts | | | 2,435 | |
Credit risk | | Unrealized gains on credit default swap transactions | | | 92,389 | ** | | Premiums received on credit default swap transactions | | | 33,395 | |
| | | | | $ | 140,796 | | | | | $ | 38,347 | |
| * | Only the current day’s variation margin as of September 30, 2017 is reported separately on the Statement of Assets and Liabilities. |
| ** | Amount includes premiums paid on swap contracts. |
The effect of derivative instruments on the Statement of Operations for the year ended September 30, 2017 was as follows for the Fund:
| | | | | | | | | | | | | | | | | | | | | | | | |
| | | Amount of realized gains (losses) on derivatives | | | Change in unrealized gains on derivatives | |
| | | Futures contracts | | | Forward currency
contracts | | | Credit
default
swaps | | | Futures contracts | | | Forward currency
contracts | | | Credit
default
swaps | |
Interest rate risk | | $ | 87,767 | | | $ | 0 | | | $ | 0 | | | $ | 147,147 | | | $ | 0 | | | $ | 0 | |
Forward currency risk | | | 0 | | | | (163,333 | ) | | | 0 | | | | 0 | | | | 75,986 | | | | 0 | |
Credit risk | | | 0 | | | | 0 | | | | 265 | | | | 0 | | | | 0 | | | | 17,037 | |
| | | $ | 87,767 | | | $ | (163,333 | ) | | $ | 265 | | | $ | 147,147 | | | $ | 75,986 | | | $ | 17,037 | |
For certain types of derivative transactions, the Fund has entered into International Swaps and Derivatives Association, Inc. master agreements (“ISDA Master Agreements”) or similar agreements with approved counterparties. The ISDA Master Agreements or similar agreements may have requirements to deliver/deposit securities or cash to/with an exchange or broker-dealer as collateral and allows the Fund to offset, with each counterparty, certain derivative financial instrument’s assets and/or liabilities with collateral held or pledged. Collateral requirements differ by type of derivative. Collateral or margin requirements are set by the broker or exchange clearinghouse for exchange traded derivatives while collateral terms are contract specific for over-the-counter traded derivatives. Cash collateral that has been pledged to cover obligations of the Fund under ISDA Master Agreements or similar agreements, if any, are reported separately in the Statement of Assets and Liabilities. Securities pledged as collateral, if any, are noted in the Portfolio of Investments. With respect to balance sheet offsetting, absent an event of default by the counterparty or a termination of the agreement, the reported amounts of financial assets and financial liabilities in the Statement of Assets and Liabilities are not offset across transactions between the Fund and the applicable counterparty. A reconciliation of the gross amounts on the Statement of Assets and Liabilities to the net amounts by derivative type, including any collateral exposure, is as follows:
| | | | | | | | | | | | | | | | |
| Counterparty | | Gross amounts
of assets in the
Statement of
Assets and
Liabilities | | | Amounts subject to
netting
agreements | | | Collateral
received | | | Net amount
of assets | |
Citibank | | $ | 9,901 | | | $ | 0 | | | $ | 0 | | | $ | 9,901 | |
JPMorgan | | | 112,475 | | | | (35,912 | ) | | | 0 | | | | 76,563 | |
State Street | | | 18,420 | | | | (2,435 | ) | | | 0 | | | | 15,985 | |
| | | | | | |
| Notes to financial statements | | Wells Fargo Strategic Income Fund | | | 37 | |
| | | | | | | | | | | | | | | | |
| Counterparty | | Gross amounts
of liabilities in the
Statement of
Assets and
Liabilities | | | Amounts
subject to
netting
agreements | | | Collateral
pledged | | | Net amount
of liabilities | |
JPMorgan | | $ | 35,912 | | | $ | (35,912 | ) | | $ | 0 | | | $ | 0 | |
State Street | | | 2,435 | | | | (2,435 | ) | | | 0 | | | | 0 | |
7. BANK BORROWINGS
The Trust (excluding the money market funds and certain other funds) and Wells Fargo Variable Trust are parties to a $280,000,000 revolving credit agreement whereby the Fund is permitted to use bank borrowings for temporary or emergency purposes, such as to fund shareholder redemption requests. Interest under the credit agreement is charged to the Fund based on a borrowing rate equal to the higher of the Federal Funds rate in effect on that day plus 1.25% or the overnight LIBOR rate in effect on that day plus 1.25%. In addition, an annual commitment fee equal to 0.25% of the unused balance is allocated to each participating fund. Prior to August 29, 2017, the revolving credit agreement amount was $250,000,000.
For the year ended September 30, 2017, there were no borrowings by the Fund under the agreement.
8. DISTRIBUTIONS TO SHAREHOLDERS
The tax character of distributions paid were as follows:
| | | | | | | | | | | | |
| | | Year ended September 30 | | | Year ended October 31 | |
| | | 2017 | | | 20161 | | | 2015 | |
Ordinary income | | $ | 891,551 | | | $ | 392,549 | | | $ | 984,146 | |
Tax basis return of capital | | | 0 | | | | 154,755 | | | | 111,450 | |
| 1 | For the eleven months ended September 30, 2016. The Fund changed its fiscal year end from October 31 to September 30, effective September 30, 2016. |
As of September 30, 2017, the components of distributable earnings on a tax basis were as follows:
| | | | | | |
Undistributed ordinary income | | Unrealized gains | | Post-October capital losses deferred | | Capital loss carryforward |
| $185,704 | | $638,848 | | $(71,469) | | $(1,417,304) |
9. INDEMNIFICATION
Under the Trust’s organizational documents, the officers and Trustees have been granted certain indemnification rights against certain liabilities that may arise out of performance of their duties to the Trust. Additionally, in the normal course of business, the Trust may enter into contracts with service providers that contain a variety of indemnification clauses. The Trust’s maximum exposure under these arrangements is dependent on future claims that may be made against the Fund and, therefore, cannot be estimated.
10. SUBSEQUENT DISTRIBUTIONS
On October 25, 2017, the Fund declared distributions from net investment income to shareholders of record on October 24, 2017. The per share amounts payable on October 26, 2017 were as follows:
| | | | |
| | | Net investment income | |
Class A | | $ | 0.02913 | |
Class C | | | 0.02319 | |
Administrator Class | | | 0.02937 | |
Institutional Class | | | 0.03144 | |
These distributions are not reflected in the accompanying financial statements.
| | | | |
| 38 | | Wells Fargo Strategic Income Fund | | Report of independent registered public accounting firm |
BOARD OF TRUSTEES AND SHAREHOLDERS OF WELLS FARGO FUNDS TRUST:
We have audited the accompanying statement of assets and liabilities, including the portfolio of investments, of the Wells Fargo Strategic Income Fund (the “Fund”), one of the funds constituting the Wells Fargo Funds Trust, as of September 30, 2017, and the related statement of operations for the year then ended, the statements of changes in net assets for the year then ended, for the period ended September 30, 2016, and for the year ended October 31, 2015, and the financial highlights for the year then ended, for the period ended September 30, 2016, and for each of the years or periods in the period from January 31, 2013 (commencement of operations) to October 31, 2015. These financial statements and financial highlights are the responsibility of the Fund’s management. Our responsibility is to express an opinion on these financial statements and financial highlights based on our audits.
We conducted our audits in accordance with the standards of the Public Company Accounting Oversight Board (United States). Those standards require that we plan and perform the audit to obtain reasonable assurance about whether the financial statements and financial highlights are free of material misstatement. An audit includes examining, on a test basis, evidence supporting the amounts and disclosures in the financial statements. Our procedures included confirmation of securities owned as of September 30, 2017, by correspondence with the custodian and brokers, or by other appropriate auditing procedures. An audit also includes assessing the accounting principles used and significant estimates made by management, as well as evaluating the overall financial statement presentation. We believe that our audits provide a reasonable basis for our opinion.
In our opinion, the financial statements and financial highlights referred to above present fairly, in all material respects, the financial position of the Wells Fargo Strategic Income Fund as of September 30, 2017, the results of its operations for the year then ended, the changes in its net assets for the year then ended, for the period ended September 30, 2016, and for the year ended October 31, 2015, and the financial highlights for the year then ended, for the period ended September 30, 2016, and for each of the years or periods in the period from January 31, 2013 (commencement of operations) to October 31, 2015, in conformity with U.S. generally accepted accounting principles.

Boston, Massachusetts
November 22, 2017
| | | | | | |
| Other information (unaudited) | | Wells Fargo Strategic Income Fund | | | 39 | |
TAX INFORMATION
For corporate shareholders, pursuant to Section 854 of the Internal Revenue Code, 1.40% of ordinary income dividends qualify for the corporate dividends-received deduction for the fiscal year ended September 30, 2017.
Pursuant to Section 854 of the Internal Revenue Code, $12,511 of income dividends paid during the fiscal year ended September 30, 2017 has been designated as qualified dividend income (QDI).
For the fiscal year ended September 30, 2017, $604,115 has been designated as interest-related dividends for nonresident alien shareholders pursuant to Section 871 of the Internal Revenue Code.
PROXY VOTING INFORMATION
A description of the policies and procedures that the Fund uses to determine how to vote proxies relating to portfolio securities is available, upon request, by calling 1-800-222-8222, visiting our website at wellsfargofunds.com, or visiting the SEC website at sec.gov. Information regarding how the Fund voted proxies relating to portfolio securities during the most recent 12-month period ended June 30 is available on the Fund’s website at wellsfargofunds.com or by visiting the SEC website at sec.gov.
PORTFOLIO HOLDINGS INFORMATION
The complete portfolio holdings for the Fund are publicly available monthly on the Fund’s website (wellsfargofunds.com), on a one-month delayed basis. In addition, top ten holdings information (excluding derivative positions) for the Fund is publicly available on the Fund’s website on a monthly, seven-day or more delayed basis. The Fund files its complete schedule of portfolio holdings with the SEC for the first and third quarters of each fiscal year on Form N-Q, which is available by visiting the SEC website at sec.gov. In addition, the Fund’s Form N-Q may be reviewed and copied at the SEC’s Public Reference Room in Washington, DC, and at regional offices in New York City, at 233 Broadway, and in Chicago, at 175 West Jackson Boulevard, Suite 900. Information about the Public Reference Room may be obtained by calling 1-800-SEC-0330.
| | | | |
| 40 | | Wells Fargo Strategic Income Fund | | Other information (unaudited) |
BOARD OF TRUSTEES AND OFFICERS
Each of the Trustees and Officers1 listed in the table below acts in identical capacities for each fund in the Wells Fargo family of funds, which consists of 152 mutual funds comprising the Wells Fargo Funds Trust, Wells Fargo Variable Trust, Wells Fargo Master Trust and four closed-end funds (collectively the “Fund Complex”). This table should be read in conjunction with the Prospectus and the Statement of Additional Information2. The mailing address of each Trustee and Officer is 525 Market Street, 12th Floor, San Francisco, CA 94105. Each Trustee and Officer serves an indefinite term, however, each Trustee serves such term until reaching the mandatory retirement age established by the Trustees.
Independent Trustees
| | | | | | |
Name and year of birth | | Position held and length of service* | | Principal occupations during past five years or longer | | Current other public company or
investment company
directorships |
William R. Ebsworth (Born 1957) | | Trustee, since 2015 | | Retired. From 1984 to 2013, equities analyst, portfolio manager, research director and chief investment officer at Fidelity Management and Research Company in Boston, Tokyo, and Hong Kong and retired in 2013 as Chief Investment Officer of Fidelity Strategic Advisers, Inc. where he led a team of investment professionals managing client assets. Prior thereto, Board member of Hong Kong Securities Clearing Co., Hong Kong Options Clearing Corp., the Thailand International Fund, Ltd., Fidelity Investments Life Insurance Company, and Empire Fidelity Investments Life Insurance Company. Board member of the Forté Foundation (non-profit organization) and the Vincent Memorial Hospital Endowment (non-profit organization), where he serves on the Investment Committee and as a Chair of the Audit Committee. Mr. Ebsworth is a CFA® charterholder. | | Asset Allocation Trust |
Jane A. Freeman (Born 1953) | | Trustee, since 2015 | | Retired. From 2012 to 2014 and 1999 to 2008, Chief Financial Officer of Scientific Learning Corporation. From 2008 to 2012, Ms. Freeman provided consulting services related to strategic business projects. Prior to 1999, Portfolio Manager at Rockefeller & Co. and Scudder, Stevens & Clark. Board member of the Harding Loevner Funds from 1996 to 2014, serving as both Lead Independent Director and chair of the Audit Committee. Board member of the Russell Exchange Traded Funds Trust from 2011 to 2012 and the chair of the Audit Committee. Ms. Freeman is a Board Member of Ruth Bancroft Garden (non-profit organization) and an inactive chartered financial analyst. | | Asset Allocation Trust |
Peter G. Gordon** (Born 1942) | | Trustee, since 1998; Chairman, since 2005 | | Co-Founder, Retired Chairman, President and CEO of Crystal Geyser Water Company. Trustee Emeritus, Colby College. | | Asset Allocation Trust |
Isaiah Harris, Jr. (Born 1952) | | Trustee, since 2009 | | Retired. Chairman of the Board of CIGNA Corporation since 2009, and Director since 2005. From 2003 to 2011, Director of Deluxe Corporation. Prior thereto, President and CEO of BellSouth Advertising and Publishing Corp. from 2005 to 2007, President and CEO of BellSouth Enterprises from 2004 to 2005 and President of BellSouth Consumer Services from 2000 to 2003. Emeritus member of the Iowa State University Foundation Board of Governors. Emeritus Member of the Advisory Board of Iowa State University School of Business. Advisory Board Member, Palm Harbor Academy (charter school). Advisory Board Member, Child Evangelism Fellowship (non-profit). Mr. Harris is a certified public accountant (inactive status). | | CIGNA Corporation; Asset Allocation Trust |
Judith M. Johnson (Born 1949) | | Trustee, since 2008; Audit Committee Chairman, since 2008 | | Retired. Prior thereto, Chief Executive Officer and Chief Investment Officer of Minneapolis Employees Retirement Fund from 1996 to 2008. Ms. Johnson is an attorney, certified public accountant and a certified managerial accountant. | | Asset Allocation Trust |
David F. Larcker (Born 1950) | | Trustee, since 2009 | | James Irvin Miller Professor of Accounting at the Graduate School of Business, Stanford University, Director of the Corporate Governance Research Initiative and Senior Faculty of The Rock Center for Corporate Governance since 2006. From 2005 to 2008, Professor of Accounting at the Graduate School of Business, Stanford University. Prior thereto, Ernst & Young Professor of Accounting at The Wharton School, University of Pennsylvania from 1985 to 2005. | | Asset Allocation Trust |
| | | | | | |
| Other information (unaudited) | | Wells Fargo Strategic Income Fund | | | 41 | |
| | | | | | |
Name and year of birth | | Position held and length of service* | | Principal occupations during past five years or longer | | Current other public company or
investment company
directorships |
Olivia S. Mitchell (Born 1953) | | Trustee, since 2006 | | International Foundation of Employee Benefit Plans Professor, Wharton School of the University of Pennsylvania since 1993. Director of Wharton’s Pension Research Council and Boettner Center on Pensions & Retirement Research, and Research Associate at the National Bureau of Economic Research. Previously, Cornell University Professor from 1978 to 1993. | | Asset Allocation Trust |
Timothy J. Penny (Born 1951) | | Trustee, since 1996:
Vice Chairman,
since 2017 | | President and Chief Executive Officer of Southern Minnesota Initiative Foundation, a non-profit organization, since 2007 and Senior Fellow at the Humphrey Institute Policy Forum at the University of Minnesota since 1995. Member of the Board of Trustees of NorthStar Education Finance, Inc., a non-profit organization, since 2007. | | Asset Allocation Trust |
| Michael S. Scofield (Born 1943) | | Trustee, since 2010 | | Served on the Investment Company Institute’s Board of Governors and Executive Committee from 2008-2011 as well the Governing Council of the Independent Directors Council from 2006-2011 and the Independent Directors Council Executive Committee from 2008-2011. Chairman of the IDC from 2008-2010. Trustee of the Evergreen Funds complex (and its predecessors) from 1984 to 2010. Chairman of the Evergreen Funds from 2000-2010. Former Trustee of the Mentor Funds. Retired Attorney, Law Offices of Michael S. Scofield. | | Asset Allocation Trust |
| * | Length of service dates reflect the Trustee’s commencement of service with the Trust’s predecessor entities, where applicable. |
| ** | Peter Gordon is expected to retire on December 31, 2017. |
Advisory Board Members
| | | | | | |
Name and year of birth | | Position held and length of service | | Principal occupations during past five years or longer | | Current other public company or
investment company
directorships |
| James G. Polisson (Born 1959) | | Advisory Board Member, since 2017 | | Retired. Chief Marketing Officer, Source (ETF) UK Services, Ltd, from 2015 to 2017. From 2012 to 2015, Principal of The Polisson Group, LLC, a management consulting, corporate advisory and principal investing company. Chief Executive Officer and Managing Director at Russell Investments, Global Exchange Traded Funds from 2010 to 2012. Managing Director of Barclays Global Investors from 1998 to 2010 and Global Chief Marketing Officer for iShares and Barclays Global Investors from 2000 to 2010. Prior thereto, Vice President, Fidelity Retail Mutual Fund Group from 1996 to 1998 and Risk Management Practice Manager, Fidelity Consulting from 1995 to 1996. Board member of the Russell Exchange Traded Fund Trust from 2011 to 2012. Director of Barclays Global Investors Holdings Deutschland GmbH from 2006 to 2009. Mr. Polisson is an attorney and has a retired status with the Massachusetts and District of Columbia Bar Associations. | | None |
Pamela Wheelock (Born 1959) | | Advisory Board Member, since 2017 | | Chief Operating Officer, Twin Cities Habitat for Humanity, since January, 2017. Vice President of University Services, University of Minnesota from 2012 to 2017. Prior thereto, Interim President and Chief Executive Officer of Blue Cross Blue Shield of Minnesota from 2010 to 2011, Chairman of the Board from 2009 to 2011 and Board Director from 2003 to 2015. Vice President, Leadership and Community Engagement, Bush Foundation, Saint Paul, Minnesota (a private foundation) from 2009 to 2011. Executive Vice President and Chief Financial Officer, Minnesota Sports and Entertainment from 2004 to 2009 and Senior Vice President from 2002 to 2004. Commissioner of Finance, State of Minnesota, from 1999 to 2002. Currently on the Board of Directors, Governance Committee and Finance Committee, for the Minnesota Philanthropy Partners (Saint Paul Foundation) since 2012 and Board Chair of the Minnesota Wild Foundation since 2010. | | None |
| | | | |
| 42 | | Wells Fargo Strategic Income Fund | | Other information (unaudited) |
Officers
| | | | | | |
Name and year of birth | | Position held and
length of service | | Principal occupations during past five years or longer | | |
Andrew Owen (Born 1960) | | President, since 2017 | | Executive Vice President of Wells Fargo & Company and Head of Affiliated Managers, Wells Fargo Asset Management, since 2014. In addition, Mr. Owen is currently President, Chief Executive Officer and Director of Wells Fargo Funds Management, LLC since 2017. Prior thereto, Executive Vice President responsible for marketing, investments and product development for Wells Fargo Funds Management, LLC, from 2009 to 2014. | | |
Nancy Wiser1 (Born 1967) | | Treasurer, since 2012 | | Executive Vice President of Wells Fargo Funds Management, LLC since 2011. Chief Operating Officer and Chief Compliance Officer at LightBox Capital Management LLC, from 2008 to 2011. | | |
C. David Messman (Born 1960) | | Secretary, since 2000; Chief Legal Officer, since 2003 | | Senior Vice President and Secretary of Wells Fargo Funds Management, LLC since 2001. Assistant General Counsel of Wells Fargo Bank, N.A. since 2013 and Vice President and Managing Counsel of Wells Fargo Bank, N.A. from 1996 to 2013. | | |
Michael H. Whitaker (Born 1967) | | Chief Compliance Officer, since 2016 | | Senior Vice President and Chief Compliance Officer since 2016. Senior Vice President and Chief Compliance Officer for Fidelity Investments from 2007 to 2016. | | |
David Berardi (Born 1975) | | Assistant Treasurer, since 2009 | | Vice President of Wells Fargo Funds Management, LLC since 2009. Vice President of Evergreen Investment Management Company, LLC from 2008 to 2010. Manager of Fund Reporting and Control for Evergreen Investment Management Company, LLC from 2004 to 2010. | | |
Jeremy DePalma1 (Born 1974) | | Assistant Treasurer, since 2009 | | Senior Vice President of Wells Fargo Funds Management, LLC since 2009. Senior Vice President of Evergreen Investment Management Company, LLC from 2008 to 2010 and head of the Fund Reporting and Control Team within Fund Administration from 2005 to 2010. | | |
| 1 | Nancy Wiser acts as Treasurer of 76 funds in the Fund Complex. Jeremy DePalma acts as Treasurer of 76 funds and Assistant Treasurer of 76 funds in the Fund Complex. |
| 2 | The Statement of Additional Information includes additional information about the Trustees and is available, without charge, upon request, by calling 1-800-222-8222 or by visiting the website at wellsfargofunds.com. |
| | | | | | |
| Other information (unaudited) | | Wells Fargo Strategic Income Fund | | | 43 | |
BOARD CONSIDERATION OF INVESTMENT MANAGEMENT AND SUB-ADVISORY AGREEMENTS:
Under the Investment Company Act of 1940 (the “1940 Act”), the Board of Trustees (the “Board”) of Wells Fargo Funds Trust (the “Trust”) must determine annually whether to approve the continuation of the Trust’s investment management and sub-advisory agreements. In this regard, at an in-person meeting held on May 16-17, 2017 (the “Meeting”), the Board, all the members of which have no direct or indirect interest in the investment management and sub-advisory agreements and are not “interested persons” of the Trust, as defined in the 1940 Act (the “Independent Trustees”), reviewed and approved for Wells Fargo Strategic Income Fund (the “Fund”): (i) an investment management agreement (the “Management Agreement”) with Wells Fargo Funds Management, LLC (“Funds Management”); (ii) an investment sub-advisory agreement with Wells Capital Management Incorporated (“WellsCap”), an affiliate of Funds Management; and (iii) an investment sub-advisory agreement with First International Advisors, LLC (“FIA”), an affiliate of Funds Management. The sub-advisory agreements with WellsCap and FIA (the “Sub-Advisers”) are collectively referred to as the “Sub-Advisory Agreements,” and the Management Agreement and the Sub-Advisory Agreements are collectively referred to as the “Advisory Agreements.”
At the Meeting, the Board considered the factors and reached the conclusions described below relating to the selection of Funds Management and the Sub-Advisers and the approval of the Advisory Agreements. Prior to the Meeting, including at an in-person meeting in April 2017, the Trustees conferred extensively among themselves and with representatives of Funds Management about these matters. Also, the Board has adopted a team-based approach, with each team consisting of a sub-set of Trustees, to assist the full Board in the discharge of its duties in reviewing performance and other matters throughout the year. The Independent Trustees were assisted in their evaluation of the Advisory Agreements by independent legal counsel, from whom they received separate legal advice and with whom they met separately.
In providing information to the Board, Funds Management and the Sub-Advisers were guided by a detailed set of requests for information submitted to them by independent legal counsel on behalf of the Independent Trustees at the start of the Board’s annual contract renewal process earlier in 2017. In considering and approving the Advisory Agreements, the Trustees considered the information they believed relevant, including but not limited to the information discussed below. The Board considered not only the specific information presented in connection with the Meeting, but also the knowledge gained over time through interaction with Funds Management and the Sub-Advisers about various topics. In this regard, the Board reviewed reports of Funds Management at each of its quarterly meetings, which included, among other things, portfolio reviews and performance reports. In addition, the Board and the teams mentioned above confer with portfolio managers at various times throughout the year. The Board did not identify any particular information or consideration that was all-important or controlling, and each individual Trustee may have attributed different weights to various factors.
After its deliberations, the Board unanimously approved the continuation of the Advisory Agreements for a one-year term and determined that the compensation payable to Funds Management and the Sub-Advisers under each of the Advisory Agreements was reasonable. The Board considered the approval of the Advisory Agreements for the Fund as part of its consideration of agreements for funds across the complex, but its approvals were made on a fund-by-fund basis. The following summarizes a number of important, but not necessarily all, factors considered by the Board in support of its approvals.
Nature, extent and quality of services
The Board received and considered various information regarding the nature, extent and quality of services provided to the Fund by Funds Management and the Sub-Advisers under the Advisory Agreements. This information included a description of the investment advisory services and Fund-level administrative services covered by the Management Agreement, as well as, among other things, a summary of the background and experience of senior management of Funds Management, a summary of certain organizational and personnel changes involving Funds Management and the Sub-Advisers, and a description of Funds Management’s and the Sub-Advisers’ business continuity planning programs and of their approaches to data privacy and cybersecurity. The Board also considered the qualifications, background, tenure and responsibilities of each of the portfolio managers primarily responsible for the day-to-day portfolio management of the Fund.
The Board evaluated the ability of Funds Management and the Sub-Advisers to attract and retain qualified investment professionals, including research, advisory and supervisory personnel. The Board further considered the compliance programs and compliance records of Funds Management and the Sub-Advisers. In addition, the Board took into account the full range of services provided to the Fund by Funds Management and its affiliates.
| | | | |
| 44 | | Wells Fargo Strategic Income Fund | | Other information (unaudited) |
Fund performance and expenses
The Board considered the performance results for the Fund over various time periods ended December 31, 2016. The Board considered these results in comparison to the performance of funds in a universe that was determined by Broadridge Inc. (“Broadridge”) to be similar to the Fund (the “Universe”), and in comparison to the Fund’s benchmark index and to other comparative data. Broadridge is an independent provider of investment company data. The Board received a description of the methodology used by Broadridge to select the mutual funds in the performance Universe. The Board noted that the performance of the Fund (Administrator Class) was lower than the average performance of the Universe for all periods under review. The Board also noted that the performance of the Fund was higher than its benchmark, the Bloomberg Barclays U.S. Universal Bond Index, for the one-year period under review, but lower than its benchmark for the three-year period under review. The Board noted the short performance history of the Fund.
The Board also received and considered information regarding the Fund’s net operating expense ratios and their various components, including actual management fees, custodian and other non-management fees, and Rule 12b-1 and non-Rule 12b-1 shareholder service fees. The Board considered these ratios in comparison to the median ratios of funds in class-specific expense groups that were determined by Broadridge to be similar to the Fund (the “Groups”). The Board received a description of the methodology used by Broadridge to select the mutual funds in the expense Groups and an explanation of how funds comprising expense groups and their expense ratios may vary from year-to-year. Based on the Broadridge reports, the Board noted that the net operating expense ratios of the Fund were lower than the median net operating expense ratios of the expense Groups for all share classes.
The Board took into account the Fund performance and expense information provided to it among the factors considered in deciding to re-approve the Advisory Agreements.
Investment management and sub-advisory fee rates
The Board reviewed and considered the contractual fee rates payable by the Fund to Funds Management under the Management Agreement, as well as the contractual fee rates payable by the Fund to Funds Management for class-level administrative services under a Class-Level Administration Agreement, which include, among other things, class-level transfer agency and sub-transfer agency costs (collectively, the “Management Rates”). The Board also reviewed and considered the contractual investment sub-advisory fee rates that are payable by Funds Management to the Sub-Advisers for investment sub-advisory services.
Among other information reviewed by the Board was a comparison of the Fund’s Management Rates with the average contractual investment management fee rates of funds in the expense Groups at a common asset level as well as transfer agency costs of the funds in the expense Groups. The Board noted that the Management Rates of the Fund were lower than the sum of these average rates for the Fund’s expense Groups for all share classes.
The Board also received and considered information about the portion of the total management fee that was retained by Funds Management after payment of the fee to the Sub-Advisers for sub-advisory services. In assessing the reasonableness of this amount, the Board received and evaluated information about the nature and extent of responsibilities retained and risks assumed by Funds Management and not delegated to or assumed by the Sub-Advisers, and about Funds Management’s on-going oversight services. Given the affiliation between Funds Management and the Sub-Advisers, the Board ascribed limited relevance to the allocation of fees between them.
Based on its consideration of the factors and information it deemed relevant, including those described here, the Board determined that the compensation payable to Funds Management under the Management Agreement and to the Sub-Advisers under the Sub-Advisory Agreements was reasonable.
Profitability
The Board received and considered information concerning the profitability of Funds Management, as well as the profitability of Wells Fargo as a whole, from providing services to the Fund and the fund family as a whole. The Board also received and considered information concerning the profitability of the Sub-Advisers from providing services to the fund family as a whole, noting that the Sub-Advisers’ profitability information with respect to providing services to the Fund was subsumed in the Wells Fargo and Funds Management profitability analysis.
Funds Management reported on the methodologies and estimates used in calculating profitability, including a description of the methodology used to allocate certain expenses. Among other things, the Board noted that the levels of profitability reported on a fund-by-fund basis varied widely, depending on factors such as the size and type of fund. Based on its review, the Board did not deem the profits reported by Funds Management or Wells Fargo from its services to the Fund to be at a level that would prevent it from approving the continuation of the Advisory Agreements.
| | | | | | |
| Other information (unaudited) | | Wells Fargo Strategic Income Fund | | | 45 | |
Economies of scale
With respect to possible economies of scale, the Board noted the existence of breakpoints in the Fund’s management fee structure, which operate generally to reduce the Fund’s expense ratios as the Fund grows in size. It considered that, for a small fund or a fund that shrinks in size, breakpoints conversely can result in higher fee levels. The Board also considered that in addition to management fee breakpoints, competitive management fee rates set at the outset without regard to breakpoints and fee waiver and expense reimbursement arrangements are means of sharing potential economies of scale with shareholders of the Fund. The Board considered Funds Management’s view, which Funds Management indicated was supported by independent third-party industry studies which were summarized for the Board, that any analyses of potential economies of scale in managing a particular fund are inherently limited in light of the joint and common costs and investments that Funds Management incurs across the fund family as a whole.
The Board concluded that the Fund’s fee and expense arrangements, including contractual breakpoints, constituted a reasonable approach to sharing potential economies of scale with the Fund and its shareholders.
Other benefits to Funds Management and the Sub-Advisers
The Board received and considered information regarding potential “fall-out” or ancillary benefits received by Funds Management and its affiliates, including the Sub-Advisers, as a result of their relationships with the Fund. Ancillary benefits could include, among others, benefits directly attributable to other relationships with the Fund and benefits potentially derived from an increase in Funds Management’s and the Sub-Advisers’ business as a result of their relationships with the Fund. The Board noted that various affiliates of Funds Management may receive distribution-related fees, shareholder servicing payments and sub-transfer agency fees in respect of shares sold or held through them and services provided.
The Board also reviewed information about soft dollar credits earned and utilized by the Sub-Advisers, fees earned by Funds Management and WellsCap from managing a private investment vehicle for the fund family’s securities lending collateral and commissions earned by an affiliated broker from portfolio transactions.
Based on its consideration of the factors and information it deemed relevant, including those described here, the Board did not find that any ancillary benefits received by Funds Management and its affiliates, including the Sub-Advisers, were unreasonable.
Conclusion
At the Meeting, after considering the above-described factors and based on its deliberations and its evaluation of the information described above, the Board unanimously approved the continuation of the Advisory Agreements for a one-year term and determined that the compensation payable to Funds Management and the Sub-Advisers under each of the Advisory Agreements was reasonable.
| | | | |
| 46 | | Wells Fargo Strategic Income Fund | | List of abbreviations |
The following is a list of common abbreviations for terms and entities that may have appeared in this report.
| ACA | — ACA Financial Guaranty Corporation |
| ADR | — American depositary receipt |
| ADS | — American depositary shares |
| AGC | — Assured Guaranty Corporation |
| AGM | — Assured Guaranty Municipal |
| Ambac | — Ambac Financial Group Incorporated |
| AMT | — Alternative minimum tax |
| BAN | — Bond anticipation notes |
| BHAC | — Berkshire Hathaway Assurance Corporation |
| CAB | — Capital appreciation bond |
| CCAB | — Convertible capital appreciation bond |
| CDA | — Community Development Authority |
| CDO | — Collateralized debt obligation |
| CLO | — Collateralized loan obligation |
| DRIVER | — Derivative inverse tax-exempt receipts |
| DW&P | — Department of Water & Power |
| DWR | — Department of Water Resources |
| ECFA | — Educational & Cultural Facilities Authority |
| EDA | — Economic Development Authority |
| EDFA | — Economic Development Finance Authority |
| ETF | — Exchange-traded fund |
| FDIC | — Federal Deposit Insurance Corporation |
| FFCB | — Federal Farm Credit Banks |
| FGIC | — Financial Guaranty Insurance Corporation |
| FHA | — Federal Housing Administration |
| FHLB | — Federal Home Loan Bank |
| FHLMC | — Federal Home Loan Mortgage Corporation |
| FICO | — The Financing Corporation |
| FNMA | — Federal National Mortgage Association |
| GDR | — Global depositary receipt |
| GNMA | — Government National Mortgage Association |
| HCFR | — Healthcare facilities revenue |
| HEFA | — Health & Educational Facilities Authority |
| HEFAR | — Higher education facilities authority revenue |
| HFA | — Housing Finance Authority |
| HFFA | — Health Facilities Financing Authority |
| HUD | — Department of Housing and Urban Development |
| IDA | — Industrial Development Authority |
| IDAG | — Industrial Development Agency |
| KRW | — Republic of Korea won |
| LIBOR | — London Interbank Offered Rate |
| LIFER | — Long Inverse Floating Exempt Receipts |
| LLC | — Limited liability company |
| LLLP | — Limited liability limited partnership |
| LLP | — Limited liability partnership |
| MBIA | — Municipal Bond Insurance Association |
| MFHR | — Multifamily housing revenue |
| MSTR | — Municipal securities trust receipts |
| MUD | — Municipal Utility District |
| National | — National Public Finance Guarantee Corporation |
| PCFA | — Pollution Control Financing Authority |
| PCL | — Public Company Limited |
| PCR | — Pollution control revenue |
| PFA | — Public Finance Authority |
| PFFA | — Public Facilities Financing Authority |
| PFOTER | — Puttable floating option tax-exempt receipts |
| PJSC | — Public Joint Stock Company |
| plc | — Public limited company |
| PUTTER | — Puttable tax-exempt receipts |
| R&D | — Research & development |
| Radian | — Radian Asset Assurance |
| RAN | — Revenue anticipation notes |
| RDA | — Redevelopment Authority |
| RDFA | — Redevelopment Finance Authority |
| REIT | — Real estate investment trust |
| ROC | — Reset option certificates |
| SAVRS | — Select auction variable rate securities |
| SBA | — Small Business Authority |
| SDR | — Swedish depositary receipt |
| SFHR | — Single-family housing revenue |
| SFMR | — Single-family mortgage revenue |
| SPA | — Standby purchase agreement |
| SPDR | — Standard & Poor’s Depositary Receipts |
| SPEAR | — Short Puttable Exempt Adjustable Receipts |
| STRIPS | — Separate trading of registered interest and |
| TAN | — Tax anticipation notes |
| TIPS | — Treasury inflation-protected securities |
| TRAN | — Tax revenue anticipation notes |
| TTFA | — Transportation Trust Fund Authority |
| TVA | — Tennessee Valley Authority |
This page is intentionally left blank.
This page is intentionally left blank.

For more information
More information about Wells Fargo Funds is available free upon request. To obtain literature, please write, email, visit the Fund’s website, or call:
Wells Fargo Funds
P.O. Box 8266
Boston, MA 02266-8266
Email: fundservice@wellsfargo.com
Website: wellsfargofunds.com
Individual investors: 1-800-222-8222
Retail investment professionals: 1-888-877-9275
Institutional investment professionals:
1-866-765-0778
This report and the financial statements contained herein are submitted for the general information of the shareholders of the Fund. If this report is used for promotional purposes, distribution of the report must be accompanied or preceded by a current prospectus. Before investing, please consider the investment objectives, risks, charges, and expenses of the investment. For a current prospectus and, if available, a summary prospectus, containing this information, call 1-800-222-8222 or visit the Fund’s website at wellsfargofunds.com. Read the prospectus carefully before you invest or send money.
Wells Fargo Asset Management (WFAM) is a trade name used by the asset management businesses of Wells Fargo & Company. Wells Fargo Funds Management, LLC, a wholly owned subsidiary of Wells Fargo & Company, provides investment advisory and administrative services for Wells Fargo Funds. Other affiliates of Wells Fargo & Company provide subadvisory and other services for the funds. The funds are distributed by Wells Fargo Funds Distributor, LLC, Member FINRA, an affiliate of Wells Fargo & Company. Neither Wells Fargo Funds Distributor nor Wells Fargo Funds Management holds fund shareholder accounts or assets. This material is for general informational and educational purposes only and is NOT intended to provide investment advice or a recommendation of any kind—including a recommendation for any specific investment, strategy, or plan.
NOT FDIC INSURED ◾ NO BANK GUARANTEE ◾ MAY LOSE VALUE
© 2017 Wells Fargo Funds Management, LLC. All rights reserved.
| | |
 | | 306433 11-17 A263/AR263 09-17 |
Annual Report
September 30, 2017

Wells Fargo C&B Mid Cap Value Fund


Reduce clutter. Save trees.
Sign up for electronic delivery of prospectuses and shareholder reports at wellsfargo.com/advantagedelivery
Contents
The views expressed and any forward-looking statements are as of September 30, 2017, unless otherwise noted, and are those of the Fund managers and/or Wells Fargo Funds Management, LLC. Discussions of individual securities, or the markets generally, or any Wells Fargo Fund are not intended as individual recommendations. Future events or results may vary significantly from those expressed in any forward-looking statements. The views expressed are subject to change at any time in response to changing circumstances in the market. Wells Fargo Funds Management, LLC and the Fund disclaim any obligation to publicly update or revise any views expressed or forward-looking statements.
NOT FDIC INSURED ◾ NO BANK GUARANTEE ◾ MAY LOSE VALUE
| | | | |
| 2 | | Wells Fargo C&B Mid Cap Value Fund | | Letter to shareholders (unaudited) |

Andrew Owen
President
Wells Fargo Funds
Favorable economic news supported stocks, and interest rates moved higher.
Hiring remained strong, and business and consumer sentiment improved.
Dear Shareholder:
We are pleased to offer you this annual report for the Wells Fargo C&B Mid Cap Value Fund for the 12-month period that ended September 30, 2017. Despite heightened market volatility at times, global stocks generally delivered double-digit results and bond markets had smaller but positive results as well. U.S. and international stocks returned 18.61% and 19.61%, respectively, for the 12-month period, as measured by the S&P 500 Index1 and the MSCI ACWI ex USA Index (Net),2 respectively; within fixed income, the Bloomberg Barclays U.S. Aggregate Bond Index3 returned 0.07% and the Bloomberg Barclays Municipal Bond Index4 returned 0.87% as interest rates rose from low levels.
Election results and central banks’ policies commanded investor attention as 2016 closed.
During the fourth quarter of 2016, investors appeared intent on the prospective outcomes of elections in the U.S. and central-bank actions globally. Following Donald Trump’s election victory, U.S. stocks rallied. Investors appeared optimistic that the new administration would pursue progrowth policies. Favorable economic news supported stocks, and interest rates moved higher. At their mid-December meeting, U.S. Federal Reserve (Fed) officials raised the target interest rate by a quarter percentage point to a range of 0.50% to 0.75%. The fourth quarter also saw the implementation of the U.S. Securities and Exchange Commission’s new rules for money market funds, which included floating net asset values (NAVs) as well as the possibility of liquidity fees and redemption gates for institutional prime and municipal money market funds. In the year leading up to money market fund reform implementation, nearly $1 trillion in assets moved from money market funds subject to floating NAVs into government money market funds, which continued to transact at a stable $1.00 NAV. Outside of the U.S., the prospects for faster U.S. growth appeared to trigger some acceleration in Europe.
Financial markets gained during the first two quarters of 2017 on positive economic data.
Stocks rallied globally through the first quarter of 2017, supported by signs of improvement in the U.S. and global economies. U.S. economic data released during the quarter reflected a healthy economy. Hiring remained strong, and business and consumer sentiment improved. In March, Fed officials raised their target interest rate by a quarter percentage point to a range of 0.75% to 1.00%. With the Fed’s target interest-rate increase, short-term bond yields rose during the quarter. Meanwhile, longer-term Treasury yields were little changed, leading to positive performance. Investment-grade and high-yield bonds benefited from strong demand. Municipal bond returns were positive in the quarter, helped by strong demand and constrained new-issue supply. Outside of the U.S., stocks in emerging markets generally outperformed stocks in the U.S. and international
| 1 | The S&P 500 Index consists of 500 stocks chosen for market size, liquidity, and industry group representation. It is a market-value-weighted index with each stock’s weight in the index proportionate to its market value. You cannot invest directly in an index. |
| 2 | The Morgan Stanley Capital International (MSCI) All Country World Index (ACWI) ex USA Index (Net) is a free-float-adjusted market-capitalization-weighted index that is designed to measure the equity market performance of developed markets, excluding the United States and Canada. Source: MSCI. MSCI makes no express or implied warranties or representations and shall have no liability whatsoever with respect to any MSCI data contained herein. The MSCI data may not be further redistributed or used as a basis for other indexes or any securities or financial products. This report is not approved, reviewed, or produced by MSCI. You cannot invest directly in an index. |
| 3 | The Bloomberg Barclays U.S. Aggregate Bond Index is a broad-based benchmark that measures the investment-grade, U.S. dollar-denominated, fixed-rate taxable bond market, including Treasuries, government-related and corporate securities, mortgage-backed securities (agency fixed-rate and hybrid adjustable-rate mortgage pass-throughs), asset-backed securities, and commercial mortgage-backed securities. You cannot invest directly in an index. |
| 4 | The Bloomberg Barclays Municipal Bond Index is an unmanaged index composed of long-term tax-exempt bonds with a minimum credit rating of Baa. You cannot invest directly in an index. |
| | | | | | |
| Letter to shareholders (unaudited) | | Wells Fargo C&B Mid Cap Value Fund | | | 3 | |
developed markets because they benefited from both global economic growth and recent weakening in the U.S. dollar. Stocks in Asia, Europe, and Latin America also outperformed the U.S. market during the quarter.
Globally, stocks marked continued gains through the second quarter of 2017. Steady, albeit modest, economic growth both in the U.S. and abroad and generally favorable corporate earnings announcements supported higher valuations. U.S. inflation trended lower despite a continued decline in the unemployment rate. Ten-year U.S. Treasury yields declined, resulting in stronger prices for long-term bonds. As was widely expected, the Fed raised the target interest rate in June by a quarter percentage point to a range of 1.00% to 1.25%. In addition, the Fed indicated that it would begin to sell bonds accumulated on its balance sheet during quantitative easing programs conducted since 2008. Later in the third quarter, the Fed confirmed that the initiative to reduce the bonds that it holds likely would begin in October.
Volatility increased during the third quarter of 2017.
Early in July and again in August, volatility expectations increased and then receded—as measured by the CBOE VIX5—amid geopolitical tensions, particularly in Asia, and declining investor optimism following unsuccessful efforts to reform health care laws in the U.S. which suggested to some that President Trump and Congress would be unable to move forward with tax and regulatory reforms.
During the quarter, economic momentum increased in Europe; the European Central Bank held its rates steady at low levels and continued its quantitative easing bond-buying program, which is intended to spark economic activity. The Bank of England suggested it could hike interest rates in November, and the pound gained against other currencies. The Bank of Japan also maintained accommodative policies intended to support business activity and economic growth. In Germany, Angela Merkel was reelected chancellor; in Japan, Prime Minister Shinzo Abe called for snap elections as his popularity increased after North Korea’s aggressive program of missile launches. Both political developments were indicative of the type of political consistency in developed markets that reassure financial markets.
In emerging markets, many countries benefited from stronger currencies versus the U.S. dollar. In addition, commodity prices were on an upward trajectory, which benefited many companies that rely on natural resources for exports.
As the quarter closed, optimism returned as economic growth continued. The second-quarter gross domestic product measure was revised higher from 2.6% annualized to 3.0%. Consumer spending and residential and nonresidential investment increased. While inflation continued to trail the Fed’s targets, expectations remained for an additional short-term interest-rate hike before year-end.
| 5 | The Chicago Board Options Exchange Market Volatility Index (CBOE VIX) is a popular measure of the implied volatility of S&P 500 Index options. It represents one measure of the market’s expectation of stock market volatility over the next 30-day period. You cannot invest directly in an index. |
| | | | |
| 4 | | Wells Fargo C&B Mid Cap Value Fund | | Letter to shareholders (unaudited) |
Don’t let short-term uncertainty derail long-term investment goals.
Periods of investment uncertainty can present challenges, but experience has taught us that maintaining long-term investment goals can be an effective way to plan for the future. To help you create a sound strategy based on your personal goals and risk tolerance, Wells Fargo Funds offers more than 100 mutual funds spanning a wide range of asset classes and investment styles. Although diversification cannot guarantee an investment profit or prevent losses, we believe it can be an effective way to manage investment risk and potentially smooth out overall portfolio performance. We encourage investors to know their investments and to understand that appropriate levels of risk-taking may unlock opportunities.
Thank you for choosing to invest with Wells Fargo Funds. We appreciate your confidence in us and remain committed to helping you meet your financial needs.
Sincerely,

Andrew Owen
President
Wells Fargo Funds
For further information about your Fund, contact your investment professional, visit our website at wellsfargofunds.com, or call us directly at 1-800-222-8222. We are available 24 hours a day, 7 days a week.
This page is intentionally left blank.
| | | | |
| 6 | | Wells Fargo C&B Mid Cap Value Fund | | Performance highlights (unaudited) |
Investment objective
The Fund seeks long-term total return (current income and capital appreciation), consistent with minimizing risk to principal.
Manager
Wells Fargo Funds Management, LLC
Subadviser
Cooke and Bieler, L.P.
Portfolio managers
Andrew B. Armstrong, CFA®
Steve Lyons, CFA®
Michael M. Meyer, CFA®
Edward W. O’Connor, CFA®
R. James O’Neil, CFA®
Mehul Trivedi, CFA®
William Weber, CFA®
Average annual total returns (%) as of September 30, 2017
| | | | | | | | | | | | | | | | | | | | | | | | | | | | | | | | | | |
| | | | | Including sales charge | | | Excluding sales charge | | | Expense ratios1 (%) | |
| | | Inception date | | 1 year | | | 5 year | | | 10 year | | | 1 year | | | 5 year | | | 10 year | | | Gross | | | Net2 | |
| Class A (CBMAX) | | 7-26-2004 | | | 12.98 | | | | 13.05 | | | | 6.73 | | | | 19.89 | | | | 14.40 | | | | 7.36 | | | | 1.33 | | | | 1.25 | |
| Class C (CBMCX) | | 7-26-2004 | | | 18.01 | | | | 13.54 | | | | 6.56 | | | | 19.01 | | | | 13.54 | | | | 6.56 | | | | 2.08 | | | | 2.00 | |
| Administrator Class (CBMIX) | | 7-26-2004 | | | – | | | | – | | | | – | | | | 20.02 | | | | 14.48 | | | | 7.44 | | | | 1.25 | | | | 1.15 | |
| Institutional Class (CBMSX) | | 7-26-2004 | | | – | | | | – | | | | – | | | | 20.30 | | | | 14.76 | | | | 7.71 | | | | 1.00 | | | | 0.90 | |
| Russell Midcap® Value Index3 | | – | | | – | | | | – | | | | – | | | | 13.37 | | | | 14.33 | | | | 7.85 | | | | – | | | | – | |
Figures quoted represent past performance, which is no guarantee of future results, and do not reflect taxes that a shareholder may pay on fund distributions or the redemption of fund shares. Investment return and principal value of an investment will fluctuate so that an investor’s shares, when redeemed, may be worth more or less than their original cost. Performance shown without sales charges would be lower if sales charges were reflected. Current performance may be lower or higher than the performance data quoted, which assumes the reinvestment of dividends and capital gains. Current month-end performance is available on the Fund’s website, wellsfargofunds.com.
Index returns do not include transaction costs associated with buying and selling securities, any mutual fund fees or expenses, or any taxes. It is not possible to invest directly in an index.
For Class A shares, the maximum front-end sales charge is 5.75%. For Class C shares, the maximum contingent deferred sales charge is 1.00%. Performance including a contingent deferred sales charge assumes the sales charge for the corresponding time period. Administrator Class and Institutional Class shares are sold without a front-end sales charge or contingent deferred sales charge.
Stock values fluctuate in response to the activities of individual companies and general market and economic conditions. Smaller-company stocks tend to be more volatile and less liquid than those of larger companies. Consult the Fund’s prospectus for additional information on these and other risks.
Please see footnotes on page 7.
| | | | | | |
| Performance highlights (unaudited) | | Wells Fargo C&B Mid Cap Value Fund | | | 7 | |
|
| Growth of $10,000 investment as of September 30, 20174 |
|
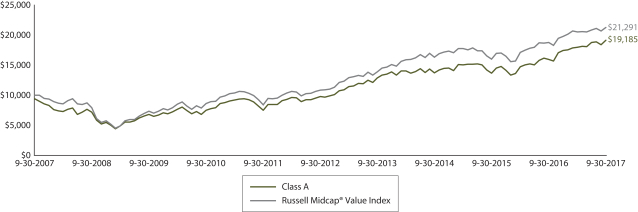 |
| 1 | Reflects the expense ratios as stated in the most recent prospectuses. The expense ratios shown are subject to change and may differ from the annualized expense ratios shown in the financial highlights of this report. |
| 2 | The manager has contractually committed through January 31, 2018, to waive fees and/or reimburse expenses to the extent necessary to cap the Fund’s Total Annual Fund Operating Expenses After Fee Waivers at the amounts shown. After this time, the cap may be increased or the commitment to maintain the cap may be terminated only with the approval of the Board of Trustees. Brokerage commissions, stamp duty fees, interest, taxes, acquired fund fees and expenses, and extraordinary expenses are excluded from the expense cap. Without this cap, the Fund’s returns would have been lower. The expense ratio paid by an investor is the net expense ratio or the Fund’s Total Annual Fund Operating Expenses After Fee Waivers, as stated in the prospectuses. |
| 3 | The Russell Midcap® Value Index measures the performance of those Russell Midcap companies with lower price/book ratios and lower forecasted growth values. The stocks are also members of the Russell 1000® Value Index. You cannot invest directly in an index. |
| 4 | The chart compares the performance of Class A shares for the most recent ten years with the Russell Midcap® Value Index. The chart assumes a hypothetical investment of $10,000 in Class A shares and reflects all operating expenses and assumes the maximum initial sales charge of 5.75%. |
| 5 | The ten largest holdings, excluding cash and cash equivalents, are calculated based on the value of the investments divided by total net assets of the Fund. Holdings are subject to change and may have changed since the date specified. |
| 6 | Amounts are calculated based on the total long-term investments of the Fund. These amounts are subject to change and may have changed since the date specified. |
| * | This security was not held in the Fund at the end of the reporting period. |
| | | | |
| 8 | | Wells Fargo C&B Mid Cap Value Fund | | Performance highlights (unaudited) |
MANAGER’S DISCUSSION
Fund highlights
| ∎ | | The Fund outperformed its benchmark, the Russell Midcap® Value Index, for the 12-month period that ended September 30, 2017. |
| ∎ | | Outperformance primarily was driven by sector allocations—a function of our bottom-up fundamental stock-selection process—including significant underweights to the real estate and energy sectors and overweights to the financials and industrials sectors. |
| ∎ | | The Fund’s overweight to the health care sector detracted from performance; several individual holdings that declined meaningfully in value detracted as well. |
U.S. stocks enjoyed a strong 12-month period. However, results were mixed at the sector level. With interest rates up in response to the November 2016 U.S. presidential election and indications that the U.S. Federal Reserve (Fed) was continuing on a normalization path, many stocks in the financials sector rose sharply while stocks with bond-like characteristics—including many in the real estate and utilities sectors—lagged. The energy sector delivered the weakest results within the index as energy companies continued to struggle due to reduced activity resulting from low oil prices and, in many cases, from overleveraged balance sheets. In addition to financials, stocks in the information technology and industrials sectors tended to perform strongly due to solid continuing earnings growth that more than offset areas of weakness. Investors appeared to prefer high-quality companies although this trend seemed to reverse toward the end of the reporting period. Given our commitment to investing in quality companies and the Fund’s positioning based on our bottom-up, fundamental stock-selection process, the environment overall was favorable for our investment strategy and for the Fund’s performance.
With a continuing favorable market environment and the Fund’s robust performance, our valuation disciplines necessitated a higher-than-normal degree of portfolio adjustments during the period. In total, 12 holdings were eliminated from the Fund and 12 new positions were initiated. As the number of new holdings reflects, the market environment overall presented good opportunities for us to refresh the portfolio, adding companies with underlying business models, strong cash-flow generation, conservative balance sheets, and reasonable valuations that we found attractive.
| | | | |
| Ten largest holdings (%) as of September 30, 20175 | |
First Cash Financial Services Incorporated | | | 3.94 | |
Gildan Activewear Incorporated | | | 3.60 | |
AerCap Holdings NV | | | 3.15 | |
TCF Financial Corporation | | | 2.79 | |
Whirlpool Corporation | | | 2.74 | |
Schweitzer-Mauduit International Incorporated | | | 2.73 | |
State Street Corporation | | | 2.66 | |
Genpact Limited | | | 2.64 | |
FNF Group | | | 2.58 | |
RenaissanceRe Holdings Limited | | | 2.56 | |
Given the diverse range of sectors in which the stocks eliminated and the stocks added are located, the Fund’s positioning from a sector perspective remained substantially similar except within the industrials sector, where the Fund’s significant overweight was meaningfully reduced. A number of holdings—including Graco Incorporated; Parker-Hannifin Corporation; Rockwell Collins, Incorporated; W.W. Grainger, Incorporated; and WESCO International, Incorporated—met our estimates of their intrinsic values and were eliminated from the Fund. Their collective portfolio weights were only partially replaced by the addition of industrials stocks Snap-on Incorporated and Steelcase Incorporated.
|
| Sector distribution as of September 30, 20176 |
|
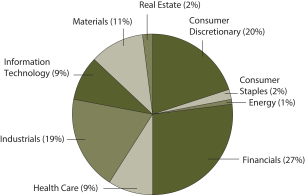 |
The Fund benefited from underweights to real estate and energy and an overweight to financials.
The underweight to the real estate sector—specifically, to real estate investment trusts (REITs)—generally was due to our valuation, debt-leverage, and balance-sheet concerns regarding REITs within the benchmark’s real estate sector. The Fund’s underweight to the energy sector was due to the fact that many companies in the sector had overextended balance sheets and appeared to us to be at risk in the event of a major industry downturn. The Fund’s overweight to the financials sector was largely due to our ability to identify a number of banks with relatively unique business models and strong deposit franchises and to identify potentially well-positioned insurance companies trading at discounted valuations
Please see footnotes on page 7.
| | | | | | |
| Performance highlights (unaudited) | | Wells Fargo C&B Mid Cap Value Fund | | | 9 | |
due to persistently low interest rates. On an individual stock level, the Fund’s top contributors to relative performance included MoneyGram International, Incorporated*; Endurance Specialty Holdings Limited*; and Rockwell Collins, which became takeover targets during the period. Financials holdings State Street Corporation; First Cash Financial Services, Incorporated; and The Progressive Corporation delivered key contributions as well.
An overweight to health care and negative results from several holdings hindered Fund performance.
At the sector level, the only detractor from relative performance during the period was the Fund’s overweight to health care. At the holdings level, major laggards included physician-services provider MEDNAX, Incorporated; beauty-supply and specialty-retail distributor Sally Beauty Holdings, Incorporated; energy-management company World Fuel Services Corporation; hospitality industry company Brinker International, Incorporated; and debt buyer PRA Group, Incorporated. MEDNAX underperformed due to several factors, including a declining birth rate. Sally Beauty faced weak revenue trends. The underperformance of World Fuel Services resulted partly from continued weakness in its marine segment. Brinker suffered from a soft casual-dining market, and PRA Group’s weak results were driven by a low number of defaulted receivables available for purchase and intensified by a changing regulatory environment and arcane accounting rules that pressured the company.
The transition away from monetary stimulus may lead to new investment opportunities.
The Fed recently announced it would begin shrinking its balance sheet, marking a new step in its process of winding down the era of extraordinary monetary stimulus. The transition away from stimulus brings with it a set of concerns but also opportunities. We have stated in the past that the various forms of quantitative easing have supported many companies of questionable quality. As monetary policy becomes more restrictive and interest rates potentially rise, weaker companies may find it increasingly harder to compete with higher-quality peers. As a result, corporate returns likely could be increasingly based on company-specific fundamentals rather than on macroeconomic factors. We believe this transitioning environment may bring new opportunities for us to uncover for the benefit of Fund shareholders.
Please see footnotes on page 7.
| | | | |
| 10 | | Wells Fargo C&B Mid Cap Value Fund | | Fund expenses (unaudited) |
As a shareholder of the Fund, you incur two types of costs: (1) transaction costs, including sales charges (loads) on purchase payments and contingent deferred sales charges (if any) on redemptions and (2) ongoing costs, including management fees, distribution (12b-1) and/or shareholder servicing fees, and other Fund expenses. This example is intended to help you understand your ongoing costs (in dollars) of investing in the Fund and to compare these costs with the ongoing costs of investing in other mutual funds.
The example is based on an investment of $1,000 invested at the beginning of the six-month period and held for the entire period from April 1, 2017 to September 30, 2017.
Actual expenses
The “Actual” line of the table below provides information about actual account values and actual expenses. You may use the information in this line, together with the amount you invested, to estimate the expenses that you paid over the period. Simply divide your account value by $1,000 (for example, an $8,600 account value divided by $1,000 = 8.6), then multiply the result by the number in the “Actual” line under the heading entitled “Expenses paid during period” for your applicable class of shares to estimate the expenses you paid on your account during this period.
Hypothetical example for comparison purposes
The “Hypothetical” line of the table below provides information about hypothetical account values and hypothetical expenses based on the Fund’s actual expense ratio and an assumed rate of return of 5% per year before expenses, which is not the Fund’s actual return. The hypothetical account values and expenses may not be used to estimate the actual ending account balance or expenses you paid for the period. You may use this information to compare the ongoing costs of investing in the Fund and other funds. To do so, compare this 5% hypothetical example with the 5% hypothetical examples that appear in the shareholder reports of the other funds.
Please note that the expenses shown in the table are meant to highlight your ongoing costs only and do not reflect any transactional costs, such as sales charges (loads) and contingent deferred sales charges. Therefore, the “Hypothetical” line of the table is useful in comparing ongoing costs only and will not help you determine the relative total costs of owning different funds. In addition, if these transactional costs were included, your costs would have been higher.
| | | | | | | | | | | | | | | | |
| | | Beginning
account value
4-1-2017 | | | Ending
account value
9-30-2017 | | | Expenses
paid during
the period¹ | | | Annualized net
expense ratio | |
Class A | | | | | | | | | | | | | | | | |
Actual | | $ | 1,000.00 | | | $ | 1,064.98 | | | $ | 6.47 | | | | 1.25 | % |
Hypothetical (5% return before expenses) | | $ | 1,000.00 | | | $ | 1,018.80 | | | $ | 6.33 | | | | 1.25 | % |
Class C | | | | | | | | | | | | | | | | |
Actual | | $ | 1,000.00 | | | $ | 1,061.20 | | | $ | 10.33 | | | | 2.00 | % |
Hypothetical (5% return before expenses) | | $ | 1,000.00 | | | $ | 1,015.04 | | | $ | 10.10 | | | | 2.00 | % |
Administrator Class | | | | | | | | | | | | | | | | |
Actual | | $ | 1,000.00 | | | $ | 1,065.71 | | | $ | 5.96 | | | | 1.15 | % |
Hypothetical (5% return before expenses) | | $ | 1,000.00 | | | $ | 1,019.30 | | | $ | 5.82 | | | | 1.15 | % |
Institutional Class | | | | | | | | | | | | | | | | |
Actual | | $ | 1,000.00 | | | $ | 1,066.89 | | | $ | 4.66 | | | | 0.90 | % |
Hypothetical (5% return before expenses) | | $ | 1,000.00 | | | $ | 1,020.56 | | | $ | 4.56 | | | | 0.90 | % |
| 1 | Expenses paid is equal to the annualized net expense ratio of each class multiplied by the average account value over the period, multiplied by the number of days in the most recent fiscal half-year divided by the number of days in the fiscal year (to reflect the one-half-year period). |
| | | | | | |
| Portfolio of investments—September 30, 2017 | | Wells Fargo C&B Mid Cap Value Fund | | | 11 | |
| | | | | | | | | | | | | | | | |
| Security name | | | | | | | | Shares | | | Value | |
| | | | |
Common Stocks: 94.89% | | | | | | | | | | | | | | | | |
| | | | |
Consumer Discretionary: 18.93% | | | | | | | | | | | | | | | | |
| | | | |
| Auto Components: 1.87% | | | | | | | | | | | | | | | | |
Tenneco Automotive Incorporated | | | | | | | | | | | 77,400 | | | $ | 4,695,858 | |
| | | | | | | | | | | | | | | | |
| | | | |
| Hotels, Restaurants & Leisure: 0.75% | | | | | | | | | | | | | | | | |
Brinker International Incorporated | | | | | | | | | | | 58,900 | | | | 1,876,554 | |
| | | | | | | | | | | | | | | | |
| | | | |
| Household Durables: 5.20% | | | | | | | | | | | | | | | | |
Helen of Troy Limited † | | | | | | | | | | | 63,792 | | | | 6,181,445 | |
Whirlpool Corporation | | | | | | | | | | | 37,200 | | | | 6,861,168 | |
| | | | |
| | | | | | | | | | | | | | | 13,042,613 | |
| | | | | | | | | | | | | | | | |
| | | | |
| Media: 2.39% | | | | | | | | | | | | | | | | |
Omnicom Group Incorporated | | | | | | | | | | | 80,700 | | | | 5,977,449 | |
| | | | | | | | | | | | | | | | |
| | | | |
| Specialty Retail: 2.80% | | | | | | | | | | | | | | | | |
Penske Auto Group Incorporated | | | | | | | | | | | 58,000 | | | | 2,759,060 | |
Sally Beauty Holdings Incorporated † | | | | | | | | | | | 218,100 | | | | 4,270,398 | |
| | | | |
| | | | | | | | | | | | | | | 7,029,458 | |
| | | | | | | | | | | | | | | | |
| | | | |
| Textiles, Apparel & Luxury Goods: 5.92% | | | | | | | | | | | | | | | | |
Gildan Activewear Incorporated | | | | | | | | | | | 288,572 | | | | 9,026,532 | |
HanesBrands Incorporated « | | | | | | | | | | | 235,400 | | | | 5,800,256 | |
| | | | |
| | | | | | | | | | | | | | | 14,826,788 | |
| | | | | | | | | | | | | | | | |
| | | | |
Consumer Staples: 1.75% | | | | | | | | | | | | | | | | |
| | | | |
| Food & Staples Retailing: 1.75% | | | | | | | | | | | | | | | | |
United Natural Foods Incorporated † | | | | | | | | | | | 105,400 | | | | 4,383,586 | |
| | | | | | | | | | | | | | | | |
| | | | |
Energy: 1.43% | | | | | | | | | | | | | | | | |
| | | | |
| Oil, Gas & Consumable Fuels: 1.43% | | | | | | | | | | | | | | | | |
World Fuel Services Corporation | | | | | | | | | | | 106,000 | | | | 3,594,460 | |
| | | | | | | | | | | | | | | | |
| | | | |
Financials: 25.62% | | | | | | | | | | | | | | | | |
| | | | |
| Banks: 5.07% | | | | | | | | | | | | | | | | |
Commerce Bancshares Incorporated | | | | | | | | | | | 40,203 | | | | 2,322,527 | |
SVB Financial Group † | | | | | | | | | | | 18,200 | | | | 3,405,038 | |
TCF Financial Corporation | | | | | | | | | | | 409,800 | | | | 6,982,992 | |
| | | | |
| | | | | | | | | | | | | | | 12,710,557 | |
| | | | | | | | | | | | | | | | |
| | | | |
| Capital Markets: 2.67% | | | | | | | | | | | | | | | | |
State Street Corporation | | | | | | | | | | | 69,900 | | | | 6,678,246 | |
| | | | | | | | | | | | | | | | |
| | | | |
| Consumer Finance: 7.45% | | | | | | | | | | | | | | | | |
First Cash Financial Services Incorporated | | | | | | | | | | | 156,200 | | | | 9,864,030 | |
PRA Group Incorporated Ǡ | | | | | | | | | | | 165,900 | | | | 4,753,035 | |
Synchrony Financial | | | | | | | | | | | 130,900 | | | | 4,064,445 | |
| | | | |
| | | | | | | | | | | | | | | 18,681,510 | |
| | | | | | | | | | | | | | | | |
The accompanying notes are an integral part of these financial statements.
| | | | |
| 12 | | Wells Fargo C&B Mid Cap Value Fund | | Portfolio of investments—September 30, 2017 |
| | | | | | | | | | | | | | | | |
| Security name | | | | | | | | Shares | | | Value | |
| | | | |
| Insurance: 10.43% | | | | | | | | | | | | | | | | |
FNF Group | | | | | | | | | | | 136,000 | | | $ | 6,454,560 | |
Markel Corporation † | | | | | | | | | | | 4,300 | | | | 4,592,314 | |
RenaissanceRe Holdings Limited | | | | | | | | | | | 47,500 | | | | 6,419,150 | |
The Progressive Corporation | | | | | | | | | | | 128,000 | | | | 6,197,760 | |
Torchmark Corporation | | | | | | | | | | | 30,800 | | | | 2,466,772 | |
| | | | |
| | | | | | | | | | | | | | | 26,130,556 | |
| | | | | | | | | | | | | | | | |
| | | | |
Health Care: 8.58% | | | | | | | | | | | | | | | | |
| | | | |
| Health Care Providers & Services: 5.80% | | | | | | | | | | | | | | | | |
Cardinal Health Incorporated | | | | | | | | | | | 78,700 | | | | 5,266,604 | |
Laboratory Corporation of America Holdings † | | | | | | | | | | | 34,700 | | | | 5,238,659 | |
MEDNAX Incorporated † | | | | | | | | | | | 93,500 | | | | 4,031,720 | |
| | | | |
| | | | | | | | | | | | | | | 14,536,983 | |
| | | | | | | | | | | | | | | | |
| | | | |
| Life Sciences Tools & Services: 1.42% | | | | | | | | | | | | | | | | |
INC Research Holdings Incorporated Class A † | | | | | | | | | | | 68,020 | | | | 3,557,446 | |
| | | | | | | | | | | | | | | | |
| | | | |
| Pharmaceuticals: 1.36% | | | | | | | | | | | | | | | | |
Perrigo Company plc | | | | | | | | | | | 40,200 | | | | 3,402,930 | |
| | | | | | | | | | | | | | | | |
| | | | |
Industrials: 17.69% | | | | | | | | | | | | | | | | |
| | | | |
| Building Products: 2.16% | | | | | | | | | | | | | | | | |
Quanex Building Products Corporation | | | | | | | | | | | 235,631 | | | | 5,407,731 | |
| | | | | | | | | | | | | | | | |
| | | | |
| Commercial Services & Supplies: 2.94% | | | | | | | | | | | | | | | | |
Steelcase Incorporated Class A | | | | | | | | | | | 201,900 | | | | 3,109,260 | |
Tetra Tech Incorporated | | | | | | | | | | | 91,610 | | | | 4,264,446 | |
| | | | |
| | | | | | | | | | | | | | | 7,373,706 | |
| | | | | | | | | | | | | | | | |
| | | | |
| Electrical Equipment: 3.90% | | | | | | | | | | | | | | | | |
AMETEK Incorporated | | | | | | | | | | | 77,200 | | | | 5,098,288 | |
Eaton Corporation plc | | | | | | | | | | | 60,900 | | | | 4,676,511 | |
| | | | |
| | | | | | | | | | | | | | | 9,774,799 | |
| | | | | | | | | | | | | | | | |
| | | | |
| Machinery: 5.54% | | | | | | | | | | | | | | | | |
Donaldson Company Incorporated | | | | | | | | | | | 71,600 | | | | 3,289,304 | |
Snap-on Incorporated « | | | | | | | | | | | 35,500 | | | | 5,289,855 | |
Woodward Governor Company | | | | | | | | | | | 68,400 | | | | 5,308,524 | |
| | | | |
| | | | | | | | | | | | | | | 13,887,683 | |
| | | | | | | | | | | | | | | | |
| | | | |
| Trading Companies & Distributors: 3.15% | | | | | | | | | | | | | | | | |
AerCap Holdings NV † | | | | | | | | | | | 154,500 | | | | 7,896,495 | |
| | | | | | | | | | | | | | | | |
| | | | |
Information Technology: 8.23% | | | | | | | | | | | | | | | | |
| | | | |
| Electronic Equipment, Instruments & Components: 3.20% | | | | | | | | | | | | | | | | |
Arrow Electronics Incorporated † | | | | | | | | | | | 56,800 | | | | 4,567,288 | |
TE Connectivity Limited | | | | | | | | | | | 41,500 | | | | 3,446,990 | |
| | | | |
| | | | | | | | | | | | | | | 8,014,278 | |
| | | | | | | | | | | | | | | | |
The accompanying notes are an integral part of these financial statements.
| | | | | | |
| Portfolio of investments—September 30, 2017 | | Wells Fargo C&B Mid Cap Value Fund | | | 13 | |
| | | | | | | | | | | | | | | | |
| Security name | | | | | | | | Shares | | | Value | |
| | | | |
| IT Services: 3.96% | | | | | | | | | | | | | | | | |
Alliance Data Systems Corporation | | | | | | | | | | | 15,000 | | | $ | 3,323,250 | |
Genpact Limited | | | | | | | | | | | 230,000 | | | | 6,612,500 | |
| | | | |
| | | | | | | | | | | | | | | 9,935,750 | |
| | | | | | | | | | | | | | | | |
| | | | |
| Semiconductors & Semiconductor Equipment: 1.07% | | | | | | | | | | | | | | | | |
Analog Devices Incorporated | | | | | | | | | | | 31,204 | | | | 2,688,849 | |
| | | | | | | | | | | | | | | | |
| | | | |
Materials: 10.86% | | | | | | | | | | | | | | | | |
| | | | |
| Chemicals: 2.16% | | | | | | | | | | | | | | | | |
Axalta Coating Systems Limited † | | | | | | | | | | | 187,100 | | | | 5,410,932 | |
| | | | | | | | | | | | | | | | |
| | | | |
| Containers & Packaging: 3.81% | | | | | | | | | | | | | | | | |
Ball Corporation | | | | | | | | | | | 113,000 | | | | 4,666,900 | |
Crown Holdings Incorporated † | | | | | | | | | | | 82,000 | | | | 4,897,040 | |
| | | | |
| | | | | | | | | | | | | | | 9,563,940 | |
| | | | | | | | | | | | | | | | |
| | | | |
| Metals & Mining: 2.16% | | | | | | | | | | | | | | | | |
Reliance Steel & Aluminum Company | | | | | | | | | | | 71,100 | | | | 5,415,687 | |
| | | | | | | | | | | | | | | | |
| | | | |
| Paper & Forest Products: 2.73% | | | | | | | | | | | | | | | | |
Schweitzer-Mauduit International Incorporated | | | | | | | | | | | 164,800 | | | | 6,832,608 | |
| | | | | | | | | | | | | | | | |
| | | | |
Real Estate: 1.80% | | | | | | | | | | | | | | | | |
| | | | |
| Real Estate Management & Development: 1.80% | | | | | | | | | | | | | | | | |
CBRE Group Incorporated Class A † | | | | | | | | | | | 119,100 | | | | 4,511,508 | |
| | | | | | | | | | | | | | | | |
| | | | |
Total Common Stocks (Cost $193,411,391) | | | | | | | | | | | | | | | 237,838,960 | |
| | | | | | | | | | | | | | | | |
| | | | |
| | | Yield | | | | | | | | | | |
| Short-Term Investments: 9.05% | | | | | | | | | | | | | | | | |
| | | | |
| Investment Companies: 9.05% | | | | | | | | | | | | | | | | |
Securities Lending Cash Investment LLC (l)(r)(u) | | | 1.25 | % | | | | | | | 9,592,251 | | | | 9,593,210 | |
Wells Fargo Government Money Market Fund Select Class (l)(u) | | | 0.92 | | | | | | | | 13,092,556 | | | | 13,092,556 | |
| | | | |
Total Short-Term Investments (Cost $22,685,527) | | | | | | | | | | | | | | | 22,685,766 | |
| | | | | | | | | | | | | | | | |
| | | | | | | | |
| Total investments in securities (Cost $216,096,918) | | | 103.94 | % | | | 260,524,726 | |
Other assets and liabilities, net | | | (3.94 | ) | | | (9,882,561 | ) |
| | | | | | | | |
| Total net assets | | | 100.00 | % | | $ | 250,642,165 | |
| | | | | | | | |
| † | Non-income-earning security |
| « | All or a portion of this security is on loan. |
| (l) | The issuer of the security is an affiliated person of the Fund as defined in the Investment Company Act of 1940. |
| (r) | The investment is a non-registered investment company purchased with cash collateral received from securities on loan. |
| (u) | The rate represents the 7-day annualized yield at period end. |
The accompanying notes are an integral part of these financial statements.
| | | | |
| 14 | | Wells Fargo C&B Mid Cap Value Fund | | Portfolio of investments—September 30, 2017 |
Investments in Affiliates
An affiliated investment is an investment in which the Fund owns at least 5% of the outstanding voting shares of the issuer or as a result of other relationships, such as the Fund and the issuer having the same investment manager. Transactions with issuers that were either affiliated persons of the Fund at the beginning of the period or the end of the period were as follows:
| | | | | | | | | | | | | | | | | | | | | | | | | | | | | | | | | | | | |
| | | Shares,
beginning of
period | | | Shares
purchased | | | Shares sold | | | Shares, end of
period | | | Net
realized
gains
(losses) | | | Net change
in
unrealized
gains
(losses) | | | Income
from
affiliated
securities | | | Value, end of period | | | % of
net
assets | |
Short-Term Investments | | | | | | | | | | | | | | | | | | | | | | | | | | | | | | | | | | | | |
| | | | | | |
Investment companies | | | | | | | | | | | | | | | | | | | | | | | | |
Securities Lending Cash Investment LLC | | | 5,691,200 | | | | 153,749,625 | | | | 149,848,574 | | | | 9,592,251 | | | $ | 846 | | | $ | 239 | | | $ | 39,640 | | | $ | 9,593,210 | | | | | |
Wells Fargo Government Money Market Fund Select Class | | | 2,192,563 | | | | 165,291,332 | | | | 154,391,339 | | | | 13,092,556 | | | | 0 | | | | 0 | | | | 76,775 | | | | 13,092,556 | | | | | |
| | | | | | | | | | | | | | | | | | | | | | | | | | | | | | | | | | | | |
| | | | | | | | | | | | | | | | | | $ | 846 | | | $ | 239 | | | $ | 116,415 | | | $ | 22,685,766 | | | | 9.05 | % |
| | | | | | | | | | | | | | | | | | | | | | | | | | | | | | | | | | | | |
The accompanying notes are an integral part of these financial statements.
| | | | | | |
| Statement of assets and liabilities—September 30, 2017 | | Wells Fargo C&B Mid Cap Value Fund | | | 15 | |
| | | | |
| | | | |
| |
Assets | | | | |
Investments in unaffiliated securities (including $9,376,662 of securities loaned), at value (cost $193,411,391) | | $ | 237,838,960 | |
Investments in affiliated securities, at value (cost $22,685,527) | | | 22,685,766 | |
Receivable for Fund shares sold | | | 1,043,388 | |
Receivable for dividends | | | 144,493 | |
Receivable for securities lending income | | | 2,723 | |
Prepaid expenses and other assets | | | 66,631 | |
| | | | |
Total assets | | | 261,781,961 | |
| | | | |
| |
Liabilities | | | | |
Payable for investments purchased | | | 792,471 | |
Payable for Fund shares redeemed | | | 499,961 | |
Payable upon receipt of securities loaned | | | 9,592,125 | |
Management fee payable | | | 142,616 | |
Administration fees payable | | | 34,868 | |
Distribution fees payable | | | 5,348 | |
Accrued expenses and other liabilities | | | 72,407 | |
| | | | |
Total liabilities | | | 11,139,796 | |
| | | | |
Total net assets | | $ | 250,642,165 | |
| | | | |
| |
NET ASSETS CONSIST OF | | | | |
Paid-in capital | | $ | 227,266,501 | |
Undistributed net investment income | | | 243,989 | |
Accumulated net realized losses on investments | | | (21,296,133 | ) |
Net unrealized gains on investments | | | 44,427,808 | |
| | | | |
Total net assets | | $ | 250,642,165 | |
| | | | |
| |
COMPUTATION OF NET ASSET VALUE AND OFFERING PRICE PER SHARE | | | | |
Net assets – Class A | | $ | 115,257,657 | |
Shares outstanding – Class A1 | | | 3,286,761 | |
Net asset value per share – Class A | | | $35.07 | |
Maximum offering price per share – Class A2 | | | $37.21 | |
Net assets – Class C | | $ | 8,567,173 | |
Shares outstanding – Class C1 | | | 258,700 | |
Net asset value per share – Class C | | | $33.12 | |
Net assets – Administrator Class | | $ | 21,267,052 | |
Shares outstanding – Administrator Class1 | | | 598,807 | |
Net asset value per share – Administrator Class | | | $35.52 | |
Net assets – Institutional Class | | $ | 105,550,283 | |
Shares outstanding – Institutional Class1 | | | 2,980,892 | |
Net asset value per share – Institutional Class | | | $35.41 | |
| 1 | The Fund has an unlimited number of authorized shares. |
| 2 | Maximum offering price is computed as 100/94.25 of net asset value. On investments of $50,000 or more, the offering price is reduced. |
The accompanying notes are an integral part of these financial statements.
| | | | |
| 16 | | Wells Fargo C&B Mid Cap Value Fund | | Statement of operations—year ended September 30, 2017 |
| | | | |
| | | | |
| |
Investment income | | | | |
Dividends (net of foreign withholding taxes of $14,276) | | $ | 2,738,738 | |
Income from affiliated securities | | | 116,415 | |
| | | | |
Total investment income | | | 2,855,153 | |
| | | | |
| |
Expenses | | | | |
Management fee | | | 1,702,526 | |
Administration fees | | | | |
Class A | | | 247,262 | |
Class B | | | 22 | 1 |
Class C | | | 17,335 | |
Administrator Class | | | 14,345 | |
Institutional Class | | | 116,948 | |
Shareholder servicing fees | | | | |
Class A | | | 294,360 | |
Class B | | | 26 | 1 |
Class C | | | 20,636 | |
Administrator Class | | | 27,586 | |
Distribution fees | | | | |
Class B | | | 78 | 1 |
Class C | | | 61,909 | |
Custody and accounting fees | | | 20,576 | |
Professional fees | | | 39,833 | |
Registration fees | | | 67,875 | |
Shareholder report expenses | | | 44,104 | |
Trustees’ fees and expenses | | | 20,768 | |
Other fees and expenses | | | 9,222 | |
| | | | |
Total expenses | | | 2,705,411 | |
Less: Fee waivers and/or expense reimbursements | | | (131,774 | ) |
| | | | |
Net expenses | | | 2,573,637 | |
| | | | |
Net investment income | | | 281,516 | |
| | | | |
| |
REALIZED AND UNREALIZED GAINS (LOSSES) ON INVESTMENTS | | | | |
| |
Net realized gains on: | | | | |
Unaffiliated securities | | | 22,528,229 | |
Affiliated securities | | | 846 | |
| | | | |
Net realized gains on investments | | | 22,529,075 | |
| | | | |
| |
Net change in unrealized gains (losses) on: | | | | |
Unaffiliated securities | | | 14,893,086 | |
Affiliated securities | | | 239 | |
| | | | |
Net change in unrealized gains (losses) on investments | | | 14,893,325 | |
| | | | |
Net realized and unrealized gains (losses) on investments | | | 37,422,400 | |
| | | | |
Net increase in net assets resulting from operations | | $ | 37,703,916 | |
| | | | |
| 1 | For the period from October 1, 2016 to December 5, 2016. Effective at the close of business on December 5, 2016, Class B shares were converted to Class A shares and are no longer offered by the Fund. |
The accompanying notes are an integral part of these financial statements.
| | | | | | |
| Statement of changes in net assets | | Wells Fargo C&B Mid Cap Value Fund | | | 17 | |
| | | | | | | | | | | | | | | | |
| | | Year ended
September 30, 2017 | | | Year ended
September 30, 2016 | |
| | | | |
Operations | | | | | | | | | | | | | | | | |
Net investment income | | | | | | $ | 281,516 | | | | | | | $ | 366,395 | |
Net realized gains on investments | | | | | | | 22,529,075 | | | | | | | | 7,300,682 | |
Net change in unrealized gains (losses) on investments | | | | | | | 14,893,325 | | | | | | | | 17,600,698 | |
| | | | |
Net increase in net assets resulting from operations | | | | | | | 37,703,916 | | | | | | | | 25,267,775 | |
| | | | |
| | | | |
Distributions to shareholders from | | | | | | | | | | | | | | | | |
Net investment income | | | | | | | | | | | | | | | | |
Class A | | | | | | | (83,058 | ) | | | | | | | (221,257 | ) |
Administrator Class | | | | | | | (9,681 | ) | | | | | | | (20,557 | ) |
Institutional Class | | | | | | | (150,215 | ) | | | | | | | (109,235 | ) |
| | | | |
Total distributions to shareholders | | | | | | | (242,954 | ) | | | | | | | (351,049 | ) |
| | | | |
| | | | |
Capital share transactions | | | Shares | | | | | | | | Shares | | | | | |
Proceeds from shares sold | | | | | | | | | | | | | | | | |
Class A | | | 329,229 | | | | 10,679,080 | | | | 4,470,268 | | | | 119,152,053 | |
Class C | | | 52,816 | | | | 1,621,177 | | | | 34,688 | | | | 897,420 | |
Administrator Class | | | 460,062 | | | | 15,785,454 | | | | 23,525 | | | | 632,143 | |
Institutional Class | | | 3,656,287 | | | | 121,259,348 | | | | 948,461 | | | | 26,675,954 | |
Investor Class | | | N/A | | | | N/A | | | | 29,800 | 1 | | | 784,378 | 1 |
| | | | |
| | | | | | | 149,345,059 | | | | | | | | 148,141,948 | |
| | | | |
Reinvestment of distributions | | | | | | | | | | | | | | | | |
Class A | | | 2,574 | | | | 82,120 | | | | 8,427 | | | | 219,598 | |
Administrator Class | | | 154 | | | | 4,968 | | | | 474 | | | | 12,485 | |
Institutional Class | | | 3,867 | | | | 124,207 | | | | 2,752 | | | | 72,162 | |
| | | | |
| | | | | | | 211,295 | | | | | | | | 304,245 | |
| | | | |
Payment for shares redeemed | | | | | | | | | | | | | | | | |
Class A | | | (1,145,224 | ) | | | (37,191,746 | ) | | | (1,169,247 | ) | | | (32,299,187 | ) |
Class B | | | (2,793 | )2 | | | (82,744 | )2 | | | (1,734 | ) | | | (44,690 | ) |
Class C | | | (56,912 | ) | | | (1,760,044 | ) | | | (52,342 | ) | | | (1,354,172 | ) |
Administrator Class | | | (141,587 | ) | | | (4,659,587 | ) | | | (126,420 | ) | | | (3,361,427 | ) |
Institutional Class | | | (1,971,512 | ) | | | (66,556,409 | ) | | | (378,243 | ) | | | (10,129,726 | ) |
Investor Class | | | N/A | | | | N/A | | | | (4,103,703 | )1 | | | (109,800,701 | )1 |
| | | | |
| | | | | | | (110,250,530 | ) | | | | | | | (156,989,903 | ) |
| | | | |
Net increase (decrease) in net assets resulting from capital share transactions | | | | | | | 39,305,824 | | | | | | | | (8,543,710 | ) |
| | | | |
Total increase in net assets | | | | | | | 76,766,786 | | | | | | | | 16,373,016 | |
| | | | |
| | | | |
Net assets | | | | | | | | | | | | | | | | |
Beginning of period | | | | | | | 173,875,379 | | | | | | | | 157,502,363 | |
| | | | |
End of period | | | | | | $ | 250,642,165 | | | | | | | $ | 173,875,379 | |
| | | | |
Undistributed net investment income | | | | | | $ | 243,989 | | | | | | | $ | 242,876 | |
| | | | |
| 1 | For the period from October 1, 2015 to October 23, 2015. Effective at the close of business on October 23, 2015, Investor Class shares were converted to Class A shares and are no longer offered by the Fund. |
| 2 | For the period from October 1, 2016 to December 5, 2016. Effective at the close of business on December 5, 2016, Class B shares were converted to Class A shares and are no longer offered by the Fund. |
The accompanying notes are an integral part of these financial statements.
| | | | |
| 18 | | Wells Fargo C&B Mid Cap Value Fund | | Financial highlights |
(For a share outstanding throughout each period)
| | | | | | | | | | | | | | | | | | | | |
| | | Year ended September 30 | |
| CLASS A | | 2017 | | | 2016 | | | 2015 | | | 2014 | | | 2013 | |
Net asset value, beginning of period | | | $29.27 | | | | $25.12 | | | | $25.26 | | | | $23.74 | | | | $18.22 | |
Net investment income (loss) | | | (0.00 | )1,2 | | | 0.07 | 1 | | | 0.05 | 1 | | | 0.06 | | | | 0.10 | 1 |
Net realized and unrealized gains (losses) on investments | | | 5.82 | | | | 4.13 | | | | (0.14 | ) | | | 1.55 | | | | 5.60 | |
| | | | | | | | | | | | | | | | | | | | |
Total from investment operations | | | 5.82 | | | | 4.20 | | | | (0.09 | ) | | | 1.61 | | | | 5.70 | |
Distributions to shareholders from | | | | | | | | | | | | | | | | | | | | |
Net investment income | | | (0.02 | ) | | | (0.05 | ) | | | (0.05 | ) | | | (0.09 | ) | | | (0.18 | ) |
Net asset value, end of period | | | $35.07 | | | | $29.27 | | | | $25.12 | | | | $25.26 | | | | $23.74 | |
Total return3 | | | 19.89 | % | | | 16.73 | % | | | (0.36 | )% | | | 6.78 | % | | | 31.59 | % |
Ratios to average net assets (annualized) | | | | | | | | | | | | | | | | | | | | |
Gross expenses | | | 1.30 | % | | | 1.33 | % | | | 1.35 | % | | | 1.35 | % | | | 1.38 | % |
Net expenses | | | 1.25 | % | | | 1.24 | % | | | 1.20 | % | | | 1.20 | % | | | 1.20 | % |
Net investment income (loss) | | | (0.00 | )% | | | 0.27 | % | | | 0.18 | % | | | 0.24 | % | | | 0.49 | % |
Supplemental data | | | | | | | | | | | | | | | | | | | | |
Portfolio turnover rate | | | 54 | % | | | 35 | % | | | 41 | % | | | 55 | % | | | 48 | % |
Net assets, end of period (000s omitted) | | | $115,258 | | | | $120,020 | | | | $19,862 | | | | $21,465 | | | | $19,468 | |
| 1 | Calculated based upon average shares outstanding |
| 2 | Amount is less than $0.005. |
| 3 | Total return calculations do not include any sales charges. |
The accompanying notes are an integral part of these financial statements.
| | | | | | |
| Financial highlights | | Wells Fargo C&B Mid Cap Value Fund | | | 19 | |
(For a share outstanding throughout each period)
| | | | | | | | | | | | | | | | | | | | |
| | | Year ended September 30 | |
| CLASS C | | 2017 | | | 2016 | | | 2015 | | | 2014 | | | 2013 | |
Net asset value, beginning of period | | | $27.83 | | | | $24.02 | | | | $24.29 | | | | $22.92 | | | | $17.60 | |
Net investment loss | | | (0.26 | ) | | | (0.14 | )1 | | | (0.15 | )1 | | | (0.13 | )1 | | | (0.05 | )1 |
Net realized and unrealized gains (losses) on investments | | | 5.55 | | | | 3.95 | | | | (0.12 | ) | | | 1.50 | | | | 5.42 | |
| | | | | | | | | | | | | | | | | | | | |
Total from investment operations | | | 5.29 | | | | 3.81 | | | | (0.27 | ) | | | 1.37 | | | | 5.37 | |
Distributions to shareholders from | | | | | | | | | | | | | | | | | | | | |
Net investment income | | | 0.00 | | | | 0.00 | | | | 0.00 | | | | 0.00 | | | | (0.05 | ) |
Net asset value, end of period | | | $33.12 | | | | $27.83 | | | | $24.02 | | | | $24.29 | | | | $22.92 | |
Total return2 | | | 19.01 | % | | | 15.86 | % | | | (1.11 | )% | | | 5.98 | % | | | 30.58 | % |
Ratios to average net assets (annualized) | | | | | | | | | | | | | | | | | | | | |
Gross expenses | | | 2.05 | % | | | 2.08 | % | | | 2.10 | % | | | 2.10 | % | | | 2.13 | % |
Net expenses | | | 2.00 | % | | | 1.98 | % | | | 1.95 | % | | | 1.95 | % | | | 1.95 | % |
Net investment loss | | | (0.74 | )% | | | (0.55 | )% | | | (0.57 | )% | | | (0.52 | )% | | | (0.26 | )% |
Supplemental data | | | | | | | | | | | | | | | | | | | | |
Portfolio turnover rate | | | 54 | % | | | 35 | % | | | 41 | % | | | 55 | % | | | 48 | % |
Net assets, end of period (000s omitted) | | | $8,567 | | | | $7,314 | | | | $6,737 | | | | $7,531 | | | | $7,598 | |
| 1 | Calculated based upon average shares outstanding |
| 2 | Total return calculations do not include any sales charges. |
The accompanying notes are an integral part of these financial statements.
| | | | |
| 20 | | Wells Fargo C&B Mid Cap Value Fund | | Financial highlights |
(For a share outstanding throughout each period)
| | | | | | | | | | | | | | | | | | | | |
| | | Year ended September 30 | |
| ADMINISTRATOR CLASS | | 2017 | | | 2016 | | | 2015 | | | 2014 | | | 2013 | |
Net asset value, beginning of period | | | $29.63 | | | | $25.42 | | | | $25.54 | | | | $24.01 | | | | $18.42 | |
Net investment income | | | 0.04 | 1 | | | 0.08 | 1 | | | 0.06 | 1 | | | 0.07 | 1 | | | 0.11 | 1 |
Net realized and unrealized gains (losses) on investments | | | 5.89 | | | | 4.19 | | | | (0.13 | ) | | | 1.56 | | | | 5.67 | |
| | | | | | | | | | | | | | | | | | | | |
Total from investment operations | | | 5.93 | | | | 4.27 | | | | (0.07 | ) | | | 1.63 | | | | 5.78 | |
Distributions to shareholders from | | | | | | | | | | | | | | | | | | | | |
Net investment income | | | (0.04 | ) | | | (0.06 | ) | | | (0.05 | ) | | | (0.10 | ) | | | (0.19 | ) |
Net asset value, end of period | | | $35.52 | | | | $29.63 | | | | $25.42 | | | | $25.54 | | | | $24.01 | |
Total return | | | 20.02 | % | | | 16.82 | % | | | (0.30 | )% | | | 6.82 | % | | | 31.65 | % |
Ratios to average net assets (annualized) | | | | | | | | | | | | | | | | | | | | |
Gross expenses | | | 1.22 | % | | | 1.25 | % | | | 1.21 | % | | | 1.19 | % | | | 1.21 | % |
Net expenses | | | 1.15 | % | | | 1.15 | % | | | 1.15 | % | | | 1.15 | % | | | 1.15 | % |
Net investment income | | | 0.12 | % | | | 0.28 | % | | | 0.22 | % | | | 0.26 | % | | | 0.53 | % |
Supplemental data | | | | | | | | | | | | | | | | | | | | |
Portfolio turnover rate | | | 54 | % | | | 35 | % | | | 41 | % | | | 55 | % | | | 48 | % |
Net assets, end of period (000s omitted) | | | $21,267 | | | | $8,302 | | | | $9,725 | | | | $12,830 | | | | $19,525 | |
| 1 | Calculated based upon average shares outstanding |
The accompanying notes are an integral part of these financial statements.
| | | | | | |
| Financial highlights | | Wells Fargo C&B Mid Cap Value Fund | | | 21 | |
(For a share outstanding throughout each period)
| | | | | | | | | | | | | | | | | | | | |
| | | Year ended September 30 | |
| INSTITUTIONAL CLASS | | 2017 | | | 2016 | | | 2015 | | | 2014 | | | 2013 | |
Net asset value, beginning of period | | | $29.53 | | | | $25.34 | | | | $25.49 | | | | $23.95 | | | | $18.38 | |
Net investment income | | | 0.16 | | | | 0.16 | | | | 0.10 | | | | 0.14 | | | | 0.17 | 1 |
Net realized and unrealized gains (losses) on investments | | | 5.82 | | | | 4.17 | | | | (0.12 | ) | | | 1.55 | | | | 5.64 | |
| | | | | | | | | | | | | | | | | | | | |
Total from investment operations | | | 5.98 | | | | 4.33 | | | | (0.02 | ) | | | 1.69 | | | | 5.81 | |
Distributions to shareholders from | | | | | | | | | | | | | | | | | | | | |
Net investment income | | | (0.10 | ) | | | (0.14 | ) | | | (0.13 | ) | | | (0.15 | ) | | | (0.24 | ) |
Net asset value, end of period | | | $35.41 | | | | $29.53 | | | | $25.34 | | | | $25.49 | | | | $23.95 | |
Total return | | | 20.30 | % | | | 17.11 | % | | | (0.09 | )%2 | | | 7.09 | % | | | 31.98 | % |
Ratios to average net assets (annualized) | | | | | | | | | | | | | | | | | | | | |
Gross expenses | | | 0.97 | % | | | 1.00 | % | | | 0.94 | % | | | 0.92 | % | | | 0.95 | % |
Net expenses | | | 0.90 | % | | | 0.90 | % | | | 0.90 | % | | | 0.90 | % | | | 0.90 | % |
Net investment income | | | 0.37 | % | | | 0.54 | % | | | 0.47 | % | | | 0.54 | % | | | 0.82 | % |
Supplemental data | | | | | | | | | | | | | | | | | | | | |
Portfolio turnover rate | | | 54 | % | | | 35 | % | | | 41 | % | | | 55 | % | | | 48 | % |
Net assets, end of period (000s omitted) | | | $105,550 | | | | $38,161 | | | | $18,229 | | | | $33,881 | | | | $24,628 | |
| 1 | Calculated based upon average shares outstanding |
| 2 | Total return reflects adjustments to conform with generally accepted accounting principles. |
The accompanying notes are an integral part of these financial statements.
| | | | |
| 22 | | Wells Fargo C&B Mid Cap Value Fund | | Notes to financial statements |
1. ORGANIZATION
Wells Fargo Funds Trust (the “Trust”), a Delaware statutory trust organized on March 10, 1999, is an open-end management investment company registered under the Investment Company Act of 1940, as amended (the “1940 Act”). As an investment company, the Trust follows the accounting and reporting guidance in Financial Accounting Standards Board Accounting Standards Codification Topic 946, Financial Services – Investment Companies. These financial statements report on the Wells Fargo C&B Mid Cap Value Fund (the “Fund”) which is a diversified series of the Trust.
Effective at the close of business on October 23, 2015, Investor Class shares were converted to Class A shares and are no longer offered by the Fund. Information for Investor Class shares reflected in the financial statements represents activity through October 23, 2015.
Effective at the close of business on December 5, 2016, Class B shares were converted to Class A shares and are no longer offered by the Fund. Information for Class B shares reflected in the financial statements represents activity through December 5, 2016.
2. SIGNIFICANT ACCOUNTING POLICIES
The following significant accounting policies, which are consistently followed in the preparation of the financial statements of the Fund, are in conformity with U.S. generally accepted accounting principles which require management to make estimates and assumptions that affect the reported amounts of assets and liabilities, disclosure of contingent assets and liabilities at the date of the financial statements, and the reported amounts of revenues and expenses during the reporting period. Actual results could differ from those estimates.
Securities valuation
All investments are valued each business day as of the close of regular trading on the New York Stock Exchange (generally 4 p.m. Eastern Time), although the Fund may deviate from this calculation time under unusual or unexpected circumstances.
Equity securities that are listed on a foreign or domestic exchange or market are valued at the official closing price or, if none, the last sales price. If no sale occurs on the principal exchange or market that day, a fair value price will be determined in accordance with the Fund’s Valuation Procedures.
Investments in registered open-end investment companies are valued at net asset value. Interests in non-registered investment companies that are redeemable at net asset value are fair valued normally at net asset value.
Investments which are not valued using any of the methods discussed above are valued at their fair value, as determined in good faith by the Board of Trustees of the Fund. The Board of Trustees has established a Valuation Committee comprised of the Trustees and has delegated to it the authority to take any actions regarding the valuation of portfolio securities that the Valuation Committee deems necessary or appropriate, including determining the fair value of portfolio securities, unless the determination has been delegated to the Management Valuation Team of Wells Fargo Funds Management, LLC (“Funds Management”). The Board of Trustees retains the authority to make or ratify any valuation decisions or approve any changes to the Valuation Procedures as it deems appropriate. On a quarterly basis, the Board of Trustees receives reports on any valuation actions taken by the Valuation Committee or the Management Valuation Team which may include items for ratification.
Valuations of fair valued securities are compared to the next actual sales price when available, or other appropriate market values, to assess the continued appropriateness of the fair valuation methodologies used. These securities are fair valued on a day-to-day basis, taking into consideration changes to appropriate market information and any significant changes to the inputs considered in the valuation process until there is a readily available price provided on an exchange or by an independent pricing service. Valuations received from an independent pricing service or independent broker-dealer quotes are periodically validated by comparisons to most recent trades and valuations provided by other independent pricing services in addition to the review of prices by the manager and/or subadviser. Unobservable inputs used in determining fair valuations are identified based on the type of security, taking into consideration factors utilized by market participants in valuing the investment, knowledge about the issuer and the current market environment.
Security loans
The Fund may lend its securities from time to time in order to earn additional income in the form of fees or interest on securities received as collateral or the investment of any cash received as collateral. The Fund continues to receive interest or dividends on the securities loaned. The Fund receives collateral in the form of cash or securities with a value at least equal to the value of the securities on loan. The value of the loaned securities is determined at the close of each business day and any additional required collateral is delivered to the Fund on the next business day. In a securities lending transaction, the net asset value of the Fund will be affected by an increase or decrease in the value of the securities loaned and by an increase or decrease in the value of the instrument in which collateral is invested. The amount
| | | | | | |
| Notes to financial statements | | Wells Fargo C&B Mid Cap Value Fund | | | 23 | |
of securities lending activity undertaken by the Fund fluctuates from time to time. In the event of default or bankruptcy by the borrower, the Fund may be prevented from recovering the loaned securities or gaining access to the collateral or may experience delays or costs in doing so. In addition, the investment of any cash collateral received may lose all or part of its value. The Fund has the right under the lending agreement to recover the securities from the borrower on demand.
The Fund lends its securities through an unaffiliated securities lending agent. Cash collateral received in connection with its securities lending transactions is invested in Securities Lending Cash Investments, LLC (the “Securities Lending Fund”). The Securities Lending Fund is exempt from registration under Section 3(c)(7) of the 1940 Act and is managed by Funds Management and is subadvised by Wells Capital Management Incorporated (“WellsCap”), an affiliate of Funds Management and an indirect wholly owned subsidiary of Wells Fargo & Company (“Wells Fargo”). Funds Management receives an advisory fee starting at 0.05% and declining to 0.01% as the average daily net assets of the Securities Lending Fund increase. All of the fees received by Funds Management are paid to WellsCap for its services as subadviser. The Securities Lending Fund seeks to provide a positive return compared to the daily Fed Funds Open Rate by investing in high-quality, U.S. dollar-denominated short-term money market instruments. Securities Lending Fund investments are valued at the evaluated bid price provided by an independent pricing service. Income earned from investment in the Securities Lending Fund is included in income from affiliates securities on the Statement of Operations.
Security transactions and income recognition
Securities transactions are recorded on a trade date basis. Realized gains or losses are recorded on the basis of identified cost.
Dividend income is recognized on the ex-dividend date. Dividend income is recorded net of foreign taxes withheld where recovery of such taxes is not assured.
Distributions to shareholders
Distributions to shareholders from net investment income and net realized gains, if any, are recorded on the ex-dividend date. Such distributions are determined in accordance with income tax regulations and may differ from U.S. generally accepted accounting principles. Dividend sources are estimated at the time of declaration. The tax character of distributions is determined as of the Fund’s fiscal year end. Therefore, a portion of the Fund’s distributions made prior to the Fund’s fiscal year end may be categorized as a tax return of capital.
Federal and other taxes
The Fund intends to continue to qualify as a regulated investment company by distributing substantially all of its investment company taxable income and any net realized capital gains (after reduction for capital loss carryforwards) sufficient to relieve it from all, or substantially all, federal income taxes. Accordingly, no provision for federal income taxes was required.
The Fund’s income and federal excise tax returns and all financial records supporting those returns for the prior three fiscal years are subject to examination by the federal and Delaware revenue authorities. Management has analyzed the Fund’s tax positions taken on federal, state, and foreign tax returns for all open tax years and does not believe that there are any uncertain tax positions that require recognition of a tax liability.
As of September 30, 2017, the aggregate cost of all investments for federal income tax purposes was $218,174,379 and the unrealized gains (losses) consisted of:
| | | | |
Gross unrealized gains | | $ | 46,412,775 | |
Gross unrealized losses | | | (4,062,428 | ) |
Net unrealized gains | | $ | 42,350,347 | |
Reclassifications are made to the Fund’s capital accounts for permanent tax differences to reflect income and gains available for distribution (or available capital loss carryforwards) under federal income tax regulations. U.S. generally accepted accounting principles require that certain components of net assets be adjusted to reflect permanent differences between financial and tax reporting. These reclassifications have no effect on net assets or net asset values per share. The primary permanent difference causing such reclassifications is due to expiration of capital loss carryforwards. At September 30, 2017, as a result of permanent book-to-tax differences, the following reclassification adjustments were made on the Statement of Assets and Liabilities:
| | | | |
| Paid-in capital | | Undistributed net
investment income | | Accumulated net
realized losses
on investments |
| $(30,745,844) | | $(37,449) | | $30,783,293 |
| | | | |
| 24 | | Wells Fargo C&B Mid Cap Value Fund | | Notes to financial statements |
As of September 30, 2017, the Fund had capital loss carryforwards available to offset future net realized capital gains in the amount of $19,218,672 expiring in 2018.
Class allocations
The separate classes of shares offered by the Fund differ principally in applicable sales charges, distribution, shareholder servicing, and administration fees. Class specific expenses are charged directly to that share class. Investment income, common expenses, and realized and unrealized gains (losses) on investments are allocated daily to each class of shares based on the relative proportion of net assets of each class.
3. FAIR VALUATION MEASUREMENTS
Fair value measurements of investments are determined within a framework that has established a fair value hierarchy based upon the various data inputs utilized in determining the value of the Fund’s investments. The three-level hierarchy gives the highest priority to unadjusted quoted prices in active markets for identical assets or liabilities (Level 1) and the lowest priority to unobservable inputs (Level 3). The Fund’s investments are classified within the fair value hierarchy based on the lowest level of input that is significant to the fair value measurement. The inputs are summarized into three broad levels as follows:
| ∎ | | Level 1 – quoted prices in active markets for identical securities |
| ∎ | | Level 2 – other significant observable inputs (including quoted prices for similar securities, interest rates, prepayment speeds, credit risk, etc.) |
| ∎ | | Level 3 – significant unobservable inputs (including the Fund’s own assumptions in determining the fair value of investments) |
The inputs or methodologies used for valuing investments in securities are not necessarily an indication of the risk associated with investing in those securities.
The following is a summary of the inputs used in valuing the Fund’s assets and liabilities as of September 30, 2017:
| | | | | | | | | | | | | | | | |
| | | Quoted prices
(Level 1) | | | Other significant
observable inputs
(Level 2) | | | Significant
unobservable inputs (Level 3) | | | Total | |
Assets | | | | | | | | | | | | | | | | |
Investments in: | | | | | | | | | | | | | | | | |
| | | | |
Common stocks | | | | | | | | | | | | | | | | |
Consumer discretionary | | $ | 47,448,720 | | | $ | 0 | | | $ | 0 | | | $ | 47,448,720 | |
Consumer staples | | | 4,383,586 | | | | 0 | | | | 0 | | | | 4,383,586 | |
Energy | | | 3,594,460 | | | | 0 | | | | 0 | | | | 3,594,460 | |
Financials | | | 64,200,869 | | | | 0 | | | | 0 | | | | 64,200,869 | |
Health care | | | 21,497,359 | | | | 0 | | | | 0 | | | | 21,497,359 | |
Industrials | | | 44,340,414 | | | | 0 | | | | 0 | �� | | | 44,340,414 | |
Information technology | | | 20,638,877 | | | | 0 | | | | 0 | | | | 20,638,877 | |
Materials | | | 27,223,167 | | | | 0 | | | | 0 | | | | 27,223,167 | |
Real estate | | | 4,511,508 | | | | 0 | | | | 0 | | | | 4,511,508 | |
| | | | |
Short-term investments | | | | | | | | | | | | | | | | |
Investment companies | | | 13,092,556 | | | | 0 | | | | 0 | | | | 13,092,556 | |
Investments measured at net asset value* | | | | | | | | | | | | | | | 9,593,210 | |
Total assets | | $ | 250,931,516 | | | $ | 0 | | | $ | 0 | | | $ | 260,524,726 | |
| * | Investments that are measured at fair value using the net asset value per share (or its equivalent) as a practical expedient have not been categorized in the fair value hierarchy. The fair value amount presented in the table is intended to permit reconciliation of the fair value hierarchy to the amounts presented in the Statement of Assets and Liabilities. The Fund’s investment in Securities Lending Cash Investments, LLC valued at $9,593,210 does not have a redemption period notice, can be redeemed daily and does not have any unfunded commitments. |
| | | | | | |
| Notes to financial statements | | Wells Fargo C&B Mid Cap Value Fund | | | 25 | |
The Fund recognizes transfers between levels within the fair value hierarchy at the end of the reporting period. At September 30, 2017, the Fund did not have any transfers into/out of Level 1, Level 2, or Level 3.
4. TRANSACTIONS WITH AFFILIATES AND OTHER EXPENSES
Management fee
Funds Management, an indirect wholly owned subsidiary of Wells Fargo, is the manager of the Fund and provides advisory and fund-level administrative services under an investment management agreement. Under the investment management agreement, Funds Management is responsible for, among other services, implementing the investment objectives and strategies of the Fund, supervising the subadviser, providing fund-level administrative services in connection with the Fund’s operations, and providing any other fund-level administrative services reasonably necessary for the operation of the Fund. As compensation for its services under the investment management agreement, Funds Management is entitled to receive an annual management fee starting at 0.75% and declining to 0.63% as the average daily net assets of the Fund increase. For the year ended September 30, 2017, the management fee was equivalent to an annual rate of 0.75% of the Fund’s average daily net assets.
Funds Management has retained the services of a subadviser to provide daily portfolio management to the Fund. The fee for subadvisory services is borne by Funds Management. Cooke & Bieler, L.P. which is not an affiliate of Funds Management, is the subadviser to the Fund and is entitled to receive a fee from Funds Management at an annual rate starting at 0.45% and declining to 0.35% as the average daily net assets of the Fund increase.
Administration fees
Under a class-level administration agreement, Funds Management provides class-level administrative services to the Fund, which includes paying fees and expenses for services provided by the transfer agent, sub-transfer agents, omnibus account servicers and record-keepers. As compensation for its services under the class-level administration agreement, Funds Management receives an annual fee which is calculated based on the average daily net assets of each class as follows:
| | | | |
| | | Class-level
administration fee | |
Class A, Class B, Class C | | | 0.21 | % |
Administrator Class, Institutional Class | | | 0.13 | |
Funds Management has contractually waived and/or reimbursed management and administration fees to the extent necessary to maintain certain net operating expense ratios for the Fund. Waiver of fees and/or reimbursement of expenses by Funds Management were made first from fund level expenses on a proportionate basis and then from class specific expenses. Funds Management has committed through January 31, 2018 to waive fees and/or reimburse expenses to the extent necessary to cap the Fund’s expenses at 1.25% for Class A shares, 2.00% for Class C shares, 1.15% for Administrator Class shares, and 0.90% for Institutional Class shares. After this time, the cap may be increased or the commitment to maintain the cap may be terminated only with the approval of the Board of Trustees.
During the year ended September 30, 2017, State Street Bank and Trust Company (“State Street’), the Fund’s custodian, reimbursed the Fund $184 for certain out-of-pocket expenses that were billed to the Fund in error from 1998-2015. This amount is included in dividend income on the Statement of Operations. In addition, Funds Management was also reimbursed $3,033 by State Street for waivers/reimbursements it made to the Fund to limit Fund expenses during the period the Fund was erroneously billed.
Distribution fees
The Trust has adopted a distribution plan for Class B and Class C shares of the Fund pursuant to Rule 12b-1 under the 1940 Act. Distribution fees are charged to Class B and Class C shares and paid to Wells Fargo Funds Distributor, LLC (“Funds Distributor”), the principal underwriter, at an annual rate of 0.75% of the average daily net assets of Class B and Class C shares.
In addition, Funds Distributor is entitled to receive the front-end sales charge from the purchase of Class A shares and a contingent deferred sales charge on the redemption of certain Class A shares. Funds Distributor is also entitled to receive the contingent deferred sales charges from redemptions of Class B and Class C shares. For the year ended September 30, 2017, Funds Distributor received $2,700 from the sale of Class A shares. No contingent deferred sales charges were incurred by Class A, Class B, and Class C shares for the year ended September 30, 2017.
| | | | |
| 26 | | Wells Fargo C&B Mid Cap Value Fund | | Notes to financial statements |
Shareholder servicing fees
The Trust has entered into contracts with one or more shareholder servicing agents, whereby Class A, Class B, Class C, and Administrator Class of the Fund are charged a fee at an annual rate of 0.25% of the average daily net assets of each respective class.
A portion of these total shareholder servicing fees were paid to affiliates of Wells Fargo.
Interfund transactions
The Fund may purchase or sell portfolio investment securities to certain other Wells Fargo affiliates pursuant to Rule 17a-7 of the 1940 Act and under procedures adopted by the Board of Trustees. The procedures have been designed to ensure that these interfund transactions, which do not incur broker commissions, are effected at current market prices.
5. INVESTMENT PORTFOLIO TRANSACTIONS
Purchases and sales of investments, excluding U.S. government obligations (if any) and short-term securities, for the year ended September 30, 2017 were $150,428,554 and $115,834,484, respectively.
6. BANK BORROWINGS
The Trust (excluding the money market funds and certain other funds) and Wells Fargo Variable Trust are parties to a $280,000,000 revolving credit agreement whereby the Fund is permitted to use bank borrowings for temporary or emergency purposes, such as to fund shareholder redemption requests. Interest under the credit agreement is charged to the Fund based on a borrowing rate equal to the higher of the Federal Funds rate in effect on that day plus 1.25% or the overnight LIBOR rate in effect on that day plus 1.25%. In addition, an annual commitment fee equal to 0.25% of the unused balance is allocated to each participating fund. Prior to August 29, 2017, the revolving credit agreement amount was $250,000,000.
For the year ended September 30, 2017, there were no borrowings by the Fund under the agreement.
7. DISTRIBUTIONS TO SHAREHOLDERS
The tax character of distributions paid was $242,954 and $351,049 of ordinary income for the years ended September 30, 2017 and September 30, 2016, respectively.
As of September 30, 2017, the components of distributable earnings on a tax basis were as follows:
| | | | |
Undistributed ordinary income | | Unrealized gains | | Capital loss carryforward |
| $243,989 | | $42,350,347 | | $(19,218,672) |
8. CONCENTRATION RISK
Concentration risks result from exposure to a limited number of sectors. A fund that invests a substantial portion of its assets in any sector may be more affected by changes in that sector than would be a fund whose investments are not heavily weighted in any sector.
9. INDEMNIFICATION
Under the Trust’s organizational documents, the officers and Trustees have been granted certain indemnification rights against certain liabilities that may arise out of performance of their duties to the Trust. Additionally, in the normal course of business, the Trust may enter into contracts with service providers that contain a variety of indemnification clauses. The Trust’s maximum exposure under these arrangements is dependent on future claims that may be made against the Fund and, therefore, cannot be estimated.
| | | | | | |
| Report of independent registered public accounting firm | | Wells Fargo C&B Mid Cap Value Fund | | | 27 | |
BOARD OF TRUSTEES AND SHAREHOLDERS OF WELLS FARGO FUNDS TRUST:
We have audited the accompanying statement of assets and liabilities, including the portfolio of investments, of the Wells Fargo C&B Mid Cap Value Fund (the “Fund”), one of the funds constituting the Wells Fargo Funds Trust, as of September 30, 2017, and the related statement of operations for the year then ended, the statements of changes in net assets for each of the years in the two-year period then ended, and the financial highlights for each of the years in the five-year period then ended. These financial statements and financial highlights are the responsibility of the Fund’s management. Our responsibility is to express an opinion on these financial statements and financial highlights based on our audits.
We conducted our audits in accordance with the standards of the Public Company Accounting Oversight Board (United States). Those standards require that we plan and perform the audit to obtain reasonable assurance about whether the financial statements and financial highlights are free of material misstatement. An audit includes examining, on a test basis, evidence supporting the amounts and disclosures in the financial statements. Our procedures included confirmation of securities owned as of September 30, 2017, by correspondence with the custodian and brokers, or by other appropriate auditing procedures. An audit also includes assessing the accounting principles used and significant estimates made by management, as well as evaluating the overall financial statement presentation. We believe that our audits provide a reasonable basis for our opinion.
In our opinion, the financial statements and financial highlights referred to above present fairly, in all material respects, the financial position of the Wells Fargo C&B Mid Cap Value Fund as of September 30, 2017, the results of its operations for the year then ended, the changes in its net assets for each of the years in the two-year period then ended, and the financial highlights for each of the years in the five-year period then ended, in conformity with U.S. generally accepted accounting principles.

Boston, Massachusetts
November 22, 2017
| | | | |
| 28 | | Wells Fargo C&B Mid Cap Value Fund | | Other information (unaudited) |
TAX INFORMATION
For corporate shareholders, pursuant to Section 854 of the Internal Revenue Code, 100% of ordinary income dividends qualify for the corporate dividends-received deduction for the fiscal year ended September 30, 2017.
Pursuant to Section 854 of the Internal Revenue Code, $242,954 of income dividends paid during the fiscal year ended September 30, 2017 has been designated as qualified dividend income (QDI).
PROXY VOTING INFORMATION
A description of the policies and procedures that the Fund uses to determine how to vote proxies relating to portfolio securities is available, upon request, by calling 1-800-222-8222, visiting our website at wellsfargofunds.com, or visiting the SEC website at sec.gov. Information regarding how the Fund voted proxies relating to portfolio securities during the most recent 12-month period ended June 30 is available on the Fund’s website at wellsfargofunds.com or by visiting the SEC website at sec.gov.
PORTFOLIO HOLDINGS INFORMATION
The complete portfolio holdings for the Fund are publicly available monthly on the Fund’s website (wellsfargofunds.com), on a one-month delayed basis. In addition, top ten holdings information (excluding derivative positions) for the Fund is publicly available on the Fund’s website on a monthly, seven-day or more delayed basis. The Fund files its complete schedule of portfolio holdings with the SEC for the first and third quarters of each fiscal year on Form N-Q, which is available by visiting the SEC website at sec.gov. In addition, the Fund’s Form N-Q may be reviewed and copied at the SEC’s Public Reference Room in Washington, DC, and at regional offices in New York City, at 233 Broadway, and in Chicago, at 175 West Jackson Boulevard, Suite 900. Information about the Public Reference Room may be obtained by calling 1-800-SEC-0330.
| | | | | | |
| Other information (unaudited) | | Wells Fargo C&B Mid Cap Value Fund | | | 29 | |
BOARD OF TRUSTEES AND OFFICERS
Each of the Trustees and Officers1 listed in the table below acts in identical capacities for each fund in the Wells Fargo family of funds, which consists of 152 mutual funds comprising the Wells Fargo Funds Trust, Wells Fargo Variable Trust, Wells Fargo Master Trust and four closed-end funds (collectively the “Fund Complex”). This table should be read in conjunction with the Prospectus and the Statement of Additional Information2. The mailing address of each Trustee and Officer is 525 Market Street, 12th Floor, San Francisco, CA 94105. Each Trustee and Officer serves an indefinite term, however, each Trustee serves such term until reaching the mandatory retirement age established by the Trustees.
Independent Trustees
| | | | | | |
Name and year of birth | | Position held and length of service* | | Principal occupations during past five years or longer | | Current other
public company or
investment company
directorships |
William R. Ebsworth (Born 1957) | | Trustee, since 2015 | | Retired. From 1984 to 2013, equities analyst, portfolio manager, research director and chief investment officer at Fidelity Management and Research Company in Boston, Tokyo, and Hong Kong and retired in 2013 as Chief Investment Officer of Fidelity Strategic Advisers, Inc. where he led a team of investment professionals managing client assets. Prior thereto, Board member of Hong Kong Securities Clearing Co., Hong Kong Options Clearing Corp., the Thailand International Fund, Ltd., Fidelity Investments Life Insurance Company, and Empire Fidelity Investments Life Insurance Company. Board member of the Forté Foundation (non-profit organization) and the Vincent Memorial Hospital Endowment (non-profit organization), where he serves on the Investment Committee and as a Chair of the Audit Committee. Mr. Ebsworth is a CFA® charterholder. | | Asset Allocation Trust |
Jane A. Freeman (Born 1953) | | Trustee, since 2015 | | Retired. From 2012 to 2014 and 1999 to 2008, Chief Financial Officer of Scientific Learning Corporation. From 2008 to 2012, Ms. Freeman provided consulting services related to strategic business projects. Prior to 1999, Portfolio Manager at Rockefeller & Co. and Scudder, Stevens & Clark. Board member of the Harding Loevner Funds from 1996 to 2014, serving as both Lead Independent Director and chair of the Audit Committee. Board member of the Russell Exchange Traded Funds Trust from 2011 to 2012 and the chair of the Audit Committee. Ms. Freeman is a Board Member of Ruth Bancroft Garden (non-profit organization) and an inactive chartered financial analyst. | | Asset Allocation Trust |
Peter G. Gordon** (Born 1942) | | Trustee, since 1998; Chairman, since 2005 | | Co-Founder, Retired Chairman, President and CEO of Crystal Geyser Water Company. Trustee Emeritus, Colby College. | | Asset Allocation Trust |
Isaiah Harris, Jr. (Born 1952) | | Trustee, since 2009 | | Retired. Chairman of the Board of CIGNA Corporation since 2009, and Director since 2005. From 2003 to 2011, Director of Deluxe Corporation. Prior thereto, President and CEO of BellSouth Advertising and Publishing Corp. from 2005 to 2007, President and CEO of BellSouth Enterprises from 2004 to 2005 and President of BellSouth Consumer Services from 2000 to 2003. Emeritus member of the Iowa State University Foundation Board of Governors. Emeritus Member of the Advisory Board of Iowa State University School of Business. Advisory Board Member, Palm Harbor Academy (charter school). Advisory Board Member, Child Evangelism Fellowship (non-profit). Mr. Harris is a certified public accountant (inactive status). | | CIGNA Corporation; Asset Allocation Trust |
Judith M. Johnson (Born 1949) | | Trustee, since 2008; Audit Committee Chairman, since 2008 | | Retired. Prior thereto, Chief Executive Officer and Chief Investment Officer of Minneapolis Employees Retirement Fund from 1996 to 2008. Ms. Johnson is an attorney, certified public accountant and a certified managerial accountant. | | Asset Allocation Trust |
David F. Larcker (Born 1950) | | Trustee, since 2009 | | James Irvin Miller Professor of Accounting at the Graduate School of Business, Stanford University, Director of the Corporate Governance Research Initiative and Senior Faculty of The Rock Center for Corporate Governance since 2006. From 2005 to 2008, Professor of Accounting at the Graduate School of Business, Stanford University. Prior thereto, Ernst & Young Professor of Accounting at The Wharton School, University of Pennsylvania from 1985 to 2005. | | Asset Allocation Trust |
| | | | |
| 30 | | Wells Fargo C&B Mid Cap Value Fund | | Other information (unaudited) |
| | | | | | |
Name and year of birth | | Position held and length of service* | | Principal occupations during past five years or longer | | Current other
public company or
investment company
directorships |
Olivia S. Mitchell (Born 1953) | | Trustee, since 2006 | | International Foundation of Employee Benefit Plans Professor, Wharton School of the University of Pennsylvania since 1993. Director of Wharton’s Pension Research Council and Boettner Center on Pensions & Retirement Research, and Research Associate at the National Bureau of Economic Research. Previously, Cornell University Professor from 1978 to 1993. | | Asset Allocation Trust |
Timothy J. Penny (Born 1951) | | Trustee, since 1996: Vice Chairman, since 2017 | | President and Chief Executive Officer of Southern Minnesota Initiative Foundation, a non-profit organization, since 2007 and Senior Fellow at the Humphrey Institute Policy Forum at the University of Minnesota since 1995. Member of the Board of Trustees of NorthStar Education Finance, Inc., a non-profit organization, since 2007. | | Asset Allocation Trust |
Michael S. Scofield (Born 1943) | | Trustee, since 2010 | | Served on the Investment Company Institute’s Board of Governors and Executive Committee from 2008-2011 as well the Governing Council of the Independent Directors Council from 2006-2011 and the Independent Directors Council Executive Committee from 2008-2011. Chairman of the IDC from 2008-2010. Trustee of the Evergreen Funds complex (and its predecessors) from 1984 to 2010. Chairman of the Evergreen Funds from 2000-2010. Former Trustee of the Mentor Funds. Retired Attorney, Law Offices of Michael S. Scofield. | | Asset Allocation Trust |
| * | Length of service dates reflect the Trustee’s commencement of service with the Trust’s predecessor entities, where applicable. |
| ** | Peter Gordon is expected to retire on December 31, 2017. |
Advisory Board Members
| | | | | | |
Name and year of birth | | Position held and length of service | | Principal occupations during past five years or longer | | Current other public company or investment company
directorships |
James G. Polisson (Born 1959) | | Advisory Board Member, since 2017 | | Retired. Chief Marketing Officer, Source (ETF) UK Services, Ltd, from 2015 to 2017. From 2012 to 2015, Principal of The Polisson Group, LLC, a management consulting, corporate advisory and principal investing company. Chief Executive Officer and Managing Director at Russell Investments, Global Exchange Traded Funds from 2010 to 2012. Managing Director of Barclays Global Investors from 1998 to 2010 and Global Chief Marketing Officer for iShares and Barclays Global Investors from 2000 to 2010. Prior thereto, Vice President, Fidelity Retail Mutual Fund Group from 1996 to 1998 and Risk Management Practice Manager, Fidelity Consulting from 1995 to 1996. Board member of the Russell Exchange Traded Fund Trust from 2011 to 2012. Director of Barclays Global Investors Holdings Deutschland GmbH from 2006 to 2009. Mr. Polisson is an attorney and has a retired status with the Massachusetts and District of Columbia Bar Associations. | | None |
Pamela Wheelock (Born 1959) | | Advisory Board Member, since 2017 | | Chief Operating Officer, Twin Cities Habitat for Humanity, since January, 2017. Vice President of University Services, University of Minnesota from 2012 to 2017. Prior thereto, Interim President and Chief Executive Officer of Blue Cross Blue Shield of Minnesota from 2010 to 2011, Chairman of the Board from 2009 to 2011 and Board Director from 2003 to 2015. Vice President, Leadership and Community Engagement, Bush Foundation, Saint Paul, Minnesota (a private foundation) from 2009 to 2011. Executive Vice President and Chief Financial Officer, Minnesota Sports and Entertainment from 2004 to 2009 and Senior Vice President from 2002 to 2004. Commissioner of Finance, State of Minnesota, from 1999 to 2002. Currently on the Board of Directors, Governance Committee and Finance Committee, for the Minnesota Philanthropy Partners (Saint Paul Foundation) since 2012 and Board Chair of the Minnesota Wild Foundation since 2010. | | None |
| | | | | | |
| Other information (unaudited) | | Wells Fargo C&B Mid Cap Value Fund | | | 31 | |
Officers
| | | | | | |
Name and year of birth | | Position held and
length of service | | Principal occupations during past five years or longer | | |
Andrew Owen (Born 1960) | | President, since 2017 | | Executive Vice President of Wells Fargo & Company and Head of Affiliated Managers, Wells Fargo Asset Management, since 2014. In addition, Mr. Owen is currently President, Chief Executive Officer and Director of Wells Fargo Funds Management, LLC since 2017. Prior thereto, Executive Vice President responsible for marketing, investments and product development for Wells Fargo Funds Management, LLC, from 2009 to 2014. | | |
Nancy Wiser1 (Born 1967) | | Treasurer, since 2012 | | Executive Vice President of Wells Fargo Funds Management, LLC since 2011. Chief Operating Officer and Chief Compliance Officer at LightBox Capital Management LLC, from 2008 to 2011. | | |
C. David Messman (Born 1960) | | Secretary, since 2000; Chief Legal Officer, since 2003 | | Senior Vice President and Secretary of Wells Fargo Funds Management, LLC since 2001. Assistant General Counsel of Wells Fargo Bank, N.A. since 2013 and Vice President and Managing Counsel of Wells Fargo Bank, N.A. from 1996 to 2013. | | |
Michael H. Whitaker (Born 1967) | | Chief Compliance Officer, since 2016 | | Senior Vice President and Chief Compliance Officer since 2016. Senior Vice President and Chief Compliance Officer for Fidelity Investments from 2007 to 2016. | | |
David Berardi (Born 1975) | | Assistant Treasurer, since 2009 | | Vice President of Wells Fargo Funds Management, LLC since 2009. Vice President of Evergreen Investment Management Company, LLC from 2008 to 2010. Manager of Fund Reporting and Control for Evergreen Investment Management Company, LLC from 2004 to 2010. | | |
Jeremy DePalma1 (Born 1974) | | Assistant Treasurer, since 2009 | | Senior Vice President of Wells Fargo Funds Management, LLC since 2009. Senior Vice President of Evergreen Investment Management Company, LLC from 2008 to 2010 and head of the Fund Reporting and Control Team within Fund Administration from 2005 to 2010. | | |
| 1 | Nancy Wiser acts as Treasurer of 76 funds in the Fund Complex. Jeremy DePalma acts as Treasurer of 76 funds and Assistant Treasurer of 76 funds in the Fund Complex. |
| 2 | The Statement of Additional Information includes additional information about the Trustees and is available, without charge, upon request, by calling 1-800-222-8222 or by visiting the website at wellsfargofunds.com. |
| | | | |
| 32 | | Wells Fargo C&B Mid Cap Value Fund | | Other information (unaudited) |
BOARD CONSIDERATION OF INVESTMENT MANAGEMENT AND SUB-ADVISORY AGREEMENTS:
Under the Investment Company Act of 1940 (the “1940 Act”), the Board of Trustees (the “Board”) of Wells Fargo Funds Trust (the “Trust”) must determine annually whether to approve the continuation of the Trust’s investment management and sub-advisory agreements. In this regard, at an in-person meeting held on May 16-17, 2017 (the “Meeting”), the Board, all the members of which have no direct or indirect interest in the investment management and sub-advisory agreements and are not “interested persons” of the Trust, as defined in the 1940 Act (the “Independent Trustees”), reviewed and approved for Wells Fargo C&B Mid Cap Value Fund (the “Fund”): (i) an investment management agreement (the “Management Agreement”) with Wells Fargo Funds Management, LLC (“Funds Management”); and (ii) an investment sub-advisory agreement (the “Sub-Advisory Agreement”) with Cooke & Bieler, L.P. (the “Sub-Adviser”). The Management Agreement and the Sub-Advisory Agreement are collectively referred to as the “Advisory Agreements.”
At the Meeting, the Board considered the factors and reached the conclusions described below relating to the selection of Funds Management and the Sub-Adviser and the approval of the Advisory Agreements. Prior to the Meeting, including at an in-person meeting in April 2017, the Trustees conferred extensively among themselves and with representatives of Funds Management about these matters. Also, the Board has adopted a team-based approach, with each team consisting of a sub-set of Trustees, to assist the full Board in the discharge of its duties in reviewing performance and other matters throughout the year. The Independent Trustees were assisted in their evaluation of the Advisory Agreements by independent legal counsel, from whom they received separate legal advice and with whom they met separately.
In providing information to the Board, Funds Management and the Sub-Adviser were guided by a detailed set of requests for information submitted to them by independent legal counsel on behalf of the Independent Trustees at the start of the Board’s annual contract renewal process earlier in 2017. In considering and approving the Advisory Agreements, the Trustees considered the information they believed relevant, including but not limited to the information discussed below. The Board considered not only the specific information presented in connection with the Meeting, but also the knowledge gained over time through interaction with Funds Management and the Sub-Adviser about various topics. In this regard, the Board reviewed reports of Funds Management at each of its quarterly meetings, which included, among other things, portfolio reviews and performance reports. In addition, the Board and the teams mentioned above confer with portfolio managers at various times throughout the year. The Board did not identify any particular information or consideration that was all-important or controlling, and each individual Trustee may have attributed different weights to various factors.
After its deliberations, the Board unanimously approved the continuation of the Advisory Agreements for a one-year term and determined that the compensation payable to Funds Management and the Sub-Adviser under each of the Advisory Agreements was reasonable. The Board considered the approval of the Advisory Agreements for the Fund as part of its consideration of agreements for funds across the complex, but its approvals were made on a fund-by-fund basis. The following summarizes a number of important, but not necessarily all, factors considered by the Board in support of its approvals.
Nature, extent and quality of services
The Board received and considered various information regarding the nature, extent and quality of services provided to the Fund by Funds Management and the Sub-Adviser under the Advisory Agreements. This information included a description of the investment advisory services and Fund-level administrative services covered by the Management Agreement, as well as, among other things, a summary of the background and experience of senior management of Funds Management, a summary of certain organizational and personnel changes involving Funds Management, and a description of Funds Management’s and the Sub-Adviser’s business continuity planning programs and of their approaches to data privacy and cybersecurity. The Board also considered the qualifications, background, tenure and responsibilities of each of the portfolio managers primarily responsible for the day-to-day portfolio management of the Fund.
The Board evaluated the ability of Funds Management and the Sub-Adviser to attract and retain qualified investment professionals, including research, advisory and supervisory personnel. The Board further considered the compliance programs and compliance records of Funds Management and the Sub-Adviser. In addition, the Board took into account the full range of services provided to the Fund by Funds Management and its affiliates.
Fund performance and expenses
The Board considered the investment performance results for the Fund over various time periods ended December 31, 2016. The Board considered these results in comparison to the performance of funds in a universe that was determined by Broadridge Inc. (“Broadridge”) to be similar to the Fund (the “Universe”), and in comparison to the Fund’s benchmark index
| | | | | | |
| Other information (unaudited) | | Wells Fargo C&B Mid Cap Value Fund | | | 33 | |
and to other comparative data. Broadridge is an independent provider of investment company data. The Board received a description of the methodology used by Broadridge to select the mutual funds in the performance Universe. The Board noted that the performance of the Fund (Administrator Class) was higher than or in range of the average performance of the Universe for all periods under review. The Board also noted that the performance of the Fund was higher than or in range of its benchmark, the Russell Midcap® Value Index, for the one- and five-year periods, but lower than its benchmark for the three- and ten-year periods.
The Board also received and considered information regarding the Fund’s net operating expense ratios and their various components, including actual management fees, custodian and other non-management fees, and Rule 12b-1 and non-Rule 12b-1 shareholder service fees. The Board considered these ratios in comparison to the median ratios of funds in class-specific expense groups that were determined by Broadridge to be similar to the Fund (the “Groups”). The Board received a description of the methodology used by Broadridge to select the mutual funds in the expense Groups and an explanation of how funds comprising expense groups and their expense ratios may vary from year-to-year. Based on the Broadridge reports, the Board noted that the net operating expense ratios of the Fund were lower than or in range of the median net operating expense ratios of the expense Groups for all share classes.
The Board took into account the Fund performance and expense information provided to it among the factors considered in deciding to re-approve the Advisory Agreements.
Investment management and sub-advisory fee rates
The Board reviewed and considered the contractual fee rates payable by the Fund to Funds Management under the Management Agreement, as well as the contractual fee rates payable by the Fund to Funds Management for class-level administrative services under a Class-Level Administration Agreement, which include, among other things, class-level transfer agency and sub-transfer agency costs (collectively, the “Management Rates”). The Board also reviewed and considered the contractual investment sub-advisory fee rates that are payable by Funds Management to the Sub-Adviser for investment sub-advisory services.
Among other information reviewed by the Board was a comparison of the Fund’s Management Rates with the average contractual investment management fee rates of funds in the expense Groups at a common asset level as well as transfer agency costs of the funds in the expense Groups. The Board noted that the Management Rates of the Fund were lower than the sum of these average rates for the Fund’s expense Groups for all share classes.
The Board also received and considered information about the portion of the total management fee that was retained by Funds Management after payment of the fee to the Sub-Adviser for sub-advisory services. The Board considered this amount in comparison to the median amount retained by advisers to funds in a sub-advised expense universe that was determined by Broadridge to be similar to the Fund. In assessing the reasonableness of this amount, the Board received and evaluated information about the nature and extent of responsibilities retained and risks assumed by Funds Management and not delegated to or assumed by the Sub-Adviser, and about Funds Management’s on-going oversight services. The Board also considered that the sub-advisory fees paid to the Sub-Adviser had been negotiated by Funds Management on an arm’s length basis.
The Board also received and considered information about the nature and extent of services offered and fee rates charged by Funds Management and the Sub-Adviser to other types of clients with investment strategies similar to those of the Fund. In this regard, the Board received information about the significantly greater scope of services, and compliance, reporting and other legal burdens and risks of managing mutual funds compared with those associated with managing assets of non-mutual fund clients such as collective funds or institutional separate accounts.
Based on its consideration of the factors and information it deemed relevant, including those described here, the Board determined that the compensation payable to Funds Management under the Management Agreement and to the Sub-Adviser under the Sub-Advisory Agreement was reasonable.
Profitability
The Board received and considered information concerning the profitability of Funds Management, as well as the profitability of Wells Fargo as a whole, from providing services to the Fund and the fund family as a whole. Funds Management reported on the methodologies and estimates used in calculating profitability, including a description of the methodology used to allocate certain expenses. Among other things, the Board noted that the levels of profitability reported on a fund-by-fund basis varied widely, depending on factors such as the size and type of fund. The Board did not consider profitability with respect to the Sub-Adviser, as the sub-advisory fees paid to the Sub-Adviser had been negotiated by Funds Management on an arm’s-length basis.
| | | | |
| 34 | | Wells Fargo C&B Mid Cap Value Fund | | Other information (unaudited) |
Based on its review, the Board did not deem the profits reported by Funds Management to be at a level that would prevent it from approving the continuation of the Advisory Agreements.
Economies of scale
With respect to possible economies of scale, the Board noted the existence of breakpoints in the Fund’s management fee structure, which operate generally to reduce the Fund’s expense ratios as the Fund grows in size. It considered that, for a small fund or a fund that shrinks in size, breakpoints conversely can result in higher fee levels. The Board also considered that in addition to management fee breakpoints, competitive management fee rates set at the outset without regard to breakpoints and fee waiver and expense reimbursement arrangements are means of sharing potential economies of scale with shareholders of the Fund. The Board considered Funds Management’s view, which Funds Management indicated was supported by independent third-party studies which were summarized for the Board, that any analyses of potential economies of scale in managing a particular fund are inherently limited in light of the joint and common costs and investments that Funds Management incurs across the fund family as a whole.
The Board concluded that the Fund’s fee and expense arrangements, including contractual breakpoints, constituted a reasonable approach to sharing potential economies of scale with the Fund and its shareholders.
Other benefits to Funds Management and the Sub-Adviser
The Board received and considered information regarding potential “fall-out” or ancillary benefits received by Funds Management, the Sub-Adviser, and their affiliates as a result of their relationships with the Fund. Ancillary benefits could include, among others, benefits directly attributable to other relationships with the Fund and benefits potentially derived from an increase in Funds Management’s and the Sub-Adviser’s business as a result of their relationships with the Fund. The Board noted that various affiliates of Funds Management may receive distribution-related fees, shareholder servicing payments and sub-transfer agency fees in respect of shares sold or held through them and services provided.
The Board also reviewed information about soft dollar credits earned and utilized by the Sub-Adviser, fees earned by Funds Management and its affiliate from managing a private investment vehicle for the fund family’s securities lending collateral and commissions earned by an affiliated broker from portfolio transactions.
Based on its consideration of the factors and information it deemed relevant, including those described here, the Board did not find that any ancillary benefits received by Funds Management, the Sub-Adviser, and their affiliates were unreasonable.
Conclusion
At the Meeting, after considering the above-described factors and based on its deliberations and its evaluation of the information described above, the Board unanimously approved the continuation of the Advisory Agreements for a one-year term and determined that the compensation payable to Funds Management and the Sub-Adviser under each of the Advisory Agreements was reasonable.
| | | | | | |
| List of abbreviations | | Wells Fargo C&B Mid Cap Value Fund | | | 35 | |
The following is a list of common abbreviations for terms and entities that may have appeared in this report.
| ACA | — ACA Financial Guaranty Corporation |
| ADR | — American depositary receipt |
| ADS | — American depositary shares |
| AGC | — Assured Guaranty Corporation |
| AGM | — Assured Guaranty Municipal |
| Ambac | — Ambac Financial Group Incorporated |
| AMT | — Alternative minimum tax |
| BAN | — Bond anticipation notes |
| BHAC | — Berkshire Hathaway Assurance Corporation |
| CAB | — Capital appreciation bond |
| CCAB | — Convertible capital appreciation bond |
| CDA | — Community Development Authority |
| CDO | — Collateralized debt obligation |
| CLO | — Collateralized loan obligation |
| DRIVER | — Derivative inverse tax-exempt receipts |
| DW&P | — Department of Water & Power |
| DWR | — Department of Water Resources |
| ECFA | — Educational & Cultural Facilities Authority |
| EDA | — Economic Development Authority |
| EDFA | — Economic Development Finance Authority |
| ETF | — Exchange-traded fund |
| FDIC | — Federal Deposit Insurance Corporation |
| FFCB | — Federal Farm Credit Banks |
| FGIC | — Financial Guaranty Insurance Corporation |
| FHA | — Federal Housing Administration |
| FHLB | — Federal Home Loan Bank |
| FHLMC | — Federal Home Loan Mortgage Corporation |
| FICO | — The Financing Corporation |
| FNMA | — Federal National Mortgage Association |
| GDR | — Global depositary receipt |
| GNMA | — Government National Mortgage Association |
| HCFR | — Healthcare facilities revenue |
| HEFA | — Health & Educational Facilities Authority |
| HEFAR | — Higher education facilities authority revenue |
| HFA | — Housing Finance Authority |
| HFFA | — Health Facilities Financing Authority |
| HUD | — Department of Housing and Urban Development |
| IDA | — Industrial Development Authority |
| IDAG | — Industrial Development Agency |
| KRW | — Republic of Korea won |
| LIBOR | — London Interbank Offered Rate |
| LIFER | — Long Inverse Floating Exempt Receipts |
| LLC | — Limited liability company |
| LLLP | — Limited liability limited partnership |
| LLP | — Limited liability partnership |
| MBIA | — Municipal Bond Insurance Association |
| MFHR | — Multifamily housing revenue |
| MSTR | — Municipal securities trust receipts |
| MUD | — Municipal Utility District |
| National | — National Public Finance Guarantee Corporation |
| PCFA | — Pollution Control Financing Authority |
| PCL | — Public Company Limited |
| PCR | — Pollution control revenue |
| PFA | — Public Finance Authority |
| PFFA | — Public Facilities Financing Authority |
| PFOTER | — Puttable floating option tax-exempt receipts |
| PJSC | — Public Joint Stock Company |
| plc | — Public limited company |
| PUTTER | — Puttable tax-exempt receipts |
| R&D | — Research & development |
| Radian | — Radian Asset Assurance |
| RAN | — Revenue anticipation notes |
| RDA | — Redevelopment Authority |
| RDFA | — Redevelopment Finance Authority |
| REIT | — Real estate investment trust |
| ROC | — Reset option certificates |
| SAVRS | — Select auction variable rate securities |
| SBA | — Small Business Authority |
| SDR | — Swedish depositary receipt |
| SFHR | — Single-family housing revenue |
| SFMR | — Single-family mortgage revenue |
| SPA | — Standby purchase agreement |
| SPDR | — Standard & Poor’s Depositary Receipts |
| SPEAR | — Short Puttable Exempt Adjustable Receipts |
| STRIPS | — Separate trading of registered interest and |
| TAN | — Tax anticipation notes |
| TIPS | — Treasury inflation-protected securities |
| TRAN | — Tax revenue anticipation notes |
| TTFA | — Transportation Trust Fund Authority |
| TVA | — Tennessee Valley Authority |
This page is intentionally left blank.

For more information
More information about Wells Fargo Funds is available free upon request. To obtain literature, please write, email, visit the Fund’s website, or call:
Wells Fargo Funds
P.O. Box 8266
Boston, MA 02266-8266
Email: fundservice@wellsfargo.com
Website: wellsfargofunds.com
Individual investors: 1-800-222-8222
Retail investment professionals: 1-888-877-9275
Institutional investment professionals:
1-866-765-0778
This report and the financial statements contained herein are submitted for the general information of the shareholders of the Fund. If this report is used for promotional purposes, distribution of the report must be accompanied or preceded by a current prospectus. Before investing, please consider the investment objectives, risks, charges, and expenses of the investment. For a current prospectus and, if available, a summary prospectus, containing this information, call 1-800-222-8222 or visit the Fund’s website at wellsfargofunds.com. Read the prospectus carefully before you invest or send money.
Wells Fargo Asset Management (WFAM) is a trade name used by the asset management businesses of Wells Fargo & Company. Wells Fargo Funds Management, LLC, a wholly owned subsidiary of Wells Fargo & Company, provides investment advisory and administrative services for Wells Fargo Funds. Other affiliates of Wells Fargo & Company provide subadvisory and other services for the funds. The funds are distributed by Wells Fargo Funds Distributor, LLC, Member FINRA, an affiliate of Wells Fargo & Company. Neither Wells Fargo Funds Distributor nor Wells Fargo Funds Management holds fund shareholder accounts or assets. This material is for general informational and educational purposes only and is NOT intended to provide investment advice or a recommendation of any kind—including a recommendation for any specific investment, strategy, or plan.
NOT FDIC INSURED ◾ NO BANK GUARANTEE ◾ MAY LOSE VALUE
© 2017 Wells Fargo Funds Management, LLC. All rights reserved.
| | |
 | | 306434 11-17 A228/AR228 09-17 |
Annual Report
September 30, 2017

Wells Fargo Common Stock Fund


Reduce clutter. Save trees.
Sign up for electronic delivery of prospectuses and shareholder reports at wellsfargo.com/advantagedelivery
Contents
The views expressed and any forward-looking statements are as of September 30, 2017, unless otherwise noted, and are those of the Fund managers and/or Wells Fargo Funds Management, LLC. Discussions of individual securities, or the markets generally, or any Wells Fargo Fund are not intended as individual recommendations. Future events or results may vary significantly from those expressed in any forward-looking statements. The views expressed are subject to change at any time in response to changing circumstances in the market. Wells Fargo Funds Management, LLC and the Fund disclaim any obligation to publicly update or revise any views expressed or forward-looking statements.
NOT FDIC INSURED ◾ NO BANK GUARANTEE ◾ MAY LOSE VALUE
| | | | |
| 2 | | Wells Fargo Common Stock Fund | | Letter to shareholders (unaudited) |

Andrew Owen
President
Wells Fargo Funds
Favorable economic news supported stocks, and interest rates moved higher.
Hiring remained strong, and business and consumer sentiment improved.
Dear Shareholder:
We are pleased to offer you this annual report for the Wells Fargo Common Stock Fund for the 12-month period that ended September 30, 2017. Despite heightened market volatility at times, global stocks generally delivered double-digit results and bond markets had smaller but positive results as well. U.S. and international stocks returned 18.61% and 19.61%, respectively, for the 12-month period, as measured by the S&P 500 Index1 and the MSCI ACWI ex USA Index (Net),2 respectively; within fixed income, the Bloomberg Barclays U.S. Aggregate Bond Index3 returned 0.07% and the Bloomberg Barclays Municipal Bond Index4 returned 0.87% as interest rates rose from low levels.
Election results and central banks’ policies commanded investor attention as 2016 closed.
During the fourth quarter of 2016, investors appeared intent on the prospective outcomes of elections in the U.S. and central-bank actions globally. Following Donald Trump’s election victory, U.S. stocks rallied. Investors appeared optimistic that the new administration would pursue progrowth policies. Favorable economic news supported stocks, and interest rates moved higher. At their mid-December meeting, U.S. Federal Reserve (Fed) officials raised the target interest rate by a quarter percentage point to a range of 0.50% to 0.75%. The fourth quarter also saw the implementation of the U.S. Securities and Exchange Commission’s new rules for money market funds, which included floating net asset values (NAVs) as well as the possibility of liquidity fees and redemption gates for institutional prime and municipal money market funds. In the year leading up to money market fund reform implementation, nearly $1 trillion in assets moved from money market funds subject to floating NAVs into government money market funds, which continued to transact at a stable $1.00 NAV. Outside of the U.S., the prospects for faster U.S. growth appeared to trigger some acceleration in Europe.
Financial markets gained during the first two quarters of 2017 on positive economic data.
Stocks rallied globally through the first quarter of 2017, supported by signs of improvement in the U.S. and global economies. U.S. economic data released during the quarter reflected a healthy economy. Hiring remained strong, and business and consumer sentiment improved. In March, Fed officials raised their target interest rate by a quarter percentage point to a range of 0.75% to 1.00%. With the Fed’s target interest-rate increase, short-term bond yields rose during the quarter. Meanwhile, longer-term Treasury yields were little changed, leading to positive performance. Investment-grade and high-yield bonds benefited from strong demand. Municipal bond returns were positive in the quarter, helped by strong demand and constrained new-issue supply. Outside of the U.S., stocks in emerging markets generally outperformed stocks in the U.S. and international
| 1 | The S&P 500 Index consists of 500 stocks chosen for market size, liquidity, and industry group representation. It is a market-value-weighted index with each stock’s weight in the index proportionate to its market value. You cannot invest directly in an index. |
| 2 | The Morgan Stanley Capital International (MSCI) All Country World Index (ACWI) ex USA Index (Net) is a free-float-adjusted market-capitalization-weighted index that is designed to measure the equity market performance of developed markets, excluding the United States and Canada. Source: MSCI. MSCI makes no express or implied warranties or representations and shall have no liability whatsoever with respect to any MSCI data contained herein. The MSCI data may not be further redistributed or used as a basis for other indexes or any securities or financial products. This report is not approved, reviewed, or produced by MSCI. You cannot invest directly in an index. |
| 3 | The Bloomberg Barclays U.S. Aggregate Bond Index is a broad-based benchmark that measures the investment-grade, U.S. dollar-denominated, fixed-rate taxable bond market, including Treasuries, government-related and corporate securities, mortgage-backed securities (agency fixed-rate and hybrid adjustable-rate mortgage pass-throughs), asset-backed securities, and commercial mortgage-backed securities. You cannot invest directly in an index. |
| 4 | The Bloomberg Barclays Municipal Bond Index is an unmanaged index composed of long-term tax-exempt bonds with a minimum credit rating of Baa. You cannot invest directly in an index. |
| | | | | | |
| Letter to shareholders (unaudited) | | Wells Fargo Common Stock Fund | | | 3 | |
developed markets because they benefited from both global economic growth and recent weakening in the U.S. dollar. Stocks in Asia, Europe, and Latin America also outperformed the U.S. market during the quarter.
Globally, stocks marked continued gains through the second quarter of 2017. Steady, albeit modest, economic growth both in the U.S. and abroad and generally favorable corporate earnings announcements supported higher valuations. U.S. inflation trended lower despite a continued decline in the unemployment rate. Ten-year U.S. Treasury yields declined, resulting in stronger prices for long-term bonds. As was widely expected, the Fed raised the target interest rate in June by a quarter percentage point to a range of 1.00% to 1.25%. In addition, the Fed indicated that it would begin to sell bonds accumulated on its balance sheet during quantitative easing programs conducted since 2008. Later in the third quarter, the Fed confirmed that the initiative to reduce the bonds that it holds likely would begin in October.
Volatility increased during the third quarter of 2017.
Early in July and again in August, volatility expectations increased and then receded—as measured by the CBOE VIX5—amid geopolitical tensions, particularly in Asia, and declining investor optimism following unsuccessful efforts to reform health care laws in the U.S. which suggested to some that President Trump and Congress would be unable to move forward with tax and regulatory reforms.
During the quarter, economic momentum increased in Europe; the European Central Bank held its rates steady at low levels and continued its quantitative easing bond-buying program, which is intended to spark economic activity. The Bank of England suggested it could hike interest rates in November, and the pound gained against other currencies. The Bank of Japan also maintained accommodative policies intended to support business activity and economic growth. In Germany, Angela Merkel was reelected chancellor; in Japan, Prime Minister Shinzo Abe called for snap elections as his popularity increased after North Korea’s aggressive program of missile launches. Both political developments were indicative of the type of political consistency in developed markets that reassure financial markets.
In emerging markets, many countries benefited from stronger currencies versus the U.S. dollar. In addition, commodity prices were on an upward trajectory, which benefited many companies that rely on natural resources for exports.
As the quarter closed, optimism returned as economic growth continued. The second-quarter gross domestic product measure was revised higher from 2.6% annualized to 3.0%. Consumer spending and residential and nonresidential investment increased. While inflation continued to trail the Fed’s targets, expectations remained for an additional short-term interest-rate hike before year-end.
| 5 | The Chicago Board Options Exchange Market Volatility Index (CBOE VIX) is a popular measure of the implied volatility of S&P 500 Index options. It represents one measure of the market’s expectation of stock market volatility over the next 30-day period. You cannot invest directly in an index. |
| | | | |
| 4 | | Wells Fargo Common Stock Fund | | Letter to shareholders (unaudited) |
Don’t let short-term uncertainty derail long-term investment goals.
Periods of investment uncertainty can present challenges, but experience has taught us that maintaining long-term investment goals can be an effective way to plan for the future. To help you create a sound strategy based on your personal goals and risk tolerance, Wells Fargo Funds offers more than 100 mutual funds spanning a wide range of asset classes and investment styles. Although diversification cannot guarantee an investment profit or prevent losses, we believe it can be an effective way to manage investment risk and potentially smooth out overall portfolio performance. We encourage investors to know their investments and to understand that appropriate levels of risk-taking may unlock opportunities.
Thank you for choosing to invest with Wells Fargo Funds. We appreciate your confidence in us and remain committed to helping you meet your financial needs.
Sincerely,

Andrew Owen
President
Wells Fargo Funds
For further information about your Fund, contact your investment professional, visit our website at wellsfargofunds.com, or call us directly at 1-800-222-8222. We are available 24 hours a day, 7 days a week.
This page is intentionally left blank.
| | | | |
| 6 | | Wells Fargo Common Stock Fund | | Performance highlights (unaudited) |
Investment objective
The Fund seeks long-term total capital appreciation.
Manager
Wells Fargo Funds Management, LLC
Subadviser
Wells Capital Management Incorporated
Portfolio managers
Ann M. Miletti
Christopher G. Miller, CFA®‡
Average annual total returns (%) as of September 30, 20171
| | | | | | | | | | | | | | | | | | | | | | | | | | | | | | | | | | |
| | | | | Including sales charge | | | Excluding sales charge | | | Expense ratios2 (%) | |
| | | Inception date | | 1 year | | | 5 year | | | 10 year | | | 1 year | | | 5 year | | | 10 year | | | Gross | | | Net3 | |
| Class A (SCSAX) | | 11-30-2000 | | | 9.43 | | | | 10.52 | | | | 7.41 | | | | 16.10 | | | | 11.83 | | | | 8.05 | | | | 1.26 | | | | 1.26 | |
| Class C (STSAX) | | 11-30-2000 | | | 14.29 | | | | 10.99 | | | | 7.23 | | | | 15.29 | | | | 10.99 | | | | 7.23 | | | | 2.01 | | | | 2.01 | |
| Class R6 (SCSRX) | | 6-28-2013 | | | – | | | | – | | | | – | | | | 16.56 | | | | 12.31 | | | | 8.37 | | | | 0.83 | | | | 0.83 | |
| Administrator Class (SCSDX) | | 7-30-2010 | | | – | | | | – | | | | – | | | | 16.26 | | | | 12.00 | | | | 8.17 | | | | 1.18 | | | | 1.11 | |
| Institutional Class (SCNSX) | | 7-30-2010 | | | – | | | | – | | | | – | | | | 16.55 | | | | 12.27 | | | | 8.35 | | | | 0.93 | | | | 0.86 | |
| Russell 2500TM Index4 | | – | | | – | | | | – | | | | – | | | | 17.79 | | | | 13.86 | | | | 8.19 | | | | – | | | | – | |
Figures quoted represent past performance, which is no guarantee of future results, and do not reflect taxes that a shareholder may pay on fund distributions or the redemption of fund shares. Investment return and principal value of an investment will fluctuate so that an investor’s shares, when redeemed, may be worth more or less than their original cost. Performance shown without sales charges would be lower if sales charges were reflected. Current performance may be lower or higher than the performance data quoted, which assumes the reinvestment of dividends and capital gains. Current month-end performance is available on the Fund’s website, wellsfargofunds.com.
Index returns do not include transaction costs associated with buying and selling securities, any mutual fund fees or expenses, or any taxes. It is not possible to invest directly in an index.
For Class A shares, the maximum front-end sales charge is 5.75%. For Class C shares, the maximum contingent deferred sales charge is 1.00%. Performance including a contingent deferred sales charge assumes the sales charge for the corresponding time period. Class R6, Administrator Class, and Institutional Class shares are sold without a front-end sales charge or contingent deferred sales charge.
Stock values fluctuate in response to the activities of individual companies and general market and economic conditions. Smaller-company stocks tend to be more volatile and less liquid than those of larger companies. Certain investment strategies tend to increase the total risk of an investment (relative to the broader market). The Fund is exposed to foreign investment risk. Consult the Fund’s prospectus for additional information on these and other risks.
Please see footnotes on page 7.
| | | | | | |
| Performance highlights (unaudited) | | Wells Fargo Common Stock Fund | | | 7 | |
|
| Growth of $10,000 investment as of September 30, 20175 |
|
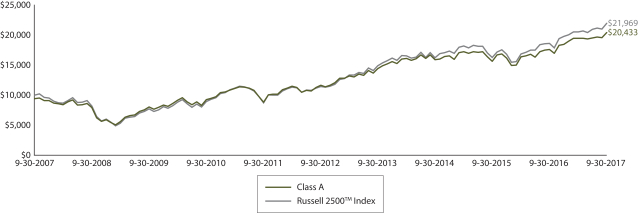 |
| ‡ | Mr. Miller became the portfolio manager of the Fund on March 1, 2017. |
| 1 | Historical performance shown for Class R6 shares prior to their inception reflects the performance of Institutional Class shares, and includes the higher expenses applicable to Institutional Class shares. If these expenses had not been included, the returns for Class R6 shares would be higher. Historical performance shown for Administrator Class and Institutional Class shares prior to their inception reflects the performance of Class A shares, and includes the higher expenses applicable to Class A shares. If these expenses had not been included, the returns would be higher. |
| 2 | Reflects the expense ratios as stated in the most recent prospectuses, which include the impact of 0.01% in acquired fund fees and expenses. The expense ratios shown are subject to change and may differ from the annualized expense ratios shown in the financial highlights of this report, which do not include acquired fund fees and expenses. |
| 3 | The manager has contractually committed through January 31, 2018, to waive fees and/or reimburse expenses to the extent necessary to cap the Fund’s Total Annual Fund Operating Expenses After Fee Waivers at 1.26% for Class A, 2.01% for Class C, 0.85% for Class R6, 1.10% for Administrator Class, and 0.85% for Institutional Class. After this time, the cap may be increased or the commitment to maintain the cap may be terminated only with the approval of the Board of Trustees. Brokerage commissions, stamp duty fees, interest, taxes, acquired fund fees and expenses, and extraordinary expenses are excluded from the expense cap. Without this cap, the Fund’s returns would have been lower. The expense ratio paid by an investor is the net expense ratio or the Fund’s Total Annual Fund Operating Expenses After Fee Waivers, as stated in the prospectuses. |
| 4 | The Russell 2500TM Index measures the performance of the 2,500 smallest companies in the Russell 3000® Index, which represents approximately 16% of the total market capitalization of the Russell 3000® Index. You cannot invest directly in an index. |
| 5 | The chart compares the performance of Class A shares for the most recent ten years with the Russell 2500TM Index. The chart assumes a hypothetical investment of $10,000 in Class A shares and reflects all operating expenses and assumes the maximum initial sales charge of 5.75%. |
| 6 | The ten largest holdings, excluding cash and cash equivalents, are calculated based on the value of the investments divided by total net assets of the Fund. Holdings are subject to change and may have changed since the date specified. |
| 7 | Amounts are calculated based on the total long-term investments of the Fund. These amounts are subject to change and may have changed since the date specified. |
| | | | |
| 8 | | Wells Fargo Common Stock Fund | | Performance highlights (unaudited) |
MANAGER’S DISCUSSION
Fund highlights
| ∎ | | The Fund underperformed its benchmark, the Russell 2500TM Index, for the 12-month period that ended September 30, 2017. |
| ∎ | | Weak results due to stock selection in the energy, industrials, information technology, and materials sectors detracted from performance. |
| ∎ | | Favorable positioning and stock selection within the financials, real estate, and consumer staples sectors benefited performance. |
The U.S. stock market rallied and many U.S. stock market indexes hit new all-time highs during the reporting period. The Fund’s benchmark, the Russell 2500TM Index, was no exception and has risen for eight straight quarters. Market volatility has remained near historical lows, and larger-cap and growth stocks generally have outperformed smaller-cap and value stocks.
A number of factors influenced the U.S. stock market during the period. From our perspective, the outcome of the November 2016 U.S. elections has had the biggest impact in the U.S., with one political party ending up in control of the White House, the House of Representatives, and the Senate. The U.S. stock market has been on a tear since then as investors have expected businesses to benefit from the new administration’s progrowth policies of less regulation, lower taxes, and increased infrastructure and defense spending. The U.S. Federal Reserve (Fed) raised its benchmark interest rate by 0.25% three times during the reporting period, most recently to a range of 1.00% to 1.25% at its June 2017 meeting. The Fed also released a fairly detailed outline of its plans to reduce the size of its $4.6 trillion balance sheet.
Throughout all of the market and economic events that occurred during the reporting period and with the expectation of tighter U.S. monetary policy going forward, we continued to seek companies with what we view to be good business models, strong management teams, and healthy cash flows trading at attractive discounts to their private market valuations (PMVs). The PMV represents the expected price an investor likely would pay for the entire company as a stand-alone private entity.
| | | | |
| Ten largest holdings (%) as of September 30, 20176 | |
E*TRADE Financial Corporation | | | 2.36 | |
Raymond James Financial Incorporated | | | 2.11 | |
Haemonetics Corporation | | | 2.05 | |
CNO Financial Group Incorporated | | | 1.90 | |
Dana Incorporated | | | 1.86 | |
Laboratory Corporation of America Holdings | | | 1.80 | |
Willis Towers Watson plc | | | 1.79 | |
LivaNova plc | | | 1.72 | |
Sensata Technologies Holding NV | | | 1.70 | |
Sterling BanCorp | | | 1.62 | |
A modest overweight to energy and stock selection within the energy and industrials sectors hindered Fund performance.
The largest individual detractor from performance was Babcock & Wilcox Company, which provides energy and environmental technologies and services for power and industrial markets worldwide. The company experienced multiple project-engineering problems that proved costly to remediate, and as further problems began to surface, we exited the Fund’s position in the stock. Spirit Airlines, Incorporated, suffered due to the competitive dynamics of aggressive pricing by another airline—United Continental Holdings, Incorporated—which hurt margins and growth expectations. The energy sector delivered the weakest results in the Russell 2500TM Index for the
reporting period with a decline of 15.3%. While the price of oil stabilized during the period, the expectation for a meaningful increase was tempered by the lack of decline in global oil inventories and the ability of the domestic shale production to respond to price signals on short order. As a result, valuations for energy-related stocks have declined considerably more than the spot price of oil. The Fund’s holdings in the exploration and production industry underperformed during the period, including Cimarex Energy Company and RSP Permian, Incorporated.
Please see footnotes on page 7.
| | | | | | |
| Performance highlights (unaudited) | | Wells Fargo Common Stock Fund | | | 9 | |
|
| Portfolio allocation as of September 30, 20177 |
|
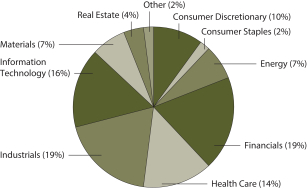 |
Favorable positioning and stock selection drove relative outperformance within the Fund’s financials and real estate sectors.
The Fund benefited from an overweight to and stock selection within the financials sector. As a group, the Fund’s financials holdings outperformed the financials sector within the benchmark index, largely due to our positive stock selection in the insurance industry and our overweight to capital markets. Insurance holdings such as CNO Financial Group, Incorporated; The Progressive Corporation; and Reinsurance Group of America, Incorporated, benefited from expectations of higher long-term interest rates and reduced regulation. Capital markets holdings E*TRADE Financial Corporation and
Raymond James Financial, Incorporated, benefited from activity influenced by a rising stock market and interest-rate expectations. Within the real estate sector, an underweight contributed to returns. Additionally, SBA Communications Corporation, an operator of wireless communication towers in North America and Central America, outperformed industry peers by a wide margin. The company’s towers have performed well, with an increase in overall business activity and a decline in churn rate (the percentage of subscribers discontinuing their subscriptions). SBA Communications also may benefit from a ramp-up in deployment of new communication technologies and protocols. The Fund also benefited from an underweight to the consumer staples sector, which delivered a negative return for the period.
Our focus remains constant: to add value for shareholders through investment in attractively priced Fund holdings.
Our methodology includes buying stocks at a discount to their estimated PMV and selling stocks as they approach or exceed the upper end of their PMV range.
Our disciplined, bottom-up investment process leads us to be overweight or underweight certain sectors. This positioning changes over time based on macroeconomic and industry-specific factors. During the reporting period, our process led us to be overweight the IT and industrials sectors and underweight the real estate and utilities sectors. Through our disciplined investment process, we remain keenly aware of both price and enterprise values on a company-by-company basis. Our proprietary database of company acquisitions across industries, sectors, and time frames enables us to maintain a steady foundation for assessing the PMVs of companies compared with their public stock prices. We strive to take advantage of those price discrepancies for the benefit of Fund shareholders by purchasing stocks when we believe they are selling at a discount to their PMVs.
Looking ahead, interest rates, energy prices, and the policies of the U.S. government likely may be themes that influence the overall market and the relative performance of the Fund. The U.S. administration has been promoting lower taxes, increased infrastructure spending, and reduced regulations—generally, a probusiness environment. However, changes in trade agreements and the eventual winners and losers from tax and regulatory reforms remain key items to watch. The Fed has signaled more rate hikes in late 2017 and 2018 if labor markets tighten further, global economic risks remain well balanced, and inflation measures hit the Fed’s target. Volatility in commodities prices and global currencies likely may continue to drive global stock markets.
Please see footnotes on page 7.
| | | | |
| 10 | | Wells Fargo Common Stock Fund | | Fund expenses (unaudited) |
As a shareholder of the Fund, you incur two types of costs: (1) transaction costs, including sales charges (loads) on purchase payments and contingent deferred sales charges (if any) on redemptions and (2) ongoing costs, including management fees, distribution (12b-1) and/or shareholder servicing fees, and other Fund expenses. This example is intended to help you understand your ongoing costs (in dollars) of investing in the Fund and to compare these costs with the ongoing costs of investing in other mutual funds.
The example is based on an investment of $1,000 invested at the beginning of the six-month period and held for the entire period from April 1, 2017 to September 30, 2017.
Actual expenses
The “Actual” line of the table below provides information about actual account values and actual expenses. You may use the information in this line, together with the amount you invested, to estimate the expenses that you paid over the period. Simply divide your account value by $1,000 (for example, an $8,600 account value divided by $1,000 = 8.6), then multiply the result by the number in the “Actual” line under the heading entitled “Expenses paid during period” for your applicable class of shares to estimate the expenses you paid on your account during this period.
Hypothetical example for comparison purposes
The “Hypothetical” line of the table below provides information about hypothetical account values and hypothetical expenses based on the Fund’s actual expense ratio and an assumed rate of return of 5% per year before expenses, which is not the Fund’s actual return. The hypothetical account values and expenses may not be used to estimate the actual ending account balance or expenses you paid for the period. You may use this information to compare the ongoing costs of investing in the Fund and other funds. To do so, compare this 5% hypothetical example with the 5% hypothetical examples that appear in the shareholder reports of the other funds.
Please note that the expenses shown in the table are meant to highlight your ongoing costs only and do not reflect any transactional costs, such as sales charges (loads) and contingent deferred sales charges. Therefore, the “Hypothetical” line of the table is useful in comparing ongoing costs only and will not help you determine the relative total costs of owning different funds. In addition, if these transactional costs were included, your costs would have been higher.
| | | | | | | | | | | | | | | | |
| | | Beginning
account value
4-1-2017 | | | Ending
account value
9-30-2017 | | | Expenses
paid during
the period¹ | | | Annualized net
expense ratio | |
Class A | | | | | | | | | | | | | | | | |
Actual | | $ | 1,000.00 | | | $ | 1,047.45 | | | $ | 6.42 | | | | 1.25 | % |
Hypothetical (5% return before expenses) | | $ | 1,000.00 | | | $ | 1,018.80 | | | $ | 6.33 | | | | 1.25 | % |
Class C | | | | | | | | | | | | | | | | |
Actual | | $ | 1,000.00 | | | $ | 1,043.41 | | | $ | 10.24 | | | | 2.00 | % |
Hypothetical (5% return before expenses) | | $ | 1,000.00 | | | $ | 1,015.04 | | | $ | 10.10 | | | | 2.00 | % |
Class R6 | | | | | | | | | | | | | | | | |
Actual | | $ | 1,000.00 | | | $ | 1,049.48 | | | $ | 4.22 | | | | 0.82 | % |
Hypothetical (5% return before expenses) | | $ | 1,000.00 | | | $ | 1,020.96 | | | $ | 4.16 | | | | 0.82 | % |
Administrator Class | | | | | | | | | | | | | | | | |
Actual | | $ | 1,000.00 | | | $ | 1,048.07 | | | $ | 5.65 | | | | 1.10 | % |
Hypothetical (5% return before expenses) | | $ | 1,000.00 | | | $ | 1,019.55 | | | $ | 5.57 | | | | 1.10 | % |
Institutional Class | | | | | | | | | | | | | | | | |
Actual | | $ | 1,000.00 | | | $ | 1,049.16 | | | $ | 4.37 | | | | 0.85 | % |
Hypothetical (5% return before expenses) | | $ | 1,000.00 | | | $ | 1,020.81 | | | $ | 4.31 | | | | 0.85 | % |
| 1 | Expenses paid is equal to the annualized net expense ratio of each class multiplied by the average account value over the period, multiplied by the number of days in the most recent fiscal half-year divided by the number of days in the fiscal year (to reflect the one-half-year period). |
| | | | | | |
| Portfolio of investments—September 30, 2017 | | Wells Fargo Common Stock Fund | | | 11 | |
| | | | | | | | | | | | | | | | |
| Security name | | | | | | | | Shares | | | Value | |
| | | |
Common Stocks: 96.89% | | | | | | | | | | | | | |
| | | | |
Consumer Discretionary: 9.66% | | | | | | | | | | | | | | | | |
| | | | |
| Auto Components: 1.86% | | | | | | | | | | | | | | | | |
Dana Incorporated | | | | | | | | | | | 832,993 | | | $ | 23,290,484 | |
| | | | | | | | | | | | | | | | |
| | | | |
| Diversified Consumer Services: 1.02% | | | | | | | | | | | | | | | | |
Houghton Mifflin Harcourt Company † | | | | | | | | | | | 1,061,424 | | | | 12,790,159 | |
| | | | | | | | | | | | | | | | |
| | | | |
| Hotels, Restaurants & Leisure: 2.14% | | | | | | | | | | | | | | | | |
Buffalo Wild Wings Incorporated † | | | | | | | | | | | 120,180 | | | | 12,703,026 | |
Jack in the Box Incorporated | | | | | | | | | | | 138,028 | | | | 14,067,814 | |
| | | | |
| | | | | | | | | | | | | | | 26,770,840 | |
| | | | | | | | | | | | | | | | |
| | | | |
| Household Durables: 1.44% | | | | | | | | | | | | | | | | |
Mohawk Industries Incorporated † | | | | | | | | | | | 72,535 | | | | 17,953,138 | |
| | | | | | | | | | | | | | | | |
| | | | |
| Media: 1.03% | | | | | | | | | | | | | | | | |
Interpublic Group of Companies Incorporated | | | | | | | | | | | 618,922 | | | | 12,867,388 | |
| | | | | | | | | | | | | | | | |
| | | | |
| Specialty Retail: 2.17% | | | | | | | | | | | | | | | | |
Tractor Supply Company | | | | | | | | | | | 267,385 | | | | 16,922,797 | |
Urban Outfitters Incorporated †« | | | | | | | | | | | 429,126 | | | | 10,256,111 | |
| | | | |
| | | | | | | | | | | | | | | 27,178,908 | |
| | | | | | | | | | | | | | | | |
| | | | |
Consumer Staples: 2.05% | | | | | | | | | | | | | | | | |
| | | | |
| Household Products: 0.98% | | | | | | | | | | | | | | | | |
Church & Dwight Company Incorporated | | | | | | | | | | | 253,116 | | | | 12,263,470 | |
| | | | | | | | | | | | | | | | |
| | | | |
| Personal Products: 1.07% | | | | | | | | | | | | | | | | |
Edgewell Personal Care Company † | | | | | | | | | | | 183,516 | | | | 13,354,459 | |
| | | | | | | | | | | | | | | | |
| | | | |
Energy: 6.34% | | | | | | | | | | | | | | | | |
| | | | |
| Oil, Gas & Consumable Fuels: 6.34% | | | | | | | | | | | | | | | | |
Cimarex Energy Company | | | | | | | | | | | 155,013 | | | | 17,620,328 | |
Parsley Energy Incorporated Class A † | | | | | | | | | | | 367,031 | | | | 9,667,597 | |
RSP Permian Incorporated † | | | | | | | | | | | 561,724 | | | | 19,430,033 | |
Targa Resources Corporation | | | | | | | | | | | 339,309 | | | | 16,049,316 | |
WPX Energy Incorporated † | | | | | | | | | | | 1,435,294 | | | | 16,505,881 | |
| | | | |
| | | | | | | | | | | | | | | 79,273,155 | |
| | | | | | | | | | | | | | | | |
| | | | |
Financials: 19.02% | | | | | | | | | | | | | | | | |
| | | | |
| Banks: 6.17% | | | | | | | | | | | | | | | | |
Bank of the Ozarks Incorporated | | | | | | | | | | | 114,922 | | | | 5,522,002 | |
First Horizon National Corporation | | | | | | | | | | | 667,971 | | | | 12,791,645 | |
MB Financial Incorporated | | | | | | | | | | | 425,893 | | | | 19,173,703 | |
PacWest Bancorp | | | | | | | | | | | 385,847 | | | | 19,489,132 | |
Sterling BanCorp | | | | | | | | | | | 823,079 | | | | 20,288,897 | |
| | | | |
| | | | | | | | | | | | | | | 77,265,379 | |
| | | | | | | | | | | | | | | | |
The accompanying notes are an integral part of these financial statements.
| | | | |
| 12 | | Wells Fargo Common Stock Fund | | Portfolio of investments—September 30, 2017 |
| | | | | | | | | | | | | | | | |
| Security name | | | | | | | | Shares | | | Value | |
| | | | |
| Capital Markets: 4.47% | | | | | | | | | | | | | | | | |
E*TRADE Financial Corporation † | | | | | | | | | | | 675,641 | | | $ | 29,464,704 | |
Raymond James Financial Incorporated | | | | | | | | | | | 313,152 | | | | 26,408,108 | |
| | | | |
| | | | | | | | | | | | | | | 55,872,812 | |
| | | | | | | | | | | | | | | | |
| | | | |
| Insurance: 8.38% | | | | | | | | | | | | | | | | |
Arch Capital Group Limited † | | | | | | | | | | | 149,332 | | | | 14,709,202 | |
CNO Financial Group Incorporated | | | | | | | | | | | 1,019,001 | | | | 23,783,483 | |
Reinsurance Group of America Incorporated | | | | | | | | | | | 113,159 | | | | 15,789,075 | |
RenaissanceRe Holdings Limited | | | | | | | | | | | 107,393 | | | | 14,513,090 | |
The Progressive Corporation | | | | | | | | | | | 281,928 | | | | 13,650,954 | |
Willis Towers Watson plc | | | | | | | | | | | 144,976 | | | | 22,359,648 | |
| | | | |
| | | | | | | | | | | | | | | 104,805,452 | |
| | | | | | | | | | | | | | | | |
| | | | |
Health Care: 14.05% | | | | | | | | | | | | | | | | |
| | | | |
| Biotechnology: 1.80% | | | | | | | | | | | | | | | | |
Alkermes plc † | | | | | | | | | | | 167,324 | | | | 8,506,752 | |
BioMarin Pharmaceutical Incorporated † | | | | | | | | | | | 82,762 | | | | 7,702,659 | |
Neurocrine Biosciences Incorporated †« | | | | | | | | | | | 102,837 | | | | 6,301,851 | |
| | | | |
| | | | | | | | | | | | | | | 22,511,262 | |
| | | | | | | | | | | | | | | | |
| | | | |
| Health Care Equipment & Supplies: 4.93% | | | | | | | | | | | | | | | | |
Haemonetics Corporation † | | | | | | | | | | | 571,198 | | | | 25,629,654 | |
Hologic Incorporated † | | | | | | | | | | | 396,687 | | | | 14,554,446 | |
LivaNova plc † | | | | | | | | | | | 307,187 | | | | 21,521,521 | |
| | | | |
| | | | | | | | | | | | | | | 61,705,621 | |
| | | | | | | | | | | | | | | | |
| | | | |
| Health Care Providers & Services: 4.81% | | | | | | | | | | | | | | | | |
HealthEquity Incorporated † | | | | | | | | | | | 194,305 | | | | 9,827,947 | |
Humana Incorporated | | | | | | | | | | | 56,890 | | | | 13,860,111 | |
Laboratory Corporation of America Holdings † | | | | | | | | | | | 149,048 | | | | 22,501,777 | |
Universal Health Services Incorporated Class B | | | | | | | | | | | 126,461 | | | | 14,029,583 | |
| | | | |
| | | | | | | | | | | | | | | 60,219,418 | |
| | | | | | | | | | | | | | | | |
| | | | |
| Life Sciences Tools & Services: 2.51% | | | | | | | | | | | | | | | | |
Agilent Technologies Incorporated | | | | | | | | | | | 269,349 | | | | 17,292,206 | |
PerkinElmer Incorporated | | | | | | | | | | | 203,591 | | | | 14,041,671 | |
| | | | |
| | | | | | | | | | | | | | | 31,333,877 | |
| | | | | | | | | | | | | | | | |
| | | | |
Industrials: 18.93% | | | | | | | | | | | | | | | | |
| | | | |
| Aerospace & Defense: 0.65% | | | | | | | | | | | | | | | | |
Hexcel Corporation | | | | | | | | | | | 141,472 | | | | 8,123,322 | |
| | | | | | | | | | | | | | | | |
| | | | |
| Airlines: 0.88% | | | | | | | | | | | | | | | | |
Spirit Airlines Incorporated † | | | | | | | | | | | 330,103 | | | | 11,028,741 | |
| | | | | | | | | | | | | | | | |
The accompanying notes are an integral part of these financial statements.
| | | | | | |
| Portfolio of investments—September 30, 2017 | | Wells Fargo Common Stock Fund | | | 13 | |
| | | | | | | | | | | | | | | | |
| Security name | | | | | | | | Shares | | | Value | |
| | | | |
| Commercial Services & Supplies: 3.47% | | | | | | | | | | | | | | | | |
Republic Services Incorporated | | | | | | | | | | | 226,602 | | | $ | 14,969,328 | |
Steelcase Incorporated Class A | | | | | | | | | | | 990,309 | | | | 15,250,759 | |
Stericycle Incorporated † | | | | | | | | | | | 184,603 | | | | 13,221,267 | |
| | | | |
| | | | | | | | | | | | | | | 43,441,354 | |
| | | | | | | | | | | | | | | | |
| | | | |
| Electrical Equipment: 4.32% | | | | | | | | | | | | | | | | |
AMETEK Incorporated | | | | | | | | | | | 234,117 | | | | 15,461,087 | |
Hubbell Incorporated | | | | | | | | | | | 149,332 | | | | 17,325,499 | |
Sensata Technologies Holding NV † | | | | | | | | | | | 442,126 | | | | 21,252,997 | |
| | | | |
| | | | | | | | | | | | | | | 54,039,583 | |
| | | | | | | | | | | | | | | | |
| | | | |
| Industrial Conglomerates: 1.06% | | | | | | | | | | | | | | | | |
Carlisle Companies Incorporated | | | | | | | | | | | 132,124 | | | | 13,250,716 | |
| | | | | | | | | | | | | | | | |
| | | | |
| Machinery: 2.82% | | | | | | | | | | | | | | | | |
Colfax Corporation † | | | | | | | | | | | 400,650 | | | | 16,683,066 | |
Wabtec Corporation « | | | | | | | | | | | 245,730 | | | | 18,614,047 | |
| | | | |
| | | | | | | | | | | | | | | 35,297,113 | |
| | | | | | | | | | | | | | | | |
| | | | |
| Road & Rail: 3.38% | | | | | | | | | | | | | | | | |
Genesee & Wyoming Incorporated Class A † | | | | | | | | | | | 163,021 | | | | 12,065,184 | |
Hertz Global Holdings Incorporated †« | | | | | | | | | | | 691,283 | | | | 15,457,088 | |
Ryder System Incorporated | | | | | | | | | | | 175,278 | | | | 14,819,755 | |
| | | | |
| | | | | | | | | | | | | | | 42,342,027 | |
| | | | | | | | | | | | | | | | |
| | | | |
| Trading Companies & Distributors: 2.35% | | | | | | | | | | | | | | | | |
GATX Corporation « | | | | | | | | | | | 186,736 | | | | 11,495,468 | |
MRC Global Incorporated † | | | | | | | | | | | 1,021,169 | | | | 17,860,246 | |
| | | | |
| | | | | | | | | | | | | | | 29,355,714 | |
| | | | | | | | | | | | | | | | |
| | | | |
Information Technology: 15.76% | | | | | | | | | | | | | | | | |
| | | | |
| Internet Software & Services: 1.41% | | | | | | | | | | | | | | | | |
Cornerstone OnDemand Incorporated † | | | | | | | | | | | 433,044 | | | | 17,585,917 | |
| | | | | | | | | | | | | | �� | | |
| | | | |
| IT Services: 4.16% | | | | | | | | | | | | | | | | |
Amdocs Limited | | | | | | | | | | | 205,959 | | | | 13,247,283 | |
CoreLogic Incorporated † | | | | | | | | | | | 252,662 | | | | 11,678,038 | |
Gartner Incorporated † | | | | | | | | | | | 97,250 | | | | 12,098,873 | |
Global Payments Incorporated | | | | | | | | | | | 158,621 | | | | 15,073,754 | |
| | | | |
| | | | | | | | | | | | | | | 52,097,948 | |
| | | | | | | | | | | | | | | | |
| | | | |
| Semiconductors & Semiconductor Equipment: 4.24% | | | | | | | | | | | | | | | | |
Integrated Device Technology Incorporated † | | | | | | | | | | | 509,737 | | | | 13,548,809 | |
Maxim Integrated Products Incorporated | | | | | | | | | | | 189,671 | | | | 9,049,203 | |
ON Semiconductor Corporation † | | | | | | | | | | | 1,056,374 | | | | 19,511,228 | |
Skyworks Solutions Incorporated | | | | | | | | | | | 107,314 | | | | 10,935,297 | |
| | | | |
| | | | | | | | | | | | | | | 53,044,537 | |
| | | | | | | | | | | | | | | | |
The accompanying notes are an integral part of these financial statements.
| | | | |
| 14 | | Wells Fargo Common Stock Fund | | Portfolio of investments—September 30, 2017 |
| | | | | | | | | | | | | | | | |
| Security name | | | | | | | | Shares | | | Value | |
| | | | |
| Software: 4.79% | | | | | | | | | | | | | | | | |
Fortinet Incorporated † | | | | | | | | | | | 363,814 | | | $ | 13,039,094 | |
Nuance Communications Incorporated † | | | | | | | | | | | 687,383 | | | | 10,805,661 | |
Red Hat Incorporated † | | | | | | | | | | | 164,358 | | | | 18,220,728 | |
Zendesk Incorporated † | | | | | | | | | | | 612,006 | | | | 17,815,495 | |
| | | | |
| | | | | | | | | | | | | | | 59,880,978 | |
| | | | | | | | | | | | | | | | |
| | | | |
| Technology Hardware, Storage & Peripherals: 1.16% | | | | | | | | | | | | | | | | |
Diebold Incorporated « | | | | | | | | | | | 635,017 | | | | 14,510,138 | |
| | | | | | | | | | | | | | | | |
| | | | |
Materials: 6.88% | | | | | | | | | | | | | | | | |
| | | |
| Chemicals: 3.34% | | | | | | | | | | | | | |
Axalta Coating Systems Limited † | | | | | | | | | | | 506,520 | | | | 14,648,558 | |
International Flavors & Fragrances Incorporated | | | | | | | | | | | 88,444 | | | | 12,639,532 | |
Valvoline Incorporated | | | | | | | | | | | 617,192 | | | | 14,473,152 | |
| | | | |
| | | | | | | | | | | | | | | 41,761,242 | |
| | | | | | | | | | | | | | | | |
| | | | |
| Containers & Packaging: 1.10% | | | | | | | | | | | | | | | | |
Crown Holdings Incorporated † | | | | | | | | | | | 231,242 | | | | 13,809,772 | |
| | | | | | | | | | | | | | | | |
| | | | |
| Metals & Mining: 2.44% | | | | | | | | | | | | | | | | |
Royal Gold Incorporated | | | | | | | | | | | 176,414 | | | | 15,178,661 | |
Steel Dynamics Incorporated | | | | | | | | | | | 445,773 | | | | 15,365,795 | |
| | | | |
| | | | | | | | | | | | | | | 30,544,456 | |
| | | | | | | | | | | | | | | | |
| | | | |
Real Estate: 4.20% | | | | | | | | | | | | | | | | |
| | | | |
| Equity REITs: 4.20% | | | | | | | | | | | | | | | | |
Camden Property Trust | | | | | | | | | | | 125,100 | | | | 11,440,395 | |
Hudson Pacific Properties Incorporated | | | | | | | | | | | 330,447 | | | | 11,079,888 | |
Physicians Realty Trust | | | | | | | | | | | 670,433 | | | | 11,886,777 | |
SBA Communications Corporation † | | | | | | | | | | | 126,352 | | | | 18,201,006 | |
| | | | |
| | | | | | | | | | | | | | | 52,608,066 | |
| | | | | | | | | | | | | | | | |
| | | | |
Total Common Stocks (Cost $826,980,927) | | | | | | | | | | | | | | | 1,212,177,446 | |
| | | | | | | | | | | | | | | | |
| | | | |
Exchange-Traded Funds: 2.12% | | | | | | | | | | | | | | | | |
SPDR Dow Jones REIT ETF | | | | | | | | | | | 99,133 | | | | 9,170,794 | |
SPDR S&P Biotech ETF « | | | | | | | | | | | 200,277 | | | | 17,337,980 | |
| | | | |
Total Exchange-Traded Funds (Cost $17,941,757) | | | | | | | | | | | | | | | 26,508,774 | |
| | | | | | | | | | | | | | | | |
| | | | |
| | | Yield | | | | | | | | | | |
| Short-Term Investments: 6.92% | | | | | | | | | | | | | | | | |
| | | | |
| Investment Companies: 6.92% | | | | | | | | | | | | | | | | |
Securities Lending Cash Investment LLC (l)(u)(r) | | | 1.25 | % | | | | | | | 73,560,412 | | | | 73,567,768 | |
Wells Fargo Government Money Market Fund Select Class (l)(u) | | | 0.92 | | | | | | | | 13,029,319 | | | | 13,029,319 | |
| | | | |
Total Short-Term Investments (Cost $86,594,790) | | | | | | | | | | | | | | | 86,597,087 | |
| | | | | | | | | | | | | | | | |
| | | | | | | | |
| Total investments in securities (Cost $931,517,474) | | | 105.93 | % | | | 1,325,283,307 | |
Other assets and liabilities, net | | | (5.93 | ) | | | (74,180,021 | ) |
| | | | | | | | |
| Total net assets | | | 100.00 | % | | $ | 1,251,103,286 | |
| | | | | | | | |
The accompanying notes are an integral part of these financial statements.
| | | | | | |
| Portfolio of investments—September 30, 2017 | | Wells Fargo Common Stock Fund | | | 15 | |
| † | Non-income-earning security |
| « | All or a portion of this security is on loan. |
| (l) | The issuer of the security is an affiliated person of the Fund as defined in the Investment Company Act of 1940. |
| (u) | The rate represents the 7-day annualized yield at period end. |
| (r) | The investment is a non-registered investment company purchased with cash collateral received from securities on loan. |
Investments in Affiliates
An affiliated investment is an investment in which the Fund owns at least 5% of the outstanding voting shares of the issuer or as a result of other relationships, such as the Fund and the issuer having the same investment manager. Transactions with issuers that were either affiliated persons of the Fund at the beginning of the period or the end of the period were as follows:
| | | | | | | | | | | | | | | | | | | | | | | | | | | | | | | | | | | | |
| | | Shares,
beginning of
period | | | Shares
purchased | | | Shares sold | | | Shares,
end of
period | | | Net
realized
gains
(losses) | | | Net change
in
unrealized
gains
(losses) | | | Income
from
affiliated
securities | | | Value,
end
of period | | | % of net assets | |
Short-Term Investments | | | | | | | | | | | | | | | | | | | | | | | | | | | | | | | | | | | | |
| | | | | | | | | |
Investment companies | | | | | | | | | | | | | | | | | | | | | | | | | | | | | | | | | | | | |
Securities Lending Cash Investment LLC | | | 23,242,150 | | | | 424,995,828 | | | | 374,677,566 | | | | 73,560,412 | | | $ | 1,088 | | | $ | 2,297 | | | $ | 364,741 | | | $ | 73,567,768 | | | | | |
Wells Fargo Government Money Market Fund Select Class | | | 23,993,777 | | | | 324,465,920 | | | | 335,430,378 | | | | 13,029,319 | | | | 0 | | | | 0 | | | | 113,706 | | | | 13,029,319 | | | | | |
| | | | | | | | | | | | | | | | | | | | | | | | | | | | | | | | | | | | |
| | | | | | | | | | | | | | | | | | $ | 1,088 | | | $ | 2,297 | | | $ | 478,447 | | | $ | 86,597,087 | | | | 6.92 | % |
| | | | | | | | | | | | | | | | | | | | | | | | | | | | | | | | | | | | |
The accompanying notes are an integral part of these financial statements.
| | | | |
| 16 | | Wells Fargo Common Stock Fund | | Statement of assets and liabilities—September 30, 2017 |
| | | | |
| | | | |
| |
Assets | | | | |
Investments in unaffiliated securities (including $71,001,995 of securities loaned), at value (cost $844,922,684) | | $ | 1,238,686,220 | |
Investments in affiliated securities, at value (cost $86,594,790) | | | 86,597,087 | |
Receivable for Fund shares sold | | | 151,596 | |
Receivable for dividends | | | 795,168 | |
Receivable for securities lending income | | | 31,922 | |
Prepaid expenses and other assets | | | 13,978 | |
| | | | |
Total assets | | | 1,326,275,971 | |
| | | | |
| |
Liabilities | | | | |
Payable for Fund shares redeemed | | | 319,215 | |
Payable upon receipt of securities loaned | | | 73,564,384 | |
Management fee payable | | | 782,033 | |
Distribution fees payable | | | 11,870 | |
Administration fees payable | | | 189,624 | |
Accrued expenses and other liabilities | | | 305,559 | |
| | | | |
Total liabilities | | | 75,172,685 | |
| | | | |
Total net assets | | $ | 1,251,103,286 | |
| | | | |
| |
NET ASSETS CONSIST OF | | | | |
Paid-in capital | | $ | 752,189,501 | |
Accumulated net investment loss | | | (3,859 | ) |
Accumulated net realized gains on investments | | | 105,151,811 | |
Net unrealized gains on investments | | | 393,765,833 | |
| | | | |
Total net assets | | $ | 1,251,103,286 | |
| | | | |
| |
COMPUTATION OF NET ASSET VALUE AND OFFERING PRICE PER SHARE | | | | |
Net assets – Class A | | $ | 942,595,920 | |
Shares outstanding – Class A1 | | | 39,181,921 | |
Net asset value per share – Class A | | | $24.06 | |
Maximum offering price per share – Class A2 | | | $25.53 | |
Net assets – Class C | | $ | 18,978,442 | |
Shares outstanding – Class C1 | | | 1,012,444 | |
Net asset value per share – Class C | | | $18.75 | |
Net assets – Class R6 | | $ | 115,640,588 | |
Shares outstanding – Class R61 | | | 4,619,514 | |
Net asset value per share – Class R6 | | | $25.03 | |
Net assets – Administrator Class | | $ | 6,336,335 | |
Shares outstanding – Administrator Class1 | | | 259,465 | |
Net asset value per share – Administrator Class | | | $24.42 | |
Net assets – Institutional Class | | $ | 167,552,001 | |
Shares outstanding – Institutional Class1 | | | 6,709,624 | |
Net asset value per share – Institutional Class | | | $24.97 | |
| 1 | The Fund has an unlimited number of authorized shares. |
| 2 | Maximum offering price is computed as 100/94.25 of net asset value. On investments of $50,000 or more, the offering price is reduced. |
The accompanying notes are an integral part of these financial statements.
| | | | | | |
| Statement of operations—year ended September 30, 2017 | | Wells Fargo Common Stock Fund | | | 17 | |
| | | | |
| | | | |
| |
Investment income | | | | |
Dividends | | $ | 10,299,189 | |
Income from affiliated securities | | | 478,447 | |
| | | | |
Total investment income | | | 10,777,636 | |
| | | | |
| |
Expenses | | | | |
Management fee | | | 9,464,245 | |
Administration fees | | | | |
Class A | | | 1,948,082 | |
Class B | | | 12 | 1 |
Class C | | | 44,300 | |
Class R6 | | | 32,721 | |
Administrator Class | | | 11,616 | |
Institutional Class | | | 231,947 | |
Shareholder servicing fees | | | | |
Class A | | | 2,319,146 | |
Class B | | | 14 | 1 |
Class C | | | 52,738 | |
Administrator Class | | | 22,338 | |
Distribution fees | | | | |
Class B | | | 41 | 1 |
Class C | | | 158,215 | |
Custody and accounting fees | | | 74,909 | |
Professional fees | | | 51,652 | |
Registration fees | | | 111,177 | |
Shareholder report expenses | | | 70,361 | |
Trustees’ fees and expenses | | | 20,901 | |
Other fees and expenses | | | 39,875 | |
| | | | |
Total expenses | | | 14,654,290 | |
Less: Fee waivers and/or expense reimbursements | | | (130,043 | ) |
| | | | |
Net expenses | | | 14,524,247 | |
| | | | |
Net investment loss | | | (3,746,611 | ) |
| | | | |
| |
REALIZED AND UNREALIZED GAINS (LOSSES) ON INVESTMENTS | | | | |
| |
Net realized gains on: | | | | |
Unaffiliated securities | | | 121,744,300 | |
Affiliated securities | | | 1,088 | |
| | | | |
Net realized gains on investments | | | 121,745,388 | |
| | | | |
| |
Net change in unrealized gains (losses) on: | | | | |
Unaffiliated securities | | | 68,745,101 | |
Affiliated securities | | | 2,297 | |
| | | | |
Net change in unrealized gains (losses) on investments | | | 68,747,398 | |
| | | | |
Net realized and unrealized gains (losses) on investments | | | 190,492,786 | |
| | | | |
Net increase in net assets resulting from operations | | $ | 186,746,175 | |
| | | | |
| 1 | For the period from October 1, 2016 to December 5, 2016. Effective at the close of business on December 5, 2016, Class B shares were converted to Class A shares and are no longer offered by the Fund. |
The accompanying notes are an integral part of these financial statements.
| | | | |
| 18 | | Wells Fargo Common Stock Fund | | Statement of changes in net assets |
| | | | | | | | | | | | | | | | |
| | | Year ended
September 30, 2017 | | | Year ended
September 30, 2016 | |
| |
Operations | | | | | |
Net investment loss | | | | | | $ | (3,746,611 | ) | | | | | | $ | (418,110 | ) |
Net realized gains on investments | | | | | | | 121,745,388 | | | | | | | | 58,412,227 | |
Net change in unrealized gains (losses) on investments | | | | | | | 68,747,398 | | | | | | | | 87,367,906 | |
| | | | |
Net increase in net assets resulting from operations | | | | | | | 186,746,175 | | | | | | | | 145,362,023 | |
| | | | |
| | | | |
Distributions to shareholders from | | | | | | | | | | | | | | | | |
Net realized gains | | | | | | | | | | | | | | | | |
Class A | | | | | | | (34,833,443 | ) | | | | | | | (110,146,894 | ) |
Class B | | | | | | | 0 | 1 | | | | | | | (12,735 | ) |
Class C | | | | | | | (1,072,237 | ) | | | | | | | (3,575,460 | ) |
Class R6 | | | | | | | (3,722,907 | ) | | | | | | | (10,822,850 | ) |
Administrator Class | | | | | | | (308,980 | ) | | | | | | | (1,979,080 | ) |
Institutional Class | | | | | | | (6,486,421 | ) | | | | | | | (25,614,461 | ) |
| | | | |
Total distributions to shareholders | | | | | | | (46,423,988 | ) | | | | | | | (152,151,480 | ) |
| | | | |
| | | | |
Capital share transactions | | | Shares | | | | | | | | Shares | | | | | |
Proceeds from shares sold | | | | | | | | | | | | | | | | |
Class A | | | 975,399 | | | | 21,721,156 | | | | 39,544,860 | | | | 906,361,116 | |
Class C | | | 58,484 | | | | 1,036,989 | | | | 87,982 | | | | 1,399,266 | |
Class R6 | | | 851,975 | | | | 19,951,604 | | | | 727,868 | | | | 15,356,332 | |
Administrator Class | | | 68,428 | | | | 1,537,967 | | | | 93,356 | | | | 1,876,928 | |
Institutional Class | | | 1,763,589 | | | | 41,457,596 | | | | 1,569,307 | | | | 33,234,939 | |
Investor Class | | | N/A | | | | N/A | | | | 38,960 | 2 | | | 902,899 | 2 |
| | | | |
| | | | | | | 85,705,312 | | | | | | | | 959,131,480 | |
| | | | |
Reinvestment of distributions | | | | | | | | | | | | | | | | |
Class A | | | 1,499,574 | | | | 33,260,548 | | | | 5,376,198 | | | | 105,588,529 | |
Class B | | | 0 | 1 | | | 0 | 1 | | | 812 | | | | 12,735 | |
Class C | | | 52,926 | | | | 920,375 | | | | 193,065 | | | | 3,025,330 | |
Class R6 | | | 161,865 | | | | 3,722,907 | | | | 534,462 | | | | 10,822,850 | |
Administrator Class | | | 13,054 | | | | 293,584 | | | | 97,753 | | | | 1,942,357 | |
Institutional Class | | | 279,367 | | | | 6,411,478 | | | | 1,256,619 | | | | 25,408,844 | |
| | | | |
| | | | | | | 44,608,892 | | | | | | | | 146,800,645 | |
| | | | |
Payment for shares redeemed | | | | | | | | | | | | | | | | |
Class A | | | (6,314,787 | ) | | | (142,096,079 | ) | | | (7,807,939 | ) | | | (160,174,152 | ) |
Class B | | | (1,872 | )1 | | | (33,351 | )1 | | | (5,487 | ) | | | (91,427 | ) |
Class C | | | (442,603 | ) | | | (7,836,662 | ) | | | (381,490 | ) | | | (6,231,682 | ) |
Class R6 | | | (954,160 | ) | | | (22,265,015 | ) | | | (984,239 | ) | | | (20,831,726 | ) |
Administrator Class | | | (589,682 | ) | | | (13,418,635 | ) | | | (249,908 | ) | | | (5,213,466 | ) |
Institutional Class | | | (3,134,026 | ) | | | (73,012,502 | ) | | | (5,255,616 | ) | | | (106,700,641 | ) |
Investor Class | | | N/A | | | | N/A | | | | (37,451,779 | )2 | | | (884,694,693 | )2 |
| | | | |
| | | | | | | (258,662,244 | ) | | | | | | | (1,183,937,787 | ) |
| | | | |
Net decrease in net assets resulting from capital share transactions | | | | | | | (128,348,040 | ) | | | | | | | (78,005,662 | ) |
| | | | |
Total increase (decrease) in net assets | | | | | | | 11,974,147 | | | | | | | | (84,795,119 | ) |
| | | | |
| | | | |
Net assets | | | | | | | | | | | | | | | | |
Beginning of period | | | | | | | 1,239,129,139 | | | | | | | | 1,323,924,258 | |
| | | | |
End of period | | | | | | $ | 1,251,103,286 | | | | | | | $ | 1,239,129,139 | |
| | | | |
Accumulated net investment loss | | | | | | $ | (3,859 | ) | | | | | | $ | (3,859 | ) |
| | | | |
| 1 | For the period from October 1, 2016 to December 5, 2016. Effective at the close of business on December 5, 2016, Class B shares were converted to Class A shares and are no longer offered by the Fund. |
| 2 | For the period from October 1, 2015 to October 23, 2015. Effective at the close of business on October 23, 2015, Investor Class shares were converted to Class A shares and are no longer offered by the Fund. |
The accompanying notes are an integral part of these financial statements.
| | | | | | |
| Financial highlights | | Wells Fargo Common Stock Fund | | | 19 | |
(For a share outstanding throughout each period)
| | | | | | | | | | | | | | | | | | | | |
| | | Year ended September 30 | |
| CLASS A | | 2017 | | | 2016 | | | 2015 | | | 2014 | | | 2013 | |
Net asset value, beginning of period | | | $21.50 | | | | $21.62 | | | | $24.79 | | | | $24.45 | | | | $21.18 | |
Net investment loss | | | (0.09 | ) | | | (0.01 | )1 | | | (0.04 | )1 | | | (0.07 | ) | | | (0.02 | ) |
Net realized and unrealized gains (losses) on investments | | | 3.48 | | | | 2.45 | | | | (0.32 | ) | | | 2.48 | | | | 4.72 | |
| | | | | | | | | | | | | | | | | | | | |
Total from investment operations | | | 3.39 | | | | 2.44 | | | | (0.36 | ) | | | 2.41 | | | | 4.70 | |
Distributions to shareholders from | | | | | | | | | | | | | | | | | | | | |
Net realized gains | | | (0.83 | ) | | | (2.56 | ) | | | (2.81 | ) | | | (2.07 | ) | | | (1.43 | ) |
Net asset value, end of period | | | $24.06 | | | | $21.50 | | | | $21.62 | | | | $24.79 | | | | $24.45 | |
Total return2 | | | 16.10 | % | | | 12.43 | % | | | (1.76 | )% | | | 10.26 | % | | | 23.72 | % |
Ratios to average net assets (annualized) | | | | | | | | | | | | | | | | | | | | |
Gross expenses | | | 1.25 | % | | | 1.25 | % | | | 1.27 | % | | | 1.28 | % | | | 1.30 | % |
Net expenses | | | 1.25 | % | | | 1.25 | % | | | 1.26 | % | | | 1.26 | % | | | 1.26 | % |
Net investment loss | | | (0.38 | )% | | | (0.05 | )% | | | (0.19 | )% | | | (0.27 | )% | | | (0.05 | )% |
Supplemental data | | | | | | | | | | | | | | | | | | | | |
Portfolio turnover rate | | | 35 | % | | | 32 | % | | | 51 | % | | | 38 | % | | | 40 | % |
Net assets, end of period (000s omitted) | | | $942,596 | | | | $924,864 | | | | $127,732 | | | | $277,517 | | | | $292,806 | |
| 1 | Calculated based upon average shares outstanding |
| 2 | Total return calculations do not include any sales charges. |
The accompanying notes are an integral part of these financial statements.
| | | | |
| 20 | | Wells Fargo Common Stock Fund | | Financial highlights |
(For a share outstanding throughout each period)
| | | | | | | | | | | | | | | | | | | | |
| | | Year ended September 30 | |
| CLASS C | | 2017 | | | 2016 | | | 2015 | | | 2014 | | | 2013 | |
Net asset value, beginning of period | | | $17.04 | | | | $17.77 | | | | $21.02 | | | | $21.18 | | | | $18.67 | |
Net investment loss | | | (0.20 | )1 | | | (0.14 | )1 | | | (0.18 | ) | | | (0.22 | )1 | | | (0.16 | )1 |
Net realized and unrealized gains (losses) on investments | | | 2.74 | | | | 1.97 | | | | (0.26 | ) | | | 2.13 | | | | 4.10 | |
| | | | | | | | | | | | | | | | | | | | |
Total from investment operations | | | 2.54 | | | | 1.83 | | | | (0.44 | ) | | | 1.91 | | | | 3.94 | |
Distributions to shareholders from | | | | | | | | | | | | | | | | | | | | |
Net realized gains | | | (0.83 | ) | | | (2.56 | ) | | | (2.81 | ) | | | (2.07 | ) | | | (1.43 | ) |
Net asset value, end of period | | | $18.75 | | | | $17.04 | | | | $17.77 | | | | $21.02 | | | | $21.18 | |
Total return2 | | | 15.29 | % | | | 11.52 | % | | | (2.49 | )% | | | 9.42 | % | | | 22.78 | % |
Ratios to average net assets (annualized) | | | | | | | | | | | | | | | | | | | | |
Gross expenses | | | 2.00 | % | | | 2.00 | % | | | 2.02 | % | | | 2.03 | % | | | 2.05 | % |
Net expenses | | | 2.00 | % | | | 2.00 | % | | | 2.00 | % | | | 2.01 | % | | | 2.01 | % |
Net investment loss | | | (1.14 | )% | | | (0.87 | )% | | | (0.93 | )% | | | (1.01 | )% | | | (0.81 | )% |
Supplemental data | | | | | | | | | | | | | | | | | | | | |
Portfolio turnover rate | | | 35 | % | | | 32 | % | | | 51 | % | | | 38 | % | | | 40 | % |
Net assets, end of period (000s omitted) | | | $18,978 | | | | $22,902 | | | | $25,668 | | | | $30,245 | | | | $29,483 | |
| 1 | Calculated based upon average shares outstanding |
| 2 | Total return calculations do not include any sales charges. |
The accompanying notes are an integral part of these financial statements.
| | | | | | |
| Financial highlights | | Wells Fargo Common Stock Fund | | | 21 | |
(For a share outstanding throughout each period)
| | | | | | | | | | | | | | | | | | | | |
| | | Year ended September 30 | |
| CLASS R6 | | 2017 | | | 2016 | | | 2015 | | | 2014 | | | 20131 | |
Net asset value, beginning of period | | | $22.25 | | | | $22.20 | | | | $25.27 | | | | $24.78 | | | | $22.83 | |
Net investment income | | | 0.01 | | | | 0.07 | 2 | | | 0.05 | | | | 0.07 | 2 | | | 0.01 | |
Net realized and unrealized gains (losses) on investments | | | 3.60 | | | | 2.54 | | | | (0.31 | ) | | | 2.49 | | | | 1.94 | |
| | | | | | | | | | | | | | | | | | | | |
Total from investment operations | | | 3.61 | | | | 2.61 | | | | (0.26 | ) | | | 2.56 | | | | 1.95 | |
Distributions to shareholders from | | | | | | | | | | | | | | | | | | | | |
Net realized gains | | | (0.83 | ) | | | (2.56 | ) | | | (2.81 | ) | | | (2.07 | ) | | | 0.00 | |
Net asset value, end of period | | | $25.03 | | | | $22.25 | | | | $22.20 | | | | $25.27 | | | | $24.78 | |
Total return3 | | | 16.56 | % | | | 12.91 | % | | | (1.29 | )% | | | 10.76 | % | | | 8.54 | % |
Ratios to average net assets (annualized) | | | | | | | | | | | | | | | | | | | | |
Gross expenses | | | 0.82 | % | | | 0.82 | % | | | 0.80 | % | | | 0.80 | % | | | 0.81 | % |
Net expenses | | | 0.82 | % | | | 0.82 | % | | | 0.80 | % | | | 0.80 | % | | | 0.81 | % |
Net investment income | | | 0.05 | % | | | 0.32 | % | | | 0.28 | % | | | 0.27 | % | | | 0.18 | % |
Supplemental data | | | | | | | | | | | | | | | | | | | | |
Portfolio turnover rate | | | 35 | % | | | 32 | % | | | 51 | % | | | 38 | % | | | 40 | % |
Net assets, end of period (000s omitted) | | | $115,641 | | | | $101,436 | | | | $95,037 | | | | $95,213 | | | | $27 | |
| 1 | For the period from June 28, 2013 (commencement of class operations) to September 30, 2013 |
| 2 | Calculated based upon average shares outstanding |
| 3 | Returns for periods of less than one year are not annualized. |
The accompanying notes are an integral part of these financial statements.
| | | | |
| 22 | | Wells Fargo Common Stock Fund | | Financial highlights |
(For a share outstanding throughout each period)
| | | | | | | | | | | | | | | | | | | | |
| | | Year ended September 30 | |
| ADMINISTRATOR CLASS | | 2017 | | | 2016 | | | 2015 | | | 2014 | | | 2013 | |
Net asset value, beginning of period | | | $21.78 | | | | $21.84 | | | | $24.98 | | | | $24.59 | | | | $21.26 | |
Net investment income (loss) | | | (0.06 | )1 | | | 0.02 | | | | (0.01 | )1 | | | (0.02 | )1 | | | 0.01 | |
Net realized and unrealized gains (losses) on investments | | | 3.53 | | | | 2.48 | | | | (0.32 | ) | | | 2.48 | | | | 4.75 | |
| | | | | | | | | | | | | | | | | | | | |
Total from investment operations | | | 3.47 | | | | 2.50 | | | | (0.33 | ) | | | 2.46 | | | | 4.76 | |
Distributions to shareholders from | | | | | | | | | | | | | | | | | | | | |
Net realized gains | | | (0.83 | ) | | | (2.56 | ) | | | (2.81 | ) | | | (2.07 | ) | | | (1.43 | ) |
Net asset value, end of period | | | $24.42 | | | | $21.78 | | | | $21.84 | | | | $24.98 | | | | $24.59 | |
Total return | | | 16.26 | % | | | 12.59 | % | | | (1.62 | )% | | | 10.41 | % | | | 23.92 | % |
Ratios to average net assets (annualized) | | | | | | | | | | | | | | | | | | | | |
Gross expenses | | | 1.17 | % | | | 1.17 | % | | | 1.12 | % | | | 1.11 | % | | | 1.11 | % |
Net expenses | | | 1.10 | % | | | 1.10 | % | | | 1.10 | % | | | 1.09 | % | | | 1.09 | % |
Net investment income (loss) | | | (0.27 | )% | | | 0.03 | % | | | (0.03 | )% | | | (0.07 | )% | | | 0.11 | % |
Supplemental data | | | | | | | | | | | | | | | | | | | | |
Portfolio turnover rate | | | 35 | % | | | 32 | % | | | 51 | % | | | 38 | % | | | 40 | % |
Net assets, end of period (000s omitted) | | | $6,336 | | | | $16,720 | | | | $18,050 | | | | $45,364 | | | | $24,871 | |
| 1 | Calculated based upon average shares outstanding |
The accompanying notes are an integral part of these financial statements.
| | | | | | |
| Financial highlights | | Wells Fargo Common Stock Fund | | | 23 | |
(For a share outstanding throughout each period)
| | | | | | | | | | | | | | | | | | | | |
| | | Year ended September 30 | |
| INSTITUTIONAL CLASS | | 2017 | | | 2016 | | | 2015 | | | 2014 | | | 2013 | |
Net asset value, beginning of period | | | $22.20 | | | | $22.16 | | | | $25.25 | | | | $24.77 | | | | $21.37 | |
Net investment income | | | 0.00 | 1,2 | | | 0.06 | 1 | | | 0.03 | | | | 0.03 | | | | 0.07 | 1 |
Net realized and unrealized gains (losses) on investments | | | 3.60 | | | | 2.54 | | | | (0.31 | ) | | | 2.52 | | | | 4.76 | |
| | | | | | | | | | | | | | | | | | | | |
Total from investment operations | | | 3.60 | | | | 2.60 | | | | (0.28 | ) | | | 2.55 | | | | 4.83 | |
Distributions to shareholders from | | | | | | | | | | | | | | | | | | | | |
Net realized gains | | | (0.83 | ) | | | (2.56 | ) | | | (2.81 | ) | | | (2.07 | ) | | | (1.43 | ) |
Net asset value, end of period | | | $24.97 | | | | $22.20 | | | | $22.16 | | | | $25.25 | | | | $24.77 | |
Total return | | | 16.55 | % | | | 12.88 | % | | | (1.38 | )% | | | 10.72 | % | | | 24.14 | % |
Ratios to average net assets (annualized) | | | | | | | | | | | | | | | | | | | | |
Gross expenses | | | 0.92 | % | | | 0.92 | % | | | 0.86 | % | | | 0.85 | % | | | 0.87 | % |
Net expenses | | | 0.85 | % | | | 0.85 | % | | | 0.85 | % | | | 0.85 | % | | | 0.87 | % |
Net investment income | | | 0.02 | % | | | 0.28 | % | | | 0.24 | % | | | 0.14 | % | | | 0.33 | % |
Supplemental data | | | | | | | | | | | | | | | | | | | | |
Portfolio turnover rate | | | 35 | % | | | 32 | % | | | 51 | % | | | 38 | % | | | 40 | % |
Net assets, end of period (000s omitted) | | | $167,552 | | | | $173,175 | | | | $226,729 | | | | $223,525 | | | | $197,453 | |
| 1 | Calculated based upon average shares outstanding |
| 2 | Amount is less than $0.005. |
The accompanying notes are an integral part of these financial statements.
| | | | |
| 24 | | Wells Fargo Common Stock Fund | | Notes to financial statements |
1. ORGANIZATION
Wells Fargo Funds Trust (the “Trust”), a Delaware statutory trust organized on March 10, 1999, is an open-end management investment company registered under the Investment Company Act of 1940, as amended (the “1940 Act”). As an investment company, the Trust follows the accounting and reporting guidance in Financial Accounting Standards Board Accounting Standards Codification Topic 946, Financial Services – Investment Companies. These financial statements report on the Wells Fargo Common Stock Fund (the “Fund”) which is a diversified series of the Trust.
Effective at the close of business on October 23, 2015, Investor Class shares were converted to Class A shares and are no longer offered by the Fund. Information for Investor Class shares reflected in the financial statements represents activity through October 23, 2015.
Effective at the close of business on December 5, 2016, Class B shares were converted to Class A shares and are no longer offered by the Fund. Information for Class B shares reflected in the financial statements represents activity through December 5, 2016.
2. SIGNIFICANT ACCOUNTING POLICIES
The following significant accounting policies, which are consistently followed in the preparation of the financial statements of the Fund, are in conformity with U.S. generally accepted accounting principles which require management to make estimates and assumptions that affect the reported amounts of assets and liabilities, disclosure of contingent assets and liabilities at the date of the financial statements, and the reported amounts of revenues and expenses during the reporting period. Actual results could differ from those estimates.
Securities valuation
All investments are valued each business day as of the close of regular trading on the New York Stock Exchange (generally 4 p.m. Eastern Time), although the Fund may deviate from this calculation time under unusual or unexpected circumstances.
Equity securities that are listed on a foreign or domestic exchange or market are valued at the official closing price or, if none, the last sales price. If no sale occurs on the principal exchange or market that day, a fair value price will be determined in accordance with the Fund’s Valuation Procedures.
Investments in registered open-end investment companies are valued at net asset value. Interests in non-registered investment companies that are redeemable at net asset value are fair valued normally at net asset value.
Investments which are not valued using any of the methods discussed above are valued at their fair value, as determined in good faith by the Board of Trustees of the Fund. The Board of Trustees has established a Valuation Committee comprised of the Trustees and has delegated to it the authority to take any actions regarding the valuation of portfolio securities that the Valuation Committee deems necessary or appropriate, including determining the fair value of portfolio securities, unless the determination has been delegated to the Management Valuation Team of Wells Fargo Funds Management, LLC (“Funds Management”). The Board of Trustees retains the authority to make or ratify any valuation decisions or approve any changes to the Valuation Procedures as it deems appropriate. On a quarterly basis, the Board of Trustees receives reports on any valuation actions taken by the Valuation Committee or the Management Valuation Team which may include items for ratification.
Valuations of fair valued securities are compared to the next actual sales price when available, or other appropriate market values, to assess the continued appropriateness of the fair valuation methodologies used. These securities are fair valued on a day-to-day basis, taking into consideration changes to appropriate market information and any significant changes to the inputs considered in the valuation process until there is a readily available price provided on an exchange or by an independent pricing service. Valuations received from an independent pricing service or independent broker-dealer quotes are periodically validated by comparisons to most recent trades and valuations provided by other independent pricing services in addition to the review of prices by the manager and/or subadviser. Unobservable inputs used in determining fair valuations are identified based on the type of security, taking into consideration factors utilized by market participants in valuing the investment, knowledge about the issuer and the current market environment.
Security loans
The Fund may lend its securities from time to time in order to earn additional income in the form of fees or interest on securities received as collateral or the investment of any cash received as collateral. The Fund continues to receive interest or dividends on the securities loaned. The Fund receives collateral in the form of cash or securities with a value at least equal to the value of the securities on loan. The value of the loaned securities is determined at the close of each
| | | | | | |
| Notes to financial statements | | Wells Fargo Common Stock Fund | | | 25 | |
business day and any additional required collateral is delivered to the Fund on the next business day. In a securities lending transaction, the net asset value of the Fund will be affected by an increase or decrease in the value of the securities loaned and by an increase or decrease in the value of the instrument in which collateral is invested. The amount of securities lending activity undertaken by the Fund fluctuates from time to time. In the event of default or bankruptcy by the borrower, the Fund may be prevented from recovering the loaned securities or gaining access to the collateral or may experience delays or costs in doing so. In addition, the investment of any cash collateral received may lose all or part of its value. The Fund has the right under the lending agreement to recover the securities from the borrower on demand.
The Fund lends its securities through an unaffiliated securities lending agent. Cash collateral received in connection with its securities lending transactions is invested in Securities Lending Cash Investments, LLC (the “Securities Lending Fund”). The Securities Lending Fund is exempt from registration under Section 3(c)(7) of the 1940 Act and is managed by Funds Management and is subadvised by Wells Capital Management Incorporated (“WellsCap”), an affiliate of Funds Management and an indirect wholly owned subsidiary of Wells Fargo & Company (“Wells Fargo”). Funds Management receives an advisory fee starting at 0.05% and declining to 0.01% as the average daily net assets of the Securities Lending Fund increase. All of the fees received by Funds Management are paid to WellsCap for its services as subadviser. The Securities Lending Fund seeks to provide a positive return compared to the daily Fed Funds Open Rate by investing in high-quality, U.S. dollar-denominated short-term money market instruments. Securities Lending Fund investments are valued at the evaluated bid price provided by an independent pricing service. Income earned from investment in the Securities Lending Fund is included in income from affiliates securities on the Statement of Operations.
Security transactions and income recognition
Securities transactions are recorded on a trade date basis. Realized gains or losses are recorded on the basis of identified cost.
Dividend income is recognized on the ex-dividend date.
Distributions to shareholders
Distributions to shareholders from net investment income and net realized gains, if any, are recorded on the ex-dividend date. Such distributions are determined in accordance with income tax regulations and may differ from U.S. generally accepted accounting principles. Dividend sources are estimated at the time of declaration. The tax character of distributions is determined as of the Fund’s fiscal year end. Therefore, a portion of the Fund’s distributions made prior to the Fund’s fiscal year end may be categorized as a tax return of capital.
Federal and other taxes
The Fund intends to continue to qualify as a regulated investment company by distributing substantially all of its investment company taxable income and any net realized capital gains (after reduction for capital loss carryforwards) sufficient to relieve it from all, or substantially all, federal income taxes. Accordingly, no provision for federal income taxes was required.
The Fund’s income and federal excise tax returns and all financial records supporting those returns for the prior three fiscal years are subject to examination by the federal and Delaware revenue authorities. Management has analyzed the Fund’s tax positions taken on federal, state, and foreign tax returns for all open tax years and does not believe that there are any uncertain tax positions that require recognition of a tax liability.
As of September 30, 2017, the aggregate cost of all investments for federal income tax purposes was $943,201,416 and the unrealized gains (losses) consisted of:
| | | | |
Gross unrealized gains | | $ | 419,969,040 | |
Gross unrealized losses | | | (37,887,149 | ) |
Net unrealized gains | | $ | 382,081,891 | |
| | | | |
| 26 | | Wells Fargo Common Stock Fund | | Notes to financial statements |
Reclassifications are made to the Fund’s capital accounts for permanent tax differences to reflect income and gains available for distribution (or available capital loss carryforwards) under federal income tax regulations. U.S. generally accepted accounting principles require that certain components of net assets be adjusted to reflect permanent differences between financial and tax reporting. These reclassifications have no effect on net assets or net asset values per share. The primary permanent difference causing such reclassifications is due to net operating losses. At September 31, 2017, as a result of permanent book-to-tax differences, the following reclassification adjustments were made on the Statement of Assets and Liabilities:
| | |
Accumulated net investment loss | | Accumulated net
realized gains on investments |
| $3,746,611 | | $(3,746,611) |
Class allocations
The separate classes of shares offered by the Fund differ principally in applicable sales charges, distribution, shareholder servicing, and administration fees. Class specific expenses are charged directly to that share class. Investment income, common expenses, and realized and unrealized gains (losses) on investments are allocated daily to each class of shares based on the relative proportion of net assets of each class.
3. FAIR VALUATION MEASUREMENTS
Fair value measurements of investments are determined within a framework that has established a fair value hierarchy based upon the various data inputs utilized in determining the value of the Fund’s investments. The three-level hierarchy gives the highest priority to unadjusted quoted prices in active markets for identical assets or liabilities (Level 1) and the lowest priority to unobservable inputs (Level 3). The Fund’s investments are classified within the fair value hierarchy based on the lowest level of input that is significant to the fair value measurement. The inputs are summarized into three broad levels as follows:
| ∎ | | Level 1 – quoted prices in active markets for identical securities |
| ∎ | | Level 2 – other significant observable inputs (including quoted prices for similar securities, interest rates, prepayment speeds, credit risk, etc.) |
| ∎ | | Level 3 – significant unobservable inputs (including the Fund’s own assumptions in determining the fair value of investments) |
The inputs or methodologies used for valuing investments in securities are not necessarily an indication of the risk associated with investing in those securities.
| | | | | | |
| Notes to financial statements | | Wells Fargo Common Stock Fund | | | 27 | |
The following is a summary of the inputs used in valuing the Fund’s assets and liabilities as of September 30, 2017:
| | | | | | | | | | | | | | | | |
| | | Quoted prices
(Level 1) | | | Other significant
observable inputs
(Level 2) | | | Significant
unobservable inputs (Level 3) | | | Total | |
Assets | | | | | | | | | | | | | | | | |
Investments in: | | | | | | | | | | | | | | | | |
| | | | |
Common stocks | | | | | | | | | | | | | | | | |
Consumer discretionary | | $ | 120,850,917 | | | $ | 0 | | | $ | 0 | | | $ | 120,850,917 | |
Consumer staples | | | 25,617,929 | | | | 0 | | | | 0 | | | | 25,617,929 | |
Energy | | | 79,273,155 | | | | 0 | | | | 0 | | | | 79,273,155 | |
Financials | | | 237,943,643 | | | | 0 | | | | 0 | | | | 237,943,643 | |
Health care | | | 175,770,178 | | | | 0 | | | | 0 | | | | 175,770,178 | |
Industrials | | | 236,878,570 | | | | 0 | | | | 0 | | | | 236,878,570 | |
Information technology | | | 197,119,518 | | | | 0 | | | | 0 | | | | 197,119,518 | |
Materials | | | 86,115,470 | | | | 0 | | | | 0 | | | | 86,115,470 | |
Real estate | | | 52,608,066 | | | | 0 | | | | 0 | | | | 52,608,066 | |
| | | | |
Exchange-traded funds | | | 26,508,774 | | | | 0 | | | | 0 | | | | 26,508,774 | |
| | | | |
Short-term investments | | | | | | | | | | | | | | | | |
Investment companies | | | 13,029,319 | | | | 0 | | | | 0 | | | | 13,029,319 | |
Investments measured at net asset value* | | | | | | | | | | | | | | | 73,567,768 | |
Total assets | | $ | 1,251,715,539 | | | $ | 0 | | | $ | 0 | | | $ | 1,325,283,307 | |
| * | Investments that are measured at fair value using the net asset value per share (or its equivalent) as a practical expedient have not been categorized in the fair value hierarchy. The fair value amount presented in the table is intended to permit reconciliation of the fair value hierarchy to the amounts presented in the Statement of Assets and Liabilities. The Fund’s investment in Securities Lending Cash Investments, LLC valued at $73,567,768 does not have a redemption period notice, can be redeemed daily and does not have any unfunded commitments. |
The Fund recognizes transfers between levels within the fair value hierarchy at the end of the reporting period. At September 30, 2017, the Fund did not have any transfers into/out of Level 1, Level 2, or Level 3.
4. TRANSACTIONS WITH AFFILIATES AND OTHER EXPENSES
Management fee
Funds Management, an indirect wholly owned subsidiary of Wells Fargo, is the manager of the Fund and provides advisory and fund-level administrative services under an investment management agreement. Under the investment management agreement, Funds Management is responsible for, among other services, implementing the investment objectives and strategies of the Fund, supervising the subadviser, providing fund-level administrative services in connection with the Fund’s operations, and providing any other fund-level administrative services reasonably necessary for the operation of the Fund. As compensation for its services under the investment management agreement, Funds Management is entitled to receive an annual management fee starting at 0.80% and declining to 0.63% as the average daily net assets of the Fund increase. For the year ended September 30, 2017, the management fee was equivalent to an annual rate of 0.76% of the Fund’s average daily net assets.
Funds Management has retained the services of a subadviser to provide daily portfolio management to the Fund. The fee for subadvisory services is borne by Funds Management. WellsCap is the subadviser to the Fund and is entitled to receive a fee from Funds Management at an annual rate starting at 0.45% and declining to 0.30% as the average daily net assets of the Fund increase.
Administration fees
Under a class-level administration agreement, Funds Management provides class-level administrative services to the Fund, which includes paying fees and expenses for services provided by the transfer agent, sub-transfer agents, omnibus account servicers and record-keepers. As compensation for its services under the class-level administration agreement, Funds Management receives an annual fee which is calculated based on the average daily net assets of each class as follows:
| | | | |
| | | Class-level
administration fee | |
Class A, Class B, Class C | | | 0.21 | % |
Class R6 | | | 0.03 | |
Administrator Class, Institutional Class | | | 0.13 | |
| | | | |
| 28 | | Wells Fargo Common Stock Fund | | Notes to financial statements |
Funds Management has contractually waived and/or reimbursed management and administration fees to the extent necessary to maintain certain net operating expense ratios for the Fund. Waiver of fees and/or reimbursement of expenses by Funds Management were made first from fund level expenses on a proportionate basis and then from class specific expenses. Funds Management has committed through January 31, 2018 to waive fees and/or reimburse expenses to the extent necessary to cap the Fund’s expenses at 1.26% for Class A shares, 2.01% for Class C shares, 0.85% for Class R6 shares, 1.10% for Administrator Class shares, and 0.85% for Institutional Class shares. After this time, the cap may be increased or the commitment to maintain the cap may be terminated only with the approval of the Board of Trustees.
During the year ended September 30, 2017, State Street Bank and Trust Company (“State Street’), the Fund’s custodian, reimbursed the Fund $32,093 for certain out-of-pocket expenses that were billed to the Fund in error from 1998-2015. This amount is included in dividend income on the Statement of Operations. In addition, Funds Management was also reimbursed $5,736 by State Street for waivers/reimbursements it made to the Fund to limit Fund expenses during the period the Fund was erroneously billed.
Distribution fees
The Trust has adopted a distribution plan for Class B and Class C shares of the Fund pursuant to Rule 12b-1 under the 1940 Act. Distribution fees are charged to Class B and Class C shares and paid to Wells Fargo Funds Distributor, LLC (“Funds Distributor”), the principal underwriter, at an annual rate of 0.75% of the average daily net assets of Class B and Class C shares.
In addition, Funds Distributor is entitled to receive the front-end sales charge from the purchase of Class A shares and a contingent deferred sales charge on the redemption of certain Class A shares. Funds Distributor is also entitled to receive the contingent deferred sales charges from redemptions of Class B and Class C shares. For the year ended September 30, 2017, Funds Distributor received $3,787 from the sale of Class A shares and $10 in contingent deferred sales charges from redemptions of Class C shares. No contingent deferred sales charges were incurred by Class A and Class B for the year ended September 30, 2017.
Shareholder servicing fees
The Trust has entered into contracts with one or more shareholder servicing agents, whereby Class A, Class B, Class C, and Administrator Class of the Fund are charged a fee at an annual rate of 0.25% of the average daily net assets of each respective class.
A portion of these total shareholder servicing fees were paid to affiliates of Wells Fargo.
Interfund transactions
The Fund may purchase or sell portfolio investment securities to certain other Wells Fargo affiliates pursuant to Rule 17a-7 of the 1940 Act and under procedures adopted by the Board of Trustees. The procedures have been designed to ensure that these interfund transactions, which do not incur broker commissions, are effected at current market prices.
5. INVESTMENT PORTFOLIO TRANSACTIONS
Purchases and sales of investments, excluding U.S. government obligations (if any) and short-term securities, for the year ended September 30, 2017 were $430,459,576 and $598,504,030, respectively.
6. BANK BORROWINGS
The Trust (excluding the money market funds and certain other funds) and Wells Fargo Variable Trust are parties to a $280,000,000 revolving credit agreement whereby the Fund is permitted to use bank borrowings for temporary or emergency purposes, such as to fund shareholder redemption requests. Interest under the credit agreement is charged to the Fund based on a borrowing rate equal to the higher of the Federal Funds rate in effect on that day plus 1.25% or the overnight LIBOR rate in effect on that day plus 1.25%. In addition, an annual commitment fee equal to 0.25% of the unused balance is allocated to each participating fund. Prior to August 29, 2017, the revolving credit agreement amount was $250,000,000.
For the year ended September 30, 2017, there were no borrowings by the Fund under the agreement.
| | | | | | |
| Notes to financial statements | | Wells Fargo Common Stock Fund | | | 29 | |
7. DISTRIBUTIONS TO SHAREHOLDERS
The tax character of distributions paid during the years ended September 30, 2017 and September 30, 2016 were as follows:
| | | | | | | | |
| | | Year ended September 30 | |
| | | 2017 | | | 2016 | |
Ordinary income | | $ | 8,270,040 | | | $ | 0 | |
Long-term capital gain | | | 38,153,948 | | | | 152,151,480 | |
As of September 30, 2017, the components of distributable earnings on a tax basis were as follows:
| | | | |
Undistributed
ordinary
income | | Undistributed
long-term
gain | | Unrealized
gains |
$17,677,628 | | $99,158,125 | | $382,081,891 |
8. INDEMNIFICATION
Under the Trust’s organizational documents, the officers and Trustees have been granted certain indemnification rights against certain liabilities that may arise out of performance of their duties to the Trust. Additionally, in the normal course of business, the Trust may enter into contracts with service providers that contain a variety of indemnification clauses. The Trust’s maximum exposure under these arrangements is dependent on future claims that may be made against the Fund and, therefore, cannot be estimated.
| | | | |
| 30 | | Wells Fargo Common Stock Fund | | Report of independent registered public accounting firm |
BOARD OF TRUSTEES AND SHAREHOLDERS OF WELLS FARGO FUNDS TRUST:
We have audited the accompanying statement of assets and liabilities, including the portfolio of investments, of the Wells Fargo Common Stock Fund (the “Fund”), one of the funds constituting the Wells Fargo Funds Trust, as of September 30, 2017, and the related statement of operations for the year then ended, the statements of changes in net assets for each of the years in the two-year period then ended, and the financial highlights for each of the years or periods in the five-year period then ended. These financial statements and financial highlights are the responsibility of the Fund’s management. Our responsibility is to express an opinion on these financial statements and financial highlights based on our audits.
We conducted our audits in accordance with the standards of the Public Company Accounting Oversight Board (United States). Those standards require that we plan and perform the audit to obtain reasonable assurance about whether the financial statements and financial highlights are free of material misstatement. An audit includes examining, on a test basis, evidence supporting the amounts and disclosures in the financial statements. Our procedures included confirmation of securities owned as of September 30, 2017, by correspondence with the custodian and brokers, or by other appropriate auditing procedures. An audit also includes assessing the accounting principles used and significant estimates made by management, as well as evaluating the overall financial statement presentation. We believe that our audits provide a reasonable basis for our opinion.
In our opinion, the financial statements and financial highlights referred to above present fairly, in all material respects, the financial position of the Wells Fargo Common Stock Fund as of September 30, 2017, the results of its operations for the year then ended, the changes in its net assets for each of the years in the two-year period then ended, and the financial highlights for each of the years or periods in the five-year period then ended, in conformity with U.S. generally accepted accounting principles.

Boston, Massachusetts
November 22, 2017
| | | | | | |
| Other information (unaudited) | | Wells Fargo Common Stock Fund | | | 31 | |
TAX INFORMATION
For corporate shareholders, pursuant to Section 854 of the Internal Revenue Code, 91.80% of ordinary income dividends qualify for the corporate dividends-received deduction for the fiscal year ended September 30, 2017.
Pursuant to Section 852 of the Internal Revenue Code, $38,153,948 was designated as a 20% rate gain distribution for the fiscal year ended September 30, 2017.
Pursuant to Section 854 of the Internal Revenue Code, $7,633,359 of income dividends paid during the fiscal year ended September 30, 2017 has been designated as qualified dividend income (QDI).
For the fiscal year ended September 30, 2017, $8,270,040 has been designated as short-term capital gain dividends for nonresident alien shareholders pursuant to Section 871 of the Internal Revenue Code.
PROXY VOTING INFORMATION
A description of the policies and procedures that the Fund uses to determine how to vote proxies relating to portfolio securities is available, upon request, by calling 1-800-222-8222, visiting our website at wellsfargofunds.com, or visiting the SEC website at sec.gov. Information regarding how the Fund voted proxies relating to portfolio securities during the most recent 12-month period ended June 30 is available on the Fund’s website at wellsfargofunds.com or by visiting the SEC website at sec.gov.
PORTFOLIO HOLDINGS INFORMATION
The complete portfolio holdings for the Fund are publicly available monthly on the Fund’s website (wellsfargofunds.com), on a one-month delayed basis. In addition, top ten holdings information (excluding derivative positions) for the Fund is publicly available on the Fund’s website on a monthly, seven-day or more delayed basis. The Fund files its complete schedule of portfolio holdings with the SEC for the first and third quarters of each fiscal year on Form N-Q, which is available by visiting the SEC website at sec.gov. In addition, the Fund’s Form N-Q may be reviewed and copied at the SEC’s Public Reference Room in Washington, DC, and at regional offices in New York City, at 233 Broadway, and in Chicago, at 175 West Jackson Boulevard, Suite 900. Information about the Public Reference Room may be obtained by calling 1-800-SEC-0330.
| | | | |
| 32 | | Wells Fargo Common Stock Fund | | Other information (unaudited) |
BOARD OF TRUSTEES AND OFFICERS
Each of the Trustees and Officers1 listed in the table below acts in identical capacities for each fund in the Wells Fargo family of funds, which consists of 152 mutual funds comprising the Wells Fargo Funds Trust, Wells Fargo Variable Trust, Wells Fargo Master Trust and four closed-end funds (collectively the “Fund Complex”). This table should be read in conjunction with the Prospectus and the Statement of Additional Information2. The mailing address of each Trustee and Officer is 525 Market Street, 12th Floor, San Francisco, CA 94105. Each Trustee and Officer serves an indefinite term, however, each Trustee serves such term until reaching the mandatory retirement age established by the Trustees.
Independent Trustees
| | | | | | |
Name and year of birth | | Position held and length of service* | | Principal occupations during past five years or longer | | Current other public company or
investment company
directorships |
| William R. Ebsworth (Born 1957) | | Trustee, since 2015 | | Retired. From 1984 to 2013, equities analyst, portfolio manager, research director and chief investment officer at Fidelity Management and Research Company in Boston, Tokyo, and Hong Kong and retired in 2013 as Chief Investment Officer of Fidelity Strategic Advisers, Inc. where he led a team of investment professionals managing client assets. Prior thereto, Board member of Hong Kong Securities Clearing Co., Hong Kong Options Clearing Corp., the Thailand International Fund, Ltd., Fidelity Investments Life Insurance Company, and Empire Fidelity Investments Life Insurance Company. Board member of the Forté Foundation (non-profit organization) and the Vincent Memorial Hospital Endowment (non-profit organization), where he serves on the Investment Committee and as a Chair of the Audit Committee. Mr. Ebsworth is a CFA® charterholder. | | Asset Allocation Trust |
| Jane A. Freeman (Born 1953) | | Trustee, since 2015 | | Retired. From 2012 to 2014 and 1999 to 2008, Chief Financial Officer of Scientific Learning Corporation. From 2008 to 2012, Ms. Freeman provided consulting services related to strategic business projects. Prior to 1999, Portfolio Manager at Rockefeller & Co. and Scudder, Stevens & Clark. Board member of the Harding Loevner Funds from 1996 to 2014, serving as both Lead Independent Director and chair of the Audit Committee. Board member of the Russell Exchange Traded Funds Trust from 2011 to 2012 and the chair of the Audit Committee. Ms. Freeman is a Board Member of Ruth Bancroft Garden (non-profit organization) and an inactive chartered financial analyst. | | Asset Allocation Trust |
| Peter G. Gordon** (Born 1942) | | Trustee, since 1998; Chairman, since 2005 | | Co-Founder, Retired Chairman, President and CEO of Crystal Geyser Water Company. Trustee Emeritus, Colby College. | | Asset Allocation Trust |
| Isaiah Harris, Jr. (Born 1952) | | Trustee, since 2009 | | Retired. Chairman of the Board of CIGNA Corporation since 2009, and Director since 2005. From 2003 to 2011, Director of Deluxe Corporation. Prior thereto, President and CEO of BellSouth Advertising and Publishing Corp. from 2005 to 2007, President and CEO of BellSouth Enterprises from 2004 to 2005 and President of BellSouth Consumer Services from 2000 to 2003. Emeritus member of the Iowa State University Foundation Board of Governors. Emeritus Member of the Advisory Board of Iowa State University School of Business. Advisory Board Member, Palm Harbor Academy (charter school). Advisory Board Member, Child Evangelism Fellowship (non-profit). Mr. Harris is a certified public accountant (inactive status). | | CIGNA Corporation; Asset Allocation Trust |
| Judith M. Johnson (Born 1949) | | Trustee, since 2008; Audit Committee Chairman, since 2008 | | Retired. Prior thereto, Chief Executive Officer and Chief Investment Officer of Minneapolis Employees Retirement Fund from 1996 to 2008. Ms. Johnson is an attorney, certified public accountant and a certified managerial accountant. | | Asset Allocation Trust |
| David F. Larcker (Born 1950) | | Trustee, since 2009 | | James Irvin Miller Professor of Accounting at the Graduate School of Business, Stanford University, Director of the Corporate Governance Research Initiative and Senior Faculty of The Rock Center for Corporate Governance since 2006. From 2005 to 2008, Professor of Accounting at the Graduate School of Business, Stanford University. Prior thereto, Ernst & Young Professor of Accounting at The Wharton School, University of Pennsylvania from 1985 to 2005. | | Asset Allocation Trust |
| | | | | | |
| Other information (unaudited) | | Wells Fargo Common Stock Fund | | | 33 | |
| | | | | | |
Name and year of birth | | Position held and length of service* | | Principal occupations during past five years or longer | | Current other public company or
investment company
directorships |
Olivia S. Mitchell (Born 1953) | | Trustee, since 2006 | | International Foundation of Employee Benefit Plans Professor, Wharton School of the University of Pennsylvania since 1993. Director of Wharton’s Pension Research Council and Boettner Center on Pensions & Retirement Research, and Research Associate at the National Bureau of Economic Research. Previously, Cornell University Professor from 1978 to 1993. | | Asset Allocation Trust |
Timothy J. Penny (Born 1951) | | Trustee, since 1996: Vice Chairman, since 2017 | | President and Chief Executive Officer of Southern Minnesota Initiative Foundation, a non-profit organization, since 2007 and Senior Fellow at the Humphrey Institute Policy Forum at the University of Minnesota since 1995. Member of the Board of Trustees of NorthStar Education Finance, Inc., a non-profit organization, since 2007. | | Asset Allocation Trust |
| Michael S. Scofield (Born 1943) | | Trustee, since 2010 | | Served on the Investment Company Institute’s Board of Governors and Executive Committee from 2008-2011 as well the Governing Council of the Independent Directors Council from 2006-2011 and the Independent Directors Council Executive Committee from 2008-2011. Chairman of the IDC from 2008-2010. Trustee of the Evergreen Funds complex (and its predecessors) from 1984 to 2010. Chairman of the Evergreen Funds from 2000-2010. Former Trustee of the Mentor Funds. Retired Attorney, Law Offices of Michael S. Scofield. | | Asset Allocation Trust |
| * | Length of service dates reflect the Trustee’s commencement of service with the Trust’s predecessor entities, where applicable. |
| ** | Peter Gordon is expected to retire on December 31, 2017. |
Advisory Board Members
| | | | | | |
Name and year of birth | | Position held and length of service | | Principal occupations during past five years or longer | | Current other public company or
investment company
directorships |
| James G. Polisson (Born 1959) | | Advisory Board Member, since 2017 | | Retired. Chief Marketing Officer, Source (ETF) UK Services, Ltd, from 2015 to 2017. From 2012 to 2015, Principal of The Polisson Group, LLC, a management consulting, corporate advisory and principal investing company. Chief Executive Officer and Managing Director at Russell Investments, Global Exchange Traded Funds from 2010 to 2012. Managing Director of Barclays Global Investors from 1998 to 2010 and Global Chief Marketing Officer for iShares and Barclays Global Investors from 2000 to 2010. Prior thereto, Vice President, Fidelity Retail Mutual Fund Group from 1996 to 1998 and Risk Management Practice Manager, Fidelity Consulting from 1995 to 1996. Board member of the Russell Exchange Traded Fund Trust from 2011 to 2012. Director of Barclays Global Investors Holdings Deutschland GmbH from 2006 to 2009. Mr. Polisson is an attorney and has a retired status with the Massachusetts and District of Columbia Bar Associations. | | None |
| Pamela Wheelock (Born 1959) | | Advisory Board Member, since 2017 | | Chief Operating Officer, Twin Cities Habitat for Humanity, since January, 2017. Vice President of University Services, University of Minnesota from 2012 to 2017. Prior thereto, Interim President and Chief Executive Officer of Blue Cross Blue Shield of Minnesota from 2010 to 2011, Chairman of the Board from 2009 to 2011 and Board Director from 2003 to 2015. Vice President, Leadership and Community Engagement, Bush Foundation, Saint Paul, Minnesota (a private foundation) from 2009 to 2011. Executive Vice President and Chief Financial Officer, Minnesota Sports and Entertainment from 2004 to 2009 and Senior Vice President from 2002 to 2004. Commissioner of Finance, State of Minnesota, from 1999 to 2002. Currently on the Board of Directors, Governance Committee and Finance Committee, for the Minnesota Philanthropy Partners (Saint Paul Foundation) since 2012 and Board Chair of the Minnesota Wild Foundation since 2010. | | None |
| | | | |
| 34 | | Wells Fargo Common Stock Fund | | Other information (unaudited) |
Officers
| | | | | | |
Name and year of birth | | Position held and
length of service | | Principal occupations during past five years or longer | | |
Andrew Owen (Born 1960) | | President, since 2017 | | Executive Vice President of Wells Fargo & Company and Head of Affiliated Managers, Wells Fargo Asset Management, since 2014. In addition, Mr. Owen is currently President, Chief Executive Officer and Director of Wells Fargo Funds Management, LLC since 2017. Prior thereto, Executive Vice President responsible for marketing, investments and product development for Wells Fargo Funds Management, LLC, from 2009 to 2014. | | |
Nancy Wiser1 (Born 1967) | | Treasurer, since 2012 | | Executive Vice President of Wells Fargo Funds Management, LLC since 2011. Chief Operating Officer and Chief Compliance Officer at LightBox Capital Management LLC, from 2008 to 2011. | | |
| C. David Messman (Born 1960) | | Secretary, since 2000; Chief Legal Officer, since 2003 | | Senior Vice President and Secretary of Wells Fargo Funds Management, LLC since 2001. Assistant General Counsel of Wells Fargo Bank, N.A. since 2013 and Vice President and Managing Counsel of Wells Fargo Bank, N.A. from 1996 to 2013. | | |
| Michael H. Whitaker (Born 1967) | | Chief Compliance Officer, since 2016 | | Senior Vice President and Chief Compliance Officer since 2016. Senior Vice President and Chief Compliance Officer for Fidelity Investments from 2007 to 2016. | | |
| David Berardi (Born 1975) | | Assistant Treasurer, since 2009 | | Vice President of Wells Fargo Funds Management, LLC since 2009. Vice President of Evergreen Investment Management Company, LLC from 2008 to 2010. Manager of Fund Reporting and Control for Evergreen Investment Management Company, LLC from 2004 to 2010. | | |
Jeremy DePalma1 (Born 1974) | | Assistant Treasurer, since 2009 | | Senior Vice President of Wells Fargo Funds Management, LLC since 2009. Senior Vice President of Evergreen Investment Management Company, LLC from 2008 to 2010 and head of the Fund Reporting and Control Team within Fund Administration from 2005 to 2010. | | |
| 1 | Nancy Wiser acts as Treasurer of 76 funds in the Fund Complex. Jeremy DePalma acts as Treasurer of 76 funds and Assistant Treasurer of 76 funds in the Fund Complex. |
| 2 | The Statement of Additional Information includes additional information about the Trustees and is available, without charge, upon request, by calling 1-800-222-8222 or by visiting the website at wellsfargofunds.com. |
| | | | | | |
| Other information (unaudited) | | Wells Fargo Common Stock Fund | | | 35 | |
BOARD CONSIDERATION OF INVESTMENT MANAGEMENT AND SUB-ADVISORY AGREEMENTS:
Under the Investment Company Act of 1940 (the “1940 Act”), the Board of Trustees (the “Board”) of Wells Fargo Funds Trust (the “Trust”) must determine annually whether to approve the continuation of the Trust’s investment management and sub-advisory agreements. In this regard, at an in-person meeting held on May 16-17, 2017 (the “Meeting”), the Board, all the members of which have no direct or indirect interest in the investment management and sub-advisory agreements and are not “interested persons” of the Trust, as defined in the 1940 Act (the “Independent Trustees”), reviewed and approved for Wells Fargo Common Stock Fund (the “Fund”): (i) an investment management agreement (the “Management Agreement”) with Wells Fargo Funds Management, LLC (“Funds Management”); and (ii) an investment sub-advisory agreement (the “Sub-Advisory Agreement”) with Wells Capital Management Incorporated (the “Sub-Adviser”), an affiliate of Funds Management. The Management Agreement and the Sub-Advisory Agreement are collectively referred to as the “Advisory Agreements.”
At the Meeting, the Board considered the factors and reached the conclusions described below relating to the selection of Funds Management and the Sub-Adviser and the approval of the Advisory Agreements. Prior to the Meeting, including at an in-person meeting in April 2017, the Trustees conferred extensively among themselves and with representatives of Funds Management about these matters. Also, the Board has adopted a team-based approach, with each team consisting of a sub-set of Trustees, to assist the full Board in the discharge of its duties in reviewing performance and other matters throughout the year. The Independent Trustees were assisted in their evaluation of the Advisory Agreements by independent legal counsel, from whom they received separate legal advice and with whom they met separately.
In providing information to the Board, Funds Management and the Sub-Adviser were guided by a detailed set of requests for information submitted to them by independent legal counsel on behalf of the Independent Trustees at the start of the Board’s annual contract renewal process earlier in 2017. In considering and approving the Advisory Agreements, the Trustees considered the information they believed relevant, including but not limited to the information discussed below. The Board considered not only the specific information presented in connection with the Meeting, but also the knowledge gained over time through interaction with Funds Management and the Sub-Adviser about various topics. In this regard, the Board reviewed reports of Funds Management at each of its quarterly meetings, which included, among other things, portfolio reviews and performance reports. In addition, the Board and the teams mentioned above confer with portfolio managers at various times throughout the year. The Board did not identify any particular information or consideration that was all-important or controlling, and each individual Trustee may have attributed different weights to various factors.
After its deliberations, the Board unanimously approved the continuation of the Advisory Agreements for a one-year term and determined that the compensation payable to Funds Management and the Sub-Adviser under each of the Advisory Agreements was reasonable. The Board considered the approval of the Advisory Agreements for the Fund as part of its consideration of agreements for funds across the complex, but its approvals were made on a fund-by-fund basis. The following summarizes a number of important, but not necessarily all, factors considered by the Board in support of its approvals.
Nature, extent and quality of services
The Board received and considered various information regarding the nature, extent and quality of services provided to the Fund by Funds Management and the Sub-Adviser under the Advisory Agreements. This information included a description of the investment advisory services and Fund-level administrative services covered by the Management Agreement, as well as, among other things, a summary of the background and experience of senior management of Funds Management, a summary of certain organizational and personnel changes involving Funds Management and the Sub-Adviser, and a description of Funds Management’s and the Sub-Adviser’s business continuity planning programs and of their approaches to data privacy and cybersecurity. The Board also considered the qualifications, background, tenure and responsibilities of each of the portfolio managers primarily responsible for the day-to-day portfolio management of the Fund.
The Board evaluated the ability of Funds Management and the Sub-Adviser to attract and retain qualified investment professionals, including research, advisory and supervisory personnel. The Board further considered the compliance programs and compliance records of Funds Management and the Sub-Adviser. In addition, the Board took into account the full range of services provided to the Fund by Funds Management and its affiliates.
| | | | |
| 36 | | Wells Fargo Common Stock Fund | | Other information (unaudited) |
Fund performance and expenses
The Board considered the investment performance results for the Fund over various time periods ended December 31, 2016. In certain cases, the Board also considered more current results for various time periods ended March 31, 2017. The Board considered these results in comparison to the performance of funds in a universe that was determined by Broadridge Inc. (“Broadridge”) to be similar to the Fund (the “Universe”), and in comparison to the Fund’s benchmark index and to other comparative data. Broadridge is an independent provider of investment company data. The Board received a description of the methodology used by Broadridge to select the mutual funds in the performance Universe. The Board noted that the performance of the Fund (Class A) was lower than the average performance of the Universe for the one-, three- and five-year periods ended December 31, 2016, and higher than the average performance of the Universe for the ten-year period ended December 31, 2016. However, the Board noted that the performance ranking of the Fund in the Universe had improved from the prior quarter-end for the one-, three- and five-year periods ended March 31, 2017. The Board also noted that the performance of the Fund was lower than its benchmark, the Russell 2500TM Index, for the one-, three- and five-year periods ended December 31, 2016, and higher than the index for the ten-year period ended December 31, 2016.
The Board received information concerning, and discussed factors contributing to, the underperformance of the Fund relative to the Universe and benchmark for the periods identified above. The Board took note of the explanations for the relative underperformance during these periods, including with respect to investment decisions and market factors that affected the Fund’s performance.
The Board also received and considered information regarding the Fund’s net operating expense ratios and their various components, including actual management fees, custodian and other non-management fees, and Rule 12b-1 and non-Rule 12b-1 shareholder service fees. The Board considered these ratios in comparison to the median ratios of funds in class-specific expense groups that were determined by Broadridge to be similar to the Fund (the “Groups”). The Board received a description of the methodology used by Broadridge to select the mutual funds in the expense Groups and an explanation of how funds comprising expense groups and their expense ratios may vary from year-to-year. Based on the Broadridge reports, the Board noted that the net operating expense ratios of the Fund were lower than, equal to or in range of the median net operating expense ratios of the expense Groups for all share classes.
The Board took into account the Fund performance and expense information provided to it among the factors considered in deciding to re-approve the Advisory Agreements.
Investment management and sub-advisory fee rates
The Board reviewed and considered the contractual fee rates payable by the Fund to Funds Management under the Management Agreement, as well as the contractual fee rates payable by the Fund to Funds Management for class-level administrative services under a Class-Level Administration Agreement, which include, among other things, class-level transfer agency and sub-transfer agency costs (collectively, the “Management Rates”). The Board also reviewed and considered the contractual investment sub-advisory fee rates that are payable by Funds Management to the Sub-Adviser for investment sub-advisory services.
Among other information reviewed by the Board was a comparison of the Fund’s Management Rates with the average contractual investment management fee rates of funds in the expense Groups at a common asset level as well as transfer agency costs of the funds in the expense Groups. The Board noted that the Management Rates of the Fund were lower than or in range of the sum of these average rates for the Fund’s expense Groups for all share classes.
The Board also received and considered information about the portion of the total management fee that was retained by Funds Management after payment of the fee to the Sub-Adviser for sub-advisory services. In assessing the reasonableness of this amount, the Board received and evaluated information about the nature and extent of responsibilities retained and risks assumed by Funds Management and not delegated to or assumed by the Sub-Adviser, and about Funds Management’s on-going oversight services. Given the affiliation between Funds Management and the Sub-Adviser, the Board ascribed limited relevance to the allocation of fees between them.
The Board also received and considered information about the nature and extent of services offered and fee rates charged by Funds Management and the Sub-Adviser to other types of clients with investment strategies similar to those of the Fund. In this regard, the Board received information about the significantly greater scope of services, and compliance, reporting and other legal burdens and risks of managing mutual funds compared with those associated with managing assets of non-mutual fund clients such as institutional separate accounts.
| | | | | | |
| Other information (unaudited) | | Wells Fargo Common Stock Fund | | | 37 | |
Based on its consideration of the factors and information it deemed relevant, including those described here, the Board determined that the compensation payable to Funds Management under the Management Agreement and to the Sub-Adviser under the Sub-Advisory Agreement was reasonable.
Profitability
The Board received and considered information concerning the profitability of Funds Management, as well as the profitability of Wells Fargo as a whole, from providing services to the Fund and the fund family as a whole. The Board also received and considered information concerning the profitability of the Sub-Adviser from providing services to the fund family as a whole, noting that the Sub-Adviser’s profitability information with respect to providing services to the Fund was subsumed in the Wells Fargo and Funds Management profitability analysis.
Funds Management reported on the methodologies and estimates used in calculating profitability, including a description of the methodology used to allocate certain expenses. Among other things, the Board noted that the levels of profitability reported on a fund-by-fund basis varied widely, depending on factors such as the size and type of fund. Based on its review, the Board did not deem the profits reported by Funds Management or Wells Fargo from its services to the Fund to be at a level that would prevent it from approving the continuation of the Advisory Agreements.
Economies of scale
With respect to possible economies of scale, the Board noted the existence of breakpoints in the Fund’s management fee structure, which operate generally to reduce the Fund’s expense ratios as the Fund grows in size. It considered that, for a small fund or a fund that shrinks in size, breakpoints conversely can result in higher fee levels. The Board also considered that in addition to management fee breakpoints, competitive management fee rates set at the outset without regard to breakpoints and fee waiver and expense reimbursement arrangements are means of sharing potential economies of scale with shareholders of the Fund. The Board considered Funds Management’s view, which Funds Management indicated was supported by independent third-party industry studies which were summarized for the Board, that any analyses of potential economies of scale in managing a particular fund are inherently limited in light of the joint and common costs and investments that Funds Management incurs across the fund family as a whole.
The Board concluded that the Fund’s fee and expense arrangements, including contractual breakpoints, constituted a reasonable approach to sharing potential economies of scale with the Fund and its shareholders.
Other benefits to Funds Management and the Sub-Adviser
The Board received and considered information regarding potential “fall-out” or ancillary benefits received by Funds Management and its affiliates, including the Sub-Adviser, as a result of their relationships with the Fund. Ancillary benefits could include, among others, benefits directly attributable to other relationships with the Fund and benefits potentially derived from an increase in Funds Management’s and the Sub-Adviser’s business as a result of their relationships with the Fund. The Board noted that various affiliates of Funds Management may receive distribution-related fees, shareholder servicing payments and sub-transfer agency fees in respect of shares sold or held through them and services provided.
The Board also reviewed information about soft dollar credits earned and utilized by the Sub-Adviser, fees earned by Funds Management and the Sub-Adviser from managing a private investment vehicle for the fund family’s securities lending collateral and commissions earned by an affiliated broker from portfolio transactions.
Based on its consideration of the factors and information it deemed relevant, including those described here, the Board did not find that any ancillary benefits received by Funds Management and its affiliates, including the Sub-Adviser, were unreasonable.
Conclusion
At the Meeting, after considering the above-described factors and based on its deliberations and its evaluation of the information described above, the Board unanimously approved the continuation of the Advisory Agreements for a one-year term and determined that the compensation payable to Funds Management and the Sub-Adviser under each of the Advisory Agreements was reasonable.
| | | | |
| 38 | | Wells Fargo Common Stock Fund | | List of abbreviations |
The following is a list of common abbreviations for terms and entities that may have appeared in this report.
| ACA | — ACA Financial Guaranty Corporation |
| ADR | — American depositary receipt |
| ADS | — American depositary shares |
| AGC | — Assured Guaranty Corporation |
| AGM | — Assured Guaranty Municipal |
| Ambac | — Ambac Financial Group Incorporated |
| AMT | — Alternative minimum tax |
| BAN | — Bond anticipation notes |
| BHAC | — Berkshire Hathaway Assurance Corporation |
| CAB | — Capital appreciation bond |
| CCAB | — Convertible capital appreciation bond |
| CDA | — Community Development Authority |
| CDO | — Collateralized debt obligation |
| CLO | — Collateralized loan obligation |
| DRIVER | — Derivative inverse tax-exempt receipts |
| DW&P | — Department of Water & Power |
| DWR | — Department of Water Resources |
| ECFA | — Educational & Cultural Facilities Authority |
| EDA | — Economic Development Authority |
| EDFA | — Economic Development Finance Authority |
| ETF | — Exchange-traded fund |
| FDIC | — Federal Deposit Insurance Corporation |
| FFCB | — Federal Farm Credit Banks |
| FGIC | — Financial Guaranty Insurance Corporation |
| FHA | — Federal Housing Administration |
| FHLB | — Federal Home Loan Bank |
| FHLMC | — Federal Home Loan Mortgage Corporation |
| FICO | — The Financing Corporation |
| FNMA | — Federal National Mortgage Association |
| GDR | — Global depositary receipt |
| GNMA | — Government National Mortgage Association |
| HCFR | — Healthcare facilities revenue |
| HEFA | — Health & Educational Facilities Authority |
| HEFAR | — Higher education facilities authority revenue |
| HFA | — Housing Finance Authority |
| HFFA | — Health Facilities Financing Authority |
| HUD | — Department of Housing and Urban Development |
| IDA | — Industrial Development Authority |
| IDAG | — Industrial Development Agency |
| KRW | — Republic of Korea won |
| LIBOR | — London Interbank Offered Rate |
| LIFER | — Long Inverse Floating Exempt Receipts |
| LLC | — Limited liability company |
| LLLP | — Limited liability limited partnership |
| LLP | — Limited liability partnership |
| MBIA | — Municipal Bond Insurance Association |
| MFHR | — Multifamily housing revenue |
| MSTR | — Municipal securities trust receipts |
| MUD | — Municipal Utility District |
| National | — National Public Finance Guarantee Corporation |
| PCFA | — Pollution Control Financing Authority |
| PCL | — Public Company Limited |
| PCR | — Pollution control revenue |
| PFA | — Public Finance Authority |
| PFFA | — Public Facilities Financing Authority |
| PFOTER | — Puttable floating option tax-exempt receipts |
| PJSC | — Public Joint Stock Company |
| plc | — Public limited company |
| PUTTER | — Puttable tax-exempt receipts |
| R&D | — Research & development |
| Radian | — Radian Asset Assurance |
| RAN | — Revenue anticipation notes |
| RDA | — Redevelopment Authority |
| RDFA | — Redevelopment Finance Authority |
| REIT | — Real estate investment trust |
| ROC | — Reset option certificates |
| SAVRS | — Select auction variable rate securities |
| SBA | — Small Business Authority |
| SDR | — Swedish depositary receipt |
| SFHR | — Single-family housing revenue |
| SFMR | — Single-family mortgage revenue |
| SPA | — Standby purchase agreement |
| SPDR | — Standard & Poor’s Depositary Receipts |
| SPEAR | — Short Puttable Exempt Adjustable Receipts |
| STRIPS | — Separate trading of registered interest and |
| TAN | — Tax anticipation notes |
| TIPS | — Treasury inflation-protected securities |
| TRAN | — Tax revenue anticipation notes |
| TTFA | — Transportation Trust Fund Authority |
| TVA | — Tennessee Valley Authority |
This page is intentionally left blank.
This page is intentionally left blank.

For more information
More information about Wells Fargo Funds is available free upon request. To obtain literature, please write, email, visit the Fund’s website, or call:
Wells Fargo Funds
P.O. Box 8266
Boston, MA 02266-8266
Email: fundservice@wellsfargo.com
Website: wellsfargofunds.com
Individual investors: 1-800-222-8222
Retail investment professionals: 1-888-877-9275
Institutional investment professionals: 1-866-765-0778
This report and the financial statements contained herein are submitted for the general information of the shareholders of the Fund. If this report is used for promotional purposes, distribution of the report must be accompanied or preceded by a current prospectus. Before investing, please consider the investment objectives, risks, charges, and expenses of the investment. For a current prospectus and, if available, a summary prospectus, containing this information, call 1-800-222-8222 or visit the Fund’s website at wellsfargofunds.com. Read the prospectus carefully before you invest or send money.
Wells Fargo Asset Management (WFAM) is a trade name used by the asset management businesses of Wells Fargo & Company. Wells Fargo Funds Management, LLC, a wholly owned subsidiary of Wells Fargo & Company, provides investment advisory and administrative services for Wells Fargo Funds. Other affiliates of Wells Fargo & Company provide subadvisory and other services for the funds. The funds are distributed by Wells Fargo Funds Distributor, LLC, Member FINRA, an affiliate of Wells Fargo & Company. Neither Wells Fargo Funds Distributor nor Wells Fargo Funds Management holds fund shareholder accounts or assets. This material is for general informational and educational purposes only and is NOT intended to provide investment advice or a recommendation of any kind—including a recommendation for any specific investment, strategy, or plan.
NOT FDIC INSURED ◾ NO BANK GUARANTEE ◾ MAY LOSE VALUE
© 2017 Wells Fargo Funds Management, LLC. All rights reserved.
| | |
 | | 306435 11-17 A229/AR229 09-17 |
Annual Report
September 30, 2017

Wells Fargo Discovery Fund


Reduce clutter. Save trees.
Sign up for electronic delivery of prospectuses and shareholder reports at wellsfargo.com/advantagedelivery
Contents
The views expressed and any forward-looking statements are as of September 30, 2017, unless otherwise noted, and are those of the Fund managers and/or Wells Fargo Funds Management, LLC. Discussions of individual securities, or the markets generally, or any Wells Fargo Fund are not intended as individual recommendations. Future events or results may vary significantly from those expressed in any forward-looking statements. The views expressed are subject to change at any time in response to changing circumstances in the market. Wells Fargo Funds Management, LLC and the Fund disclaim any obligation to publicly update or revise any views expressed or forward-looking statements.
NOT FDIC INSURED ◾ NO BANK GUARANTEE ◾ MAY LOSE VALUE
| | | | |
| 2 | | Wells Fargo Discovery Fund | | Letter to shareholders (unaudited) |

Andrew Owen
President
Wells Fargo Funds
Favorable economic news supported stocks, and interest rates moved higher.
Hiring remained strong, and business and consumer sentiment improved.
Dear Shareholder:
We are pleased to offer you this annual report for the Wells Fargo Discovery Fund for the 12-month period that ended September 30, 2017. Despite heightened market volatility at times, global stocks generally delivered double-digit results and bond markets had smaller but positive results as well. U.S. and international stocks returned 18.61% and 19.61%, respectively, for the 12-month period, as measured by the S&P 500 Index1 and the MSCI ACWI ex USA Index (Net),2 respectively; within fixed income, the Bloomberg Barclays U.S. Aggregate Bond Index3 returned 0.07% and the Bloomberg Barclays Municipal Bond Index4 returned 0.87% as interest rates rose from low levels.
Election results and central banks’ policies commanded investor attention as 2016 closed.
During the fourth quarter of 2016, investors appeared intent on the prospective outcomes of elections in the U.S. and central-bank actions globally. Following Donald Trump’s election victory, U.S. stocks rallied. Investors appeared optimistic that the new administration would pursue progrowth policies. Favorable economic news supported stocks, and interest rates moved higher. At their mid-December meeting, U.S. Federal Reserve (Fed) officials raised the target interest rate by a quarter percentage point to a range of 0.50% to 0.75%. The fourth quarter also saw the implementation of the U.S. Securities and Exchange Commission’s new rules for money market funds, which included floating net asset values (NAVs) as well as the possibility of liquidity fees and redemption gates for institutional prime and municipal money market funds. In the year leading up to money market fund reform implementation, nearly $1 trillion in assets moved from money market funds subject to floating NAVs into government money market funds, which continued to transact at a stable $1.00 NAV. Outside of the U.S., the prospects for faster U.S. growth appeared to trigger some acceleration in Europe.
Financial markets gained during the first two quarters of 2017 on positive economic data.
Stocks rallied globally through the first quarter of 2017, supported by signs of improvement in the U.S. and global economies. U.S. economic data released during the quarter reflected a healthy economy. Hiring remained strong, and business and consumer sentiment improved. In March, Fed officials raised their target interest rate by a quarter percentage point to a range of 0.75% to 1.00%. With the Fed’s target interest-rate increase, short-term bond yields rose during the quarter. Meanwhile, longer-term Treasury yields were little changed, leading to positive performance. Investment-grade and high-yield bonds benefited from strong demand. Municipal bond returns were positive in the quarter, helped by strong demand and constrained new-issue supply. Outside of the U.S., stocks in emerging markets generally outperformed stocks in the U.S. and international
| 1 | The S&P 500 Index consists of 500 stocks chosen for market size, liquidity, and industry group representation. It is a market-value-weighted index with each stock’s weight in the index proportionate to its market value. You cannot invest directly in an index. |
| 2 | The Morgan Stanley Capital International (MSCI) All Country World Index (ACWI) ex USA Index (Net) is a free-float-adjusted market-capitalization-weighted index that is designed to measure the equity market performance of developed markets, excluding the United States and Canada. Source: MSCI. MSCI makes no express or implied warranties or representations and shall have no liability whatsoever with respect to any MSCI data contained herein. The MSCI data may not be further redistributed or used as a basis for other indexes or any securities or financial products. This report is not approved, reviewed, or produced by MSCI. You cannot invest directly in an index. |
| 3 | The Bloomberg Barclays U.S. Aggregate Bond Index is a broad-based benchmark that measures the investment-grade, U.S. dollar-denominated, fixed-rate taxable bond market, including Treasuries, government-related and corporate securities, mortgage-backed securities (agency fixed-rate and hybrid adjustable-rate mortgage pass-throughs), asset-backed securities, and commercial mortgage-backed securities. You cannot invest directly in an index. |
| 4 | The Bloomberg Barclays Municipal Bond Index is an unmanaged index composed of long-term tax-exempt bonds with a minimum credit rating of Baa. You cannot invest directly in an index. |
| | | | | | |
| Letter to shareholders (unaudited) | | Wells Fargo Discovery Fund | | | 3 | |
developed markets because they benefited from both global economic growth and recent weakening in the U.S. dollar. Stocks in Asia, Europe, and Latin America also outperformed the U.S. market during the quarter.
Globally, stocks marked continued gains through the second quarter of 2017. Steady, albeit modest, economic growth both in the U.S. and abroad and generally favorable corporate earnings announcements supported higher valuations. U.S. inflation trended lower despite a continued decline in the unemployment rate. Ten-year U.S. Treasury yields declined, resulting in stronger prices for long-term bonds. As was widely expected, the Fed raised the target interest rate in June by a quarter percentage point to a range of 1.00% to 1.25%. In addition, the Fed indicated that it would begin to sell bonds accumulated on its balance sheet during quantitative easing programs conducted since 2008. Later in the third quarter, the Fed confirmed that the initiative to reduce the bonds that it holds likely would begin in October.
Volatility increased during the third quarter of 2017.
Early in July and again in August, volatility expectations increased and then receded—as measured by the CBOE VIX5—amid geopolitical tensions, particularly in Asia, and declining investor optimism following unsuccessful efforts to reform health care laws in the U.S. which suggested to some that President Trump and Congress would be unable to move forward with tax and regulatory reforms.
During the quarter, economic momentum increased in Europe; the European Central Bank held its rates steady at low levels and continued its quantitative easing bond-buying program, which is intended to spark economic activity. The Bank of England suggested it could hike interest rates in November, and the pound gained against other currencies. The Bank of Japan also maintained accommodative policies intended to support business activity and economic growth. In Germany, Angela Merkel was reelected chancellor; in Japan, Prime Minister Shinzo Abe called for snap elections as his popularity increased after North Korea’s aggressive program of missile launches. Both political developments were indicative of the type of political consistency in developed markets that reassure financial markets.
In emerging markets, many countries benefited from stronger currencies versus the U.S. dollar. In addition, commodity prices were on an upward trajectory, which benefited many companies that rely on natural resources for exports.
As the quarter closed, optimism returned as economic growth continued. The second-quarter gross domestic product measure was revised higher from 2.6% annualized to 3.0%. Consumer spending and residential and nonresidential investment increased. While inflation continued to trail the Fed’s targets, expectations remained for an additional short-term interest-rate hike before year-end.
| 5 | The Chicago Board Options Exchange Market Volatility Index (CBOE VIX) is a popular measure of the implied volatility of S&P 500 Index options. It represents one measure of the market’s expectation of stock market volatility over the next 30-day period. You cannot invest directly in an index. |
| | | | |
| 4 | | Wells Fargo Discovery Fund | | Letter to shareholders (unaudited) |
Don’t let short-term uncertainty derail long-term investment goals.
Periods of investment uncertainty can present challenges, but experience has taught us that maintaining long-term investment goals can be an effective way to plan for the future. To help you create a sound strategy based on your personal goals and risk tolerance, Wells Fargo Funds offers more than 100 mutual funds spanning a wide range of asset classes and investment styles. Although diversification cannot guarantee an investment profit or prevent losses, we believe it can be an effective way to manage investment risk and potentially smooth out overall portfolio performance. We encourage investors to know their investments and to understand that appropriate levels of risk-taking may unlock opportunities.
Thank you for choosing to invest with Wells Fargo Funds. We appreciate your confidence in us and remain committed to helping you meet your financial needs.
Sincerely,

Andrew Owen
President
Wells Fargo Funds
For further information about your Fund, contact your investment professional, visit our website at wellsfargofunds.com, or call us directly at 1-800-222-8222. We are available 24 hours a day, 7 days a week.
This page is intentionally left blank.
| | | | |
| 6 | | Wells Fargo Discovery Fund | | Performance highlights (unaudited) |
Investment objective
The Fund seeks long-term capital appreciation.
Manager
Wells Fargo Funds Management, LLC
Subadviser
Wells Capital Management Incorporated
Portfolio managers
Michale T. Smith, CFA®
Christopher J. Warner, CFA®
Average annual total returns (%) as of September 30, 20171
| | | | | | | | | | | | | | | | | | | | | | | | | | | | | | | | | | |
| | | | | Including sales charge | | | Excluding sales charge | | | Expense ratios2 (%) | |
| | | Inception date | | 1 year | | | 5 year | | | 10 year | | | 1 year | | | 5 year | | | 10 year | | | Gross | | | Net3 | |
| Class A (WFDAX) | | 7-31-2007 | | | 16.31 | | | | 11.63 | | | | 7.71 | | | | 23.42 | | | | 12.96 | | | | 8.35 | | | | 1.20 | | | | 1.20 | |
| Class C (WDSCX) | | 7-31-2007 | | | 21.51 | | | | 12.11 | | | | 7.53 | | | | 22.51 | | | | 12.11 | | | | 7.53 | | | | 1.95 | | | | 1.95 | |
| Class R6 (WFDRX) | | 6-28-2013 | | | – | | | | – | | | | – | | | | 23.98 | | | | 13.44 | | | | 8.78 | | | | 0.77 | | | | 0.77 | |
| Administrator Class (WFDDX) | | 4-8-2005 | | | – | | | | – | | | | – | | | | 23.52 | | | | 13.08 | | | | 8.48 | | | | 1.12 | | | | 1.12 | |
| Institutional Class (WFDSX) | | 8-31-2006 | | | – | | | | – | | | | – | | | | 23.88 | | | | 13.37 | | | | 8.75 | | | | 0.87 | | | | 0.87 | |
| Russell 2500TM Growth Index4 | | – | | | – | | | | – | | | | – | | | | 20.07 | | | | 14.46 | | | | 8.72 | | | | – | | | | – | |
Figures quoted represent past performance, which is no guarantee of future results, and do not reflect taxes that a shareholder may pay on fund distributions or the redemption of fund shares. Investment return and principal value of an investment will fluctuate so that an investor’s shares, when redeemed, may be worth more or less than their original cost. Performance shown without sales charges would be lower if sales charges were reflected. Current performance may be lower or higher than the performance data quoted, which assumes the reinvestment of dividends and capital gains. Current month-end performance is available on the Fund’s website, wellsfargofunds.com.
Index returns do not include transaction costs associated with buying and selling securities, any mutual fund fees or expenses, or any taxes. It is not possible to invest directly in an index.
For Class A shares, the maximum front-end sales charge is 5.75%. For Class C shares, the maximum contingent deferred sales charge is 1.00%. Performance including a contingent deferred sales charge assumes the sales charge for the corresponding time period. Class R6, Administrator Class, and Institutional Class shares are sold without a front-end sales charge or contingent deferred sales charge.
Stock values fluctuate in response to the activities of individual companies and general market and economic conditions. Smaller-company stocks tend to be more volatile and less liquid than those of larger companies. Certain investment strategies tend to increase the total risk of an investment (relative to the broader market). The Fund is exposed to foreign investment risk. Consult the Fund’s prospectus for additional information on these and other risks.
Please see footnotes on page 7.
| | | | | | |
| Performance highlights (unaudited) | | Wells Fargo Discovery Fund | | | 7 | |
|
| Growth of $10,000 investment as of September 30, 20175 |
|
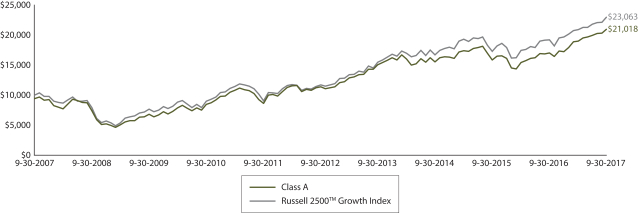 |
| 1 | Historical performance shown for Class R6 shares prior to their inception reflects the performance of Institutional Class shares, and includes the higher expenses applicable to Institutional Class shares. If these expenses had not been included, the returns for Class R6 shares would be higher. |
| 2 | Reflects the expense ratios as stated in the most recent prospectuses. The expense ratios shown are subject to change and may differ from the annualized expense ratios shown in the financial highlights of this report. |
| 3 | The manager has contractually committed through January 31, 2018, to waive fees and/or reimburse expenses to the extent necessary to cap the Fund’s Total Annual Fund Operating Expenses After Fee Waivers at 1.22% for Class A, 1.97% for Class C, 0.84% for Class R6, 1.15% for Administrator Class, and 0.89% for Institutional Class. After this time, the cap may be increased or the commitment to maintain the cap may be terminated only with the approval of the Board of Trustees. Brokerage commissions, stamp duty fees, interest, taxes, acquired fund fees and expenses, and extraordinary expenses are excluded from the expense cap. Without this cap, the Fund’s returns would have been lower. The expense ratio paid by an investor is the net expense ratio or the Fund’s Total Annual Fund Operating Expenses After Fee Waivers, as stated in the prospectuses. |
| 4 | The Russell 2500™ Growth Index measures the performance of those Russell 2500 companies with higher price-to-book ratios and higher forecasted growth values. You cannot invest directly in an index. |
| 5 | The chart compares the performance of Class A shares for the most recent ten years with the Russell 2500™ Growth Index. The chart assumes a hypothetical investment of $10,000 in Class A shares and reflects all operating expenses and assumes the maximum initial sales charge of 5.75%. |
| 6 | The ten largest holdings, excluding cash and cash equivalents, are calculated based on the value of the investments divided by total net assets of the Fund. Holdings are subject to change and may have changed since the date specified. |
| 7 | Amounts are calculated based on the total long-term investments of the Fund. These amounts are subject to change and may have changed since the date specified. |
| | | | |
| 8 | | Wells Fargo Discovery Fund | | Performance highlights (unaudited) |
MANAGER’S DISCUSSION
Fund highlights
| ∎ | | The Fund outperformed its benchmark, the Russell 2500TM Growth Index, for the 12-month period that ended September 30, 2017. |
| ∎ | | Stock selection in the information technology (IT) and health care sectors contributed to performance. |
| ∎ | | Stock selection in the industrials sector detracted from performance. |
Over the 12-month period, the Russell 2500TM Growth Index experienced robust gains; rising optimism for synchronized global growth and expectations for higher interest rates drove the strong returns. Market leadership during the period primarily favored growth-oriented sectors within the benchmark index, which proved beneficial to our positioning.
| | | | |
| Ten largest holdings (%) as of September 30, 20176 | |
Waste Connections Incorporated | | | 3.05 | |
Take-Two Interactive Software Incorporated | | | 2.80 | |
The Brink’s Company | | | 2.23 | |
WEX Incorporated | | | 2.01 | |
Teradyne Incorporated | | | 2.00 | |
BWX Technologies Incorporated | | | 1.99 | |
Vail Resorts Incorporated | | | 1.96 | |
Bright Horizons Family Solutions Incorporated | | | 1.84 | |
Allegion plc | | | 1.83 | |
John Bean Technologies Corporation | | | 1.79 | |
Stock selection benefited the Fund’s relative performance, especially within IT and also within health care.
Within the IT sector, video-game developer and publisher Take-Two Interactive Software, Incorporated, delivered a notable contribution to the Fund’s outperformance. Like many video-game software firms, Take-Two has benefited from rising digital downloads and in-game monetization opportunities. These revenue streams, which tended to carry significantly higher profit margins, increased gross margins meaningfully year over year and helped earnings grow well above the consensus estimate. Also within the IT sector, Fund holding Universal Display Corporation provided strong returns. Demand for the company’s
materials used in the manufacture of organic light-emitting diode (OLED) displays for smartphones continued to surge. OLED displays are being incorporated into an increasing number of new phone models as they are lighter and cheaper and offer more flexibility and power efficiency than legacy phone-display screens. This strong demand led to financial results that were better than the consensus expectations. We continued to maintain a position in Universal Display as of the end of the reporting period and to closely monitor its valuation.
Within the health care sector, stock selection among health care providers contributed to returns—especially VCA Incorporated, which manages animal hospitals and provides pet-care services. VCA agreed to be acquired by Mars, Incorporated, early in 2017 at a substantial premium, which validated our investment thesis. Consistent with our discipline, we exited the position in VCA following the acquisition as shares approached our internal valuation target.
The Fund’s performance was hindered by stock selection in the industrials sector.
Among the Fund’s industrials holdings, exposure to ultralow-cost airline Spirit Airlines, Incorporated, detracted from the Fund’s performance. Our investment thesis for investing in Spirit was predicated on our expectation that the company’s addition of capacity in new markets would allow for market-share gains. We also thought that Spirit could raise prices due to its low-cost advantage and the pricing umbrella that resulted from industry consolidation. Spirit Airlines successfully improved the amount of revenue generated per passenger; however, the industry’s pricing backdrop recently came under more pressure than we expected. We continued to retain a position in Spirit Airlines at the end of the reporting period and to closely monitor the company’s fundamentals.
Please see footnotes on page 7.
| | | | | | |
| Performance highlights (unaudited) | | Wells Fargo Discovery Fund | | | 9 | |
|
| Sector distribution as of September 30, 20177 |
|
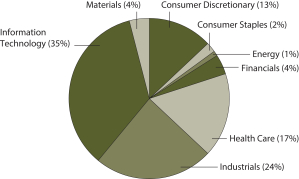
|
We are cautious regarding the broad economic environment but confident in the Fund’s positioning.
As we progress toward 2018, we believe the market backdrop remains mostly constructive, but we have a modestly higher level of caution. For the time being, inflation expectations have overcome deflationary fears. Credit markets have been calm, and capital has been flowing freely at low cost. Weaknesses in areas such as automobiles and mall-based retailers have tended to be offset by strength in domestic industries such as housing, travel and leisure, e-commerce, and digital advertising. In our view, economic indicators likely point to an elongated business cycle marked by steady, if unspectacular, earnings
growth and modestly higher interest rates. The U.S. economy seems poised to potentially continue to expand—but at a more sluggish rate than many people would like to see.
Despite recent improvements, global growth remains below the long-term trend. Our base view is that the economic recovery, which is elongated, likely should continue at a muted pace. Value is created through scarcity, and we seek to invest in companies that have a scarce attribute in the investing world: organic growth. We seek companies that have been benefiting from change—companies with innovations that have been disrupting industries, which in turn has allowed these companies to take market share. The businesses we seek in our assessment have been growing naturally, which means their success has been less reliant on changes in economic growth or in government policies. We seek companies within the stock market that have developed self-sufficiency—a valuable-but-rare trait in a world in which many companies have tended to wait for help from Congress, regulators, or the U.S. Federal Reserve to stimulate their growth.
Please see footnotes on page 7.
| | | | |
| 10 | | Wells Fargo Discovery Fund | | Fund expenses (unaudited) |
As a shareholder of the Fund, you incur two types of costs: (1) transaction costs, including sales charges (loads) on purchase payments and contingent deferred sales charges (if any) on redemptions and (2) ongoing costs, including management fees, distribution (12b-1) and/or shareholder servicing fees, and other Fund expenses. This example is intended to help you understand your ongoing costs (in dollars) of investing in the Fund and to compare these costs with the ongoing costs of investing in other mutual funds.
The example is based on an investment of $1,000 invested at the beginning of the six-month period and held for the entire period from April 1, 2017 to September 30, 2017.
Actual expenses
The “Actual” line of the table below provides information about actual account values and actual expenses. You may use the information in this line, together with the amount you invested, to estimate the expenses that you paid over the period. Simply divide your account value by $1,000 (for example, an $8,600 account value divided by $1,000 = 8.6), then multiply the result by the number in the “Actual” line under the heading entitled “Expenses paid during period” for your applicable class of shares to estimate the expenses you paid on your account during this period.
Hypothetical example for comparison purposes
The “Hypothetical” line of the table below provides information about hypothetical account values and hypothetical expenses based on the Fund’s actual expense ratio and an assumed rate of return of 5% per year before expenses, which is not the Fund’s actual return. The hypothetical account values and expenses may not be used to estimate the actual ending account balance or expenses you paid for the period. You may use this information to compare the ongoing costs of investing in the Fund and other funds. To do so, compare this 5% hypothetical example with the 5% hypothetical examples that appear in the shareholder reports of the other funds.
Please note that the expenses shown in the table are meant to highlight your ongoing costs only and do not reflect any transactional costs, such as sales charges (loads) and contingent deferred sales charges. Therefore, the “Hypothetical” line of the table is useful in comparing ongoing costs only and will not help you determine the relative total costs of owning different funds. In addition, if these transactional costs were included, your costs would have been higher.
| | | | | | | | | | | | | | | | |
| | | Beginning account value 4-1-2017 | | | Ending account value 9-30-2017 | | | Expenses paid during the period¹ | | | Annualized net expense ratio | |
Class A | | | | | | | | | | | | | | | | |
Actual | | $ | 1,000.00 | | | $ | 1,107.16 | | | $ | 6.41 | | | | 1.21 | % |
Hypothetical (5% return before expenses) | | $ | 1,000.00 | | | $ | 1,018.98 | | | $ | 6.15 | | | | 1.21 | % |
Class C | | | | | | | | | | | | | | | | |
Actual | | $ | 1,000.00 | | | $ | 1,102.97 | | | $ | 10.35 | | | | 1.96 | % |
Hypothetical (5% return before expenses) | | $ | 1,000.00 | | | $ | 1,015.22 | | | $ | 9.92 | | | | 1.96 | % |
Class R6 | | | | | | | | | | | | | | | | |
Actual | | $ | 1,000.00 | | | $ | 1,109.75 | | | $ | 4.15 | | | | 0.78 | % |
Hypothetical (5% return before expenses) | | $ | 1,000.00 | | | $ | 1,021.13 | | | $ | 3.98 | | | | 0.78 | % |
Administrator Class | | | | | | | | | | | | | | | | |
Actual | | $ | 1,000.00 | | | $ | 1,107.69 | | | $ | 5.99 | | | | 1.13 | % |
Hypothetical (5% return before expenses) | | $ | 1,000.00 | | | $ | 1,019.38 | | | $ | 5.74 | | | | 1.13 | % |
Institutional Class | | | | | | | | | | | | | | | | |
Actual | | $ | 1,000.00 | | | $ | 1,109.21 | | | $ | 4.67 | | | | 0.88 | % |
Hypothetical (5% return before expenses) | | $ | 1,000.00 | | | $ | 1,020.64 | | | $ | 4.48 | | | | 0.88 | % |
| 1 | Expenses paid is equal to the annualized net expense ratio of each class multiplied by the average account value over the period, multiplied by the number of days in the most recent fiscal half-year divided by the number of days in the fiscal year (to reflect the one-half-year period). |
| | | | | | |
| Portfolio of investments—September 30, 2017 | | Wells Fargo Discovery Fund | | | 11 | |
| | | | | | | | | | | | | | | | |
| Security name | | | | | | | | Shares | | | Value | |
| | | | |
Common Stocks: 96.93% | | | | | | | | | | | | | | | | |
| | | | |
Consumer Discretionary: 12.79% | | | | | | | | | | | | | | | | |
| | | | |
| Diversified Consumer Services: 3.12% | | | | | | | | | | | | | | | | |
Adtalem Global Education Incorporated | | | | | | | | | | | 889,500 | | | $ | 31,888,575 | |
Bright Horizons Family Solutions Incorporated † | | | | | | | | | | | 533,007 | | | | 45,950,533 | |
| | | | |
| | | | | | | | | | | | | | | 77,839,108 | |
| | | | | | | | | | | | | | | | |
| | | | |
| Hotels, Restaurants & Leisure: 6.77% | | | | | | | | | | | | | | | | |
Dave & Buster’s Entertainment Incorporated † | | | | | | | | | | | 455,594 | | | | 23,909,573 | |
Hilton Grand Vacations Incorporated † | | | | | | | | | | | 909,100 | | | | 35,118,533 | |
Six Flags Entertainment Corporation « | | | | | | | | | | | 603,740 | | | | 36,791,916 | |
Vail Resorts Incorporated | | | | | | | | | | | 214,114 | | | | 48,843,686 | |
Wingstop Incorporated « | | | | | | | | | | | 725,225 | | | | 24,113,731 | |
| | | | |
| | | | | | | | | | | | | | | 168,777,439 | |
| | | | | | | | | | | | | | | | |
| | | | |
| Media: 1.24% | | | | | | | | | | | | | | | | |
Cinemark Holdings Incorporated | | | | | | | | | | | 851,805 | | | | 30,843,859 | |
| | | | | | | | | | | | | | | | |
| | | | |
| Specialty Retail: 1.66% | | | | | | | | | | | | | | | | |
Burlington Stores Incorporated † | | | | | | | | | | | 432,565 | | | | 41,292,655 | |
| | | | | | | | | | | | | | | | |
| | | | |
Consumer Staples: 2.10% | | | | | | | | | | | | | | | | |
| | | | |
| Beverages: 2.10% | | | | | | | | | | | | | | | | |
Constellation Brands Incorporated Class A | | | | | | | | | | | 136,157 | | | | 27,156,514 | |
National Beverage Corporation « | | | | | | | | | | | 202,100 | | | | 25,070,505 | |
| | | | |
| | | | | | | | | | | | | | | 52,227,019 | |
| | | | | | | | | | | | | | | | |
| | | | |
Energy: 0.92% | | | | | | | | | | | | | | | | |
| | | | |
| Oil, Gas & Consumable Fuels: 0.92% | | | | | | | | | | | | | | | | |
Diamondback Energy Incorporated † | | | | | | | | | | | 233,865 | | | | 22,909,415 | |
| | | | | | | | | | | | | | | | |
| | | | |
Financials: 3.48% | | | | | | | | | | | | | | | | |
| | | | |
| Capital Markets: 1.29% | | | | | | | | | | | | | | | | |
Raymond James Financial Incorporated | | | | | | | | | | | 381,945 | | | | 32,209,422 | |
| | | | | | | | | | | | | | | | |
| | | | |
| Consumer Finance: 1.32% | | | | | | | | | | | | | | | | |
SLM Corporation † | | | | | | | | | | | 2,852,700 | | | | 32,720,469 | |
| | | | | | | | | | | | | | | | |
| | | | |
| Thrifts & Mortgage Finance: 0.87% | | | | | | | | | | | | | | | | |
Radian Group Incorporated | | | | | | | | | | | 1,161,800 | | | | 21,714,042 | |
| | | | | | | | | | | | | | | | |
| | | | |
Health Care: 16.47% | | | | | | | | | | | | | | | | |
| | | | |
| Biotechnology: 4.47% | | | | | | | | | | | | | | | | |
Array BioPharma Incorporated † | | | | | | | | | | | 1,272,479 | | | | 15,651,492 | |
Bioverativ Incorporated † | | | | | | | | | | | 606,000 | | | | 34,584,420 | |
bluebird bio Incorporated †« | | | | | | | | | | | 92,400 | | | | 12,691,140 | |
Exelixis Incorporated † | | | | | | | | | | | 848,238 | | | | 20,552,807 | |
Ignyta Incorporated † | | | | | | | | | | | 559,000 | | | | 6,903,650 | |
The accompanying notes are an integral part of these financial statements.
| | | | |
| 12 | | Wells Fargo Discovery Fund | | Portfolio of investments—September 30, 2017 |
| | | | | | | | | | | | | | | | |
| Security name | | | | | | | | Shares | | | Value | |
| | | | |
| Biotechnology (continued) | | | | | | | | | | | | | | | | |
Puma Biotechnology Incorporated † | | | | | | | | | | | 19,100 | | | $ | 2,284,298 | |
Tesaro Incorporated †« | | | | | | | | | | | 144,100 | | | | 18,603,310 | |
| | | | |
| | | | | | | | | | | | | | | 111,271,117 | |
| | | | | | | | | | | | | | | | |
| | | | |
| Health Care Equipment & Supplies: 8.21% | | | | | | | | | | | | | | | | |
ABIOMED Incorporated † | | | | | | | | | | | 170,700 | | | | 28,780,020 | |
Cantel Medical Corporation | | | | | | | | | | | 331,913 | | | | 31,256,247 | |
Glaukos Corporation †« | | | | | | | | | | | 518,200 | | | | 17,100,600 | |
Hill-Rom Holdings Incorporated | | | | | | | | | | | 401,770 | | | | 29,730,980 | |
Hologic Incorporated † | | | | | | | | | | | 779,800 | | | | 28,610,862 | |
ICU Medical Incorporated † | | | | | | | | | | | 193,461 | | | | 35,954,727 | |
Insulet Corporation † | | | | | | | | | | | 467,795 | | | | 25,766,149 | |
iRhythm Technologies Incorporated † | | | | | | | | | | | 143,100 | | | | 7,424,028 | |
| | | | |
| | | | | | | | | | | | | | | 204,623,613 | |
| | | | | | | | | | | | | | | | |
| | | | |
| Health Care Providers & Services: 2.94% | | | | | | | | | | | | | | | | |
Amedisys Incorporated † | | | | | | | | | | | 689,052 | | | | 38,559,350 | |
Tivity Health Incorporated † | | | | | | | | | | | 848,869 | | | | 34,633,855 | |
| | | | |
| | | | | | | | | | | | | | | 73,193,205 | |
| | | | | | | | | | | | | | | | |
| | | | |
| Life Sciences Tools & Services: 0.49% | | | | | | | | | | | | | | | | |
Bio-Rad Laboratories Incorporated Class A † | | | | | | | | | | | 55,200 | | | | 12,266,544 | |
| | | | | | | | | | | | | | | | |
| | | | |
| Pharmaceuticals: 0.36% | | | | | | | | | | | | | | | | |
MyoKardia Incorporated † | | | | | | | | | | | 212,245 | | | | 9,094,698 | |
| | | | | | | | | | | | | | | | |
| | | | |
Industrials: 22.83% | | | | | | | | | | | | | | | | |
| | | | |
| Aerospace & Defense: 4.50% | | | | | | | | | | | | | | | | |
Aerojet Rocketdyne Holdings † | | | | | | | | | | | 675,100 | | | | 23,635,251 | |
BWX Technologies Incorporated | | | | | | | | | | | 885,400 | | | | 49,600,108 | |
Mercury Computer Systems Incorporated † | | | | | | | | | | | 751,100 | | | | 38,967,068 | |
| | | | |
| | | | | | | | | | | | | | | 112,202,427 | |
| | | | | | | | | | | | | | | | |
| | | | |
| Airlines: 0.86% | | | | | | | | | | | | | | | | |
Spirit Airlines Incorporated † | | | | | | | | | | | 644,496 | | | | 21,532,611 | |
| | | | | | | | | | | | | | | | |
| | | | |
| Building Products: 4.58% | | | | | | | | | | | | | | | | |
A.O. Smith Corporation | | | | | | | | | | | 590,200 | | | | 35,075,586 | |
Allegion plc | | | | | | | | | | | 527,053 | | | | 45,574,273 | |
Masonite International Corporation † | | | | | | | | | | | 481,660 | | | | 33,330,872 | |
| | | | |
| | | | | | | | | | | | | | | 113,980,731 | |
| | | | | | | | | | | | | | | | |
| | | | |
| Commercial Services & Supplies: 5.39% | | | | | | | | | | | | | | | | |
Aqua Metals Incorporated †« | | | | | | | | | | | 389,400 | | | | 2,667,390 | |
The Brink’s Company | | | | | | | | | | | 659,300 | | | | 55,546,025 | |
Waste Connections Incorporated | | | | | | | | | | | 1,086,729 | | | | 76,027,561 | |
| | | | |
| | | | | | | | | | | | | | | 134,240,976 | |
| | | | | | | | | | | | | | | | |
The accompanying notes are an integral part of these financial statements.
| | | | | | |
| Portfolio of investments—September 30, 2017 | | Wells Fargo Discovery Fund | | | 13 | |
| | | | | | | | | | | | | | | | |
| Security name | | | | | | | | Shares | | | Value | |
| | | | |
| Machinery: 2.99% | | | | | | | | | | | | | | | | |
Colfax Corporation † | | | | | | | | | | | 717,600 | | | $ | 29,880,864 | |
John Bean Technologies Corporation | | | | | | | | | | | 440,901 | | | | 44,575,091 | |
| | | | |
| | | | | | | | | | | | | | | 74,455,955 | |
| | | | | | | | | | | | | | | | |
| | | | |
| Professional Services: 1.77% | | | | | | | | | | | | | | | | |
TransUnion† | | | | | | | | | | | 931,150 | | | | 44,006,149 | |
| | | | | | | | | | | | | | | | |
| | | | |
| Trading Companies & Distributors: 2.74% | | | | | | | | | | | | | | | | |
Siteone Landscape Supply Incorporated † | | | | | | | | | | | 605,143 | | | | 35,158,808 | |
Univar Incorporated † | | | | | | | | | | | 1,147,000 | | | | 33,182,710 | |
| | | | |
| | | | | | | | | | | | | | | 68,341,518 | |
| | | | | | | | | | | | | | | | |
| | | | |
Information Technology: 34.40% | | | | | | | | | | | | | | | | |
| | | | |
| Electronic Equipment, Instruments & Components: 5.23% | | | | | | | | | | | | | | | | |
Littelfuse Incorporated | | | | | | | | | | | 206,624 | | | | 40,473,509 | |
National Instruments Corporation | | | | | | | | | | | 540,900 | | | | 22,809,753 | |
Universal Display Corporation | | | | | | | | | | | 324,735 | | | | 41,842,105 | |
Zebra Technologies Corporation Class A † | | | | | | | | | | | 232,900 | | | | 25,288,282 | |
| | | | |
| | | | | | | | | | | | | | | 130,413,649 | |
| | | | | | | | | | | | | | | | |
| | | | |
| Internet Software & Services: 6.01% | | | | | | | | | | | | | | | | |
2U Incorporated † | | | | | | | | | | | 274,413 | | | | 15,378,105 | |
Box Incorporated Class A † | | | | | | | | | | | 2,051,100 | | | | 39,627,252 | |
Envestnet Incorporated † | | | | | | | | | | | 426,725 | | | | 21,762,975 | |
MercadoLibre Incorporated | | | | | | | | | | | 151,000 | | | | 39,098,430 | |
Yandex NV Class A † | | | | | | | | | | | 1,031,222 | | | | 33,978,764 | |
| | | | |
| | | | | | | | | | | | | | | 149,845,526 | |
| | | | | | | | | | | | | | | | |
| | | | |
| IT Services: 10.33% | | | | | | | | | | | | | | | | |
Acxiom Corporation † | | | | | | | | | | | 1,117,809 | | | | 27,542,814 | |
Black Knight Financial Services Incorporated Class A † | | | | | | | | | | | 626,719 | | | | 26,980,253 | |
EPAM Systems Incorporated † | | | | | | | | | | | 416,879 | | | | 36,656,170 | |
Euronet Worldwide Incorporated † | | | | | | | | | | | 389,972 | | | | 36,965,446 | |
Gartner Incorporated † | | | | | | | | | | | 297,600 | | | | 37,024,416 | |
Total System Services Incorporated | | | | | | | | | | | 643,500 | | | | 42,149,250 | |
WEX Incorporated † | | | | | | | | | | | 447,100 | | | | 50,173,562 | |
| | | | |
| | | | | | | | | | | | | | | 257,491,911 | |
| | | | | | | | | | | | | | | | |
| | | | |
| Semiconductors & Semiconductor Equipment: 3.06% | | | | | | | | | | | | | | | | |
Advanced Micro Devices Incorporated †« | | | | | | | | | | | 2,068,900 | | | | 26,378,475 | |
Teradyne Incorporated | | | | | | | | | | | 1,333,500 | | | | 49,726,215 | |
| | | | |
| | | | | | | | | | | | | | | 76,104,690 | |
| | | | | | | | | | | | | | | | |
| | | | |
| Software: 8.50% | | | | | | | | | | | | | | | | |
Ellie Mae Incorporated † | | | | | | | | | | | 269,400 | | | | 22,125,822 | |
Guidewire Software Incorporated † | | | | | | | | | | | 260,204 | | | | 20,259,483 | |
Proofpoint Incorporated † | | | | | | | | | | | 335,844 | | | | 29,292,314 | |
PTC Incorporated † | | | | | | | | | | | 575,400 | | | | 32,383,512 | |
The accompanying notes are an integral part of these financial statements.
| | | | |
| 14 | | Wells Fargo Discovery Fund | | Portfolio of investments—September 30, 2017 |
| | | | | | | | | | | | | | | | |
| Security name | | | | | | | | Shares | | | Value | |
| | | | |
| Software (continued) | | | | | | | | | | | | | | | | |
Take-Two Interactive Software Incorporated † | | | | | | | | | | | 682,000 | | | $ | 69,720,860 | |
Ultimate Software Group Incorporated † | | | | | | | | | | | 200,300 | | | | 37,976,880 | |
| | | | |
| | | | | | | | | | | | | | | 211,758,871 | |
| | | | | | | | | | | | | | | | |
| | | | |
| Technology Hardware, Storage & Peripherals: 1.27% | | | | | | | | | | | | | | | | |
NCR Corporation † | | | | | | | | | | | 843,900 | | | | 31,663,128 | |
| | | | | | | | | | | | | | | | |
| | | | |
Materials: 3.94% | | | | | | | | | | | | | | | | |
| | | | |
| Chemicals: 0.95% | | | | | | | | | | | | | | | | |
Albemarle Corporation | | | | | | | | | | | 174,700 | | | | 23,813,357 | |
| | | | | | | | | | | | | | | | |
| | | | |
| Construction Materials: 1.21% | | | | | | | | | | | | | | | | |
Vulcan Materials Company | | | | | | | | | | | 251,700 | | | | 30,103,320 | |
| | | | | | | | | | | | | | | | |
| | | | |
| Containers & Packaging: 1.78% | | | | | | | | | | | | | | | | |
Berry Plastics Group Incorporated † | | | | | | | | | | | 782,733 | | | | 44,341,825 | |
| | | | | | | | | | | | | | | | |
| | | | |
Total Common Stocks (Cost $1,871,693,838) | | | | | | | | | | | | | | | 2,415,279,249 | |
| | | | | | | | | | | | | | | | |
| | | | |
| | | Yield | | | | | | | | | | |
| Short-Term Investments: 8.10% | | | | | | | | | | | | | | | | |
| | | | |
| Investment Companies: 8.10% | | | | | | | | | | | | | | | | |
Securities Lending Cash Investment LLC (l)(r)(u) | | | 1.25 | % | | | | | | | 138,258,417 | | | | 138,272,243 | |
Wells Fargo Government Money Market Fund Select Class (l)(u) | | | 0.92 | | | | | | | | 63,484,377 | | | | 63,484,377 | |
| | | | |
Total Short-Term Investments (Cost $201,753,632) | | | | | | | | | | | | | | | 201,756,620 | |
| | | | | | | | | | | | | | | | |
| | | | | | | | |
| Total investments in securities (Cost $2,073,447,470) | | | 105.03 | % | | | 2,617,035,869 | |
Other assets and liabilities, net | | | (5.03 | ) | | | (125,333,181 | ) |
| | | | | | | | |
| Total net assets | | | 100.00 | % | | $ | 2,491,702,688 | |
| | | | | | | | |
| † | Non-income-earning security |
| « | All or a portion of this security is on loan. |
| (l) | The issuer of the security is an affiliated person of the Fund as defined in the Investment Company Act of 1940. |
| (r) | The investment is a non-registered investment company purchased with cash collateral received from securities on loan. |
| (u) | The rate represents the 7-day annualized yield at period end. |
Investments in Affiliates
An affiliated investment is an investment in which the Fund owns at least 5% of the outstanding voting shares of the issuer or as a result of other relationships, such as the Fund and the issuer having the same investment manager. Transactions with issuers that were either affiliated persons of the Fund at the beginning of the period or the end of the period were as follows:
| | | | | | | | | | | | | | | | | | | | | | | | | | | | | | | | | | | | |
| | | Shares, beginning of period | | | Shares purchased | | | Shares sold | | | Shares, end of period | | | Net realized gains | | | Net change in unrealized gains (losses) | | | Income from affiliated securities | | | Value, end of period | | | % of net assets | |
Short-Term Investments | | | | | | | | | | | | | | | | | | | | | | | | | | | | | | | | | | | | |
| | | | | | | | | |
Investment companies | | | | | | | | | | | | | | | | | | | | | | | | | | | | | | | | | | | | |
Securities Lending Cash Investment LLC | | | 53,359,685 | | | | 627,755,886 | | | | 542,857,154 | | | | 138,258,417 | | | $ | 2,330 | | | $ | 2,988 | | | $ | 1,162,143 | | | $ | 138,272,243 | | | | | |
Wells Fargo Government Money Market Fund Select Class | | | 24,767,941 | | | | 917,563,811 | | | | 878,847,375 | | | | 63,484,377 | | | | 0 | | | | 0 | | | | 246,691 | | | | 63,484,377 | | | | | |
| | | | | | | | | | | | | | | | | | | | | | | | | | | | | | | | | | | | |
| | | | | | | | | | | | | | | | | | $ | 2,330 | | | $ | 2,988 | | | $ | 1,408,834 | | | $ | 201,756,620 | | | | 8.10 | % |
| | | | | | | | | | | | | | | | | | | | | | | | | | | | | | | | | | | | |
The accompanying notes are an integral part of these financial statements.
| | | | | | |
| Statement of assets and liabilities—September 30, 2017 | | Wells Fargo Discovery Fund | | | 15 | |
| | | | |
| | | | |
| |
Assets | | | | |
Investments in unaffiliated securities (including $134,885,890 of securities loaned), at value (cost $1,871,693,838) | | $ | 2,415,279,249 | |
Investments in affiliated securities, at value (cost $201,753,632) | | | 201,756,620 | |
Receivable for investments sold | | | 16,398,555 | |
Receivable for Fund shares sold | | | 2,320,325 | |
Receivable for dividends | | | 291,572 | |
Receivable for securities lending income | | | 50,269 | |
| | | | |
Total assets | | | 2,636,096,590 | |
| | | | |
| |
Liabilities | | | | |
Payable upon receipt of securities loaned | | | 138,266,925 | |
Payable for investments purchased | | | 2,284,298 | |
Management fee payable | | | 1,511,485 | |
Payable for Fund shares redeemed | | | 1,476,015 | |
Administration fees payable | | | 284,786 | |
Distribution fee payable | | | 25,215 | |
Trustees’ fees and expenses payable | | | 502 | |
Accrued expenses and other liabilities | | | 544,676 | |
| | | | |
Total liabilities | | | 144,393,902 | |
| | | | |
Total net assets | | $ | 2,491,702,688 | |
| | | | |
| |
NET ASSETS CONSIST OF | | | | |
Paid-in capital | | $ | 1,573,416,369 | |
Accumulated net investment loss | | | (396 | ) |
Accumulated net realized gains on investments | | | 374,698,316 | |
Net unrealized gains on investments | | | 543,588,399 | |
| | | | |
Total net assets | | $ | 2,491,702,688 | |
| | | | |
| |
COMPUTATION OF NET ASSET VALUE AND OFFERING PRICE PER SHARE | | | | |
Net assets – Class A | | $ | 607,318,047 | |
Shares outstanding – Class A1 | | | 16,652,280 | |
Net asset value per share – Class A | | | $36.47 | |
Maximum offering price per share – Class A2 | | | $38.69 | |
Net assets – Class C | | $ | 40,070,212 | |
Shares outstanding – Class C1 | | | 1,214,553 | |
Net asset value per share – Class C | | | $32.99 | |
Net assets – Class R6 | | $ | 351,268,451 | |
Shares outstanding – Class R61 | | | 9,022,511 | |
Net asset value per share – Class R6 | | | $38.93 | |
Net assets – Administrator Class | | $ | 335,897,997 | |
Shares outstanding – Administrator Class1 | | | 8,970,788 | |
Net asset value per share – Administrator Class | | | $37.44 | |
Net assets – Institutional Class | | $ | 1,157,147,981 | |
Shares outstanding – Institutional Class1 | | | 29,827,659 | |
Net asset value per share – Institutional Class | | | $38.79 | |
| 1 | The Fund has an unlimited number of authorized shares. |
| 2 | Maximum offering price is computed as 100/94.25 of net asset value. On investments of $50,000 or more, the offering price is reduced. |
The accompanying notes are an integral part of these financial statements.
| | | | |
| 16 | | Wells Fargo Discovery Fund | | Statement of operations—year ended September 30, 2017 |
| | | | |
| | | | |
| |
Investment income | | | | |
Dividends (net of foreign withholding taxes of $85,780) | | $ | 11,432,445 | |
Securities lending income from affiliates, net | | | 1,162,143 | |
Income from affiliated securities | | | 246,691 | |
| | | | |
Total investment income | | | 12,841,279 | |
| | | | |
| |
Expenses | | | | |
Management fee | | | 18,022,137 | |
Administration fees | |
Class A | | | 1,259,286 | |
Class C | | | 90,232 | |
Class R6 | | | 92,299 | |
Administrator Class | | | 442,987 | |
Institutional Class | | | 1,552,484 | |
Shareholder servicing fees | |
Class A | | | 1,499,150 | |
Class C | | | 107,419 | |
Administrator Class | | | 850,759 | |
Distribution fee | |
Class C | | | 322,257 | |
Custody and accounting fees | | | 150,694 | |
Professional fees | | | 43,276 | |
Registration fees | | | 213,209 | |
Shareholder report expenses | | | 193,284 | |
Trustees’ fees and expenses | | | 21,541 | |
Other fees and expenses | | | 71,769 | |
| | | | |
Total expenses | | | 24,932,783 | |
Less: Fee waivers and/or expense reimbursements | | | (125 | ) |
| | | | |
Net expenses | | | 24,932,658 | |
| | | | |
Net investment loss | | | (12,091,379 | ) |
| | | | |
| |
REALIZED AND UNREALIZED GAINS (LOSSES) ON INVESTMENTS | | | | |
| |
Net realized gains on: | | | | |
Unaffiliated securities | | | 442,261,971 | |
Affiliated securities | | | 2,330 | |
| | | | |
Net realized gains on investments | | | 442,264,301 | |
| | | | |
|
Net change in unrealized gains (losses) on: | |
Unaffiliated securities | | | 90,990,128 | |
Affiiliated securities | | | 2,988 | |
| | | | |
Net change in unrealized gains (losses) on investments | | | 90,993,116 | |
| | | | |
Net realized and unrealized gains (losses) on investments | | | 533,257,417 | |
| | | | |
Net increase in net assets resulting from operations | | $ | 521,166,038 | |
| | | | |
The accompanying notes are an integral part of these financial statements.
| | | | | | |
| Statement of changes in net assets | | Wells Fargo Discovery Fund | | | 17 | |
| | | | | | | | | | | | | | | | |
| | | Year ended September 30, 2017 | | | Year ended September 30, 2016 | |
| | | | |
Operations | | | | | | | | | | | | | | | | |
Net investment loss | | | | | | $ | (12,091,379 | ) | | | | | | $ | (13,341,712 | ) |
Net realized gains (losses) on investments | | | | | | | 442,264,301 | | | | | | | | (6,021,855 | ) |
Net change in unrealized gains (losses) on investments | | | | | | | 90,993,116 | | | | | | | | 207,908,464 | |
| | | | |
Net increase in net assets resulting from operations | | | | | | | 521,166,038 | | | | | | | | 188,544,897 | |
| | | | |
| | | | |
Distributions to shareholders from | | | | | | | | | | | | | | | | |
Net realized gains | | | | | | | | | | | | | | | | |
Class A | | | | | | | (8,136,174 | ) | | | | | | | (67,195,832 | ) |
Class C | | | | | | | (671,858 | ) | | | | | | | (5,778,904 | ) |
Class R6 | | | | | | | (3,804,488 | ) | | | | | | | (23,478,672 | ) |
Administrator Class | | | | | | | (4,526,561 | ) | | | | | | | (47,459,845 | ) |
Institutional Class | | | | | | | (16,230,955 | ) | | | | | | | (114,235,168 | ) |
| | | | |
Total distributions to shareholders | | | | | | | (33,370,036 | ) | | | | | | | (258,148,421 | ) |
| | | | |
| | | | |
Capital share transactions | | | Shares | | | | | | | | Shares | | | | | |
Proceeds from shares sold | | | | | | | | | | | | | | | | |
Class A | | | 1,274,807 | | | | 41,940,957 | | | | 18,576,523 | | | | 573,833,981 | |
Class C | | | 48,882 | | | | 1,447,999 | | | | 85,248 | | | | 2,195,640 | |
Class R6 | | | 1,956,366 | | | | 69,699,870 | | | | 2,705,304 | | | | 81,981,174 | |
Administrator Class | | | 1,012,912 | | | | 34,218,485 | | | | 1,929,217 | | | | 57,133,826 | |
Institutional Class | | | 5,741,288 | | | | 198,618,853 | | | | 5,696,148 | | | | 169,010,558 | |
Investor Class | | | N/A | | | | N/A | | | | 55,579 | 1 | | | 1,728,387 | 1 |
| | | | |
| | | | | | | 345,926,164 | | | | | | | | 885,883,566 | |
| | | | |
Reinvestment of distributions | | | | | | | | | | | | | | | | |
Class A | | | 255,886 | | | | 7,873,622 | | | | 2,330,578 | | | | 65,162,949 | |
Class C | | | 19,199 | | | | 537,750 | | | | 183,951 | | | | 4,722,020 | |
Class R6 | | | 116,203 | | | | 3,804,488 | | | | 793,466 | | | | 23,478,672 | |
Administrator Class | | | 142,683 | | | | 4,504,510 | | | | 1,650,359 | | | | 47,282,773 | |
Institutional Class | | | 471,707 | | | | 15,401,227 | | | | 3,798,743 | | | | 112,214,868 | |
| | | | |
| | | | | | | 32,121,597 | | | | | | | | 252,861,282 | |
| | | | |
Payment for shares redeemed | | | | | | | | | | | | | | | | |
Class A | | | (6,316,847 | ) | | | (202,308,530 | ) | | | (9,136,801 | ) | | | (255,432,871 | ) |
Class C | | | (666,827 | ) | | | (19,445,166 | ) | | | (820,726 | ) | | | (21,433,438 | ) |
Class R6 | | | (2,489,101 | ) | | | (84,079,620 | ) | | | (2,598,689 | ) | | | (77,229,246 | ) |
Administrator Class | | | (5,246,628 | ) | | | (170,695,467 | ) | | | (8,985,182 | ) | | | (255,827,949 | ) |
Institutional Class | | | (17,883,060 | ) | | | (606,158,168 | ) | | | (12,826,340 | ) | | | (384,667,531 | ) |
Investor Class | | | N/A | | | | N/A | | | | (17,797,151 | )1 | | | (549,387,039 | )1 |
| | | | |
| | | | | | | (1,082,686,951 | ) | | | | | | | (1,543,978,074 | ) |
| | | | |
Net decrease in net assets resulting from capital share transactions | | | | | | | (704,639,190 | ) | | | | | | | (405,233,226 | ) |
| | | | |
Total decrease in net assets | | | | | | | (216,843,188 | ) | | | | | | | (474,836,750 | ) |
| | | | |
| | | | |
Net assets | | | | | | | | | | | | | | | | |
Beginning of period | | | | | | | 2,708,545,876 | | | | | | | | 3,183,382,626 | |
| | | | |
End of period | | | | | | $ | 2,491,702,688 | | | | | | | $ | 2,708,545,876 | |
| | | | |
Accumulated net investment loss | | | | | | $ | (396 | ) | | | | | | $ | (9,174,872 | ) |
| | | | |
| 1 | For the period from October 1, 2015 to October 23, 2015. Effective at the close of business on October 23, 2015, Investor Class shares were converted to Class A shares and are no longer offered by the Fund. |
The accompanying notes are an integral part of these financial statements.
| | | | |
| 18 | | Wells Fargo Discovery Fund | | Financial highlights |
(For a share outstanding throughout each period)
| | | | | | | | | | | | | | | | | | | | |
| | | Year ended September 30 | |
| CLASS A | | 2017 | | | 2016 | | | 2015 | | | 2014 | | | 2013 | |
Net asset value, beginning of period | | | $29.94 | | | | $30.48 | | | | $32.35 | | | | $33.50 | | | | $26.89 | |
Net investment loss | | | (0.23 | ) | | | (0.18 | )1 | | | (0.24 | ) | | | (0.30 | ) | | | (0.08 | )1 |
Net realized and unrealized gains (losses) on investments | | | 7.17 | | | | 2.23 | | | | 0.96 | | | | 1.36 | | | | 8.14 | |
| | | | | | | | | | | | | | | | | | | | |
Total from investment operations | | | 6.94 | | | | 2.05 | | | | 0.72 | | | | 1.06 | | | | 8.06 | |
Distributions to shareholders from | | | | | | | | | | | | | | | | | | | | |
Net realized gains | | | (0.41 | ) | | | (2.59 | ) | | | (2.59 | ) | | | (2.21 | ) | | | (1.45 | ) |
Net asset value, end of period | | | $36.47 | | | | $29.94 | | | | $30.48 | | | | $32.35 | | | | $33.50 | |
Total return2 | | | 23.42 | % | | | 7.33 | % | | | 2.09 | % | | | 3.15 | % | | | 31.86 | % |
Ratios to average net assets (annualized) | | | | | | | | | | | | | | | | | | | | |
Gross expenses | | | 1.21 | % | | | 1.20 | % | | | 1.23 | % | | | 1.25 | % | | | 1.27 | % |
Net expenses | | | 1.21 | % | | | 1.20 | % | | | 1.21 | % | | | 1.22 | % | | | 1.22 | % |
Net investment loss | | | (0.70 | )% | | | (0.64 | )% | | | (0.64 | )% | | | (0.95 | )% | | | (0.29 | )% |
Supplemental data | | | | | | | | | | | | | | | | | | | | |
Portfolio turnover rate | | | 73 | % | | | 78 | % | | | 87 | % | | | 84 | % | | | 86 | % |
Net assets, end of period (000s omitted) | | | $607,318 | | | | $641,786 | | | | $294,661 | | | | $335,221 | | | | $239,506 | |
| 1 | Calculated based upon average shares outstanding |
| 2 | Total return calculations do not include any sales charges. |
The accompanying notes are an integral part of these financial statements.
| | | | | | |
| Financial highlights | | Wells Fargo Discovery Fund | | | 19 | |
(For a share outstanding throughout each period)
| | | | | | | | | | | | | | | | | | | | |
| | | Year ended September 30 | |
| CLASS C | | 2017 | | | 2016 | | | 2015 | | | 2014 | | | 2013 | |
Net asset value, beginning of period | | | $27.32 | | | | $28.24 | | | | $30.37 | | | | $31.81 | | | | $25.79 | |
Net investment loss | | | (0.42 | )1 | | | (0.37 | )1 | | | (0.43 | )1 | | | (0.35 | ) | | | (0.30 | )1 |
Net realized and unrealized gains (losses) on investments | | | 6.50 | | | | 2.04 | | | | 0.89 | | | | 1.12 | | | | 7.77 | |
| | | | | | | | | | | | | | | | | | | | |
Total from investment operations | | | 6.08 | | | | 1.67 | | | | 0.46 | | | | 0.77 | | | | 7.47 | |
Distributions to shareholders from | | | | | | | | | | | | | | | | | | | | |
Net realized gains | | | (0.41 | ) | | | (2.59 | ) | | | (2.59 | ) | | | (2.21 | ) | | | (1.45 | ) |
Net asset value, end of period | | | $32.99 | | | | $27.32 | | | | $28.24 | | | | $30.37 | | | | $31.81 | |
Total return2 | | | 22.51 | % | | | 6.51 | % | | | 1.35 | % | | | 2.33 | % | | | 30.89 | % |
Ratios to average net assets (annualized) | | | | | | | | | | | | | | | | | | | | |
Gross expenses | | | 1.96 | % | | | 1.95 | % | | | 1.98 | % | | | 2.00 | % | | | 2.02 | % |
Net expenses | | | 1.96 | % | | | 1.95 | % | | | 1.96 | % | | | 1.97 | % | | | 1.97 | % |
Net investment loss | | | (1.45 | )% | | | (1.41 | )% | | | (1.39 | )% | | | (1.70 | )% | | | (1.08 | )% |
Supplemental data | | | | | | | | | | | | | | | | | | | | |
Portfolio turnover rate | | | 73 | % | | | 78 | % | | | 87 | % | | | 84 | % | | | 86 | % |
Net assets, end of period (000s omitted) | | | $40,070 | | | | $49,538 | | | | $66,772 | | | | $84,585 | | | | $48,768 | |
| 1 | Calculated based upon average shares outstanding |
| 2 | Total return calculations do not include any sales charges. |
The accompanying notes are an integral part of these financial statements.
| | | | |
| 20 | | Wells Fargo Discovery Fund | | Financial highlights |
(For a share outstanding throughout each period)
| | | | | | | | | | | | | | | | | | | | |
| | | Year ended September 30 | |
| CLASS R6 | | 2017 | | | 2016 | | | 2015 | | | 2014 | | | 20131 | |
Net asset value, beginning of period | | | $31.80 | | | | $32.08 | | | | $33.78 | | | | $34.73 | | | | $31.03 | |
Net investment income (loss) | | | (0.08 | ) | | | (0.07 | ) | | | (0.07 | ) | | | (0.17 | ) | | | 0.02 | 2 |
Net realized and unrealized gains (losses) on investments | | | 7.62 | | | | 2.38 | | | | 0.96 | | | | 1.43 | | | | 3.68 | |
| | | | | | | | | | | | | | | | | | | | |
Total from investment operations | | | 7.54 | | | | 2.31 | | | | 0.89 | | | | 1.26 | | | | 3.70 | |
Distributions to shareholders from | | | | | | | | | | | | | | | | | | | | |
Net realized gains | | | (0.41 | ) | | | (2.59 | ) | | | (2.59 | ) | | | (2.21 | ) | | | 0.00 | |
Net asset value, end of period | | | $38.93 | | | | $31.80 | | | | $32.08 | | | | $33.78 | | | | $34.73 | |
Total return3 | | | 23.98 | % | | | 7.77 | % | | | 2.53 | % | | | 3.60 | % | | | 11.96 | % |
Ratios to average net assets (annualized) | | | | | | | | | | | | | | | | | | | | |
Gross expenses | | | 0.78 | % | | | 0.77 | % | | | 0.76 | % | | | 0.77 | % | | | 0.77 | % |
Net expenses | | | 0.78 | % | | | 0.77 | % | | | 0.76 | % | | | 0.77 | % | | | 0.77 | % |
Net investment income (loss) | | | (0.27 | )% | | | (0.22 | )% | | | (0.21 | )% | | | (0.45 | )% | | | 0.30 | % |
Supplemental data | | | | | | | | | | | | | | | | | | | | |
Portfolio turnover rate | | | 73 | % | | | 78 | % | | | 87 | % | | | 84 | % | | | 86 | % |
Net assets, end of period (000s omitted) | | | $351,268 | | | | $300,118 | | | | $273,941 | | | | $221,043 | | | | $28 | |
| 1 | For the period from June 28, 2013 (commencement of class operations) to September 30, 2013 |
| 2 | Calculated based upon average shares outstanding |
| 3 | Returns for periods of less than one year are not annualized. |
The accompanying notes are an integral part of these financial statements.
| | | | | | |
| Financial highlights | | Wells Fargo Discovery Fund | | | 21 | |
(For a share outstanding throughout each period)
| | | | | | | | | | | | | | | | | | | | |
| | | Year ended September 30 | |
| ADMINISTRATOR CLASS | | 2017 | | | 2016 | | | 2015 | | | 2014 | | | 2013 | |
Net asset value, beginning of period | | | $30.70 | | | | $31.17 | | | | $32.99 | | | | $34.08 | | | | $27.30 | |
Net investment loss | | | (0.20 | )1 | | | (0.17 | )1 | | | (0.20 | ) | | | (0.27 | )1 | | | (0.04 | ) |
Net realized and unrealized gains (losses) on investments | | | 7.35 | | | | 2.29 | | | | 0.97 | | | | 1.39 | | | | 8.27 | |
| | | | | | | | | | | | | | | | | | | | |
Total from investment operations | | | 7.15 | | | | 2.12 | | | | 0.77 | | | | 1.12 | | | | 8.23 | |
Distributions to shareholders from | | | | | | | | | | | | | | | | | | | | |
Net realized gains | | | (0.41 | ) | | | (2.59 | ) | | | (2.59 | ) | | | (2.21 | ) | | | (1.45 | ) |
Net asset value, end of period | | | $37.44 | | | | $30.70 | | | | $31.17 | | | | $32.99 | | | | $34.08 | |
Total return | | | 23.52 | % | | | 7.40 | % | | | 2.24 | % | | | 3.25 | % | | | 32.01 | % |
Ratios to average net assets (annualized) | | | | | | | | | | | | | | | | | | | | |
Gross expenses | | | 1.13 | % | | | 1.12 | % | | | 1.09 | % | | | 1.08 | % | | | 1.10 | % |
Net expenses | | | 1.13 | % | | | 1.12 | % | | | 1.09 | % | | | 1.08 | % | | | 1.10 | % |
Net investment loss | | | (0.62 | )% | | | (0.58 | )% | | | (0.52 | )% | | | (0.81 | )% | | | (0.13 | )% |
Supplemental data | | | | | | | | | | | | | | | | | | | | |
Portfolio turnover rate | | | 73 | % | | | 78 | % | | | 87 | % | | | 84 | % | | | 86 | % |
Net assets, end of period (000s omitted) | | | $335,898 | | | | $400,997 | | | | $575,568 | | | | $687,537 | | | | $648,228 | |
| 1 | Calculated based upon average shares outstanding |
The accompanying notes are an integral part of these financial statements.
| | | | |
| 22 | | Wells Fargo Discovery Fund | | Financial highlights |
(For a share outstanding throughout each period)
| | | | | | | | | | | | | | | | | | | | |
| | | Year ended September 30 | |
| INSTITUTIONAL CLASS | | 2017 | | | 2016 | | | 2015 | | | 2014 | | | 2013 | |
Net asset value, beginning of period | | | $31.72 | | | | $32.04 | | | | $33.76 | | | | $34.74 | | | | $27.73 | |
Net investment income (loss) | | | (0.13 | )1 | | | (0.10 | ) | | | (0.09 | ) | | | (0.20 | ) | | | 0.01 | |
Net realized and unrealized gains (losses) on investments | | | 7.61 | | | | 2.37 | | | | 0.96 | | | | 1.43 | | | | 8.45 | |
| | | | | | | | | | | | | | | | | | | | |
Total from investment operations | | | 7.48 | | | | 2.27 | | | | 0.87 | | | | 1.23 | | | | 8.46 | |
Distributions to shareholders from | | | | | | | | | | | | | | | | | | | | |
Net realized gains | | | (0.41 | ) | | | (2.59 | ) | | | (2.59 | ) | | | (2.21 | ) | | | (1.45 | ) |
Net asset value, end of period | | | $38.79 | | | | $31.72 | | | | $32.04 | | | | $33.76 | | | | $34.74 | |
Total return | | | 23.88 | % | | | 7.68 | % | | | 2.47 | % | | | 3.51 | % | | | 32.36 | % |
Ratios to average net assets (annualized) | | | | | | | | | | | | | | | | | | | | |
Gross expenses | | | 0.88 | % | | | 0.87 | % | | | 0.82 | % | | | 0.82 | % | | | 0.84 | % |
Net expenses | | | 0.88 | % | | | 0.87 | % | | | 0.82 | %�� | | | 0.82 | % | | | 0.84 | % |
Net investment income (loss) | | | (0.37 | )% | | | (0.32 | )% | | | (0.26 | )% | | | (0.54 | )% | | | 0.11 | % |
Supplemental data | | | | | | | | | | | | | | | | | | | | |
Portfolio turnover rate | | | 73 | % | | | 78 | % | | | 87 | % | | | 84 | % | | | 86 | % |
Net assets, end of period (000s omitted) | | | $1,157,148 | | | | $1,316,107 | | | | $1,436,125 | | | | $1,396,603 | | | | $988,615 | |
| 1 | Calculated based upon average shares outstanding |
The accompanying notes are an integral part of these financial statements.
| | | | | | |
| Notes to financial statements | | Wells Fargo Discovery Fund | | | 23 | |
1. ORGANIZATION
Wells Fargo Funds Trust (the “Trust”), a Delaware statutory trust organized on March 10, 1999, is an open-end management investment company registered under the Investment Company Act of 1940, as amended (the “1940 Act”). As an investment company, the Trust follows the accounting and reporting guidance in Financial Accounting Standards Board Accounting Standards Codification Topic 946, Financial Services – Investment Companies. These financial statements report on the Wells Fargo Discovery Fund (the “Fund”) which is a diversified series of the Trust.
Effective at the close of business on October 23, 2015, Investor Class shares were converted to Class A shares and are no longer offered by the Fund. Information for Investor Class shares reflected in the financial statements represents activity through October 23, 2015.
2. SIGNIFICANT ACCOUNTING POLICIES
The following significant accounting policies, which are consistently followed in the preparation of the financial statements of the Fund, are in conformity with U.S. generally accepted accounting principles which require management to make estimates and assumptions that affect the reported amounts of assets and liabilities, disclosure of contingent assets and liabilities at the date of the financial statements, and the reported amounts of revenues and expenses during the reporting period. Actual results could differ from those estimates.
Securities valuation
All investments are valued each business day as of the close of regular trading on the New York Stock Exchange (generally 4 p.m. Eastern Time), although the Fund may deviate from this calculation time under unusual or unexpected circumstances.
Equity securities that are listed on a foreign or domestic exchange or market are valued at the official closing price or, if none, the last sales price. If no sale occurs on the principal exchange or market that day, a fair value price will be determined in accordance with the Fund’s Valuation Procedures.
Investments in registered open-end investment companies are valued at net asset value. Interests in non-registered investment companies that are redeemable at net asset value are fair valued normally at net asset value.
Investments which are not valued using any of the methods discussed above are valued at their fair value, as determined in good faith by the Board of Trustees of the Fund. The Board of Trustees has established a Valuation Committee comprised of the Trustees and has delegated to it the authority to take any actions regarding the valuation of portfolio securities that the Valuation Committee deems necessary or appropriate, including determining the fair value of portfolio securities, unless the determination has been delegated to the Management Valuation Team of Wells Fargo Funds Management, LLC (“Funds Management”). The Board of Trustees retains the authority to make or ratify any valuation decisions or approve any changes to the Valuation Procedures as it deems appropriate. On a quarterly basis, the Board of Trustees receives reports on any valuation actions taken by the Valuation Committee or the Management Valuation Team which may include items for ratification.
Valuations of fair valued securities are compared to the next actual sales price when available, or other appropriate market values, to assess the continued appropriateness of the fair valuation methodologies used. These securities are fair valued on a day-to-day basis, taking into consideration changes to appropriate market information and any significant changes to the inputs considered in the valuation process until there is a readily available price provided on an exchange or by an independent pricing service. Valuations received from an independent pricing service or independent broker-dealer quotes are periodically validated by comparisons to most recent trades and valuations provided by other independent pricing services in addition to the review of prices by the manager and/or subadviser. Unobservable inputs used in determining fair valuations are identified based on the type of security, taking into consideration factors utilized by market participants in valuing the investment, knowledge about the issuer and the current market environment.
Security loans
The Fund may lend its securities from time to time in order to earn additional income in the form of fees or interest on securities received as collateral or the investment of any cash received as collateral. The Fund continues to receive interest or dividends on the securities loaned. The Fund receives collateral in the form of cash or securities with a value at least equal to the value of the securities on loan. The value of the loaned securities is determined at the close of each business day and any additional required collateral is delivered to the Fund on the next business day. In a securities lending transaction, the net asset value of the Fund will be affected by an increase or decrease in the value of the securities loaned and by an increase or decrease in the value of the instrument in which collateral is invested. The amount of securities lending activity undertaken by the Fund fluctuates from time to time. In the event of default or bankruptcy
| | | | |
| 24 | | Wells Fargo Discovery Fund | | Notes to financial statements |
by the borrower, the Fund may be prevented from recovering the loaned securities or gaining access to the collateral or may experience delays or costs in doing so. In addition, the investment of any cash collateral received may lose all or part of its value. The Fund has the right under the lending agreement to recover the securities from the borrower on demand.
The Fund lends its securities through an unaffiliated securities lending agent. Cash collateral received in connection with its securities lending transactions is invested in Securities Lending Cash Investments, LLC (the “Securities Lending Fund”). The Securities Lending Fund is exempt from registration under Section 3(c)(7) of the 1940 Act and is managed by Funds Management and is subadvised by Wells Capital Management Incorporated (“WellsCap”), an affiliate of Funds Management and an indirect wholly owned subsidiary of Wells Fargo & Company (“Wells Fargo”). Funds Management receives an advisory fee starting at 0.05% and declining to 0.01% as the average daily net assets of the Securities Lending Fund increase. All of the fees received by Funds Management are paid to WellsCap for its services as subadviser. The Securities Lending Fund seeks to provide a positive return compared to the daily Fed Funds Open Rate by investing in high-quality, U.S. dollar-denominated short-term money market instruments. Securities Lending Fund investments are valued at the evaluated bid price provided by an independent pricing service. Income earned from investment in the Securities Lending Fund is included in securities lending income from affiliates (net of fees and rebates) on the Statement of Operations.
Security transactions and income recognition
Securities transactions are recorded on a trade date basis. Realized gains or losses are recorded on the basis of identified cost.
Dividend income is recognized on the ex-dividend date. Dividend income is recorded net of foreign taxes withheld where recovery of such taxes is not assured.
Distributions to shareholders
Distributions to shareholders from net investment income and net realized gains, if any, are recorded on the ex-dividend date. Such distributions are determined in accordance with income tax regulations and may differ from U.S. generally accepted accounting principles. Dividend sources are estimated at the time of declaration. The tax character of distributions is determined as of the Fund’s fiscal year end. Therefore, a portion of the Fund’s distributions made prior to the Fund’s fiscal year end may be categorized as a tax return of capital.
Federal and other taxes
The Fund intends to continue to qualify as a regulated investment company by distributing substantially all of its investment company taxable and any net realized capital gains (after reduction for capital loss carryforwards) sufficient to relieve it from all, or substantially all, federal income taxes. Accordingly, no provision for federal income taxes was required.
The Fund’s income and federal excise tax returns and all financial records supporting those returns for the prior three fiscal years are subject to examination by the federal and Delaware revenue authorities. Management has analyzed the Fund’s tax positions taken on federal, state, and foreign tax returns for all open tax years and does not believe that there are any uncertain tax positions that require recognition of a tax liability.
As of September 30, 2017, the aggregate cost of all investments for federal income tax purposes was $2,083,400,575 and the unrealized gains (losses) consisted of:
| | | | |
Gross unrealized gains | | $ | 572,781,320 | |
Gross unrealized losses | | | (39,146,026 | ) |
Net unrealized gains | | $ | 533,635,294 | |
Reclassifications are made to the Fund’s capital accounts for permanent tax differences to reflect income and gains available for distribution (or available capital loss carryforwards) under federal income tax regulations. U.S. generally accepted accounting principles require that certain components of net assets be adjusted to reflect permanent differences between financial and tax reporting. These reclassifications have no effect on net assets or net asset values per share. The primary permanent differences causing such reclassifications are due to net operating losses and passive foreign investment companies. At September 30, 2017, as a result of permanent book-to-tax differences, the following reclassification adjustments were made on the Statement of Assets and Liabilities:
| | |
Accumulated net investment loss | | Accumulated net realized gains on investments |
| $21,265,855 | | $(21,265,855) |
| | | | | | |
| Notes to financial statements | | Wells Fargo Discovery Fund | | | 25 | |
Class allocations
The separate classes of shares offered by the Fund differ principally in applicable sales charges, distribution, shareholder servicing, and administration fees. Class specific expenses are charged directly to that share class. Investment income, common expenses, and realized and unrealized gains (losses) on investments are allocated daily to each class of shares based on the relative proportion of net assets of each class.
3. FAIR VALUATION MEASUREMENTS
Fair value measurements of investments are determined within a framework that has established a fair value hierarchy based upon the various data inputs utilized in determining the value of the Fund’s investments. The three-level hierarchy gives the highest priority to unadjusted quoted prices in active markets for identical assets or liabilities (Level 1) and the lowest priority to unobservable inputs (Level 3). The Fund’s investments are classified within the fair value hierarchy based on the lowest level of input that is significant to the fair value measurement. The inputs are summarized into three broad levels as follows:
| ∎ | | Level 1 – quoted prices in active markets for identical securities |
| ∎ | | Level 2 – other significant observable inputs (including quoted prices for similar securities, interest rates, prepayment speeds, credit risk, etc.) |
| ∎ | | Level 3 – significant unobservable inputs (including the Fund’s own assumptions in determining the fair value of investments) |
The inputs or methodologies used for valuing investments in securities are not necessarily an indication of the risk associated with investing in those securities.
The following is a summary of the inputs used in valuing the Fund’s assets and liabilities as of September 30, 2017:
| | | | | | | | | | | | | | | | |
| | | Quoted prices
(Level 1) | | | Other significant
observable inputs
(Level 2) | | | Significant
unobservable inputs (Level 3) | | | Total | |
Assets | | | | | | | | | | | | | | | | |
Investments in: | | | | | | | | | | | | | | | | |
| | | | |
Common stocks | | | | | | | | | | | | | | | | |
Consumer discretionary | | $ | 318,753,061 | | | $ | 0 | | | $ | 0 | | | $ | 318,753,061 | |
Consumer staples | | | 52,227,019 | | | | 0 | | | | 0 | | | | 52,227,019 | |
Energy | | | 22,909,415 | | | | 0 | | | | 0 | | | | 22,909,415 | |
Financials | | | 86,643,933 | | | | 0 | | | | 0 | | | | 86,643,933 | |
Health care | | | 410,449,177 | | | | 0 | | | | 0 | | | | 410,449,177 | |
Industrials | | | 568,760,367 | | | | 0 | | | | 0 | | | | 568,760,367 | |
Information technology | | | 857,277,775 | | | | 0 | | | | 0 | | | | 857,277,775 | |
Materials | | | 98,258,502 | | | | 0 | | | | 0 | | | | 98,258,502 | |
| | | | |
Short-term investments | | | | | | | | | | | | | | | | |
Investment companies | | | 63,484,377 | | | | 0 | | | | 0 | | | | 63,484,377 | |
Investments measured at net asset value* | | | | | | | | | | | | | | | 138,272,243 | |
Total assets | | $ | 2,478,763,626 | | | $ | 0 | | | $ | 0 | | | $ | 2,617,035,869 | |
| * | Investments that are measured at fair value using the net asset value per share (or its equivalent) as a practical expedient have not been categorized in the fair value hierarchy. The fair value amount presented in the table is intended to permit reconciliation of the fair value hierarchy to the amounts presented in the Statement of Assets and Liabilities. The Fund’s investment in Securities Lending Cash Investments, LLC valued at $138,272,243 does not have a redemption period notice, can be redeemed daily and does not have any unfunded commitments. |
The Fund recognizes transfers between levels within the fair value hierarchy at the end of the reporting period. At September 30, 2017, the Fund did not have any transfers into/out of Level 1, Level 2, or Level 3.
4. TRANSACTIONS WITH AFFILIATES AND OTHER EXPENSES
Management fee
Funds Management, an indirect wholly owned subsidiary of Wells Fargo, is the manager of the Fund and provides advisory and fund-level administrative services under an investment management agreement. Under the investment
| | | | |
| 26 | | Wells Fargo Discovery Fund | | Notes to financial statements |
management agreement, Funds Management is responsible for, among other services, implementing the investment objectives and strategies of the Fund, supervising the subadviser, providing fund-level administrative services in connection with the Fund’s operations, and providing any other fund-level administrative services reasonably necessary for the operation of the Fund. As compensation for its services under the investment management agreement, Funds Management is entitled to receive an annual management fee starting at 0.80% and declining to 0.63% as the average daily net assets of the Fund increase. For the year ended September 30, 2017, the management fee was equivalent to an annual rate of 0.73% of the Fund’s average daily net assets.
Funds Management has retained the services of a subadviser to provide daily portfolio management to the Fund. The fee for subadvisory services is borne by Funds Management. WellsCap is the subadviser to the Fund and is entitled to receive a fee from Funds Management at an annual rate starting at 0.45% and declining to 0.35% as the average daily net assets of the Fund increase.
Administration fees
Under a class-level administration agreement, Funds Management provides class-level administrative services to the Fund, which includes paying fees and expenses for services provided by the transfer agent, sub-transfer agents, omnibus account servicers and record-keepers. As compensation for its services under the class-level administration agreement, Funds Management receives an annual fee which is calculated based on the average daily net assets of each class as follows:
| | | | |
| | | Class-level
administration fee | |
Class A, Class C | | | 0.21 | % |
Class R6 | | | 0.03 | |
Administrator Class, Institutional Class | | | 0.13 | |
Funds Management has contractually waived and/or reimbursed management and administration fees to the extent necessary to maintain certain net operating expense ratios for the Fund. Waiver of fees and/or reimbursement of expenses by Funds Management were made first from fund level expenses on a proportionate basis and then from class specific expenses. Funds Management has committed through January 31, 2018 to waive fees and/or reimburse expenses to the extent necessary to cap the Fund’s expenses at 1.22% for Class A shares, 1.97% for Class C shares, 0.84% for Class R6 shares, 1.15% for Administrator Class shares, and 0.89% for Institutional Class shares. After this time, the cap may be increased or the commitment to maintain the cap may be terminated only with the approval of the Board of Trustees.
During the year ended September 30, 2017, State Street Bank and Trust Company (“State Street”), the Fund’s custodian, reimbursed the Fund $ $2,453 for certain out-of-pocket expenses that were billed to the Fund in error from 1998-2015. This amount is included in dividend on the Statement of Operations. In addition, Funds Management was also reimbursed $31,004 by State Street for waivers/reimbursements it made to the Fund to limit Fund expenses during the period the Fund was erroneously billed.
Distribution fee
The Trust has adopted a distribution plan for Class C shares of the Fund pursuant to Rule 12b-1 under the 1940 Act. A distribution fee is charged to Class C shares and paid to Wells Fargo Funds Distributor, LLC (“Funds Distributor”), the principal underwriter, at an annual rate of 0.75% of the average daily net assets of Class C shares.
In addition, Funds Distributor is entitled to receive the front-end sales charge from the purchase of Class A shares and a contingent deferred sales charge on the redemption of certain Class A shares. Funds Distributor is also entitled to receive the contingent deferred sales charges from redemptions of Class C shares. For the year ended September 30, 2017, Funds Distributor received $5,901 from the sale of Class A shares and $52 in contingent deferred sales charges from redemptions of Class C shares. No contingent deferred sales charges were incurred by Class A for the year ended September 30, 2017.
Shareholder servicing fees
The Trust has entered into contracts with one or more shareholder servicing agents, whereby Class A, Class C, and Administrator Class of the Fund are charged a fee at an annual rate of 0.25% of the average daily net assets of each respective class.
A portion of these total shareholder servicing fees were paid to affiliates of Wells Fargo.
| | | | | | |
| Notes to financial statements | | Wells Fargo Discovery Fund | | | 27 | |
Interfund transactions
The Fund may purchase or sell portfolio investment securities to certain other Wells Fargo affiliates pursuant to Rule 17a-7 of the 1940 Act and under procedures adopted by the Board of Trustees. The procedures have been designed to ensure that these interfund transactions, which do not incur broker commissions, are effected at current market prices.
5. INVESTMENT PORTFOLIO TRANSACTIONS
Purchases and sales of investments, excluding U.S. government obligations (if any) and short-term securities, for the year ended September 30, 2017 were $1,794,179,236 and $2,604,950,314, respectively.
6. BANK BORROWINGS
The Trust (excluding the money market funds and certain other funds) and Wells Fargo Variable Trust are parties to a $280,000,000 revolving credit agreement whereby the Fund is permitted to use bank borrowings for temporary or emergency purposes, such as to fund shareholder redemption requests. Interest under the credit agreement is charged to the Fund based on a borrowing rate equal to the higher of the Federal Funds rate in effect on that day plus 1.25% or the overnight LIBOR rate in effect on that day plus 1.25%. In addition, an annual commitment fee equal to 0.25% of the unused balance is allocated to each participating fund. Prior to August 29, 2017, the revolving credit agreement amount was $250,000,000.
For the year ended September 30, 2017, there were no borrowings by the Fund under the agreement.
7. DISTRIBUTIONS TO SHAREHOLDERS
The tax character of distributions paid was $33,370,036 and $258,148,421 of long-term capital gain for the years ended September 30, 2017 and September 30,2016, respectively.
As of September 30, 2017, the components of distributable earnings on a tax basis were as follows:
| | | | |
Undistributed ordinary income | | Undistributed long-term gain | | Unrealized gains |
| $60,678,879 | | $323,972,542 | | $533,635,294 |
8. CONCENTRATION RISK
Concentration risks result from exposure to a limited number of sectors. A fund that invests a substantial portion of its assets in any sector may be more affected by changes in that sector than would be a fund whose investments are not heavily weighted in any sector.
9. INDEMNIFICATION
Under the Trust’s organizational documents, the officers and Trustees have been granted certain indemnification rights against certain liabilities that may arise out of performance of their duties to the Trust. Additionally, in the normal course of business, the Trust may enter into contracts with service providers that contain a variety of indemnification clauses. The Trust’s maximum exposure under these arrangements is dependent on future claims that may be made against the Fund and, therefore, cannot be estimated.
| | | | |
| 28 | | Wells Fargo Discovery Fund | | Report of independent registered public accounting firm |
BOARD OF TRUSTEES AND SHAREHOLDERS OF WELLS FARGO FUNDS TRUST:
We have audited the accompanying statement of assets and liabilities, including the portfolio of investments, of the Wells Fargo Discovery Fund (the “Fund”), one of the funds constituting the Wells Fargo Funds Trust, as of September 30, 2017, and the related statement of operations for the year then ended, the statements of changes in net assets for each of the years in the two-year period then ended, and the financial highlights for each of the years or periods in the five-year period then ended. These financial statements and financial highlights are the responsibility of the Fund’s management. Our responsibility is to express an opinion on these financial statements and financial highlights based on our audits.
We conducted our audits in accordance with the standards of the Public Company Accounting Oversight Board (United States). Those standards require that we plan and perform the audit to obtain reasonable assurance about whether the financial statements and financial highlights are free of material misstatement. An audit includes examining, on a test basis, evidence supporting the amounts and disclosures in the financial statements. Our procedures included confirmation of securities owned as of September 30, 2017, by correspondence with the custodian and brokers, or by other appropriate auditing procedures. An audit also includes assessing the accounting principles used and significant estimates made by management, as well as evaluating the overall financial statement presentation. We believe that our audits provide a reasonable basis for our opinion.
In our opinion, the financial statements and financial highlights referred to above present fairly, in all material respects, the financial position of the Wells Fargo Discovery Fund as of September 30, 2017, the results of its operations for the year then ended, the changes in its net assets for each of the years in the two-year period then ended, and the financial highlights for each of the years or periods in the five-year period then ended, in conformity with U.S. generally accepted accounting principles.

Boston, Massachusetts
November 22, 2017
| | | | | | |
| Other information (unaudited) | | Wells Fargo Discovery Fund | | | 29 | |
TAX INFORMATION
Pursuant to Section 852 of the Internal Revenue Code, $33,370,036 was designated as a 20% rate gain distribution for the fiscal year ended September 30, 2017.
PROXY VOTING INFORMATION
A description of the policies and procedures that the Fund uses to determine how to vote proxies relating to portfolio securities is available, upon request, by calling 1-800-222-8222, visiting our website at wellsfargofunds.com, or visiting the SEC website at sec.gov. Information regarding how the Fund voted proxies relating to portfolio securities during the most recent 12-month period ended June 30 is available on the Fund’s website at wellsfargofunds.com or by visiting the SEC website at sec.gov.
PORTFOLIO HOLDINGS INFORMATION
The complete portfolio holdings for the Fund are publicly available monthly on the Fund’s website (wellsfargofunds.com), on a one-month delayed basis. In addition, top ten holdings information (excluding derivative positions) for the Fund is publicly available on the Fund’s website on a monthly, seven-day or more delayed basis. The Fund files its complete schedule of portfolio holdings with the SEC for the first and third quarters of each fiscal year on Form N-Q, which is available by visiting the SEC website at sec.gov. In addition, the Fund’s Form N-Q may be reviewed and copied at the SEC’s Public Reference Room in Washington, DC, and at regional offices in New York City, at 233 Broadway, and in Chicago, at 175 West Jackson Boulevard, Suite 900. Information about the Public Reference Room may be obtained by calling 1-800-SEC-0330.
| | | | |
| 30 | | Wells Fargo Discovery Fund | | Other information (unaudited) |
BOARD OF TRUSTEES AND OFFICERS
Each of the Trustees and Officers1 listed in the table below acts in identical capacities for each fund in the Wells Fargo family of funds, which consists of 152 mutual funds comprising the Wells Fargo Funds Trust, Wells Fargo Variable Trust, Wells Fargo Master Trust and four closed-end funds (collectively the “Fund Complex”). This table should be read in conjunction with the Prospectus and the Statement of Additional Information2. The mailing address of each Trustee and Officer is 525 Market Street, 12th Floor, San Francisco, CA 94105. Each Trustee and Officer serves an indefinite term, however, each Trustee serves such term until reaching the mandatory retirement age established by the Trustees.
Independent Trustees
| | | | | | |
Name and
year of birth | | Position held and
length of service* | | Principal occupations during past five years or longer | | Current other
public company or
investment company
directorships |
| William R. Ebsworth (Born 1957) | | Trustee, since 2015 | | Retired. From 1984 to 2013, equities analyst, portfolio manager, research director and chief investment officer at Fidelity Management and Research Company in Boston, Tokyo, and Hong Kong and retired in 2013 as Chief Investment Officer of Fidelity Strategic Advisers, Inc. where he led a team of investment professionals managing client assets. Prior thereto, Board member of Hong Kong Securities Clearing Co., Hong Kong Options Clearing Corp., the Thailand International Fund, Ltd., Fidelity Investments Life Insurance Company, and Empire Fidelity Investments Life Insurance Company. Board member of the Forté Foundation (non-profit organization) and the Vincent Memorial Hospital Endowment (non-profit organization), where he serves on the Investment Committee and as a Chair of the Audit Committee. Mr. Ebsworth is a CFA® charterholder. | | Asset Allocation Trust |
| Jane A. Freeman (Born 1953) | | Trustee, since 2015 | | Retired. From 2012 to 2014 and 1999 to 2008, Chief Financial Officer of Scientific Learning Corporation. From 2008 to 2012, Ms. Freeman provided consulting services related to strategic business projects. Prior to 1999, Portfolio Manager at Rockefeller & Co. and Scudder, Stevens & Clark. Board member of the Harding Loevner Funds from 1996 to 2014, serving as both Lead Independent Director and chair of the Audit Committee. Board member of the Russell Exchange Traded Funds Trust from 2011 to 2012 and the chair of the Audit Committee. Ms. Freeman is a Board Member of Ruth Bancroft Garden (non-profit organization) and an inactive chartered financial analyst. | | Asset Allocation Trust |
Peter G. Gordon**
(Born 1942) | | Trustee, since 1998; Chairman, since 2005 | | Co-Founder, Retired Chairman, President and CEO of Crystal Geyser Water Company. Trustee Emeritus, Colby College. | | Asset Allocation Trust |
Isaiah Harris, Jr. (Born 1952) | | Trustee, since 2009 | | Retired. Chairman of the Board of CIGNA Corporation since 2009, and Director since 2005. From 2003 to 2011, Director of Deluxe Corporation. Prior thereto, President and CEO of BellSouth Advertising and Publishing Corp. from 2005 to 2007, President and CEO of BellSouth Enterprises from 2004 to 2005 and President of BellSouth Consumer Services from 2000 to 2003. Emeritus member of the Iowa State University Foundation Board of Governors. Emeritus Member of the Advisory Board of Iowa State University School of Business. Advisory Board Member, Palm Harbor Academy (charter school). Advisory Board Member, Child Evangelism Fellowship (non-profit). Mr. Harris is a certified public accountant (inactive status). | | CIGNA Corporation; Asset Allocation Trust |
Judith M. Johnson
(Born 1949) | | Trustee, since 2008; Audit Committee Chairman, since 2008 | | Retired. Prior thereto, Chief Executive Officer and Chief Investment Officer of Minneapolis Employees Retirement Fund from 1996 to 2008. Ms. Johnson is an attorney, certified public accountant and a certified managerial accountant. | | Asset Allocation Trust |
David F. Larcker (Born 1950) | | Trustee, since 2009 | | James Irvin Miller Professor of Accounting at the Graduate School of Business, Stanford University, Director of the Corporate Governance Research Initiative and Senior Faculty of The Rock Center for Corporate Governance since 2006. From 2005 to 2008, Professor of Accounting at the Graduate School of Business, Stanford University. Prior thereto, Ernst & Young Professor of Accounting at The Wharton School, University of Pennsylvania from 1985 to 2005. | | Asset Allocation Trust |
| | | | | | |
| Other information (unaudited) | | Wells Fargo Discovery Fund | | | 31 | |
| | | | | | |
Name and
year of birth | | Position held and
length of service* | | Principal occupations during past five years or longer | | Current other
public company or
investment company
directorships |
Olivia S. Mitchell (Born 1953) | | Trustee, since 2006 | | International Foundation of Employee Benefit Plans Professor, Wharton School of the University of Pennsylvania since 1993. Director of Wharton’s Pension Research Council and Boettner Center on Pensions & Retirement Research, and Research Associate at the National Bureau of Economic Research. Previously, Cornell University Professor from 1978 to 1993. | | Asset Allocation Trust |
Timothy J. Penny (Born 1951) | | Trustee, since 1996: Vice Chairman,
since 2017 | | President and Chief Executive Officer of Southern Minnesota Initiative Foundation, a non-profit organization, since 2007 and Senior Fellow at the Humphrey Institute Policy Forum at the University of Minnesota since 1995. Member of the Board of Trustees of NorthStar Education Finance, Inc., a non-profit organization, since 2007. | | Asset Allocation Trust |
Michael S. Scofield (Born 1943) | | Trustee, since 2010 | | Served on the Investment Company Institute’s Board of Governors and Executive Committee from 2008-2011 as well the Governing Council of the Independent Directors Council from 2006-2011 and the Independent Directors Council Executive Committee from 2008-2011. Chairman of the IDC from 2008-2010. Trustee of the Evergreen Funds complex (and its predecessors) from 1984 to 2010. Chairman of the Evergreen Funds from 2000-2010. Former Trustee of the Mentor Funds. Retired Attorney, Law Offices of Michael S. Scofield. | | Asset Allocation Trust |
| * | Length of service dates reflect the Trustee’s commencement of service with the Trust’s predecessor entities, where applicable. |
| ** | Peter Gordon is expected to retire on December 31, 2017. |
Advisory Board Members
| | | | | | |
Name and
year of birth | | Position held and
length of service | | Principal occupations during past five years or longer | | Current other
public company or
investment company
directorships |
James G. Polisson (Born 1959) | | Advisory Board Member, since 2017 | | Retired. Chief Marketing Officer, Source (ETF) UK Services, Ltd, from 2015 to 2017. From 2012 to 2015, Principal of The Polisson Group, LLC, a management consulting, corporate advisory and principal investing company. Chief Executive Officer and Managing Director at Russell Investments, Global Exchange Traded Funds from 2010 to 2012. Managing Director of Barclays Global Investors from 1998 to 2010 and Global Chief Marketing Officer for iShares and Barclays Global Investors from 2000 to 2010. Prior thereto, Vice President, Fidelity Retail Mutual Fund Group from 1996 to 1998 and Risk Management Practice Manager, Fidelity Consulting from 1995 to 1996. Board member of the Russell Exchange Traded Fund Trust from 2011 to 2012. Director of Barclays Global Investors Holdings Deutschland GmbH from 2006 to 2009. Mr. Polisson is an attorney and has a retired status with the Massachusetts and District of Columbia Bar Associations. | | None |
Pamela Wheelock (Born 1959) | | Advisory Board Member, since 2017 | | Chief Operating Officer, Twin Cities Habitat for Humanity, since January, 2017. Vice President of University Services, University of Minnesota from 2012 to 2017. Prior thereto, Interim President and Chief Executive Officer of Blue Cross Blue Shield of Minnesota from 2010 to 2011, Chairman of the Board from 2009 to 2011 and Board Director from 2003 to 2015. Vice President, Leadership and Community Engagement, Bush Foundation, Saint Paul, Minnesota (a private foundation) from 2009 to 2011. Executive Vice President and Chief Financial Officer, Minnesota Sports and Entertainment from 2004 to 2009 and Senior Vice President from 2002 to 2004. Commissioner of Finance, State of Minnesota, from 1999 to 2002. Currently on the Board of Directors, Governance Committee and Finance Committee, for the Minnesota Philanthropy Partners (Saint Paul Foundation) since 2012 and Board Chair of the Minnesota Wild Foundation since 2010. | | None |
| | | | |
| 32 | | Wells Fargo Discovery Fund | | Other information (unaudited) |
Officers
| | | | | | |
Name and
year of birth | | Position held and length of service | | Principal occupations during past five years or longer | | |
Andrew Owen (Born 1960) | | President, since 2017 | | Executive Vice President of Wells Fargo & Company and Head of Affiliated Managers, Wells Fargo Asset Management, since 2014. In addition, Mr. Owen is currently President, Chief Executive Officer and Director of Wells Fargo Funds Management, LLC since 2017. Prior thereto, Executive Vice President responsible for marketing, investments and product development for Wells Fargo Funds Management, LLC, from 2009 to 2014. | | |
Nancy Wiser1 (Born 1967) | | Treasurer, since 2012 | | Executive Vice President of Wells Fargo Funds Management, LLC since 2011. Chief Operating Officer and Chief Compliance Officer at LightBox Capital Management LLC, from 2008 to 2011. | | |
C. David Messman (Born 1960) | | Secretary, since 2000; Chief Legal Officer, since 2003 | | Senior Vice President and Secretary of Wells Fargo Funds Management, LLC since 2001. Assistant General Counsel of Wells Fargo Bank, N.A. since 2013 and Vice President and Managing Counsel of Wells Fargo Bank, N.A. from 1996 to 2013. | | |
Michael H. Whitaker (Born 1967) | | Chief Compliance Officer, since 2016 | | Senior Vice President and Chief Compliance Officer since 2016. Senior Vice President and Chief Compliance Officer for Fidelity Investments from 2007 to 2016. | | |
David Berardi (Born 1975) | | Assistant Treasurer, since 2009 | | Vice President of Wells Fargo Funds Management, LLC since 2009. Vice President of Evergreen Investment Management Company, LLC from 2008 to 2010. Manager of Fund Reporting and Control for Evergreen Investment Management Company, LLC from 2004 to 2010. | | |
Jeremy DePalma1 (Born 1974) | | Assistant Treasurer, since 2009 | | Senior Vice President of Wells Fargo Funds Management, LLC since 2009. Senior Vice President of Evergreen Investment Management Company, LLC from 2008 to 2010 and head of the Fund Reporting and Control Team within Fund Administration from 2005 to 2010. | | |
| 1 | Nancy Wiser acts as Treasurer of 76 funds in the Fund Complex. Jeremy DePalma acts as Treasurer of 76 funds and Assistant Treasurer of 76 funds in the Fund Complex. |
| 2 | The Statement of Additional Information includes additional information about the Trustees and is available, without charge, upon request, by calling 1-800-222-8222 or by visiting the website at wellsfargofunds.com. |
| | | | | | |
| Other information (unaudited) | | Wells Fargo Discovery Fund | | | 33 | |
BOARD CONSIDERATION OF INVESTMENT MANAGEMENT AND SUB-ADVISORY AGREEMENTS:
Under the Investment Company Act of 1940 (the “1940 Act”), the Board of Trustees (the “Board”) of Wells Fargo Funds Trust (the “Trust”) must determine annually whether to approve the continuation of the Trust’s investment management and sub-advisory agreements. In this regard, at an in-person meeting held on May 16-17, 2017 (the “Meeting”), the Board, all the members of which have no direct or indirect interest in the investment management and sub-advisory agreements and are not “interested persons” of the Trust, as defined in the 1940 Act (the “Independent Trustees”), reviewed and approved for Wells Fargo Discovery Fund (the “Fund”): (i) an investment management agreement (the “Management Agreement”) with Wells Fargo Funds Management, LLC (“Funds Management”); and (ii) an investment sub-advisory agreement (the “Sub-Advisory Agreement”) with Wells Capital Management Incorporated (the “Sub-Adviser”), an affiliate of Funds Management. The Management Agreement and the Sub-Advisory Agreement are collectively referred to as the “Advisory Agreements.”
At the Meeting, the Board considered the factors and reached the conclusions described below relating to the selection of Funds Management and the Sub-Adviser and the approval of the Advisory Agreements. Prior to the Meeting, including at an in-person meeting in April 2017, the Trustees conferred extensively among themselves and with representatives of Funds Management about these matters. Also, the Board has adopted a team-based approach, with each team consisting of a sub-set of Trustees, to assist the full Board in the discharge of its duties in reviewing performance and other matters throughout the year. The Independent Trustees were assisted in their evaluation of the Advisory Agreements by independent legal counsel, from whom they received separate legal advice and with whom they met separately.
In providing information to the Board, Funds Management and the Sub-Adviser were guided by a detailed set of requests for information submitted to them by independent legal counsel on behalf of the Independent Trustees at the start of the Board’s annual contract renewal process earlier in 2017. In considering and approving the Advisory Agreements, the Trustees considered the information they believed relevant, including but not limited to the information discussed below. The Board considered not only the specific information presented in connection with the Meeting, but also the knowledge gained over time through interaction with Funds Management and the Sub-Adviser about various topics. In this regard, the Board reviewed reports of Funds Management at each of its quarterly meetings, which included, among other things, portfolio reviews and performance reports. In addition, the Board and the teams mentioned above confer with portfolio managers at various times throughout the year. The Board did not identify any particular information or consideration that was all-important or controlling, and each individual Trustee may have attributed different weights to various factors.
After its deliberations, the Board unanimously approved the continuation of the Advisory Agreements for a one-year term and determined that the compensation payable to Funds Management and the Sub-Adviser under each of the Advisory Agreements was reasonable. The Board considered the approval of the Advisory Agreements for the Fund as part of its consideration of agreements for funds across the complex, but its approvals were made on a fund-by-fund basis. The following summarizes a number of important, but not necessarily all, factors considered by the Board in support of its approvals.
Nature, extent and quality of services
The Board received and considered various information regarding the nature, extent and quality of services provided to the Fund by Funds Management and the Sub-Adviser under the Advisory Agreements. This information included a description of the investment advisory services and Fund-level administrative services covered by the Management Agreement, as well as, among other things, a summary of the background and experience of senior management of Funds Management, a summary of certain organizational and personnel changes involving Funds Management and the Sub-Adviser, and a description of Funds Management’s and the Sub-Adviser’s business continuity planning programs and of their approaches to data privacy and cybersecurity. The Board also considered the qualifications, background, tenure and responsibilities of each of the portfolio managers primarily responsible for the day-to-day portfolio management of the Fund.
The Board evaluated the ability of Funds Management and the Sub-Adviser to attract and retain qualified investment professionals, including research, advisory and supervisory personnel. The Board further considered the compliance programs and compliance records of Funds Management and the Sub-Adviser. In addition, the Board took into account the full range of services provided to the Fund by Funds Management and its affiliates.
| | | | |
| 34 | | Wells Fargo Discovery Fund | | Other information (unaudited) |
Fund performance and expenses
The Board considered the investment performance results for the Fund over various time periods ended December 31, 2016. In certain cases, the Board also considered more current results for various time periods ended March 31, 2017. The Board considered these results in comparison to the performance of funds in a universe that was determined by Broadridge Inc. (“Broadridge”) to be similar to the Fund (the “Universe”), and in comparison to the Fund’s benchmark index and to other comparative data. Broadridge is an independent provider of investment company data. The Board received a description of the methodology used by Broadridge to select the mutual funds in the performance Universe. The Board noted that the performance of the Fund (Administrator Class) was higher than the average performance of the Universe for the one-, five- and ten-year periods ended December 31, 2016, but lower than the average performance of the Universe for the three-year period ended December 31, 2016. However, the Board noted that the performance ranking of the Fund in the Universe had improved from the prior quarter-end for the one-, three and five-year periods ended March 31, 2017. The Board also noted that the performance of the Fund was lower than its benchmark, the Russell 2500TM Growth Index, for the one-, three- and five-year periods ended December 31, 2016, but higher than its index for the ten-year period ended December 31, 2016.
The Board received information concerning, and discussed factors contributing to, the underperformance of the Fund relative to the Universe and benchmark for the periods identified above. The Board took note of the explanations for the relative underperformance during these periods, including with respect to investment decisions and market factors that affected the Fund’s performance. The Board also noted that the Fund experienced a portfolio manager change during the third quarter of 2016.
The Board also received and considered information regarding the Fund’s net operating expense ratios and their various components, including actual management fees, custodian and other non-management fees, and Rule 12b-1 and non-Rule 12b-1 shareholder service fees. The Board considered these ratios in comparison to the median ratios of funds in class-specific expense groups that were determined by Broadridge to be similar to the Fund (the “Groups”). The Board received a description of the methodology used by Broadridge to select the mutual funds in the expense Groups and an explanation of how funds comprising expense groups and their expense ratios may vary from year-to-year. Based on the Broadridge reports, the Board noted that the net operating expense ratios of the Fund were lower than or equal to the median net operating expense ratios of the expense Groups for all share classes.
The Board took into account the Fund performance and expense information provided to it among the factors considered in deciding to re-approve the Advisory Agreements.
Investment management and sub-advisory fee rates
The Board reviewed and considered the contractual fee rates payable by the Fund to Funds Management under the Management Agreement, as well as the contractual fee rates payable by the Fund to Funds Management for class-level administrative services under a Class-Level Administration Agreement, which include, among other things, class-level transfer agency and sub-transfer agency costs (collectively, the “Management Rates”). The Board also reviewed and considered the contractual investment sub-advisory fee rates that are payable by Funds Management to the Sub-Adviser for investment sub-advisory services.
Among other information reviewed by the Board was a comparison of the Fund’s Management Rates with the average contractual investment management fee rates of funds in the expense Groups at a common asset level as well as transfer agency costs of the funds in the expense Groups. The Board noted that the Management Rates of the Fund were lower than, equal to or in range of the sum of these average rates for the Fund’s expense Groups for all share classes.
The Board also received and considered information about the portion of the total management fee that was retained by Funds Management after payment of the fee to the Sub-Adviser for sub-advisory services. In assessing the reasonableness of this amount, the Board received and evaluated information about the nature and extent of responsibilities retained and risks assumed by Funds Management and not delegated to or assumed by the Sub-Adviser, and about Funds Management’s on-going oversight services. Given the affiliation between Funds Management and the Sub-Adviser, the Board ascribed limited relevance to the allocation of fees between them.
The Board also received and considered information about the nature and extent of services offered and fee rates charged by Funds Management and the Sub-Adviser to other types of clients with investment strategies similar to those of the Fund. In this regard, the Board received information about the significantly greater scope of services, and compliance, reporting and other legal burdens and risks of managing mutual funds compared with those associated with managing assets of non-mutual fund clients such as institutional separate accounts.
| | | | | | |
| Other information (unaudited) | | Wells Fargo Discovery Fund | | | 35 | |
Based on its consideration of the factors and information it deemed relevant, including those described here, the Board determined that the compensation payable to Funds Management under the Management Agreement and to the Sub-Adviser under the Sub-Advisory Agreement was reasonable.
Profitability
The Board received and considered information concerning the profitability of Funds Management, as well as the profitability of Wells Fargo as a whole, from providing services to the Fund and the fund family as a whole. The Board also received and considered information concerning the profitability of the Sub-Adviser from providing services to the fund family as a whole, noting that the Sub-Adviser’s profitability information with respect to providing services to the Fund was subsumed in the Wells Fargo and Funds Management profitability analysis.
Funds Management reported on the methodologies and estimates used in calculating profitability, including a description of the methodology used to allocate certain expenses. Among other things, the Board noted that the levels of profitability reported on a fund-by-fund basis varied widely, depending on factors such as the size and type of fund. Based on its review, the Board did not deem the profits reported by Funds Management or Wells Fargo from its services to the Fund to be at a level that would prevent it from approving the continuation of the Advisory Agreements.
Economies of scale
With respect to possible economies of scale, the Board noted the existence of breakpoints in the Fund’s management fee structure, which operate generally to reduce the Fund’s expense ratios as the Fund grows in size. It considered that, for a small fund or a fund that shrinks in size, breakpoints conversely can result in higher fee levels. The Board also considered that in addition to management fee breakpoints, competitive management fee rates set at the outset without regard to breakpoints and fee waiver and expense reimbursement arrangements are means of sharing potential economies of scale with shareholders of the Fund. The Board considered Funds Management’s view, which Funds Management indicated was supported by independent third-party industry studies which were summarized for the Board, that any analyses of potential economies of scale in managing a particular fund are inherently limited in light of the joint and common costs and investments that Funds Management incurs across the fund family as a whole.
The Board concluded that the Fund’s fee and expense arrangements, including contractual breakpoints, constituted a reasonable approach to sharing potential economies of scale with the Fund and its shareholders.
Other benefits to Funds Management and the Sub-Adviser
The Board received and considered information regarding potential “fall-out” or ancillary benefits received by Funds Management and its affiliates, including the Sub-Adviser, as a result of their relationships with the Fund. Ancillary benefits could include, among others, benefits directly attributable to other relationships with the Fund and benefits potentially derived from an increase in Funds Management’s and the Sub-Adviser’s business as a result of their relationships with the Fund. The Board noted that various affiliates of Funds Management may receive distribution-related fees, shareholder servicing payments and sub-transfer agency fees in respect of shares sold or held through them and services provided.
The Board also reviewed information about soft dollar credits earned and utilized by the Sub-Adviser, fees earned by Funds Management and the Sub-Adviser from managing a private investment vehicle for the fund family’s securities lending collateral and commissions earned by an affiliated broker from portfolio transactions.
Based on its consideration of the factors and information it deemed relevant, including those described here, the Board did not find that any ancillary benefits received by Funds Management and its affiliates, including the Sub-Adviser, were unreasonable.
Conclusion
At the Meeting, after considering the above-described factors and based on its deliberations and its evaluation of the information described above, the Board unanimously approved the continuation of the Advisory Agreements for a one-year term and determined that the compensation payable to Funds Management and the Sub-Adviser under each of the Advisory Agreements was reasonable.
| | | | |
| 36 | | Wells Fargo Discovery Fund | | List of abbreviations |
The following is a list of common abbreviations for terms and entities that may have appeared in this report.
| ACA | — ACA Financial Guaranty Corporation |
| ADR | — American depositary receipt |
| ADS | — American depositary shares |
| AGC | — Assured Guaranty Corporation |
| AGM | — Assured Guaranty Municipal |
| Ambac | — Ambac Financial Group Incorporated |
| AMT | — Alternative minimum tax |
| BAN | — Bond anticipation notes |
| BHAC | — Berkshire Hathaway Assurance Corporation |
| CAB | — Capital appreciation bond |
| CCAB | — Convertible capital appreciation bond |
| CDA | — Community Development Authority |
| CDO | — Collateralized debt obligation |
| CLO | — Collateralized loan obligation |
| DRIVER | — Derivative inverse tax-exempt receipts |
| DW&P | — Department of Water & Power |
| DWR | — Department of Water Resources |
| ECFA | — Educational & Cultural Facilities Authority |
| EDA | — Economic Development Authority |
| EDFA | — Economic Development Finance Authority |
| ETF | — Exchange-traded fund |
| FDIC | — Federal Deposit Insurance Corporation |
| FFCB | — Federal Farm Credit Banks |
| FGIC | — Financial Guaranty Insurance Corporation |
| FHA | — Federal Housing Administration |
| FHLB | — Federal Home Loan Bank |
| FHLMC | — Federal Home Loan Mortgage Corporation |
| FICO | — The Financing Corporation |
| FNMA | — Federal National Mortgage Association |
| GDR | — Global depositary receipt |
| GNMA | — Government National Mortgage Association |
| HCFR | — Healthcare facilities revenue |
| HEFA | — Health & Educational Facilities Authority |
| HEFAR | — Higher education facilities authority revenue |
| HFA | — Housing Finance Authority |
| HFFA | — Health Facilities Financing Authority |
| HUD | — Department of Housing and Urban Development |
| IDA | — Industrial Development Authority |
| IDAG | — Industrial Development Agency |
| KRW | — Republic of Korea won |
| LIBOR | — London Interbank Offered Rate |
| LIFER | — Long Inverse Floating Exempt Receipts |
| LLC | — Limited liability company |
| LLLP | — Limited liability limited partnership |
| LLP | — Limited liability partnership |
| MBIA | — Municipal Bond Insurance Association |
| MFHR | — Multifamily housing revenue |
| MSTR | — Municipal securities trust receipts |
| MUD | — Municipal Utility District |
| National | — National Public Finance Guarantee Corporation |
| PCFA | — Pollution Control Financing Authority |
| PCL | — Public Company Limited |
| PCR | — Pollution control revenue |
| PFA | — Public Finance Authority |
| PFFA | — Public Facilities Financing Authority |
| PFOTER | — Puttable floating option tax-exempt receipts |
| PJSC | — Public Joint Stock Company |
| plc | — Public limited company |
| PUTTER | — Puttable tax-exempt receipts |
| R&D | — Research & development |
| Radian | — Radian Asset Assurance |
| RAN | — Revenue anticipation notes |
| RDA | — Redevelopment Authority |
| RDFA | — Redevelopment Finance Authority |
| REIT | — Real estate investment trust |
| ROC | — Reset option certificates |
| SAVRS | — Select auction variable rate securities |
| SBA | — Small Business Authority |
| SDR | — Swedish depositary receipt |
| SFHR | — Single-family housing revenue |
| SFMR | — Single-family mortgage revenue |
| SPA | — Standby purchase agreement |
| SPDR | — Standard & Poor’s Depositary Receipts |
| SPEAR | — Short Puttable Exempt Adjustable Receipts |
| STRIPS | — Separate trading of registered interest and |
| TAN | — Tax anticipation notes |
| TIPS | — Treasury inflation-protected securities |
| TRAN | — Tax revenue anticipation notes |
| TTFA | — Transportation Trust Fund Authority |
| TVA | — Tennessee Valley Authority |

For more information
More information about Wells Fargo Funds is available free upon request. To obtain literature, please write, email, visit the Fund’s website, or call:
Wells Fargo Funds
P.O. Box 8266
Boston, MA 02266-8266
Email: fundservice@wellsfargo.com
Website: wellsfargofunds.com
Individual investors: 1-800-222-8222
Retail investment professionals: 1-888-877-9275
Institutional investment professionals: 1-866-765-0778
This report and the financial statements contained herein are submitted for the general information of the shareholders of the Fund. If this report is used for promotional purposes, distribution of the report must be accompanied or preceded by a current prospectus. Before investing, please consider the investment objectives, risks, charges, and expenses of the investment. For a current prospectus and, if available, a summary prospectus, containing this information, call 1-800-222-8222 or visit the Fund’s website at wellsfargofunds.com. Read the prospectus carefully before you invest or send money.
Wells Fargo Asset Management (WFAM) is a trade name used by the asset management businesses of Wells Fargo & Company. Wells Fargo Funds Management, LLC, a wholly owned subsidiary of Wells Fargo & Company, provides investment advisory and administrative services for Wells Fargo Funds. Other affiliates of Wells Fargo & Company provide subadvisory and other services for the funds. The funds are distributed by Wells Fargo Funds Distributor, LLC, Member FINRA, an affiliate of Wells Fargo & Company. Neither Wells Fargo Funds Distributor nor Wells Fargo Funds Management holds fund shareholder accounts or assets. This material is for general informational and educational purposes only and is NOT intended to provide investment advice or a recommendation of any kind—including a recommendation for any specific investment, strategy, or plan.
NOT FDIC INSURED ◾ NO BANK GUARANTEE ◾ MAY LOSE VALUE
© 2017 Wells Fargo Funds Management, LLC. All rights reserved.
| | |
 | | 306436 11-17 A230/AR230 09-17 |
Annual Report
September 30, 2017

Wells Fargo Enterprise Fund


Reduce clutter. Save trees.
Sign up for electronic delivery of prospectuses and shareholder reports at wellsfargo.com/advantagedelivery
Contents
The views expressed and any forward-looking statements are as of September 30, 2017, unless otherwise noted, and are those of the Fund managers and/or Wells Fargo Funds Management, LLC. Discussions of individual securities, or the markets generally, or any Wells Fargo Fund are not intended as individual recommendations. Future events or results may vary significantly from those expressed in any forward-looking statements. The views expressed are subject to change at any time in response to changing circumstances in the market. Wells Fargo Funds Management, LLC and the Fund disclaim any obligation to publicly update or revise any views expressed or forward-looking statements.
NOT FDIC INSURED ◾ NO BANK GUARANTEE ◾ MAY LOSE VALUE
| | | | |
| 2 | | Wells Fargo Enterprise Fund | | Letter to shareholders (unaudited) |

Andrew Owen
President
Wells Fargo Funds
Favorable economic news supported stocks, and interest rates moved higher.
Hiring remained strong, and business and consumer sentiment improved.
Dear Shareholder:
We are pleased to offer you this annual report for the Wells Fargo Enterprise Fund for the 12-month period that ended September 30, 2017. Despite heightened market volatility at times, global stocks generally delivered double-digit results and bond markets had smaller but positive results as well. U.S. and international stocks returned 18.61% and 19.61%, respectively, for the 12-month period, as measured by the S&P 500 Index1 and the MSCI ACWI ex USA Index (Net),2 respectively; within fixed income, the Bloomberg Barclays U.S. Aggregate Bond Index3 returned 0.07% and the Bloomberg Barclays Municipal Bond Index4 returned 0.87% as interest rates rose from low levels.
Election results and central banks’ policies commanded investor attention as 2016 closed.
During the fourth quarter of 2016, investors appeared intent on the prospective outcomes of elections in the U.S. and central-bank actions globally. Following Donald Trump’s election victory, U.S. stocks rallied. Investors appeared optimistic that the new administration would pursue progrowth policies. Favorable economic news supported stocks, and interest rates moved higher. At their mid-December meeting, U.S. Federal Reserve (Fed) officials raised the target interest rate by a quarter percentage point to a range of 0.50% to 0.75%. The fourth quarter also saw the implementation of the U.S. Securities and Exchange Commission’s new rules for money market funds, which included floating net asset values (NAVs) as well as the possibility of liquidity fees and redemption gates for institutional prime and municipal money market funds. In the year leading up to money market fund reform implementation, nearly $1 trillion in assets moved from money market funds subject to floating NAVs into government money market funds, which continued to transact at a stable $1.00 NAV. Outside of the U.S., the prospects for faster U.S. growth appeared to trigger some acceleration in Europe.
Financial markets gained during the first two quarters of 2017 on positive economic data.
Stocks rallied globally through the first quarter of 2017, supported by signs of improvement in the U.S. and global economies. U.S. economic data released during the quarter reflected a healthy economy. Hiring remained strong, and business and consumer sentiment improved. In March, Fed officials raised their target interest rate by a quarter percentage point to a range of 0.75% to 1.00%. With the Fed’s target interest-rate increase, short-term bond yields rose during the quarter. Meanwhile, longer-term Treasury yields were little changed, leading to positive performance. Investment-grade and high-yield bonds benefited from strong demand. Municipal bond returns were positive in the quarter, helped by strong demand and constrained new-issue supply. Outside of the U.S., stocks in emerging markets generally outperformed stocks in the U.S. and international
| 1 | The S&P 500 Index consists of 500 stocks chosen for market size, liquidity, and industry group representation. It is a market-value-weighted index with each stock’s weight in the index proportionate to its market value. You cannot invest directly in an index. |
| 2 | The Morgan Stanley Capital International (MSCI) All Country World Index (ACWI) ex USA Index (Net) is a free-float-adjusted market-capitalization-weighted index that is designed to measure the equity market performance of developed markets, excluding the United States and Canada. Source: MSCI. MSCI makes no express or implied warranties or representations and shall have no liability whatsoever with respect to any MSCI data contained herein. The MSCI data may not be further redistributed or used as a basis for other indexes or any securities or financial products. This report is not approved, reviewed, or produced by MSCI. You cannot invest directly in an index. |
| 3 | The Bloomberg Barclays U.S. Aggregate Bond Index is a broad-based benchmark that measures the investment-grade, U.S. dollar-denominated, fixed-rate taxable bond market, including Treasuries, government-related and corporate securities, mortgage-backed securities (agency fixed-rate and hybrid adjustable-rate mortgage pass-throughs), asset-backed securities, and commercial mortgage-backed securities. You cannot invest directly in an index. |
| 4 | The Bloomberg Barclays Municipal Bond Index is an unmanaged index composed of long-term tax-exempt bonds with a minimum credit rating of Baa. You cannot invest directly in an index. |
| | | | | | |
| Letter to shareholders (unaudited) | | Wells Fargo Enterprise Fund | | | 3 | |
developed markets because they benefited from both global economic growth and recent weakening in the U.S. dollar. Stocks in Asia, Europe, and Latin America also outperformed the U.S. market during the quarter.
Globally, stocks marked continued gains through the second quarter of 2017. Steady, albeit modest, economic growth both in the U.S. and abroad and generally favorable corporate earnings announcements supported higher valuations. U.S. inflation trended lower despite a continued decline in the unemployment rate. Ten-year U.S. Treasury yields declined, resulting in stronger prices for long-term bonds. As was widely expected, the Fed raised the target interest rate in June by a quarter percentage point to a range of 1.00% to 1.25%. In addition, the Fed indicated that it would begin to sell bonds accumulated on its balance sheet during quantitative easing programs conducted since 2008. Later in the third quarter, the Fed confirmed that the initiative to reduce the bonds that it holds likely would begin in October.
Volatility increased during the third quarter of 2017.
Early in July and again in August, volatility expectations increased and then receded—as measured by the CBOE VIX5—amid geopolitical tensions, particularly in Asia, and declining investor optimism following unsuccessful efforts to reform health care laws in the U.S. which suggested to some that President Trump and Congress would be unable to move forward with tax and regulatory reforms.
During the quarter, economic momentum increased in Europe; the European Central Bank held its rates steady at low levels and continued its quantitative easing bond-buying program, which is intended to spark economic activity. The Bank of England suggested it could hike interest rates in November, and the pound gained against other currencies. The Bank of Japan also maintained accommodative policies intended to support business activity and economic growth. In Germany, Angela Merkel was reelected chancellor; in Japan, Prime Minister Shinzo Abe called for snap elections as his popularity increased after North Korea’s aggressive program of missile launches. Both political developments were indicative of the type of political consistency in developed markets that reassure financial markets.
In emerging markets, many countries benefited from stronger currencies versus the U.S. dollar. In addition, commodity prices were on an upward trajectory, which benefited many companies that rely on natural resources for exports.
As the quarter closed, optimism returned as economic growth continued. The second-quarter gross domestic product measure was revised higher from 2.6% annualized to 3.0%. Consumer spending and residential and nonresidential investment increased. While inflation continued to trail the Fed’s targets, expectations remained for an additional short-term interest-rate hike before year-end.
| 5 | The Chicago Board Options Exchange Market Volatility Index (CBOE VIX) is a popular measure of the implied volatility of S&P 500 Index options. It represents one measure of the market’s expectation of stock market volatility over the next 30-day period. You cannot invest directly in an index. |
| | | | |
| 4 | | Wells Fargo Enterprise Fund | | Letter to shareholders (unaudited) |
Don’t let short-term uncertainty derail long-term investment goals.
Periods of investment uncertainty can present challenges, but experience has taught us that maintaining long-term investment goals can be an effective way to plan for the future. To help you create a sound strategy based on your personal goals and risk tolerance, Wells Fargo Funds offers more than 100 mutual funds spanning a wide range of asset classes and investment styles. Although diversification cannot guarantee an investment profit or prevent losses, we believe it
can be an effective way to manage investment risk and potentially smooth out overall portfolio performance. We encourage investors to know their investments and to understand that appropriate levels of risk-taking may unlock opportunities.
Thank you for choosing to invest with Wells Fargo Funds. We appreciate your confidence in us and remain committed to helping you meet your financial needs.
Sincerely,

Andrew Owen
President
Wells Fargo Funds
For further information about your Fund, contact your investment professional, visit our website at wellsfargofunds.com, or call us directly at 1-800-222-8222. We are available 24 hours a day, 7 days a week.
This page is intentionally left blank.
| | | | |
| 6 | | Wells Fargo Enterprise Fund | | Performance highlights (unaudited) |
Investment objective
The Fund seeks long-term capital appreciation.
Manager
Wells Fargo Funds Management, LLC
Subadviser
Wells Capital Management Incorporated
Portfolio managers
Michale T. Smith, CFA®
Christopher J. Warner, CFA®
Average annual total returns (%) as of September 30, 20171
| | | | | | | | | | | | | | | | | | | | | | | | | | | | | | | | | | |
| | | | | Including sales charge | | | Excluding sales charge | | | Expense ratios2 (%) | |
| | | Inception date | | 1 year | | | 5 year | | | 10 year | | | 1 year | | | 5 year | | | 10 year | | | Gross | | | Net3 | |
| Class A (SENAX) | | 2-24-2000 | | | 14.56 | | | | 11.35 | | | | 5.79 | | | | 21.55 | | | | 12.68 | | | | 6.42 | | | | 1.26 | | | | 1.18 | |
| Class C (WENCX) | | 3-31-2008 | | | 19.66 | | | | 11.83 | | | | 5.63 | | | | 20.66 | | | | 11.83 | | | | 5.63 | | | | 2.01 | | | | 1.93 | |
| Class R6 (WENRX) | | 10-31-2014 | | | – | | | | – | | | | – | | | | 22.01 | | | | 13.08 | | | | 6.85 | | | | 0.83 | | | | 0.80 | |
| Administrator Class (SEPKX) | | 8-30-2002 | | | – | | | | – | | | | – | | | | 21.66 | | | | 12.79 | | | | 6.58 | | | | 1.18 | | | | 1.10 | |
| Institutional Class (WFEIX) | | 6-30-2003 | | | – | | | | – | | | | – | | | | 21.97 | | | | 13.05 | | | | 6.83 | | | | 0.93 | | | | 0.85 | |
| Russell Midcap® Growth Index4 | | – | | | – | | | | – | | | | – | | | | 17.82 | | | | 14.18 | | | | 8.20 | | | | – | | | | – | |
Figures quoted represent past performance, which is no guarantee of future results, and do not reflect taxes that a shareholder may pay on fund distributions or the redemption of fund shares. Investment return and principal value of an investment will fluctuate so that an investor’s shares, when redeemed, may be worth more or less than their original cost. Performance shown without sales charges would be lower if sales charges were reflected. Current performance may be lower or higher than the performance data quoted, which assumes the reinvestment of dividends and capital gains. Current month-end performance is available on the Fund’s website, wellsfargofunds.com.
Index returns do not include transaction costs associated with buying and selling securities, any mutual fund fees or expenses, or any taxes. It is not possible to invest directly in an index.
For Class A shares, the maximum front-end sales charge is 5.75%. For Class C shares, the maximum contingent deferred sales charge is 1.00%. Performance including a contingent deferred sales charge assumes the sales charge for the corresponding time period. Class R6, Administrator Class, and Institutional Class shares are sold without a front-end sales charge or contingent deferred sales charge.
Stock values fluctuate in response to the activities of individual companies and general market and economic conditions. Smaller-company stocks tend to be more volatile and less liquid than those of larger companies. Certain investment strategies tend to increase the total risk of an investment (relative to the broader market). The Fund is exposed to foreign investment risk. Consult the Fund’s prospectus for additional information on these and other risks.
Please see footnotes on page 7.
| | | | | | |
| Performance highlights (unaudited) | | Wells Fargo Enterprise Fund | | | 7 | |
|
| Growth of $10,000 investment as of September 30, 20175 |
|
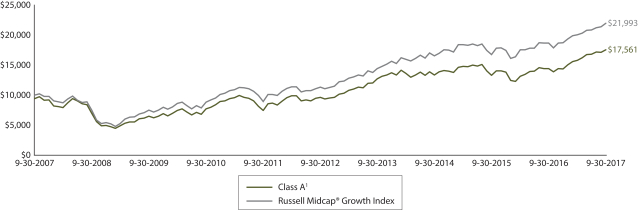 |
| 1 | Effective June 20, 2008, Advisor Class was renamed Class A and modified to assume the features and attributes of Class A. Historical performance shown for Class A shares through June 19, 2008, includes the expenses of the Advisor Class shares. Historical performance shown for Class C shares prior to their inception reflects the performance of the former Investor Class shares and has been adjusted to reflect the higher expenses applicable to Class C shares. Historical performance shown for Class R6 shares prior to their inception reflects the performance of the Institutional Class shares, and is not adjusted to reflect the expenses of Class R6. If these expenses had been included, returns for Class R6 shares would be higher. |
| 2 | Reflects the expense ratios as stated in the most recent prospectuses. The expense ratios shown are subject to change and may differ from the annualized expense ratios shown in the financial highlights of this report. |
| 3 | The manager has contractually committed through January 31, 2018, to waive fees and/or reimburse expenses to the extent necessary to cap the Fund’s Total Annual Fund Operating Expenses After Fee Waivers at the amounts shown. After this time, the cap may be increased or the commitment to maintain the cap may be terminated only with the approval of the Board of Trustees. Brokerage commissions, stamp duty fees, interest, taxes, acquired fund fees and expenses, and extraordinary expenses are excluded from the expense cap. Without this cap, the Fund’s returns would have been lower. The expense ratio paid by an investor is the net expense ratio or the Fund’s Total Annual Fund Operating Expenses After Fee Waivers, as stated in the prospectuses. |
| 4 | The Russell Midcap® Growth Index measures the performance of those Russell Midcap companies with higher price-to-book ratios and higher forecasted growth values. The stocks are also members of the Russell 1000® Growth index. You cannot invest directly in an index. |
| 5 | The chart compares the performance of Class A shares for the most recent ten years with the Russell Midcap® Growth Index. The chart assumes a hypothetical investment of $10,000 in Class A shares and reflects all operating expenses and assumes the maximum initial sales charge of 5.75%. |
| 6 | The ten largest holdings, excluding cash and cash equivalents, are calculated based on the value of the investments divided by total net assets of the Fund. Holdings are subject to change and may have changed since the date specified. |
| 7 | Amounts are calculated based on the total long-term investments of the Fund. These amounts are subject to change and may have changed since the date specified. |
| | | | |
| 8 | | Wells Fargo Enterprise Fund | | Performance highlights (unaudited) |
MANAGER’S DISCUSSION
Fund highlights
| ∎ | | The Fund outperformed its benchmark, the Russell Midcap® Growth Index, for the 12-month period that ended September 30, 2017. |
| ∎ | | Stock selection in the consumer discretionary sector and positioning within the information technology (IT) sector contributed to performance. |
| ∎ | | Stock selection within the industrials sector detracted from performance. |
Over the 12-month period, the Russell Midcap® Growth Index experienced robust gains; rising optimism for synchronized global growth and expectations for higher interest rates drove the strong returns. Market leadership during the period primarily favored growth-oriented sectors within the benchmark index, which proved beneficial to our positioning.
| | | | |
| Ten largest holdings (%) as of September 30, 20176 | |
Waste Connections Incorporated | | | 3.11 | |
Total System Services Incorporated | | | 2.08 | |
Delphi Automotive plc | | | 2.07 | |
WEX Incorporated | | | 1.98 | |
BWX Technologies Incorporated | | | 1.95 | |
Teradyne Incorporated | | | 1.94 | |
Fidelity National Information Services Incorporated | | | 1.92 | |
Vail Resorts Incorporated | | | 1.90 | |
Rockwell Automation Incorporated | | | 1.89 | |
TransUnion | | | 1.81 | |
The Fund benefited from stock selection in the consumer discretionary sector and positioning within IT.
Within the consumer discretionary sector, longtime holding Vail Resorts, Incorporated, displayed particular strength. The ski-resort operator continued to benefit from its acquisition strategy and data-driven marketing approach. Vail has been heavily focused on guest experiences and on data metrics that allow the company to enhance and personalize visitor experiences. This approach has led to rising guest volumes and expanding profit margins. We believe Vail’s improved pricing potential at newly acquired resorts may be a catalyst for continued strong returns in the future. Also within the
leisure industry, shares of Royal Caribbean Cruises Limited outperformed as the cruise-ship operator reported better-than-expected financial results driven by strong industry pricing trends and improved demand. The company also raised its earnings guidance going forward. The rise in Royal Caribbean’s valuation, along with new uncertainty due to the 2017 hurricanes, triggered our sell discipline, and we eliminated the position from the Fund.
|
| Sector distribution as of September 30, 20177 |
|
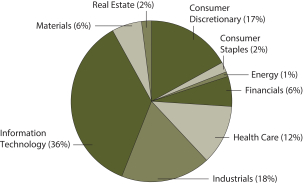 |
Within the IT sector, the Fund’s position in Universal Display Corporation provided strong returns. Demand for the company’s materials used in the manufacture of organic light-emitting diode (OLED) displays for smartphones continued to surge. OLED displays are being incorporated into an increasing number of new phone models as they are lighter and cheaper and offer more flexibility and power efficiency than legacy phone-display screens. This strong demand led to financial results that exceeded consensus expectations. We continued to maintain a position in Universal Display as of the end of the reporting period and to closely monitor its valuation.
The Fund’s performance was hindered by stock selection in the industrials sector.
The Fund’s exposure to Acuity Brands, Incorporated, detracted from performance. Acuity Brands, which provides lighting and building-management solutions, has a strong position in commercial LED solutions. However, weak demand in short-cycle lighting projects caused the company to report disappointing results that led to a reduction in its share price. After reevaluating our investment thesis, we exited the position in favor of investment prospects in which we had higher conviction.
Please see footnotes on page 7.
| | | | | | |
| Performance highlights (unaudited) | | Wells Fargo Enterprise Fund | | | 9 | |
We are cautious regarding the broad economic environment but confident in the Fund’s positioning.
As we progress toward 2018, we believe the market backdrop remains mostly constructive, but we have a modestly higher level of caution. For the time being, inflation expectations have overcome deflationary fears. Credit markets have been calm, and capital has been flowing freely at low cost. Weaknesses in areas such as automobiles and mall-based retailers have tended to be offset by strength in domestic industries such as housing, travel and leisure, e-commerce, and digital advertising. In our view, economic indicators likely point to an elongated business cycle marked by steady, if unspectacular, earnings growth and modestly higher interest rates. The U.S. economy seems poised to potentially continue to expand—but at a more sluggish rate than many people would like to see.
Despite recent improvements, global growth remains below the long-term trend. Our base view is that the economic recovery, which is elongated, likely should continue at a muted pace. Value is created through scarcity, and we seek to invest in companies that have a scarce attribute in the investing world: organic growth. We seek companies that have been benefiting from change—companies with innovations that have been disrupting industries, which in turn has allowed these companies to take market share. The businesses we seek in our assessment have been growing naturally, which means their success has been less reliant on changes in economic growth or in government policies. We seek companies within the stock market that have developed self-sufficiency—a valuable-but-rare trait in a world in which many companies have tended to wait for help from Congress, regulators, or the U.S. Federal Reserve to stimulate their growth.
Please see footnotes on page 7.
| | | | |
| 10 | | Wells Fargo Enterprise Fund | | Fund expenses (unaudited) |
As a shareholder of the Fund, you incur two types of costs: (1) transaction costs, including sales charges (loads) on purchase payments and contingent deferred sales charges (if any) on redemptions and (2) ongoing costs, including management fees, distribution (12b-1) and/or shareholder servicing fees, and other Fund expenses. This example is intended to help you understand your ongoing costs (in dollars) of investing in the Fund and to compare these costs with the ongoing costs of investing in other mutual funds.
The example is based on an investment of $1,000 invested at the beginning of the six-month period and held for the entire period from April 1, 2017 to September 30, 2017.
Actual expenses
The “Actual” line of the table below provides information about actual account values and actual expenses. You may use the information in this line, together with the amount you invested, to estimate the expenses that you paid over the period. Simply divide your account value by $1,000 (for example, an $8,600 account value divided by $1,000 = 8.6), then multiply the result by the number in the “Actual” line under the heading entitled “Expenses paid during period” for your applicable class of shares to estimate the expenses you paid on your account during this period.
Hypothetical example for comparison purposes
The “Hypothetical” line of the table below provides information about hypothetical account values and hypothetical expenses based on the Fund’s actual expense ratio and an assumed rate of return of 5% per year before expenses, which is not the Fund’s actual return. The hypothetical account values and expenses may not be used to estimate the actual ending account balance or expenses you paid for the period. You may use this information to compare the ongoing costs of investing in the Fund and other funds. To do so, compare this 5% hypothetical example with the 5% hypothetical examples that appear in the shareholder reports of the other funds.
Please note that the expenses shown in the table are meant to highlight your ongoing costs only and do not reflect any transactional costs, such as sales charges (loads) and contingent deferred sales charges. Therefore, the “Hypothetical” line of the table is useful in comparing ongoing costs only and will not help you determine the relative total costs of owning different funds. In addition, if these transactional costs were included, your costs would have been higher.
| | | | | | | | | | | | | | | | |
| | | Beginning
account value
4-1-2017 | | | Ending
account value
9-30-2017 | | | Expenses
paid during
the period¹ | | | Annualized net
expense ratio | |
Class A | | | | | | | | | | | | | | | | |
Actual | | $ | 1,000.00 | | | $ | 1,110.10 | | | $ | 6.24 | | | | 1.18 | % |
Hypothetical (5% return before expenses) | | $ | 1,000.00 | | | $ | 1,019.15 | | | $ | 5.97 | | | | 1.18 | % |
Class C | | | | | | | | | | | | | | | | |
Actual | | $ | 1,000.00 | | | $ | 1,105.94 | | | $ | 10.19 | | | | 1.93 | % |
Hypothetical (5% return before expenses) | | $ | 1,000.00 | | | $ | 1,015.39 | | | $ | 9.75 | | | | 1.93 | % |
Class R6 | | | | | | | | | | | | | | | | |
Actual | | $ | 1,000.00 | | | $ | 1,112.11 | | | $ | 4.24 | | | | 0.80 | % |
Hypothetical (5% return before expenses) | | $ | 1,000.00 | | | $ | 1,021.06 | | | $ | 4.05 | | | | 0.80 | % |
Administrator Class | | | | | | | | | | | | | | | | |
Actual | | $ | 1,000.00 | | | $ | 1,110.58 | | | $ | 5.82 | | | | 1.10 | % |
Hypothetical (5% return before expenses) | | $ | 1,000.00 | | | $ | 1,019.55 | | | $ | 5.57 | | | | 1.10 | % |
Institutional Class | | | | | | | | | | | | | | | | |
Actual | | $ | 1,000.00 | | | $ | 1,111.86 | | | $ | 4.50 | | | | 0.85 | % |
Hypothetical (5% return before expenses) | | $ | 1,000.00 | | | $ | 1,020.81 | | | $ | 4.31 | | | | 0.85 | % |
| 1 | Expenses paid is equal to the annualized net expense ratio of each class multiplied by the average account value over the period, multiplied by the number of days in the most recent fiscal half-year divided by the number of days in the fiscal year (to reflect the one-half-year period). |
| | | | | | |
| Portfolio of investments—September 30, 2017 | | Wells Fargo Enterprise Fund | | | 11 | |
| | | | | | | | | | | | | | | | |
| Security name | | | | | | | | Shares | | | Value | |
|
Common Stocks: 98.81% | |
|
Consumer Discretionary: 16.77% | |
|
| Auto Components: 3.31% | |
Delphi Automotive plc | | | | | | | | | | | 146,385 | | | $ | 14,404,284 | |
Ferrari NV | | | | | | | | | | | 78,000 | | | | 8,617,440 | |
| | | | |
| | | | | | | | | | | | | | | 23,021,724 | |
| | | | | | | | | | | | | | | | |
|
| Diversified Consumer Services: 1.70% | |
Bright Horizons Family Solutions Incorporated † | | | | | | | | | | | 136,700 | | | | 11,784,907 | |
| | | | | | | | | | | | | | | | |
|
| Hotels, Restaurants & Leisure: 4.81% | |
Hilton Grand Vacations Incorporated † | | | | | | | | | | | 264,400 | | | | 10,213,772 | |
Six Flags Entertainment Corporation « | | | | | | | | | | | 164,200 | | | | 10,006,348 | |
Vail Resorts Incorporated | | | | | | | | | | | 57,817 | | | | 13,189,214 | |
| | | | |
| | | | | | | | | | | | | | | 33,409,334 | |
| | | | | | | | | | | | | | | | |
|
| Internet & Direct Marketing Retail: 1.22% | |
Ctrip.com International Limited ADR † | | | | | | | | | | | 161,300 | | | | 8,506,962 | |
| | | | | | | | | | | | | | | | |
|
| Media: 2.30% | |
Cinemark Holdings Incorporated | | | | | | | | | | | 227,825 | | | | 8,249,543 | |
Liberty Broadband Corporation Class C † | | | | | | | | | | | 80,900 | | | | 7,709,770 | |
| | | | |
| | | | | | | | | | | | | | | 15,959,313 | |
| | | | | | | | | | | | | | | | |
|
| Specialty Retail: 3.43% | |
Burlington Stores Incorporated † | | | | | | | | | | | 126,100 | | | | 12,037,506 | |
CarMax Incorporated † | | | | | | | | | | | 155,000 | | | | 11,750,550 | |
| | | | |
| | | | | | | | | | | | | | | 23,788,056 | |
| | | | | | | | | | | | | | | | |
|
Consumer Staples: 2.55% | |
|
| Beverages: 2.55% | |
Constellation Brands Incorporated Class A | | | | | | | | | | | 52,600 | | | | 10,491,070 | |
Monster Beverage Corporation † | | | | | | | | | | | 130,300 | | | | 7,199,075 | |
| | | | |
| | | | | | | | | | | | | | | 17,690,145 | |
| | | | | | | | | | | | | | | | |
|
Energy: 0.88% | |
|
| Oil, Gas & Consumable Fuels: 0.88% | |
Diamondback Energy Incorporated † | | | | | | | | | | | 62,700 | | | | 6,142,092 | |
| | | | | | | | | | | | | | | | |
|
Financials: 5.59% | |
|
| Capital Markets: 4.24% | |
Intercontinental Exchange Incorporated | | | | | | | | | | | 179,225 | | | | 12,312,758 | |
Raymond James Financial Incorporated | | | | | | | | | | | 116,600 | | | | 9,832,878 | |
S&P Global Incorporated | | | | | | | | | | | 46,841 | | | | 7,321,717 | |
| | | | |
| | | | | | | | | | | | | | | 29,467,353 | |
| | | | | | | | | | | | | | | | |
|
| Consumer Finance: 1.35% | |
SLM Corporation † | | | | | | | | | | | 816,200 | | | | 9,361,814 | |
| | | | | | | | | | | | | | | | |
The accompanying notes are an integral part of these financial statements.
| | | | |
| 12 | | Wells Fargo Enterprise Fund | | Portfolio of investments—September 30, 2017 |
| | | | | | | | | | | | | | | | |
| Security name | | | | | | | | Shares | | | Value | |
|
Health Care: 11.95% | |
|
| Biotechnology: 3.96% | |
Bioverativ Incorporated † | | | | | | | | | | | 163,200 | | | $ | 9,313,824 | |
Exelixis Incorporated † | | | | | | | | | | | 211,300 | | | | 5,119,799 | |
Incyte Corporation † | | | | | | | | | | | 71,000 | | | | 8,288,540 | |
Tesaro Incorporated †« | | | | | | | | | | | 36,900 | | | | 4,763,790 | |
| | | | |
| | | | | | | | | | | | | | | 27,485,953 | |
| | | | | | | | | | | | | | | | |
|
| Health Care Equipment & Supplies: 7.25% | |
ABIOMED Incorporated † | | | | | | | | | | | 45,600 | | | | 7,688,160 | |
Align Technology Incorporated † | | | | | | | | | | | 21,500 | | | | 4,004,805 | |
Boston Scientific Corporation † | | | | | | | | | | | 303,700 | | | | 8,858,929 | |
Edwards Lifesciences Corporation † | | | | | | | | | | | 113,100 | | | | 12,362,961 | |
Hill-Rom Holdings Incorporated | | | | | | | | | | | 107,900 | | | | 7,984,600 | |
Hologic Incorporated † | | | | | | | | | | | 258,000 | | | | 9,466,020 | |
| | | | |
| | | | | | | | | | | | | | | 50,365,475 | |
| | | | | | | | | | | | | | | | |
|
| Life Sciences Tools & Services: 0.74% | |
Bio-Rad Laboratories Incorporated Class A † | | | | | | | | | | | 23,100 | | | | 5,133,282 | |
| | | | | | | | | | | | | | | | |
|
Industrials: 18.21% | |
|
| Aerospace & Defense: 1.95% | |
BWX Technologies Incorporated | | | | | | | | | | | 241,700 | | | | 13,540,034 | |
| | | | | | | | | | | | | | | | |
|
| Airlines: 0.81% | |
Spirit Airlines Incorporated † | | | | | | | | | | | 168,300 | | | | 5,622,903 | |
| | | | | | | | | | | | | | | | |
|
| Building Products: 3.04% | |
Allegion plc | | | | | | | | | | | 144,300 | | | | 12,477,621 | |
Masonite International Corporation † | | | | | | | | | | | 124,769 | | | | 8,634,015 | |
| | | | |
| | | | | | | | | | | | | | | 21,111,636 | |
| | | | | | | | | | | | | | | | |
|
| Commercial Services & Supplies: 4.49% | |
Cintas Corporation | | | | | | | | | | | 66,500 | | | | 9,594,620 | |
Waste Connections Incorporated | | | | | | | | | | | 308,639 | | | | 21,592,384 | |
| | | | |
| | | | | | | | | | | | | | | 31,187,004 | |
| | | | | | | | | | | | | | | | |
|
| Electrical Equipment: 1.89% | |
Rockwell Automation Incorporated | | | | | | | | | | | 73,700 | | | | 13,134,077 | |
| | | | | | | | | | | | | | | | |
|
| Machinery: 2.91% | |
Colfax Corporation † | | | | | | | | | | | 201,800 | | | | 8,402,952 | |
John Bean Technologies Corporation | | | | | | | | | | | 116,459 | | | | 11,774,005 | |
| | | | |
| | | | | | | | | | | | | | | 20,176,957 | |
| | | | | | | | | | | | | | | | |
|
| Professional Services: 1.81% | |
TransUnion † | | | | | | | | | | | 265,477 | | | | 12,546,443 | |
| | | | | | | | | | | | | | | | |
|
| Trading Companies & Distributors: 1.31% | |
Univar Incorporated † | | | | | | | | | | | 315,200 | | | | 9,118,736 | |
| | | | | | | | | | | | | | | | |
The accompanying notes are an integral part of these financial statements.
| | | | | | |
| Portfolio of investments—September 30, 2017 | | Wells Fargo Enterprise Fund | | | 13 | |
| | | | | | | | | | | | | | | | |
| Security name | | | | | | | | Shares | | | Value | |
|
Information Technology: 35.53% | |
|
| Electronic Equipment, Instruments & Components: 5.08% | |
Littelfuse Incorporated | | | | | | | | | | | 39,100 | | | $ | 7,658,908 | |
National Instruments Corporation | | | | | | | | | | | 150,400 | | | | 6,342,368 | |
Universal Display Corporation | | | | | | | | | | | 83,200 | | | | 10,720,320 | |
Zebra Technologies Corporation Class A † | | | | | | | | | | | 97,300 | | | | 10,564,834 | |
| | | | |
| | | | | | | | | | | | | | | 35,286,430 | |
| | | | | | | | | | | | | | | | |
|
| Internet Software & Services: 4.31% | |
Box Incorporated Class A † | | | | | | | | | | | 516,300 | | | | 9,974,916 | |
MercadoLibre Incorporated | | | | | | | | | | | 44,300 | | | | 11,470,599 | |
Yandex NV Class A † | | | | | | | | | | | 257,500 | | | | 8,484,625 | |
| | | | |
| | | | | | | | | | | | | | | 29,930,140 | |
| | | | | | | | | | | | | | | | |
|
| IT Services: 11.15% | |
Black Knight Financial Services Incorporated Class A †« | | | | | | | | | | | 180,900 | | | | 7,787,745 | |
EPAM Systems Incorporated † | | | | | | | | | | | 100,054 | | | | 8,797,748 | |
Euronet Worldwide Incorporated † | | | | | | | | | | | 104,106 | | | | 9,868,208 | |
Fidelity National Information Services Incorporated | | | | | | | | | | | 142,700 | | | | 13,326,753 | |
Gartner Incorporated † | | | | | | | | | | | 75,900 | | | | 9,442,719 | |
Total System Services Incorporated | | | | | | | | | | | 220,900 | | | | 14,468,950 | |
WEX Incorporated † | | | | | | | | | | | 122,300 | | | | 13,724,506 | |
| | | | |
| | | | | | | | | | | | | | | 77,416,629 | |
| | | | | | | | | | | | | | | | |
|
| Semiconductors & Semiconductor Equipment: 6.08% | |
Advanced Micro Devices Incorporated †« | | | | | | | | | | | 509,900 | | | | 6,501,225 | |
Analog Devices Incorporated | | | | | | | | | | | 144,200 | | | | 12,425,714 | |
Micron Technology Incorporated † | | | | | | | | | | | 249,500 | | | | 9,812,835 | |
Teradyne Incorporated | | | | | | | | | | | 361,400 | | | | 13,476,606 | |
| | | | |
| | | | | | | | | | | | | | | 42,216,380 | |
| | | | | | | | | | | | | | | | |
|
| Software: 7.66% | |
Activision Blizzard Incorporated | | | | | | | | | | | 115,800 | | | | 7,470,258 | |
Electronic Arts Incorporated † | | | | | | | | | | | 63,200 | | | | 7,461,392 | |
Ellie Mae Incorporated † | | | | | | | | | | | 75,600 | | | | 6,209,028 | |
Guidewire Software Incorporated † | | | | | | | | | | | 11 | | | | 856 | |
Nintendo Company Limited « | | | | | | | | | | | 254,300 | | | | 11,685,085 | |
ServiceNow Incorporated † | | | | | | | | | | | 86,250 | | | | 10,136,963 | |
Ultimate Software Group Incorporated † | | | | | | | | | | | 54,100 | | | | 10,257,360 | |
| | | | |
| | | | | | | | | | | | | | | 53,220,942 | |
| | | | | | | | | | | | | | | | |
|
| Technology Hardware, Storage & Peripherals: 1.25% | |
NCR Corporation † | | | | | | | | | | | 231,500 | | | | 8,685,880 | |
| | | | | | | | | | | | | | | | |
|
Materials: 5.59% | |
|
| Chemicals: 2.35% | |
Albemarle Corporation | | | | | | | | | | | 49,300 | | | | 6,720,083 | |
The Sherwin-Williams Company | | | | | | | | | | | 26,700 | | | | 9,559,668 | |
| | | | |
| | | | | | | | | | | | | | | 16,279,751 | |
| | | | | | | | | | | | | | | | |
The accompanying notes are an integral part of these financial statements.
| | | | |
| 14 | | Wells Fargo Enterprise Fund | | Portfolio of investments—September 30, 2017 |
| | | | | | | | | | | | | | | | |
| Security name | | | | | | | | Shares | | | Value | |
|
| Construction Materials: 1.54% | |
Vulcan Materials Company | | | | | | | | | | | 89,600 | | | $ | 10,716,160 | |
| | | | | | | | | | | | | | | | |
|
| Containers & Packaging: 1.70% | |
Berry Plastics Group Incorporated † | | | | | | | | | | | 208,100 | | | | 11,788,865 | |
| | | | | | | | | | | | | | | | |
| | | | |
Real Estate: 1.74% | | | | | | | | | | | | | | | | |
| | | | |
| Equity REITs: 1.74% | | | | | | | | | | | | | | | | |
SBA Communications Corporation † | | | | | | | | | | | 83,700 | | | | 12,056,984 | |
| | | | | | | | | | | | | | | | |
| | | | |
Total Common Stocks (Cost $541,032,847) | | | | | | | | | | | | | | | 686,152,361 | |
| | | | | | | | | | | | | | | | |
| | | | |
| | | Yield | | | | | | | | | | |
| Short-Term Investments: 4.64% | | | | | | | | | | | | | | | | |
| | | | |
| Investment Companies: 4.64% | | | | | | | | | | | | | | | | |
Securities Lending Cash Investment LLC (l)(r)(u) | | | 1.25 | % | | | | | | | 24,700,733 | | | | 24,703,203 | |
Wells Fargo Government Money Market Fund Select Class (l)(u) | | | 0.92 | | | | | | | | 7,539,373 | | | | 7,539,373 | |
| | | | |
Total Short-Term Investments (Cost $32,242,576) | | | | | | | | | | | | | | | 32,242,576 | |
| | | | | | | | | | | | | | | | |
| | | | | | | | |
| Total investments in securities (Cost $573,275,423) | | | 103.45 | % | | | 718,394,937 | |
Other assets and liabilities, net | | | (3.45 | ) | | | (23,990,127 | ) |
| | | | | | | | |
| Total net assets | | | 100.00 | % | | $ | 694,404,810 | |
| | | | | | | | |
| † | Non-income-earning security |
| « | All or a portion of this security is on loan. |
| (l) | The issuer of the security is an affiliated person of the Fund as defined in the Investment Company Act of 1940. |
| (r) | The investment is a non-registered investment company purchased with cash collateral received from securities on loan. |
| (u) | The rate represents the 7-day annualized yield at period end. |
Investments in Affiliates
An affiliated investment is an investment in which the Fund owns at least 5% of the outstanding voting shares of the issuer or as a result of other relationships, such as the Fund and the issuer having the same investment manager. Transactions with issuers that were either affiliated persons of the Fund at the beginning of the period or the end of the period were as follows:
| | | | | | | | | | | | | | | | | | | | | | | | | | | | | | | | | | | | |
| | | Shares,
beginning of
period | | | Shares purchased | | | Shares sold | | | Shares,
end of period | | | Net
realized gains | | | Net change in unrealized
gains (losses) | | | Income from
affiliated
securities | | | Value,
end
of period | | | % of
net
assets | |
Short-Term Investments | | | | | | | | | | | | | | | | | | | | | | | | | | | | | | | | | | | | |
| | | | | | | | | |
Investment companies | | | | | | | | | | | | | | | | | | | | | | | | | | | | | | | | | | | | |
Securities Lending Cash Investment LLC | | | 1,020,000 | | | | 232,343,549 | | | | 208,662,816 | | | | 24,700,733 | | | $ | 104 | | | $ | 0 | | | $ | 38,987 | | | $ | 24,703,203 | | | | | |
Wells Fargo Government Money Market Fund Select Class | | | 4,723,179 | | | | 229,500,842 | | | | 226,684,648 | | | | 7,539,373 | | | | 0 | | | | 0 | | | | 54,507 | | | | 7,539,373 | | | | | |
| | | | | | | | | | | | | | | | | | | | | | | | | | | | | | | | | | | | |
| | | | | | | | | | | | | | | | | | $ | 104 | | | $ | 0 | | | $ | 93,494 | | | $ | 32,242,576 | | | | 4.64 | % |
| | | | | | | | | | | | | | | | | | | | | | | | | | | | | | | | | | | | |
The accompanying notes are an integral part of these financial statements.
| | | | | | |
| Statement of assets and liabilities—September 30, 2017 | | Wells Fargo Enterprise Fund | | | 15 | |
| | | | |
| | | | |
| |
Assets | | | | |
Investments in unaffiliated securities (including $24,346,681 of securities on loan), at value (cost $541,032,847) | | $ | 686,152,361 | |
Investments in affiliated securities, at value (cost $32,242,576) | | | 32,242,576 | |
Receivable for investments sold | | | 1,306,024 | |
Receivable for Fund shares sold | | | 71,990 | |
Receivable for dividends | | | 130,682 | |
Receivable for securities lending income | | | 4,357 | |
Prepaid expenses and other assets | | | 85,462 | |
| | | | |
Total assets | | | 719,993,452 | |
| | | | |
| |
Liabilities | | | | |
Payable for Fund shares redeemed | | | 138,710 | |
Payable upon receipt of securities loaned | | | 24,703,125 | |
Management fee payable | | | 391,123 | |
Distribution fees payable | | | 5,603 | |
Administration fees payable | | | 112,804 | |
Accrued expenses and other liabilities | | | 237,277 | |
| | | | |
Total liabilities | | | 25,588,642 | |
| | | | |
Total net assets | | $ | 694,404,810 | |
| | | | |
| |
NET ASSETS CONSIST OF | | | | |
Paid-in capital | | $ | 483,812,250 | |
Accumulated net investment loss | | | (22,316 | ) |
Accumulated net realized gains on investments | | | 65,495,362 | |
Net unrealized gains on investments | | | 145,119,514 | |
| | | | |
Total net assets | | $ | 694,404,810 | |
| | | | |
| |
COMPUTATION OF NET ASSET VALUE AND OFFERING PRICE PER SHARE | | | | |
Net assets – Class A | | $ | 591,001,846 | |
Shares outstanding – Class A1 | | | 12,111,549 | |
Net asset value per share – Class A | | | $48.80 | |
Maximum offering price per share – Class A2 | | | $51.78 | |
Net assets – Class C | | $ | 8,897,667 | |
Shares outstanding – Class C1 | | | 202,459 | |
Net asset value per share – Class C | | | $43.95 | |
Net assets – Class R6 | | $ | 35,923,416 | |
Shares outstanding – Class R61 | | | 675,642 | |
Net asset value per share – Class R6 | | | $53.17 | |
Net assets – Administrator Class | | $ | 3,704,744 | |
Shares outstanding – Administrator Class1 | | | 72,470 | |
Net asset value per share – Administrator Class | | | $51.12 | |
Net assets – Institutional Class | | $ | 54,877,137 | |
Shares outstanding – Institutional Class1 | | | 1,033,904 | |
Net asset value per share – Institutional Class | | | $53.08 | |
| 1 | The Fund has an unlimited number of authorized shares. |
| 2 | Maximum offering price is computed as 100/94.25 of net asset value. On investments of $50,000 or more, the offering price is reduced. |
The accompanying notes are an integral part of these financial statements.
| | | | |
| 16 | | Wells Fargo Enterprise Fund | | Statement of operations—year ended September 30, 2017 |
| | | | |
| | | | |
| |
Investment income | | | | |
Dividends (net of foreign withholding taxes of $33,498) | | $ | 4,044,021 | |
Income from affiliated securities | | | 93,494 | |
| | | | |
Total investment income | | | 4,137,515 | |
| | | | |
| |
Expenses | | | | |
Management fee | | | 4,870,101 | |
Administration fees | |
Class A | | | 1,163,649 | |
Class B | | | 104 | 1 |
Class C | | | 18,557 | |
Class R6 | | | 9,696 | |
Administrator Class | | | 5,846 | |
Institutional Class | | | 71,138 | |
Shareholder servicing fees | |
Class A | | | 1,385,296 | |
Class B | | | 123 | 1 |
Class C | | | 22,092 | |
Administrator Class | | | 11,242 | |
Distribution fees | |
Class B | | | 370 | 1 |
Class C | | | 66,276 | |
Custody and accounting fees | | | 62,192 | |
Professional fees | | | 42,155 | |
Registration fees | | | 100,983 | |
Shareholder report expenses | | | 96,202 | |
Trustees’ fees and expenses | | | 20,990 | |
Other fees and expenses | | | 19,529 | |
| | | | |
Total expenses | | | 7,966,541 | |
Less: Fee waivers and/or expense reimbursements | | | (483,275 | ) |
| | | | |
Net expenses | | | 7,483,266 | |
| | | | |
Net investment loss | | | (3,345,751 | ) |
| | | | |
| |
REALIZED AND UNREALIZED GAINS (LOSSES) ON INVESTMENTS | | | | |
|
Net realized gains on: | |
Unaffiliated securities | | | 81,607,520 | |
Affiliated securities | | | 104 | |
| | | | |
Net realized gains on investments | | | 81,607,624 | |
Net change in unrealized gains (losses) on investments | | | 50,265,823 | |
| | | | |
Net realized and unrealized gains (losses) on investments | | | 131,873,447 | |
| | | | |
Net increase in net assets resulting from operations | | $ | 128,527,696 | |
| | | | |
| 1 | For the period from October 1, 2016 to December 5, 2016. Effective at the close of business on December 5, 2016, Class B shares were converted to Class A shares and are no longer offered by the Fund. |
The accompanying notes are an integral part of these financial statements.
| | | | | | |
| Statement of changes in net assets | | Wells Fargo Enterprise Fund | | | 17 | |
| | | | | | | | | | | | | | | | |
| | | Year ended
September 30, 2017 | | | Year ended
September 30, 2016 | |
| |
Operations | | | | | |
Net investment loss | | | | | | $ | (3,345,751 | ) | | | | | | $ | (3,186,682 | ) |
Net realized gains on investments | | | | | | | 81,607,624 | | | | | | | | 17,584,427 | |
Net change in unrealized gains (losses) on investments | | | | | | | 50,265,823 | | | | | | | | 38,732,302 | |
| | | | |
Net increase in net assets resulting from operations | | | | | | | 128,527,696 | | | | | | | | 53,130,047 | |
| | | | |
| |
Distributions to shareholders from | | | | | |
Net realized gains | |
Class A | | | | | | | (23,114,697 | ) | | | | | | | (43,636,386 | ) |
Class B | | | | | | | 0 | 1 | | | | | | | (61,455 | ) |
Class C | | | | | | | (425,970 | ) | | | | | | | (809,467 | ) |
Class R6 | | | | | | | (1,209,334 | ) | | | | | | | (148,611 | ) |
Administrator Class | | | | | | | (197,246 | ) | | | | | | | (262,668 | ) |
Institutional Class | | | | | | | (2,319,994 | ) | | | | | | | (5,679,281 | ) |
| | | | |
Total distributions to shareholders | | | | | | | (27,267,241 | ) | | | | | | | (50,597,868 | ) |
| | | | |
| | | | |
Capital share transactions | | | Shares | | | | | | | | Shares | | | | | |
Proceeds from shares sold | |
Class A | | | 195,089 | | | | 8,516,613 | | | | 4,522,822 | | | | 197,186,460 | |
Class B | | | 0 | 1 | | | 0 | 1 | | | 1 | | | | 16 | |
Class C | | | 13,435 | | | | 531,304 | | | | 23,985 | | | | 869,811 | |
Class R6 | | | 53,059 | | | | 2,534,424 | | | | 691,533 | | | | 29,003,966 | |
Administrator Class | | | 24,924 | | | | 1,147,821 | | | | 47,307 | | | | 1,846,716 | |
Institutional Class | | | 211,541 | | | | 10,100,449 | | | | 292,382 | | | | 12,703,511 | |
Investor Class | | | N/A | | | | N/A | | | | 4,864 | 2 | | | 207,062 | 2 |
| | | | |
| | | | | | | 22,830,611 | | | | | | | | 241,817,542 | |
| | | | |
Reinvestment of distributions | |
Class A | | | 533,814 | | | | 21,805,829 | | | | 1,043,906 | | | | 41,244,748 | |
Class B | | | 0 | 1 | | | 0 | 1 | | | 1,651 | | | | 59,782 | |
Class C | | | 10,964 | | | | 405,900 | | | | 21,345 | | | | 773,309 | |
Class R6 | | | 27,250 | | | | 1,209,334 | | | | 3,488 | | | | 148,611 | |
Administrator Class | | | 4,560 | | | | 195,026 | | | | 6,238 | | | | 257,327 | |
Institutional Class | | | 51,089 | | | | 2,264,283 | | | | 120,020 | | | | 5,110,433 | |
| | | | |
| | | | | | | 25,880,372 | | | | | | | | 47,594,210 | |
| | | | |
Payment for shares redeemed | |
Class A | | | (1,542,559 | ) | | | (67,085,160 | ) | | | (1,489,094 | ) | | | (59,409,799 | ) |
Class B | | | (9,343 | )1 | | | (353,582 | )1 | | | (15,187 | ) | | | (564,158 | ) |
Class C | | | (62,115 | ) | | | (2,474,823 | ) | | | (47,670 | ) | | | (1,691,275 | ) |
Class R6 | | | (62,855 | ) | | | (2,999,473 | ) | | | (37,369 | ) | | | (1,612,164 | ) |
Administrator Class | | | (64,120 | ) | | | (3,098,008 | ) | | | (27,720 | ) | | | (1,163,795 | ) |
Institutional Class | | | (587,234 | ) | | | (27,287,442 | ) | | | (998,881 | ) | | | (43,244,941 | ) |
Investor Class | | | N/A | | | | N/A | | | | (4,428,901 | )2 | | | (190,508,618 | )2 |
| | | | |
| | | | | | | (103,298,488 | ) | | | | | | | (298,194,750 | ) |
| | | | |
Net decrease in net assets resulting from capital share transactions | | | | | | | (54,587,505 | ) | | | | | | | (8,782,998 | ) |
| | | | |
Total increase (decrease) in net assets | | | | | | | 46,672,950 | | | | | | | | (6,250,819 | ) |
| | | | |
| | | | |
Net assets | | | | | | | | | | | | | | | | |
Beginning of period | | | | | | | 647,731,860 | | | | | | | | 653,982,679 | |
| | | | |
End of period | | | | | | $ | 694,404,810 | | | | | | | $ | 647,731,860 | |
| | | | |
Accumulated net investment loss | | | | | | $ | (22,316 | ) | | | | | | $ | (2,200,728 | ) |
| | | | |
| 1 | For the period from October 1, 2016 to December 5, 2016. Effective at the close of business on December 5, 2016, Class B shares were converted to Class A shares and are no longer offered by the Fund. |
| 2 | For the period from October 1, 2015 to October 23, 2015. Effective at the close of business on October 23, 2015, Investor Class shares were converted to Class A shares and are no longer offered by the Fund. |
The accompanying notes are an integral part of these financial statements.
| | | | |
| 18 | | Wells Fargo Enterprise Fund | | Financial highlights |
(For a share outstanding throughout each period)
| | | | | | | | | | | | | | | | | | | | |
| | | Year ended September 30 | |
| CLASS A | | 2017 | | | 2016 | | | 2015 | | | 2014 | | | 2013 | |
Net asset value, beginning of period | | | $41.94 | | | | $41.90 | | | | $47.93 | | | | $49.54 | | | | $37.67 | |
Net investment income (loss) | | | (0.25 | ) | | | (0.21 | )1 | | | (0.29 | ) | | | (0.43 | )1 | | | 0.01 | 1 |
Net realized and unrealized gains (losses) on investments | | | 8.94 | | | | 3.61 | | | | 0.18 | | | | 3.00 | | | | 11.86 | |
| | | | | | | | | | | | | | | | | | | | |
Total from investment operations | | | 8.69 | | | | 3.40 | | | | (0.11 | ) | | | 2.57 | | | | 11.87 | |
Distributions to shareholders from | | | | | | | | | | | | | | | | | | | | |
Net realized gains | | | (1.83 | ) | | | (3.36 | ) | | | (5.92 | ) | | | (4.18 | ) | | | 0.00 | |
Net asset value, end of period | | | $48.80 | | | | $41.94 | | | | $41.90 | | | | $47.93 | | | | $49.54 | |
Total return2 | | | 21.55 | % | | | 8.63 | % | | | (0.67 | )% | | | 5.27 | % | | | 31.55 | % |
Ratios to average net assets (annualized) | | | | | | | | | | | | | | | | | | | | |
Gross expenses | | | 1.26 | % | | | 1.26 | % | | | 1.29 | % | | | 1.29 | % | | | 1.30 | % |
Net expenses | | | 1.18 | % | | | 1.18 | % | | | 1.18 | % | | | 1.18 | % | | | 1.18 | % |
Net investment income (loss) | | | (0.55 | )% | | | (0.52 | )% | | | (0.60 | )% | | | (0.87 | )% | | | 0.01 | % |
Supplemental data | | | | | | | | | | | | | | | | | | | | |
Portfolio turnover rate | | | 75 | % | | | 99 | % | | | 101 | % | | | 98 | % | | | 91 | % |
Net assets, end of period (000s omitted) | | | $591,002 | | | | $542,077 | | | | $370,743 | | | | $417,971 | | | | $427,860 | |
| 1 | Calculated based upon average shares outstanding |
| 2 | Total return calculations do not include any sales charges. |
The accompanying notes are an integral part of these financial statements.
| | | | | | |
| Financial highlights | | Wells Fargo Enterprise Fund | | | 19 | |
(For a share outstanding throughout each period)
| | | | | | | | | | | | | | | | | | | | |
| | | Year ended September 30 | |
| CLASS C | | 2017 | | | 2016 | | | 2015 | | | 2014 | | | 2013 | |
Net asset value, beginning of period | | | $38.23 | | | | $38.75 | | | | $45.07 | | | | $47.14 | | | | $36.11 | |
Net investment loss | | | (0.85 | ) | | | (0.47 | )1 | | | (0.59 | )1 | | | (0.75 | )1 | | | (0.29 | )1 |
Net realized and unrealized gains (losses) on investments | | | 8.40 | | | | 3.31 | | | | 0.19 | | | | 2.86 | | | | 11.32 | |
| | | | | | | | | | | | | | | | | | | | |
Total from investment operations | | | 7.55 | | | | 2.84 | | | | (0.40 | ) | | | 2.11 | | | | 11.03 | |
Distributions to shareholders from | | | | | | | | | | | | | | | | | | | | |
Net realized gains | | | (1.83 | ) | | | (3.36 | ) | | | (5.92 | ) | | | (4.18 | ) | | | 0.00 | |
Net asset value, end of period | | | $43.95 | | | | $38.23 | | | | $38.75 | | | | $45.07 | | | | $47.14 | |
Total return2 | | | 20.66 | % | | | 7.80 | % | | | (1.41 | )% | | | 4.49 | % | | | 30.55 | % |
Ratios to average net assets (annualized) | | | | | | | | | | | | | | | | | | | | |
Gross expenses | | | 2.01 | % | | | 2.01 | % | | | 2.04 | % | | | 2.04 | % | | | 2.05 | % |
Net expenses | | | 1.93 | % | | | 1.93 | % | | | 1.93 | % | | | 1.93 | % | | | 1.93 | % |
Net investment loss | | | (1.31 | )% | | | (1.28 | )% | | | (1.36 | )% | | | (1.62 | )% | | | (0.72 | )% |
Supplemental data | | | | | | | | | | | | | | | | | | | | |
Portfolio turnover rate | | | 75 | % | | | 99 | % | | | 101 | % | | | 98 | % | | | 91 | % |
Net assets, end of period (000s omitted) | | | $8,898 | | | | $9,181 | | | | $9,399 | | | | $9,658 | | | | $8,483 | |
| 1 | Calculated based upon average shares outstanding |
| 2 | Total return calculations do not include any sales charges. |
The accompanying notes are an integral part of these financial statements.
| | | | |
| 20 | | Wells Fargo Enterprise Fund | | Financial highlights |
(For a share outstanding throughout each period)
| | | | | | | | | | | | |
| | | Year ended September 30 | |
| CLASS R6 | | 2017 | | | 2016 | | | 20151 | |
Net asset value, beginning of period | | | $45.37 | | | | $44.89 | | | | $52.65 | |
Net investment loss | | | (0.08 | ) | | | (0.06 | )2 | | | (0.08 | ) |
Net realized and unrealized gains (losses) on investments | | | 9.71 | | | | 3.90 | | | | (1.76 | ) |
| | | | | | | | | | | | |
Total from investment operations | | | 9.63 | | | | 3.84 | | | | (1.84 | ) |
Distributions to shareholders from | | | | | | | | | | | | |
Net realized gains | | | (1.83 | ) | | | (3.36 | ) | | | (5.92 | ) |
Net asset value, end of period | | | $53.17 | | | | $45.37 | | | | $44.89 | |
Total return3 | | | 22.01 | % | | | 9.06 | % | | | (3.84 | )% |
Ratios to average net assets (annualized) | | | | | | | | | | | | |
Gross expenses | | | 0.83 | % | | | 0.83 | % | | | 0.81 | % |
Net expenses | | | 0.80 | % | | | 0.80 | % | | | 0.80 | % |
Net investment loss | | | (0.17 | )% | | | (0.14 | )% | | | (0.19 | )% |
Supplemental data | | | | | | | | | | | | |
Portfolio turnover rate | | | 75 | % | | | 99 | % | | | 101 | % |
Net assets, end of period (000s omitted) | | | $35,923 | | | | $29,861 | | | | $24 | |
| 1 | For the period from October 31, 2014 (commencement of class operations) to September 30, 2015 |
| 2 | Calculated based upon average shares outstanding |
| 3 | Returns for periods of less than one year are not annualized. |
The accompanying notes are an integral part of these financial statements.
| | | | | | |
| Financial highlights | | Wells Fargo Enterprise Fund | | | 21 | |
(For a share outstanding throughout each period)
| | | | | | | | | | | | | | | | | | | | |
| | | Year ended September 30 | |
| ADMINISTRATOR CLASS | | 2017 | | | 2016 | | | 2015 | | | 2014 | | | 2013 | |
Net asset value, beginning of period | | | $43.81 | | | | $43.58 | | | | $49.54 | | | | $51.03 | | | | $38.77 | |
Net investment income (loss) | | | (0.20 | )1 | | | (0.18 | )1 | | | (0.23 | )1 | | | (0.37 | )1 | | | 0.02 | 1 |
Net realized and unrealized gains (losses) on investments | | | 9.34 | | | | 3.77 | | | | 0.19 | | | | 3.06 | | | | 12.24 | |
| | | | | | | | | | | | | | | | | | | | |
Total from investment operations | | | 9.14 | | | | 3.59 | | | | (0.04 | ) | | | 2.69 | | | | 12.26 | |
Distributions to shareholders from | | | | | | | | | | | | | | | | | | | | |
Net realized gains | | | (1.83 | ) | | | (3.36 | ) | | | (5.92 | ) | | | (4.18 | ) | | | 0.00 | |
Net asset value, end of period | | | $51.12 | | | | $43.81 | | | | $43.58 | | | | $49.54 | | | | $51.03 | |
Total return | | | 21.66 | % | | | 8.74 | % | | | (0.46 | )% | | | 5.33 | % | | | 31.62 | % |
Ratios to average net assets (annualized) | | | | | | | | | | | | | | | | | | | | |
Gross expenses | | | 1.18 | % | | | 1.15 | % | | | 1.09 | % | | | 1.12 | % | | | 1.13 | % |
Net expenses | | | 1.10 | % | | | 1.07 | % | | | 1.07 | % | | | 1.09 | % | | | 1.11 | % |
Net investment income (loss) | | | (0.44 | )% | | | (0.41 | )% | | | (0.47 | )% | | | (0.74 | )% | | | 0.05 | % |
Supplemental data | | | | | | | | | | | | | | | | | | | | |
Portfolio turnover rate | | | 75 | % | | | 99 | % | | | 101 | % | | | 98 | % | | | 91 | % |
Net assets, end of period (000s omitted) | | | $3,705 | | | | $4,693 | | | | $3,542 | | | | $44,760 | | | | $10,046 | |
| 1 | Calculated based upon average shares outstanding |
The accompanying notes are an integral part of these financial statements.
| | | | |
| 22 | | Wells Fargo Enterprise Fund | | Financial highlights |
(For a share outstanding throughout each period)
| | | | | | | | | | | | | | | | | | | | |
| | | Year ended September 30 | |
| INSTITUTIONAL CLASS | | 2017 | | | 2016 | | | 2015 | | | 2014 | | | 2013 | |
Net asset value, beginning of period | | | $45.32 | | | | $44.87 | | | | $50.77 | | | | $52.07 | | | | $39.46 | |
Net investment income (loss) | | | (0.09 | )1 | | | (0.09 | )1 | | | (0.13 | )1 | | | (0.28 | )1 | | | 0.18 | 1 |
Net realized and unrealized gains (losses) on investments | | | 9.68 | | | | 3.90 | | | | 0.15 | | | | 3.16 | | | | 12.43 | |
| | | | | | | | | | | | | | | | | | | | |
Total from investment operations | | | 9.59 | | | | 3.81 | | | | 0.02 | | | | 2.88 | | | | 12.61 | |
Distributions to shareholders from | | | | | | | | | | | | | | | | | | | | |
Net realized gains | | | (1.83 | ) | | | (3.36 | ) | | | (5.92 | ) | | | (4.18 | ) | | | 0.00 | |
Net asset value, end of period | | | $53.08 | | | | $45.32 | | | | $44.87 | | | | $50.77 | | | | $52.07 | |
Total return | | | 21.97 | % | | | 8.97 | % | | | (0.32 | )% | | | 5.61 | % | | | 31.96 | % |
Ratios to average net assets (annualized) | | | | | | | | | | | | | | | | | | | | |
Gross expenses | | | 0.93 | % | | | 0.93 | % | | | 0.88 | % | | | 0.86 | % | | | 0.87 | % |
Net expenses | | | 0.85 | % | | | 0.85 | % | | | 0.85 | % | | | 0.85 | % | | | 0.85 | % |
Net investment income (loss) | | | (0.19 | )% | | | (0.21 | )% | | | (0.27 | )% | | | (0.54 | )% | | | 0.41 | % |
Supplemental data | | | | | | | | | | | | | | | | | | | | |
Portfolio turnover rate | | | 75 | % | | | 99 | % | | | 101 | % | | | 98 | % | | | 91 | % |
Net assets, end of period (000s omitted) | | | $54,877 | | | | $61,563 | | | | $87,279 | | | | $76,790 | | | | $81,021 | |
| 1 | Calculated based upon average shares outstanding |
The accompanying notes are an integral part of these financial statements.
| | | | | | |
| Notes to financial statements | | Wells Fargo Enterprise Fund | | | 23 | |
1. ORGANIZATION
Wells Fargo Funds Trust (the “Trust”), a Delaware statutory trust organized on March 10, 1999, is an open-end management investment company registered under the Investment Company Act of 1940, as amended (the “1940 Act”). As an investment company, the Trust follows the accounting and reporting guidance in Financial Accounting Standards Board Accounting Standards Codification Topic 946, Financial Services – Investment Companies. These financial statements report on the Wells Fargo Enterprise Fund (the “Fund”) which is a diversified series of the Trust.
Effective at the close of business on October 23, 2015, Investor Class shares were converted to Class A shares and are no longer offered by the Fund. Information for Investor Class shares reflected in the financial statements represents activity through October 23, 2015.
Effective at the close of business on December 5, 2016, Class B shares were converted to Class A shares and are no longer offered by the Fund. Information for Class B shares reflected in the financial statements represents activity through December 5, 2016.
2. SIGNIFICANT ACCOUNTING POLICIES
The following significant accounting policies, which are consistently followed in the preparation of the financial statements of the Fund, are in conformity with U.S. generally accepted accounting principles which require management to make estimates and assumptions that affect the reported amounts of assets and liabilities, disclosure of contingent assets and liabilities at the date of the financial statements, and the reported amounts of revenues and expenses during the reporting period. Actual results could differ from those estimates.
Securities valuation
All investments are valued each business day as of the close of regular trading on the New York Stock Exchange (generally 4 p.m. Eastern Time), although the Fund may deviate from this calculation time under unusual or unexpected circumstances.
Equity securities that are listed on a foreign or domestic exchange or market are valued at the official closing price or, if none, the last sales price. If no sale occurs on the principal exchange or market that day, a fair value price will be determined in accordance with the Fund’s Valuation Procedures.
Investments in registered open-end investment companies are valued at net asset value. Interests in non-registered investment companies that are redeemable at net asset value are fair valued normally at net asset value.
Investments which are not valued using any of the methods discussed above are valued at their fair value, as determined in good faith by the Board of Trustees of the Fund. The Board of Trustees has established a Valuation Committee comprised of the Trustees and has delegated to it the authority to take any actions regarding the valuation of portfolio securities that the Valuation Committee deems necessary or appropriate, including determining the fair value of portfolio securities, unless the determination has been delegated to the Management Valuation Team of Wells Fargo Funds Management, LLC (“Funds Management”). The Board of Trustees retains the authority to make or ratify any valuation decisions or approve any changes to the Valuation Procedures as it deems appropriate. On a quarterly basis, the Board of Trustees receives reports on any valuation actions taken by the Valuation Committee or the Management Valuation Team which may include items for ratification.
Valuations of fair valued securities are compared to the next actual sales price when available, or other appropriate market values, to assess the continued appropriateness of the fair valuation methodologies used. These securities are fair valued on a day-to-day basis, taking into consideration changes to appropriate market information and any significant changes to the inputs considered in the valuation process until there is a readily available price provided on an exchange or by an independent pricing service. Valuations received from an independent pricing service or independent broker-dealer quotes are periodically validated by comparisons to most recent trades and valuations provided by other independent pricing services in addition to the review of prices by the manager and/or subadviser. Unobservable inputs used in determining fair valuations are identified based on the type of security, taking into consideration factors utilized by market participants in valuing the investment, knowledge about the issuer and the current market environment.
Security loans
The Fund may lend its securities from time to time in order to earn additional income in the form of fees or interest on securities received as collateral or the investment of any cash received as collateral. The Fund continues to receive interest or dividends on the securities loaned. The Fund receives collateral in the form of cash or securities with a value at least equal to the value of the securities on loan. The value of the loaned securities is determined at the close of each business day and any additional required collateral is delivered to the Fund on the next business day. In a securities lending transaction, the net
| | | | |
| 24 | | Wells Fargo Enterprise Fund | | Notes to financial statements |
asset value of the Fund will be affected by an increase or decrease in the value of the securities loaned and by an increase or decrease in the value of the instrument in which collateral is invested. The amount of securities lending activity undertaken by the Fund fluctuates from time to time. In the event of default or bankruptcy by the borrower, the Fund may be prevented from recovering the loaned securities or gaining access to the collateral or may experience delays or costs in doing so. In addition, the investment of any cash collateral received may lose all or part of its value. The Fund has the right under the lending agreement to recover the securities from the borrower on demand.
The Fund lends its securities through an unaffiliated securities lending agent. Cash collateral received in connection with its securities lending transactions is invested in Securities Lending Cash Investments, LLC (the “Securities Lending Fund”). The Securities Lending Fund is exempt from registration under Section 3(c)(7) of the 1940 Act and is managed by Funds Management and is subadvised by Wells Capital Management Incorporated (“WellsCap”), an affiliate of Funds Management and an indirect wholly owned subsidiary of Wells Fargo & Company (“Wells Fargo”). Funds Management receives an advisory fee starting at 0.05% and declining to 0.01% as the average daily net assets of the Securities Lending Fund increase. All of the fees received by Funds Management are paid to WellsCap for its services as subadviser. The Securities Lending Fund seeks to provide a positive return compared to the daily Fed Funds Open Rate by investing in high-quality, U.S. dollar-denominated short-term money market instruments. Securities Lending Fund investments are valued at the evaluated bid price provided by an independent pricing service. Income earned from investment in the Securities Lending Fund is included in income from affiliates securities on the Statement of Operations.
Security transactions and income recognition
Securities transactions are recorded on a trade date basis. Realized gains or losses are recorded on the basis of identified cost.
Dividend income is recognized on the ex-dividend date. Dividend income is recorded net of foreign taxes withheld where recovery of such taxes is not assured.
Distributions to shareholders
Distributions to shareholders from net investment income and net realized gains, if any, are recorded on the ex-dividend date. Such distributions are determined in accordance with income tax regulations and may differ from U.S. generally accepted accounting principles. Dividend sources are estimated at the time of declaration. The tax character of distributions is determined as of the Fund’s fiscal year end. Therefore, a portion of the Fund’s distributions made prior to the Fund’s fiscal year end may be categorized as a tax return of capital.
Federal and other taxes
The Fund intends to continue to qualify as a regulated investment company by distributing substantially all of its investment company taxable income and any net realized capital gains (after reduction for capital loss carryforwards) sufficient to relieve it from all, or substantially all, federal income taxes. Accordingly, no provision for federal income taxes was required.
The Fund’s income and federal excise tax returns and all financial records supporting those returns for the prior three fiscal years are subject to examination by the federal and Delaware revenue authorities. Management has analyzed the Fund’s tax positions taken on federal, state, and foreign tax returns for all open tax years and does not believe that there are any uncertain tax positions that require recognition of a tax liability.
As of September 30, 2017, the aggregate cost of all investments for federal income tax purposes was $574,268,891 and the unrealized gains (losses) consisted of:
| | | | |
Gross unrealized gains | | $ | 152,684,074 | |
Gross unrealized losses | | | (8,558,028 | ) |
Net unrealized gains | | $ | 144,126,046 | |
Reclassifications are made to the Fund’s capital accounts for permanent tax differences to reflect income and gains available for distribution (or available capital loss carryforwards) under federal income tax regulations. U.S. generally accepted accounting principles require that certain components of net assets be adjusted to reflect permanent differences between financial and tax reporting. These reclassifications have no effect on net assets or net asset values per share. The primary permanent differences causing such reclassifications are due to corporate actions and net
| | | | | | |
| Notes to financial statements | | Wells Fargo Enterprise Fund | | | 25 | |
operating losses. At September 30, 2017, as a result of permanent book-to-tax differences, the following reclassification adjustments were made on the Statement of Assets and Liabilities:
| | |
Accumulated net investment loss | | Accumulated net realized gains on investments |
| $5,524,163 | | $(5,524,163) |
Class allocations
The separate classes of shares offered by the Fund differ principally in applicable sales charges, distribution, shareholder servicing, and administration fees. Class specific expenses are charged directly to that share class. Investment income, common expenses, and realized and unrealized gains (losses) on investments are allocated daily to each class of shares based on the relative proportion of net assets of each class.
3. FAIR VALUATION MEASUREMENTS
Fair value measurements of investments are determined within a framework that has established a fair value hierarchy based upon the various data inputs utilized in determining the value of the Fund’s investments. The three-level hierarchy gives the highest priority to unadjusted quoted prices in active markets for identical assets or liabilities (Level 1) and the lowest priority to unobservable inputs (Level 3). The Fund’s investments are classified within the fair value hierarchy based on the lowest level of input that is significant to the fair value measurement. The inputs are summarized into three broad levels as follows:
| ∎ | | Level 1 – quoted prices in active markets for identical securities |
| ∎ | | Level 2 – other significant observable inputs (including quoted prices for similar securities, interest rates, prepayment speeds, credit risk, etc.) |
| ∎ | | Level 3 – significant unobservable inputs (including the Fund’s own assumptions in determining the fair value of investments) |
The inputs or methodologies used for valuing investments in securities are not necessarily an indication of the risk associated with investing in those securities.
The following is a summary of the inputs used in valuing the Fund’s assets and liabilities as of September 30, 2017:
| | | | | | | | | | | | | | | | |
| | | Quoted prices (Level 1) | | | Other significant
observable inputs
(Level 2) | | | Significant
unobservable inputs (Level 3) | | | Total | |
Assets | | | | | | | | | | | | | | | | |
Investments in: | | | | | | | | | | | | | | | | |
| | | | |
Common stocks | | | | | | | | | | | | | | | | |
Consumer discretionary | | $ | 116,470,296 | | | $ | 0 | | | $ | 0 | | | $ | 116,470,296 | |
Consumer staples | | | 17,690,145 | | | | 0 | | | | 0 | | | | 17,690,145 | |
Energy | | | 6,142,092 | | | | 0 | | | | 0 | | | | 6,142,092 | |
Financials | | | 38,829,167 | | | | 0 | | | | 0 | | | | 38,829,167 | |
Health care | | | 82,984,710 | | | | 0 | | | | 0 | | | | 82,984,710 | |
Industrials | | | 126,437,790 | | | | 0 | | | | 0 | | | | 126,437,790 | |
Information technology | | | 246,756,401 | | | | 0 | | | | 0 | | | | 246,756,401 | |
Materials | | | 38,784,776 | | | | 0 | | | | 0 | | | | 38,784,776 | |
Real estate | | | 12,056,984 | | | | 0 | | | | 0 | | | | 12,056,984 | |
| | | | |
Short-term investments | | | | | | | | | | | | | | | | |
Investment companies | | | 7,539,373 | | | | 0 | | | | 0 | | | | 7,539,373 | |
Investments measured at net asset value* | | | | | | | | | | | | | | | 24,703,203 | |
Total assets | | $ | 693,691,734 | | | $ | 0 | | | $ | 0 | | | $ | 718,394,937 | |
| * | Investments that are measured at fair value using the net asset value per share (or its equivalent) as a practical expedient have not been categorized in the fair value hierarchy. The fair value amount presented in the table is intended to permit reconciliation of the fair value hierarchy to the amounts presented in the Statement of Assets and Liabilities. The Fund’s investment in Securities Lending Cash Investments, LLC valued at $24,703,203 does not have a redemption period notice, can be redeemed daily and does not have any unfunded commitments. |
The Fund recognizes transfers between levels within the fair value hierarchy at the end of the reporting period. At September 30, 2017, the Fund did not have any transfers into/out of Level 1, Level 2, or Level 3.
| | | | |
| 26 | | Wells Fargo Enterprise Fund | | Notes to financial statements |
4. TRANSACTIONS WITH AFFILIATES AND OTHER EXPENSES
Management fee
Funds Management, an indirect wholly owned subsidiary of Wells Fargo, is the manager of the Fund and provides advisory and fund-level administrative services under an investment management agreement. Under the investment management agreement, Funds Management is responsible for, among other services, implementing the investment objectives and strategies of the Fund, supervising the subadviser, providing fund-level administrative services in connection with the Fund’s operations, and providing any other fund-level administrative services reasonably necessary for the operation of the Fund. As compensation for its services under the investment management agreement, Funds Management is entitled to receive an annual management fee starting at 0.75% and declining to 0.63% as the average daily net assets of the Fund increase. For the year ended September 30, 2017, the management fee was equivalent to an annual rate of 0.74% of the Fund’s average daily net assets.
Funds Management has retained the services of a subadviser to provide daily portfolio management to the Fund. The fee for subadvisory services is borne by Funds Management. WellsCap is the subadviser to the Fund and is entitled to receive a fee from Funds Management at an annual rate starting at 0.45% and declining to 0.30% as the average daily net assets of the Fund increase.
Administration fees
Under a class-level administration agreement, Funds Management provides class-level administrative services to the Fund, which includes paying fees and expenses for services provided by the transfer agent, sub-transfer agents, omnibus account servicers and record-keepers. As compensation for its services under the class-level administration agreement, Funds Management receives an annual fee which is calculated based on the average daily net assets of each class as follows:
| | | | |
| | | Class-level
administration fee | |
Class A, Class B, Class C | | | 0.21 | % |
Class R6 | | | 0.03 | |
Administrator Class, Institutional Class | | | 0.13 | |
Funds Management has contractually waived and/or reimbursed management and administration fees to the extent necessary to maintain certain net operating expense ratios for the Fund. Waiver of fees and/or reimbursement of expenses by Funds Management were made first from fund level expenses on a proportionate basis and then from class specific expenses. Funds Management has committed through January 31, 2018 to waive fees and/or reimburse expenses to the extent necessary to cap the Fund’s expenses at 1.18% for Class A shares, 1.93% for Class C shares, 0.80% for Class R6 shares, 1.10% for Administrator Class shares, and 0.85% for Institutional Class shares. After this time, the cap may be increased or the commitment to maintain the cap may be terminated only with the approval of the Board of Trustees.
During the year ended September 30, 2017, State Street Bank and Trust Company (“State Street”), the Fund’s custodian, reimbursed the Fund $5,080 for certain out-of-pocket expenses that were billed to the Fund in error from 1998-2015. This amount is included in dividend income on the Statement of Operations. In addition, Funds Management was also reimbursed $6,888 by State Street for waivers/reimbursements it made to the Fund to limit Fund expenses during the period the Fund was erroneously billed.
Distribution fees
The Trust has adopted a distribution plan for Class B and Class C shares of the Fund pursuant to Rule 12b-1 under the 1940 Act. Distribution fees are charged to Class B and Class C shares and paid to Wells Fargo Funds Distributor, LLC (“Funds Distributor”), the principal underwriter, at an annual rate of 0.75% of the average daily net assets of Class B and Class C shares.
In addition, Funds Distributor is entitled to receive the front-end sales charge from the purchase of Class A shares and a contingent deferred sales charge on the redemption of certain Class A shares. Funds Distributor is also entitled to receive the contingent deferred sales charges from redemptions of Class B and Class C shares. For the year ended September 30, 2017, Funds Distributor received $2,807 from the sale of Class A shares and $67 in contingent deferred sales charges from redemptions of Class C shares. No contingent deferred sales charges were incurred by Class A and Class B shares for the year ended September 30, 2017.
| | | | | | |
| Notes to financial statements | | Wells Fargo Enterprise Fund | | | 27 | |
Shareholder servicing fees
The Trust has entered into contracts with one or more shareholder servicing agents, whereby Class A, Class B, Class C, and Administrator Class of the Fund are charged a fee at an annual rate of 0.25% of the average daily net assets of each respective class.
A portion of these total shareholder servicing fees were paid to affiliates of Wells Fargo.
Interfund transactions
The Fund may purchase or sell portfolio investment securities to certain other Wells Fargo affiliates pursuant to Rule 17a-7 of the 1940 Act and under procedures adopted by the Board of Trustees. The procedures have been designed to ensure that these interfund transactions, which do not incur broker commissions, are effected at current market prices.
5. INVESTMENT PORTFOLIO TRANSACTIONS
Purchases and sales of investments, excluding U.S. government obligations (if any) and short-term securities, for the year ended September 30, 2017 were $486,882,879 and $579,904,219, respectively.
6. BANK BORROWINGS
The Trust (excluding the money market funds and certain other funds) and Wells Fargo Variable Trust are parties to a $280,000,000 revolving credit agreement whereby the Fund is permitted to use bank borrowings for temporary or emergency purposes, such as to fund shareholder redemption requests. Interest under the credit agreement is charged to the Fund based on a borrowing rate equal to the higher of the Federal Funds rate in effect on that day plus 1.25% or the overnight LIBOR rate in effect on that day plus 1.25%. In addition, an annual commitment fee equal to 0.25% of the unused balance is allocated to each participating fund. Prior to August 29, 2017, the revolving credit agreement amount was $250,000,000.
For the year ended September 30, 2017, there were no borrowings by the Fund under the agreement.
7. DISTRIBUTIONS TO SHAREHOLDERS
The tax character of distributions paid was $27,267,241 and $50,597,868 of long-term capital gain for the years ended September 30, 2017 and September 30, 2016, respectively.
As of September 30, 2017, the components of distributable earnings on a tax basis were as follows:
| | | | |
Undistributed
ordinary
income | | Undistributed
long-term
gain | | Unrealized gains |
| $10,391,604 | | $56,097,226 | | $144,126,046 |
8. CONCENTRATION RISK
Concentration risks result from exposure to a limited number of sectors. A fund that invests a substantial portion of its assets in any sector may be more affected by changes in that sector than would be a fund whose investments are not heavily weighted in any sector.
9. INDEMNIFICATION
Under the Trust’s organizational documents, the officers and Trustees have been granted certain indemnification rights against certain liabilities that may arise out of performance of their duties to the Trust. Additionally, in the normal course of business, the Trust may enter into contracts with service providers that contain a variety of indemnification clauses. The Trust’s maximum exposure under these arrangements is dependent on future claims that may be made against the Fund and, therefore, cannot be estimated.
| | | | |
| 28 | | Wells Fargo Enterprise Fund | | Report of independent registered public accounting firm |
BOARD OF TRUSTEES AND SHAREHOLDERS OF WELLS FARGO FUNDS TRUST:
We have audited the accompanying statement of assets and liabilities, including the portfolio of investments, of the Wells Fargo Enterprise Fund (the “Fund”), one of the funds constituting the Wells Fargo Funds Trust, as of September 30, 2017, and the related statement of operations for the year then ended, the statements of changes in net assets for each of the years in the two-year period then ended, and the financial highlights for each of the years or periods in the five-year period then ended. These financial statements and financial highlights are the responsibility of the Fund’s management. Our responsibility is to express an opinion on these financial statements and financial highlights based on our audits.
We conducted our audits in accordance with the standards of the Public Company Accounting Oversight Board (United States). Those standards require that we plan and perform the audit to obtain reasonable assurance about whether the financial statements and financial highlights are free of material misstatement. An audit includes examining, on a test basis, evidence supporting the amounts and disclosures in the financial statements. Our procedures included confirmation of securities owned as of September 30, 2017, by correspondence with the custodian and brokers, or by other appropriate auditing procedures. An audit also includes assessing the accounting principles used and significant estimates made by management, as well as evaluating the overall financial statement presentation. We believe that our audits provide a reasonable basis for our opinion.
In our opinion, the financial statements and financial highlights referred to above present fairly, in all material respects, the financial position of the Wells Fargo Enterprise Fund as of September 30, 2017, the results of its operations for the year then ended, the changes in its net assets for each of the years in the two-year period then ended, and the financial highlights for each of the years or periods in the five-year period then ended, in conformity with U.S. generally accepted accounting principles.

Boston, Massachusetts
November 22, 2017
| | | | | | |
| Other information (unaudited) | | Wells Fargo Enterprise Fund | | | 29 | |
TAX INFORMATION
Pursuant to Section 852 of the Internal Revenue Code, $27,267,241 was designated as a 20% rate gain distribution for the fiscal year ended September 30, 2017.
PROXY VOTING INFORMATION
A description of the policies and procedures that the Fund uses to determine how to vote proxies relating to portfolio securities is available, upon request, by calling 1-800-222-8222, visiting our website at wellsfargofunds.com, or visiting the SEC website at sec.gov. Information regarding how the Fund voted proxies relating to portfolio securities during the most recent 12-month period ended June 30 is available on the Fund’s website at wellsfargofunds.com or by visiting the SEC website at sec.gov.
PORTFOLIO HOLDINGS INFORMATION
The complete portfolio holdings for the Fund are publicly available monthly on the Fund’s website (wellsfargofunds.com), on a one-month delayed basis. In addition, top ten holdings information (excluding derivative positions) for the Fund is publicly available on the Fund’s website on a monthly, seven-day or more delayed basis. The Fund files its complete schedule of portfolio holdings with the SEC for the first and third quarters of each fiscal year on Form N-Q, which is available by visiting the SEC website at sec.gov. In addition, the Fund’s Form N-Q may be reviewed and copied at the SEC’s Public Reference Room in Washington, DC, and at regional offices in New York City, at 233 Broadway, and in Chicago, at 175 West Jackson Boulevard, Suite 900. Information about the Public Reference Room may be obtained by calling 1-800-SEC-0330.
| | | | |
| 30 | | Wells Fargo Enterprise Fund | | Other information (unaudited) |
BOARD OF TRUSTEES AND OFFICERS
Each of the Trustees and Officers1 listed in the table below acts in identical capacities for each fund in the Wells Fargo family of funds, which consists of 152 mutual funds comprising the Wells Fargo Funds Trust, Wells Fargo Variable Trust, Wells Fargo Master Trust and four closed-end funds (collectively the “Fund Complex”). This table should be read in conjunction with the Prospectus and the Statement of Additional Information2. The mailing address of each Trustee and Officer is 525 Market Street, 12th Floor, San Francisco, CA 94105. Each Trustee and Officer serves an indefinite term, however, each Trustee serves such term until reaching the mandatory retirement age established by the Trustees.
Independent Trustees
| | | | | | |
Name and year of birth | | Position held and length of service* | | Principal occupations during past five years or longer | | Current other public company or investment company directorships |
William R. Ebsworth (Born 1957) | | Trustee, since 2015 | | Retired. From 1984 to 2013, equities analyst, portfolio manager, research director and chief investment officer at Fidelity Management and Research Company in Boston, Tokyo, and Hong Kong and retired in 2013 as Chief Investment Officer of Fidelity Strategic Advisers, Inc. where he led a team of investment professionals managing client assets. Prior thereto, Board member of Hong Kong Securities Clearing Co., Hong Kong Options Clearing Corp., the Thailand International Fund, Ltd., Fidelity Investments Life Insurance Company, and Empire Fidelity Investments Life Insurance Company. Board member of the Forté Foundation (non-profit organization) and the Vincent Memorial Hospital Endowment (non-profit organization), where he serves on the Investment Committee and as a Chair of the Audit Committee. Mr. Ebsworth is a CFA® charterholder. | | Asset Allocation Trust |
Jane A. Freeman (Born 1953) | | Trustee, since 2015 | | Retired. From 2012 to 2014 and 1999 to 2008, Chief Financial Officer of Scientific Learning Corporation. From 2008 to 2012, Ms. Freeman provided consulting services related to strategic business projects. Prior to 1999, Portfolio Manager at Rockefeller & Co. and Scudder, Stevens & Clark. Board member of the Harding Loevner Funds from 1996 to 2014, serving as both Lead Independent Director and chair of the Audit Committee. Board member of the Russell Exchange Traded Funds Trust from 2011 to 2012 and the chair of the Audit Committee. Ms. Freeman is a Board Member of Ruth Bancroft Garden (non-profit organization) and an inactive chartered financial analyst. | | Asset Allocation Trust |
Peter G. Gordon** (Born 1942) | | Trustee, since 1998; Chairman, since 2005 | | Co-Founder, Retired Chairman, President and CEO of Crystal Geyser Water Company. Trustee Emeritus, Colby College. | | Asset Allocation Trust |
Isaiah Harris, Jr. (Born 1952) | | Trustee, since 2009 | | Retired. Chairman of the Board of CIGNA Corporation since 2009, and Director since 2005. From 2003 to 2011, Director of Deluxe Corporation. Prior thereto, President and CEO of BellSouth Advertising and Publishing Corp. from 2005 to 2007, President and CEO of BellSouth Enterprises from 2004 to 2005 and President of BellSouth Consumer Services from 2000 to 2003. Emeritus member of the Iowa State University Foundation Board of Governors. Emeritus Member of the Advisory Board of Iowa State University School of Business. Advisory Board Member, Palm Harbor Academy (charter school). Advisory Board Member, Child Evangelism Fellowship (non-profit). Mr. Harris is a certified public accountant (inactive status). | | CIGNA Corporation; Asset Allocation Trust |
Judith M. Johnson (Born 1949) | | Trustee, since 2008; Audit Committee Chairman, since 2008 | | Retired. Prior thereto, Chief Executive Officer and Chief Investment Officer of Minneapolis Employees Retirement Fund from 1996 to 2008. Ms. Johnson is an attorney, certified public accountant and a certified managerial accountant. | | Asset Allocation Trust |
David F. Larcker (Born 1950) | | Trustee, since 2009 | | James Irvin Miller Professor of Accounting at the Graduate School of Business, Stanford University, Director of the Corporate Governance Research Initiative and Senior Faculty of The Rock Center for Corporate Governance since 2006. From 2005 to 2008, Professor of Accounting at the Graduate School of Business, Stanford University. Prior thereto, Ernst & Young Professor of Accounting at The Wharton School, University of Pennsylvania from 1985 to 2005. | | Asset Allocation Trust |
| | | | | | |
| Other information (unaudited) | | Wells Fargo Enterprise Fund | | | 31 | |
| | | | | | |
Name and year of birth | | Position held and length of service* | | Principal occupations during past five years or longer | | Current other public company or investment company directorships |
Olivia S. Mitchell (Born 1953) | | Trustee, since 2006 | | International Foundation of Employee Benefit Plans Professor, Wharton School of the University of Pennsylvania since 1993. Director of Wharton’s Pension Research Council and Boettner Center on Pensions & Retirement Research, and Research Associate at the National Bureau of Economic Research. Previously, Cornell University Professor from 1978 to 1993. | | Asset Allocation Trust |
Timothy J. Penny (Born 1951) | | Trustee, since 1996: Vice Chairman, since 2017 | | President and Chief Executive Officer of Southern Minnesota Initiative Foundation, a non-profit organization, since 2007 and Senior Fellow at the Humphrey Institute Policy Forum at the University of Minnesota since 1995. Member of the Board of Trustees of NorthStar Education Finance, Inc., a non-profit organization, since 2007. | | Asset Allocation Trust |
Michael S. Scofield (Born 1943) | | Trustee, since 2010 | | Served on the Investment Company Institute’s Board of Governors and Executive Committee from 2008-2011 as well the Governing Council of the Independent Directors Council from 2006-2011 and the Independent Directors Council Executive Committee from 2008-2011. Chairman of the IDC from 2008-2010. Trustee of the Evergreen Funds complex (and its predecessors) from 1984 to 2010. Chairman of the Evergreen Funds from 2000-2010. Former Trustee of the Mentor Funds. Retired Attorney, Law Offices of Michael S. Scofield. | | Asset Allocation Trust |
| * | Length of service dates reflect the Trustee’s commencement of service with the Trust’s predecessor entities, where applicable. |
| ** | Peter Gordon is expected to retire on December 31, 2017. |
Advisory Board Members
| | | | | | |
Name and year of birth | | Position held and length of service | | Principal occupations during past five years or longer | | Current other public company or investment company directorships |
| James G. Polisson (Born 1959) | | Advisory Board Member, since 2017 | | Retired. Chief Marketing Officer, Source (ETF) UK Services, Ltd, from 2015 to 2017. From 2012 to 2015, Principal of The Polisson Group, LLC, a management consulting, corporate advisory and principal investing company. Chief Executive Officer and Managing Director at Russell Investments, Global Exchange Traded Funds from 2010 to 2012. Managing Director of Barclays Global Investors from 1998 to 2010 and Global Chief Marketing Officer for iShares and Barclays Global Investors from 2000 to 2010. Prior thereto, Vice President, Fidelity Retail Mutual Fund Group from 1996 to 1998 and Risk Management Practice Manager, Fidelity Consulting from 1995 to 1996. Board member of the Russell Exchange Traded Fund Trust from 2011 to 2012. Director of Barclays Global Investors Holdings Deutschland GmbH from 2006 to 2009. Mr. Polisson is an attorney and has a retired status with the Massachusetts and District of Columbia Bar Associations. | | None |
| Pamela Wheelock (Born 1959) | | Advisory Board Member, since 2017 | | Chief Operating Officer, Twin Cities Habitat for Humanity, since January, 2017. Vice President of University Services, University of Minnesota from 2012 to 2017. Prior thereto, Interim President and Chief Executive Officer of Blue Cross Blue Shield of Minnesota from 2010 to 2011, Chairman of the Board from 2009 to 2011 and Board Director from 2003 to 2015. Vice President, Leadership and Community Engagement, Bush Foundation, Saint Paul, Minnesota (a private foundation) from 2009 to 2011. Executive Vice President and Chief Financial Officer, Minnesota Sports and Entertainment from 2004 to 2009 and Senior Vice President from 2002 to 2004. Commissioner of Finance, State of Minnesota, from 1999 to 2002. Currently on the Board of Directors, Governance Committee and Finance Committee, for the Minnesota Philanthropy Partners (Saint Paul Foundation) since 2012 and Board Chair of the Minnesota Wild Foundation since 2010. | | None |
| | | | |
| 32 | | Wells Fargo Enterprise Fund | | Other information (unaudited) |
Officers
| | | | | | |
Name and year of birth | | Position held and length of service | | Principal occupations during past five years or longer | | |
Andrew Owen (Born 1960) | | President, since 2017 | | Executive Vice President of Wells Fargo & Company and Head of Affiliated Managers, Wells Fargo Asset Management, since 2014. In addition, Mr. Owen is currently President, Chief Executive Officer and Director of Wells Fargo Funds Management, LLC since 2017. Prior thereto, Executive Vice President responsible for marketing, investments and product development for Wells Fargo Funds Management, LLC, from 2009 to 2014. | | |
Nancy Wiser1 (Born 1967) | | Treasurer, since 2012 | | Executive Vice President of Wells Fargo Funds Management, LLC since 2011. Chief Operating Officer and Chief Compliance Officer at LightBox Capital Management LLC, from 2008 to 2011. | | |
| C. David Messman (Born 1960) | | Secretary, since 2000; Chief Legal Officer, since 2003 | | Senior Vice President and Secretary of Wells Fargo Funds Management, LLC since 2001. Assistant General Counsel of Wells Fargo Bank, N.A. since 2013 and Vice President and Managing Counsel of Wells Fargo Bank, N.A. from 1996 to 2013. | | |
| Michael H. Whitaker (Born 1967) | | Chief Compliance Officer, since 2016 | | Senior Vice President and Chief Compliance Officer since 2016. Senior Vice President and Chief Compliance Officer for Fidelity Investments from 2007 to 2016. | | |
David Berardi (Born 1975) | | Assistant Treasurer, since 2009 | | Vice President of Wells Fargo Funds Management, LLC since 2009. Vice President of Evergreen Investment Management Company, LLC from 2008 to 2010. Manager of Fund Reporting and Control for Evergreen Investment Management Company, LLC from 2004 to 2010. | | |
Jeremy DePalma1 (Born 1974) | | Assistant Treasurer, since 2009 | | Senior Vice President of Wells Fargo Funds Management, LLC since 2009. Senior Vice President of Evergreen Investment Management Company, LLC from 2008 to 2010 and head of the Fund Reporting and Control Team within Fund Administration from 2005 to 2010. | | |
| 1 | Nancy Wiser acts as Treasurer of 76 funds in the Fund Complex. Jeremy DePalma acts as Treasurer of 76 funds and Assistant Treasurer of 76 funds in the Fund Complex. |
| 2 | The Statement of Additional Information includes additional information about the Trustees and is available, without charge, upon request, by calling 1-800-222-8222 or by visiting the website at wellsfargofunds.com. |
| | | | | | |
| Other information (unaudited) | | Wells Fargo Enterprise Fund | | | 33 | |
BOARD CONSIDERATION OF INVESTMENT MANAGEMENT AND SUB-ADVISORY AGREEMENTS:
Under the Investment Company Act of 1940 (the “1940 Act”), the Board of Trustees (the “Board”) of Wells Fargo Funds Trust (the “Trust”) must determine annually whether to approve the continuation of the Trust’s investment management and sub-advisory agreements. In this regard, at an in-person meeting held on May 16-17, 2017 (the “Meeting”), the Board, all the members of which have no direct or indirect interest in the investment management and sub-advisory agreements and are not “interested persons” of the Trust, as defined in the 1940 Act (the “Independent Trustees”), reviewed and approved for Wells Fargo Enterprise Fund (the “Fund”): (i) an investment management agreement (the “Management Agreement”) with Wells Fargo Funds Management, LLC (“Funds Management”); and (ii) an investment sub-advisory agreement (the “Sub-Advisory Agreement”) with Wells Capital Management Incorporated (the “Sub-Adviser”), an affiliate of Funds Management. The Management Agreement and the Sub-Advisory Agreement are collectively referred to as the “Advisory Agreements.”
At the Meeting, the Board considered the factors and reached the conclusions described below relating to the selection of Funds Management and the Sub-Adviser and the approval of the Advisory Agreements. Prior to the Meeting, including at an in-person meeting in April 2017, the Trustees conferred extensively among themselves and with representatives of Funds Management about these matters. Also, the Board has adopted a team-based approach, with each team consisting of a sub-set of Trustees, to assist the full Board in the discharge of its duties in reviewing performance and other matters throughout the year. The Independent Trustees were assisted in their evaluation of the Advisory Agreements by independent legal counsel, from whom they received separate legal advice and with whom they met separately.
In providing information to the Board, Funds Management and the Sub-Adviser were guided by a detailed set of requests for information submitted to them by independent legal counsel on behalf of the Independent Trustees at the start of the Board’s annual contract renewal process earlier in 2017. In considering and approving the Advisory Agreements, the Trustees considered the information they believed relevant, including but not limited to the information discussed below. The Board considered not only the specific information presented in connection with the Meeting, but also the knowledge gained over time through interaction with Funds Management and the Sub-Adviser about various topics. In this regard, the Board reviewed reports of Funds Management at each of its quarterly meetings, which included, among other things, portfolio reviews and performance reports. In addition, the Board and the teams mentioned above confer with portfolio managers at various times throughout the year. The Board did not identify any particular information or consideration that was all-important or controlling, and each individual Trustee may have attributed different weights to various factors.
After its deliberations, the Board unanimously approved the continuation of the Advisory Agreements for a one-year term and determined that the compensation payable to Funds Management and the Sub-Adviser under each of the Advisory Agreements was reasonable. The Board considered the approval of the Advisory Agreements for the Fund as part of its consideration of agreements for funds across the complex, but its approvals were made on a fund-by-fund basis. The following summarizes a number of important, but not necessarily all, factors considered by the Board in support of its approvals.
Nature, extent and quality of services
The Board received and considered various information regarding the nature, extent and quality of services provided to the Fund by Funds Management and the Sub-Adviser under the Advisory Agreements. This information included a description of the investment advisory services and Fund-level administrative services covered by the Management Agreement, as well as, among other things, a summary of the background and experience of senior management of Funds Management, a summary of certain organizational and personnel changes involving Funds Management and the Sub-Adviser, and a description of Funds Management’s and the Sub-Adviser’s business continuity planning programs and of their approaches to data privacy and cybersecurity. The Board also considered the qualifications, background, tenure and responsibilities of each of the portfolio managers primarily responsible for the day-to-day portfolio management of the Fund.
The Board evaluated the ability of Funds Management and the Sub-Adviser to attract and retain qualified investment professionals, including research, advisory and supervisory personnel. The Board further considered the compliance programs and compliance records of Funds Management and the Sub-Adviser. In addition, the Board took into account the full range of services provided to the Fund by Funds Management and its affiliates.
Fund performance and expenses
The Board considered the investment performance results for the Fund over various time periods ended December 31, 2016. In certain cases, the Board also considered more current results for various time periods ended March 31, 2017. The Board considered these results in comparison to the performance of funds in a universe that was determined by Broadridge Inc.
| | | | |
| 34 | | Wells Fargo Enterprise Fund | | Other information (unaudited) |
(“Broadridge”) to be similar to the Fund (the “Universe”), and in comparison to the Fund’s benchmark index and to other comparative data. Broadridge is an independent provider of investment company data. The Board received a description of the methodology used by Broadridge to select the mutual funds in the performance Universe. The Board noted that the performance of the Fund (Administrator Class) was higher than or in range of the average performance of the Universe for the one- and ten-year periods ended December 31, 2016, but lower than the average performance of the Universe for the three- and five-year periods ended December 31, 2016. However, the Board noted that the performance ranking of the Fund in the Universe had improved from the prior quarter-end for the one- and three-year periods ended March 31, 2017. The Board also noted that the performance of the Fund was lower than its benchmark, the Russell Midcap® Growth Index, for all periods under review ended December 31, 2016.
The Board received information concerning, and discussed factors contributing to, the underperformance of the Fund relative to the Universe and benchmark for the periods identified above. The Board took note of the explanations for the relative underperformance during these periods, including with respect to investment decisions and market factors that affected the Fund’s performance. The Board also noted that the Fund experienced a portfolio manager change during the third quarter of 2016.
The Board also received and considered information regarding the Fund’s net operating expense ratios and their various components, including actual management fees, custodian and other non-management fees, and Rule 12b-1 and non-Rule 12b-1 shareholder service fees. The Board considered these ratios in comparison to the median ratios of funds in class-specific expense groups that were determined by Broadridge to be similar to the Fund (the “Groups”). The Board received a description of the methodology used by Broadridge to select the mutual funds in the expense Groups and an explanation of how funds comprising expense groups and their expense ratios may vary from year-to-year. Based on the Broadridge reports, the Board noted that the net operating expense ratios of the Fund were lower than the median net operating expense ratios of the expense Groups for all share classes except Administrator Class.
The Board took into account the Fund performance and expense information provided to it among the factors considered in deciding to re-approve the Advisory Agreements.
Investment management and sub-advisory fee rates
The Board reviewed and considered the contractual fee rates payable by the Fund to Funds Management under the Management Agreement, as well as the contractual fee rates payable by the Fund to Funds Management for class-level administrative services under a Class-Level Administration Agreement, which include, among other things, class-level transfer agency and sub-transfer agency costs (collectively, the “Management Rates”). The Board also reviewed and considered the contractual investment sub-advisory fee rates that are payable by Funds Management to the Sub-Adviser for investment sub-advisory services.
Among other information reviewed by the Board was a comparison of the Fund’s Management Rates with the average contractual investment management fee rates of funds in the expense Groups at a common asset level as well as transfer agency costs of the funds in the expense Groups. The Board noted that the Management Rates of the Fund were lower than or in range of the sum of these average rates for the Fund’s expense Groups for all share classes.
The Board also received and considered information about the portion of the total management fee that was retained by Funds Management after payment of the fee to the Sub-Adviser for sub-advisory services. In assessing the reasonableness of this amount, the Board received and evaluated information about the nature and extent of responsibilities retained and risks assumed by Funds Management and not delegated to or assumed by the Sub-Adviser, and about Funds Management’s on-going oversight services. Given the affiliation between Funds Management and the Sub-Adviser, the Board ascribed limited relevance to the allocation of fees between them.
The Board also received and considered information about the nature and extent of services offered and fee rates charged by Funds Management and the Sub-Adviser to other types of clients with investment strategies similar to those of the Fund. In this regard, the Board received information about the significantly greater scope of services, and compliance, reporting and other legal burdens and risks of managing mutual funds compared with those associated with managing assets of non-mutual fund clients such as institutional separate accounts.
Based on its consideration of the factors and information it deemed relevant, including those described here, the Board determined that the compensation payable to Funds Management under the Management Agreement and to the Sub-Adviser under the Sub-Advisory Agreement was reasonable.
| | | | | | |
| Other information (unaudited) | | Wells Fargo Enterprise Fund | | | 35 | |
Profitability
The Board received and considered information concerning the profitability of Funds Management, as well as the profitability of Wells Fargo as a whole, from providing services to the Fund and the fund family as a whole. The Board also received and considered information concerning the profitability of the Sub-Adviser from providing services to the fund family as a whole, noting that the Sub-Adviser’s profitability information with respect to providing services to the Fund was subsumed in the Wells Fargo and Funds Management profitability analysis.
Funds Management reported on the methodologies and estimates used in calculating profitability, including a description of the methodology used to allocate certain expenses. Among other things, the Board noted that the levels of profitability reported on a fund-by-fund basis varied widely, depending on factors such as the size and type of fund. Based on its review, the Board did not deem the profits reported by Funds Management or Wells Fargo from its services to the Fund to be at a level that would prevent it from approving the continuation of the Advisory Agreements.
Economies of scale
With respect to possible economies of scale, the Board noted the existence of breakpoints in the Fund’s management fee structure, which operate generally to reduce the Fund’s expense ratios as the Fund grows in size. It considered that, for a small fund or a fund that shrinks in size, breakpoints conversely can result in higher fee levels. The Board also considered that in addition to management fee breakpoints, competitive management fee rates set at the outset without regard to breakpoints and fee waiver and expense reimbursement arrangements are means of sharing potential economies of scale with shareholders of the Fund. The Board considered Funds Management’s view, which Funds Management indicated was supported by independent third-party industry studies which were summarized for the Board, that any analyses of potential economies of scale in managing a particular fund are inherently limited in light of the joint and common costs and investments that Funds Management incurs across the fund family as a whole.
The Board concluded that the Fund’s fee and expense arrangements, including contractual breakpoints, constituted a reasonable approach to sharing potential economies of scale with the Fund and its shareholders.
Other benefits to Funds Management and the Sub-Adviser
The Board received and considered information regarding potential “fall-out” or ancillary benefits received by Funds Management and its affiliates, including the Sub-Adviser, as a result of their relationships with the Fund. Ancillary benefits could include, among others, benefits directly attributable to other relationships with the Fund and benefits potentially derived from an increase in Funds Management’s and the Sub-Adviser’s business as a result of their relationships with the Fund. The Board noted that various affiliates of Funds Management may receive distribution-related fees, shareholder servicing payments and sub-transfer agency fees in respect of shares sold or held through them and services provided.
The Board also reviewed information about soft dollar credits earned and utilized by the Sub-Adviser, fees earned by Funds Management and the Sub-Adviser from managing a private investment vehicle for the fund family’s securities lending collateral and commissions earned by an affiliated broker from portfolio transactions.
Based on its consideration of the factors and information it deemed relevant, including those described here, the Board did not find that any ancillary benefits received by Funds Management and its affiliates, including the Sub-Adviser, were unreasonable.
Conclusion
At the Meeting, after considering the above-described factors and based on its deliberations and its evaluation of the information described above, the Board unanimously approved the continuation of the Advisory Agreements for a one-year term and determined that the compensation payable to Funds Management and the Sub-Adviser under each of the Advisory Agreements was reasonable.
| | | | |
| 36 | | Wells Fargo Enterprise Fund | | List of abbreviations |
The following is a list of common abbreviations for terms and entities that may have appeared in this report.
| ACA | — ACA Financial Guaranty Corporation |
| ADR | — American depositary receipt |
| ADS | — American depositary shares |
| AGC | — Assured Guaranty Corporation |
| AGM | — Assured Guaranty Municipal |
| Ambac | — Ambac Financial Group Incorporated |
| AMT | — Alternative minimum tax |
| BAN | — Bond anticipation notes |
| BHAC | — Berkshire Hathaway Assurance Corporation |
| CAB | — Capital appreciation bond |
| CCAB | — Convertible capital appreciation bond |
| CDA | — Community Development Authority |
| CDO | — Collateralized debt obligation |
| CLO | — Collateralized loan obligation |
| DRIVER | — Derivative inverse tax-exempt receipts |
| DW&P | — Department of Water & Power |
| DWR | — Department of Water Resources |
| ECFA | — Educational & Cultural Facilities Authority |
| EDA | — Economic Development Authority |
| EDFA | — Economic Development Finance Authority |
| ETF | — Exchange-traded fund |
| FDIC | — Federal Deposit Insurance Corporation |
| FFCB | — Federal Farm Credit Banks |
| FGIC | — Financial Guaranty Insurance Corporation |
| FHA | — Federal Housing Administration |
| FHLB | — Federal Home Loan Bank |
| FHLMC | — Federal Home Loan Mortgage Corporation |
| FICO | — The Financing Corporation |
| FNMA | — Federal National Mortgage Association |
| GDR | — Global depositary receipt |
| GNMA | — Government National Mortgage Association |
| HCFR | — Healthcare facilities revenue |
| HEFA | — Health & Educational Facilities Authority |
| HEFAR | — Higher education facilities authority revenue |
| HFA | — Housing Finance Authority |
| HFFA | — Health Facilities Financing Authority |
| HUD | — Department of Housing and Urban Development |
| IDA | — Industrial Development Authority |
| IDAG | — Industrial Development Agency |
| KRW | — Republic of Korea won |
| LIBOR | — London Interbank Offered Rate |
| LIFER | — Long Inverse Floating Exempt Receipts |
| LLC | — Limited liability company |
| LLLP | — Limited liability limited partnership |
| LLP | — Limited liability partnership |
| MBIA | — Municipal Bond Insurance Association |
| MFHR | — Multifamily housing revenue |
| MSTR | — Municipal securities trust receipts |
| MUD | — Municipal Utility District |
| National | — National Public Finance Guarantee Corporation |
| PCFA | — Pollution Control Financing Authority |
| PCL | — Public Company Limited |
| PCR | — Pollution control revenue |
| PFA | — Public Finance Authority |
| PFFA | — Public Facilities Financing Authority |
| PFOTER | — Puttable floating option tax-exempt receipts |
| PJSC | — Public Joint Stock Company |
| plc | — Public limited company |
| PUTTER | — Puttable tax-exempt receipts |
| R&D | — Research & development |
| Radian | — Radian Asset Assurance |
| RAN | — Revenue anticipation notes |
| RDA | — Redevelopment Authority |
| RDFA | — Redevelopment Finance Authority |
| REIT | — Real estate investment trust |
| ROC | — Reset option certificates |
| SAVRS | — Select auction variable rate securities |
| SBA | — Small Business Authority |
| SDR | — Swedish depositary receipt |
| SFHR | — Single-family housing revenue |
| SFMR | — Single-family mortgage revenue |
| SPA | — Standby purchase agreement |
| SPDR | — Standard & Poor’s Depositary Receipts |
| SPEAR | — Short Puttable Exempt Adjustable Receipts |
| STRIPS | — Separate trading of registered interest and |
| TAN | — Tax anticipation notes |
| TIPS | — Treasury inflation-protected securities |
| TRAN | — Tax revenue anticipation notes |
| TTFA | — Transportation Trust Fund Authority |
| TVA | — Tennessee Valley Authority |

For more information
More information about Wells Fargo Funds is available free upon request. To obtain literature, please write, email, visit the Fund’s website, or call:
Wells Fargo Funds
P.O. Box 8266
Boston, MA 02266-8266
Email: fundservice@wellsfargo.com
Website: wellsfargofunds.com
Individual investors: 1-800-222-8222
Retail investment professionals: 1-888-877-9275
Institutional investment professionals:
1-866-765-0778
This report and the financial statements contained herein are submitted for the general information of the shareholders of the Fund. If this report is used for promotional purposes, distribution of the report must be accompanied or preceded by a current prospectus. Before investing, please consider the investment objectives, risks, charges, and expenses of the investment. For a current prospectus and, if available, a summary prospectus, containing this information, call 1-800-222-8222 or visit the Fund’s website at wellsfargofunds.com. Read the prospectus carefully before you invest or send money.
Wells Fargo Asset Management (WFAM) is a trade name used by the asset management businesses of Wells Fargo & Company. Wells Fargo Funds Management, LLC, a wholly owned subsidiary of Wells Fargo & Company, provides investment advisory and administrative services for Wells Fargo Funds. Other affiliates of Wells Fargo & Company provide subadvisory and other services for the funds. The funds are distributed by Wells Fargo Funds Distributor, LLC, Member FINRA, an affiliate of Wells Fargo & Company. Neither Wells Fargo Funds Distributor nor Wells Fargo Funds Management holds fund shareholder accounts or assets. This material is for general informational and educational purposes only and is NOT intended to provide investment advice or a recommendation of any kind—including a recommendation for any specific investment, strategy, or plan.
NOT FDIC INSURED ◾ NO BANK GUARANTEE ◾ MAY LOSE VALUE
© 2017 Wells Fargo Funds Management, LLC. All rights reserved.
| | |
 | | 306437 11-17 A231/AR231 09-17 |
Annual Report
September 30, 2017

Wells Fargo Opportunity Fund


Reduce clutter. Save trees.
Sign up for electronic delivery of prospectuses and shareholder reports at wellsfargo.com/advantagedelivery
Contents
The views expressed and any forward-looking statements are as of September 30, 2017, unless otherwise noted, and are those of the Fund managers and/or Wells Fargo Funds Management, LLC. Discussions of individual securities, or the markets generally, or any Wells Fargo Fund are not intended as individual recommendations. Future events or results may vary significantly from those expressed in any forward-looking statements. The views expressed are subject to change at any time in response to changing circumstances in the market. Wells Fargo Funds Management, LLC and the Fund disclaim any obligation to publicly update or revise any views expressed or forward-looking statements.
NOT FDIC INSURED ◾ NO BANK GUARANTEE ◾ MAY LOSE VALUE
| | | | |
| 2 | | Wells Fargo Opportunity Fund | | Letter to shareholders (unaudited) |

Andrew Owen
President
Wells Fargo Funds
Favorable economic news supported stocks, and interest rates moved higher.
Hiring remained strong, and business and consumer sentiment improved.
Dear Shareholder:
We are pleased to offer you this annual report for the Wells Fargo Opportunity Fund for the 12-month period that ended September 30, 2017. Despite heightened market volatility at times, global stocks generally delivered double-digit results and bond markets had smaller but positive results as well. U.S. and international stocks returned 18.61% and 19.61%, respectively, for the 12-month period, as measured by the S&P 500 Index1 and the MSCI ACWI ex USA Index (Net),2 respectively; within fixed income, the Bloomberg Barclays U.S. Aggregate Bond Index3 returned 0.07% and the Bloomberg Barclays Municipal Bond Index4 returned 0.87% as interest rates rose from low levels.
Election results and central banks’ policies commanded investor attention as 2016 closed.
During the fourth quarter of 2016, investors appeared intent on the prospective outcomes of elections in the U.S. and central-bank actions globally. Following Donald Trump’s election victory, U.S. stocks rallied. Investors appeared optimistic that the new administration would pursue progrowth policies. Favorable economic news supported stocks, and interest rates moved higher. At their mid-December meeting, U.S. Federal Reserve (Fed) officials raised the target interest rate by a quarter percentage point to a range of 0.50% to 0.75%. The fourth quarter also saw the implementation of the U.S. Securities and Exchange Commission’s new rules for money market funds, which included floating net asset values (NAVs) as well as the possibility of liquidity fees and redemption gates for institutional prime and municipal money market funds. In the year leading up to money market fund reform implementation, nearly $1 trillion in assets moved from money market funds subject to floating NAVs into government money market funds, which continued to transact at a stable $1.00 NAV. Outside of the U.S., the prospects for faster U.S. growth appeared to trigger some acceleration in Europe.
Financial markets gained during the first two quarters of 2017 on positive economic data.
Stocks rallied globally through the first quarter of 2017, supported by signs of improvement in the U.S. and global economies. U.S. economic data released during the quarter reflected a healthy economy. Hiring remained strong, and business and consumer sentiment improved. In March, Fed officials raised their target interest rate by a quarter percentage point to a range of 0.75% to 1.00%. With the Fed’s target interest-rate increase, short-term bond yields rose during the quarter. Meanwhile, longer-term Treasury yields were little changed, leading to positive performance. Investment-grade and high-yield bonds benefited from strong demand. Municipal bond returns were positive in the quarter, helped by strong demand and constrained new-issue supply. Outside of the U.S., stocks in emerging markets generally outperformed stocks in the U.S. and international
| 1 | The S&P 500 Index consists of 500 stocks chosen for market size, liquidity, and industry group representation. It is a market-value-weighted index with each stock’s weight in the index proportionate to its market value. You cannot invest directly in an index. |
| 2 | The Morgan Stanley Capital International (MSCI) All Country World Index (ACWI) ex USA Index (Net) is a free-float-adjusted market-capitalization-weighted index that is designed to measure the equity market performance of developed markets, excluding the United States and Canada. Source: MSCI. MSCI makes no express or implied warranties or representations and shall have no liability whatsoever with respect to any MSCI data contained herein. The MSCI data may not be further redistributed or used as a basis for other indexes or any securities or financial products. This report is not approved, reviewed, or produced by MSCI. You cannot invest directly in an index. |
| 3 | The Bloomberg Barclays U.S. Aggregate Bond Index is a broad-based benchmark that measures the investment-grade, U.S. dollar-denominated, fixed-rate taxable bond market, including Treasuries, government-related and corporate securities, mortgage-backed securities (agency fixed-rate and hybrid adjustable-rate mortgage pass-throughs), asset-backed securities, and commercial mortgage-backed securities. You cannot invest directly in an index. |
| 4 | The Bloomberg Barclays Municipal Bond Index is an unmanaged index composed of long-term tax-exempt bonds with a minimum credit rating of Baa. You cannot invest directly in an index. |
| | | | | | |
| Letter to shareholders (unaudited) | | Wells Fargo Opportunity Fund | | | 3 | |
developed markets because they benefited from both global economic growth and recent weakening in the U.S. dollar. Stocks in Asia, Europe, and Latin America also outperformed the U.S. market during the quarter.
Globally, stocks marked continued gains through the second quarter of 2017. Steady, albeit modest, economic growth both in the U.S. and abroad and generally favorable corporate earnings announcements supported higher valuations. U.S. inflation trended lower despite a continued decline in the unemployment rate. Ten-year U.S. Treasury yields declined, resulting in stronger prices for long-term bonds. As was widely expected, the Fed raised the target interest rate in June by a quarter percentage point to a range of 1.00% to 1.25%. In addition, the Fed indicated that it would begin to sell bonds accumulated on its balance sheet during quantitative easing programs conducted since 2008. Later in the third quarter, the Fed confirmed that the initiative to reduce the bonds that it holds likely would begin in October.
Volatility increased during the third quarter of 2017.
Early in July and again in August, volatility expectations increased and then receded—as measured by the CBOE VIX5—amid geopolitical tensions, particularly in Asia, and declining investor optimism following unsuccessful efforts to reform health care laws in the U.S. which suggested to some that President Trump and Congress would be unable to move forward with tax and regulatory reforms.
During the quarter, economic momentum increased in Europe; the European Central Bank held its rates steady at low levels and continued its quantitative easing bond-buying program, which is intended to spark economic activity. The Bank of England suggested it could hike interest rates in November, and the pound gained against other currencies. The Bank of Japan also maintained accommodative policies intended to support business activity and economic growth. In Germany, Angela Merkel was reelected chancellor; in Japan, Prime Minister Shinzo Abe called for snap elections as his popularity increased after North Korea’s aggressive program of missile launches. Both political developments were indicative of the type of political consistency in developed markets that reassure financial markets.
In emerging markets, many countries benefited from stronger currencies versus the U.S. dollar. In addition, commodity prices were on an upward trajectory, which benefited many companies that rely on natural resources for exports.
As the quarter closed, optimism returned as economic growth continued. The second-quarter gross domestic product measure was revised higher from 2.6% annualized to 3.0%. Consumer spending and residential and nonresidential investment increased. While inflation continued to trail the Fed’s targets, expectations remained for an additional short-term interest-rate hike before year-end.
| 5 | The Chicago Board Options Exchange Market Volatility Index (CBOE VIX) is a popular measure of the implied volatility of S&P 500 Index options. It represents one measure of the market’s expectation of stock market volatility over the next 30-day period. You cannot invest directly in an index. |
| | | | |
| 4 | | Wells Fargo Opportunity Fund | | Letter to shareholders (unaudited) |
Don’t let short-term uncertainty derail long-term investment goals.
Periods of investment uncertainty can present challenges, but experience has taught us that maintaining long-term investment goals can be an effective way to plan for the future. To help you create a sound strategy based on your personal goals and risk tolerance, Wells Fargo Funds offers more than 100 mutual funds spanning a wide range of asset classes and investment styles. Although diversification cannot guarantee an investment profit or prevent losses, we believe it can be an effective way to manage investment risk and potentially smooth out overall portfolio performance. We encourage investors to know their investments and to understand that appropriate levels of risk-taking may unlock opportunities.
Thank you for choosing to invest with Wells Fargo Funds. We appreciate your confidence in us and remain committed to helping you meet your financial needs.
Sincerely,

Andrew Owen
President
Wells Fargo Funds
For further information about your Fund, contact your investment professional, visit our website at wellsfargofunds.com, or call us directly at 1-800-222-8222. We are available 24 hours a day, 7 days a week.
This page is intentionally left blank.
| | | | |
| 6 | | Wells Fargo Opportunity Fund | | Performance highlights (unaudited) |
Investment objective
The Fund seeks long-term capital appreciation.
Manager
Wells Fargo Funds Management, LLC
Subadviser
Wells Capital Management Incorporated
Portfolio managers
Ann M. Miletti
Christopher G. Miller, CFA®‡
Average annual total returns (%) as of September 30, 20171
| | | | | | | | | | | | | | | | | | | | | | | | | | | | | | | | | | |
| | | | | Including sales charge | | | Excluding sales charge | | | Expense ratios2 (%) | |
| | | Inception date | | 1 year | | | 5 year | | | 10 year | | | 1 year | | | 5 year | | | 10 year | | | Gross | | | Net3 | |
| Class A (SOPVX) | | 2-24-2000 | | | 9.81 | | | | 11.22 | | | | 5.96 | | | | 16.49 | | | | 12.54 | | | | 6.59 | | | | 1.21 | | | | 1.21 | |
| Class C (WFOPX) | | 3-31-2008 | | | 14.62 | | | | 11.70 | | | | 5.80 | | | | 15.62 | | | | 11.70 | | | | 5.80 | | | | 1.96 | | | | 1.96 | |
| Administrator Class (WOFDX) | | 8-30-2002 | | | – | | | | – | | | | – | | | | 16.74 | | | | 12.79 | | | | 6.84 | | | | 1.13 | | | | 1.00 | |
| Institutional Class (WOFNX) | | 7-30-2010 | | | – | | | | – | | | | – | | | | 17.02 | | | | 13.07 | | | | 7.02 | | | | 0.88 | | | | 0.75 | |
| Russell 3000® Index4 | | – | | | – | | | | – | | | | – | | | | 18.71 | | | | 14.23 | | | | 7.57 | | | | – | | | | – | |
Figures quoted represent past performance, which is no guarantee of future results, and do not reflect taxes that a shareholder may pay on fund distributions or the redemption of fund shares. Investment return and principal value of an investment will fluctuate so that an investor’s shares, when redeemed, may be worth more or less than their original cost. Performance shown without sales charges would be lower if sales charges were reflected. Current performance may be lower or higher than the performance data quoted, which assumes the reinvestment of dividends and capital gains. Current month-end performance is available on the Fund’s website, wellsfargofunds.com.
Index returns do not include transaction costs associated with buying and selling securities, any mutual fund fees or expenses, or any taxes. It is not possible to invest directly in an index.
For Class A shares, the maximum front-end sales charge is 5.75%. For Class C shares, the maximum contingent deferred sales charge is 1.00%. Performance including a contingent deferred sales charge assumes the sales charge for the corresponding time period. Administrator Class and Institutional Class shares are sold without a front-end sales charge or contingent deferred sales charge.
Stock values fluctuate in response to the activities of individual companies and general market and economic conditions. Smaller-company stocks tend to be more volatile and less liquid than those of larger companies. Certain investment strategies tend to increase the total risk of an investment (relative to the broader market). The Fund is exposed to foreign investment risk. Consult the Fund’s prospectus for additional information on these and other risks.
Please see footnotes on page 7.
| | | | | | |
| Performance highlights (unaudited) | | Wells Fargo Opportunity Fund | | | 7 | |
|
| Growth of $10,000 investment as of September 30, 20175 |
|
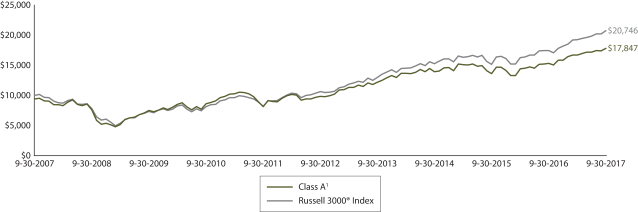 |
| ‡ | Mr. Miller became the portfolio manager of the Fund on March 1, 2017. |
| 1 | Effective June 20, 2008, Advisor Class was renamed Class A and modified to assume the features and attributes of Class A. Historical performance shown for the Class A shares through June 19, 2008, includes the expenses of Advisor Class shares. Historical performance shown for Class C shares prior to their inception reflects the performance of Class A shares and has been adjusted to reflect the higher expenses applicable to Class C shares. Historical performance shown for Institutional Class shares prior to their inception reflects the performance of Administrator Class shares, and includes the higher expenses applicable to Administrator Class shares. If these expenses had not been included, returns for Institutional Class shares would be higher. |
| 2 | Reflects the expense ratios as stated in the most recent prospectuses. The expense ratios shown are subject to change and may differ from the annualized expense ratios shown in the financial highlights of this report. |
| 3 | The manager has contractually committed through January 31, 2018, to waive fees and/or reimburse expenses to the extent necessary to cap the Fund’s Total Annual Fund Operating Expenses After Fee Waivers at the amounts shown. After this time, the cap may be increased or the commitment to maintain the cap may be terminated only with the approval of the Board of Trustees. Brokerage commissions, stamp duty fees, interest, taxes, acquired fund fees and expenses, and extraordinary expenses are excluded from the expense cap. Without this cap, the Fund’s returns would have been lower. The expense ratio paid by an investor is the net expense ratio or the Fund’s Total Annual Fund Operating Expenses After Fee Waivers, as stated in the prospectuses. |
| 4 | The Russell 3000® Index measures the performance of the 3,000 largest U.S. companies based on total market capitalization, which represents approximately 98% of the investable U.S. equity market. You cannot invest directly in an index. |
| 5 | The chart compares the performance of Class A shares for the most recent ten years with the Russell 3000® Index . The chart assumes a hypothetical investment of $10,000 in Class A shares and reflects all operating expenses and assumes the maximum initial sales charge of 5.75%. |
| 6 | The ten largest holdings, excluding cash and cash equivalents, are calculated based on the value of the investments divided by total net assets of the Fund. Holdings are subject to change and may have changed since the date specified. |
| 7 | Amounts are calculated based on the total long-term investments of the Fund. These amounts are subject to change and may have changed since the date specified. |
| * | This security was not held in the Fund at the end of the reporting period. |
| | | | |
| 8 | | Wells Fargo Opportunity Fund | | Performance highlights (unaudited) |
MANAGER’S DISCUSSION
Fund highlights
| ∎ | | The Fund underperformed its benchmark, the Russell 3000® Index, for the 12-month period that ended September 30, 2017. |
| ∎ | | Stock selection in the energy and consumer discretionary sectors detracted the most from performance. |
| ∎ | | Stock selection added value in the information technology (IT) and real estate sectors. |
The U.S. stock market rallied and many U.S. stock market indexes hit new all-time highs during the reporting period. The Fund’s benchmark, the Russell 3000® Index, was no exception and has risen for eight straight quarters. Market volatility has remained near historical lows, and larger-cap and growth stocks generally have outperformed smaller-cap and value stocks.
A number of factors influenced the U.S. stock market during the period. From our perspective, the outcome of the November 2016 U.S. elections has had the biggest impact in the U.S., with one political party ending up in control of the White House, the House of Representatives, and the Senate. The U.S. stock market has been on a tear since then as investors have expected businesses to benefit from the new administration’s progrowth policies of less regulation, lower taxes, and increased infrastructure and defense spending. The U.S. Federal Reserve (Fed) raised its benchmark interest rate by 0.25% three times during the reporting period, most recently to a range of 1.00% to 1.25% at its June 2017 meeting. The Fed also released a fairly detailed outline of its plans to reduce the size of its $4.6 trillion balance sheet.
Throughout all of the market and economic events that occurred during the reporting period and with the expectation of tighter U.S. monetary policy going forward, we continued to seek companies with what we view to be good business models, strong management teams, and healthy cash flows trading at attractive discounts to their private market valuations (PMVs). The PMV represents the expected price an investor likely would pay for the entire company as a stand-alone private entity.
| | | | |
| Ten largest holdings (%) as of September 30, 20176 | |
Alphabet Incorporated Class C | | | 3.53 | |
Apple Incorporated | | | 2.92 | |
E*TRADE Financial Corporation | | | 2.58 | |
EOG Resources Incorporated | | | 2.45 | |
Novartis AG ADR | | | 2.39 | |
Johnson Controls International plc | | | 2.28 | |
PNC Financial Services Group Incorporated | | | 2.19 | |
The Sherwin-Williams Company | | | 2.17 | |
Salesforce.com Incorporated | | | 2.11 | |
Oracle Corporation | | | 2.04 | |
Stock selection in the energy and consumer discretionary sectors hindered Fund performance.
Energy was the only sector in the Russell 3000® Index that declined during the period. While the price of oil stabilized during the period, the expectation for a meaningful increase was tempered by the lack of decline in global oil inventories and the ability of domestic shale production to respond to price signals on short order. As a result, valuations for energy-related stocks declined considerably more than the spot price of oil. The Fund’s holdings in the energy services and exploration and production industries underperformed during the period, including Newfield Exploration Company* and Pioneer Natural Resources Company. In the consumer
discretionary sector, we have continued to see a trend in consumer preferences toward shopping online instead of in brick-and-mortar stores. The Fund’s holdings in L Brands, Incorporated; Target Corporation*; and Ralph Lauren Corporation* experienced softening in same-store sales due to this trend, which led to lower valuations for these stocks.
Please see footnotes on page 7.
| | | | | | |
| Performance highlights (unaudited) | | Wells Fargo Opportunity Fund | | | 9 | |
|
| Sector distribution as of September 30, 20177 |
|
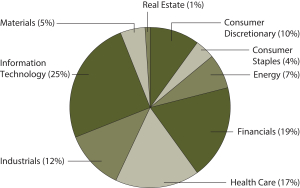 |
Fund performance benefited from positive stock selection in the IT and real estate sectors.
An overweight to and stock selection within the IT sector contributed to performance relative to the benchmark. The overweight proved beneficial as IT was the second-best-performing sector in the index for the period. A number of Fund holdings in the software and semiconductor industries delivered strong results. Check Point Software Technologies Limited provides enterprise security software, which has become a higher priority for organizations given the increasing frequency of reported data breaches and the damages they can cause. Red Hat, Incorporated, provides open-source software that has benefited from the ongoing shift to cloud computing.
Broadcom Limited benefited from exposure to the iPhone product cycle and the announced acquisition of Brocade Communications Systems, Incorporated. Within the real estate sector, American Tower Corporation, an operator of wireless and broadcast communication towers in the U.S., Europe, Asia, and Latin America, outperformed industry peers by a wide margin. American Tower has experienced an increase in business activity, and investors have anticipated that the company could benefit from a ramp-up in deployment of new communication technologies and protocols. Also within the real estate sector, the Fund benefited from lack of exposure to retail real estate investment trusts, which have been negatively affected by the consumer trend toward shopping online rather than in brick-and-mortar stores.
Our focus remains constant: to add value for shareholders through investment in attractively priced Fund holdings.
Our methodology includes buying stocks at a discount to their estimated PMV and selling stocks as they approach or exceed the upper end of their PMV range.
Our disciplined, bottom-up investment process leads us to be overweight or underweight certain sectors. This positioning changes over time based on macroeconomic and industry-specific factors. During the reporting period, our process led us to be overweight the IT and industrials sectors and underweight the real estate and utilities sectors. Through our disciplined investment process, we remain keenly aware of both price and enterprise values on a company-by-company basis. Our proprietary database of company acquisitions across industries, sectors, and time frames enables us to maintain a steady foundation for assessing the PMVs of companies compared with their public stock prices. We strive to take advantage of those price discrepancies for the benefit of Fund shareholders by purchasing stocks when we believe they are selling at a discount to their PMVs.
Looking ahead, interest rates, energy prices, and the policies of the U.S. government likely may be themes that influence the overall market and the relative performance of the Fund. The U.S. administration has been promoting lower taxes, increased infrastructure spending, and reduced regulations—generally, a probusiness environment. However, changes in trade agreements and the eventual winners and losers from tax and regulatory reforms remain key items to watch. The Fed has signaled more rate hikes in late 2017 and 2018 if labor markets tighten further, global economic risks remain well balanced, and inflation measures hit the Fed’s target. Volatility in commodities prices and global currencies likely may continue to drive global stock markets.
Please see footnotes on page 7.
| | | | |
| 10 | | Wells Fargo Opportunity Fund | | Fund expenses (unaudited) |
As a shareholder of the Fund, you incur two types of costs: (1) transaction costs, including sales charges (loads) on purchase payments and contingent deferred sales charges (if any) on redemptions and (2) ongoing costs, including management fees, distribution (12b-1) and/or shareholder servicing fees, and other Fund expenses. This example is intended to help you understand your ongoing costs (in dollars) of investing in the Fund and to compare these costs with the ongoing costs of investing in other mutual funds.
The example is based on an investment of $1,000 invested at the beginning of the six-month period and held for the entire period from April 1, 2017 to September 30, 2017.
Actual expenses
The “Actual” line of the table below provides information about actual account values and actual expenses. You may use the information in this line, together with the amount you invested, to estimate the expenses that you paid over the period. Simply divide your account value by $1,000 (for example, an $8,600 account value divided by $1,000 = 8.6), then multiply the result by the number in the “Actual” line under the heading entitled “Expenses paid during period” for your applicable class of shares to estimate the expenses you paid on your account during this period.
Hypothetical example for comparison purposes
The “Hypothetical” line of the table below provides information about hypothetical account values and hypothetical expenses based on the Fund’s actual expense ratio and an assumed rate of return of 5% per year before expenses, which is not the Fund’s actual return. The hypothetical account values and expenses may not be used to estimate the actual ending account balance or expenses you paid for the period. You may use this information to compare the ongoing costs of investing in the Fund and other funds. To do so, compare this 5% hypothetical example with the 5% hypothetical examples that appear in the shareholder reports of the other funds.
Please note that the expenses shown in the table are meant to highlight your ongoing costs only and do not reflect any transactional costs, such as sales charges (loads) and contingent deferred sales charges. Therefore, the “Hypothetical” line of the table is useful in comparing ongoing costs only and will not help you determine the relative total costs of owning different funds. In addition, if these transactional costs were included, your costs would have been higher.
| | | | | | | | | | | | | | | | |
| | | Beginning
account value
4-1-2017 | | | Ending
account value
9-30-2017 | | | Expenses
paid during
the period¹ | | | Annualized net
expense ratio | |
Class A | | | | | | | | | | | | | | | | |
Actual | | $ | 1,000.00 | | | $ | 1,066.06 | | | $ | 6.25 | | | | 1.21 | % |
Hypothetical (5% return before expenses) | | $ | 1,000.00 | | | $ | 1,019.02 | | | $ | 6.11 | | | | 1.21 | % |
Class C | | | | | | | | | | | | | | | | |
Actual | | $ | 1,000.00 | | | $ | 1,062.07 | | | $ | 10.11 | | | | 1.96 | % |
Hypothetical (5% return before expenses) | | $ | 1,000.00 | | | $ | 1,015.26 | | | $ | 9.88 | | | | 1.96 | % |
Administrator Class | | | | | | | | | | | | | | | | |
Actual | | $ | 1,000.00 | | | $ | 1,067.11 | | | $ | 5.18 | | | | 1.00 | % |
Hypothetical (5% return before expenses) | | $ | 1,000.00 | | | $ | 1,020.05 | | | $ | 5.06 | | | | 1.00 | % |
Institutional Class | | | | | | | | | | | | | | | | |
Actual | | $ | 1,000.00 | | | $ | 1,068.39 | | | $ | 3.89 | | | | 0.75 | % |
Hypothetical (5% return before expenses) | | $ | 1,000.00 | | | $ | 1,021.31 | | | $ | 3.80 | | | | 0.75 | % |
| 1 | Expenses paid is equal to the annualized net expense ratio of each class multiplied by the average account value over the period, multiplied by the number of days in the most recent fiscal half-year divided by the number of days in the fiscal year (to reflect the one-half-year period). |
| | | | | | |
| Portfolio of investments—September 30, 2017 | | Wells Fargo Opportunity Fund | | | 11 | |
| | | | | | | | | | | | | | | | |
| Security name | | | | | | | | Shares | | | Value | |
| | | | | | | | | | | | | | | | |
| | | | |
Common Stocks: 96.70% | | | | | | | | | | | | | | | | |
| | | | |
Consumer Discretionary: 10.14% | | | | | | | | | | | | | | | | |
| | | | |
| Hotels, Restaurants & Leisure: 2.88% | | | | | | | | | | | | | | | | |
Royal Caribbean Cruises Limited | | | | | | | | | | | 131,827 | | | $ | 15,626,771 | |
Starbucks Corporation | | | | | | | | | | | 664,377 | | | | 35,683,689 | |
| | | | |
| | | | | | | | | | | | | | | 51,310,460 | |
| | | | | | | | | | | | | | | | |
| | | | |
| Internet & Direct Marketing Retail: 1.11% | | | | | | | | | | | | | | | | |
Amazon.com Incorporated † | | | | | | | | | | | 20,460 | | | | 19,669,221 | |
| | | | | | | | | | | | | | | | |
| | | | |
| Media: 3.45% | | | | | | | | | | | | | | | | |
Comcast Corporation Class A | | | | | | | | | | | 830,825 | | | | 31,970,146 | |
Twenty-First Century Fox Incorporated Class B | | | | | | | | | | | 1,138,730 | | | | 29,367,847 | |
| | | | |
| | | | | | | | | | | | | | | 61,337,993 | |
| | | | | | | | | | | | | | | | |
| | | | |
| Multiline Retail: 1.77% | | | | | | | | | | | | | | | | |
Dollar General Corporation | | | | | | | | | | | 388,215 | | | | 31,464,826 | |
| | | | | | | | | | | | | | | | |
| | | | |
| Specialty Retail: 0.93% | | | | | | | | | | | | | | | | |
L Brands Incorporated | | | | | | | | | | | 399,558 | | | | 16,625,608 | |
| | | | | | | | | | | | | | | | |
| | | | |
Consumer Staples: 4.04% | | | | | | | | | | | | | | | | |
| | | | |
| Food Products: 1.52% | | | | | | | | | | | | | | | | |
The Hershey Company | | | | | | | | | | | 247,185 | | | | 26,985,186 | |
| | | | | | | | | | | | | | | | |
| | | | |
| Household Products: 1.22% | | | | | | | | | | | | | | | | |
Church & Dwight Company Incorporated | | | | | | | | | | | 449,415 | | | | 21,774,157 | |
| | | | | | | | | | | | | | | | |
| | | | |
| Personal Products: 1.30% | | | | | | | | | | | | | | | | |
The Estee Lauder Companies Incorporated Class A | | | | | | | | | | | 214,035 | | | | 23,081,534 | |
| | | | | | | | | | | | | | | | |
| | | | |
Energy: 6.65% | | | | | | | | | | | | | | | | |
| | | | |
| Oil, Gas & Consumable Fuels: 6.65% | | | | | | | | | | | | | | | | |
Concho Resources Incorporated † | | | | | | | | | | | 212,131 | | | | 27,941,895 | |
EOG Resources Incorporated | | | | | | | | | | | 450,487 | | | | 43,580,112 | |
Pioneer Natural Resources Company | | | | | | | | | | | 149,060 | | | | 21,992,312 | |
RSP Permian Incorporated † | | | | | | | | | | | 718,712 | | | | 24,860,248 | |
| | | | |
| | | | | | | | | | | | | | | 118,374,567 | |
| | | | | | | | | | | | | | | | |
| | | | |
Financials: 18.09% | | | | | | | | | | | | | | | | |
| | | | |
| Banks: 7.65% | | | | | | | | | | | | | | | | |
KeyCorp | | | | | | | | | | | 1,813,219 | | | | 34,124,782 | |
Pinnacle Financial Partners Incorporated | | | | | | | | | | | 429,898 | | | | 28,781,671 | |
PNC Financial Services Group Incorporated | | | | | | | | | | | 289,699 | | | | 39,042,734 | |
Webster Financial Corporation | | | | | | | | | | | 648,391 | | | | 34,072,947 | |
| | | | |
| | | | | | | | | | | | | | | 136,022,134 | |
| | | | | | | | | | | | | | | | |
The accompanying notes are an integral part of these financial statements.
| | | | |
| 12 | | Wells Fargo Opportunity Fund | | Portfolio of investments—September 30, 2017 |
| | | | | | | | | | | | | | | | |
| Security name | | | | | | | | Shares | | | Value | |
| | | | | | | | | | | | | | | | |
| | | | |
| Capital Markets: 4.00% | | | | | | | | | | | | | | | | |
E*TRADE Financial Corporation † | | | | | | | | | | | 1,052,980 | | | $ | 45,920,458 | |
Intercontinental Exchange Incorporated | | | | | | | | | | | 368,431 | | | | 25,311,210 | |
| | | | |
| | | | | | | | | | | | | | | 71,231,668 | |
| | | | | | | | | | | | | | | | |
| | | | |
| Insurance: 6.44% | | | | | | | | | | | | | | | | |
Aon plc | | | | | | | | | | | 218,657 | | | | 31,945,788 | |
Chubb Limited | | | | | | | | | | | 246,446 | | | | 35,130,877 | |
The Progressive Corporation | | | | | | | | | | | 406,899 | | | | 19,702,050 | |
Willis Towers Watson plc | | | | | | | | | | | 180,574 | | | | 27,849,928 | |
| | | | |
| | | | | | | | | | | | | | | 114,628,643 | |
| | | | | | | | | | | | | | | | |
| | | | |
Health Care: 15.95% | | | | | | | | | | | | | | | | |
| | | | |
| Biotechnology: 2.58% | | | | | | | | | | | | | | | | |
Alexion Pharmaceuticals Incorporated † | | | | | | | | | | | 83,554 | | | | 11,721,791 | |
Celgene Corporation † | | | | | | | | | | | 233,856 | | | | 34,100,882 | |
| | | | |
| | | | | | | | | | | | | | | 45,822,673 | |
| | | | | | | | | | | | | | | | |
| | | | |
| Health Care Equipment & Supplies: 2.71% | | | | | | | | | | | | | | | | |
Medtronic plc | | | | | | | | | | | 334,662 | | | | 26,026,664 | |
Zimmer Biomet Holdings Incorporated | | | | | | | | | | | 190,257 | | | | 22,277,192 | |
| | | | |
| | | | | | | | | | | | | | | 48,303,856 | |
| | | | | | | | | | | | | | | | |
| | | | |
| Health Care Providers & Services: 2.40% | | | | | | | | | | | | | | | | |
Cigna Corporation | | | | | | | | | | | 141,249 | | | | 26,405,088 | |
Envision Healthcare Corporation † | | | | | | | | | | | 364,365 | | | | 16,378,207 | |
| | | | |
| | | | | | | | | | | | | | | 42,783,295 | |
| | | | | | | | | | | | | | | | |
| | | | |
| Life Sciences Tools & Services: 4.64% | | | | | | | | | | | | | | | | |
Agilent Technologies Incorporated | | | | | | | | | | | 380,952 | | | | 24,457,118 | |
Bio-Rad Laboratories Incorporated Class A † | | | | | | | | | | | 149,901 | | | | 33,311,000 | |
Thermo Fisher Scientific Incorporated | | | | | | | | | | | 130,692 | | | | 24,726,926 | |
| | | | |
| | | | | | | | | | | | | | | 82,495,044 | |
| | | | | | | | | | | | | | | | |
| | | | |
| Pharmaceuticals: 3.62% | | | | | | | | | | | | | | | | |
Mylan NV † | | | | | | | | | | | 701,394 | | | | 22,002,730 | |
Novartis AG ADR | | | | | | | | | | | 494,764 | | | | 42,475,489 | |
| | | | |
| | | | | | | | | | | | | | | 64,478,219 | |
| | | | | | | | | | | | | | | | |
| | | | |
Industrials: 11.89% | | | | | | | | | | | | | | | | |
| | | | |
| Aerospace & Defense: 1.53% | | | | | | | | | | | | | | | | |
Lockheed Martin Corporation | | | | | | | | | | | 87,883 | | | | 27,269,216 | |
| | | | | | | | | | | | | | | | |
| | | | |
| Airlines: 1.23% | | | | | | | | | | | | | | | | |
United Continental Holdings Incorporated † | | | | | | | | | | | 357,804 | | | | 21,783,108 | |
| | | | | | | | | | | | | | | | |
| | | | |
| Building Products: 2.28% | | | | | | | | | | | | | | | | |
Johnson Controls International plc | | | | | | | | | | | 1,007,933 | | | | 40,609,621 | |
| | | | | | | | | | | | | | | | |
The accompanying notes are an integral part of these financial statements.
| | | | | | |
| Portfolio of investments—September 30, 2017 | | Wells Fargo Opportunity Fund | | | 13 | |
| | | | | | | | | | | | | | | | |
| Security name | | | | | | | | Shares | | | Value | |
| | | | | | | | | | | | | | | | |
| | | | |
| Commercial Services & Supplies: 1.28% | | | | | | | | | | | | | | | | |
Republic Services Incorporated | | | | | | | | | | | 345,143 | | | $ | 22,800,147 | |
| | | | | | | | | | | | | | | | |
| | | | |
| Electrical Equipment: 1.62% | | | | | | | | | | | | | | | | |
Eaton Corporation plc | | | | | | | | | | | 374,228 | | | | 28,736,968 | |
| | | | | | | | | | | | | | | | |
| | | | |
| Machinery: 3.00% | | | | | | | | | | | | | | | | |
Colfax Corporation † | | | | | | | | | | | 670,701 | | | | 27,927,990 | |
Gardner Denver Holdings Incorporated † | | | | | | | | | | | 924,287 | | | | 25,436,378 | |
| | | | |
| | | | | | | | | | | | | | | 53,364,368 | |
| | | | | | | | | | | | | | | | |
| | | | |
| Road & Rail: 0.95% | | | | | | | | | | | | | | | | |
Hertz Global Holdings Incorporated †« | | | | | | | | | | | 758,960 | | | | 16,970,346 | |
| | | | | | | | | | | | | | | | |
| | | | |
Information Technology: 23.89% | | | | | | | | | | | | | | | | |
| | | | |
| Electronic Equipment, Instruments & Components: 1.71% | | | | | | | | | | | | | | | | |
Amphenol Corporation Class A | | | | | | | | | | | 360,361 | | | | 30,500,955 | |
| | | | | | | | | | | | | | | | |
| | | | |
| Internet Software & Services: 5.25% | | | | | | | | | | | | | | | | |
Alphabet Incorporated Class C † | | | | | | | | | | | 65,429 | | | | 62,753,608 | |
Facebook Incorporated Class A † | | | | | | | | | | | 179,931 | | | | 30,744,810 | |
| | | | |
| | | | | | | | | | | | | | | 93,498,418 | |
| | | | | | | | | | | | | | | | |
| | | | |
| IT Services: 3.58% | | | | | | | | | | | | | | | | |
Fidelity National Information Services Incorporated | | | | | | | | | | | 321,347 | | | | 30,010,596 | |
MasterCard Incorporated Class A | | | | | | | | | | | 239,101 | | | | 33,761,061 | |
| | | | |
| | | | | | | | | | | | | | | 63,771,657 | |
| | | | | | | | | | | | | | | | |
| | | | |
| Semiconductors & Semiconductor Equipment: 3.59% | | | | | | | | | | | | | | | | |
Broadcom Limited | | | | | | | | | | | 128,111 | | | | 31,072,042 | |
Texas Instruments Incorporated | | | | | | | | | | | 364,980 | | | | 32,716,807 | |
| | | | |
| | | | | | | | | | | | | | | 63,788,849 | |
| | | | | | | | | | | | | | | | |
| | | | |
| Software: 6.84% | | | | | | | | | | | | | | | | |
Check Point Software Technologies Limited † | | | | | | | | | | | 188,664 | | | | 21,511,469 | |
Oracle Corporation | | | | | | | | | | | 751,662 | | | | 36,342,858 | |
Red Hat Incorporated † | | | | | | | | | | | 237,267 | | | | 26,303,420 | |
Salesforce.com Incorporated † | | | | | | | | | | | 401,527 | | | | 37,510,652 | |
| | | | |
| | | | | | | | | | | | | | | 121,668,399 | |
| | | | | | | | | | | | | | | | |
| | | | |
| Technology Hardware, Storage & Peripherals: 2.92% | | | | | | | | | | | | | | | | |
Apple Incorporated | | | | | | | | | | | 336,980 | | | | 51,935,358 | |
| | | | | | | | | | | | | | | | |
| | | | |
Materials: 4.62% | | | | | | | | | | | | | | | | |
| | | | |
| Chemicals: 2.17% | | | | | | | | | | | | | | | | |
The Sherwin-Williams Company | | | | | | | | | | | 107,853 | | | | 38,615,688 | |
| | | | | | | | | | | | | | | | |
The accompanying notes are an integral part of these financial statements.
| | | | |
| 14 | | Wells Fargo Opportunity Fund | | Portfolio of investments—September 30, 2017 |
| | | | | | | | | | | | | | | | |
| Security name | | | | | | | | Shares | | | Value | |
| | | | | | | | | | | | | | | | |
| | | | |
| Metals & Mining: 2.45% | | | | | | | | | | | | | | | | |
Goldcorp Incorporated | | | | | | | | | | | 1,431,425 | | | $ | 18,551,268 | |
Steel Dynamics Incorporated | | | | | | | | | | | 727,114 | | | | 25,063,620 | |
| | | | |
| | | | | | | | | | | | | | | 43,614,888 | |
| | | | | | | | | | | | | | | | |
| | | | |
Real Estate: 1.43% | | | | | | | | | | | | | | | | |
| | | | |
| Equity REITs: 1.43% | | | | | | | | | | | | | | | | |
American Tower Corporation | | | | | | | | | | | 186,536 | | | | 25,495,740 | |
| | | | | | | | | | | | | | | | |
| | | | |
Total Common Stocks (Cost $1,247,841,887) | | | | | | | | | | | | | | | 1,720,812,810 | |
| | | | | | | | | | | | | | | | |
| | | | |
| | | Yield | | | | | | | | | | |
| | | | |
Short-Term Investments: 4.31% | | | | | | | | | | | | | | | | |
| | | | |
| Investment Companies: 4.31% | | | | | | | | | | | | | | | | |
Securities Lending Cash Investment LLC (l)(r)(u) | | | 1.25 | % | | | | | | | 17,482,656 | | | | 17,484,405 | |
Wells Fargo Government Money Market Fund Select Class (l)(u) | | | 0.92 | % | | | | | | | 59,194,191 | | | | 59,194,191 | |
| | | | |
Total Short-Term Investments (Cost $76,678,596) | | | | | | | | | | | | | | | 76,678,596 | |
| | | | | | | | | | | | | | | | |
| | | | | | | | |
| Total investments in securities (Cost $1,324,520,483) | | | 101.01 | % | | | 1,797,491,406 | |
Other assets and liabilities, net | | | (1.01 | ) | | | (17,952,595 | ) |
| | | | | | | | |
| Total net assets | | | 100.00 | % | | $ | 1,779,538,811 | |
| | | | | | | | |
| † | Non-income-earning security |
| « | All or a portion of this security is on loan. |
| (l) | The issuer of the security is an affiliated person of the Fund as defined in the Investment Company Act of 1940. |
| (r) | The investment is a non-registered investment company purchased with cash collateral received from securities on loan. |
| (u) | The rate represents the 7-day annualized yield at period end. |
Investments in Affiliates
An affiliated investment is an investment in which the Fund owns at least 5% of the outstanding voting shares of the issuer or as a result of other relationships, such as the Fund and the issuer having the same investment manager. Transactions with issuers that were either affiliated persons of the Fund at the beginning of the period or the end of the period were as follows:
| | | | | | | | | | | | | | | | | | | | | | | | | | | | | | | | | | | | |
| | | Shares,
beginning of
period | | | Shares
purchased | | | Shares
sold | | | Shares, end of
period | | | Net
realized
gains
(losses) | | | Net change in unrealized
gains
(losses) | | | Income
from
affiliated
securities | | | Value,
end
of period | | | % of
net
assets | |
Short-Term Investments | | | | | | | | | | | | | | | | | | | | | | | | | | | | | | | | | | | | |
| | | | | | | | | |
Investment companies | | | | | | | | | | | | | | | | | | | | | | | | | | | | | | | | | | | | |
Securities Lending Cash Investment LLC | | | 16,584,600 | | | | 293,325,424 | | | | 292,427,368 | | | | 17,482,656 | | | $ | 1,797 | | | $ | 0 | | | $ | 110,062 | | | $ | 17,484,405 | | | | | |
Wells Fargo Government Money Market Fund Select Class | | | 25,778,872 | | | | 383,886,083 | | | | 350,470,764 | | | | 59,194,191 | | | | 0 | | | | 0 | | | | 141,734 | | | | 59,194,191 | | | | | |
| | | | | | | | | | | | | | | | | | | | | | | | | | | | | | | | | | | | |
| | | | | | | | | | | | | | | | | | $ | 1,797 | | | $ | 0 | | | $ | 251,796 | | | $ | 76,678,596 | | | | 4.31 | % |
| | | | | | | | | | | | | | | | | | | | | | | | | | | | | | | | | | | | |
The accompanying notes are an integral part of these financial statements.
| | | | | | |
| Statement of assets and liabilities—September 30, 2017 | | Wells Fargo Opportunity Fund | | | 15 | |
| | | | |
| | | | |
| |
Assets | | | | |
Investments in unaffiliated securities (including $16,121,560 of securities loaned), at value (cost $1,247,841,887) | | $ | 1,720,812,810 | |
Investments in affiliated securities, at value (cost $76,678,596) | | | 76,678,596 | |
Receivable for Fund shares sold | | | 101,970 | |
Receivable for dividends | | | 1,976,862 | |
Receivable for securities lending income | | | 10,606 | |
Prepaid expenses and other assets | | | 60,767 | |
| | | | |
Total assets | | | 1,799,641,611 | |
| | | | |
| |
Liabilities | | | | |
Payable upon receipt of securities loaned | | | 17,484,250 | |
Management fee payable | | | 1,047,367 | |
Payable for Fund shares redeemed | | | 666,304 | |
Administration fees payable | | | 295,289 | |
Distribution fee payable | | | 20,947 | |
Accrued expenses and other liabilities | | | 588,643 | |
| | | | |
Total liabilities | | | 20,102,800 | |
| | | | |
Total net assets | | $ | 1,779,538,811 | |
| | | | |
| |
NET ASSETS CONSIST OF | | | | |
Paid-in capital | | $ | 1,088,986,182 | |
Undistributed net investment income | | | 7,274,751 | |
Accumulated net realized gains on investments | | | 210,306,955 | |
Net unrealized gains on investments | | | 472,970,923 | |
| | | | |
Total net assets | | $ | 1,779,538,811 | |
| | | | |
| |
COMPUTATION OF NET ASSET VALUE AND OFFERING PRICE PER SHARE | | | | |
Net assets – Class A | | $ | 1,479,456,958 | |
Shares outstanding – Class A1 | | | 32,280,705 | |
Net asset value per share – Class A | | | $45.83 | |
Maximum offering price per share – Class A2 | | | $48.63 | |
Net assets – Class C | | $ | 33,057,073 | |
Shares outstanding – Class C1 | | | 760,604 | |
Net asset value per share – Class C | | | $43.46 | |
Net assets – Administrator Class | | $ | 237,315,412 | |
Shares outstanding – Administrator Class1 | | | 4,799,561 | |
Net asset value per share – Administrator Class | | | $49.45 | |
Net assets – Institutional Class | | $ | 29,709,368 | |
Shares outstanding – Institutional Class1 | | | 590,647 | |
Net asset value per share – Institutional Class | | | $50.30 | |
| 1 | The Fund has an unlimited number of authorized shares. |
| 2 | Maximum offering price is computed as 100/94.25 of net asset value. On investments of $50,000 or more, the offering price is reduced. |
The accompanying notes are an integral part of these financial statements.
| | | | |
| 16 | | Wells Fargo Opportunity Fund | | Statement of operations—year ended September 30, 2017 |
| | | | |
| | | | |
| |
Investment income | | | | |
Dividends (net of foreign withholding taxes of $117,258) | | $ | 22,526,339 | |
Income from affiliated securities | | | 251,796 | |
| | | | |
Total investment income | | | 22,778,135 | |
| | | | |
| |
Expenses | | | | |
Management fee | | | 12,527,715 | |
Administration fees | |
Class A | | | 3,037,365 | |
Class B | | | 1,190 | 1 |
Class C | | | 71,829 | |
Administrator Class | | | 298,895 | |
Institutional Class | | | 32,752 | |
Shareholder servicing fees | |
Class A | | | 3,615,910 | |
Class B | | | 1,417 | 1 |
Class C | | | 85,511 | |
Administrator Class | | | 574,393 | |
Distribution fees | |
Class B | | | 4,251 | 1 |
Class C | | | 256,534 | |
Custody and accounting fees | | | 94,411 | |
Professional fees | | | 51,677 | |
Registration fees | | | 85,453 | |
Shareholder report expenses | | | 156,848 | |
Trustees’ fees and expenses | | | 20,282 | |
Other fees and expenses | | | 34,121 | |
| | | | |
Total expenses | | | 20,950,554 | |
Less: Fee waivers and/or expense reimbursements | | | (323,867 | ) |
| | | | |
Net expenses | | | 20,626,687 | |
| | | | |
Net investment income | | | 2,151,448 | |
| | | | |
| |
REALIZED AND UNREALIZED GAINS (LOSSES) ON INVESTMENTS | | | | |
|
Net realized gains on: | |
Unaffiliated securities | | | 215,324,024 | |
Affiliated securities | | | 1,797 | |
| | | | |
Net realized gains on investments | | | 215,325,821 | |
Net change in unrealized gains (losses) on investments | | | 48,036,389 | |
| | | | |
Net realized and unrealized gains (losses) on investments | | | 263,362,210 | |
| | | | |
Net increase in net assets resulting from operations | | $ | 265,513,658 | |
| | | | |
| 1 | For the period from October 1, 2016 to May 5, 2017. Effective at the close of business on May 5, 2017, Class B shares were converted to Class A shares and are no longer offered by the Fund. |
The accompanying notes are an integral part of these financial statements.
| | | | | | |
| Statement of changes in net assets | | Wells Fargo Opportunity Fund | | | 17 | |
| | | | | | | | | | | | | | | | |
| | | Year ended
September 30, 2017 | | | Year ended
September 30, 2016 | |
| | | | |
Operations | | | | | | | | | | | | | | | | |
Net investment income | | | | | | $ | 2,151,448 | | | | | | | $ | 6,138,111 | |
Net realized gains on investments | | | | | | | 215,325,821 | | | | | | | | 105,020,650 | |
Net change in unrealized gains (losses) on investments | | | | | | | 48,036,389 | | | | | | | | 87,822,225 | |
| | | | |
Net increase in net assets resulting from operations | | | | | | | 265,513,658 | | | | | | | | 198,980,986 | |
| | | | |
| | | | |
Distributions to shareholders from | | | | | | | | | | | | | | | | |
Net investment income | | | | | | | | | | | | | | | | |
Class A | | | | | | | (4,495,053 | ) | | | | | | | (20,934,141 | ) |
Class C | | | | | | | 0 | | | | | | | | (189,287 | ) |
Administrator Class | | | | | | | (942,123 | ) | | | | | | | (3,656,721 | ) |
Institutional Class | | | | | | | (123,346 | ) | | | | | | | (234,706 | ) |
Net realized gains | | | | | | | | | | | | | | | | |
Class A | | | | | | | (83,846,276 | ) | | | | | | | (185,395,064 | ) |
Class B | | | | | | | (69,785 | )1 | | | | | | | (425,984 | ) |
Class C | | | | | | | (2,126,589 | ) | | | | | | | (4,995,377 | ) |
Administrator Class | | | | | | | (12,365,471 | ) | | | | | | | (27,497,135 | ) |
Institutional Class | | | | | | | (1,124,308 | ) | | | | | | | (1,456,485 | ) |
| | | | |
Total distributions to shareholders | | | | | | | (105,092,951 | ) | | | | | | | (244,784,900 | ) |
| | | | |
| | | | |
Capital share transactions | | | Shares | | | | | | | | Shares | | | | | |
Proceeds from shares sold | | | | | | | | | | | | | | | | |
Class A | | | 431,395 | | | | 18,572,948 | | | | 24,061,660 | | | | 1,119,678,940 | |
Class B | | | 104 | 1 | | | 4,292 | 1 | | | 2 | | | | 80 | |
Class C | | | 18,274 | | | | 754,023 | | | | 13,720 | | | | 517,107 | |
Administrator Class | | | 90,883 | | | | 4,235,879 | | | | 129,304 | | | | 5,492,475 | |
Institutional Class | | | 375,768 | | | | 17,731,095 | | | | 198,222 | | | | 8,697,552 | |
Investor Class | | | N/A | | | | N/A | | | | 14,679 | 2 | | | 683,049 | 2 |
| | | | |
| | | | | | | 41,298,237 | | | | | | | | 1,135,069,203 | |
| | | | |
Reinvestment of distributions | | | | | | | | | | | | | | | | |
Class A | | | 2,058,839 | | | | 86,052,018 | | | | 5,133,573 | | | | 200,595,023 | |
Class B | | | 1,720 | 1 | | | 68,785 | 1 | | | 11,360 | | | | 422,382 | |
Class C | | | 49,931 | | | | 1,986,269 | | | | 129,505 | | | | 4,817,319 | |
Administrator Class | | | 278,197 | | | | 12,532,938 | | | | 701,312 | | | | 29,406,409 | |
Institutional Class | | | 24,783 | | | | 1,134,964 | | | | 33,469 | | | | 1,426,272 | |
| | | | |
| | | | | | | 101,774,974 | | | | | | | | 236,667,405 | |
| | | | |
Payment for shares redeemed | | | | | | | | | | | | | | | | |
Class A | | | (4,097,274 | ) | | | (176,512,570 | ) | | | (4,306,621 | ) | | | (173,325,216 | ) |
Class B | | | (44,500 | )1 | | | (1,816,478 | )1 | | | (54,234 | ) | | | (2,123,946 | ) |
Class C | | | (175,866 | ) | | | (7,256,150 | ) | | | (169,002 | ) | | | (6,566,702 | ) |
Administrator Class | | | (602,797 | ) | | | (27,931,325 | ) | | | (640,144 | ) | | | (27,663,783 | ) |
Institutional Class | | | (187,341 | ) | | | (8,851,083 | ) | | | (108,868 | ) | | | (4,765,522 | ) |
Investor Class | | | N/A | | | | N/A | | | | (23,333,080 | )2 | | | (1,113,901,150 | )2 |
| | | | |
| | | | | | | (222,367,606 | ) | | | | | | | (1,328,346,319 | ) |
| | | | |
Net increase (decrease) in net assets resulting from capital share transactions | | | | | | | (79,294,395 | ) | | | | | | | 43,390,289 | |
| | | | |
Total increase (decrease) in net assets | | | | | | | 81,126,312 | | | | | | | | (2,413,625 | ) |
| | | | |
| | | | |
Net assets | | | | | | | | | | | | | | | | |
Beginning of period | | | | | | | 1,698,412,499 | | | | | | | | 1,700,826,124 | |
| | | | |
End of period | | | | | | $ | 1,779,538,811 | | | | | | | $ | 1,698,412,499 | |
| | | | |
Undistributed net investment income | | | | | | $ | 7,274,751 | | | | | | | $ | 5,457,563 | |
| | | | |
| 1 | For the period from October 1, 2016 to May 5, 2017. Effective at the close of business on May 5, 2017, Class B shares were converted to Class A shares and are no longer offered by the Fund. |
| 2 | For the period from October 1, 2015 to October 23, 2015. Effective at the close of business on October 23, 2015, Investor Class shares were converted to Class A shares and are no longer offered by the Fund. |
The accompanying notes are an integral part of these financial statements.
| | | | |
| 18 | | Wells Fargo Opportunity Fund | | Financial highlights |
(For a share outstanding throughout each period)
| | | | | | | | | | | | | | | | | | | | |
| | | Year ended September 30 | |
| CLASS A | | 2017 | | | 2016 | | | 2015 | | | 2014 | | | 2013 | |
Net asset value, beginning of period | | | $41.86 | | | | $43.35 | | | | $49.56 | | | | $46.23 | | | | $38.99 | |
Net investment income (loss) | | | 0.04 | | | | 0.13 | 1 | | | 0.64 | | | | (0.07 | ) | | | (0.04 | ) |
Net realized and unrealized gains (losses) on investments | | | 6.60 | | | | 4.72 | | | | (1.52 | ) | | | 6.46 | | | | 8.80 | |
| | | | | | | | | | | | | | | | | | | | |
Total from investment operations | | | 6.64 | | | | 4.85 | | | | (0.88 | ) | | | 6.39 | | | | 8.76 | |
Distributions to shareholders from | | | | | | | | | | | | | | | | | | | | |
Net investment income | | | (0.13 | ) | | | (0.57 | ) | | | 0.00 | | | | 0.00 | | | | 0.00 | |
Net realized gains | | | (2.54 | ) | | | (5.77 | ) | | | (5.33 | ) | | | (3.06 | ) | | | (1.52 | ) |
| | | | | | | | | | | | | | | | | | | | |
Total distributions to shareholders | | | (2.67 | ) | | | (6.34 | ) | | | (5.33 | ) | | | (3.06 | ) | | | (1.52 | ) |
Net asset value, end of period | | | $45.83 | | | | $41.86 | | | | $43.35 | | | | $49.56 | | | | $46.23 | |
Total return2 | | | 16.49 | % | | | 12.46 | % | | | (2.27 | )% | | | 14.35 | % | | | 23.31 | % |
Ratios to average net assets (annualized) | | | | | | | | | | | | | | | | | | | | |
Gross expenses | | | 1.21 | % | | | 1.21 | % | | | 1.24 | % | | | 1.26 | % | | | 1.26 | % |
Net expenses | | | 1.21 | % | | | 1.21 | % | | | 1.22 | % | | | 1.22 | % | | | 1.23 | % |
Net investment income (loss) | | | 0.11 | % | | | 0.33 | % | | | 1.30 | % | | | (0.13 | )% | | | (0.08 | )% |
Supplemental data | | | | | | | | | | | | | | | | | | | | |
Portfolio turnover rate | | | 43 | % | | | 34 | % | | | 42 | % | | | 32 | % | | | 26 | % |
Net assets, end of period (000s omitted) | | | $1,479,457 | | | | $1,418,614 | | | | $390,154 | | | | $442,840 | | | | $431,201 | |
| 1 | Calculated based upon average shares outstanding |
| 2 | Total return calculations do not include any sales charges. |
The accompanying notes are an integral part of these financial statements.
| | | | | | |
| Financial highlights | | Wells Fargo Opportunity Fund | | | 19 | |
(For a share outstanding throughout each period)
| | | | | | | | | | | | | | | | | | | | |
| | | Year ended September 30 | |
| CLASS C | | 2017 | | | 2016 | | | 2015 | | | 2014 | | | 2013 | |
Net asset value, beginning of period | | | $39.99 | | | | $41.60 | | | | $48.10 | | | | $45.27 | | | | $38.49 | |
Net investment income (loss) | | | (0.26 | )1 | | | (0.16 | )1 | | | 0.26 | | | | (0.42 | )1 | | | (0.35 | )1 |
Net realized and unrealized gains (losses) on investments | | | 6.27 | | | | 4.51 | | | | (1.43 | ) | | | 6.31 | | | | 8.65 | |
| | | | | | | | | | | | | | | | | | | | |
Total from investment operations | | | 6.01 | | | | 4.35 | | | | (1.17 | ) | | | 5.89 | | | | 8.30 | |
Distributions to shareholders from | | | | | | | | | | | | | | | | | | | | |
Net investment income | | | 0.00 | | | | (0.19 | ) | | | 0.00 | | | | 0.00 | | | | 0.00 | |
Net realized gains | | | (2.54 | ) | | | (5.77 | ) | | | (5.33 | ) | | | (3.06 | ) | | | (1.52 | ) |
| | | | | | | | | | | | | | | | | | | | |
Total distributions to shareholders | | | (2.54 | ) | | | (5.96 | ) | | | (5.33 | ) | | | (3.06 | ) | | | (1.52 | ) |
Net asset value, end of period | | | $43.46 | | | | $39.99 | | | | $41.60 | | | | $48.10 | | | | $45.27 | |
Total return2 | | | 15.62 | % | | | 11.62 | % | | | (3.01 | )% | | | 13.48 | % | | | 22.41 | % |
Ratios to average net assets (annualized) | | | | | | | | | | | | | | | | | | | | |
Gross expenses | | | 1.96 | % | | | 1.96 | % | | | 1.99 | % | | | 2.01 | % | | | 2.01 | % |
Net expenses | | | 1.96 | % | | | 1.96 | % | | | 1.97 | % | | | 1.97 | % | | | 1.98 | % |
Net investment income (loss) | | | (0.64 | )% | | | (0.40 | )% | | | 0.55 | % | | | (0.88 | )% | | | (0.83 | )% |
Supplemental data | | | | | | | | | | | | | | | | | | | | |
Portfolio turnover rate | | | 43 | % | | | 34 | % | | | 42 | % | | | 32 | % | | | 26 | % |
Net assets, end of period (000s omitted) | | | $33,057 | | | | $34,721 | | | | $37,196 | | | | $42,940 | | | | $43,209 | |
| 1 | Calculated based upon average shares outstanding |
| 2 | Total return calculations do not include any sales charges. |
The accompanying notes are an integral part of these financial statements.
| | | | |
| 20 | | Wells Fargo Opportunity Fund | | Financial highlights |
(For a share outstanding throughout each period)
| | | | | | | | | | | | | | | | | | | | |
| | | Year ended September 30 | |
| ADMINISTRATOR CLASS | | 2017 | | | 2016 | | | 2015 | | | 2014 | | | 2013 | |
Net asset value, beginning of period | | | $44.93 | | | | $46.11 | | | | $52.27 | | | | $48.50 | | | | $40.74 | |
Net investment income | | | 0.15 | 1 | | | 0.24 | 1 | | | 0.79 | | | | 0.08 | | | | 0.06 | 1 |
Net realized and unrealized gains (losses) on investments | | | 7.09 | | | | 5.04 | | | | (1.62 | ) | | | 6.75 | | | | 9.22 | |
| | | | | | | | | | | | | | | | | | | | |
Total from investment operations | | | 7.24 | | | | 5.28 | | | | (0.83 | ) | | | 6.83 | | | | 9.28 | |
Distributions to shareholders from | | | | | | | | | | | | | | | | | | | | |
Net investment income | | | (0.18 | ) | | | (0.69 | ) | | | 0.00 | | | | 0.00 | | | | 0.00 | |
Net realized gains | | | (2.54 | ) | | | (5.77 | ) | | | (5.33 | ) | | | (3.06 | ) | | | (1.52 | ) |
| | | | | | | | | | | | | | | | | | | | |
Total distributions to shareholders | | | (2.72 | ) | | | (6.46 | ) | | | (5.33 | ) | | | (3.06 | ) | | | (1.52 | ) |
Net asset value, end of period | | | $49.45 | | | | $44.93 | | | | $46.11 | | | | $52.27 | | | | $48.50 | |
Total return | | | 16.74 | % | | | 12.68 | % | | | (2.04 | )% | | | 14.60 | % | | | 23.59 | % |
Ratios to average net assets (annualized) | | | | | | | | | | | | | | | | | | | | |
Gross expenses | | | 1.13 | % | | | 1.13 | % | | | 1.10 | % | | | 1.10 | % | | | 1.10 | % |
Net expenses | | | 1.00 | % | | | 1.00 | % | | | 1.00 | % | | | 1.00 | % | | | 1.00 | % |
Net investment income | | | 0.31 | % | | | 0.56 | % | | | 1.52 | % | | | 0.09 | % | | | 0.13 | % |
Supplemental data | | | | | | | | | | | | | | | | | | | | |
Portfolio turnover rate | | | 43 | % | | | 34 | % | | | 42 | % | | | 32 | % | | | 26 | % |
Net assets, end of period (000s omitted) | | | $237,315 | | | | $226,140 | | | | $223,281 | | | | $253,121 | | | | $247,230 | |
| 1 | Calculated based upon average shares outstanding |
The accompanying notes are an integral part of these financial statements.
| | | | | | |
| Financial highlights | | Wells Fargo Opportunity Fund | | | 21 | |
(For a share outstanding throughout each period)
| | | | | | | | | | | | | | | | | | | | |
| | | Year ended September 30 | |
| INSTITUTIONAL CLASS | | 2017 | | | 2016 | | | 2015 | | | 2014 | | | 2013 | |
Net asset value, beginning of period | | | $45.63 | | | | $46.76 | | | | $52.82 | | | | $48.86 | | | | $40.93 | |
Net investment income | | | 0.22 | 1 | | | 0.35 | 1 | | | 0.92 | 1 | | | 0.19 | 1 | | | 0.17 | |
Net realized and unrealized gains (losses) on investments | | | 7.25 | | | | 5.12 | | | | (1.65 | ) | | | 6.83 | | | | 9.28 | |
| | | | | | | | | | | | | | | | | | | | |
Total from investment operations | | | 7.47 | | | | 5.47 | | | | (0.73 | ) | | | 7.02 | | | | 9.45 | |
Distributions to shareholders from | | | | | | | | | | | | | | | | | | | | |
Net investment income | | | (0.26 | ) | | | (0.83 | ) | | | 0.00 | | | | 0.00 | | | | 0.00 | |
Net realized gains | | | (2.54 | ) | | | (5.77 | ) | | | (5.33 | ) | | | (3.06 | ) | | | (1.52 | ) |
| | | | | | | | | | | | | | | | | | | | |
Total distributions to shareholders | | | (2.80 | ) | | | (6.60 | ) | | | (5.33 | ) | | | (3.06 | ) | | | (1.52 | ) |
Net asset value, end of period | | | $50.30 | | | | $45.63 | | | | $46.76 | | | | $52.82 | | | | $48.86 | |
Total return | | | 17.02 | % | | | 12.97 | % | | | (1.81 | )% | | | 14.89 | % | | | 23.91 | % |
Ratios to average net assets (annualized) | | | | | | | | | | | | | | | | | | | | |
Gross expenses | | | 0.88 | % | | | 0.88 | % | | | 0.83 | % | | | 0.83 | % | | | 0.83 | % |
Net expenses | | | 0.75 | % | | | 0.75 | % | | | 0.75 | % | | | 0.75 | % | | | 0.75 | % |
Net investment income | | | 0.47 | % | | | 0.79 | % | | | 1.79 | % | | | 0.36 | % | | | 0.41 | % |
Supplemental data | | | | | | | | | | | | | | | | | | | | |
Portfolio turnover rate | | | 43 | % | | | 34 | % | | | 42 | % | | | 32 | % | | | 26 | % |
Net assets, end of period (000s omitted) | | | $29,709 | | | | $17,222 | | | | $11,906 | | | | $29,335 | | | | $14,030 | |
| 1 | Calculated based upon average shares outstanding |
The accompanying notes are an integral part of these financial statements.
| | | | |
| 22 | | Wells Fargo Opportunity Fund | | Notes to financial statements |
1. ORGANIZATION
Wells Fargo Funds Trust (the “Trust”), a Delaware statutory trust organized on March 10, 1999, is an open-end management investment company registered under the Investment Company Act of 1940, as amended (the “1940 Act”). As an investment company, the Trust follows the accounting and reporting guidance in Financial Accounting Standards Board Accounting Standards Codification Topic 946, Financial Services – Investment Companies. These financial statements report on the Wells Fargo Opportunity Fund (the “Fund”) which is a diversified series of the Trust.
Effective at the close of business on October 23, 2015, Investor Class shares were converted to Class A shares and are no longer offered by the Fund. Information for Investor Class shares reflected in the financial statements represents activity through October 23, 2015.
Effective at the close of business on May 5, 2017, Class B shares were converted to Class A shares and are no longer offered by the Fund. Information for Class B shares reflected in the financial statements represents activity through May 5, 2017.
2. SIGNIFICANT ACCOUNTING POLICIES
The following significant accounting policies, which are consistently followed in the preparation of the financial statements of the Fund, are in conformity with U.S. generally accepted accounting principles which require management to make estimates and assumptions that affect the reported amounts of assets and liabilities, disclosure of contingent assets and liabilities at the date of the financial statements, and the reported amounts of revenues and expenses during the reporting period. Actual results could differ from those estimates.
Securities valuation
All investments are valued each business day as of the close of regular trading on the New York Stock Exchange (generally 4 p.m. Eastern Time), although the Fund may deviate from this calculation time under unusual or unexpected circumstances.
Equity securities that are listed on a foreign or domestic exchange or market are valued at the official closing price or, if none, the last sales price. If no sale occurs on the principal exchange or market that day, a fair value price will be determined in accordance with the Fund’s Valuation Procedures.
The values of securities denominated in foreign currencies are translated into U.S. dollars at rates provided by an independent foreign currency pricing source at a time each business day specified by the Management Valuation Team of Wells Fargo Funds Management, LLC (“Funds Management”).
Many securities markets and exchanges outside the U.S. close prior to the close of the New York Stock Exchange and therefore may not fully reflect trading or events that occur after the close of the principal exchange in which the foreign securities are traded, but before the close of the New York Stock Exchange. If such trading or events are expected to materially affect the value of such securities, then fair value pricing procedures approved by the Board of Trustees of the Fund are applied. These procedures take into account multiple factors including movements in U.S. securities markets after foreign exchanges close. Foreign securities that are fair valued under these procedures are categorized as Level 2 and the application of these procedures may result in transfers between Level 1 and Level 2. Depending on market activity, such fair valuations may be frequent. Such fair value pricing may result in net asset values that are higher or lower than net asset values based on the last reported sales price or latest quoted bid price. On September 30, 2017, such fair value pricing was not used in pricing foreign securities.
Investments in registered open-end investment companies are valued at net asset value. Interests in non-registered investment companies that are redeemable at net asset value are fair valued normally at net asset value.
Investments which are not valued using any of the methods discussed above are valued at their fair value, as determined in good faith by the Board of Trustees. The Board of Trustees has established a Valuation Committee comprised of the Trustees and has delegated to it the authority to take any actions regarding the valuation of portfolio securities that the Valuation Committee deems necessary or appropriate, including determining the fair value of portfolio securities, unless the determination has been delegated to the Management Valuation Team. The Board of Trustees retains the authority to make or ratify any valuation decisions or approve any changes to the Valuation Procedures as it deems appropriate. On a quarterly basis, the Board of Trustees receives reports on any valuation actions taken by the Valuation Committee or the Management Valuation Team which may include items for ratification.
Valuations of fair valued securities are compared to the next actual sales price when available, or other appropriate market values, to assess the continued appropriateness of the fair valuation methodologies used. These securities are fair
| | | | | | |
| Notes to financial statements | | Wells Fargo Opportunity Fund | | | 23 | |
valued on a day-to-day basis, taking into consideration changes to appropriate market information and any significant changes to the inputs considered in the valuation process until there is a readily available price provided on an exchange or by an independent pricing service. Valuations received from an independent pricing service or independent broker-dealer quotes are periodically validated by comparisons to most recent trades and valuations provided by other independent pricing services in addition to the review of prices by the manager and/or subadviser. Unobservable inputs used in determining fair valuations are identified based on the type of security, taking into consideration factors utilized by market participants in valuing the investment, knowledge about the issuer and the current market environment.
Foreign currency translation
The accounting records of the Fund are maintained in U.S. dollars. The values of other assets and liabilities denominated in foreign currencies are translated into U.S. dollars at rates provided by an independent foreign currency pricing source at a time each business day specified by the Management Valuation Team. Purchases and sales of securities, and income and expenses are converted at the rate of exchange on the respective dates of such transactions. Net realized foreign exchange gains or losses arise from sales of foreign currencies, currency gains or losses realized between the trade and settlement dates on securities transactions, and the difference between the amounts of dividends, interest and foreign withholding taxes recorded and the U.S. dollar equivalent of the amounts actually paid or received. Net unrealized foreign exchange gains and losses arise from changes in the fair value of assets and liabilities other than investments in securities resulting from changes in exchange rates. The changes in net assets arising from changes in exchange rates of securities and the changes in net assets resulting from changes in market prices of securities are not separately presented. Such changes are included in net realized and unrealized gains or losses from investments.
Security loans
The Fund may lend its securities from time to time in order to earn additional income in the form of fees or interest on securities received as collateral or the investment of any cash received as collateral. The Fund continues to receive interest or dividends on the securities loaned. The Fund receives collateral in the form of cash or securities with a value at least equal to the value of the securities on loan. The value of the loaned securities is determined at the close of each business day and any additional required collateral is delivered to the Fund on the next business day. In a securities lending transaction, the net asset value of the Fund will be affected by an increase or decrease in the value of the securities loaned and by an increase or decrease in the value of the instrument in which collateral is invested. The amount of securities lending activity undertaken by the Fund fluctuates from time to time. In the event of default or bankruptcy by the borrower, the Fund may be prevented from recovering the loaned securities or gaining access to the collateral or may experience delays or costs in doing so. In addition, the investment of any cash collateral received may lose all or part of its value. The Fund has the right under the lending agreement to recover the securities from the borrower on demand.
The Fund lends its securities through an unaffiliated securities lending agent. Cash collateral received in connection with its securities lending transactions is invested in Securities Lending Cash Investments, LLC (the “Securities Lending Fund”). The Securities Lending Fund is exempt from registration under Section 3(c)(7) of the 1940 Act and is managed by Funds Management and is subadvised by Wells Capital Management Incorporated (“WellsCap”), an affiliate of Funds Management and an indirect wholly owned subsidiary of Wells Fargo & Company (“Wells Fargo”). Funds Management receives an advisory fee starting at 0.05% and declining to 0.01% as the average daily net assets of the Securities Lending Fund increase. All of the fees received by Funds Management are paid to WellsCap for its services as subadviser. The Securities Lending Fund seeks to provide a positive return compared to the daily Fed Funds Open Rate by investing in high-quality, U.S. dollar-denominated short-term money market instruments. Securities Lending Fund investments are valued at the evaluated bid price provided by an independent pricing service. Income earned from investment in the Securities Lending Fund is included in income from affiliates securities on the Statement of Operations.
Security transactions and income recognition
Securities transactions are recorded on a trade date basis. Realized gains or losses are recorded on the basis of identified cost.
Dividend income is recognized on the ex-dividend date, except for certain dividends from foreign securities, which are recorded as soon as the custodian verifies the ex-dividend date. Dividend income from foreign securities is recorded net of foreign taxes withheld where recovery of such taxes is not assured.
Distributions to shareholders
Distributions to shareholders from net investment income and net realized gains, if any, are recorded on the ex-dividend date. Such distributions are determined in accordance with income tax regulations and may differ from U.S. generally accepted accounting principles. Dividend sources are estimated at the time of declaration. The tax character of
| | | | |
| 24 | | Wells Fargo Opportunity Fund | | Notes to financial statements |
distributions is determined as of the Fund’s fiscal year end. Therefore, a portion of the Fund’s distributions made prior to the Fund’s fiscal year end may be categorized as a tax return of capital.
Federal and other taxes
The Fund intends to continue to qualify as a regulated investment company by distributing substantially all of its investment company taxable income and any net realized capital gains (after reduction for capital loss carryforwards) sufficient to relieve it from all, or substantially all, federal income taxes. Accordingly, no provision for federal income taxes was required.
The Fund’s income and federal excise tax returns and all financial records supporting those returns for the prior three fiscal years are subject to examination by the federal and Delaware revenue authorities. Management has analyzed the Fund’s tax positions taken on federal, state, and foreign tax returns for all open tax years and does not believe that there are any uncertain tax positions that require recognition of a tax liability.
As of September 30, 2017, the aggregate cost of all investments for federal income tax purposes was $1,329,734,256 and the unrealized gains (losses) consisted of:
| | | | |
Gross unrealized gains | | $ | 501,510,557 | |
Gross unrealized losses | | | (33,753,407) | |
Net unrealized gains | | $ | 467,757,150 | |
Reclassifications are made to the Fund’s capital accounts for permanent tax differences to reflect income and gains available for distribution (or available capital loss carryforwards) under federal income tax regulations. U.S. generally accepted accounting principles require that certain components of net assets be adjusted to reflect permanent differences between financial and tax reporting. The primary permanent difference causing such reclassification is due to corporate actions. At September 30, 2017, as a result of permanent book-to-tax differences, the following reclassification adjustments were made on the Statement of Assets and Liabilities:
| | | | |
| Paid-in capital | | Undistributed net
investment income | | Accumulated net
realized gains
on investments |
| $(4,182,374) | | $5,226,262 | | $(1,043,888) |
Class allocations
The separate classes of shares offered by the Fund differ principally in applicable sales charges, distribution, shareholder servicing, and administration fees. Class specific expenses are charged directly to that share class. Investment income, common expenses, and realized and unrealized gains (losses) on investments are allocated daily to each class of shares based on the relative proportion of net assets of each class.
3. FAIR VALUATION MEASUREMENTS
Fair value measurements of investments are determined within a framework that has established a fair value hierarchy based upon the various data inputs utilized in determining the value of the Fund’s investments. The three-level hierarchy gives the highest priority to unadjusted quoted prices in active markets for identical assets or liabilities (Level 1) and the lowest priority to unobservable inputs (Level 3). The Fund’s investments are classified within the fair value hierarchy based on the lowest level of input that is significant to the fair value measurement. The inputs are summarized into three broad levels as follows:
| ∎ | | Level 1 – quoted prices in active markets for identical securities |
| ∎ | | Level 2 – other significant observable inputs (including quoted prices for similar securities, interest rates, prepayment speeds, credit risk, etc.) |
| ∎ | | Level 3 – significant unobservable inputs (including the Fund’s own assumptions in determining the fair value of investments) |
The inputs or methodologies used for valuing investments in securities are not necessarily an indication of the risk associated with investing in those securities.
| | | | | | |
| Notes to financial statements | | Wells Fargo Opportunity Fund | | | 25 | |
The following is a summary of the inputs used in valuing the Fund’s assets and liabilities as of September 30, 2017:
| | | | | | | | | | | | | | | | |
| | | Quoted prices
(Level 1) | | | Other significant
observable inputs
(Level 2) | | | Significant
unobservable inputs (Level 3) | | | Total | |
Assets | | | | | | | | | | | | | | | | |
Investments in: | | | | | | | | | | | | | | | | |
| | | | |
Common stocks | | | | | | | | | | | | | | | | |
Consumer discretionary | | $ | 180,408,108 | | | $ | 0 | | | $ | 0 | | | $ | 180,408,108 | |
Consumer staples | | | 71,840,877 | | | | 0 | | | | 0 | | | | 71,840,877 | |
Energy | | | 118,374,567 | | | | 0 | | | | 0 | | | | 118,374,567 | |
Financials | | | 321,882,445 | | | | 0 | | | | 0 | | | | 321,882,445 | |
Health care | | | 283,883,087 | | | | 0 | | | | 0 | | | | 283,883,087 | |
Industrials | | | 211,533,774 | | | | 0 | | | | 0 | | | | 211,533,774 | |
Information technology | | | 425,163,636 | | | | 0 | | | | 0 | | | | 425,163,636 | |
Materials | | | 82,230,576 | | | | 0 | | | | 0 | | | | 82,230,576 | |
Real estate | | | 25,495,740 | | | | 0 | | | | 0 | | | | 25,495,740 | |
| | | | |
Short-term investments | | | | | | | | | | | | | | | | |
Investment companies | | | 59,194,191 | | | | 0 | | | | 0 | | | | 59,194,191 | |
Investments measured at net asset value* | | | | | | | | | | | | | | | 17,484,405 | |
Total assets | | $ | 1,780,007,001 | | | $ | 0 | | | $ | 0 | | | $ | 1,797,491,406 | |
| * | Investments that are measured at fair value using the net asset value per share (or its equivalent) as a practical expedient have not been categorized in the fair value hierarchy. The fair value amount presented in the table is intended to permit reconciliation of the fair value hierarchy to the amounts presented in the Statement of Assets and Liabilities. The Fund’s investment in Securities Lending Cash Investments, LLC valued at $17,484,405 does not have a redemption period notice, can be redeemed daily and does not have any unfunded commitments. |
The Fund recognizes transfers between levels within the fair value hierarchy at the end of the reporting period. At September 30, 2017, the Fund did not have any transfers into/out of Level 1, Level 2, or Level 3.
4. TRANSACTIONS WITH AFFILIATES AND OTHER EXPENSES
Management fee
Funds Management, an indirect wholly owned subsidiary of Wells Fargo, is the manager of the Fund and provides advisory and fund-level administrative services under an investment management agreement. Under the investment management agreement, Funds Management is responsible for, among other services, implementing the investment objectives and strategies of the Fund, supervising the subadviser, providing fund-level administrative services in connection with the Fund’s operations, and providing any other fund-level administrative services reasonably necessary for the operation of the Fund. As compensation for its services under the investment management agreement, Funds Management is entitled to receive an annual management fee starting at 0.75% and declining to 0.63% as the average daily net assets of the Fund increase. For the year ended September 30, 2017, the management fee was equivalent to an annual rate of 0.72% of the Fund’s average daily net assets.
Funds Management has retained the services of a subadviser to provide daily portfolio management to the Fund. The fee for subadvisory services is borne by Funds Management. WellsCap is the subadviser to the Fund and is entitled to receive a fee from Funds Management at an annual rate starting at 0.45% and declining to 0.30% as the average daily net assets of the Fund increase.
Administration fees
Under a class-level administration agreement, Funds Management provides class-level administrative services to the Fund, which includes paying fees and expenses for services provided by the transfer agent, sub-transfer agents, omnibus account servicers and record-keepers. As compensation for its services under the class-level administration agreement, Funds Management receives an annual fee which is calculated based on the average daily net assets of each class as follows:
| | | | |
| | | Class-level
administration fee | |
Class A, Class B, Class C | | | 0.21 | % |
Administrator Class, Institutional Class | | | 0.13 | |
| | | | |
| 26 | | Wells Fargo Opportunity Fund | | Notes to financial statements |
Funds Management has contractually waived and/or reimbursed management and administration fees to the extent necessary to maintain certain net operating expense ratios for the Fund. Waiver of fees and/or reimbursement of expenses by Funds Management were made first from fund level expenses on a proportionate basis and then from class specific expenses. Funds Management has committed through January 31, 2018 to waive fees and/or reimburse expenses to the extent necessary to cap the Fund’s expenses at 1.21% for Class A shares, 1.96% for Class C shares, 1.00% for Administrator Class shares, and 0.75% for Institutional Class shares. After this time, the cap may be increased or the commitment to maintain the cap may be terminated only with the approval of the Board of Trustees.
During the year ended September 30, 2017, State Street Bank and Trust Company (“State Street”), the Fund’s custodian, reimbursed the Fund $4,273 for certain out-of-pocket expenses that were billed to the Fund in error from 1998-2015. This amount is included in dividend income on the Statement of Operations. In addition, Funds Management was also reimbursed $10,171 by State Street for waivers/reimbursements it made to the Fund to limit Fund expenses during the period the Fund was erroneously billed.
Distribution fees
The Trust has adopted a distribution plan for Class B and Class C shares of the Fund pursuant to Rule 12b-1 under the 1940 Act. Distribution fees are charged to Class B and Class C shares and paid to Wells Fargo Funds Distributor, LLC (“Funds Distributor”), the principal underwriter, at an annual rate of 0.75% of the average daily net assets of Class B and Class C shares.
In addition, Funds Distributor is entitled to receive the front-end sales charge from the purchase of Class A shares and a contingent deferred sales charge on the redemption of certain Class A shares. Funds Distributor is also entitled to receive the contingent deferred sales charges from redemptions of Class B and Class C shares. For the year ended September 30, 2017, Funds Distributor received $6,257 from the sale of Class A shares and $143 in contingent deferred sales charges from redemptions of Class C shares. No contingent deferred sales charges were incurred by Class A and Class B shares for the year ended September 30, 2017.
Shareholder servicing fees
The Trust has entered into contracts with one or more shareholder servicing agents, whereby Class A, Class B, Class C, and Administrator Class of the Fund are charged a fee at an annual rate of 0.25% of the average daily net assets of each respective class.
A portion of these total shareholder servicing fees were paid to affiliates of Wells Fargo.
Interfund transactions
The Fund may purchase or sell portfolio investment securities to certain other Wells Fargo affiliates pursuant to Rule 17a-7 of the 1940 Act and under procedures adopted by the Board of Trustees. The procedures have been designed to ensure that these interfund transactions, which do not incur broker commissions, are effected at current market prices.
5. INVESTMENT PORTFOLIO TRANSACTIONS
Purchases and sales of investments, excluding U.S. government obligations (if any) and short-term securities, for the year ended September 30, 2017 were $731,902,171 and $945,370,499, respectively.
6. BANK BORROWINGS
The Trust (excluding the money market funds and certain other funds) and Wells Fargo Variable Trust are parties to a $280,000,000 revolving credit agreement whereby the Fund is permitted to use bank borrowings for temporary or emergency purposes, such as to fund shareholder redemption requests. Interest under the credit agreement is charged to the Fund based on a borrowing rate equal to the higher of the Federal Funds rate in effect on that day plus 1.25% or the overnight LIBOR rate in effect on that day plus 1.25%. In addition, an annual commitment fee equal to 0.25% of the unused balance is allocated to each participating fund. Prior to August 29, 2017, the revolving credit agreement amount was $250,000,000.
For the year ended September 30, 2017, there were no borrowings by the Fund under the agreement.
7. CONCENTRATION RISK
Concentration risks result from exposure to a limited number of sectors. A fund that invests a substantial portion of its assets in any sector may be more affected by changes in that sector than would be a fund whose investments are not heavily weighted in any sector.
| | | | | | |
| Notes to financial statements | | Wells Fargo Opportunity Fund | | | 27 | |
8. DISTRIBUTIONS TO SHAREHOLDERS
The tax character of distributions paid during the years ended September 30, 2017 and September 30, 2016 were as follows:
| | | | | | | | |
| | | Year ended September 30 | |
| | | 2017 | | | 2016 | |
Ordinary income | | $ | 8,715,519 | | | $ | 25,177,386 | |
Long-term capital gain | | | 96,377,432 | | | | 219,607,514 | |
As of September 30, 2017, the components of distributable earnings on a tax basis were as follows:
| | | | |
Undistributed
ordinary
income | | Undistributed
long-term
gain | | Unrealized
gains |
| $32,866,327 | | $190,365,237 | | $467,423,627 |
9. INDEMNIFICATION
Under the Trust’s organizational documents, the officers and Trustees have been granted certain indemnification rights against certain liabilities that may arise out of performance of their duties to the Trust. Additionally, in the normal course of business, the Trust may enter into contracts with service providers that contain a variety of indemnification clauses. The Trust’s maximum exposure under these arrangements is dependent on future claims that may be made against the Fund and, therefore, cannot be estimated.
| | | | |
| 28 | | Wells Fargo Opportunity Fund | | Report of independent registered public accounting firm |
BOARD OF TRUSTEES AND SHAREHOLDERS OF WELLS FARGO FUNDS TRUST:
We have audited the accompanying statement of assets and liabilities, including the portfolio of investments, of the Wells Fargo Opportunity Fund (the “Fund”), one of the funds constituting the Wells Fargo Funds Trust, as of September 30, 2017, and the related statement of operations for the year then ended, the statements of changes in net assets for each of the years in the two-year period then ended, and the financial highlights for each of the years in the five-year period then ended. These financial statements and financial highlights are the responsibility of the Fund’s management. Our responsibility is to express an opinion on these financial statements and financial highlights based on our audits.
We conducted our audits in accordance with the standards of the Public Company Accounting Oversight Board (United States). Those standards require that we plan and perform the audit to obtain reasonable assurance about whether the financial statements and financial highlights are free of material misstatement. An audit includes examining, on a test basis, evidence supporting the amounts and disclosures in the financial statements. Our procedures included confirmation of securities owned as of September 30, 2017, by correspondence with the custodian and brokers, or by other appropriate auditing procedures. An audit also includes assessing the accounting principles used and significant estimates made by management, as well as evaluating the overall financial statement presentation. We believe that our audits provide a reasonable basis for our opinion.
In our opinion, the financial statements and financial highlights referred to above present fairly, in all material respects, the financial position of the Wells Fargo Opportunity Fund as of September 30, 2017, the results of its operations for the year then ended, the changes in its net assets for each of the years in the two-year period then ended, and the financial highlights for each of the years in the five-year period then ended, in conformity with U.S. generally accepted accounting principles.

Boston, Massachusetts
November 22, 2017
| | | | | | |
| Other information (unaudited) | | Wells Fargo Opportunity Fund | | | 29 | |
TAX INFORMATION
For corporate shareholders, pursuant to Section 854 of the Internal Revenue Code, 100% of ordinary income dividends qualify for the corporate dividends-received deduction for the fiscal year ended September 30, 2017.
Pursuant to Section 852 of the Internal Revenue Code, $96,377,432 was designated as a 20% rate gain distribution for the fiscal year ended September 30, 2017.
Pursuant to Section 854 of the Internal Revenue Code, $8,715,428 of income dividends paid during the fiscal year ended September 30, 2017 has been designated as qualified dividend income (QDI).
For the fiscal year ended September 30, 2017, $12,790 has been designated as interest-related dividends for nonresident alien shareholders pursuant to Section 871 of the Internal Revenue Code.
For the fiscal year ended September 30, 2017, $3,154,997 has been designated as short-term capital gain dividends for nonresident alien shareholders pursuant to Section 871 of the Internal Revenue Code.
PORTFOLIO HOLDINGS INFORMATION
The complete portfolio holdings for the Fund are publicly available monthly on the Fund’s website (wellsfargofunds.com), on a one-month delayed basis. In addition, top ten holdings information (excluding derivative positions) for the Fund is publicly available on the Fund’s website on a monthly, seven-day or more delayed basis. The Fund files its complete schedule of portfolio holdings with the SEC for the first and third quarters of each fiscal year on Form N-Q, which is available by visiting the SEC website at sec.gov. In addition, the Fund’s Form N-Q may be reviewed and copied at the SEC’s Public Reference Room in Washington, DC, and at regional offices in New York City, at 233 Broadway, and in Chicago, at 175 West Jackson Boulevard, Suite 900. Information about the Public Reference Room may be obtained by calling 1-800-SEC-0330.
PROXY VOTING INFORMATION
A description of the policies and procedures that the Fund uses to determine how to vote proxies relating to portfolio securities is available, upon request, by calling 1-800-222-8222, visiting our website at wellsfargofunds.com, or visiting the SEC website at sec.gov. Information regarding how the Fund voted proxies relating to portfolio securities during the most recent 12-month period ended June 30 is available on the Fund’s website at wellsfargofunds.com or by visiting the SEC website at sec.gov.
| | | | |
| 30 | | Wells Fargo Opportunity Fund | | Other information (unaudited) |
BOARD OF TRUSTEES AND OFFICERS
Each of the Trustees and Officers1 listed in the table below acts in identical capacities for each fund in the Wells Fargo family of funds, which consists of 152 mutual funds comprising the Wells Fargo Funds Trust, Wells Fargo Variable Trust, Wells Fargo Master Trust and four closed-end funds (collectively the “Fund Complex”). This table should be read in conjunction with the Prospectus and the Statement of Additional Information2. The mailing address of each Trustee and Officer is 525 Market Street, 12th Floor, San Francisco, CA 94105. Each Trustee and Officer serves an indefinite term, however, each Trustee serves such term until reaching the mandatory retirement age established by the Trustees.
Independent Trustees
| | | | | | |
Name and year of birth | | Position held and length of service* | | Principal occupations during past five years or longer | | Current other public company or
investment company
directorships |
| William R. Ebsworth (Born 1957) | | Trustee, since 2015 | | Retired. From 1984 to 2013, equities analyst, portfolio manager, research director and chief investment officer at Fidelity Management and Research Company in Boston, Tokyo, and Hong Kong and retired in 2013 as Chief Investment Officer of Fidelity Strategic Advisers, Inc. where he led a team of investment professionals managing client assets. Prior thereto, Board member of Hong Kong Securities Clearing Co., Hong Kong Options Clearing Corp., the Thailand International Fund, Ltd., Fidelity Investments Life Insurance Company, and Empire Fidelity Investments Life Insurance Company. Board member of the Forté Foundation (non-profit organization) and the Vincent Memorial Hospital Endowment (non-profit organization), where he serves on the Investment Committee and as a Chair of the Audit Committee. Mr. Ebsworth is a CFA® charterholder. | | Asset Allocation Trust |
| Jane A. Freeman (Born 1953) | | Trustee, since 2015 | | Retired. From 2012 to 2014 and 1999 to 2008, Chief Financial Officer of Scientific Learning Corporation. From 2008 to 2012, Ms. Freeman provided consulting services related to strategic business projects. Prior to 1999, Portfolio Manager at Rockefeller & Co. and Scudder, Stevens & Clark. Board member of the Harding Loevner Funds from 1996 to 2014, serving as both Lead Independent Director and chair of the Audit Committee. Board member of the Russell Exchange Traded Funds Trust from 2011 to 2012 and the chair of the Audit Committee. Ms. Freeman is a Board Member of Ruth Bancroft Garden (non-profit organization) and an inactive chartered financial analyst. | | Asset Allocation Trust |
| Peter G. Gordon** (Born 1942) | | Trustee, since 1998; Chairman, since 2005 | | Co-Founder, Retired Chairman, President and CEO of Crystal Geyser Water Company. Trustee Emeritus, Colby College. | | Asset Allocation Trust |
| Isaiah Harris, Jr. (Born 1952) | | Trustee, since 2009 | | Retired. Chairman of the Board of CIGNA Corporation since 2009, and Director since 2005. From 2003 to 2011, Director of Deluxe Corporation. Prior thereto, President and CEO of BellSouth Advertising and Publishing Corp. from 2005 to 2007, President and CEO of BellSouth Enterprises from 2004 to 2005 and President of BellSouth Consumer Services from 2000 to 2003. Emeritus member of the Iowa State University Foundation Board of Governors. Emeritus Member of the Advisory Board of Iowa State University School of Business. Advisory Board Member, Palm Harbor Academy (charter school). Advisory Board Member, Child Evangelism Fellowship (non-profit). Mr. Harris is a certified public accountant (inactive status). | | CIGNA Corporation; Asset Allocation Trust |
| Judith M. Johnson (Born 1949) | | Trustee, since 2008; Audit Committee Chairman, since 2008 | | Retired. Prior thereto, Chief Executive Officer and Chief Investment Officer of Minneapolis Employees Retirement Fund from 1996 to 2008. Ms. Johnson is an attorney, certified public accountant and a certified managerial accountant. | | Asset Allocation Trust |
| David F. Larcker (Born 1950) | | Trustee, since 2009 | | James Irvin Miller Professor of Accounting at the Graduate School of Business, Stanford University, Director of the Corporate Governance Research Initiative and Senior Faculty of The Rock Center for Corporate Governance since 2006. From 2005 to 2008, Professor of Accounting at the Graduate School of Business, Stanford University. Prior thereto, Ernst & Young Professor of Accounting at The Wharton School, University of Pennsylvania from 1985 to 2005. | | Asset Allocation Trust |
| | | | | | |
| Other information (unaudited) | | Wells Fargo Opportunity Fund | | | 31 | |
| | | | | | |
Name and year of birth | | Position held and length of service* | | Principal occupations during past five years or longer | | Current other public company or
investment company
directorships |
| Olivia S. Mitchell (Born 1953) | | Trustee, since 2006 | | International Foundation of Employee Benefit Plans Professor, Wharton School of the University of Pennsylvania since 1993. Director of Wharton’s Pension Research Council and Boettner Center on Pensions & Retirement Research, and Research Associate at the National Bureau of Economic Research. Previously, Cornell University Professor from 1978 to 1993. | | Asset Allocation Trust |
| Timothy J. Penny (Born 1951) | | Trustee, since 1996: Vice Chairman, since 2017 | | President and Chief Executive Officer of Southern Minnesota Initiative Foundation, a non-profit organization, since 2007 and Senior Fellow at the Humphrey Institute Policy Forum at the University of Minnesota since 1995. Member of the Board of Trustees of NorthStar Education Finance, Inc., a non-profit organization, since 2007. | | Asset Allocation Trust |
| Michael S. Scofield (Born 1943) | | Trustee, since 2010 | | Served on the Investment Company Institute’s Board of Governors and Executive Committee from 2008-2011 as well the Governing Council of the Independent Directors Council from 2006-2011 and the Independent Directors Council Executive Committee from 2008-2011. Chairman of the IDC from 2008-2010. Trustee of the Evergreen Funds complex (and its predecessors) from 1984 to 2010. Chairman of the Evergreen Funds from 2000-2010. Former Trustee of the Mentor Funds. Retired Attorney, Law Offices of Michael S. Scofield. | | Asset Allocation Trust |
| * | Length of service dates reflect the Trustee’s commencement of service with the Trust’s predecessor entities, where applicable. |
| ** | Peter Gordon is expected to retire on December 31, 2017. |
Advisory Board Members
| | | | | | |
Name and year of birth | | Position held and length of service | | Principal occupations during past five years or longer | | Current other public company or
investment company
directorships |
| James G. Polisson (Born 1959) | | Advisory Board Member, since 2017 | | Retired. Chief Marketing Officer, Source (ETF) UK Services, Ltd, from 2015 to 2017. From 2012 to 2015, Principal of The Polisson Group, LLC, a management consulting, corporate advisory and principal investing company. Chief Executive Officer and Managing Director at Russell Investments, Global Exchange Traded Funds from 2010 to 2012. Managing Director of Barclays Global Investors from 1998 to 2010 and Global Chief Marketing Officer for iShares and Barclays Global Investors from 2000 to 2010. Prior thereto, Vice President, Fidelity Retail Mutual Fund Group from 1996 to 1998 and Risk Management Practice Manager, Fidelity Consulting from 1995 to 1996. Board member of the Russell Exchange Traded Fund Trust from 2011 to 2012. Director of Barclays Global Investors Holdings Deutschland GmbH from 2006 to 2009. Mr. Polisson is an attorney and has a retired status with the Massachusetts and District of Columbia Bar Associations. | | None |
| Pamela Wheelock (Born 1959) | | Advisory Board Member, since 2017 | | Chief Operating Officer, Twin Cities Habitat for Humanity, since January, 2017. Vice President of University Services, University of Minnesota from 2012 to 2017. Prior thereto, Interim President and Chief Executive Officer of Blue Cross Blue Shield of Minnesota from 2010 to 2011, Chairman of the Board from 2009 to 2011 and Board Director from 2003 to 2015. Vice President, Leadership and Community Engagement, Bush Foundation, Saint Paul, Minnesota (a private foundation) from 2009 to 2011. Executive Vice President and Chief Financial Officer, Minnesota Sports and Entertainment from 2004 to 2009 and Senior Vice President from 2002 to 2004. Commissioner of Finance, State of Minnesota, from 1999 to 2002. Currently on the Board of Directors, Governance Committee and Finance Committee, for the Minnesota Philanthropy Partners (Saint Paul Foundation) since 2012 and Board Chair of the Minnesota Wild Foundation since 2010. | | None |
| | | | |
| 32 | | Wells Fargo Opportunity Fund | | Other information (unaudited) |
Officers
| | | | | | |
Name and year of birth | | Position held and
length of service | | Principal occupations during past five years or longer | | |
Andrew Owen
(Born 1960) | | President, since 2017 | | Executive Vice President of Wells Fargo & Company and Head of Affiliated Managers, Wells Fargo Asset Management, since 2014. In addition, Mr. Owen is currently President, Chief Executive Officer and Director of Wells Fargo Funds Management, LLC since 2017. Prior thereto, Executive Vice President responsible for marketing, investments and product development for Wells Fargo Funds Management, LLC, from 2009 to 2014. | | |
Nancy Wiser1
(Born 1967) | | Treasurer, since 2012 | | Executive Vice President of Wells Fargo Funds Management, LLC since 2011. Chief Operating Officer and Chief Compliance Officer at LightBox Capital Management LLC, from 2008 to 2011. | | |
| C. David Messman (Born 1960) | | Secretary, since 2000; Chief Legal Officer, since 2003 | | Senior Vice President and Secretary of Wells Fargo Funds Management, LLC since 2001. Assistant General Counsel of Wells Fargo Bank, N.A. since 2013 and Vice President and Managing Counsel of Wells Fargo Bank, N.A. from 1996 to 2013. | | |
| Michael H. Whitaker (Born 1967) | | Chief Compliance Officer, since 2016 | | Senior Vice President and Chief Compliance Officer since 2016. Senior Vice President and Chief Compliance Officer for Fidelity Investments from 2007 to 2016. | | |
David Berardi
(Born 1975) | | Assistant Treasurer, since 2009 | | Vice President of Wells Fargo Funds Management, LLC since 2009. Vice President of Evergreen Investment Management Company, LLC from 2008 to 2010. Manager of Fund Reporting and Control for Evergreen Investment Management Company, LLC from 2004 to 2010. | | |
| Jeremy DePalma1 (Born 1974) | | Assistant Treasurer, since 2009 | | Senior Vice President of Wells Fargo Funds Management, LLC since 2009. Senior Vice President of Evergreen Investment Management Company, LLC from 2008 to 2010 and head of the Fund Reporting and Control Team within Fund Administration from 2005 to 2010. | | |
| 1 | Nancy Wiser acts as Treasurer of 76 funds in the Fund Complex. Jeremy DePalma acts as Treasurer of 76 funds and Assistant Treasurer of 76 funds in the Fund Complex. |
| 2 | The Statement of Additional Information includes additional information about the Trustees and is available, without charge, upon request, by calling 1-800-222-8222 or by visiting the website at wellsfargofunds.com. |
| | | | | | |
| Other information (unaudited) | | Wells Fargo Opportunity Fund | | | 33 | |
BOARD CONSIDERATION OF INVESTMENT MANAGEMENT AND SUB-ADVISORY AGREEMENTS:
Under the Investment Company Act of 1940 (the “1940 Act”), the Board of Trustees (the “Board”) of Wells Fargo Funds Trust (the “Trust”) must determine annually whether to approve the continuation of the Trust’s investment management and sub-advisory agreements. In this regard, at an in-person meeting held on May 16-17, 2017 (the “Meeting”), the Board, all the members of which have no direct or indirect interest in the investment management and sub-advisory agreements and are not “interested persons” of the Trust, as defined in the 1940 Act (the “Independent Trustees”), reviewed and approved for Wells Fargo Opportunity Fund (the “Fund”): (i) an investment management agreement (the “Management Agreement”) with Wells Fargo Funds Management, LLC (“Funds Management”); and (ii) an investment sub-advisory agreement (the “Sub-Advisory Agreement”) with Wells Capital Management Incorporated (the “Sub-Adviser”), an affiliate of Funds Management. The Management Agreement and the Sub-Advisory Agreement are collectively referred to as the “Advisory Agreements.”
At the Meeting, the Board considered the factors and reached the conclusions described below relating to the selection of Funds Management and the Sub-Adviser and the approval of the Advisory Agreements. Prior to the Meeting, including at an in-person meeting in April 2017, the Trustees conferred extensively among themselves and with representatives of Funds Management about these matters. Also, the Board has adopted a team-based approach, with each team consisting of a sub-set of Trustees, to assist the full Board in the discharge of its duties in reviewing performance and other matters throughout the year. The Independent Trustees were assisted in their evaluation of the Advisory Agreements by independent legal counsel, from whom they received separate legal advice and with whom they met separately.
In providing information to the Board, Funds Management and the Sub-Adviser were guided by a detailed set of requests for information submitted to them by independent legal counsel on behalf of the Independent Trustees at the start of the Board’s annual contract renewal process earlier in 2017. In considering and approving the Advisory Agreements, the Trustees considered the information they believed relevant, including but not limited to the information discussed below. The Board considered not only the specific information presented in connection with the Meeting, but also the knowledge gained over time through interaction with Funds Management and the Sub-Adviser about various topics. In this regard, the Board reviewed reports of Funds Management at each of its quarterly meetings, which included, among other things, portfolio reviews and performance reports. In addition, the Board and the teams mentioned above confer with portfolio managers at various times throughout the year. The Board did not identify any particular information or consideration that was all-important or controlling, and each individual Trustee may have attributed different weights to various factors.
After its deliberations, the Board unanimously approved the continuation of the Advisory Agreements for a one-year term and determined that the compensation payable to Funds Management and the Sub-Adviser under each of the Advisory Agreements was reasonable. The Board considered the approval of the Advisory Agreements for the Fund as part of its consideration of agreements for funds across the complex, but its approvals were made on a fund-by-fund basis. The following summarizes a number of important, but not necessarily all, factors considered by the Board in support of its approvals.
Nature, extent and quality of services
The Board received and considered various information regarding the nature, extent and quality of services provided to the Fund by Funds Management and the Sub-Adviser under the Advisory Agreements. This information included a description of the investment advisory services and Fund-level administrative services covered by the Management Agreement, as well as, among other things, a summary of the background and experience of senior management of Funds Management, a summary of certain organizational and personnel changes involving Funds Management and the Sub-Adviser, and a description of Funds Management’s and the Sub-Adviser’s business continuity planning programs and of their approaches to data privacy and cybersecurity. The Board also considered the qualifications, background, tenure and responsibilities of each of the portfolio managers primarily responsible for the day-to-day portfolio management of the Fund.
The Board evaluated the ability of Funds Management and the Sub-Adviser to attract and retain qualified investment professionals, including research, advisory and supervisory personnel. The Board further considered the compliance programs and compliance records of Funds Management and the Sub-Adviser. In addition, the Board took into account the full range of services provided to the Fund by Funds Management and its affiliates.
Fund performance and expenses
The Board considered the performance results for the Fund over various time periods ended December 31, 2016. The Board considered these results in comparison to the performance of funds in a universe that was determined by Broadridge Inc.
| | | | |
| 34 | | Wells Fargo Opportunity Fund | | Other information (unaudited) |
(“Broadridge”) to be similar to the Fund (the “Universe”), and in comparison to the Fund’s benchmark index and to other comparative data. Broadridge is an independent provider of investment company data. The Board received a description of the methodology used by Broadridge to select the mutual funds in the performance Universe. The Board noted that the performance of the Fund (Administrator Class) was higher than the average performance of the Universe for all periods under review except the five-year period. The Board also noted that the performance of the Fund was lower than its benchmark, the Russell 3000® Index, for all periods under review.
The Board received information concerning, and discussed factors contributing to, the underperformance of the Fund relative to the Universe and benchmark for the periods identified above. The Board took note of the explanations for the relative underperformance during these periods, including with respect to investment decisions and market factors that affected the Fund’s performance.
The Board also received and considered information regarding the Fund’s net operating expense ratios and their various components, including actual management fees, custodian and other non-management fees, and Rule 12b-1 and non-Rule 12b-1 shareholder service fees. The Board considered these ratios in comparison to the median ratios of funds in class-specific expense groups that were determined by Broadridge to be similar to the Fund (the “Groups”). The Board received a description of the methodology used by Broadridge to select the mutual funds in the expense Groups and an explanation of how funds comprising expense groups and their expense ratios may vary from year-to-year. Based on the Broadridge reports, the Board noted that the net operating expense ratios of the Fund were lower than, equal to or in range of the median net operating expense ratios of the expense Groups for all share classes.
The Board took into account the Fund performance and expense information provided to it among the factors considered in deciding to re-approve the Advisory Agreements.
Investment management and sub-advisory fee rates
The Board reviewed and considered the contractual fee rates payable by the Fund to Funds Management under the Management Agreement, as well as the contractual fee rates payable by the Fund to Funds Management for class-level administrative services under a Class-Level Administration Agreement, which include, among other things, class-level transfer agency and sub-transfer agency costs (collectively, the “Management Rates”). The Board also reviewed and considered the contractual investment sub-advisory fee rates that are payable by Funds Management to the Sub-Adviser for investment sub-advisory services.
Among other information reviewed by the Board was a comparison of the Fund’s Management Rates with the average contractual investment management fee rates of funds in the expense Groups at a common asset level as well as transfer agency costs of the funds in the expense Groups. The Board noted that the Management Rates of the Fund were in range of the sum of these average rates for the Fund’s expense Group for Class A, but higher than the sum of these average rates for the Fund’s expense Groups for Administrator Class and Institutional Class. The Board noted that the net operating expense ratios of the Fund were lower than, equal to or in range of the median net operating expense ratios of the expense Groups for all share classes, including Administrator Class and Institutional Class.
The Board also received and considered information about the portion of the total management fee that was retained by Funds Management after payment of the fee to the Sub-Adviser for sub-advisory services. In assessing the reasonableness of this amount, the Board received and evaluated information about the nature and extent of responsibilities retained and risks assumed by Funds Management and not delegated to or assumed by the Sub-Adviser, and about Funds Management’s on-going oversight services. Given the affiliation between Funds Management and the Sub-Adviser, the Board ascribed limited relevance to the allocation of fees between them.
The Board also received and considered information about the nature and extent of services offered and fee rates charged by Funds Management and the Sub-Adviser to other types of clients with investment strategies similar to those of the Fund. In this regard, the Board received information about the significantly greater scope of services, and compliance, reporting and other legal burdens and risks of managing mutual funds compared with those associated with managing assets of non-mutual fund clients such as institutional separate accounts.
Based on its consideration of the factors and information it deemed relevant, including those described here, the Board determined that the compensation payable to Funds Management under the Management Agreement and to the Sub-Adviser under the Sub-Advisory Agreement was reasonable.
Profitability
The Board received and considered information concerning the profitability of Funds Management, as well as the profitability of Wells Fargo as a whole, from providing services to the Fund and the fund family as a whole. The Board also
| | | | | | |
| Other information (unaudited) | | Wells Fargo Opportunity Fund | | | 35 | |
received and considered information concerning the profitability of the Sub-Adviser from providing services to the fund family as a whole, noting that the Sub-Adviser’s profitability information with respect to providing services to the Fund was subsumed in the Wells Fargo and Funds Management profitability analysis.
Funds Management reported on the methodologies and estimates used in calculating profitability, including a description of the methodology used to allocate certain expenses. Among other things, the Board noted that the levels of profitability reported on a fund-by-fund basis varied widely, depending on factors such as the size and type of fund. Based on its review, the Board did not deem the profits reported by Funds Management or Wells Fargo from its services to the Fund to be at a level that would prevent it from approving the continuation of the Advisory Agreements.
Economies of scale
With respect to possible economies of scale, the Board noted the existence of breakpoints in the Fund’s management fee structure, which operate generally to reduce the Fund’s expense ratios as the Fund grows in size. It considered that, for a small fund or a fund that shrinks in size, breakpoints conversely can result in higher fee levels. The Board also considered that in addition to management fee breakpoints, competitive management fee rates set at the outset without regard to breakpoints and fee waiver and expense reimbursement arrangements are means of sharing potential economies of scale with shareholders of the Fund. The Board considered Funds Management’s view, which Funds Management indicated was supported by independent third-party industry studies which were summarized for the Board, that any analyses of potential economies of scale in managing a particular fund are inherently limited in light of the joint and common costs and investments that Funds Management incurs across the fund family as a whole.
The Board concluded that the Fund’s fee and expense arrangements, including contractual breakpoints, constituted a reasonable approach to sharing potential economies of scale with the Fund and its shareholders.
Other benefits to Funds Management and the Sub-Adviser
The Board received and considered information regarding potential “fall-out” or ancillary benefits received by Funds Management and its affiliates, including the Sub-Adviser, as a result of their relationships with the Fund. Ancillary benefits could include, among others, benefits directly attributable to other relationships with the Fund and benefits potentially derived from an increase in Funds Management’s and the Sub-Adviser’s business as a result of their relationships with the Fund. The Board noted that various affiliates of Funds Management may receive distribution-related fees, shareholder servicing payments and sub-transfer agency fees in respect of shares sold or held through them and services provided.
The Board also reviewed information about soft dollar credits earned and utilized by the Sub-Adviser, fees earned by Funds Management and the Sub-Adviser from managing a private investment vehicle for the fund family’s securities lending collateral and commissions earned by an affiliated broker from portfolio transactions.
Based on its consideration of the factors and information it deemed relevant, including those described here, the Board did not find that any ancillary benefits received by Funds Management and its affiliates, including the Sub-Adviser, were unreasonable.
Conclusion
At the Meeting, after considering the above-described factors and based on its deliberations and its evaluation of the information described above, the Board unanimously approved the continuation of the Advisory Agreements for a one-year term and determined that the compensation payable to Funds Management and the Sub-Adviser under each of the Advisory Agreements was reasonable.
| | | | |
| 36 | | Wells Fargo Opportunity Fund | | List of abbreviations |
The following is a list of common abbreviations for terms and entities that may have appeared in this report.
| ACA | — ACA Financial Guaranty Corporation |
| ADR | — American depositary receipt |
| ADS | — American depositary shares |
| AGC | — Assured Guaranty Corporation |
| AGM | — Assured Guaranty Municipal |
| Ambac | — Ambac Financial Group Incorporated |
| AMT | — Alternative minimum tax |
| BAN | — Bond anticipation notes |
| BHAC | — Berkshire Hathaway Assurance Corporation |
| CAB | — Capital appreciation bond |
| CCAB | — Convertible capital appreciation bond |
| CDA | — Community Development Authority |
| CDO | — Collateralized debt obligation |
| CLO | — Collateralized loan obligation |
| DRIVER | — Derivative inverse tax-exempt receipts |
| DW&P | — Department of Water & Power |
| DWR | — Department of Water Resources |
| ECFA | — Educational & Cultural Facilities Authority |
| EDA | — Economic Development Authority |
| EDFA | — Economic Development Finance Authority |
| ETF | — Exchange-traded fund |
| FDIC | — Federal Deposit Insurance Corporation |
| FFCB | — Federal Farm Credit Banks |
| FGIC | — Financial Guaranty Insurance Corporation |
| FHA | — Federal Housing Administration |
| FHLB | — Federal Home Loan Bank |
| FHLMC | — Federal Home Loan Mortgage Corporation |
| FICO | — The Financing Corporation |
| FNMA | — Federal National Mortgage Association |
| GDR | ��� Global depositary receipt |
| GNMA | — Government National Mortgage Association |
| HCFR | — Healthcare facilities revenue |
| HEFA | — Health & Educational Facilities Authority |
| HEFAR | — Higher education facilities authority revenue |
| HFA | — Housing Finance Authority |
| HFFA | — Health Facilities Financing Authority |
| HUD | — Department of Housing and Urban Development |
| IDA | — Industrial Development Authority |
| IDAG | — Industrial Development Agency |
| KRW | — Republic of Korea won |
| LIBOR | — London Interbank Offered Rate |
| LIFER | — Long Inverse Floating Exempt Receipts |
| LLC | — Limited liability company |
| LLLP | — Limited liability limited partnership |
| LLP | — Limited liability partnership |
| MBIA | — Municipal Bond Insurance Association |
| MFHR | — Multifamily housing revenue |
| MSTR | — Municipal securities trust receipts |
| MUD | — Municipal Utility District |
| National | — National Public Finance Guarantee Corporation |
| PCFA | — Pollution Control Financing Authority |
| PCL | — Public Company Limited |
| PCR | — Pollution control revenue |
| PFA | — Public Finance Authority |
| PFFA | — Public Facilities Financing Authority |
| PFOTER | — Puttable floating option tax-exempt receipts |
| PJSC | — Public Joint Stock Company |
| plc | — Public limited company |
| PUTTER | — Puttable tax-exempt receipts |
| R&D | — Research & development |
| Radian | — Radian Asset Assurance |
| RAN | — Revenue anticipation notes |
| RDA | — Redevelopment Authority |
| RDFA | — Redevelopment Finance Authority |
| REIT | — Real estate investment trust |
| ROC | — Reset option certificates |
| SAVRS | — Select auction variable rate securities |
| SBA | — Small Business Authority |
| SDR | — Swedish depositary receipt |
| SFHR | — Single-family housing revenue |
| SFMR | — Single-family mortgage revenue |
| SPA | — Standby purchase agreement |
| SPDR | — Standard & Poor’s Depositary Receipts |
| SPEAR | — Short Puttable Exempt Adjustable Receipts |
| STRIPS | — Separate trading of registered interest and |
| TAN | — Tax anticipation notes |
| TIPS | — Treasury inflation-protected securities |
| TRAN | — Tax revenue anticipation notes |
| TTFA | — Transportation Trust Fund Authority |
| TVA | — Tennessee Valley Authority |

For more information
More information about Wells Fargo Funds is available free upon request. To obtain literature, please write, email, visit the Fund’s website, or call:
Wells Fargo Funds
P.O. Box 8266
Boston, MA 02266-8266
Email: fundservice@wellsfargo.com
Website: wellsfargofunds.com
Individual investors: 1-800-222-8222
Retail investment professionals: 1-888-877-9275
Institutional investment professionals: 1-866-765-0778
This report and the financial statements contained herein are submitted for the general information of the shareholders of the Fund. If this report is used for promotional purposes, distribution of the report must be accompanied or preceded by a current prospectus. Before investing, please consider the investment objectives, risks, charges, and expenses of the investment. For a current prospectus and, if available, a summary prospectus, containing this information, call 1-800-222-8222 or visit the Fund’s website at wellsfargofunds.com. Read the prospectus carefully before you invest or send money.
Wells Fargo Asset Management (WFAM) is a trade name used by the asset management businesses of Wells Fargo & Company. Wells Fargo Funds Management, LLC, a wholly owned subsidiary of Wells Fargo & Company, provides investment advisory and administrative services for Wells Fargo Funds. Other affiliates of Wells Fargo & Company provide subadvisory and other services for the funds. The funds are distributed by Wells Fargo Funds Distributor, LLC, Member FINRA, an affiliate of Wells Fargo & Company. Neither Wells Fargo Funds Distributor nor Wells Fargo Funds Management holds fund shareholder accounts or assets. This material is for general informational and educational purposes only and is NOT intended to provide investment advice or a recommendation of any kind—including a recommendation for any specific investment, strategy, or plan.
NOT FDIC INSURED ◾ NO BANK GUARANTEE ◾ MAY LOSE VALUE
© 2017 Wells Fargo Funds Management, LLC. All rights reserved.
| | |
 | | 306438 11-17 A232/AR232 09-17 |
Annual Report
September 30, 2017

Wells Fargo Special Mid Cap Value Fund


Reduce clutter. Save trees.
Sign up for electronic delivery of prospectuses and shareholder reports at wellsfargo.com/advantagedelivery
Contents
The views expressed and any forward-looking statements are as of September 30, 2017, unless otherwise noted, and are those of the Fund managers and/or Wells Fargo Funds Management, LLC. Discussions of individual securities, or the markets generally, or any Wells Fargo Fund are not intended as individual recommendations. Future events or results may vary significantly from those expressed in any forward-looking statements. The views expressed are subject to change at any time in response to changing circumstances in the market. Wells Fargo Funds Management, LLC and the Fund disclaim any obligation to publicly update or revise any views expressed or forward-looking statements.
NOT FDIC INSURED ◾ NO BANK GUARANTEE ◾ MAY LOSE VALUE
| | | | |
| 2 | | Wells Fargo Special Mid Cap Value Fund | | Letter to shareholders (unaudited) |

Andrew Owen
President
Wells Fargo Funds
Favorable economic news supported stocks, and interest rates moved higher.
Hiring remained strong, and business and consumer sentiment improved.
Dear Shareholder:
We are pleased to offer you this annual report for the Wells Fargo Special Mid Cap Value Fund for the 12-month period that ended September 30, 2017. Despite heightened market volatility at times, global stocks generally delivered double-digit results and bond markets had smaller but positive results as well. U.S. and international stocks returned 18.61% and 19.61%, respectively, for the 12-month period, as measured by the S&P 500 Index1 and the MSCI ACWI ex USA Index (Net)2 respectively; within fixed income, the Bloomberg Barclays U.S. Aggregate Bond Index3 returned 0.07% and the Bloomberg Barclays Municipal Bond Index4 returned 0.87% as interest rates rose from low levels.
Election results and central banks’ policies commanded investor attention as 2016 closed.
During the fourth quarter of 2016, investors appeared intent on the prospective outcomes of elections in the U.S. and central-bank actions globally. Following Donald Trump’s election victory, U.S. stocks rallied. Investors appeared optimistic that the new administration would pursue progrowth policies. Favorable economic news supported stocks, and interest rates moved higher. At their mid-December meeting, U.S. Federal Reserve (Fed) officials raised the target interest rate by a quarter percentage point to a range of 0.50% to 0.75%. The fourth quarter also saw the implementation of the U.S. Securities and Exchange Commission’s new rules for money market funds, which included floating net asset values (NAVs) as well as the possibility of liquidity fees and redemption gates for institutional prime and municipal money market funds. In the year leading up to money market fund reform implementation, nearly $1 trillion in assets moved from money market funds subject to floating NAVs into government money market funds, which continued to transact at a stable $1.00 NAV. Outside of the U.S., the prospects for faster U.S. growth appeared to trigger some acceleration in Europe.
Financial markets gained during the first two quarters of 2017 on positive economic data.
Stocks rallied globally through the first quarter of 2017, supported by signs of improvement in the U.S. and global economies. U.S. economic data released during the quarter reflected a healthy economy. Hiring remained strong, and business and consumer sentiment improved. In March, Fed officials raised their target interest rate by a quarter percentage point to a range of 0.75% to 1.00%. With the Fed’s target interest-rate increase, short-term bond yields rose during the quarter. Meanwhile, longer-term Treasury yields were little changed, leading to positive performance. Investment-grade and high-yield bonds benefited from strong demand. Municipal bond returns were positive in the quarter, helped by strong demand and constrained new-issue supply. Outside of the U.S., stocks in emerging markets generally outperformed stocks in the U.S. and international
| 1 | The S&P 500 Index consists of 500 stocks chosen for market size, liquidity, and industry group representation. It is a market-value-weighted index with each stock’s weight in the index proportionate to its market value. You cannot invest directly in an index. |
| 2 | The Morgan Stanley Capital International (MSCI) All Country World Index (ACWI) ex USA Index (Net) is a free-float-adjusted market-capitalization-weighted index that is designed to measure the equity market performance of developed markets, excluding the United States and Canada. Source: MSCI. MSCI makes no express or implied warranties or representations and shall have no liability whatsoever with respect to any MSCI data contained herein. The MSCI data may not be further redistributed or used as a basis for other indexes or any securities or financial products. This report is not approved, reviewed, or produced by MSCI. You cannot invest directly in an index. |
| 3 | The Bloomberg Barclays U.S. Aggregate Bond Index is a broad-based benchmark that measures the investment-grade, U.S. dollar-denominated, fixed-rate taxable bond market, including Treasuries, government-related and corporate securities, mortgage-backed securities (agency fixed-rate and hybrid adjustable-rate mortgage pass-throughs), asset-backed securities, and commercial mortgage-backed securities. You cannot invest directly in an index. |
| 4 | The Bloomberg Barclays Municipal Bond Index is an unmanaged index composed of long-term tax-exempt bonds with a minimum credit rating of Baa. You cannot invest directly in an index. |
| | | | | | |
| Letter to shareholders (unaudited) | | Wells Fargo Special Mid Cap Value Fund | | | 3 | |
developed markets because they benefited from both global economic growth and recent weakening in the U.S. dollar. Stocks in Asia, Europe, and Latin America also outperformed the U.S. market during the quarter.
Globally, stocks marked continued gains through the second quarter of 2017. Steady, albeit modest, economic growth both in the U.S. and abroad and generally favorable corporate earnings announcements supported higher valuations. U.S. inflation trended lower despite a continued decline in the unemployment rate. Ten-year U.S. Treasury yields declined, resulting in stronger prices for long-term bonds. As was widely expected, the Fed raised the target interest rate in June by a quarter percentage point to a range of 1.00% to 1.25%. In addition, the Fed indicated that it would begin to sell bonds accumulated on its balance sheet during quantitative easing programs conducted since 2008. Later in the third quarter, the Fed confirmed that the initiative to reduce the bonds that it holds likely would begin in October.
Volatility increased during the third quarter of 2017.
Early in July and again in August, volatility expectations increased and then receded—as measured by the CBOE VIX5—amid geopolitical tensions, particularly in Asia, and declining investor optimism following unsuccessful efforts to reform health care laws in the U.S. which suggested to some that President Trump and Congress would be unable to move forward with tax and regulatory reforms.
During the quarter, economic momentum increased in Europe; the European Central Bank held its rates steady at low levels and continued its quantitative easing bond-buying program, which is intended to spark economic activity. The Bank of England suggested it could hike interest rates in November, and the pound gained against other currencies. The Bank of Japan also maintained accommodative policies intended to support business activity and economic growth. In Germany, Angela Merkel was reelected chancellor; in Japan, Prime Minister Shinzo Abe called for snap elections as his popularity increased after North Korea’s aggressive program of missile launches. Both political developments were indicative of the type of political consistency in developed markets that reassure financial markets.
In emerging markets, many countries benefited from stronger currencies versus the U.S. dollar. In addition, commodity prices were on an upward trajectory, which benefited many companies that rely on natural resources for exports.
As the quarter closed, optimism returned as economic growth continued. The second-quarter gross domestic product measure was revised higher from 2.6% annualized to 3.0%. Consumer spending and residential and nonresidential investment increased. While inflation continued to trail the Fed’s targets, expectations remained for an additional short-term interest-rate hike before year-end.
| 5 | The Chicago Board Options Exchange Market Volatility Index (CBOE VIX) is a popular measure of the implied volatility of S&P 500 Index options. It represents one measure of the market’s expectation of stock market volatility over the next 30-day period. You cannot invest directly in an index. |
| | | | |
| 4 | | Wells Fargo Special Mid Cap Value Fund | | Letter to shareholders (unaudited) |
Don’t let short-term uncertainty derail long-term investment goals.
Periods of investment uncertainty can present challenges, but experience has taught us that maintaining long-term investment goals can be an effective way to plan for the future. To help you create a sound strategy based on your personal goals and risk tolerance, Wells Fargo Funds offers more than 100 mutual funds spanning a wide range of asset classes and investment styles. Although diversification cannot guarantee an investment profit or prevent losses, we believe it can be an effective way to manage investment risk and potentially smooth out overall portfolio performance. We encourage investors to know their investments and to understand that appropriate levels of risk-taking may unlock opportunities.
Thank you for choosing to invest with Wells Fargo Funds. We appreciate your confidence in us and remain committed to helping you meet your financial needs.
Sincerely,

Andrew Owen
President
Wells Fargo Funds
For further information about your Fund, contact your investment professional, visit our website at wellsfargofunds.com, or call us directly at 1-800-222-8222. We are available 24 hours a day, 7 days a week.
This page is intentionally left blank.
| | | | |
| 6 | | Wells Fargo Special Mid Cap Value Fund | | Performance highlights (unaudited) |
Investment objective
The Fund seeks long-term capital appreciation.
Manager
Wells Fargo Funds Management, LLC
Subadviser
Wells Capital Management Incorporated
Portfolio managers
James M. Tringas, CFA®, CPA
Bryant VanCronkhite, CFA®, CPA
Average annual total returns (%) as of September 30, 20171
| | | | | | | | | | | | | | | | | | | | | | | | | | | | | | | | | | |
| | | | | Including sales charge | | | Excluding sales charge | | | Expense ratios2 (%) | |
| | | Inception date | | 1 year | | | 5 year | | | 10 year | | | 1 year | | | 5 year | | | 10 year | | | Gross | | | Net3 | |
| Class A (WFPAX) | | 7-31-2007 | | | 7.83 | | | | 14.23 | | | | 8.24 | | | | 14.41 | | | | 15.59 | | | | 8.88 | | | | 1.20 | | | | 1.20 | |
| Class C (WFPCX) | | 7-31-2007 | | | 12.56 | | | | 14.73 | | | | 8.08 | | | | 13.56 | | | | 14.73 | | | | 8.08 | | | | 1.95 | | | | 1.95 | |
| Class R (WFHHX) | | 9-30-2015 | | | – | | | | – | | | | – | | | | 14.13 | | | | 15.33 | | | | 8.63 | | | | 1.45 | | | | 1.45 | |
| Class R6 (WFPRX) | | 6-28-2013 | | | – | | | | – | | | | – | | | | 14.88 | | | | 16.12 | | | | 9.33 | | | | 0.77 | | | | 0.77 | |
| Administrator Class (WFMDX) | | 4-8-2005 | | | – | | | | – | | | | – | | | | 14.50 | | | | 15.73 | | | | 9.01 | | | | 1.12 | | | | 1.12 | |
| Institutional Class (WFMIX) | | 4-8-2005 | | | – | | | | – | | | | – | | | | 14.76 | | | | 16.04 | | | | 9.30 | | | | 0.87 | | | | 0.87 | |
| Russell Midcap® Value Index4 | | – | | | – | | | | – | | | | – | | | | 13.37 | | | | 14.33 | | | | 7.85 | | | | – | | | | – | |
Figures quoted represent past performance, which is no guarantee of future results, and do not reflect taxes that a shareholder may pay on fund distributions or the redemption of fund shares. Investment return and principal value of an investment will fluctuate so that an investor’s shares, when redeemed, may be worth more or less than their original cost. Performance shown without sales charges would be lower if sales charges were reflected. Current performance may be lower or higher than the performance data quoted, which assumes the reinvestment of dividends and capital gains. Current month-end performance is available on the Fund’s website, wellsfargofunds.com.
Index returns do not include transaction costs associated with buying and selling securities, any mutual fund fees or expenses, or any taxes. It is not possible to invest directly in an index.
For Class A shares, the maximum front-end sales charge is 5.75%. For Class C shares, the maximum contingent deferred sales charge is 1.00%. Performance including a contingent deferred sales charge assumes the sales charge for the corresponding time period. Class R, Class R6, Administrator Class, and Institutional Class shares are sold without a front-end sales charge or contingent deferred sales charge.
Stock values fluctuate in response to the activities of individual companies and general market and economic conditions. Smaller-company stocks tend to be more volatile and less liquid than those of larger companies. Consult the Fund’s prospectus for additional information on these and other risks.
Please see footnotes on page 7.
| | | | | | |
| Performance highlights (unaudited) | | Wells Fargo Special Mid Cap Value Fund | | | 7 | |
|
| Growth of $10,000 investment as of September 30, 20175 |
|
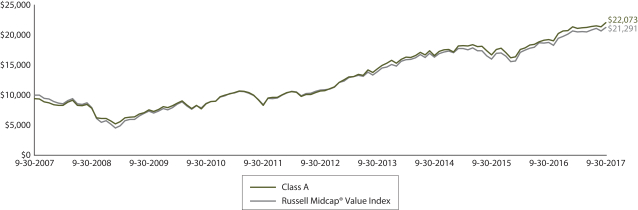 |
| 1 | Historical performance shown for the Class R shares prior to their inception reflects the performance of the Institutional Class shares, adjusted to reflect the higher expenses applicable to Class R shares. Historical performance shown for Class R6 shares prior to their inception reflects the performance of Institutional Class shares, and includes the higher expenses applicable to Institutional Class shares. If these expenses had not been included, the returns for Class R6 shares would be higher. |
| 2 | Reflects the expense ratios as stated in the most recent prospectuses, which include the impact of 0.01% in acquired fund fees and expenses. The expense ratios shown are subject to change and may differ from the annualized expense ratios shown in the financial highlights of this report, which do not include acquired fund fees and expenses. |
| 3 | The manager has contractually committed through January 31, 2018, to waive fees and/or reimburse expenses to the extent necessary to cap the Fund’s Total Annual Fund Operating Expenses After Fee Waivers at 1.22% for Class A, 1.97% for Class C, 1.47% for Class R, 0.79% for Class R6, 1.14% for Administrator Class, and 0.87% for Institutional Class. After this time, the cap may be increased or the commitment to maintain the cap may be terminated only with the approval of the Board of Trustees. Brokerage commissions, stamp duty fees, interest, taxes, acquired fund fees and expenses, and extraordinary expenses are excluded from the expense cap. Without this cap, the Fund’s returns would have been lower. The expense ratio paid by an investor is the net expense ratio or the Fund’s Total Annual Fund Operating Expenses After Fee Waivers, as stated in the prospectuses. |
| 4 | The Russell Midcap® Value Index measures the performance of those Russell Midcap companies with lower price-to-book ratios and lower forecasted growth values. The stocks are also members of the Russell 1000® Value Index. You cannot invest directly in an index. |
| 5 | The chart compares the performance of Class A shares for the most recent ten years with the Russell Midcap® Value Index. The chart assumes a hypothetical investment of $10,000 in Class A shares and reflects all operating expenses and assumes the maximum initial sales charge of 5.75%. |
| 6 | The ten largest holdings, excluding cash and cash equivalents, are calculated based on the value of the investments divided by total net assets of the Fund. Holdings are subject to change and may have changed since the date specified. |
| 7 | Amounts are calculated based on the total long-term investments of the Fund. These amounts are subject to change and may have changed since the date specified. |
| | | | |
| 8 | | Wells Fargo Special Mid Cap Value Fund | | Performance highlights (unaudited) |
MANAGER’S DISCUSSION
Fund highlights
| ∎ | | The Fund outperformed its benchmark, the Russell Midcap® Value Index, for the 12-month period that ended September 30, 2017. |
| ∎ | | Contributors to performance included stock selection in the materials and health care sectors and an underweight to the real estate sector. |
| ∎ | | Detractors from performance included stock selection in the consumer staples and information technology (IT) sectors; cash held in the portfolio also hindered performance. |
Over the 12-month period, the U.S. stock market produced strong returns, primarily driven by improved expectations for global growth and hope that the new Trump administration would be successful in delivering on the progrowth agenda emphasized during the campaign. Although many of the progrowth items on the president’s agenda have faced political challenges in the period since the election, mid-cap value stocks, along with the overall stock market, have continued to show resiliency as investors have appeared to remain optimistic regarding the potential for tax reform and reduced government regulations.
Our process focuses on companies that strive to control their own destinies through long-term competitive advantages, flexible balance sheets, and sustainable free cash flow. We believe that with our focus on these types of companies, the Fund potentially can continue to participate in up markets, such as we experienced over the reporting period, and that losses in any down markets may be mitigated should progrowth policies not be implemented.
| | | | |
| Ten largest holdings (%) as of September 30, 20176 | |
Fidelity National Information Services Incorporated | | | 2.84 | |
Republic Services Incorporated | | | 2.66 | |
Ameren Corporation | | | 2.61 | |
Molson Coors Brewing Company Class B | | | 2.58 | |
Kansas City Southern | | | 2.57 | |
The Allstate Corporation | | | 2.43 | |
TreeHouse Foods Incorporated | | | 2.37 | |
CBRE Group Incorporated Class A | | | 2.33 | |
Jacobs Engineering Group Incorporated | | | 2.31 | |
Loews Corporation | | | 2.30 | |
We made modest changes to sector weightings.
Our stock-selection process is predominantly driven by our bottom-up stock selection; this process led to modest changes to the Fund’s sector weightings during the period. We maintained overweights to the industrials and IT sectors because they offer an eclectic set of companies that in our view potentially create unique investment opportunities. Although we added several real estate companies during the period, the Fund remained heavily underweight the real estate sector due to results obtained through our valuation research. The Fund’s overweight to the consumer staples sector narrowed over the 12-month period partly because we trimmed positions as valuations moved higher and individual reward/risk ratios decreased. The Fund’s underweight to
the consumer discretionary sector widened as we saw increased shorter-term risks with many of the stocks within the sector and potentially better reward/risk opportunities elsewhere. We increased the Fund’s exposure to the materials sector to an overweight position as we uncovered what we think could be good value-creation opportunities within the sector.
An underweight to the real estate sector and stock selection in the materials and health care sectors benefited the Fund’s performance.
We have struggled to find compelling valuation opportunities within the real estate sector in recent years. This disciplined valuation approach benefited performance during the period as the sector significantly underperformed. Within the materials sector, containerboard and packaging producer Packaging Corporation of America was a significant contributor to the Fund’s performance. We have seen Packaging Corporation use its balance-sheet flexibility to consolidate the containerboard industry and vertically integrate its operations to improve its cost structure and the industry’s supply dynamics. We are heartened to see that investments like Packaging Corporation are now being rewarded via improved results and stock-price appreciation. Within the health care sector, insurer Humana Incorporated positively contributed to the Fund’s performance. The company has made significant investments in its Medicare Advantage business; Humana exited some noncore businesses over the past few years, and its reallocation of capital has benefited from a trend toward strong growth in Medicare Advantage enrollments.
Please see footnotes on page 7.
| | | | | | |
| Performance highlights (unaudited) | | Wells Fargo Special Mid Cap Value Fund | | | 9 | |
|
| Sector distribution as of September 30, 20177 |
|
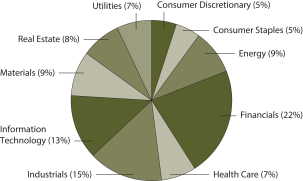 |
Stock selection in the IT and consumer staples sectors detracted from the Fund’s performance.
Within the IT sector, the Fund has been exposed primarily to the IT services industry, which produced more modest returns than the more volatile IT hardware and semiconductor industries did during the period. Our process demands sustainable free cash flow, and that discipline typically eliminates many of the more cyclical semiconductor and hardware stocks that rallied substantially over the reporting period.
Consumer staples holding TreeHouse Foods, Incorporated was the Fund’s largest detractor over the period. A manufacturer of private-label food and
beverage products, TreeHouse Foods has been facing some near-term challenges, including higher input costs, lower volume growth, complications with integrating a recent acquisition, and a need to increase investment in its packaging solutions. TreeHouse Foods remains a core holding within the Fund because we believe many of these headwinds may be short-term issues, and we have confidence that the company’s management knows the steps it needs to take to position the company for future success.
Our outlooks for the Fund and our process remain positive.
As we look toward the end of 2017, we see numerous market forces at play that could bring further volatility. Stock valuations have moved significantly higher and may be forecasting a corporate tax cut; however, we view the amount, timing, and structure of any cuts as very uncertain. Another question mark facing investors over the next 6 to 12 months is when, and by how much, the Federal Reserve (Fed) will choose to raise interest rates. Also uncertain is the potential impact of the Fed’s planned effort to reduce its $4.5 trillion balance sheet. We believe it is prudent to manage downside risks, and we will continue to invest in companies that we believe have taken steps to control their own destiny, as noted earlier.
We believe our team’s fundamental analysis, risk management, and active investment process are well suited to potentially take advantage of new opportunities as the stock market evolves. While volatility may increase, the strong balance sheets and stable cash flows of the companies within the Fund’s portfolio may support consistent long-term performance. We maintain a favorable outlook for the portfolio as we enter the calendar-year fourth quarter of 2017.
Please see footnotes on page 7.
| | | | |
| 10 | | Wells Fargo Special Mid Cap Value Fund | | Fund expenses (unaudited) |
As a shareholder of the Fund, you incur two types of costs: (1) transaction costs, including sales charges (loads) on purchase payments and contingent deferred sales charges (if any) on redemptions and (2) ongoing costs, including management fees, distribution (12b-1) and/or shareholder servicing fees, and other Fund expenses. This example is intended to help you understand your ongoing costs (in dollars) of investing in the Fund and to compare these costs with the ongoing costs of investing in other mutual funds.
The example is based on an investment of $1,000 invested at the beginning of the six-month period and held for the entire period from April 1, 2017 to September 30, 2017.
Actual expenses
The “Actual” line of the table below provides information about actual account values and actual expenses. You may use the information in this line, together with the amount you invested, to estimate the expenses that you paid over the period. Simply divide your account value by $1,000 (for example, an $8,600 account value divided by $1,000 = 8.6), then multiply the result by the number in the “Actual” line under the heading entitled “Expenses paid during period” for your applicable class of shares to estimate the expenses you paid on your account during this period.
Hypothetical example for comparison purposes
The “Hypothetical” line of the table below provides information about hypothetical account values and hypothetical expenses based on the Fund’s actual expense ratio and an assumed rate of return of 5% per year before expenses, which is not the Fund’s actual return. The hypothetical account values and expenses may not be used to estimate the actual ending account balance or expenses you paid for the period. You may use this information to compare the ongoing costs of investing in the Fund and other funds. To do so, compare this 5% hypothetical example with the 5% hypothetical examples that appear in the shareholder reports of the other funds.
Please note that the expenses shown in the table are meant to highlight your ongoing costs only and do not reflect any transactional costs, such as sales charges (loads) and contingent deferred sales charges. Therefore, the “Hypothetical” line of the table is useful in comparing ongoing costs only and will not help you determine the relative total costs of owning different funds. In addition, if these transactional costs were included, your costs would have been higher.
| | | | | | | | | | | | | | | | |
| | | Beginning
account value
4-1-2017 | | | Ending
account value
9-30-2017 | | | Expenses
paid during
the period¹ | | | Annualized net
expense ratio | |
Class A | | | | | | | | | | | | | | | | |
Actual | | $ | 1,000.00 | | | $ | 1,045.45 | | | $ | 5.99 | | | | 1.17 | % |
Hypothetical (5% return before expenses) | | $ | 1,000.00 | | | $ | 1,019.22 | | | $ | 5.91 | | | | 1.17 | % |
Class C | | | | | | | | | | | | | | | | |
Actual | | $ | 1,000.00 | | | $ | 1,041.63 | | | $ | 9.82 | | | | 1.92 | % |
Hypothetical (5% return before expenses) | | $ | 1,000.00 | | | $ | 1,015.45 | | | $ | 9.69 | | | | 1.92 | % |
Class R | | | | | | | | | | | | | | | | |
Actual | | $ | 1,000.00 | | | $ | 1,044.43 | | | $ | 7.27 | | | | 1.42 | % |
Hypothetical (5% return before expenses) | | $ | 1,000.00 | | | $ | 1,017.95 | | | $ | 7.18 | | | | 1.42 | % |
Class R6 | | | | | | | | | | | | | | | | |
Actual | | $ | 1,000.00 | | | $ | 1,047.88 | | | $ | 3.79 | | | | 0.74 | % |
Hypothetical (5% return before expenses) | | $ | 1,000.00 | | | $ | 1,021.36 | | | $ | 3.74 | | | | 0.74 | % |
Administrator Class | | | | | | | | | | | | | | | | |
Actual | | $ | 1,000.00 | | | $ | 1,046.10 | | | $ | 5.58 | | | | 1.09 | % |
Hypothetical (5% return before expenses) | | $ | 1,000.00 | | | $ | 1,019.61 | | | $ | 5.51 | | | | 1.09 | % |
Institutional Class | | | | | | | | | | | | | | | | |
Actual | | $ | 1,000.00 | | | $ | 1,047.09 | | | $ | 4.30 | | | | 0.84 | % |
Hypothetical (5% return before expenses) | | $ | 1,000.00 | | | $ | 1,020.86 | | | $ | 4.25 | | | | 0.84 | % |
| 1 | Expenses paid is equal to the annualized net expense ratio of each class multiplied by the average account value over the period, multiplied by the number of days in the most recent fiscal half-year divided by the number of days in the fiscal year (to reflect the one-half-year period). |
| | | | | | |
| Portfolio of investments—September 30, 2017 | | Wells Fargo Special Mid Cap Value Fund | | | 11 | |
| | | | | | | | | | | | | | | | |
| Security name | | | | | | | | Shares | | | Value | |
| | | | |
Common Stocks: 94.44% | | | | | | | | | | | | | | | | |
| | | | |
Consumer Discretionary: 4.94% | | | | | | | | | | | | | | | | |
| | | | |
| Hotels, Restaurants & Leisure: 0.90% | | | | | | | | | | | | | | | | |
The Wendy’s Company | | | | | | | | | | | 4,621,700 | | | $ | 71,775,001 | |
| | | | | | | | | | | | | | | | |
| | | | |
| Household Durables: 1.05% | | | | | | | | | | | | | | | | |
Mohawk Industries Incorporated † | | | | | | | | | | | 335,900 | | | | 83,138,609 | |
| | | | | | | | | | | | | | | | |
| | | | |
| Media: 0.97% | | | | | | | | | | | | | | | | |
Interpublic Group of Companies Incorporated | | | | | | | | | | | 3,683,600 | | | | 76,582,044 | |
| | | | | | | | | | | | | | | | |
| | | | |
| Multiline Retail: 2.02% | | | | | | | | | | | | | | | | |
Kohl’s Corporation « | | | | | | | | | | | 3,516,900 | | | | 160,546,485 | |
| | | | | | | | | | | | | | | | |
| | | | |
Consumer Staples: 4.95% | | | | | | | | | | | | | | | | |
| | | | |
| Beverages: 2.58% | | | | | | | | | | | | | | | | |
Molson Coors Brewing Company Class B | | | | | | | | | | | 2,507,210 | | | | 204,688,624 | |
| | | | | | | | | | | | | | | | |
| | | | |
| Food Products: 2.37% | | | | | | | | | | | | | | | | |
TreeHouse Foods Incorporated Ǡ | | | | | | | | | | | 2,771,109 | | | | 187,687,213 | |
| | | | | | | | | | | | | | | | |
| | | | |
Energy: 7.97% | | | | | | | | | | | | | | | | |
| | | | |
| Energy Equipment & Services: 4.39% | | | | | | | | | | | | | | | | |
C&J Energy Services Incorporated † | | | | | | | | | | | 2,369,100 | | | | 71,001,927 | |
National Oilwell Varco Incorporated | | | | | | | | | | | 3,231,100 | | | | 115,447,203 | |
Patterson-UTI Energy Incorporated | | | | | | | | | | | 5,684,600 | | | | 119,035,524 | |
US Silica Holdings Incorporated « | | | | | | | | | | | 1,379,900 | | | | 42,873,493 | |
| |
| | | | 348,358,147 | |
| | | | | | | | | | | | | | | | |
| | | | |
| Oil, Gas & Consumable Fuels: 3.58% | | | | | | | | | | | | | | | | |
Anadarko Petroleum Corporation | | | | | | | | | | | 1,730,200 | | | | 84,520,270 | |
Cimarex Energy Company | | | | | | | | | | | 746,400 | | | | 84,843,288 | |
Hess Corporation | | | | | | | | | | | 2,453,100 | | | | 115,025,859 | |
| |
| | | | 284,389,417 | |
| | | | | | | | | | | | | | | | |
| | | | |
Financials: 20.99% | | | | | | | | | | | | | | | | |
| | | | |
| Banks: 5.14% | | | | | | | | | | | | | | | | |
Fifth Third Bancorp | | | | | | | | | | | 3,578,700 | | | | 100,132,026 | |
PacWest Bancorp | | | | | | | | | | | 2,535,407 | | | | 128,063,408 | |
Regions Financial Corporation | | | | | | | | | | | 7,956,100 | | | | 121,171,403 | |
Zions Bancorporation | | | | | | | | | | | 1,238,100 | | | | 58,413,558 | |
| |
| | | | 407,780,395 | |
| | | | | | | | | | | | | | | | |
| | | | |
| Capital Markets: 2.11% | | | | | | | | | | | | | | | | |
Northern Trust Corporation | | | | | | | | | | | 1,302,700 | | | | 119,757,211 | |
TD Ameritrade Holding Corporation | | | | | | | | | | | 979,100 | | | | 47,780,080 | |
| |
| | | | 167,537,291 | |
| | | | | | | | | | | | | | | | |
The accompanying notes are an integral part of these financial statements.
| | | | |
| 12 | | Wells Fargo Special Mid Cap Value Fund | | Portfolio of investments—September 30, 2017 |
| | | | | | | | | | | | | | | | |
| Security name | | | | | | | | Shares | | | Value | |
| | | | |
| Consumer Finance: 1.20% | | | | | | | | | | | | | | | | |
Ally Financial Incorporated | | | | | | | | | | | 3,943,261 | | | $ | 95,663,512 | |
| | | | | | | | | | | | | | | | |
| | | | |
| Insurance: 11.55% | | | | | | | | | | | | | | | | |
Arch Capital Group Limited † | | | | | | | | | | | 1,100,736 | | | | 108,422,496 | |
Brown & Brown Incorporated | | | | | | | | | | | 3,156,100 | | | | 152,092,459 | |
FNF Group | | | | | | | | | | | 3,198,214 | | | | 151,787,236 | |
Loews Corporation | | | | | | | | | | | 3,816,500 | | | | 182,657,690 | |
The Allstate Corporation | | | | | | | | | | | 2,095,900 | | | | 192,634,169 | |
Willis Towers Watson plc | | | | | | | | | | | 834,900 | | | | 128,766,627 | |
| | | | |
| | | | | | | | | | | | | | | 916,360,677 | |
| | | | | | | | | | | | | | | | |
| | | | |
| Mortgage REITs: 0.99% | | | | | | | | | | | | | | | | |
AGNC Investment Corporation | | | | | | | | | | | 3,627,200 | | | | 78,637,696 | |
| | | | | | | | | | | | | | | | |
| | | | |
Health Care: 6.63% | | | | | | | | | | | | | | | | |
| | | | |
| Health Care Equipment & Supplies: 1.93% | | | | | | | | | | | | | | | | |
Steris plc | | | | | | | | | | | 811,500 | | | | 71,736,600 | |
Varian Medical Systems Incorporated | | | | | | | | | | | 619,900 | | | | 62,027,194 | |
Zimmer Biomet Holdings Incorporated | | | | | | | | | | | 164,200 | | | | 19,226,178 | |
| | | | |
| | | | | | | | | | | | | | | 152,989,972 | |
| | | | | | | | | | | | | | | | |
| | | | |
| Health Care Providers & Services: 4.70% | | | | | | | | | | | | | | | | |
AmerisourceBergen Corporation | | | | | | | | | | | 1,399,500 | | | | 115,808,625 | |
Humana Incorporated | | | | | | | | | | | 540,200 | | | | 131,608,926 | |
Patterson Companies Incorporated « | | | | | | | | | | | 1,030,100 | | | | 39,813,365 | |
Universal Health Services Incorporated Class B | | | | | | | | | | | 774,900 | | | | 85,967,406 | |
| | | | |
| | | | | | | | | | | | | | | 373,198,322 | |
| | | | | | | | | | | | | | | | |
| | | | |
Industrials: 14.19% | | | | | | | | | | | | | | | | |
| | | | |
| Aerospace & Defense: 2.36% | | | | | | | | | | | | | | | | |
Arconic Incorporated | | | | | | | | | | | 3,300,700 | | | | 82,121,416 | |
Raytheon Company | | | | | | | | | | | 561,900 | | | | 104,839,302 | |
| | | | |
| | | | | | | | | | | | | | | 186,960,718 | |
| | | | | | | | | | | | | | | | |
| | | | |
| Commercial Services & Supplies: 3.66% | | | | | | | | | | | | | | | | |
Republic Services Incorporated | | | | | | | | | | | 3,189,675 | | | | 210,709,931 | |
Stericycle Incorporated † | | | | | | | | | | | 1,117,300 | | | | 80,021,026 | |
| | | | |
| | | | | | | | | | | | | | | 290,730,957 | |
| | | | | | | | | | | | | | | | |
| | | | |
| Construction & Engineering: 2.31% | | | | | | | | | | | | | | | | |
Jacobs Engineering Group Incorporated | | | | | | | | | | | 3,151,800 | | | | 183,655,386 | |
| | | | | | | | | | | | | | | | |
| | | | |
| Machinery: 1.91% | | | | | | | | | | | | | | | | |
Deere & Company | | | | | | | | | | | 639,900 | | | | 80,365,041 | |
The Middleby Corporation † | | | | | | | | | | | 552,600 | | | | 70,826,742 | |
| | | | |
| | | | | | | | | | | | | | | 151,191,783 | |
| | | | | | | | | | | | | | | | |
The accompanying notes are an integral part of these financial statements.
| | | | | | |
| Portfolio of investments—September 30, 2017 | | Wells Fargo Special Mid Cap Value Fund | | | 13 | |
| | | | | | | | | | | | | | | | |
| Security name | | | | | | | | Shares | | | Value | |
| | | | |
| Road & Rail: 3.95% | | | | | | | | | | | | | | | | |
Kansas City Southern | | | | | | | | | | | 1,880,000 | | | $ | 204,318,400 | |
Ryder System Incorporated | | | | | | | | | | | 1,294,500 | | | | 109,449,975 | |
| | | | |
| | | | | | | | | | | | | | | 313,768,375 | |
| | | | | | | | | | | | | | | | |
| | | | |
Information Technology: 12.08% | | | | | | | | | | | | | | | | |
| | | | |
| Communications Equipment: 3.08% | | | | | | | | | | | | | | | | |
ARRIS International plc † | | | | | | | | | | | 2,953,600 | | | | 84,148,064 | |
Harris Corporation | | | | | | | | | | | 1,219,300 | | | | 160,557,424 | |
| | | | |
| | | | | | | | | | | | | | | 244,705,488 | |
| | | | | | | | | | | | | | | | |
| | | | |
| IT Services: 7.11% | | | | | | | | | | | | | | | | |
Amdocs Limited | | | | | | | | | | | 2,361,800 | | | | 151,910,976 | |
DST Systems Incorporated | | | | | | | | | | | 1,243,864 | | | | 68,263,256 | |
Fidelity National Information Services Incorporated | | | | | | | | | | | 2,412,000 | | | | 225,256,680 | |
Leidos Holdings Incorporated | | | | | | | | | | | 2,004,800 | | | | 118,724,256 | |
| | | | |
| | | | | | | | | | | | | | | 564,155,168 | |
| | | | | | | | | | | | | | | | |
| | | | |
| Technology Hardware, Storage & Peripherals: 1.89% | | | | | | | | | | | | | | | | |
NCR Corporation † | | | | | | | | | | | 3,989,500 | | | | 149,686,040 | |
| | | | | | | | | | | | | | | | |
| | | | |
Materials: 8.65% | | | | | | | | | | | | | | | | |
| | | | |
| Chemicals: 3.31% | | | | | | | | | | | | | | | | |
International Flavors & Fragrances Incorporated | | | | | | | | | | | 908,000 | | | | 129,762,280 | |
PPG Industries Incorporated | | | | | | | | | | | 1,219,800 | | | | 132,543,468 | |
| | | | |
| | | | | | | | | | | | | | | 262,305,748 | |
| | | | | | | | | | | | | | | | |
| | | | |
| Containers & Packaging: 5.34% | | | | | | | | | | | | | | | | |
International Paper Company | | | | | | | | | | | 2,697,600 | | | | 153,277,632 | |
Packaging Corporation of America | | | | | | | | | | | 1,204,300 | | | | 138,109,124 | |
Sealed Air Corporation | | | | | | | | | | | 3,102,400 | | | | 132,534,528 | |
| | | | |
| | | | | | | | | | | | | | | 423,921,284 | |
| | | | | | | | | | | | | | | | |
| | | | |
Real Estate: 7.22% | | | | | | | | | | | | | | | | |
| | | | |
| Equity REITs: 4.89% | | | | | | | | | | | | | | | | |
American Campus Communities Incorporated | | | | | | | | | | | 2,742,585 | | | | 121,085,128 | |
Corporate Office Properties Trust | | | | | | | | | | | 1,644,100 | | | | 53,975,803 | |
GGP Incorporated | | | | | | | | | | | 1,528,300 | | | | 31,742,791 | |
Invitation Homes Incorporated « | | | | | | | | | | | 3,633,828 | | | | 82,306,204 | |
Mid-America Apartment Communities Incorporated | | | | | | | | | | | 926,400 | | | | 99,013,632 | |
| | | | |
| | | | | | | | | | | | | | | 388,123,558 | |
| | | | | | | | | | | | | | | | |
| | | | |
| Real Estate Management & Development: 2.33% | | | | | | | | | | | | | | | | |
CBRE Group Incorporated Class A † | | | | | | | | | | | 4,871,600 | | | | 184,536,208 | |
| | | | | | | | | | | | | | | | |
| | | | |
Utilities: 6.82% | | | | | | | | | | | | | | | | |
| | | | |
| Electric Utilities: 2.22% | | | | | | | | | | | | | | | | |
American Electric Power Company Incorporated | | | | | | | | | | | 2,509,460 | �� | | | 176,264,470 | |
| | | | | | | | | | | | | | | | |
The accompanying notes are an integral part of these financial statements.
| | | | |
| 14 | | Wells Fargo Special Mid Cap Value Fund | | Portfolio of investments—September 30, 2017 |
| | | | | | | | | | | | | | | | |
| Security name | | | | | | | | Shares | | | Value | |
| | | | |
| Multi-Utilities: 2.60% | | | | | | | | | | | | | | | | |
Ameren Corporation | | | | | | | | | | | 3,575,250 | | | $ | 206,792,460 | |
| | | | | | | | | | | | | | | | |
| | | | |
| Water Utilities: 2.00% | | | | | | | | | | | | | | | | |
American Water Works Company Incorporated | | | | | | | | | | | 1,958,700 | | | | 158,478,417 | |
| | | | | | | | | | | | | | | | |
| | | | |
Total Common Stocks (Cost $6,447,906,731) | | | | | | | | | | | | | | | 7,494,609,465 | |
| | | | | | | | | | | | | | | | |
| | | | |
| | | Yield | | | | | | | | | | |
| Short-Term Investments: 7.33% | | | | | | | | | | | | | | | | |
| | | | |
| Investment Companies: 7.33% | | | | | | | | | | | | | | | | |
Securities Lending Cash Investment LLC (l)(r)(u) | | | 1.25 | % | | | | | | | 131,645,898 | | | | 131,659,063 | |
Wells Fargo Government Money Market Fund Select Class (l)(u) | | | 0.92 | | | | | | | | 450,420,430 | | | | 450,420,430 | |
| | | | |
Total Short-Term Investments (Cost $582,079,493) | | | | | | | | | | | | | | | 582,079,493 | |
| | | | | | | | | | | | | | | | |
| | | | | | | | |
| Total investments in securities (Cost $7,029,986,224) | | | 101.77 | % | | | 8,076,688,958 | |
Other assets and liabilities, net | | | (1.77 | ) | | | (140,687,027 | ) |
| | | | | | | | |
| Total net assets | | | 100.00 | % | | $ | 7,936,001,931 | |
| | | | | | | | |
| † | Non-income-earning security |
| « | All or a portion of this security is on loan. |
| (l) | The issuer of the security is an affiliated person of the Fund as defined in the Investment Company Act of 1940. |
| (r) | The investment is a non-registered investment company purchased with cash collateral received from securities on loan. |
| (u) | The rate represents the 7-day annualized yield at period end. |
Investments in Affiliates
An affiliated investment is an investment in which the Fund owns at least 5% of the outstanding voting shares of the issuer or as a result of other relationships, such as the Fund and the issuer having the same investment manager. Transactions with issuers that were either affiliated persons of the Fund at the beginning of the period or the end of the period were as follows:
| | | | | | | | | | | | | | | | | | | | | | | | | | | | | | | | | | | | |
| | | Shares,
beginning of
period | | | Shares
purchased | | | Shares
sold | | | Shares,
end of
period | | | Net
realized
gains
(losses) | | | Net change
in
unrealized
gains
(losses) | | | Income
from
affiliated
securities | | | Value,
end
of period | | | % of net assets | |
Short-Term Investments | | | | | | | | | | | | | | | | | | | | | | | | | | | | | | | | | | | | |
| | | | | | | | | |
Investment companies | | | | | | | | | | | | | | | | | | | | | | | | | | | | | | | | | | | | |
Securities Lending Cash Investment LLC | | | 0 | | | | 1,099,008,982 | | | | 967,363,084 | | | | 131,645,898 | | | $ | 313 | | | $ | 0 | | | $ | 755,571 | | | $ | 131,659,063 | | | | | |
Wells Fargo Government Money Market Fund Select Class | | | 159,931,136 | | | | 2,062,487,092 | | | | 1,771,997,798 | | | | 450,420,430 | | | | 0 | | | | 0 | | | | 2,422,987 | | | | 450,420,430 | | | | | |
| | | | | | | | | | | | | | | | | | | | | | | | | | | | | | | | | | | | |
| | | | | | | | | | | | | | | | | | $ | 313 | | | $ | 0 | | | $ | 3,178,558 | | | $ | 582,079,493 | | | | 7.33 | % |
| | | | | | | | | | | | | | | | | | | | | | | | | | | | | | | | | | | | |
The accompanying notes are an integral part of these financial statements.
| | | | | | |
| Statement of assets and liabilities—September 30, 2017 | | Wells Fargo Special Mid Cap Value Fund | | | 15 | |
| | | | |
| | | | |
| |
Assets | | | | |
Investments in unaffiliated securities (including $128,712,287 of securities loaned), at value (cost $6,447,906,731) | | $ | 7,494,609,465 | |
Investments in affiliated securities, at value (cost $582,079,493) | | | 582,079,493 | |
Receivable for investments sold | | | 3,866,692 | |
Receivable for Fund shares sold | | | 28,495,820 | |
Receivable for dividends | | | 8,296,186 | |
Receivable for securities lending income | | | 26,393 | |
Prepaid expenses and other assets | | | 34,723 | |
| | | | |
Total assets | | | 8,117,408,772 | |
| | | | |
| |
Liabilities | | | | |
Payable for investments purchased | | | 33,483,639 | |
Payable for Fund shares redeemed | | | 9,409,765 | |
Payable upon receipt of securities loaned | | | 131,658,750 | |
Management fee payable | | | 4,374,706 | |
Administration fees payable | | | 859,089 | |
Distribution fees payable | | | 122,840 | |
Accrued expenses and other liabilities | | | 1,498,052 | |
| | | | |
Total liabilities | | | 181,406,841 | |
| | | | |
Total net assets | | $ | 7,936,001,931 | |
| | | | |
| |
NET ASSETS CONSIST OF | | | | |
Paid-in capital | | $ | 6,600,716,268 | |
Undistributed net investment income | | | 56,598,980 | |
Accumulated net realized gains on investments | | | 231,983,949 | |
Net unrealized gains on investments | | | 1,046,702,734 | |
| | | | |
Total net assets | | $ | 7,936,001,931 | |
| | | | |
| |
COMPUTATION OF NET ASSET VALUE AND OFFERING PRICE PER SHARE | | | | |
Net assets – Class A | | $ | 1,070,690,027 | |
Shares outstanding – Class A1 | | | 28,559,263 | |
Net asset value per share – Class A | | | $37.49 | |
Maximum offering price per share – Class A2 | | | $39.78 | |
Net assets – Class C | | $ | 191,953,579 | |
Shares outstanding – Class C1 | | | 5,327,258 | |
Net asset value per share – Class C | | | $36.03 | |
Net assets – Class R | | $ | 14,504,559 | |
Shares outstanding – Class R1 | | | 380,923 | |
Net asset value per share – Class R | | | $38.08 | |
Net assets – Class R6 | | $ | 906,784,330 | |
Shares outstanding – Class R61 | | | 23,538,918 | |
Net asset value per share – Class R6 | | | $38.52 | |
Net assets – Administrator Class | | $ | 1,156,795,523 | |
Shares outstanding – Administrator Class1 | | | 30,347,753 | |
Net asset value per share – Administrator Class | | | $38.12 | |
Net assets – Institutional Class | | $ | 4,595,273,913 | |
Shares outstanding – Institutional Class1 | | | 119,440,081 | |
Net asset value per share – Institutional Class | | | $38.47 | |
| 1 | The Fund has an unlimited number of authorized shares. |
| 2 | Maximum offering price is computed as 100/94.25 of net asset value. On investments of $50,000 or more, the offering price is reduced. |
The accompanying notes are an integral part of these financial statements.
| | | | |
| 16 | | Wells Fargo Special Mid Cap Value Fund | | Statement of operations—year ended September 30, 2017 |
| | | | |
| | | | |
| |
Investment income | | | | |
Dividends (net of foreign withholding taxes of $57,923) | | $ | 128,641,497 | |
Income from affiliated securities | | | 3,178,558 | |
| | | | |
Total investment income | | | 131,820,055 | |
| | | | |
| |
Expenses | | | | |
Management fee | | | 43,414,879 | |
Administration fees | | | | |
Class A | | | 2,601,111 | |
Class C | | | 341,519 | |
Class R | | | 14,330 | |
Class R6 | | | 180,692 | |
Administrator Class | | | 1,297,474 | |
Institutional Class | | | 4,426,602 | |
Shareholder servicing fees | | | | |
Class A | | | 3,096,560 | |
Class C | | | 406,571 | |
Class R | | | 17,060 | |
Administrator Class | | | 2,495,143 | |
Distribution fees | | | | |
Class C | | | 1,219,712 | |
Class R | | | 17,060 | |
Custody and accounting fees | | | 252,691 | |
Professional fees | | | 44,867 | |
Registration fees | | | 695,138 | |
Shareholder report expenses | | | 1,383,721 | |
Trustees’ fees and expenses | | | 20,060 | |
Other fees and expenses | | | 37,891 | |
| | | | |
Total expenses | | | 61,963,081 | |
| | | | |
Net investment income | | | 69,856,974 | |
| | | | |
| |
REALIZED AND UNREALIZED GAINS (LOSSES) ON INVESTMENTS | | | | |
| |
Net realized gains on: | | | | |
Unaffiliated securities | | | 263,905,358 | |
Affiliated securities | | | 313 | |
| | | | |
Net realized gains on investments | | | 263,905,671 | |
Net change in unrealized gains (losses) on investments | | | 507,582,662 | |
| | | | |
Net realized and unrealized gains (losses) on investments | | | 771,488,333 | |
| | | | |
Net increase in net assets resulting from operations | | $ | 841,345,307 | |
| | | | |
The accompanying notes are an integral part of these financial statements.
| | | | | | |
| Statement of changes in net assets | | Wells Fargo Special Mid Cap Value Fund | | | 17 | |
| | | | | | | | | | | | | | | | |
| | | Year ended
September 30, 2017 | | | Year ended
September 30, 2016 | |
| | | | |
Operations | | | | | | | | | | | | | | | | |
Net investment income | | | | | | $ | 69,856,974 | | | | | | | $ | 29,787,605 | |
Net realized gains on investments | | | | | | | 263,905,671 | | | | | | | | 1,165,809 | |
Net change in unrealized gains (losses) on investments | | | | | | | 507,582,662 | | | | | | | | 524,769,917 | |
| | | | |
Net increase in net assets resulting from operations | | | | | | | 841,345,307 | | | | | | | | 555,723,331 | |
| | | | |
| | | | |
Distributions to shareholders from | | | | | | | | | | | | | | | | |
Net investment income | | | | | | | | | | | | | | | | |
Class A | | | | | | | (7,950,644 | ) | | | | | | | (3,106,870 | ) |
Class C | | | | | | | (22,847 | ) | | | | | | | (20,450 | ) |
Class R | | | | | | | (20,893 | ) | | | | | | | (195 | ) |
Class R6 | | | | | | | (4,366,000 | ) | | | | | | | (1,171,323 | ) |
Administrator Class | | | | | | | (5,647,481 | ) | | | | | | | (2,729,427 | ) |
Institutional Class | | | | | | | (24,469,171 | ) | | | | | | | (3,574,594 | ) |
Net realized gains | | | | | | | | | | | | | | | | |
Class A | | | | | | | (8,040,188 | ) | | | | | | | (40,065,294 | ) |
Class C | | | | | | | (774,149 | ) | | | | | | | (2,776,111 | ) |
Class R | | | | | | | (15,345 | ) | | | | | | | (920 | ) |
Class R6 | | | | | | | (2,351,311 | ) | | | | | | | (5,563,069 | ) |
Administrator Class | | | | | | | (4,977,762 | ) | | | | | | | (17,677,686 | ) |
Institutional Class | | | | | | | (14,258,083 | ) | | | | | | | (17,921,301 | ) |
| | | | |
Total distributions to shareholders | | | | | | | (72,893,874 | ) | | | | | | | (94,607,240 | ) |
| | | | |
| | | | |
Capital share transactions | | | Shares | | | | | | | | Shares | | | | | |
Proceeds from shares sold | | | | | | | | | | | | | | | | |
Class A | | | 13,154,908 | | | | 465,537,737 | | | | 32,591,298 | | | | 1,012,650,670 | |
Class C | | | 2,711,868 | | | | 92,767,956 | | | | 2,098,801 | | | | 62,533,533 | |
Class R | | | 375,826 | | | | 13,756,543 | | | | 54,121 | | | | 1,738,947 | |
Class R6 | | | 15,662,932 | | | | 576,145,190 | | | | 8,542,115 | | | | 271,942,094 | |
Administrator Class | | | 11,300,924 | | | | 409,573,144 | | | | 36,577,283 | | | | 1,062,087,191 | |
Institutional Class | | | 73,476,646 | | | | 2,698,093,386 | | | | 64,727,505 | | | | 2,061,463,035 | |
Investor Class | | | N/A | | | | N/A | | | | 231,357 | 1 | | | 7,299,395 | 1 |
| | | | |
| | | | | | | 4,255,873,956 | | | | | | | | 4,479,714,865 | |
| | | | |
Reinvestment of distributions | | | | | | | | | | | | | | | | |
Class A | | | 430,399 | | | | 15,319,605 | | | | 1,432,793 | | | | 41,899,896 | |
Class C | | | 21,636 | | | | 747,041 | | | | 91,890 | | | | 2,596,151 | |
Class R | | | 1,001 | | | | 36,238 | | | | 37 | | | | 1,115 | |
Class R6 | | | 184,501 | | | | 6,716,950 | | | | 223,787 | | | | 6,734,392 | |
Administrator Class | | | 293,544 | | | | 10,613,440 | | | | 684,328 | | | | 20,395,161 | |
Institutional Class | | | 939,200 | | | | 34,186,140 | | | | 647,950 | | | | 19,486,743 | |
| | | | |
| | | | | | | 67,619,414 | | | | | | | | 91,113,458 | |
| | | | |
Payment for shares redeemed | | | | | | | | | | | | | | | | |
Class A | | | (26,185,672 | ) | | | (938,590,776 | ) | | | (9,893,268 | ) | | | (302,160,382 | ) |
Class C | | | (1,041,925 | ) | | | (35,763,015 | ) | | | (742,121 | ) | | | (22,059,406 | ) |
Class R | | | (48,532 | ) | | | (1,793,289 | ) | | | (2,344 | ) | | | (77,354 | ) |
Class R6 | | | (3,316,560 | ) | | | (121,702,544 | ) | | | (1,208,673 | ) | | | (38,504,373 | ) |
Administrator Class | | | (6,021,913 | ) | | | (218,649,630 | ) | | | (25,433,290 | ) | | | (773,879,830 | ) |
Institutional Class | | | (23,386,735 | ) | | | (854,924,224 | ) | | | (10,381,138 | ) | | | (332,586,897 | ) |
Investor Class | | | N/A | | | | N/A | | | | (17,217,665 | )1 | | | (549,439,619 | )1 |
| | | | |
| | | | | | | (2,171,423,478 | ) | | | | | | | (2,018,707,861 | ) |
| | | | |
Net increase in net assets resulting from capital share transactions | | | | | | | 2,152,069,892 | | | | | | | | 2,552,120,462 | |
| | | | |
Total increase in net assets | | | | | | | 2,920,521,325 | | | | | | | | 3,013,236,553 | |
| | | | |
| | | | |
Net assets | | | | | | | | | | | | | | | | |
Beginning of period | | | | | | | 5,015,480,606 | | | | | | | | 2,002,244,053 | |
| | | | |
End of period | | | | | | $ | 7,936,001,931 | | | | | | | $ | 5,015,480,606 | |
| | | | |
Undistributed net investment income | | | | | | $ | 56,598,980 | | | | | | | $ | 29,219,042 | |
| | | | |
| 1 | For the period from October 1, 2015 to October 23, 2015. Effective at the close of business on October 23, 2015, Investor Class shares were converted to Class A shares and are no longer offered by the Fund. |
The accompanying notes are an integral part of these financial statements.
| | | | |
| 18 | | Wells Fargo Special Mid Cap Value Fund | | Financial highlights |
(For a share outstanding throughout each period)
| | | | | | | | | | | | | | | | | | | | |
| | | Year ended September 30 | |
| CLASS A | | 2017 | | | 2016 | | | 2015 | | | 2014 | | | 2013 | |
Net asset value, beginning of period | | | $33.12 | | | | $29.91 | | | | $32.68 | | | | $30.36 | | | | $22.83 | |
Net investment income | | | 0.33 | | | | 0.19 | | | | 0.25 | | | | 0.12 | 1 | | | 0.15 | 1 |
Net realized and unrealized gains (losses) on investments | | | 4.42 | | | | 4.23 | | | | 0.07 | | | | 4.47 | | | | 7.60 | |
| | | | | | | | | | | | | | | | | | | | |
Total from investment operations | | | 4.75 | | | | 4.42 | | | | 0.32 | | | | 4.59 | | | | 7.75 | |
Distributions to shareholders from | | | | | | | | | | | | | | | | | | | | |
Net investment income | | | (0.19 | ) | | | (0.08 | ) | | | (0.18 | ) | | | (0.09 | ) | | | (0.22 | ) |
Net realized gains | | | (0.19 | ) | | | (1.13 | ) | | | (2.91 | ) | | | (2.18 | ) | | | 0.00 | |
| | | | | | | | | | | | | | | | | | | | |
Total distributions to shareholders | | | (0.38 | ) | | | (1.21 | ) | | | (3.09 | ) | | | (2.27 | ) | | | (0.22 | ) |
Net asset value, end of period | | | $37.49 | | | | $33.12 | | | | $29.91 | | | | $32.68 | | | | $30.36 | |
Total return2 | | | 14.41 | % | | | 15.34 | % | | | 0.69 | % | | | 15.70 | % | | | 34.23 | % |
Ratios to average net assets (annualized) | | | | | | | | | | | | | | | | | | | | |
Gross expenses | | | 1.18 | % | | | 1.19 | % | | | 1.25 | % | | | 1.28 | % | | | 1.29 | % |
Net expenses | | | 1.18 | % | | | 1.19 | % | | | 1.24 | % | | | 1.25 | % | | | 1.25 | % |
Net investment income | | | 0.78 | % | | | 0.82 | % | | | 0.85 | % | | | 0.38 | % | | | 0.54 | % |
Supplemental data | | | | | | | | | | | | | | | | | | | | |
Portfolio turnover rate | | | 46 | % | | | 30 | % | | | 58 | % | | | 58 | % | | | 87 | % |
Net assets, end of period (000s omitted) | | | $1,070,690 | | | | $1,363,213 | | | | $509,386 | | | | $110,219 | | | | $38,119 | |
| 1 | Calculated based upon average shares outstanding |
| 2 | Total return calculations do not include any sales charges. |
The accompanying notes are an integral part of these financial statements.
| | | | | | |
| Financial highlights | | Wells Fargo Special Mid Cap Value Fund | | | 19 | |
(For a share outstanding throughout each period)
| | | | | | | | | | | | | | | | | | | | |
| | | Year ended September 30 | |
| CLASS C | | 2017 | | | 2016 | | | 2015 | | | 2014 | | | 2013 | |
Net asset value, beginning of period | | | $31.91 | | | | $29.00 | | | | $31.82 | | | | $29.73 | | | | $22.38 | |
Net investment income (loss) | | | 0.06 | | | | 0.03 | | | | 0.02 | 1 | | | (0.04 | ) | | | (0.07 | )1 |
Net realized and unrealized gains (losses) on investments | | | 4.26 | | | | 4.02 | | | | 0.07 | | | | 4.31 | | | | 7.49 | |
| | | | | | | | | | | | | | | | | | | | |
Total from investment operations | | | 4.32 | | | | 4.05 | | | | 0.09 | | | | 4.27 | | | | 7.42 | |
Distributions to shareholders from | | | | | | | | | | | | | | | | | | | | |
Net investment income | | | (0.01 | ) | | | (0.01 | ) | | | 0.00 | | | | 0.00 | | | | (0.07 | ) |
Net realized gains | | | (0.19 | ) | | | (1.13 | ) | | | (2.91 | ) | | | (2.18 | ) | | | 0.00 | |
| | | | | | | | | | | | | | | | | | | | |
Total distributions to shareholders | | | (0.20 | ) | | | (1.14 | ) | | | (2.91 | ) | | | (2.18 | ) | | | (0.07 | ) |
Net asset value, end of period | | | $36.03 | | | | $31.91 | | | | $29.00 | | | | $31.82 | | | | $29.73 | |
Total return2 | | | 13.56 | % | | | 14.47 | % | | | (0.05 | )% | | | 14.86 | % | | | 33.23 | % |
Ratios to average net assets (annualized) | | | | | | | | | | | | | | | | | | | | |
Gross expenses | | | 1.92 | % | | | 1.94 | % | | | 2.00 | % | | | 2.03 | % | | | 2.04 | % |
Net expenses | | | 1.92 | % | | | 1.94 | % | | | 1.99 | % | | | 2.00 | % | | | 2.00 | % |
Net investment income (loss) | | | 0.14 | % | | | 0.03 | % | | | 0.08 | % | | | (0.38 | )% | | | (0.25 | )% |
Supplemental data | | | | | | | | | | | | | | | | | | | | |
Portfolio turnover rate | | | 46 | % | | | 30 | % | | | 58 | % | | | 58 | % | | | 87 | % |
Net assets, end of period (000s omitted) | | | $191,954 | | | | $116,022 | | | | $63,431 | | | | $29,217 | | | | $14,913 | |
| 1 | Calculated based upon average shares outstanding |
| 2 | Total return calculations do not include any sales charges. |
The accompanying notes are an integral part of these financial statements.
| | | | |
| 20 | | Wells Fargo Special Mid Cap Value Fund | | Financial highlights |
(For a share outstanding throughout each period)
| | | | | | | | | | | | |
| | | Year ended September 30 | |
| CLASS R | | 2017 | | | 2016 | | | 20151 | |
Net asset value, beginning of period | | | $33.78 | | | | $30.70 | | | | $30.70 | |
Net investment income | | | 0.31 | | | | 0.12 | 2 | | | 0.00 | |
Net realized and unrealized gains (losses) on investments | | | 4.44 | | | | 4.32 | | | | 0.00 | |
| | | | | | | | | | | | |
Total from investment operations | | | 4.75 | | | | 4.44 | | | | 0.00 | |
Distributions to shareholders from | | | | | | | | | | | | |
Net investment income | | | (0.26 | ) | | | (0.23 | ) | | | 0.00 | |
Net realized gains | | | (0.19 | ) | | | (1.13 | ) | | | 0.00 | |
| | | | | | | | | | | | |
Total distributions to shareholders | | | (0.45 | ) | | | (1.36 | ) | | | 0.00 | |
Net asset value, end of period | | | $38.08 | | | | $33.78 | | | | $30.70 | |
Total return3 | | | 14.13 | % | | | 15.05 | % | | | 0.00 | % |
Ratios to average net assets (annualized) | | | | | | | | | | | | |
Gross expenses | | | 1.42 | % | | | 1.44 | % | | | 0.00 | % |
Net expenses | | | 1.42 | % | | | 1.44 | % | | | 0.00 | % |
Net investment income | | | 0.77 | % | | | 0.37 | % | | | 0.00 | % |
Supplemental data | | | | | | | | | | | | |
Portfolio turnover rate | | | 46 | % | | | 30 | % | | | 58 | % |
Net assets, end of period (000s omitted) | | | $14,505 | | | | $1,778 | | | | $25 | |
| 1 | The class commenced operations on September 30, 2015. Information represents activity for the one day of operation. |
| 2 | Calculated based upon average shares outstanding |
| 3 | Returns for periods of less than one year are not annualized. |
The accompanying notes are an integral part of these financial statements.
| | | | | | |
| Financial highlights | | Wells Fargo Special Mid Cap Value Fund | | | 21 | |
(For a share outstanding throughout each period)
| | | | | | | | | | | | | | | | | | | | |
| | | Year ended September 30 | |
| CLASS R6 | | 2017 | | | 2016 | | | 2015 | | | 2014 | | | 20131 | |
Net asset value, beginning of period | | | $34.03 | | | | $30.71 | | | | $33.39 | | | | $30.90 | | | | $28.69 | |
Net investment income | | | 0.50 | 2 | | | 0.38 | 2 | | | 0.41 | 2 | | | 0.41 | 2 | | | 0.06 | 2 |
Net realized and unrealized gains (losses) on investments | | | 4.53 | | | | 4.30 | | | | 0.05 | | | | 4.43 | | | | 2.15 | |
| | | | | | | | | | | | | | | | | | | | |
Total from investment operations | | | 5.03 | | | | 4.68 | | | | 0.46 | | | | 4.84 | | | | 2.21 | |
Distributions to shareholders from | | | | | | | | | | | | | | | | | | | | |
Net investment income | | | (0.35 | ) | | | (0.23 | ) | | | (0.23 | ) | | | (0.17 | ) | | | 0.00 | |
Net realized gains | | | (0.19 | ) | | | (1.13 | ) | | | (2.91 | ) | | | (2.18 | ) | | | 0.00 | |
| | | | | | | | | | | | | | | | | | | | |
Total distributions to shareholders | | | (0.54 | ) | | | (1.36 | ) | | | (3.14 | ) | | | (2.35 | ) | | | 0.00 | |
Net asset value, end of period | | | $38.52 | | | | $34.03 | | | | $30.71 | | | | $33.39 | | | | $30.90 | |
Total return3 | | | 14.88 | % | | | 15.84 | % | | | 1.14 | % | | | 16.29 | % | | | 7.70 | % |
Ratios to average net assets (annualized) | | | | | | | | | | | | | | | | | | | | |
Gross expenses | | | 0.74 | % | | | 0.76 | % | | | 0.79 | % | | | 0.80 | % | | | 0.81 | % |
Net expenses | | | 0.74 | % | | | 0.76 | % | | | 0.79 | % | | | 0.80 | % | | | 0.81 | % |
Net investment income | | | 1.37 | % | | | 1.21 | % | | | 1.26 | % | | | 1.22 | % | | | 0.73 | % |
Supplemental data | | | | | | | | | | | | | | | | | | | | |
Portfolio turnover rate | | | 46 | % | | | 30 | % | | | 58 | % | | | 58 | % | | | 87 | % |
Net assets, end of period (000s omitted) | | | $906,784 | | | | $374,557 | | | | $105,973 | | | | $4,013 | | | | $27 | |
| 1 | For the period from June 28, 2013 (commencement of class operations) to September 30, 2013 |
| 2 | Calculated based upon average shares outstanding |
| 3 | Returns for periods of less than one year are not annualized. |
The accompanying notes are an integral part of these financial statements.
| | | | |
| 22 | | Wells Fargo Special Mid Cap Value Fund | | Financial highlights |
(For a share outstanding throughout each period)
| | | | | | | | | | | | | | | | | | | | |
| | | Year ended September 30 | |
| ADMINISTRATOR CLASS | | 2017 | | | 2016 | | | 2015 | | | 2014 | | | 2013 | |
Net asset value, beginning of period | | | $33.67 | | | | $30.45 | | | | $33.14 | | | | $30.71 | | | | $23.09 | |
Net investment income | | | 0.34 | 1 | | | 0.26 | | | | 0.31 | 1 | | | 0.15 | | | | 0.20 | 1 |
Net realized and unrealized gains (losses) on investments | | | 4.52 | | | | 4.26 | | | | 0.05 | | | | 4.55 | | | | 7.67 | |
| | | | | | | | | | | | | | | | | | | | |
Total from investment operations | | | 4.86 | | | | 4.52 | | | | 0.36 | | | | 4.70 | | | | 7.87 | |
Distributions to shareholders from | | | | | | | | | | | | | | | | | | | | |
Net investment income | | | (0.22 | ) | | | (0.17 | ) | | | (0.14 | ) | | | (0.09 | ) | | | (0.25 | ) |
Net realized gains | | | (0.19 | ) | | | (1.13 | ) | | | (2.91 | ) | | | (2.18 | ) | | | 0.00 | |
| | | | | | | | | | | | | | | | | | | | |
Total distributions to shareholders | | | (0.41 | ) | | | (1.30 | ) | | | (3.05 | ) | | | (2.27 | ) | | | (0.25 | ) |
Net asset value, end of period | | | $38.12 | | | | $33.67 | | | | $30.45 | | | | $33.14 | | | | $30.71 | |
Total return | | | 14.50 | % | | | 15.42 | % | | | 0.84 | % | | | 15.89 | % | | | 34.41 | % |
Ratios to average net assets (annualized) | | | | | | | | | | | | | | | | | | | | |
Gross expenses | | | 1.09 | % | | | 1.10 | % | | | 1.12 | % | | | 1.12 | % | | | 1.13 | % |
Net expenses | | | 1.09 | % | | | 1.10 | % | | | 1.11 | % | | | 1.12 | % | | | 1.13 | % |
Net investment income | | | 0.95 | % | | | 0.88 | % | | | 0.95 | % | | | 0.48 | % | | | 0.71 | % |
Supplemental data | | | | | | | | | | | | | | | | | | | | |
Portfolio turnover rate | | | 46 | % | | | 30 | % | | | 58 | % | | | 58 | % | | | 87 | % |
Net assets, end of period (000s omitted) | | | $1,156,796 | | | | $834,134 | | | | $394,188 | | | | $187,968 | | | | $117,087 | |
| 1 | Calculated based upon average shares outstanding |
The accompanying notes are an integral part of these financial statements.
| | | | | | |
| Financial highlights | | Wells Fargo Special Mid Cap Value Fund | | | 23 | |
(For a share outstanding throughout each period)
| | | | | | | | | | | | | | | | | | | | |
| | | Year ended September 30 | |
| INSTITUTIONAL CLASS | | 2017 | | | 2016 | | | 2015 | | | 2014 | | | 2013 | |
Net asset value, beginning of period | | | $34.00 | | | | $30.70 | | | | $33.38 | | | | $30.91 | | | | $23.15 | |
Net investment income | | | 0.41 | | | | 0.35 | 1 | | | 0.41 | 1 | | | 0.24 | | | | 0.20 | 1 |
Net realized and unrealized gains (losses) on investments | | | 4.58 | | | | 4.29 | | | | 0.04 | | | | 4.57 | | | | 7.81 | |
| | | | | | | | | | | | | | | | | | | | |
Total from investment operations | | | 4.99 | | | | 4.64 | | | | 0.45 | | | | 4.81 | | | | 8.01 | |
Distributions to shareholders from | | | | | | | | | | | | | | | | | | | | |
Net investment income | | | (0.33 | ) | | | (0.21 | ) | | | (0.22 | ) | | | (0.16 | ) | | | (0.25 | ) |
Net realized gains | | | (0.19 | ) | | | (1.13 | ) | | | (2.91 | ) | | | (2.18 | ) | | | 0.00 | |
| | | | | | | | | | | | | | | | | | | | |
Total distributions to shareholders | | | (0.52 | ) | | | (1.34 | ) | | | (3.13 | ) | | | (2.34 | ) | | | (0.25 | ) |
Net asset value, end of period | | | $38.47 | | | | $34.00 | | | | $30.70 | | | | $33.38 | | | | $30.91 | |
Total return | | | 14.76 | % | | | 15.73 | % | | | 1.10 | % | | | 16.17 | % | | | 34.90 | % |
Ratios to average net assets (annualized) | | | | | | | | | | | | | | | | | | | | |
Gross expenses | | | 0.84 | % | | | 0.86 | % | | | 0.85 | % | | | 0.85 | % | | | 0.85 | % |
Net expenses | | | 0.84 | % | | | 0.86 | % | | | 0.85 | % | | | 0.85 | % | | | 0.85 | % |
Net investment income | | | 1.24 | % | | | 1.07 | % | | | 1.23 | % | | | 0.81 | % | | | 0.72 | % |
Supplemental data | | | | | | | | | | | | | | | | | | | | |
Portfolio turnover rate | | | 46 | % | | | 30 | % | | | 58 | % | | | 58 | % | | | 87 | % |
Net assets, end of period (000s omitted) | | | $4,595,274 | | | | $2,325,777 | | | | $411,919 | | | | $174,989 | | | | $66,056 | |
| 1 | Calculated based upon average shares outstanding |
The accompanying notes are an integral part of these financial statements.
| | | | |
| 24 | | Wells Fargo Special Mid Cap Value Fund | | Notes to financial statements |
1. ORGANIZATION
Wells Fargo Funds Trust (the “Trust”), a Delaware statutory trust organized on March 10, 1999, is an open-end management investment company registered under the Investment Company Act of 1940, as amended (the “1940 Act”). As an investment company, the Trust follows the accounting and reporting guidance in Financial Accounting Standards Board Accounting Standards Codification Topic 946, Financial Services – Investment Companies. These financial statements report on the Wells Fargo Special Mid Cap Value Fund (the “Fund”) which is a diversified series of the Trust.
Effective at the close of business on October 23, 2015, Investor Class shares were converted to Class A shares and are no longer offered by the Fund. Information for Investor Class shares reflected in the financial statements represents activity through October 23, 2015.
2. SIGNIFICANT ACCOUNTING POLICIES
The following significant accounting policies, which are consistently followed in the preparation of the financial statements of the Fund, are in conformity with U.S. generally accepted accounting principles which require management to make estimates and assumptions that affect the reported amounts of assets and liabilities, disclosure of contingent assets and liabilities at the date of the financial statements, and the reported amounts of revenues and expenses during the reporting period. Actual results could differ from those estimates.
Securities valuation
All investments are valued each business day as of the close of regular trading on the New York Stock Exchange (generally 4 p.m. Eastern Time), although the Fund may deviate from this calculation time under unusual or unexpected circumstances.
Equity securities that are listed on a foreign or domestic exchange or market are valued at the official closing price or, if none, the last sales price. If no sale occurs on the principal exchange or market that day, a fair value price will be determined in accordance with the Fund’s Valuation Procedures.
Investments in registered open-end investment companies are valued at net asset value. Interests in non-registered investment companies that are redeemable at net asset value are fair valued normally at net asset value.
Investments which are not valued using any of the methods discussed above are valued at their fair value, as determined in good faith by the Board of Trustees of the Fund. The Board of Trustees has established a Valuation Committee comprised of the Trustees and has delegated to it the authority to take any actions regarding the valuation of portfolio securities that the Valuation Committee deems necessary or appropriate, including determining the fair value of portfolio securities, unless the determination has been delegated to the Management Valuation Team of Wells Fargo Funds Management, LLC (“Funds Management”). The Board of Trustees retains the authority to make or ratify any valuation decisions or approve any changes to the Valuation Procedures as it deems appropriate. On a quarterly basis, the Board of Trustees receives reports on any valuation actions taken by the Valuation Committee or the Management Valuation Team which may include items for ratification.
Valuations of fair valued securities are compared to the next actual sales price when available, or other appropriate market values, to assess the continued appropriateness of the fair valuation methodologies used. These securities are fair valued on a day-to-day basis, taking into consideration changes to appropriate market information and any significant changes to the inputs considered in the valuation process until there is a readily available price provided on an exchange or by an independent pricing service. Valuations received from an independent pricing service or independent broker-dealer quotes are periodically validated by comparisons to most recent trades and valuations provided by other independent pricing services in addition to the review of prices by the manager and/or subadviser. Unobservable inputs used in determining fair valuations are identified based on the type of security, taking into consideration factors utilized by market participants in valuing the investment, knowledge about the issuer and the current market environment.
Security loans
The Fund may lend its securities from time to time in order to earn additional income in the form of fees or interest on securities received as collateral or the investment of any cash received as collateral. The Fund continues to receive interest or dividends on the securities loaned. The Fund receives collateral in the form of cash or securities with a value at least equal to the value of the securities on loan. The value of the loaned securities is determined at the close of each business day and any additional required collateral is delivered to the Fund on the next business day. In a securities lending transaction, the net asset value of the Fund will be affected by an increase or decrease in the value of the securities loaned and by an increase or decrease in the value of the instrument in which collateral is invested. The amount of securities lending activity undertaken by the Fund fluctuates from time to time. In the event of default or bankruptcy by the borrower, the Fund may be prevented
| | | | | | |
| Notes to financial statements | | Wells Fargo Special Mid Cap Value Fund | | | 25 | |
from recovering the loaned securities or gaining access to the collateral or may experience delays or costs in doing so. In addition, the investment of any cash collateral received may lose all or part of its value. The Fund has the right under the lending agreement to recover the securities from the borrower on demand.
The Fund lends its securities through an unaffiliated securities lending agent. Cash collateral received in connection with its securities lending transactions is invested in Securities Lending Cash Investments, LLC (the “Securities Lending Fund”). The Securities Lending Fund is exempt from registration under Section 3(c)(7) of the 1940 Act and is managed by Funds Management and is subadvised by Wells Capital Management Incorporated (“WellsCap”), an affiliate of Funds Management and an indirect wholly owned subsidiary of Wells Fargo & Company (“Wells Fargo”). Funds Management receives an advisory fee starting at 0.05% and declining to 0.01% as the average daily net assets of the Securities Lending Fund increase. All of the fees received by Funds Management are paid to WellsCap for its services as subadviser. The Securities Lending Fund seeks to provide a positive return compared to the daily Fed Funds Open Rate by investing in high-quality, U.S. dollar-denominated short-term money market instruments. Securities Lending Fund investments are valued at the evaluated bid price provided by an independent pricing service. Income earned from investment in the Securities Lending Fund is included in income from affiliates securities on the Statement of Operations.
Security transactions and income recognition
Securities transactions are recorded on a trade date basis. Realized gains or losses are recorded on the basis of identified cost.
Dividend income is recognized on the ex-dividend date. Dividend income is recorded net of foreign taxes withheld where recovery of such taxes is not assured.
Distributions to shareholders
Distributions to shareholders from net investment income and net realized gains, if any, are recorded on the ex-dividend date. Such distributions are determined in accordance with income tax regulations and may differ from U.S. generally accepted accounting principles. Dividend sources are estimated at the time of declaration. The tax character of distributions is determined as of the Fund’s fiscal year end. Therefore, a portion of the Fund’s distributions made prior to the Fund’s fiscal year end may be categorized as a tax return of capital.
Federal and other taxes
The Fund intends to continue to qualify as a regulated investment company by distributing substantially all of its investment company taxable income and any net realized capital gains (after reduction for capital loss carryforwards) sufficient to relieve it from all, or substantially all, federal income taxes. Accordingly, no provision for federal income taxes was required.
The Fund’s income and federal excise tax returns and all financial records supporting those returns for the prior three fiscal years are subject to examination by the federal and Delaware revenue authorities. Management has analyzed the Fund’s tax positions taken on federal, state, and foreign tax returns for all open tax years and does not believe that there are any uncertain tax positions that require recognition of a tax liability.
As of September 30, 2017, the aggregate cost of all investments for federal income tax purposes was $7,038,418,302 and the unrealized gains (losses) consisted of:
| | | | |
Gross unrealized gains | | $ | 1,154,463,080 | |
Gross unrealized losses | | | (116,192,424 | ) |
Net unrealized gains | | $ | 1,038,270,656 | |
Class allocations
The separate classes of shares offered by the Fund differ principally in applicable sales charges, distribution, shareholder servicing, and administration fees. Class specific expenses are charged directly to that share class. Investment income, common expenses, and realized and unrealized gains (losses) on investments are allocated daily to each class of shares based on the relative proportion of net assets of each class.
3. FAIR VALUATION MEASUREMENTS
Fair value measurements of investments are determined within a framework that has established a fair value hierarchy based upon the various data inputs utilized in determining the value of the Fund’s investments. The three-level hierarchy gives the highest priority to unadjusted quoted prices in active markets for identical assets or liabilities (Level 1) and the lowest priority to unobservable inputs (Level 3). The Fund’s investments are classified within the fair value hierarchy based on the lowest level of input that is significant to the fair value measurement. The inputs are summarized into three broad levels as follows:
| | | | |
| 26 | | Wells Fargo Special Mid Cap Value Fund | | Notes to financial statements |
| ∎ | | Level 1 – quoted prices in active markets for identical securities |
| ∎ | | Level 2 – other significant observable inputs (including quoted prices for similar securities, interest rates, prepayment speeds, credit risk, etc.) |
| ∎ | | Level 3 – significant unobservable inputs (including the Fund’s own assumptions in determining the fair value of investments) |
The inputs or methodologies used for valuing investments in securities are not necessarily an indication of the risk associated with investing in those securities.
The following is a summary of the inputs used in valuing the Fund’s assets and liabilities as of September 30, 2017:
| | | | | | | | | | | | | | | | |
| | | Quoted prices
(Level 1) | | | Other significant
observable inputs
(Level 2) | | | Significant
unobservable inputs (Level 3) | | | Total | |
Assets | | | | | | | | | | | | | | | | |
Investments in: | | | | | | | | | | | | | | | | |
| | | | |
Common stocks | | | | | | | | | | | | | | | | |
Consumer discretionary | | $ | 392,042,139 | | | $ | 0 | | | $ | 0 | | | $ | 392,042,139 | |
Consumer staples | | | 392,375,837 | | | | 0 | | | | 0 | | | | 392,375,837 | |
Energy | | | 632,747,564 | | | | 0 | | | | 0 | | | | 632,747,564 | |
Financials | | | 1,665,979,571 | | | | 0 | | | | 0 | | | | 1,665,979,571 | |
Health care | | | 526,188,294 | | | | 0 | | | | 0 | | | | 526,188,294 | |
Industrials | | | 1,126,307,219 | | | | 0 | | | | 0 | | | | 1,126,307,219 | |
Information technology | | | 958,546,696 | | | | 0 | | | | 0 | | | | 958,546,696 | |
Materials | | | 686,227,032 | | | | 0 | | | | 0 | | | | 686,227,032 | |
Real estate | | | 572,659,766 | | | | 0 | | | | 0 | | | | 572,659,766 | |
Utilities | | | 541,535,347 | | | | 0 | | | | 0 | | | | 541,535,347 | |
| | | | |
Short-term investments | | | | | | | | | | | | | | | | |
Investment companies | | | 450,420,430 | | | | 0 | | | | 0 | | | | 450,420,430 | |
Investments measured at net asset value* | | | | | | | | | | | | | | | 131,659,063 | |
Total assets | | $ | 7,945,029,895 | | | $ | 0 | | | $ | 0 | | | $ | 8,076,688,958 | |
| * | Investments that are measured at fair value using the net asset value per share (or its equivalent) as a practical expedient have not been categorized in the fair value hierarchy. The fair value amount presented in the table is intended to permit reconciliation of the fair value hierarchy to the amounts presented in the Statement of Assets and Liabilities. The Fund’s investment in Securities Lending Cash Investments, LLC valued at $131,659,063 does not have a redemption period notice, can be redeemed daily and does not have any unfunded commitments. |
The Fund recognizes transfers between levels within the fair value hierarchy at the end of the reporting period. At September 30, 2017, the Fund did not have any transfers into/out of Level 1, Level 2, or Level 3.
4. TRANSACTIONS WITH AFFILIATES AND OTHER EXPENSES
Management fee
Funds Management, an indirect wholly owned subsidiary of Wells Fargo, is the manager of the Fund and provides advisory and fund-level administrative services under an investment management agreement. Under the investment management agreement, Funds Management is responsible for, among other services, implementing the investment objectives and strategies of the Fund, supervising the subadviser, providing fund-level administrative services in connection with the Fund’s operations, and providing any other fund-level administrative services reasonably necessary for the operation of the Fund. As compensation for its services under the investment management agreement, Funds Management is entitled to receive an annual management fee starting at 0.75% and declining to 0.63% as the average daily net assets of the Fund increase. For the year ended September 30, 2017, the management fee was equivalent to an annual rate of 0.68% of the Fund’s average daily net assets.
Funds Management has retained the services of a subadviser to provide daily portfolio management to the Fund. The fee for subadvisory services is borne by Funds Management. WellsCap is the subadviser to the Fund and is entitled to receive a fee from Funds Management at an annual rate starting at 0.45% and declining to 0.30% as the average daily net assets of the Fund increase.
| | | | | | |
| Notes to financial statements | | Wells Fargo Special Mid Cap Value Fund | | | 27 | |
Administration fees
Under a class-level administration agreement, Funds Management provides class-level administrative services to the Fund, which includes paying fees and expenses for services provided by the transfer agent, sub-transfer agents, omnibus account servicers and record-keepers. As compensation for its services under the class-level administration agreement, Funds Management receives an annual fee which is calculated based on the average daily net assets of each class as follows:
| | | | |
| | | Class level
administration fee | |
Class A, Class C, Class R | | | 0.21 | % |
Class R6 | | | 0.03 | |
Administrator Class, Institutional Class | | | 0.13 | |
Funds Management has contractually waived and/or reimbursed management and administration fees to the extent necessary to maintain certain net operating expense ratios for the Fund. Waiver of fees and/or reimbursement of expenses by Funds Management were made first from fund level expenses on a proportionate basis and then from class specific expenses. Funds Management has committed through January 31, 2018 to waive fees and/or reimburse expenses to the extent necessary to cap the Fund’s expenses at 1.22% for Class A shares, 1.97% for Class C shares, 1.47% for Class R shares, 0.79% for Class R6 shares, 1.14% for Administration Class shares, and 0.87% for Institutional Class shares. After this time, the cap may be increased or the commitment to maintain the cap may be terminated only with the approval of the Board of Trustees. Prior to February 2, 2017, the Fund’s expenses were capped at 1.25% for Class A shares, 2.00% for Class C shares, 1.50% for Class R shares, and 0.82% for Class R6 shares.
During the year ended September 30, 2017, State Street Bank and Trust Company (“State Street”), the Fund’s custodian, reimbursed the Fund $5,405 certain out-of-pocket expenses that were billed to the Fund in error from 1998-2015. This amount is included in dividend income on the Statement of Operations. In addition, Funds Management was also reimbursed $3,058 by State Street for waivers/reimbursements it made to the Fund to limit Fund expenses during the period the Fund was erroneously billed.
Distribution fees
The Trust has adopted a distribution plan for Class C and Class R shares of the Fund pursuant to Rule 12b-1 under the 1940 Act. Distribution fees are charged to Class C and Class R shares and paid to Wells Fargo Funds Distributor, LLC (“Funds Distributor”), the principal underwriter, at an annual rate of 0.75% of the average daily net assets of Class C shares and 0.25% of the average daily net assets of Class R shares.
In addition, Funds Distributor is entitled to receive the front-end sales charge from the purchase of Class A shares and a contingent deferred sales charge on the redemption of certain Class A shares. Funds Distributor is also entitled to receive the contingent deferred sales charges from redemptions of Class C shares. For the year ended September 30, 2017, Funds Distributor received $213,086 from the sale of Class A shares and $3,459 in contingent deferred sales charges from redemptions of Class C shares. No contingent deferred sales charges were incurred by Class A for the year ended September 30, 2017.
Shareholder servicing fees
The Trust has entered into contracts with one or more shareholder servicing agents, whereby Class A, Class C, Class R, and Administrator Class of the Fund are charged a fee at an annual rate of 0.25% of the average daily net assets of each respective class.
A portion of these total shareholder servicing fees were paid to affiliates of Wells Fargo.
Interfund transactions
The Fund may purchase or sell portfolio investment securities to certain other Wells Fargo affiliates pursuant to Rule 17a-7 of the 1940 Act and under procedures adopted by the Board of Trustees. The procedures have been designed to ensure that these interfund transactions, which do not incur broker commissions, are effected at current market prices.
5. INVESTMENT PORTFOLIO TRANSACTIONS
Purchases and sales of investments, excluding U.S. government obligations (if any) and short-term securities, for the year ended September 30, 2017 were $4,705,178,936 and $2,813,120,474, respectively.
| | | | |
| 28 | | Wells Fargo Special Mid Cap Value Fund | | Notes to financial statements |
6. BANK BORROWINGS
The Trust (excluding the money market funds and certain other funds) and Wells Fargo Variable Trust are parties to a $280,000,000 revolving credit agreement whereby the Fund is permitted to use bank borrowings for temporary or emergency purposes, such as to fund shareholder redemption requests. Interest under the credit agreement is charged to the Fund based on a borrowing rate equal to the higher of the Federal Funds rate in effect on that day plus 1.25% or the overnight LIBOR rate in effect on that day plus 1.25%. In addition, an annual commitment fee equal to 0.25% of the unused balance is allocated to each participating fund. Prior to August 29, 2017, the revolving credit agreement amount was $250,000,000.
For the year ended September 30, 2017, there were no borrowings by the Fund under the agreement.
7. DISTRIBUTIONS TO SHAREHOLDERS
The tax character of distributions paid during the years ended September 30, 2017 and September 30, 2016 were as follows:
| | | | | | | | |
| | | Year ended September 30 | |
| | | 2017 | | | 2016 | |
Ordinary income | | $ | 52,453,889 | | | $ | 30,591,334 | |
Long-term capital gain | | | 20,439,985 | | | | 64,015,906 | |
As of September 30, 2017, the components of distributable earnings on a tax basis were as follows:
| | | | |
Undistributed
ordinary
income | | Undistributed
long-term
gain | | Unrealized
gains |
| $159,922,652 | | $137,092,342 | | $1,038,270,656 |
8. INDEMNIFICATION
Under the Trust’s organizational documents, the officers and Trustees have been granted certain indemnification rights against certain liabilities that may arise out of performance of their duties to the Trust. Additionally, in the normal course of business, the Trust may enter into contracts with service providers that contain a variety of indemnification clauses. The Trust’s maximum exposure under these arrangements is dependent on future claims that may be made against the Fund and, therefore, cannot be estimated.
| | | | | | |
| Report of independent registered public accounting firm | | Wells Fargo Special Mid Cap Value Fund | | | 29 | |
BOARD OF TRUSTEES AND SHAREHOLDERS OF WELLS FARGO FUNDS TRUST:
We have audited the accompanying statement of assets and liabilities, including the portfolio of investments, of the Wells Fargo Special Mid Cap Value Fund (the “Fund”), one of the funds constituting the Wells Fargo Funds Trust, as of September 30, 2017, and the related statement of operations for the year then ended, the statements of changes in net assets for each of the years in the two-year period then ended, and the financial highlights for each of the years or periods in the five-year period then ended. These financial statements and financial highlights are the responsibility of the Fund’s management. Our responsibility is to express an opinion on these financial statements and financial highlights based on our audits.
We conducted our audits in accordance with the standards of the Public Company Accounting Oversight Board (United States). Those standards require that we plan and perform the audit to obtain reasonable assurance about whether the financial statements and financial highlights are free of material misstatement. An audit includes examining, on a test basis, evidence supporting the amounts and disclosures in the financial statements. Our procedures included confirmation of securities owned as of September 30, 2017, by correspondence with the custodian and brokers, or by other appropriate auditing procedures. An audit also includes assessing the accounting principles used and significant estimates made by management, as well as evaluating the overall financial statement presentation. We believe that our audits provide a reasonable basis for our opinion.
In our opinion, the financial statements and financial highlights referred to above present fairly, in all material respects, the financial position of the Wells Fargo Special Mid Cap Value Fund as of September 30, 2017, the results of its operations for the year then ended, the changes in its net assets for each of the years in the two-year period then ended, and the financial highlights for each of the years or periods in the five-year period then ended, in conformity with U.S. generally accepted accounting principles.

Boston, Massachusetts
November 22, 2017
| | | | |
| 30 | | Wells Fargo Special Mid Cap Value Fund | | Other information (unaudited) |
TAX INFORMATION
For corporate shareholders, pursuant to Section 854 of the Internal Revenue Code, 77.16% of ordinary income dividends qualify for the corporate dividends-received deduction for the fiscal year ended September 30, 2017.
Pursuant to Section 852 of the Internal Revenue Code, $20,439,985 was designated as a 20% rate gain distribution for the fiscal year ended September 30, 2017.
Pursuant to Section 854 of the Internal Revenue Code, $44,255,278 of income dividends paid during the fiscal year ended September 30, 2017 has been designated as qualified dividend income (QDI).
For the fiscal year ended September 30, 2017, $536,138 has been designated as interest-related dividends for nonresident alien shareholders pursuant to Section 871 of the Internal Revenue Code.
For the fiscal year ended September 30, 2017, $9,976,853 has been designated as short-term capital gain dividends for nonresident alien shareholders pursuant to Section 871 of the Internal Revenue Code.
PROXY VOTING INFORMATION
A description of the policies and procedures that the Fund uses to determine how to vote proxies relating to portfolio securities is available, upon request, by calling 1-800-222-8222, visiting our website at wellsfargofunds.com, or visiting the SEC website at sec.gov. Information regarding how the Fund voted proxies relating to portfolio securities during the most recent 12-month period ended June 30 is available on the Fund’s website at wellsfargofunds.com or by visiting the SEC website at sec.gov.
PORTFOLIO HOLDINGS INFORMATION
The complete portfolio holdings for the Fund are publicly available monthly on the Fund’s website (wellsfargofunds.com), on a one-month delayed basis. In addition, top ten holdings information (excluding derivative positions) for the Fund is publicly available on the Fund’s website on a monthly, seven-day or more delayed basis. The Fund files its complete schedule of portfolio holdings with the SEC for the first and third quarters of each fiscal year on Form N-Q, which is available by visiting the SEC website at sec.gov. In addition, the Fund’s Form N-Q may be reviewed and copied at the SEC’s Public Reference Room in Washington, DC, and at regional offices in New York City, at 233 Broadway, and in Chicago, at 175 West Jackson Boulevard, Suite 900. Information about the Public Reference Room may be obtained by calling 1-800-SEC-0330.
| | | | | | |
| Other information (unaudited) | | Wells Fargo Special Mid Cap Value Fund | | | 31 | |
BOARD OF TRUSTEES AND OFFICERS
Each of the Trustees and Officers1 listed in the table below acts in identical capacities for each fund in the Wells Fargo family of funds, which consists of 152 mutual funds comprising the Wells Fargo Funds Trust, Wells Fargo Variable Trust, Wells Fargo Master Trust and four closed-end funds (collectively the “Fund Complex”). This table should be read in conjunction with the Prospectus and the Statement of Additional Information2. The mailing address of each Trustee and Officer is 525 Market Street, 12th Floor, San Francisco, CA 94105. Each Trustee and Officer serves an indefinite term, however, each Trustee serves such term until reaching the mandatory retirement age established by the Trustees.
Independent Trustees
| | | | | | |
Name and
year of birth | | Position held and
length of service* | | Principal occupations during past five years or longer | | Current other
public company or
investment company
directorships |
William R. Ebsworth
(Born 1957) | | Trustee, since 2015 | | Retired. From 1984 to 2013, equities analyst, portfolio manager, research director and chief investment officer at Fidelity Management and Research Company in Boston, Tokyo, and Hong Kong and retired in 2013 as Chief Investment Officer of Fidelity Strategic Advisers, Inc. where he led a team of investment professionals managing client assets. Prior thereto, Board member of Hong Kong Securities Clearing Co., Hong Kong Options Clearing Corp., the Thailand International Fund, Ltd., Fidelity Investments Life Insurance Company, and Empire Fidelity Investments Life Insurance Company. Board member of the Forté Foundation (non-profit organization) and the Vincent Memorial Hospital Endowment (non-profit organization), where he serves on the Investment Committee and as a Chair of the Audit Committee. Mr. Ebsworth is a CFA® charterholder. | | Asset Allocation Trust |
Jane A. Freeman
(Born 1953) | | Trustee, since 2015 | | Retired. From 2012 to 2014 and 1999 to 2008, Chief Financial Officer of Scientific Learning Corporation. From 2008 to 2012, Ms. Freeman provided consulting services related to strategic business projects. Prior to 1999, Portfolio Manager at Rockefeller & Co. and Scudder, Stevens & Clark. Board member of the Harding Loevner Funds from 1996 to 2014, serving as both Lead Independent Director and chair of the Audit Committee. Board member of the Russell Exchange Traded Funds Trust from 2011 to 2012 and the chair of the Audit Committee. Ms. Freeman is a Board Member of Ruth Bancroft Garden (non-profit organization) and an inactive chartered financial analyst. | | Asset Allocation Trust |
Peter G. Gordon**
(Born 1942) | | Trustee, since 1998;
Chairman, since 2005 | | Co-Founder, Retired Chairman, President and CEO of Crystal Geyser Water Company. Trustee Emeritus, Colby College. | | Asset Allocation Trust |
Isaiah Harris, Jr.
(Born 1952) | | Trustee, since 2009 | | Retired. Chairman of the Board of CIGNA Corporation since 2009, and Director since 2005. From 2003 to 2011, Director of Deluxe Corporation. Prior thereto, President and CEO of BellSouth Advertising and Publishing Corp. from 2005 to 2007, President and CEO of BellSouth Enterprises from 2004 to 2005 and President of BellSouth Consumer Services from 2000 to 2003. Emeritus member of the Iowa State University Foundation Board of Governors. Emeritus Member of the Advisory Board of Iowa State University School of Business. Advisory Board Member, Palm Harbor Academy (charter school). Advisory Board Member, Child Evangelism Fellowship (non-profit). Mr. Harris is a certified public accountant (inactive status). | | CIGNA Corporation; Asset Allocation Trust |
Judith M. Johnson
(Born 1949) | | Trustee, since 2008;
Audit Committee Chairman, since 2008 | | Retired. Prior thereto, Chief Executive Officer and Chief Investment Officer of Minneapolis Employees Retirement Fund from 1996 to 2008. Ms. Johnson is an attorney, certified public accountant and a certified managerial accountant. | | Asset Allocation Trust |
David F. Larcker
(Born 1950) | | Trustee, since 2009 | | James Irvin Miller Professor of Accounting at the Graduate School of Business, Stanford University, Director of the Corporate Governance Research Initiative and Senior Faculty of The Rock Center for Corporate Governance since 2006. From 2005 to 2008, Professor of Accounting at the Graduate School of Business, Stanford University. Prior thereto, Ernst & Young Professor of Accounting at The Wharton School, University of Pennsylvania from 1985 to 2005. | | Asset Allocation Trust |
| | | | |
| 32 | | Wells Fargo Special Mid Cap Value Fund | | Other information (unaudited) |
| | | | | | |
Name and
year of birth | | Position held and
length of service* | | Principal occupations during past five years or longer | | Current other
public company or
investment company
directorships |
Olivia S. Mitchell
(Born 1953) | | Trustee, since 2006 | | International Foundation of Employee Benefit Plans Professor, Wharton School of the University of Pennsylvania since 1993. Director of Wharton’s Pension Research Council and Boettner Center on Pensions & Retirement Research, and Research Associate at the National Bureau of Economic Research. Previously, Cornell University Professor from 1978 to 1993. | | Asset Allocation Trust |
Timothy J. Penny
(Born 1951) | | Trustee, since 1996:
Vice Chairman, since 2017 | | President and Chief Executive Officer of Southern Minnesota Initiative Foundation, a non-profit organization, since 2007 and Senior Fellow at the Humphrey Institute Policy Forum at the University of Minnesota since 1995. Member of the Board of Trustees of NorthStar Education Finance, Inc., a non-profit organization, since 2007. | | Asset Allocation Trust |
Michael S. Scofield
(Born 1943) | | Trustee, since 2010 | | Served on the Investment Company Institute’s Board of Governors and Executive Committee from 2008-2011 as well the Governing Council of the Independent Directors Council from 2006-2011 and the Independent Directors Council Executive Committee from 2008-2011. Chairman of the IDC from 2008-2010. Trustee of the Evergreen Funds complex (and its predecessors) from 1984 to 2010. Chairman of the Evergreen Funds from 2000-2010. Former Trustee of the Mentor Funds. Retired Attorney, Law Offices of Michael S. Scofield. | | Asset Allocation Trust |
| * | Length of service dates reflect the Trustee’s commencement of service with the Trust’s predecessor entities, where applicable. |
| ** | Peter Gordon is expected to retire on December 31, 2017. |
Advisory Board Members
| | | | | | |
Name and
year of birth | | Position held and
length of service | | Principal occupations during past five years or longer | | Current other
public company or
investment company
directorships |
James G. Polisson
(Born 1959) | | Advisory Board Member,
since 2017 | | Retired. Chief Marketing Officer, Source (ETF) UK Services, Ltd, from 2015 to 2017. From 2012 to 2015, Principal of The Polisson Group, LLC, a management consulting, corporate advisory and principal investing company. Chief Executive Officer and Managing Director at Russell Investments, Global Exchange Traded Funds from 2010 to 2012. Managing Director of Barclays Global Investors from 1998 to 2010 and Global Chief Marketing Officer for iShares and Barclays Global Investors from 2000 to 2010. Prior thereto, Vice President, Fidelity Retail Mutual Fund Group from 1996 to 1998 and Risk Management Practice Manager, Fidelity Consulting from 1995 to 1996. Board member of the Russell Exchange Traded Fund Trust from 2011 to 2012. Director of Barclays Global Investors Holdings Deutschland GmbH from 2006 to 2009. Mr. Polisson is an attorney and has a retired status with the Massachusetts and District of Columbia Bar Associations. | | None |
Pamela Wheelock
(Born 1959) | | Advisory Board Member,
since 2017 | | Chief Operating Officer, Twin Cities Habitat for Humanity, since January, 2017. Vice President of University Services, University of Minnesota from 2012 to 2017. Prior thereto, Interim President and Chief Executive Officer of Blue Cross Blue Shield of Minnesota from 2010 to 2011, Chairman of the Board from 2009 to 2011 and Board Director from 2003 to 2015. Vice President, Leadership and Community Engagement, Bush Foundation, Saint Paul, Minnesota (a private foundation) from 2009 to 2011. Executive Vice President and Chief Financial Officer, Minnesota Sports and Entertainment from 2004 to 2009 and Senior Vice President from 2002 to 2004. Commissioner of Finance, State of Minnesota, from 1999 to 2002. Currently on the Board of Directors, Governance Committee and Finance Committee, for the Minnesota Philanthropy Partners (Saint Paul Foundation) since 2012 and Board Chair of the Minnesota Wild Foundation since 2010. | | None |
| | | | | | |
| Other information (unaudited) | | Wells Fargo Special Mid Cap Value Fund | | | 33 | |
Officers
| | | | | | |
Name and
year of birth | | Position held and
length of service | | Principal occupations during past five years or longer | | |
Andrew Owen
(Born 1960) | | President, since 2017 | | Executive Vice President of Wells Fargo & Company and Head of Affiliated Managers, Wells Fargo Asset Management, since 2014. In addition, Mr. Owen is currently President, Chief Executive Officer and Director of Wells Fargo Funds Management, LLC since 2017. Prior thereto, Executive Vice President responsible for marketing, investments and product development for Wells Fargo Funds Management, LLC, from 2009 to 2014. | | |
Nancy Wiser1
(Born 1967) | | Treasurer, since 2012 | | Executive Vice President of Wells Fargo Funds Management, LLC since 2011. Chief Operating Officer and Chief Compliance Officer at LightBox Capital Management LLC, from 2008 to 2011. | | |
C. David Messman
(Born 1960) | | Secretary, since 2000; Chief Legal Officer, since 2003 | | Senior Vice President and Secretary of Wells Fargo Funds Management, LLC since 2001. Assistant General Counsel of Wells Fargo Bank, N.A. since 2013 and Vice President and Managing Counsel of Wells Fargo Bank, N.A. from 1996 to 2013. | | |
Michael H. Whitaker
(Born 1967) | | Chief Compliance Officer, since 2016 | | Senior Vice President and Chief Compliance Officer since 2016. Senior Vice President and Chief Compliance Officer for Fidelity Investments from 2007 to 2016. | | |
David Berardi
(Born 1975) | | Assistant Treasurer, since 2009 | | Vice President of Wells Fargo Funds Management, LLC since 2009. Vice President of Evergreen Investment Management Company, LLC from 2008 to 2010. Manager of Fund Reporting and Control for Evergreen Investment Management Company, LLC from 2004 to 2010. | | |
Jeremy DePalma1
(Born 1974) | | Assistant Treasurer, since 2009 | | Senior Vice President of Wells Fargo Funds Management, LLC since 2009. Senior Vice President of Evergreen Investment Management Company, LLC from 2008 to 2010 and head of the Fund Reporting and Control Team within Fund Administration from 2005 to 2010. | | |
| 1 | Nancy Wiser acts as Treasurer of 76 funds in the Fund Complex. Jeremy DePalma acts as Treasurer of 76 funds and Assistant Treasurer of 76 funds in the Fund Complex. |
| 2 | The Statement of Additional Information includes additional information about the Trustees and is available, without charge, upon request, by calling 1-800-222-8222 or by visiting the website at wellsfargofunds.com. |
| | | | |
| 34 | | Wells Fargo Special Mid Cap Value Fund | | Other information (unaudited) |
BOARD CONSIDERATION OF INVESTMENT MANAGEMENT AND SUB-ADVISORY AGREEMENTS:
Under the Investment Company Act of 1940 (the “1940 Act”), the Board of Trustees (the “Board”) of Wells Fargo Funds Trust (the “Trust”) must determine annually whether to approve the continuation of the Trust’s investment management and sub-advisory agreements. In this regard, at an in-person meeting held on May 16-17, 2017 (the “Meeting”), the Board, all the members of which have no direct or indirect interest in the investment management and sub-advisory agreements and are not “interested persons” of the Trust, as defined in the 1940 Act (the “Independent Trustees”), reviewed and approved for Wells Fargo Special Mid Cap Value Fund (the “Fund”): (i) an investment management agreement (the “Management Agreement”) with Wells Fargo Funds Management, LLC (“Funds Management”); and (ii) an investment sub-advisory agreement (the “Sub-Advisory Agreement”) with Wells Capital Management Incorporated (the “Sub-Adviser”), an affiliate of Funds Management. The Management Agreement and the Sub-Advisory Agreement are collectively referred to as the “Advisory Agreements.”
At the Meeting, the Board considered the factors and reached the conclusions described below relating to the selection of Funds Management and the Sub-Adviser and the approval of the Advisory Agreements. Prior to the Meeting, including at an in-person meeting in April 2017, the Trustees conferred extensively among themselves and with representatives of Funds Management about these matters. Also, the Board has adopted a team-based approach, with each team consisting of a sub-set of Trustees, to assist the full Board in the discharge of its duties in reviewing performance and other matters throughout the year. The Independent Trustees were assisted in their evaluation of the Advisory Agreements by independent legal counsel, from whom they received separate legal advice and with whom they met separately.
In providing information to the Board, Funds Management and the Sub-Adviser were guided by a detailed set of requests for information submitted to them by independent legal counsel on behalf of the Independent Trustees at the start of the Board’s annual contract renewal process earlier in 2017. In considering and approving the Advisory Agreements, the Trustees considered the information they believed relevant, including but not limited to the information discussed below. The Board considered not only the specific information presented in connection with the Meeting, but also the knowledge gained over time through interaction with Funds Management and the Sub-Adviser about various topics. In this regard, the Board reviewed reports of Funds Management at each of its quarterly meetings, which included, among other things, portfolio reviews and performance reports. In addition, the Board and the teams mentioned above confer with portfolio managers at various times throughout the year. The Board did not identify any particular information or consideration that was all-important or controlling, and each individual Trustee may have attributed different weights to various factors.
After its deliberations, the Board unanimously approved the continuation of the Advisory Agreements for a one-year term and determined that the compensation payable to Funds Management and the Sub-Adviser under each of the Advisory Agreements was reasonable. The Board considered the approval of the Advisory Agreements for the Fund as part of its consideration of agreements for funds across the complex, but its approvals were made on a fund-by-fund basis. The following summarizes a number of important, but not necessarily all, factors considered by the Board in support of its approvals.
Nature, extent and quality of services
The Board received and considered various information regarding the nature, extent and quality of services provided to the Fund by Funds Management and the Sub-Adviser under the Advisory Agreements. This information included a description of the investment advisory services and Fund-level administrative services covered by the Management Agreement, as well as, among other things, a summary of the background and experience of senior management of Funds Management, a summary of certain organizational and personnel changes involving Funds Management and the Sub-Adviser, and a description of Funds Management’s and the Sub-Adviser’s business continuity planning programs and of their approaches to data privacy and cybersecurity. The Board also considered the qualifications, background, tenure and responsibilities of each of the portfolio managers primarily responsible for the day-to-day portfolio management of the Fund.
The Board evaluated the ability of Funds Management and the Sub-Adviser to attract and retain qualified investment professionals, including research, advisory and supervisory personnel. The Board further considered the compliance programs and compliance records of Funds Management and the Sub-Adviser. In addition, the Board took into account the full range of services provided to the Fund by Funds Management and its affiliates.
Fund performance and expenses
The Board considered the performance results for the Fund over various time periods ended December 31, 2016. The Board considered these results in comparison to the performance of funds in a universe that was determined by Broadridge Inc. (“Broadridge”) to be similar to the Fund (the “Universe”), and in comparison to the Fund’s benchmark index and to other comparative data. Broadridge is an independent provider of investment company data. The Board
| | | | | | |
| Other information (unaudited) | | Wells Fargo Special Mid Cap Value Fund | | | 35 | |
received a description of the methodology used by Broadridge to select the mutual funds in the performance Universe. The Board noted that the performance of the Fund (Administrator Class) was higher than the average performance of the Universe for all periods under review. The Board also noted that the performance of the Fund was higher than its benchmark, the Russell Midcap® Value Index, for all periods under review.
The Board also received and considered information regarding the Fund’s net operating expense ratios and their various components, including actual management fees, custodian and other non-management fees, and Rule 12b-1 and non-Rule 12b-1 shareholder service fees. The Board considered these ratios in comparison to the median ratios of funds in class-specific expense groups that were determined by Broadridge to be similar to the Fund (the “Groups”). The Board received a description of the methodology used by Broadridge to select the mutual funds in the expense Groups and an explanation of how funds comprising expense groups and their expense ratios may vary from year-to-year. Based on the Broadridge reports, the Board noted that the net operating expense ratios of the Fund were lower than or in range of the median net operating expense ratios of the expense Groups for all share classes. The Board discussed and accepted Funds Management’s proposal to reduce the net operating expense ratio caps for the Class A, Class C, Class R, Administrator Class, Institutional Class and Class R6.
The Board took into account the Fund performance and expense information provided to it among the factors considered in deciding to re-approve the Advisory Agreements.
Investment management and sub-advisory fee rates
The Board reviewed and considered the contractual fee rates payable by the Fund to Funds Management under the Management Agreement, as well as the contractual fee rates payable by the Fund to Funds Management for class-level administrative services under a Class-Level Administration Agreement, which include, among other things, class-level transfer agency and sub-transfer agency costs (collectively, the “Management Rates”). The Board also reviewed and considered the contractual investment sub-advisory fee rates that are payable by Funds Management to the Sub-Adviser for investment sub-advisory services.
Among other information reviewed by the Board was a comparison of the Fund’s Management Rates with the average contractual investment management fee rates of funds in the expense Groups at a common asset level as well as transfer agency costs of the funds in the expense Groups. The Board noted that the Management Rates of the Fund were lower than, equal to or in range of the sum of these average rates for the Fund’s expense Groups for all share classes.
The Board also received and considered information about the portion of the total management fee that was retained by Funds Management after payment of the fee to the Sub-Adviser for sub-advisory services. In assessing the reasonableness of this amount, the Board received and evaluated information about the nature and extent of responsibilities retained and risks assumed by Funds Management and not delegated to or assumed by the Sub-Adviser, and about Funds Management’s on-going oversight services. Given the affiliation between Funds Management and the Sub-Adviser, the Board ascribed limited relevance to the allocation of fees between them.
The Board also received and considered information about the nature and extent of services offered and fee rates charged by Funds Management and the Sub-Adviser to other types of clients with investment strategies similar to those of the Fund. In this regard, the Board received information about the significantly greater scope of services, and compliance, reporting and other legal burdens and risks of managing mutual funds compared with those associated with managing assets of non-mutual fund clients such as institutional separate accounts.
Based on its consideration of the factors and information it deemed relevant, including those described here, the Board determined that the compensation payable to Funds Management under the Management Agreement and to the Sub-Adviser under the Sub-Advisory Agreement was reasonable.
Profitability
The Board received and considered information concerning the profitability of Funds Management, as well as the profitability of Wells Fargo as a whole, from providing services to the Fund and the fund family as a whole. The Board also received and considered information concerning the profitability of the Sub-Adviser from providing services to the fund family as a whole, noting that the Sub-Adviser’s profitability information with respect to providing services to the Fund was subsumed in the Wells Fargo and Funds Management profitability analysis.
Funds Management reported on the methodologies and estimates used in calculating profitability, including a description of the methodology used to allocate certain expenses. Among other things, the Board noted that the levels of profitability reported on a fund-by-fund basis varied widely, depending on factors such as the size and type of fund. Based on its review, the Board did not deem the profits reported by Funds Management or Wells Fargo from its services to the Fund to be at a level that would prevent it from approving the continuation of the Advisory Agreements.
| | | | |
| 36 | | Wells Fargo Special Mid Cap Value Fund | | Other information (unaudited) |
Economies of scale
With respect to possible economies of scale, the Board noted the existence of breakpoints in the Fund’s management fee structure, which operate generally to reduce the Fund’s expense ratios as the Fund grows in size. It considered that, for a small fund or a fund that shrinks in size, breakpoints conversely can result in higher fee levels. The Board also considered that in addition to management fee breakpoints, competitive management fee rates set at the outset without regard to breakpoints and fee waiver and expense reimbursement arrangements are means of sharing potential economies of scale with shareholders of the Fund. The Board discussed and accepted Funds Management’s proposal to reduce the net operating expense ratio caps for the Class A, Class C, Class R, Administrator Class, Institutional Class and Class R6. The Board considered Funds Management’s view, which Funds Management indicated was supported by independent third-party industry studies which were summarized for the Board, that any analyses of potential economies of scale in managing a particular fund are inherently limited in light of the joint and common costs and investments that Funds Management incurs across the fund family as a whole.
The Board concluded that the Fund’s fee and expense arrangements, including contractual breakpoints, constituted a reasonable approach to sharing potential economies of scale with the Fund and its shareholders.
Other benefits to Funds Management and the Sub-Adviser
The Board received and considered information regarding potential “fall-out” or ancillary benefits received by Funds Management and its affiliates, including the Sub-Adviser, as a result of their relationships with the Fund. Ancillary benefits could include, among others, benefits directly attributable to other relationships with the Fund and benefits potentially derived from an increase in Funds Management’s and the Sub-Adviser’s business as a result of their relationships with the Fund. The Board noted that various affiliates of Funds Management may receive distribution-related fees, shareholder servicing payments and sub-transfer agency fees in respect of shares sold or held through them and services provided.
The Board also reviewed information about soft dollar credits earned and utilized by the Sub-Adviser, fees earned by Funds Management and the Sub-Adviser from managing a private investment vehicle for the fund family’s securities lending collateral and commissions earned by an affiliated broker from portfolio transactions.
Based on its consideration of the factors and information it deemed relevant, including those described here, the Board did not find that any ancillary benefits received by Funds Management and its affiliates, including the Sub-Adviser, were unreasonable.
Conclusion
At the Meeting, after considering the above-described factors and based on its deliberations and its evaluation of the information described above, the Board unanimously approved the continuation of the Advisory Agreements for a one-year term and determined that the compensation payable to Funds Management and the Sub-Adviser under each of the Advisory Agreements was reasonable.
| | | | | | |
| List of abbreviations | | Wells Fargo Special Mid Cap Value Fund | | | 37 | |
The following is a list of common abbreviations for terms and entities that may have appeared in this report.
| ACA | — ACA Financial Guaranty Corporation |
| ADR | — American depositary receipt |
| ADS | — American depositary shares |
| AGC | — Assured Guaranty Corporation |
| AGM | — Assured Guaranty Municipal |
| Ambac | — Ambac Financial Group Incorporated |
| AMT | — Alternative minimum tax |
| BAN | — Bond anticipation notes |
| BHAC | — Berkshire Hathaway Assurance Corporation |
| CAB | — Capital appreciation bond |
| CCAB | — Convertible capital appreciation bond |
| CDA | — Community Development Authority |
| CDO | — Collateralized debt obligation |
| CLO | — Collateralized loan obligation |
| DRIVER | — Derivative inverse tax-exempt receipts |
| DW&P | — Department of Water & Power |
| DWR | — Department of Water Resources |
| ECFA | — Educational & Cultural Facilities Authority |
| EDA | — Economic Development Authority |
| EDFA | — Economic Development Finance Authority |
| ETF | — Exchange-traded fund |
| FDIC | — Federal Deposit Insurance Corporation |
| FFCB | — Federal Farm Credit Banks |
| FGIC | — Financial Guaranty Insurance Corporation |
| FHA | — Federal Housing Administration |
| FHLB | — Federal Home Loan Bank |
| FHLMC | — Federal Home Loan Mortgage Corporation |
| FICO | — The Financing Corporation |
| FNMA | — Federal National Mortgage Association |
| GDR | — Global depositary receipt |
| GNMA | — Government National Mortgage Association |
| HCFR | — Healthcare facilities revenue |
| HEFA | — Health & Educational Facilities Authority |
| HEFAR | — Higher education facilities authority revenue |
| HFA | — Housing Finance Authority |
| HFFA | — Health Facilities Financing Authority |
| HUD | — Department of Housing and Urban Development |
| IDA | — Industrial Development Authority |
| IDAG | — Industrial Development Agency |
| KRW | — Republic of Korea won |
| LIBOR | — London Interbank Offered Rate |
| LIFER | — Long Inverse Floating Exempt Receipts |
| LLC | — Limited liability company |
| LLLP | — Limited liability limited partnership |
| LLP | — Limited liability partnership |
| MBIA | — Municipal Bond Insurance Association |
| MFHR | — Multifamily housing revenue |
| MSTR | — Municipal securities trust receipts |
| MUD | — Municipal Utility District |
| National | — National Public Finance Guarantee Corporation |
| PCFA | — Pollution Control Financing Authority |
| PCL | — Public Company Limited |
| PCR | — Pollution control revenue |
| PFA | — Public Finance Authority |
| PFFA | — Public Facilities Financing Authority |
| PFOTER | — Puttable floating option tax-exempt receipts |
| PJSC | — Public Joint Stock Company |
| plc | — Public limited company |
| PUTTER | — Puttable tax-exempt receipts |
| R&D | — Research & development |
| Radian | — Radian Asset Assurance |
| RAN | — Revenue anticipation notes |
| RDA | — Redevelopment Authority |
| RDFA | — Redevelopment Finance Authority |
| REIT | — Real estate investment trust |
| ROC | — Reset option certificates |
| SAVRS | — Select auction variable rate securities |
| SBA | — Small Business Authority |
| SDR | — Swedish depositary receipt |
| SFHR | — Single-family housing revenue |
| SFMR | — Single-family mortgage revenue |
| SPA | — Standby purchase agreement |
| SPDR | — Standard & Poor’s Depositary Receipts |
| SPEAR | — Short Puttable Exempt Adjustable Receipts |
| STRIPS | — Separate trading of registered interest and |
| TAN | — Tax anticipation notes |
| TIPS | — Treasury inflation-protected securities |
| TRAN | — Tax revenue anticipation notes |
| TTFA | — Transportation Trust Fund Authority |
| TVA | — Tennessee Valley Authority |
This page is intentionally left blank.
This page is intentionally left blank.
This page is intentionally left blank.

For more information
More information about Wells Fargo Funds is available free upon request. To obtain literature, please write, email, visit the Fund’s website, or call:
Wells Fargo Funds
P.O. Box 8266
Boston, MA 02266-8266
Email: fundservice@wellsfargo.com
Website: wellsfargofunds.com
Individual investors: 1-800-222-8222
Retail investment professionals: 1-888-877-9275
Institutional investment professionals:
1-866-765-0778
This report and the financial statements contained herein are submitted for the general information of the shareholders of the Fund. If this report is used for promotional purposes, distribution of the report must be accompanied or preceded by a current prospectus. Before investing, please consider the investment objectives, risks, charges, and expenses of the investment. For a current prospectus and, if available, a summary prospectus, containing this information, call 1-800-222-8222 or visit the Fund’s website at wellsfargofunds.com. Read the prospectus carefully before you invest or send money.
Wells Fargo Asset Management (WFAM) is a trade name used by the asset management businesses of Wells Fargo & Company. Wells Fargo Funds Management, LLC, a wholly owned subsidiary of Wells Fargo & Company, provides investment advisory and administrative services for Wells Fargo Funds. Other affiliates of Wells Fargo & Company provide subadvisory and other services for the funds. The funds are distributed by Wells Fargo Funds Distributor, LLC, Member FINRA, an affiliate of Wells Fargo & Company. Neither Wells Fargo Funds Distributor nor Wells Fargo Funds Management holds fund shareholder accounts or assets. This material is for general informational and educational purposes only and is NOT intended to provide investment advice or a recommendation of any kind—including a recommendation for any specific investment, strategy, or plan.
NOT FDIC INSURED ◾ NO BANK GUARANTEE ◾ MAY LOSE VALUE
© 2017 Wells Fargo Funds Management, LLC. All rights reserved.
| | |
 | | 306439 11-17 A234/AR234 09-17 |
(a) As of the end of the period covered by the report, Wells Fargo Funds Trust has adopted a code of ethics that applies to its President and Treasurer. A copy of the code of ethics is filed as an exhibit to this Form N-CSR.
(c) During the period covered by this report, there were no amendments to the provisions of the code of ethics adopted in Item 2(a) above.
(d) During the period covered by this report, there were no implicit or explicit waivers to the provisions of the code of ethics adopted in Item 2(a) above.
| ITEM 3. | AUDIT COMMITTEE FINANCIAL EXPERT |
The Board of Trustees of Wells Fargo Funds Trust has determined that Judith Johnson is an audit committee financial expert, as defined in Item 3 of Form N-CSR. Mrs. Johnson is independent for purposes of Item 3 of Form N-CSR.
| ITEM 4. | PRINCIPAL ACCOUNTANT FEES AND SERVICES |
(a), (b), (c), (d) The following table presents aggregate fees billed in each of the last two fiscal years for services rendered
to the Registrant by the Registrant’s principal accountant. These fees were billed to the registrant and were approved by
the Registrant’s audit committee.
| | | | | | | | |
| | | Fiscal
year ended
September 30,
2017 | | | Fiscal
year ended
September 30,
2016 | |
Audit fees | | $ | 360,232 | | | $ | 344,493 | |
Audit-related fees | | | — | | | | — | |
Tax fees (1) | | | 46,665 | | | | 45,130 | |
All other fees | | | — | | | | — | |
| | | | | | | | |
| | $ | 406,897 | | | $ | 389,623 | |
| | | | | | | | |
| (1) | Tax fees consist of fees for tax compliance, tax advice, tax planning and excise tax. |
(e) The Chairman of the Audit Committees is authorized to pre-approve: (1) audit services for the mutual funds of Wells Fargo Funds Trust; (2) non-audit tax or compliance consulting or training services provided to the Funds by the independent auditors (“Auditors”) if the fees for any particular engagement are not anticipated to exceed $50,000; and (3) non-audit tax or compliance consulting or training services provided by the Auditors to a Fund’s investment adviser and its controlling entities (where pre-approval is required because the engagement relates directly to the operations and financial reporting of the Fund) if the fee to the Auditors for any particular engagement is not anticipated to exceed $50,000. For any such pre-approval
sought from the Chairman, Management shall prepare a brief description of the proposed services. If the Chairman approves of such service, he or she shall sign the statement prepared by Management. Such written statement shall be presented to the full Committees at their next regularly scheduled meetings.
(f) Not applicable
(g) Not applicable
(h) Not applicable
| ITEM 5. | AUDIT COMMITTEE OF LISTED REGISTRANTS |
Not applicable.
A Portfolio of Investments for each series of Wells Fargo Funds Trust is included as part of the report to shareholders filed under Item 1 of this Form.
| ITEM 7. | DISCLOSURE OF PROXY VOTING POLICIES AND PROCEDURES FOR CLOSED-END MANAGEMENT INVESTMENT COMPANIES |
Not applicable.
| ITEM 8. | PORTFOLIO MANAGERS OF CLOSED-END MANAGEMENT INVESTMENT COMPANIES |
Not applicable.
| ITEM 9. | PURCHASES OF EQUITY SECURITIES BY CLOSED-END MANAGEMENT INVESTMENT COMPANY AND AFFILIATED PURCHASERS |
Not applicable.
| ITEM 10. | SUBMISSION OF MATTERS TO A VOTE OF SECURITY HOLDERS |
There have been no material changes to the procedures by which shareholders may recommend nominees to the registrant’s Board of Trustees that have been implemented since the registrant’s last provided disclosure in response to the requirements of this Item.
| ITEM 11. | CONTROLS AND PROCEDURES |
(a) The President and Treasurer have concluded that the Wells Fargo Funds Trust (the “Trust”) disclosure controls and procedures (as defined in Rule 30a-3(c) under the Investment Company Act of 1940) provide reasonable assurances that material information relating to the Trust is made known to them by the appropriate persons based on their evaluation of these controls and procedures as of a date within 90 days of the filing of this report.
(b) There were no significant changes in the Trust’s internal controls over financial reporting (as defined in Rule 30a-3(d) under the Investment Company Act of 1940) that occurred during the second fiscal quarter of the period covered by this report that materially affected, or is reasonably likely to materially affect, the registrant’s internal control over financial reporting.
(a)(1) Code of Ethics pursuant to Item 2 of Form N-CSR is filed and attached hereto as Exhibit COE.
(a)(2) Certification pursuant to Rule 30a-2(a) under the Investment Company Act of 1940 (17 CFR 270.30a-2(a)) is filed and attached hereto as Exhibit 99.CERT.
(a)(3) Not applicable.
(b) Certification pursuant to Rule 30a-2(b) under the Investment Company Act of 1940 (17 CFR 270.30a-2(b)) is filed and attached hereto as Exhibit 99.906CERT.
SIGNATURES
Pursuant to the requirements of the Securities Exchange Act of 1934 and the Investment Company Act of 1940, the registrant has duly caused this report to be signed on its behalf by the undersigned, thereunto duly authorized.
| | |
| Wells Fargo Funds Trust |
| |
| By: | | |
| | /s/ Andrew Owen |
| |
| | Andrew Owen |
| | President |
| |
| Date: | | November 22, 2017 |
Pursuant to the requirements of the Securities Exchange Act of 1934 and the Investment Company Act of 1940, this report has been signed below by the following persons on behalf of the registrant and in the capacities and on the date indicated.
| | |
| Wells Fargo Funds Trust |
| |
| By: | | |
| | /s/ Andrew Owen |
| |
| | Andrew Owen |
| | President |
| |
| Date: | | November 22, 2017 |
| |
| By: | | |
| | /s/ Nancy Wiser |
| |
| | Nancy Wiser |
| | Treasurer |
| |
| Date: | | November 22, 2017 |
| |
| By: | | |
| | /s/ Jeremy DePalma |
| |
| | Jeremy DePalma |
| | Treasurer |
| |
| Date: | | November 22, 2017 |