
UNITED STATES
SECURITIES AND EXCHANGE COMMISSION
Washington, D.C. 20549
FORM N-CSR
CERTIFIED SHAREHOLDER REPORT OF REGISTERED
MANAGEMENT INVESTMENT COMPANIES
Investment Company Act file number: 811-09253
Wells Fargo Funds Trust
(Exact name of registrant as specified in charter)
525 Market St., San Francisco, CA 94105
(Address of principal executive offices) (Zip code)
C. David Messman
Wells Fargo Funds Management, LLC
525 Market St., San Francisco, CA 94105
(Name and address of agent for service)
Registrant’s telephone number, including area code: 800-222-8222
Date of fiscal year end: October 31
Registrant is making a filing for 7 of its series:
Wells Fargo Asia Pacific Fund, Wells Fargo Diversified International Fund, Wells Fargo Emerging Markets Equity Fund, Wells Fargo Emerging Markets Equity Income Fund, Wells Fargo Global Small Cap Fund, Wells Fargo International Equity Fund, and Wells Fargo Intrinsic World Equity Fund.
Date of reporting period: October 31, 2017
ITEM 1. REPORT TO STOCKHOLDERS
Annual Report
October 31, 2017

Wells Fargo Asia Pacific Fund


Reduce clutter. Save trees.
Sign up for electronic delivery of prospectuses and shareholder reports at wellsfargo.com/advantagedelivery
Contents
The views expressed and any forward-looking statements are as of October 31, 2017, unless otherwise noted, and are those of the Fund managers and/or Wells Fargo Funds Management, LLC. Discussions of individual securities, or the markets generally, or any Wells Fargo Fund are not intended as individual recommendations. Future events or results may vary significantly from those expressed in any forward-looking statements. The views expressed are subject to change at any time in response to changing circumstances in the market. Wells Fargo Funds Management, LLC and the Fund disclaim any obligation to publicly update or revise any views expressed or forward-looking statements.
NOT FDIC INSURED ◾ NO BANK GUARANTEE ◾ MAY LOSE VALUE
| | | | |
| 2 | | Wells Fargo Asia Pacific Fund | | Letter to shareholders (unaudited) |

Andrew Owen
President
Wells Fargo Funds
Global stocks generally delivered double-digit results; bond markets had smaller but positive results as well.
Dear Shareholder:
We are pleased to offer you this annual report for the Wells Fargo Asia Pacific Fund for the 12-month period that ended October 31, 2017. Global stocks generally delivered double-digit results; bond markets had smaller but positive results as well. U.S. and international stocks performed similarly overall with returns of 23.63% and 23.64%, respectively, for the 12-month period, as measured by the S&P 500 Index1 and the MSCI ACWI ex USA Index (Net),2 respectively. Within fixed income, the Bloomberg Barclays U.S. Aggregate Bond Index3 returned 0.90% and the Bloomberg Barclays Municipal Bond Index4 returned 2.19% as interest rates rose from low levels.
Election results and central banks’ policies commanded investor attention as 2016 closed.
During the last two months of 2016, investors appeared intent on the prospective outcomes of elections in the U.S. and central-bank actions globally. Following Donald Trump’s election victory in November, U.S. stocks rallied. Investors appeared optimistic that the new administration would pursue progrowth policies. Favorable economic news supported stocks, and interest rates moved higher. At their mid-December meeting, U.S. Federal Reserve (Fed) officials raised the target interest rate by a quarter percentage point to a range of 0.50% to 0.75%. The fourth quarter also saw the implementation of the U.S. Securities and Exchange Commission’s amended rule for money market funds, which included the possibility of liquidity fees and redemption gates and, for institutional prime and municipal money market funds, floating net asset values (NAVs). Outside of the U.S., the prospects for faster U.S. growth appeared to trigger some acceleration in Europe.
Financial markets gained during the first two quarters of 2017 on positive economic data.
Stocks rallied globally through the first quarter of 2017, supported by signs of improvement in the U.S. and global economies. In the U.S., hiring remained strong, and business and consumer sentiment improved. In March, Fed officials raised their target interest rate by a quarter percentage point to a range of 0.75% to 1.00%. With the Fed’s target interest-rate increase, short-term bond yields rose during the quarter. Meanwhile, longer-term Treasury yields were little changed, leading to positive performance. Investment-grade and high-yield bonds benefited from strong demand. Municipal bond returns were positive in the quarter, helped by strong demand and constrained new-issue supply. Outside the U.S., stocks in emerging markets generally outperformed stocks in the U.S. and international developed markets because they benefited from both global economic growth and recent weakening of the U.S. dollar. Stocks in Asia, Europe, and Latin America also outperformed the U.S. market during the quarter.
| 1 | The S&P 500 Index consists of 500 stocks chosen for market size, liquidity, and industry group representation. It is a market-value-weighted index with each stock’s weight in the index proportionate to its market value. You cannot invest directly in an index. |
| 2 | The Morgan Stanley Capital International (MSCI) All Country World Index (ACWI) ex USA Index (Net) is a free-float-adjusted market-capitalization-weighted index that is designed to measure the equity market performance of developed markets, excluding the United States and Canada. Source: MSCI. MSCI makes no express or implied warranties or representations and shall have no liability whatsoever with respect to any MSCI data contained herein. The MSCI data may not be further redistributed or used as a basis for other indexes or any securities or financial products. This report is not approved, reviewed, or produced by MSCI. You cannot invest directly in an index. |
| 3 | The Bloomberg Barclays U.S. Aggregate Bond Index is a broad-based benchmark that measures the investment-grade, U.S. dollar-denominated, fixed-rate taxable bond market, including Treasuries, government-related and corporate securities, mortgage-backed securities (agency fixed-rate and hybrid adjustable-rate mortgage pass-throughs), asset-backed securities, and commercial mortgage-backed securities. You cannot invest directly in an index. |
| 4 | The Bloomberg Barclays Municipal Bond Index is an unmanaged index composed of long-term tax-exempt bonds with a minimum credit rating of Baa. You cannot invest directly in an index. |
| | | | | | |
| Letter to shareholders (unaudited) | | Wells Fargo Asia Pacific Fund | | | 3 | |
Globally, stocks marked continued gains through the second quarter of 2017. Steady, albeit modest, economic growth both in the U.S. and abroad and generally favorable corporate earnings announcements supported higher valuations. U.S. inflation trended lower despite a continued decline in the unemployment rate. Ten-year U.S. Treasury yields declined, resulting in stronger prices for long-term bonds. As was widely expected, Fed officials raised the target interest rate in June by a quarter percentage point to a range of 1.00% to 1.25%. In addition, the Fed indicated that it planned to start selling bonds that accumulated on its balance sheet during quantitative easing programs conducted since 2008.
As global growth improved in the third quarter of 2017, financial markets generally advanced.
Most stock markets worldwide moved higher during the quarter and ended the period at or near all-time highs. Moderate acceleration in global economic growth was supported by improving corporate earnings, low inflation pressure, and still-low interest rates. Corporate earnings reports were favorable overall as companies continued to benefit from healthy operating leverage. Global commodity prices climbed during the quarter. Oil prices rebounded, partly due to a better balance between supply and demand. While North Korea’s recent missile launches and nuclear testing raised serious concerns around the world, the heightened geopolitical risk had relatively minimal impact on the quarter’s stock returns. In the U.S., economic data released during the quarter reflected a generally healthy economy. Second-quarter economic output grew at a 3.1% annual rate, and consumers displayed more willingness to spend. Meanwhile, the Fed maintained the target range for the federal funds rate at 1.00% to 1.25%, noting that inflation had remained below the Fed’s 2.00% objective. Reflecting continued confidence in the U.S. economy, the Fed also stated the possibility of one more 0.25% increase in the federal funds rate by the end of 2017 and announced plans to begin the process of unwinding its $4.5 trillion portfolio of bonds and other assets in October. Outside the U.S., stocks in the Asia Pacific region benefited from solid earnings reports and investors’ willingness to take on risk despite the rising tensions between North Korea and the U.S. In Europe, markets were supported by better-than-expected economic growth, which has led to narrowing of the gap between Europe’s growth rate and that of the U.S. In emerging markets, many countries benefited from stronger currencies versus the U.S. dollar. Also, commodity prices were on an upward trajectory, which benefited many companies that rely on natural resources for exports.
Positive economic and market news continued into October.
October proved to be a strong month for U.S. stocks. The S&P 500 Index delivered 11 record closes amid rising consumer confidence and signs the economy was continuing to gain momentum, including news in late October that economic output was estimated to have grown at a 3.0% annual rate in the third quarter. At its October meeting, the Fed, in a unanimous vote, left short-term interest rates unchanged but signaled it could make another rate increase before the end of 2017 if the economy remains on track. The Fed also began the process of unwinding its quantitative easing program. Outside the U.S., international stocks generally delivered positive results in October as global economic growth continued to strengthen.
| | | | |
| 4 | | Wells Fargo Asia Pacific Fund | | Letter to shareholders (unaudited) |
Don’t let short-term uncertainty derail long-term investment goals.
Periods of investment uncertainty can present challenges, but experience has taught us that maintaining long-term investment goals can be an effective way to plan for the future. To help you create a sound strategy based on your personal goals and risk tolerance, Wells Fargo Funds offers more than 100 mutual funds spanning a wide range of asset classes and investment styles. Although diversification cannot guarantee an investment profit or prevent losses, we believe it can be an effective way to manage investment risk and potentially smooth out overall portfolio performance. We encourage investors to know their investments and to understand that appropriate levels of risk-taking may unlock opportunities.
Thank you for choosing to invest with Wells Fargo Funds. We appreciate your confidence in us and remain committed to helping you meet your financial needs.
Sincerely,

Andrew Owen
President
Wells Fargo Funds
Although diversification cannot guarantee an investment profit or prevent losses, we believe it can be an effective way to manage investment risk and potentially smooth out overall portfolio performance.
For further information about your Fund, contact your investment professional, visit our website at wellsfargofunds.com, or call us directly at 1-800-222-8222. We are available 24 hours a day, 7 days a week.
This page is intentionally left blank.
| | | | |
| 6 | | Wells Fargo Asia Pacific Fund | | Performance highlights (unaudited) |
Investment objective
The Fund seeks long-term capital appreciation.
Manager
Wells Fargo Funds Management, LLC
Subadviser
Wells Capital Management Incorporated
Portfolio managers
Anthony L.T. Cragg
Alison Shimada
Average annual total returns (%) as of October 31, 20171
| | | | | | | | | | | | | | | | | | | | | | | | | | | | | | | | | | |
| | | | | Including sales charge | | | Excluding sales charge | | | Expense ratios2 (%) | |
| | | Inception date | | 1 year | | | 5 year | | | 10 year | | | 1 year | | | 5 year | | | 10 year | | | Gross | | | Net3 | |
| Class A (WFAAX) | | 7-31-2007 | | | 18.60 | | | | 9.10 | | | | 0.96 | | | | 25.84 | | | | 10.39 | | | | 1.56 | | | | 1.69 | | | | 1.60 | |
| Class C (WFCAX) | | 7-31-2007 | | | 23.86 | | | | 9.57 | | | | 0.79 | | | | 24.86 | | | | 9.57 | | | | 0.79 | | | | 2.44 | | | | 2.35 | |
| Administrator Class (WFADX) | | 7-30-2010 | | | – | | | | – | | | | – | | | | 25.83 | | | | 10.56 | | | | 1.67 | | | | 1.61 | | | | 1.50 | |
| Institutional Class (WFPIX) | | 7-30-2010 | | | – | | | | – | | | | – | | | | 26.25 | | | | 10.77 | | | | 1.81 | | | | 1.36 | | | | 1.25 | |
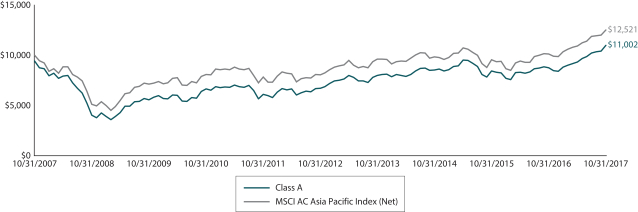
| MSCI AC Asia Pacific Index (Net)4 | | – | | | – | | | | – | | | | – | | | | 23.70 | | | | 9.22 | | | | 2.27 | | | | – | | | | – | |
Figures quoted represent past performance, which is no guarantee of future results, and do not reflect taxes that a shareholder may pay on fund distributions or the redemption of fund shares. Investment return and principal value of an investment will fluctuate so that an investor’s shares, when redeemed, may be worth more or less than their original cost. Performance shown without sales charges would be lower if sales charges were reflected. Current performance may be lower or higher than the performance data quoted, which assumes the reinvestment of dividends and capital gains. Current month-end performance is available on the Fund’s website, wellsfargofunds.com.
Please keep in mind that high double-digit returns were primarily achieved during favorable market conditions. You should not expect that such favorable returns can be consistently achieved. A fund’s performance, especially for short time periods, should not be the sole factor in making your investment decision.
Index returns do not include transaction costs associated with buying and selling securities, any mutual fund fees or expenses, or any taxes. It is not possible to invest directly in an index.
For Class A shares, the maximum front-end sales charge is 5.75%. For Class C shares, the maximum contingent deferred sales charge is 1.00%. Performance including a contingent deferred sales charge assumes the sales charge for the corresponding time period. Administrator Class and Institutional Class shares are sold without a front-end sales charge or contingent deferred sales charge.
Stock values fluctuate in response to the activities of individual companies and general market and economic conditions. Foreign investments are especially volatile and can rise or fall dramatically due to differences in the political and economic conditions of the host country. These risks are generally intensified in emerging markets. The use of derivatives may reduce returns and/or increase volatility. Certain investment strategies tend to increase the total risk of an investment (relative to the broader market). The Fund is exposed to geographic risk and smaller-company securities risk. Consult the Fund’s prospectus for additional information on these and other risks.
Please see footnotes on page 7.
| | | | | | |
| Performance highlights (unaudited) | | Wells Fargo Asia Pacific Fund | | | 7 | |
|
| Growth of $10,000 investment as of October 31, 20175 |
|
 |
| 1 | Historical performance shown for Administrator and Institutional Class shares prior to their inception reflects the performance of Class A shares, and includes the higher expenses applicable to Class A shares. If these expenses had not been included, returns for Administrator and Institutional Class shares would be higher. |
| 2 | Reflects the expense ratios as stated in the most recent prospectuses. The expense ratios shown are subject to change and may differ from the annualized expense ratios shown in the financial highlights of this report. |
| 3 | The manager has contractually committed through February 28, 2018 to waive fees and/or reimburse expenses to the extent necessary to cap the Fund’s Total Annual Operating Expenses After Fee Waivers at the amounts shown. After this time, the cap may be increased or the commitment to maintain the cap may be terminated only with the approval of the Board of Trustees. Brokerage commissions, stamp duty fees, interest, taxes, acquired fees and expenses, and extraordinary expenses are excluded from the expense cap. Without this cap, the Fund’s returns would have been lower. The expense ratio paid by an investor is the net expense ratio or the Fund’s Total Annual Fund Operating Expenses After Fee Waivers, as stated in the prospectuses. |
| 4 | The Morgan Stanley Capital International (MSCI) All Country (AC) Asia Pacific Index (Net) is a free-float-adjusted market-capitalization-weighted index that is designed to measure the equity market performance of the developed and emerging markets in the Pacific region. The MSCI AC Asia Pacific Index (Net) consists of the following 13 developed and emerging markets countries: Australia, China, Hong Kong, India, Indonesia, Japan, Korea, Malaysia, New Zealand, the Philippines, Singapore, Taiwan, and Thailand. Source: MSCI. MSCI makes no express or implied warranties or representations and shall have no liability whatsoever with respect to any MSCI data contained herein. The MSCI data may not be further redistributed or used as a basis for other indexes or any securities or financial products. This report is not approved, reviewed, or produced by MSCI. You cannot invest directly in an index. |
| 5 | The chart compares the performance of Class A shares for the most recent ten years with the MSCI AC Asia Pacific Index (Net). The chart assumes a hypothetical investment of $10,000 in Class A shares and reflects all operating expenses and assumes the maximum initial sales charge of 5.75%. |
| 6 | The ten largest holdings, excluding cash and cash equivalents, are calculated based on the value of the investments divided by total net assets of the Fund. Holdings are subject to change and may have changed since the date specified. |
| 7 | Amounts are calculated based on the total long-term investments of the Fund. These amounts are subject to change and may have changed since the date specified. |
| * | This security was no longer held at the end of the reporting period. |
| | | | |
| 8 | | Wells Fargo Asia Pacific Fund | | Performance highlights (unaudited) |
MANAGER’S DISCUSSION
Fund highlights
| ∎ | | The Fund outperformed its benchmark, the MSCI AC Asia Pacific Index (Net), for the 12-month period that ended October 31, 2017. |
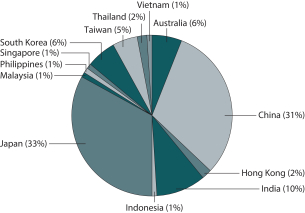
| ∎ | | Overall country allocation contributed to relative returns for the period, led by an overweight to China/Hong Kong and an underweight to Japan. Stock selection contributed the bulk of positive attribution in China/Hong Kong and Japan. |
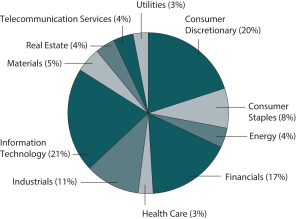
| ∎ | | Allocation at the sector level did not have a material impact on performance. Stock selection contributed the majority of positive attribution, particularly in the consumer discretionary and consumer staples sectors; selection within real estate and utilities was negative. |
| | | | |
| Ten largest holdings (%) as of October 31, 20176 | |
Alibaba Group Holding Limited ADR | | | 2.33 | |
Taiwan Semiconductor Manufacturing Company Limited | | | 2.11 | |
Mitsubishi UFJ Financial Group Incorporated | | | 2.02 | |
Toyota Motor Corporation | | | 1.97 | |
Tencent Holdings Limited | | | 1.93 | |
Samsung Electronics Company Limited | | | 1.84 | |
Macromill Incorporated | | | 1.69 | |
China Construction Bank H Shares | | | 1.58 | |
Sekisui House Limited | | | 1.54 | |
Hitachi Limited | | | 1.51 | |
|
| Sector distribution as of October 31, 20177 |
|
 |
The Fund outperformed its benchmark during a volatile market.
During the 12-month period, returns in the Asia Pacific region appreciated significantly as earnings growth accelerated in Asian emerging markets. Consensus earnings estimates called for 15.9% earnings growth at the beginning of the period, and actual earnings delivered, moving from negative territory to double-digit growth toward the end of the period, which provided a catalyst for investors to allocate to the asset class after two-plus years of negative earnings growth from 2013 to 2015.
Information technology (IT) led the index in terms of absolute performance; the sector rose 49.4%, making it the largest positive contributor to the index. Against this backdrop, the portfolio’s overweight position to IT as a whole and Chinese IT, which appreciated 64.8%, resulted in positive attribution.
In the consumer discretionary sector, the Fund benefited from investments in Japanese shares such as Macromill, Incorporated; Suzuki Motor Corporation; and Ryohin Keikaku Company, Limited. Japanese stocks also led in the consumer staples sector as names such as Matsumotokiyoshi Holdings Company, Limited, and KOSE Corporation outperformed. Holdings in China A shares also contributed to relative outperformance and benefited from MSCI’s decision to begin including China A shares in the MSCI AC World Index and the MSCI Emerging Markets Index in June 2017. Midea Group Company Limited, Inner Mongolia Yili Industrial Group Company Limited, and Huayu Automotive Systems
Company Limited represent China A shares that contributed to outperformance during the period.
Real estate was the largest detractor due to stock selection, particularly within China/Hong Kong, which returned 34.3% as a whole. The portfolio participated in Chinese real estate through a holding in China Overseas Land & Investment Limited; however, it was the highly levered names such as China Evergrande Group* (482% return, 400% total debt/equity) and Sunac China Holdings Limited* (661% return, 529% total debt/equity) that saw the largest increases.
The team increased the Fund’s position within India from 5.2% of the portfolio at the beginning of the period to 10% by the end of the period, primarily in the industrials and consumer discretionary sectors, while reducing the position in Indonesia, particularly within the telecommunication services and real estate sectors. Chinese consumer discretionary
Please see footnotes on page 7.
| | | | | | |
| Performance highlights (unaudited) | | Wells Fargo Asia Pacific Fund | | | 9 | |
also saw a lift, given the addition of new positions in the China A-share market and tourism and the reduction of exposure to Taiwanese IT as the tech up cycle began to wind down toward the end of the period.
|
| Country allocation as of October 31, 20177 |
|
 |
Our investment outlook on the Asia Pacific region remains positive.
Chinese equities may consolidate at current levels after very strong market performance year to date, rising more than 45%. The new economy sectors have dramatically outperformed this year and we continue to like IT and consumption sectors for growth, but we expect market performance to broaden out. Above and beyond the internet giants of Baidu, Incorporated; Alibaba Group Holding Limited; and Tencent Holdings Limited, we are finding more investment opportunities in IT in the China A-share market. We expect the economic and political environment to remain stable following the 19th National Party Congress. President Xi has been elevated to the highest status, with his thoughts incorporated in the Party constitution. The new Politburo Standing
Committee members fully support his agenda for balanced, quality growth and accelerated state-owned enterprise reform.
The Korean equity outlook is supported by earnings growth, most notably in the IT sector, and recovery in the industrials sector. Taiwan’s economy continues to be supported by global expansion, boosting exports and industrial production; however, the improvement in the external environment has not fed through to domestic demand.
We remain bullish on India, as we are positive on the reform momentum, which appears to be accelerating. In particular, the goods and services tax (GST) was implemented in July and there are limited disruptions thus far. We are positive on stocks that will benefit from market-share loss from informal sectors as a result of both demonetization and GST. We agree with Bank Indonesia’s view that economic growth in Indonesia should accelerate in the second half on higher infrastructure spending. While we do not have a positive structural view on Thailand due to the overall indebtedness of households and the fluid political situation, we are closely monitoring cyclical upturns and are tactically positioned with strong, but reasonably valued, franchises.
Japan remains one of the large developed markets in which equity performance lagged. Prime Minister Abe’s victory in the snap elections solidified chances for further labor reform and other domestic policies.
We remain cautious on the Australian market due to the deterioration of household savings rates and recent weak earnings announcements. New Zealand macroeconomic trends are supportive of a stronger market, but we are limited by the availability of attractive names in the near term.
Please see footnotes on page 7.
| | | | |
| 10 | | Wells Fargo Asia Pacific Fund | | Fund expenses (unaudited) |
As a shareholder of the Fund, you incur two types of costs: (1) transaction costs, including sales charges (loads) on purchase payments and contingent deferred sales charges (if any) on redemptions and (2) ongoing costs, including management fees, distribution (12b-1) and/or shareholder servicing fees, and other Fund expenses. This example is intended to help you understand your ongoing costs (in dollars) of investing in the Fund and to compare these costs with the ongoing costs of investing in other mutual funds.
The example is based on an investment of $1,000 invested at the beginning of the six-month period and held for the entire period from May 1, 2017 to October 31, 2017.
Actual expenses
The “Actual” line of the table below provides information about actual account values and actual expenses. You may use the information in this line, together with the amount you invested, to estimate the expenses that you paid over the period. Simply divide your account value by $1,000 (for example, an $8,600 account value divided by $1,000 = 8.6), then multiply the result by the number in the “Actual” line under the heading entitled “Expenses paid during period” for your applicable class of shares to estimate the expenses you paid on your account during this period.
Hypothetical example for comparison purposes
The “Hypothetical” line of the table below provides information about hypothetical account values and hypothetical expenses based on the Fund’s actual expense ratio and an assumed rate of return of 5% per year before expenses, which is not the Fund’s actual return. The hypothetical account values and expenses may not be used to estimate the actual ending account balance or expenses you paid for the period. You may use this information to compare the ongoing costs of investing in the Fund and other funds. To do so, compare this 5% hypothetical example with the 5% hypothetical examples that appear in the shareholder reports of the other funds.
Please note that the expenses shown in the table are meant to highlight your ongoing costs only and do not reflect any transactional costs, such as sales charges (loads) and contingent deferred sales charges. Therefore, the “Hypothetical” line of the table is useful in comparing ongoing costs only and will not help you determine the relative total costs of owning different funds. In addition, if these transactional costs were included, your costs would have been higher.
| | | | | | | | | | | | | | | | |
| | | Beginning
account value
5-1-2017 | | | Ending
account value
10-31-2017 | | | Expenses
paid during
the period¹ | | | Annualized net
expense ratio | |
Class A | | | | | | | | | | | | | | | | |
Actual | | $ | 1,000.00 | | | $ | 1,177.76 | | | $ | 8.78 | | | | 1.60 | % |
Hypothetical (5% return before expenses) | | $ | 1,000.00 | | | $ | 1,017.14 | | | $ | 8.13 | | | | 1.60 | % |
Class C | | | | | | | | | | | | | | | | |
Actual | | $ | 1,000.00 | | | $ | 1,173.95 | | | $ | 12.88 | | | | 2.35 | % |
Hypothetical (5% return before expenses) | | $ | 1,000.00 | | | $ | 1,013.36 | | | $ | 11.93 | | | | 2.35 | % |
Administrator Class | | | | | | | | | | | | | | | | |
Actual | | $ | 1,000.00 | | | $ | 1,177.69 | | | $ | 8.23 | | | | 1.50 | % |
Hypothetical (5% return before expenses) | | $ | 1,000.00 | | | $ | 1,017.65 | | | $ | 7.63 | | | | 1.50 | % |
Institutional Class | | | | | | | | | | | | | | | | |
Actual | | $ | 1,000.00 | | | $ | 1,180.00 | | | $ | 6.87 | | | | 1.25 | % |
Hypothetical (5% return before expenses) | | $ | 1,000.00 | | | $ | 1,018.90 | | | $ | 6.36 | | | | 1.25 | % |
| 1 | Expenses paid is equal to the annualized net expense ratio of each class multiplied by the average account value over the period, multiplied by the number of days in the most recent fiscal half-year divided by the number of days in the fiscal year (to reflect the one-half-year period). |
| | | | | | |
| Portfolio of investments—October 31, 2017 | | Wells Fargo Asia Pacific Fund | | | 11 | |
| | | | | | | | | | | | | | | | |
| Security name | | | | | | | | Shares | | | Value | |
| | | |
Common Stocks: 88.89% | | | | | | | | | | | | | |
| | | |
| Australia: 5.73% | | | | | | | | | | | | | |
Australia & New Zealand Banking Group Limited (Financials, Banks) | | | | | | | | | | | 34,415 | | | $ | 788,078 | |
BHP Billiton Limited (Materials, Metals & Mining) | | | | | | | | | | | 90,171 | | | | 1,831,588 | |
IOOF Holdings Limited (Financials, Capital Markets) | | | | | | | | | | | 88,767 | | | | 731,011 | |
Medibank Private Limited (Financials, Insurance) | | | | | | | | | | | 306,927 | | | | 721,163 | |
MYOB Group Limited (Information Technology, Internet Software & Services) | | | | | | | | | | | 256,900 | | | | 737,319 | |
Northern Star Resources Limited (Materials, Metals & Mining) | | | | | | | | | | | 297,009 | | | | 1,186,588 | |
Rio Tinto Limited (Materials, Metals & Mining) | | | | | | | | | | | 24,585 | | | | 1,306,780 | |
Suncorp Group Limited (Financials, Insurance) | | | | | | | | | | | 106,752 | | | | 1,109,522 | |
Woodside Petroleum Limited (Energy, Oil, Gas & Consumable Fuels) | | | | | | | | | | | 43,439 | | | | 1,021,651 | |
| | | | |
| | | | | | | | | | | | | | | 9,433,700 | |
| | | | | | | | | | | | | | | | |
| | | |
| China: 21.46% | | | | | | | | | | | | | |
3SBio Incorporated (Health Care, Biotechnology)† | | | | | | | | | | | 557,500 | | | | 997,603 | |
Alibaba Group Holding Limited ADR (Information Technology, Internet Software & Services) † | | | | | | | | | | | 20,750 | | | | 3,836,468 | |
AviChina Industry & Technology Company Limited H Shares (Industrials, Aerospace & Defense) | | | | | | | | | | | 2,137,000 | | | | 1,240,881 | |
Baidu Incorporated ADR (Information Technology, Internet Software & Services) † | | | | | | | | | | | 7,255 | | | | 1,769,785 | |
Bank of China Limited H Shares (Financials, Banks) | | | | | | | | | | | 2,682,000 | | | | 1,337,322 | |
Beijing Enterprises Water Group Limited (Utilities, Water Utilities) | | | | | | | | | | | 1,906,000 | | | | 1,600,264 | |
BYD Company Limited H Shares (Consumer Discretionary, Automobiles)« | | | | | | | | | | | 131,000 | | | | 1,147,723 | |
China Communications Construction Company Limited H Shares (Industrials, Construction & Engineering) | | | | | | | | | | | 406,000 | | | | 492,837 | |
China Construction Bank H Shares (Financials, Banks) | | | | | | | | | | | 2,910,000 | | | | 2,596,149 | |
China Everbright International Limited (Industrials, Commercial Services & Supplies) | | | | | | | | | | | 579,000 | | | | 816,392 | |
China Galaxy Securities Company Limited H Shares (Financials, Capital Markets) | | | | | | | | | | | 689,500 | | | | 600,995 | |
China Merchants Bank Company Limited H Shares (Financials, Banks) | | | | | | | | | | | 276,500 | | | | 1,054,410 | |
China Mobile Limited (Telecommunication Services, Wireless Telecommunication Services) | | | | | | | | | | | 151,500 | | | | 1,521,525 | |
China Petroleum & Chemical Corporation H Shares (Energy, Oil, Gas & Consumable Fuels) | | | | | | | | | | | 1,140,000 | | | | 837,311 | |
China Resources Phoenix Healthcare Holdings Company Limited (Health Care, Health Care Providers & Services) « | | | | | | | | | | | 565,000 | | | | 741,610 | |
Ctrip.com International Limited ADR (Consumer Discretionary, Internet & Direct Marketing Retail) † | | | | | | | | | | | 13,300 | | | | 636,937 | |
Hengan International Group Company Limited (Consumer Staples, Personal Products) | | | | | | | | | | | 101,000 | | | | 995,578 | |
Huaneng Renewables Corporation Limited H Shares (Utilities, Independent Power & Renewable Electricity Producers) | | | | | | | | | | | 4,424,000 | | | | 1,519,768 | |
Industrial & Commercial Bank of China Limited H Shares (Financials, Banks) | | | | | | | | | | | 2,715,000 | | | | 2,154,210 | |
JD.com Incorporated ADR (Consumer Discretionary, Internet & Direct Marketing Retail) † | | | | | | | | | | | 18,700 | | | | 701,624 | |
PetroChina Company Limited H Shares (Energy, Oil, Gas & Consumable Fuels) | | | | | | | | | | | 1,222,000 | | | | 797,290 | |
PICC Property & Casualty Company Limited H Shares (Financials, Insurance) | | | | | | | | | | | 390,000 | | | | 772,861 | |
Ping An Insurance (Group) Company of China Limited H Shares (Financials, Insurance) | | | | | | | | | | | 231,000 | | | | 2,028,290 | |
Shanghai Fosun Pharmaceutical Company Limited H Shares (Health Care, Pharmaceuticals) | | | | | | | | | | | 235,000 | | | | 1,173,283 | |
Tencent Holdings Limited (Information Technology, Internet Software & Services) | | | | | | | | | | | 70,800 | | | | 3,174,538 | |
Yum China Holdings Incorporated (Consumer Discretionary, Hotels, Restaurants & Leisure) † | | | | | | | | | | | 19,400 | | | | 782,790 | |
| | | | |
| | | | | | | | | | | | | | | 35,328,444 | |
| | | | | | | | | | | | | | | | |
| | | |
| Hong Kong: 1.96% | | | | | | | | | | | | | |
China Overseas Land & Investment Limited (Real Estate, Real Estate Management & Development) | | | | | | | | | | | 426,000 | | | | 1,381,521 | |
Li & Fung Limited (Consumer Discretionary, Textiles, Apparel & Luxury Goods) | | | | | | | | | | | 1,842,000 | | | | 927,918 | |
Sun Art Retail Group Limited (Consumer Staples, Food & Staples Retailing) | | | | | | | | | | | 910,000 | | | | 919,168 | |
| | | | |
| | | | | | | | | | | | | | | 3,228,607 | |
| | | | | | | | | | | | | | | | |
The accompanying notes are an integral part of these financial statements.
| | | | |
| 12 | | Wells Fargo Asia Pacific Fund | | Portfolio of investments—October 31, 2017 |
| | | | | | | | | | | | | | | | |
| Security name | | | | | | | | Shares | | | Value | |
| | | |
| India: 9.32% | | | | | | | | | | | | | |
Bharat Electronics Limited (Industrials, Aerospace & Defense) | | | | | | | | | | | 462,102 | | | $ | 1,317,005 | |
Bharat Petroleum Corporation Limited (Energy, Oil, Gas & Consumable Fuels) | | | | | | | | | | | 98,018 | | | | 819,601 | |
Emami Limited (Consumer Staples, Personal Products) | | | | | | | | | | | 64,915 | | | | 1,261,043 | |
HDFC Bank Limited (Financials, Banks) | | | | | | | | | | | 79,100 | | | | 2,208,578 | |
Hindalco Industries Limited (Materials, Metals & Mining) | | | | | | | | | | | 475,352 | | | | 1,962,431 | |
ICICI Bank Limited (Financials, Banks) | | | | | | | | | | | 186,670 | | | | 864,885 | |
Indian Hotels Company Limited (Consumer Discretionary, Hotels, Restaurants & Leisure) | | | | | | | | | | | 335,643 | | | | 586,859 | |
Indian Hotels Company Limited (Interim Shares) (Consumer Discretionary, Hotels, Restaurants & Leisure) (a) | | | | | | | | | | | 67,128 | | | | 117,371 | |
Larsen & Toubro Limited (Industrials, Construction & Engineering) | | | | | | | | | | | 72,054 | | | | 1,359,733 | |
MakeMyTrip Limited (Consumer Discretionary, Internet & Direct Marketing Retail) † | | | | | | | | | | | 27,600 | | | | 753,474 | |
Maruti Suzuki India Limited (Consumer Discretionary, Automobiles) | | | | | | | | | | | 6,760 | | | | 856,986 | |
Reliance Industries Limited (Energy, Oil, Gas & Consumable Fuels) | | | | | | | | | | | 153,310 | | | | 2,226,940 | |
Tata Motors Limited (Consumer Discretionary, Automobiles) † | | | | | | | | | | | 152,900 | | | | 1,011,288 | |
| | | | |
| | | | | | | | | | | | | | | 15,346,194 | |
| | | | | | | | | | | | | | | | |
| | | |
| Indonesia: 1.32% | | | | | | | | | | | | | |
PT Bank Rakyat Indonesia Tbk (Financials, Banks) | | | | | | | | | | | 809,400 | | �� | | 930,997 | |
PT Cikarang Listrindo Tbk (Utilities, Independent Power & Renewable Electricity Producers) | | | | | | | | | | | 6,279,300 | | | | 506,974 | |
PT Telekomunikasi Indonesia Persero Tbk (Telecommunication Services, Diversified Telecommunication Services) | | | | | | | | | | | 2,451,200 | | | | 728,357 | |
| | | | |
| | | | | | | | | | | | | | | 2,166,328 | |
| | | | | | | | | | | | | | | | |
| | | |
| Japan: 33.13% | | | | | | | | | | | | | |
Ezaki Glico Company Limited (Consumer Staples, Food Products) | | | | | | | | | | | 14,900 | | | | 824,247 | |
FANUC Corporation (Industrials, Machinery) | | | | | | | | | | | 3,700 | | | | 858,089 | |
Hitachi Limited (Information Technology, Electronic Equipment, Instruments & Components) | | | | | | | | | | | 316,000 | | | | 2,492,872 | |
Honda Motor Company Limited (Consumer Discretionary, Automobiles) | | | | | | | | | | | 23,000 | | | | 712,625 | |
J.Front Retailing Company Limited (Consumer Discretionary, Multiline Retail) | | | | | | | | | | | 70,100 | | | | 1,028,335 | |
Japan Airlines Company Limited (Industrials, Airlines) | | | | | | | | | | | 51,000 | | | | 1,735,808 | |
Japan Rental Housing Investment Incorporated (Real Estate, Equity REITs) | | | | | | | | | | | 1,900 | | | | 1,313,399 | |
Japan Tobacco Incorporated (Consumer Staples, Tobacco) | | | | | | | | | | | 35,800 | | | | 1,179,742 | |
Kao Corporation (Consumer Staples, Personal Products) | | | | | | | | | | | 13,500 | | | | 811,627 | |
KOSE Corporation (Consumer Staples, Personal Products) | | | | | | | | | | | 7,700 | | | | 929,783 | |
Kubota Corporation (Industrials, Machinery) | | | | | | | | | | | 71,200 | | | | 1,328,445 | |
Kura Corporation (Consumer Discretionary, Hotels, Restaurants & Leisure) | | | | | | | | | | | 27,800 | | | | 1,242,021 | |
Kyushu Railway Company (Industrials, Road & Rail) | | | | | | | | | | | 61,400 | | | | 1,957,478 | |
Macromill Incorporated (Consumer Discretionary, Media) | | | | | | | | | | | 92,700 | | | | 2,780,062 | |
Matsumotokiyoshi Holdings Company Limited (Consumer Staples, Food & Staples Retailing) | | | | | | | | | | | 31,600 | | | | 2,262,205 | |
Mitsubishi UFJ Financial Group Incorporated (Financials, Banks) | | | | | | | | | | | 496,700 | | | | 3,330,845 | |
Mitsui Fudosan Company Limited (Real Estate, Real Estate Management & Development) | | | | | | | | | | | 82,400 | | | | 1,903,016 | |
Nintendo Company Limited (Information Technology, Software) | | | | | | | | | | | 4,100 | | | | 1,579,350 | |
Nippon Telegraph & Telephone Corporation (Telecommunication Services, Diversified Telecommunication Services) | | | | | | | | | | | 18,900 | | | | 909,720 | |
NTT DOCOMO Incorporated (Telecommunication Services, Wireless Telecommunication Services) | | | | | | | | | | | 34,100 | | | | 822,023 | |
Obayashi Corporation (Industrials, Construction & Engineering) | | | | | | | | | | | 131,500 | | | | 1,711,622 | |
ORIX Corporation (Financials, Diversified Financial Services) | | | | | | | | | | | 109,800 | | | | 1,871,926 | |
Otsuka Corporation (Information Technology, IT Services) | | | | | | | | | | | 18,700 | | | | 1,266,347 | |
Panasonic Corporation (Consumer Discretionary, Household Durables) | | | | | | | | | | | 139,700 | | | | 2,089,265 | |
Recruit Holdings Company Limited (Industrials, Professional Services) | | | | | | | | | | | 56,100 | | | | 1,369,628 | |
Ryohin Keikaku Company Limited (Consumer Discretionary, Multiline Retail) | | | | | | | | | | | 5,500 | | | | 1,615,584 | |
Sekisui House Limited (Consumer Discretionary, Household Durables) | | | | | | | | | | | 136,500 | | | | 2,534,203 | |
The accompanying notes are an integral part of these financial statements.
| | | | | | |
| Portfolio of investments—October 31, 2017 | | Wells Fargo Asia Pacific Fund | | | 13 | |
| | | | | | | | | | | | | | | | |
| Security name | | | | | | | | Shares | | | Value | |
| | | |
| Japan (continued) | | | | | | | | | | | | | |
SoftBank Group Corporation (Telecommunication Services, Wireless Telecommunication Services) | | | | | | | | | | | 20,100 | | | $ | 1,758,363 | |
Sony Corporation (Consumer Discretionary, Household Durables) | | | | | | | | | | | 40,400 | | | | 1,567,963 | |
Sumitomo Mitsui Trust Holdings Incorporated (Financials, Banks) | | | | | | | | | | | 43,400 | | | | 1,696,610 | |
Suzuki Motor Corporation (Consumer Discretionary, Automobiles) | | | | | | | | | | | 14,900 | | | | 809,177 | |
Tokyo Electron Limited (Information Technology, Semiconductors & Semiconductor Equipment) | | | | | | | | | | | 8,200 | | | | 1,424,660 | |
Toyota Motor Corporation (Consumer Discretionary, Automobiles) | | | | | | | | | | | 52,800 | | | | 3,245,873 | |
Tsukui Corporation (Health Care, Health Care Providers & Services) | | | | | | | | | | | 125,200 | | | | 896,291 | |
Yahoo! Japan Corporation (Information Technology, Internet Software & Services) | | | | | | | | | | | 149,800 | | | | 667,944 | |
| | | | |
| | | | | | | | | | | | | | | 54,527,148 | |
| | | | | | | | | | | | | | | | |
| | | |
| Malaysia: 1.33% | | | | | | | | | | | | | |
Genting Malaysia Bhd (Consumer Discretionary, Hotels, Restaurants & Leisure) | | | | | | | | | | | 585,300 | | | | 695,420 | |
IHH Healthcare Bhd (Health Care, Health Care Providers & Services) | | | | | | | | | | | 549,000 | | | | 731,395 | |
Sime Darby Bhd (Industrials, Industrial Conglomerates) | | | | | | | | | | | 353,200 | | | | 767,554 | |
| | | | |
| | | | | | | | | | | | | | | 2,194,369 | |
| | | | | | | | | | | | | | | | |
| | | |
| Philippines: 1.11% | | | | | | | | | | | | | |
GT Capital Holdings Incorporated (Financials, Diversified Financial Services) | | | | | | | | | | | 26,135 | | | | 597,371 | |
Semirara Mining & Power Corporation (Energy, Oil, Gas & Consumable Fuels) | | | | | | | | | | | 1,499,440 | | | | 1,234,406 | |
| | | | |
| | | | | | | | | | | | | | | 1,831,777 | |
| | | | | | | | | | | | | | | | |
| | | |
| Singapore: 0.98% | | | | | | | | | | | | | |
Genting Singapore plc (Consumer Discretionary, Hotels, Restaurants & Leisure) | | | | | | | | | | | 947,900 | | | | 848,388 | |
Singapore Telecommunications Limited (Telecommunication Services, Diversified Telecommunication Services) | | | | | | | | | | | 277,700 | | | | 763,976 | |
| | | | |
| | | | | | | | | | | | | | | 1,612,364 | |
| | | | | | | | | | | | | | | | |
| | | |
| South Korea: 4.83% | | | | | | | | | | | | | |
Celltrion Healthcare Company Limited (Health Care, Health Care Providers & Services) † | | | | | | | | | | | 9,700 | | | | 509,957 | |
Hana Financial Group Incorporated (Financials, Banks) | | | | | | | | | | | 18,391 | | | | 787,119 | |
KB Financial Group Incorporated (Financials, Banks) | | | | | | | | | | | 15,723 | | | | 819,586 | |
Korea Electric Power Corporation (Utilities, Electric Utilities) | | | | | | | | | | | 26,713 | | | | 934,663 | |
LG Chem Limited (Materials, Chemicals) | | | | | | | | | | | 3,049 | | | | 1,098,114 | |
Samsung Electronics Company Limited (Information Technology, Technology Hardware, Storage & Peripherals) | | | | | | | | | | | 1,231 | | | | 3,025,995 | |
Samsung SDI Company Limited (Information Technology, Electronic Equipment, Instruments & Components) | | | | | | | | | | | 4,254 | | | | 782,188 | |
| | | | |
| | | | | | | | | | | | | | | 7,957,622 | |
| | | | | | | | | | | | | | | | |
| | | |
| Taiwan: 5.36% | | | | | | | | | | | | | |
Hon Hai Precision Industry Company Limited (Information Technology, Electronic Equipment, Instruments & Components) | | | | | | | | | | | 441,085 | | | | 1,638,009 | |
Siliconware Precision Industries Company (Information Technology, Semiconductors & Semiconductor Equipment) | | | | | | | | | | | 493,000 | | | | 781,359 | |
Taiwan Paiho Limited (Consumer Discretionary, Textiles, Apparel & Luxury Goods) | | | | | | | | | | | 228,000 | | | | 941,196 | |
Taiwan Semiconductor Manufacturing Company Limited (Information Technology, Semiconductors & Semiconductor Equipment) | | | | | | | | | | | 431,000 | | | | 3,472,637 | |
Uni-President Enterprises Corporation (Consumer Staples, Food Products) | | | | | | | | | | | 413,000 | | | | 862,713 | |
United Microelectronics Corporation (Information Technology, Semiconductors & Semiconductor Equipment) | | | | | | | | | | | 2,180,000 | | | | 1,120,377 | |
| | | | |
| | | | | | | | | | | | | | | 8,816,291 | |
| | | | | | | | | | | | | | | | |
The accompanying notes are an integral part of these financial statements.
| | | | |
| 14 | | Wells Fargo Asia Pacific Fund | | Portfolio of investments—October 31, 2017 |
| | | | | | | | | | | | | | | | |
| Security name | | | | | | | | Shares | | | Value | |
| | | |
| Thailand: 1.82% | | | | | | | | | | | | | |
Land & Houses PCL (Real Estate, Real Estate Management & Development) | | | | | | | | | | | 5,322,700 | | | $ | 1,746,461 | |
Thai Beverage PCL (Consumer Staples, Beverages) | | | | | | | | | | | 1,732,800 | | | | 1,245,796 | |
| | | | |
| | | | | | | | | | | | | | | 2,992,257 | |
| | | | | | | | | | | | | | | | |
| | | |
| Vietnam: 0.54% | | | | | | | | | | | | | |
Masan Group Corporation (Consumer Staples, Food Products) | | | | | | | | | | | 336,000 | | | | 880,220 | |
| | | | | | | | | | | | | | | | |
| | | |
Total Common Stocks (Cost $116,074,001) | | | | | | | | | | | | 146,315,321 | |
| | | | | | | | | | | | | | | | |
| | | |
| | | | Expiration date | | | | | | | |
| Participation Notes: 8.90% | |
|
| China: 8.90% | |
HSBC Bank plc (Baoshan Iron & Steel Company Limited Class A) (Materials, Metals & Mining) †(a)144A | | | | | | | 2-19-2019 | | | | 870,995 | | | | 1,007,530 | |
HSBC Bank plc (China International Travel Service Corporation Class A) (Consumer Discretionary, Hotels, Restaurants & Leisure) †(a) | | | | | | | 12-23-2024 | | | | 191,000 | | | | 1,191,698 | |
HSBC Bank plc (Han’s Laser Technology Industry Group Company Limited Class A) (Industrials, Machinery) †(a) | | | | | | | 3-18-2019 | | | | 178,169 | | | | 1,285,495 | |
HSBC Bank plc (Hangzhou Hikvision Digital Technology Company Limited Class A) (Information Technology, Electronic Equipment, Instruments & Components) †(a) | | | | | | | 6-18-2018 | | | | 511,261 | | | | 3,028,735 | |
HSBC Bank plc (Huayu Automotive Systems Company Limited Class A) (Consumer Discretionary, Auto Components) †(a) | | | | | | | 12-2-2019 | | | | 233,800 | | | | 896,681 | |
HSBC Bank plc (Inner Mongolia Yili Industrial Group Company Limited Class A) (Consumer Staples, Food Products) †(a) | | | | | | | 9-25-2023 | | | | 277,800 | | | | 1,238,046 | |
HSBC Bank plc (Midea Group Company Limited Class A) (Consumer Discretionary, Household Durables) †(a) | | | | | | | 5-8-2018 | | | | 175,000 | | | | 1,346,032 | |
HSBC Bank plc (Songcheng Performance Development Company Limited Class A) (Consumer Discretionary, Hotels, Restaurants & Leisure) †(a) | | | | | | | 10-12-2020 | | | | 415,952 | | | | 1,264,054 | |
UBS AG (China Vanke Company Limited Class A) (Real Estate, Real Estate Management & Development) † | | | | | | | 10-31-2018 | | | | 187,200 | | | | 815,897 | |
UBS AG (GoerTek Incorporated Class A) (Information Technology, Electronic Equipment, Instruments & Components) †(a) | | | | | | | 7-24-2018 | | | | 331,400 | | | | 1,106,566 | |
UBS AG (Han’s Laser Technology Industry Group Company Limited Class A) (Industrials, Machinery) †(a) | | | | | | | 3-19-2018 | | | | 203,912 | | | | 1,471,232 | |
| | | |
Total Participation Notes (Cost $9,427,469) | | | | | | | | | | | | 14,651,966 | |
| | | | | | | | | | | | | | | | |
| | | | |
| | | Dividend yield | | | | | | | | | | |
| Preferred Stocks: 1.11% | | | | | | | | | | | | | |
| | | | |
| South Korea: 1.11% | | | | | | | | | | | | | | | | |
Samsung Electronics Company Limited (Information Technology, Technology Hardware, Storage & Peripherals) | | | 2.06 | % | | | | | | | 910 | | | | 1,819,431 | |
| | | | | | | | | | | | | | | | |
| | | |
Total Preferred Stocks (Cost $630,728) | | | | | | | | | | | | 1,819,431 | |
| | | | | | | | | | | | | | | | |
The accompanying notes are an integral part of these financial statements.
| | | | | | |
| Portfolio of investments—October 31, 2017 | | Wells Fargo Asia Pacific Fund | | | 15 | |
| | | | | | | | | | | | | | | | |
| Security name | | Yield | | | | | | Shares | | | Value | |
| | | |
Short-Term Investments: 1.24% | | | | | | | | | | | | | |
| | | | |
| Investment Companies: 1.24% | | | | | | | | | | | | | | | | |
Securities Lending Cash Investment LLC (l)(r)(u) | | | 1.26 | % | | | | | | | 993,151 | | | $ | 993,250 | |
Wells Fargo Government Money Market Fund Select Class (l)(u) | | | 0.96 | | | | | | | | 1,050,305 | | | | 1,050,305 | |
| | | |
Total Short-Term Investments (Cost $2,043,555) | | | | | | | | | | | | 2,043,555 | |
| | | | | | | | | | | | | | | | |
| | | | | | | | |
| Total investments in securities (Cost $128,175,753) | | | 100.14 | % | | | 164,830,273 | |
Other assets and liabilities, net | | | (0.14 | ) | | | (234,846 | ) |
| | | | | | | | |
| Total net assets | | | 100.00 | % | | $ | 164,595,427 | |
| | | | | | | | |
| † | Non-income-earning security |
| « | All or a portion of this security is on loan. |
| (a) | The security is fair valued in accordance with procedures approved by the Board of Trustees. |
| 144A | The security may be resold in transactions exempt from registration, normally to qualified institutional buyers, pursuant to Rule 144A under the Securities Act of 1933. |
| (l) | The issuer of the security is an affiliated person of the Fund as defined in the Investment Company Act of 1940. |
| (r) | The investment is a non-registered investment company purchased with cash collateral received from securities on loan. |
| (u) | The rate represents the 7-day annualized yield at period end. |
Investments in Affiliates
An affiliated investment is an investment in which the Fund owns at least 5% of the outstanding voting shares of the issuer or as a result of other relationships, such as the Fund and the issuer having the same investment manager. Transactions with issuers that were either affiliated persons of the Fund at the beginning of the period or the end of the period were as follows:
| | | | | | | | | | | | | | | | | | | | | | | | | | | | | | | | | | | | |
| | | Shares, beginning of period | | | Shares purchased | | | Shares sold | | | Shares, end of period | | | Net realized gains | | | Net
change in unrealized gains (losses) | | | Income from affiliated securities | | | Value, end of period | | | % of net
assets | |
Short-Term Investments | | | | | | | | | | | | | | | | | | | | | | | | | | | | | | | | | | | | |
Investment companies | | | | | | | | | | | | | | | | | | | | | | | | | | | | | | | | | | | | |
Securities Lending Cash Investment LLC | | | 1,315,692 | | | | 47,838,370 | | | | 48,160,911 | | | | 993,151 | | | $ | 59 | | | $ | (59 | ) | | $ | 42,173 | | | $ | 993,250 | | | | | |
Wells Fargo Government Money Market Fund Select Class | | | 1,975,446 | | | | 62,511,814 | | | | 63,436,955 | | | | 1,050,305 | | | | 0 | | | | 0 | | | | 18,048 | | | | 1,050,305 | | | | | |
| | | | | | | | | | | | | | | | | | | | | | | | | | | | | | | | | | | | |
| | | | | | | | | | | | | | | | | | $ | 59 | | | $ | (59 | ) | | $ | 60,221 | | | $ | 2,043,555 | | | | 1.24 | % |
| | | | | | | | | | | | | | | | | | | | | | | | | | | | | | | | | | | | |
The accompanying notes are an integral part of these financial statements.
| | | | |
| 16 | | Wells Fargo Asia Pacific Fund | | Statement of assets and liabilities—October 31, 2017 |
| | | | |
| | | | |
| |
Assets | | | | |
Investments in unaffiliated securities (including $937,167 of securities loaned), at value (cost $126,132,198) | | $ | 162,786,718 | |
Investments in affiliated securities, at value (cost $2,043,555) | | | 2,043,555 | |
Foreign currency, at value (cost $931,367) | | | 931,337 | |
Receivable for investments sold | | | 399,252 | |
Receivable for Fund shares sold | | | 100,718 | |
Receivable for dividends | | | 369,722 | |
Receivable for securities lending income | | | 5,008 | |
Prepaid expenses and other assets | | | 43,726 | |
| | | | |
Total assets | | | 166,680,036 | |
| | | | |
| |
Liabilities | | | | |
Payable upon receipt of securities loaned | | | 993,250 | |
Payable for investments purchased | | | 815,897 | |
Management fee payable | | | 131,009 | |
Payable for Fund shares redeemed | | | 86,816 | |
Administration fees payable | | | 26,365 | |
Distribution fee payable | | | 1,440 | |
Trustees’ fees and expenses payable | | | 1,383 | |
Accrued expenses and other liabilities | | | 28,449 | |
| | | | |
Total liabilities | | | 2,084,609 | |
| | | | |
Total net assets | | $ | 164,595,427 | |
| | | | |
| |
NET ASSETS CONSIST OF | | | | |
Paid-in capital | | $ | 127,814,392 | |
Undistributed net investment income | | | 516,058 | |
Accumulated net realized losses on investments | | | (387,403 | ) |
Net unrealized gains on investments | | | 36,652,380 | |
| | | | |
Total net assets | | $ | 164,595,427 | |
| | | | |
| |
COMPUTATION OF NET ASSET VALUE AND OFFERING PRICE PER SHARE | | | | |
Net assets – Class A | | $ | 126,265,147 | |
Shares outstanding – Class A1 | | | 8,396,146 | |
Net asset value per share – Class A | | | $15.04 | |
Maximum offering price per share – Class A2 | | | $15.96 | |
Net assets – Class C | | $ | 2,308,678 | |
Shares outstanding – Class C1 | | | 162,147 | |
Net asset value per share – Class C | | | $14.24 | |
Net assets – Administrator Class | | $ | 2,000,020 | |
Shares outstanding – Administrator Class1 | | | 135,265 | |
Net asset value per share – Administrator Class | | | $14.79 | |
Net assets – Institutional Class | | $ | 34,021,582 | |
Shares outstanding – Institutional Class1 | | | 2,305,821 | |
Net asset value per share – Institutional Class | | | $14.75 | |
| 1 | The Fund has an unlimited number of authorized shares. |
| 2 | Maximum offering price is computed as 100/94.25 of net asset value. On investments of $50,000 or more, the offering price is reduced. |
The accompanying notes are an integral part of these financial statements.
| | | | | | |
| Statement of operations—year ended October 31, 2017 | | Wells Fargo Asia Pacific Fund | | | 17 | |
| | | | |
| | | | |
| |
Investment income | | | | |
Dividends (net of foreign withholding taxes of $351,945) | | $ | 3,184,882 | |
Income from affiliated securities | | | 60,221 | |
| | | | |
Total investment income | | | 3,245,103 | |
| | | | |
| |
Expenses | | | | |
Management fee | | | 1,472,590 | |
Administration fees | | | | |
Class A | | | 246,060 | |
Class C | | | 4,444 | |
Administrator Class | | | 5,081 | |
Institutional Class | | | 31,282 | |
Shareholder servicing fees | | | | |
Class A | | | 292,929 | |
Class C | | | 5,291 | |
Administrator Class | | | 9,771 | |
Distribution fee | | | | |
Class C | | | 15,872 | |
Custody and accounting fees | | | 95,193 | |
Professional fees | | | 53,212 | |
Registration fees | | | 71,288 | |
Shareholder report expenses | | | 24,522 | |
Trustees’ fees and expenses | | | 21,512 | |
Other fees and expenses | | | 25,970 | |
| | | | |
Total expenses | | | 2,375,017 | |
Less: Fee waivers and/or expense reimbursements | | | (91,134 | ) |
| | | | |
Net expenses | | | 2,283,883 | |
| | | | |
Net investment income | | | 961,220 | |
| | | | |
| |
REALIZED AND UNREALIZED GAINS (LOSSES) ON INVESTMENTS | | | | |
| |
Net realized gains on: | | | | |
Unaffiliated securities | | | 4,252,801 | |
Affiliated securities | | | 59 | |
| | | | |
Net realized gains on investments | | | 4,252,860 | |
| | | | |
|
Net change in unrealized gains (losses) on: | |
Unaffiliated securities | | | 29,328,740 | |
Affiiliated securities | | | (59 | ) |
| | | | |
Net change in unrealized gains (losses) on investments | | | 29,328,681 | |
| | | | |
Net realized and unrealized gains (losses) on investments | | | 33,581,541 | |
| | | | |
Net increase in net assets resulting from operations | | $ | 34,542,761 | |
| | | | |
The accompanying notes are an integral part of these financial statements.
| | | | |
| 18 | | Wells Fargo Asia Pacific Fund | | Statement of changes in net assets |
| | | | | | | | | | | | | | | | |
| | | Year ended
October 31, 2017 | | | Year ended
October 31, 2016 | |
| | | | |
Operations | | | | | | | | | | | | | | | | |
Net investment income | | | | | | $ | 961,220 | | | | | | | $ | 1,443,500 | |
Net realized gains (losses) on investments | | | | | | | 4,252,860 | | | | | | | | (3,319,116 | ) |
Net change in unrealized gains (losses) on investments | | | | | | | 29,328,681 | | | | | | | | 5,861,420 | |
| | | | |
Net increase in net assets resulting from operations | | | | | | | 34,542,761 | | | | | | | | 3,985,804 | |
| | | | |
| | | | |
Distributions to shareholders from | | | | | | | | | | | | | | | | |
Net investment income | | | | | | | | | | | | | | | | |
Class A | | | | | | | (1,463,867 | ) | | | | | | | (2,403,259 | ) |
Class C | | | | | | | (6,107 | ) | | | | | | | (44,466 | ) |
Administrator Class | | | | | | | (50,069 | ) | | | | | | | (274,359 | ) |
Institutional Class | | | | | | | (295,073 | ) | | | | | | | (250,376 | ) |
| | | | |
Total distributions to shareholders | | | | | | | (1,815,116 | ) | | | | | | | (2,972,460 | ) |
| | | | |
| | | | |
Capital share transactions | | | Shares | | | | | | | | Shares | | | | | |
Proceeds from shares sold | | | | | | | | | | | | | | | | |
Class A | | | 620,409 | | | | 7,822,027 | | | | 1,604,531 | | | | 18,556,341 | |
Class C | | | 5,243 | | | | 62,877 | | | | 13,686 | | | | 149,151 | |
Administrator Class | | | 60,384 | | | | 741,557 | | | | 70,112 | | | | 783,199 | |
Institutional Class | | | 1,809,183 | | | | 22,286,904 | | | | 334,375 | | | | 3,796,409 | |
| | | | |
| | | | | | | 30,913,365 | | | | | | | | 23,285,100 | |
| | | | |
Reinvestment of distributions | | | | | | | | | | | | | | | | |
Class A | | | 124,042 | | | | 1,419,041 | | | | 203,382 | | | | 2,336,858 | |
Class C | | | 449 | | | | 4,899 | | | | 3,274 | | | | 35,719 | |
Administrator Class | | | 4,266 | | | | 47,951 | | | | 24,161 | | | | 272,051 | |
Institutional Class | | | 25,127 | | | | 281,166 | | | | 20,214 | | | | 227,203 | |
| | | | |
| | | | | | | 1,753,057 | | | | | | | | 2,871,831 | |
| | | | |
Payment for shares redeemed | | | | | | | | | | | | | | | | |
Class A | | | (2,264,628 | ) | | | (28,673,054 | ) | | | (3,431,646 | ) | | | (39,403,961 | ) |
Class C | | | (37,870 | ) | | | (444,028 | ) | | | (132,110 | ) | | | (1,420,868 | ) |
Administrator Class | | | (885,130 | ) | | | (10,601,230 | ) | | | (337,011 | ) | | | (3,756,219 | ) |
Institutional Class | | | (389,294 | ) | | | (5,004,838 | ) | | | (434,461 | ) | | | (4,818,709 | ) |
| | | | |
| | | | | | | (44,723,150 | ) | | | | | | | (49,399,757 | ) |
| | | | |
Net decrease in net assets resulting from capital share transactions | | | | | | | (12,056,728 | ) | | | | | | | (23,242,826 | ) |
| | | | |
Total increase (decrease) in net assets | | | | | | | 20,670,917 | | | | | | | | (22,229,482 | ) |
| | | | |
| | | | |
Net assets | | | | | | | | | | | | | | | | |
Beginning of period | | | | | | | 143,924,510 | | | | | | | | 166,153,992 | |
| | | | |
End of period | | | | | | $ | 164,595,427 | | | | | | | $ | 143,924,510 | |
| | | | |
Undistributed net investment income | | | | | | $ | 516,058 | | | | | | | $ | 1,270,787 | |
| | | | |
The accompanying notes are an integral part of these financial statements.
| | | | | | |
| Financial highlights | | Wells Fargo Asia Pacific Fund | | | 19 | |
(For a share outstanding throughout each period)
| | | | | | | | | | | | | | | | | | | | |
| | | Year ended October 31 | |
| CLASS A | | 2017 | | | 2016 | | | 2015 | | | 2014 | | | 2013 | |
Net asset value, beginning of period | | | $12.11 | | | | $11.92 | | | | $12.18 | | | | $11.72 | | | | $10.19 | |
Net investment income | | | 0.08 | | | | 0.11 | 1 | | | 0.04 | 1 | | | 0.09 | 1 | | | 0.12 | 1 |
Net realized and unrealized gains (losses) on investments | | | 3.00 | | | | 0.29 | | | | (0.16 | ) | | | 0.67 | | | | 1.79 | |
| | | | | | | | | | | | | | | | | | | | |
Total from investment operations | | | 3.08 | | | | 0.40 | | | | (0.12 | ) | | | 0.76 | | | | 1.91 | |
Distributions to shareholders from | | | | | | | | | | | | | | | | | | | | |
Net investment income | | | (0.15 | ) | | | (0.21 | ) | | | (0.14 | ) | | | (0.30 | ) | | | (0.38 | ) |
Net asset value, end of period | | | $15.04 | | | | $12.11 | | | | $11.92 | | | | $12.18 | | | | $11.72 | |
Total return2 | | | 25.84 | % | | | 3.47 | % | | | (0.95 | )% | | | 6.61 | % | | | 19.24 | % |
Ratios to average net assets (annualized) | | | | | | | | | | | | | | | | | | | | |
Gross expenses | | | 1.66 | % | | | 1.69 | % | | | 1.72 | % | | | 1.71 | % | | | 1.79 | % |
Net expenses | | | 1.60 | % | | | 1.60 | % | | | 1.60 | % | | | 1.60 | % | | | 1.60 | % |
Net investment income | | | 0.58 | % | | | 0.97 | % | | | 0.34 | % | | | 0.80 | % | | | 1.08 | % |
Supplemental data | | | | | | | | | | | | | | | | | | | | |
Portfolio turnover rate | | | 63 | % | | | 52 | % | | | 113 | % | | | 113 | % | | | 187 | % |
Net assets, end of period (000s omitted) | | | $126,265 | | | | $120,108 | | | | $137,578 | | | | $6,755 | | | | $8,720 | |
| 1 | Calculated based upon average shares outstanding |
| 2 | Total return calculations do not include any sales charges. |
The accompanying notes are an integral part of these financial statements.
| | | | |
| 20 | | Wells Fargo Asia Pacific Fund | | Financial highlights |
(For a share outstanding throughout each period)
| | | | | | | | | | | | | | | | | | | | |
| | | Year ended October 31 | |
| CLASS C | | 2017 | | | 2016 | | | 2015 | | | 2014 | | | 2013 | |
Net asset value, beginning of period | | | $11.44 | | | | $11.29 | | | | $11.57 | | | | $11.15 | | | | $9.73 | |
Net investment income (loss) | | | (0.02 | )1 | | | 0.02 | 1 | | | (0.00 | )1,2 | | | 0.01 | 1 | | | 0.05 | |
Net realized and unrealized gains (losses) on investments | | | 2.85 | | | | 0.28 | | | | (0.20 | ) | | | 0.63 | | | | 1.69 | |
| | | | | | | | | | | | | | | | | | | | |
Total from investment operations | | | 2.83 | | | | 0.30 | | | | (0.20 | ) | | | 0.64 | | | | 1.74 | |
Distributions to shareholders from | | | | | | | | | | | | | | | | | | | | |
Net investment income | | | (0.03 | ) | | | (0.15 | ) | | | (0.08 | ) | | | (0.22 | ) | | | (0.32 | ) |
Net asset value, end of period | | | $14.24 | | | | $11.44 | | | | $11.29 | | | | $11.57 | | | | $11.15 | |
Total return3 | | | 24.86 | % | | | 2.75 | % | | | (1.71 | )% | | | 5.76 | % | | | 18.44 | % |
Ratios to average net assets (annualized) | | | | | | | | | | | | | | | | | | | | |
Gross expenses | | | 2.41 | % | | | 2.44 | % | | | 2.46 | % | | | 2.46 | % | | | 2.54 | % |
Net expenses | | | 2.35 | % | | | 2.35 | % | | | 2.35 | % | | | 2.35 | % | | | 2.35 | % |
Net investment income (loss) | | | (0.17 | )% | | | 0.14 | % | | | (0.01 | )% | | | 0.12 | % | | | 0.37 | % |
Supplemental data | | | | | | | | | | | | | | | | | | | | |
Portfolio turnover rate | | | 63 | % | | | 52 | % | | | 113 | % | | | 113 | % | | | 187 | % |
Net assets, end of period (000s omitted) | | | $2,309 | | | | $2,223 | | | | $3,495 | | | | $2,427 | | | | $1,980 | |
| 1 | Calculated based upon average shares outstanding |
| 2 | Amount is less than $0.005. |
| 3 | Total return calculations do not include any sales charges. |
The accompanying notes are an integral part of these financial statements.
| | | | | | |
| Financial highlights | | Wells Fargo Asia Pacific Fund | | | 21 | |
(For a share outstanding throughout each period)
| | | | | | | | | | | | | | | | | | | | |
| | | Year ended October 31 | |
| ADMINISTRATOR CLASS | | 2017 | | | 2016 | | | 2015 | | | 2014 | | | 2013 | |
Net asset value, beginning of period | | | $11.88 | | | | $11.72 | | | | $11.99 | | | | $11.54 | | | | $10.04 | |
Net investment income | | | 0.04 | 1 | | | 0.12 | | | | 0.11 | 1 | | | 0.12 | 1 | | | 0.14 | 1 |
Net realized and unrealized gains (losses) on investments | | | 3.00 | | | | 0.29 | | | | (0.21 | ) | | | 0.65 | | | | 1.77 | |
| | | | | | | | | | | | | | | | | | | | |
Total from investment operations | | | 3.04 | | | | 0.41 | | | | (0.10 | ) | | | 0.77 | | | | 1.91 | |
Distributions to shareholders from | | | | | | | | | | | | | | | | | | | | |
Net investment income | | | (0.13 | ) | | | (0.25 | ) | | | (0.17 | ) | | | (0.32 | ) | | | (0.41 | ) |
Net asset value, end of period | | | $14.79 | | | | $11.88 | | | | $11.72 | | | | $11.99 | | | | $11.54 | |
Total return | | | 25.83 | % | | | 3.60 | % | | | (0.83 | )% | | | 6.86 | % | | | 19.57 | % |
Ratios to average net assets (annualized) | | | | | | | | | | | | | | | | | | | | |
Gross expenses | | | 1.58 | % | | | 1.61 | % | | | 1.56 | % | | | 1.52 | % | | | 1.61 | % |
Net expenses | | | 1.50 | % | | | 1.47 | % | | | 1.40 | % | | | 1.40 | % | | | 1.40 | % |
Net investment income | | | 0.36 | % | | | 1.07 | % | | | 0.87 | % | | | 1.04 | % | | | 1.26 | % |
Supplemental data | | | | | | | | | | | | | | | | | | | | |
Portfolio turnover rate | | | 63 | % | | | 52 | % | | | 113 | % | | | 113 | % | | | 187 | % |
Net assets, end of period (000s omitted) | | | $2,000 | | | | $11,357 | | | | $14,048 | | | | $13,956 | | | | $12,577 | |
| 1 | Calculated based upon average shares outstanding |
The accompanying notes are an integral part of these financial statements.
| | | | |
| 22 | | Wells Fargo Asia Pacific Fund | | Financial highlights |
(For a share outstanding throughout each period)
| | | | | | | | | | | | | | | | | | | | |
| | | Year ended October 31 | |
| INSTITUTIONAL CLASS | | 2017 | | | 2016 | | | 2015 | | | 2014 | | | 2013 | |
Net asset value, beginning of period | | | $11.89 | | | | $11.73 | | | | $12.00 | | | | $11.55 | | | | $10.05 | |
Net investment income | | | 0.21 | | | | 0.13 | | | | 0.15 | 1 | | | 0.14 | 1 | | | 0.18 | 1 |
Net realized and unrealized gains (losses) on investments | | | 2.85 | | | | 0.30 | | | | (0.23 | ) | | | 0.65 | | | | 1.74 | |
| | | | | | | | | | | | | | | | | | | | |
Total from investment operations | | | 3.06 | | | | 0.43 | | | | (0.08 | ) | | | 0.79 | | | | 1.92 | |
Distributions to shareholders from | | | | | | | | | | | | | | | | | | | | |
Net investment income | | | (0.20 | ) | | | (0.27 | ) | | | (0.19 | ) | | | (0.34 | ) | | | (0.42 | ) |
Net asset value, end of period | | | $14.75 | | | | $11.89 | | | | $11.73 | | | | $12.00 | | | | $11.55 | |
Total return | | | 26.25 | % | | | 3.83 | % | | | (0.65 | )% | | | 6.99 | % | | | 19.70 | % |
Ratios to average net assets (annualized) | | | | | | | | | | | | | | | | | | | | |
Gross expenses | | | 1.33 | % | | | 1.36 | % | | | 1.36 | % | | | 1.27 | % | | | 1.33 | % |
Net expenses | | | 1.25 | % | | | 1.25 | % | | | 1.25 | % | | | 1.25 | % | | | 1.25 | % |
Net investment income | | | 1.11 | % | | | 1.28 | % | | | 1.27 | % | | | 1.15 | % | | | 1.62 | % |
Supplemental data | | | | | | | | | | | | | | | | | | | | |
Portfolio turnover rate | | | 63 | % | | | 52 | % | | | 113 | % | | | 113 | % | | | 187 | % |
Net assets, end of period (000s omitted) | | | $34,022 | | | | $10,237 | | | | $11,034 | | | | $502 | | | | $129 | |
| 1 | Calculated based upon average shares outstanding |
The accompanying notes are an integral part of these financial statements.
| | | | | | |
| Notes to financial statements | | Wells Fargo Asia Pacific Fund | | | 23 | |
1. ORGANIZATION
Wells Fargo Funds Trust (the “Trust”), a Delaware statutory trust organized on March 10, 1999, is an open-end management investment company registered under the Investment Company Act of 1940, as amended (the “1940 Act”). As an investment company, the Trust follows the accounting and reporting guidance in Financial Accounting Standards Board Accounting Standards Codification Topic 946, Financial Services – Investment Companies. These financial statements report on the Wells Fargo Asia Pacific Fund (the “Fund”) which is a diversified series of the Trust.
2. SIGNIFICANT ACCOUNTING POLICIES
The following significant accounting policies, which are consistently followed in the preparation of the financial statements of the Fund, are in conformity with U.S. generally accepted accounting principles which require management to make estimates and assumptions that affect the reported amounts of assets and liabilities, disclosure of contingent assets and liabilities at the date of the financial statements, and the reported amounts of revenues and expenses during the reporting period. Actual results could differ from those estimates.
Securities valuation
All investments are valued each business day as of the close of regular trading on the New York Stock Exchange (generally 4 p.m. Eastern Time), although the Fund may deviate from this calculation time under unusual or unexpected circumstances.
Equity securities that are listed on a foreign or domestic exchange or market are valued at the official closing price or, if none, the last sales price. If no sale occurs on the principal exchange or market that day, a fair value price will be determined in accordance with the Fund’s Valuation Procedures.
The values of securities denominated in foreign currencies are translated into U.S. dollars at rates provided by an independent foreign currency pricing source at a time each business day specified by the Management Valuation Team of Wells Fargo Funds Management, LLC (“Funds Management”).
Many securities markets and exchanges outside the U.S. close prior to the close of the New York Stock Exchange and therefore may not fully reflect trading or events that occur after the close of the principal exchange in which the foreign securities are traded, but before the close of the New York Stock Exchange. If such trading or events are expected to materially affect the value of such securities, then fair value pricing procedures approved by the Board of Trustees of the Fund are applied. These procedures take into account multiple factors including movements in U.S. securities markets after foreign exchanges close. Foreign securities that are fair valued under these procedures are categorized as Level 2 and the application of these procedures may result in transfers between Level 1 and Level 2. Depending on market activity, such fair valuations may be frequent. Such fair value pricing may result in net asset values that are higher or lower than net asset values based on the last reported sales price or latest quoted bid price. On October 31, 2017, such fair value pricing was not used in pricing foreign securities.
Investments in registered open-end investment companies are valued at net asset value. Interests in non-registered investment companies that are redeemable at net asset value are fair valued normally at net asset value.
Investments which are not valued using any of the methods discussed above are valued at their fair value, as determined in good faith by the Board of Trustees. The Board of Trustees has established a Valuation Committee comprised of the Trustees and has delegated to it the authority to take any actions regarding the valuation of portfolio securities that the Valuation Committee deems necessary or appropriate, including determining the fair value of portfolio securities, unless the determination has been delegated to the Management Valuation Team. The Board of Trustees retains the authority to make or ratify any valuation decisions or approve any changes to the Valuation Procedures as it deems appropriate. On a quarterly basis, the Board of Trustees receives reports on any valuation actions taken by the Valuation Committee or the Management Valuation Team which may include items for ratification.
Valuations of fair valued securities are compared to the next actual sales price when available, or other appropriate market values, to assess the continued appropriateness of the fair valuation methodologies used. These securities are fair valued on a day-to-day basis, taking into consideration changes to appropriate market information and any significant changes to the inputs considered in the valuation process until there is a readily available price provided on an exchange or by an independent pricing service. Valuations received from an independent pricing service or independent broker-dealer quotes are periodically validated by comparisons to most recent trades and valuations provided by other independent pricing services in addition to the review of prices by the manager and/or subadviser. Unobservable inputs used in determining fair valuations are identified based on the type of security, taking into consideration factors utilized by market participants in valuing the investment, knowledge about the issuer and the current market environment.
| | | | |
| 24 | | Wells Fargo Asia Pacific Fund | | Notes to financial statements |
Foreign currency translation
The accounting records of the Fund are maintained in U.S. dollars. The values of other assets and liabilities denominated in foreign currencies are translated into U.S. dollars at rates provided by an independent foreign currency pricing source at a time each business day specified by the Management Valuation Team. Purchases and sales of securities, and income and expenses are converted at the rate of exchange on the respective dates of such transactions. Net realized foreign exchange gains or losses arise from sales of foreign currencies, currency gains or losses realized between the trade and settlement dates on securities transactions, and the difference between the amounts of dividends, interest and foreign withholding taxes recorded and the U.S. dollar equivalent of the amounts actually paid or received. Net unrealized foreign exchange gains and losses arise from changes in the fair value of assets and liabilities other than investments in securities resulting from changes in exchange rates. The changes in net assets arising from changes in exchange rates of securities and the changes in net assets resulting from changes in market prices of securities are not separately presented. Such changes are included in net realized and unrealized gains or losses from investments.
Participation notes
The Fund may invest in participation notes to gain exposure to securities in certain foreign markets. Participation notes are issued by banks or broker-dealers and are designed to offer a return linked to a particular underlying foreign security. Participation notes involve transaction costs, which may be higher than those applicable to the underlying foreign security. The holder of the participation note is entitled to receive from the bank or broker-dealer, an amount equal to the dividend paid by the issuer of the underlying foreign security; however, the holder is not entitled to the same rights (i.e. dividends, voting rights) as an owner of the underlying foreign security. Investments in participation notes involve risks beyond those normally associated with a direct investment in an underlying security. The Fund has no rights against the issuer of the underlying foreign security and participation notes expose the Fund to counterparty risk in the event the counterparty does not perform. There is also no assurance there will be a secondary trading market for the participation note or that the trading price of the participation note will equal the underlying value of the foreign security that it seeks to replicate.
Security loans
The Fund may lend its securities from time to time in order to earn additional income in the form of fees or interest on securities received as collateral or the investment of any cash received as collateral. The Fund continues to receive interest or dividends on the securities loaned. The Fund receives collateral in the form of cash or securities with a value at least equal to the value of the securities on loan. The value of the loaned securities is determined at the close of each business day and any additional required collateral is delivered to the Fund on the next business day. In a securities lending transaction, the net asset value of the Fund will be affected by an increase or decrease in the value of the securities loaned and by an increase or decrease in the value of the instrument in which collateral is invested. The amount of securities lending activity undertaken by the Fund fluctuates from time to time. In the event of default or bankruptcy by the borrower, the Fund may be prevented from recovering the loaned securities or gaining access to the collateral or may experience delays or costs in doing so. In addition, the investment of any cash collateral received may lose all or part of its value. The Fund has the right under the lending agreement to recover the securities from the borrower on demand.
The Fund lends its securities through an unaffiliated securities lending agent. Cash collateral received in connection with its securities lending transactions is invested in Securities Lending Cash Investments, LLC (the “Securities Lending Fund”). The Securities Lending Fund is exempt from registration under Section 3(c)(7) of the 1940 Act and is managed by Funds Management and is subadvised by Wells Capital Management Incorporated (“WellsCap”), an affiliate of Funds Management and an indirect wholly owned subsidiary of Wells Fargo & Company (“Wells Fargo”). Funds Management receives an advisory fee starting at 0.05% and declining to 0.01% as the average daily net assets of the Securities Lending Fund increase. All of the fees received by Funds Management are paid to WellsCap for its services as subadviser. The Securities Lending Fund seeks to provide a positive return compared to the daily Fed Funds Open Rate by investing in high-quality, U.S. dollar-denominated short-term money market instruments. Securities Lending Fund investments are valued at the evaluated bid price provided by an independent pricing service. Income earned from investment in the Securities Lending Fund is included in income from affiliated securities on the Statement of Operations.
Security transactions and income recognition
Securities transactions are recorded on a trade date basis. Realized gains or losses are recorded on the basis of identified cost.
Dividend income is recognized on the ex-dividend date, except for certain dividends from foreign securities, which are recorded as soon as the custodian verifies the ex-dividend date. Dividend income from foreign securities is recorded net of foreign taxes withheld where recovery of such taxes is not assured.
| | | | | | |
| Notes to financial statements | | Wells Fargo Asia Pacific Fund | | | 25 | |
Distributions to shareholders
Distributions to shareholders from net investment income and net realized gains, if any, are recorded on the ex-dividend date. Such distributions are determined in accordance with income tax regulations and may differ from U.S. generally accepted accounting principles. Dividend sources are estimated at the time of declaration. The tax character of distributions is determined as of the Fund’s fiscal year end. Therefore, a portion of the Fund’s distributions made prior to the Fund’s fiscal year end may be categorized as a tax return of capital.
Federal and other taxes
The Fund intends to continue to qualify as a regulated investment company by distributing substantially all of its investment company taxable income and any net realized capital gains (after reduction for capital loss carryforwards) sufficient to relieve it from all, or substantially all, federal income taxes. Accordingly, no provision for federal income taxes was required.
The Fund’s income and federal excise tax returns and all financial records supporting those returns for the prior three fiscal years are subject to examination by the federal and Delaware revenue authorities. Management has analyzed the Fund’s tax positions taken on federal, state, and foreign tax returns for all open tax years and does not believe that there are any uncertain tax positions that require recognition of a tax liability.
As of October 31, 2017, the aggregate cost of all investments for federal income tax purposes was $128,725,874 and the unrealized gains (losses) consisted of:
| | | | |
Gross unrealized gains | | $ | 37,896,801 | |
Gross unrealized losses | | | (1,792,402) | |
Net unrealized gains | | $ | 36,104,399 | |
Reclassifications are made to the Fund’s capital accounts for permanent tax differences to reflect income and gains available for distribution (or available capital loss carryforwards) under federal income tax regulations. U.S. generally accepted accounting principles require that certain components of net assets be adjusted to reflect permanent differences between financial and tax reporting. These reclassifications have no effect on net assets or net asset values per share. The primary permanent differences causing such reclassifications are due to expiration of capital loss carryforwards, foreign currency transactions, and passive foreign investment companies. At October 31, 2017, as a result of permanent book-to-tax differences, the following reclassification adjustments were made on the Statement of Assets and Liabilities:
| | | | |
| Paid-in capital | | Undistributed net
investment income | | Accumulated net
realized losses
on investments |
| $(80,817,205) | | $99,167 | | $80,718,038 |
As of October 31, 2017, the Fund had capital loss carryforwards which consist of $133,729 in long-term capital losses.
Class allocations
The separate classes of shares offered by the Fund differ principally in applicable sales charges, distribution, shareholder servicing, and administration fees. Class specific expenses are charged directly to that share class. Investment income, common expenses, and realized and unrealized gains (losses) on investments are allocated daily to each class of shares based on the relative proportion of net assets of each class.
3. FAIR VALUATION MEASUREMENTS
Fair value measurements of investments are determined within a framework that has established a fair value hierarchy based upon the various data inputs utilized in determining the value of the Fund’s investments. The three-level hierarchy gives the highest priority to unadjusted quoted prices in active markets for identical assets or liabilities (Level 1) and the lowest priority to unobservable inputs (Level 3). The Fund’s investments are classified within the fair value hierarchy based on the lowest level of input that is significant to the fair value measurement. The inputs are summarized into three broad levels as follows:
| ∎ | | Level 1 – quoted prices in active markets for identical securities |
| ∎ | | Level 2 – other significant observable inputs (including quoted prices for similar securities, interest rates, prepayment speeds, credit risk, etc.) |
| ∎ | | Level 3 – significant unobservable inputs (including the Fund’s own assumptions in determining the fair value of investments) |
| | | | |
| 26 | | Wells Fargo Asia Pacific Fund | | Notes to financial statements |
The inputs or methodologies used for valuing investments in securities are not necessarily an indication of the risk associated with investing in those securities.
The following is a summary of the inputs used in valuing the Fund’s assets and liabilities as of October 31, 2017:
| | | | | | | | | | | | | | | | |
| | | Quoted prices (Level 1) | | | Other significant
observable inputs
(Level 2) | | | Significant
unobservable inputs (Level 3) | | | Total | |
Assets | | | | | | | | | | | | | | | | |
Investments in: | | | | | | | | | | | | | | | | |
| | | | |
Common stocks | | | | | | | | | | | | | | | | |
Australia | | $ | 9,433,700 | | | $ | 0 | | | $ | 0 | | | $ | 9,433,700 | |
China | | | 35,328,444 | | | | 0 | | | | 0 | | | | 35,328,444 | |
Hong Kong | | | 3,228,607 | | | | 0 | | | | 0 | | | | 3,228,607 | |
India | | | 15,228,823 | | | | 117,371 | | | | 0 | | | | 15,346,194 | |
Indonesia | | | 2,166,328 | | | | 0 | | | | 0 | | | | 2,166,328 | |
Japan | | | 54,527,148 | | | | 0 | | | | 0 | | | | 54,527,148 | |
Malaysia | | | 2,194,369 | | | | 0 | | | | 0 | | | | 2,194,369 | |
Philippines | | | 1,831,777 | | | | 0 | | | | 0 | | | | 1,831,777 | |
Singapore | | | 1,612,364 | | | | 0 | | | | 0 | | | | 1,612,364 | |
South Korea | | | 7,957,622 | | | | 0 | | | | 0 | | | | 7,957,622 | |
Taiwan | | | 8,816,291 | | | | 0 | | | | 0 | | | | 8,816,291 | |
Thailand | | | 2,992,257 | | | | 0 | | | | 0 | | | | 2,992,257 | |
Vietnam | | | 880,220 | | | | 0 | | | | 0 | | | | 880,220 | |
| | | | |
Participation notes | | | | | | | | | | | | | | | | |
China | | | 0 | | | | 14,651,966 | | | | 0 | | | | 14,651,966 | |
| | | | |
Preferred stocks | | | | | | | | | | | | | | | | |
South Korea | | | 1,819,431 | | | | 0 | | | | 0 | | | | 1,819,431 | |
| | | | |
Short-term investments | | | | | | | | | | | | | | | | |
Investment companies | | | 1,050,305 | | | | 0 | | | | 0 | | | | 1,050,305 | |
Investments measured at net asset value* | | | | | | | | | | | | | | | 993,250 | |
Total assets | | $ | 149,067,686 | | | $ | 14,769,337 | | | $ | 0 | | | $ | 164,830,273 | |
| * | Investments that are measured at fair value using the net asset value per share (or its equivalent) as a practical expedient have not been categorized in the fair value hierarchy. The fair value amount presented in the table is intended to permit reconciliation of the fair value hierarchy to the amounts presented in the Statement of Assets and Liabilities. The Fund’s investment in Securities Lending Cash Investments, LLC valued at $993,250 does not have a redemption period notice, can be redeemed daily and does not have any unfunded commitments. |
The Fund recognizes transfers between levels within the fair value hierarchy at the end of the reporting period. At October 31, 2017, the Fund did not have any transfers into/out of Level 1, Level 2, or Level 3.
4. TRANSACTIONS WITH AFFILIATES AND OTHER EXPENSES
Management fee
Funds Management, an indirect wholly owned subsidiary of Wells Fargo, is the manager of the Fund and provides advisory and fund-level administrative services under an investment management agreement. Under the investment management agreement, Funds Management is responsible for, among other services, implementing the investment objectives and strategies of the Fund, supervising the subadviser, providing fund-level administrative services in connection with the Fund’s operations, and providing any other fund-level administrative services reasonably necessary for the operation of the Fund. As compensation for its services under the investment management agreement, Funds Management is entitled to receive an annual management fee starting at 1.00% and declining to 0.83% as the average daily net assets of the Fund increase. For the year ended October 31, 2017, the management fee was equivalent to an annual rate of 1.00% of the Fund’s average daily net assets.
Funds Management has retained the services of a subadviser to provide daily portfolio management to the Fund. The fee for subadvisory services is borne by Funds Management. WellsCap is the subadviser to the Fund and is entitled to receive a fee from Funds Management at an annual rate starting at 0.65% and declining to 0.45% as the average daily net assets of the Fund increase.
| | | | | | |
| Notes to financial statements | | Wells Fargo Asia Pacific Fund | | | 27 | |
Administration fees
Under a class-level administration agreement, Funds Management provides class-level administrative services to the Fund, which includes paying fees and expenses for services provided by the transfer agent, sub-transfer agents, omnibus account servicers and record-keepers. As compensation for its services under the class-level administration agreement, Funds Management receives an annual fee which is calculated based on the average daily net assets of each class as follows:
| | | | |
| | | Class-level
administration fee | |
Class A, Class C | | | 0.21 | % |
Administrator Class, Institutional Class | | | 0.13 | |
Funds Management has contractually waived and/or reimbursed management and administration fees to the extent necessary to maintain certain net operating expense ratios for the Fund. Waiver of fees and/or reimbursement of expenses by Funds Management were made first from fund level expenses on a proportionate basis and then from class specific expenses. Funds Management has committed through February 28, 2018 to waive fees and/or reimburse expenses to the extent necessary to cap the Fund’s expenses at 1.60% for Class A shares, 2.35% for Class C shares, 1.50% for Administrator Class shares, and 1.25% for Institutional Class shares. After this time, the cap may be increased or the commitment to maintain the cap may be terminated only with the approval of the Board of Trustees.
Out-of-pocket reimbursements
During the year ended October 31, 2017, State Street Bank and Trust Company (“State Street’), the Fund’s custodian, reimbursed the Fund $162 for certain out-of-pocket expenses that were billed to the Fund in error from 1998-2015. This amount is included in dividend income on the Statement of Operations. In addition, Funds Management was also reimbursed $14,925 by State Street for waivers/reimbursements it made to the Fund to limit Fund expenses during the period the Fund was erroneously billed.
Distribution fee
The Trust has adopted a distribution plan for Class C shares of the Fund pursuant to Rule 12b-1 under the 1940 Act. A distribution fee is charged to Class C shares and paid to Wells Fargo Funds Distributor, LLC (“Funds Distributor”), the principal underwriter, at an annual rate of 0.75% of the average daily net assets of Class C shares.
In addition, Funds Distributor is entitled to receive the front-end sales charge from the purchase of Class A shares and a contingent deferred sales charge on the redemption of certain Class A shares. Funds Distributor is also entitled to receive the contingent deferred sales charges from redemptions of Class C shares. For the year ended October 31, 2017, Funds Distributor received $203 from the sale of Class A shares and $18 in contingent deferred sales charges from redemptions of Class C shares. No contingent deferred sales charges were incurred by Class A for the year ended October 31, 2017.
Shareholder servicing fees
The Trust has entered into contracts with one or more shareholder servicing agents, whereby, Class A, Class C, and Administrator Class of the Fund are charged a fee at an annual rate of 0.25% of the average daily net assets of each respective class.
A portion of these total shareholder servicing fees were paid to affiliates of Wells Fargo.
Interfund transactions
The Fund may purchase or sell portfolio investment securities to certain other Wells Fargo affiliates pursuant to Rule 17a-7 under the 1940 Act and under procedures adopted by the Board of Trustees. The procedures have been designed to ensure that these interfund transactions, which do not incur broker commissions, are effected at current market prices.
5. INVESTMENT PORTFOLIO TRANSACTIONS
Purchases and sales of investments, excluding U.S. government obligations (if any) and short-term securities, for the year ended October 31, 2017 were $89,710,210 and $100,668,127, respectively.
6. BANK BORROWINGS
The Trust (excluding the money market funds and certain other funds) and Wells Fargo Variable Trust are parties to a $280,000,000 revolving credit agreement whereby the Fund is permitted to use bank borrowings for temporary or emergency purposes, such as to fund shareholder redemption requests. Interest under the credit agreement is charged to the Fund based on a borrowing rate equal to the higher of the Federal Funds rate in effect on that day plus 1.25% or the overnight LIBOR rate in effect on that day plus 1.25%. In addition, an annual commitment fee equal to 0.25% of the unused balance is allocated to each participating fund. Prior to August 29, 2017, the revolving credit agreement amount was $250,000,000.
| | | | |
| 28 | | Wells Fargo Asia Pacific Fund | | Notes to financial statements |
For the year ended October 31, 2017, there were no borrowings by the Fund under the agreement.
7. DISTRIBUTIONS TO SHAREHOLDERS
The tax character of distributions paid was $1,815,116 and $2,972,460 of ordinary income for the years ended October 31, 2017 and October 31, 2016, respectively.
As of October 31, 2017, the components of distributable earnings on a tax basis were as follows:
| | | | |
Undistributed
ordinary
income | | Unrealized
gains | | Capital loss
carryforward |
| $812,505 | | $36,102,259 | | $(133,729) |
8. CONCENTRATION RISK
Concentration risks result from exposure to a limited number of geographic regions. A fund that invest a substantial portion of their assets in any geographic region may be more affected by changes in that geographic region than would be a fund whose investments are not heavily weighted in any geographic region.
9. INDEMNIFICATION
Under the Trust’s organizational documents, the officers and Trustees have been granted certain indemnification rights against certain liabilities that may arise out of performance of their duties to the Trust. Additionally, in the normal course of business, the Trust may enter into contracts with service providers that contain a variety of indemnification clauses. The Trust’s maximum exposure under these arrangements is dependent on future claims that may be made against the Fund and, therefore, cannot be estimated.
| | | | | | |
| Report of independent registered public accounting firm | | Wells Fargo Asia Pacific Fund | | | 29 | |
BOARD OF TRUSTEES AND SHAREHOLDERS OF WELLS FARGO FUNDS TRUST:
We have audited the accompanying statement of assets and liabilities, including the portfolio of investments, of the Wells Fargo Asia Pacific Fund (the “Fund”), one of the funds constituting the Wells Fargo Funds Trust, as of October 31, 2017, and the related statements of operations for the year then ended, the statements of changes in net assets for each of the years in the two-year period then ended, and the financial highlights for each of the years in the five-year period then ended. These financial statements and financial highlights are the responsibility of the Fund’s management. Our responsibility is to express an opinion on these financial statements and financial highlights based on our audits.
We conducted our audits in accordance with the standards of the Public Company Accounting Oversight Board (United States). Those standards require that we plan and perform the audit to obtain reasonable assurance about whether the financial statements and financial highlights are free of material misstatement. An audit includes examining, on a test basis, evidence supporting the amounts and disclosures in the financial statements. Our procedures included confirmation of securities owned as of October 31, 2017, by correspondence with custodian and brokers, or by other appropriate audit procedures. An audit also includes assessing the accounting principles used and significant estimates made by management, as well as evaluating the overall financial statement presentation. We believe that our audits provide a reasonable basis for our opinion.
In our opinion, the financial statements and financial highlights referred to above present fairly, in all material respects, the financial position of the Wells Fargo Asia Pacific Fund as of October 31, 2017, the results of its operations for the year then ended, the changes in its net assets for each of the years in the two-year period then ended, and the financial highlights for each of the years in the five-year period then ended, in conformity with U.S. generally accepted accounting principles.

Boston, Massachusetts
December 21, 2017
| | | | |
| 30 | | Wells Fargo Asia Pacific Fund | | Other information (unaudited) |
TAX INFORMATION
Pursuant to Section 854 of the Internal Revenue Code, $1,815,116 of income dividends paid during the fiscal year ended October 31, 2017 has been designated as qualified dividend income (QDI).
Pursuant to Section 853 of the Internal Revenue Code, the Fund expects to designate amounts as foreign taxes paid for the fiscal year ended October 31, 2017. Additional details will be available in the semiannual report.
PROXY VOTING INFORMATION
A description of the policies and procedures that the Fund uses to determine how to vote proxies relating to portfolio securities is available, upon request, by calling 1-800-222-8222, visiting our website at wellsfargofunds.com, or visiting the SEC website at sec.gov. Information regarding how the Fund voted proxies relating to portfolio securities during the most recent 12-month period ended June 30 is available on the Fund’s website at wellsfargofunds.com or by visiting the SEC website at sec.gov.
PORTFOLIO HOLDINGS INFORMATION
The complete portfolio holdings for the Fund are publicly available monthly on the Fund’s website (wellsfargofunds.com), on a one-month delayed basis. In addition, top ten holdings information (excluding derivative positions) for the Fund is publicly available on the Fund’s website on a monthly, seven-day or more delayed basis. The Fund files its complete schedule of portfolio holdings with the SEC for the first and third quarters of each fiscal year on Form N-Q, which is available by visiting the SEC website at sec.gov. In addition, the Fund’s Form N-Q may be reviewed and copied at the SEC’s Public Reference Room in Washington, DC, and at regional offices in New York City, at 233 Broadway, and in Chicago, at 175 West Jackson Boulevard, Suite 900. Information about the Public Reference Room may be obtained by calling 1-800-SEC-0330.
| | | | | | |
| Other information (unaudited) | | Wells Fargo Asia Pacific Fund | | | 31 | |
BOARD OF TRUSTEES AND OFFICERS
Each of the Trustees and Officers1 listed in the table below acts in identical capacities for each fund in the Wells Fargo family of funds, which consists of 152 mutual funds comprising the Wells Fargo Funds Trust, Wells Fargo Variable Trust, Wells Fargo Master Trust and four closed-end funds (collectively the “Fund Complex”). This table should be read in conjunction with the Prospectus and the Statement of Additional Information2. The mailing address of each Trustee and Officer is 525 Market Street, 12th Floor, San Francisco, CA 94105. Each Trustee and Officer serves an indefinite term, however, each Trustee serves such term until reaching the mandatory retirement age established by the Trustees.
Independent Trustees
| | | | | | |
Name and year of birth | | Position held and length of service* | | Principal occupations during past five years or longer | | Current other public company or
investment company
directorships |
William R. Ebsworth (Born 1957) | | Trustee, since 2015 | | Retired. From 1984 to 2013, equities analyst, portfolio manager, research director and chief investment officer at Fidelity Management and Research Company in Boston, Tokyo, and Hong Kong, and retired in 2013 as Chief Investment Officer of Fidelity Strategic Advisers, Inc. where he led a team of investment professionals managing client assets. Prior thereto, Board member of Hong Kong Securities Clearing Co., Hong Kong Options Clearing Corp., the Thailand International Fund, Ltd., Fidelity Investments Life Insurance Company, and Empire Fidelity Investments Life Insurance Company. Board member of the Forté Foundation (non-profit organization) and the Vincent Memorial Hospital Endowment (non-profit organization), where he serves on the Investment Committee and as Chair of the Audit Committee. Mr. Ebsworth is a CFA® charterholder. | | Asset Allocation Trust |
Jane A. Freeman** (Born 1953) | | Trustee, since 2015;
Chair Liaison, effective 2018 | | Retired. From 2012 to 2014 and 1999 to 2008, Chief Financial Officer of Scientific Learning Corporation. From 2008 to 2012, Ms. Freeman provided consulting services related to strategic business projects. Prior to 1999, Portfolio Manager at Rockefeller & Co. and Scudder, Stevens & Clark. Board member of the Harding Loevner Funds from 1996 to 2014, serving as both Lead Independent Director and chair of the Audit Committee. Board member of the Russell Exchange Traded Funds Trust from 2011 to 2012 and the chair of the Audit Committee. Ms. Freeman is a Board Member of Ruth Bancroft Garden (non-profit organization) and an inactive chartered financial analyst. | | Asset Allocation Trust |
Peter G. Gordon*** (Born 1942) | | Trustee, from 1998 to 2017; Chairman, from 2005 to 2017 | | Co-Founder, Retired Chairman, President and CEO of Crystal Geyser Water Company. Trustee Emeritus, Colby College. | | Asset Allocation Trust |
Isaiah Harris, Jr. (Born 1952) | | Trustee, since 2009 | | Retired. Chairman of the Board of CIGNA Corporation since 2009, and Director since 2005. From 2003 to 2011, Director of Deluxe Corporation. Prior thereto, President and CEO of BellSouth Advertising and Publishing Corp. from 2005 to 2007, President and CEO of BellSouth Enterprises from 2004 to 2005 and President of BellSouth Consumer Services from 2000 to 2003. Emeritus member of the Iowa State University Foundation Board of Governors. Emeritus Member of the Advisory Board of Iowa State University School of Business. Advisory Board Member, Palm Harbor Academy (charter school). Advisory Board Member, Child Evangelism Fellowship (non-profit). Mr. Harris is a certified public accountant (inactive status). | | CIGNA Corporation; Asset Allocation Trust |
Judith M. Johnson (Born 1949) | | Trustee, since 2008; Audit Committee Chairman, since 2008 | | Retired. Prior thereto, Chief Executive Officer and Chief Investment Officer of Minneapolis Employees Retirement Fund from 1996 to 2008. Ms. Johnson is an attorney, certified public accountant and a certified managerial accountant. | | Asset Allocation Trust |
David F. Larcker (Born 1950) | | Trustee, since 2009 | | James Irvin Miller Professor of Accounting at the Graduate School of Business, Stanford University, Director of the Corporate Governance Research Initiative and Senior Faculty of The Rock Center for Corporate Governance since 2006. From 2005 to 2008, Professor of Accounting at the Graduate School of Business, Stanford University. Prior thereto, Ernst & Young Professor of Accounting at The Wharton School, University of Pennsylvania from 1985 to 2005. | | Asset Allocation Trust |
| | | | |
| 32 | | Wells Fargo Asia Pacific Fund | | Other information (unaudited) |
| | | | | | |
Name and year of birth | | Position held and length of service* | | Principal occupations during past five years or longer | | Current other public company or
investment company
directorships |
Olivia S. Mitchell**** (Born 1953) | | Trustee, since 2006; Governance Committee Chairman, effective 2018 | | International Foundation of Employee Benefit Plans Professor, Wharton School of the University of Pennsylvania since 1993. Director of Wharton’s Pension Research Council and Boettner Center on Pensions & Retirement Research, and Research Associate at the National Bureau of Economic Research. Previously, Cornell University Professor from 1978 to 1993. | | Asset Allocation Trust |
Timothy J. Penny***** (Born 1951) | | Trustee, since 1996; Chairman, effective 2018; Vice Chairman, from 2017 to 2018 | | President and Chief Executive Officer of Southern Minnesota Initiative Foundation, a non-profit organization, since 2007 and Senior Fellow at the Humphrey Institute Policy Forum at the University of Minnesota since 1995. Member of the Board of Trustees of NorthStar Education Finance, Inc., a non-profit organization, since 2007. | | Asset Allocation Trust |
James G. Polisson****** (Born 1959) | | Trustee, effective 2018; Advisory Board Member, from 2017 to 2018 | | Retired. Chief Marketing Officer, Source (ETF) UK Services, Ltd, from 2015 to 2017. From 2012 to 2015, Principal of The Polisson Group, LLC, a management consulting, corporate advisory and principal investing company. Chief Executive Officer and Managing Director at Russell Investments, Global Exchange Traded Funds from 2010 to 2012. Managing Director of Barclays Global Investors from 1998 to 2010 and Global Chief Marketing Officer for iShares and Barclays Global Investors from 2000 to 2010. Prior thereto, Vice President, Fidelity Retail Mutual Fund Group from 1996 to 1998 and Risk Management Practice Manager, Fidelity Consulting from 1995 to 1996. Board member of the Russell Exchange Traded Fund Trust from 2011 to 2012. Director of Barclays Global Investors Holdings Deutschland GmbH from 2006 to 2009. Mr. Polisson is an attorney and has a retired status with the Massachusetts and District of Columbia Bar Associations. | | Asset Allocation Trust |
Michael S. Scofield (Born 1943) | | Trustee, since 2010 | | Served on the Investment Company Institute’s Board of Governors and Executive Committee from 2008-2011 as well the Governing Council of the Independent Directors Council from 2006-2011 and the Independent Directors Council Executive Committee from 2008-2011. Trustee of the Evergreen Funds complex (and its predecessors) from 1984 to 2010. Chairman of the Evergreen Funds from 2000-2010. Former Trustee of the Mentor Funds. Retired Attorney, Law Offices of Michael S. Scofield. | | Asset Allocation Trust |
Pamela Wheelock****** (Born 1959) | | Trustee, effective 2018; Advisory Board Member, from 2017 to 2018 | | Chief Operating Officer, Twin Cities Habitat for Humanity, since January, 2017. Vice President of University Services, University of Minnesota from 2012 to 2017. Prior thereto, Interim President and Chief Executive Officer of Blue Cross Blue Shield of Minnesota from 2010 to 2011, Chairman of the Board from 2009 to 2011 and Board Director from 2003 to 2015. Vice President, Leadership and Community Engagement, Bush Foundation, Saint Paul, Minnesota (a private foundation) from 2009 to 2011. Executive Vice President and Chief Financial Officer, Minnesota Sports and Entertainment from 2004 to 2009 and Senior Vice President from 2002 to 2004. Commissioner of Finance, State of Minnesota, from 1999 to 2002. Currently on the Board of Directors, Governance Committee and Finance Committee, for the Minnesota Philanthropy Partners (Saint Paul Foundation) since 2012 and Board Chair of the Minnesota Wild Foundation since 2010. | | Asset Allocation Trust |
| * | Length of service dates reflect the Trustee’s commencement of service with the Trust’s predecessor entities, where applicable. |
| ** | Jane Freeman will become Chair Liaison effective January 1, 2018. |
| *** | Peter Gordon will retire on December 31, 2017. |
| **** | Olivia Mitchell will become Chairman of the Governance Committee effective January 1, 2018. |
| ***** | Timothy Penny will become Chairman effective January 1, 2018. |
| ****** | James Polisson and Pamela Wheelock each will become a Trustee effective January 1, 2018. |
| | | | | | |
| Other information (unaudited) | | Wells Fargo Asia Pacific Fund | | | 33 | |
Officers
| | | | | | |
Name and year of birth | | Position held and length of service | | Principal occupations during past five years or longer | | |
Andrew Owen (Born 1960) | | President, since 2017 | | Executive Vice President of Wells Fargo & Company and Head of Affiliated Managers, Wells Fargo Asset Management, since 2014. In addition, Mr. Owen is currently President, Chief Executive Officer and Director of Wells Fargo Funds Management, LLC since 2017. Prior thereto, Executive Vice President responsible for marketing, investments and product development for Wells Fargo Funds Management, LLC, from 2009 to 2014. | | |
Jeremy DePalma1 (Born 1974) | | Treasurer, since 2012 | | Senior Vice President of Wells Fargo Funds Management, LLC since 2009. Senior Vice President of Evergreen Investment Management Company, LLC from 2008 to 2010 and head of the Fund Reporting and Control Team within Fund Administration from 2005 to 2010. | | |
C. David Messman (Born 1960) | | Secretary, since 2000; Chief Legal Officer, since 2003 | | Senior Vice President and Secretary of Wells Fargo Funds Management, LLC since 2001. Assistant General Counsel of Wells Fargo Bank, N.A. since 2013 and Vice President and Managing Counsel of Wells Fargo Bank, N.A. from 1996 to 2013. | | |
Michael H. Whitaker (Born 1967) | | Chief Compliance Officer, since 2016 | | Senior Vice President and Chief Compliance Officer since 2016. Senior Vice President and Chief Compliance Officer for Fidelity Investments from 2007 to 2016. | | |
David Berardi (Born 1975) | | Assistant Treasurer, since 2009 | | Vice President of Wells Fargo Funds Management, LLC since 2009. Vice President of Evergreen Investment Management Company, LLC from 2008 to 2010. Manager of Fund Reporting and Control for Evergreen Investment Management Company, LLC from 2004 to 2010. | | |
| 1 | Jeremy DePalma acts as Treasurer of 76 funds and Assistant Treasurer of 76 funds in the Fund Complex. |
| 2 | The Statement of Additional Information includes additional information about the Trustees and is available, without charge, upon request, by calling 1-800-222-8222 or by visiting the website at wellsfargofunds.com. |
| | | | |
| 34 | | Wells Fargo Asia Pacific Fund | | Other information (unaudited) |
BOARD CONSIDERATION OF INVESTMENT MANAGEMENT AND SUB-ADVISORY AGREEMENTS:
Under the Investment Company Act of 1940 (the “1940 Act”), the Board of Trustees (the “Board”) of Wells Fargo Funds Trust (the “Trust”) must determine annually whether to approve the continuation of the Trust’s investment management and sub-advisory agreements. In this regard, at an in-person meeting held on May 16-17, 2017 (the “Meeting”), the Board, all the members of which have no direct or indirect interest in the investment management and sub-advisory agreements and are not “interested persons” of the Trust, as defined in the 1940 Act (the “Independent Trustees”), reviewed and approved for Wells Fargo Asia Pacific Fund (the “Fund”): (i) an investment management agreement (the “Management Agreement”) with Wells Fargo Funds Management, LLC (“Funds Management”); and (ii) an investment sub-advisory agreement (the “Sub-Advisory Agreement”) with Wells Capital Management Incorporated (the “Sub-Adviser”), an affiliate of Funds Management. The Management Agreement and the Sub-Advisory Agreement are collectively referred to as the “Advisory Agreements.”
At the Meeting, the Board considered the factors and reached the conclusions described below relating to the selection of Funds Management and the Sub-Adviser and the approval of the Advisory Agreements. Prior to the Meeting, including at an in-person meeting in April 2017, the Trustees conferred extensively among themselves and with representatives of Funds Management about these matters. Also, the Board has adopted a team-based approach, with each team consisting of a sub-set of Trustees, to assist the full Board in the discharge of its duties in reviewing performance and other matters throughout the year. The Independent Trustees were assisted in their evaluation of the Advisory Agreements by independent legal counsel, from whom they received separate legal advice and with whom they met separately.
In providing information to the Board, Funds Management and the Sub-Adviser were guided by a detailed set of requests for information submitted to them by independent legal counsel on behalf of the Independent Trustees at the start of the Board’s annual contract renewal process earlier in 2017. In considering and approving the Advisory Agreements, the Trustees considered the information they believed relevant, including but not limited to the information discussed below. The Board considered not only the specific information presented in connection with the Meeting, but also the knowledge gained over time through interaction with Funds Management and the Sub-Adviser about various topics. In this regard, the Board reviewed reports of Funds Management at each of its quarterly meetings, which included, among other things, portfolio reviews and performance reports. In addition, the Board and the teams mentioned above confer with portfolio managers at various times throughout the year. The Board did not identify any particular information or consideration that was all-important or controlling, and each individual Trustee may have attributed different weights to various factors.
After its deliberations, the Board unanimously approved the continuation of the Advisory Agreements for a one-year term and determined that the compensation payable to Funds Management and the Sub-Adviser under each of the Advisory Agreements was reasonable. The Board considered the approval of the Advisory Agreements for the Fund as part of its consideration of agreements for funds across the complex, but its approvals were made on a fund-by-fund basis. The following summarizes a number of important, but not necessarily all, factors considered by the Board in support of its approvals.
Nature, extent and quality of services
The Board received and considered various information regarding the nature, extent and quality of services provided to the Fund by Funds Management and the Sub-Adviser under the Advisory Agreements. This information included a description of the investment advisory services and Fund-level administrative services covered by the Management Agreement, as well as, among other things, a summary of the background and experience of senior management of Funds Management, a summary of certain organizational and personnel changes involving Funds Management and the Sub-Adviser, and a description of Funds Management’s and the Sub-Adviser’s business continuity planning programs and of their approaches to data privacy and cybersecurity. The Board also considered the qualifications, background, tenure and responsibilities of each of the portfolio managers primarily responsible for the day-to-day portfolio management of the Fund.
The Board evaluated the ability of Funds Management and the Sub-Adviser to attract and retain qualified investment professionals, including research, advisory and supervisory personnel. The Board further considered the compliance programs and compliance records of Funds Management and the Sub-Adviser. In addition, the Board took into account the full range of services provided to the Fund by Funds Management and its affiliates.
Fund performance and expenses
The Board considered the investment performance results for the Fund over various time periods ended December 31, 2016. In certain cases, the Board also considered more current results for various time periods ended
| | | | | | |
| Other information (unaudited) | | Wells Fargo Asia Pacific Fund | | | 35 | |
March 31, 2017. The Board considered these results in comparison to the performance of funds in a universe that was determined by Broadridge Inc. (“Broadridge”) to be similar to the Fund (the “Universe”), and in comparison to the Fund’s benchmark index and to other comparative data. Broadridge is an independent provider of investment company data. The Board received a description of the methodology used by Broadridge to select the mutual funds in the performance Universe. The Board noted that the performance of the Fund (Class A) was higher than the average performance of the Universe for the three- and five-year periods ended December 31, 2016, but lower than the average performance of the Universe for the one- and ten-year periods ended December 31, 2016. The Board also noted that the performance ranking of the Fund in the Universe had improved from the prior quarter-end for the five-year period ended March 31, 2017. The Board also noted that the performance of the Fund was higher than its benchmark, the MSCI All Country Asia Pacific Index (Net), for the three-, five- and ten-year periods ended December 31, 2016, but lower than its benchmark for the one-year period ended December 31, 2016.
The Board also received and considered information regarding the Fund’s net operating expense ratios and their various components, including actual management fees, custodian and other non-management fees, and Rule 12b-1 and non-Rule 12b-1 shareholder service fees. The Board considered these ratios in comparison to the median ratios of funds in class-specific expense groups that were determined by Broadridge to be similar to the Fund (the “Groups”). The Board received a description of the methodology used by Broadridge to select the mutual funds in the expense Groups and an explanation of how funds comprising expense groups and their expense ratios may vary from year-to-year. Based on the Broadridge reports, the Board noted that the net operating expense ratios of the Fund were lower than or equal to the median net operating expense ratios of the expense Groups for all share classes.
The Board took into account the Fund performance and expense information provided to it among the factors considered in deciding to re-approve the Advisory Agreements.
Investment management and sub-advisory fee rates
The Board reviewed and considered the contractual fee rates payable by the Fund to Funds Management under the Management Agreement, as well as the contractual fee rates payable by the Fund to Funds Management for class-level administrative services under a Class-Level Administration Agreement, which include, among other things, class-level transfer agency and sub-transfer agency costs (collectively, the “Management Rates”). The Board also reviewed and considered the contractual investment sub-advisory fee rates that are payable by Funds Management to the Sub-Adviser for investment sub-advisory services.
Among other information reviewed by the Board was a comparison of the Fund’s Management Rates with the average contractual investment management fee rates of funds in the expense Groups at a common asset level as well as transfer agency costs of the funds in the expense Groups. The Board noted that the Management Rates of the Fund were in range of the sum of these average rates for the expense Groups for the Fund’s Class A and Administrator Class, but higher than the sum of these average rates for the Fund’s Institutional Class. However, the Board noted that the net operating expense ratio of the Fund’s Institutional Class was equal to the median net operating expense ratio of its expense Group.
The Board also received and considered information about the portion of the total management fee that was retained by Funds Management after payment of the fee to the Sub-Adviser for sub-advisory services. In assessing the reasonableness of this amount, the Board received and evaluated information about the nature and extent of responsibilities retained and risks assumed by Funds Management and not delegated to or assumed by the Sub-Adviser, and about Funds Management’s on-going oversight services. Given the affiliation between Funds Management and the Sub-Adviser, the Board ascribed limited relevance to the allocation of fees between them.
The Board also received and considered information about the nature and extent of services offered and fee rates charged by Funds Management and the Sub-Adviser to other types of clients with investment strategies similar to those of the Fund. In this regard, the Board received information about the significantly greater scope of services, and compliance, reporting and other legal burdens and risks of managing mutual funds compared with those associated with managing assets of non-mutual fund clients such as institutional separate accounts.
Based on its consideration of the factors and information it deemed relevant, including those described here, the Board determined that the compensation payable to Funds Management under the Management Agreement and to the Sub-Adviser under the Sub-Advisory Agreement was reasonable.
Profitability
The Board received and considered information concerning the profitability of Funds Management, as well as the profitability of Wells Fargo as a whole, from providing services to the Fund and the fund family as a whole. The Board also
| | | | |
| 36 | | Wells Fargo Asia Pacific Fund | | Other information (unaudited) |
received and considered information concerning the profitability of the Sub-Adviser from providing services to the fund family as a whole, noting that the Sub-Adviser’s profitability information with respect to providing services to the Fund was subsumed in the Wells Fargo and Funds Management profitability analysis.
Funds Management reported on the methodologies and estimates used in calculating profitability, including a description of the methodology used to allocate certain expenses. Among other things, the Board noted that the levels of profitability reported on a fund-by-fund basis varied widely, depending on factors such as the size and type of fund. Based on its review, the Board did not deem the profits reported by Funds Management or Wells Fargo from its services to the Fund to be at a level that would prevent it from approving the continuation of the Advisory Agreements.
Economies of scale
With respect to possible economies of scale, the Board noted the existence of breakpoints in the Fund’s management fee structure, which operate generally to reduce the Fund’s expense ratios as the Fund grows in size. It considered that, for a small fund or a fund that shrinks in size, breakpoints conversely can result in higher fee levels. The Board also considered that in addition to management fee breakpoints, competitive management fee rates set at the outset without regard to breakpoints and fee waiver and expense reimbursement arrangements are means of sharing potential economies of scale with shareholders of the Fund. The Board considered Funds Management’s view, which Funds Management indicated was supported by independent third-party industry studies which were summarized for the Board, that any analyses of potential economies of scale in managing a particular fund are inherently limited in light of the joint and common costs and investments that Funds Management incurs across the fund family as a whole.
The Board concluded that the Fund’s fee and expense arrangements, including contractual breakpoints, constituted a reasonable approach to sharing potential economies of scale with the Fund and its shareholders.
Other benefits to Funds Management and the Sub-Adviser
The Board received and considered information regarding potential “fall-out” or ancillary benefits received by Funds Management and its affiliates, including the Sub-Adviser, as a result of their relationships with the Fund. Ancillary benefits could include, among others, benefits directly attributable to other relationships with the Fund and benefits potentially derived from an increase in Funds Management’s and the Sub-Adviser’s business as a result of their relationships with the Fund. The Board noted that various affiliates of Funds Management may receive distribution-related fees, shareholder servicing payments and sub-transfer agency fees in respect of shares sold or held through them and services provided.
The Board also reviewed information about soft dollar credits earned and utilized by the Sub-Adviser, fees earned by Funds Management and the Sub-Adviser from managing a private investment vehicle for the fund family’s securities lending collateral and commissions earned by an affiliated broker from portfolio transactions.
Based on its consideration of the factors and information it deemed relevant, including those described here, the Board did not find that any ancillary benefits received by Funds Management and its affiliates, including the Sub-Adviser, were unreasonable.
Conclusion
At the Meeting, after considering the above-described factors and based on its deliberations and its evaluation of the information described above, the Board unanimously approved the continuation of the Advisory Agreements for a one-year term and determined that the compensation payable to Funds Management and the Sub-Adviser under each of the Advisory Agreements was reasonable.
| | | | | | |
| List of abbreviations | | Wells Fargo Asia Pacific Fund | | | 37 | |
The following is a list of common abbreviations for terms and entities that may have appeared in this report.
| ACA | — ACA Financial Guaranty Corporation |
| ADR | — American depositary receipt |
| ADS | — American depositary shares |
| AGC | — Assured Guaranty Corporation |
| AGM | — Assured Guaranty Municipal |
| Ambac | — Ambac Financial Group Incorporated |
| AMT | — Alternative minimum tax |
| BAN | — Bond anticipation notes |
| BHAC | — Berkshire Hathaway Assurance Corporation |
| CAB | — Capital appreciation bond |
| CCAB | — Convertible capital appreciation bond |
| CDA | — Community Development Authority |
| CDO | — Collateralized debt obligation |
| CLO | — Collateralized loan obligation |
| DRIVER | — Derivative inverse tax-exempt receipts |
| DW&P | — Department of Water & Power |
| DWR | — Department of Water Resources |
| ECFA | — Educational & Cultural Facilities Authority |
| EDA | — Economic Development Authority |
| EDFA | — Economic Development Finance Authority |
| ETF | — Exchange-traded fund |
| FDIC | — Federal Deposit Insurance Corporation |
| FFCB | — Federal Farm Credit Banks |
| FGIC | — Financial Guaranty Insurance Corporation |
| FHA | — Federal Housing Administration |
| FHLB | — Federal Home Loan Bank |
| FHLMC | — Federal Home Loan Mortgage Corporation |
| FICO | — The Financing Corporation |
| FNMA | — Federal National Mortgage Association |
| GDR | — Global depositary receipt |
| GNMA | — Government National Mortgage Association |
| HCFR | — Healthcare facilities revenue |
| HEFA | — Health & Educational Facilities Authority |
| HEFAR | — Higher education facilities authority revenue |
| HFA | — Housing Finance Authority |
| HFFA | — Health Facilities Financing Authority |
| HUD | — Department of Housing and Urban Development |
| IDA | — Industrial Development Authority |
| IDAG | — Industrial Development Agency |
| KRW | — Republic of Korea won |
| LIBOR | — London Interbank Offered Rate |
| LIFER | — Long Inverse Floating Exempt Receipts |
| LLC | — Limited liability company |
| LLLP | — Limited liability limited partnership |
| LLP | — Limited liability partnership |
| MBIA | — Municipal Bond Insurance Association |
| MFHR | — Multifamily housing revenue |
| MSTR | — Municipal securities trust receipts |
| MUD | — Municipal Utility District |
| National | — National Public Finance Guarantee Corporation |
| PCFA | — Pollution Control Financing Authority |
| PCL | — Public Company Limited |
| PCR | — Pollution control revenue |
| PFA | — Public Finance Authority |
| PFFA | — Public Facilities Financing Authority |
| PFOTER | — Puttable floating option tax-exempt receipts |
| PJSC | — Public Joint Stock Company |
| plc | — Public limited company |
| PUTTER | — Puttable tax-exempt receipts |
| R&D | — Research & development |
| Radian | — Radian Asset Assurance |
| RAN | — Revenue anticipation notes |
| RDA | — Redevelopment Authority |
| RDFA | — Redevelopment Finance Authority |
| REIT | — Real estate investment trust |
| ROC | — Reset option certificates |
| SAVRS | — Select auction variable rate securities |
| SBA | — Small Business Authority |
| SDR | — Swedish depositary receipt |
| SFHR | — Single-family housing revenue |
| SFMR | — Single-family mortgage revenue |
| SPA | — Standby purchase agreement |
| SPDR | — Standard & Poor’s Depositary Receipts |
| SPEAR | — Short Puttable Exempt Adjustable Receipts |
| STRIPS | — Separate trading of registered interest and |
| TAN | — Tax anticipation notes |
| TIPS | — Treasury inflation-protected securities |
| TRAN | — Tax revenue anticipation notes |
| TTFA | — Transportation Trust Fund Authority |
| TVA | — Tennessee Valley Authority |
This page is intentionally left blank.
This page is intentionally left blank.
This page is intentionally left blank.

For more information
More information about Wells Fargo Funds is available free upon request. To obtain literature, please write, email, visit the Fund’s website, or call:
Wells Fargo Funds
P.O. Box 8266
Boston, MA 02266-8266
Email: fundservice@wellsfargo.com
Website: wellsfargofunds.com
Individual investors: 1-800-222-8222
Retail investment professionals: 1-888-877-9275
Institutional investment professionals: 1-866-765-0778
This report and the financial statements contained herein are submitted for the general information of the shareholders of the Fund. If this report is used for promotional purposes, distribution of the report must be accompanied or preceded by a current prospectus. Before investing, please consider the investment objectives, risks, charges, and expenses of the investment. For a current prospectus and, if available, a summary prospectus, containing this information, call 1-800-222-8222 or visit the Fund’s website at wellsfargofunds.com. Read the prospectus carefully before you invest or send money.
Wells Fargo Asset Management (WFAM) is a trade name used by the asset management businesses of Wells Fargo & Company. Wells Fargo Funds Management, LLC, a wholly owned subsidiary of Wells Fargo & Company, provides investment advisory and administrative services for Wells Fargo Funds. Other affiliates of Wells Fargo & Company provide subadvisory and other services for the funds. The funds are distributed by Wells Fargo Funds Distributor, LLC, Member FINRA, an affiliate of Wells Fargo & Company. Neither Wells Fargo Funds Distributor nor Wells Fargo Funds Management holds fund shareholder accounts or assets. This material is for general informational and educational purposes only and is NOT intended to provide investment advice or a recommendation of any kind—including a recommendation for any specific investment, strategy, or plan.
NOT FDIC INSURED ◾ NO BANK GUARANTEE ◾ MAY LOSE VALUE
© 2017 Wells Fargo Funds Management, LLC. All rights reserved.
| | |
 | | 307198 12-17 A236/AR236 10-17 |
Annual Report
October 31, 2017

Wells Fargo Diversified International Fund


Reduce clutter. Save trees.
Sign up for electronic delivery of prospectuses and shareholder reports at wellsfargo.com/advantagedelivery
Contents
The views expressed and any forward-looking statements are as of October 31, 2017, unless otherwise noted, and are those of the Fund managers and/or Wells Fargo Funds Management, LLC. Discussions of individual securities, or the markets generally, or any Wells Fargo Fund are not intended as individual recommendations. Future events or results may vary significantly from those expressed in any forward-looking statements. The views expressed are subject to change at any time in response to changing circumstances in the market. Wells Fargo Funds Management, LLC and the Fund disclaim any obligation to publicly update or revise any views expressed or forward-looking statements.
NOT FDIC INSURED ◾ NO BANK GUARANTEE ◾ MAY LOSE VALUE
| | | | |
| 2 | | Wells Fargo Diversified International Fund | | Letter to shareholders (unaudited) |

Andrew Owen
President
Wells Fargo Funds
Global stocks generally delivered double-digit results; bond markets had smaller but positive results as well.
Dear Shareholder:
We are pleased to offer you this annual report for the Wells Fargo Diversified International Fund for the 12-month period that ended October 31, 2017. Global stocks generally delivered double-digit results; bond markets had smaller but positive results as well. U.S. and international stocks performed similarly overall with returns of 23.63% and 23.64%, respectively, for the 12-month period, as measured by the S&P 500 Index1 and the MSCI ACWI ex USA Index (Net),2 respectively. Within fixed income, the Bloomberg Barclays U.S. Aggregate Bond Index3 returned 0.90% and the Bloomberg Barclays Municipal Bond Index4 returned 2.19% as interest rates rose from low levels.
Election results and central banks’ policies commanded investor attention as 2016 closed.
During the last two months of 2016, investors appeared intent on the prospective outcomes of elections in the U.S. and central-bank actions globally. Following Donald Trump’s election victory in November, U.S. stocks rallied. Investors appeared optimistic that the new administration would pursue progrowth policies. Favorable economic news supported stocks, and interest rates moved higher. At their mid-December meeting, U.S. Federal Reserve (Fed) officials raised the target interest rate by a quarter percentage point to a range of 0.50% to 0.75%. The fourth quarter also saw the implementation of the U.S. Securities and Exchange Commission’s amended rule for money market funds, which included the possibility of liquidity fees and redemption gates and, for institutional prime and municipal money market funds, floating net asset values (NAVs). Outside of the U.S., the prospects for faster U.S. growth appeared to trigger some acceleration in Europe.
Financial markets gained during the first two quarters of 2017 on positive economic data.
Stocks rallied globally through the first quarter of 2017, supported by signs of improvement in the U.S. and global economies. In the U.S., hiring remained strong, and business and consumer sentiment improved. In March, Fed officials raised their target interest rate by a quarter percentage point to a range of 0.75% to 1.00%. With the Fed’s target interest-rate increase, short-term bond yields rose during the quarter. Meanwhile, longer-term Treasury yields were little changed, leading to positive performance. Investment-grade and high-yield bonds benefited from strong demand. Municipal bond returns were positive in the quarter, helped by strong demand and constrained new-issue supply. Outside the U.S., stocks in emerging markets generally outperformed stocks in the U.S. and international developed markets because they benefited from both global economic growth and recent weakening of the U.S. dollar. Stocks in Asia, Europe, and Latin America also outperformed the U.S. market during the quarter.
| 1 | The S&P 500 Index consists of 500 stocks chosen for market size, liquidity, and industry group representation. It is a market-value-weighted index with each stock’s weight in the index proportionate to its market value. You cannot invest directly in an index. |
| 2 | The Morgan Stanley Capital International (MSCI) All Country World Index (ACWI) ex USA Index (Net) is a free-float-adjusted market-capitalization-weighted index that is designed to measure the equity market performance of developed markets, excluding the United States and Canada. Source: MSCI. MSCI makes no express or implied warranties or representations and shall have no liability whatsoever with respect to any MSCI data contained herein. The MSCI data may not be further redistributed or used as a basis for other indexes or any securities or financial products. This report is not approved, reviewed, or produced by MSCI. You cannot invest directly in an index. |
| 3 | The Bloomberg Barclays U.S. Aggregate Bond Index is a broad-based benchmark that measures the investment-grade, U.S. dollar-denominated, fixed-rate taxable bond market, including Treasuries, government-related and corporate securities, mortgage-backed securities (agency fixed-rate and hybrid adjustable-rate mortgage pass-throughs), asset-backed securities, and commercial mortgage-backed securities. You cannot invest directly in an index. |
| 4 | The Bloomberg Barclays Municipal Bond Index is an unmanaged index composed of long-term tax-exempt bonds with a minimum credit rating of Baa. You cannot invest directly in an index. |
| | | | | | |
| Letter to shareholders (unaudited) | | Wells Fargo Diversified International Fund | | | 3 | |
Globally, stocks marked continued gains through the second quarter of 2017. Steady, albeit modest, economic growth both in the U.S. and abroad and generally favorable corporate earnings announcements supported higher valuations. U.S. inflation trended lower despite a continued decline in the unemployment rate. Ten-year U.S. Treasury yields declined, resulting in stronger prices for long-term bonds. As was widely expected, Fed officials raised the target interest rate in June by a quarter percentage point to a range of 1.00% to 1.25%. In addition, the Fed indicated that it planned to start selling bonds that accumulated on its balance sheet during quantitative easing programs conducted since 2008.
As global growth improved in the third quarter of 2017, financial markets generally advanced.
Most stock markets worldwide moved higher during the quarter and ended the period at or near all-time highs. Moderate acceleration in global economic growth was supported by improving corporate earnings, low inflation pressure, and still-low interest rates. Corporate earnings reports were favorable overall as companies continued to benefit from healthy operating leverage. Global commodity prices climbed during the quarter. Oil prices rebounded, partly due to a better balance between supply and demand. While North Korea’s recent missile launches and nuclear testing raised serious concerns around the world, the heightened geopolitical risk had relatively minimal impact on the quarter’s stock returns. In the U.S., economic data released during the quarter reflected a generally healthy economy. Second-quarter economic output grew at a 3.1% annual rate, and consumers displayed more willingness to spend. Meanwhile, the Fed maintained the target range for the federal funds rate at 1.00% to 1.25%, noting that inflation had remained below the Fed’s 2.00% objective. Reflecting continued confidence in the U.S. economy, the Fed also stated the possibility of one more 0.25% increase in the federal funds rate by the end of 2017 and announced plans to begin the process of unwinding its $4.5 trillion portfolio of bonds and other assets in October. Outside the U.S., stocks in the Asia Pacific region benefited from solid earnings reports and investors’ willingness to take on risk despite the rising tensions between North Korea and the U.S. In Europe, markets were supported by better-than-expected economic growth, which has led to narrowing of the gap between Europe’s growth rate and that of the U.S. In emerging markets, many countries benefited from stronger currencies versus the U.S. dollar. Also, commodity prices were on an upward trajectory, which benefited many companies that rely on natural resources for exports.
Positive economic and market news continued into October.
October proved to be a strong month for U.S. stocks. The S&P 500 Index delivered 11 record closes amid rising consumer confidence and signs the economy was continuing to gain momentum, including news in late October that economic output was estimated to have grown at a 3.0% annual rate in the third quarter. At its October meeting, the Fed, in a unanimous vote, left short-term interest rates unchanged but signaled it could make another rate increase before the end of 2017 if the economy remains on track. The Fed also began the process of unwinding its quantitative easing program. Outside the U.S., international stocks generally delivered positive results in October as global economic growth continued to strengthen.
| | | | |
| 4 | | Wells Fargo Diversified International Fund | | Letter to shareholders (unaudited) |
Don’t let short-term uncertainty derail long-term investment goals.
Periods of investment uncertainty can present challenges, but experience has taught us that maintaining long-term investment goals can be an effective way to plan for the future. To help you create a sound strategy based on your personal goals and risk tolerance, Wells Fargo Funds offers more than 100 mutual funds spanning a wide range of asset classes and investment styles. Although diversification cannot guarantee an investment profit or prevent losses, we believe it can be an effective way to manage investment risk and potentially smooth out overall portfolio performance. We encourage investors to know their investments and to understand that appropriate levels of risk-taking may unlock opportunities.
Thank you for choosing to invest with Wells Fargo Funds. We appreciate your confidence in us and remain committed to helping you meet your financial needs.
Sincerely,

Andrew Owen
President
Wells Fargo Funds
Although diversification cannot guarantee an investment profit or prevent losses, we believe it can be an effective way to manage investment risk and potentially smooth out overall portfolio performance.
For further information about your Fund, contact your investment professional, visit our website at wellsfargofunds.com, or call us directly at 1-800-222-8222. We are available 24 hours a day, 7 days a week.
This page is intentionally left blank.
| | | | |
| 6 | | Wells Fargo Diversified International Fund | | Performance highlights (unaudited) |
Investment objective
The Fund seeks long-term capital appreciation.
Manager
Wells Fargo Funds Management, LLC
Subadvisers
Artisan Partners Limited Partnership
LSV Asset Management
Wells Capital Management Incorporated
Portfolio managers
Josef Lakonishok, Ph.D.
Venkateshwar Lal‡
Puneet Mansharamani, CFA®
Menno Vermeulen, CFA®
Dale A. Winner, CFA®
Mark L. Yockey, CFA®
Average annual total returns (%) as of October 31, 20171
| | | | | | | | | | | | | | | | | | | | | | | | | | | | | | | | | | |
| | | | | Including sales charge | | | Excluding sales charge | | | Expense ratios2 (%) | |
| | | Inception date | | 1 year | | | 5 year | | | 10 year | | | 1 year | | | 5 year | | | 10 year | | | Gross | | | Net3 | |
| Class A (SILAX) | | 9-24-1997 | | | 16.14 | | | | 6.90 | | | | (0.10 | ) | | | 23.27 | | | | 8.18 | | | | 0.50 | | | | 1.75 | | | | 1.36 | |
| Class C (WFECX) | | 4-1-1998 | | | 21.51 | | | | 7.39 | | | | (0.23 | ) | | | 22.51 | | | | 7.39 | | | | (0.23 | ) | | | 2.50 | | | | 2.11 | |
| Class R* (WDIHX) | | 9-30-2015 | | | – | | | | – | | | | – | | | | 22.97 | | | | 7.95 | | | | 0.31 | | | | 2.00 | | | | 1.61 | |
| Class R6 (WDIRX) | | 9-30-2015 | | | – | | | | – | | | | – | | | | 23.88 | | | | 8.49 | | | | 0.74 | | | | 1.32 | | | | 0.90 | |
| Administrator Class (WFIEX) | | 11-8-1999 | | | – | | | | – | | | | – | | | | 23.46 | | | | 8.34 | | | | 0.67 | | | | 1.67 | | | | 1.26 | |
| Institutional Class (WFISX) | | 8-31-2006 | | | – | | | | – | | | | – | | | | 23.91 | | | | 8.64 | | | | 0.88 | | | | 1.42 | | | | 1.00 | |
| MSCI EAFE Index (Net)4 | | – | | | – | | | | – | | | | – | | | | 23.44 | | | | 8.53 | | | | 1.10 | | | | – | | | | – | |
| * | | Effective at the close of business on November 13, 2017, Class R shares were liquidated and the class was subsequently closed. Class R shares are no longer offered by the Fund. |
Figures quoted represent past performance, which is no guarantee of future results, and do not reflect taxes that a shareholder may pay on fund distributions or the redemption of fund shares. Investment return and principal value of an investment will fluctuate so that an investor’s shares, when redeemed, may be worth more or less than their original cost. Performance shown without sales charges would be lower if sales charges were reflected. Current performance may be lower or higher than the performance data quoted, which assumes the reinvestment of dividends and capital gains. Current month-end performance is available on the Fund’s website, wellsfargofunds.com.
Index returns do not include transaction costs associated with buying and selling securities, any mutual fund fees or expenses, or any taxes. It is not possible to invest directly in an index.
For Class A shares, the maximum front-end sales charge is 5.75%. For Class C shares, the maximum contingent deferred sales charge is 1.00%. Performance including a contingent deferred sales charge assumes the sales charge for the corresponding time period. Class R, Class R6, Administrator Class, and Institutional Class shares are sold without a front-end sales charge or contingent deferred sales charge.
Stock values fluctuate in response to the activities of individual companies and general market and economic conditions. Foreign investments are especially volatile and can rise or fall dramatically due to differences in the political and economic conditions of the host country. These risks are generally intensified in emerging markets. The use of derivatives may reduce returns and/or increase volatility. Certain investment strategies tend to increase the total risk of an investment (relative to the broader market). The Fund is exposed to smaller-company securities risk. Consult the Fund’s prospectus for additional information on these and other risks.
Please see footnotes on page 7.
| | | | | | |
| Performance highlights (unaudited) | | Wells Fargo Diversified International Fund | | | 7 | |
|
| Growth of $10,000 investment as of October 31, 20175 |
|
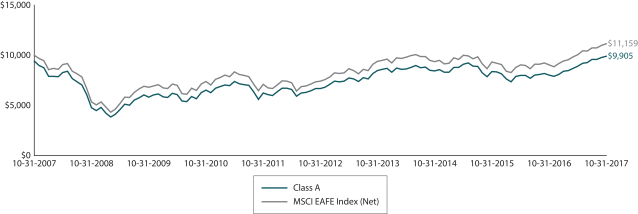 |
| ‡ | Mr. Lal became a portfolio manager of the Fund on June 30, 2017. |
| 1 | Historical performance shown for the Class R shares prior to their inception reflects the performance of the Administrator Class shares, adjusted to reflect the higher expenses applicable to Class R shares. Historical performance shown for the Class R6 shares prior to their inception reflects the performance of the Administrator Class shares, and includes the higher expenses applicable to Administrator Class shares. If these expenses had not been included, returns for Class R6 shares would be higher. |
| 2 | Reflects the expense ratios as stated in the most recent prospectuses, which include the impact of 0.01% in acquired fund fees and expenses. The expense ratios shown are subject to change and may differ from the annualized expense ratios shown in the financial highlights of this report, which do not include acquired fund fees and expenses. |
| 3 | The manager has contractually committed through February 28, 2018, to waive fees and/or reimburse expenses to the extent necessary to cap the Fund’s Total Annual Operating Expenses After Fee Waivers at 1.35% for Class A, 2.10% for Class C, 1.60% for Class R, 0.89% for Class R6, 1.25% for Administrator Class, and 0.99% Institutional Class. After this time, the cap may be increased or the commitment to maintain the cap may be terminated only with the approval of the Board of Trustees. Brokerage commissions, stamp duty fees, interest, taxes, acquired fund fees and expenses, and extraordinary expenses are excluded from the expense cap. Without this cap, the Fund’s returns would have been lower. The expense ratio paid by an investor is the net expense ratio or the Fund’s Total Annual Fund Operating Expenses After Fee Waivers, as stated in the prospectuses. |
| 4 | The Morgan Stanley Capital International (MSCI) Europe, Australasia, and Far East (EAFE) Index (Net) is a free-float-adjusted market-capitalization weighted index that is designed to measure the equity market performance of developed markets, excluding the United States and Canada. The MSCI EAFE Index (Net) consists of the following 21 developed markets country indexes: Australia, Austria, Belgium, Denmark, Finland, France, Germany, Hong Kong, Ireland, Israel, Italy, Japan, the Netherlands, New Zealand, Norway, Portugal, Singapore, Spain, Sweden, Switzerland, and the United Kingdom. Source: MSCI. MSCI makes no express or implied warranties or representations and shall have no liability whatsoever with respect to any MSCI data contained herein. The MSCI data may not be further redistributed or used as a basis for other indexes or any securities or financial products. This report is not approved, reviewed, or produced by MSCI. You cannot invest directly in an index. |
| 5 | The chart compares the performance of Class A shares for the most recent ten years with the MSCI EAFE Index (Net). The chart assumes a hypothetical investment of $10,000 in Class A shares and reflects all operating expenses and assumes the maximum initial sales charge of 5.75%. |
| 6 | The MSCI EAFE Value Index is a free-float-adjusted market-capitalization-weighted index that is designed to measure the equity market performance of value securities within developed equity markets, excluding the United States and Canada. The MSCI EAFE Value Index consists of the following 21 developed markets country indexes: Australia, Austria, Belgium, Denmark, Finland, France, Germany, Hong Kong, Ireland, Israel, Italy, Japan, the Netherlands, New Zealand, Norway, Portugal, Singapore, Spain, Sweden, Switzerland, and the United Kingdom. You cannot invest directly in an index. |
| 7 | The MSCI EAFE Growth Index is a free-float-adjusted market-capitalization-weighted index that is designed to measure the equity market performance of growth securities within developed equity markets, excluding the United States and Canada. The MSCI EAFE Growth Index consists of the following 21 developed markets country indexes: Australia, Austria, Belgium, Denmark, Finland, France, Germany, Hong Kong, Ireland, Israel, Italy, Japan, the Netherlands, New Zealand, Norway, Portugal, Singapore, Spain, Sweden, Switzerland, and the United Kingdom. You cannot invest directly in an index. |
| 8 | The ten largest holdings, excluding cash and cash equivalents, are calculated based on the value of the investments divided by total net assets of the Fund. Holdings are subject to change and may have changed since the date specified. |
| 9 | Amounts are calculated based on the total long-term investments of the Fund. These amounts are subject to change and may have changed since the date specified. |
| 10 | Current target allocation includes the effect of any tactical futures overlay that may be in place. These amounts are subject to change and may have changed since the date specified. |
| * | This security was no longer held at the end of the reporting period. |
| | | | |
| 8 | | Wells Fargo Diversified International Fund | | Performance highlights (unaudited) |
MANAGERS’ DISCUSSION
Fund highlights
| ∎ | | The Fund (Class A, excluding sales charges) underperformed its benchmark, the MSCI EAFE Index (Net), for the 12-month period that ended October 31, 2017. |
| ∎ | | Value stocks slightly underperformed growth stocks during the reporting period, creating a more challenging investment climate for two of the three subadvisors—LSV Asset Management (LSV) and Wells Capital Management Incorporated (WellsCap), although both subadvisors posted favorable results. Artisan Partners Limited Partnership trailed the benchmark during the period. |
| ∎ | | All three teams continued to execute their disciplined investment approaches, and all continued to find what they believed were attractive investment candidates in the current market environment. |
Developed international equity markets posted strong returns for the 12-month period that ended October 31, 2017, as the MSCI EAFE Index (Net) returned 23.4% in U.S. dollar terms. While there was very little difference between the performance of value and growth stocks over the trailing 12 months, with returns of 23.2% and 23.6%, respectively, the MSCI EAFE Value Index6 slightly trailed the MSCI EAFE Growth Index7 during the period.
International equity markets were supported by good economic data and strong corporate earnings. Global monetary policy remained accommodative, also helping boost equities. Information technology (IT) stocks led the market, returning nearly 40%. This past year’s market performance was underpinned by signs of a synchronized economic recovery in developed and international economies. In late August, the Organisation for Economic Co-operation and Development (OECD) announced that each of the 45 countries whose economies the OECD tracks were on target to grow this year, a rare coincident recovery that has been evident in only three prior periods of time in the past 50 years. In addition, during the past quarter, Brent crude-oil prices appreciated approximately 30% from their second-quarter lows, reflecting some stabilization in a key commodity market metric that had registered a disinflationary shock to commodity-dependent economies and overall reflationary sentiment among global investors as oil had depreciated by more than 60% during its mid-2014 to early-2016 descent.
| | | | |
| Ten largest holdings (%) as of October 31, 20178 | |
Allianz AG | | | 1.78 | |
Alibaba Group Holding Limited ADR | | | 1.49 | |
Linde AG | | | 1.49 | |
ING Groep NV | | | 1.48 | |
Deutsche Boerse AG | | | 1.47 | |
UniCredit SpA | | | 1.46 | |
Den Norske Bank ASA | | | 1.44 | |
Siemens AG | | | 1.30 | |
Bayer AG | | | 1.28 | |
Hitachi Limited | | | 1.26 | |
WellsCap
WellsCap maintains a blend equity style that emphasizes bottom-up stock selection based on rigorous, in-depth fundamental company research and incorporates consideration of top-down factors and developments as they affect market and economic activity within regions, countries, and sectors.
Based on fundamental stock picking, the Fund’s strategy continues to have notable concentrated exposures, led by positions in the financial services (insurers and diversified financials), industrials (self-help cyclicals with catalysts for progress), and telecommunication services (developed markets and especially emerging markets) sectors as top sector weights in several developed and emerging markets.
From a currency perspective, the Fund had limited currency hedges in place as the period closed, consisting of partial hedges of British sterling stock exposures and minor remaining hedges of euro-denominated positions.
Underperforming holdings over the course of last year, included selections in the consumer and commodities-related sectors. Consumer stocks accounted for sector weakness in parts of Asia (Coca-Cola Bottlers Japan*, Xtep International*, and Xinyi Glass Holdings Limited), Europe (METRO AG and Reckitt Benckiser Group plc*), and Latin America (JBS S.A.). A smaller position weight in particular—JBS—suffered earlier in the year as it became embroiled in controversy surrounding Brazil’s political leadership; we exited that holding in the second quarter. Stocks in commodity-related sectors also underperformed, including energy holdings (Frontline Securities Limited*, a Norwegian shipper, and Cosan S.A., a Brazilian ethanol producer) and energy stocks (Sasol Limited).
Please see footnotes on page 7.
| | | | | | |
| Performance highlights (unaudited) | | Wells Fargo Diversified International Fund | | | 9 | |
Losses from holdings in lagging contribution countries included the following: Brazil (JBS S.A.), South Africa (Sasol Limited, a South African integrated oil firm), Denmark (Novo Nordisk A/S), Hong Kong (Xinyi Solar Holdings Limited, Xtep International Holdings Limited, China Mobile Limited), and Italy (UniCredit S.p.A.).
Absolute and relative performance was driven by strong position gains across Europe, Asia, and the Americas. Top positive international country performance contributors included Germany (Rheinmetall AG, Bayer AG, Siemens AG), the U.K. (Man Group plc, Smiths Group plc), Japan (Hitachi, Limited; Mitsubishi UFJ Financial Group, Incorporated; Nomura Holdings, Incorporated), the Netherlands (NN Group N.V., Koninklijke Philips N.V.), South Korea (SK Telecom Company, Limited; Hana Financial Group, Incorporated), Canada (Lundin Mining Corporation), and China (Kweichow Moutai Company, Limited).
|
| Sector distribution as of October 31, 20179 |
|
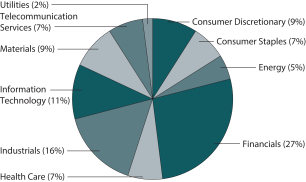
|
The year’s sector performance reflected strong stock selection across several sectors. The financial services sector overweight had a number of top performers, ranging from asset managers (Man Group) to diversified financials (Hana Financial, Mitsubishi UFJ, and Nomura), insurers (NN Group and Zurich Insurance Group Limited), and banks (CIMB Group Holdings Berhad and DnB ASA*). DnB, a bank domiciled in oil-sensitive Norway and the Fund’s largest average position weight last quarter, delivered strong results, both from its self-help cost-cutting as well as from the underlying recovery in its cyclically sensitive, commodity-loan exposures. Industrials sector performers included a number of self-help restructuring companies, such as Compagnie de
Saint-Gobain S.A., Rheinmetall, Siemens, and Sensata Technologies Holding N.V. As a new 2017 holding, Sensata appreciated after deleveraging its balance sheet and digesting two acquisitions accretive to earnings. In the health care sector, both Bayer and Philips were positive performers; in the case of Philips, the company’s ongoing transformation from a diversified industrial to a medical technology company has progressed with material earnings improvements.
Artisan Partners
Artisan Partners invests in what the team considers to be dominant, high-quality companies that are exposed to positive secular growth trends or themes at reasonable valuations.
The Artisan portion of the Fund performed in line with, although slightly lower, than the MSCI EAFE Index (Net) during the period. The Fund’s above-benchmark weighting in the consumer staples sector was a relative headwind, whereas an above-benchmark exposure to the IT sector was beneficial. Stock selection was particularly strong in the IT sector, but this was offset by relative weakness in the consumer staples, telecommunication services, and consumer discretionary sectors.
The largest individual detractors included Japan Tobacco Incorporated and Medtronic plc. Sales volumes for Japan Tobacco, a leading international tobacco company, have been pressured by shifting consumption patterns away from traditional cigarettes toward potentially less-harmful nicotine alternatives, such as electronic cigarettes and vaporizers. Medtronic, a medical devices company, experienced an IT system disruption during the week of June 19, causing delays to customer orders and fulfillment. The issue was fixed, but some sales were pushed into the following quarter. We believe this is a temporary issue.
The Fund’s top individual contributors included Wirecard AG, a global payments processing company; Alibaba Group Holding Limited, China’s largest e-commerce company; and Allianz SE, a diversified insurance and asset management services company. Wirecard is benefiting from structural growth in online payments and the convergence of online and offline payments, evidenced by strong gains in transactions volume. Alibaba is experiencing strong organic growth in its core e-commerce business, driven by user growth and improving user engagement. Allianz’s execution across business lines has been solid, highlighted by better-than-expected underwriting results in the property and casualty insurance business and strong inflows at its U.S.-based asset management subsidiary, PIMCO.
Please see footnotes on page 7.
| | | | |
| 10 | | Wells Fargo Diversified International Fund | | Performance highlights (unaudited) |
The general economic backdrop continues to remain supportive of equities. Broadening economic growth across geographies and higher inflation have pushed up bond yields and positioned central banks to normalize monetary policy after nearly a decade of extraordinary accommodation following the financial crisis. As always, we will maintain our focus on sustainable growth, placing a high amount of conviction behind companies we believe offer sustainable competitive advantages, strong management teams, and reasonable valuations.
LSV
LSV seeks to add value through a quantitative selection process that favors deep-value stocks.
Defensive sectors of the market lagged, particularly telecommunication services, real estate, and health care. Cyclical sectors including materials, industrials, and financials performed well. Our overweight to financials, a sector where we find attractive stocks, had a positive impact on results, as did our underweight to real estate, which lagged.
Poor stock selection in the consumer staples and health care sectors detracted from performance. Detractors included Skyworth Digital Holdings Limited, JBS S.A., Teva Pharmaceutical Industries Limited, Carillion plc, and Koninklijke Ahold Delhaize N.V. Stock selection contributed to the outperformance, particularly in the energy, materials, and consumer discretionary sectors. Notable contributors in the period included Mitsubishi Gas Chemical Company, Incorporated, and Denka Company Limited in the materials sector; OMV AG and Thai Oil PCL in the energy sector; and Calsonic Kansei Corporation and U.K. homebuilders Redrow plc, The Berkeley Group Holdings plc, and Barratt Developments PLC in the consumer discretionary sector.
Changes to the Fund tend to be gradual given our low turnover strategy. Over the past 12 months, we reduced the exposure to consumer staples and health care and increased the exposure to consumer discretionary and materials stocks. The LSV portion of the Fund is overweight the financials and consumer discretionary sectors and is underweight consumer staples, IT, health care, and real estate. Portfolio valuations in the LSV portion of the Fund remain attractive. We calculate that the LSV portion of the Fund is trading at less than 12 times forward earnings estimates and below 7 times cash flow, both significant discounts to the overall market.
|
| Country allocation as of October 31, 201710 |
|
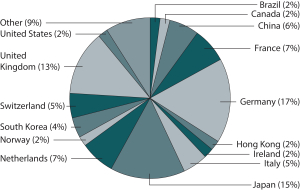 |
Please see footnotes on page 7.
| | | | | | |
| Fund expenses (unaudited) | | Wells Fargo Diversified International Fund | | | 11 | |
As a shareholder of the Fund, you incur two types of costs: (1) transaction costs, including sales charges (loads) on purchase payments and contingent deferred sales charges (if any) on redemptions and (2) ongoing costs, including management fees, distribution (12b-1) and/or shareholder servicing fees, and other Fund expenses. This example is intended to help you understand your ongoing costs (in dollars) of investing in the Fund and to compare these costs with the ongoing costs of investing in other mutual funds.
The example is based on an investment of $1,000 invested at the beginning of the six-month period and held for the entire period from May 1, 2017 to October 31, 2017.
Actual expenses
The “Actual” line of the table below provides information about actual account values and actual expenses. You may use the information in this line, together with the amount you invested, to estimate the expenses that you paid over the period. Simply divide your account value by $1,000 (for example, an $8,600 account value divided by $1,000 = 8.6), then multiply the result by the number in the “Actual” line under the heading entitled “Expenses paid during period” for your applicable class of shares to estimate the expenses you paid on your account during this period.
Hypothetical example for comparison purposes
The “Hypothetical” line of the table below provides information about hypothetical account values and hypothetical expenses based on the Fund’s actual expense ratio and an assumed rate of return of 5% per year before expenses, which is not the Fund’s actual return. The hypothetical account values and expenses may not be used to estimate the actual ending account balance or expenses you paid for the period. You may use this information to compare the ongoing costs of investing in the Fund and other funds. To do so, compare this 5% hypothetical example with the 5% hypothetical examples that appear in the shareholder reports of the other funds.
Please note that the expenses shown in the table are meant to highlight your ongoing costs only and do not reflect any transactional costs, such as sales charges (loads) and contingent deferred sales charges. Therefore, the “Hypothetical” line of the table is useful in comparing ongoing costs only and will not help you determine the relative total costs of owning different funds. In addition, if these transactional costs were included, your costs would have been higher.
| | | | | | | | | | | | | | | | |
| | | Beginning
account value
5-1-2017 | | | Ending
account value
10-31-2017 | | | Expenses
paid during
the period¹ | | | Annualized net
expense ratio | |
Class A | | | | | | | | | | | | | | | | |
Actual | | $ | 1,000.00 | | | $ | 1,112.13 | | | $ | 7.19 | | | | 1.35 | % |
Hypothetical (5% return before expenses) | | $ | 1,000.00 | | | $ | 1,018.40 | | | $ | 6.87 | | | | 1.35 | % |
Class C | | | | | | | | | | | | | | | | |
Actual | | $ | 1,000.00 | | | $ | 1,108.30 | | | $ | 11.16 | | | | 2.10 | % |
Hypothetical (5% return before expenses) | | $ | 1,000.00 | | | $ | 1,014.62 | | | $ | 10.66 | | | | 2.10 | % |
Class R | | | | | | | | | | | | | | | | |
Actual | | $ | 1,000.00 | | | $ | 1,110.20 | | | $ | 8.51 | | | | 1.60 | % |
Hypothetical (5% return before expenses) | | $ | 1,000.00 | | | $ | 1,017.14 | | | $ | 8.14 | | | | 1.60 | % |
Class R6 | | | | | | | | | | | | | | | | |
Actual | | $ | 1,000.00 | | | $ | 1,113.73 | | | $ | 4.74 | | | | 0.89 | % |
Hypothetical (5% return before expenses) | | $ | 1,000.00 | | | $ | 1,020.72 | | | $ | 4.53 | | | | 0.89 | % |
Administrator Class | | | | | | | | | | | | | | | | |
Actual | | $ | 1,000.00 | | | $ | 1,112.56 | | | $ | 6.66 | | | | 1.25 | % |
Hypothetical (5% return before expenses) | | $ | 1,000.00 | | | $ | 1,018.90 | | | $ | 6.36 | | | | 1.25 | % |
Institutional Class | | | | | | | | | | | | | | | | |
Actual | | $ | 1,000.00 | | | $ | 1,115.55 | | | $ | 5.28 | | | | 0.99 | % |
Hypothetical (5% return before expenses) | | $ | 1,000.00 | | | $ | 1,020.21 | | | $ | 5.04 | | | | 0.99 | % |
| 1 | Expenses paid is equal to the annualized net expense ratio of each class multiplied by the average account value over the period, multiplied by the number of days in the most recent fiscal half-year divided by the number of days in the fiscal year (to reflect the one-half-year period). |
| | | | |
| 12 | | Wells Fargo Diversified International Fund | | Portfolio of investments—October 31, 2017 |
| | | | | | | | | | | | | | | | |
| Security name | | | | | | | | Shares | | | Value | |
| | | | |
Common Stocks: 95.53% | | | | | | | | | | | | | | | | |
| | | | |
| Australia: 1.38% | | | | | | | | | | | | | | | | |
Arrium Limited (Materials, Metals & Mining) †(a) | | | | | | | | | | | 397,400 | | | $ | 0 | |
Asaleo Care Limited (Consumer Staples, Personal Products) | | | | | | | | | | | 114,700 | | | | 129,923 | |
Automotive Holdings Group Limited (Consumer Discretionary, Specialty Retail) | | | | | | | | | | | 29,300 | | | | 72,656 | |
Bendigo Bank Limited (Financials, Banks) | | | | | | | | | | | 26,100 | | | | 227,323 | |
CSR Limited (Materials, Construction Materials) | | | | | | | | | | | 59,900 | | | | 217,303 | |
Downer EDI Limited (Industrials, Commercial Services & Supplies) | | | | | | | | | | | 42,300 | | | | 226,296 | |
Lendlease Corporation Limited (Real Estate, Real Estate Management & Development) | | | | | | | | | | | 24,500 | | | | 303,955 | |
Metcash Limited (Consumer Staples, Food & Staples Retailing) | | | | | | | | | | | 28,500 | | | | 58,676 | |
Mineral Resources Limited (Materials, Metals & Mining) | | | | | | | | | | | 14,900 | | | | 198,425 | |
Qantas Airways Limited (Industrials, Airlines) | | | | | | | | | | | 59,300 | | | | 279,119 | |
| | | | |
| | | | | | | | | | | | | | | 1,713,676 | |
| | | | | | | | | | | | | | | | |
| | | | |
| Austria: 0.44% | | | | | | | | | | | | | | | | |
OMV AG (Energy, Oil, Gas & Consumable Fuels) | | | | | | | | | | | 5,100 | | | | 306,423 | |
Voestalpine AG (Materials, Metals & Mining) | | | | | | | | | | | 4,300 | | | | 236,593 | |
| | | | |
| | | | | | | | | | | | | | | 543,016 | |
| | | | | | | | | | | | | | | | |
| | | | |
| Brazil: 1.49% | | | | | | | | | | | | | | | | |
Ambev SA ADR (Consumer Staples, Beverages) | | | | | | | | | | | 37,718 | | | | 238,755 | |
Banco de Brasil SA (Financials, Banks) | | | | | | | | | | | 19,000 | | | | 200,031 | |
Companhia de Saneamento de Minas Gerais SA (Utilities, Water Utilities) | | | | | | | | | | | 5,300 | | | | 63,834 | |
Cosan Limited Class A (Energy, Oil, Gas & Consumable Fuels) | | | | | | | | | | | 137,483 | | | | 1,194,727 | |
JBS SA (Consumer Staples, Food Products) | | | | | | | | | | | 67,500 | | | | 155,580 | |
| | | | |
| | | | | | | | | | | | | | | 1,852,927 | |
| | | | | | | | | | | | | | | | |
| | | | |
| Canada: 2.38% | | | | | | | | | | | | | | | | |
Canadian Pacific Railway Limited (Industrials, Road & Rail) | | | | | | | | | | | 7,242 | | | | 1,256,052 | |
Lundin Mining Corporation (Materials, Metals & Mining) | | | | | | | | | | | 131,908 | | | | 1,006,104 | |
Magna International Incorporated (Consumer Discretionary, Auto Components) | | | | | | | | | | | 9,100 | | | | 496,441 | |
WestJet Airlines Limited (Industrials, Airlines) | | | | | | | | | | | 9,200 | | | | 192,258 | |
| | | | |
| | | | | | | | | | | | | | | 2,950,855 | |
| | | | | | | | | | | | | | | | |
| | | | |
| Chile: 0.04% | | | | | | | | | | | | | | | | |
Sociedad Quimica Minera de Chile (Materials, Chemicals) | | | | | | | | | | | 808 | | | | 48,270 | |
| | | | | | | | | | | | | | | | |
| | | | |
| China: 5.23% | | | | | | | | | | | | | | | | |
Alibaba Group Holding Limited ADR (Information Technology, Internet Software & Services) † | | | | | | | | | | | 9,989 | | | | 1,846,872 | |
China Communications Services Corporation Limited H Shares (Telecommunication Services, Diversified Telecommunication Services) | | | | 220,000 | | | | 133,386 | |
China Everbright Limited (Financials, Capital Markets) | | | | | | | | | | | 190,000 | | | | 450,560 | |
China Literature Limited (Information Technology, Internet Software & Services) †(a) | | | | | | | | | | | 6 | | | | 43 | |
China Mobile Limited (Telecommunication Services, Wireless Telecommunication Services) | | | | | | | | | | | 99,500 | | | | 999,285 | |
China Petroleum & Chemical Corporation H Shares (Energy, Oil, Gas & Consumable Fuels) | | | | | | | | | | | 218,000 | | | | 160,117 | |
China Railway Construction Corporation Limited H Shares (Industrials, Construction & Engineering) | | | | | | | | | | | 141,500 | | | | 177,569 | |
Dongfeng Motor Group Company Limited H Shares (Consumer Discretionary, Automobiles) | | | | | | | | | | | 106,000 | | | | 145,384 | |
HollySys Automation Technologies Limited (Information Technology, Electronic Equipment, Instruments & Components) | | | | | | | | | | | 20,909 | | | | 469,407 | |
Industrial & Commercial Bank of China Limited H Shares (Financials, Banks) | | | | | | | | | | | 181,000 | | | | 143,614 | |
NetEase Incorporated ADR (Information Technology, Internet Software & Services) | | | | | | | | | | | 1,409 | | | | 397,225 | |
The accompanying notes are an integral part of these financial statements.
| | | | | | |
| Portfolio of investments—October 31, 2017 | | Wells Fargo Diversified International Fund | | | 13 | |
| | | | | | | | | | | | | | | | |
| Security name | | | | | | | | Shares | | | Value | |
| | | | |
| China (continued) | | | | | | | | | | | | | | | | |
PICC Property & Casualty Company Limited H Shares (Financials, Insurance) | | | | | | | | | | | 69,000 | | | $ | 136,737 | |
Ping An Insurance (Group) Company of China Limited H Shares (Financials, Insurance) | | | | | | | | | | | 25,000 | | | | 219,512 | |
Shanghai Pharmaceuticals Holding Company Limited H Shares (Health Care, Health Care Providers & Services) | | | | | | | | | | | 272,000 | | | | 702,541 | |
Shenzhen International Holdings Limited H Shares (Industrials, Transportation Infrastructure) | | | | | | | | | | | 49,500 | | | | 94,541 | |
Tencent Holdings Limited (Information Technology, Internet Software & Services) | | | | | | | | | | | 7,800 | | | | 349,737 | |
Yantai Changyu Pioneer Wine Company Limited Class B (Consumer Staples, Beverages) | | | | | | | | | | | 23,400 | | | | 60,589 | |
| | | | |
| | | | | | | | | | | | | | | 6,487,119 | |
| | | | | | | | | | | | | | | | |
| | | | |
| Denmark: 0.63% | | | | | | | | | | | | | | | | |
Danske Bank AS (Financials, Banks) | | | | | | | | | | | 9,300 | | | | 354,778 | |
Genmab AS (Health Care, Biotechnology) † | | | | | | | | | | | 651 | | | | 131,459 | |
Novo Nordisk AS Class B (Health Care, Pharmaceuticals) | | | | | | | | | | | 2,659 | | | | 132,279 | |
Sydbank AS (Financials, Banks) | | | | | | | | | | | 4,000 | | | | 156,036 | |
| | | | |
| | | | | | | | | | | | | | | 774,552 | |
| | | | | | | | | | | | | | | | |
| | | | |
| France: 6.46% | | | | | | | | | | | | | | | | |
Arkema SA (Materials, Chemicals) | | | | | | | | | | | 910 | | | | 114,958 | |
Atos Origin SA (Information Technology, IT Services) | | | | | | | | | | | 2,000 | | | | 310,782 | |
AXA SA (Financials, Insurance) | | | | | | | | | | | 9,200 | | | | 277,882 | |
BNP Paribas SA (Financials, Banks) | | | | | | | | | | | 6,075 | | | | 474,406 | |
Compagnie de Saint-Gobain SA (Industrials, Building Products) | | | | | | | | | | | 25,699 | | | | 1,507,550 | |
Compagnie Generale des Establissements Michelin SCA (Consumer Discretionary, Auto Components) | | | | | | | | | | | 2,200 | | | | 318,283 | |
Credit Agricole SA (Financials, Banks) | | | | | | | | | | | 13,900 | | | | 242,547 | |
Eiffage SA (Industrials, Construction & Engineering) | | | | | | | | | | | 4,746 | | | | 495,840 | |
Electricite de France SA (Utilities, Electric Utilities) | | | | | | | | | | | 9,000 | | | | 117,836 | |
Engie SA (Utilities, Multi-Utilities) | | | | | | | | | | | 13,300 | | | | 224,796 | |
Orange SA (Telecommunication Services, Diversified Telecommunication Services) | | | | | | | | | | | 75,279 | | | | 1,235,095 | |
Renault SA (Consumer Discretionary, Automobiles) | | | | | | | | | | | 3,100 | | | | 307,443 | |
Sanofi SA (Health Care, Pharmaceuticals) | | | | | | | | | | | 8,600 | | | | 814,339 | |
Schneider Electric SE (Industrials, Electrical Equipment) | | | | | | | | | | | 5,142 | | | | 451,920 | |
SCOR SE (Financials, Insurance) | | | | | | | | | | | 7,700 | | | | 319,712 | |
Societe Generale SA (Financials, Banks) | | | | | | | | | | | 3,700 | | | | 206,015 | |
Total SA (Energy, Oil, Gas & Consumable Fuels) | | | | | | | | | | | 7,000 | | | | 390,329 | |
Vallourec SA (Energy, Energy Equipment & Services) †« | | | | | | | | | | | 5,579 | | | | 30,550 | |
Zodiac Aerospace SA (Industrials, Aerospace & Defense) | | | | | | | | | | | 5,858 | | | | 167,522 | |
| | | | |
| | | | | | | | | | | | | | | 8,007,805 | |
| | | | | | | | | | | | | | | | |
| | | | |
| Germany: 15.78% | | | | | | | | | | | | | | | | |
Allianz AG (Financials, Insurance) | | | | | | | | | | | 9,516 | | | | 2,209,736 | |
Aurubis AG (Materials, Metals & Mining) | | | | | | | | | | | 1,600 | | | | 130,929 | |
BASF SE (Materials, Chemicals) | | | | | | | | | | | 2,900 | | | | 316,254 | |
Bayer AG (Health Care, Pharmaceuticals) | | | | | | | | | | | 12,177 | | | | 1,584,394 | |
Bayerische Motoren Werke AG (Consumer Discretionary, Automobiles) | | | | | | | | | | | 2,200 | | | | 224,234 | |
Beiersdorf AG (Consumer Staples, Personal Products) | | | | | | | | | | | 6,734 | | | | 755,387 | |
Ceconomy AG (Consumer Discretionary, Specialty Retail) | | | | | | | | | | | 43,170 | | | | 563,209 | |
Celesio AG (Health Care, Health Care Providers & Services) | | | | | | | | | | | 400 | | | | 12,163 | |
Daimler AG (Consumer Discretionary, Automobiles) | | | | | | | | | | | 5,300 | | | | 440,123 | |
Deutsche Bank AG (Financials, Capital Markets) | | | | | | | | | | | 13,649 | | | | 221,791 | |
Deutsche Boerse AG (Financials, Capital Markets) | | | | | | | | | | | 17,612 | | | | 1,819,299 | |
The accompanying notes are an integral part of these financial statements.
| | | | |
| 14 | | Wells Fargo Diversified International Fund | | Portfolio of investments—October 31, 2017 |
| | | | | | | | | | | | | | | | |
| Security name | | | | | | | | Shares | | | Value | |
| | | | |
| Germany (continued) | | | | | | | | | | | | | | | | |
Deutsche Post AG (Industrials, Air Freight & Logistics) | | | | | | | | | | | 30,855 | | | $ | 1,413,217 | |
Deutsche Telekom AG (Telecommunication Services, Diversified Telecommunication Services) | | | | | | | | | | | 27,845 | | | | 507,287 | |
Hannover Rueck SE (Financials, Insurance) | | | | | | | | | | | 1,200 | | | | 150,475 | |
Linde AG (Materials, Chemicals) | | | | | | | | | | | 8,554 | | | | 1,842,864 | |
Metro AG (Consumer Staples, Food & Staples Retailing) † | | | | | | | | | | | 43,170 | | | | 824,448 | |
Muenchener Rueckversicherungs Gesellschaft AG (Financials, Insurance) | | | | | | | | | | | 5,224 | | | | 1,168,658 | |
Rheinmetall AG (Industrials, Industrial Conglomerates) | | | | | | | | | | | 6,000 | | | | 707,646 | |
SAP SE (Information Technology, Software) | | | | | | | | | | | 10,894 | | | | 1,239,293 | |
Siemens AG (Industrials, Industrial Conglomerates) | | | | | | | | | | | 11,254 | | | | 1,605,879 | |
Uniper SE (Utilities, Independent Power & Renewable Electricity Producers) | | | | | | | | | | | 7,700 | | | | 216,341 | |
Volkswagen AG (Consumer Discretionary, Automobiles) | | | | | | | | | | | 1,600 | | | | 297,083 | |
Wirecard AG (Information Technology, IT Services) | | | | | | | | | | | 13,357 | | | | 1,315,505 | |
| | | | |
| | | | | | | | | | | | | | | 19,566,215 | |
| | | | | | | | | | | | | | | | |
| | | | |
| Hong Kong: 1.92% | | | | | | | | | | | | | | | | |
AIA Group Limited (Financials, Insurance) | | | | | | | | | | | 136,400 | | | | 1,026,313 | |
China Resources Cement Holdings Limited (Materials, Construction Materials) | | | | | | | | | | | 168,000 | | | | 113,487 | |
i-Cable Communications Limited (Consumer Discretionary, Media) † | | | | | | | | | | | 5,590 | | | | 175 | |
Kingboard Laminates Holdings Limited (Information Technology, Electronic Equipment, Instruments & Components) | | | | | | | | | | | 109,500 | | | | 183,871 | |
Skyworth Digital Holdings Limited (Consumer Discretionary, Household Durables) | | | | | | | | | | | 320,000 | | | | 147,256 | |
Wheelock & Company Limited (Real Estate, Real Estate Management & Development) | | | | | | | | | | | 22,000 | | | | 153,126 | |
Xinyi Glass Holdings Limited (Consumer Discretionary, Auto Components) | | | | | | | | | | | 620,000 | | | | 600,021 | |
Yue Yuen Industrial Holdings Limited (Consumer Discretionary, Textiles, Apparel & Luxury Goods) | | | | | | | | | | | 42,000 | | | | 160,971 | |
| | | | |
| | | | | | | | | | | | | | | 2,385,220 | |
| | | | | | | | | | | | | | | | |
| | | | |
| Hungary: 0.07% | | | | | | | | | | | | | | | | |
Richter Gedeon (Health Care, Pharmaceuticals) | | | | | | | | | | | 3,500 | | | | 87,071 | |
| | | | | | | | | | | | | | | | |
| | | | |
| Indonesia: 0.19% | | | | | | | | | | | | | | | | |
PT Bank Rakyat Indonesia Tbk (Financials, Banks) | | | | | | | | | | | 206,500 | | | | 237,523 | |
| | | | | | | | | | | | | | | | |
| | | | |
| Ireland: 1.17% | | | | | | | | | | | | | | | | |
C&C Group plc (Consumer Staples, Beverages) | | | | | | | | | | | 18,600 | | | | 63,829 | |
Medtronic plc (Health Care, Health Care Equipment & Supplies) | | | | | | | | | | | 13,946 | | | | 1,122,932 | |
Smurfit Kappa Group plc (Materials, Containers & Packaging) | | | | | | | | | | | 8,800 | | | | 262,469 | |
| | | | |
| | | | | | | | | | | | | | | 1,449,230 | |
| | | | | | | | | | | | | | | | |
| | | | |
| Israel: 0.25% | | | | | | | | | | | | | | | | |
Bank Hapoalim Limited (Financials, Banks) | | | | | | | | | | | 38,000 | | | | 268,927 | |
Teva Pharmaceutical Industries Limited (Health Care, Pharmaceuticals) | | | | | | | | | | | 3,400 | | | | 46,424 | |
| | | | |
| | | | | | | | | | | | | | | 315,351 | |
| | | | | | | | | | | | | | | | |
| | | | |
| Italy: 4.93% | | | | | | | | | | | | | | | | |
A2A SpA (Utilities, Multi-Utilities) | | | | | | | | | | | 104,600 | | | | 179,719 | |
Assicurazioni Generali SpA (Financials, Insurance) | | | | | | | | | | | 37,704 | | | | 686,901 | |
Enel SpA (Utilities, Electric Utilities) | | | | | | | | | | | 94,000 | | | | 583,065 | |
Eni SpA (Energy, Oil, Gas & Consumable Fuels) | | | | | | | | | | | 93,171 | | | | 1,523,764 | |
Intesa Sanpaolo SpA (Financials, Banks) | | | | | | | | | | | 227,338 | | | | 764,255 | |
Leonardo-Finmeccanica SpA (Industrials, Aerospace & Defense) | | | | | | | | | | | 9,300 | | | | 160,655 | |
The accompanying notes are an integral part of these financial statements.
| | | | | | |
| Portfolio of investments—October 31, 2017 | | Wells Fargo Diversified International Fund | | | 15 | |
| | | | | | | | | | | | | | | | |
| Security name | | | | | | | | Shares | | | Value | |
| | | | |
| Italy (continued) | | | | | | | | | | | | | | | | |
Mediobanca SpA (Financials, Banks) | | | | | | | | | | | 23,400 | | | $ | 256,493 | |
Prysmian SpA (Industrials, Electrical Equipment) | | | | | | | | | | | 4,302 | | | | 148,331 | |
UniCredit SpA (Financials, Banks) † | | | | | | | | | | | 94,793 | | | | 1,814,194 | |
| | | | |
| | | | | | | | | | | | | | | 6,117,377 | |
| | | | | | | | | | | | | | | | |
| | | | |
| Japan: 14.81% | | | | | | | | | | | | | | | | |
Adeka Corporation (Materials, Chemicals) | | | | | | | | | | | 13,000 | | | | 223,174 | |
Aisin Seiki Company Limited (Consumer Discretionary, Auto Components) | | | | | | | | | | | 3,300 | | | | 169,491 | |
Aoyama Trading Company Limited (Consumer Discretionary, Specialty Retail) | | | | | | | | | | | 1,800 | | | | 66,488 | |
Astellas Pharma Incorporated (Health Care, Pharmaceuticals) | | | | | | | | | | | 17,100 | | | | 226,862 | |
CALBEE Incorporated (Consumer Staples, Food Products) | | | | | | | | | | | 10,700 | | | | 359,004 | |
Central Glass Company Limited (Industrials, Building Products) | | | | | | | | | | | 6,800 | | | | 151,124 | |
Daikyo Incorporated (Real Estate, Real Estate Management & Development) | | | | | | | | | | | 7,350 | | | | 140,723 | |
Daiwa Securities Group Incorporated (Financials, Capital Markets) | | | | | | | | | | | 96,000 | | | | 595,815 | |
DCM Holdings Company Limited (Consumer Discretionary, Specialty Retail) | | | | | | | | | | | 14,100 | | | | 128,965 | |
Denka Company Limited (Materials, Chemicals) | | | | | | | | | | | 10,000 | | | | 331,120 | |
DIC Incorporated (Materials, Chemicals) | | | | | | | | | | | 5,300 | | | | 195,304 | |
Eizo Corporation (Information Technology, Technology Hardware, Storage & Peripherals) | | | | | | | | | | | 7,300 | | | | 301,425 | |
FANUC Corporation (Industrials, Machinery) | | | | | | | | | | | 1,800 | | | | 417,449 | |
Fuji Oil Company Limited (Energy, Oil, Gas & Consumable Fuels) | | | | | | | | | | | 4,000 | | | | 107,295 | |
Fujikura Limited (Industrials, Electrical Equipment) | | | | | | | | | | | 25,000 | | | | 215,910 | |
Hitachi Limited (Information Technology, Electronic Equipment, Instruments & Components) | | | | | | | | | | | 198,000 | | | | 1,561,989 | |
Isuzu Motors Limited (Consumer Discretionary, Automobiles) | | | | | | | | | | | 16,500 | | | | 239,218 | |
Itochu Corporation (Industrials, Trading Companies & Distributors) | | | | | | | | | | | 14,600 | | | | 253,980 | |
Japan Airlines Company Limited (Industrials, Airlines) | | | | | | | | | | | 6,300 | | | | 214,423 | |
Japan Tobacco Incorporated (Consumer Staples, Tobacco) | | | | | | | | | | | 30,320 | | | | 999,156 | |
Kaken Pharmaceutical Company Limited (Health Care, Pharmaceuticals) | | | | | | | | | | | 3,000 | | | | 151,445 | |
KDDI Corporation (Telecommunication Services, Wireless Telecommunication Services) | | | | | | | | | | | 18,500 | | | | 492,010 | |
Kyorin Company Limited (Health Care, Pharmaceuticals) | | | | | | | | | | | 4,700 | | | | 96,063 | |
Maeda Road Construction Company Limited (Industrials, Construction & Engineering) | | | | | | | | | | | 11,000 | | | | 235,759 | |
Marubeni Corporation (Industrials, Trading Companies & Distributors) | | | | | | | | | | | 36,300 | | | | 241,574 | |
Matsumotokiyoshi Holdings Company Limited (Consumer Staples, Food & Staples Retailing) | | | | | | | | | | | 2,500 | | | | 178,972 | |
Mazda Motor Corporation (Consumer Discretionary, Automobiles) | | | | | | | | | | | 12,000 | | | | 171,180 | |
Mitsubishi Gas Chemical Company Incorporated (Materials, Chemicals) | | | | | | | | | | | 6,100 | | | | 148,014 | |
Mitsubishi UFJ Financial Group Incorporated (Financials, Banks) | | | | | | | | | | | 196,900 | | | | 1,320,401 | |
Mitsui Chemicals Incorporated (Materials, Chemicals) | | | | | | | | | | | 9,500 | | | | 290,752 | |
Mizuho Financial Group Incorporated (Financials, Banks) | | | | | | | | | | | 171,600 | | | | 309,229 | |
Nintendo Company Limited (Information Technology, Software) | | | | | | | | | | | 3,100 | | | | 1,194,143 | |
Nippon Telegraph & Telephone Corporation (Telecommunication Services, Diversified Telecommunication Services) | | | | | | | | | | | 13,500 | | | | 649,800 | |
Nissan Motor Company Limited (Consumer Discretionary, Automobiles) | | | | | | | | | | | 32,200 | | | | 311,083 | |
Nisshinbo Holdings Incorporated (Industrials, Industrial Conglomerates) | | | | | | | | | | | 12,400 | | | | 147,659 | |
Nomura Holdings Incorporated (Financials, Capital Markets) | | | | | | | | | | | 220,200 | | | | 1,256,460 | |
NTT DOCOMO Incorporated (Telecommunication Services, Wireless Telecommunication Services) | | | | | | | | | | | 24,403 | | | | 588,265 | |
ORIX Corporation (Financials, Diversified Financial Services) | | | | | | | | | | | 16,500 | | | | 281,300 | |
Resona Holdings Incorporated (Financials, Banks) | | | | | | | | | | | 62,600 | | | | 334,843 | |
Rohm Company Limited (Information Technology, Semiconductors & Semiconductor Equipment) | | | | | | | | | | | 1,300 | | | | 119,590 | |
S Foods Incorporated (Consumer Staples, Food Products) | | | | | | | | | | | 7,500 | | | | 284,288 | |
Sankyu Incorporated (Industrials, Road & Rail) | | | | | | | | | | | 3,900 | | | | 160,521 | |
Sawai Pharmaceutical Company Limited (Health Care, Pharmaceuticals) | | | | | | | | | | | 2,100 | | | | 118,755 | |
The accompanying notes are an integral part of these financial statements.
| | | | |
| 16 | | Wells Fargo Diversified International Fund | | Portfolio of investments—October 31, 2017 |
| | | | | | | | | | | | | | | | |
| Security name | | | | | | | | Shares | | | Value | |
| | | | |
| Japan (continued) | | | | | | | | | | | | | | | | |
SEINO Holdings Company Limited (Industrials, Road & Rail) | | | | | | | | | | | 3,000 | | | $ | 43,455 | |
Sojitz Corporation (Industrials, Trading Companies & Distributors) | | | | | | | | | | | 77,400 | | | | 232,122 | |
Sumitomo Heavy Industries Limited (Industrials, Machinery) | | | | | | | | | | | 6,000 | | | | 250,121 | |
Sumitomo Metal Mining Company Limited (Materials, Metals & Mining) | | | | | | | | | | | 10,820 | | | | 424,026 | |
Sumitomo Mitsui Financial Group Incorporated (Financials, Banks) | | | | | | | | | | | 8,000 | | | | 317,805 | |
Sumitomo Osaka Cement Company (Materials, Construction Materials) | | | | | | | | | | | 37,600 | | | | 171,292 | |
The Yokohama Rubber Company Limited (Consumer Discretionary, Auto Components) | | | | | | | | | | | 10,500 | | | | 233,631 | |
Toho Holdings Company Limited (Health Care, Health Care Providers & Services) | | | | | | | | | | | 6,200 | | | | 121,159 | |
Toyo Ink SC Holding Company Limited (Materials, Chemicals) | | | | | | | | | | | 36,800 | | | | 215,224 | |
Toyo Tire & Rubber Company Limited (Consumer Discretionary, Auto Components) | | | | | | | | | | | 5,900 | | | | 132,524 | |
UBE Industries Limited (Materials, Chemicals) | | | | | | | | | | | 7,900 | | | | 240,741 | |
| | | | |
| | | | | | | | | | | | | | | 18,363,121 | |
| | | | | | | | | | | | | | | | |
| | | | |
| Malaysia: 0.98% | | | | | | | | | | | | | | | | |
CIMB Group Holdings Bhd (Financials, Banks) | | | | | | | | | | | 835,262 | | | | 1,211,411 | |
| | | | | | | | | | | | | | | | |
| | | | |
| Netherlands: 6.70% | | | | | | | | | | | | | | | | |
Aegon NV (Financials, Insurance) | | | | | | | | | | | 23,200 | | | | 136,960 | |
Airbus Group NV (Industrials, Aerospace & Defense) | | | | | | | | | | | 3,000 | | | | 306,647 | |
Akzo Nobel NV (Materials, Chemicals) | | | | | | | | | | | 5,083 | | | | 460,293 | |
ASML Holding NV (Information Technology, Semiconductors & Semiconductor Equipment) | | | | | | | | | | | 3,371 | | | | 607,854 | |
ING Groep NV (Financials, Banks) | | | | | | | | | | | 99,463 | | | | 1,837,531 | |
Koninklijke Ahold NV (Consumer Staples, Food & Staples Retailing) | | | | | | | | | | | 7,700 | | | | 144,900 | |
Koninklijke Philips NV (Industrials, Industrial Conglomerates) | | | | | | | | | | | 31,236 | | | | 1,271,846 | |
NN Group NV (Financials, Insurance) | | | | | | | | | | | 33,855 | | | | 1,418,118 | |
OCI NV (Materials, Chemicals) †« | | | | | | | | | | | 34,783 | | | | 825,128 | |
Sensata Technologies Holding NV (Industrials, Electrical Equipment) † | | | | | | | | | | | 25,131 | | | | 1,229,157 | |
X5 Retail Group NV GDR (Consumer Staples, Food & Staples Retailing) † | | | | | | | | | | | 1,700 | | | | 69,870 | |
| | | | |
| | | | | | | | | | | | | | | 8,308,304 | |
| | | | | | | | | | | | | | | | |
| | | | |
| Norway: 1.64% | | | | | | | | | | | | | | | | |
Den Norske Bank ASA (Financials, Banks) | | | | | | | | | | | 92,501 | | | | 1,783,657 | |
Marine Harvest ASA (Consumer Staples, Food Products) | | | | | | | | | | | 6,000 | | | | 117,165 | |
Yara International ASA (Materials, Chemicals) | | | | | | | | | | | 2,900 | | | | 137,686 | |
| | | | |
| | | | | | | | | | | | | | | 2,038,508 | |
| | | | | | | | | | | | | | | | |
| | | | |
| Poland: 0.06% | | | | | | | | | | | | | | | | |
Asseco Poland SA (Information Technology, Software) | | | | | | | | | | | 5,900 | | | | 77,317 | |
| | | | | | | | | | | | | | | | |
| | | | |
| Portugal: 0.14% | | | | | | | | | | | | | | | | |
Energias de Portugal SA (Utilities, Electric Utilities) | | | | | | | | | | | 49,800 | | | | 177,683 | |
| | | | | | | | | | | | | | | | |
| | | | |
| Russia: 1.25% | | | | | | | | | | | | | | | | |
Gazprom Neft Sponsored ADR (Energy, Oil, Gas & Consumable Fuels) | | | | | | | | | | | 10,500 | | | | 218,925 | |
LUKOIL OAO ADR (Energy, Oil, Gas & Consumable Fuels) | | | | | | | | | | | 4,200 | | | | 222,726 | |
MMC Norilsk Nickel PJSC ADR (Materials, Metals & Mining) | | | | | | | | | | | 24,905 | | | | 458,252 | |
Mobile TeleSystems PJSC ADR (Telecommunication Services, Wireless Telecommunication Services) | | | | | | | | | | | 61,063 | | | | 647,878 | |
| | | | |
| | | | | | | | | | | | | | | 1,547,781 | |
| | | | | | | | | | | | | | | | |
The accompanying notes are an integral part of these financial statements.
| | | | | | |
| Portfolio of investments—October 31, 2017 | | Wells Fargo Diversified International Fund | | | 17 | |
| | | | | | | | | | | | | | | | |
| Security name | | | | | | | | Shares | | | Value | |
| | | | |
| Singapore: 0.39% | | | | | | | | | | | | | | | | |
DBS Group Holdings Limited (Financials, Banks) | | | | | | | | | | | 17,000 | | | $ | 284,102 | |
United Overseas Bank Limited (Financials, Banks) | | | | | | | | | | | 10,700 | | | | 193,261 | |
| | | | |
| | | | | | | | | | | | | | | 477,363 | |
| | | | | | | | | | | | | | | | |
| | | | |
| South Africa: 1.16% | | | | | | | | | | | | | | | | |
Barclays Africa Group Limited (Financials, Banks) | | | | | | | | | | | 12,600 | | | | 124,888 | |
Imperial Holdings Limited (Consumer Discretionary, Distributors) | | | | | | | | | | | 5,700 | | | | 81,690 | |
Naspers Limited (Consumer Discretionary, Media) | | | | | | | | | | | 670 | | | | 163,250 | |
Omnia Holdings Limited (Materials, Chemicals) | | | | | | | | | | | 7,600 | | | | 78,350 | |
Sasol Limited (Materials, Chemicals) | | | | | | | | | | | 33,802 | | | | 988,975 | |
| | | | |
| | | | | | | | | | | | | | | 1,437,153 | |
| | | | | | | | | | | | | | | | |
| | | | |
| South Korea: 3.65% | | | | | | | | | | | | | | | | |
BNK Financial Group Incorporated (Financials, Banks) | | | | | | | | | | | 1,018 | | | | 9,032 | |
Hana Financial Group Incorporated (Financials, Banks) | | | | | | | | | | | 19,491 | | | | 834,198 | |
Industrial Bank of Korea (Financials, Banks) | | | | | | | | | | | 16,600 | | | | 227,438 | |
KT&G Corporation (Consumer Staples, Tobacco) | | | | | | | | | | | 2,300 | | | | 217,611 | |
Kwangju Bank (Financials, Banks) | | | | | | | | | | | 1,044 | | | | 10,996 | |
LG Household & Health Care Limited (Consumer Staples, Personal Products) | | | | | | | | | | | 177 | | | | 185,950 | |
Samsung Electronics Company Limited (Information Technology, Technology Hardware, Storage & Peripherals) | | | | | | | | | | | 430 | | | | 1,057,009 | |
Samsung Electronics Company Limited GDR (Information Technology, Technology Hardware, Storage & Peripherals) 144A | | | | 246 | | | | 303,318 | |
SK Telecom Company Limited (Telecommunication Services, Wireless Telecommunication Services) | | | | | | | | | | | 6,287 | | | | 1,481,473 | |
Woori Bank (Financials, Banks) | | | | | | | | | | | 13,760 | | | | 201,423 | |
| | | | |
| | | | | | | | | | | | | | | 4,528,448 | |
| | | | | | | | | | | | | | | | |
| | | | |
| Spain: 1.38% | | | | | | | | | | | | | | | | |
Banco Santander Central Hispano SA (Financials, Banks) | | | | | | | | | | | 29,500 | | | | 200,096 | |
Distribuidora Internacional SA (Consumer Staples, Food & Staples Retailing) | | | | | | | | | | | 33,900 | | | | 165,851 | |
Gas Natural SDG SA (Utilities, Gas Utilities) | | | | | | | | | | | 9,100 | | | | 194,724 | |
Grifols SA (Health Care, Biotechnology) | | | | | | | | | | | 10,079 | | | | 315,526 | |
Grifols SA ADR (Health Care, Biotechnology) | | | | | | | | | | | 15,985 | | | | 378,045 | |
International Consolidated Airlines Group SA (Industrials, Airlines) | | | | | | | | | | | 17,900 | | | | 151,202 | |
Repsol YPF SA (Energy, Oil, Gas & Consumable Fuels) | | | | | | | | | | | 16,200 | | | | 303,533 | |
| | | | |
| | | | | | | | | | | | | | | 1,708,977 | |
| | | | | | | | | | | | | | | | |
| | | | |
| Sweden: 0.34% | | | | | | | | | | | | | | | | |
Boliden AB (Materials, Metals & Mining) | | | | | | | | | | | 6,700 | | | | 234,494 | |
Nordea Bank AB (Financials, Banks) | | | | | | | | | | | 15,000 | | | | 181,326 | |
| | | | |
| | | | | | | | | | | | | | | 415,820 | |
| | | | | | | | | | | | | | | | |
| | | | |
| Switzerland: 4.72% | | | | | | | | | | | | | | | | |
Aryzta AG (Consumer Staples, Food Products) | | | | | | | | | | | 400 | | | | 12,698 | |
Baloise Holding AG (Financials, Insurance) | | | | | | | | | | | 2,000 | | | | 315,341 | |
Credit Suisse Group AG (Financials, Capital Markets) | | | | | | | | | | | 16,500 | | | | 260,156 | |
Georg Fischer AG (Industrials, Machinery) | | | | | | | | | | | 100 | | | | 123,190 | |
Idorsia Limited (Health Care, Biotechnology) † | | | | | | | | | | | 1,130 | | | | 22,257 | |
Nestle SA (Consumer Staples, Food Products) | | | | | | | | | | | 15,739 | | | | 1,323,613 | |
Novartis AG (Health Care, Pharmaceuticals) | | | | | | | | | | | 16,745 | | | | 1,379,681 | |
The accompanying notes are an integral part of these financial statements.
| | | | |
| 18 | | Wells Fargo Diversified International Fund | | Portfolio of investments—October 31, 2017 |
| | | | | | | | | | | | | | | | |
| Security name | | | | | | | | Shares | | | Value | |
| | | | |
| Switzerland (continued) | | | | | | | | | | | | | | | | |
Roche Holding AG (Health Care, Pharmaceuticals) | | | | | | | | | | | 1,560 | | | $ | 360,427 | |
Swatch Group AG Class B (Consumer Discretionary, Textiles, Apparel & Luxury Goods) | | | | | | | | | | | 769 | | | | 301,387 | |
Swiss Life Holding AG (Financials, Insurance) | | | | | | | | | | | 1,500 | | | | 521,425 | |
Swiss Reinsurance AG (Financials, Insurance) | | | | | | | | | | | 3,900 | | | | 366,877 | |
UBS Group AG (Financials, Capital Markets) | | | | | | | | | | | 10,600 | | | | 180,412 | |
Valiant Holding AG (Financials, Banks) | | | | | | | | | | | 1,900 | | | | 195,590 | |
Zurich Insurance Group AG (Financials, Insurance) | | | | | | | | | | | 1,602 | | | | 488,959 | |
| | | | |
| | | | | | | | | | | | | | | 5,852,013 | |
| | | | | | | | | | | | | | | | |
| | | | |
| Taiwan: 0.82% | | | | | | | | | | | | | | | | |
Hon Hai Precision Industry Company Limited (Information Technology, Electronic Equipment, Instruments & Components) | | | | 54,000 | | | | 200,534 | |
Pegatron Corporation (Information Technology, Technology Hardware, Storage & Peripherals) | | | | 83,000 | | | | 214,659 | |
Taiwan Semiconductor Manufacturing Company Limited (Information Technology, Semiconductors & Semiconductor Equipment) | | | | 57,000 | | | | 459,258 | |
Zhen Ding Technology Holding (Information Technology, Electronic Equipment, Instruments & Components) | | | | 55,000 | | | | 137,867 | |
| | | | |
| | | | | | | | | | | | | | | 1,012,318 | |
| | | | | | | | | | | | | | | | |
| | | | |
| Thailand: 0.32% | | | | | | | | | | | | | | | | |
Bangchak Corporation PCL (Energy, Oil, Gas & Consumable Fuels) | | | | | | | | | | | 135,400 | | | | 170,167 | |
Thai Oil PCL (Energy, Oil, Gas & Consumable Fuels) | | | | | | | | | | | 75,100 | | | | 230,590 | |
| | | | |
| | | | | | | | | | | | | | | 400,757 | |
| | | | | | | | | | | | | | | | |
| | | | |
| United Kingdom: 13.00% | | | | | | | | | | | | | | | | |
3i Group plc (Financials, Capital Markets) | | | | | | | | | | | 27,100 | | | | 345,891 | |
Anglo American plc (Materials, Metals & Mining) | | | | | | | | | | | 7,400 | | | | 139,562 | |
Aon plc (Financials, Insurance) | | | | | | | | | | | 8,926 | | | | 1,280,256 | |
Aviva plc (Financials, Insurance) | | | | | | | | | | | 22,000 | | | | 147,557 | |
BAE Systems plc (Industrials, Aerospace & Defense) | | | | | | | | | | | 143,099 | | | | 1,127,988 | |
Barclays plc (Financials, Banks) | | | | | | | | | | | 66,900 | | | | 165,223 | |
Barratt Developments plc (Consumer Discretionary, Household Durables) | | | | | | | | | | | 23,400 | | | | 203,410 | |
Bellway plc (Consumer Discretionary, Household Durables) | | | | | | | | | | | 4,200 | | | | 203,605 | |
Bovis Homes Group plc (Consumer Discretionary, Household Durables) | | | | | | | | | | | 8,600 | | | | 134,324 | |
BP plc (Energy, Oil, Gas & Consumable Fuels) | | | | | | | | | | | 91,700 | | | | 621,380 | |
BT Group plc (Telecommunication Services, Diversified Telecommunication Services) | | | | | | | | | | | 33,500 | | | | 115,815 | |
Carillion plc (Industrials, Construction & Engineering) « | | | | | | | | | | | 30,400 | | | | 18,371 | |
Centrica plc (Utilities, Multi-Utilities) | | | | | | | | | | | 68,900 | | | | 155,383 | |
Coca-Cola European Partners plc (Consumer Staples, Beverages) | | | | | | | | | | | 25,764 | | | | 1,052,717 | |
ConvaTec Limited (Health Care, Health Care Equipment & Supplies) 144A | | | | | | | | | | | 166,620 | | | | 433,520 | |
Crest Nicholson Holdings plc (Consumer Discretionary, Household Durables) | | | | | | | | | | | 20,500 | | | | 154,241 | |
Debenhams plc (Consumer Discretionary, Multiline Retail) | | | | | | | | | | | 93,500 | | | | 54,330 | |
easyJet plc (Industrials, Airlines) | | | | | | | | | | | 6,700 | | | | 119,152 | |
Experian Group Limited plc (Industrials, Professional Services) | | | | | | | | | | | 19,829 | | | | 417,687 | |
Firstgroup plc (Industrials, Road & Rail) † | | | | | | | | | | | 54,400 | | | | 79,477 | |
Galliford Try plc (Industrials, Construction & Engineering) | | | | | | | | | | | 6,500 | | | | 105,322 | |
GKN plc (Consumer Discretionary, Auto Components) | | | | | | | | | | | 42,600 | | | | 179,356 | |
GlaxoSmithKline plc (Health Care, Pharmaceuticals) | | | | | | | | | | | 19,400 | | | | 349,775 | |
Glencore International plc (Materials, Metals & Mining) | | | | | | | | | | | 99,575 | | | | 480,069 | |
Inchcape plc (Consumer Discretionary, Distributors) | | | | | | | | | | | 19,900 | | | | 206,552 | |
J Sainsbury plc (Consumer Staples, Food & Staples Retailing) | | | | | | | | | | | 90,900 | | | | 292,767 | |
The accompanying notes are an integral part of these financial statements.
| | | | | | |
| Portfolio of investments—October 31, 2017 | | Wells Fargo Diversified International Fund | | | 19 | |
| | | | | | | | | | | | | | | | |
| Security name | | | | | | | | Shares | | | Value | |
| | | | |
| United Kingdom (continued) | | | | | | | | | | | | | | | | |
Kingfisher plc (Consumer Discretionary, Specialty Retail) | | | | | | | | | | | 55,500 | | | $ | 230,425 | |
Liberty Global plc Class A (Consumer Discretionary, Media) † | | | | | | | | | | | 9,638 | | | | 297,332 | |
Liberty Global plc Class C (Consumer Discretionary, Media) † | | | | | | | | | | | 19,002 | | | | 567,970 | |
Lloyds Banking Group plc (Financials, Banks) | | | | | | | | | | | 134,900 | | | | 122,353 | |
London Stock Exchange Group plc (Financials, Capital Markets) | | | | | | | | | | | 6,064 | | | | 302,907 | |
Man Group plc (Financials, Capital Markets) | | | | | | | | | | | 364,280 | | | | 936,673 | |
Marks & Spencer Group plc (Consumer Discretionary, Multiline Retail) | | | | | | | | | | | 44,100 | | | | 201,544 | |
Mondi plc (Materials, Paper & Forest Products) | | | | | | | | | | | 2,300 | | | | 55,627 | |
Old Mutual plc (Financials, Insurance) | | | | | | | | | | | 59,600 | | | | 151,191 | |
Prudential plc (Financials, Insurance) | | | | | | | | | | | 12,903 | | | | 317,379 | |
Qinetiq Group plc (Industrials, Aerospace & Defense) | | | | | | | | | | | 47,700 | | | | 154,644 | |
Redrow plc (Consumer Discretionary, Household Durables) | | | | | | | | | | | 24,200 | | | | 209,239 | |
Royal Dutch Shell plc Class B (Energy, Oil, Gas & Consumable Fuels) | | | | | | | | | | | 6,800 | | | | 218,696 | |
Royal Mail plc (Industrials, Air Freight & Logistics) | | | | | | | | | | | 20,900 | | | | 103,927 | |
Smiths Group plc (Industrials, Industrial Conglomerates) | | | | | | | | | | | 20,284 | | | | 423,230 | |
The Berkeley Group Holdings plc (Consumer Discretionary, Household Durables) | | | | | | | | | | | 4,400 | | | | 218,619 | |
United Business Media plc (Consumer Discretionary, Media) | | | | | | | | | | | 111,238 | | | | 1,039,356 | |
Vodafone Group plc (Telecommunication Services, Wireless Telecommunication Services) | | | | 496,838 | | | | 1,422,691 | |
Wolseley plc (Industrials, Trading Companies & Distributors) | | | | | | | | | | | 8,090 | | | | 565,710 | |
| | | | |
| | | | | | | | | | | | | | | 16,123,243 | |
| | | | | | | | | | | | | | | | |
| | | | |
| United States: 1.81% | | | | | | | | | | | | | | | | |
Amazon.com Incorporated (Consumer Discretionary, Internet & Direct Marketing Retail) † | | | | 614 | | | | 678,642 | |
Apple Incorporated (Information Technology, Technology Hardware, Storage & Peripherals) | | | | 3,136 | | | | 530,109 | |
Tapestry Incorporated (Consumer Discretionary, Textiles, Apparel & Luxury Goods) | | | | | | | | | | | 14,882 | | | | 609,418 | |
WABCO Holdings Incorporated (Industrials, Machinery) † | | | | | | | | | | | 2,863 | | | | 422,493 | |
| | | | |
| | | | | | | | | | | | | | | 2,240,662 | |
| | | | | | | | | | | | | | | | |
| | | | |
Total Common Stocks (Cost $98,236,975) | | | | | | | | | | | | | | | 118,457,086 | |
| | | | | | | | | | | | | | | | |
| | | | |
| | | | | | Expiration date | | | | | | | |
| Participation Notes: 1.23% | | | | | | | | | | | | | | | | |
| | | | |
| China: 0.29% | | | | | | | | | | | | | | | | |
HSBC Bank plc (Kweichow Moutai Company Limited Class A) (Consumer Staples, Beverages) 144A†(a) | | | | 2-19-2019 | | | | 3,790 | | | | 353,261 | |
| | | | | | | | | | | | | | | | |
| | | | |
| Ireland: 0.94% | | | | | | | | | | | | | | | | |
HSBC Bank plc (Ryanair Holdings plc) (Industrials, Airlines) (a) | | | | | | | 10-29-2018 | | | | 59,387 | | | | 1,163,406 | |
| | | | | | | | | | | | | | | | |
| | | | |
Total Participation Notes (Cost $844,710) | | | | | | | | | | | | | | | 1,516,667 | |
| | | | | | | | | | | | | | | | |
| | | | |
| | | Dividend yield | | | | | | | | | | |
| Preferred Stocks: 0.48% | | | | | | | | | | | | | | | | |
| | | | |
| Brazil: 0.03% | | | | | | | | | | | | | | | | |
Companhia Energetica de Minas Gerais SA (Utilities, Electric Utilities) | | | 3.22 | % | | | | | | | 13,600 | | | | 32,136 | |
| | | | | | | | | | | | | | | | |
| | | | |
| Germany: 0.45% | | | | | | | | | | | | | | | | |
Henkel AG & Company KGaA (Consumer Staples, Household Products) | | | 1.22 | | | | | | | | 4,023 | | | | 564,686 | |
| | | | | | | | | | | | | | | | |
| | | | |
Total Preferred Stocks (Cost $452,981) | | | | | | | | | | | | | | | 596,822 | |
| | | | | | | | | | | | | | | | |
The accompanying notes are an integral part of these financial statements.
| | | | |
| 20 | | Wells Fargo Diversified International Fund | | Portfolio of investments—October 31, 2017 |
| | | | | | | | | | | | | | | | |
| Security name | | | | | Expiration date | | | Shares | | | Value | |
| | | | |
Rights: 0.00% | | | | | | | | | | | | | | | | |
| | | | |
| Brazil: 0.00% | | | | | | | | | | | | | | | | |
Companhia Energetica de Minas Gerais Right (Utilities, Electric Utilities) † | | | | | | | 11-29-2017 | | | | 2,160 | | | $ | 766 | |
| | | | | | | | | | | | | | | | |
| | | | |
| Spain: 0.00% | | | | | | | | | | | | | | | | |
Banco Santander SA Right (Financials, Banks) † | | | | | | | 11-3-2017 | | | | 29,500 | | | | 1,409 | |
| | | | | | | | | | | | | | | | |
| | | | |
Total Rights (Cost $1,389) | | | | | | | | | | | | | | | 2,175 | |
| | | | | | | | | | | | | | | | |
| | | | |
| | | Yield | | | | | | | | | | |
| Short-Term Investments: 2.88% | | | | | | | | | | | | | | | | |
| | | | |
| Investment Companies: 2.88% | | | | | | | | | | | | | | | | |
Securities Lending Cash Investment LLC (l)(r)(u) | | | 1.26 | % | | | | | | | 798,430 | | | | 798,510 | |
Wells Fargo Government Money Market Fund Select Class (l)(u) | | | 0.96 | | | | | | | | 2,773,394 | | | | 2,773,394 | |
| | | | |
Total Short-Term Investments (Cost $3,571,902) | | | | | | | | | | | | | | | 3,571,904 | |
| | | | | | | | | | | | | | | | |
| | | | | | | | |
| Total investments in securities (Cost $103,107,957) | | | 100.12 | % | | | 124,144,654 | |
Other assets and liabilities, net | | | (0.12 | ) | | | (142,901 | ) |
| | | | | | | | |
| Total net assets | | | 100.00 | % | | $ | 124,001,753 | |
| | | | | | | | |
| † | Non-income-earning security |
| (a) | The security is fair valued in accordance with procedures approved by the Board of Trustees. |
| « | All or a portion of this security is on loan. |
| 144A | The security may be resold in transactions exempt from registration, normally to qualified institutional buyers, pursuant to Rule 144A under the Securities Act of 1933. |
| (l) | The issuer of the security is an affiliated person of the Fund as defined in the Investment Company Act of 1940. |
| (r) | The investment is a non-registered investment company purchased with cash collateral received from securities on loan. |
| (u) | The rate represents the 7-day annualized yield at period end. |
Forward Foreign Currency Contracts
| | | | | | | | | | | | | | |
Currency to be
received | | Currency to be
delivered | | Counterparty¤¤ | | Settlement date | | Unrealized
gains | | | Unrealized
losses | |
| 2,288,947 USD | | 1,728,700 GBP | | Morgan Stanley | | 12-12-2017 | | $ | 0 | | | ($ | 9,741 | ) |
| 2,444,016 USD | | 2,066,000 EUR | | Goldman Sachs | | 1-30-2018 | | | 24,722 | | | | 0 | |
| | | | | | | | | | | | | | |
| | | | | | | | $ | 24,722 | | | ($ | 9,741 | ) |
| | | | | | | | | | | | | | |
| | ¤¤ | Transactions can only be closed with the originating counterparty. |
The accompanying notes are an integral part of these financial statements.
| | | | | | |
| Portfolio of investments—October 31, 2017 | | Wells Fargo Diversified International Fund | | | 21 | |
Investments in Affiliates
An affiliated investment is an investment in which the Fund owns at least 5% of the outstanding voting shares of the issuer or as a result of other relationships, such as the Fund and the issuer having the same investment manager. Transactions with issuers that were either affiliated persons of the Fund at the beginning of the period or the end of the period were as follows:
| | | | | | | | | | | | | | | | | | | | | | | | | | | | | | | | | | | | |
| | | Shares,
beginning of
period | | | Shares
purchased | | | Shares
sold | | | Shares,
end of
period | | | Net
realized
gains
(losses) | | | Net
change in
unrealized
gains
(losses) | | | Income
from
affiliated
securities | | | Value,
end
of period | | | % of
net
assets | |
Short-Term Investments | | | | | | | | | | | | | | | | | | | | | | | | | | | | | | | | | | | | |
Investment companies | | | | | | | | | | | | | | | | | | | | | | | | | | | | | | | | | | | | |
Securities Lending Cash Investment LLC | | | 1,251,365 | | | | 41,907,230 | | | | 42,360,165 | | | | 798,430 | | | $ | 21 | | | $ | (52 | ) | | $ | 49,533 | | | $ | 798,510 | | | | | |
Wells Fargo Government Money Market Fund Select Class | | | 5,132,495 | | | | 31,413,037 | | | | 33,772,138 | | | | 2,773,394 | | | | 0 | | | | 0 | | | | 28,891 | | | | 2,773,394 | | | | | |
| | | | | | | | | | | | | | | | | | | | | | | | | | | | | | | | | | | | |
| | | | | | | | | | | | | | | | | | $ | 21 | | | $ | (52 | ) | | $ | 78,424 | | | $ | 3,571,904 | | | | 2.88 | % |
| | | | | | | | | | | | | | | | | | | | | | | | | | | | | | | | | | | | |
The accompanying notes are an integral part of these financial statements.
| | | | |
| 22 | | Wells Fargo Diversified International Fund | | Statement of assets and liabilities—October 31, 2017 |
| | | | |
| | | | |
| |
Assets | | | | |
Investments in unaffiliated securities (including $773,285 of securities loaned), at value (cost $99,536,055) | | $ | 120,572,750 | |
Investments in affiliated securities, at value (cost $3,571,902) | | | 3,571,904 | |
Cash | | | 3,126 | |
Foreign currency, at value (cost $327,632) | | | 325,246 | |
Receivable for investments sold | | | 256,791 | |
Receivable for Fund shares sold | | | 109,342 | |
Receivable for dividends | | | 436,549 | |
Receivable for securities lending income | | | 1,167 | |
Unrealized gains on forward foreign currency contracts | | | 24,722 | |
Prepaid expenses and other assets | | | 67,782 | |
| | | | |
Total assets | | | 125,369,379 | |
| | | | |
| |
Liabilities | | | | |
Payable upon receipt of securities loaned | | | 798,474 | |
Payable for investments purchased | | | 296,284 | |
Custodian and accounting fees payable | | | 86,709 | |
Management fee payable | | | 46,626 | |
Payable for Fund shares redeemed | | | 28,232 | |
Administration fees payable | | | 15,535 | |
Unrealized losses on forward foreign currency contracts | | | 9,741 | |
Distribution fees payable | | | 2,859 | |
Trustees’ fees and expenses payable | | | 37 | |
Accrued expenses and other liabilities | | | 83,129 | |
| | | | |
Total liabilities | | | 1,367,626 | |
| | | | |
Total net assets | | $ | 124,001,753 | |
| | | | |
| |
NET ASSETS CONSIST OF | | | | |
Paid-in capital | | $ | 113,407,895 | |
Undistributed net investment income | | | 2,927,725 | |
Accumulated net realized losses on investments | | | (13,384,826 | ) |
Net unrealized gains on investments | | | 21,050,959 | |
| | | | |
Total net assets | | $ | 124,001,753 | |
| | | | |
| |
COMPUTATION OF NET ASSET VALUE AND OFFERING PRICE PER SHARE | | | | |
Net assets – Class A | | $ | 64,346,910 | |
Shares outstanding – Class A1 | | | 4,805,057 | |
Net asset value per share – Class A | | | $13.39 | |
Maximum offering price per share – Class A2 | | | $14.21 | |
Net assets – Class C | | $ | 4,065,954 | |
Shares outstanding – Class C1 | | | 331,250 | |
Net asset value per share – Class C | | | $12.27 | |
Net assets – Class R | | $ | 31,398 | |
Shares outstanding – Class R1 | | | 2,309 | |
Net asset value per share – Class R | | | $13.60 | |
Net assets – Class R6 | | $ | 33,697,811 | |
Shares outstanding – Class R61 | | | 2,457,360 | |
Net asset value per share – Class R6 | | | $13.71 | |
Net assets – Administrator Class | | $ | 13,713,738 | |
Shares outstanding – Administrator Class1 | | | 1,005,454 | |
Net asset value per share – Administrator Class | | | $13.64 | |
Net assets – Institutional Class | | $ | 8,145,942 | |
Shares outstanding – Institutional Class1 | | | 634,522 | |
Net asset value per share – Institutional Class | | | $12.84 | |
| 1 | The Fund has an unlimited number of authorized shares. |
| 2 | Maximum offering price is computed as 100/94.25 of net asset value. On investments of $50,000 or more, the offering price is reduced. |
The accompanying notes are an integral part of these financial statements.
| | | | | | |
| Statement of operations—year ended October 31, 2017 | | Wells Fargo Diversified International Fund | | | 23 | |
| | | | |
| | | | |
| |
Investment income | | | | |
Dividends (net of foreign withholding taxes of $353,017) | | $ | 3,429,880 | |
Income from affiliated securities | | | 78,424 | |
| | | | |
Total investment income | | | 3,508,304 | |
| | | | |
| |
Expenses | | | | |
Management fee | | | 999,111 | |
Administration fees | | | | |
Class A | | | 129,108 | |
Class B | | | 2 | 1 |
Class C | | | 9,164 | |
Class R | | | 59 | |
Class R6 | | | 5,247 | |
Administrator Class | | | 15,152 | |
Institutional Class | | | 26,588 | |
Shareholder servicing fees | | | | |
Class A | | | 153,700 | |
Class B | | | 2 | 1 |
Class C | | | 10,910 | |
Class R | | | 71 | |
Administrator Class | | | 29,138 | |
Distribution fees | | | | |
Class B | | | 7 | 1 |
Class C | | | 32,729 | |
Class R | | | 71 | |
Custody and accounting fees | | | 232,766 | |
Professional fees | | | 57,040 | |
Registration fees | | | 112,583 | |
Shareholder report expenses | | | 67,004 | |
Trustees’ fees and expenses | | | 20,166 | |
Other fees and expenses | | | 55,220 | |
| | | | |
Total expenses | | | 1,955,838 | |
Less: Fee waivers and/or expense reimbursements | | | (529,909 | ) |
| | | | |
Net expenses | | | 1,425,929 | |
| | | | |
Net investment income | | | 2,082,375 | |
| | | | |
| |
REALIZED AND UNREALIZED GAINS (LOSSES) ON INVESTMENTS | | | | |
| |
Net realized gains on: | | | | |
Unaffiliated securities | | | 2,851,296 | |
Affiliated securities | | | 21 | |
Forward foreign currency contract transactions | | | 70,271 | |
| | | | |
Net realized gains on investments | | | 2,921,588 | |
| | | | |
| |
Net change in unrealized gains (losses) on: | | | | |
Unaffiliated securities | | | 19,474,285 | |
Affiliated securities | | | (52 | ) |
Forward foreign currency contract transactions | | | (102,941 | ) |
| | | | |
Net change in unrealized gains (losses) on investments | | | 19,371,292 | |
| | | | |
Net realized and unrealized gains (losses) on investments | | | 22,292,880 | |
| | | | |
Net increase in net assets resulting from operations | | $ | 24,375,255 | |
| | | | |
| 1 | For the period from November 1, 2016 to December 5, 2016. Effective at the close of business on December 5, 2016, Class B shares were converted to Class A shares and are no longer offered by the Fund. |
The accompanying notes are an integral part of these financial statements.
| | | | |
| 24 | | Wells Fargo Diversified International Fund | | Statement of changes in net assets |
| | | | | | | | | | | | | | | | |
| | | Year ended
October 31, 2017 | | | Year ended
October 31, 2016 | |
| | | | |
Operations | | | | | | | | | | | | | | | | |
Net investment income | | | | | | $ | 2,082,375 | | | | | | | $ | 1,909,544 | |
Net realized gains (losses) on investments | | | | | | | 2,921,588 | | | | | | | | (2,103,113 | ) |
Net change in unrealized gains (losses) on investments | | | | | | | 19,371,292 | | | | | | | | (4,109,274 | ) |
| | | | |
Net increase (decrease) in net assets resulting from operations | | | | | | | 24,375,255 | | | | | | | | (4,302,843 | ) |
| | | | |
| | | | |
Distributions to shareholders from | | | | | | | | | | | | | | | | |
Net investment income | | | | | | | | | | | | | | | | |
Class A | | | | | | | (1,161,061 | ) | | | | | | | (692,930 | ) |
Class C | | | | | | | (54,176 | ) | | | | | | | (30,743 | ) |
Class R | | | | | | | (434 | ) | | | | | | | (268 | ) |
Class R6 | | | | | | | (131,270 | ) | | | | | | | (54,538 | ) |
Administrator Class | | | | | | | (197,876 | ) | | | | | | | (136,524 | ) |
Institutional Class | | | | | | | (625,514 | ) | | | | | | | (249,898 | ) |
| | | | |
Total distributions to shareholders | | | | | | | (2,170,331 | ) | | | | | | | (1,164,901 | ) |
| | | | |
| | | | |
Capital share transactions | | | Shares | | | | | | | | Shares | | | | | |
Proceeds from shares sold | | | | | | | | | | | | | | | | |
Class A | | | 135,356 | | | | 1,651,415 | | | | 322,484 | | | | 3,510,932 | |
Class C | | | 59,340 | | | | 667,474 | | | | 281,595 | | | | 2,860,258 | |
Class R6 | | | 2,005,822 | | | | 25,485,197 | | | | 517,935 | | | | 6,092,247 | |
Administrator Class | | | 381,177 | | | | 4,685,042 | | | | 459,760 | | | | 5,176,981 | |
Institutional Class | | | 807,153 | | | | 8,925,286 | | | | 1,803,946 | | | | 19,585,715 | |
| | | | |
| | | | | | | 41,414,414 | | | | | | | | 37,226,133 | |
| | | | |
Reinvestment of distributions | | | | | | | | | | | | | | | | |
Class A | | | 104,664 | | | | 1,141,882 | | | | 60,092 | | | | 682,650 | |
Class C | | | 5,009 | | | | 50,389 | | | | 2,596 | | | | 27,233 | |
Class R | | | 40 | | | | 434 | | | | 23 | | | | 268 | |
Class R6 | | | 11,794 | | | | 131,270 | | | | 4,710 | | | | 54,538 | |
Administrator Class | | | 12,354 | | | | 137,133 | | | | 11,807 | | | | 136,486 | |
Institutional Class | | | 59,475 | | | | 619,734 | | | | 21,007 | | | | 227,935 | |
| | | | |
| | | | | | | 2,080,842 | | | | | | | | 1,129,110 | |
| | | | |
Payment for shares redeemed | | | | | | | | | | | | | | | | |
Class A | | | (945,211 | ) | | | (11,188,195 | ) | | | (1,217,038 | ) | | | (13,371,782 | ) |
Class B | | | (870 | )1 | | | (9,339 | )1 | | | (3,553 | ) | | | (39,685 | ) |
Class C | | | (161,156 | ) | | | (1,827,608 | ) | | | (188,833 | ) | | | (1,877,720 | ) |
Class R6 | | | (47,567 | ) | | | (608,453 | ) | | | (37,580 | ) | | | (419,983 | ) |
Administrator Class | | | (481,500 | ) | | | (5,617,290 | ) | | | (266,367 | ) | | | (2,965,371 | ) |
Institutional Class | | | (2,524,974 | ) | | | (30,049,009 | ) | | | (169,927 | ) | | | (1,825,525 | ) |
| | | | |
| | | | | | | (49,299,894 | ) | | | | | | | (20,500,066 | ) |
| | | | |
Net increase (decrease) in net assets resulting from capital share transactions | | | | | | | (5,804,638 | ) | | | | | | | 17,855,177 | |
| | | | |
Total increase in net assets | | | | | | | 16,400,286 | | | | | | | | 12,387,433 | |
| | | | |
| | | | |
Net assets | | | | | | | | | | | | | | | | |
Beginning of period | | | | | | | 107,601,467 | | | | | | | | 95,214,034 | |
| | | | |
End of period | | | | | | $ | 124,001,753 | | | | | | | $ | 107,601,467 | |
| | | | |
Undistributed net investment income | | | | | | $ | 2,927,725 | | | | | | | $ | 2,027,832 | |
| | | | |
| 1 | For the period from November 1, 2016 to December 5, 2016. Effective at the close of business on December 5, 2016, Class B shares were converted to Class A shares and are no longer offered by the Fund. |
The accompanying notes are an integral part of these financial statements.
| | | | | | |
| Financial highlights | | Wells Fargo Diversified International Fund | | | 25 | |
(For a share outstanding throughout each period)
| | | | | | | | | | | | | | | | | | | | |
| | | Year ended October 31 | |
| CLASS A | | 2017 | | | 2016 | | | 2015 | | | 2014 | | | 2013 | |
Net asset value, beginning of period | | | $11.08 | | | | $11.65 | | | | $12.01 | | | | $12.25 | | | | $10.25 | |
Net investment income | | | 0.19 | | | | 0.17 | | | | 0.13 | 1 | | | 0.24 | 1 | | | 0.19 | 1 |
Net realized and unrealized gains (losses) on investments | | | 2.34 | | | | (0.63 | ) | | | (0.21 | ) | | | (0.29 | ) | | | 2.41 | |
| | | | | | | | | | | | | | | | | | | | |
Total from investment operations | | | 2.53 | | | | (0.46 | ) | | | (0.08 | ) | | | (0.05 | ) | | | 2.60 | |
Distributions to shareholders from | | | | | | | | | | | | | | | | | | | | |
Net investment income | | | (0.22 | ) | | | (0.11 | ) | | | (0.28 | ) | | | (0.19 | ) | | | (0.60 | ) |
Net asset value, end of period | | | $13.39 | | | | $11.08 | | | | $11.65 | | | | $12.01 | | | | $12.25 | |
Total return2 | | | 23.27 | % | | | (3.96 | )% | | | (0.66 | )% | | | (0.49 | )% | | | 26.59 | % |
Ratios to average net assets (annualized) | | | | | | | | | | | | | | | | | | | | |
Gross expenses | | | 1.80 | % | | | 1.79 | % | | | 1.85 | % | | | 1.76 | % | | | 1.92 | % |
Net expenses | | | 1.35 | % | | | 1.35 | % | | | 1.40 | % | | | 1.41 | % | | | 1.41 | % |
Net investment income | | | 1.64 | % | | | 1.67 | % | | | 1.07 | % | | | 1.93 | % | | | 1.75 | % |
Supplemental data | | | | | | | | | | | | | | | | | | | | |
Portfolio turnover rate | | | 42 | % | | | 50 | % | | | 31 | % | | | 33 | % | | | 40 | % |
Net assets, end of period (000s omitted) | | | $64,347 | | | | $61,031 | | | | $73,891 | | | | $24,921 | | | | $28,928 | |
| 1 | Calculated based upon average shares outstanding |
| 2 | Total return calculations do not include any sales charges. |
The accompanying notes are an integral part of these financial statements.
| | | | |
| 26 | | Wells Fargo Diversified International Fund | | Financial highlights |
(For a share outstanding throughout each period)
| | | | | | | | | | | | | | | | | | | | |
| | | Year ended October 31 | |
| CLASS C | | 2017 | | | 2016 | | | 2015 | | | 2014 | | | 2013 | |
Net asset value, beginning of period | | | $10.16 | | | | $10.74 | | | | $11.08 | | | | $11.35 | | | | $9.54 | |
Net investment income | | | 0.10 | 1 | | | 0.10 | 1 | | | 0.04 | 1 | | | 0.13 | 1 | | | 0.09 | 1 |
Net realized and unrealized gains (losses) on investments | | | 2.15 | | | | (0.60 | ) | | | (0.20 | ) | | | (0.27 | ) | | | 2.25 | |
| | | | | | | | | | | | | | | | | | | | |
Total from investment operations | | | 2.25 | | | | (0.50 | ) | | | (0.16 | ) | | | (0.14 | ) | | | 2.34 | |
Distributions to shareholders from | | | | | | | | | | | | | | | | | | | | |
Net investment income | | | (0.14 | ) | | | (0.08 | ) | | | (0.18 | ) | | | (0.13 | ) | | | (0.53 | ) |
Net asset value, end of period | | | $12.27 | | | | $10.16 | | | | $10.74 | | | | $11.08 | | | | $11.35 | |
Total return2 | | | 22.51 | % | | | (4.72 | )% | | | (1.44 | )% | | | (1.24 | )% | | | 25.67 | % |
Ratios to average net assets (annualized) | | | | | | | | | | | | | | | | | | | | |
Gross expenses | | | 2.55 | % | | | 2.54 | % | | | 2.60 | % | | | 2.51 | % | | | 2.66 | % |
Net expenses | | | 2.10 | % | | | 2.10 | % | | | 2.15 | % | | | 2.16 | % | | | 2.16 | % |
Net investment income | | | 0.92 | % | | | 1.01 | % | | | 0.33 | % | | | 1.15 | % | | | 0.84 | % |
Supplemental data | | | | | | | | | | | | | | | | | | | | |
Portfolio turnover rate | | | 42 | % | | | 50 | % | | | 31 | % | | | 33 | % | | | 40 | % |
Net assets, end of period (000s omitted) | | | $4,066 | | | | $4,351 | | | | $3,573 | | | | $1,616 | | | | $1,746 | |
| 1 | Calculated based upon average shares outstanding |
| 2 | Total return calculations do not include any sales charges. |
The accompanying notes are an integral part of these financial statements.
| | | | | | |
| Financial highlights | | Wells Fargo Diversified International Fund | | | 27 | |
(For a share outstanding throughout each period)
| | | | | | | | | | | | |
| | | Year ended October 31 | |
| CLASS R | | 2017 | | | 2016 | | | 20151 | |
Net asset value, beginning of period | | | $11.25 | | | | $11.86 | | | | $11.13 | |
Net investment income (loss) | | | 0.18 | | | | 0.16 | 2 | | | (0.01 | ) |
Net realized and unrealized gains (losses) on investments | | | 2.36 | | | | (0.65 | ) | | | 0.74 | |
| | | | | | | | | | | | |
Total from investment operations | | | 2.54 | | | | (0.49 | ) | | | 0.73 | |
Distributions to shareholders from | | | | | | | | | | | | |
Net investment income | | | (0.19 | ) | | | (0.12 | ) | | | 0.00 | |
Net asset value, end of period | | | $13.60 | | | | $11.25 | | | | $11.86 | |
Total return3 | | | 22.97 | % | | | (4.16 | )% | | | 6.56 | % |
Ratios to average net assets (annualized) | | | | | | | | | | | | |
Gross expenses | | | 2.05 | % | | | 2.04 | % | | | 2.15 | % |
Net expenses | | | 1.60 | % | | | 1.60 | % | | | 1.60 | % |
Net investment income (loss) | | | 1.43 | % | | | 1.42 | % | | | (0.65 | )% |
Supplemental data | | | | | | | | | | | | |
Portfolio turnover rate | | | 42 | % | | | 50 | % | | | 31 | % |
Net assets, end of period (000s omitted) | | | $31 | | | | $26 | | | | $27 | |
| 1 | For the period from September 30, 2015 (commencement of class operations) to October 31, 2015 |
| 2 | Calculated based upon average shares outstanding |
| 3 | Returns for periods of less than one year are not annualized. |
The accompanying notes are an integral part of these financial statements.
| | | | |
| 28 | | Wells Fargo Diversified International Fund | | Financial highlights |
(For a share outstanding throughout each period)
| | | | | | | | | | | | |
| | | Year ended October 31 | |
| CLASS R6 | | 2017 | | | 2016 | | | 20151 | |
Net asset value, beginning of period | | | $11.33 | | | | $11.87 | | | | $11.13 | |
Net investment income | | | 0.30 | 2 | | | 0.26 | 2 | | | 0.00 | 3 |
Net realized and unrealized gains (losses) on investments | | | 2.34 | | | | (0.68 | ) | | | 0.74 | |
| | | | | | | | | | | | |
Total from investment operations | | | 2.64 | | | | (0.42 | ) | | | 0.74 | |
Distributions to shareholders from | | | | | | | | | | | | |
Net investment income | | | (0.26 | ) | | | (0.12 | ) | | | 0.00 | |
Net asset value, end of period | | | $13.71 | | | | $11.33 | | | | $11.87 | |
Total return4 | | | 23.88 | % | | | (3.55 | )% | | | 6.65 | % |
Ratios to average net assets (annualized) | | | | | | | | | | | | |
Gross expenses | | | 1.34 | % | | | 1.36 | % | | | 1.46 | % |
Net expenses | | | 0.89 | % | | | 0.89 | % | | | 0.89 | % |
Net investment income | | | 2.37 | % | | | 2.30 | % | | | 0.05 | % |
Supplemental data | | | | | | | | | | | | |
Portfolio turnover rate | | | 42 | % | | | 50 | % | | | 31 | % |
Net assets, end of period (000s omitted) | | | $33,698 | | | | $5,523 | | | | $27 | |
| 1 | For the period from September 30, 2015 (commencement of class operations) to October 31, 2015 |
| 2 | Calculated based upon average shares outstanding |
| 3 | Amount is less than $0.005. |
| 4 | Returns for periods of less than one year are not annualized. |
The accompanying notes are an integral part of these financial statements.
| | | | | | |
| Financial highlights | | Wells Fargo Diversified International Fund | | | 29 | |
(For a share outstanding throughout each period)
| | | | | | | | | | | | | | | | | | | | |
| | | Year ended October 31 | |
| ADMINISTRATOR CLASS | | 2017 | | | 2016 | | | 2015 | | | 2014 | | | 2013 | |
Net asset value, beginning of period | | | $11.28 | | | | $11.87 | | | | $12.23 | | | | $12.47 | | | | $10.42 | |
Net investment income | | | 0.22 | 1 | | | 0.20 | 1 | | | 0.16 | 1 | | | 0.26 | 1 | | | 0.19 | 1 |
Net realized and unrealized gains (losses) on investments | | | 2.37 | | | | (0.66 | ) | | | (0.22 | ) | | | (0.30 | ) | | | 2.47 | |
| | | | | | | | | | | | | | | | | | | | |
Total from investment operations | | | 2.59 | | | | (0.46 | ) | | | (0.06 | ) | | | (0.04 | ) | | | 2.66 | |
Distributions to shareholders from | | | | | | | | | | | | | | | | | | | | |
Net investment income | | | (0.23 | ) | | | (0.13 | ) | | | (0.30 | ) | | | (0.20 | ) | | | (0.61 | ) |
Net asset value, end of period | | | $13.64 | | | | $11.28 | | | | $11.87 | | | | $12.23 | | | | $12.47 | |
Total return | | | 23.46 | % | | | (3.90 | )% | | | (0.46 | )% | | | (0.39 | )% | | | 26.85 | % |
Ratios to average net assets (annualized) | | | | | | | | | | | | | | | | | | | | |
Gross expenses | | | 1.72 | % | | | 1.71 | % | | | 1.72 | % | | | 1.60 | % | | | 1.74 | % |
Net expenses | | | 1.25 | % | | | 1.25 | % | | | 1.25 | % | | | 1.25 | % | | | 1.25 | % |
Net investment income | | | 1.79 | % | | | 1.83 | % | | | 1.31 | % | | | 2.10 | % | | | 1.72 | % |
Supplemental data | | | | | | | | | | | | | | | | | | | | |
Portfolio turnover rate | | | 42 | % | | | 50 | % | | | 31 | % | | | 33 | % | | | 40 | % |
Net assets, end of period (000s omitted) | | | $13,714 | | | | $12,334 | | | | $10,540 | | | | $7,283 | | | | $8,195 | |
| 1 | Calculated based upon average shares outstanding |
The accompanying notes are an integral part of these financial statements.
| | | | |
| 30 | | Wells Fargo Diversified International Fund | | Financial highlights |
(For a share outstanding throughout each period)
| | | | | | | | | | | | | | | | | | | | |
| | | Year ended October 31 | |
| INSTITUTIONAL CLASS | | 2017 | | | 2016 | | | 2015 | | | 2014 | | | 2013 | |
Net asset value, beginning of period | | | $10.61 | | | | $11.14 | | | | $11.50 | | | | $11.79 | | | | $10.20 | |
Net investment income | | | 0.23 | 1 | | | 0.23 | 1 | | | 0.17 | 1 | | | 0.26 | 1 | | | 0.20 | 1 |
Net realized and unrealized gains (losses) on investments | | | 2.25 | | | | (0.63 | ) | | | (0.20 | ) | | | (0.27 | ) | | | 2.37 | |
| | | | | | | | | | | | | | | | | | | | |
Total from investment operations | | | 2.48 | | | | (0.40 | ) | | | (0.03 | ) | | | (0.01 | ) | | | 2.57 | |
Distributions to shareholders from | | | | | | | | | | | | | | | | | | | | |
Net investment income | | | (0.25 | ) | | | (0.13 | ) | | | (0.33 | ) | | | (0.28 | ) | | | (0.98 | ) |
Net asset value, end of period | | | $12.84 | | | | $10.61 | | | | $11.14 | | | | $11.50 | | | | $11.79 | |
Total return | | | 23.91 | % | | | (3.63 | )% | | | (0.23 | )% | | | (0.18 | )% | | | 27.28 | % |
Ratios to average net assets (annualized) | | | | | | | | | | | | | | | | | | | | |
Gross expenses | | | 1.49 | % | | | 1.46 | % | | | 1.47 | % | | | 1.33 | % | | | 1.50 | % |
Net expenses | | | 0.99 | % | | | 0.99 | % | | | 0.99 | % | | | 0.99 | % | | | 0.99 | % |
Net investment income | | | 2.02 | % | | | 2.16 | % | | | 1.45 | % | | | 2.23 | % | | | 1.94 | % |
Supplemental data | | | | | | | | | | | | | | | | | | | | |
Portfolio turnover rate | | | 42 | % | | | 50 | % | | | 31 | % | | | 33 | % | | | 40 | % |
Net assets, end of period (000s omitted) | | | $8,146 | | | | $24,328 | | | | $7,106 | | | | $2,683 | | | | $2,406 | |
| 1 | Calculated based upon average shares outstanding |
The accompanying notes are an integral part of these financial statements.
| | | | | | |
| Notes to financial statements | | Wells Fargo Diversified International Fund | | | 31 | |
1. ORGANIZATION
Wells Fargo Funds Trust (the “Trust”), a Delaware statutory trust organized on March 10, 1999, is an open-end management investment company registered under the Investment Company Act of 1940, as amended (the “1940 Act”). As an investment company, the Trust follows the accounting and reporting guidance in Financial Accounting Standards Board Accounting Standards Codification Topic 946, Financial Services – Investment Companies. These financial statements report on the Wells Fargo Diversified International Fund (the “Fund”) which is a diversified series of the Trust.
Effective at the close of business on December 5, 2016, Class B shares were converted to Class A shares and are no longer offered by the Fund. Information for Class B shares reflected in the financial statements represents activity through December 5, 2016.
2. SIGNIFICANT ACCOUNTING POLICIES
The following significant accounting policies, which are consistently followed in the preparation of the financial statements of the Fund, are in conformity with U.S. generally accepted accounting principles which require management to make estimates and assumptions that affect the reported amounts of assets and liabilities, disclosure of contingent assets and liabilities at the date of the financial statements, and the reported amounts of revenues and expenses during the reporting period. Actual results could differ from those estimates.
Securities valuation
All investments are valued each business day as of the close of regular trading on the New York Stock Exchange (generally 4 p.m. Eastern Time), although the Fund may deviate from this calculation time under unusual or unexpected circumstances.
Equity securities that are listed on a foreign or domestic exchange or market are valued at the official closing price or, if none, the last sales price. If no sale occurs on the principal exchange or market that day, a fair value price will be determined in accordance with the Fund’s Valuation Procedures.
The values of securities denominated in foreign currencies are translated into U.S. dollars at rates provided by an independent foreign currency pricing source at a time each business day specified by the Management Valuation Team of Wells Fargo Funds Management, LLC (“Funds Management”).
Many securities markets and exchanges outside the U.S. close prior to the close of the New York Stock Exchange and therefore may not fully reflect trading or events that occur after the close of the principal exchange in which the foreign securities are traded, but before the close of the New York Stock Exchange. If such trading or events are expected to materially affect the value of such securities, then fair value pricing procedures approved by the Board of Trustees of the Fund are applied. These procedures take into account multiple factors including movements in U.S. securities markets after foreign exchanges close. Foreign securities that are fair valued under these procedures are categorized as Level 2 and the application of these procedures may result in transfers between Level 1 and Level 2. Depending on market activity, such fair valuations may be frequent. Such fair value pricing may result in net asset values that are higher or lower than net asset values based on the last reported sales price or latest quoted bid price. On October 31, 2017, such fair value pricing was not used in pricing foreign securities.
Investments in registered open-end investment companies are valued at net asset value. Interests in non-registered investment companies that are redeemable at net asset value are fair valued normally at net asset value.
Investments which are not valued using any of the methods discussed above are valued at their fair value, as determined in good faith by the Board of Trustees. The Board of Trustees has established a Valuation Committee comprised of the Trustees and has delegated to it the authority to take any actions regarding the valuation of portfolio securities that the Valuation Committee deems necessary or appropriate, including determining the fair value of portfolio securities, unless the determination has been delegated to the Management Valuation Team. The Board of Trustees retains the authority to make or ratify any valuation decisions or approve any changes to the Valuation Procedures as it deems appropriate. On a quarterly basis, the Board of Trustees receives reports on any valuation actions taken by the Valuation Committee or the Management Valuation Team which may include items for ratification.
Valuations of fair valued securities are compared to the next actual sales price when available, or other appropriate market values, to assess the continued appropriateness of the fair valuation methodologies used. These securities are fair valued on a day-to-day basis, taking into consideration changes to appropriate market information and any significant changes to the inputs considered in the valuation process until there is a readily available price provided on an exchange or by an independent pricing service. Valuations received from an independent pricing service or independent broker-dealer quotes
| | | | |
| 32 | | Wells Fargo Diversified International Fund | | Notes to financial statements |
are periodically validated by comparisons to most recent trades and valuations provided by other independent pricing services in addition to the review of prices by the manager and/or subadviser. Unobservable inputs used in determining fair valuations are identified based on the type of security, taking into consideration factors utilized by market participants in valuing the investment, knowledge about the issuer and the current market environment.
Foreign currency translation
The accounting records of the Fund are maintained in U.S. dollars. The values of other assets and liabilities denominated in foreign currencies are translated into U.S. dollars at rates provided by an independent foreign currency pricing source at a time each business day specified by the Management Valuation Team. Purchases and sales of securities, and income and expenses are converted at the rate of exchange on the respective dates of such transactions. Net realized foreign exchange gains or losses arise from sales of foreign currencies, currency gains or losses realized between the trade and settlement dates on securities transactions, and the difference between the amounts of dividends, interest and foreign withholding taxes recorded and the U.S. dollar equivalent of the amounts actually paid or received. Net unrealized foreign exchange gains and losses arise from changes in the fair value of assets and liabilities other than investments in securities resulting from changes in exchange rates. The changes in net assets arising from changes in exchange rates of securities and the changes in net assets resulting from changes in market prices of securities are not separately presented. Such changes are included in net realized and unrealized gains or losses from investments.
Participation notes
The Fund may invest in participation notes to gain exposure to securities in certain foreign markets. Participation notes are issued by banks or broker-dealers and are designed to offer a return linked to a particular underlying foreign security. Participation notes involve transaction costs, which may be higher than those applicable to the underlying foreign security. The holder of the participation note is entitled to receive from the bank or broker-dealer, an amount equal to the dividend paid by the issuer of the underlying foreign security; however, the holder is not entitled to the same rights (i.e. dividends, voting rights) as an owner of the underlying foreign security. Investments in participation notes involve risks beyond those normally associated with a direct investment in an underlying security. The Fund has no rights against the issuer of the underlying foreign security and participation notes expose the Fund to counterparty risk in the event the counterparty does not perform. There is also no assurance there will be a secondary trading market for the participation note or that the trading price of the participation note will equal the underlying value of the foreign security that it seeks to replicate.
Forward foreign currency contracts
The Fund is subject to foreign currency risk in the normal course of pursuing its investment objectives. A forward foreign currency contract is an agreement between two parties to purchase or sell a specific currency for an agreed-upon price at a future date. The Fund enters into forward foreign currency contracts to facilitate transactions in foreign-denominated securities and to attempt to minimize the risk to the Fund from adverse changes in the relationship between currencies. Forward foreign currency contracts are recorded at the forward rate and marked-to-market daily. When the contracts are closed, realized gains and losses arising from such transactions are recorded as realized gains or losses on forward foreign currency contract transactions. The Fund could be exposed to risks if the counterparties to the contracts are unable to meet the terms of their contracts or if the value of the foreign currency changes unfavorably. The Fund’s maximum risk of loss from counterparty credit risk is the unrealized gains on the contracts. This risk may be mitigated if there is a master netting arrangement between the Fund and the counterparty.
Security loans
The Fund may lend its securities from time to time in order to earn additional income in the form of fees or interest on securities received as collateral or the investment of any cash received as collateral. The Fund continues to receive interest or dividends on the securities loaned. The Fund receives collateral in the form of cash or securities with a value at least equal to the value of the securities on loan. The value of the loaned securities is determined at the close of each business day and any additional required collateral is delivered to the Fund on the next business day. In a securities lending transaction, the net asset value of the Fund will be affected by an increase or decrease in the value of the securities loaned and by an increase or decrease in the value of the instrument in which collateral is invested. The amount of securities lending activity undertaken by the Fund fluctuates from time to time. In the event of default or bankruptcy by the borrower, the Fund may be prevented from recovering the loaned securities or gaining access to the collateral or may experience delays or costs in doing so. In addition, the investment of any cash collateral received may lose all or part of its value. The Fund has the right under the lending agreement to recover the securities from the borrower on demand.
The Fund lends its securities through an unaffiliated securities lending agent. Cash collateral received in connection with its securities lending transactions is invested in Securities Lending Cash Investments, LLC (the “Securities Lending Fund”). The
| | | | | | |
| Notes to financial statements | | Wells Fargo Diversified International Fund | | | 33 | |
Securities Lending Fund is exempt from registration under Section 3(c)(7) of the 1940 Act and is managed by Funds Management and is subadvised by Wells Capital Management Incorporated (“WellsCap”), an affiliate of Funds Management and an indirect wholly owned subsidiary of Wells Fargo & Company (“Wells Fargo”). Funds Management receives an advisory fee starting at 0.05% and declining to 0.01% as the average daily net assets of the Securities Lending Fund increase. All of the fees received by Funds Management are paid to WellsCap for its services as subadviser. The Securities Lending Fund seeks to provide a positive return compared to the daily Fed Funds Open Rate by investing in high-quality, U.S. dollar-denominated short-term money market instruments. Securities Lending Fund investments are valued at the evaluated bid price provided by an independent pricing service. Income earned from investment in the Securities Lending Fund is included in income from affiliates securities on the Statement of Operations.
Security transactions and income recognition
Securities transactions are recorded on a trade date basis. Realized gains or losses are recorded on the basis of identified cost.
Dividend income is recognized on the ex-dividend date, except for certain dividends from foreign securities, which are recorded as soon as the custodian verifies the ex-dividend date. Dividend income from foreign securities is recorded net of foreign taxes withheld where recovery of such taxes is not assured.
Distributions to shareholders
Distributions to shareholders from net investment income and net realized gains, if any, are recorded on the ex-dividend date. Such distributions are determined in accordance with income tax regulations and may differ from U.S. generally accepted accounting principles. Dividend sources are estimated at the time of declaration. The tax character of distributions is determined as of the Fund’s fiscal year end. Therefore, a portion of the Fund’s distributions made prior to the Fund’s fiscal year end may be categorized as a tax return of capital.
Federal and other taxes
The Fund intends to continue to qualify as a regulated investment company by distributing substantially all of its investment company taxable income and any net realized capital gains (after reduction for capital loss carryforwards) sufficient to relieve it from all, or substantially all, federal income taxes. Accordingly, no provision for federal income taxes was required.
The Fund’s income and federal excise tax returns and all financial records supporting those returns for the prior three fiscal years are subject to examination by the federal and Delaware revenue authorities. Management has analyzed the Fund’s tax positions taken on federal, state, and foreign tax returns for all open tax years and does not believe that there are any uncertain tax positions that require recognition of a tax liability.
As of October 31, 2017, the aggregate cost of all investments for federal income tax purposes was $105,052,330 and the unrealized gains (losses) consisted of:
| | | | |
Gross unrealized gains | | | $24,490,039 | |
Gross unrealized losses | | | (5,397,715 | ) |
Net unrealized gains | | | $19,092,324 | |
Reclassifications are made to the Fund’s capital accounts for permanent tax differences to reflect income and gains available for distribution (or available capital loss carryforwards) under federal income tax regulations. U.S. generally accepted accounting principles require that certain components of net assets be adjusted to reflect permanent differences between financial and tax reporting. These reclassifications have no effect on net assets or net asset values per share. The primary permanent differences causing such reclassifications are due to expiration of capital loss carryforwards, corporate actions, and foreign currency transactions. At October 31, 2017, as a result of permanent book-to-tax differences, the following reclassification adjustments were made on the Statement of Assets and Liabilities:
| | | | |
| Paid-in capital | | Undistributed net
investment income | | Accumulated net
realized losses
on investments |
| $(89,306,476) | | $987,849 | | $88,318,627 |
As of October 31, 2017, the Fund had capital loss carryforwards which consist of $11,186,599 in short-term capital losses and $460,833 in long-term capital losses.
| | | | |
| 34 | | Wells Fargo Diversified International Fund | | Notes to financial statements |
Class allocations
The separate classes of shares offered by the Fund differ principally in applicable sales charges, distribution, shareholder servicing, and administration fees. Class specific expenses are charged directly to that share class. Investment income, common expenses, and realized and unrealized gains (losses) on investments are allocated daily to each class of shares based on the relative proportion of net assets of each class.
3. FAIR VALUATION MEASUREMENTS
Fair value measurements of investments are determined within a framework that has established a fair value hierarchy based upon the various data inputs utilized in determining the value of the Fund’s investments. The three-level hierarchy gives the highest priority to unadjusted quoted prices in active markets for identical assets or liabilities (Level 1) and the lowest priority to unobservable inputs (Level 3). The Fund’s investments are classified within the fair value hierarchy based on the lowest level of input that is significant to the fair value measurement. The inputs are summarized into three broad levels as follows:
| ∎ | | Level 1 – quoted prices in active markets for identical securities |
| ∎ | | Level 2 – other significant observable inputs (including quoted prices for similar securities, interest rates, prepayment speeds, credit risk, etc.) |
| ∎ | | Level 3 – significant unobservable inputs (including the Fund’s own assumptions in determining the fair value of investments) |
The inputs or methodologies used for valuing investments in securities are not necessarily an indication of the risk associated with investing in those securities.
| | | | | | |
| Notes to financial statements | | Wells Fargo Diversified International Fund | | | 35 | |
The following is a summary of the inputs used in valuing the Fund’s assets and liabilities as of October 31, 2017:
| | | | | | | | | | | | | | | | |
| | | Quoted prices
(Level 1) | | | Other significant
observable inputs
(Level 2) | | | Significant
unobservable inputs (Level 3) | | | Total | |
Assets | | | | | | | | | | | | | | | | |
Investments in: | | | | | | | | | | | | | | | | |
| | | | |
Common stocks | | | | | | | | | | | | | | | | |
Australia | | $ | 1,713,676 | | | $ | 0 | | | $ | 0 | | | $ | 1,713,676 | |
Austria | | | 543,016 | | | | 0 | | | | 0 | | | | 543,016 | |
Brazil | | | 1,852,927 | | | | 0 | | | | 0 | | | | 1,852,927 | |
Canada | | | 2,950,855 | | | | 0 | | | | 0 | | | | 2,950,855 | |
Chile | | | 48,270 | | | | 0 | | | | 0 | | | | 48,270 | |
China | | | 6,487,076 | | | | 43 | | | | 0 | | | | 6,487,119 | |
Denmark | | | 774,552 | | | | 0 | | | | 0 | | | | 774,552 | |
France | | | 8,007,805 | | | | 0 | | | | 0 | | | | 8,007,805 | |
Germany | | | 19,566,215 | | | | 0 | | | | 0 | | | | 19,566,215 | |
Hong Kong | | | 2,385,220 | | | | 0 | | | | 0 | | | | 2,385,220 | |
Hungary | | | 87,071 | | | | 0 | | | | 0 | | | | 87,071 | |
Indonesia | | | 237,523 | | | | 0 | | | | 0 | | | | 237,523 | |
Ireland | | | 1,449,230 | | | | 0 | | | | 0 | | | | 1,449,230 | |
Israel | | | 315,351 | | | | 0 | | | | 0 | | | | 315,351 | |
Italy | | | 6,117,377 | | | | 0 | | | | 0 | | | | 6,117,377 | |
Japan | | | 18,363,121 | | | | 0 | | | | 0 | | | | 18,363,121 | |
Malaysia | | | 1,211,411 | | | | 0 | | | | 0 | | | | 1,211,411 | |
Netherlands | | | 8,308,304 | | | | 0 | | | | 0 | | | | 8,308,304 | |
Norway | | | 2,038,508 | | | | 0 | | | | 0 | | | | 2,038,508 | |
Poland | | | 77,317 | | | | 0 | | | | 0 | | | | 77,317 | |
Portugal | | | 177,683 | | | | 0 | | | | 0 | | | | 177,683 | |
Russia | | | 1,547,781 | | | | 0 | | | | 0 | | | | 1,547,781 | |
Singapore | | | 477,363 | | | | 0 | | | | 0 | | | | 477,363 | |
South Africa | | | 1,437,153 | | | | 0 | | | | 0 | | | | 1,437,153 | |
South Korea | | | 4,528,448 | | | | 0 | | | | 0 | | | | 4,528,448 | |
Spain | | | 1,708,977 | | | | 0 | | | | 0 | | | | 1,708,977 | |
Sweden | | | 415,820 | | | | 0 | | | | 0 | | | | 415,820 | |
Switzerland | | | 5,852,013 | | | | 0 | | | | 0 | | | | 5,852,013 | |
Taiwan | | | 1,012,318 | | | | 0 | | | | 0 | | | | 1,012,318 | |
Thailand | | | 400,757 | | | | 0 | | | | 0 | | | | 400,757 | |
United Kingdom | | | 16,123,243 | | | | 0 | | | | 0 | | | | 16,123,243 | |
United States | | | 2,240,662 | | | | 0 | | | | 0 | | | | 2,240,662 | |
| | | | |
Participation notes | | | | | | | | | | | | | | | | |
China | | | 0 | | | | 353,261 | | | | 0 | | | | 353,261 | |
Ireland | | | 0 | | | | 1,163,406 | | | | 0 | | | | 1,163,406 | |
| | | | |
Preferred stocks | | | | | | | | | | | | | | | | |
Brazil | | | 32,136 | | | | 0 | | | | 0 | | | | 32,136 | |
Germany | | | 564,686 | | | | 0 | | | | 0 | | | | 564,686 | |
| | | | |
Rights | | | | | | | | | | | | | | | | |
Brazil | | | 0 | | | | 766 | | | | 0 | | | | 766 | |
Spain | | | 0 | | | | 1,409 | | | | 0 | | | | 1,409 | |
| | | | |
Short-term investments | | | | | | | | | | | | | | | | |
Investment companies | | | 2,773,394 | | | | 0 | | | | 0 | | | | 2,773,394 | |
Investments measured at net asset value* | | | | | | | | | | | | | | | 798,510 | |
| | | 121,827,259 | | | | 1,518,885 | | | | 0 | | | | 124,144,654 | |
Forward foreign currency contracts | | | 0 | | | | 24,722 | | | | 0 | | | | 24,722 | |
Total assets | | $ | 121,827,259 | | | $ | 1,543,607 | | | $ | 0 | | | $ | 124,169,376 | |
Liabilities | | | | | | | | | | | | | | | | |
Forward foreign currency contracts | | $ | 0 | | | $ | 9,741 | | | $ | 0 | | | $ | 9,741 | |
Total liabilities | | $ | 0 | | | $ | 9,741 | | | $ | 0 | | | $ | 9,741 | |
| * | Investments that are measured at fair value using the net asset value per share (or its equivalent) as a practical expedient have not been categorized in the fair value hierarchy. The fair value amount presented in the table is intended to permit reconciliation of the fair value hierarchy to the amounts presented in the Statement of Assets and Liabilities. The Fund’s investment in Securities Lending Cash Investments, LLC valued at $798,510 does not have a redemption period notice, can be redeemed daily and does not have any unfunded commitments. |
| | | | |
| 36 | | Wells Fargo Diversified International Fund | | Notes to financial statements |
Forward foreign currency contracts are reported at their unrealized gains (losses) at measurement date, which represents the change in the contract’s value from trade date. All other assets and liabilities are reported at their market value at measurement date.
The Fund recognizes transfers between levels within the fair value hierarchy at the end of the reporting period. At October 31, 2017, the Fund did not have any transfers into/out of Level 1, Level 2, or Level 3.
4. TRANSACTIONS WITH AFFILIATES AND OTHER EXPENSES
Management fee
Funds Management, an indirect wholly owned subsidiary of Wells Fargo, is the manager of the Fund and provides advisory and fund-level administrative services under an investment management agreement. Under the investment management agreement, Funds Management is responsible for, among other services, implementing the investment objectives and strategies of the Fund, supervising the applicable subadvisers, providing fund-level administrative services in connection with the Fund’s operations, and providing any other fund-level administrative services reasonably necessary for the operation of the Fund. As compensation for its services under the investment management agreement, Funds Management is entitled to receive an annual management fee starting at 0.85% and declining to 0.68% as the average daily net assets of the Fund increase. Prior to March 1, 2017, Fund Management is entitled to receive an annual management fee starting at 0.90% and declining to 0.73% as the average daily net assets of the Fund increase. For the year ended October 31, 2017, the management fee was equivalent to an annual rate of 0.87% of the Fund’s average daily net assets.
Funds Management has retained the services of certain subadvisers to provide daily portfolio management to the Fund. The fee for subadvisory services is borne by Funds Management. Artisan Partners Limited Partnership, LSV Asset Management, and WellsCap are the subadvisers to the Fund and are each entitled to receive a fee from Funds Management which is calculated based on the average daily net assets of the Fund as follows:
| | | | | | | | |
| | | Annual subadvisory fee | |
| | | starting at | | | declining to | |
Artisan Partners Limited Partnership | | | 0.80 | % | | | 0.50 | % |
LSV Asset Management | | | 0.35 | | | | 0.30 | |
WellsCap | | | 0.45 | | | | 0.40 | |
Administration fees
Under a class-level administration agreement, Funds Management provides class-level administrative services to the Fund, which includes paying fees and expenses for services provided by the transfer agent, sub-transfer agents, omnibus account servicers and record-keepers. As compensation for its services under the class-level administration agreement, Funds Management receives an annual fee which is calculated based on the average daily net assets of each class as follows:
| | | | |
| | | Class-level
administration fee | |
Class A, Class B, Class C, Class R | | | 0.21 | % |
Class R6 | | | 0.03 | |
Administrator Class, Institutional Class | | | 0.13 | |
Funds Management has contractually waived and/or reimbursed management and administration fees to the extent necessary to maintain certain net operating expense ratios for the Fund. Waiver of fees and/or reimbursement of expenses by Funds Management were made first from fund level expenses on a proportionate basis and then from class specific expenses. Funds Management has committed through February 28, 2018 to waive fees and/or reimburse expenses to the extent necessary to cap the Fund’s expenses at 1.35% for Class A shares, 2.10% for Class C shares, 1.60% for Class R shares, 0.89% for Class R6 shares, 1.25% for Administrator Class shares, and 0.99% for Institutional Class shares. After this time, the cap may be increased or the commitment to maintain the cap may be terminated only with the approval of the Board of Trustees.
Out-of-pocket reimbursements
During the year ended October 31, 2017, State Street Bank and Trust Company (“State Street”), the Fund’s custodian, reimbursed the Fund $19,158 for certain out-of-pocket expenses that were billed to the Fund in error from 1998-2015. This amount is included in dividend income on the Statement of Operations. In addition, Funds Management was also reimbursed $68,706 by State Street for waivers/reimbursements it made to the Fund to limit Fund expenses during the period the Fund was erroneously billed.
| | | | | | |
| Notes to financial statements | | Wells Fargo Diversified International Fund | | | 37 | |
Distribution fees
The Trust has adopted a distribution plan for Class B, Class C, and Class R shares of the Fund pursuant to Rule 12b-1 under the 1940 Act. Distribution fees are charged to Class B, Class C, and Class R shares and paid to Wells Fargo Funds Distributor, LLC (“Funds Distributor”), the principal underwriter, at an annual rate of 0.75% of the average daily net assets of Class B and Class C shares and 0.25% of the average daily net assets of Class R shares.
In addition, Funds Distributor is entitled to receive the front-end sales charge from the purchase of Class A shares and a contingent deferred sales charge on the redemption of certain Class A shares. Funds Distributor is also entitled to receive the contingent deferred sales charges from redemptions of Class B and Class C shares. For the year ended October 31, 2017, Funds Distributor received $853 from the sale of Class A shares. No contingent deferred sales charges were incurred by Class A, Class B, and Class C shares for the year ended October 31, 2017.
Shareholder servicing fees
The Trust has entered into contracts with one or more shareholder servicing agents, whereby Class A, Class B, Class C, Class R, and Administrator Class of the Fund are charged a fee at an annual rate of 0.25% of the average daily net assets of each respective class.
A portion of these total shareholder servicing fees were paid to affiliates of Wells Fargo.
Interfund transactions
The Fund may purchase or sell portfolio investment securities to certain other Wells Fargo affiliates pursuant to Rule 17a-7 under the 1940 Act and under procedures adopted by the Board of Trustees. The procedures have been designed to ensure that these interfund transactions, which do not incur broker commissions, are effected at current market prices.
5. INVESTMENT PORTFOLIO TRANSACTIONS
Purchases and sales of investments, excluding U.S. government obligations (if any) and short-term securities, for the year ended October 31, 2017 were $46,610,024 and $49,414,677, respectively.
6. DERIVATIVE TRANSACTIONS
During the year ended October 31, 2017, the Fund entered into forward foreign currency contracts for economic hedging purposes. The Fund had average contract amounts of $1,257,661 and $5,219,308 in forward foreign currency contracts to buy and forward foreign currency contracts to sell, respectively, during the year ended October 31, 2017.
The fair value, realized gains or losses and change in unrealized gains or losses, if any, on derivative instruments are reflected in the corresponding financial statement captions.
For certain types of derivative transactions, the Fund has entered into International Swaps and Derivatives Association, Inc. master agreements (“ISDA Master Agreements”) or similar agreements with approved counterparties. The ISDA Master Agreements or similar agreements may have requirements to deliver/deposit securities or cash to/with an exchange or broker-dealer as collateral and allows the Fund to offset, with each counterparty, certain derivative financial instrument’s assets and/or liabilities with collateral held or pledged. Collateral requirements differ by type of derivative. Collateral or margin requirements are set by the broker or exchange clearinghouse for exchange traded derivatives while collateral terms are contract specific for over-the-counter traded derivatives. Cash collateral that has been pledged to cover obligations of the Fund under ISDA Master Agreements or similar agreements, if any, are reported separately in the Statement of Assets and Liabilities. Securities pledged as collateral, if any, are noted in the Portfolio of Investments. With respect to balance sheet offsetting, absent an event of default by the counterparty or a termination of the agreement, the reported amounts of financial assets and financial liabilities in the Statement of Assets and Liabilities are not offset across transactions between the Fund and the applicable counterparty. A reconciliation of the gross amounts on the Statement of Assets and Liabilities to the net amounts by derivative type, including any collateral exposure, is as follows:
| | | | | | | | | | | | | | | | |
| Counterparty | | Gross amounts
of assets in the
Statement of
Assets and
Liabilities
| | | Amounts
subject to
netting
agreements
| | | Collateral
received | | | Net amount
of assets | |
Goldman Sachs | | | $24,722 | | | | $0 | | | $ | 0 | | | $ | 24,722 | |
| | | | | | | | | | | | | | | | |
| Counterparty | | Gross amounts
of liabilities in the Statement of
Assets and
Liabilities | | | Amounts
subject to
netting
agreements
| | | Collateral
pledged | | | Net amount
of liabilities | |
Morgan Stanley | | | $9,741 | | | | $0 | | | $ | 0 | | | $ | 9,741 | |
| | | | |
| 38 | | Wells Fargo Diversified International Fund | | Notes to financial statements |
7. BANK BORROWINGS
The Trust (excluding the money market funds and certain other funds) and Wells Fargo Variable Trust are parties to a $280,000,000 revolving credit agreement whereby the Fund is permitted to use bank borrowings for temporary or emergency purposes, such as to fund shareholder redemption requests. Interest under the credit agreement is charged to the Fund based on a borrowing rate equal to the higher of the Federal Funds rate in effect on that day plus 1.25% or the overnight LIBOR rate in effect on that day plus 1.25%. In addition, an annual commitment fee equal to 0.25% of the unused balance is allocated to each participating fund. Prior to August 29, 2017, the revolving credit agreement amount was $250,000,000.
For the year ended October 31, 2017, there were no borrowings by the Fund under the agreement.
8. DISTRIBUTIONS TO SHAREHOLDERS
The tax character of distributions paid was $2,170,331 and $1,164,901 of ordinary income for the years ended October 31, 2017 and October 31, 2016, respectively.
As of October 31, 2017, the components of distributable earnings on a tax basis were as follows:
| | | | |
Undistributed
ordinary
income | | Unrealized
gains | | Capital loss
carryforward |
| $3,148,849 | | $19,092,441 | | $(11,647,432) |
9. CONCENTRATION RISK
Concentration risks result from exposure to a limited number of sectors. A fund that invests a substantial portion of its assets in any sector may be more affected by changes in that sector than would be a fund whose investments are not heavily weighted in any sector.
10. INDEMNIFICATION
Under the Trust’s organizational documents, the officers and Trustees have been granted certain indemnification rights against certain liabilities that may arise out of performance of their duties to the Trust. Additionally, in the normal course of business, the Trust may enter into contracts with service providers that contain a variety of indemnification clauses. The Trust’s maximum exposure under these arrangements is dependent on future claims that may be made against the Fund and, therefore, cannot be estimated.
| | | | | | |
| Report of independent registered public accounting firm | | Wells Fargo Diversified International Fund | | | 39 | |
BOARD OF TRUSTEES AND SHAREHOLDERS OF WELLS FARGO FUNDS TRUST:
We have audited the accompanying statement of assets and liabilities, including the portfolio of investments, of the Wells Fargo Diversified International Fund (the “Fund”), one of the funds constituting the Wells Fargo Funds Trust, as of October 31, 2017, and the related statements of operations for the year then ended, the statements of changes in net assets for each of the years in the two-year period then ended, and the financial highlights for each of the years or periods in the five-year period then ended. These financial statements and financial highlights are the responsibility of the Fund’s management. Our responsibility is to express an opinion on these financial statements and financial highlights based on our audits.
We conducted our audits in accordance with the standards of the Public Company Accounting Oversight Board (United States). Those standards require that we plan and perform the audit to obtain reasonable assurance about whether the financial statements and financial highlights are free of material misstatement. An audit includes examining, on a test basis, evidence supporting the amounts and disclosures in the financial statements. Our procedures included confirmation of securities owned as of October 31, 2017, by correspondence with custodian and brokers, or by other appropriate audit procedures. An audit also includes assessing the accounting principles used and significant estimates made by management, as well as evaluating the overall financial statement presentation. We believe that our audits provide a reasonable basis for our opinion.
In our opinion, the financial statements and financial highlights referred to above present fairly, in all material respects, the financial position of the Wells Fargo Diversified International Fund as of October 31, 2017, the results of its operations for the year then ended, the changes in its net assets for each of the years in the two-year period then ended, and the financial highlights for each of the years or periods in the five-year period then ended, in conformity with U.S. generally accepted accounting principles.

Boston, Massachusetts
December 21, 2017
| | | | |
| 40 | | Wells Fargo Diversified International Fund | | Other information (unaudited) |
TAX INFORMATION
For corporate shareholders, pursuant to Section 854 of the Internal Revenue Code, 1.17% of ordinary income dividends qualify for the corporate dividends-received deduction for the fiscal year ended October 31, 2017.
Pursuant to Section 854 of the Internal Revenue Code, $2,170,331 of income dividends paid during the fiscal year ended October 31, 2017 has been designated as qualified dividend income (QDI).
Pursuant to Section 853 of the Internal Revenue Code, the Fund expects to designate amounts as foreign taxes paid for the fiscal year ended October 31, 2017. Additional details will be available in the semiannual report.
PROXY VOTING INFORMATION
A description of the policies and procedures that the Fund uses to determine how to vote proxies relating to portfolio securities is available, upon request, by calling 1-800-222-8222, visiting our website at wellsfargofunds.com, or visiting the SEC website at sec.gov. Information regarding how the Fund voted proxies relating to portfolio securities during the most recent 12-month period ended June 30 is available on the Fund’s website at wellsfargofunds.com or by visiting the SEC website at sec.gov.
PORTFOLIO HOLDINGS INFORMATION
The complete portfolio holdings for the Fund are publicly available monthly on the Fund’s website (wellsfargofunds.com), on a one-month delayed basis. In addition, top ten holdings information (excluding derivative positions) for the Fund is publicly available on the Fund’s website on a monthly, seven-day or more delayed basis. The Fund files its complete schedule of portfolio holdings with the SEC for the first and third quarters of each fiscal year on Form N-Q, which is available by visiting the SEC website at sec.gov. In addition, the Fund’s Form N-Q may be reviewed and copied at the SEC’s Public Reference Room in Washington, DC, and at regional offices in New York City, at 233 Broadway, and in Chicago, at 175 West Jackson Boulevard, Suite 900. Information about the Public Reference Room may be obtained by calling 1-800-SEC-0330.
| | | | | | |
| Other information (unaudited) | | Wells Fargo Diversified International Fund | | | 41 | |
BOARD OF TRUSTEES AND OFFICERS
Each of the Trustees and Officers1 listed in the table below acts in identical capacities for each fund in the Wells Fargo family of funds, which consists of 152 mutual funds comprising the Wells Fargo Funds Trust, Wells Fargo Variable Trust, Wells Fargo Master Trust and four closed-end funds (collectively the “Fund Complex”). This table should be read in conjunction with the Prospectus and the Statement of Additional Information2. The mailing address of each Trustee and Officer is 525 Market Street, 12th Floor, San Francisco, CA 94105. Each Trustee and Officer serves an indefinite term, however, each Trustee serves such term until reaching the mandatory retirement age established by the Trustees.
Independent Trustees
| | | | | | |
Name and year of birth | | Position held and length of service* | | Principal occupations during past five years or longer | | Current other public company or
investment company
directorships |
| William R. Ebsworth (Born 1957) | | Trustee, since 2015 | | Retired. From 1984 to 2013, equities analyst, portfolio manager, research director and chief investment officer at Fidelity Management and Research Company in Boston, Tokyo, and Hong Kong, and retired in 2013 as Chief Investment Officer of Fidelity Strategic Advisers, Inc. where he led a team of investment professionals managing client assets. Prior thereto, Board member of Hong Kong Securities Clearing Co., Hong Kong Options Clearing Corp., the Thailand International Fund, Ltd., Fidelity Investments Life Insurance Company, and Empire Fidelity Investments Life Insurance Company. Board member of the Forté Foundation (non-profit organization) and the Vincent Memorial Hospital Endowment (non-profit organization), where he serves on the Investment Committee and as Chair of the Audit Committee. Mr. Ebsworth is a CFA® charterholder. | | Asset Allocation Trust |
Jane A. Freeman** (Born 1953) | | Trustee, since 2015; Chair Liaison, effective 2018 | | Retired. From 2012 to 2014 and 1999 to 2008, Chief Financial Officer of Scientific Learning Corporation. From 2008 to 2012, Ms. Freeman provided consulting services related to strategic business projects. Prior to 1999, Portfolio Manager at Rockefeller & Co. and Scudder, Stevens & Clark. Board member of the Harding Loevner Funds from 1996 to 2014, serving as both Lead Independent Director and chair of the Audit Committee. Board member of the Russell Exchange Traded Funds Trust from 2011 to 2012 and the chair of the Audit Committee. Ms. Freeman is a Board Member of Ruth Bancroft Garden (non-profit organization) and an inactive chartered financial analyst. | | Asset Allocation Trust |
Peter G. Gordon*** (Born 1942) | | Trustee, from 1998 to 2017; Chairman, from 2005 to 2017 | | Co-Founder, Retired Chairman, President and CEO of Crystal Geyser Water Company. Trustee Emeritus, Colby College. | | Asset Allocation Trust |
Isaiah Harris, Jr. (Born 1952) | | Trustee, since 2009 | | Retired. Chairman of the Board of CIGNA Corporation since 2009, and Director since 2005. From 2003 to 2011, Director of Deluxe Corporation. Prior thereto, President and CEO of BellSouth Advertising and Publishing Corp. from 2005 to 2007, President and CEO of BellSouth Enterprises from 2004 to 2005 and President of BellSouth Consumer Services from 2000 to 2003. Emeritus member of the Iowa State University Foundation Board of Governors. Emeritus Member of the Advisory Board of Iowa State University School of Business. Advisory Board Member, Palm Harbor Academy (charter school). Advisory Board Member, Child Evangelism Fellowship (non-profit). Mr. Harris is a certified public accountant (inactive status). | | CIGNA Corporation; Asset Allocation Trust |
Judith M. Johnson (Born 1949) | | Trustee, since 2008; Audit Committee Chairman, since 2008 | | Retired. Prior thereto, Chief Executive Officer and Chief Investment Officer of Minneapolis Employees Retirement Fund from 1996 to 2008. Ms. Johnson is an attorney, certified public accountant and a certified managerial accountant. | | Asset Allocation Trust |
David F. Larcker (Born 1950) | | Trustee, since 2009 | | James Irvin Miller Professor of Accounting at the Graduate School of Business, Stanford University, Director of the Corporate Governance Research Initiative and Senior Faculty of The Rock Center for Corporate Governance since 2006. From 2005 to 2008, Professor of Accounting at the Graduate School of Business, Stanford University. Prior thereto, Ernst & Young Professor of Accounting at The Wharton School, University of Pennsylvania from 1985 to 2005. | | Asset Allocation Trust |
| | | | |
| 42 | | Wells Fargo Diversified International Fund | | Other information (unaudited) |
| | | | | | |
Name and year of birth | | Position held and length of service* | | Principal occupations during past five years or longer | | Current other public company or
investment company
directorships |
Olivia S. Mitchell**** (Born 1953) | | Trustee, since 2006; Governance Committee Chairman, effective 2018 | | International Foundation of Employee Benefit Plans Professor, Wharton School of the University of Pennsylvania since 1993. Director of Wharton’s Pension Research Council and Boettner Center on Pensions & Retirement Research, and Research Associate at the National Bureau of Economic Research. Previously, Cornell University Professor from 1978 to 1993. | | Asset Allocation Trust |
| Timothy J. Penny***** (Born 1951) | | Trustee, since 1996; Chairman, effective 2018; Vice Chairman, from 2017 to 2018 | | President and Chief Executive Officer of Southern Minnesota Initiative Foundation, a non-profit organization, since 2007 and Senior Fellow at the Humphrey Institute Policy Forum at the University of Minnesota since 1995. Member of the Board of Trustees of NorthStar Education Finance, Inc., a non-profit organization, since 2007. | | Asset Allocation Trust |
| James G. Polisson****** (Born 1959) | | Trustee, effective 2018; Advisory Board Member, from 2017 to 2018 | | Retired. Chief Marketing Officer, Source (ETF) UK Services, Ltd, from 2015 to 2017. From 2012 to 2015, Principal of The Polisson Group, LLC, a management consulting, corporate advisory and principal investing company. Chief Executive Officer and Managing Director at Russell Investments, Global Exchange Traded Funds from 2010 to 2012. Managing Director of Barclays Global Investors from 1998 to 2010 and Global Chief Marketing Officer for iShares and Barclays Global Investors from 2000 to 2010. Prior thereto, Vice President, Fidelity Retail Mutual Fund Group from 1996 to 1998 and Risk Management Practice Manager, Fidelity Consulting from 1995 to 1996. Board member of the Russell Exchange Traded Fund Trust from 2011 to 2012. Director of Barclays Global Investors Holdings Deutschland GmbH from 2006 to 2009. Mr. Polisson is an attorney and has a retired status with the Massachusetts and District of Columbia Bar Associations. | | Asset Allocation Trust |
Michael S. Scofield (Born 1943) | | Trustee, since 2010 | | Served on the Investment Company Institute’s Board of Governors and Executive Committee from 2008-2011 as well the Governing Council of the Independent Directors Council from 2006-2011 and the Independent Directors Council Executive Committee from 2008-2011. Trustee of the Evergreen Funds complex (and its predecessors) from 1984 to 2010. Chairman of the Evergreen Funds from 2000-2010. Former Trustee of the Mentor Funds. Retired Attorney, Law Offices of Michael S. Scofield. | | Asset Allocation Trust |
| Pamela Wheelock****** (Born 1959) | | Trustee, effective 2018; Advisory Board Member, from 2017 to 2018 | | Chief Operating Officer, Twin Cities Habitat for Humanity, since January, 2017. Vice President of University Services, University of Minnesota from 2012 to 2017. Prior thereto, Interim President and Chief Executive Officer of Blue Cross Blue Shield of Minnesota from 2010 to 2011, Chairman of the Board from 2009 to 2011 and Board Director from 2003 to 2015. Vice President, Leadership and Community Engagement, Bush Foundation, Saint Paul, Minnesota (a private foundation) from 2009 to 2011. Executive Vice President and Chief Financial Officer, Minnesota Sports and Entertainment from 2004 to 2009 and Senior Vice President from 2002 to 2004. Commissioner of Finance, State of Minnesota, from 1999 to 2002. Currently on the Board of Directors, Governance Committee and Finance Committee, for the Minnesota Philanthropy Partners (Saint Paul Foundation) since 2012 and Board Chair of the Minnesota Wild Foundation since 2010. | | Asset Allocation Trust |
| * | Length of service dates reflect the Trustee’s commencement of service with the Trust’s predecessor entities, where applicable. |
| ** | Jane Freeman will become Chair Liaison effective January 1, 2018. |
| *** | Peter Gordon will retire on December 31, 2017. |
| **** | Olivia Mitchell will become Chairman of the Governance Committee effective January 1, 2018. |
| ***** | Timothy Penny will become Chairman effective January 1, 2018. |
| ****** | James Polisson and Pamela Wheelock each will become a Trustee effective January 1, 2018. |
| | | | | | |
| Other information (unaudited) | | Wells Fargo Diversified International Fund | | | 43 | |
Officers
| | | | | | |
Name and year of birth | | Position held and
length of service | | Principal occupations during past five years or longer | | |
Andrew Owen (Born 1960) | | President, since 2017 | | Executive Vice President of Wells Fargo & Company and Head of Affiliated Managers, Wells Fargo Asset Management, since 2014. In addition, Mr. Owen is currently President, Chief Executive Officer and Director of Wells Fargo Funds Management, LLC since 2017. Prior thereto, Executive Vice President responsible for marketing, investments and product development for Wells Fargo Funds Management, LLC, from 2009 to 2014. | | |
Jeremy DePalma1 (Born 1974) | | Treasurer, since 2012 | | Senior Vice President of Wells Fargo Funds Management, LLC since 2009. Senior Vice President of Evergreen Investment Management Company, LLC from 2008 to 2010 and head of the Fund Reporting and Control Team within Fund Administration from 2005 to 2010. | | |
C. David Messman (Born 1960) | | Secretary, since 2000; Chief Legal Officer, since 2003 | | Senior Vice President and Secretary of Wells Fargo Funds Management, LLC since 2001. Assistant General Counsel of Wells Fargo Bank, N.A. since 2013 and Vice President and Managing Counsel of Wells Fargo Bank, N.A. from 1996 to 2013. | | |
Michael H. Whitaker (Born 1967) | | Chief Compliance Officer, since 2016 | | Senior Vice President and Chief Compliance Officer since 2016. Senior Vice President and Chief Compliance Officer for Fidelity Investments from 2007 to 2016. | | |
David Berardi (Born 1975) | | Assistant Treasurer, since 2009 | | Vice President of Wells Fargo Funds Management, LLC since 2009. Vice President of Evergreen Investment Management Company, LLC from 2008 to 2010. Manager of Fund Reporting and Control for Evergreen Investment Management Company, LLC from 2004 to 2010. | | |
| 1 | Jeremy DePalma acts as Treasurer of 76 funds and Assistant Treasurer of 76 funds in the Fund Complex. |
| 2 | The Statement of Additional Information includes additional information about the Trustees and is available, without charge, upon request, by calling 1-800-222-8222 or by visiting the website at wellsfargofunds.com. |
| | | | |
| 44 | | Wells Fargo Diversified International Fund | | Other information (unaudited) |
BOARD CONSIDERATION OF INVESTMENT MANAGEMENT AND SUB-ADVISORY AGREEMENTS:
Under the Investment Company Act of 1940 (the “1940 Act”), the Board of Trustees (the “Board”) of Wells Fargo Funds Trust (the “Trust”) must determine annually whether to approve the continuation of the Trust’s investment management and sub-advisory agreements. In this regard, at an in-person meeting held on May 16-17, 2017 (the “Meeting”), the Board, all the members of which have no direct or indirect interest in the investment management and sub-advisory agreements and are not “interested persons” of the Trust, as defined in the 1940 Act (the “Independent Trustees”), reviewed and approved for Wells Fargo Diversified International Fund (the “Fund”): (i) an investment management agreement (the “Management Agreement”) with Wells Fargo Funds Management, LLC (“Funds Management”); (ii) an investment sub-advisory agreement with Wells Capital Management Incorporated (“WellsCap”), an affiliate of Funds Management; (iii) an investment sub-advisory agreement with Artisan Partners Limited Partnership ( “Artisan”); and (iv) an investment sub-advisory agreement with LSV Asset Management (“LSV”). The sub-advisory agreements with WellsCap, Artisan and LSV (the “Sub-Advisers”) are collectively referred to as the “Sub-Advisory Agreements,” and the Management Agreement and the Sub-Advisory Agreements are collectively referred to as the “Advisory Agreements.”
At the Meeting, the Board considered the factors and reached the conclusions described below relating to the selection of Funds Management and the Sub-Advisers and the approval of the Advisory Agreements. Prior to the Meeting, including at an in-person meeting in April 2017, the Trustees conferred extensively among themselves and with representatives of Funds Management about these matters. Also, the Board has adopted a team-based approach, with each team consisting of a sub-set of Trustees, to assist the full Board in the discharge of its duties in reviewing performance and other matters throughout the year. The Independent Trustees were assisted in their evaluation of the Advisory Agreements by independent legal counsel, from whom they received separate legal advice and with whom they met separately.
In providing information to the Board, Funds Management and the Sub-Advisers were guided by a detailed set of requests for information submitted to them by independent legal counsel on behalf of the Independent Trustees at the start of the Board’s annual contract renewal process earlier in 2017. In considering and approving the Advisory Agreements, the Trustees considered the information they believed relevant, including but not limited to the information discussed below. The Board considered not only the specific information presented in connection with the Meeting, but also the knowledge gained over time through interaction with Funds Management and the Sub-Advisers about various topics. In this regard, the Board reviewed reports of Funds Management at each of its quarterly meetings, which included, among other things, portfolio reviews and performance reports. In addition, the Board and the teams mentioned above confer with portfolio managers at various times throughout the year. The Board did not identify any particular information or consideration that was all-important or controlling, and each individual Trustee may have attributed different weights to various factors.
After its deliberations, the Board unanimously approved the continuation of the Advisory Agreements for a one-year term and determined that the compensation payable to Funds Management and the Sub-Advisers under each of the Advisory Agreements was reasonable. The Board considered the approval of the Advisory Agreements for the Fund as part of its consideration of agreements for funds across the complex, but its approvals were made on a fund-by-fund basis. The following summarizes a number of important, but not necessarily all, factors considered by the Board in support of its approvals.
Nature, extent and quality of services
The Board received and considered various information regarding the nature, extent and quality of services provided to the Fund by Funds Management and the Sub-Advisers under the Advisory Agreements. This information included a description of the investment advisory services and Fund-level administrative services covered by the Management Agreement, as well as, among other things, a summary of the background and experience of senior management of Funds Management, a summary of certain organizational and personnel changes involving Funds Management, and a description of Funds Management’s and the Sub-Advisers’ business continuity planning programs and of their approaches to data privacy and cybersecurity. The Board also considered the qualifications, background, tenure and responsibilities of each of the portfolio managers primarily responsible for the day-to-day portfolio management of the Fund.
The Board evaluated the ability of Funds Management and the Sub-Advisers to attract and retain qualified investment professionals, including research, advisory and supervisory personnel. The Board further considered the compliance programs and compliance records of Funds Management and the Sub-Advisers. In addition, the Board took into account the full range of services provided to the Fund by Funds Management and its affiliates.
Fund performance and expenses
The Board considered the performance results for the Fund over various time periods ended December 31, 2016. The Board considered these results in comparison to the performance of funds in a universe that was determined by
| | | | | | |
| Other information (unaudited) | | Wells Fargo Diversified International Fund | | | 45 | |
Broadridge Inc. (“Broadridge”) to be similar to the Fund (the “Universe”), and in comparison to the Fund’s benchmark index and to other comparative data. Broadridge is an independent provider of investment company data. The Board received a description of the methodology used by Broadridge to select the mutual funds in the performance Universe. The Board noted that the performance of the Fund (Administrator Class) was higher than or in range of the average performance of the Universe for all periods under review except the one- and three-year periods. The Board also noted that the performance of the Fund was in range of its benchmark, the MSCI EAFE Index (Net), for all periods under review except the one- and three-year periods.
The Board received information concerning, and discussed factors contributing to, the underperformance of the Fund relative to the Universe and benchmark for the periods identified above. The Board took note of the explanations for the relative underperformance during these periods, including with respect to investment decisions and market factors that affected the Fund’s performance. The Board took note of the long term performance of the Fund.
The Board also received and considered information regarding the Fund’s net operating expense ratios and their various components, including actual management fees, custodian and other non-management fees, and Rule 12b-1 and non-Rule 12b-1 shareholder service fees. The Board considered these ratios in comparison to the median ratios of funds in class-specific expense groups that were determined by Broadridge to be similar to the Fund (the “Groups”). The Board received a description of the methodology used by Broadridge to select the mutual funds in the expense Groups and an explanation of how funds comprising expense groups and their expense ratios may vary from year-to-year. Based on the Broadridge reports, the Board noted that the net operating expense ratios of the Fund were lower than, equal to or in range of the median net operating expense ratios of the expense Groups for all share classes.
The Board took into account the Fund performance and expense information provided to it among the factors considered in deciding to re-approve the Advisory Agreements.
Investment management and sub-advisory fee rates
The Board reviewed and considered the contractual fee rates payable by the Fund to Funds Management under the Management Agreement, as well as the contractual fee rates payable by the Fund to Funds Management for class-level administrative services under a Class-Level Administration Agreement, which include, among other things, class-level transfer agency and sub-transfer agency costs (collectively, the “Management Rates”). The Board also reviewed and considered the contractual investment sub-advisory fee rates that are payable by Funds Management to each of the Sub-Advisers for investment sub-advisory services.
Among other information reviewed by the Board was a comparison of the Fund’s Management Rates with the average contractual investment management fee rates of funds in the expense Groups at a common asset level as well as transfer agency costs of the other funds in the expense Groups. The Board noted that the Management Rates of the Fund were lower than or in range of the sum of these average rates for the Fund’s expense Groups for all share classes except Administrator Class, although the Board noted that the net operating expense ratio for Administrator Class was lower than the median net operating expense ratio of the expense Group for Administrator Class.
The Board also received and considered information about the portion of the total management fee that was retained by Funds Management after payment of the fee to the Sub-Advisers for sub-advisory services. The Board considered this amount in comparison to the median amount retained by advisers to funds in a sub-advised expense universe that was determined by Broadridge to be similar to the Fund. In assessing the reasonableness of this amount, the Board received and evaluated information about the nature and extent of responsibilities retained and risks assumed by Funds Management and not delegated to or assumed by the Sub-Advisers, and about Funds Management’s on-going oversight services. Given the affiliation between Funds Management and WellsCap, the Board ascribed limited relevance to the allocation of fees between them. The Board also considered that the sub-advisory fees paid to Artisan and LSV had been negotiated by Funds Management on an arm’s length basis.
The Board also received and considered information about the nature and extent of services offered and fee rates charged by Funds Management and the Sub-Advisers to other types of clients with investment strategies similar to those of the Fund. In this regard, the Board received information about the significantly greater scope of services, and compliance, reporting and other legal burdens and risks of managing mutual funds compared with those associated with managing assets of non-mutual fund clients such as collective funds or institutional separate accounts.
Based on its consideration of the factors and information it deemed relevant, including those described here, the Board determined that the compensation payable to Funds Management under the Management Agreement and to the Sub-Advisers under the Sub-Advisory Agreements was reasonable.
| | | | |
| 46 | | Wells Fargo Diversified International Fund | | Other information (unaudited) |
Profitability
The Board received and considered information concerning the profitability of Funds Management, as well as the profitability of Wells Fargo as a whole, from providing services to the Fund and the fund family as a whole. The Board also received and considered information concerning the profitability of WellsCap from providing services to the fund family as a whole, noting that WellsCap’s profitability information with respect to providing services to the Fund was subsumed in the Wells Fargo and Funds Management profitability analysis. The Board did not consider profitability with respect to Artisan or LSV, as the sub-advisory fees paid to the Artisan and LSV had been negotiated by Funds Management on an arm’s-length basis.
Funds Management reported on the methodologies and estimates used in calculating profitability, including a description of the methodology used to allocate certain expenses. Among other things, the Board noted that the levels of profitability reported on a fund-by-fund basis varied widely, depending on factors such as the size and type of fund. Based on its review, the Board did not deem the profits reported by Funds Management or Wells Fargo from its services to the Fund to be at a level that would prevent it from approving the continuation of the Advisory Agreements.
Economies of scale
With respect to possible economies of scale, the Board noted the existence of breakpoints in the Fund’s management fee structure, which operate generally to reduce the Fund’s expense ratios as the Fund grows in size. It considered that, for a small fund or a fund that shrinks in size, breakpoints conversely can result in higher fee levels. The Board also considered that in addition to management fee breakpoints, competitive management fee rates set at the outset without regard to breakpoints and fee waiver and expense reimbursement arrangements are means of sharing potential economies of scale with shareholders of the Fund. The Board also discussed and accepted Funds Management’s proposal to revise the Management Agreement to reduce fees at all asset levels for the Fund. The Board considered Funds Management’s view, which Funds Management indicated was supported by independent third-party studies which were summarized for the Board, that any analyses of potential economies of scale in managing a particular fund are inherently limited in light of the joint and common costs and investments that Funds Management incurs across the fund family as a whole.
The Board concluded that the Fund’s fee and expense arrangements, including contractual breakpoints, constituted a reasonable approach to sharing potential economies of scale with the Fund and its shareholders.
Other benefits to Funds Management and the Sub-Advisers
The Board received and considered information regarding potential “fall-out” or ancillary benefits received by Funds Management and its affiliates including WellsCap, and Artisan and LSV, as a result of their relationships with the Fund. Ancillary benefits could include, among others, benefits directly attributable to other relationships with the Fund and benefits potentially derived from an increase in Funds Management’s and the Sub-Advisers’ business as a result of their relationships with the Fund. The Board noted that various affiliates of Funds Management may receive distribution-related fees, shareholder servicing payments and sub-transfer agency fees in respect of shares sold or held through them and services provided.
The Board also reviewed information about soft dollar credits earned and utilized by WellsCap and Artisan, fees earned by Funds Management and WellsCap from managing a private investment vehicle for the fund family’s securities lending collateral and commissions earned by an affiliated broker from portfolio transactions.
Based on its consideration of the factors and information it deemed relevant, including those described here, the Board did not find that any ancillary benefits received by Funds Management and its affiliates, including WellsCap, or either Artisan or LSV were unreasonable.
Conclusion
At the Meeting, after considering the above-described factors and based on its deliberations and its evaluation of the information described above, the Board unanimously approved the continuation of the Advisory Agreements for a one-year term and determined that the compensation payable to Funds Management and the Sub-Advisers under each of the Advisory Agreements was reasonable.
| | | | | | |
| List of abbreviations | | Wells Fargo Diversified International Fund | | | 47 | |
The following is a list of common abbreviations for terms and entities that may have appeared in this report.
| ACA | — ACA Financial Guaranty Corporation |
| ADR | — American depositary receipt |
| ADS | — American depositary shares |
| AGC | — Assured Guaranty Corporation |
| AGM | — Assured Guaranty Municipal |
| Ambac | — Ambac Financial Group Incorporated |
| AMT | — Alternative minimum tax |
| BAN | — Bond anticipation notes |
| BHAC | — Berkshire Hathaway Assurance Corporation |
| CAB | — Capital appreciation bond |
| CCAB | — Convertible capital appreciation bond |
| CDA | — Community Development Authority |
| CDO | — Collateralized debt obligation |
| CLO | — Collateralized loan obligation |
| DRIVER | — Derivative inverse tax-exempt receipts |
| DW&P | — Department of Water & Power |
| DWR | — Department of Water Resources |
| ECFA | — Educational & Cultural Facilities Authority |
| EDA | — Economic Development Authority |
| EDFA | — Economic Development Finance Authority |
| ETF | — Exchange-traded fund |
| FDIC | — Federal Deposit Insurance Corporation |
| FFCB | — Federal Farm Credit Banks |
| FGIC | — Financial Guaranty Insurance Corporation |
| FHA | — Federal Housing Administration |
| FHLB | — Federal Home Loan Bank |
| FHLMC | — Federal Home Loan Mortgage Corporation |
| FICO | — The Financing Corporation |
| FNMA | — Federal National Mortgage Association |
| GDR | — Global depositary receipt |
| GNMA | — Government National Mortgage Association |
| HCFR | — Healthcare facilities revenue |
| HEFA | — Health & Educational Facilities Authority |
| HEFAR | — Higher education facilities authority revenue |
| HFA | — Housing Finance Authority |
| HFFA | — Health Facilities Financing Authority |
| HUD | — Department of Housing and Urban Development |
| IDA | — Industrial Development Authority |
| IDAG | — Industrial Development Agency |
| KRW | — Republic of Korea won |
| LIBOR | — London Interbank Offered Rate |
| LIFER | — Long Inverse Floating Exempt Receipts |
| LLC | — Limited liability company |
| LLLP | — Limited liability limited partnership |
| LLP | — Limited liability partnership |
| MBIA | — Municipal Bond Insurance Association |
| MFHR | — Multifamily housing revenue |
| MSTR | — Municipal securities trust receipts |
| MUD | — Municipal Utility District |
| National | — National Public Finance Guarantee Corporation |
| PCFA | — Pollution Control Financing Authority |
| PCL | — Public Company Limited |
| PCR | — Pollution control revenue |
| PFA | — Public Finance Authority |
| PFFA | — Public Facilities Financing Authority |
| PFOTER | — Puttable floating option tax-exempt receipts |
| PJSC | — Public Joint Stock Company |
| plc | — Public limited company |
| PUTTER | — Puttable tax-exempt receipts |
| R&D | — Research & development |
| Radian | — Radian Asset Assurance |
| RAN | — Revenue anticipation notes |
| RDA | — Redevelopment Authority |
| RDFA | — Redevelopment Finance Authority |
| REIT | — Real estate investment trust |
| ROC | — Reset option certificates |
| SAVRS | — Select auction variable rate securities |
| SBA | — Small Business Authority |
| SDR | — Swedish depositary receipt |
| SFHR | — Single-family housing revenue |
| SFMR | — Single-family mortgage revenue |
| SPA | — Standby purchase agreement |
| SPDR | — Standard & Poor’s Depositary Receipts |
| SPEAR | — Short Puttable Exempt Adjustable Receipts |
| STRIPS | — Separate trading of registered interest and |
| TAN | — Tax anticipation notes |
| TIPS | — Treasury inflation-protected securities |
| TRAN | — Tax revenue anticipation notes |
| TTFA | — Transportation Trust Fund Authority |
| TVA | — Tennessee Valley Authority |
This page is intentionally left blank.

For more information
More information about Wells Fargo Funds is available free upon request. To obtain literature, please write, email, visit the Fund’s website, or call:
Wells Fargo Funds
P.O. Box 8266
Boston, MA 02266-8266
Email: fundservice@wellsfargo.com
Website: wellsfargofunds.com
Individual investors: 1-800-222-8222
Retail investment professionals: 1-888-877-9275
Institutional investment professionals: 1-866-765-0778
This report and the financial statements contained herein are submitted for the general information of the shareholders of the Fund. If this report is used for promotional purposes, distribution of the report must be accompanied or preceded by a current prospectus. Before investing, please consider the investment objectives, risks, charges, and expenses of the investment. For a current prospectus and, if available, a summary prospectus, containing this information, call 1-800-222-8222 or visit the Fund’s website at wellsfargofunds.com. Read the prospectus carefully before you invest or send money.
Wells Fargo Asset Management (WFAM) is a trade name used by the asset management businesses of Wells Fargo & Company. Wells Fargo Funds Management, LLC, a wholly owned subsidiary of Wells Fargo & Company, provides investment advisory and administrative services for Wells Fargo Funds. Other affiliates of Wells Fargo & Company provide subadvisory and other services for the funds. The funds are distributed by Wells Fargo Funds Distributor, LLC, Member FINRA, an affiliate of Wells Fargo & Company. Neither Wells Fargo Funds Distributor nor Wells Fargo Funds Management holds fund shareholder accounts or assets. This material is for general informational and educational purposes only and is NOT intended to provide investment advice or a recommendation of any kind—including a recommendation for any specific investment, strategy, or plan.
NOT FDIC INSURED ◾ NO BANK GUARANTEE ◾ MAY LOSE VALUE
© 2017 Wells Fargo Funds Management, LLC. All rights reserved.
| | |
 | | 307199 12-17 A237/AR237 10-17 |
Annual Report
October 31, 2017

Wells Fargo Emerging Markets Equity Fund


Reduce clutter. Save trees.
Sign up for electronic delivery of prospectuses and shareholder reports at wellsfargo.com/advantagedelivery
Contents
The views expressed and any forward-looking statements are as of October 31, 2017, unless otherwise noted, and are those of the Fund managers and/or Wells Fargo Funds Management, LLC. Discussions of individual securities, or the markets generally, or any Wells Fargo Fund are not intended as individual recommendations. Future events or results may vary significantly from those expressed in any forward-looking statements. The views expressed are subject to change at any time in response to changing circumstances in the market. Wells Fargo Funds Management, LLC and the Fund disclaim any obligation to publicly update or revise any views expressed or forward-looking statements.
NOT FDIC INSURED ◾ NO BANK GUARANTEE ◾ MAY LOSE VALUE
| | | | |
| 2 | | Wells Fargo Emerging Markets Equity Fund | | Letter to shareholders (unaudited) |

Andrew Owen
President
Wells Fargo Funds
Global stocks generally delivered double-digit results; bond markets had smaller but positive results as well.
Dear Shareholder:
We are pleased to offer you this annual report for the Wells Fargo Emerging Markets Equity Fund for the 12-month period that ended October 31, 2017. Global stocks generally delivered double-digit results; bond markets had smaller but positive results as well. U.S. and international stocks performed similarly overall with returns of 23.63% and 23.64%, respectively, for the 12-month period, as measured by the S&P 500 Index1 and the MSCI ACWI ex USA Index (Net),2 respectively. Within fixed income, the Bloomberg Barclays U.S. Aggregate Bond Index3 returned 0.90% and the Bloomberg Barclays Municipal Bond Index4 returned 2.19% as interest rates rose from low levels.
Election results and central banks’ policies commanded investor attention as 2016 closed.
During the last two months of 2016, investors appeared intent on the prospective outcomes of elections in the U.S. and central-bank actions globally. Following Donald Trump’s election victory in November, U.S. stocks rallied. Investors appeared optimistic that the new administration would pursue progrowth policies. Favorable economic news supported stocks, and interest rates moved higher. At their mid-December meeting, U.S. Federal Reserve (Fed) officials raised the target interest rate by a quarter percentage point to a range of 0.50% to 0.75%. The fourth quarter also saw the implementation of the U.S. Securities and Exchange Commission’s amended rule for money market funds, which included the possibility of liquidity fees and redemption gates and, for institutional prime and municipal money market funds, floating net asset values (NAVs). Outside of the U.S., the prospects for faster U.S. growth appeared to trigger some acceleration in Europe.
Financial markets gained during the first two quarters of 2017 on positive economic data.
Stocks rallied globally through the first quarter of 2017, supported by signs of improvement in the U.S. and global economies. In the U.S., hiring remained strong, and business and consumer sentiment improved. In March, Fed officials raised their target interest rate by a quarter percentage point to a range of 0.75% to 1.00%. With the Fed’s target interest-rate increase, short-term bond yields rose during the quarter. Meanwhile, longer-term Treasury yields were little changed, leading to positive performance. Investment-grade and high-yield bonds benefited from strong demand. Municipal bond returns were positive in the quarter, helped by strong demand and constrained new-issue supply. Outside the U.S., stocks in emerging markets generally outperformed stocks in the U.S. and international developed markets because they benefited from both global economic growth and recent weakening of the U.S. dollar. Stocks in Asia, Europe, and Latin America also outperformed the U.S. market during the quarter.
| 1 | The S&P 500 Index consists of 500 stocks chosen for market size, liquidity, and industry group representation. It is a market-value-weighted index with each stock’s weight in the index proportionate to its market value. You cannot invest directly in an index. |
| 2 | The Morgan Stanley Capital International (MSCI) All Country World Index (ACWI) ex USA Index (Net) is a free-float-adjusted market-capitalization-weighted index that is designed to measure the equity market performance of developed markets, excluding the United States and Canada. Source: MSCI. MSCI makes no express or implied warranties or representations and shall have no liability whatsoever with respect to any MSCI data contained herein. The MSCI data may not be further redistributed or used as a basis for other indexes or any securities or financial products. This report is not approved, reviewed, or produced by MSCI. You cannot invest directly in an index. |
| 3 | The Bloomberg Barclays U.S. Aggregate Bond Index is a broad-based benchmark that measures the investment-grade, U.S. dollar-denominated, fixed-rate taxable bond market, including Treasuries, government-related and corporate securities, mortgage-backed securities (agency fixed-rate and hybrid adjustable-rate mortgage pass-throughs), asset-backed securities, and commercial mortgage-backed securities. You cannot invest directly in an index. |
| 4 | The Bloomberg Barclays Municipal Bond Index is an unmanaged index composed of long-term tax-exempt bonds with a minimum credit rating of Baa. You cannot invest directly in an index. |
| | | | | | |
| Letter to shareholders (unaudited) | | Wells Fargo Emerging Markets Equity Fund | | | 3 | |
Globally, stocks marked continued gains through the second quarter of 2017. Steady, albeit modest, economic growth both in the U.S. and abroad and generally favorable corporate earnings announcements supported higher valuations. U.S. inflation trended lower despite a continued decline in the unemployment rate. Ten-year U.S. Treasury yields declined, resulting in stronger prices for long-term bonds. As was widely expected, Fed officials raised the target interest rate in June by a quarter percentage point to a range of 1.00% to 1.25%. In addition, the Fed indicated that it planned to start selling bonds that accumulated on its balance sheet during quantitative easing programs conducted since 2008.
As global growth improved in the third quarter of 2017, financial markets generally advanced.
Most stock markets worldwide moved higher during the quarter and ended the period at or near all-time highs. Moderate acceleration in global economic growth was supported by improving corporate earnings, low inflation pressure, and still-low interest rates. Corporate earnings reports were favorable overall as companies continued to benefit from healthy operating leverage. Global commodity prices climbed during the quarter. Oil prices rebounded, partly due to a better balance between supply and demand. While North Korea’s recent missile launches and nuclear testing raised serious concerns around the world, the heightened geopolitical risk had relatively minimal impact on the quarter’s stock returns. In the U.S., economic data released during the quarter reflected a generally healthy economy. Second-quarter economic output grew at a 3.1% annual rate, and consumers displayed more willingness to spend. Meanwhile, the Fed maintained the target range for the federal funds rate at 1.00% to 1.25%, noting that inflation had remained below the Fed’s 2.00% objective. Reflecting continued confidence in the U.S. economy, the Fed also stated the possibility of one more 0.25% increase in the federal funds rate by the end of 2017 and announced plans to begin the process of unwinding its $4.5 trillion portfolio of bonds and other assets in October. Outside the U.S., stocks in the Asia Pacific region benefited from solid earnings reports and investors’ willingness to take on risk despite the rising tensions between North Korea and the U.S. In Europe, markets were supported by better-than-expected economic growth, which has led to narrowing of the gap between Europe’s growth rate and that of the U.S. In emerging markets, many countries benefited from stronger currencies versus the U.S. dollar. Also, commodity prices were on an upward trajectory, which benefited many companies that rely on natural resources for exports.
Positive economic and market news continued into October.
October proved to be a strong month for U.S. stocks. The S&P 500 Index delivered 11 record closes amid rising consumer confidence and signs the economy was continuing to gain momentum, including news in late October that economic output was estimated to have grown at a 3.0% annual rate in the third quarter. At its October meeting, the Fed, in a unanimous vote, left short-term interest rates unchanged but signaled it could make another rate increase before the end of 2017 if the economy remains on track. The Fed also began the process of unwinding its quantitative easing program. Outside the U.S., international stocks generally delivered positive results in October as global economic growth continued to strengthen.
| | | | |
| 4 | | Wells Fargo Emerging Markets Equity Fund | | Letter to shareholders (unaudited) |
Don’t let short-term uncertainty derail long-term investment goals.
Periods of investment uncertainty can present challenges, but experience has taught us that maintaining long-term investment goals can be an effective way to plan for the future. To help you create a sound strategy based on your personal goals and risk tolerance, Wells Fargo Funds offers more than 100 mutual funds spanning a wide range of asset classes and investment styles. Although diversification cannot guarantee an investment profit or prevent losses, we believe it can be an effective way to manage investment risk and potentially smooth out overall portfolio performance. We encourage investors to know their investments and to understand that appropriate levels of risk-taking may unlock opportunities.
Thank you for choosing to invest with Wells Fargo Funds. We appreciate your confidence in us and remain committed to helping you meet your financial needs.
Sincerely,

Andrew Owen
President
Wells Fargo Funds
Although diversification cannot guarantee an investment profit or prevent losses, we believe it can be an effective way to manage investment risk and potentially smooth out overall portfolio performance.
For further information about your Fund, contact your investment professional, visit our website at wellsfargofunds.com, or call us directly at 1-800-222-8222. We are available 24 hours a day, 7 days a week.
This page is intentionally left blank.
| | | | |
| 6 | | Wells Fargo Emerging Markets Equity Fund | | Performance highlights (unaudited) |
Investment objective
The Fund seeks long-term capital appreciation.
Manager
Wells Fargo Funds Management, LLC
Subadviser
Wells Capital Management Incorporated
Portfolio managers
Derrick Irwin, CFA®
Richard Peck, CFA®
Yi (Jerry) Zhang, Ph.D., CFA®
Average annual total returns (%) as of October 31, 20171
| | | | | | | | | | | | | | | | | | | | | | | | | | | | | | | | | | |
| | | | | Including sales charge | | | Excluding sales charge | | | Expense ratios2 (%) | |
| | | Inception date | | 1 year | | | 5 year | | | 10 year | | | 1 year | | | 5 year | | | 10 year | | | Gross | | | Net3 | |
| Class A (EMGAX) | | 9-6-1994 | | | 14.98 | | | | 3.17 | | | | 0.93 | | | | 21.99 | | | | 4.40 | | | | 1.53 | | | | 1.60 | | | | 1.58 | |
| Class C (EMGCX) | | 9-6-1994 | | | 20.06 | | | | 3.62 | | | | 0.77 | | | | 21.06 | | | | 3.62 | | | | 0.77 | | | | 2.35 | | | | 2.33 | |
| Class R6 (EMGDX) | | 6-28-2013 | | | – | | | | – | | | | – | | | | 22.53 | | | | 4.88 | | | | 1.94 | | | | 1.17 | | | | 1.15 | |
| Administrator Class (EMGYX) | | 9-6-1994 | | | – | | | | – | | | | – | | | | 22.10 | | | | 4.54 | | | | 1.71 | | | | 1.52 | | | | 1.46 | |
| Institutional Class (EMGNX) | | 7-30-2010 | | | – | | | | – | | | | – | | | | 22.42 | | | | 4.83 | | | | 1.92 | | | | 1.27 | | | | 1.19 | |
| MSCI EM Index (Net)4 | | – | | | – | | | | – | | | | – | | | | 26.45 | | | | 4.83 | | | | 0.60 | | | | – | | | | – | |
Figures quoted represent past performance, which is no guarantee of future results, and do not reflect taxes that a shareholder may pay on fund distributions or the redemption of fund shares. Investment return and principal value of an investment will fluctuate so that an investor’s shares, when redeemed, may be worth more or less than their original cost. Performance shown without sales charges would be lower if sales charges were reflected. Current performance may be lower or higher than the performance data quoted, which assumes the reinvestment of dividends and capital gains. Current month-end performance is available on the Fund’s website, wellsfargofunds.com.
Index returns do not include transaction costs associated with buying and selling securities, any mutual fund fees or expenses, or any taxes. It is not possible to invest directly in an index.
For Class A shares, the maximum front-end sales charge is 5.75%. For Class C shares, the maximum contingent deferred sales charge is 1.00%. Performance including a contingent deferred sales charge assumes the sales charge for the corresponding time period. Class R6, Administrator Class, and Institutional Class shares are sold without a front-end sales charge or contingent deferred sales charge.
Stock values fluctuate in response to the activities of individual companies and general market and economic conditions. Foreign investments are especially volatile and can rise or fall dramatically due to differences in the political and economic conditions of the host country. These risks are generally intensified in emerging markets. The use of derivatives may reduce returns and/or increase volatility. Certain investment strategies tend to increase the total risk of an investment (relative to the broader market). The Fund is exposed to smaller-company securities risk. Consult the Fund’s prospectus for additional information on these and other risks.
Please see footnotes on page 7.
| | | | | | |
| Performance highlights (unaudited) | | Wells Fargo Emerging Markets Equity Fund | | | 7 | |
|
| Growth of $10,000 investment as of October 31, 20175 |
|
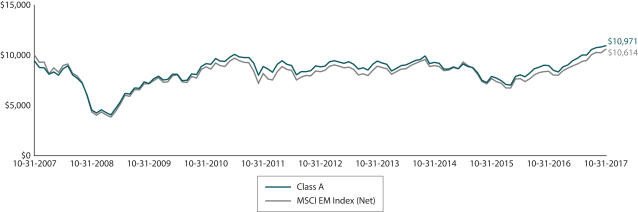 |
| 1 | Historical performance shown for Class R6 shares prior to their inception reflects the performance of Institutional Class shares and includes the higher expenses applicable to Institutional Class shares. If these expenses had not been included, returns for Class R6 shares would have been higher. Historical performance shown for Institutional Class shares prior to their inception reflects the performance of Administrator Class shares and includes the higher expenses applicable to Administrator Class shares. If these expenses had not been included, returns for Institutional Class shares would be higher. Historical performance shown for all classes of the Fund prior to July 19, 2010, is based on the performance of the Fund’s predecessor, Evergreen Emerging Markets Growth Fund. |
| 2 | Reflects the expense ratios as stated in the most recent prospectuses. The expense ratios shown are subject to change and may differ from the annualized expense ratios shown in the financial highlights of this report. |
| 3 | The manager has contractually committed through February 28, 2018, to waive fees and/or reimburse expenses to the extent necessary to cap the Fund’s Total Annual Operating Expenses After Fee Waivers at the amounts shown. After this time, the cap may be increased or the commitment to maintain the cap may be terminated only with the approval of the Board of Trustees. Brokerage commissions, stamp duty fees, interest, taxes, acquired fund fees and expenses, and extraordinary expenses are excluded from the expense cap. Without this cap, the Fund’s returns would have been lower. The expense ratio paid by an investor is the net expense ratio or the Fund’s Total Annual Fund Operating Expenses After Fee Waivers, as stated in the prospectuses. |
| 4 | The Morgan Stanley Capital International (MSCI) Emerging Markets (EM) Index (Net) is a free-float-adjusted market-capitalization-weighted index that is designed to measure large and mid-cap equity market performance of emerging markets. The MSCI EM Index (Net) consists of the following 24 emerging markets country indexes: Brazil, Chile, China, Colombia, Czech Republic, Egypt, Greece, Hungary, India, Indonesia, Korea, Malaysia, Mexico, Pakistan, Peru, the Philippines, Poland, Qatar, Russia, South Africa, Taiwan, Thailand, Turkey, and United Arab Emirates. Source: MSCI. MSCI makes no express or implied warranties or representations and shall have no liability whatsoever with respect to any MSCI data contained herein. The MSCI data may not be further redistributed or used as a basis for other indexes or any securities or financial products. This report is not approved, reviewed, or produced by MSCI. You cannot invest directly in an index. |
| 5 | The chart compares the performance of Class A shares for the most recent ten years with the MSCI EM Index (Net). The chart assumes a hypothetical investment of $10,000 in Class A shares and reflects all operating expenses and assumes the maximum initial sales charge of 5.75%. |
| 6 | The ten largest holdings, excluding cash and cash equivalents, are calculated based on the value of the investments divided by total net assets of the Fund. Holdings are subject to change and may have changed since the date specified. |
| 7 | Amounts are calculated based on the total long-term investments of the Fund. These amounts are subject to change and may have changed since the date specified. |
| | | | |
| 8 | | Wells Fargo Emerging Markets Equity Fund | | Performance highlights (unaudited) |
MANAGER’S DISCUSSION
Fund highlights
| ∎ | | The Fund underperformed its benchmark, the MSCI EM Index (Net), for the 12-month period that ended October 31, 2017. |
| ∎ | | Top detracting sectors included consumer staples and consumer discretionary. Among countries, detractors included China/Hong Kong and Mexico. |
| ∎ | | The largest relative contributors among sectors included industrials, energy, and financials. India and Russia were among the most notable contributors on a country basis. |
After a tumultuous period following the U.S. presidential election, emerging markets equities enjoyed a very strong period of performance through most of 2017.
Investors initially perceived the outcome of the U.S. presidential election to be negative for emerging markets. The new administration’s progrowth stance was expected to put upward pressure on global interest rates and the U.S. dollar, while its expected trade and geopolitical strategy was perceived to be negative for emerging markets. Equities in emerging markets fell sharply immediately following the election.
However, as it became clear that many of the new administration’s policies were unlikely to be implemented immediately and would likely be more pragmatic and less isolationist than initially expected, investors turned their focus toward the strong country and company fundamentals in emerging markets. Aggregate earnings for emerging markets rose approximately 6% in 2016, an encouraging sign of growth after two years of falling earnings. This earnings momentum continued through the first 10 months of 2017. This supported growth in return on capital across many countries and sectors within emerging markets, leading to significant market tailwinds.
The U.S. dollar rallied sharply postelection but retreated through much of the remainder of the period, beginning in January 2017. The U.S. currency more than gave up its postelection strength as investors lowered growth and inflation expectations for the U.S. economy and reacted to improving growth outside of the U.S. This acted as a further tailwind to emerging markets equites during the period.
A third notable driver during the year was the strong performance of the information technology (IT) sector in the emerging markets. Chinese internet stocks performed strongly on the back of increased monetization and market consolidation. Additionally, semiconductor companies such as Samsung Electronics Company, Limited; Taiwan Semiconductor Manufacturing Company Limited; and SK Hynix Incorporated enjoyed strong cyclical tailwinds. Outside of Asia, the stocks of internet companies in Russia and Brazil also outperformed.
| | | | |
| Ten largest holdings (%) as of October 31, 20176 | |
Samsung Electronics Company Limited | | | 5.87 | |
Taiwan Semiconductor Manufacturing Company Limited ADR | | | 3.20 | |
China Mobile Limited | | | 3.00 | |
SINA Corporation | | | 2.42 | |
China Life Insurance Company Limited H Shares | | | 2.22 | |
Tencent Holdings Limited | | | 2.13 | |
WH Group Limited | | | 1.84 | |
New Oriental Education & Technology Group Incorporated ADR | | | 1.83 | |
Uni-President Enterprises Corporation | | | 1.83 | |
Fomento Economico Mexicano SAB de CV ADR | | | 1.77 | |
We continued to make changes in the Fund to ensure the highest level of quality and to take advantage of valuation opportunities. Key new positions include Brazil’s Atacadao S.A.; Poland’s PLAY Communications S.A.; and China’s Best, Incorporated, a logistics company. Among the larger positions eliminated from the Fund were China’s Tingyi Holding Corporation; Mexico’s Grupo Televisa, S.A.B.; and Turkey’s Anadolu Efes Biracilik ve Malt Sanayii A.S., a beverages company. China’s Belle International Holdings Limited was removed because it was taken private.
In the Fund, positive stock selection in India, Russia, and Taiwan was offset by weaker results among stocks in China and Thailand. An overweight positioning in Mexico was a drag on performance, while an underweight in Malaysia coupled with strong stock selection helped. In India, the
Fund benefited from strong performances from such companies as Reliance Industries Limited, Bharti Airtel Limited, and Dalmia Bharat Limited. In China, our biggest challenge were related to the Fund’s position in Vipshop Holdings Limited. In Mexico, a weak Mexican peso and the underperformance of Fomento Economico Mexicano, S.A.B. de C.V., were detractors from performance.
Please see footnotes on page 7.
| | | | | | |
| Performance highlights (unaudited) | | Wells Fargo Emerging Markets Equity Fund | | | 9 | |
|
| Sector distribution as of October 31, 20177 |
|
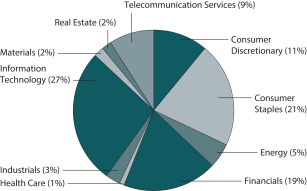
|
|
| Country allocation as of October 31, 20177 |
|
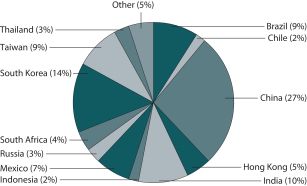
|
Among sectors, the industrials sector was a key performance driver, including 51job, Incorporated; Johnson Electric Holdings Limited; and Best, Incorporated. In energy, Fund performance benefited from the strong performance of Reliance Industries Limited in India and PTT Public Company Limited in Thailand. The Fund lagged in the consumer staples sector, in part due to an overweight sector position coupled with underperformance by Fomento Economico Mexicano and Uni-President Enterprises Corporation. In the consumer discretionary sector, Vipshop Holdings and Lojas Americanas S.A. in Brazil also detracted.
We remain cautiously optimistic about the opportunities in emerging markets.
The recovery in many emerging markets economies and improving earnings prospects at the company level are providing support to the equity markets. Low inflation, improving growth, and low external vulnerability mean that emerging markets are far more resilient than in the past. It is likely that the increasing importance of IT for emerging markets investors is changing the drivers of emerging markets performance away from global trade and macroeconomics to local and company-specific factors. It is also undoubtedly creating new risk factors. As long as earnings growth and improving returns on capital remain in place, we believe that emerging markets equities will be well suited to ride out any near-term market volatility.
In mid-September, the World Trade Organization upgraded its merchandise trade volume forecast from 2.4% to 3.6%. This should lead to faster top-line growth in emerging markets, driving higher margins and improving returns. Indeed, we already have seen a substantial increase in export volumes from the emerging markets (aided by recovering commodity prices and demand from China). As top-line growth filters through to higher returns, this will support emerging markets equities valuations. Looking farther down the road, higher margins and returns in emerging markets could lead to increased investment spending and credit growth, potentially driving another leg of growth for companies operating in the emerging markets economies.
Please see footnotes on page 7.
| | | | |
| 10 | | Wells Fargo Emerging Markets Equity Fund | | Fund expenses (unaudited) |
As a shareholder of the Fund, you incur two types of costs: (1) transaction costs, including sales charges (loads) on purchase payments and contingent deferred sales charges (if any) on redemptions and (2) ongoing costs, including management fees, distribution (12b-1) and/or shareholder servicing fees, and other Fund expenses. This example is intended to help you understand your ongoing costs (in dollars) of investing in the Fund and to compare these costs with the ongoing costs of investing in other mutual funds.
The example is based on an investment of $1,000 invested at the beginning of the six-month period and held for the entire period from May 1, 2017 to October 31, 2017.
Actual expenses
The “Actual” line of the table below provides information about actual account values and actual expenses. You may use the information in this line, together with the amount you invested, to estimate the expenses that you paid over the period. Simply divide your account value by $1,000 (for example, an $8,600 account value divided by $1,000 = 8.6), then multiply the result by the number in the “Actual” line under the heading entitled “Expenses paid during period” for your applicable class of shares to estimate the expenses you paid on your account during this period.
Hypothetical example for comparison purposes
The “Hypothetical” line of the table below provides information about hypothetical account values and hypothetical expenses based on the Fund’s actual expense ratio and an assumed rate of return of 5% per year before expenses, which is not the Fund’s actual return. The hypothetical account values and expenses may not be used to estimate the actual ending account balance or expenses you paid for the period. You may use this information to compare the ongoing costs of investing in the Fund and other funds. To do so, compare this 5% hypothetical example with the 5% hypothetical examples that appear in the shareholder reports of the other funds.
Please note that the expenses shown in the table are meant to highlight your ongoing costs only and do not reflect any transactional costs, such as sales charges (loads) and contingent deferred sales charges. Therefore, the “Hypothetical” line of the table is useful in comparing ongoing costs only and will not help you determine the relative total costs of owning different funds. In addition, if these transactional costs were included, your costs would have been higher.
| | | | | | | | | | | | | | | | |
| | | Beginning
account value
5-1-2017 | | | Ending
account value
10-31-2017 | | | Expenses
paid during
the period1 | | | Annualized net
expense ratio | |
Class A | | | | | | | | | | | | | | | | |
Actual | | $ | 1,000.00 | | | $ | 1,129.15 | | | $ | 8.28 | | | | 1.54 | % |
Hypothetical (5% return before expenses) | | $ | 1,000.00 | | | $ | 1,017.42 | | | $ | 7.85 | | | | 1.54 | % |
Class C | | | | | | | | | | | | | | | | |
Actual | | $ | 1,000.00 | | | $ | 1,125.34 | | | $ | 12.29 | | | | 2.29 | % |
Hypothetical (5% return before expenses) | | $ | 1,000.00 | | | $ | 1,013.64 | | | $ | 11.64 | | | | 2.29 | % |
Class R6 | | | | | | | | | | | | | | | | |
Actual | | $ | 1,000.00 | | | $ | 1,131.91 | | | $ | 5.98 | | | | 1.11 | % |
Hypothetical (5% return before expenses) | | $ | 1,000.00 | | | $ | 1,019.59 | | | $ | 5.67 | | | | 1.11 | % |
Administrator Class | | | | | | | | | | | | | | | | |
Actual | | $ | 1,000.00 | | | $ | 1,129.49 | | | $ | 7.79 | | | | 1.45 | % |
Hypothetical (5% return before expenses) | | $ | 1,000.00 | | | $ | 1,017.89 | | | $ | 7.38 | | | | 1.45 | % |
Institutional Class | | | | | | | | | | | | | | | | |
Actual | | $ | 1,000.00 | | | $ | 1,131.48 | | | $ | 6.39 | | | | 1.19 | % |
Hypothetical (5% return before expenses) | | $ | 1,000.00 | | | $ | 1,019.21 | | | $ | 6.06 | | | | 1.19 | % |
| 1 | Expenses paid is equal to the annualized net expense ratio of each class multiplied by the average account value over the period, multiplied by the number of days in the most recent fiscal half-year divided by the number of days in the fiscal year (to reflect the one-half-year period). |
| | | | | | |
| Portfolio of investments—October 31, 2017 | | Wells Fargo Emerging Markets Equity Fund | | | 11 | |
| | | | | | | | | | | | | | | | |
| Security name | | | | | | | | Shares | | | Value | |
| | | | |
Common Stocks: 92.20% | | | | | | | | | | | | | | | | |
| | | | |
| Argentina: 0.49% | | | | | | | | | | | | | | | | |
MercadoLibre Incorporated (Information Technology, Internet Software & Services) | | | | | | | | | | | 82,900 | | | $ | 19,921,699 | |
| | | | | | | | | | | | | | | | |
| | | | |
| Brazil: 6.99% | | | | | | | | | | | | | | | | |
Ambev SA ADR (Consumer Staples, Beverages) | | | | | | | | | | | 5,822,000 | | | | 36,853,260 | |
Atacadao Distribuicao Comercio e Industria Limitada (Consumer Staples, Food & Staples Retailing) † | | | | | | | | | | | 5,960,000 | | | | 29,296,243 | |
B2W Companhia Digital (Consumer Discretionary, Internet & Direct Marketing Retail) † | | | | | | | | | | | 4,424,833 | | | | 28,716,169 | |
Banco Bradesco SA ADR (Financials, Banks) | | | | | | | | | | | 3,432,950 | | | | 36,286,282 | |
BM&F Bovespa SA (Financials, Capital Markets) | | | | | | | | | | | 7,413,005 | | | | 54,159,148 | |
BRF Brazil Foods SA ADR (Consumer Staples, Food Products) Ǡ | | | | | | | | | | | 1,516,078 | | | | 20,421,571 | |
IRB-Brasil Resseguros SA (Financials, Insurance) | | | | | | | | | | | 1,220,669 | | | | 12,242,885 | |
Lojas Renner SA (Consumer Discretionary, Multiline Retail) | | | | | | | | | | | 3,144,250 | | | | 33,140,874 | |
Multiplan Empreendimentos Imobiliarios SA (Real Estate, Real Estate Management & Development) | | | | | | | | | | | 787,302 | | | | 17,207,866 | |
Raia Drogasil SA (Consumer Staples, Food & Staples Retailing) | | | | | | | | | | | 761,600 | | | | 18,208,277 | |
| | | | |
| | | | | | | | | | | | | | | 286,532,575 | |
| | | | | | | | | | | | | | | | |
| | | | |
| Chile: 1.97% | | | | | | | | | | | | | | | | |
AES Gener SA (Utilities, Independent Power & Renewable Electricity Producers) | | | | | | | | | | | 16,613,250 | | | | 5,742,397 | |
Banco Santander Chile SA ADR (Financials, Banks) | | | | | | | | | | | 1,244,392 | | | | 38,924,582 | |
SACI Falabella (Consumer Discretionary, Multiline Retail) | | | | | | | | | | | 3,777,228 | | | | 36,202,515 | |
| | | | |
| | | | | | | | | | | | | | | 80,869,494 | |
| | | | | | | | | | | | | | | | |
| | | | |
| China: 25.67% | | | | | | | | | | | | | | | | |
51job Incorporated ADR (Industrials, Professional Services) Ǡ | | | | | | | | | | | 723,941 | | | | 44,811,948 | |
Alibaba Group Holding Limited ADR (Information Technology, Internet Software & Services) † | | | | | | | | | | | 321,037 | | | | 59,356,531 | |
Baidu Incorporated ADR (Information Technology, Internet Software & Services) † | | | | | | | | | | | 116,540 | | | | 28,428,768 | |
Best Incorporated ADR (Industrials, Air Freight & Logistics) Ǡ | | | | | | | | | | | 2,369,642 | | | | 27,440,454 | |
China Distance Education ADR (Consumer Discretionary, Diversified Consumer Services) | | | | | | | | | | | 973,710 | | | | 7,594,938 | |
China International Capital Corporation Limited H Shares (Financials, Diversified Financial Services) « | | | | | | | | | | | 1,334,904 | | | | 2,751,462 | |
China Life Insurance Company Limited H Shares (Financials, Insurance) | | | | | | | | | | | 27,548,290 | | | | 91,104,915 | |
China Literature Limited (Consumer Discretionary, Internet & Direct Marketing Retail) †(a) | | | | | | | | | | | 1,551 | | | | 11,045 | |
China Mobile Limited (Telecommunication Services, Wireless Telecommunication Services) | | | | | | | | | | | 12,260,165 | | | | 123,129,685 | |
China Rapid Finance Limited ADR (Financials, Consumer Finance) Ǡ | | | | | | | | | | | 992,702 | | | | 8,021,032 | |
CNOOC Limited (Energy, Oil, Gas & Consumable Fuels) | | | | | | | | | | | 26,974,000 | | | | 36,719,548 | |
Ctrip.com International Limited ADR (Consumer Discretionary, Internet & Direct Marketing Retail) † | | | | | | | | | | | 1,186,632 | | | | 56,827,806 | |
Gridsum Holding Incorporated ADR (Information Technology, Software) Ǡ | | | | | | | | | | | 441,040 | | | | 3,814,996 | |
Hengan International Group Company Limited (Consumer Staples, Personal Products) | | | | | | | | | | | 4,957,000 | | | | 48,862,166 | |
Li Ning Company Limited (Consumer Discretionary, Textiles, Apparel & Luxury Goods) † | | | | | | | | | | | 27,484,207 | | | | 23,991,521 | |
New Oriental Education & Technology Group Incorporated ADR (Consumer Discretionary, Diversified Consumer Services) † | | | | | | | | | | | 901,413 | | | | 75,033,618 | |
PetroChina Company Limited H Shares (Energy, Oil, Gas & Consumable Fuels) | | | | | | | | | | | 11,566,000 | | | | 7,546,202 | |
Shandong Weigao Group Medical Polymer Company Limited H Shares (Health Care, Health Care Equipment & Supplies) | | | | | | | | | | | 18,024,000 | | | | 12,937,985 | |
SINA Corporation (Information Technology, Internet Software & Services) | | | | | | | | | | | 922,907 | | | | 99,350,939 | |
Tencent Holdings Limited (Information Technology, Internet Software & Services) | | | | | | | | | | | 1,948,800 | | | | 87,380,501 | |
Tsingtao Brewery Company Limited H Shares (Consumer Staples, Beverages) | | | | | | | | | | | 7,690,000 | | | | 32,183,775 | |
Vipshop Holdings Limited ADR (Consumer Discretionary, Internet & Direct Marketing Retail) † | | | | | | | | | | | 6,144,738 | | | | 48,543,430 | |
Want Want China Holdings Limited (Consumer Staples, Food Products) | | | | | | | | | | | 50,204,000 | | | | 41,056,928 | |
Weibo Corporation ADR (Information Technology, Internet Software & Services) Ǡ | | | | | | | | | | | 665,626 | | | | 61,670,249 | |
ZhongAn Online P & C Insurance Company Limited (Financials, Insurance) † | | | | | | | | | | | 391,875 | | | | 3,953,209 | |
Zhou Hei Ya International Holding Company Limited (Consumer Staples, Food Products) | | | | | | | | | | | 20,553,626 | | | | 19,785,901 | |
| | | | |
| | | | | | | | | | | | | | | 1,052,309,552 | |
| | | | | | | | | | | | | | | | |
The accompanying notes are an integral part of these financial statements.
| | | | |
| 12 | | Wells Fargo Emerging Markets Equity Fund | | Portfolio of investments—October 31, 2017 |
| | | | | | | | | | | | | | | | |
| Security name | | | | | | | | Shares | | | Value | |
| | | | |
| Colombia: 0.43% | | | | | | | | | | | | | | | | |
Bancolombia SA ADR (Financials, Banks) | | | | | | | | | | | 462,400 | | | $ | 17,455,600 | |
| | | | | | | | | | | | | | | | |
| | | | |
| Hong Kong: 4.59% | | | | | | | | | | | | | | | | |
AIA Group Limited (Financials, Insurance) | | | | | | | | | | | 9,321,400 | | | | 70,136,922 | |
Johnson Electric Holdings Limited (Industrials, Electrical Equipment) | | | | | | | | | | | 4,214,250 | | | | 16,989,023 | |
Sun Art Retail Group Limited (Consumer Staples, Food & Staples Retailing) | | | | | | | | | | | 25,490,500 | | | | 25,747,320 | |
WH Group Limited (Consumer Staples, Food Products) 144A | | | | | | | | | | | 74,305,500 | | | | 75,244,629 | |
| | | | |
| | | | | | | | | | | | | | | 188,117,894 | |
| | | | | | | | | | | | | | | | |
| | | | |
| India: 9.58% | | | | | | | | | | | | | | | | |
AU Small Finance Bank Limited (Financials, Consumer Finance) 144A† | | | | | | | | | | | 451,041 | | | | 4,051,074 | |
Bajaj Finance Limited (Financials, Consumer Finance) | | | | | | | | | | | 470,281 | | | | 13,073,516 | |
Bharti Airtel Limited (Telecommunication Services, Wireless Telecommunication Services) | | | | | | | | | | | 2,618,728 | | | | 20,101,998 | |
Bharti Infratel Limited (Telecommunication Services, Diversified Telecommunication Services) | | | | | | | | | | | 2,873,851 | | | | 19,617,859 | |
Dalmia Bharat Limited (Materials, Construction Materials) | | | | | | | | | | | 312,329 | | | | 14,428,241 | |
Fortis Healthcare Limited (Health Care, Health Care Providers & Services) † | | | | | | | | | | | 3,950,000 | | | | 8,775,576 | |
HDFC Bank Limited ADR (Financials, Banks) | | | | | | | | | | | 123,826 | | | | 11,429,140 | |
Housing Development Finance Corporation Limited (Financials, Thrifts & Mortgage Finance) | | | | | | | | | | | 1,115,700 | | | | 29,410,366 | |
ICICI Bank Limited ADR (Financials, Banks) | | | | | | | | | | | 3,126,952 | | | | 28,611,611 | |
Indusind Bank Limited (Financials, Banks) | | | | | | | | | | | 817,217 | | | | 20,529,705 | |
Infosys Limited ADR (Information Technology, IT Services) « | | | | | | | | | | | 1,857,460 | | | | 27,583,281 | |
ITC Limited (Consumer Staples, Tobacco) | | | | | | | | | | | 10,078,960 | | | | 41,345,191 | |
Kotak Mahindra Bank Limited (Financials, Banks) | | | | | | | | | | | 1,057,262 | | | | 16,731,905 | |
Laurus Labs Limited (Health Care, Pharmaceuticals) 144A | | | | | | | | | | | 455,595 | | | | 3,787,056 | |
Max India Limited (Financials, Industrial Conglomerates) | | | | | | | | | | | 925,389 | | | | 8,386,489 | |
PNB Housing Finance Limited (Financials, Thrifts & Mortgage Finance) 144A | | | | | | | | | | | 191,606 | | | | 4,209,808 | |
Reliance Industries Limited (Energy, Oil, Gas & Consumable Fuels) | | | | | | | | | | | 1,008,400 | | | | 14,647,751 | |
Reliance Industries Limited GDR (Energy, Oil, Gas & Consumable Fuels) 144A | | | | | | | | | | | 2,493,174 | | | | 71,554,094 | |
SBI Life Insurance Company Limited (Financials, Insurance) 144A† | | | | | | | | | | | 914,273 | | | | 9,345,816 | |
SH Kelkar & Company Limited (Materials, Chemicals) 144A | | | | | | | | | | | 1,314,144 | | | | 5,501,363 | |
Ultra Tech Cement Limited (Materials, Construction Materials) | | | | | | | | | | | 286,000 | | | | 19,433,009 | |
| | | | |
| | | | | | | | | | | | | | | 392,554,849 | |
| | | | | | | | | | | | | | | | |
| | | | |
| Indonesia: 2.05% | | | | | | | | | | | | | | | | |
PT Astra International Tbk (Consumer Discretionary, Automobiles) | | | | | | | | | | | 19,151,000 | | | | 11,296,442 | |
PT Bank Central Asia Tbk (Financials, Banks) | | | | | | | | | | | 11,349,500 | | | | 17,489,736 | |
PT Blue Bird Tbk (Industrials, Road & Rail) | | | | | | | | | | | 13,605,309 | | | | 4,574,393 | |
PT Link Net Tbk (Telecommunication Services, Diversified Telecommunication Services) | | | | | | | | | | | 38,278,161 | | | | 14,083,541 | |
PT Matahari Department Store Tbk (Consumer Discretionary, Multiline Retail) | | | | | | | | | | | 10,474,600 | | | | 6,641,958 | |
PT Telekomunikasi Indonesia Persero Tbk ADR (Telecommunication Services, Diversified Telecommunication Services) | | | | | | | | | | | 997,754 | | | | 29,972,530 | |
| | | | |
| | | | | | | | | | | | | | | 84,058,600 | |
| | | | | | | | | | | | | | | | |
| | | | |
| Luxembourg: 0.20% | | | | | | | | | | | | | | | | |
Biotoscana Investments SA (Health Care, Biotechnology) † | | | | | | | | | | | 1,156,551 | | | | 8,308,302 | |
| | | | | | | | | | | | | | | | |
| | | | |
| Malaysia: 0.88% | | | | | | | | | | | | | | | | |
Genting Bhd (Consumer Discretionary, Hotels, Restaurants & Leisure) | | | | | | | | | | | 8,780,900 | | | | 18,771,028 | |
Genting Malaysia Bhd (Consumer Discretionary, Hotels, Restaurants & Leisure) | | | | | | | | | | | 14,496,300 | | | | 17,223,666 | |
| | | | |
| | | | | | | | | | | | | | | 35,994,694 | |
| | | | | | | | | | | | | | | | |
The accompanying notes are an integral part of these financial statements.
| | | | | | |
| Portfolio of investments—October 31, 2017 | | Wells Fargo Emerging Markets Equity Fund | | | 13 | |
| | | | | | | | | | | | | | | | |
| Security name | | | | | | | | Shares | | | Value | |
| | | | |
| Mexico: 6.15% | | | | | | | | | | | | | | | | |
America Movil SAB de CV ADR (Telecommunication Services, Wireless Telecommunication Services) | | | | | | | | | | | 1,657,320 | | | $ | 28,373,318 | |
Becle SAB de CV ADR (Consumer Staples, Beverages) † | | | | | | | | | | | 12,063,925 | | | | 19,267,797 | |
Cemex SAB de CV ADR (Materials, Construction Materials) † | | | | | | | | | | | 2,111,848 | | | | 17,127,087 | |
Fibra Uno Administracion SAB de CV (Real Estate, Equity REITs) | | | | | | | | | | | 29,136,922 | | | | 45,715,108 | |
Fomento Economico Mexicano SAB de CV ADR (Consumer Staples, Beverages) | | | | | | | | | | | 826,120 | | | | 72,492,030 | |
Grupo Financiero Banorte SAB de CV (Financials, Banks) | | | | | | | | | | | 6,128,188 | | | | 36,311,873 | |
Grupo Financiero Santander SAB de CV ADR (Financials, Banks) | | | | | | | | | | | 1,723,441 | | | | 14,511,373 | |
Wal-Mart de Mexico SAB de CV (Consumer Staples, Food & Staples Retailing) | | | | | | | | | | | 8,127,100 | | | | 18,194,225 | |
| | | | |
| | | | | | | | | | | | | | | 251,992,811 | |
| | | | | | | | | | | | | | | | |
| | | | |
| Peru: 0.39% | | | | | | | | | | | | | | | | |
Compania de Minas Buenaventura SA ADR (Materials, Metals & Mining) | | | | | | | | | | | 1,152,495 | | | | 15,892,906 | |
| | | | | | | | | | | | | | | | |
| | | | |
| Philippines: 0.72% | | | | | | | | | | | | | | | | |
Ayala Corporation (Financials, Diversified Financial Services) | | | | | | | | | | | 727,624 | | | | 14,531,338 | |
SM Investments Corporation (Industrials, Industrial Conglomerates) | | | | | | | | | | | 812,873 | | | | 15,037,166 | |
| | | | |
| | | | | | | | | | | | | | | 29,568,504 | |
| | | | | | | | | | | | | | | | |
| | | | |
| Poland: 0.40% | | | | | | | | | | | | | | | | |
PLAY Communications SA (Telecommunication Services, Wireless Telecommunication Services)† | | | | | | | | | | | 1,600,779 | | | | 16,183,922 | |
| | | | | | | | | | | | | | | | |
| | | | |
| Russia: 2.65% | | | | | | | | | | | | | | | | |
LUKOIL PJSC ADR (Energy, Oil, Gas & Consumable Fuels) | | | | | | | | | | | 503,249 | | | | 26,722,522 | |
Magnit (Consumer Staples, Food & Staples Retailing) (a) | | | | | | | | | | | 126,300 | | | | 16,657,113 | |
Sberbank of Russia ADR (Financials, Banks) | | | | | | | | | | | 1,541,195 | | | | 22,116,148 | |
Yandex NV Class A (Information Technology, Internet Software & Services) † | | | | | | | | | | | 1,280,106 | | | | 43,305,986 | |
| | | | |
| | | | | | | | | | | | | | | 108,801,769 | |
| | | | | | | | | | | | | | | | |
| | | | |
| Singapore: 0.17% | | | | | | | | | | | | | | | | |
Sea Limited ADR (Information Technology, Internet Software & Services) Ǡ | | | | | | | | | | | 469,342 | | | | 7,077,677 | |
| | | | | | | | | | | | | | | | |
| | | | |
| South Africa: 3.50% | | | | | | | | | | | | | | | | |
AngloGold Ashanti Limited ADR (Materials, Metals & Mining) | | | | | | | | | | | 958,071 | | | | 8,910,060 | |
Clicks Group Limited (Consumer Staples, Food & Staples Retailing) | | | | | | | | | | | 690,000 | | | | 7,731,709 | |
MTN Group Limited (Telecommunication Services, Wireless Telecommunication Services) « | | | | | | | | | | | 2,732,643 | | | | 23,728,164 | |
Shoprite Holdings Limited (Consumer Staples, Food & Staples Retailing) | | | | | | | | | | | 2,678,100 | | | | 38,330,143 | |
Standard Bank Group Limited (Financials, Banks) | | | | | | | | | | | 1,660,190 | | | | 19,257,089 | |
Steinhoff Africa Retail Limited (Consumer Discretionary, Household Products) † | | | | | | | | | | | 4,881,610 | | | | 7,930,728 | |
Tiger Brands Limited (Consumer Staples, Food Products) | | | | | | | | | | | 1,370,333 | | | | 37,411,266 | |
| | | | |
| | | | | | | | | | | | | | | 143,299,159 | |
| | | | | | | | | | | | | | | | |
| | | | |
| South Korea: 12.79% | | | | | | | | | | | | | | | | |
Amorepacific Corporation (Consumer Staples, Personal Products) | | | | | | | | | | | 20,500 | | | | 5,745,526 | |
KT Corporation ADR (Telecommunication Services, Diversified Telecommunication Services) « | | | | | | | | | | | 3,614,813 | | | | 52,017,159 | |
KT&G Corporation (Consumer Staples, Tobacco) | | | | | | | | | | | 234,091 | | | | 22,148,120 | |
Naver Corporation (Information Technology, Internet Software & Services) | | | | | | | | | | | 86,200 | | | | 68,784,576 | |
Netmarble Games Corporation (Information Technology, Software) 144A† | | | | | | | | | | | 23,102 | | | | 3,587,939 | |
Samsung Biologics Company Limited (Health Care, Life Sciences Tools & Services) 144A† | | | | | | | | | | | 21,099 | | | | 7,231,683 | |
Samsung Electronics Company Limited (Information Technology, Technology Hardware, Storage & Peripherals) | | | | | | | | | | | 97,836 | | | | 240,496,579 | |
The accompanying notes are an integral part of these financial statements.
| | | | |
| 14 | | Wells Fargo Emerging Markets Equity Fund | | Portfolio of investments—October 31, 2017 |
| | | | | | | | | | | | | | | | |
| Security name | | | | | | | | Shares | | | Value | |
| | | | |
| South Korea (continued) | | | | | | | | | | | | | | | | |
Samsung Life Insurance Company Limited (Financials, Insurance) | | | | | | | | | | | 503,337 | | | $ | 60,651,131 | |
SK Hynix Incorporated (Information Technology, Semiconductors & Semiconductor Equipment) | | | | 866,000 | | | | 63,538,359 | |
| | | | |
| | | | | | | | | | | | | | | 524,201,072 | |
| | | | | | | | | | | | | | | | |
| | | | |
| Taiwan: 8.86% | | | | | | | | | | | | | | | | |
104 Corporation (Industrials, Professional Services) | | | | | | | | | | | 1,655,000 | | | | 8,340,987 | |
MediaTek Incorporated (Information Technology, Semiconductors & Semiconductor Equipment) | | | | 3,629,881 | | | | 41,221,978 | |
President Chain Store Corporation (Consumer Staples, Food & Staples Retailing) | | | | | | | | | | | 4,545,000 | | | | 40,839,371 | |
Taiwan Semiconductor Manufacturing Company Limited (Information Technology, Semiconductors & Semiconductor Equipment) | | | | 8,285,224 | | | | 66,755,398 | |
Taiwan Semiconductor Manufacturing Company Limited ADR (Information Technology, Semiconductors & Semiconductor Equipment) | | | | 3,097,852 | | | | 131,132,075 | |
Uni-President Enterprises Corporation (Consumer Staples, Food Products) | | | | | | | | | | | 35,862,368 | | | | 74,912,687 | |
| | | | |
| | | | | | | | | | | | | | | 363,202,496 | |
| | | | | | | | | | | | | | | | |
| | | | |
| Thailand: 2.81% | | | | | | | | | | | | | | | | |
PTT Exploration & Production PCL (Energy, Oil, Gas & Consumable Fuels) | | | | | | | | | | | 4,128,139 | | | | 10,718,001 | |
PTT PCL (Energy, Oil, Gas & Consumable Fuels) | | | | | | | | | | | 2,235,900 | | | | 28,268,453 | |
Siam Commercial Bank PCL (Financials, Banks) | | | | | | | | | | | 7,805,100 | | | | 34,420,444 | |
Thai Beverage PCL (Consumer Staples, Beverages) | | | | | | | | | | | 58,227,000 | | | | 41,862,270 | |
| | | | |
| | | | | | | | | | | | | | | 115,269,168 | |
| | | | | | | | | | | | | | | | |
| | | | |
| Turkey: 0.15% | | | | | | | | | | | | | | | | |
Avivasa Emeklilik Ve Hayat AS (Financials, Insurance) « | | | | | | | | | | | 1,246,853 | | | | 6,159,409 | |
| | | | | | | | | | | | | | | | |
| | | | |
| United Arab Emirates: 0.06% | | | | | | | | | | | | | | | | |
Emaar Malls Group (Real Estate, Real Estate Management & Development) | | | | | | | | | | | 3,773,147 | | | | 2,373,210 | |
| | | | | | | | | | | | | | | | |
| | | | |
| United Kingdom: 0.70% | | | | | | | | | | | | | | | | |
Standard Chartered plc (Financials, Banks) † | | | | | | | | | | | 2,895,244 | | | | 28,855,269 | |
| | | | | | | | | | | | | | | | |
| | | | |
Total Common Stocks (Cost $2,753,207,630) | | | | | | | | | | | | | | | 3,779,000,631 | |
| | | | | | | | | | | | | | | | |
| | | | |
| | | Interest rate | | | Maturity date | | | Principal | | | | |
| Convertible Debentures: 0.00% | | | | | | | | | | | | | | | | |
| | | | |
| Brazil: 0.00% | | | | | | | | | | | | | | | | |
Lupatech SA (Energy, Energy Equipment & Services) (a)† | | | 6.50 | % | | | 4-15-2018 | | | $ | 303,000 | | | | 0 | |
| | | | | | | | | | | | | | | | |
| | | | |
Total Convertible Debentures (Cost $160,691) | | | | | | | | | | | | | | | 0 | |
| | | | | | | | | | | | | | | | |
| | | | |
| | | Dividend yield | | | | | | Shares | | | | |
| Preferred Stocks: 1.40% | | | | | | | | | | | | | | | | |
| | | | |
| Brazil: 1.40% | | | | | | | | | | | | | | | | |
Lojas Americanas SA (Consumer Discretionary, Multiline Retail) † | | | 0.00 | | | | | | | | 10,710,093 | | | | 57,556,150 | |
| | | | | | | | | | | | | | | | |
| |
Total Preferred Stocks (Cost $44,707,496) | | | | 57,556,150 | |
| | | | | | | | | | | | | | | | |
The accompanying notes are an integral part of these financial statements.
| | | | | | |
| Portfolio of investments—October 31, 2017 | | Wells Fargo Emerging Markets Equity Fund | | | 15 | |
| | | | | | | | | | | | | | | | |
| Security name | | Yield | | | | | | Shares | | | Value | |
| | | | |
Short-Term Investments: 9.43% | | | | | | | | | | | | | | | | |
| | | | |
| Investment Companies: 9.43% | | | | | | | | | | | | | | | | |
Securities Lending Cash Investment LLC (l)(r)(u) | | | 1.26 | % | | | | | | | 123,189,507 | | | $ | 123,201,826 | |
Wells Fargo Government Money Market Fund Select Class (l)(u) | | | 0.96 | | | | | | | | 263,185,940 | | | | 263,185,940 | |
| |
Total Short-Term Investments (Cost $386,387,518) | | | | 386,387,766 | |
| | | | | | | | | | | | | | | | |
| | | | | | | | |
| Total investments in securities (Cost $3,184,463,335) | | | 103.03 | % | | | 4,222,944,547 | |
Other assets and liabilities, net | | | (3.03 | ) | | | (124,000,214 | ) |
| | | | | | | | |
| Total net assets | | | 100.00 | % | | $ | 4,098,944,333 | |
| | | | | | | | |
| † | Non-income-earning security |
| « | All or a portion of this security is on loan. |
| (a) | The security is fair valued in accordance with procedures approved by the Board of Trustees. |
| 144A | The security may be resold in transactions exempt from registration, normally to qualified institutional buyers, pursuant to Rule 144A under the Securities Act of 1933. |
| (l) | The issuer of the security is an affiliated person of the Fund as defined in the Investment Company Act of 1940. |
| (r) | The investment is a non-registered investment company purchased with cash collateral received from securities on loan. |
| (u) | The rate represents the 7-day annualized yield at period end. |
Investments in Affiliates
An affiliated investment is an investment in which the Fund owns at least 5% of the outstanding voting shares of the issuer or as a result of other relationships, such as the Fund and the issuer having the same investment manager. Transactions with issuers that were either affiliated persons of the Fund at the beginning of the period or the end of the period were as follows:
| | | | | | | | | | | | | | | | | | | | | | | | | | | | | | | | | | | | |
| | | Shares,
beginning of
period | | | Shares
purchased | | | Shares sold | | | Shares, end of period | | | Net
realized
gains
(losses) | | | Net
change in
unrealized
gains
(losses) | | | Income from
affiliated
securities | | | Value, end of period | | | % of
net
assets | |
Short-Term Investments | | | | | | | | | | | | | | | | | | | | | | | | | | | | | | | | | | | | |
Investment companies | | | | | | | | | | | | | | | | | | | | | | | | | | | | | | | | | | | | |
Securities Lending Cash Investment LLC | | | 156,094,383 | | | | 1,043,824,094 | | | | 1,076,728,970 | | | | 123,189,507 | | | $ | 9,700 | | | ($ | 9,259 | ) | | $ | 1,171,561 | | | $ | 123,201,826 | | | | | |
Wells Fargo Government Money Market Fund Select Class | | | 47,363,740 | | | | 792,202,191 | | | | 576,379,991 | | | | 263,185,940 | | | | 0 | | | | 0 | | | | 929,998 | | | | 263,185,940 | | | | | |
| | | | | | | | | | | | | | | | | | | | | | | | | | | | | | | | | | | | |
| | | | | | | | | | | | | | | | | | $ | 9,700 | | | ($ | 9,259 | ) | | $ | 2,101,559 | | | $ | 386,387,766 | | | | 9.43 | % |
| | | | | | | | | | | | | | | | | | | | | | | | | | | | | | | | | | | | |
The accompanying notes are an integral part of these financial statements.
| | | | |
| 16 | | Wells Fargo Emerging Markets Equity Fund | | Statement of assets and liabilities—October 31, 2017 |
| | | | |
| | | | |
| |
Assets | | | | |
Investments in unaffiliated securities (including $123,205,510 of securities loaned), at value (cost $2,798,075,817) | | $ | 3,836,556,781 | |
Investments in affiliated securities, at value (cost $386,387,518) | | | 386,387,766 | |
Foreign currency, at value (cost $3,651,473) | | | 2,764,823 | |
Receivable for investments sold | | | 733,441 | |
Receivable for Fund shares sold | | | 10,660,702 | |
Receivable for dividends | | | 1,916,501 | |
Receivable for securities lending income | | | 165,124 | |
Prepaid expenses and other assets | | | 150,267 | |
| | | | |
Total assets | | | 4,239,335,405 | |
| | | | |
| |
Liabilities | | | | |
Payable upon receipt of securities loaned | | | 123,191,058 | |
Payable for Fund shares redeemed | | | 7,511,646 | |
Management fee payable | | | 3,497,853 | |
Payable for investments purchased | | | 3,363,019 | |
Contingent tax liability | | | 1,605,818 | |
Administration fees payable | | | 458,845 | |
Distribution fees payable | | | 44,469 | |
Trustees’ fees and expenses payable | | | 3,756 | |
Accrued expenses and other liabilities | | | 714,608 | |
| | | | |
Total liabilities | | | 140,391,072 | |
| | | | |
Total net assets | | $ | 4,098,944,333 | |
| | | | |
| |
NET ASSETS CONSIST OF | | | | |
Paid-in capital | | $ | 3,414,750,366 | |
Undistributed net investment income | | | 13,070,041 | |
Accumulated net realized losses on investments | | | (364,870,340 | ) |
Net unrealized gains on investments | | | 1,035,994,266 | |
| | | | |
Total net assets | | $ | 4,098,944,333 | |
| | | | |
| |
COMPUTATION OF NET ASSET VALUE AND OFFERING PRICE PER SHARE | | | | |
Net assets – Class A | | $ | 268,383,962 | |
Shares outstanding – Class A1 | | | 10,806,964 | |
Net asset value per share – Class A | | | $24.83 | |
Maximum offering price per share – Class A2 | | | $26.34 | |
Net assets – Class C | | $ | 69,845,276 | |
Shares outstanding – Class C1 | | | 3,339,054 | |
Net asset value per share – Class C | | | $20.92 | |
Net assets – Class R6 | | $ | 192,928,568 | |
Shares outstanding – Class R61 | | | 7,421,193 | |
Net asset value per share – Class R6 | | | $26.00 | |
Net assets – Administrator Class | | $ | 144,420,692 | |
Shares outstanding – Administrator Class1 | | | 5,536,843 | |
Net asset value per share – Administrator Class | | | $26.08 | |
Net assets – Institutional Class | | $ | 3,423,365,835 | |
Shares outstanding – Institutional Class1 | | | 131,719,050 | |
Net asset value per share – Institutional Class | | | $25.99 | |
| 1 | The Fund has an unlimited number of authorized shares. |
| 2 | Maximum offering price is computed as 100/94.25 of net asset value. On investments of $50,000 or more, the offering price is reduced. |
The accompanying notes are an integral part of these financial statements.
| | | | | | |
| Statement of operations—year ended October 31, 2017 | | Wells Fargo Emerging Markets Equity Fund | | | 17 | |
| | | | |
| | | | |
| |
Investment income | | | | |
Dividends (net of foreign withholding taxes of $8,669,522) | | $ | 62,186,987 | |
Income from affiliated securities | | | 2,101,559 | |
| | | | |
Total investment income | | | 64,288,546 | |
| | | | |
| |
Expenses | | | | |
Management fee | | | 34,667,543 | |
Administration fees | | | | |
Class A | | | 1,008,351 | |
Class B | | | 439 | 1 |
Class C | | | 141,374 | |
Class R6 | | | 51,685 | |
Administrator Class | | | 186,188 | |
Institutional Class | | | 3,234,374 | |
Shareholder servicing fees | | | | |
Class A | | | 1,200,418 | |
Class B | | | 523 | 1 |
Class C | | | 168,303 | |
Administrator Class | | | 348,849 | |
Distribution fees | | | | |
Class B | | | 1,569 | 1 |
Class C | | | 504,908 | |
Custody and accounting fees | | | 1,165,806 | |
Professional fees | | | 73,861 | |
Registration fees | | | 156,687 | |
Shareholder report expenses | | | 852,096 | |
Trustees’ fees and expenses | | | 23,886 | |
Other fees and expenses | | | 51,903 | |
| | | | |
Total expenses | | | 43,838,763 | |
Less: Fee waivers and/or expense reimbursements | | | (856,232 | ) |
| | | | |
Net expenses | | | 42,982,531 | |
| | | | |
Net investment income | | | 21,306,015 | |
| | | | |
| |
REALIZED AND UNREALIZED GAINS (LOSSES) ON INVESTMENTS | | | | |
| |
Net realized gains (losses) on: | | | | |
Unaffiliated securities | | | (18,485,032 | ) |
Affiliated securities | | | 9,700 | |
Forward foreign currency contract transactions | | | 10,937 | |
| | | | |
Net realized losses on investments | | | (18,464,395 | ) |
| | | | |
| |
Net change in unrealized gains (losses) on: | | | | |
Unaffiliated securities | | | 680,829,881 | |
Affiliated securities | | | (9,259 | ) |
| | | | |
Net change in unrealized gains (losses) on investments | | | 680,820,622 | |
| | | | |
Net realized and unrealized gains (losses) on investments | | | 662,356,227 | |
| | | | |
Net increase in net assets resulting from operations | | $ | 683,662,242 | |
| | | | |
| 1 | For the period from November 1, 2016 to May 5, 2017. Effective at the close of business on May 5, 2017, Class B shares were converted to Class A shares and are no longer offered by the Fund. |
The accompanying notes are an integral part of these financial statements.
| | | | |
| 18 | | Wells Fargo Emerging Markets Equity Fund | | Statement of changes in net assets |
| | | | | | | | | | | | | | | | |
| | | Year ended
October 31, 2017 | | | Year ended
October 31, 2016 | |
| | | | |
Operations | | | | | | | | | | | | | | | | |
Net investment income | | | | | | $ | 21,306,015 | | | | | | | $ | 28,132,427 | |
Net realized losses on investments | | | | | | | (18,464,395 | ) | | | | | | | (78,862,801 | ) |
Net change in unrealized gains (losses) on investments | | | | | | | 680,820,622 | | | | | | | | 486,377,392 | |
| | | | |
Net increase in net assets resulting from operations | | | | | | | 683,662,242 | | | | | | | | 435,647,018 | |
| | | | |
| | | | |
Distributions to shareholders from | | | | | | | | | | | | | | | | |
Net investment income | | | | | | | | | | | | | | | | |
Class A | | | | | | | (5,313,014 | ) | | | | | | | (4,821,280 | ) |
Class R6 | | | | | | | (2,098,471 | ) | | | | | | | (1,207,067 | ) |
Administrator Class | | | | | | | (1,140,541 | ) | | | | | | | (915,237 | ) |
Institutional Class | | | | | | | (18,026,382 | ) | | | | | | | (22,745,172 | ) |
| | | | |
Total distributions to shareholders | | | | | | | (26,578,408 | ) | | | | | | | (29,688,756 | ) |
| | | | |
| | | | |
Capital share transactions | | | Shares | | | | | | | | Shares | | | | | |
Proceeds from shares sold | | | | | | | | | | | | | | | | |
Class A | | | 6,942,787 | | | | 140,950,802 | | | | 14,276,408 | | | | 257,431,388 | |
Class C | | | 442,470 | | | | 8,292,373 | | | | 284,656 | | | | 4,423,556 | |
Class R6 | | | 3,436,746 | | | | 79,020,347 | | | | 4,886,774 | | | | 94,696,839 | |
Administrator Class | | | 1,621,779 | | | | 36,816,903 | | | | 2,473,929 | | | | 47,026,221 | |
Institutional Class | | | 71,588,783 | | | | 1,652,655,030 | | | | 25,310,308 | | | | 470,045,141 | |
| | | | |
| | | | | | | 1,917,735,455 | | | | | | | | 873,623,145 | |
| | | | |
Reinvestment of distributions | | | | | | | | | | | | | | | | |
Class A | | | 274,903 | | | | 5,190,176 | | | | 275,442 | | | | 4,701,801 | |
Class R6 | | | 105,864 | | | | 2,085,516 | | | | 66,974 | | | | 1,193,482 | |
Administrator Class | | | 54,161 | | | | 1,073,463 | | | | 49,021 | | | | 878,463 | |
Institutional Class | | | 841,119 | | | | 16,578,453 | | | | 1,178,702 | | | | 21,004,467 | |
| | | | |
| | | | | | | 24,927,608 | | | | | | | | 27,778,213 | |
| | | | |
Payment for shares redeemed | | | | | | | | | | | | | | | | |
Class A | | | (39,090,896 | ) | | | (823,196,611 | ) | | | (20,179,942 | ) | | | (375,408,750 | ) |
Class B | | | (34,219 | )1 | | | (614,939 | )1 | | | (60,187 | ) | | | (925,067 | ) |
Class C | | | (1,264,603 | ) | | | (23,051,252 | ) | | | (1,621,268 | ) | | | (24,542,512 | ) |
Class R6 | | | (5,032,929 | ) | | | (110,185,480 | ) | | | (1,051,876 | ) | | | (20,911,449 | ) |
Administrator Class | | | (3,599,740 | ) | | | (80,342,148 | ) | | | (4,603,140 | ) | | | (87,710,425 | ) |
Institutional Class | | | (25,803,379 | ) | | | (588,537,786 | ) | | | (54,409,985 | ) | | | (1,055,274,030 | ) |
| | | | |
| | | | | | | (1,625,928,216 | ) | | | | | | | (1,564,772,233 | ) |
| | | | |
Net increase (decrease) in net assets resulting from capital share transactions | | | | | | | 316,734,847 | | | | | | | | (663,370,875 | ) |
| | | | |
Total increase (decrease) in net assets | | | | | | | 973,818,681 | | | | | | | | (257,412,613 | ) |
| | | | |
| | | | |
Net assets | | | | | | | | | | | | | | | | |
Beginning of period | | | | | | | 3,125,125,652 | | | | | | | | 3,382,538,265 | |
| | | | |
End of period | | | | | | $ | 4,098,944,333 | | | | | | | $ | 3,125,125,652 | |
| | | | |
Undistributed net investment income | | | | | | $ | 13,070,041 | | | | | | | $ | 7,243,488 | |
| | | | |
| 1 | For the period from November 1, 2016 to May 5, 2017. Effective at the close of business on May 5, 2017, Class B shares were converted to Class A shares and are no longer offered by the Fund. |
The accompanying notes are an integral part of these financial statements.
| | | | | | |
| Financial highlights | | Wells Fargo Emerging Markets Equity Fund | | | 19 | |
(For a share outstanding throughout each period)
| | | | | | | | | | | | | | | | | | | | |
| | | Year ended October 31 | |
| CLASS A | | 2017 | | | 2016 | | | 2015 | | | 2014 | | | 2013 | |
Net asset value, beginning of period | | | $20.49 | | | | $18.09 | | | | $21.44 | | | | $21.77 | | | | $20.48 | |
Net investment income (loss) | | | (0.03 | )1 | | | 0.12 | | | | 0.08 | | | | 0.07 | | | | 0.02 | |
Net realized and unrealized gains (losses) on investments | | | 4.50 | | | | 2.38 | | | | (3.29 | ) | | | (0.40 | ) | | | 1.33 | |
| | | | | | | | | | | | | | | | | | | | |
Total from investment operations | | | 4.47 | | | | 2.50 | | | | (3.21 | ) | | | (0.33 | ) | | | 1.35 | |
Distributions to shareholders from | | | | | | | | | | | | | | | | | | | | |
Net investment income | | | (0.13 | ) | | | (0.10 | ) | | | (0.14 | ) | | | 0.00 | | | | (0.06 | ) |
Net asset value, end of period | | | $24.83 | | | | $20.49 | | | | $18.09 | | | | $21.44 | | | | $21.77 | |
Total return2 | | | 21.99 | % | | | 13.93 | % | | | (15.02 | )% | | | (1.52 | )% | | | 6.62 | % |
Ratios to average net assets (annualized) | | | | | | | | | | | | | | | | | | | | |
Gross expenses | | | 1.58 | % | | | 1.64 | % | | | 1.64 | % | | | 1.64 | % | | | 1.65 | % |
Net expenses | | | 1.58 | % | | | 1.60 | % | | | 1.64 | % | | | 1.64 | % | | | 1.65 | % |
Net investment income (loss) | | | (0.13 | )% | | | 0.64 | % | | | 0.37 | % | | | 0.36 | % | | | 0.15 | % |
Supplemental data | | | | | | | | | | | | | | | | | | | | |
Portfolio turnover rate | | | 13 | % | | | 8 | % | | | 8 | % | | | 7 | % | | | 13 | % |
Net assets, end of period (000s omitted) | | | $268,384 | | | | $874,625 | | | | $873,992 | | | | $1,502,597 | | | | $1,306,269 | |
| 1 | Calculated based upon average shares outstanding |
| 2 | Total return calculations do not include any sales charges. |
The accompanying notes are an integral part of these financial statements.
| | | | |
| 20 | | Wells Fargo Emerging Markets Equity Fund | | Financial highlights |
(For a share outstanding throughout each period)
| | | | | | | | | | | | | | | | | | | | |
| | | Year ended October 31 | |
| CLASS C | | 2017 | | | 2016 | | | 2015 | | | 2014 | | | 2013 | |
Net asset value, beginning of period | | | $17.28 | | | | $15.28 | | | | $18.11 | | | | $18.53 | | | | $17.51 | |
Net investment loss | | | (0.08 | )1 | | | (0.02 | )1 | | | (0.06 | )1 | | | (0.08 | )1 | | | (0.11 | )1 |
Net realized and unrealized gains (losses) on investments | | | 3.72 | | | | 2.02 | | | | (2.77 | ) | | | (0.34 | ) | | | 1.13 | |
| | | | | | | | | | | | | | | | | | | | |
Total from investment operations | | | 3.64 | | | | 2.00 | | | | (2.83 | ) | | | (0.42 | ) | | | 1.02 | |
Net asset value, end of period | | | $20.92 | | | | $17.28 | | | | $15.28 | | | | $18.11 | | | | $18.53 | |
Total return2 | | | 21.06 | % | | | 13.09 | % | | | (15.63 | )% | | | (2.27 | )% | | | 5.83 | % |
Ratios to average net assets (annualized) | | | | | | | | | | | | | | | | | | | | |
Gross expenses | | | 2.31 | % | | | 2.39 | % | | | 2.39 | % | | | 2.39 | % | | | 2.39 | % |
Net expenses | | | 2.31 | % | | | 2.35 | % | | | 2.39 | % | | | 2.39 | % | | | 2.39 | % |
Net investment loss | | | (0.43 | )% | | | (0.12 | )% | | | (0.39 | )% | | | (0.42 | )% | | | (0.62 | )% |
Supplemental data | | | | | | | | | | | | | | | | | | | | |
Portfolio turnover rate | | | 13 | % | | | 8 | % | | | 8 | % | | | 7 | % | | | 13 | % |
Net assets, end of period (000s omitted) | | | $69,845 | | | | $71,900 | | | | $84,004 | | | | $138,169 | | | | $173,454 | |
| 1 | Calculated based upon average shares outstanding |
| 2 | Total return calculations do not include any sales charges. |
The accompanying notes are an integral part of these financial statements.
| | | | | | |
| Financial highlights | | Wells Fargo Emerging Markets Equity Fund | | | 21 | |
(For a share outstanding throughout each period)
| | | | | | | | | | | | | | | | | | | | |
| | | Year ended October 31 | |
| CLASS R6 | | 2017 | | | 2016 | | | 2015 | | | 2014 | | | 20131 | |
Net asset value, beginning of period | | | $21.46 | | | | $19.00 | | | | $22.53 | | | | $22.86 | | | | $20.89 | |
Net investment income | | | 0.17 | 2 | | | 0.23 | 2 | | | 0.19 | | | | 0.21 | | | | 0.01 | 2 |
Net realized and unrealized gains (losses) on investments | | | 4.59 | | | | 2.46 | | | | (3.46 | ) | | | (0.44 | ) | | | 1.96 | |
| | | | | | | | | | | | | | | | | | | | |
Total from investment operations | | | 4.76 | | | | 2.69 | | | | (3.27 | ) | | | (0.23 | ) | | | 1.97 | |
Distributions to shareholders from | | | | | | | | | | | | | | | | | | | | |
Net investment income | | | (0.22 | ) | | | (0.23 | ) | | | (0.26 | ) | | | (0.10 | ) | | | 0.00 | |
Net asset value, end of period | | | $26.00 | | | | $21.46 | | | | $19.00 | | | | $22.53 | | | | $22.86 | |
Total return3 | | | 22.53 | % | | | 14.43 | % | | | (14.61 | )% | | | (1.01 | )% | | | 9.43 | % |
Ratios to average net assets (annualized) | | | | | | | | | | | | | | | | | | | | |
Gross expenses | | | 1.14 | % | | | 1.20 | % | | | 1.19 | % | | | 1.17 | % | | | 1.17 | % |
Net expenses | | | 1.14 | % | | | 1.17 | % | | | 1.18 | % | | | 1.17 | % | | | 1.17 | % |
Net investment income | | | 0.76 | % | | | 1.16 | % | | | 0.84 | % | | | 0.88 | % | | | 0.15 | % |
Supplemental data | | | | | | | | | | | | | | | | | | | | |
Portfolio turnover rate | | | 13 | % | | | 8 | % | | | 8 | % | | | 7 | % | | | 13 | % |
Net assets, end of period (000s omitted) | | | $192,929 | | | | $191,250 | | | | $95,190 | | | | $35,967 | | | | $4,809 | |
| 1 | For the period from June 28, 2013 (commencement of class operations) to October 31, 2013 |
| 2 | Calculated based upon average shares outstanding |
| 3 | Returns for periods of less than one year are not annualized. |
The accompanying notes are an integral part of these financial statements.
| | | | |
| 22 | | Wells Fargo Emerging Markets Equity Fund | | Financial highlights |
(For a share outstanding throughout each period)
| | | | | | | | | | | | | | | | | | | | |
| | | Year ended October 31 | |
| ADMINISTRATOR CLASS | | 2017 | | | 2016 | | | 2015 | | | 2014 | | | 2013 | |
Net asset value, beginning of period | | | $21.53 | | | | $18.99 | | | | $22.44 | | | | $22.79 | | | | $21.44 | |
Net investment income | | | 0.10 | 1 | | | 0.15 | 1 | | | 0.12 | 1 | | | 0.13 | 1 | | | 0.05 | |
Net realized and unrealized gains (losses) on investments | | | 4.61 | | | | 2.50 | | | | (3.46 | ) | | | (0.44 | ) | | | 1.40 | |
| | | | | | | | | | | | | | | | | | | | |
Total from investment operations | | | 4.71 | | | | 2.65 | | | | (3.34 | ) | | | (0.31 | ) | | | 1.45 | |
Distributions to shareholders from | | | | | | | | | | | | | | | | | | | | |
Net investment income | | | (0.16 | ) | | | (0.11 | ) | | | (0.11 | ) | | | (0.04 | ) | | | (0.10 | ) |
Net asset value, end of period | | | $26.08 | | | | $21.53 | | | | $18.99 | | | | $22.44 | | | | $22.79 | |
Total return | | | 22.10 | % | | | 14.07 | % | | | (14.91 | )% | | | (1.36 | )% | | | 6.83 | % |
Ratios to average net assets (annualized) | | | | | | | | | | | | | | | | | | | | |
Gross expenses | | | 1.48 | % | | | 1.56 | % | | | 1.49 | % | | | 1.48 | % | | | 1.48 | % |
Net expenses | | | 1.46 | % | | | 1.49 | % | | | 1.48 | % | | | 1.48 | % | | | 1.48 | % |
Net investment income | | | 0.42 | % | | | 0.76 | % | | | 0.58 | % | | | 0.57 | % | | | 0.35 | % |
Supplemental data | | | | | | | | | | | | | | | | | | | | |
Portfolio turnover rate | | | 13 | % | | | 8 | % | | | 8 | % | | | 7 | % | | | 13 | % |
Net assets, end of period (000s omitted) | | | $144,421 | | | | $160,657 | | | | $181,224 | | | | $464,135 | | | | $1,050,660 | |
| 1 | Calculated based upon average shares outstanding |
The accompanying notes are an integral part of these financial statements.
| | | | | | |
| Financial highlights | | Wells Fargo Emerging Markets Equity Fund | | | 23 | |
(For a share outstanding throughout each period)
| | | | | | | | | | | | | | | | | | | | |
| | | Year ended October 31 | |
| INSTITUTIONAL CLASS | | 2017 | | | 2016 | | | 2015 | | | 2014 | | | 2013 | |
Net asset value, beginning of period | | | $21.46 | | | | $18.99 | | | | $22.52 | | | | $22.86 | | | | $21.50 | |
Net investment income | | | 0.19 | 1 | | | 0.20 | 1 | | | 0.17 | | | | 0.15 | | | | 0.11 | |
Net realized and unrealized gains (losses) on investments | | | 4.55 | | | | 2.49 | | | | (3.45 | ) | | | (0.40 | ) | | | 1.40 | |
| | | | | | | | | | | | | | | | | | | | |
Total from investment operations | | | 4.74 | | | | 2.69 | | | | (3.28 | ) | | | (0.25 | ) | | | 1.51 | |
Distributions to shareholders from | | | | | | | | | | | | | | | | | | | | |
Net investment income | | | (0.21 | ) | | | (0.22 | ) | | | (0.25 | ) | | | (0.09 | ) | | | (0.15 | ) |
Net asset value, end of period | | | $25.99 | | | | $21.46 | | | | $18.99 | | | | $22.52 | | | | $22.86 | |
Total return | | | 22.42 | % | | | 14.40 | % | | | (14.66 | )% | | | (1.09 | )% | | | 7.07 | % |
Ratios to average net assets (annualized) | | | | | | | | | | | | | | | | | | | | |
Gross expenses | | | 1.23 | % | | | 1.31 | % | | | 1.24 | % | | | 1.21 | % | | | 1.22 | % |
Net expenses | | | 1.20 | % | | | 1.22 | % | | | 1.22 | % | | | 1.21 | % | | | 1.22 | % |
Net investment income | | | 0.82 | % | | | 1.04 | % | | | 0.82 | % | | | 0.77 | % | | | 0.57 | % |
Supplemental data | | | | | | | | | | | | | | | | | | | | |
Portfolio turnover rate | | | 13 | % | | | 8 | % | | | 8 | % | | | 7 | % | | | 13 | % |
Net assets, end of period (000s omitted) | | | $3,423,366 | | | | $1,826,097 | | | | $2,146,675 | | | | $2,900,353 | | | | $2,183,281 | |
| 1 | Calculated based upon average shares outstanding |
The accompanying notes are an integral part of these financial statements.
| | | | |
| 24 | | Wells Fargo Emerging Markets Equity Fund | | Notes to financial statements |
1. ORGANIZATION
Wells Fargo Funds Trust (the “Trust”), a Delaware statutory trust organized on March 10, 1999, is an open-end management investment company registered under the Investment Company Act of 1940, as amended (the “1940 Act”). As an investment company, the Trust follows the accounting and reporting guidance in Financial Accounting Standards Board Accounting Standards Codification Topic 946, Financial Services – Investment Companies. These financial statements report on the Wells Fargo Emerging Markets Equity Fund (the “Fund”) which is a diversified series of the Trust.
Effective at the close of business on May 5, 2017, Class B shares were converted to Class A shares and are no longer offered by the Fund. Information for Class B shares reflected in the financial statements represents activity through May 5, 2017.
2. SIGNIFICANT ACCOUNTING POLICIES
The following significant accounting policies, which are consistently followed in the preparation of the financial statements of the Fund, are in conformity with U.S. generally accepted accounting principles which require management to make estimates and assumptions that affect the reported amounts of assets and liabilities, disclosure of contingent assets and liabilities at the date of the financial statements, and the reported amounts of revenues and expenses during the reporting period. Actual results could differ from those estimates.
Securities valuation
All investments are valued each business day as of the close of regular trading on the New York Stock Exchange (generally 4 p.m. Eastern Time), although the Fund may deviate from this calculation time under unusual or unexpected circumstances.
Equity securities that are listed on a foreign or domestic exchange or market are valued at the official closing price or, if none, the last sales price. If no sale occurs on the principal exchange or market that day, a fair value price will be determined in accordance with the Fund’s Valuation Procedures.
The values of securities denominated in foreign currencies are translated into U.S. dollars at rates provided by an independent foreign currency pricing source at a time each business day specified by the Management Valuation Team of Wells Fargo Funds Management, LLC (“Funds Management”).
Many securities markets and exchanges outside the U.S. close prior to the close of the New York Stock Exchange and therefore may not fully reflect trading or events that occur after the close of the principal exchange in which the foreign securities are traded, but before the close of the New York Stock Exchange. If such trading or events are expected to materially affect the value of such securities, then fair value pricing procedures approved by the Board of Trustees of the Fund are applied. These procedures take into account multiple factors including movements in U.S. securities markets after foreign exchanges close. Foreign securities that are fair valued under these procedures are categorized as Level 2 and the application of these procedures may result in transfers between Level 1 and Level 2. Depending on market activity, such fair valuations may be frequent. Such fair value pricing may result in net asset values that are higher or lower than net asset values based on the last reported sales price or latest quoted bid price. On October 31, 2017, such fair value pricing was not used in pricing foreign securities.
Debt securities are valued at the evaluated bid price provided by an independent pricing service or, if a reliable price is not available, the quoted bid price from an independent broker-dealer.
Investments in registered open-end investment companies are valued at net asset value. Interests in non-registered investment companies that are redeemable at net asset value are fair valued normally at net asset value.
Investments which are not valued using any of the methods discussed above are valued at their fair value, as determined in good faith by the Board of Trustees. The Board of Trustees has established a Valuation Committee comprised of the Trustees and has delegated to it the authority to take any actions regarding the valuation of portfolio securities that the Valuation Committee deems necessary or appropriate, including determining the fair value of portfolio securities, unless the determination has been delegated to the Management Valuation Team. The Board of Trustees retains the authority to make or ratify any valuation decisions or approve any changes to the Valuation Procedures as it deems appropriate. On a quarterly basis, the Board of Trustees receives reports on any valuation actions taken by the Valuation Committee or the Management Valuation Team which may include items for ratification.
Valuations of fair valued securities are compared to the next actual sales price when available, or other appropriate market values, to assess the continued appropriateness of the fair valuation methodologies used. These securities are fair valued on a day-to-day basis, taking into consideration changes to appropriate market information and any significant
| | | | | | |
| Notes to financial statements | | Wells Fargo Emerging Markets Equity Fund | | | 25 | |
changes to the inputs considered in the valuation process until there is a readily available price provided on an exchange or by an independent pricing service. Valuations received from an independent pricing service or independent broker-dealer quotes are periodically validated by comparisons to most recent trades and valuations provided by other independent pricing services in addition to the review of prices by the manager and/or subadviser. Unobservable inputs used in determining fair valuations are identified based on the type of security, taking into consideration factors utilized by market participants in valuing the investment, knowledge about the issuer and the current market environment.
Foreign currency translation
The accounting records of the Fund are maintained in U.S. dollars. The values of other assets and liabilities denominated in foreign currencies are translated into U.S. dollars at rates provided by an independent foreign currency pricing source at a time each business day specified by the Management Valuation Team. Purchases and sales of securities, and income and expenses are converted at the rate of exchange on the respective dates of such transactions. Net realized foreign exchange gains or losses arise from sales of foreign currencies, currency gains or losses realized between the trade and settlement dates on securities transactions, and the difference between the amounts of dividends, interest and foreign withholding taxes recorded and the U.S. dollar equivalent of the amounts actually paid or received. Net unrealized foreign exchange gains and losses arise from changes in the fair value of assets and liabilities other than investments in securities resulting from changes in exchange rates. The changes in net assets arising from changes in exchange rates of securities and the changes in net assets resulting from changes in market prices of securities are not separately presented. Such changes are included in net realized and unrealized gains or losses from investments.
Forward foreign currency contracts
The Fund is subject to foreign currency risk in the normal course of pursuing its investment objectives. A forward foreign currency contract is an agreement between two parties to purchase or sell a specific currency for an agreed-upon price at a future date. The Fund enters into forward foreign currency contracts to facilitate transactions in foreign-denominated securities and to attempt to minimize the risk to the Fund from adverse changes in the relationship between currencies. Forward foreign currency contracts are recorded at the forward rate and marked-to-market daily. When the contracts are closed, realized gains and losses arising from such transactions are recorded as realized gains or losses on forward foreign currency contract transactions. The Fund could be exposed to risks if the counterparties to the contracts are unable to meet the terms of their contracts or if the value of the foreign currency changes unfavorably. The Fund’s maximum risk of loss from counterparty credit risk is the unrealized gains on the contracts. This risk may be mitigated if there is a master netting arrangement between the Fund and the counterparty.
Security loans
The Fund may lend its securities from time to time in order to earn additional income in the form of fees or interest on securities received as collateral or the investment of any cash received as collateral. The Fund continues to receive interest or dividends on the securities loaned. The Fund receives collateral in the form of cash or securities with a value at least equal to the value of the securities on loan. The value of the loaned securities is determined at the close of each business day and any additional required collateral is delivered to the Fund on the next business day. In a securities lending transaction, the net asset value of the Fund will be affected by an increase or decrease in the value of the securities loaned and by an increase or decrease in the value of the instrument in which collateral is invested. The amount of securities lending activity undertaken by the Fund fluctuates from time to time. In the event of default or bankruptcy by the borrower, the Fund may be prevented from recovering the loaned securities or gaining access to the collateral or may experience delays or costs in doing so. In addition, the investment of any cash collateral received may lose all or part of its value. The Fund has the right under the lending agreement to recover the securities from the borrower on demand.
The Fund lends its securities through an unaffiliated securities lending agent. Cash collateral received in connection with its securities lending transactions is invested in Securities Lending Cash Investments, LLC (the “Securities Lending Fund”). The Securities Lending Fund is exempt from registration under Section 3(c)(7) of the 1940 Act and is managed by Funds Management and is subadvised by Wells Capital Management Incorporated (“WellsCap”), an affiliate of Funds Management and an indirect wholly owned subsidiary of Wells Fargo & Company (“Wells Fargo”). Funds Management receives an advisory fee starting at 0.05% and declining to 0.01% as the average daily net assets of the Securities Lending Fund increase. All of the fees received by Funds Management are paid to WellsCap for its services as subadviser. The Securities Lending Fund seeks to provide a positive return compared to the daily Fed Funds Open Rate by investing in high-quality, U.S. dollar-denominated short-term money market instruments. Securities Lending Fund investments are valued at the evaluated bid price provided by an independent pricing service. Income earned from investment in the Securities Lending Fund is included in income from affiliates securities on the Statement of Operations.
| | | | |
| 26 | | Wells Fargo Emerging Markets Equity Fund | | Notes to financial statements |
Security transactions and income recognition
Securities transactions are recorded on a trade date basis. Realized gains or losses are recorded on the basis of identified cost.
Dividend income is recognized on the ex-dividend date, except for certain dividends from foreign securities, which are recorded as soon as the custodian verifies the ex-dividend date. Dividend income from foreign securities is recorded net of foreign taxes withheld where recovery of such taxes is not assured.
Interest income is accrued daily and bond discounts are accreted and premiums are amortized daily based on the effective interest method. To the extent debt obligations are placed on non-accrual status, any related interest income may be reduced by writing off interest receivables when the collection of all or a portion of interest has been determined to be doubtful based on consistently applied procedures and the fair value has decreased. If the issuer subsequently resumes interest payments or when the collectability of interest is reasonably assured, the debt obligation is removed from non-accrual status.
Distributions to shareholders
Distributions to shareholders from net investment income and net realized gains, if any, are recorded on the ex-dividend date. Such distributions are determined in accordance with income tax regulations and may differ from U.S. generally accepted accounting principles. Dividend sources are estimated at the time of declaration. The tax character of distributions is determined as of the Fund’s fiscal year end. Therefore, a portion of the Fund’s distributions made prior to the Fund’s fiscal year end may be categorized as a tax return of capital.
Federal and other taxes
The Fund intends to continue to qualify as a regulated investment company by distributing substantially all of its investment company taxable income and any net realized capital gains (after reduction for capital loss carryforwards) sufficient to relieve it from all, or substantially all, federal income taxes. Accordingly, no provision for federal income taxes was required.
The Fund’s income and federal excise tax returns and all financial records supporting those returns for the prior three fiscal years are subject to examination by the federal and Delaware revenue authorities. Management has analyzed the Fund’s tax positions taken on federal, state, and foreign tax returns for all open tax years and does not believe that there are any uncertain tax positions that require recognition of a tax liability.
As of October 31, 2017, the aggregate cost of all investments for federal income tax purposes was $3,206,898,486 and the unrealized gains (losses) consisted of:
| | | | |
Gross unrealized gains | | $ | 1,246,909,036 | |
Gross unrealized losses | | | (230,862,975 | ) |
Net unrealized gains | | $ | 1,016,046,061 | |
Reclassifications are made to the Fund’s capital accounts for permanent tax differences to reflect income and gains available for distribution (or available capital loss carryforwards) under federal income tax regulations. U.S. generally accepted accounting principles require that certain components of net assets be adjusted to reflect permanent differences between financial and tax reporting. These reclassifications have no effect on net assets or net asset values per share. The primary permanent differences causing such reclassifications are due to corporate actions, expiration of capital loss carryforwards and passive foreign investment companies. At October 31, 2017, as a result of permanent book-to-tax differences, the following reclassification adjustments were made on the Statement of Assets and Liabilities:
| | | | |
| Paid-in capital | | Undistributed net investment income | | Accumulated net
realized losses
on investments |
| $(10,889,488) | | $11,098,946 | | $(209,458) |
As of October 31, 2017, the Fund had capital loss carryforwards which consist of $26,793,257 in short-term capital losses and $331,573,201 in long-term capital losses.
Class allocations
The separate classes of shares offered by the Fund differ principally in applicable sales charges, distribution, shareholder servicing, and administration fees. Class specific expenses are charged directly to that share class. Investment income, common expenses, and realized and unrealized gains (losses) on investments are allocated daily to each class of shares based on the relative proportion of net assets of each class.
| | | | | | |
| Notes to financial statements | | Wells Fargo Emerging Markets Equity Fund | | | 27 | |
3. FAIR VALUATION MEASUREMENTS
Fair value measurements of investments are determined within a framework that has established a fair value hierarchy based upon the various data inputs utilized in determining the value of the Fund’s investments. The three-level hierarchy gives the highest priority to unadjusted quoted prices in active markets for identical assets or liabilities (Level 1) and the lowest priority to unobservable inputs (Level 3). The Fund’s investments are classified within the fair value hierarchy based on the lowest level of input that is significant to the fair value measurement. The inputs are summarized into three broad levels as follows:
| ∎ | | Level 1 – quoted prices in active markets for identical securities |
| ∎ | | Level 2 – other significant observable inputs (including quoted prices for similar securities, interest rates, prepayment speeds, credit risk, etc.) |
| ∎ | | Level 3 – significant unobservable inputs (including the Fund’s own assumptions in determining the fair value of investments) |
The inputs or methodologies used for valuing investments in securities are not necessarily an indication of the risk associated with investing in those securities.
The following is a summary of the inputs used in valuing the Fund’s assets and liabilities as of October 31, 2017:
| | | | | | | | | | | | | | | | |
| | | Quoted prices
(Level 1) | | | Other significant
observable inputs
(Level 2) | | | Significant
unobservable inputs (Level 3) | | | Total | |
Assets | | | | | | | | | | | | | | | | |
Investments in: | | | | | | | | | | | | | | | | |
| | | | |
Common stocks | | | | | | | | | | | | | | | | |
Argentina | | $ | 19,921,699 | | | $ | 0 | | | $ | 0 | | | $ | 19,921,699 | |
Brazil | | | 286,532,575 | | | | 0 | | | | 0 | | | | 286,532,575 | |
Chile | | | 80,869,494 | | | | 0 | | | | 0 | | | | 80,869,494 | |
China | | | 1,052,298,507 | | | | 11,045 | | | | 0 | | | | 1,052,309,552 | |
Colombia | | | 17,455,600 | | | | 0 | | | | 0 | | | | 17,455,600 | |
Hong Kong | | | 188,117,894 | | | | 0 | | | | 0 | | | | 188,117,894 | |
India | | | 392,554,849 | | | | 0 | | | | 0 | | | | 392,554,849 | |
Indonesia | | | 84,058,600 | | | | 0 | | | | 0 | | | | 84,058,600 | |
Luxembourg | | | 8,308,302 | | | | 0 | | | | 0 | | | | 8,308,302 | |
Malaysia | | | 35,994,694 | | | | 0 | | | | 0 | | | | 35,994,694 | |
Mexico | | | 251,992,811 | | | | 0 | | | | 0 | | | | 251,992,811 | |
Peru | | | 15,892,906 | | | | 0 | | | | 0 | | | | 15,892,906 | |
Philippines | | | 29,568,504 | | | | 0 | | | | 0 | | | | 29,568,504 | |
Poland | | | 16,183,922 | | | | 0 | | | | 0 | | | | 16,183,922 | |
Russia | | | 92,144,656 | | | | 16,657,113 | | | | 0 | | | | 108,801,769 | |
Singapore | | | 7,077,677 | | | | 0 | | | | 0 | | | | 7,077,677 | |
South Africa | | | 143,299,159 | | | | 0 | | | | 0 | | | | 143,299,159 | |
South Korea | | | 524,201,072 | | | | 0 | | | | 0 | | | | 524,201,072 | |
Taiwan | | | 363,202,496 | | | | 0 | | | | 0 | | | | 363,202,496 | |
Thailand | | | 115,269,168 | | | | 0 | | | | 0 | | | | 115,269,168 | |
Turkey | | | 6,159,409 | | | | 0 | | | | 0 | | | | 6,159,409 | |
United Arab Emirates | | | 2,373,210 | | | | 0 | | | | 0 | | | | 2,373,210 | |
United Kingdom | | | 28,855,269 | | | | 0 | | | | 0 | | | | 28,855,269 | |
| | | | |
Convertible debentures | | | 0 | | | | 0 | | | | 0 | | | | 0 | |
| | | | |
Preferred stocks | | | | | | | | | | | | | | | | |
Brazil | | | 57,556,150 | | | | 0 | | | | 0 | | | | 57,556,150 | |
| | | | |
Short-term investments | | | | | | | | | | | | | | | | |
Investment companies | | | 263,185,940 | | | | 0 | | | | 0 | | | | 263,185,940 | |
Investments measured at net asset value* | | | | | | | | | | | | | | | 123,201,826 | |
Total assets | | $ | 4,083,074,563 | | | $ | 16,668,158 | | | $ | 0 | | | $ | 4,222,944,547 | |
| * | Investments that are measured at fair value using the net asset value per share (or its equivalent) as a practical expedient have not been categorized in the fair value hierarchy. The fair value amount presented in the table is intended to permit reconciliation of the fair value hierarchy to the amounts presented in the Statement of Assets and Liabilities. The Fund’s investment in Securities Lending Cash Investments, LLC valued at $123,201,826 does not have a redemption period notice, can be redeemed daily and does not have any unfunded commitments. |
| | | | |
| 28 | | Wells Fargo Emerging Markets Equity Fund | | Notes to financial statements |
The Fund recognizes transfers between levels within the fair value hierarchy at the end of the reporting period. At October 31, 2017, the Fund had no material transfers between Level 1 and Level 2. The Fund did not have any transfers into/out of Level 3.
4. TRANSACTIONS WITH AFFILIATES AND OTHER EXPENSES
Management fee
Funds Management, an indirect wholly owned subsidiary of Wells Fargo, is the manager of the Fund and provides advisory and fund-level administrative services under an investment management agreement. Under the investment management agreement, Funds Management is responsible for, among other services, implementing the investment objectives and strategies of the Fund, supervising the subadviser, providing fund-level administrative services in connection with the Fund’s operations, and providing any other fund-level administrative services reasonably necessary for the operation of the Fund. As compensation for its services under the investment management agreement, Funds Management is entitled to receive an annual management fee starting at 1.05% and declining to 0.945% as the average daily net assets of the Fund increase. Prior to March 1, 2017, Funds Management received a fee at an annual rate which started at 1.15% and declined to 0.955% as the average daily net assets of the Fund increased. For the year ended October 31, 2017, the management fee was equivalent to an annual rate of 1.03% of the Fund’s average daily net assets.
Funds Management has retained the services of a subadviser to provide daily portfolio management to the Fund. The fee for subadvisory services is borne by Funds Management. WellsCap is the subadviser to the Fund and is entitled to receive a fee from Funds Management at an annual rate starting at 0.65% and declining to 0.45% as the average daily net assets of the Fund increase.
Administration fees
Under a class-level administration agreement, Funds Management provides class-level administrative services to the Fund, which includes paying fees and expenses for services provided by the transfer agent, sub-transfer agents, omnibus account servicers and record-keepers. As compensation for its services under the class-level administration agreement, Funds Management receives an annual fee which is calculated based on the average daily net assets of each class as follows:
| | | | |
| | | Class-level
administration fee | |
Class A, Class B, Class C | | | 0.21 | % |
Class R6 | | | 0.03 | |
Administrator Class, Institutional Class | | | 0.13 | |
Funds Management has contractually waived and/or reimbursed management and administration fees to the extent necessary to maintain certain net operating expense ratios for the Fund. Waiver of fees and/or reimbursement of expenses by Funds Management were made first from fund level expenses on a proportionate basis and then from class specific expenses. Funds Management has committed through February 28, 2018 to waive fees and/or reimburse expenses to the extent necessary to cap the Fund’s expenses at 1.58% for Class A shares, 2.33% for Class C shares, 1.15% for Class R6 shares, 1.46% for Administrator Class shares, and 1.19% for Institutional Class shares. After this time, the cap may be increased or the commitment to maintain the cap may be terminated only with the approval of the Board of Trustees. Prior to March 1, 2017, the Fund’s expenses were capped at 1.61% for Class A shares, 2.36% for Class C shares, 1.18% for Class R6 shares, 1.49% for Administrator Class shares, and 1.22% for Institutional Class shares.
Out-of-pocket reimbursements
During the year ended October 31, 2017, State Street Bank and Trust Company (“State Street’), the Fund’s custodian, reimbursed the Fund $21,642 for certain out-of-pocket expenses that were billed to the Fund in error from 1998-2015. This amount is included in dividend income on the Statement of Operations. In addition, Funds Management was also reimbursed $63,842 by State Street for waivers/reimbursements it made to the Fund to limit Fund expenses during the period the Fund was erroneously billed.
Distribution fees
The Trust has adopted a distribution plan for Class B and Class C shares of the Fund pursuant to Rule 12b-1 under the 1940 Act. Distribution fees are charged to Class B and Class C shares and paid to Wells Fargo Funds Distributor, LLC (“Funds Distributor”), the principal underwriter, at an annual rate of 0.75% of the average daily net assets of Class B and Class C shares.
| | | | | | |
| Notes to financial statements | | Wells Fargo Emerging Markets Equity Fund | | | 29 | |
In addition, Funds Distributor is entitled to receive the front-end sales charge from the purchase of Class A shares and a contingent deferred sales charge on the redemption of certain Class A shares. Funds Distributor is also entitled to receive the contingent deferred sales charges from redemptions of Class B and Class C shares. For the year ended October 31, 2017, Funds Distributor received $22,694 from the sale of Class A shares and $584 in contingent deferred sales charges from redemptions of Class C. No contingent deferred sales charges were incurred by Class A and Class B shares for the year ended October 31, 2017.
Shareholder servicing fees
The Trust has entered into contracts with one or more shareholder servicing agents, whereby Class A, Class B, Class C, and Administrator Class of the Fund are charged a fee at an annual rate of 0.25% of the average daily net assets of each respective class.
A portion of these total shareholder servicing fees were paid to affiliates of Wells Fargo.
Interfund transactions
The Fund may purchase or sell portfolio investment securities to certain other Wells Fargo affiliates pursuant to Rule 17a-7 under the 1940 Act and under procedures adopted by the Board of Trustees. The procedures have been designed to ensure that these interfund transactions, which do not incur broker commissions, are effected at current market prices.
5. INVESTMENT PORTFOLIO TRANSACTIONS
Purchases and sales of investments, excluding U.S. government obligations (if any) and short-term securities, for the year ended October 31, 2017 were $570,382,485 and $406,138,827, respectively.
6. DERIVATIVE TRANSACTIONS
During the year ended October 31, 2017, the Fund entered into forward foreign currency contracts for economic hedging purposes. The Fund had average contract amounts of $163,276 in forward foreign currency contracts to buy during the year ended October 31, 2017.
The fair value, realized gains or losses and change in unrealized gains or losses, if any, on derivative instruments are reflected in the corresponding financial statement captions.
7. BANK BORROWINGS
The Trust (excluding the money market funds and certain other funds) and Wells Fargo Variable Trust are parties to a $280,000,000 revolving credit agreement whereby the Fund is permitted to use bank borrowings for temporary or emergency purposes, such as to fund shareholder redemption requests. Interest under the credit agreement is charged to the Fund based on a borrowing rate equal to the higher of the Federal Funds rate in effect on that day plus 1.25% or the overnight LIBOR rate in effect on that day plus 1.25%. In addition, an annual commitment fee equal to 0.25% of the unused balance is allocated to each participating fund. Prior to August 29, 2017, the revolving credit agreement amount was $250,000,000.
For the year ended October 31, 2017, there were no borrowings by the Fund under the agreement.
8. CONCENTRATION RISKS
Concentration risks result from exposure to a limited number of sectors or geographic regions. A fund that invest a substantial portion of their assets in any sector or geographic region may be more affected by changes in that sector or geographic region than would be a fund whose investments are not heavily weighted in any sector or geographic region.
9. DISTRIBUTIONS TO SHAREHOLDERS
The tax character of distributions paid was $26,578,408 and $29,688,756 of ordinary income the years ended October 31, 2017 and October 31, 2016, respectively.
As of October 31, 2017, the components of distributable earnings on a tax basis were as follows:
| | | | |
Undistributed ordinary
income | | Unrealized gains | | Capital loss carryforward |
$27,404,874 | | $ 1,015,164,934 | | $(358,366,458) |
| | | | |
| 30 | | Wells Fargo Emerging Markets Equity Fund | | Notes to financial statements |
10. INDEMNIFICATION
Under the Trust’s organizational documents, the officers and Trustees have been granted certain indemnification rights against certain liabilities that may arise out of performance of their duties to the Trust. Additionally, in the normal course of business, the Trust may enter into contracts with service providers that contain a variety of indemnification clauses. The Trust’s maximum exposure under these arrangements is dependent on future claims that may be made against the Fund and, therefore, cannot be estimated.
| | | | | | |
| Report of independent registered public accounting firm | | Wells Fargo Emerging Markets Equity Fund | | | 31 | |
BOARD OF TRUSTEES AND SHAREHOLDERS OF WELLS FARGO FUNDS TRUST:
We have audited the accompanying statement of assets and liabilities, including the portfolio of investments, of the Wells Fargo Emerging Markets Equity Fund (the “Fund”), one of the funds constituting the Wells Fargo Funds Trust, as of October 31, 2017, and the related statement of operations for the year then ended, the statements of changes in net assets for each of the years in the two-year period then ended, and the financial highlights for each of the years or periods in the five-year period then ended. These financial statements and financial highlights are the responsibility of the Fund’s management. Our responsibility is to express an opinion on these financial statements and financial highlights based on our audits.
We conducted our audits in accordance with the standards of the Public Company Accounting Oversight Board (United States). Those standards require that we plan and perform the audit to obtain reasonable assurance about whether the financial statements and financial highlights are free of material misstatement. An audit includes examining, on a test basis, evidence supporting the amounts and disclosures in the financial statements. Our procedures included confirmation of securities owned as of October 31, 2017, by correspondence with the custodian and brokers, or by other appropriate audit procedures. An audit also includes assessing the accounting principles used and significant estimates made by management, as well as evaluating the overall financial statement presentation. We believe that our audits provide a reasonable basis for our opinion.
In our opinion, the financial statements and financial highlights referred to above present fairly, in all material respects, the financial position of the Wells Fargo Emerging Markets Equity Fund as of October 31, 2017, the results of its operations for the year then ended, the changes in its net assets for each of the years in the two-year period then ended, and the financial highlights for each of the years or periods in the five-year period then ended, in conformity with U.S. generally accepted accounting principles.

Boston, Massachusetts
December 21, 2017
| | | | |
| 32 | | Wells Fargo Emerging Markets Equity Fund | | Other information (unaudited) |
TAX INFORMATION
Pursuant to Section 854 of the Internal Revenue Code, $26,578,408 of income dividends paid during the fiscal year ended October 31, 2017 has been designated as qualified dividend income (QDI).
For the fiscal year ended October 31, 2017, $72,873 has been designated as interest-related dividends for nonresident alien shareholders pursuant to Section 871 of the Internal Revenue Code.
Pursuant to Section 853 of the Internal Revenue Code, the Fund expects to designate amounts as foreign taxes paid for the fiscal year ended October 31, 2017. Additional details will be available in the semiannual report.
PROXY VOTING INFORMATION
A description of the policies and procedures that the Fund uses to determine how to vote proxies relating to portfolio securities is available, upon request, by calling 1-800-222-8222, visiting our website at wellsfargofunds.com, or visiting the SEC website at sec.gov. Information regarding how the Fund voted proxies relating to portfolio securities during the most recent 12-month period ended June 30 is available on the Fund’s website at wellsfargofunds.com or by visiting the SEC website at sec.gov.
PORTFOLIO HOLDINGS INFORMATION
The complete portfolio holdings for the Fund are publicly available monthly on the Fund’s website (wellsfargofunds.com), on a one-month delayed basis. In addition, top ten holdings information (excluding derivative positions) for the Fund is publicly available on the Fund’s website on a monthly, seven-day or more delayed basis. The Fund files its complete schedule of portfolio holdings with the SEC for the first and third quarters of each fiscal year on Form N-Q, which is available by visiting the SEC website at sec.gov. In addition, the Fund’s Form N-Q may be reviewed and copied at the SEC’s Public Reference Room in Washington, DC, and at regional offices in New York City, at 233 Broadway, and in Chicago, at 175 West Jackson Boulevard, Suite 900. Information about the Public Reference Room may be obtained by calling 1-800-SEC-0330.
| | | | | | |
| Other information (unaudited) | | Wells Fargo Emerging Markets Equity Fund | | | 33 | |
BOARD OF TRUSTEES AND OFFICERS
Each of the Trustees and Officers1 listed in the table below acts in identical capacities for each fund in the Wells Fargo family of funds, which consists of 152 mutual funds comprising the Wells Fargo Funds Trust, Wells Fargo Variable Trust, Wells Fargo Master Trust and four closed-end funds (collectively the “Fund Complex”). This table should be read in conjunction with the Prospectus and the Statement of Additional Information2. The mailing address of each Trustee and Officer is 525 Market Street, 12th Floor, San Francisco, CA 94105. Each Trustee and Officer serves an indefinite term, however, each Trustee serves such term until reaching the mandatory retirement age established by the Trustees.
Independent Trustees
| | | | | | |
Name and year of birth | | Position held and length of service* | | Principal occupations during past five years or longer | | Current other public company or investment company
directorships |
William R. Ebsworth (Born 1957) | | Trustee, since 2015 | | Retired. From 1984 to 2013, equities analyst, portfolio manager, research director and chief investment officer at Fidelity Management and Research Company in Boston, Tokyo, and Hong Kong, and retired in 2013 as Chief Investment Officer of Fidelity Strategic Advisers, Inc. where he led a team of investment professionals managing client assets. Prior thereto, Board member of Hong Kong Securities Clearing Co., Hong Kong Options Clearing Corp., the Thailand International Fund, Ltd., Fidelity Investments Life Insurance Company, and Empire Fidelity Investments Life Insurance Company. Board member of the Forté Foundation (non-profit organization) and the Vincent Memorial Hospital Endowment (non-profit organization), where he serves on the Investment Committee and as Chair of the Audit Committee. Mr. Ebsworth is a CFA® charterholder. | | Asset Allocation Trust |
Jane A. Freeman** (Born 1953) | | Trustee, since 2015; Chair Liaison, effective 2018 | | Retired. From 2012 to 2014 and 1999 to 2008, Chief Financial Officer of Scientific Learning Corporation. From 2008 to 2012, Ms. Freeman provided consulting services related to strategic business projects. Prior to 1999, Portfolio Manager at Rockefeller & Co. and Scudder, Stevens & Clark. Board member of the Harding Loevner Funds from 1996 to 2014, serving as both Lead Independent Director and chair of the Audit Committee. Board member of the Russell Exchange Traded Funds Trust from 2011 to 2012 and the chair of the Audit Committee. Ms. Freeman is a Board Member of Ruth Bancroft Garden (non-profit organization) and an inactive chartered financial analyst. | | Asset Allocation Trust |
Peter G. Gordon*** (Born 1942) | | Trustee, from 1998 to 2017; Chairman, from 2005 to 2017 | | Co-Founder, Retired Chairman, President and CEO of Crystal Geyser Water Company. Trustee Emeritus, Colby College. | | Asset Allocation Trust |
Isaiah Harris, Jr. (Born 1952) | | Trustee, since 2009 | | Retired. Chairman of the Board of CIGNA Corporation since 2009, and Director since 2005. From 2003 to 2011, Director of Deluxe Corporation. Prior thereto, President and CEO of BellSouth Advertising and Publishing Corp. from 2005 to 2007, President and CEO of BellSouth Enterprises from 2004 to 2005 and President of BellSouth Consumer Services from 2000 to 2003. Emeritus member of the Iowa State University Foundation Board of Governors. Emeritus Member of the Advisory Board of Iowa State University School of Business. Advisory Board Member, Palm Harbor Academy (charter school). Advisory Board Member, Child Evangelism Fellowship (non-profit). Mr. Harris is a certified public accountant (inactive status). | | CIGNA Corporation; Asset Allocation Trust |
Judith M. Johnson (Born 1949) | | Trustee, since 2008; Audit Committee Chairman, since 2008 | | Retired. Prior thereto, Chief Executive Officer and Chief Investment Officer of Minneapolis Employees Retirement Fund from 1996 to 2008. Ms. Johnson is an attorney, certified public accountant and a certified managerial accountant. | | Asset Allocation Trust |
David F. Larcker (Born 1950) | | Trustee, since 2009 | | James Irvin Miller Professor of Accounting at the Graduate School of Business, Stanford University, Director of the Corporate Governance Research Initiative and Senior Faculty of The Rock Center for Corporate Governance since 2006. From 2005 to 2008, Professor of Accounting at the Graduate School of Business, Stanford University. Prior thereto, Ernst & Young Professor of Accounting at The Wharton School, University of Pennsylvania from 1985 to 2005. | | Asset Allocation Trust |
| | | | |
| 34 | | Wells Fargo Emerging Markets Equity Fund | | Other information (unaudited) |
| | | | | | |
Name and year of birth | | Position held and length of service* | | Principal occupations during past five years or longer | | Current other public company or investment company
directorships |
Olivia S. Mitchell**** (Born 1953) | | Trustee, since 2006; Governance Committee Chairman, effective 2018 | | International Foundation of Employee Benefit Plans Professor, Wharton School of the University of Pennsylvania since 1993. Director of Wharton’s Pension Research Council and Boettner Center on Pensions & Retirement Research, and Research Associate at the National Bureau of Economic Research. Previously, Cornell University Professor from 1978 to 1993. | | Asset Allocation Trust |
Timothy J. Penny***** (Born 1951) | | Trustee, since 1996; Chairman, effective 2018; Vice Chairman, from 2017 to 2018 | | President and Chief Executive Officer of Southern Minnesota Initiative Foundation, a non-profit organization, since 2007 and Senior Fellow at the Humphrey Institute Policy Forum at the University of Minnesota since 1995. Member of the Board of Trustees of NorthStar Education Finance, Inc., a non-profit organization, since 2007. | | Asset Allocation Trust |
James G. Polisson****** (Born 1959) | | Trustee, since 2018; Advisory Board Member, effective 2017 to 2018 | | Retired. Chief Marketing Officer, Source (ETF) UK Services, Ltd, from 2015 to 2017. From 2012 to 2015, Principal of The Polisson Group, LLC, a management consulting, corporate advisory and principal investing company. Chief Executive Officer and Managing Director at Russell Investments, Global Exchange Traded Funds from 2010 to 2012. Managing Director of Barclays Global Investors from 1998 to 2010 and Global Chief Marketing Officer for iShares and Barclays Global Investors from 2000 to 2010. Prior thereto, Vice President, Fidelity Retail Mutual Fund Group from 1996 to 1998 and Risk Management Practice Manager, Fidelity Consulting from 1995 to 1996. Board member of the Russell Exchange Traded Fund Trust from 2011 to 2012. Director of Barclays Global Investors Holdings Deutschland GmbH from 2006 to 2009. Mr. Polisson is an attorney and has a retired status with the Massachusetts and District of Columbia Bar Associations. | | Asset Allocation Trust |
Michael S. Scofield (Born 1943) | | Trustee, since 2010 | | Served on the Investment Company Institute’s Board of Governors and Executive Committee from 2008-2011 as well the Governing Council of the Independent Directors Council from 2006-2011 and the Independent Directors Council Executive Committee from 2008-2011. Trustee of the Evergreen Funds complex (and its predecessors) from 1984 to 2010. Chairman of the Evergreen Funds from 2000-2010. Former Trustee of the Mentor Funds. Retired Attorney, Law Offices of Michael S. Scofield. | | Asset Allocation Trust |
Pamela Wheelock****** (Born 1959) | | Trustee, effective 2018; Advisory Board Member, from 2017 to 2018 | | Chief Operating Officer, Twin Cities Habitat for Humanity, since January, 2017. Vice President of University Services, University of Minnesota from 2012 to 2017. Prior thereto, Interim President and Chief Executive Officer of Blue Cross Blue Shield of Minnesota from 2010 to 2011, Chairman of the Board from 2009 to 2011 and Board Director from 2003 to 2015. Vice President, Leadership and Community Engagement, Bush Foundation, Saint Paul, Minnesota (a private foundation) from 2009 to 2011. Executive Vice President and Chief Financial Officer, Minnesota Sports and Entertainment from 2004 to 2009 and Senior Vice President from 2002 to 2004. Commissioner of Finance, State of Minnesota, from 1999 to 2002. Currently on the Board of Directors, Governance Committee and Finance Committee, for the Minnesota Philanthropy Partners (Saint Paul Foundation) since 2012 and Board Chair of the Minnesota Wild Foundation since 2010. | | Asset Allocation Trust |
| * | Length of service dates reflect the Trustee’s commencement of service with the Trust’s predecessor entities, where applicable. |
| ** | Jane Freeman will become Chair Liaison effective January 1, 2018. |
| *** | Peter Gordon will retire on December 31, 2017. |
| **** | Olivia Mitchell will become Chairman of the Governance Committee effective January 1, 2018. |
| ***** | Timothy Penny will become Chairman effective January 1, 2018. |
| ****** | James Polisson and Pamela Wheelock each will become a Trustee effective January 1, 2018. |
| | | | | | |
| Other information (unaudited) | | Wells Fargo Emerging Markets Equity Fund | | | 35 | |
Officers
| | | | | | |
Name and year of birth | | Position held and length of service | | Principal occupations during past five years or longer | | |
Andrew Owen (Born 1960) | | President, since 2017 | | Executive Vice President of Wells Fargo & Company and Head of Affiliated Managers, Wells Fargo Asset Management, since 2014. In addition, Mr. Owen is currently President, Chief Executive Officer and Director of Wells Fargo Funds Management, LLC since 2017. Prior thereto, Executive Vice President responsible for marketing, investments and product development for Wells Fargo Funds Management, LLC, from 2009 to 2014. | | |
Jeremy DePalma1 (Born 1974) | | Treasurer, since 2012 | | Senior Vice President of Wells Fargo Funds Management, LLC since 2009. Senior Vice President of Evergreen Investment Management Company, LLC from 2008 to 2010 and head of the Fund Reporting and Control Team within Fund Administration from 2005 to 2010. | | |
C. David Messman (Born 1960) | | Secretary, since 2000; Chief Legal Officer, since 2003 | | Senior Vice President and Secretary of Wells Fargo Funds Management, LLC since 2001. Assistant General Counsel of Wells Fargo Bank, N.A. since 2013 and Vice President and Managing Counsel of Wells Fargo Bank, N.A. from 1996 to 2013. | | |
Michael H. Whitaker (Born 1967) | | Chief Compliance Officer, since 2016 | | Senior Vice President and Chief Compliance Officer since 2016. Senior Vice President and Chief Compliance Officer for Fidelity Investments from 2007 to 2016. | | |
David Berardi (Born 1975) | | Assistant Treasurer, since 2009 | | Vice President of Wells Fargo Funds Management, LLC since 2009. Vice President of Evergreen Investment Management Company, LLC from 2008 to 2010. Manager of Fund Reporting and Control for Evergreen Investment Management Company, LLC from 2004 to 2010. | | |
| 1 | Jeremy DePalma acts as Treasurer of 76 funds and Assistant Treasurer of 76 funds in the Fund Complex. |
| 2 | The Statement of Additional Information includes additional information about the Trustees and is available, without charge, upon request, by calling 1-800-222-8222 or by visiting the website at wellsfargofunds.com. |
| | | | |
| 36 | | Wells Fargo Emerging Markets Equity Fund | | Other information (unaudited) |
BOARD CONSIDERATION OF INVESTMENT MANAGEMENT AND SUB-ADVISORY AGREEMENTS:
Under the Investment Company Act of 1940 (the “1940 Act”), the Board of Trustees (the “Board”) of Wells Fargo Funds Trust (the “Trust”) must determine annually whether to approve the continuation of the Trust’s investment management and sub-advisory agreements. In this regard, at an in-person meeting held on May 16-17, 2017 (the “Meeting”), the Board, all the members of which have no direct or indirect interest in the investment management and sub-advisory agreements and are not “interested persons” of the Trust, as defined in the 1940 Act (the “Independent Trustees”), reviewed and approved for Wells Fargo Emerging Markets Equity Fund (the “Fund”): (i) an investment management agreement (the “Management Agreement”) with Wells Fargo Funds Management, LLC (“Funds Management”); and (ii) an investment sub-advisory agreement (the “Sub-Advisory Agreement”) with Wells Capital Management Incorporated (the “Sub-Adviser”), an affiliate of Funds Management. The Management Agreement and the Sub-Advisory Agreement are collectively referred to as the “Advisory Agreements.”
At the Meeting, the Board considered the factors and reached the conclusions described below relating to the selection of Funds Management and the Sub-Adviser and the approval of the Advisory Agreements. Prior to the Meeting, including at an in-person meeting in April 2017, the Trustees conferred extensively among themselves and with representatives of Funds Management about these matters. Also, the Board has adopted a team-based approach, with each team consisting of a sub-set of Trustees, to assist the full Board in the discharge of its duties in reviewing performance and other matters throughout the year. The Independent Trustees were assisted in their evaluation of the Advisory Agreements by independent legal counsel, from whom they received separate legal advice and with whom they met separately.
In providing information to the Board, Funds Management and the Sub-Adviser were guided by a detailed set of requests for information submitted to them by independent legal counsel on behalf of the Independent Trustees at the start of the Board’s annual contract renewal process earlier in 2017. In considering and approving the Advisory Agreements, the Trustees considered the information they believed relevant, including but not limited to the information discussed below. The Board considered not only the specific information presented in connection with the Meeting, but also the knowledge gained over time through interaction with Funds Management and the Sub-Adviser about various topics. In this regard, the Board reviewed reports of Funds Management at each of its quarterly meetings, which included, among other things, portfolio reviews and performance reports. In addition, the Board and the teams mentioned above confer with portfolio managers at various times throughout the year. The Board did not identify any particular information or consideration that was all-important or controlling, and each individual Trustee may have attributed different weights to various factors.
After its deliberations, the Board unanimously approved the continuation of the Advisory Agreements for a one-year term and determined that the compensation payable to Funds Management and the Sub-Adviser under each of the Advisory Agreements was reasonable. The Board considered the approval of the Advisory Agreements for the Fund as part of its consideration of agreements for funds across the complex, but its approvals were made on a fund-by-fund basis. The following summarizes a number of important, but not necessarily all, factors considered by the Board in support of its approvals.
Nature, extent and quality of services
The Board received and considered various information regarding the nature, extent and quality of services provided to the Fund by Funds Management and the Sub-Adviser under the Advisory Agreements. This information included a description of the investment advisory services and Fund-level administrative services covered by the Management Agreement, as well as, among other things, a summary of the background and experience of senior management of Funds Management, a summary of certain organizational and personnel changes involving Funds Management and the Sub-Adviser, and a description of Funds Management’s and the Sub-Adviser’s business continuity planning programs and of their approaches to data privacy and cybersecurity. The Board also considered the qualifications, background, tenure and responsibilities of each of the portfolio managers primarily responsible for the day-to-day portfolio management of the Fund.
The Board evaluated the ability of Funds Management and the Sub-Adviser to attract and retain qualified investment professionals, including research, advisory and supervisory personnel. The Board further considered the compliance programs and compliance records of Funds Management and the Sub-Adviser. In addition, the Board took into account the full range of services provided to the Fund by Funds Management and its affiliates.
Fund performance and expenses
The Board considered the investment performance results for the Fund over various time periods ended December 31, 2016. In certain cases, the Board also considered more current results for various time periods ended March 31, 2017. The Board considered these results in comparison to the performance of funds in a universe that was determined by Broadridge Inc.
| | | | | | |
| Other information (unaudited) | | Wells Fargo Emerging Markets Equity Fund | | | 37 | |
(“Broadridge”) to be similar to the Fund (the “Universe”), and in comparison to the Fund’s benchmark index and to other comparative data. Broadridge is an independent provider of investment company data. The Board received a description of the methodology used by Broadridge to select the mutual funds in the performance Universe. The Board noted that the performance of the Fund (Administrator Class) was higher than the average performance of the Universe for the one-, three- and ten-year periods ended December 31, 2016, but lower than the average performance of the Universe for the five-year period ended December 31, 2016. The Board also noted that the performance ranking of the Fund in the Universe had improved from the prior quarter-end for the one-, three- and five-year periods ended March 31, 2017. The Board also noted that the performance of the Fund was lower than its benchmark, the MSCI Emerging Markets Index (Net), for the five-year period ended December 31, 2016, but higher than or in range of its benchmark for the one-, three- and ten-year periods ended December 31, 2016.
The Board also received and considered information regarding the Fund’s net operating expense ratios and their various components, including actual management fees, custodian and other non-management fees, and Rule 12b-1 and non-Rule 12b-1 shareholder service fees. The Board considered these ratios in comparison to the median ratios of funds in class-specific expense groups that were determined by Broadridge to be similar to the Fund (the “Groups”). The Board received a description of the methodology used by Broadridge to select the mutual funds in the expense Groups and an explanation of how funds comprising expense groups and their expense ratios may vary from year-to-year. Based on the Broadridge reports, the Board noted that the net operating expense ratios of the Fund were in range of the median net operating expense ratios of the expense Groups for all share classes.
The Board took into account the Fund performance and expense information provided to it among the factors considered in deciding to re-approve the Advisory Agreements.
Investment management and sub-advisory fee rates
The Board reviewed and considered the contractual fee rates payable by the Fund to Funds Management under the Management Agreement, as well as the contractual fee rates payable by the Fund to Funds Management for class-level administrative services under a Class-Level Administration Agreement, which include, among other things, class-level transfer agency and sub-transfer agency costs (collectively, the “Management Rates”). The Board also reviewed and considered the contractual investment sub-advisory fee rates that are payable by Funds Management to the Sub-Adviser for investment sub-advisory services.
Among other information reviewed by the Board was a comparison of the Fund’s Management Rates with the average contractual investment management fee rates of funds in the expense Groups at a common asset level as well as transfer agency costs of the funds in the expense Groups. The Board noted that the Management Rates of the Fund were in range of the sum of these average rates for the Fund’s expense Groups for all share classes.
The Board also received and considered information about the portion of the total management fee that was retained by Funds Management after payment of the fee to the Sub-Adviser for sub-advisory services. In assessing the reasonableness of this amount, the Board received and evaluated information about the nature and extent of responsibilities retained and risks assumed by Funds Management and not delegated to or assumed by the Sub-Adviser, and about Funds Management’s on-going oversight services. Given the affiliation between Funds Management and the Sub-Adviser, the Board ascribed limited relevance to the allocation of fees between them.
The Board also received and considered information about the nature and extent of services offered and fee rates charged by Funds Management and the Sub-Adviser to other types of clients with investment strategies similar to those of the Fund. In this regard, the Board received information about the significantly greater scope of services, and compliance, reporting and other legal burdens and risks of managing mutual funds compared with those associated with managing assets of non-mutual fund clients such as institutional separate accounts.
Based on its consideration of the factors and information it deemed relevant, including those described here, the Board determined that the compensation payable to Funds Management under the Management Agreement and to the Sub-Adviser under the Sub-Advisory Agreement was reasonable.
Profitability
The Board received and considered information concerning the profitability of Funds Management, as well as the profitability of Wells Fargo as a whole, from providing services to the Fund and the fund family as a whole. The Board also received and considered information concerning the profitability of the Sub-Adviser from providing services to the fund family as a whole, noting that the Sub-Adviser’s profitability information with respect to providing services to the Fund was subsumed in the Wells Fargo and Funds Management profitability analysis.
| | | | |
| 38 | | Wells Fargo Emerging Markets Equity Fund | | Other information (unaudited) |
Funds Management reported on the methodologies and estimates used in calculating profitability, including a description of the methodology used to allocate certain expenses. Among other things, the Board noted that the levels of profitability reported on a fund-by-fund basis varied widely, depending on factors such as the size and type of fund. Based on its review, the Board did not deem the profits reported by Funds Management or Wells Fargo from its services to the Fund to be at a level that would prevent it from approving the continuation of the Advisory Agreements.
Economies of scale
With respect to possible economies of scale, the Board noted the existence of breakpoints in the Fund’s management fee structure, which operate generally to reduce the Fund’s expense ratios as the Fund grows in size. It considered that, for a small fund or a fund that shrinks in size, breakpoints conversely can result in higher fee levels. The Board also considered that in addition to management fee breakpoints, competitive management fee rates set at the outset without regard to breakpoints and fee waiver and expense reimbursement arrangements are means of sharing potential economies of scale with shareholders of the Fund. The Board considered Funds Management’s view, which Funds Management indicated was supported by independent third-party industry studies which were summarized for the Board, that any analyses of potential economies of scale in managing a particular fund are inherently limited in light of the joint and common costs and investments that Funds Management incurs across the fund family as a whole.
The Board concluded that the Fund’s fee and expense arrangements, including contractual breakpoints, constituted a reasonable approach to sharing potential economies of scale with the Fund and its shareholders.
Other benefits to Funds Management and the Sub-Adviser
The Board received and considered information regarding potential “fall-out” or ancillary benefits received by Funds Management and its affiliates, including the Sub-Adviser, as a result of their relationships with the Fund. Ancillary benefits could include, among others, benefits directly attributable to other relationships with the Fund and benefits potentially derived from an increase in Funds Management’s and the Sub-Adviser’s business as a result of their relationships with the Fund. The Board noted that various affiliates of Funds Management may receive distribution-related fees, shareholder servicing payments and sub-transfer agency fees in respect of shares sold or held through them and services provided.
The Board also reviewed information about soft dollar credits earned and utilized by the Sub-Adviser, fees earned by Funds Management and the Sub-Adviser from managing a private investment vehicle for the fund family’s securities lending collateral and commissions earned by an affiliated broker from portfolio transactions.
Based on its consideration of the factors and information it deemed relevant, including those described here, the Board did not find that any ancillary benefits received by Funds Management and its affiliates, including the Sub-Adviser, were unreasonable.
Conclusion
At the Meeting, after considering the above-described factors and based on its deliberations and its evaluation of the information described above, the Board unanimously approved the continuation of the Advisory Agreements for a one-year term and determined that the compensation payable to Funds Management and the Sub-Adviser under each of the Advisory Agreements was reasonable.
| | | | | | |
| List of abbreviations | | Wells Fargo Emerging Markets Equity Fund | | | 39 | |
The following is a list of common abbreviations for terms and entities that may have appeared in this report.
| ACA | — ACA Financial Guaranty Corporation |
| ADR | — American depositary receipt |
| ADS | — American depositary shares |
| AGC | — Assured Guaranty Corporation |
| AGM | — Assured Guaranty Municipal |
| Ambac | — Ambac Financial Group Incorporated |
| AMT | — Alternative minimum tax |
| BAN | — Bond anticipation notes |
| BHAC | — Berkshire Hathaway Assurance Corporation |
| CAB | — Capital appreciation bond |
| CCAB | — Convertible capital appreciation bond |
| CDA | — Community Development Authority |
| CDO | — Collateralized debt obligation |
| CLO | — Collateralized loan obligation |
| DRIVER | — Derivative inverse tax-exempt receipts |
| DW&P | — Department of Water & Power |
| DWR | — Department of Water Resources |
| ECFA | — Educational & Cultural Facilities Authority |
| EDA | — Economic Development Authority |
| EDFA | — Economic Development Finance Authority |
| ETF | — Exchange-traded fund |
| FDIC | — Federal Deposit Insurance Corporation |
| FFCB | — Federal Farm Credit Banks |
| FGIC | — Financial Guaranty Insurance Corporation |
| FHA | — Federal Housing Administration |
| FHLB | — Federal Home Loan Bank |
| FHLMC | — Federal Home Loan Mortgage Corporation |
| FICO | — The Financing Corporation |
| FNMA | — Federal National Mortgage Association |
| GDR | — Global depositary receipt |
| GNMA | — Government National Mortgage Association |
| HCFR | — Healthcare facilities revenue |
| HEFA | — Health & Educational Facilities Authority |
| HEFAR | — Higher education facilities authority revenue |
| HFA | — Housing Finance Authority |
| HFFA | — Health Facilities Financing Authority |
| HUD | — Department of Housing and Urban Development |
| IDA | — Industrial Development Authority |
| IDAG | — Industrial Development Agency |
| KRW | — Republic of Korea won |
| LIBOR | — London Interbank Offered Rate |
| LIFER | — Long Inverse Floating Exempt Receipts |
| LLC | — Limited liability company |
| LLLP | — Limited liability limited partnership |
| LLP | — Limited liability partnership |
| MBIA | — Municipal Bond Insurance Association |
| MFHR | — Multifamily housing revenue |
| MSTR | — Municipal securities trust receipts |
| MUD | — Municipal Utility District |
| National | — National Public Finance Guarantee Corporation |
| PCFA | — Pollution Control Financing Authority |
| PCL | — Public Company Limited |
| PCR | — Pollution control revenue |
| PFA | — Public Finance Authority |
| PFFA | — Public Facilities Financing Authority |
| PFOTER | — Puttable floating option tax-exempt receipts |
| PJSC | — Public Joint Stock Company |
| plc | — Public limited company |
| PUTTER | — Puttable tax-exempt receipts |
| R&D | — Research & development |
| Radian | — Radian Asset Assurance |
| RAN | — Revenue anticipation notes |
| RDA | — Redevelopment Authority |
| RDFA | — Redevelopment Finance Authority |
| REIT | — Real estate investment trust |
| ROC | — Reset option certificates |
| SAVRS | — Select auction variable rate securities |
| SBA | — Small Business Authority |
| SDR | — Swedish depositary receipt |
| SFHR | — Single-family housing revenue |
| SFMR | — Single-family mortgage revenue |
| SPA | — Standby purchase agreement |
| SPDR | — Standard & Poor’s Depositary Receipts |
| SPEAR | — Short Puttable Exempt Adjustable Receipts |
| STRIPS | — Separate trading of registered interest and |
| TAN | — Tax anticipation notes |
| TIPS | — Treasury inflation-protected securities |
| TRAN | — Tax revenue anticipation notes |
| TTFA | — Transportation Trust Fund Authority |
| TVA | — Tennessee Valley Authority |
This page is intentionally left blank.

For more information
More information about Wells Fargo Funds is available free upon request. To obtain literature, please write, email, visit the Fund’s website, or call:
Wells Fargo Funds
P.O. Box 8266
Boston, MA 02266-8266
Email: fundservice@wellsfargo.com
Website: wellsfargofunds.com
Individual investors: 1-800-222-8222
Retail investment professionals: 1-888-877-9275
Institutional investment professionals: 1-866-765-0778
This report and the financial statements contained herein are submitted for the general information of the shareholders of the Fund. If this report is used for promotional purposes, distribution of the report must be accompanied or preceded by a current prospectus. Before investing, please consider the investment objectives, risks, charges, and expenses of the investment. For a current prospectus and, if available, a summary prospectus, containing this information, call 1-800-222-8222 or visit the Fund’s website at wellsfargofunds.com. Read the prospectus carefully before you invest or send money.
Wells Fargo Asset Management (WFAM) is a trade name used by the asset management businesses of Wells Fargo & Company. Wells Fargo Funds Management, LLC, a wholly owned subsidiary of Wells Fargo & Company, provides investment advisory and administrative services for Wells Fargo Funds. Other affiliates of Wells Fargo & Company provide subadvisory and other services for the funds. The funds are distributed by Wells Fargo Funds Distributor, LLC, Member FINRA, an affiliate of Wells Fargo & Company. Neither Wells Fargo Funds Distributor nor Wells Fargo Funds Management holds fund shareholder accounts or assets. This material is for general informational and educational purposes only and is NOT intended to provide investment advice or a recommendation of any kind—including a recommendation for any specific investment, strategy, or plan.
NOT FDIC INSURED ◾ NO BANK GUARANTEE ◾ MAY LOSE VALUE
© 2017 Wells Fargo Funds Management, LLC. All rights reserved.
| | |
 | | 307200 12-17 A238/AR238 10-17 |
Annual Report
October 31, 2017

Wells Fargo
Emerging Markets Equity Income Fund


Reduce clutter. Save trees.
Sign up for electronic delivery of prospectuses and shareholder reports at wellsfargo.com/advantagedelivery
Contents
The views expressed and any forward-looking statements are as of October 31, 2017 unless otherwise noted, and are those of the Fund managers and/or Wells Fargo Funds Management, LLC. Discussions of individual securities, or the markets generally, or any Wells Fargo Fund are not intended as individual recommendations. Future events or results may vary significantly from those expressed in any forward-looking statements. The views expressed are subject to change at any time in response to changing circumstances in the market. Wells Fargo Funds Management, LLC and the Fund disclaim any obligation to publicly update or revise any views expressed or forward-looking statements.
NOT FDIC INSURED ◾ NO BANK GUARANTEE ◾ MAY LOSE VALUE
| | | | |
| 2 | | Wells Fargo Emerging Markets Equity Income Fund | | Letter to shareholders (unaudited) |

Andrew Owen
President
Wells Fargo Funds
Global stocks generally delivered double-digit results; bond markets had smaller but positive results as well.
Dear Shareholder:
We are pleased to offer you this annual report for the Wells Fargo Emerging Markets Equity Income Fund for the 12-month period that ended October 31, 2017. Global stocks generally delivered double-digit results; bond markets had smaller but positive results as well. U.S. and international stocks performed similarly overall with returns of 23.63% and 23.64%, respectively, for the 12-month period, as measured by the S&P 500 Index1 and the MSCI ACWI ex USA Index (Net),2 respectively. Within fixed income, the Bloomberg Barclays U.S. Aggregate Bond Index3 returned 0.90% and the Bloomberg Barclays Municipal Bond Index4 returned 2.19% as interest rates rose from low levels.
Election results and central banks’ policies commanded investor attention as 2016 closed.
During the last two months of 2016, investors appeared intent on the prospective outcomes of elections in the U.S. and central-bank actions globally. Following Donald Trump’s election victory in November, U.S. stocks rallied. Investors appeared optimistic that the new administration would pursue progrowth policies. Favorable economic news supported stocks, and interest rates moved higher. At their mid-December meeting, U.S. Federal Reserve (Fed) officials raised the target interest rate by a quarter percentage point to a range of 0.50% to 0.75%. The fourth quarter also saw the implementation of the U.S. Securities and Exchange Commission’s amended rule for money market funds, which included the possibility of liquidity fees and redemption gates and, for institutional prime and municipal money market funds, floating net asset values (NAVs). Outside of the U.S., the prospects for faster U.S. growth appeared to trigger some acceleration in Europe.
Financial markets gained during the first two quarters of 2017 on positive economic data.
Stocks rallied globally through the first quarter of 2017, supported by signs of improvement in the U.S. and global economies. In the U.S., hiring remained strong, and business and consumer sentiment improved. In March, Fed officials raised their target interest rate by a quarter percentage point to a range of 0.75% to 1.00%. With the Fed’s target interest-rate increase, short-term bond yields rose during the quarter. Meanwhile, longer-term Treasury yields were little changed, leading to positive performance. Investment-grade and high-yield bonds benefited from strong demand. Municipal bond returns were positive in the quarter, helped by strong demand and constrained new-issue supply. Outside the U.S., stocks in emerging markets generally outperformed stocks in the U.S. and international developed markets because they benefited from both global economic growth and recent weakening of the U.S. dollar. Stocks in Asia, Europe, and Latin America also outperformed the U.S. market during the quarter.
| 1 | The S&P 500 Index consists of 500 stocks chosen for market size, liquidity, and industry group representation. It is a market-value-weighted index with each stock’s weight in the index proportionate to its market value. You cannot invest directly in an index. |
| 2 | The Morgan Stanley Capital International (MSCI) All Country World Index (ACWI) ex USA Index (Net) is a free-float-adjusted market-capitalization-weighted index that is designed to measure the equity market performance of developed markets, excluding the United States and Canada. Source: MSCI. MSCI makes no express or implied warranties or representations and shall have no liability whatsoever with respect to any MSCI data contained herein. The MSCI data may not be further redistributed or used as a basis for other indexes or any securities or financial products. This report is not approved, reviewed, or produced by MSCI. You cannot invest directly in an index. |
| 3 | The Bloomberg Barclays U.S. Aggregate Bond Index is a broad-based benchmark that measures the investment-grade, U.S. dollar-denominated, fixed-rate taxable bond market, including Treasuries, government-related and corporate securities, mortgage-backed securities (agency fixed-rate and hybrid adjustable-rate mortgage pass-throughs), asset-backed securities, and commercial mortgage-backed securities. You cannot invest directly in an index. |
| 4 | The Bloomberg Barclays Municipal Bond Index is an unmanaged index composed of long-term tax-exempt bonds with a minimum credit rating of Baa. You cannot invest directly in an index. |
| | | | | | |
| Letter to shareholders (unaudited) | | Wells Fargo Emerging Markets Equity Income Fund | | | 3 | |
Globally, stocks marked continued gains through the second quarter of 2017. Steady, albeit modest, economic growth both in the U.S. and abroad and generally favorable corporate earnings announcements supported higher valuations. U.S. inflation trended lower despite a continued decline in the unemployment rate. Ten-year U.S. Treasury yields declined, resulting in stronger prices for long-term bonds. As was widely expected, Fed officials raised the target interest rate in June by a quarter percentage point to a range of 1.00% to 1.25%. In addition, the Fed indicated that it planned to start selling bonds that accumulated on its balance sheet during quantitative easing programs conducted since 2008.
As global growth improved in the third quarter of 2017, financial markets generally advanced.
Most stock markets worldwide moved higher during the quarter and ended the period at or near all-time highs. Moderate acceleration in global economic growth was supported by improving corporate earnings, low inflation pressure, and still-low interest rates. Corporate earnings reports were favorable overall as companies continued to benefit from healthy operating leverage. Global commodity prices climbed during the quarter. Oil prices rebounded, partly due to a better balance between supply and demand. While North Korea’s recent missile launches and nuclear testing raised serious concerns around the world, the heightened geopolitical risk had relatively minimal impact on the quarter’s stock returns. In the U.S., economic data released during the quarter reflected a generally healthy economy. Second-quarter economic output grew at a 3.1% annual rate, and consumers displayed more willingness to spend. Meanwhile, the Fed maintained the target range for the federal funds rate at 1.00% to 1.25%, noting that inflation had remained below the Fed’s 2.00% objective. Reflecting continued confidence in the U.S. economy, the Fed also stated the possibility of one more 0.25% increase in the federal funds rate by the end of 2017 and announced plans to begin the process of unwinding its $4.5 trillion portfolio of bonds and other assets in October. Outside the U.S., stocks in the Asia Pacific region benefited from solid earnings reports and investors’ willingness to take on risk despite the rising tensions between North Korea and the U.S. In Europe, markets were supported by better-than-expected economic growth, which has led to narrowing of the gap between Europe’s growth rate and that of the U.S. In emerging markets, many countries benefited from stronger currencies versus the U.S. dollar. Also, commodity prices were on an upward trajectory, which benefited many companies that rely on natural resources for exports.
Positive economic and market news continued into October.
October proved to be a strong month for U.S. stocks. The S&P 500 Index delivered 11 record closes amid rising consumer confidence and signs the economy was continuing to gain momentum, including news in late October that economic output was estimated to have grown at a 3.0% annual rate in the third quarter. At its October meeting, the Fed, in a unanimous vote, left short-term interest rates unchanged but signaled it could make another rate increase before the end of 2017 if the economy remains on track. The Fed also began the process of unwinding its quantitative easing program. Outside the U.S., international stocks generally delivered positive results in October as global economic growth continued to strengthen.
| | | | |
| 4 | | Wells Fargo Emerging Markets Equity Income Fund | | Letter to shareholders (unaudited) |
Don’t let short-term uncertainty derail long-term investment goals.
Periods of investment uncertainty can present challenges, but experience has taught us that maintaining long-term investment goals can be an effective way to plan for the future. To help you create a sound strategy based on your personal goals and risk tolerance, Wells Fargo Funds offers more than 100 mutual funds spanning a wide range of asset classes and investment styles. Although diversification cannot guarantee an investment profit or prevent losses, we believe it can be an effective way to manage investment risk and potentially smooth out overall portfolio performance. We encourage investors to know their investments and to understand that appropriate levels of risk-taking may unlock opportunities.
Thank you for choosing to invest with Wells Fargo Funds. We appreciate your confidence in us and remain committed to helping you meet your financial needs.
Sincerely,

Andrew Owen
President
Wells Fargo Funds
Although diversification cannot guarantee an investment profit or prevent losses, we believe it can be an effective way to manage investment risk and potentially smooth out overall portfolio performance.
For further information about your Fund, contact your investment professional, visit our website at wellsfargofunds.com, or call us directly at 1-800-222-8222. We are available 24 hours a day, 7 days a week.
This page is intentionally left blank.
| | | | |
| 6 | | Wells Fargo Emerging Markets Equity Income Fund | | Performance highlights (unaudited) |
Investment objective
The Fund seeks to achieve long-term capital appreciation and current income.
Manager
Wells Fargo Funds Management, LLC
Subadviser
Wells Capital Management Incorporated
Portfolio managers
Anthony L.T. Cragg
Alison Shimada
Average annual total returns (%) as of October 31, 20171
| | | | | | | | | | | | | | | | | | | | | | | | | | | | |
| | | | | Including sales charge | | Excluding sales charge | | | Expense ratios2 (%) | |
| | | Inception date | | 1 year | | 5 year | | Since Inception | | 1 year | | | 5 year | | | Since Inception | | | Gross | | | Net3 | |
| Class A (EQIAX) | | 5-31-2012 | | 9.10 | | 3.13 | | 5.19 | | | 15.79 | | | | 4.36 | | | | 6.35 | | | | 1.72 | | | | 1.65 | |
| Class C (EQICX) | | 5-31-2012 | | 13.91 | | 3.59 | | 5.57 | | | 14.91 | | | | 3.59 | | | | 5.57 | | | | 2.47 | | | | 2.40 | |
| Class R (EQIHX) | | 9-30-2015 | | – | | – | | – | | | 15.39 | | | | 4.10 | | | | 6.08 | | | | 1.97 | | | | 1.90 | |
| Class R6 (EQIRX) | | 9-30-2015 | | – | | – | | – | | | 16.25 | | | | 4.80 | | | | 6.80 | | | | 1.29 | | | | 1.20 | |
| Administrator Class (EQIDX) | | 5-31-2012 | | – | | – | | – | | | 15.99 | | | | 4.58 | | | | 6.58 | | | | 1.64 | | | | 1.48 | |
| Institutional Class (EQIIX) | | 5-31-2012 | | – | | – | | – | | | 16.11 | | | | 4.78 | | | | 6.78 | | | | 1.39 | | | | 1.25 | |
| MSCI EM Index (Net)4 | | – | | – | | – | | – | | | 26.45 | | | | 4.83 | | | | 6.52 | | | | – | | | | – | |
Figures quoted represent past performance, which is no guarantee of future results, and do not reflect taxes that a shareholder may pay on fund distributions or the redemption of fund shares. Investment return and principal value of an investment will fluctuate so that an investor’s shares, when redeemed, may be worth more or less than their original cost. Performance shown without sales charges would be lower if sales charges were reflected. Current performance may be lower or higher than the performance data quoted, which assumes the reinvestment of dividends and capital gains. Current month-end performance is available on the Fund’s website, wellsfargofunds.com.
Index returns do not include transaction costs associated with buying and selling securities, any mutual fund fees or expenses, or any taxes. It is not possible to invest directly in an index.
For Class A shares, the maximum front-end sales charge is 5.75%. For Class C shares, the maximum contingent deferred sales charge is 1.00%. Performance including a contingent deferred sales charge assumes the sales charge for the corresponding time period. Class R, Class R6, Administrator Class, and Institutional Class shares are sold without a front-end sales charge or contingent deferred sales charge.
Stock values fluctuate in response to the activities of individual companies and general market and economic conditions. Foreign investments are especially volatile and can rise or fall dramatically due to differences in the political and economic conditions of the host country. These risks are generally intensified in emerging markets. The use of derivatives may reduce returns and/or increase volatility. Certain investment strategies tend to increase the total risk of investment (relative to the broader market). The Fund is exposed to smaller-company securities risk. Consult the Fund’s prospectus for additional information on these and other risks.
Please see footnotes on page 7.
| | | | | | |
| Performance highlights (unaudited) | | Wells Fargo Emerging Markets Equity Income Fund | | | 7 | |
|
| Growth of $10,000 investment as of October 31, 20175 |
|
 |
| 1 | Historical performance shown for the Class R shares prior to their inception reflects the performance of the Administrator Class shares, adjusted to reflect the higher expenses applicable to Class R shares. Historical performance shown for the Class R6 shares prior to their inception reflects the performance of the Institutional Class shares, and includes the higher expenses applicable to Institutional Class shares. If these expenses had not been included, returns for Class R6 shares would be higher. |
| 2 | Reflects the expense ratios as stated in the most recent prospectuses, which include the impact of 0.03% in acquired fund fees and expenses. The expense ratios shown are subject to change and may differ from the annualized expense ratios shown in the financial highlights of this report, which do not include acquired fund fees and expenses. |
| 3 | The manager has contractually committed through February 28, 2018, to waive fees and/or reimburse expenses to the extent necessary to cap the Fund’s Total Annual Operating Expenses After Fee Waivers at 1.62% for Class A, 2.37% for Class C, 1.87% for Class R, 1.17% for Class R6, 1.45% for Administrator Class, and 1.22% for Institutional Class. After this time, the cap may be increased or the commitment to maintain the cap may be terminated only with the approval of the Board of Trustees. Brokerage commissions, stamp duty fees, interest, taxes, acquired fund fees and expenses, and extraordinary expenses are excluded from the expense cap. Without this cap, the Fund’s returns would have been lower. The expense ratio paid by an investor is the net expense ratio or the Fund’s Total Annual Fund Operating Expenses After Fee Waivers, as stated in the prospectuses. |
| 4 | The Morgan Stanley Capital International (MSCI) Emerging Markets (EM) Index (Net) is a free-float-adjusted market-capitalization-weighted index that is designed to measure large and mid-cap equity market performance of emerging markets. The MSCI EM Index (Net) consists of the following 24 emerging markets country indexes: Brazil, Chile, China, Colombia, Czech Republic, Egypt, Greece, Hungary, India, Indonesia, Korea, Malaysia, Mexico, Pakistan, Peru, the Philippines, Poland, Qatar, Russia, South Africa, Taiwan, Thailand, Turkey, and United Arab Emirates. Source: MSCI. MSCI makes no express or implied warranties or representations and shall have no liability whatsoever with respect to any MSCI data contained herein. The MSCI data may not be further redistributed or used as a basis for other indexes or any securities or financial products. This report is not approved, reviewed, or produced by MSCI. You cannot invest directly in an index. |
| 5 | The chart compares the performance of Class A shares since inception with the MSCI EM Index (Net). The chart assumes a hypothetical investment of $10,000 in Class A shares and reflects all operating expenses and assumes the maximum initial sales charge of 5.75%. |
| 6 | The ten largest holdings, excluding cash and cash equivalents, are calculated based on the value of the investments divided by total net assets of the Fund. Holdings are subject to change and may have changed since the date specified. |
| 7 | Amounts are calculated based on the total long-term investments of the Fund. These amounts are subject to change and may have changed since the date specified. |
| | | | |
| 8 | | Wells Fargo Emerging Markets Equity Income Fund | | Performance highlights (unaudited) |
MANAGER’S DISCUSSION
Fund highlights
| ∎ | | The Fund underperformed its benchmark, the MSCI EM Index (Net), for the 12-month period that ended October 31, 2017. |
| ∎ | | Stock selection within the consumer staples, consumer discretionary, and materials sectors contributed to relative returns for the period. However, an underweight to information technology (IT) and overweight positions in utilities and financials detracted from relative returns. |
| ∎ | | Among countries, strong stock selection helped the Fund’s relative performance in Russia, Turkey, and the Philippines. Unfavorable stock selection in China/Hong Kong, Korea, and Brazil detracted from relative performance. |
The Fund underperformed its benchmark during a strong absolute return market.
During the period, returns in emerging markets appreciated significantly as earnings growth returned to several emerging markets economies. Consensus estimates called for 20% earnings growth during 2017, which provided a catalyst for investors to allocate to the asset class after three consecutive years of negative earnings growth from 2013 through 2015.
IT led the index in terms of absolute performance, which saw the sector rise 52%, making it the largest positive contributor to the index. Against this backdrop, the portfolio’s underweight position in IT coupled with a 0% allocation to Chinese IT, which appreciated 64.8%, resulted in significant negative attribution as the largest names do not meet the Fund’s dividend-yield requirements for inclusion in the Fund.
| | |
| Ten largest holdings (%) as of October 31, 20176 |
Samsung Electronics Company Limited | | 4.79 |
Taiwan Semiconductor Manufacturing Company Limited | | 3.52 |
China Construction Bank H Shares | | 3.29 |
Industrial & Commercial Bank of China Limited H Shares | | 3.08 |
China Mobile Limited | | 1.77 |
Hon Hai Precision Industry Company Limited | | 1.68 |
Itausa Investimentos Itau SA | | 1.67 |
iShares MSCI Emerging Markets ETF | | 1.57 |
HSBC Bank plc (Huayu Automotive Systems Company Limited) | | 1.53 |
BB Seguridade Participacoes SA | | 1.39 |
|
| Sector distribution as of October 31, 20177 |
|
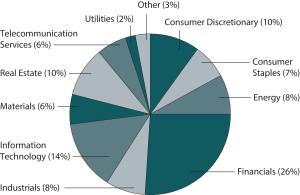 |
|
| Country allocation as of October 31, 20177 |
|
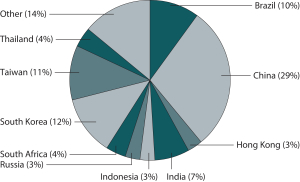 |
Outperformance in the consumer staples and consumer discretionary sectors was primarily driven by the Fund’s exposure to China A-shares. MSCI made the decision to begin including China A-shares in the MSCI EM Index in June 2017, which was a positive development. The Fund has invested in A-shares since 2014. Midea Group Company Limited and Huayu Automotive Systems Company Limited were the leading contributors to portfolio performance, both of which are Chinese A-shares.
Please see footnotes on page 7.
| | | | | | |
| Performance highlights (unaudited) | | Wells Fargo Emerging Markets Equity Income Fund | | | 9 | |
The team increased its position in China from 24% of the Fund at the beginning of the period to 29% by the end of the period, primarily in the consumer discretionary and financials sectors, while reducing the investment position in Mexico, particularly within the industrials and real estate sectors. Korean IT also saw a lift given a new position in Samsung Electronics Company, Limited, as the company articulated a more favorable and sustainable shareholder dividend return policy. The team reduced the Fund’s exposure to Taiwanese IT as the tech upcycle began to wind down toward the end of the period.
Our investment outlook on the emerging markets region remains positive.
We continue to expect further broadening of interest in emerging markets to be sustainable and stock performance likely will compare favorably with developed markets. Within this quarter we are evaluating positions with the goal of positioning for the first half of 2018. Some themes we see going forward include state-owned enterprise reform in China, secondary effects of further consumer IT penetration, government reform packages, and recovery of consumer and business confidence. Additionally, we expect the rally in emerging markets will become broader to include a variety of sectors, which would benefit diversified strategies like ours.
We will position to participate in such a rally in companies with capable management, good operational track records, and strong financials that can leverage improving earnings growth to drive stronger cash flows. It is important that corporations demonstrate efficient capital allocation at this point in the cycle rather than chasing growth at any cost. Range-bound oil and controlled inflation should benefit emerging markets. We also expect the overall operating environment in emerging markets to remain positive.
Year to date, the dividend factor unusually has not been additive to returns but investors may begin to prioritize sustainable earnings growth with dividends over straight growth investing. Although dividend payouts remain somewhat low in emerging markets, through government policy, shareholder calls for return of capital, and improving fundamentals, there may be a trend toward higher payouts and/or special dividends going forward. We also are considering share buybacks in the equation of total shareholder returns. In addition, increased protectionism by the U.S. would only serve to highlight the increasing prominence of China as a world power. The structural increase of consumption also will continue despite changes to global politics
We are positive on emerging markets as we see reasonable valuations and such reacceleration of earnings growth as a favorable comparison with developed markets. Even though the market oscillates between risk-on and risk-off, even within one month, the track record of management and the strength of the business model are two of the most important criteria for share-price performance. We reiterate that stock selectivity based on company specifics is critical as we move into 2018.
Please see footnotes on page 7.
| | | | |
| 10 | | Wells Fargo Emerging Markets Equity Income Fund | | Fund expenses (unaudited) |
As a shareholder of the Fund, you incur two types of costs: (1) transaction costs, including sales charges (loads) on purchase payments and contingent deferred sales charges (if any) on redemptions and (2) ongoing costs, including management fees, distribution (12b-1) and/or shareholder servicing fees, and other Fund expenses. This example is intended to help you understand your ongoing costs (in dollars) of investing in the Fund and to compare these costs with the ongoing costs of investing in other mutual funds.
The example is based on an investment of $1,000 invested at the beginning of the six-month period and held for the entire period from May 1, 2017 to October 31, 2017.
Actual expenses
The “Actual” line of the table below provides information about actual account values and actual expenses. You may use the information in this line, together with the amount you invested, to estimate the expenses that you paid over the period. Simply divide your account value by $1,000 (for example, an $8,600 account value divided by $1,000 = 8.6), then multiply the result by the number in the “Actual” line under the heading entitled “Expenses paid during period” for your applicable class of shares to estimate the expenses you paid on your account during this period.
Hypothetical example for comparison purposes
The “Hypothetical” line of the table below provides information about hypothetical account values and hypothetical
expenses based on the Fund’s actual expense ratio and an assumed rate of return of 5% per year before expenses, which is not the Fund’s actual return. The hypothetical account values and expenses may not be used to estimate the actual ending account balance or expenses you paid for the period. You may use this information to compare the ongoing costs of investing in the Fund and other funds. To do so, compare this 5% hypothetical example with the 5% hypothetical examples that appear in the shareholder reports of the other funds.
Please note that the expenses shown in the table are meant to highlight your ongoing costs only and do not reflect any transactional costs, such as sales charges (loads) and contingent deferred sales charges. Therefore, the “Hypothetical” line of the table is useful in comparing ongoing costs only and will not help you determine the relative total costs of owning different funds. In addition, if these transactional costs were included, your costs would have been higher.
| | | | | | | | | | | | | | | | |
| | | Beginning
account value
5-1-2017 | | | Ending
account value
10-31-2017 | | | Expenses
paid during
the period¹ | | | Annualized net
expense ratio | |
Class A | | | | | | | | | | | | | | | | |
Actual | | $ | 1,000.00 | | | $ | 1,090.63 | | | $ | 8.52 | | | | 1.62 | % |
Hypothetical (5% return before expenses) | | $ | 1,000.00 | | | $ | 1,017.05 | | | $ | 8.22 | | | | 1.62 | % |
Class C | | | | | | | | | | | | | | | | |
Actual | | $ | 1,000.00 | | | $ | 1,086.68 | | | $ | 12.45 | | | | 2.37 | % |
Hypothetical (5% return before expenses) | | $ | 1,000.00 | | | $ | 1,013.27 | | | $ | 12.02 | | | | 2.37 | % |
Class R | | | | | | | | | | | | | | | | |
Actual | | $ | 1,000.00 | | | $ | 1,089.07 | | | $ | 9.80 | | | | 1.86 | % |
Hypothetical (5% return before expenses) | | $ | 1,000.00 | | | $ | 1,015.82 | | | $ | 9.46 | | | | 1.86 | % |
Class R6 | | | | | | | | | | | | | | | | |
Actual | | $ | 1,000.00 | | | $ | 1,092.84 | | | $ | 6.17 | | | | 1.17 | % |
Hypothetical (5% return before expenses) | | $ | 1,000.00 | | | $ | 1,019.31 | | | $ | 5.95 | | | | 1.17 | % |
Administrator Class | | | | | | | | | | | | | | | | |
Actual | | $ | 1,000.00 | | | $ | 1,091.46 | | | $ | 7.64 | | | | 1.45 | % |
Hypothetical (5% return before expenses) | | $ | 1,000.00 | | | $ | 1,017.90 | | | $ | 7.38 | | | | 1.45 | % |
Institutional Class | | | | | | | | | | | | | | | | |
Actual | | $ | 1,000.00 | | | $ | 1,093.22 | | | $ | 6.44 | | | | 1.22 | % |
Hypothetical (5% return before expenses) | | $ | 1,000.00 | | | $ | 1,019.06 | | | $ | 6.21 | | | | 1.22 | % |
| 1 | Expenses paid is equal to the annualized net expense ratio of each class multiplied by the average account value over the period, multiplied by the number of days in the most recent fiscal half-year divided by the number of days in the fiscal year (to reflect the one-half-year period). |
| | | | | | |
| Portfolio of investments—October 31, 2017 | | Wells Fargo Emerging Markets Equity Income Fund | | | 11 | |
| | | | | | | | | | | | | | | | |
| Security name | | | | | | | | Shares | | | Value | |
| | | | |
Common Stocks: 83.81% | | | | | | | | | | | | | | | | |
| | | | |
| Argentina: 0.96% | | | | | | | | | | | | | | | | |
Banco Macro SA (Financials, Banks) | | | | | | | | | | | 47,638 | | | $ | 5,998,577 | |
| | | | | | | | | | | | | | | | |
| | | | |
| Brazil: 6.28% | | | | | | | | | | | | | | | | |
Ambev SA (Consumer Staples, Beverages) | | | | | | | | | | | 610,500 | | | | 3,900,422 | |
Banco de Brasil SA (Financials, Banks) | | | | | | | | | | | 462,600 | | | | 4,870,218 | |
BB Seguridade Participacoes SA (Financials, Insurance) | | | | | | | | | | | 988,896 | | | | 8,382,627 | |
B3 SA (Financials, Capital Markets) | | | | | | | | | | | 821,100 | | | | 5,998,927 | |
Energisa SA (Utilities, Electric Utilities) | | | | | | | | | | | 421,900 | | | | 3,188,142 | |
Itausa Investimentos Itau SA (Financials, Banks) | | | | | | | | | | | 1,689 | | | | 5,204 | |
Petroleo Brasileiro SA ADR Class A (Energy, Oil, Gas & Consumable Fuels) † | | | | | | | | | | | 650,002 | | | | 6,662,521 | |
Vale SA (Materials, Metals & Mining) | | | | | | | | | | | 321,674 | | | | 3,156,462 | |
WEG SA (Industrials, Machinery) | | | | | | | | | | | 481,200 | | | | 3,130,234 | |
| | | | |
| | | | | | | | | | | | | | | 39,294,757 | |
| | | | | | | | | | | | | | | | |
| | | | |
| Cayman Islands: 1.03% | | | | | | | | | | | | | | | | |
Wynn Macau Limited (Consumer Discretionary, Hotels, Restaurants & Leisure) | | | | | | | | | | | 2,521,200 | | | | 6,463,455 | |
| | | | | | | | | | | | | | | | |
| | | | |
| Chile: 1.02% | | | | | | | | | | | | | | | | |
Enersis SA ADR (Utilities, Electric Utilities) | | | | | | | | | | | 601,192 | | | | 6,372,635 | |
| | | | | | | | | | | | | | | | |
| | | | |
| China: 20.25% | | | | | | | | | | | | | | | | |
Bank of China Limited H Shares (Financials, Banks) | | | | | | | | | | | 11,531,000 | | | | 5,749,685 | |
Beijing Capital International Airport Company Limited H Shares (Industrials, Transportation Infrastructure) | | | | | | | | | | | 4,330,000 | | | | 7,104,366 | |
China Communications Construction Company Limited H Shares (Industrials, Construction & Engineering) | | | | | | | | | | | 4,340,000 | | | | 5,268,260 | |
China Communications Services Corporation Limited H Shares (Telecommunication Services, Diversified Telecommunication Services) | | | | | | | | | | | 9,730,000 | | | | 5,899,313 | |
China Construction Bank H Shares (Financials, Banks) | | | | | | | | | | | 22,236,000 | | | | 19,837,793 | |
China Galaxy Securities Company Limited H Shares (Financials, Capital Markets) | | | | | | | | | | | 4,424,500 | | | | 3,856,564 | |
China Lesso Group Holdings Limited Class L (Industrials, Building Products) | | | | | | | | | | | 5,707,000 | | | | 3,811,299 | |
China Mobile Limited (Telecommunication Services, Wireless Telecommunication Services) | | | | | | | | | | | 1,067,000 | | | | 10,715,955 | |
China Petroleum & Chemical Corporation H Shares (Energy, Oil, Gas & Consumable Fuels) | | | | | | | | | | | 10,317,600 | | | | 7,578,108 | |
China Resources Land Limited (Real Estate, Real Estate Management & Development) | | | | | | | | | | | 1,526,000 | | | | 4,547,838 | |
China State Construction International Holdings Limited (Industrials, Construction & Engineering) | | | | | | | | | | | 2,188,000 | | | | 3,073,869 | |
Hengan International Group Company Limited (Consumer Staples, Personal Products) | | | | | | | | | | | 378,500 | | | | 3,730,952 | |
Huaneng Power International Incorporated H Shares (Utilities, Independent Power & Renewable Electricity Producers) | | | | | | | | | | | 4,138,000 | | | | 2,768,780 | |
Industrial & Commercial Bank of China Limited H Shares (Financials, Banks) | | | | | | | | | | | 23,448,000 | | | | 18,604,753 | |
PICC Property & Casualty Company Limited H Shares (Financials, Insurance) | | | | | | | | | | | 3,968,000 | | | | 7,863,368 | |
Sinotrans Limited H Shares (Industrials, Air Freight & Logistics) | | | | | | | | | | | 11,507,000 | | | | 5,531,219 | |
Xinjiang Goldwind Science & Technology Company Limited H Shares (Industrials, Electrical Equipment) | | | | | | | | | | | 3,851,280 | | | | 4,877,413 | |
Zhejiang Expressway Company Limited (Industrials, Transportation Infrastructure) | | | | | | | | | | | 4,798,000 | | | | 5,934,922 | |
| | | | |
| | | | | | | | | | | | | | | 126,754,457 | |
| | | | | | | | | | | | | | | | |
| | | | |
| Hong Kong: 2.75% | | | | | | | | | | | | | | | | |
China Power International Development Limited (Utilities, Independent Power & Renewable Electricity Producers) | | | | | | | | | | | 7,815,000 | | | | 2,484,323 | |
CNOOC Limited (Energy, Oil, Gas & Consumable Fuels) | | | | | | | | | | | 4,595,000 | | | | 6,255,147 | |
Li & Fung Limited (Consumer Discretionary, Textiles, Apparel & Luxury Goods) | | | | | | | | | | | 7,196,000 | | | | 3,625,026 | |
Sun Art Retail Group Limited (Consumer Staples, Food & Staples Retailing) | | | | | | | | | | | 4,772,500 | | | | 4,820,583 | |
| | | | |
| | | | | | | | | | | | | | | 17,185,079 | |
| | | | | | | | | | | | | | | | |
The accompanying notes are an integral part of these financial statements.
| | | | |
| 12 | | Wells Fargo Emerging Markets Equity Income Fund | | Portfolio of investments—October 31, 2017 |
| | | | | | | | | | | | | | | | |
| Security name | | | | | | | | Shares | | | Value | |
| | | |
| India: 6.51% | | | | | | | | | | | | | |
Bharat Petroleum Corporation Limited (Energy, Oil, Gas & Consumable Fuels) | | | | | | | | | | | 847,594 | | | $ | 7,087,356 | |
Bharti Infratel Limited (Telecommunication Services, Diversified Telecommunication Services) | | | | | | | | | | | 924,210 | | | | 6,308,963 | |
Credit Analysis & Research Limited (Financials, Capital Markets) | | | | | | | | | | | 125,348 | | | | 2,910,119 | |
HCL Technologies Limited (Information Technology, IT Services) | | | | | | | | | | | 184,772 | | | | 2,441,328 | |
Hero Honda Motors Limited (Consumer Discretionary, Automobiles) | | | | | | | | | | | 71,497 | | | | 4,249,668 | |
Infosys Technologies Limited (Information Technology, IT Services) | | | | | | | | | | | 248,722 | | | | 3,539,910 | |
NTPC Limited (Utilities, Independent Power & Renewable Electricity Producers) | | | | | | | | | | | 2,206,768 | | | | 6,175,220 | |
Vedanta Limited (Materials, Metals & Mining) | | | | | | | | | | | 1,571,351 | | | | 8,050,683 | |
| | | | |
| | | | | | | | | | | | | | | 40,763,247 | |
| | | | | | | | | | | | | | | | |
| | | | |
| Indonesia: 2.47% | | | | | | | | | | | | | | | | |
PT Bank Rakyat Indonesia Tbk (Financials, Banks) | | | | | | | | | | | 4,225,800 | | | | 4,860,644 | |
PT Cikarang Listrindo Tbk (Utilities, Independent Power & Renewable Electricity Producers) | | | | | | | | | | | 19,732,900 | | | | 1,593,182 | |
PT Matahari Department Store Tbk (Consumer Discretionary, Multiline Retail) | | | | | | | | | | | 5,213,700 | | | | 3,306,014 | |
PT Telekomunikasi Indonesia Persero Tbk (Telecommunication Services, Diversified Telecommunication Services) | | | | | | | | | | | 19,293,300 | | | | 5,732,866 | |
| | | | |
| | | | | | | | | | | | | | | 15,492,706 | |
| | | | | | | | | | | | | | | | |
| | | | |
| Luxembourg: 0.98% | | | | | | | | | | | | | | | | |
Ternium SA (Materials, Metals & Mining) | | | | | | | | | | | 197,909 | | | | 6,137,158 | |
| | | | | | | | | | | | | | | | |
| | | | |
| Malaysia: 2.04% | | | | | | | | | | | | | | | | |
Bursa Malaysia Bhd (Financials, Diversified Financial Services) | | | | | | | | | | | 1,144,100 | | | | 2,699,790 | |
Sime Darby Bhd (Industrials, Industrial Conglomerates) | | | | | | | | | | | 1,791,100 | | | | 3,892,316 | |
Telecom Malaysia Bhd (Telecommunication Services, Diversified Telecommunication Services) | | | | | | | | | | | 2,310,781 | | | | 3,466,035 | |
Tenaga Nasional Bhd (Utilities, Electric Utilities) | | | | | | | | | | | 770,600 | | | | 2,730,365 | |
| | | | |
| | | | | | | | | | | | | | | 12,788,506 | |
| | | | | | | | | | | | | | | | |
| | | | |
| Mexico: 1.86% | | | | | | | | | | | | | | | | |
Grupo Financiero Banorte SAB de CV (Financials, Banks) | | | | | | | | | | | 550,100 | | | | 3,259,554 | |
Grupo Financiero Santander SAB de CV Class B (Financials, Banks) | | | | | | | | | | | 1,705,810 | | | | 2,866,780 | |
Wal-Mart de Mexico SAB de CV (Consumer Staples, Food & Staples Retailing) | | | | | | | | | | | 2,457,828 | | | | 5,502,366 | |
| | | | |
| | | | | | | | | | | | | | | 11,628,700 | |
| | | | | | | | | | | | | | | | |
| | | | |
| Philippines: 1.06% | | | | | | | | | | | | | | | | |
Semirara Mining and Power Corporation (Energy, Oil, Gas & Consumable Fuels) | | | | | | | | | | | 8,093,080 | | | | 6,662,584 | |
| | | | | | | | | | | | | | | | |
| | | | |
| Russia: 2.73% | | | | | | | | | | | | | | | | |
LUKOIL PJSC ADR (Energy, Oil, Gas & Consumable Fuels) | | | | | | | | | | | 85,026 | | | | 4,514,881 | |
Magnitogorsk Iron & Steel Works (Materials, Metals & Mining) (a) | | | | | | | | | | | 8,232,017 | | | | 6,230,394 | |
MegaFon PJSC (Telecommunication Services, Wireless Telecommunication Services) (a) | | | | | | | | | | | 265,068 | | | | 2,635,639 | |
Sberbank of Russia ADR (Financials, Banks) | | | | | | | | | | | 259,528 | | | | 3,724,227 | |
| | | | |
| | | | | | | | | | | | | | | 17,105,141 | |
| | | | | | | | | | | | | | | | |
| | | | |
| Singapore: 2.00% | | | | | | | | | | | | | | | | |
CapitaRetail China Trust (Real Estate, Equity REITs) | | | | | | | | | | | 2,348,357 | | | | 2,859,858 | |
Jardine Cycle & Carriage Limited (Consumer Discretionary, Distributors) | | | | | | | | | | | 121,600 | | | | 3,513,920 | |
Singapore Telecommunications Limited (Telecommunication Services, Diversified Telecommunication Services) | | | | | | | | | | | 2,241,900 | | | | 6,167,651 | |
| | | | |
| | | | | | | | | | | | | | | 12,541,429 | |
| | | | | | | | | | | | | | | | |
The accompanying notes are an integral part of these financial statements.
| | | | | | |
| Portfolio of investments—October 31, 2017 | | Wells Fargo Emerging Markets Equity Income Fund | | | 13 | |
| | | | | | | | | | | | | | | | |
| Security name | | | | | | | | Shares | | | Value | |
| | | | |
| South Africa: 3.75% | | | | | | | | | | | | | | | | |
Barclays Africa Group Limited (Financials, Banks) | | | | | | | | | | | 583,931 | | | $ | 5,787,788 | |
Life Healthcare Group Holdings Limited (Health Care, Health Care Providers & Services) | | | | | | | | | | | 1,610,449 | | | | 2,984,264 | |
MTN Group Limited (Telecommunication Services, Wireless Telecommunication Services) | | | | | | | | | | | 656,049 | | | | 5,696,624 | |
Sanlam Limited (Financials, Insurance) | | | | | | | | | | | 1,195,559 | | | | 5,978,323 | |
Sasol Limited (Materials, Chemicals) | | | | | | | | | | | 103,433 | | | | 3,026,231 | |
| | | | |
| | | | | | | | | | | | | | | 23,473,230 | |
| | | | | | | | | | | | | | | | |
| | | | |
| South Korea: 11.52% | | | | | | | | | | | | | | | | |
Coway Company Limited (Consumer Discretionary, Household Durables) | | | | | | | | | | | 49,789 | | | | 4,324,068 | |
Hana Financial Group Incorporated (Financials, Banks) | | | | | | | | | | | 71,522 | | | | 3,061,079 | |
Hyundai Motor Company (Consumer Discretionary, Automobiles) | | | | | | | | | | | 35,877 | | | | 5,155,708 | |
KB Financial Group Incorporated (Financials, Banks) | | | | | | | | | | | 91,719 | | | | 4,780,997 | |
Korea Electric Power Corporation (Utilities, Electric Utilities) | | | | | | | | | | | 170,250 | | | | 5,956,888 | |
Korea Reinsurance Company (Financials, Insurance) | | | | | | | | | | | 526,323 | | | | 5,261,586 | |
S-Oil Corporation (Energy, Oil, Gas & Consumable Fuels) | | | | | | | | | | | 27,861 | | | | 3,195,554 | |
Samsung Electronics Company Limited (Information Technology, Technology Hardware, Storage & Peripherals) | | | | | | | | | | | 11,777 | | | | 28,949,755 | |
SK Innovation Company Limited (Energy, Oil, Gas & Consumable Fuels) | | | | | | | | | | | 26,776 | | | | 4,899,433 | |
SK Telecom Company Limited ADR (Telecommunication Services, Wireless Telecommunication Services) | | | | | | | | | | | 248,779 | | | | 6,503,083 | |
| | | | |
| | | | | | | | | | | | | | | 72,088,151 | |
| | | | | | | | | | | | | | | | |
| | | | |
| Taiwan: 10.71% | | | | | | | | | | | | | | | | |
Cathay Financial Holding Company Limited (Financials, Insurance) | | | | | | | | | | | 2,224,000 | | | | 3,672,316 | |
Chicony Electronics Company Limited (Information Technology, Technology Hardware, Storage & Peripherals) | | | | | | | | | | | 1,048,770 | | | | 2,625,446 | |
CTBC Financial Holding Company Limited (Financials, Banks) | | | | | | | | | | | 4,611,130 | | | | 2,950,805 | |
CTCI Corporation (Industrials, Construction & Engineering) | | | | | | | | | | | 1,497,000 | | | | 2,320,488 | |
Formosa Plastics Corporation (Materials, Chemicals) | | | | | | | | | | | 975,000 | | | | 2,970,954 | |
Hon Hai Precision Industry Company Limited (Information Technology, Electronic Equipment, Instruments & Components) | | | | | | | | | | | 2,735,630 | | | | 10,159,007 | |
Novatek Microelectronics Corporation Limited (Information Technology, Semiconductors & Semiconductor Equipment) | | | | | | | | | | | 735,000 | | | | 2,717,303 | |
Siliconware Precision Industries Company (Information Technology, Semiconductors & Semiconductor Equipment) | | | | | | | | | | | 1,511,000 | | | | 2,394,794 | |
Taiwan Semiconductor Manufacturing Company Limited (Information Technology, Semiconductors & Semiconductor Equipment) | | | | | | | | | | | 2,640,000 | | | | 21,270,910 | |
Teco Electric & Machinery Company Limited (Industrials, Electrical Equipment) | | | | | | | | | | | 3,907,000 | | | | 3,646,680 | |
Uni-President Enterprises Corporation (Consumer Staples, Food Products) | | | | | | | | | | | 2,108,000 | | | | 4,403,389 | |
United Microelectronics Corporation ADR (Information Technology, Semiconductors & Semiconductor Equipment) | | | | | | | | | | | 3,049,477 | | | | 7,928,640 | |
| | | | |
| | | | | | | | | | | | | | | 67,060,732 | |
| | | | | | | | | | | | | | | | |
| | | | |
| Thailand: 3.68% | | | | | | | | | | | | | | | | |
Charoen Pokphand Food PCL (Consumer Staples, Food Products) | | | | | | | | | | | 4,991,900 | | | | 3,906,966 | |
Intouch Holdings PCL (Telecommunication Services, Wireless Telecommunication Services) | | | | | | | | | | | 1,724,500 | | | | 3,010,867 | |
Land & Houses PCL (Real Estate, Real Estate Management & Development) | | | | | | | | | | | 22,327,000 | | | | 7,325,837 | |
Major Cineplex Group PCL (Consumer Discretionary, Media) | | | | | | | | | | | 2,633,200 | | | | 2,576,129 | |
Thai Beverage PCL (Consumer Staples, Beverages) | | | | | | | | | | | 8,678,900 | | | | 6,239,690 | |
| | | | |
| | | | | | | | | | | | | | | 23,059,489 | |
| | | | | | | | | | | | | | | | |
The accompanying notes are an integral part of these financial statements.
| | | | |
| 14 | | Wells Fargo Emerging Markets Equity Income Fund | | Portfolio of investments—October 31, 2017 |
| | | | | | | | | | | | | | | | |
| Security name | | | | | | | | Shares | | | Value | |
| | | | |
| Turkey: 1.02% | | | | | | | | | | | | | | | | |
Tupras Turkiye Petrol Rafinerileri AS (Energy, Oil, Gas & Consumable Fuels) | | | | | | | | | | | 91,812 | | | $ | 3,303,591 | |
Turkcell Iletisim Hizmetleri AS (Telecommunication Services, Wireless Telecommunication Services) | | | | | | | | | | | 825,740 | | | | 3,084,376 | |
| | | | |
| | | | | | | | | | | | | | | 6,387,967 | |
| | | | | | | | | | | | | | | | |
| | | | |
| United Arab Emirates: 0.72% | | | | | | | | | | | | | | | | |
Abu Dhabi Commercial Bank PJSC (Financials, Banks) | | | | | | | | | | | 2,238,680 | | | | 4,504,607 | |
| | | | | | | | | | | | | | | | |
| | | | |
| United Kingdom: 0.47% | | | | | | | | | | | | | | | | |
United Company Rusal plc (Materials, Metals & Mining) | | | | | | | | | | | 4,515,000 | | | | 2,911,074 | |
| | | | | | | | | | | | | | | | |
| | | | |
Total Common Stocks (Cost $462,046,254) | | | | | | | | | | | | | | | 524,673,681 | |
| | | | | | | | | | | | | | | | |
| | | | |
Exchange-Traded Funds: 1.51% | | | | | | | | | | | | | | | | |
| | | | |
| United States: 1.51% | | | | | | | | | | | | | | | | |
iShares MSCI Emerging Markets ETF | | | | | | | | | | | 205,000 | | | | 9,471,287 | |
| | | | | | | | | | | | | | | | |
| | | | |
Total Exchange-Traded Funds (Cost $9,471,287) | | | | | | | | | | | | | | | 9,471,287 | |
| | | | | | | | | | | | | | | | |
| | | | |
| | | | | | Expiration date | | | | | | | |
| Participation Notes: 7.68% | | | | | | | | | | | | | | | | |
| | | | |
| China: 7.68% | | | | | | | | | | | | | | | | |
HSBC Bank plc (Huayu Automotive Systems Company Limited) (Consumer Discretionary, Auto Components) †(a) | | | | | | | 8-9-2019 | | | | 2,415,600 | | | | 9,264,427 | |
HSBC Bank plc (Inner Mongolia Yili Industrial Group Company Limited Class A) (Consumer Staples, Food Products) †(a) | | | | | | | 3-30-2018 | | | | 666,000 | | | | 2,968,102 | |
HSBC Bank plc (Inner Mongolia Yili Industrial Group Company Limited) (Consumer Staples, Food Products) †(a) | | | | | | | 3-30-2018 | | | | 320,377 | | | | 1,427,795 | |
HSBC Bank plc (Midea Group Company Limited Class A) (Consumer Discretionary, Household Durables) †(a) | | | | | | | 3-30-2018 | | | | 512,000 | | | | 3,938,105 | |
HSBC Bank plc (Ningbo Green Electric Appliance Company Limited) (Consumer Discretionary, Household Durables) †%%(a) | | | | | | | 3-30-2018 | | | | 640,772 | | | | 4,111,973 | |
UBS AG (Agricultural Bank of China Limited) (Financials, Banks) †(a) | | | | | | | 3-28-2018 | | | | 8,002,400 | | | | 4,513,770 | |
UBS AG (Baoshan Iron & Steel Company Limited) (Materials, Metals & Mining) †(a) | | | | | | | 4-27-2018 | | | | 4,107,461 | | | | 4,751,338 | |
UBS AG (Jiangsu Yanghe Brewery Joint-Stock Company Limited) (Consumer Staples, Beverages) †(a) | | | | | | | 4-27-2018 | | | | 228,371 | | | | 3,796,885 | |
UBS AG (Midea Group Company Limited Class A) (Consumer Discretionary, Household Durables) †(a) | | | | | | | 11-26-2018 | | | | 949,833 | | | | 7,302,403 | |
UBS AG (Poly Real Estate Group Company Limited) (Real Estate, Real Estate Management & Development) †(a) | | | | | | | 3-13-2018 | | | | 3,661,740 | | | | 6,013,987 | |
| | | | |
Total Participation Notes (Cost $36,712,314) | | | | | | | | | | | | | | | 48,088,785 | |
| | | | | | | | | | | | | | | | |
| | | | |
| | | Dividend yield | | | | | | | | | | |
Preferred Stocks: 3.45% | | | | | | | | | | | | | | | | |
| | | | |
| Brazil: 3.45% | | | | | | | | | | | | | | | | |
Banco Bradesco SA (Financials, Banks) | | | 6.69 | % | | | | | | | 663,830 | | | | 7,037,454 | |
Companhia de Saneamento do Parana (Utilities, Water Utilities) | | | 16.24 | | | | | | | | 1,353,920 | | | | 4,490,579 | |
Itausa Investimentos Itau SA (Financials, Banks) | | | 13.79 | | | | | | | | 3,139,888 | | | | 10,059,006 | |
| | | | |
Total Preferred Stocks (Cost $15,434,438) | | | | | | | | | | | | | | | 21,587,039 | |
| | | | | | | | | | | | | | | | |
The accompanying notes are an integral part of these financial statements.
| | | | | | |
| Portfolio of investments—October 31, 2017 | | Wells Fargo Emerging Markets Equity Income Fund | | | 15 | |
| | | | | | | | | | | | | | | | |
| Security name | | Yield | | | | | | Shares | | | Value | |
| | | | |
Short-Term Investments: 6.15% | | | | | | | | | | | | | | | | |
| | | | |
| Investment Companies: 6.15% | | | | | | | | | | | | | | | | |
Wells Fargo Government Money Market Fund Select Class (l)(u)## | | | 0.96 | % | | | | | | | 38,470,174 | | | $ | 38,470,174 | |
| | | | | | | | | | | | | | | | |
| | | | |
Total Short-Term Investments (Cost $38,470,174) | | | | | | | | | | | | | | | 38,470,174 | |
| | | | | | | | | | | | | | | | |
| | | | | | | | |
| Total investments in securities (Cost $562,134,467) | | | 102.60 | % | | | 642,290,966 | |
Other assets and liabilities, net | | | (2.60 | ) | | | (16,259,156 | ) |
| | | | | | | | |
| Total net assets | | | 100.00 | % | | $ | 626,031,810 | |
| | | | | | | | |
| † | Non-income-earning security |
| (a) | The security is fair valued in accordance with procedures approved by the Board of Trustees. |
| %% | The security is issued on a when-issued basis. |
| (l) | The issuer of the security is an affiliated person of the Fund as defined in the Investment Company Act of 1940. |
| (u) | The rate represents the 7-day annualized yield at period end. |
| ## | All or a portion of this security is segregated for when-issued securities. |
Investments in Affiliates
An affiliated investment is an investment in which the Fund owns at least 5% of the outstanding voting shares of the issuer or as a result of other relationships, such as the Fund and the issuer having the same investment manager. Transactions with issuers that were either affiliated persons of the Fund at the beginning of the period or the end of the period were as follows:
| | | | | | | | | | | | | | | | | | | | | | | | | | | | | | | | | | | | |
| | | Shares,
beginning of
period | | | Shares
purchased | | | Shares
sold | | | Shares,
end of
period | | | Net
realized
gains
(losses) | | | Net
change in
unrealized
gains
(losses) | | | Income
from
affiliated
securities | | | Value,
end
of period | | | % of
net
assets | |
| | | | | | | | | |
Short-Term Investments | | | | | | | | | | | | | | | | | | | | | | | | | | | | | | | | | | | | |
Investment companies | | | | | | | | | | | | | | | | | | | | | | | | | | | | | | | | | | | | |
Wells Fargo Government Money Market Fund Select Class | | | 21,137,527 | | | | 305,859,304 | | | | 288,526,657 | | | | 38,470,174 | | | $ | 0 | | | $ | 0 | | | $ | 157,887 | | | $ | 38,470,174 | | | | 6.15 | % |
The accompanying notes are an integral part of these financial statements.
| | | | |
| 16 | | Wells Fargo Emerging Markets Equity Income Fund | | Statement of assets and liabilities—October 31, 2017 |
| | | | |
| | | | |
| |
Assets | | | | |
Investments in unaffiliated securities, at value (cost $523,664,293) | | $ | 603,820,792 | |
Investments in affiliated securities, at value (cost $38,470,174) | | | 38,470,174 | |
Cash | | | 555,355 | |
Foreign currency, at value (cost $3,022,476) | | | 3,023,867 | |
Receivable for investments sold | | | 1,064,295 | |
Receivable for Fund shares sold | | | 1,451,829 | |
Receivable for dividends | | | 437,070 | |
Prepaid expenses and other assets | | | 194,584 | |
| | | | |
Total assets | | | 649,017,966 | |
| | | | |
| |
Liabilities | | | | |
Payable for investments purchased | | | 21,313,141 | |
Contingent tax liability | | | 585,000 | |
Management fee payable | | | 515,868 | |
Payable for Fund shares redeemed | | | 492,719 | |
Administration fees payable | | | 65,199 | |
Distribution fees payable | | | 10,611 | |
Trustees’ fees and expenses payable | | | 3,618 | |
| | | | |
Total liabilities | | | 22,986,156 | |
| | | | |
Total net assets | | $ | 626,031,810 | |
| | | | |
| |
NET ASSETS CONSIST OF | | | | |
Paid-in capital | | $ | 569,781,790 | |
Undistributed net investment income | | | 824,494 | |
Accumulated net realized losses on investments | | | (24,144,700 | ) |
Net unrealized gains on investments | | | 79,570,226 | |
| | | | |
Total net assets | | $ | 626,031,810 | |
| | | | |
| |
COMPUTATION OF NET ASSET VALUE AND OFFERING PRICE PER SHARE | | | | |
Net assets – Class A | | $ | 22,773,657 | |
Shares outstanding – Class A1 | | | 1,949,969 | |
Net asset value per share – Class A | | | $11.68 | |
Maximum offering price per share – Class A2 | | | $12.39 | |
Net assets – Class C | | $ | 16,897,563 | |
Shares outstanding – Class C1 | | | 1,453,265 | |
Net asset value per share – Class C | | | $11.63 | |
Net assets – Class R | | $ | 32,053 | |
Shares outstanding – Class R1 | | | 2,738 | |
Net asset value per share – Class R | | | $11.71 | |
Net assets – Class R6 | | $ | 57,764,742 | |
Shares outstanding – Class R61 | | | 4,939,471 | |
Net asset value per share – Class R6 | | | $11.69 | |
Net assets – Administrator Class | | $ | 13,939,973 | |
Shares outstanding – Administrator Class1 | | | 1,185,215 | |
Net asset value per share – Administrator Class | | | $11.76 | |
Net assets – Institutional Class | | $ | 514,623,822 | |
Shares outstanding – Institutional Class1 | | | 43,974,706 | |
Net asset value per share – Institutional Class | | | $11.70 | |
| 1 | The Fund has an unlimited number of authorized shares. |
| 2 | Maximum offering price is computed as 100/94.25 of net asset value. On investments of $50,000 or more, the offering price is reduced. |
The accompanying notes are an integral part of these financial statements.
| | | | | | |
| Statement of operations—year ended October 31, 2017 | | Wells Fargo Emerging Markets Equity Income Fund | | | 17 | |
| | | | |
| | | | |
| |
Investment income | | | | |
Dividends (net of foreign withholding taxes of $2,093,130) | | $ | 17,949,613 | |
Income from affiliated securities | | | 157,887 | |
| | | | |
Total investment income | | | 18,107,500 | |
| | | | |
| |
Expenses | | | | |
Management fee | | | 5,477,136 | |
Administration fees | |
Class A | | | 46,078 | |
Class C | | | 30,327 | |
Class R | | | 62 | |
Class R6 | | | 9,340 | |
Administrator Class | | | 18,870 | |
Institutional Class | | | 553,694 | |
Shareholder servicing fees | |
Class A | | | 54,854 | |
Class C | | | 36,104 | |
Class R | | | 73 | |
Administrator Class | | | 33,977 | |
Distribution fees | |
Class C | | | 108,313 | |
Class R | | | 73 | |
Custody and accounting fees | | | 281,607 | |
Professional fees | | | 50,038 | |
Registration fees | | | 163,334 | |
Shareholder report expenses | | | 98,685 | |
Trustees’ fees and expenses | | | 23,747 | |
Other fees and expenses | | | 20,171 | |
| | | | |
Total expenses | | | 7,006,483 | |
Less: Fee waivers and/or expense reimbursements | | | (496,388 | ) |
| | | | |
Net expenses | | | 6,510,095 | |
| | | | |
Net investment income | | | 11,597,405 | |
| | | | |
| |
REALIZED AND UNREALIZED GAINS (LOSSES) ON INVESTMENTS | | | | |
|
Net realized gains (losses) on: | |
Unaffiliated securities | | | (3,694,499 | ) |
Forward foreign currency contract transactions | | | 58,200 | |
| | | | |
Net realized losses on investments | | | (3,636,299 | ) |
Net change in unrealized gains (losses) on investments | | | 62,981,538 | |
| | | | |
Net realized and unrealized gains (losses) on investments | | | 59,345,239 | |
| | | | |
Net increase in net assets resulting from operations | | $ | 70,942,644 | |
| | | | |
The accompanying notes are an integral part of these financial statements.
| | | | |
| 18 | | Wells Fargo Emerging Markets Equity Income Fund | | Statement of changes in net assets |
| | | | | | | | | | | | | | | | |
| | | Year ended October 31, 2017 | | | Year ended October 31, 2016 | |
| | | | |
Operations | | | | | | | | | | | | | | | | |
Net investment income | | | | | | $ | 11,597,405 | | | | | | | $ | 8,427,369 | |
Net realized losses on investments | | | | | | | (3,636,299 | ) | | | | | | | (12,750,447 | ) |
Net change in unrealized gains (losses) on investments | | | | | | | 62,981,538 | | | | | | | | 27,078,980 | |
| | | | |
Net increase in net assets resulting from operations | | | | | | | 70,942,644 | | | | | | | | 22,755,902 | |
| | | | |
| | | | |
Distributions to shareholders from | | | | | | | | | | | | | | | | |
Net investment income | | | | | | | | | | | | | | | | |
Class A | | | | | | | (390,251 | ) | | | | | | | (520,415 | ) |
Class C | | | | | | | (158,747 | ) | | | | | | | (196,473 | ) |
Class R | | | | | | | (467 | ) | | | | | | | (512 | ) |
Class R6 | | | | | | | (855,755 | ) | | | | | | | (62,106 | ) |
Administrator Class | | | | | | | (225,230 | ) | | | | | | | (1,092,920 | ) |
Institutional Class | | | | | | | (9,529,261 | ) | | | | | | | (6,378,435 | ) |
| | | | |
Total distributions to shareholders | | | | | | | (11,159,711 | ) | | | | | | | (8,250,861 | ) |
| | | | |
| | | | |
Capital share transactions | | | Shares | | | | | | | | Shares | | | | | |
Proceeds from shares sold | | | | | | | | | | | | | | | | |
Class A | | | 1,340,340 | | | | 14,361,130 | | | | 1,710,525 | | | | 16,669,000 | |
Class C | | | 485,274 | | | | 5,275,730 | | | | 735,242 | | | | 7,145,583 | |
Class R6 | | | 4,641,082 | | | | 50,565,308 | | | | 280,056 | | | | 2,733,901 | |
Administrator Class | | | 420,223 | | | | 4,491,827 | | | | 3,295,035 | | | | 31,905,381 | |
Institutional Class | | | 25,669,078 | | | | 273,448,732 | | | | 42,218,845 | | | | 417,403,734 | |
| | | | |
| | | | | | | 348,142,727 | | | | | | | | 475,857,599 | |
| | | | |
Reinvestment of distributions | | | | | | | | | | | | | | | | |
Class A | | | 34,360 | | | | 371,140 | | | | 50,509 | | | | 495,441 | |
Class C | | | 12,373 | | | | 135,828 | | | | 16,592 | | | | 161,956 | |
Class R | | | 37 | | | | 406 | | | | 52 | | | | 512 | |
Class R6 | | | 75,780 | | | | 855,656 | | | | 6,334 | | | | 62,106 | |
Administrator Class | | | 19,897 | | | | 220,679 | | | | 110,594 | | | | 1,087,476 | |
Institutional Class | | | 786,082 | | | | 8,603,349 | | | | 526,646 | | | | 5,191,655 | |
| | | | |
| | | | | | | 10,187,058 | | | | | | | | 6,999,146 | |
| | | | |
Payment for shares redeemed | | | | | | | | | | | | | | | | |
Class A | | | (1,999,905 | ) | | | (21,197,128 | ) | | | (1,479,305 | ) | | | (14,314,963 | ) |
Class C | | | (346,875 | ) | | | (3,692,327 | ) | | | (474,574 | ) | | | (4,639,504 | ) |
Class R6 | | | (29,306 | ) | | | (331,724 | ) | | | (37,131 | ) | | | (356,931 | ) |
Administrator Class | | | (4,195,059 | ) | | | (40,979,767 | ) | | | (2,859,314 | ) | | | (27,376,015 | ) |
Institutional Class | | | (23,935,891 | ) | | | (246,056,781 | ) | | | (14,607,459 | ) | | | (140,452,239 | ) |
| | | | |
| | | | | | | (312,257,727 | ) | | | | | | | (187,139,652 | ) |
| | | | |
Net increase in net assets resulting from capital share transactions | | | | | | | 46,072,058 | | | | | | | | 295,717,093 | |
| | | | |
Total increase in net assets | | | | | | | 105,854,991 | | | | | | | | 310,222,134 | |
| | | | |
| | | | |
Net assets | | | | | | | | | | | | | | | | |
Beginning of period | | | | | | | 520,176,819 | | | | | | | | 209,954,685 | |
| | | | |
End of period | | | | | | $ | 626,031,810 | | | | | | | $ | 520,176,819 | |
| | | | |
Undistributed net investment income | | | | | | $ | 824,494 | | | | | | | $ | 407,795 | |
| | | | |
The accompanying notes are an integral part of these financial statements.
| | | | | | |
| Financial highlights | | Wells Fargo Emerging Markets Equity Income Fund | | | 19 | |
(For a share outstanding throughout each period)
| | | | | | | | | | | | | | | | | | | | |
| | | Year ended October 31 | |
| CLASS A | | 2017 | | | 2016 | | | 2015 | | | 2014 | | | 2013 | |
Net asset value, beginning of period | | | $10.27 | | | | $9.97 | | | | $11.33 | | | | $11.79 | | | | $11.17 | |
Net investment income | | | 0.18 | 1 | | | 0.23 | 1 | | | 0.20 | | | | 0.33 | | | | 0.31 | |
Net realized and unrealized gains (losses) on investments | | | 1.43 | | | | 0.29 | | | | (1.36 | ) | | | (0.11 | ) | | | 0.88 | |
| | | | | | | | | | | | | | | | | | | | |
Total from investment operations | | | 1.61 | | | | 0.52 | | | | (1.16 | ) | | | 0.22 | | | | 1.19 | |
Distributions to shareholders from | | | | | | | | | | | | | | | | | | | | |
Net investment income | | | (0.20 | ) | | | (0.22 | ) | | | (0.20 | ) | | | (0.31 | ) | | | (0.34 | ) |
Net realized gains | | | 0.00 | | | | 0.00 | | | | 0.00 | | | | (0.37 | ) | | | (0.23 | ) |
| | | | | | | | | | | | | | | | | | | | |
Total distributions to shareholders | | | (0.20 | ) | | | (0.22 | ) | | | (0.20 | ) | | | (0.68 | ) | | | (0.57 | ) |
Net asset value, end of period | | | $11.68 | | | | $10.27 | | | | $9.97 | | | | $11.33 | | | | $11.79 | |
Total return2 | | | 15.79 | % | | | 5.29 | % | | | (10.34 | )% | | | 2.05 | % | | | 10.94 | % |
Ratios to average net assets (annualized) | | | | | | | | | | | | | | | | | | | | |
Gross expenses | | | 1.68 | % | | | 1.79 | % | | | 1.89 | % | | | 2.09 | % | | | 2.88 | % |
Net expenses | | | 1.63 | % | | | 1.65 | % | | | 1.65 | % | | | 1.65 | % | | | 1.65 | % |
Net investment income | | | 1.72 | % | | | 2.34 | % | | | 2.22 | % | | | 3.12 | % | | | 2.64 | % |
Supplemental data | | | | | | | | | | | | | | | | | | | | |
Portfolio turnover rate | | | 80 | % | | | 64 | % | | | 84 | % | | | 91 | % | | | 85 | % |
Net assets, end of period (000s omitted) | | | $22,774 | | | | $26,459 | | | | $22,866 | | | | $14,010 | | | | $8,658 | |
| 1 | Calculated based upon average shares outstanding. |
| 2 | Total return calculations do not include any sales charges. |
The accompanying notes are an integral part of these financial statements.
| | | | |
| 20 | | Wells Fargo Emerging Markets Equity Income Fund | | Financial highlights |
(For a share outstanding throughout each period)
| | | | | | | | | | | | | | | | | | | | |
| | | Year ended October 31 | |
| CLASS C | | 2017 | | | 2016 | | | 2015 | | | 2014 | | | 2013 | |
Net asset value, beginning of period | | | $10.23 | | | | $9.94 | | | | $11.32 | | | | $11.79 | | | | $11.16 | |
Net investment income | | | 0.13 | | | | 0.16 | 1 | | | 0.14 | | | | 0.23 | | | | 0.22 | |
Net realized and unrealized gains (losses) on investments | | | 1.39 | | | | 0.28 | | | | (1.38 | ) | | | (0.08 | ) | | | 0.89 | |
| | | | | | | | | | | | | | | | | | | | |
Total from investment operations | | | 1.52 | | | | 0.44 | | | | (1.24 | ) | | | 0.15 | | | | 1.11 | |
Distributions to shareholders from | | | | | | | | | | | | | | | | | | | | |
Net investment income | | | (0.12 | ) | | | (0.15 | ) | | | (0.14 | ) | | | (0.25 | ) | | | (0.25 | ) |
Net realized gains | | | 0.00 | | | | 0.00 | | | | 0.00 | | | | (0.37 | ) | | | (0.23 | ) |
| | | | | | | | | | | | | | | | | | | | |
Total distributions to shareholders | | | (0.12 | ) | | | (0.15 | ) | | | (0.14 | ) | | | (0.62 | ) | | | (0.48 | ) |
Net asset value, end of period | | | $11.63 | | | | $10.23 | | | | $9.94 | | | | $11.32 | | | | $11.79 | |
Total return2 | | | 14.91 | % | | | 4.53 | % | | | (10.95 | )% | | | 1.27 | % | | | 10.11 | % |
Ratios to average net assets (annualized) | | | | | | | | | | | | | | | | | | | | |
Gross expenses | | | 2.42 | % | | | 2.54 | % | | | 2.64 | % | | | 2.83 | % | | | 3.81 | % |
Net expenses | | | 2.38 | % | | | 2.40 | % | | | 2.40 | % | | | 2.40 | % | | | 2.40 | % |
Net investment income | | | 1.18 | % | | | 1.62 | % | | | 1.45 | % | | | 2.17 | % | | | 1.80 | % |
Supplemental data | | | | | | | | | | | | | | | | | | | | |
Portfolio turnover rate | | | 80 | % | | | 64 | % | | | 84 | % | | | 91 | % | | | 85 | % |
Net assets, end of period (000s omitted) | | | $16,898 | | | | $13,327 | | | | $10,190 | | | | $6,390 | | | | $2,028 | |
| 1 | Calculated based upon average shares outstanding. |
| 2 | Total return calculations do not include any sales charges. |
The accompanying notes are an integral part of these financial statements.
| | | | | | |
| Financial highlights | | Wells Fargo Emerging Markets Equity Income Fund | | | 21 | |
(For a share outstanding throughout each period)
| | | | | | | | | | | | |
| | | Year ended October 31 | |
| CLASS R | | 2017 | | | 2016 | | | 20151 | |
Net asset value, beginning of period | | | $10.30 | | | | $9.99 | | | | $9.44 | |
Net investment income (loss) | | | 0.18 | | | | 0.20 | 2 | | | (0.01 | )2 |
Net realized and unrealized gains (losses) on investments | | | 1.40 | | | | 0.30 | | | | 0.56 | |
| | | | | | | | | | | | |
Total from investment operations | | | 1.58 | | | | 0.50 | | | | 0.55 | |
Distributions to shareholders from | | | | | | | | | | | | |
Net investment income | | | (0.17 | ) | | | (0.19 | ) | | | (0.00 | )3 |
Net asset value, end of period | | | $11.71 | | | | $10.30 | | | | $9.99 | |
Total return4 | | | 15.39 | % | | | 5.13 | % | | | 5.87 | % |
Ratios to average net assets (annualized) | | | | | | | | | | | | |
Gross expenses | | | 1.91 | % | | | 2.04 | % | | | 2.10 | % |
Net expenses | | | 1.87 | % | | | 1.90 | % | | | 1.90 | % |
Net investment income (loss) | | | 1.69 | % | | | 2.08 | % | | | (0.90 | )% |
Supplemental data | | | | | | | | | | | | |
Portfolio turnover rate | | | 80 | % | | | 64 | % | | | 84 | % |
Net assets, end of period (000s omitted) | | | $32 | | | | $28 | | | | $26 | |
| 1 | For the period from September 30, 2015 (commencement of class operations) to October 31, 2015 |
| 2 | Calculated based upon average shares outstanding |
| 3 | Amount is less than $0.005. |
| 4 | Returns for periods of less than one year are not annualized. |
The accompanying notes are an integral part of these financial statements.
| | | | |
| 22 | | Wells Fargo Emerging Markets Equity Income Fund | | Financial highlights |
(For a share outstanding throughout each period)
| | | | | | | | | | | | |
| | | Year ended October 31 | |
| CLASS R6 | | 2017 | | | 2016 | | | 20151 | |
Net asset value, beginning of period | | | $10.29 | | | | $9.97 | | | | $9.42 | |
Net investment income (loss) | | | 0.33 | 2 | | | 0.30 | 2 | | | (0.00 | )2,3 |
Net realized and unrealized gains (losses) on investments | | | 1.32 | | | | 0.27 | | | | 0.56 | |
| | | | | | | | | | | | |
Total from investment operations | | | 1.65 | | | | 0.57 | | | | 0.56 | |
Distributions to shareholders from | | | | | | | | | | | | |
Net investment income | | | (0.25 | ) | | | (0.25 | ) | | | (0.01 | ) |
Net asset value, end of period | | | $11.69 | | | | $10.29 | | | | $9.97 | |
Total return4 | | | 16.25 | % | | | 5.90 | % | | | 5.91 | % |
Ratios to average net assets (annualized) | | | | | | | | | | | | |
Gross expenses | | | 1.20 | % | | | 1.36 | % | | | 1.40 | % |
Net expenses | | | 1.17 | % | | | 1.20 | % | | | 1.20 | % |
Net investment income (loss) | | | 2.96 | % | | | 3.05 | % | | | (0.19 | )% |
Supplemental data | | | | | | | | | | | | |
Portfolio turnover rate | | | 80 | % | | | 64 | % | | | 84 | % |
Net assets, end of period (000s omitted) | | | $57,765 | | | | $2,592 | | | | $26 | |
| 1 | For the period from September 30, 2015 (commencement of class operations) to October 31, 2015 |
| 2 | Calculated based upon average shares outstanding. |
| 3 | Amount is less than $0.005. |
| 4 | Returns for periods of less than one year are not annualized. |
The accompanying notes are an integral part of these financial statements.
| | | | | | |
| Financial highlights | | Wells Fargo Emerging Markets Equity Income Fund | | | 23 | |
(For a share outstanding throughout each period)
| | | | | | | | | | | | | | | | | | | | |
| | | Year ended October 31 | |
| ADMINISTRATOR CLASS | | 2017 | | | 2016 | | | 2015 | | | 2014 | | | 2013 | |
Net asset value, beginning of period | | | $10.32 | | | | $10.00 | | | | $11.35 | | | | $11.80 | | | | $11.17 | |
Net investment income | | | 0.18 | 1 | | | 0.25 | 1 | | | 0.23 | | | | 0.33 | 1 | | | 0.32 | |
Net realized and unrealized gains (losses) on investments | | | 1.46 | | | | 0.29 | | | | (1.37 | ) | | | (0.08 | ) | | | 0.89 | |
| | | | | | | | | | | | | | | | | | | | |
Total from investment operations | | | 1.64 | | | | 0.54 | | | | (1.14 | ) | | | 0.25 | | | | 1.21 | |
Distributions to shareholders from | | | | | | | | | | | | | | | | | | | | |
Net investment income | | | (0.20 | ) | | | (0.22 | ) | | | (0.21 | ) | | | (0.33 | ) | | | (0.35 | ) |
Net realized gains | | | 0.00 | | | | 0.00 | | | | 0.00 | | | | (0.37 | ) | | | (0.23 | ) |
| | | | | | | | | | | | | | | | | | | | |
Total distributions to shareholders | | | (0.20 | ) | | | (0.22 | ) | | | (0.21 | ) | | | (0.70 | ) | | | (0.58 | ) |
Net asset value, end of period | | | $11.76 | | | | $10.32 | | | | $10.00 | | | | $11.35 | | | | $11.80 | |
Total return | | | 15.99 | % | | | 5.56 | % | | | (10.12 | )% | | | 2.30 | % | | | 11.13 | % |
Ratios to average net assets (annualized) | | | | | | | | | | | | | | | | | | | | |
Gross expenses | | | 1.58 | % | | | 1.71 | % | | | 1.76 | % | | | 1.91 | % | | | 2.94 | % |
Net expenses | | | 1.45 | % | | | 1.45 | % | | | 1.45 | % | | | 1.45 | % | | | 1.45 | % |
Net investment income | | | 1.73 | % | | | 2.54 | % | | | 2.38 | % | | | 2.89 | % | | | 2.70 | % |
Supplemental data | | | | | | | | | | | | | | | | | | | | |
Portfolio turnover rate | | | 80 | % | | | 64 | % | | | 84 | % | | | 91 | % | | | 85 | % |
Net assets, end of period (000s omitted) | | | $13,940 | | | | $50,970 | | | | $43,928 | | | | $52,896 | | | | $13,527 | |
| 1 | Calculated based upon average shares outstanding. |
The accompanying notes are an integral part of these financial statements.
| | | | |
| 24 | | Wells Fargo Emerging Markets Equity Income Fund | | Financial highlights |
(For a share outstanding throughout each period)
| | | | | | | | | | | | | | | | | | | | |
| | | Year ended October 31 | |
| INSTITUTIONAL CLASS | | 2017 | | | 2016 | | | 2015 | | | 2014 | | | 2013 | |
Net asset value, beginning of period | | | $10.30 | | | | $9.98 | | | | $11.34 | | | | $11.79 | | | | $11.17 | |
Net investment income | | | 0.25 | | | | 0.27 | 1 | | | 0.25 | 1 | | | 0.35 | | | | 0.34 | |
Net realized and unrealized gains (losses) on investments | | | 1.39 | | | | 0.30 | | | | (1.36 | ) | | | (0.07 | ) | | | 0.89 | |
| | | | | | | | | | | | | | | | | | | | |
Total from investment operations | | | 1.64 | | | | 0.57 | | | | (1.11 | ) | | | 0.28 | | | | 1.23 | |
Distributions to shareholders from | | | | | | | | | | | | | | | | | | | | |
Net investment income | | | (0.24 | ) | | | (0.25 | ) | | | (0.25 | ) | | | (0.36 | ) | | | (0.38 | ) |
Net realized gains | | | 0.00 | | | | 0.00 | | | | 0.00 | | | | (0.37 | ) | | | (0.23 | ) |
| | | | | | | | | | | | | | | | | | | | |
Total distributions to shareholders | | | (0.24 | ) | | | (0.25 | ) | | | (0.25 | ) | | | (0.73 | ) | | | (0.61 | ) |
Net asset value, end of period | | | $11.70 | | | | $10.30 | | | | $9.98 | | | | $11.34 | | | | $11.79 | |
Total return | | | 16.11 | % | | | 5.84 | % | | | (9.95 | )% | | | 2.52 | % | | | 11.32 | % |
Ratios to average net assets (annualized) | | | | | | | | | | | | | | | | | | | | |
Gross expenses | | | 1.33 | % | | | 1.45 | % | | | 1.51 | % | | | 1.62 | % | | | 2.74 | % |
Net expenses | | | 1.23 | % | | | 1.25 | % | | | 1.25 | % | | | 1.25 | % | | | 1.25 | % |
Net investment income | | | 2.32 | % | | | 2.75 | % | | | 2.41 | % | | | 3.69 | % | | | 2.88 | % |
Supplemental data | | | | | | | | | | | | | | | | | | | | |
Portfolio turnover rate | | | 80 | % | | | 64 | % | | | 84 | % | | | 91 | % | | | 85 | % |
Net assets, end of period (000s omitted) | | | $514,624 | | | | $426,801 | | | | $132,918 | | | | $35,114 | | | | $6,077 | |
| 1 | Calculated based upon average shares outstanding. |
The accompanying notes are an integral part of these financial statements.
| | | | | | |
| Notes to financial statements | | Wells Fargo Emerging Markets Equity Income Fund | | | 25 | |
1. ORGANIZATION
Wells Fargo Funds Trust (the “Trust”), a Delaware statutory trust organized on March 10, 1999, is an open-end management investment company registered under the Investment Company Act of 1940, as amended (the “1940 Act”). As an investment company, the Trust follows the accounting and reporting guidance in Financial Accounting Standards Board Accounting Standards Codification Topic 946, Financial Services – Investment Companies. These financial statements report on the Wells Fargo Emerging Markets Equity Income Fund (the “Fund”) which is a diversified series of the Trust.
2. SIGNIFICANT ACCOUNTING POLICIES
The following significant accounting policies, which are consistently followed in the preparation of the financial statements of the Fund, are in conformity with U.S. generally accepted accounting principles which require management to make estimates and assumptions that affect the reported amounts of assets and liabilities, disclosure of contingent assets and liabilities at the date of the financial statements, and the reported amounts of revenues and expenses during the reporting period. Actual results could differ from those estimates.
Securities valuation
All investments are valued each business day as of the close of regular trading on the New York Stock Exchange (generally 4 p.m. Eastern Time), although the Fund may deviate from this calculation time under unusual or unexpected circumstances.
Equity securities that are listed on a foreign or domestic exchange or market are valued at the official closing price or, if none, the last sales price. If no sale occurs on the principal exchange or market that day, a fair value price will be determined in accordance with the Fund’s Valuation Procedures.
The values of securities denominated in foreign currencies are translated into U.S. dollars at rates provided by an independent foreign currency pricing source at a time each business day specified by the Management Valuation Team of Wells Fargo Funds Management, LLC (“Funds Management”).
Many securities markets and exchanges outside the U.S. close prior to the close of the New York Stock Exchange and therefore may not fully reflect trading or events that occur after the close of the principal exchange in which the foreign securities are traded, but before the close of the New York Stock Exchange. If such trading or events are expected to materially affect the value of such securities, then fair value pricing procedures approved by the Board of Trustees of the Fund are applied. These procedures take into account multiple factors including movements in U.S. securities markets after foreign exchanges close. Foreign securities that are fair valued under these procedures are categorized as Level 2 and the application of these procedures may result in transfers between Level 1 and Level 2. Depending on market activity, such fair valuations may be frequent. Such fair value pricing may result in net asset values that are higher or lower than net asset values based on the last reported sales price or latest quoted bid price. On October 31, 2017, such fair value pricing was not used in pricing foreign securities.
Investments in registered open-end investment companies are valued at net asset value.
Investments which are not valued using any of the methods discussed above are valued at their fair value, as determined in good faith by the Board of Trustees. The Board of Trustees has established a Valuation Committee comprised of the Trustees and has delegated to it the authority to take any actions regarding the valuation of portfolio securities that the Valuation Committee deems necessary or appropriate, including determining the fair value of portfolio securities, unless the determination has been delegated to the Management Valuation Team. The Board of Trustees retains the authority to make or ratify any valuation decisions or approve any changes to the Valuation Procedures as it deems appropriate. On a quarterly basis, the Board of Trustees receives reports on any valuation actions taken by the Valuation Committee or the Management Valuation Team which may include items for ratification.
Valuations of fair valued securities are compared to the next actual sales price when available, or other appropriate market values, to assess the continued appropriateness of the fair valuation methodologies used. These securities are fair valued on a day-to-day basis, taking into consideration changes to appropriate market information and any significant changes to the inputs considered in the valuation process until there is a readily available price provided on an exchange or by an independent pricing service. Valuations received from an independent pricing service or independent broker-dealer quotes are periodically validated by comparisons to most recent trades and valuations provided by other independent pricing services in addition to the review of prices by the manager and/or subadviser. Unobservable inputs used in determining fair valuations are identified based on the type of security, taking into consideration factors utilized by market participants in valuing the investment, knowledge about the issuer and the current market environment.
| | | | |
| 26 | | Wells Fargo Emerging Markets Equity Income Fund | | Notes to financial statements |
Foreign currency translation
The accounting records of the Fund are maintained in U.S. dollars. The values of other assets and liabilities denominated in foreign currencies are translated into U.S. dollars at rates provided by an independent foreign currency pricing source at a time each business day specified by the Management Valuation Team. Purchases and sales of securities, and income and expenses are converted at the rate of exchange on the respective dates of such transactions. Net realized foreign exchange gains or losses arise from sales of foreign currencies, currency gains or losses realized between the trade and settlement dates on securities transactions, and the difference between the amounts of dividends, interest and foreign withholding taxes recorded and the U.S. dollar equivalent of the amounts actually paid or received. Net unrealized foreign exchange gains and losses arise from changes in the fair value of assets and liabilities other than investments in securities resulting from changes in exchange rates. The changes in net assets arising from changes in exchange rates of securities and the changes in net assets resulting from changes in market prices of securities are not separately presented. Such changes are included in net realized and unrealized gains or losses from investments.
Participation notes
The Fund may invest in participation notes to gain exposure to securities in certain foreign markets. Participation notes are issued by banks or broker-dealers and are designed to offer a return linked to a particular underlying foreign security. Participation notes involve transaction costs, which may be higher than those applicable to the underlying foreign security. The holder of the participation note is entitled to receive from the bank or broker-dealer, an amount equal to the dividend paid by the issuer of the underlying foreign security; however, the holder is not entitled to the same rights (i.e. dividends, voting rights) as an owner of the underlying foreign security. Investments in participation notes involve risks beyond those normally associated with a direct investment in an underlying security. The Fund has no rights against the issuer of the underlying foreign security and participation notes expose the Fund to counterparty risk in the event the counterparty does not perform. There is also no assurance there will be a secondary trading market for the participation note or that the trading price of the participation note will equal the underlying value of the foreign security that it seeks to replicate.
Forward foreign currency contracts
The Fund is subject to foreign currency risk in the normal course of pursuing its investment objectives. A forward foreign currency contract is an agreement between two parties to purchase or sell a specific currency for an agreed-upon price at a future date. The Fund enters into forward foreign currency contracts to facilitate transactions in foreign-denominated securities and to attempt to minimize the risk to the Fund from adverse changes in the relationship between currencies. Forward foreign currency contracts are recorded at the forward rate and marked-to-market daily. When the contracts are closed, realized gains and losses arising from such transactions are recorded as realized gains or losses on forward foreign currency contract transactions. The Fund could be exposed to risks if the counterparties to the contracts are unable to meet the terms of their contracts or if the value of the foreign currency changes unfavorably. The Fund’s maximum risk of loss from counterparty credit risk is the unrealized gains on the contracts. This risk may be mitigated if there is a master netting arrangement between the Fund and the counterparty.
Security transactions and income recognition
Securities transactions are recorded on a trade date basis. Realized gains or losses are recorded on the basis of identified cost.
Dividend income is recognized on the ex-dividend date, except for certain dividends from foreign securities, which are recorded as soon as the custodian verifies the ex-dividend date. Dividend income from foreign securities is recorded net of foreign taxes withheld where recovery of such taxes is not assured.
Distributions to shareholders
Distributions to shareholders from net investment income and net realized gains, if any, are recorded on the ex-dividend date. Such distributions are determined in accordance with income tax regulations and may differ from U.S. generally accepted accounting principles. Dividend sources are estimated at the time of declaration. The tax character of distributions is determined as of the Fund’s fiscal year end. Therefore, a portion of the Fund’s distributions made prior to the Fund’s fiscal year end may be categorized as a tax return of capital.
Federal and other taxes
The Fund intends to continue to qualify as a regulated investment company by distributing substantially all of its investment company taxable income and any net realized capital gains (after reduction for capital loss carryforwards) sufficient to relieve it from all, or substantially all, federal income taxes. Accordingly, no provision for federal income taxes was required.
| | | | | | |
| Notes to financial statements | | Wells Fargo Emerging Markets Equity Income Fund | | | 27 | |
The Fund’s income and federal excise tax returns and all financial records supporting those returns for the prior three fiscal years are subject to examination by the federal and Delaware revenue authorities. Management has analyzed the Fund’s tax positions taken on federal, state, and foreign tax returns for all open tax years and does not believe that there are any uncertain tax positions that require recognition of a tax liability.
As of October 31, 2017, the aggregate cost of all investments for federal income tax purposes was $565,401,347 and the unrealized gains (losses) consisted of:
| | | | |
Gross unrealized gains | | $ | 85,871,660 | |
Gross unrealized losses | | | (8,985,340 | ) |
Net unrealized gains | | $ | 76,886,320 | |
Reclassifications are made to the Fund’s capital accounts for permanent tax differences to reflect income and gains available for distribution (or available capital loss carryforwards) under federal income tax regulations. U.S. generally accepted accounting principles require that certain components of net assets be adjusted to reflect permanent differences between financial and tax reporting. These reclassifications have no effect on net assets or net asset values per share. The primary permanent differences causing such reclassifications are due to foreign currency transactions and passive foreign investment companies. At October 31, 2017, as a result of permanent book-to-tax differences, the following reclassification adjustments were made on the Statement of Assets and Liabilities:
| | |
Undistributed net
investment income | | Accumulated net
realized losses
on investments |
| $(20,995) | | $20,995 |
As of October 31, 2017 the Fund had capital loss carryforwards which consist of $12,684,027 in short-term capital losses and $9,118,727 in long-term capital losses.
Class allocations
The separate classes of shares offered by the Fund differ principally in applicable sales charges, distribution, shareholder servicing, and administration fees. Class specific expenses are charged directly to that share class. Investment income, common expenses, and realized and unrealized gains (losses) on investments are allocated daily to each class of shares based on the relative proportion of net assets of each class.
3. FAIR VALUATION MEASUREMENTS
Fair value measurements of investments are determined within a framework that has established a fair value hierarchy based upon the various data inputs utilized in determining the value of the Fund’s investments. The three-level hierarchy gives the highest priority to unadjusted quoted prices in active markets for identical assets or liabilities (Level 1) and the lowest priority to unobservable inputs (Level 3). The Fund’s investments are classified within the fair value hierarchy based on the lowest level of input that is significant to the fair value measurement. The inputs are summarized into three broad levels as follows:
| ∎ | | Level 1 – quoted prices in active markets for identical securities |
| ∎ | | Level 2 – other significant observable inputs (including quoted prices for similar securities, interest rates, prepayment speeds, credit risk, etc.) |
| ∎ | | Level 3 – significant unobservable inputs (including the Fund’s own assumptions in determining the fair value of investments) |
The inputs or methodologies used for valuing investments in securities are not necessarily an indication of the risk associated with investing in those securities.
| | | | |
| 28 | | Wells Fargo Emerging Markets Equity Income Fund | | Notes to financial statements |
The following is a summary of the inputs used in valuing the Fund’s assets and liabilities as of October 31, 2017:
| | | | | | | | | | | | | | | | |
| | | Quoted prices
(Level 1) | | | Other significant
observable inputs
(Level 2) | | | Significant
unobservable inputs (Level 3) | | | Total | |
Assets | | | | | | | | | | | | | | | | |
Investments in: | | | | | | | | | | | | | | | | |
| | | | |
Common stocks | | | | | | | | | | | | | | | | |
Argentina | | $ | 5,998,577 | | | $ | 0 | | | $ | 0 | | | $ | 5,998,577 | |
Brazil | | | 39,294,757 | | | | 0 | | | | 0 | | | | 39,294,757 | |
Cayman Islands | | | 6,463,455 | | | | 0 | | | | 0 | | | | 6,463,455 | |
Chile | | | 6,372,635 | | | | 0 | | | | 0 | | | | 6,372,635 | |
China | | | 126,754,457 | | | | 0 | | | | 0 | | | | 126,754,457 | |
Hong Kong | | | 17,185,079 | | | | 0 | | | | 0 | | | | 17,185,079 | |
India | | | 40,763,247 | | | | 0 | | | | 0 | | | | 40,763,247 | |
Indonesia | | | 15,492,706 | | | | 0 | | | | 0 | | | | 15,492,706 | |
Luxembourg | | | 6,137,158 | | | | 0 | | | | 0 | | | | 6,137,158 | |
Malaysia | | | 12,788,506 | | | | 0 | | | | 0 | | | | 12,788,506 | |
Mexico | | | 11,628,700 | | | | 0 | | | | 0 | | | | 11,628,700 | |
Philippines | | | 6,662,584 | | | | 0 | | | | 0 | | | | 6,662,584 | |
Russia | | | 8,239,108 | | | | 8,866,033 | | | | 0 | | | | 17,105,141 | |
Singapore | | | 12,541,429 | | | | 0 | | | | 0 | | | | 12,541,429 | |
South Africa | | | 23,473,230 | | | | 0 | | | | 0 | | | | 23,473,230 | |
South Korea | | | 72,088,151 | | | | 0 | | | | 0 | | | | 72,088,151 | |
Taiwan | | | 67,060,732 | | | | 0 | | | | 0 | | | | 67,060,732 | |
Thailand | | | 23,059,489 | | | | 0 | | | | 0 | | | | 23,059,489 | |
Turkey | | | 6,387,967 | | | | 0 | | | | 0 | | | | 6,387,967 | |
United Arab Emirates | | | 4,504,607 | | | | 0 | | | | 0 | | | | 4,504,607 | |
United Kingdom | | | 2,911,074 | | | | 0 | | | | 0 | | | | 2,911,074 | |
| | | | |
Exchange-traded funds | | | | | | | | | | | | | | | | |
United States | | | 9,471,287 | | | | 0 | | | | 0 | | | | 9,471,287 | |
| | | | |
Participation notes | | | | | | | | | | | | | | | | |
China | | | 0 | | | | 48,088,785 | | | | 0 | | | | 48,088,785 | |
| | | | |
Preferred stocks | | | | | | | | | | | | | | | | |
Brazil | | | 21,587,039 | | | | 0 | | | | 0 | | | | 21,587,039 | |
| | | | |
Short-term investments | | | | | | | | | | | | | | | | |
Investment companies | | | 38,470,174 | | | | 0 | | | | 0 | | | | 38,470,174 | |
Total assets | | $ | 585,336,148 | | | $ | 56,954,818 | | | $ | 0 | | | $ | 642,290,966 | |
The Fund recognizes transfers between levels within the fair value hierarchy at the end of the reporting period. At October 31, 2017, the Fund did not have any transfers into/out of Level 1, Level 2, or Level 3.
4. TRANSACTIONS WITH AFFILIATES AND OTHER EXPENSES
Management fee
Funds Management, an indirect wholly owned subsidiary of Wells Fargo & Company (“Wells Fargo”), is the manager of the Fund and provides advisory and fund-level administrative services under an investment management agreement. Under the investment management agreement, Funds Management is responsible for, among other services, implementing the investment objectives and strategies of the Fund, supervising the subadviser, providing fund-level administrative services in connection with the Fund’s operations, and providing any other fund-level administrative services reasonably necessary for the operation of the Fund. As compensation for its services under the investment management agreement, Funds Management is entitled to receive an annual management fee starting at 1.05% and declining to 0.945% as the average daily net assets of the Fund increase. Prior to March 1, 2017, Funds Management received a fee at an annual rate which started at 1.15% and declined to 0.955% as the average daily net assets of the Fund increased. For the year ended October 31, 2017, the management fee was equivalent to an annual rate of 1.08% of the Fund’s average daily net assets.
| | | | | | |
| Notes to financial statements | | Wells Fargo Emerging Markets Equity Income Fund | | | 29 | |
Funds Management has retained the services of a subadviser to provide daily portfolio management to the Fund. The fee for subadvisory services is borne by Funds Management. Wells Capital Management Incorporated, an affiliate of Funds Management and an indirect wholly owned subsidiary of Wells Fargo, is the subadviser to the Fund and is entitled to receive a fee from Funds Management at an annual rate starting at 0.65% and declining to 0.45% as the average daily net assets of the Fund increase.
Administration fees
Under a class-level administration agreement, Funds Management provides class-level administrative services to the Fund, which includes paying fees and expenses for services provided by the transfer agent, sub-transfer agents, omnibus account servicers and record-keepers. As compensation for its services under the class-level administration agreement, Funds Management receives an annual fee which is calculated based on the average daily net assets of each class as follows:
| | | | |
| | | Class-level
administration fee | |
Class A, Class C, Class R | | | 0.21 | % |
Class R6 | | | 0.03 | |
Administrator Class, Institutional Class | | | 0.13 | |
Funds Management has contractually waived and/or reimbursed management and administration fees to the extent necessary to maintain certain net operating expense ratios for the Fund. Waiver of fees and/or reimbursement of expenses by Funds Management were made first from fund level expenses on a proportionate basis and then from class specific expenses. Funds Management has committed through February 28, 2018 to waive fees and/or reimburse expenses to the extent necessary to cap the Fund’s expenses at 1.62% for Class A shares, 2.37% for Class C shares, 1.87% for Class R shares, 1.17% for Class R6 shares, 1.45% for Administrator Class shares and 1.22% for Institutional Class shares. After this time, the cap may be increased or the commitment to maintain the cap may be terminated only with the approval of the Board of Trustees. Prior to March 1, 2017, the Fund’s expenses were capped at 1.65% for Class A shares, 2.40% for Class C shares, 1.90% for Class R shares, 1.20% for Class R6 shares, 1.45% for Administrator Class shares, and 1.25% for Institutional Class shares.
Out-of-pocket reimbursements
During the year ended October 31, 2017, State Street Bank and Trust Company (“State Street”), the Fund’s custodian, reimbursed the Fund $373 for certain out-of-pocket expenses that were billed to the Fund in error from 1998-2015. This amount is included in dividend income on the Statement of Operations. In addition, Funds Management was also reimbursed $2,063 by State Street for waivers/reimbursements it made to the Fund to limit Fund expenses during the period the Fund was erroneously billed.
Distribution fees
The Trust has adopted a distribution plan for Class C and Class R shares of the Fund pursuant to Rule 12b-1 under the 1940 Act. Distribution fees are charged to Class C and Class R shares and paid to Wells Fargo Funds Distributor, LLC (“Funds Distributor”), the principal underwriter, at an annual rate of 0.75% of the average daily net assets of Class C shares and 0.25% of the average daily net assets of Class R shares.
In addition, Funds Distributor is entitled to receive the front-end sales charge from the purchase of Class A shares and a contingent deferred sales charge on the redemption of certain Class A shares. Funds Distributor is also entitled to receive the contingent deferred sales charges from redemptions of Class C shares. For the year ended October 31, 2017, Funds Distributor received $22,825 from the sale of Class A shares and $939 in contingent deferred sales charges from redemptions of Class C shares, respectively. No contingent deferred sales charges were incurred by Class A shares for the year ended October 31, 2017.
Shareholder servicing fees
The Trust has entered into contracts with one or more shareholder servicing agents, whereby Class A, Class C, Class R, and Administrator Class of the Fund are charged a fee at an annual rate of 0.25% of the average daily net assets of each respective class.
A portion of these total shareholder servicing fees were paid to affiliates of Wells Fargo.
Interfund transactions
The Fund may purchase or sell investment securities to other Wells Fargo affiliates pursuant to Rule 17a-7 under the 1940 Act and under procedures adopted by the Board of Trustees. The procedures have been designed to ensure that these interfund transactions, which do not incur broker commissions, are effected at current market prices.
| | | | |
| 30 | | Wells Fargo Emerging Markets Equity Income Fund | | Notes to financial statements |
5. INVESTMENT PORTFOLIO TRANSACTIONS
Purchases and sales of investments, excluding U.S. government obligations (if any) and short-term securities, for the year ended October 31, 2017 were $432,764,392 and $391,934,290, respectively.
6. DERIVATIVE TRANSACTIONS
During the year ended October 31, 2017, the Fund entered into forward foreign currency contracts for economic hedging purposes. The Fund had average contract amounts of $62,935 in forward foreign currency contracts to buy during the year ended October 31, 2017.
The fair value, realized gains or losses and change in unrealized gains or losses, if any, on derivative instruments are reflected in the corresponding financial statement captions.
7. BANK BORROWINGS
The Trust (excluding the money market funds and certain other funds) and Wells Fargo Variable Trust are parties to a $280,000,000 revolving credit agreement whereby the Fund is permitted to use bank borrowings for temporary or emergency purposes, such as to fund shareholder redemption requests. Interest under the credit agreement is charged to the Fund based on a borrowing rate equal to the higher of the Federal Funds rate in effect on that day plus 1.25% or the overnight LIBOR rate in effect on that day plus 1.25%. In addition, an annual commitment fee equal to 0.25% of the unused balance is allocated to each participating fund. Prior to August 29, 2017, the revolving credit agreement amount was $250,000,000.
For the year ended October 31, 2017, there were no borrowings by the Fund under the agreement.
8. DISTRIBUTIONS TO SHAREHOLDERS
The tax character of distributions paid was $11,159,711 and $8,250,861 of ordinary income for the years ended October 31, 2017 and October 31, 2016, respectively.
As of October 31, 2017, the components of distributable earnings on a tax basis were as follows:
| | | | |
Undistributed
ordinary income | | Unrealized
gains | | Capital loss
carryforward |
| $1,163,627 | | $76,889,147 | | $(21,802,754) |
9. CONCENTRATION RISK
Concentration risks result from exposure to a limited number of sectors. A fund that invests a substantial portion of its assets in any sector may be more affected by changes in that sector than would be a fund whose investments are not heavily weighted in any sector.
10. INDEMNIFICATION
Under the Trust’s organizational documents, the officers and Trustees have been granted certain indemnification rights against certain liabilities that may arise out of performance of their duties to the Trust. Additionally, in the normal course of business, the Trust may enter into contracts with service providers that contain a variety of indemnification clauses. The Trust’s maximum exposure under these arrangements is dependent on future claims that may be made against the Fund and, therefore, cannot be estimated.
| | | | | | |
| Notes to financial statements | | Wells Fargo Emerging Markets Equity Income Fund | | | 31 | |
11. SUBSEQUENT DISTRIBUTIONS
On November 24, 2017, the Fund declared distributions from net investment income to shareholders of record on November 22, 2017. The per share amounts payable on November 27, 2017 were as follows:
| | | | |
| | | Net
investment
income | |
Class A | | | $0.00661 | |
Class C | | | 0.00000 | |
Class R | | | 0.00389 | |
Class R6 | | | 0.01107 | |
Administrator Class | | | 0.00740 | |
Institutional Class | | | 0.01002 | |
These distributions are not reflected in the accompanying financial statements.
| | | | |
| 32 | | Wells Fargo Emerging Markets Equity Income Fund | | Report of independent registered public accountig firm |
BOARD OF TRUSTEES AND SHAREHOLDERS OF WELLS FARGO FUNDS TRUST:
We have audited the accompanying statement of assets and liabilities, including the portfolio of investments, of the Wells Fargo Emerging Markets Equity Income Fund (the “Fund”), one of the funds constituting the Wells Fargo Funds Trust, as of October 31, 2017, and the related statement of operations for the year then ended, the statements of changes in net assets for each of the years in the two-year period then ended, and the financial highlights for each of the years or periods in the five-year period then ended. These financial statements and financial highlights are the responsibility of the Fund’s management. Our responsibility is to express an opinion on these financial statements and financial highlights based on our audits.
We conducted our audits in accordance with the standards of the Public Company Accounting Oversight Board (United States). Those standards require that we plan and perform the audit to obtain reasonable assurance about whether the financial statements and financial highlights are free of material misstatement. An audit includes examining, on a test basis, evidence supporting the amounts and disclosures in the financial statements. Our procedures included confirmation of securities owned as of October 31, 2017, by correspondence with the custodian and brokers, or by other appropriate audit procedures. An audit also includes assessing the accounting principles used and significant estimates made by management, as well as evaluating the overall financial statement presentation. We believe that our audits provide a reasonable basis for our opinion.
In our opinion, the financial statements and financial highlights referred to above present fairly, in all material respects, the financial position of the Wells Fargo Emerging Markets Equity Income Fund as of October 31, 2017, the results of its operations for the year then ended, the changes in its net assets for each of the years in the two-year period then ended, and the financial highlights for each of the years or periods in the five-year period then ended, in conformity with U.S. generally accepted accounting principles.

Boston, Massachusetts
December 21, 2017
| | | | | | |
| Other information (unaudited) | | Wells Fargo Emerging Markets Equity Income Fund | | | 33 | |
TAX INFORMATION
Pursuant to Section 854 of the Internal Revenue Code, $11,031,469 of income dividends paid during the fiscal year ended October 31, 2017 has been designated as qualified dividend income (QDI).
For the fiscal year ended October 31, 2017, $94,200 has been designated as interest-related dividends for nonresident alien shareholders pursuant to Section 871 of the Internal Revenue Code.
Pursuant to Section 853 of the Internal Revenue Code, the Fund expects to designate amounts as foreign taxes paid for the fiscal year ended October 31, 2017. Additional details will be available in the semiannual report.
PROXY VOTING INFORMATION
A description of the policies and procedures that the Fund uses to determine how to vote proxies relating to portfolio securities is available, upon request, by calling 1-800-222-8222, visiting our website at wellsfargofunds.com, or visiting the SEC website at sec.gov. Information regarding how the Fund voted proxies relating to portfolio securities during the most recent 12-month period ended June 30 is available on the Fund’s website at wellsfargofunds.com or by visiting the SEC website at sec.gov.
PORTFOLIO HOLDINGS INFORMATION
The complete portfolio holdings for the Fund are publicly available monthly on the Fund’s website (wellsfargofunds.com), on a one-month delayed basis. In addition, top ten holdings information (excluding derivative positions) for the Fund is publicly available on the Fund’s website on a monthly, seven-day or more delayed basis. The Fund files its complete schedule of portfolio holdings with the SEC for the first and third quarters of each fiscal year on Form N-Q, which is available by visiting the SEC website at sec.gov. In addition, the Fund’s Form N-Q may be reviewed and copied at the SEC’s Public Reference Room in Washington, DC, and at regional offices in New York City, at 233 Broadway, and in Chicago, at 175 West Jackson Boulevard, Suite 900. Information about the Public Reference Room may be obtained by calling 1-800-SEC-0330.
| | | | |
| 34 | | Wells Fargo Emerging Markets Equity Income Fund | | Other information (unaudited) |
BOARD OF TRUSTEES AND OFFICERS
Each of the Trustees and Officers1 listed in the table below acts in identical capacities for each fund in the Wells Fargo family of funds, which consists of 152 mutual funds comprising the Wells Fargo Funds Trust, Wells Fargo Variable Trust, Wells Fargo Master Trust and four closed-end funds (collectively the “Fund Complex”). This table should be read in conjunction with the Prospectus and the Statement of Additional Information2. The mailing address of each Trustee and Officer is 525 Market Street, 12th Floor, San Francisco, CA 94105. Each Trustee and Officer serves an indefinite term, however, each Trustee serves such term until reaching the mandatory retirement age established by the Trustees.
Independent Trustees
| | | | | | |
Name and year of birth | | Position held and length of service* | | Principal occupations during past five years or longer | | Current other public company or
investment company
directorships |
| William R. Ebsworth (Born 1957) | | Trustee, since 2015 | | Retired. From 1984 to 2013, equities analyst, portfolio manager, research director and chief investment officer at Fidelity Management and Research Company in Boston, Tokyo, and Hong Kong, and retired in 2013 as Chief Investment Officer of Fidelity Strategic Advisers, Inc. where he led a team of investment professionals managing client assets. Prior thereto, Board member of Hong Kong Securities Clearing Co., Hong Kong Options Clearing Corp., the Thailand International Fund, Ltd., Fidelity Investments Life Insurance Company, and Empire Fidelity Investments Life Insurance Company. Board member of the Forté Foundation (non-profit organization) and the Vincent Memorial Hospital Endowment (non-profit organization), where he serves on the Investment Committee and as Chair of the Audit Committee. Mr. Ebsworth is a CFA® charterholder. | | Asset Allocation Trust |
Jane A. Freeman** (Born 1953) | | Trustee, since 2015; Chair Liaison, effective 2018 | | Retired. From 2012 to 2014 and 1999 to 2008, Chief Financial Officer of Scientific Learning Corporation. From 2008 to 2012, Ms. Freeman provided consulting services related to strategic business projects. Prior to 1999, Portfolio Manager at Rockefeller & Co. and Scudder, Stevens & Clark. Board member of the Harding Loevner Funds from 1996 to 2014, serving as both Lead Independent Director and chair of the Audit Committee. Board member of the Russell Exchange Traded Funds Trust from 2011 to 2012 and the chair of the Audit Committee. Ms. Freeman is a Board Member of Ruth Bancroft Garden (non-profit organization) and an inactive chartered financial analyst. | | Asset Allocation Trust |
Peter G. Gordon*** (Born 1942) | | Trustee, from 1998 to 2017; Chairman, from 2005 to 2017 | | Co-Founder, Retired Chairman, President and CEO of Crystal Geyser Water Company. Trustee Emeritus, Colby College. | | Asset Allocation Trust |
Isaiah Harris, Jr. (Born 1952) | | Trustee, since 2009 | | Retired. Chairman of the Board of CIGNA Corporation since 2009, and Director since 2005. From 2003 to 2011, Director of Deluxe Corporation. Prior thereto, President and CEO of BellSouth Advertising and Publishing Corp. from 2005 to 2007, President and CEO of BellSouth Enterprises from 2004 to 2005 and President of BellSouth Consumer Services from 2000 to 2003. Emeritus member of the Iowa State University Foundation Board of Governors. Emeritus Member of the Advisory Board of Iowa State University School of Business. Advisory Board Member, Palm Harbor Academy (charter school). Advisory Board Member, Child Evangelism Fellowship (non-profit). Mr. Harris is a certified public accountant (inactive status). | | CIGNA Corporation; Asset Allocation Trust |
Judith M. Johnson (Born 1949) | | Trustee, since 2008; Audit Committee Chairman, since 2008 | | Retired. Prior thereto, Chief Executive Officer and Chief Investment Officer of Minneapolis Employees Retirement Fund from 1996 to 2008. Ms. Johnson is an attorney, certified public accountant and a certified managerial accountant. | | Asset Allocation Trust |
David F. Larcker (Born 1950) | | Trustee, since 2009 | | James Irvin Miller Professor of Accounting at the Graduate School of Business, Stanford University, Director of the Corporate Governance Research Initiative and Senior Faculty of The Rock Center for Corporate Governance since 2006. From 2005 to 2008, Professor of Accounting at the Graduate School of Business, Stanford University. Prior thereto, Ernst & Young Professor of Accounting at The Wharton School, University of Pennsylvania from 1985 to 2005. | | Asset Allocation Trust |
| | | | | | |
| Other information (unaudited) | | Wells Fargo Emerging Markets Equity Income Fund | | | 35 | |
| | | | | | |
Name and year of birth | | Position held and length of service* | | Principal occupations during past five years or longer | | Current other public company or
investment company
directorships |
Olivia S. Mitchell**** (Born 1953) | | Trustee, since 2006; Governance Committee Chairman, effective 2018 | | International Foundation of Employee Benefit Plans Professor, Wharton School of the University of Pennsylvania since 1993. Director of Wharton’s Pension Research Council and Boettner Center on Pensions & Retirement Research, and Research Associate at the National Bureau of Economic Research. Previously, Cornell University Professor from 1978 to 1993. | | Asset Allocation Trust |
Timothy J. Penny***** (Born 1951) | | Trustee, since 1996; Chairman, effective 2018; Vice Chairman, from 2017 to 2018 | | President and Chief Executive Officer of Southern Minnesota Initiative Foundation, a non-profit organization, since 2007 and Senior Fellow at the Humphrey Institute Policy Forum at the University of Minnesota since 1995. Member of the Board of Trustees of NorthStar Education Finance, Inc., a non-profit organization, since 2007. | | Asset Allocation Trust |
James G. Polisson****** (Born 1959) | | Trustee, effective 2018; Advisory Board Member, from 2017 to 2018 | | Retired. Chief Marketing Officer, Source (ETF) UK Services, Ltd, from 2015 to 2017. From 2012 to 2015, Principal of The Polisson Group, LLC, a management consulting, corporate advisory and principal investing company. Chief Executive Officer and Managing Director at Russell Investments, Global Exchange Traded Funds from 2010 to 2012. Managing Director of Barclays Global Investors from 1998 to 2010 and Global Chief Marketing Officer for iShares and Barclays Global Investors from 2000 to 2010. Prior thereto, Vice President, Fidelity Retail Mutual Fund Group from 1996 to 1998 and Risk Management Practice Manager, Fidelity Consulting from 1995 to 1996. Board member of the Russell Exchange Traded Fund Trust from 2011 to 2012. Director of Barclays Global Investors Holdings Deutschland GmbH from 2006 to 2009. Mr. Polisson is an attorney and has a retired status with the Massachusetts and District of Columbia Bar Associations. | | Asset Allocation Trust |
Michael S. Scofield (Born 1943) | | Trustee, since 2010 | | Served on the Investment Company Institute’s Board of Governors and Executive Committee from 2008-2011 as well the Governing Council of the Independent Directors Council from 2006-2011 and the Independent Directors Council Executive Committee from 2008-2011. Trustee of the Evergreen Funds complex (and its predecessors) from 1984 to 2010. Chairman of the Evergreen Funds from 2000-2010. Former Trustee of the Mentor Funds. Retired Attorney, Law Offices of Michael S. Scofield. | | Asset Allocation Trust |
| Pamela Wheelock****** (Born 1959) | | Trustee, effective 2018; Advisory Board Member, from 2017 to 2018 | | Chief Operating Officer, Twin Cities Habitat for Humanity, since January, 2017. Vice President of University Services, University of Minnesota from 2012 to 2017. Prior thereto, Interim President and Chief Executive Officer of Blue Cross Blue Shield of Minnesota from 2010 to 2011, Chairman of the Board from 2009 to 2011 and Board Director from 2003 to 2015. Vice President, Leadership and Community Engagement, Bush Foundation, Saint Paul, Minnesota (a private foundation) from 2009 to 2011. Executive Vice President and Chief Financial Officer, Minnesota Sports and Entertainment from 2004 to 2009 and Senior Vice President from 2002 to 2004. Commissioner of Finance, State of Minnesota, from 1999 to 2002. Currently on the Board of Directors, Governance Committee and Finance Committee, for the Minnesota Philanthropy Partners (Saint Paul Foundation) since 2012 and Board Chair of the Minnesota Wild Foundation since 2010. | | Asset Allocation Trust |
| * | Length of service dates reflect the Trustee’s commencement of service with the Trust’s predecessor entities, where applicable. |
| ** | Jane Freeman will become Chair Liaison effective January 1, 2018. |
| *** | Peter Gordon will retire on December 31, 2017. |
| **** | Olivia Mitchell will become Chairman of the Governance Committee effective January 1, 2018. |
| ***** | Timothy Penny will become Chairman effective January 1, 2018. |
| ****** | James Polisson and Pamela Wheelock each will become a Trustee effective January 1, 2018. |
| | | | |
| 36 | | Wells Fargo Emerging Markets Equity Income Fund | | Other information (unaudited) |
Officers
| | | | | | |
Name and year of birth | | Position held and length of service | | Principal occupations during past five years or longer | | |
Andrew Owen (Born 1960) | | President, since 2017 | | Executive Vice President of Wells Fargo & Company and Head of Affiliated Managers, Wells Fargo Asset Management, since 2014. In addition, Mr. Owen is currently President, Chief Executive Officer and Director of Wells Fargo Funds Management, LLC since 2017. Prior thereto, Executive Vice President responsible for marketing, investments and product development for Wells Fargo Funds Management, LLC, from 2009 to 2014. | | |
Jeremy DePalma1 (Born 1974) | | Treasurer, since 2012 | | Senior Vice President of Wells Fargo Funds Management, LLC since 2009. Senior Vice President of Evergreen Investment Management Company, LLC from 2008 to 2010 and head of the Fund Reporting and Control Team within Fund Administration from 2005 to 2010. | | |
| C. David Messman (Born 1960) | | Secretary, since 2000; Chief Legal Officer, since 2003 | | Senior Vice President and Secretary of Wells Fargo Funds Management, LLC since 2001. Assistant General Counsel of Wells Fargo Bank, N.A. since 2013 and Vice President and Managing Counsel of Wells Fargo Bank, N.A. from 1996 to 2013. | | |
Michael H. Whitaker (Born 1967) | | Chief Compliance Officer, since 2016 | | Senior Vice President and Chief Compliance Officer since 2016. Senior Vice President and Chief Compliance Officer for Fidelity Investments from 2007 to 2016. | | |
David Berardi
(Born 1975) | | Assistant Treasurer, since 2009 | | Vice President of Wells Fargo Funds Management, LLC since 2009. Vice President of Evergreen Investment Management Company, LLC from 2008 to 2010. Manager of Fund Reporting and Control for Evergreen Investment Management Company, LLC from 2004 to 2010. | | |
| 1 | Jeremy DePalma acts as Treasurer of 76 funds and Assistant Treasurer of 76 funds in the Fund Complex. |
| 2 | The Statement of Additional Information includes additional information about the Trustees and is available, without charge, upon request, by calling 1-800-222-8222 or by visiting the website at wellsfargofunds.com. |
| | | | | | |
| Other information (unaudited) | | Wells Fargo Emerging Markets Equity Income Fund | | | 37 | |
BOARD CONSIDERATION OF INVESTMENT MANAGEMENT AND SUB-ADVISORY AGREEMENTS:
Under the Investment Company Act of 1940 (the “1940 Act”), the Board of Trustees (the “Board”) of Wells Fargo Funds Trust (the “Trust”) must determine annually whether to approve the continuation of the Trust’s investment management and sub-advisory agreements. In this regard, at an in-person meeting held on May 16-17, 2017 (the “Meeting”), the Board, all the members of which have no direct or indirect interest in the investment management and sub-advisory agreements and are not “interested persons” of the Trust, as defined in the 1940 Act (the “Independent Trustees”), reviewed and approved for Wells Fargo Emerging Markets Equity Income Fund (the “Fund”): (i) an investment management agreement (the “Management Agreement”) with Wells Fargo Funds Management, LLC (“Funds Management”); and (ii) an investment sub-advisory agreement (the “Sub-Advisory Agreement”) with Wells Capital Management Incorporated (the “Sub-Adviser”), an affiliate of Funds Management. The Management Agreement and the Sub-Advisory Agreement are collectively referred to as the “Advisory Agreements.”
At the Meeting, the Board considered the factors and reached the conclusions described below relating to the selection of Funds Management and the Sub-Adviser and the approval of the Advisory Agreements. Prior to the Meeting, including at an in-person meeting in April 2017, the Trustees conferred extensively among themselves and with representatives of Funds Management about these matters. Also, the Board has adopted a team-based approach, with each team consisting of a sub-set of Trustees, to assist the full Board in the discharge of its duties in reviewing performance and other matters throughout the year. The Independent Trustees were assisted in their evaluation of the Advisory Agreements by independent legal counsel, from whom they received separate legal advice and with whom they met separately.
In providing information to the Board, Funds Management and the Sub-Adviser were guided by a detailed set of requests for information submitted to them by independent legal counsel on behalf of the Independent Trustees at the start of the Board’s annual contract renewal process earlier in 2017. In considering and approving the Advisory Agreements, the Trustees considered the information they believed relevant, including but not limited to the information discussed below. The Board considered not only the specific information presented in connection with the Meeting, but also the knowledge gained over time through interaction with Funds Management and the Sub-Adviser about various topics. In this regard, the Board reviewed reports of Funds Management at each of its quarterly meetings, which included, among other things, portfolio reviews and performance reports. In addition, the Board and the teams mentioned above confer with portfolio managers at various times throughout the year. The Board did not identify any particular information or consideration that was all-important or controlling, and each individual Trustee may have attributed different weights to various factors.
After its deliberations, the Board unanimously approved the continuation of the Advisory Agreements for a one-year term and determined that the compensation payable to Funds Management and the Sub-Adviser under each of the Advisory Agreements was reasonable. The Board considered the approval of the Advisory Agreements for the Fund as part of its consideration of agreements for funds across the complex, but its approvals were made on a fund-by-fund basis. The following summarizes a number of important, but not necessarily all, factors considered by the Board in support of its approvals.
Nature, extent and quality of services
The Board received and considered various information regarding the nature, extent and quality of services provided to the Fund by Funds Management and the Sub-Adviser under the Advisory Agreements. This information included a description of the investment advisory services and Fund-level administrative services covered by the Management Agreement, as well as, among other things, a summary of the background and experience of senior management of Funds Management, a summary of certain organizational and personnel changes involving Funds Management and the Sub-Adviser, and a description of Funds Management’s and the Sub-Adviser’s business continuity planning programs and of their approaches to data privacy and cybersecurity. The Board also considered the qualifications, background, tenure and responsibilities of each of the portfolio managers primarily responsible for the day-to-day portfolio management of the Fund.
The Board evaluated the ability of Funds Management and the Sub-Adviser to attract and retain qualified investment professionals, including research, advisory and supervisory personnel. The Board further considered the compliance programs and compliance records of Funds Management and the Sub-Adviser. In addition, the Board took into account the full range of services provided to the Fund by Funds Management and its affiliates.
Fund performance and expenses
The Board considered the performance results for the Fund over various time periods ended December 31, 2016. The Board considered these results in comparison to the performance of funds in a universe that was determined by Broadridge Inc. (“Broadridge”) to be similar to the Fund (the “Universe”), and in comparison to the Fund’s benchmark
| | | | |
| 38 | | Wells Fargo Emerging Markets Equity Income Fund | | Other information (unaudited) |
index and to other comparative data. Broadridge is an independent provider of investment company data. The Board received a description of the methodology used by Broadridge to select the mutual funds in the performance Universe. The Board noted that the performance of the Fund (Administrator Class) was higher than the average performance of the Universe for the three-year period under review, but lower than the average performance of the Universe for the one-year period under review. The Board also noted that the performance of the Fund was higher than its benchmark, the MSCI Emerging Markets Index (Net), for the three-year period under review, but lower than its benchmark for the one-year period under review.
The Board also received and considered information regarding the Fund’s net operating expense ratios and their various components, including actual management fees, custodian and other non-management fees, and Rule 12b-1 and non-Rule 12b-1 shareholder service fees. The Board considered these ratios in comparison to the median ratios of funds in class-specific expense groups that were determined by Broadridge to be similar to the Fund (the “Groups”). The Board received a description of the methodology used by Broadridge to select the mutual funds in the expense Groups and an explanation of how funds comprising expense groups and their expense ratios may vary from year-to-year. Based on the Broadridge reports, the Board noted that the net operating expense ratios of the Fund were equal to or in range of the median net operating expense ratios of expense Groups for all share classes.
The Board took into account the Fund performance and expense information provided to it among the factors considered in deciding to re-approve the Advisory Agreements.
Investment management and sub-advisory fee rates
The Board reviewed and considered the contractual fee rates payable by the Fund to Funds Management under the Management Agreement, as well as the contractual fee rates payable by the Fund to Funds Management for class-level administrative services under a Class-Level Administration Agreement, which include, among other things, class-level transfer agency and sub-transfer agency costs (collectively, the “Management Rates”). The Board also reviewed and considered the contractual investment sub-advisory fee rates that are payable by Funds Management to the Sub-Adviser for investment sub-advisory services.
Among other information reviewed by the Board was a comparison of the Fund’s Management Rates with the average contractual investment management fee rates of funds in the expense Groups at a common asset level as well as transfer agency costs of the funds in the expense Groups. The Board noted that the Management Rates of the Fund were in range of the sum of these average rates for the expense Groups for the Fund’s Class A and Class R6, but higher than the sum of these average rates for the Fund’s Class R, Administrator Class, and Institutional Class. However, the Board noted that the net operating expense ratios of the Fund were equal to or in range of the median net operating expense ratios of expense Groups for all share classes.
The Board also received and considered information about the portion of the total management fee that was retained by Funds Management after payment of the fee to the Sub-Adviser for sub-advisory services. In assessing the reasonableness of this amount, the Board received and evaluated information about the nature and extent of responsibilities retained and risks assumed by Funds Management and not delegated to or assumed by the Sub-Adviser, and about Funds Management’s on-going oversight services. Given the affiliation between Funds Management and the Sub-Adviser, the Board ascribed limited relevance to the allocation of fees between them.
The Board also received and considered information about the nature and extent of services offered and fee rates charged by Funds Management and the Sub-Adviser to other types of clients with investment strategies similar to those of the Fund. In this regard, the Board received information about the significantly greater scope of services, and compliance, reporting and other legal burdens and risks of managing mutual funds compared with those associated with managing assets of non-mutual fund clients such as institutional separate accounts.
Based on its consideration of the factors and information it deemed relevant, including those described here, the Board determined that the compensation payable to Funds Management under the Management Agreement and to the Sub-Adviser under the Sub-Advisory Agreement was reasonable.
Profitability
The Board received and considered information concerning the profitability of Funds Management, as well as the profitability of Wells Fargo as a whole, from providing services to the Fund and the fund family as a whole. The Board also received and considered information concerning the profitability of the Sub-Adviser from providing services to the fund family as a whole, noting that the Sub-Adviser’s profitability information with respect to providing services to the Fund was subsumed in the Wells Fargo and Funds Management profitability analysis.
| | | | | | |
| Other information (unaudited) | | Wells Fargo Emerging Markets Equity Income Fund | | | 39 | |
Funds Management reported on the methodologies and estimates used in calculating profitability, including a description of the methodology used to allocate certain expenses. Among other things, the Board noted that the levels of profitability reported on a fund-by-fund basis varied widely, depending on factors such as the size and type of fund. Based on its review, the Board did not deem the profits reported by Funds Management or Wells Fargo from its services to the Fund to be at a level that would prevent it from approving the continuation of the Advisory Agreements.
Economies of scale
With respect to possible economies of scale, the Board noted the existence of breakpoints in the Fund’s management fee structure, which operate generally to reduce the Fund’s expense ratios as the Fund grows in size. It considered that, for a small fund or a fund that shrinks in size, breakpoints conversely can result in higher fee levels. The Board also considered that in addition to management fee breakpoints, competitive management fee rates set at the outset without regard to breakpoints and fee waiver and expense reimbursement arrangements are means of sharing potential economies of scale with shareholders of the Fund. The Board considered Funds Management’s view, which Funds Management indicated was supported by independent third-party industry studies which were summarized for the Board, that any analyses of potential economies of scale in managing a particular fund are inherently limited in light of the joint and common costs and investments that Funds Management incurs across the fund family as a whole.
The Board concluded that the Fund’s fee and expense arrangements, including contractual breakpoints, constituted a reasonable approach to sharing potential economies of scale with the Fund and its shareholders.
Other benefits to Funds Management and the Sub-Adviser
The Board received and considered information regarding potential “fall-out” or ancillary benefits received by Funds Management and its affiliates, including the Sub-Adviser, as a result of their relationships with the Fund. Ancillary benefits could include, among others, benefits directly attributable to other relationships with the Fund and benefits potentially derived from an increase in Funds Management’s and the Sub-Adviser’s business as a result of their relationships with the Fund. The Board noted that various affiliates of Funds Management may receive distribution-related fees, shareholder servicing payments and sub-transfer agency fees in respect of shares sold or held through them and services provided.
The Board also reviewed information about soft dollar credits earned and utilized by the Sub-Adviser, fees earned by Funds Management and the Sub-Adviser from managing a private investment vehicle for the fund family’s securities lending collateral and commissions earned by an affiliated broker from portfolio transactions.
Based on its consideration of the factors and information it deemed relevant, including those described here, the Board did not find that any ancillary benefits received by Funds Management and its affiliates, including the Sub-Adviser, were unreasonable.
Conclusion
At the Meeting, after considering the above-described factors and based on its deliberations and its evaluation of the information described above, the Board unanimously approved the continuation of the Advisory Agreements for a one-year term and determined that the compensation payable to Funds Management and the Sub-Adviser under each of the Advisory Agreements was reasonable.
| | | | |
| 40 | | Wells Fargo Emerging Markets Equity Income Fund | | List of abbreviations |
The following is a list of common abbreviations for terms and entities that may have appeared in this report.
| ACA | — ACA Financial Guaranty Corporation |
| ADR | — American depositary receipt |
| ADS | — American depositary shares |
| AGC | — Assured Guaranty Corporation |
| AGM | — Assured Guaranty Municipal |
| Ambac | — Ambac Financial Group Incorporated |
| AMT | — Alternative minimum tax |
| BAN | — Bond anticipation notes |
| BHAC | — Berkshire Hathaway Assurance Corporation |
| CAB | — Capital appreciation bond |
| CCAB | — Convertible capital appreciation bond |
| CDA | — Community Development Authority |
| CDO | — Collateralized debt obligation |
| CLO | — Collateralized loan obligation |
| DRIVER | — Derivative inverse tax-exempt receipts |
| DW&P | — Department of Water & Power |
| DWR | — Department of Water Resources |
| ECFA | — Educational & Cultural Facilities Authority |
| EDA | — Economic Development Authority |
| EDFA | — Economic Development Finance Authority |
| ETF | — Exchange-traded fund |
| FDIC | — Federal Deposit Insurance Corporation |
| FFCB | — Federal Farm Credit Banks |
| FGIC | — Financial Guaranty Insurance Corporation |
| FHA | — Federal Housing Administration |
| FHLB | — Federal Home Loan Bank |
| FHLMC | — Federal Home Loan Mortgage Corporation |
| FICO | — The Financing Corporation |
| FNMA | — Federal National Mortgage Association |
| GDR | — Global depositary receipt |
| GNMA | — Government National Mortgage Association |
| HCFR | — Healthcare facilities revenue |
| HEFA | — Health & Educational Facilities Authority |
| HEFAR | — Higher education facilities authority revenue |
| HFA | — Housing Finance Authority |
| HFFA | — Health Facilities Financing Authority |
| HUD | — Department of Housing and Urban Development |
| IDA | — Industrial Development Authority |
| IDAG | — Industrial Development Agency |
| KRW | — Republic of Korea won |
| LIBOR | — London Interbank Offered Rate |
| LIFER | — Long Inverse Floating Exempt Receipts |
| LLC | — Limited liability company |
| LLLP | — Limited liability limited partnership |
| LLP | — Limited liability partnership |
| MBIA | — Municipal Bond Insurance Association |
| MFHR | — Multifamily housing revenue |
| MSTR | — Municipal securities trust receipts |
| MUD | — Municipal Utility District |
| National | — National Public Finance Guarantee Corporation |
| PCFA | — Pollution Control Financing Authority |
| PCL | — Public Company Limited |
| PCR | — Pollution control revenue |
| PFA | — Public Finance Authority |
| PFFA | — Public Facilities Financing Authority |
| PFOTER | — Puttable floating option tax-exempt receipts |
| PJSC | — Public Joint Stock Company |
| plc | — Public limited company |
| PUTTER | — Puttable tax-exempt receipts |
| R&D | — Research & development |
| Radian | — Radian Asset Assurance |
| RAN | — Revenue anticipation notes |
| RDA | — Redevelopment Authority |
| RDFA | — Redevelopment Finance Authority |
| REIT | — Real estate investment trust |
| ROC | — Reset option certificates |
| SAVRS | — Select auction variable rate securities |
| SBA | — Small Business Authority |
| SDR | — Swedish depositary receipt |
| SFHR | — Single-family housing revenue |
| SFMR | — Single-family mortgage revenue |
| SPA | — Standby purchase agreement |
| SPDR | — Standard & Poor’s Depositary Receipts |
| SPEAR | — Short Puttable Exempt Adjustable Receipts |
| STRIPS | — Separate trading of registered interest and |
| TAN | — Tax anticipation notes |
| TIPS | — Treasury inflation-protected securities |
| TRAN | — Tax revenue anticipation notes |
| TTFA | — Transportation Trust Fund Authority |
| TVA | — Tennessee Valley Authority |

For more information
More information about Wells Fargo Funds is available free upon request. To obtain literature, please write, email, visit the Fund’s website, or call:
Wells Fargo Funds
P.O. Box 8266
Boston, MA 02266-8266
Email: fundservice@wellsfargo.com
Website: wellsfargofunds.com
Individual investors: 1-800-222-8222
Retail investment professionals: 1-888-877-9275
Institutional investment professionals: 1-866-765-0778
This report and the financial statements contained herein are submitted for the general information of the shareholders of the Fund. If this report is used for promotional purposes, distribution of the report must be accompanied or preceded by a current prospectus. Before investing, please consider the investment objectives, risks, charges, and expenses of the investment. For a current prospectus and, if available, a summary prospectus, containing this information, call 1-800-222-8222 or visit the Fund’s website at wellsfargofunds.com. Read the prospectus carefully before you invest or send money.
Wells Fargo Asset Management (WFAM) is a trade name used by the asset management businesses of Wells Fargo & Company. Wells Fargo Funds Management, LLC, a wholly owned subsidiary of Wells Fargo & Company, provides investment advisory and administrative services for Wells Fargo Funds. Other affiliates of Wells Fargo & Company provide subadvisory and other services for the funds. The funds are distributed by Wells Fargo Funds Distributor, LLC, Member FINRA, an affiliate of Wells Fargo & Company. Neither Wells Fargo Funds Distributor nor Wells Fargo Funds Management holds fund shareholder accounts or assets. This material is for general informational and educational purposes only and is NOT intended to provide investment advice or a recommendation of any kind—including a recommendation for any specific investment, strategy, or plan.
NOT FDIC INSURED ◾ NO BANK GUARANTEE ◾ MAY LOSE VALUE
© 2017 Wells Fargo Funds Management, LLC. All rights reserved.
| | |
 | | 307201 12-17 A262/AR262 10-17 |
Annual Report
October 31, 2017

Wells Fargo Global Small Cap Fund
(formerly known as Wells Fargo Global Opportunities Fund)


Reduce clutter. Save trees.
Sign up for electronic delivery of prospectuses and shareholder reports at wellsfargo.com/advantagedelivery
Contents
The views expressed and any forward-looking statements are as of October 31, 2017, unless otherwise noted, and are those of the Fund managers and/or Wells Fargo Funds Management, LLC. Discussions of individual securities, or the markets generally, or any Wells Fargo Fund are not intended as individual recommendations. Future events or results may vary significantly from those expressed in any forward-looking statements. The views expressed are subject to change at any time in response to changing circumstances in the market. Wells Fargo Funds Management, LLC and the Fund disclaim any obligation to publicly update or revise any views expressed or forward-looking statements.
NOT FDIC INSURED ◾ NO BANK GUARANTEE ◾ MAY LOSE VALUE
| | | | |
| 2 | | Wells Fargo Global Small Cap Fund | | Letter to shareholders (unaudited) |

Andrew Owen
President
Wells Fargo Funds
Global stocks generally delivered double-digit results; bond markets had smaller but positive results as well.
Dear Shareholder:
We are pleased to offer you this annual report for the Wells Fargo Global Small Cap Fund for the 12-month period that ended October 31, 2017. Effective April 1, 2017, the Fund changed its name from Wells Fargo Global Opportunities Fund to Wells Fargo Global Small Cap Fund. Global stocks generally delivered double-digit results; bond markets had smaller but positive results as well. U.S. and international stocks performed similarly overall with returns of 23.63% and 23.64%, respectively, for the 12-month period, as measured by the S&P 500 Index1 and the MSCI ACWI ex USA Index (Net),2 respectively. Within fixed income, the Bloomberg Barclays U.S. Aggregate Bond Index3 returned 0.90% and the Bloomberg Barclays Municipal Bond Index4 returned 2.19% as interest rates rose from low levels.
Election results and central banks’ policies commanded investor attention as 2016 closed.
During the last two months of 2016, investors appeared intent on the prospective outcomes of elections in the U.S. and central-bank actions globally. Following Donald Trump’s election victory in November, U.S. stocks rallied. Investors appeared optimistic that the new administration would pursue progrowth policies. Favorable economic news supported stocks, and interest rates moved higher. At their mid-December meeting, U.S. Federal Reserve (Fed) officials raised the target interest rate by a quarter percentage point to a range of 0.50% to 0.75%. The fourth quarter also saw the implementation of the U.S. Securities and Exchange Commission’s amended rule for money market funds, which included the possibility of liquidity fees and redemption gates and, for institutional prime and municipal money market funds, floating net asset values (NAVs). Outside of the U.S., the prospects for faster U.S. growth appeared to trigger some acceleration in Europe.
Financial markets gained during the first two quarters of 2017 on positive economic data.
Stocks rallied globally through the first quarter of 2017, supported by signs of improvement in the U.S. and global economies. In the U.S., hiring remained strong, and business and consumer sentiment improved. In March, Fed officials raised their target interest rate by a quarter percentage point to a range of 0.75% to 1.00%. With the Fed’s target interest-rate increase, short-term bond yields rose during the quarter. Meanwhile, longer-term Treasury yields were little changed, leading to positive performance. Investment-grade and high-yield bonds benefited from strong demand. Municipal bond returns were positive in the quarter, helped by strong demand and constrained new-issue supply. Outside the U.S., stocks in emerging markets generally outperformed stocks in the U.S. and international developed markets because they benefited from both global economic growth and recent weakening of the U.S. dollar. Stocks in Asia, Europe, and Latin America also outperformed the U.S. market during the quarter.
| 1 | The S&P 500 Index consists of 500 stocks chosen for market size, liquidity, and industry group representation. It is a market-value-weighted index with each stock’s weight in the index proportionate to its market value. You cannot invest directly in an index. |
| 2 | The Morgan Stanley Capital International (MSCI) All Country World Index (ACWI) ex USA Index (Net) is a free-float-adjusted market-capitalization-weighted index that is designed to measure the equity market performance of developed markets, excluding the United States and Canada. Source: MSCI. MSCI makes no express or implied warranties or representations and shall have no liability whatsoever with respect to any MSCI data contained herein. The MSCI data may not be further redistributed or used as a basis for other indexes or any securities or financial products. This report is not approved, reviewed, or produced by MSCI. You cannot invest directly in an index. |
| 3 | The Bloomberg Barclays U.S. Aggregate Bond Index is a broad-based benchmark that measures the investment-grade, U.S. dollar-denominated, fixed-rate taxable bond market, including Treasuries, government-related and corporate securities, mortgage-backed securities (agency fixed-rate and hybrid adjustable-rate mortgage pass-throughs), asset-backed securities, and commercial mortgage-backed securities. You cannot invest directly in an index. |
| 4 | The Bloomberg Barclays Municipal Bond Index is an unmanaged index composed of long-term tax-exempt bonds with a minimum credit rating of Baa. You cannot invest directly in an index. |
| | | | | | |
| Letter to shareholders (unaudited) | | Wells Fargo Global Small Cap Fund | | | 3 | |
Globally, stocks marked continued gains through the second quarter of 2017. Steady, albeit modest, economic growth both in the U.S. and abroad and generally favorable corporate earnings announcements supported higher valuations. U.S. inflation trended lower despite a continued decline in the unemployment rate. Ten-year U.S. Treasury yields declined, resulting in stronger prices for long-term bonds. As was widely expected, Fed officials raised the target interest rate in June by a quarter percentage point to a range of 1.00% to 1.25%. In addition, the Fed indicated that it planned to start selling bonds that accumulated on its balance sheet during quantitative easing programs conducted since 2008.
As global growth improved in the third quarter of 2017, financial markets generally advanced.
Most stock markets worldwide moved higher during the quarter and ended the period at or near all-time highs. Moderate acceleration in global economic growth was supported by improving corporate earnings, low inflation pressure, and still-low interest rates. Corporate earnings reports were favorable overall as companies continued to benefit from healthy operating leverage. Global commodity prices climbed during the quarter. Oil prices rebounded, partly due to a better balance between supply and demand. While North Korea’s recent missile launches and nuclear testing raised serious concerns around the world, the heightened geopolitical risk had relatively minimal impact on the quarter’s stock returns. In the U.S., economic data released during the quarter reflected a generally healthy economy. Second-quarter economic output grew at a 3.1% annual rate, and consumers displayed more willingness to spend. Meanwhile, the Fed maintained the target range for the federal funds rate at 1.00% to 1.25%, noting that inflation had remained below the Fed’s 2.00% objective. Reflecting continued confidence in the U.S. economy, the Fed also stated the possibility of one more 0.25% increase in the federal funds rate by the end of 2017 and announced plans to begin the process of unwinding its $4.5 trillion portfolio of bonds and other assets in October. Outside the U.S., stocks in the Asia Pacific region benefited from solid earnings reports and investors’ willingness to take on risk despite the rising tensions between North Korea and the U.S. In Europe, markets were supported by better-than-expected economic growth, which has led to narrowing of the gap between Europe’s growth rate and that of the U.S. In emerging markets, many countries benefited from stronger currencies versus the U.S. dollar. Also, commodity prices were on an upward trajectory, which benefited many companies that rely on natural resources for exports.
Positive economic and market news continued into October.
October proved to be a strong month for U.S. stocks. The S&P 500 Index delivered 11 record closes amid rising consumer confidence and signs the economy was continuing to gain momentum, including news in late October that economic output was estimated to have grown at a 3.0% annual rate in the third quarter. At its October meeting, the Fed, in a unanimous vote, left short-term interest rates unchanged but signaled it could make another rate increase before the end of 2017 if the economy remains on track. The Fed also began the process of unwinding its quantitative easing program. Outside the U.S., international stocks generally delivered positive results in October as global economic growth continued to strengthen.
| | | | |
| 4 | | Wells Fargo Global Small Cap Fund | | Letter to shareholders (unaudited) |
Don’t let short-term uncertainty derail long-term investment goals.
Periods of investment uncertainty can present challenges, but experience has taught us that maintaining long-term investment goals can be an effective way to plan for the future. To help you create a sound strategy based on your personal goals and risk tolerance, Wells Fargo Funds offers more than 100 mutual funds spanning a wide range of asset classes and investment styles. Although diversification cannot guarantee an investment profit or prevent losses, we believe it can be an effective way to manage investment risk and potentially smooth out overall portfolio performance. We encourage investors to know their investments and to understand that appropriate levels of risk-taking may unlock opportunities.
Thank you for choosing to invest with Wells Fargo Funds. We appreciate your confidence in us and remain committed to helping you meet your financial needs.
Sincerely,

Andrew Owen
President
Wells Fargo Funds
Although diversification cannot guarantee an investment profit or prevent losses, we believe it can be an effective way to manage investment risk and potentially smooth out overall portfolio performance.
For further information about your Fund, contact your investment professional, visit our website at wellsfargofunds.com, or call us directly at 1-800-222-8222. We are available 24 hours a day, 7 days a week.
This page is intentionally left blank.
| | | | |
| 6 | | Wells Fargo Global Small Cap Fund | | Performance highlights (unaudited) |
Investment objective
The Fund seeks long-term capital appreciation.
Manager
Wells Fargo Funds Management, LLC
Subadviser
Wells Capital Management Incorporated
Portfolio managers
Oleg Makhorine
Robert Rifkin, CFA®
James M. Tringas, CFA®, CPA
Bryant VanCronkhite, CFA®, CPA
Average annual total returns (%) as of October 31, 20171
| | | | | | | | | | | | | | | | | | | | | | | | | | | | | | | | | | |
| | | | | Including sales charge | | | Excluding sales charge | | | Expense ratios2 (%) | |
| | | Inception date | | 1 year | | | 5 year | | | 10 year | | | 1 year | | | 5 year | | | 10 year | | | Gross | | | Net3 | |
| Class A (EKGAX) | | 3-16-1988 | | | 19.60 | | | | 11.99 | | | | 4.52 | | | | 26.90 | | | | 13.32 | | | | 5.14 | | | | 1.56 | | | | 1.56 | |
| Class C (EKGCX) | | 2-1-1993 | | | 24.95 | | | | 12.48 | | | | 4.35 | | | | 25.95 | | | | 12.48 | | | | 4.35 | | | | 2.31 | | | | 2.31 | |
| Administrator Class (EKGYX) | | 1-13-1997 | | | – | | | | – | | | | – | | | | 27.04 | | | | 13.49 | | | | 5.33 | | | | 1.48 | | | | 1.41 | |
| Institutional Class (EKGIX) | | 7-30-2010 | | | – | | | | – | | | | – | | | | 27.38 | | | | 13.78 | | | | 5.53 | | | | 1.23 | | | | 1.16 | |
| S&P Developed SmallCap Index4 | | – | | | – | | | | – | | | | – | | | | 25.95 | | | | 13.56 | | | | 5.73 | | | | – | | | | – | |
Figures quoted represent past performance, which is no guarantee of future results, and do not reflect taxes that a shareholder may pay on fund distributions or the redemption of fund shares. Investment return and principal value of an investment will fluctuate so that an investor’s shares, when redeemed, may be worth more or less than their original cost. Performance shown without sales charges would be lower if sales charges were reflected. Current performance may be lower or higher than the performance data quoted, which assumes the reinvestment of dividends and capital gains. Current month-end performance is available on the Fund’s website, wellsfargofunds.com.
Please keep in mind that high double-digit returns were primarily achieved during favorable market conditions. You should not expect that such favorable returns can be consistently achieved. A fund’s performance, especially for short time periods, should not be the sole factor in making your investment decision.
Index returns do not include transaction costs associated with buying and selling securities, any mutual fund fees or expenses, or any taxes. It is not possible to invest directly in an index.
For Class A shares, the maximum front-end sales charge is 5.75%. For Class C shares, the maximum contingent deferred sales charge is 1.00%. Performance including a contingent deferred sales charge assumes the sales charge for the corresponding time period. Administrator Class and Institutional Class shares are sold without a front-end sales charge or contingent deferred sales charge.
Stock values fluctuate in response to the activities of individual companies and general market and economic conditions. Foreign investments are especially volatile and can rise or fall dramatically due to differences in the political and economic conditions of the host country. These risks are generally intensified in emerging markets. The use of derivatives may reduce returns and/or increase volatility. Certain investment strategies tend to increase the total risk of an investment (relative to the broader market). The Fund is exposed to geographic risk and smaller-company securities risk. Consult the Fund’s prospectus for additional information on these and other risks.
Please see footnotes on page 7.
| | | | | | |
| Performance highlights (unaudited) | | Wells Fargo Global Small Cap Fund | | | 7 | |
|
| Growth of $10,000 investment as of October 31, 20175 |
|
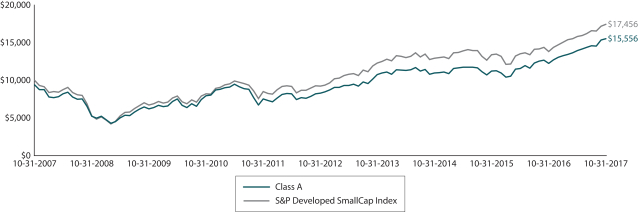 |
| 1 | Historical performance shown for Institutional Class shares prior to their inception reflects the performance of Administrator Class shares, and includes the higher expenses applicable to Administrator Class shares. If these expenses had not been included, returns for Institutional Class shares would be higher. Historical performance shown for all classes of the Fund prior to July 19, 2010, is based on the performance of the Fund’s predecessor, Evergreen Global Opportunities Fund. |
| 2 | Reflects the expense ratios as stated in the most recent prospectuses, which include the impact of 0.01% in acquired fund fees and expenses. The expense ratios shown are subject to change and may differ from the annualized expense ratios shown in the financial highlights of this report, which do not include acquired fund fees and expenses. |
| 3 | The manager has contractually committed through February 28, 2018, to waive fees and/or reimburse expenses to the extent necessary to cap the Fund’s Total Annual Operating Expenses After Fee Waivers at 1.55% for Class A, 2.30% for Class C, 1.40% for Administrator Class, and 1.15% for Institutional Class. After this time, the cap may be increased or the commitment to maintain the cap may be terminated only with the approval of the Board of Trustees. Brokerage commissions, stamp duty fees, interest, taxes, acquired fund fees and expenses, and extraordinary expenses are excluded from the expense cap. Without this cap, the Fund’s returns would have been lower. The expense ratio paid by an investor is the net expense ratio or the Fund’s Total Annual Fund Operating Expenses After Fee Waivers, as stated in the prospectuses. |
| 4 | The S&P Developed SmallCap Index is a free-float-adjusted market-capitalization-weighted index designed to measure the equity market performance of small-capitalization companies located in developed markets. The index is composed of companies within the bottom 15% of the cumulative market capitalization in developed markets. The index covers all publicly listed equities with float-adjusted market values of U.S. $100 million or more and annual dollar value traded of at least U.S. $50 million in all included countries. You cannot invest directly in an index. |
| 5 | The chart compares the performance of Class A shares for the most recent ten years with the S&P Developed SmallCap Index. The chart assumes a hypothetical investment of $10,000 in Class A shares and reflects all operating expenses and assumes the maximum initial sales charge of 5.75%. |
| 6 | The ten largest holdings, excluding cash and cash equivalents, are calculated based on the value of the investments divided by total net assets of the Fund. Holdings are subject to change and may have changed since the date specified. |
| 7 | Amounts are calculated based on the total long-term investments of the Fund. These amounts are subject to change and may have changed since the date specified. |
| | | | |
| 8 | | Wells Fargo Global Small Cap Fund | | Performance highlights (unaudited) |
MANAGER’S DISCUSSION
Fund highlights
| ∎ | | The Fund outperformed its benchmark, the S&P Developed SmallCap Index, for the 12-month period that ended October 31, 2017. |
| ∎ | | Stock selection in the information technology (IT), consumer discretionary, and industrials sectors contributed to relative performance. |
| ∎ | | These gains were partly offset by an overweight to the consumer staples sector and stock selection in the health care sector. |
| ∎ | | Geographically, security selection in the U.S., Europe, and the U.K. were all positive contributors. |
| ∎ | | The Fund’s cash position negatively affected relative performance. |
The 25.95% return of the S&P Developed SmallCap Index over the period was a reflection of solid global economic growth across geographies and a belief that newly elected governments in the U.S. and several European nations would advance probusiness agendas. Energy was the weakest sector as investors showed a lack of confidence in global oil prices.
As our process dictates, security selection drove the Fund’s outperformance. As bottom-up investors, we evaluate how these global macroeconomic events might affect the Fund’s holdings but we do not derive our security selection from macroeconomic bets. We aim to use market volatility opportunistically, and we will seek to use any future volatility to the advantage of our bottom-up stock-selection process.
| | | | |
| Ten largest holdings (%) as of October 31, 20176 | |
Nomad Foods Limited | | | 2.04 | |
Novanta Incorporated | | | 1.92 | |
Denny’s Corporation | | | 1.80 | |
CSW Industrials Incorporated | | | 1.75 | |
WD-40 Company | | | 1.68 | |
Aeon Delight Company Limited | | | 1.60 | |
Douglas Dynamics Incorporated | | | 1.59 | |
Belden Incorporated | | | 1.54 | |
Gerresheimer AG | | | 1.52 | |
Westwood Holdings Group Incorporated | | | 1.51 | |
Stock selection in IT, consumer discretionary, and industrials contributed to relative performance.
In the IT sector, Novanta Incorporated contributed to performance. Novanta is a U.S.-based manufacturer of photonic and motion control components. We were attracted to its strategy to diversify into the higher margin and more stable medical end markets via strategic capital redeployment. This strategy has been rewarded via strong financial performance and expansion of stock-price multiples.
In the consumer discretionary sector, Great Canadian Gaming Corporation was a significant contributor to performance. The company is the largest casino operator in Canada. We are attracted to Great Canadian’s strong
operating history and its under-leveraged balance sheet that we believe has ample opportunity to deploy capital. The company was part of a partnership that was awarded the GTA Gaming Bundle by Ontario Lottery and Gaming Corporation, expanding Great Canadian’s portfolio of casinos. With three more Ontario bundles still to be awarded, we see further opportunity for Great Canadian to deploy capital that could result in further upside from current levels.
Within the industrials sector, Korn/Ferry International, a U.S.-based provider of talent management solutions worldwide, contributed to performance. Our initial investment thesis was based on the breadth and scale of Korn/Ferry’s services, strong employer and candidate relationships, and a flexible balance sheet. The company reported upbeat results throughout the year, which it attributed partly to its late-2015 acquisition of Hay Group. Our analysis suggested that the acquisition would increase the company’s global scale and help mitigate cyclical concerns associated with the executive search business, all of which proved to be beneficial for the stock’s performance.
An overweight to the consumer staples sector detracted from relative performance. Although the sector was up over 11%, that result lagged the broader index’s 25.95% return. Equity investors preferred the more cyclical sectors in a very strong year for global small-cap stocks.
Please see footnotes on page 7.
| | | | | | |
| Performance highlights (unaudited) | | Wells Fargo Global Small Cap Fund | | | 9 | |
Stock selection within the health care sector detracted from relative performance. Ireland-based biopharmaceutical company Horizon Pharma plc detracted from performance. The company’s disappointing results were driven by weakness in its primary care business and an unfavorable mix of higher rebates and lower product volumes. We were attracted to steps the company had taken to transform itself into an orphan drug company through key acquisitions; however, poor execution in the company’s primary care business left it with significantly less financial flexibility than desired. As a result, we chose to exit our position.
Given the strong market returns, the Fund’s cash position negatively affected relative performance. The Fund attempts to always be fully invested, but the cash needed for daily liquidity acted as a drag on performance during the year.
|
| Sector distribution as of October 31, 20177 |
|
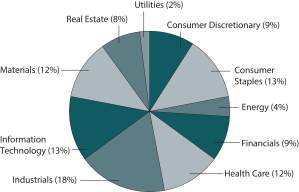 |
|
| Country allocation as of October 31, 20177 |
|
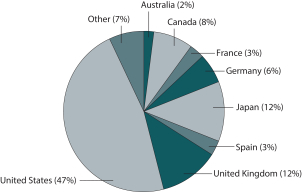 |
Our investment philosophy focuses on company-specific factors rather than on headline-dominating macroeconomic events.
As we look toward the end of 2017 and beyond, we see numerous market forces at play that could bring higher volatility, which reached historical lows during the 12-month period that ended October 31, 2017. Equity valuations continue to move higher across geographies and at times can become dislocated from individual company fundamentals. Another question facing investors over the next 6 to 12 months is about the potential effects of reductions in stimulus measures among European and U.S. central banks. We are not experts in forecasting macro or political events; however, we believe it always is prudent to protect downside risks.
We believe our fundamental analysis, risk management, and active investment process are well-suited to take advantage of new opportunities as the equity market evolves. While volatility may increase, the strong balance sheets and stable cash flow of the companies in our portfolio should support consistent long-term performance.
Please see footnotes on page 7.
| | | | |
| 10 | | Wells Fargo Global Small Cap Fund | | Fund expenses (unaudited) |
As a shareholder of the Fund, you incur two types of costs: (1) transaction costs, including sales charges (loads) on purchase payments and contingent deferred sales charges (if any) on redemptions and (2) ongoing costs, including management fees, distribution (12b-1) and/or shareholder servicing fees, and other Fund expenses. This example is intended to help you understand your ongoing costs (in dollars) of investing in the Fund and to compare these costs with the ongoing costs of investing in other mutual funds.
The example is based on an investment of $1,000 invested at the beginning of the six-month period and held for the entire period from May 1, 2017 to October 31, 2017.
Actual expenses
The “Actual” line of the table below provides information about actual account values and actual expenses. You may use the information in this line, together with the amount you invested, to estimate the expenses that you paid over the period. Simply divide your account value by $1,000 (for example, an $8,600 account value divided by $1,000 = 8.6), then multiply the result by the number in the “Actual” line under the heading entitled “Expenses paid during period” for your applicable class of shares to estimate the expenses you paid on your account during this period.
Hypothetical example for comparison purposes
The “Hypothetical” line of the table below provides information about hypothetical account values and hypothetical expenses based on the Fund’s actual expense ratio and an assumed rate of return of 5% per year before expenses, which is not the Fund’s actual return. The hypothetical account values and expenses may not be used to estimate the actual ending account balance or expenses you paid for the period. You may use this information to compare the ongoing costs of investing in the Fund and other funds. To do so, compare this 5% hypothetical example with the 5% hypothetical examples that appear in the shareholder reports of the other funds.
Please note that the expenses shown in the table are meant to highlight your ongoing costs only and do not reflect any transactional costs, such as sales charges (loads) and contingent deferred sales charges. Therefore, the “Hypothetical” line of the table is useful in comparing ongoing costs only and will not help you determine the relative total costs of owning different funds. In addition, if these transactional costs were included, your costs would have been higher.
| | | | | | | | | | | | | | | | |
| | | Beginning
account value
5-1-2017 | | | Ending
account value
10-31-2017 | | | Expenses
paid during
the period¹ | | | Annualized net
expense ratio | |
Class A | | | | | | | | | | | | | | | | |
Actual | | $ | 1,000.00 | | | $ | 1,111.89 | | | $ | 8.16 | | | | 1.53 | % |
Hypothetical (5% return before expenses) | | $ | 1,000.00 | | | $ | 1,017.47 | | | $ | 7.80 | | | | 1.53 | % |
Class C | | | | | | | | | | | | | | | | |
Actual | | $ | 1,000.00 | | | $ | 1,107.64 | | | $ | 12.13 | | | | 2.28 | % |
Hypothetical (5% return before expenses) | | $ | 1,000.00 | | | $ | 1,013.70 | | | $ | 11.59 | | | | 2.28 | % |
Administrator Class | | | | | | | | | | | | | | | | |
Actual | | $ | 1,000.00 | | | $ | 1,112.46 | | | $ | 7.45 | | | | 1.40 | % |
Hypothetical (5% return before expenses) | | $ | 1,000.00 | | | $ | 1,018.15 | | | $ | 7.12 | | | | 1.40 | % |
Institutional Class | | | | | | | | | | | | | | | | |
Actual | | $ | 1,000.00 | | | $ | 1,114.02 | | | $ | 6.13 | | | | 1.15 | % |
Hypothetical (5% return before expenses) | | $ | 1,000.00 | | | $ | 1,019.41 | | | $ | 5.85 | | | | 1.15 | % |
| 1 | Expenses paid is equal to the annualized net expense ratio of each class multiplied by the average account value over the period, multiplied by the number of days in the most recent fiscal half-year divided by the number of days in the fiscal year (to reflect the one-half-year period). |
| | | | | | |
| Portfolio of investments—October 31, 2017 | | Wells Fargo Global Small Cap Fund | | | 11 | |
| | | | | | | | | | | | | | | | |
| Security name | | | | | | | | Shares | | | Value | |
| | | | |
Common Stocks: 93.13% | | | | | | | | | | | | | | | | |
| | | | |
| Australia: 2.01% | | | | | | | | | | | | | | | | |
Ansell Limited (Health Care, Health Care Equipment & Supplies) | | | | | | | | | | | 180,609 | | | $ | 3,317,498 | |
Domino’s Pizza Enterprises Limited (Consumer Discretionary, Hotels, Restaurants & Leisure) « | | | | | | | | | | | 34,188 | | | | 1,219,064 | |
Inghams Group Limited (Consumer Staples, Food Products) « | | | | | | | | | | | 247,416 | | | | 672,227 | |
| | | | |
| | | | | | | | | | | | | | | 5,208,789 | |
| | | | | | | | | | | | | | | | |
| | | | |
| Austria: 0.57% | | | | | | | | | | | | | | | | |
Mayr-Melnhof Karton AG (Materials, Containers & Packaging) | | | | | | | | | | | 10,231 | | | | 1,486,122 | |
| | | | | | | | | | | | | | | | |
| | | | |
| Canada: 7.89% | | | | | | | | | | | | | | | | |
Colliers International Group (Real Estate, Real Estate Management & Development) | | | | | | | | | | | 28,553 | | | | 1,673,430 | |
Cott Corporation (Consumer Staples, Beverages) | | | | | | | | | | | 145,935 | | | | 2,187,724 | |
Great Canadian Gaming Corporation (Consumer Discretionary, Hotels, Restaurants & Leisure) † | | | | | | | | | | | 77,622 | | | | 1,844,733 | |
Intertape Polymer Group Incorporated (Materials, Containers & Packaging) | | | | | | | | | | | 76,000 | | | | 1,121,649 | |
Maple Leaf Foods Incorporated (Consumer Staples, Food Products) | | | | | | | | | | | 65,725 | | | | 1,704,642 | |
MTY Food Group Incorporated (Consumer Discretionary, Hotels, Restaurants & Leisure) | | | | | | | | | | | 50,294 | | | | 1,985,484 | |
Mullen Group Limited (Energy, Energy Equipment & Services) | | | | | | | | | | | 118,591 | | | | 1,556,271 | |
Novanta Incorporated (Information Technology, Electronic Equipment, Instruments & Components) † | | | | | | | | | | | 105,005 | | | | 4,966,737 | |
Parex Resources Incorporated (Energy, Oil, Gas & Consumable Fuels) † | | | | | | | | | | | 96,736 | | | | 1,286,714 | |
Source Energy Services Limited (Energy, Energy Equipment & Services) † | | | | | | | | | | | 125,000 | | | | 838,113 | |
Western Forest Products Incorporated (Materials, Paper & Forest Products) | | | | | | | | | | | 612,717 | | | | 1,244,337 | |
| | | | |
| | | | | | | | | | | | | | | 20,409,834 | |
| | | | | | | | | | | | | | | | |
| | | | |
| Finland: 0.63% | | | | | | | | | | | | | | | | |
Metsa Board OYJ (Materials, Paper & Forest Products) | | | | | | | | | | | 221,157 | | | | 1,641,005 | |
| | | | | | | | | | | | | | | | |
| | | | |
| France: 2.42% | | | | | | | | | | | | | | | | |
ALTEN SA (Information Technology, IT Services) | | | | | | | | | | | 30,325 | | | | 2,654,603 | |
M6 Metropole Television SA (Consumer Discretionary, Media) | | | | | | | | | | | 95,389 | | | | 2,205,610 | |
Vicat SA (Materials, Construction Materials) | | | | | | | | | | | 18,014 | | | | 1,393,521 | |
| | | | |
| | | | | | | | | | | | | | | 6,253,734 | |
| | | | | | | | | | | | | | | | |
| | | | |
| Germany: 5.80% | | | | | | | | | | | | | | | | |
Cancom SE (Information Technology, IT Services) | | | | | | | | | | | 21,140 | | | | 1,559,250 | |
Gerresheimer AG (Health Care, Life Sciences Tools & Services) | | | | | | | | | | | 49,388 | | | | 3,925,819 | |
Krones AG (Industrials, Machinery) | | | | | | | | | | | 12,478 | | | | 1,577,773 | |
Nemetschek SE (Information Technology, Software) | | | | | | | | | | | 18,484 | | | | 1,649,927 | |
SMA Solar Technology AG (Information Technology, Semiconductors & Semiconductor Equipment) « | | | | | | | | | | | 37,302 | | | | 1,729,141 | |
TAG Immobilien AG (Real Estate, Real Estate Management & Development) | | | | | | | | | | | 137,371 | | | | 2,362,644 | |
TLG Immobilien AG (Real Estate, Real Estate Management & Development) | | | | | | | | | | | 95,108 | | | | 2,201,328 | |
| | | | |
| | | | | | | | | | | | | | | 15,005,882 | |
| | | | | | | | | | | | | | | | |
| | | | |
| Hong Kong: 1.03% | | | | | | | | | | | | | | | | |
Sunlight REIT (Real Estate, Equity REITs) | | | | | | | | | | | 3,949,000 | | | | 2,677,751 | |
| | | | | | | | | | | | | | | | |
| | | | |
| Ireland: 0.05% | | | | | | | | | | | | | | | | |
Greencore Group plc (Consumer Staples, Food Products) | | | | | | | | | | | 47,566 | | | | 121,801 | |
| | | | | | | | | | | | | | | | |
The accompanying notes are an integral part of these financial statements.
| | | | |
| 12 | | Wells Fargo Global Small Cap Fund | | Portfolio of investments—October 31, 2017 |
| | | | | | | | | | | | | | | | |
| Security name | | | | | | | | Shares | | | Value | |
| | | | |
| Israel: 0.72% | | | | | | | | | | | | | | | | |
Orbotech Limited (Information Technology, Electronic Equipment, Instruments & Components) † | | | | | | | | | | | 41,476 | | | $ | 1,854,807 | |
| | | | | | | | | | | | | | | | |
| | | | |
| Japan: 10.95% | | | | | | | | | | | | | | | | |
Aeon Delight Company Limited (Industrials, Commercial Services & Supplies) | | | | | | | | | | | 111,400 | | | | 4,144,250 | |
DTS Corporation (Information Technology, IT Services) | | | | | | | | | | | 91,400 | | | | 2,729,018 | |
Ezaki Glico Company Limited (Consumer Staples, Food Products) | | | | | | | | | | | 34,400 | | | | 1,902,959 | |
Fuji Seal International Incorporated (Materials, Containers & Packaging) | | | | | | | | | | | 50,400 | | | | 1,646,682 | |
Meitec Corporation (Industrials, Professional Services) | | | | | | | | | | | 59,400 | | | | 2,888,897 | |
Musashi Seimitsu Industry Company Limited (Consumer Discretionary, Auto Components) | | | | | | | | | | | 37,600 | | | | 1,188,796 | |
Nihon Parkerizing Company Limited (Materials, Chemicals) | | | | | | | | | | | 170,100 | | | | 2,763,069 | |
ORIX JREIT Incorporated (Real Estate, Equity REITs) | | | | | | | | | | | 2,577 | | | | 3,537,837 | |
OSG Corporation (Industrials, Machinery) « | | | | | | | | | | | 60,400 | | | | 1,300,376 | |
San-A Company Limited (Consumer Staples, Food & Staples Retailing) | | | | | | | | | | | 37,700 | | | | 1,727,426 | |
Ship Healthcare Holdings Incorporated (Health Care, Health Care Providers & Services) | | | | | | | | | | | 52,100 | | | | 1,619,748 | |
Sumitomo Warehouse Company Limited (Industrials, Transportation Infrastructure) | | | | | | | | | | | 202,000 | | | | 1,378,585 | |
Taikisha Limited (Industrials, Construction & Engineering) | | | | | | | | | | | 51,500 | | | | 1,490,128 | |
| | | | |
| | | | | | | | | | | | | | | 28,317,771 | |
| | | | | | | | | | | | | | | | |
| | | | |
| Netherlands: 0.43% | | | | | | | | | | | | | | | | |
Frank’s International NV (Energy, Energy Equipment & Services) « | | | | | | | | | | | 169,100 | | | | 1,117,751 | |
| | | | | | | | | | | | | | | | |
| | | | |
| Norway: 0.61% | | | | | | | | | | | | | | | | |
SpareBank 1 SMN (Financials, Banks) | | | | | | | | | | | 152,925 | | | | 1,586,728 | |
| | | | | | | | | | | | | | | | |
| | | | |
| Spain: 2.77% | | | | | | | | | | | | | | | | |
Almirall SA (Health Care, Pharmaceuticals) « | | | | | | | | | | | 123,533 | | | | 1,195,787 | |
Merlin Properties Socimi SA (Real Estate, Equity REITs) | | | | | | | | | | | 159,945 | | | | 2,110,913 | |
Prosegur Compania de Seguridad SA (Industrials, Commercial Services & Supplies) | | | | | | | | | | | 184,827 | | | | 1,410,186 | |
Viscofan SA (Consumer Staples, Food Products) | | | | | | | | | | | 40,261 | | | | 2,437,758 | |
| | | | |
| | | | | | | | | | | | | | | 7,154,644 | |
| | | | | | | | | | | | | | | | |
| | | | |
| Sweden: 0.91% | | | | | | | | | | | | | | | | |
Hexpol AB (Materials, Chemicals) | | | | | | | | | | | 130,395 | | | | 1,319,269 | |
Rezidor Hotel Group AB (Consumer Discretionary, Hotels, Restaurants & Leisure) | | | | | | | | | | | 286,112 | | | | 1,025,289 | |
| | | | |
| | | | | | | | | | | | | | | 2,344,558 | |
| | | | | | | | | | | | | | | | |
| | | | |
| Switzerland: 0.78% | | | | | | | | | | | | | | | | |
Bucher Industries AG (Industrials, Machinery) | | | | | | | | | | | 3,611 | | | | 1,413,417 | |
OC Oerlikon Corporation AG (Information Technology, Electronic Equipment, Instruments & Components) | | | | | | | | | | | 37,940 | | | | 608,470 | |
| | | | |
| | | | | | | | | | | | | | | 2,021,887 | |
| | | | | | | | | | | | | | | | |
| | | | |
| United Kingdom: 11.33% | | | | | | | | | | | | | | | | |
Bovis Homes Group plc (Consumer Discretionary, Household Durables) | | | | | | | | | | | 94,712 | | | | 1,479,311 | |
Britvic plc (Consumer Staples, Beverages) | | | | | | | | | | | 261,789 | | | | 2,632,052 | |
Consort Medical plc (Health Care, Health Care Equipment & Supplies) | | | | | | | | | | | 45,055 | | | | 664,222 | |
Domino’s Pizza Group plc (Consumer Discretionary, Hotels, Restaurants & Leisure) | | | | | | | | | | | 552,574 | | | | 2,463,706 | |
Elementis plc (Materials, Chemicals) | | | | | | | | | | | 478,366 | | | | 1,806,277 | |
Hikma Pharmaceuticals plc (Health Care, Pharmaceuticals) « | | | | | | | | | | | 54,646 | | | | 844,809 | |
Hunting plc (Energy, Energy Equipment & Services) † | | | | | | | | | | | 199,757 | | | | 1,388,884 | |
The accompanying notes are an integral part of these financial statements.
| | | | | | |
| Portfolio of investments—October 31, 2017 | | Wells Fargo Global Small Cap Fund | | | 13 | |
| | | | | | | | | | | | | | | | |
| Security name | | | | | | | | Shares | | | Value | |
| | | | |
| United Kingdom (continued) | | | | | | | | | | | | | | | | |
Jupiter Fund Management plc (Financials, Capital Markets) | | | | | | | | | | | 215,564 | | | $ | 1,702,061 | |
Lancashire Holdings Limited (Financials, Insurance) | | | | | | | | | | | 248,808 | | | | 2,483,364 | |
Mears Group plc (Industrials, Commercial Services & Supplies) | | | | | | | | | | | 259,794 | | | | 1,563,918 | |
NCC Group plc (Information Technology, IT Services) « | | | | | | | | | | | 895,060 | | | | 2,734,180 | |
Nomad Foods Limited (Consumer Staples, Food Products) † | | | | | | | | | | | 349,924 | | | | 5,283,852 | |
OM Asset Management plc (Financials, Capital Markets) | | | | | | | | | | | 138,500 | | | | 2,116,280 | |
Playtech plc (Information Technology, Software) | | | | | | | | | | | 35,543 | | | | 464,511 | |
Savills plc (Real Estate, Real Estate Management & Development) | | | | | | | | | | | 136,225 | | | | 1,688,051 | |
| | | | |
| | | | | | | | | | | | | | | 29,315,478 | |
| | | | | | | | | | | | | | | | |
| | | | |
| United States: 44.23% | | | | | | | | | | | | | | | | |
ACI Worldwide Incorporated (Information Technology, Software) † | | | | | | | | | | | 154,200 | | | | 3,713,136 | |
ALLETE Incorporated (Utilities, Electric Utilities) | | | | | | | | | | | 26,400 | | | | 2,068,440 | |
AMN Healthcare Services Incorporated (Health Care, Health Care Providers & Services) † | | | | | | | | | | | 67,100 | | | | 2,945,690 | |
Analogic Corporation (Health Care, Health Care Equipment & Supplies) | | | | | | | | | | | 35,654 | | | | 2,863,016 | |
AptarGroup Incorporated (Materials, Containers & Packaging) | | | | | | | | | | | 43,500 | | | | 3,787,545 | |
Aspen Insurance Holdings Limited (Financials, Insurance) | | | | | | | | | | | 75,800 | | | | 3,251,820 | |
Atkore International Incorporated (Industrials, Electrical Equipment) † | | | | | | | | | | | 68,500 | | | | 1,322,735 | |
Belden Incorporated (Information Technology, Electronic Equipment, Instruments & Components) | | | | | | | | | | | 49,700 | | | | 3,971,527 | |
Berkshire Hills Bancorp Incorporated (Financials, Banks) | | | | | | | | | | | 80,838 | | | | 3,096,095 | |
Cambrex Corporation (Health Care, Life Sciences Tools & Services) † | | | | | | | | | | | 36,700 | | | | 1,587,275 | |
Casey’s General Stores Incorporated (Consumer Staples, Food & Staples Retailing) | | | | | | | | | | | 22,300 | | | | 2,554,911 | |
Compass Minerals International Incorporated (Materials, Metals & Mining) « | | | | | | | | | | | 51,400 | | | | 3,371,840 | |
CSW Industrials Incorporated (Industrials, Building Products) † | | | | | | | | | | | 92,500 | | | | 4,537,125 | |
Denny’s Corporation (Consumer Discretionary, Hotels, Restaurants & Leisure) † | | | | | | | | | | | 356,800 | | | | 4,663,376 | |
Douglas Dynamics Incorporated (Industrials, Machinery) | | | | | | | | | | | 98,042 | | | | 4,112,862 | |
Forward Air Corporation (Industrials, Air Freight & Logistics) | | | | | | | | | | | 63,000 | | | | 3,618,720 | |
GCP Applied Technologies Incorporated (Materials, Chemicals) † | | | | | | | | | | | 102,675 | | | | 3,003,244 | |
Gibraltar Industries Incorporated (Industrials, Building Products) † | | | | | | | | | | | 70,200 | | | | 2,334,150 | |
Haemonetics Corporation (Health Care, Health Care Equipment & Supplies) † | | | | | | | | | | | 82,176 | | | | 3,908,291 | |
Helen of Troy Limited (Consumer Discretionary, Household Durables) † | | | | | | | | | | | 40,400 | | | | 3,753,160 | |
Horace Mann Educators Corporation (Financials, Insurance) | | | | | | | | | | | 49,400 | | | | 2,163,720 | |
Hostess Brands Incorporated (Consumer Staples, Food Products) † | | | | | | | | | | | 184,800 | | | | 2,130,744 | |
Innoviva Incorporated (Health Care, Pharmaceuticals) Ǡ | | | | | | | | | | | 241,608 | | | | 2,957,282 | |
Invacare Corporation (Health Care, Health Care Equipment & Supplies) « | | | | | | | | | | | 57,500 | | | | 891,250 | |
Keane Group Incorporated (Energy, Energy Equipment & Services) Ǡ | | | | | | | | | | | 91,474 | | | | 1,412,359 | |
KMG Chemicals Incorporated (Materials, Chemicals) | | | | | | | | | | | 42,823 | | | | 2,360,832 | |
Korn/Ferry International (Industrials, Professional Services) | | | | | | | | | | | 81,600 | | | | 3,413,328 | |
Manhattan Associates Incorporated (Information Technology, Software) † | | | | | | | | | | | 35,100 | | | | 1,469,286 | |
MGE Energy Incorporated (Utilities, Electric Utilities) | | | | | | | | | | | 24,900 | | | | 1,644,645 | |
NCR Corporation (Information Technology, Technology Hardware, Storage & Peripherals) † | | | | | | | | | | | 60,800 | | | | 1,951,072 | |
Prestige Brands Holdings Incorporated (Health Care, Pharmaceuticals) † | | | | | | | | | | | 42,000 | | | | 1,969,800 | |
Quanex Building Products Corporation (Industrials, Building Products) | | | | | | | | | | | 162,008 | | | | 3,556,076 | |
Ryder System Incorporated (Industrials, Road & Rail) | | | | | | | | | | | 22,000 | | | | 1,783,760 | |
Schweitzer-Mauduit International Incorporated (Materials, Paper & Forest Products) | | | | | | | | | | | 54,018 | | | | 2,281,180 | |
Smart Sand Incorporated (Energy, Energy Equipment & Services) Ǡ | | | | | | | | | | | 66,000 | | | | 474,540 | |
South Jersey Industries Incorporated (Utilities, Gas Utilities) | | | | | | | | | | | 51,100 | | | | 1,735,867 | |
Spectrum Brands Holdings Incorporated (Consumer Staples, Household Products) « | | | | | | | | | | | 21,000 | | | | 2,308,320 | |
Thermon Group Holdings Incorporated (Industrials, Electrical Equipment) † | | | | | | | | | | | 99,000 | | | | 2,129,490 | |
The accompanying notes are an integral part of these financial statements.
| | | | |
| 14 | | Wells Fargo Global Small Cap Fund | | Portfolio of investments—October 31, 2017 |
| | | | | | | | | | | | | | | | |
| Security name | | | | | | | | Shares | | | Value | |
| | | | |
| United States (continued) | | | | | | | | | | | | | | | | |
TreeHouse Foods Incorporated (Consumer Staples, Food Products) † | | | | | | | | | | | 29,200 | | | $ | 1,938,296 | |
WD-40 Company (Consumer Staples, Household Products) | | | | | | | | | | | 39,200 | | | | 4,345,320 | |
Weingarten Realty Investors (Real Estate, Equity REITs) | | | | | | | | | | | 57,300 | | | | 1,744,785 | |
Westwood Holdings Group Incorporated (Financials, Capital Markets) | | | | | | | | | | | 60,350 | | | | 3,916,715 | |
WPX Energy Incorporated (Energy, Oil, Gas & Consumable Fuels) † | | | | | | | | | | | 122,900 | | | | 1,386,312 | |
| | | | |
| | | | | | | | | | | | | | | 114,429,937 | |
| | | | | | | | | | | | | | | | |
| | | | |
Total Common Stocks (Cost $193,497,286) | | | | | | | | | | | | | | | 240,948,479 | |
| | | | | | | | | | | | | | | | |
| | | | |
| | | Yield | | | | | | | | | | |
| Short-Term Investments: 13.19% | | | | | | | | | | | | | | | | |
| | | | |
| Investment Companies: 13.19% | | | | | | | | | | | | | | | | |
Securities Lending Cash Investment LLC (l)(r)(u) | | | 1.26 | % | | | | | | | 17,584,369 | | | | 17,586,128 | |
Wells Fargo Government Money Market Fund Select Class (l)(u) | | | 0.96 | | | | | | | | 16,552,450 | | | | 16,552,450 | |
| | | | |
Total Short-Term Investments (Cost $34,138,578) | | | | | | | | | | | | | | | 34,138,578 | |
| | | | | | | | | | | | | | | | |
| | | | | | | | |
| Total investments in securities (Cost $227,635,864) | | | 106.32 | % | | | 275,087,057 | |
Other assets and liabilities, net | | | (6.32 | ) | | | (16,358,004 | ) |
| | | | | | | | |
| Total net assets | | | 100.00 | % | | $ | 258,729,054 | |
| | | | | | | | |
| « | All or a portion of this security is on loan. |
| † | Non-income-earning security |
| (l) | The issuer of the security is an affiliated person of the Fund as defined in the Investment Company Act of 1940. |
| (r) | The investment is a non-registered investment company purchased with cash collateral received from securities on loan. |
| (u) | The rate represents the 7-day annualized yield at period end. |
Investments in Affiliates
An affiliated investment is an investment in which the Fund owns at least 5% of the outstanding voting shares of the issuer or as a result of other relationships, such as the Fund and the issuer having the same investment manager. Transactions with issuers that were either affiliated persons of the Fund at the beginning of the period or the end of the period were as follows:
| | | | | | | | | | | | | | | | | | | | | | | | | | | | | | | | | | | | |
| | | Shares,
beginning of
period | | | Shares
purchased | | | Shares
sold | | | Shares,
end of
period | | | Net
realized
gains
(losses) | | | Net
change in
unrealized
gains
(losses) | | | Income
from
affiliated
securities | | | Value,
end
of period | | | % of
net
assets | |
Short-Term Invesstments | | | | | | | | | | | | | | | | | | | | | | | | | | | | | | | | | | | | |
Investment companies | | | | | | | | | | | | | | | | | | | | | | | | | | | | | | | | | | | | |
Securities Lending Cash Investment LLC | | | 10,081,201 | | | | 138,721,407 | | | | 131,218,239 | | | | 17,584,369 | | | $ | 0 | | | $ | (790 | ) | | $ | 345,631 | | | $ | 17,586,128 | | | | | |
Wells Fargo Government Money Market Fund Select Class | | | 11,290,784 | | | | 122,431,947 | | | | 117,170,281 | | | | 16,552,450 | | | | 0 | | | | 0 | | | | 75,202 | | | | 16,552,450 | | | | | |
| | | | | | | | | | | | | | | | | | | | | | | | | | | | | | | | | | | | |
| | | | | | | | | | | | | | | | | | $ | 0 | | | $ | (790 | ) | | $ | 420,833 | | | $ | 34,138,578 | | | | 13.19 | % |
| | | | | | | | | | | | | | | | | | | | | | | | | | | | | | | | | | | | |
The accompanying notes are an integral part of these financial statements.
| | | | | | |
| Statement of assets and liabilities—October 31, 2017 | | Wells Fargo Global Small Cap Fund | | | 15 | |
| | | | |
| | | | |
| |
Assets | | | | |
Investments in unaffiliated securities (including $17,050,001 of securities loaned), at value (cost $193,497,286) | | $ | 240,948,479 | |
Investments in affiliated securities, at value (cost $34,138,578) | | | 34,138,578 | |
Foreign currency, at value (cost $178,027) | | | 179,519 | |
Receivable for investments sold | | | 856,369 | |
Receivable for Fund shares sold | | | 2,150,381 | |
Receivable for dividends | | | 299,569 | |
Receivable for securities lending income | | | 32,950 | |
Prepaid expenses and other assets | | | 91,427 | |
| | | | |
Total assets | | | 278,697,272 | |
| | | | |
| |
Liabilities | | | | |
Payable upon receipt of securities loaned | | | 17,584,992 | |
Payable for investments purchased | | | 1,301,438 | |
Payable for Fund shares redeemed | | | 677,128 | |
Management fee payable | | | 205,680 | |
Administration fees payable | | | 41,139 | |
Distribution fees payable | | | 20,086 | |
Accrued expenses and other liabilities | | | 137,755 | |
| | | | |
Total liabilities | | | 19,968,218 | |
| | | | |
Total net assets | | $ | 258,729,054 | |
| | | | |
| |
NET ASSETS CONSIST OF | | | | |
Paid-in capital | | $ | 183,021,949 | |
Undistributed net investment income | | | 1,427,489 | |
Accumulated net realized gains on investments | | | 26,829,811 | |
Net unrealized gains on investments | | | 47,449,805 | |
| | | | |
Total net assets | | $ | 258,729,054 | |
| | | | |
| |
COMPUTATION OF NET ASSET VALUE AND OFFERING PRICE PER SHARE | | | | |
Net assets – Class A | | $ | 155,828,169 | |
Shares outstanding – Class A1 | | | 3,401,764 | |
Net asset value per share – Class A | | | $45.81 | |
Maximum offering price per share – Class A2 | | | $48.60 | |
Net assets – Class C | | $ | 31,486,637 | |
Shares outstanding – Class C1 | | | 935,749 | |
Net asset value per share – Class C | | | $33.65 | |
Net assets – Administrator Class | | $ | 30,327,295 | |
Shares outstanding – Administrator Class1 | | | 634,686 | |
Net asset value per share – Administrator Class | | | $47.78 | |
Net assets – Institutional Class | | $ | 41,086,953 | |
Shares outstanding – Institutional Class1 | | | 861,723 | |
Net asset value per share – Institutional Class | | | $47.68 | |
| 1 | The Fund has an unlimited number of authorized shares. |
| 2 | Maximum offering price is computed as 100/94.25 of net asset value. On investments of $50,000 or more, the offering price is reduced. |
The accompanying notes are an integral part of these financial statements.
| | | | |
| 16 | | Wells Fargo Global Small Cap Fund | | Statement of operations—year ended October 31, 2017 |
| | | | |
| | | | |
| |
Investment income | | | | |
Dividends (net of foreign withholding taxes of $207,338) | | $ | 4,562,777 | |
Securities lending income from affiliates, net | | | 345,631 | |
Income from affiliated securities | | | 75,202 | |
| | | | |
Total investment income | | | 4,983,610 | |
| | | | |
| |
Expenses | | | | |
Management fee | | | 2,281,465 | |
Administration fees | |
Class A | | | 307,073 | |
Class B | | | 796 | 1 |
Class C | | | 68,867 | |
Administrator Class | | | 36,763 | |
Institutional Class | | | 42,221 | |
Shareholder servicing fees | |
Class A | | | 365,563 | |
Class B | | | 947 | 1 |
Class C | | | 81,984 | |
Administrator Class | | | 70,240 | |
Distribution fees | |
Class B | | | 2,841 | 1 |
Class C | | | 245,954 | |
Custody and accounting fees | | | 90,971 | |
Professional fees | | | 71,431 | |
Registration fees | | | 63,703 | |
Shareholder report expenses | | | 45,939 | |
Trustees’ fees and expenses | | | 19,823 | |
Other fees and expenses | | | 18,688 | |
| | | | |
Total expenses | | | 3,815,269 | |
Less: Fee waivers and/or expense reimbursements | | | (38,625 | ) |
| | | | |
Net expenses | | | 3,776,644 | |
| | | | |
Net investment income | | | 1,206,966 | |
| | | | |
| |
REALIZED AND UNREALIZED GAINS (LOSSES) ON INVESTMENTS | | | | |
|
Net realized gains (losses) on: | |
Unaffiliated securities | | | 28,955,130 | |
Forward foreign currency contract transactions | | | (2,014 | ) |
| | | | |
Net realized gains on investments | | | 28,953,116 | |
| | | | |
|
Net change in unrealized gains (losses) on: | |
Unaffiliated securities | | | 26,444,423 | |
Affiiliated securities | | | (790 | ) |
| | | | |
Net change in unrealized gains (losses) on investments | | | 26,443,633 | |
| | | | |
Net realized and unrealized gains (losses) on investments | | | 55,396,749 | |
| | | | |
Net increase in net assets resulting from operations | | $ | 56,603,715 | |
| | | | |
| 1 | For the period from November 1, 2016 to May 5, 2017. Effective at the close of business on May 5, 2017, Class B shares were converted to Class A shares and are no longer offered by the Fund. |
The accompanying notes are an integral part of these financial statements.
| | | | | | |
| Statement of changes in net assets | | Wells Fargo Global Small Cap Fund | | | 17 | |
| | | | | | | | | | | | | | | | |
| | | Year ended
October 31, 2017 | | | Year ended
October 31, 2016 | |
| | | |
Operations | | | | | | | | | | | | |
Net investment income | | | | | | $ | 1,206,966 | | | | | | | $ | 1,424,127 | |
Net realized gains on investments | | | | | | | 28,953,116 | | | | | | | | 14,082,086 | |
Net change in unrealized gains (losses) on investments | | | | | | | 26,443,633 | | | | | | | | 2,225,625 | |
| | | | |
Net increase in net assets resulting from operations | | | | | | | 56,603,715 | | | | | | | | 17,731,838 | |
| | | | |
| | | | |
Distributions to shareholders from | | | | | | | | | | | | | | | | |
Net investment income | | | | | | | | | | | | | | | | |
Class A | | | | | | | (1,253,803 | ) | | | | | | | (886,928 | ) |
Class C | | | | | | | (83,983 | ) | | | | | | | 0 | |
Administrator Class | | | | | | | (242,326 | ) | | | | | | | (231,280 | ) |
Institutional Class | | | | | | | (251,541 | ) | | | | | | | (115,938 | ) |
Net realized gains | | | | | | | | | | | | | | | | |
Class A | | | | | | | (8,370,890 | ) | | | | | | | (6,414,005 | ) |
Class B | | | | | | | (64,415 | )1 | | | | | | | (179,734 | ) |
Class C | | | | | | | (2,630,739 | ) | | | | | | | (1,977,317 | ) |
Administrator Class | | | | | | | (1,441,791 | ) | | | | | | | (1,289,238 | ) |
Institutional Class | | | | | | | (1,098,674 | ) | | | | | | | (426,341 | ) |
| | | | |
Total distributions to shareholders | | | | | | | (15,438,162 | ) | | | | | | | (11,520,781 | ) |
| | | | |
| | | | |
Capital share transactions | | | Shares | | | | | | | | Shares | | | | | |
Proceeds from shares sold | | | | | | | | | | | | | | | | |
Class A | | | 498,285 | | | | 20,496,273 | | | | 287,344 | | | | 10,463,647 | |
Class B | | | 0 | 1 | | | 0 | 1 | | | 67 | | | | 1,865 | |
Class C | | | 85,049 | | | | 2,534,837 | | | | 44,683 | | | | 1,201,168 | |
Administrator Class | | | 169,243 | | | | 7,216,769 | | | | 164,556 | | | | 6,297,087 | |
Institutional Class | | | 864,023 | | | | 36,105,981 | | | | 146,823 | | | | 5,639,061 | |
| | | | |
| | | | | | | 66,353,860 | | | | | | | | 23,602,828 | |
| | | | |
Reinvestment of distributions | | | | | | | | | | | | | | | | |
Class A | | | 229,395 | | | | 8,959,763 | | | | 196,310 | | | | 6,790,837 | |
Class B | | | 2,242 | 1 | | | 64,035 | 1 | | | 6,892 | | | | 177,539 | |
Class C | | | 79,166 | | | | 2,276,848 | | | | 63,376 | | | | 1,643,340 | |
Administrator Class | | | 39,320 | | | | 1,601,354 | | | | 41,455 | | | | 1,492,072 | |
Institutional Class | | | 30,428 | | | | 1,235,167 | | | | 11,643 | | | | 418,957 | |
| | | | |
| | | | | | | 14,137,167 | | | | | | | | 10,522,745 | |
| | | | |
Payment for shares redeemed | | | | | | | | | | | | | | | | |
Class A | | | (921,309 | ) | | | (37,540,409 | ) | | | (963,819 | ) | | | (34,320,655 | ) |
Class B | | | (33,102 | )1 | | | (985,857 | )1 | | | (125,178 | ) | | | (3,309,009 | ) |
Class C | | | (362,621 | ) | | | (11,022,329 | ) | | | (249,405 | ) | | | (6,823,638 | ) |
Administrator Class | | | (341,822 | ) | | | (14,495,540 | ) | | | (259,890 | ) | | | (9,801,894 | ) |
Institutional Class | | | (345,420 | ) | | | (14,803,205 | ) | | | (114,180 | ) | | | (4,457,864 | ) |
| | | | |
| | | | | | | (78,847,340 | ) | | | | | | | (58,713,060 | ) |
| | | | |
Net increase (decrease) in net assets resulting from capital share transactions | | | | | | | 1,643,687 | | | | | | | | (24,587,487 | ) |
| | | | |
Total increase (decrease) in net assets | | | | | | | 42,809,240 | | | | | | | | (18,376,430 | ) |
| | | | |
| | | | |
Net assets | | | | | | | | | | | | | | | | |
Beginning of period | | | | | | | 215,919,814 | | | | | | | | 234,296,244 | |
| | | | |
End of period | | | | | | $ | 258,729,054 | | | | | | | $ | 215,919,814 | |
| | | | |
Undistributed net investment income | | | | | | $ | 1,427,489 | | | | | | | $ | 1,823,994 | |
| | | | |
| 1 | For the period from November 1, 2016 to May 5, 2017. Effective at the close of business on May 5, 2017, Class B shares were converted to Class A shares and are no longer offered by the Fund. |
The accompanying notes are an integral part of these financial statements.
| | | | |
| 18 | | Wells Fargo Global Small Cap Fund | | Financial highlights |
(For a share outstanding throughout each period)
| | | | | | | | | | | | | | | | | | | | |
| | | Year ended October 31 | |
| CLASS A | | 2017 | | | 2016 | | | 2015 | | | 2014 | | | 2013 | |
Net asset value, beginning of period | | | $38.61 | | | | $37.23 | | | | $43.26 | | | | $42.68 | | | | $33.17 | |
Net investment income | | | 0.21 | 1 | | | 0.26 | 1 | | | 0.10 | 1 | | | 0.03 | 1 | | | 0.16 | 1 |
Net realized and unrealized gains (losses) on investments | | | 9.68 | | | | 2.92 | | | | 0.64 | | | | 0.86 | | | | 9.58 | |
| | | | | | | | | | | | | | | | | | | | |
Total from investment operations | | | 9.89 | | | | 3.18 | | | | 0.74 | | | | 0.89 | | | | 9.74 | |
Distributions to shareholders from | | | | | | | | | | | | | | | | | | | | |
Net investment income | | | (0.34 | ) | | | (0.21 | ) | | | (0.03 | ) | | | (0.31 | ) | | | (0.23 | ) |
Net realized gains | | | (2.35 | ) | | | (1.59 | ) | | | (6.74 | ) | | | 0.00 | | | | 0.00 | |
| | | | | | | | | | | | | | | | | | | | |
Total distributions to shareholders | | | (2.69 | ) | | | (1.80 | ) | | | (6.77 | ) | | | (0.31 | ) | | | (0.23 | ) |
Net asset value, end of period | | | $45.81 | | | | $38.61 | | | | $37.23 | | | | $43.26 | | | | $42.68 | |
Total return2 | | | 26.90 | % | | | 9.12 | % | | | 2.12 | % | | | 2.07 | % | | | 29.50 | % |
Ratios to average net assets (annualized) | | | | | | | | | | | | | | | | | | | | |
Gross expenses | | | 1.54 | % | | | 1.55 | % | | | 1.57 | % | | | 1.57 | % | | | 1.59 | % |
Net expenses | | | 1.54 | % | | | 1.55 | % | | | 1.55 | % | | | 1.55 | % | | | 1.55 | % |
Net investment income | | | 0.52 | % | | | 0.73 | % | | | 0.27 | % | | | 0.06 | % | | | 0.43 | % |
Supplemental data | | | | | | | | | | | | | | | | | | | | |
Portfolio turnover rate | | | 70 | % | | | 70 | % | | | 42 | % | | | 66 | % | | | 59 | % |
Net assets, end of period (000s omitted) | | | $155,828 | | | | $138,805 | | | | $151,740 | | | | $167,166 | | | | $181,764 | |
| 1 | Calculated based upon average shares outstanding |
| 2 | Total return calculations do not include any sales charges. |
The accompanying notes are an integral part of these financial statements.
| | | | | | |
| Financial highlights | | Wells Fargo Global Small Cap Fund | | | 19 | |
(For a share outstanding throughout each period)
| | | | | | | | | | | | | | | | | | | | |
| | | Year ended October 31 | |
| CLASS C | | 2017 | | | 2016 | | | 2015 | | | 2014 | | | 2013 | |
Net asset value, beginning of period | | | $28.98 | | | | $28.39 | | | | $34.80 | | | | $34.36 | | | | $26.73 | |
Net investment loss | | | (0.06 | )1 | | | (0.01 | )1 | | | (0.14 | )1 | | | (0.24 | )1 | | | (0.09 | )1 |
Net realized and unrealized gains (losses) on investments | | | 7.15 | | | | 2.19 | | | | 0.47 | | | | 0.69 | | | | 7.72 | |
| | | | | | | | | | | | | | | | | | | | |
Total from investment operations | | | 7.09 | | | | 2.18 | | | | 0.33 | | | | 0.45 | | | | 7.63 | |
Distributions to shareholders from | | | | | | | | | | | | | | | | | | | | |
Net investment income | | | (0.07 | ) | | | 0.00 | | | | 0.00 | | | | (0.01 | ) | | | 0.00 | |
Net realized gains | | | (2.35 | ) | | | (1.59 | ) | | | (6.74 | ) | | | 0.00 | | | | 0.00 | |
| | | | | | | | | | | | | | | | | | | | |
Total distributions to shareholders | | | (2.42 | ) | | | (1.59 | ) | | | (6.74 | ) | | | (0.01 | ) | | | 0.00 | |
Net asset value, end of period | | | $33.65 | | | | $28.98 | | | | $28.39 | | | | $34.80 | | | | $34.36 | |
Total return2 | | | 25.95 | % | | | 8.31 | % | | | 1.34 | % | | | 1.32 | % | | | 28.54 | % |
Ratios to average net assets (annualized) | | | | | | | | | | | | | | | | | | | | |
Gross expenses | | | 2.29 | % | | | 2.30 | % | | | 2.32 | % | | | 2.32 | % | | | 2.34 | % |
Net expenses | | | 2.29 | % | | | 2.30 | % | | | 2.30 | % | | | 2.30 | % | | | 2.30 | % |
Net investment loss | | | (0.20 | )% | | | (0.02 | )% | | | (0.48 | )% | | | (0.69 | )% | | | (0.31 | )% |
Supplemental data | | | | | | | | | | | | | | | | | | | | |
Portfolio turnover rate | | | 70 | % | | | 70 | % | | | 42 | % | | | 66 | % | | | 59 | % |
Net assets, end of period (000s omitted) | | | $31,487 | | | | $32,863 | | | | $36,215 | | | | $41,792 | | | | $44,618 | |
| 1 | Calculated based upon average shares outstanding |
| 2 | Total return calculations do not include any sales charges. |
The accompanying notes are an integral part of these financial statements.
| | | | |
| 20 | | Wells Fargo Global Small Cap Fund | | Financial highlights |
(For a share outstanding throughout each period)
| | | | | | | | | | | | | | | | | | | | |
| | | Year ended October 31 | |
| ADMINISTRATOR CLASS | | 2017 | | | 2016 | | | 2015 | | | 2014 | | | 2013 | |
Net asset value, beginning of period | | | $40.15 | | | | $38.65 | | | | $44.60 | | | | $44.00 | | | | $34.21 | |
Net investment income | | | 0.29 | 1 | | | 0.41 | | | | 0.16 | 1 | | | 0.09 | | | | 0.22 | 1 |
Net realized and unrealized gains (losses) on investments | | | 10.07 | | | | 2.95 | | | | 0.66 | | | | 0.90 | | | | 9.86 | |
| | | | | | | | | | | | | | | | | | | | |
Total from investment operations | | | 10.36 | | | | 3.36 | | | | 0.82 | | | | 0.99 | | | | 10.08 | |
Distributions to shareholders from | | | | | | | | | | | | | | | | | | | | |
Net investment income | | | (0.38 | ) | | | (0.27 | ) | | | (0.03 | ) | | | (0.39 | ) | | | (0.29 | ) |
Net realized gains | | | (2.35 | ) | | | (1.59 | ) | | | (6.74 | ) | | | 0.00 | | | | 0.00 | |
| | | | | | | | | | | | | | | | | | | | |
Total distributions to shareholders | | | (2.73 | ) | | | (1.86 | ) | | | (6.77 | ) | | | (0.39 | ) | | | (0.29 | ) |
Net asset value, end of period | | | $47.78 | | | | $40.15 | | | | $38.65 | | | | $44.60 | | | | $44.00 | |
Total return | | | 27.04 | % | | | 9.30 | % | | | 2.27 | % | | | 2.22 | % | | | 29.73 | % |
Ratios to average net assets (annualized) | | | | | | | | | | | | | | | | | | | | |
Gross expenses | | | 1.46 | % | | | 1.47 | % | | | 1.43 | % | | | 1.41 | % | | | 1.42 | % |
Net expenses | | | 1.40 | % | | | 1.40 | % | | | 1.40 | % | | | 1.40 | % | | | 1.40 | % |
Net investment income | | | 0.68 | % | | | 0.90 | % | | | 0.41 | % | | | 0.22 | % | | | 0.58 | % |
Supplemental data | | | | | | | | | | | | | | | | | | | | |
Portfolio turnover rate | | | 70 | % | | | 70 | % | | | 42 | % | | | 66 | % | | | 59 | % |
Net assets, end of period (000s omitted) | | | $30,327 | | | | $30,832 | | | | $31,765 | | | | $53,966 | | | | $52,461 | |
| 1 | Calculated based upon average shares outstanding |
The accompanying notes are an integral part of these financial statements.
| | | | | | |
| Financial highlights | | Wells Fargo Global Small Cap Fund | | | 21 | |
(For a share outstanding throughout each period)
| | | | | | | | | | | | | | | | | | | | |
| | | Year ended October 31 | |
| INSTITUTIONAL CLASS | | 2017 | | | 2016 | | | 2015 | | | 2014 | | | 2013 | |
Net asset value, beginning of period | | | $40.08 | | | | $38.63 | | | | $44.67 | | | | $44.05 | | | | $34.25 | |
Net investment income | | | 0.38 | | | | 0.45 | | | | 0.20 | | | | 0.15 | | | | 0.32 | 1 |
Net realized and unrealized gains (losses) on investments | | | 10.06 | | | | 3.00 | | | | 0.72 | | | | 0.96 | | | | 9.86 | |
| | | | | | | | | | | | | | | | | | | | |
Total from investment operations | | | 10.44 | | | | 3.45 | | | | 0.92 | | | | 1.11 | | | | 10.18 | |
Distributions to shareholders from | | | | | | | | | | | | | | | | | | | | |
Net investment income | | | (0.49 | ) | | | (0.41 | ) | | | (0.22 | ) | | | (0.49 | ) | | | (0.38 | ) |
Net realized gains | | | (2.35 | ) | | | (1.59 | ) | | | (6.74 | ) | | | 0.00 | | | | 0.00 | |
| | | | | | | | | | | | | | | | | | | | |
Total distributions to shareholders | | | (2.84 | ) | | | (2.00 | ) | | | (6.96 | ) | | | (0.49 | ) | | | (0.38 | ) |
Net asset value, end of period | | | $47.68 | | | | $40.08 | | | | $38.63 | | | | $44.67 | | | | $44.05 | |
Total return | | | 27.38 | % | | | 9.56 | % | | | 2.53 | % | | | 2.48 | % | | | 30.06 | % |
Ratios to average net assets (annualized) | | | | | | | | | | | | | | | | | | | | |
Gross expenses | | | 1.21 | % | | | 1.22 | % | | | 1.18 | % | | | 1.14 | % | | | 1.16 | % |
Net expenses | | | 1.15 | % | | | 1.15 | % | | | 1.15 | % | | | 1.14 | % | | | 1.15 | % |
Net investment income | | | 1.01 | % | | | 1.20 | % | | | 0.66 | % | | | 0.47 | % | | | 0.83 | % |
Supplemental data | | | | | | | | | | | | | | | | | | | | |
Portfolio turnover rate | | | 70 | % | | | 70 | % | | | 42 | % | | | 66 | % | | | 59 | % |
Net assets, end of period (000s omitted) | | | $41,087 | | | | $12,531 | | | | $10,369 | | | | $5,284 | | | | $2,151 | |
| 1 | Calculated based upon average shares outstanding |
The accompanying notes are an integral part of these financial statements.
| | | | |
| 22 | | Wells Fargo Global Small Cap Fund | | Notes to financial statements |
1. ORGANIZATION
Wells Fargo Funds Trust (the “Trust”), a Delaware statutory trust organized on March 10, 1999, is an open-end management investment company registered under the Investment Company Act of 1940, as amended (the “1940 Act”). As an investment company, the Trust follows the accounting and reporting guidance in Financial Accounting Standards Board Accounting Standards Codification Topic 946, Financial Services – Investment Companies. These financial statements report on the Wells Fargo Global Small Cap Fund (formerly, Wells Fargo Global Opportunities Fund) (the “Fund”) which is a diversified series of the Trust.
Effective at the close of business on May 5, 2017, Class B shares were converted to Class A shares and are no longer offered by the Fund. Information for Class B shares reflected in the financial statements represents activity through May 5, 2017.
2. SIGNIFICANT ACCOUNTING POLICIES
The following significant accounting policies, which are consistently followed in the preparation of the financial statements of the Fund, are in conformity with U.S. generally accepted accounting principles which require management to make estimates and assumptions that affect the reported amounts of assets and liabilities, disclosure of contingent assets and liabilities at the date of the financial statements, and the reported amounts of revenues and expenses during the reporting period. Actual results could differ from those estimates.
Securities valuation
All investments are valued each business day as of the close of regular trading on the New York Stock Exchange (generally 4 p.m. Eastern Time), although the Fund may deviate from this calculation time under unusual or unexpected circumstances.
Equity securities that are listed on a foreign or domestic exchange or market are valued at the official closing price or, if none, the last sales price. If no sale occurs on the principal exchange or market that day, a fair value price will be determined in accordance with the Fund’s Valuation Procedures.
The values of securities denominated in foreign currencies are translated into U.S. dollars at rates provided by an independent foreign currency pricing source at a time each business day specified by the Management Valuation Team of Wells Fargo Funds Management, LLC (“Funds Management”).
Many securities markets and exchanges outside the U.S. close prior to the close of the New York Stock Exchange and therefore may not fully reflect trading or events that occur after the close of the principal exchange in which the foreign securities are traded, but before the close of the New York Stock Exchange. If such trading or events are expected to materially affect the value of such securities, then fair value pricing procedures approved by the Board of Trustees of the Fund are applied. These procedures take into account multiple factors including movements in U.S. securities markets after foreign exchanges close. Foreign securities that are fair valued under these procedures are categorized as Level 2 and the application of these procedures may result in transfers between Level 1 and Level 2. Depending on market activity, such fair valuations may be frequent. Such fair value pricing may result in net asset values that are higher or lower than net asset values based on the last reported sales price or latest quoted bid price. On October 31, 2017, such fair value pricing was not used in pricing foreign securities.
Investments in registered open-end investment companies are valued at net asset value. Interests in non-registered investment companies that are redeemable at net asset value are fair valued normally at net asset value.
Investments which are not valued using any of the methods discussed above are valued at their fair value, as determined in good faith by the Board of Trustees. The Board of Trustees has established a Valuation Committee comprised of the Trustees and has delegated to it the authority to take any actions regarding the valuation of portfolio securities that the Valuation Committee deems necessary or appropriate, including determining the fair value of portfolio securities, unless the determination has been delegated to the Management Valuation Team. The Board of Trustees retains the authority to make or ratify any valuation decisions or approve any changes to the Valuation Procedures as it deems appropriate. On a quarterly basis, the Board of Trustees receives reports on any valuation actions taken by the Valuation Committee or the Management Valuation Team which may include items for ratification.
Valuations of fair valued securities are compared to the next actual sales price when available, or other appropriate market values, to assess the continued appropriateness of the fair valuation methodologies used. These securities are fair valued on a day-to-day basis, taking into consideration changes to appropriate market information and any significant changes to the inputs considered in the valuation process until there is a readily available price provided on an exchange or by an independent pricing service. Valuations received from an independent pricing service or independent broker-dealer quotes
| | | | | | |
| Notes to financial statements | | Wells Fargo Global Small Cap Fund | | | 23 | |
are periodically validated by comparisons to most recent trades and valuations provided by other independent pricing services in addition to the review of prices by the manager and/or subadviser. Unobservable inputs used in determining fair valuations are identified based on the type of security, taking into consideration factors utilized by market participants in valuing the investment, knowledge about the issuer and the current market environment.
Foreign currency translation
The accounting records of the Fund are maintained in U.S. dollars. The values of other assets and liabilities denominated in foreign currencies are translated into U.S. dollars at rates provided by an independent foreign currency pricing source at a time each business day specified by the Management Valuation Team. Purchases and sales of securities, and income and expenses are converted at the rate of exchange on the respective dates of such transactions. Net realized foreign exchange gains or losses arise from sales of foreign currencies, currency gains or losses realized between the trade and settlement dates on securities transactions, and the difference between the amounts of dividends, interest and foreign withholding taxes recorded and the U.S. dollar equivalent of the amounts actually paid or received. Net unrealized foreign exchange gains and losses arise from changes in the fair value of assets and liabilities other than investments in securities resulting from changes in exchange rates. The changes in net assets arising from changes in exchange rates of securities and the changes in net assets resulting from changes in market prices of securities are not separately presented. Such changes are included in net realized and unrealized gains or losses from investments.
Security loans
The Fund may lend its securities from time to time in order to earn additional income in the form of fees or interest on securities received as collateral or the investment of any cash received as collateral. The Fund continues to receive interest or dividends on the securities loaned. The Fund receives collateral in the form of cash or securities with a value at least equal to the value of the securities on loan. The value of the loaned securities is determined at the close of each business day and any additional required collateral is delivered to the Fund on the next business day. In a securities lending transaction, the net asset value of the Fund will be affected by an increase or decrease in the value of the securities loaned and by an increase or decrease in the value of the instrument in which collateral is invested. The amount of securities lending activity undertaken by the Fund fluctuates from time to time. In the event of default or bankruptcy by the borrower, the Fund may be prevented from recovering the loaned securities or gaining access to the collateral or may experience delays or costs in doing so. In addition, the investment of any cash collateral received may lose all or part of its value. The Fund has the right under the lending agreement to recover the securities from the borrower on demand.
The Fund lends its securities through an unaffiliated securities lending agent. Cash collateral received in connection with its securities lending transactions is invested in Securities Lending Cash Investments, LLC (the “Securities Lending Fund”). The Securities Lending Fund is exempt from registration under Section 3(c)(7) of the 1940 Act and is managed by Funds Management and is subadvised by Wells Capital Management Incorporated (“WellsCap”), an affiliate of Funds Management and an indirect wholly owned subsidiary of Wells Fargo & Company (“Wells Fargo”). Funds Management receives an advisory fee starting at 0.05% and declining to 0.01% as the average daily net assets of the Securities Lending Fund increase. All of the fees received by Funds Management are paid to WellsCap for its services as subadviser. The Securities Lending Fund seeks to provide a positive return compared to the daily Fed Funds Open Rate by investing in high-quality, U.S. dollar-denominated short-term money market instruments. Securities Lending Fund investments are valued at the evaluated bid price provided by an independent pricing service. Income earned from investment in the Securities Lending Fund is included in securities lending income from affiliates (net of fees and rebates) on the Statement of Operations.
Security transactions and income recognition
Securities transactions are recorded on a trade date basis. Realized gains or losses are recorded on the basis of identified cost.
Dividend income is recognized on the ex-dividend date, except for certain dividends from foreign securities, which are recorded as soon as the custodian verifies the ex-dividend date. Dividend income from foreign securities is recorded net of foreign taxes withheld where recovery of such taxes is not assured.
Distributions to shareholders
Distributions to shareholders from net investment income and net realized gains, if any, are recorded on the ex-dividend date. Such distributions are determined in accordance with income tax regulations and may differ from U.S. generally accepted accounting principles. Dividend sources are estimated at the time of declaration. The tax character of distributions is determined as of the Fund’s fiscal year end. Therefore, a portion of the Fund’s distributions made prior to the Fund’s fiscal year end may be categorized as a tax return of capital.
| | | | |
| 24 | | Wells Fargo Global Small Cap Fund | | Notes to financial statements |
Federal and other taxes
The Fund intends to continue to qualify as a regulated investment company by distributing substantially all of its investment company taxable income and any net realized capital gains (after reduction for capital loss carryforwards) sufficient to relieve it from all, or substantially all, federal income taxes. Accordingly, no provision for federal income taxes was required.
The Fund’s income and federal excise tax returns and all financial records supporting those returns for the prior three fiscal years are subject to examination by the federal and Delaware revenue authorities. Management has analyzed the Fund’s tax positions taken on federal, state, and foreign tax returns for all open tax years and does not believe that there are any uncertain tax positions that require recognition of a tax liability.
As of October 31, 2017, the aggregate cost of all investments for federal income tax purposes was $229,840,606 and the unrealized gains (losses) consisted of:
| | | | |
Gross unrealized gains | | $ | 49,341,412 | |
Gross unrealized losses | | | (4,094,961 | ) |
Net unrealized gains | | $ | 45,246,451 | |
Reclassifications are made to the Fund’s capital accounts for permanent tax differences to reflect income and gains available for distribution (or available capital loss carryforwards) under federal income tax regulations. U.S. generally accepted accounting principles require that certain components of net assets be adjusted to reflect permanent differences between financial and tax reporting. These reclassifications have no effect on net assets or net asset values per share. The primary permanent differences causing such reclassifications is due to passive foreign investment companies. At October 31, 2017, as a result of permanent book-to-tax differences, the following reclassification adjustments were made on the Statement of Assets and Liabilities:
| | |
Undistributed net investment income | | Accumulated net realized gains on investments |
| $228,182 | | $(228,182) |
Class allocations
The separate classes of shares offered by the Fund differ principally in applicable sales charges, distribution, shareholder servicing, and administration fees. Class specific expenses are charged directly to that share class. Investment income, common expenses, and realized and unrealized gains (losses) on investments are allocated daily to each class of shares based on the relative proportion of net assets of each class.
3. FAIR VALUATION MEASUREMENTS
Fair value measurements of investments are determined within a framework that has established a fair value hierarchy based upon the various data inputs utilized in determining the value of the Fund’s investments. The three-level hierarchy gives the highest priority to unadjusted quoted prices in active markets for identical assets or liabilities (Level 1) and the lowest priority to unobservable inputs (Level 3). The Fund’s investments are classified within the fair value hierarchy based on the lowest level of input that is significant to the fair value measurement. The inputs are summarized into three broad levels as follows:
| ∎ | | Level 1 – quoted prices in active markets for identical securities |
| ∎ | | Level 2 – other significant observable inputs (including quoted prices for similar securities, interest rates, prepayment speeds, credit risk, etc.) |
| ∎ | | Level 3 – significant unobservable inputs (including the Fund’s own assumptions in determining the fair value of investments) |
The inputs or methodologies used for valuing investments in securities are not necessarily an indication of the risk associated with investing in those securities.
| | | | | | |
| Notes to financial statements | | Wells Fargo Global Small Cap Fund | | | 25 | |
The following is a summary of the inputs used in valuing the Fund’s assets and liabilities as of October 31, 2017:
| | | | | | | | | | | | | | | | |
| | | Quoted prices
(Level 1) | | | Other significant
observable inputs
(Level 2) | | | Significant
unobservable inputs (Level 3) | | | Total | |
Assets | | | | | | | | | | | | | | | | |
Investments in: | | | | | | | | | | | | | | | | |
| | | | |
Common stocks | | | | | | | | | | | | | | | | |
Australia | | $ | 5,208,789 | | | $ | 0 | | | $ | 0 | | | $ | 5,208,789 | |
Austria | | | 1,486,122 | | | | 0 | | | | 0 | | | | 1,486,122 | |
Canada | | | 20,409,834 | | | | 0 | | | | 0 | | | | 20,409,834 | |
Finland | | | 1,641,005 | | | | 0 | | | | 0 | | | | 1,641,005 | |
France | | | 6,253,734 | | | | 0 | | | | 0 | | | | 6,253,734 | |
Germany | | | 15,005,882 | | | | 0 | | | | 0 | | | | 15,005,882 | |
Hong Kong | | | 2,677,751 | | | | 0 | | | | 0 | | | | 2,677,751 | |
Ireland | | | 121,801 | | | | 0 | | | | 0 | | | | 121,801 | |
Israel | | | 1,854,807 | | | | 0 | | | | 0 | | | | 1,854,807 | |
Japan | | | 28,317,771 | | | | 0 | | | | 0 | | | | 28,317,771 | |
Netherlands | | | 1,117,751 | | | | 0 | | | | 0 | | | | 1,117,751 | |
Norway | | | 1,586,728 | | | | 0 | | | | 0 | | | | 1,586,728 | |
Spain | | | 7,154,644 | | | | 0 | | | | 0 | | | | 7,154,644 | |
Sweden | | | 2,344,558 | | | | 0 | | | | 0 | | | | 2,344,558 | |
Switzerland | | | 2,021,887 | | | | 0 | | | | 0 | | | | 2,021,887 | |
United Kingdom | | | 29,315,478 | | | | 0 | | | | 0 | | | | 29,315,478 | |
United States | | | 114,429,937 | | | | 0 | | | | 0 | | | | 114,429,937 | |
| | | | |
Short-term investments | | | | | | | | | | | | | | | | |
Investment companies | | | 16,552,450 | | | | 0 | | | | 0 | | | | 16,552,450 | |
Investments measured at net asset value* | | | | | | | | | | | | | | | 17,586,128 | |
Total assets | | $ | 257,500,929 | | | $ | 0 | | | $ | 0 | | | $ | 275,087,057 | |
| * | Investments that are measured at fair value using the net asset value per share (or its equivalent) as a practical expedient have not been categorized in the fair value hierarchy. The fair value amount presented in the table is intended to permit reconciliation of the fair value hierarchy to the amounts presented in the Statement of Assets and Liabilities. The Fund’s investment in Securities Lending Cash Investments, LLC valued at $17,586,128 does not have a redemption period notice, can be redeemed daily and does not have any unfunded commitments. |
The Fund recognizes transfers between levels within the fair value hierarchy at the end of the reporting period. At October 31, 2017, the Fund did not have any transfers into/out of Level 1, Level 2, or Level 3.
4. TRANSACTIONS WITH AFFILIATES AND OTHER EXPENSES
Management fee
Funds Management, an indirect wholly owned subsidiary of Wells Fargo, is the manager of the Fund and provides advisory and fund-level administrative services under an investment management agreement. Under the investment management agreement, Funds Management is responsible for, among other services, implementing the investment objectives and strategies of the Fund, supervising the subadviser, providing fund-level administrative services in connection with the Fund’s operations, and providing any other fund-level administrative services reasonably necessary for the operation of the Fund. As compensation for its services under the investment management agreement, Funds Management is entitled to receive an annual management fee starting at 0.95% and declining to 0.83% as the average daily net assets of the Fund increase. For the year ended October 31, 2017, the management fee was equivalent to an annual rate of 0.95% of the Fund’s average daily net assets.
Funds Management has retained the services of a subadviser to provide daily portfolio management to the Fund. The fee for subadvisory services is borne by Funds Management. WellsCap is the subadviser to the Fund and is entitled to receive a fee from Funds Management at an annual rate starting at 0.55% and declining to 0.40% as the average daily net assets of the Fund increase.
| | | | |
| 26 | | Wells Fargo Global Small Cap Fund | | Notes to financial statements |
Administration fees
Under a class-level administration agreement, Funds Management provides class-level administrative services to the Fund, which includes paying fees and expenses for services provided by the transfer agent, sub-transfer agents, omnibus account servicers and record-keepers. As compensation for its services under the class-level administration agreement, Funds Management receives an annual fee which is calculated based on the average daily net assets of each class as follows:
| | | | |
| | | Class-level
administration fee | |
Class A, Class B, Class C | | | 0.21 | % |
Administrator Class, Institutional Class | | | 0.13 | |
Funds Management has contractually waived and/or reimbursed management and administration fees to the extent necessary to maintain certain net operating expense ratios for the Fund. Waiver of fees and/or reimbursement of expenses by Funds Management were made first from fund level expenses on a proportionate basis and then from class specific expenses. Funds Management has committed through February 28, 2018 to waive fees and/or reimburse expenses to the extent necessary to cap the Fund’s expenses at 1.55% for Class A shares, 2.30% for Class C shares, 1.40% for Administrator Class shares, and 1.15% for Institutional Class shares. After this time, the cap may be increased or the commitment to maintain the cap may be terminated only with the approval of the Board of Trustees.
Out-of-pocket reimbursements
During the year ended October 31, 2017 State Street Bank and Trust Company (“State Street’), the Fund’s custodian, reimbursed the Fund $24,532 for certain out-of-pocket expenses that were billed to the Fund in error from 1998-2015. This amount is included in dividend income on the Statement of Operations. In addition, Funds Management was also reimbursed $14,545 by State Street for waivers/reimbursements it made to the Fund to limit Fund expenses during the period the Fund was erroneously billed.
Distribution fees
The Trust has adopted a distribution plan for Class B and Class C shares of the Fund pursuant to Rule 12b-1 under the 1940 Act. Distribution fees are charged to Class B and Class C shares and paid to Wells Fargo Funds Distributor, LLC (“Funds Distributor”), the principal underwriter, at an annual rate of 0.75% of the average daily net assets of Class B and Class C shares.
In addition, Funds Distributor is entitled to receive the front-end sales charge from the purchase of Class A shares and a contingent deferred sales charge on the redemption of certain Class A shares. Funds Distributor is also entitled to receive the contingent deferred sales charges from redemptions of Class B and Class C shares. For the year ended October 31, 2017, Funds Distributor received $8,466 from the sale of Class A shares and $148 in contingent deferred sales charges from redemptions of Class C shares. No contingent deferred sales charges were incurred by Class A and Class B shares for year ended October 31, 2017.
Shareholder servicing fees
The Trust has entered into contracts with one or more shareholder servicing agents, whereby Class A, Class B, Class C, and Administrator Class of the Fund are charged a fee at an annual rate of 0.25% of the average daily net assets of each respective class.
A portion of these total shareholder servicing fees were paid to affiliates of Wells Fargo.
Interfund transactions
The Fund may purchase or sell portfolio investment securities to certain other Wells Fargo affiliates pursuant to Rule 17a-7 under the 1940 Act and under procedures adopted by the Board of Trustees. The procedures have been designed to ensure that these interfund transactions, which do not incur broker commissions, are effected at current market prices. Pursuant to these procedures, the Fund had $32,404,800 in interfund purchases during the year ended October 31, 2017.
5. INVESTMENT PORTFOLIO TRANSACTIONS
Purchases and sales of investments, excluding U.S. government obligations (if any) and short-term securities, for the year ended October 31, 2017 were $155,348,221 and $166,291,300, respectively.
| | | | | | |
| Notes to financial statements | | Wells Fargo Global Small Cap Fund | | | 27 | |
6. BANK BORROWINGS
The Trust (excluding the money market funds and certain other funds) and Wells Fargo Variable Trust are parties to a $280,000,000 revolving credit agreement whereby the Fund is permitted to use bank borrowings for temporary or emergency purposes, such as to fund shareholder redemption requests. Interest under the credit agreement is charged to the Fund based on a borrowing rate equal to the higher of the Federal Funds rate in effect on that day plus 1.25% or the overnight LIBOR rate in effect on that day plus 1.25%. In addition, an annual commitment fee equal to 0.25% of the unused balance is allocated to each participating fund. Prior to August 29, 2017, the revolving credit agreement amount was $250,000,000.
For the year ended October 31, 2017, there were no borrowings by the Fund under the agreement.
7. DISTRIBUTIONS TO SHAREHOLDERS
The tax character of distributions paid during the years ended October 31, 2017 and October 31, 2016 were as follows:
| | | | | | | | |
| | | Year ended October 31 | |
| | | 2017 | | | 2016 | |
Ordinary income | | $ | 4,472,432 | | | $ | 1,234,146 | |
Long-term capital gain | | | 10,965,730 | | | | 10,286,635 | |
As of October 31, 2017, the components of distributable earnings on a tax basis were as follows:
| | | | |
Undistributed ordinary income | | Undistributed long-term gain | | Unrealized gains |
| $8,131,821 | | $22,337,704 | | $45,245,192 |
8. INDEMNIFICATION
Under the Trust’s organizational documents, the officers and Trustees have been granted certain indemnification rights against certain liabilities that may arise out of performance of their duties to the Trust. Additionally, in the normal course of business, the Trust may enter into contracts with service providers that contain a variety of indemnification clauses. The Trust’s maximum exposure under these arrangements is dependent on future claims that may be made against the Fund and, therefore, cannot be estimated.
9. SUBSEQUENT DISTRIBUTIONS
On December 13, 2017, the Fund declared distributions from capital gains to shareholders of record on December 12, 2017. The per share amounts payable on December 14, 2017 were as follows:
| | | | | | | | |
| | | Short-term capital gains | | | Long-term capital gains | |
Class A | | | $1.15230 | | | | $3.84356 | |
Class C | | | 1.15230 | | | | 3.84356 | |
Administrator Class | | | 1.15230 | | | | 3.84356 | |
Institutional Class | | | 1.15230 | | | | 3.84356 | |
These distributions are not reflected in the accompanying financial statements.
| | | | |
| 28 | | Wells Fargo Global Small Cap Fund | | Report of independent registered public accounting firm |
BOARD OF TRUSTEES AND SHAREHOLDERS OF WELLS FARGO FUNDS TRUST:
We have audited the accompanying statement of assets and liabilities, including the portfolio of investments, of the Wells Fargo Global Small Cap Fund (formerly known as Wells Fargo Global Opportunities Fund) (the “Fund”), one of the funds constituting the Wells Fargo Funds Trust, as of October 31, 2017, and the related statement of operations for the year then ended, the statements of changes in net assets for each of the years in the two-year period then ended, and the financial highlights for each of the years in the five-year period then ended. These financial statements and financial highlights are the responsibility of the Fund’s management. Our responsibility is to express an opinion on these financial statements and financial highlights based on our audits.
We conducted our audits in accordance with the standards of the Public Company Accounting Oversight Board (United States). Those standards require that we plan and perform the audit to obtain reasonable assurance about whether the financial statements and financial highlights are free of material misstatement. An audit includes examining, on a test basis, evidence supporting the amounts and disclosures in the financial statements. Our procedures included confirmation of securities owned as of October 31, 2017, by correspondence with the custodian and brokers, or by other appropriate audit procedures. An audit also includes assessing the accounting principles used and significant estimates made by management, as well as evaluating the overall financial statement presentation. We believe that our audits provide a reasonable basis for our opinion.
In our opinion, the financial statements and financial highlights referred to above present fairly, in all material respects, the financial position of the Wells Fargo Global Small Cap Fund as of October 31, 2017, the results of its operations for the year then ended, the changes in its net assets for each of the years in the two-year period then ended, and the financial highlights for each of the years in the five-year period then ended, in conformity with U.S. generally accepted accounting principles.

Boston, Massachusetts
December 21, 2017
| | | | | | |
| Other information (unaudited) | | Wells Fargo Global Small Cap Fund | | | 29 | |
TAX INFORMATION
For corporate shareholders, pursuant to Section 854 of the Internal Revenue Code, 27.64% of ordinary income dividends qualify for the corporate dividends-received deduction for the fiscal year ended October 31, 2017.
Pursuant to Section 852 of the Internal Revenue Code, $10,965,730 was designated as a 20% rate gain distribution for the fiscal year ended October 31, 2017.
Pursuant to Section 854 of the Internal Revenue Code, $4,103,535 of income dividends paid during the fiscal year ended October 31, 2017 has been designated as qualified dividend income (QDI).
For the fiscal year ended October 31, 2017, $9,525 has been designated as interest-related dividends for nonresident alien shareholders pursuant to Section 871 of the Internal Revenue Code.
For the fiscal year ended October 31, 2017, $2,640,779 has been designated as short-term capital gain dividends for nonresident alien shareholders pursuant to Section 871 of the Internal Revenue Code.
PROXY VOTING INFORMATION
A description of the policies and procedures that the Fund uses to determine how to vote proxies relating to portfolio securities is available, upon request, by calling 1-800-222-8222, visiting our website at wellsfargofunds.com, or visiting the SEC website at sec.gov. Information regarding how the Fund voted proxies relating to portfolio securities during the most recent 12-month period ended June 30 is available on the Fund’s website at wellsfargofunds.com or by visiting the SEC website at sec.gov.
PORTFOLIO HOLDINGS INFORMATION
The complete portfolio holdings for the Fund are publicly available monthly on the Fund’s website (wellsfargofunds.com), on a one-month delayed basis. In addition, top ten holdings information (excluding derivative positions) for the Fund is publicly available on the Fund’s website on a monthly, seven-day or more delayed basis. The Fund files its complete schedule of portfolio holdings with the SEC for the first and third quarters of each fiscal year on Form N-Q, which is available by visiting the SEC website at sec.gov. In addition, the Fund’s Form N-Q may be reviewed and copied at the SEC’s Public Reference Room in Washington, DC, and at regional offices in New York City, at 233 Broadway, and in Chicago, at 175 West Jackson Boulevard, Suite 900. Information about the Public Reference Room may be obtained by calling 1-800-SEC-0330.
| | | | |
| 30 | | Wells Fargo Global Small Cap Fund | | Other information (unaudited) |
BOARD OF TRUSTEES AND OFFICERS
Each of the Trustees and Officers1 listed in the table below acts in identical capacities for each fund in the Wells Fargo family of funds, which consists of 152 mutual funds comprising the Wells Fargo Funds Trust, Wells Fargo Variable Trust, Wells Fargo Master Trust and four closed-end funds (collectively the “Fund Complex”). This table should be read in conjunction with the Prospectus and the Statement of Additional Information2. The mailing address of each Trustee and Officer is 525 Market Street, 12th Floor, San Francisco, CA 94105. Each Trustee and Officer serves an indefinite term, however, each Trustee serves such term until reaching the mandatory retirement age established by the Trustees.
Independent Trustees
| | | | | | |
Name and year of birth | | Position held and length of service* | | Principal occupations during past five years or longer | | Current other public company or
investment company
directorships |
| William R. Ebsworth (Born 1957) | | Trustee, since 2015 | | Retired. From 1984 to 2013, equities analyst, portfolio manager, research director and chief investment officer at Fidelity Management and Research Company in Boston, Tokyo, and Hong Kong, and retired in 2013 as Chief Investment Officer of Fidelity Strategic Advisers, Inc. where he led a team of investment professionals managing client assets. Prior thereto, Board member of Hong Kong Securities Clearing Co., Hong Kong Options Clearing Corp., the Thailand International Fund, Ltd., Fidelity Investments Life Insurance Company, and Empire Fidelity Investments Life Insurance Company. Board member of the Forté Foundation (non-profit organization) and the Vincent Memorial Hospital Endowment (non-profit organization), where he serves on the Investment Committee and as Chair of the Audit Committee. Mr. Ebsworth is a CFA® charterholder. | | Asset Allocation Trust |
| Jane A. Freeman** (Born 1953) | | Trustee, since 2015; Chair Liaison, effective 2018 | | Retired. From 2012 to 2014 and 1999 to 2008, Chief Financial Officer of Scientific Learning Corporation. From 2008 to 2012, Ms. Freeman provided consulting services related to strategic business projects. Prior to 1999, Portfolio Manager at Rockefeller & Co. and Scudder, Stevens & Clark. Board member of the Harding Loevner Funds from 1996 to 2014, serving as both Lead Independent Director and chair of the Audit Committee. Board member of the Russell Exchange Traded Funds Trust from 2011 to 2012 and the chair of the Audit Committee. Ms. Freeman is a Board Member of Ruth Bancroft Garden (non-profit organization) and an inactive chartered financial analyst. | | Asset Allocation Trust |
| Peter G. Gordon*** (Born 1942) | | Trustee, from 1998 to 2017; Chairman, from 2005 to 2017 | | Co-Founder, Retired Chairman, President and CEO of Crystal Geyser Water Company. Trustee Emeritus, Colby College. | | Asset Allocation Trust |
Isaiah Harris, Jr. (Born 1952) | | Trustee, since 2009 | | Retired. Chairman of the Board of CIGNA Corporation since 2009, and Director since 2005. From 2003 to 2011, Director of Deluxe Corporation. Prior thereto, President and CEO of BellSouth Advertising and Publishing Corp. from 2005 to 2007, President and CEO of BellSouth Enterprises from 2004 to 2005 and President of BellSouth Consumer Services from 2000 to 2003. Emeritus member of the Iowa State University Foundation Board of Governors. Emeritus Member of the Advisory Board of Iowa State University School of Business. Advisory Board Member, Palm Harbor Academy (charter school). Advisory Board Member, Child Evangelism Fellowship (non-profit). Mr. Harris is a certified public accountant (inactive status). | | CIGNA Corporation; Asset Allocation Trust |
Judith M. Johnson (Born 1949) | | Trustee, since 2008; Audit Committee Chairman, since 2008 | | Retired. Prior thereto, Chief Executive Officer and Chief Investment Officer of Minneapolis Employees Retirement Fund from 1996 to 2008. Ms. Johnson is an attorney, certified public accountant and a certified managerial accountant. | | Asset Allocation Trust |
David F. Larcker (Born 1950) | | Trustee, since 2009 | | James Irvin Miller Professor of Accounting at the Graduate School of Business, Stanford University, Director of the Corporate Governance Research Initiative and Senior Faculty of The Rock Center for Corporate Governance since 2006. From 2005 to 2008, Professor of Accounting at the Graduate School of Business, Stanford University. Prior thereto, Ernst & Young Professor of Accounting at The Wharton School, University of Pennsylvania from 1985 to 2005. | | Asset Allocation Trust |
| | | | | | |
| Other information (unaudited) | | Wells Fargo Global Small Cap Fund | | | 31 | |
| | | | | | |
Name and year of birth | | Position held and length of service* | | Principal occupations during past five years or longer | | Current other public company or
investment company
directorships |
Olivia S. Mitchell**** (Born 1953) | | Trustee, since 2006; Governance Committee Chairman, effective 2018 | | International Foundation of Employee Benefit Plans Professor, Wharton School of the University of Pennsylvania since 1993. Director of Wharton’s Pension Research Council and Boettner Center on Pensions & Retirement Research, and Research Associate at the National Bureau of Economic Research. Previously, Cornell University Professor from 1978 to 1993. | | Asset Allocation Trust |
Timothy J. Penny***** (Born 1951) | | Trustee, since 1996; Chairman, effective 2018; Vice Chairman, from 2017 to 2018 | | President and Chief Executive Officer of Southern Minnesota Initiative Foundation, a non-profit organization, since 2007 and Senior Fellow at the Humphrey Institute Policy Forum at the University of Minnesota since 1995. Member of the Board of Trustees of NorthStar Education Finance, Inc., a non-profit organization, since 2007. | | Asset Allocation Trust |
James G. Polisson****** (Born 1959) | | Trustee, effective 2018; Advisory Board Member, from 2017 to 2018 | | Retired. Chief Marketing Officer, Source (ETF) UK Services, Ltd, from 2015 to 2017. From 2012 to 2015, Principal of The Polisson Group, LLC, a management consulting, corporate advisory and principal investing company. Chief Executive Officer and Managing Director at Russell Investments, Global Exchange Traded Funds from 2010 to 2012. Managing Director of Barclays Global Investors from 1998 to 2010 and Global Chief Marketing Officer for iShares and Barclays Global Investors from 2000 to 2010. Prior thereto, Vice President, Fidelity Retail Mutual Fund Group from 1996 to 1998 and Risk Management Practice Manager, Fidelity Consulting from 1995 to 1996. Board member of the Russell Exchange Traded Fund Trust from 2011 to 2012. Director of Barclays Global Investors Holdings Deutschland GmbH from 2006 to 2009. Mr. Polisson is an attorney and has a retired status with the Massachusetts and District of Columbia Bar Associations. | | Asset Allocation Trust |
Michael S. Scofield (Born 1943) | | Trustee, since 2010 | | Served on the Investment Company Institute’s Board of Governors and Executive Committee from 2008-2011 as well the Governing Council of the Independent Directors Council from 2006-2011 and the Independent Directors Council Executive Committee from 2008-2011. Trustee of the Evergreen Funds complex (and its predecessors) from 1984 to 2010. Chairman of the Evergreen Funds from 2000-2010. Former Trustee of the Mentor Funds. Retired Attorney, Law Offices of Michael S. Scofield. | | Asset Allocation Trust |
Pamela Wheelock****** (Born 1959) | | Trustee, effective 2018; Advisory Board Member, from 2017 to 2018 | | Chief Operating Officer, Twin Cities Habitat for Humanity, since January, 2017. Vice President of University Services, University of Minnesota from 2012 to 2017. Prior thereto, Interim President and Chief Executive Officer of Blue Cross Blue Shield of Minnesota from 2010 to 2011, Chairman of the Board from 2009 to 2011 and Board Director from 2003 to 2015. Vice President, Leadership and Community Engagement, Bush Foundation, Saint Paul, Minnesota (a private foundation) from 2009 to 2011. Executive Vice President and Chief Financial Officer, Minnesota Sports and Entertainment from 2004 to 2009 and Senior Vice President from 2002 to 2004. Commissioner of Finance, State of Minnesota, from 1999 to 2002. Currently on the Board of Directors, Governance Committee and Finance Committee, for the Minnesota Philanthropy Partners (Saint Paul Foundation) since 2012 and Board Chair of the Minnesota Wild Foundation since 2010. | | Asset Allocation Trust |
| * | Length of service dates reflect the Trustee’s commencement of service with the Trust’s predecessor entities, where applicable. |
| ** | Jane Freeman will become Chair Liaison effective January 1, 2018. |
| *** | Peter Gordon will retire on December 31, 2017. |
| **** | Olivia Mitchell will become Chairman of the Governance Committee effective January 1, 2018. |
| ***** | Timothy Penny will become Chairman effective January 1, 2018. |
| ****** | James Polisson and Pamela Wheelock each will become a Trustee effective January 1, 2018. |
| | | | |
| 32 | | Wells Fargo Global Small Cap Fund | | Other information (unaudited) |
Officers
| | | | | | |
Name and year of birth | | Position held and length of service | | Principal occupations during past five years or longer | | |
Andrew Owen (Born 1960) | | President, since 2017 | | Executive Vice President of Wells Fargo & Company and Head of Affiliated Managers, Wells Fargo Asset Management, since 2014. In addition, Mr. Owen is currently President, Chief Executive Officer and Director of Wells Fargo Funds Management, LLC since 2017. Prior thereto, Executive Vice President responsible for marketing, investments and product development for Wells Fargo Funds Management, LLC, from 2009 to 2014. | | |
Jeremy DePalma1 (Born 1974) | | Treasurer, since 2012 | | Senior Vice President of Wells Fargo Funds Management, LLC since 2009. Senior Vice President of Evergreen Investment Management Company, LLC from 2008 to 2010 and head of the Fund Reporting and Control Team within Fund Administration from 2005 to 2010. | | |
C. David Messman (Born 1960) | | Secretary, since 2000; Chief Legal Officer, since 2003 | | Senior Vice President and Secretary of Wells Fargo Funds Management, LLC since 2001. Assistant General Counsel of Wells Fargo Bank, N.A. since 2013 and Vice President and Managing Counsel of Wells Fargo Bank, N.A. from 1996 to 2013. | | |
Michael H. Whitaker (Born 1967) | | Chief Compliance Officer, since 2016 | | Senior Vice President and Chief Compliance Officer since 2016. Senior Vice President and Chief Compliance Officer for Fidelity Investments from 2007 to 2016. | | |
David Berardi (Born 1975) | | Assistant Treasurer, since 2009 | | Vice President of Wells Fargo Funds Management, LLC since 2009. Vice President of Evergreen Investment Management Company, LLC from 2008 to 2010. Manager of Fund Reporting and Control for Evergreen Investment Management Company, LLC from 2004 to 2010. | | |
| 1 | Jeremy DePalma acts as Treasurer of 76 funds and Assistant Treasurer of 76 funds in the Fund Complex. |
| 2 | The Statement of Additional Information includes additional information about the Trustees and is available, without charge, upon request, by calling 1-800-222-8222 or by visiting the website at wellsfargofunds.com. |
| | | | | | |
| Other information (unaudited) | | Wells Fargo Global Small Cap Fund | | | 33 | |
BOARD CONSIDERATION OF INVESTMENT MANAGEMENT AND SUB-ADVISORY AGREEMENTS:
Under the Investment Company Act of 1940 (the “1940 Act”), the Board of Trustees (the “Board”) of Wells Fargo Funds Trust (the “Trust”) must determine annually whether to approve the continuation of the Trust’s investment management and sub-advisory agreements. In this regard, at an in-person meeting held on May 16-17, 2017 (the “Meeting”), the Board, all the members of which have no direct or indirect interest in the investment management and sub-advisory agreements and are not “interested persons” of the Trust, as defined in the 1940 Act (the “Independent Trustees”), reviewed and approved for Wells Fargo Global Small Cap Fund (the “Fund”): (i) an investment management agreement (the “Management Agreement”) with Wells Fargo Funds Management, LLC (“Funds Management”); and (ii) an investment sub-advisory agreement (the “Sub-Advisory Agreement”) with Wells Capital Management Incorporated (the “Sub-Adviser”), an affiliate of Funds Management. The Management Agreement and the Sub-Advisory Agreement are collectively referred to as the “Advisory Agreements.”
At the Meeting, the Board considered the factors and reached the conclusions described below relating to the selection of Funds Management and the Sub-Adviser and the approval of the Advisory Agreements. Prior to the Meeting, including at an in-person meeting in April 2017, the Trustees conferred extensively among themselves and with representatives of Funds Management about these matters. Also, the Board has adopted a team-based approach, with each team consisting of a sub-set of Trustees, to assist the full Board in the discharge of its duties in reviewing performance and other matters throughout the year. The Independent Trustees were assisted in their evaluation of the Advisory Agreements by independent legal counsel, from whom they received separate legal advice and with whom they met separately.
In providing information to the Board, Funds Management and the Sub-Adviser were guided by a detailed set of requests for information submitted to them by independent legal counsel on behalf of the Independent Trustees at the start of the Board’s annual contract renewal process earlier in 2017. In considering and approving the Advisory Agreements, the Trustees considered the information they believed relevant, including but not limited to the information discussed below. The Board considered not only the specific information presented in connection with the Meeting, but also the knowledge gained over time through interaction with Funds Management and the Sub-Adviser about various topics. In this regard, the Board reviewed reports of Funds Management at each of its quarterly meetings, which included, among other things, portfolio reviews and performance reports. In addition, the Board and the teams mentioned above confer with portfolio managers at various times throughout the year. The Board did not identify any particular information or consideration that was all-important or controlling, and each individual Trustee may have attributed different weights to various factors.
After its deliberations, the Board unanimously approved the continuation of the Advisory Agreements for a one-year term and determined that the compensation payable to Funds Management and the Sub-Adviser under each of the Advisory Agreements was reasonable. The Board considered the approval of the Advisory Agreements for the Fund as part of its consideration of agreements for funds across the complex, but its approvals were made on a fund-by-fund basis. The following summarizes a number of important, but not necessarily all, factors considered by the Board in support of its approvals.
Nature, extent and quality of services
The Board received and considered various information regarding the nature, extent and quality of services provided to the Fund by Funds Management and the Sub-Adviser under the Advisory Agreements. This information included a description of the investment advisory services and Fund-level administrative services covered by the Management Agreement, as well as, among other things, a summary of the background and experience of senior management of Funds Management, a summary of certain organizational and personnel changes involving Funds Management and the Sub-Adviser, and a description of Funds Management’s and the Sub-Adviser’s business continuity planning programs and of their approaches to data privacy and cybersecurity. The Board also considered the qualifications, background, tenure and responsibilities of each of the portfolio managers primarily responsible for the day-to-day portfolio management of the Fund. The Board noted that it had approved changes to the Fund’s principal investment strategy, which became effective on or about April 1, 2017.
The Board evaluated the ability of Funds Management and the Sub-Adviser to attract and retain qualified investment professionals, including research, advisory and supervisory personnel. The Board further considered the compliance programs and compliance records of Funds Management and the Sub-Adviser. In addition, the Board took into account the full range of services provided to the Fund by Funds Management and its affiliates.
| | | | |
| 34 | | Wells Fargo Global Small Cap Fund | | Other information (unaudited) |
Fund performance and expenses
The Board considered the performance results for the Fund over various time periods ended December 31, 2016. The Board considered these results in comparison to the performance of funds in a universe that was determined by Broadridge Inc. (“Broadridge”) to be similar to the Fund (the “Universe”), and in comparison to the Fund’s benchmark index and to other comparative data. Broadridge is an independent provider of investment company data. The Board received a description of the methodology used by Broadridge to select the mutual funds in the performance Universe. The Board noted that the performance of the Fund (Administrator Class) was higher than the average performance of the Universe for all the periods under review. The Board also noted that the performance of the Fund was higher than its benchmark, the S&P Developed SmallCap Index, for all the periods under review.
The Board also received and considered information regarding the Fund’s net operating expense ratios and their various components, including actual management fees, custodian and other non-management fees, and Rule 12b-1 and non-Rule 12b-1 shareholder service fees. The Board considered these ratios in comparison to the median ratios of funds in class-specific expense groups that were determined by Broadridge to be similar to the Fund (the “Groups”). The Board received a description of the methodology used by Broadridge to select the mutual funds in the expense Groups and an explanation of how funds comprising expense groups and their expense ratios may vary from year-to-year. Based on the Broadridge reports, the Board noted that the net operating expense ratios of the Fund were lower than or in range of the median net operating expense ratios of the expense Groups for all share classes.
The Board took into account the Fund performance and expense information provided to it among the factors considered in deciding to re-approve the Advisory Agreements.
Investment management and sub-advisory fee rates
The Board reviewed and considered the contractual fee rates payable by the Fund to Funds Management under the Management Agreement, as well as the contractual fee rates payable by the Fund to Funds Management for class-level administrative services under a Class-Level Administration Agreement, which include, among other things, class-level transfer agency and sub-transfer agency costs (collectively, the “Management Rates”). The Board also reviewed and considered the contractual investment sub-advisory fee rates that are payable by Funds Management to the Sub-Adviser for investment sub-advisory services.
Among other information reviewed by the Board was a comparison of the Fund’s Management Rates with the average contractual investment management fee rates of funds in the expense Groups at a common asset level as well as transfer agency costs of the funds in the expense Groups. The Board noted that the Management Rates of the Fund were lower than or in range of the sum of these average rates for the Fund’s expense Groups for all share classes.
The Board also received and considered information about the portion of the total management fee that was retained by Funds Management after payment of the fee to the Sub-Adviser for sub-advisory services. In assessing the reasonableness of this amount, the Board received and evaluated information about the nature and extent of responsibilities retained and risks assumed by Funds Management and not delegated to or assumed by the Sub-Adviser, and about Funds Management’s on-going oversight services. Given the affiliation between Funds Management and the Sub-Adviser, the Board ascribed limited relevance to the allocation of fees between them.
The Board also received and considered information about the nature and extent of services offered and fee rates charged by Funds Management and the Sub-Adviser to other types of clients with investment strategies similar to those of the Fund. In this regard, the Board received information about the significantly greater scope of services, and compliance, reporting and other legal burdens and risks of managing mutual funds compared with those associated with managing assets of non-mutual fund clients such as institutional separate accounts.
Based on its consideration of the factors and information it deemed relevant, including those described here, the Board determined that the compensation payable to Funds Management under the Management Agreement and to the Sub-Adviser under the Sub-Advisory Agreement was reasonable.
Profitability
The Board received and considered information concerning the profitability of Funds Management, as well as the profitability of Wells Fargo as a whole, from providing services to the Fund and the fund family as a whole. The Board also received and considered information concerning the profitability of the Sub-Adviser from providing services to the fund family as a whole, noting that the Sub-Adviser’s profitability information with respect to providing services to the Fund was subsumed in the Wells Fargo and Funds Management profitability analysis.
| | | | | | |
| Other information (unaudited) | | Wells Fargo Global Small Cap Fund | | | 35 | |
Funds Management reported on the methodologies and estimates used in calculating profitability, including a description of the methodology used to allocate certain expenses. Among other things, the Board noted that the levels of profitability reported on a fund-by-fund basis varied widely, depending on factors such as the size and type of fund. Based on its review, the Board did not deem the profits reported by Funds Management or Wells Fargo from its services to the Fund to be at a level that would prevent it from approving the continuation of the Advisory Agreements.
Economies of scale
With respect to possible economies of scale, the Board noted the existence of breakpoints in the Fund’s management fee structure, which operate generally to reduce the Fund’s expense ratios as the Fund grows in size. It considered that, for a small fund or a fund that shrinks in size, breakpoints conversely can result in higher fee levels. The Board also considered that in addition to management fee breakpoints, competitive management fee rates set at the outset without regard to breakpoints and fee waiver and expense reimbursement arrangements are means of sharing potential economies of scale with shareholders of the Fund. The Board considered Funds Management’s view, which Funds Management indicated was supported by independent third-party industry studies which were summarized for the Board, that any analyses of potential economies of scale in managing a particular fund are inherently limited in light of the joint and common costs and investments that Funds Management incurs across the fund family as a whole.
The Board concluded that the Fund’s fee and expense arrangements, including contractual breakpoints, constituted a reasonable approach to sharing potential economies of scale with the Fund and its shareholders.
Other benefits to Funds Management and the Sub-Adviser
The Board received and considered information regarding potential “fall-out” or ancillary benefits received by Funds Management and its affiliates, including the Sub-Adviser, as a result of their relationships with the Fund. Ancillary benefits could include, among others, benefits directly attributable to other relationships with the Fund and benefits potentially derived from an increase in Funds Management’s and the Sub-Adviser’s business as a result of their relationships with the Fund. The Board noted that various affiliates of Funds Management may receive distribution-related fees, shareholder servicing payments and sub-transfer agency fees in respect of shares sold or held through them and services provided.
The Board also reviewed information about soft dollar credits earned and utilized by the Sub-Adviser, fees earned by Funds Management and the Sub-Adviser from managing a private investment vehicle for the fund family’s securities lending collateral and commissions earned by an affiliated broker from portfolio transactions.
Based on its consideration of the factors and information it deemed relevant, including those described here, the Board did not find that any ancillary benefits received by Funds Management and its affiliates, including the Sub-Adviser, were unreasonable.
Conclusion
At the Meeting, after considering the above-described factors and based on its deliberations and its evaluation of the information described above, the Board unanimously approved the continuation of the Advisory Agreements for a one-year term and determined that the compensation payable to Funds Management and the Sub-Adviser under each of the Advisory Agreements was reasonable.
| | | | |
| 36 | | Wells Fargo Global Small Cap Fund | | List of abbreviations |
The following is a list of common abbreviations for terms and entities that may have appeared in this report.
| ACA | — ACA Financial Guaranty Corporation |
| ADR | — American depositary receipt |
| ADS | — American depositary shares |
| AGC | — Assured Guaranty Corporation |
| AGM | — Assured Guaranty Municipal |
| Ambac | — Ambac Financial Group Incorporated |
| AMT | — Alternative minimum tax |
| BAN | — Bond anticipation notes |
| BHAC | — Berkshire Hathaway Assurance Corporation |
| CAB | — Capital appreciation bond |
| CCAB | — Convertible capital appreciation bond |
| CDA | — Community Development Authority |
| CDO | — Collateralized debt obligation |
| CLO | — Collateralized loan obligation |
| DRIVER | — Derivative inverse tax-exempt receipts |
| DW&P | — Department of Water & Power |
| DWR | — Department of Water Resources |
| ECFA | — Educational & Cultural Facilities Authority |
| EDA | — Economic Development Authority |
| EDFA | — Economic Development Finance Authority |
| ETF | — Exchange-traded fund |
| FDIC | — Federal Deposit Insurance Corporation |
| FFCB | — Federal Farm Credit Banks |
| FGIC | — Financial Guaranty Insurance Corporation |
| FHA | — Federal Housing Administration |
| FHLB | — Federal Home Loan Bank |
| FHLMC | — Federal Home Loan Mortgage Corporation |
| FICO | — The Financing Corporation |
| FNMA | — Federal National Mortgage Association |
| GDR | — Global depositary receipt |
| GNMA | — Government National Mortgage Association |
| HCFR | — Healthcare facilities revenue |
| HEFA | — Health & Educational Facilities Authority |
| HEFAR | — Higher education facilities authority revenue |
| HFA | — Housing Finance Authority |
| HFFA | — Health Facilities Financing Authority |
| HUD | — Department of Housing and Urban Development |
| IDA | — Industrial Development Authority |
| IDAG | — Industrial Development Agency |
| KRW | — Republic of Korea won |
| LIBOR | — London Interbank Offered Rate |
| LIFER | — Long Inverse Floating Exempt Receipts |
| LLC | — Limited liability company |
| LLLP | — Limited liability limited partnership |
| LLP | — Limited liability partnership |
| MBIA | — Municipal Bond Insurance Association |
| MFHR | — Multifamily housing revenue |
| MSTR | — Municipal securities trust receipts |
| MUD | — Municipal Utility District |
| National | — National Public Finance Guarantee Corporation |
| PCFA | — Pollution Control Financing Authority |
| PCL | — Public Company Limited |
| PCR | — Pollution control revenue |
| PFA | — Public Finance Authority |
| PFFA | — Public Facilities Financing Authority |
| PFOTER | — Puttable floating option tax-exempt receipts |
| PJSC | — Public Joint Stock Company |
| plc | — Public limited company |
| PUTTER | — Puttable tax-exempt receipts |
| R&D | — Research & development |
| Radian | — Radian Asset Assurance |
| RAN | — Revenue anticipation notes |
| RDA | — Redevelopment Authority |
| RDFA | — Redevelopment Finance Authority |
| REIT | — Real estate investment trust |
| ROC | — Reset option certificates |
| SAVRS | — Select auction variable rate securities |
| SBA | — Small Business Authority |
| SDR | — Swedish depositary receipt |
| SFHR | — Single-family housing revenue |
| SFMR | — Single-family mortgage revenue |
| SPA | — Standby purchase agreement |
| SPDR | — Standard & Poor’s Depositary Receipts |
| SPEAR | — Short Puttable Exempt Adjustable Receipts |
| STRIPS | — Separate trading of registered interest and |
| TAN | — Tax anticipation notes |
| TIPS | — Treasury inflation-protected securities |
| TRAN | — Tax revenue anticipation notes |
| TTFA | — Transportation Trust Fund Authority |
| TVA | — Tennessee Valley Authority |

For more information
More information about Wells Fargo Funds is available free upon request. To obtain literature, please write, email, visit the Fund’s website, or call:
Wells Fargo Funds
P.O. Box 8266
Boston, MA 02266-8266
Email: fundservice@wellsfargo.com
Website: wellsfargofunds.com
Individual investors: 1-800-222-8222
Retail investment professionals: 1-888-877-9275
Institutional investment professionals:
1-866-765-0778
This report and the financial statements contained herein are submitted for the general information of the shareholders of the Fund. If this report is used for promotional purposes, distribution of the report must be accompanied or preceded by a current prospectus. Before investing, please consider the investment objectives, risks, charges, and expenses of the investment. For a current prospectus and, if available, a summary prospectus, containing this information, call 1-800-222-8222 or visit the Fund’s website at wellsfargofunds.com. Read the prospectus carefully before you invest or send money.
Wells Fargo Asset Management (WFAM) is a trade name used by the asset management businesses of Wells Fargo & Company. Wells Fargo Funds Management, LLC, a wholly owned subsidiary of Wells Fargo & Company, provides investment advisory and administrative services for Wells Fargo Funds. Other affiliates of Wells Fargo & Company provide subadvisory and other services for the funds. The funds are distributed by Wells Fargo Funds Distributor, LLC, Member FINRA, an affiliate of Wells Fargo & Company. Neither Wells Fargo Funds Distributor nor Wells Fargo Funds Management holds fund shareholder accounts or assets. This material is for general informational and educational purposes only and is NOT intended to provide investment advice or a recommendation of any kind—including a recommendation for any specific investment, strategy, or plan.
NOT FDIC INSURED ◾ NO BANK GUARANTEE ◾ MAY LOSE VALUE
© 2017 Wells Fargo Funds Management, LLC. All rights reserved.
| | |
 | | 307202 12-17 A239/AR239 10-17 |
Annual Report
October 31, 2017

Wells Fargo International Equity Fund


Reduce clutter. Save trees.
Sign up for electronic delivery of prospectuses and shareholder reports at wellsfargo.com/advantagedelivery
Contents
The views expressed and any forward-looking statements are as of October 31, 2017, unless otherwise noted, and are those of the Fund managers and/or Wells Fargo Funds Management, LLC. Discussions of individual securities, or the markets generally, or any Wells Fargo Fund are not intended as individual recommendations. Future events or results may vary significantly from those expressed in any forward-looking statements. The views expressed are subject to change at any time in response to changing circumstances in the market. Wells Fargo Funds Management, LLC and the Fund disclaim any obligation to publicly update or revise any views expressed or forward-looking statements.
NOT FDIC INSURED ◾ NO BANK GUARANTEE ◾ MAY LOSE VALUE
| | | | |
| 2 | | Wells Fargo International Equity Fund | | Letter to shareholders (unaudited) |

Andrew Owen
President
Wells Fargo Funds
Global stocks generally delivered double-digit results; bond markets had smaller but positive results as well.
Dear Shareholder:
We are pleased to offer you this annual report for the Wells Fargo International Equity Fund for the 12-month period that ended October 31, 2017. Global stocks generally delivered double-digit results; bond markets had smaller but positive results as well. U.S. and international stocks performed similarly overall with returns of 23.63% and 23.64%, respectively, for the 12-month period, as measured by the S&P 500 Index1 and the MSCI ACWI ex USA Index (Net),2 respectively. Within fixed income, the Bloomberg Barclays U.S. Aggregate Bond Index3 returned 0.90% and the Bloomberg Barclays Municipal Bond Index4 returned 2.19% as interest rates rose from low levels.
Election results and central banks’ policies commanded investor attention as 2016 closed.
During the last two months of 2016, investors appeared intent on the prospective outcomes of elections in the U.S. and central-bank actions globally. Following Donald Trump’s election victory in November, U.S. stocks rallied. Investors appeared optimistic that the new administration would pursue progrowth policies. Favorable economic news supported stocks, and interest rates moved higher. At their mid-December meeting, U.S. Federal Reserve (Fed) officials raised the target interest rate by a quarter percentage point to a range of 0.50% to 0.75%. The fourth quarter also saw the implementation of the U.S. Securities and Exchange Commission’s amended rule for money market funds, which included the possibility of liquidity fees and redemption gates and, for institutional prime and municipal money market funds, floating net asset values (NAVs). Outside of the U.S., the prospects for faster U.S. growth appeared to trigger some acceleration in Europe.
Financial markets gained during the first two quarters of 2017 on positive economic data.
Stocks rallied globally through the first quarter of 2017, supported by signs of improvement in the U.S. and global economies. In the U.S., hiring remained strong, and business and consumer sentiment improved. In March, Fed officials raised their target interest rate by a quarter percentage point to a range of 0.75% to 1.00%. With the Fed’s target interest-rate increase, short-term bond yields rose during the quarter. Meanwhile, longer-term Treasury yields were little changed, leading to positive performance. Investment-grade and high-yield bonds benefited from strong demand. Municipal bond returns were positive in the quarter, helped by strong demand and constrained new-issue supply. Outside the U.S., stocks in emerging markets generally outperformed stocks in the U.S. and international developed markets because they benefited from both global economic growth and recent weakening of the U.S. dollar. Stocks in Asia, Europe, and Latin America also outperformed the U.S. market during the quarter.
| 1 | The S&P 500 Index consists of 500 stocks chosen for market size, liquidity, and industry group representation. It is a market-value-weighted index with each stock’s weight in the index proportionate to its market value. You cannot invest directly in an index. |
| 2 | The Morgan Stanley Capital International (MSCI) All Country World Index (ACWI) ex USA Index (Net) is a free-float-adjusted market-capitalization-weighted index that is designed to measure the equity market performance of developed markets, excluding the United States and Canada. Source: MSCI. MSCI makes no express or implied warranties or representations and shall have no liability whatsoever with respect to any MSCI data contained herein. The MSCI data may not be further redistributed or used as a basis for other indexes or any securities or financial products. This report is not approved, reviewed, or produced by MSCI. You cannot invest directly in an index. |
| 3 | The Bloomberg Barclays U.S. Aggregate Bond Index is a broad-based benchmark that measures the investment-grade, U.S. dollar-denominated, fixed-rate taxable bond market, including Treasuries, government-related and corporate securities, mortgage-backed securities (agency fixed-rate and hybrid adjustable-rate mortgage pass-throughs), asset-backed securities, and commercial mortgage-backed securities. You cannot invest directly in an index. |
| 4 | The Bloomberg Barclays Municipal Bond Index is an unmanaged index composed of long-term tax-exempt bonds with a minimum credit rating of Baa. You cannot invest directly in an index. |
| | | | | | |
| Letter to shareholders (unaudited) | | Wells Fargo International Equity Fund | | | 3 | |
Globally, stocks marked continued gains through the second quarter of 2017. Steady, albeit modest, economic growth both in the U.S. and abroad and generally favorable corporate earnings announcements supported higher valuations. U.S. inflation trended lower despite a continued decline in the unemployment rate. Ten-year U.S. Treasury yields declined, resulting in stronger prices for long-term bonds. As was widely expected, Fed officials raised the target interest rate in June by a quarter percentage point to a range of 1.00% to 1.25%. In addition, the Fed indicated that it planned to start selling bonds that accumulated on its balance sheet during quantitative easing programs conducted since 2008.
As global growth improved in the third quarter of 2017, financial markets generally advanced.
Most stock markets worldwide moved higher during the quarter and ended the period at or near all-time highs. Moderate acceleration in global economic growth was supported by improving corporate earnings, low inflation pressure, and still-low interest rates. Corporate earnings reports were favorable overall as companies continued to benefit from healthy operating leverage. Global commodity prices climbed during the quarter. Oil prices rebounded, partly due to a better balance between supply and demand. While North Korea’s recent missile launches and nuclear testing raised serious concerns around the world, the heightened geopolitical risk had relatively minimal impact on the quarter’s stock returns. In the U.S., economic data released during the quarter reflected a generally healthy economy. Second-quarter economic output grew at a 3.1% annual rate, and consumers displayed more willingness to spend. Meanwhile, the Fed maintained the target range for the federal funds rate at 1.00% to 1.25%, noting that inflation had remained below the Fed’s 2.00% objective. Reflecting continued confidence in the U.S. economy, the Fed also stated the possibility of one more 0.25% increase in the federal funds rate by the end of 2017 and announced plans to begin the process of unwinding its $4.5 trillion portfolio of bonds and other assets in October. Outside the U.S., stocks in the Asia Pacific region benefited from solid earnings reports and investors’ willingness to take on risk despite the rising tensions between North Korea and the U.S. In Europe, markets were supported by better-than-expected economic growth, which has led to narrowing of the gap between Europe’s growth rate and that of the U.S. In emerging markets, many countries benefited from stronger currencies versus the U.S. dollar. Also, commodity prices were on an upward trajectory, which benefited many companies that rely on natural resources for exports.
Positive economic and market news continued into October.
October proved to be a strong month for U.S. stocks. The S&P 500 Index delivered 11 record closes amid rising consumer confidence and signs the economy was continuing to gain momentum, including news in late October that economic output was estimated to have grown at a 3.0% annual rate in the third quarter. At its October meeting, the Fed, in a unanimous vote, left short-term interest rates unchanged but signaled it could make another rate increase before the end of 2017 if the economy remains on track. The Fed also began the process of unwinding its quantitative easing program. Outside the U.S., international stocks generally delivered positive results in October as global economic growth continued to strengthen.
| | | | |
| 4 | | Wells Fargo International Equity Fund | | Letter to shareholders (unaudited) |
Don’t let short-term uncertainty derail long-term investment goals.
Periods of investment uncertainty can present challenges, but experience has taught us that maintaining long-term investment goals can be an effective way to plan for the future. To help you create a sound strategy based on your personal goals and risk tolerance, Wells Fargo Funds offers more than 100 mutual funds spanning a wide range of asset classes and investment styles. Although diversification cannot guarantee an investment profit or prevent losses, we believe it can be an effective way to manage investment risk and potentially smooth out overall portfolio performance. We encourage investors to know their investments and to understand that appropriate levels of risk-taking may unlock opportunities.
Thank you for choosing to invest with Wells Fargo Funds. We appreciate your confidence in us and remain committed to helping you meet your financial needs.
Sincerely,

Andrew Owen
President
Wells Fargo Funds
Although diversification cannot guarantee an investment profit or prevent losses, we believe it can be an effective way to manage investment risk and potentially smooth out overall portfolio performance.
For further information about your Fund, contact your investment professional, visit our website at wellsfargofunds.com, or call us directly at 1-800-222-8222. We are available 24 hours a day, 7 days a week.
This page is intentionally left blank.
| | | | |
| 6 | | Wells Fargo International Equity Fund | | Performance highlights (unaudited) |
Investment objective
The Fund seeks long-term capital appreciation.
Manager
Wells Fargo Funds Management, LLC
Subadviser
Wells Capital Management Incorporated
Portfolio managers
Dale A. Winner, CFA®
Venkateshwar Lal‡
Average annual total returns (%) as of October 31, 20171
| | | | | | | | | | | | | | | | | | | | | | | | | | | | | | | | | | |
| | | | | Including sales charge | | | Excluding sales charge | | | Expense ratios2 (%) | |
| | | Inception date | | 1 year | | | 5 year | | | 10 year | | | 1 year | | | 5 year | | | 10 year | | | Gross | | | Net3 | |
| Class A (WFEAX) | | 1-20-1998 | | | 17.68 | | | | 8.19 | | | | 0.05 | | | | 24.91 | | | | 9.49 | | | | 0.64 | | | | 1.43 | | | | 1.15 | |
| Class C (WFEFX) | | 3-6-1998 | | | 22.91 | | | | 8.67 | | | | (0.11 | ) | | | 23.91 | | | | 8.67 | | | | (0.11 | ) | | | 2.18 | | | | 1.90 | |
| Class R (WFERX) | | 10-10-2003 | | | – | | | | – | | | | – | | | | 24.47 | | | | 9.20 | | | | 0.38 | | | | 1.68 | | | | 1.40 | |
| Class R6 (WFEHX) | | 9-30-2015 | | | – | | | | – | | | | – | | | | 25.30 | | | | 9.75 | | | | 0.83 | | | | 1.00 | | | | 0.85 | |
| Administrator Class (WFEDX) | | 7-16-2010 | | | – | | | | – | | | | – | | | | 24.84 | | | | 9.49 | | | | 0.71 | | | | 1.35 | | | | 1.15 | |
| Institutional Class (WFENX) | | 3-9-1998 | | | – | | | | – | | | | – | | | | 25.21 | | | | 9.76 | | | | 0.89 | | | | 1.10 | | | | 0.90 | |
| MSCI ACWI ex USA Index (Net)4 | | – | | | – | | | | – | | | | – | | | | 23.64 | | | | 7.29 | | | | 0.92 | | | | – | | | | – | |
Figures quoted represent past performance, which is no guarantee of future results, and do not reflect taxes that a shareholder may pay on fund distributions or the redemption of fund shares. Investment return and principal value of an investment will fluctuate so that an investor’s shares, when redeemed, may be worth more or less than their original cost. Performance shown without sales charges would be lower if sales charges were reflected. Current performance may be lower or higher than the performance data quoted, which assumes the reinvestment of dividends and capital gains. Current month-end performance is available on the Fund’s website, wellsfargofunds.com.
Index returns do not include transaction costs associated with buying and selling securities, any mutual fund fees or expenses, or any taxes. It is not possible to invest directly in an index.
For Class A shares, the maximum front-end sales charge is 5.75%. For Class C shares, the maximum contingent deferred sales charge is 1.00%. Performance including a contingent deferred sales charge assumes the sales charge for the corresponding time period. Class R, Class R6, Administrator Class, and Institutional Class shares are sold without a front-end sales charge or contingent deferred sales charge.
Stock values fluctuate in response to the activities of individual companies and general market and economic conditions. Foreign investments are especially volatile and can rise or fall dramatically due to differences in the political and economic conditions of the host country. These risks are generally intensified in emerging markets. The use of derivatives may reduce returns and/or increase volatility. Certain investment strategies tend to increase the total risk of an investment (relative to the broader market). The Fund is exposed to smaller-company securities risk. Consult the Fund’s prospectus for additional information on these and other risks.
Please see footnotes on page 7.
| | | | | | |
| Performance highlights (unaudited) | | Wells Fargo International Equity Fund | | | 7 | |
|
| Growth of $10,000 investment as of October 31, 20175 |
|
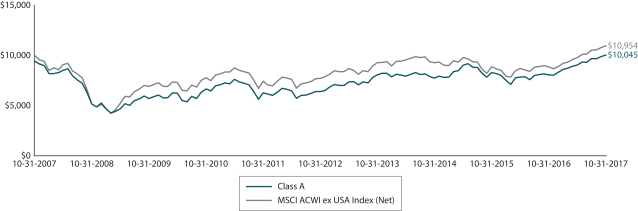 |
| ‡ | Mr. Lal became a portfolio manager of the Fund on June 30, 2017. |
| 1 | Historical performance shown for Class R6 shares prior to their inception reflects the performance of Institutional Class shares and includes the higher expenses applicable to Institutional Class shares. If these expenses had not been included, returns for Class R6 shares would be higher. Historical performance shown for Administrator Class shares prior to their inception reflects the performance of Institutional Class shares and has been adjusted to reflect the higher expenses applicable to Administrator Class shares. Historical performance shown for all classes of the Fund prior to July 12, 2010, is based on the performance of the Fund’s predecessor, Evergreen International Equity Fund. |
| 2 | Reflects the expense ratios as stated in the most recent prospectuses, which include the impact of 0.01% in acquired fund fees and expenses. The expense ratios shown are subject to change and may differ from the annualized expense ratios shown in the financial highlights of this report, which do not include acquired fund fees and expenses. |
| 3 | The manager has contractually committed through February 28, 2018, to waive fees and/or reimburse expenses to the extent necessary to cap the Fund’s Total Annual Operating Expenses After Fee Waivers at 1.14% for Cass A, 1.89% for Class C, 1.39% for Class R, 0.84% for Class R6, 1.14% for Administrator Class, and 0.89% for Institutional Class. After this time, the cap may be increased or the commitment to maintain the cap may be terminated only with the approval of the Board of Trustees. Brokerage commissions, stamp duty fees, interest, taxes, acquired fund fees and expenses, and extraordinary expenses are excluded from the expense cap. Without this cap, the Fund’s returns would have been lower. The expense ratio paid by an investor is the net expense ratio or the Fund’s Total Annual Fund Operating Expenses After Fee Waivers, as stated in the prospectuses. |
| 4 | The Morgan Stanley Capital International (MSCI) All Country World Index (ACWI) ex USA Index (Net) is a free-float-adjusted market-capitalization-weighted index that is designed to measure the equity market performance of developed markets, excluding the Unites States and Canada. Source: MSCI. MSCI makes no express or implied warranties or representations and shall have no liability whatsoever with respect to any MSCI data contained herein. The MSCI data may not be further redistributed or used as a basis for other indexes or any securities or financial products. This report is not approved, reviewed, or produced by MSCI. You cannot invest directly in an index. |
| 5 | The chart compares the performance of Class A shares for the most recent ten years with the MSCI ACWI ex USA Index (Net). The chart assumes a hypothetical investment of $10,000 in Class A shares and reflects all operating expenses and assumes the maximum initial sales charge of 5.75%. |
| 6 | The ten largest holdings, excluding cash and cash equivalents, are calculated based on the value of the investments divided by total net assets of the Fund. Holdings are subject to change and may have changed since the date specified. |
| 7 | Amounts are calculated based on the total long-term investments of the Fund. These amounts are subject to change and may have changed since the date specified. |
| * | This security was no longer held at the end of the reporting period. |
| | | | |
| 8 | | Wells Fargo International Equity Fund | | Performance highlights (unaudited) |
MANAGER’S DISCUSSION
Fund highlights
| ∎ | | The Fund outperformed the MSCI ACWI ex USA Index (Net) for the 12-month period that ended October 31, 2017. |
| ∎ | | Financials, industrials, health care, and information technology stocks were notable positive contributors to performance. Consumer, commodities, and telecommunication services stocks were relative performance laggards. |
| ∎ | | The Fund remained mainly overweight stocks in Europe (including overweights to Germany, the Netherlands, Italy, and Norway but underweights to Spain, Switzerland, and France) and underweight stocks in Asia on a regional basis (including underweights to Japan, Australia, and Taiwan but overweights to Hong Kong/China, South Korea, and Malaysia). |
Emerging and developed international markets outperformed versus U.S. equities.
Over the past year, we have witnessed a strong period for international equity market returns, with emerging markets as well as developed markets showing continued positive performance and outperformance versus domestic U.S. equities. We continued to find attractive stocks benefiting from a combination of self-help restructuring, targeted structural reforms, and reflationary public policies.
This past year’s market performance was underpinned by signs of a synchronized economic recovery in developed and international economies. In late August, the Organization for Economic Co-operation and Development (OECD) announced that each of the 45 countries whose economies the OECD tracks were on target to grow this year, a rare coincident recovery that has been evident in only three prior periods of time in the past 50 years. In addition, during the past quarter, Brent crude-oil prices appreciated approximately 30% from their second-quarter lows, reflecting some stabilization in a key commodity market metric that had registered a disinflationary shock to commodity-dependent economies and overall reflationary sentiment among global investors as oil had depreciated by more than 60% during its mid-2014 to early-2016 descent.
| | | | |
| Ten largest holdings (%) as of October 31, 20176 | |
Hitachi Limited | | | 3.63 | |
Eni SpA | | | 3.59 | |
Den Norske Bank ASA | | | 3.58 | |
Compagnie de Saint-Gobain SA | | | 3.39 | |
Vodafone Group plc | | | 3.39 | |
NN Group NV | | | 3.28 | |
Siemens AG | | | 3.24 | |
UniCredit SpA | | | 3.22 | |
Novartis AG | | | 3.21 | |
Nomura Holdings Incorporated | | | 2.91 | |
|
| Sector distribution as of October 31, 20177 |
|
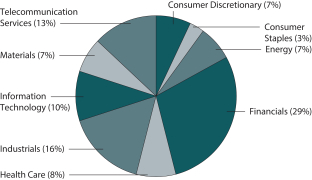
|
We continued to see strong earnings announcements from an increasing breadth of European, Japanese, and emerging markets corporate issuers that have positively surprised market expectations through concerted revitalization of depressed earnings and profitability. Based on fundamental stock picking, the Fund’s strategy continues to have notable concentrated exposures, led by positions in the financial services (insurers and diversified financials), industrials (self-help cyclicals with catalysts for progress), and telecommunication services (developed markets and especially emerging markets) sectors as top sector weights in several developed and emerging markets.
From a currency perspective, the Fund has limited currency hedges in place as the period closed, consisting of partial hedges of British sterling stock exposures and minor remaining hedges of euro-denominated positions.
Please see footnotes on page 7.
| | | | | | |
| Performance highlights (unaudited) | | Wells Fargo International Equity Fund | | | 9 | |
|
| Country allocation as of October 31, 20177 |
|
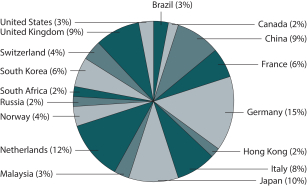 |
Absolute and relative performance was driven by strong gains across Europe, Asia, and the Americas.
Top positive international country performance contributors included Germany (Rheinmetall AG, Bayer AG, Siemens AG), the U.K. (Man Group plc, Smiths Group plc), Japan (Hitachi, Limited; Mitsubishi UFJ Financial Group, Incorporated; Nomura Holdings, Incorporated), the Netherlands (NN Group N.V., Koninklijke Philips N.V.), South Korea (SK Telecom Company, Limited; Hana Financial Group, Incorporated), Canada (Lundin Mining Corporation), and China (Kweichow Moutai Company, Limited). These gains outweighed losses from holdings in lagging contribution countries: Brazil (JBS S.A.*), South Africa (Sasol Limited, a South African integrated oil firm),
Denmark (Novo Nordisk A/S), Hong Kong (Xinyi Solar Holdings Limited*, Xtep International Holdings Limited*, China Mobile Limited*), and Italy (UniCredit S.p.A.).
The year’s sector performance reflected strong stock selection across several sectors. The financial services sector overweight had a number of top performers, ranging from asset managers (Man Group) to diversified financials (Hana Financial, Mitsubishi UFJ, and Nomura), insurers (NN Group, Zurich Insurance Group Limited), and banks (CIMB Group Holdings Berhad and DnB ASA*). DnB, a bank domiciled in oil-sensitive Norway and the Fund’s largest average position weight last quarter, delivered strong results, both from its self-help cost-cutting as well as from the underlying recovery in its cyclically sensitive, commodity-loan exposures. Industrials sector performers included a number of self-help restructuring companies, such as Compagnie de Saint-Gobain S.A., Rheinmetall, Siemens, and Sensata Technologies Holding N.V. As a new 2017 holding, Sensata appreciated after deleveraging its balance sheet and digesting two acquisitions accretive to earnings. In the health care sector, both Bayer and Philips were positive performers; in the case of Philips, the company’s ongoing transformation from a diversified industrial to a medical technology company has progressed with material earnings improvements.
On the other hand, there were some underperforming holdings over the course of last year, notably in the consumer and commodities-related sectors. Consumer stocks accounted for sector weakness in parts of Asia (Coca-Cola Bottlers Japan*, Xtep International*, and Xinyi Glass Holdings Limited), Europe (METRO AG and Reckitt Benckiser Group plc*), and Latin America (JBS). A smaller position weight in particular—JBS—suffered earlier in the year as it became embroiled in controversy surrounding Brazil’s political leadership; we exited that holding in the second quarter. Stocks in commodity-related sectors also underperformed, including energy holdings (Frontline Securities Limited, a Norwegian shipper, and Cosan S.A., a Brazilian ethanol producer) and energy stocks (Sasol).
Investing internationally is supported by valuations, earning power, operating leverage, and public policies.
We remain excited about the bottom-up stock opportunities we continue to find internationally and remain constructive of the overall investment climate—especially as we have passed a traditionally weak season of equity market performance and this summer’s inflation soft patch, investor economic and earnings expectations globally appear to have become more realistic, and prospects of some form of U.S. fiscal/tax policy stimulus (or at least reform) have appeared on the horizon.
Longer term, the case for investing internationally also remains supported by the confluence of historically extremely cheap absolute and relative valuations, potentially strong earnings power and operating leverage, and relatively supportive public policies outside the U.S. We expect total return outperformance is most likely to be realized from companies engaged in self-help restructuring, taking advantage of targeted structural reforms and benefiting from a backdrop of reflationary public policies, including still-accommodative central banks, at a time of well-diversified and synchronized global recovery, as indicated by rising international Purchasing Managers’ Index readings and cheap equity valuations relative to bonds. Some elements driving potentially sustained global recovery recently have become evident, including incremental progress toward tax reforms in the U.S., greater fiscal policy coordination between the European Union’s Franco-German core, the strongest Tankan survey of business enterprises in Japan, and surprisingly firm Producer Price Index indications from China.
Our value-focused and risk-conscious investment philosophy continues to guide our stock selection and portfolio management as we seek to assemble the most attractive collection of concentrated global equity investments—each representing nonconsensus undervalued opportunities whose total return derives from combinations of value rerating with self-help catalysts, sustainable earnings growth, and dividend yields supported by strong balance sheets and cash flows. We expect to continue to use inherent market volatility in the years to come, fueled by the prevalence of macro risks in each region of the globe, to continue to search for opportunities capturing dislocations when equity valuations stray from company fundamentals.
Please see footnotes on page 7.
| | | | |
| 10 | | Wells Fargo International Equity Fund | | Fund expenses (unaudited) |
As a shareholder of the Fund, you incur two types of costs: (1) transaction costs, including sales charges (loads) on purchase payments and contingent deferred sales charges (if any) on redemptions and (2) ongoing costs, including management fees, distribution (12b-1) and/or shareholder servicing fees, and other Fund expenses. This example is intended to help you understand your ongoing costs (in dollars) of investing in the Fund and to compare these costs with the ongoing costs of investing in other mutual funds.
The example is based on an investment of $1,000 invested at the beginning of the six-month period and held for the entire period from May 1, 2017 to October 31, 2017.
Actual expenses
The “Actual” line of the table below provides information about actual account values and actual expenses. You may use the information in this line, together with the amount you invested, to estimate the expenses that you paid over the period. Simply divide your account value by $1,000 (for example, an $8,600 account value divided by $1,000 = 8.6), then multiply the result by the number in the “Actual” line under the heading entitled “Expenses paid during period” for your applicable class of shares to estimate the expenses you paid on your account during this period.
Hypothetical example for comparison purposes
The “Hypothetical” line of the table below provides information about hypothetical account values and hypothetical expenses based on the Fund’s actual expense ratio and an assumed rate of return of 5% per year before expenses, which is not the Fund’s actual return. The hypothetical account values and expenses may not be used to estimate the actual ending account balance or expenses you paid for the period. You may use this information to compare the ongoing costs of investing in the Fund and other funds. To do so, compare this 5% hypothetical example with the 5% hypothetical examples that appear in the shareholder reports of the other funds.
Please note that the expenses shown in the table are meant to highlight your ongoing costs only and do not reflect any transactional costs, such as sales charges (loads) and contingent deferred sales charges. Therefore, the “Hypothetical” line of the table is useful in comparing ongoing costs only and will not help you determine the relative total costs of owning different funds. In addition, if these transactional costs were included, your costs would have been higher.
| | | | | | | | | | | | | | | | |
| | | Beginning
account value
5-1-2017 | | | Ending
account value
10-31-2017 | | | Expenses
paid during
the period¹ | | | Annualized net
expense ratio | |
Class A | | | | | | | | | | | | | | | | |
Actual | | $ | 1,000.00 | | | $ | 1,111.75 | | | $ | 6.07 | | | | 1.14 | % |
Hypothetical (5% return before expenses) | | $ | 1,000.00 | | | $ | 1,019.46 | | | $ | 5.80 | | | | 1.14 | % |
Class C | | | | | | | | | | | | | | | | |
Actual | | $ | 1,000.00 | | | $ | 1,107.08 | | | $ | 10.04 | | | | 1.89 | % |
Hypothetical (5% return before expenses) | | $ | 1,000.00 | | | $ | 1,015.68 | | | $ | 9.60 | | | | 1.89 | % |
Class R | | | | | | | | | | | | | | | | |
Actual | | $ | 1,000.00 | | | $ | 1,110.38 | | | $ | 7.39 | | | | 1.39 | % |
Hypothetical (5% return before expenses) | | $ | 1,000.00 | | | $ | 1,018.20 | | | $ | 7.07 | | | | 1.39 | % |
Class R6 | | | | | | | | | | | | | | | | |
Actual | | $ | 1,000.00 | | | $ | 1,113.50 | | | $ | 4.47 | | | | 0.84 | % |
Hypothetical (5% return before expenses) | | $ | 1,000.00 | | | $ | 1,020.97 | | | $ | 4.28 | | | | 0.84 | % |
Administrator Class | | | | | | | | | | | | | | | | |
Actual | | $ | 1,000.00 | | | $ | 1,112.05 | | | $ | 6.07 | | | | 1.14 | % |
Hypothetical (5% return before expenses) | | $ | 1,000.00 | | | $ | 1,019.46 | | | $ | 5.80 | | | | 1.14 | % |
Institutional Class | | | | | | | | | | | | | | | | |
Actual | | $ | 1,000.00 | | | $ | 1,112.96 | | | $ | 4.74 | | | | 0.89 | % |
Hypothetical (5% return before expenses) | | $ | 1,000.00 | | | $ | 1,020.72 | | | $ | 4.53 | | | | 0.89 | % |
| 1 | Expenses paid is equal to the annualized net expense ratio of each class multiplied by the average account value over the period, multiplied by the number of days in the most recent fiscal half-year divided by the number of days in the fiscal year (to reflect the one-half-year period). |
| | | | | | |
| Portfolio of investments—October 31, 2017 | | Wells Fargo International Equity Fund | | | 11 | |
| | | | | | | | | | | | | | | | |
| Security name | | | | | | | | Shares | | | Value | |
|
Common Stocks: 91.27% | |
| | | | |
| Brazil: 2.71% | | | | | | | | | | | | | | | | |
Cosan Limited Class A (Energy, Oil, Gas & Consumable Fuels) | | | | | | | | | | | 1,466,709 | | | $ | 12,745,701 | |
| | | | | | | | | | | | | | | | |
| | | | |
| Canada: 2.26% | | | | | | | | | | | | | | | | |
Lundin Mining Corporation (Materials, Metals & Mining) | | | | | | | | | | | 1,391,645 | | | | 10,614,516 | |
| | | | | | | | | | | | | | | | |
| | | | |
| China: 6.98% | | | | | | | | | | | | | | | | |
China Everbright Limited (Financials, Capital Markets) | | | | | | | | | | | 2,054,000 | | | | 4,870,792 | |
China Mobile Limited (Telecommunication Services, Wireless Telecommunication Services) | | | | | | | | | | | 1,080,000 | | | | 10,846,515 | |
Hollysys Automation Technologies Limited (Information Technology, Electronic Equipment, Instruments & Components) | | | | | | | | | | | 451,098 | | | | 10,127,150 | |
Industrial & Commercial Bank of China Limited H Shares (Financials, Banks) | | | | | | | | | | | 1,935,000 | | | | 1,535,321 | |
Shanghai Pharmaceuticals Holding Company Limited H Shares (Health Care, Health Care Providers & Services) | | | | | | | | | | | 2,096,400 | | | | 5,414,728 | |
| |
| | | | 32,794,506 | |
| | | | | | | | | | | | | | | | |
| | | | |
| Denmark: 0.31% | | | | | | | | | | | | | | | | |
Novo Nordisk AS Class B (Health Care, Pharmaceuticals) | | | | | | | | | | | 29,200 | | | | 1,452,629 | |
| | | | | | | | | | | | | | | | |
| | | | |
| France: 5.67% | | | | | | | | | | | | | | | | |
Compagnie de Saint-Gobain SA (Industrials, Building Products) | | | | | | | | | | | 271,745 | | | | 15,941,057 | |
Orange SA (Telecommunication Services, Diversified Telecommunication Services) | | | | | | | | | | | 653,237 | | | | 10,717,598 | |
| |
| | | | 26,658,655 | |
| | | | | | | | | | | | | | | | |
| | | | |
| Germany: 13.87% | | | | | | | | | | | | | | | | |
Bayer AG (Health Care, Pharmaceuticals) | | | | | | | | | | | 104,197 | | | | 13,557,456 | |
Ceconomy AG (Consumer Discretionary, Specialty Retail) | | | | | | | | | | | 358,829 | | | | 4,681,396 | |
Metro AG (Consumer Staples, Food & Staples Retailing) † | | | | | | | | | | | 358,829 | | | | 6,852,811 | |
Muenchener Rueckversicherungs Gesellschaft AG (Financials, Insurance) | | | | | | | | | | | 38,423 | | | | 8,595,584 | |
Rheinmetall AG (Industrials, Industrial Conglomerates) | | | | | | | | | | | 66,449 | | | | 7,837,062 | |
SAP SE (Information Technology, Software) | | | | | | | | | | | 74,269 | | | | 8,448,782 | |
Siemens AG (Industrials, Industrial Conglomerates) | | | | | | | | | | | 106,893 | | | | 15,252,997 | |
| |
| | | | 65,226,088 | |
| | | | | | | | | | | | | | | | |
| | | | |
| Hong Kong: 1.39% | | | | | | | | | | | | | | | | |
Xinyi Glass Holdings Limited (Consumer Discretionary, Auto Components) | | | | | | | | | | | 6,766,000 | | | | 6,547,966 | |
| | | | | | | | | | | | | | | | |
| | | | |
| Italy: 7.12% | | | | | | | | | | | | | | | | |
Eni SpA (Energy, Oil, Gas & Consumable Fuels) | | | | | | | | | | | 1,030,965 | | | | 16,860,904 | |
Prysmian SpA (Industrials, Electrical Equipment) | | | | | | | | | | | 43,799 | | | | 1,510,170 | |
UniCredit SpA (Financials, Banks) † | | | | | | | | | | | 789,848 | | | | 15,116,488 | |
| |
| | | | 33,487,562 | |
| | | | | | | | | | | | | | | | |
| | | | |
| Japan: 9.64% | | | | | | | | | | | | | | | | |
Daiwa Securities Group Incorporated (Financials, Capital Markets) | | | | | | | | | | | 1,032,000 | | | | 6,405,016 | |
Hitachi Limited (Information Technology, Electronic Equipment, Instruments & Components) | | | | | | | | | | | 2,161,000 | | | | 17,047,773 | |
Mitsubishi UFJ Financial Group Incorporated (Financials, Banks) | | | | | | | | | | | 1,217,400 | | | | 8,163,823 | |
Nomura Holdings Incorporated (Financials, Capital Markets) | | | | | | | | | | | 2,401,000 | | | | 13,700,091 | |
| |
| | | | 45,316,703 | |
| | | | | | | | | | | | | | | | |
The accompanying notes are an integral part of these financial statements.
| | | | |
| 12 | | Wells Fargo International Equity Fund | | Portfolio of investments—October 31, 2017 |
| | | | | | | | | | | | | | | | |
| Security name | | | | | | | | Shares | | | Value | |
| | | | |
| Malaysia: 2.86% | | | | | | | | | | | | | | | | |
CIMB Group Holdings Bhd (Financials, Banks) | | | | | | | | | | | 9,255,563 | | | $ | 13,423,682 | |
| | | | | | | | | | | | | | | | |
| | | | |
| Netherlands: 10.79% | | | | | | | | | | | | | | | | |
Koninklijke Philips NV (Industrials, Industrial Conglomerates) | | | | | | | | | | | 318,132 | | | | 12,953,481 | |
NN Group NV (Financials, Insurance) | | | | | | | | | | | 367,983 | | | | 15,414,068 | |
OCI NV (Materials, Chemicals) Ǡ | | | | | | | | | | | 379,273 | | | | 8,997,175 | |
Sensata Technologies Holding NV (Industrials, Electrical Equipment) † | | | | | | | | | | | 273,186 | | | | 13,361,527 | |
| | | | |
| | | | | | | | | | | | | | | 50,726,251 | |
| | | | | | | | | | | | | | | | |
| | | | |
| Norway: 3.58% | | | | | | | | | | | | | | | | |
Den Norske Bank ASA (Financials, Banks) | | | | | | | | | | | 873,997 | | | | 16,852,905 | |
| | | | | | | | | | | | | | | | |
| | | | |
| Russia: 1.50% | | | | | | | | | | | | | | | | |
Mobile TeleSystems PJSC ADR (Telecommunication Services, Wireless Telecommunication Services) | | | | | | | | | | | 665,509 | | | | 7,061,050 | |
| | | | | | | | | | | | | | | | |
| | | | |
| South Africa: 2.32% | | | | | | | | | | | | | | | | |
Sasol Limited (Materials, Chemicals) | | | | | | | | | | | 372,724 | | | | 10,905,118 | |
| | | | | | | | | | | | | | | | |
| | | | |
| South Korea: 5.27% | | | | | | | | | | | | | | | | |
Hana Financial Group Incorporated (Financials, Banks) | | | | | | | | | | | 212,530 | | | | 9,096,098 | |
Samsung Electronics Company Limited GDR (Information Technology, Technology Hardware, Storage & Peripherals) 144A | | | | | | | | | | | 2,644 | | | | 3,260,052 | |
SK Telecom Company Limited (Telecommunication Services, Wireless Telecommunication Services) | | | | | | | | | | | 52,630 | | | | 12,401,767 | |
| | | | |
| | | | | | | | | | | | | | | 24,757,917 | |
| | | | | | | | | | | | | | | | |
| | | | |
| Switzerland: 3.70% | | | | | | | | | | | | | | | | |
Novartis AG (Health Care, Pharmaceuticals) | | | | | | | | | | | 183,331 | | | | 15,105,306 | |
Zurich Insurance Group AG (Financials, Insurance) | | | | | | | | | | | 7,506 | | | | 2,290,961 | |
| | | | |
| | | | | | | | | | | | | | | 17,396,267 | |
| | | | | | | | | | | | | | | | |
| | | | |
| United Kingdom: 8.76% | | | | | | | | | | | | | | | | |
Man Group plc (Financials, Capital Markets) | | | | | | | | | | | 3,888,750 | | | | 9,999,137 | |
Smiths Group plc (Industrials, Industrial Conglomerates) | | | | | | | | | | | 221,180 | | | | 4,614,973 | |
United Business Media plc (Consumer Discretionary, Media) | | | | | | | | | | | 1,136,931 | | | | 10,622,955 | |
Vodafone Group plc (Telecommunication Services, Wireless Telecommunication Services) | | | | | | | | | | | 5,566,458 | | | | 15,939,504 | |
| | | | |
| | | | | | | | | | | | | | | 41,176,569 | |
| | | | | | | | | | | | | | | | |
| | | | |
| United States: 2.54% | | | | | | | | | | | | | | | | |
Apple Incorporated (Information Technology, Technology Hardware, Storage & Peripherals) | | | | | | | | | | | 33,432 | | | | 5,651,345 | |
Tapestry Incorporated (Consumer Discretionary, Textiles, Apparel & Luxury Goods) | | | | | | | | | | | 153,491 | | | | 6,285,456 | |
| | | | |
| | | | | | | | | | | | | | | 11,936,801 | |
| | | | | | | | | | | | | | | | |
| | | | |
Total Common Stocks (Cost $350,113,519) | | | | | | | | | | | | | | | 429,080,886 | |
| | | | | | | | | | | | | | | | |
| | | | |
| | | | | | Expiration date | | | | | | | |
| Participation Notes: 1.42% | | | | | | | | | | | | | | | | |
| | | | |
| China: 1.42% | | | | | | | | | | | | | | | | |
HSBC Bank plc (Kweichow Moutai Company Limited Class A) (Consumer Staples, Beverages) 144A†(a) | | | | | | | 2-19-2019 | | | | 47,806 | | | | 4,455,938 | |
HSBC Bank plc (Kweichow Moutai Company Limited Class A) (Consumer Staples, Beverages) †(a) | | | | | | | 12-4-2024 | | | | 23,731 | | | | 2,211,937 | |
| | | | |
Total Participation Notes (Cost $2,038,877) | | | | | | | | | | | | | | | 6,667,875 | |
| | | | | | | | | | | | | | | | |
The accompanying notes are an integral part of these financial statements.
| | | | | | |
| Portfolio of investments—October 31, 2017 | | Wells Fargo International Equity Fund | | | 13 | |
| | | | | | | | | | | | | | | | |
| Security name | | Yield | | | | | | Shares | | | Value | |
| | | | |
Short-Term Investments: 7.37% | | | | | | | | | | | | | | | | |
| | | | |
| Investment Companies: 7.37% | | | | | | | | | | | | | | | | |
Securities Lending Cash Investment LLC (l)(r)(u) | | | 1.26 | % | | | | | | | 2,149,231 | | | $ | 2,149,446 | |
Wells Fargo Government Money Market Fund Select Class (l)(u) | | | 0.96 | | | | | | | | 32,495,353 | | | | 32,495,353 | |
| |
Total Short-Term Investments (Cost $34,644,784) | | | | 34,644,799 | |
| | | | | | | | | | | | | | | | |
| | | | | | | | |
| Total investments in securities (Cost $386,797,180) | | | 100.06 | % | | | 470,393,560 | |
Other assets and liabilities, net | | | (0.06 | ) | | | (298,078 | ) |
| | | | | | | | |
| Total net assets | | | 100.00 | % | | $ | 470,095,482 | |
| | | | | | | | |
| † | Non-income-earning security |
| « | All or a portion of this security is on loan. |
| 144A | The security may be resold in transactions exempt from registration, normally to qualified institutional buyers, pursuant to Rule 144A under the Securities Act of 1933. |
| (a) | The security is fair valued in accordance with procedures approved by the Board of Trustees. |
| (l) | The issuer of the security is an affiliated person of the Fund as defined in the Investment Company Act of 1940. |
| (r) | The investment is a non-registered investment company purchased with cash collateral received from securities on loan. |
| (u) | The rate represents the 7-day annualized yield at period end. |
Forward Foreign Currency Contracts
| | | | | | | | | | | | | | |
Currency to be
received | | Currency to be
delivered | | Counterparty¤¤ | | Settlement date | | Unrealized
gains | | | Unrealized
losses | |
| 24,461,954 USD | | 18,474,600 GBP | | Morgan Stanley | | 12-12-2017 | | $ | 0 | | | $ | (104,105 | ) |
| 25,936,617 USD | | 21,925,000 EUR | | Goldman Sachs | | 1-30-2018 | | | 262,354 | | | | 0 | |
| | ¤¤ | Transactions can only be closed with the originating counterparty. |
Investments in Affiliates
An affiliated investment is an investment in which the Fund owns at least 5% of the outstanding voting shares of the issuer or as a result of other relationships, such as the Fund and the issuer having the same investment manager. Transactions with issuers that were either affiliated persons of the Fund at the beginning of the period or the end of the period were as follows:
| | | | | | | | | | | | | | | | | | | | | | | | | | | | | | | | | | | | |
| | | Shares,
beginning of
period | | | Shares
purchased | | | Shares
sold | | | Shares,
end of
period | | | Net
realized
gains
(losses) | | | Net change in
unrealized
gains
(losses) | | | Income
from
affiliated
securities | | | Value,
end
of period | | | % of
net
assets | |
Short-Term Investments | | | | | | | | | | | | | | | | | | | | | | | | | | | | | | | | | | | | |
Investment companies | | | | | | | | | | | | | | | | | | | | | | | | | | | | | | | | | | | | |
Securities Lending Cash Investment LLC | | | 3,155,666 | | | | 132,499,452 | | | | 133,505,887 | | | | 2,149,231 | | | $ | 291 | | | $ | (292 | ) | | $ | 191,923 | | | $ | 2,149,446 | | | | | |
Wells Fargo Government Money Market Fund Select Class | | | 38,856,450 | | | | 221,840,934 | | | | 228,202,031 | | | | 32,495,353 | | | | 0 | | | | 0 | | | | 214,920 | | | | 32,495,353 | | | | | |
| | | | | | | | | | | | | | | | | | | | | | | | | | | | | | | | | | | | |
| | | | | | | | | | | | | | | | | | $ | 291 | | | $ | (292 | ) | | $ | 406,843 | | | $ | 34,644,799 | | | | 7.37 | % |
| | | | | | | | | | | | | | | | | | | | | | | | | | | | | | | | | | | | |
The accompanying notes are an integral part of these financial statements.
| | | | |
| 14 | | Wells Fargo International Equity Fund | | Statement of assets and liabilities—October 31, 2017 |
| | | | |
| | | | |
| |
Assets | | | | |
Investments in unaffiliated securities (including $2,081,087 of securities loaned), at value (cost $352,152,396) | | $ | 435,748,761 | |
Investments in affiliated securities, at value (cost $34,644,784) | | | 34,644,799 | |
Foreign currency, at value (cost $69,235) | | | 70,279 | |
Receivable for investments sold | | | 1,249,948 | |
Receivable for Fund shares sold | | | 1,048,734 | |
Receivable for dividends | | | 1,639,990 | |
Receivable for securities lending income | | | 4,557 | |
Unrealized gains on forward foreign currency contracts | | | 262,354 | |
Prepaid expenses and other assets | | | 10,003 | |
| | | | |
Total assets | | | 474,679,425 | |
| | | | |
| |
Liabilities | | | | |
Payable upon receipt of securities loaned | | | 2,149,140 | |
Payable for Fund shares redeemed | | | 1,222,444 | |
Cash collateral due to broker | | | 602,000 | |
Management fee payable | | | 243,066 | |
Unrealized losses on forward foreign currency contracts | | | 104,105 | |
Administration fees payable | | | 54,420 | |
Distribution fees payable | | | 18,639 | |
Trustees’ fees and expenses payable | | | 1,346 | |
Accrued expenses and other liabilities | | | 188,783 | |
| | | | |
Total liabilities | | | 4,583,943 | |
| | | | |
Total net assets | | $ | 470,095,482 | |
| | | | |
| |
NET ASSETS CONSIST OF | | | | |
Paid-in capital | | $ | 386,112,624 | |
Undistributed net investment income | | | 16,241,700 | |
Accumulated net realized losses on investments | | | (16,029,662 | ) |
Net unrealized gains on investments | | | 83,770,820 | |
| | | | |
Total net assets | | $ | 470,095,482 | |
| | | | |
| |
COMPUTATION OF NET ASSET VALUE AND OFFERING PRICE PER SHARE | | | | |
Net assets – Class A | | $ | 109,655,002 | |
Shares outstanding – Class A1 | | | 8,165,975 | |
Net asset value per share – Class A | | | $13.43 | |
Maximum offering price per share – Class A2 | | | $14.25 | |
Net assets – Class C | | $ | 28,919,484 | |
Shares outstanding – Class C1 | | | 2,202,447 | |
Net asset value per share – Class C | | | $13.13 | |
Net assets – Class R | | $ | 1,995,660 | |
Shares outstanding – Class R1 | | | 146,909 | |
Net asset value per share – Class R | | | $13.58 | |
Net assets – Class R6 | | $ | 74,405,100 | |
Shares outstanding – Class R61 | | | 5,537,501 | |
Net asset value per share – Class R6 | | | $13.44 | |
Net assets – Administrator Class | | $ | 18,173,742 | |
Shares outstanding – Administrator Class1 | | | 1,376,824 | |
Net asset value per share – Administrator Class | | | $13.20 | |
Net assets – Institutional Class | | $ | 236,946,494 | |
Shares outstanding – Institutional Class1 | | | 17,682,263 | |
Net asset value per share – Institutional Class | | | $13.40 | |
| 1 | The Fund has an unlimited number of authorized shares. |
| 2 | Maximum offering price is computed as 100/94.25 of net asset value. On investments of $50,000 or more, the offering price is reduced. |
The accompanying notes are an integral part of these financial statements.
| | | | | | |
| Statement of operations—year ended October 31, 2017 | | Wells Fargo International Equity Fund | | | 15 | |
| | | | |
| | | | |
| |
Investment income | | | | |
Dividends (net of foreign withholding taxes of $1,333,361) | | $ | 12,903,594 | |
Income from affiliated securities | | | 406,843 | |
| | | | |
Total investment income | | | 13,310,437 | |
| | | | |
| |
Expenses | | | | |
Management fee | | | 3,568,342 | |
Administration fees | | | | |
Class A | | | 227,630 | |
Class B | | | 617 | 1 |
Class C | | | 56,771 | |
Class R | | | 4,052 | |
Class R6 | | | 12,800 | |
Administrator Class | | | 26,945 | |
Institutional Class | | | 274,756 | |
Shareholder servicing fees | | | | |
Class A | | | 270,988 | |
Class B | | | 735 | 1 |
Class C | | | 67,584 | |
Class R | | | 4,824 | |
Administrator Class | | | 51,493 | |
Distribution fees | | | | |
Class B | | | 2,205 | 1 |
Class C | | | 202,752 | |
Class R | | | 4,824 | |
Custody and accounting fees | | | 173,436 | |
Professional fees | | | 83,091 | |
Registration fees | | | 192,162 | |
Shareholder report expenses | | | 95,688 | |
Trustees’ fees and expenses | | | 21,475 | |
Other fees and expenses | | | 25,508 | |
| | | | |
Total expenses | | | 5,368,678 | |
Less: Fee waivers and/or expense reimbursements | | | (1,113,962 | ) |
| | | | |
Net expenses | | | 4,254,716 | |
| | | | |
Net investment income | | | 9,055,721 | |
| | | | |
| |
REALIZED AND UNREALIZED GAINS (LOSSES) ON INVESTMENTS | | | | |
| |
Net realized gains on: | | | | |
Unaffiliated securities | | | 21,276,002 | |
Affiliated securities | | | 291 | |
Forward foreign currency contract transactions | | | 749,869 | |
| | | | |
Net realized gains on investments | | | 22,026,162 | |
| | | | |
| |
Net change in unrealized gains (losses) on: | | | | |
Unaffiliated securities | | | 61,635,047 | |
Affiiliated securities | | | (292 | ) |
Forward foreign currency contract transactions | | | (1,062,785 | ) |
| | | | |
Net change in unrealized gains (losses) on investments | | | 60,571,970 | |
| | | | |
Net realized and unrealized gains (losses) on investments | | | 82,598,132 | |
| | | | |
Net increase in net assets resulting from operations | | $ | 91,653,853 | |
| | | | |
| 1 | For the period from November 1, 2016 to May 5, 2017. Effective at the close of business on May 5, 2017, Class B shares were converted to Class A shares and are no longer offered by the Fund. |
The accompanying notes are an integral part of these financial statements.
| | | | |
| 16 | | Wells Fargo International Equity Fund | | Statement of changes in net assets |
| | | | | | | | | | | | | | | | |
| | | Year ended
October 31, 2017 | | | Year ended
October 31, 2016 | |
| | | | |
Operations | | | | | | | | | | | | | | | | |
Net investment income | | | | | | $ | 9,055,721 | | | | | | | $ | 8,536,868 | |
Net realized gains (losses) on investments | | | | | | | 22,026,162 | | | | | | | | (24,356,272 | ) |
Net change in unrealized gains (losses) on investments | | | | | | | 60,571,970 | | | | | | | | (1,641,199 | ) |
| | | | |
Net increase (decrease) in net assets resulting from operations | | | | | | | 91,653,853 | | | | | | | | (17,460,603 | ) |
| | | | |
| | | | |
Distributions to shareholders from | | | | | | | | | | | | | | | | |
Net investment income | | | | | | | | | | | | | | | | |
Class A | | | | | | | (3,419,346 | ) | | | | | | | (1,980,548 | ) |
Class B | | | | | | | (8,853 | )1 | | | | | | | (4,737 | ) |
Class C | | | | | | | (543,400 | ) | | | | | | | (292,082 | ) |
Class R | | | | | | | (49,858 | ) | | | | | | | (24,021 | ) |
Class R6 | | | | | | | (681,611 | ) | | | | | | | (338 | ) |
Administrator Class | | | | | | | (583,495 | ) | | | | | | | (731,926 | ) |
Institutional Class | | | | | | | (6,175,331 | ) | | | | | | | (3,153,699 | ) |
| | | | |
Total distributions to shareholders | | | | | | | (11,461,894 | ) | | | | | | | (6,187,351 | ) |
| | | | |
| | | | |
Capital share transactions | | | Shares | | | | | | | | Shares | | | | | |
Proceeds from shares sold | | | | | | | | | | | | | | | | |
Class A | | | 1,631,046 | | | | 19,984,132 | | | | 3,672,410 | | | | 40,169,639 | |
Class B | | | 0 | 1 | | | 0 | 1 | | | 815 | | | | 8,671 | |
Class C | | | 398,900 | | | | 4,843,542 | | | | 998,881 | | | | 10,835,255 | |
Class R | | | 34,029 | | | | 414,621 | | | | 72,262 | | | | 801,881 | |
Class R6 | | | 5,473,610 | | | | 65,619,194 | | | | 51 | | | | 541 | |
Administrator Class | | | 659,302 | | | | 7,618,280 | | | | 2,805,944 | | | | 30,263,453 | |
Institutional Class | | | 10,000,651 | | | | 119,901,457 | | | | 9,957,611 | | | | 108,139,415 | |
| | | | |
| | | | | | | 218,381,226 | | | | | | | | 190,218,855 | |
| | | | |
Reinvestment of distributions | | | | | | | | | | | | | | | | |
Class A | | | 289,214 | | | | 3,207,383 | | | | 167,795 | | | | 1,860,967 | |
Class B | | | 801 | 1 | | | 8,812 | 1 | | | 431 | | | | 4,689 | |
Class C | | | 43,293 | | | | 472,331 | | | | 23,355 | | | | 254,804 | |
Class R | | | 1,205 | | | | 13,541 | | | | 822 | | | | 9,244 | |
Class R6 | | | 61,573 | | | | 681,611 | | | | 30 | | | | 338 | |
Administrator Class | | | 53,401 | | | | 582,070 | | | | 67,082 | | | | 731,191 | |
Institutional Class | | | 436,449 | | | | 4,818,398 | | | | 230,119 | | | | 2,542,811 | |
| | | | |
| | | | | | | 9,784,146 | | | | | | | | 5,404,044 | |
| | | | |
Payment for shares redeemed | | | | | | | | | | | | | | | | |
Class A | | | (4,793,391 | ) | | | (56,593,909 | ) | | | (5,436,299 | ) | | | (57,973,044 | ) |
Class B | | | (88,742 | )1 | | | (1,021,023 | )1 | | | (148,673 | ) | | | (1,557,542 | ) |
Class C | | | (782,261 | ) | | | (9,154,193 | ) | | | (1,053,145 | ) | | | (11,165,445 | ) |
Class R | | | (69,529 | ) | | | (831,199 | ) | | | (76,036 | ) | | | (818,347 | ) |
Class R6 | | | (59 | ) | | | (691 | ) | | | 0 | | | | 0 | |
Administrator Class | | | (2,647,963 | ) | | | (29,828,261 | ) | | | (4,192,576 | ) | | | (44,163,215 | ) |
Institutional Class | | | (9,276,734 | ) | | | (112,265,403 | ) | | | (10,441,636 | ) | | | (109,679,342 | ) |
| | | | |
| | | | | | | (209,694,679 | ) | | | | | | | (225,356,935 | ) |
| | | | |
Net increase (decrease) in net assets resulting from capital share transactions | | | | | | | 18,470,693 | | | | | | | | (29,734,036 | ) |
| | | | |
Total increase (decrease) in net assets | | | | | | | 98,662,652 | | | | | | | | (53,381,990 | ) |
| | | | |
| | | | |
Net assets | | | | | | | | | | | | | | | | |
Beginning of period | | | | | | | 371,432,830 | | | | | | | | 424,814,820 | |
| | | | |
End of period | | | | | | $ | 470,095,482 | | | | | | | $ | 371,432,830 | |
| | | | |
Undistributed net investment income | | | | | | $ | 16,241,700 | | | | | | | $ | 10,190,249 | |
| | | | |
| 1 | For the period from November 1, 2016 to May 5, 2017. Effective at the close of business on May 5, 2017, Class B shares were converted to Class A shares and are no longer offered by the Fund. |
The accompanying notes are an integral part of these financial statements.
| | | | | | |
| Financial highlights | | Wells Fargo International Equity Fund | | | 17 | |
(For a share outstanding throughout each period)
| | | | | | | | | | | | | | | | | | | | |
| | | Year ended October 31 | |
| CLASS A | | 2017 | | | 2016 | | | 2015 | | | 2014 | | | 2013 | |
Net asset value, beginning of period | | | $11.07 | | | | $11.53 | | | | $11.28 | | | | $11.98 | | | | $9.77 | |
Net investment income | | | 0.22 | | | | 0.22 | | | | 0.18 | 1 | | | 0.37 | 1 | | | 0.21 | |
Net realized and unrealized gains (losses) on investments | | | 2.47 | | | | (0.54 | ) | | | 0.57 | | | | (0.81 | ) | | | 2.27 | |
| | | | | | | | | | | | | | | | | | | | |
Total from investment operations | | | 2.69 | | | | (0.32 | ) | | | 0.75 | | | | (0.44 | ) | | | 2.48 | |
Distributions to shareholders from | | | | | | | | | | | | | | | | | | | | |
Net investment income | | | (0.33 | ) | | | (0.14 | ) | | | (0.50 | ) | | | (0.26 | ) | | | (0.27 | ) |
Net asset value, end of period | | | $13.43 | | | | $11.07 | | | | $11.53 | | | | $11.28 | | | | $11.98 | |
Total return2 | | | 24.91 | % | | | (2.76 | )% | | | 6.85 | % | | | (3.77 | )% | | | 25.99 | % |
Ratios to average net assets (annualized) | | | | | | | | | | | | | | | | | | | | |
Gross expenses | | | 1.47 | % | | | 1.47 | % | | | 1.53 | % | | | 1.53 | % | | | 1.56 | % |
Net expenses | | | 1.14 | % | | | 1.12 | % | | | 1.09 | % | | | 1.09 | % | | | 1.09 | % |
Net investment income | | | 1.82 | % | | | 2.04 | % | | | 1.50 | % | | | 3.14 | % | | | 2.03 | % |
Supplemental data | | | | | | | | | | | | | | | | | | | | |
Portfolio turnover rate | | | 59 | % | | | 65 | % | | | 27 | % | | | 32 | % | | | 38 | % |
Net assets, end of period (000s omitted) | | | $109,655 | | | | $122,248 | | | | $145,654 | | | | $97,640 | | | | $115,821 | |
| 1 | Calculated based upon average shares outstanding |
| 2 | Total return calculations do not include any sales charges. |
The accompanying notes are an integral part of these financial statements.
| | | | |
| 18 | | Wells Fargo International Equity Fund | | Financial highlights |
(For a share outstanding throughout each period)
| | | | | | | | | | | | | | | | | | | | |
| | | Year ended October 31 | |
| CLASS C | | 2017 | | | 2016 | | | 2015 | | | 2014 | | | 2013 | |
Net asset value, beginning of period | | | $10.82 | | | | $11.30 | | | | $11.06 | | | | $11.75 | | | | $9.58 | |
Net investment income | | | 0.14 | | | | 0.14 | | | | 0.08 | 1 | | | 0.27 | 1 | | | 0.14 | 1 |
Net realized and unrealized gains (losses) on investments | | | 2.40 | | | | (0.53 | ) | | | 0.57 | | | | (0.79 | ) | | | 2.22 | |
| | | | | | | | | | | | | | | | | | | | |
Total from investment operations | | | 2.54 | | | | (0.39 | ) | | | 0.65 | | | | (0.52 | ) | | | 2.36 | |
Distributions to shareholders from | | | | | | | | | | | | | | | | | | | | |
Net investment income | | | (0.23 | ) | | | (0.09 | ) | | | (0.41 | ) | | | (0.17 | ) | | | (0.19 | ) |
Net asset value, end of period | | | $13.13 | | | | $10.82 | | | | $11.30 | | | | $11.06 | | | | $11.75 | |
Total return2 | | | 23.91 | % | | | (3.43 | )% | | | 6.03 | % | | | (4.49 | )% | | | 25.05 | % |
Ratios to average net assets (annualized) | | | | | | | | | | | | | | | | | | | | |
Gross expenses | | | 2.22 | % | | | 2.22 | % | | | 2.28 | % | | | 2.28 | % | | | 2.31 | % |
Net expenses | | | 1.89 | % | | | 1.87 | % | | | 1.84 | % | | | 1.84 | % | | | 1.84 | % |
Net investment income | | | 1.26 | % | | | 1.33 | % | | | 0.72 | % | | | 2.37 | % | | | 1.30 | % |
Supplemental data | | | | | | | | | | | | | | | | | | | | |
Portfolio turnover rate | | | 59 | % | | | 65 | % | | | 27 | % | | | 32 | % | | | 38 | % |
Net assets, end of period (000s omitted) | | | $28,919 | | | | $27,508 | | | | $29,080 | | | | $16,346 | | | | $16,997 | |
| 1 | Calculated based upon average shares outstanding |
| 2 | Total return calculations do not include any sales charges. |
The accompanying notes are an integral part of these financial statements.
| | | | | | |
| Financial highlights | | Wells Fargo International Equity Fund | | | 19 | |
(For a share outstanding throughout each period)
| | | | | | | | | | | | | | | | | | | | |
| | | Year ended October 31 | |
| CLASS R | | 2017 | | | 2016 | | | 2015 | | | 2014 | | | 2013 | |
Net asset value, beginning of period | | | $11.20 | | | | $11.66 | | | | $11.40 | | | | $11.96 | | | | $9.75 | |
Net investment income | | | 0.20 | 1 | | | 0.19 | 1 | | | 0.15 | 1 | | | 0.32 | 1 | | | 0.18 | 1 |
Net realized and unrealized gains (losses) on investments | | | 2.48 | | | | (0.53 | ) | | | 0.57 | | | | (0.79 | ) | | | 2.27 | |
| | | | | | | | | | | | | | | | | | | | |
Total from investment operations | | | 2.68 | | | | (0.34 | ) | | | 0.72 | | | | (0.47 | ) | | | 2.45 | |
Distributions to shareholders from | | | | | | | | | | | | | | | | | | | | |
Net investment income | | | (0.30 | ) | | | (0.12 | ) | | | (0.46 | ) | | | (0.09 | ) | | | (0.24 | ) |
Net asset value, end of period | | | $13.58 | | | | $11.20 | | | | $11.66 | | | | $11.40 | | | | $11.96 | |
Total return | | | 24.47 | % | | | (2.94 | )% | | | 6.53 | % | | | (4.00 | )% | | | 25.68 | % |
Ratios to average net assets (annualized) | | | | | | | | | | | | | | | | | | | | |
Gross expenses | | | 1.72 | % | | | 1.72 | % | | | 1.78 | % | | | 1.78 | % | | | 1.81 | % |
Net expenses | | | 1.39 | % | | | 1.37 | % | | | 1.34 | % | | | 1.34 | % | | | 1.34 | % |
Net investment income | | | 1.66 | % | | | 1.77 | % | | | 1.23 | % | | | 2.71 | % | | | 1.72 | % |
Supplemental data | | | | | | | | | | | | | | | | | | | | |
Portfolio turnover rate | | | 59 | % | | | 65 | % | | | 27 | % | | | 32 | % | | | 38 | % |
Net assets, end of period (000s omitted) | | | $1,996 | | | | $2,029 | | | | $2,147 | | | | $1,576 | | | | $2,234 | |
| 1 | Calculated based upon average shares outstanding |
The accompanying notes are an integral part of these financial statements.
| | | | |
| 20 | | Wells Fargo International Equity Fund | | Financial highlights |
(For a share outstanding throughout each period)
| | | | | | | | | | | | |
| | | Year ended October 31 | |
| CLASS R6 | | 2017 | | | 2016 | | | 20151 | |
Net asset value, beginning of period | | | $11.06 | | | | $11.49 | | | | $10.89 | |
Net investment income | | | 0.45 | 2 | | | 0.24 | | | | 0.00 | 3 |
Net realized and unrealized gains (losses) on investments | | | 2.27 | | | | (0.52 | ) | | | 0.60 | |
| | | | | | | | | | | | |
Total from investment operations | | | 2.72 | | | | (0.28 | ) | | | 0.60 | |
Distributions to shareholders from | | | | | | | | | | | | |
Net investment income | | | (0.34 | ) | | | (0.15 | ) | | | 0.00 | |
Net asset value, end of period | | | $13.44 | | | | $11.06 | | | | $11.49 | |
Total return4 | | | 25.30 | % | | | (2.46 | )% | | | 5.51 | % |
Ratios to average net assets (annualized) | | | | | | | | | | | | |
Gross expenses | | | 1.03 | % | | | 1.04 | % | | | 1.05 | % |
Net expenses | | | 0.84 | % | | | 0.85 | % | | | 0.88 | % |
Net investment income | | | 3.55 | % | | | 2.31 | % | | | 0.23 | % |
Supplemental data | | | | | | | | | | | | |
Portfolio turnover rate | | | 59 | % | | | 65 | % | | | 27 | % |
Net assets, end of period (000s omitted) | | | $74,405 | | | | $26 | | | | $26 | |
| 1 | For the period from September 30, 2015 (commencement of class operations) to October 31, 2015 |
| 2 | Calculated based upon average shares outstanding |
| 3 | Amount is less than $0.005. |
| 4 | Returns for periods of less than one year are not annualized. |
The accompanying notes are an integral part of these financial statements.
| | | | | | |
| Financial highlights | | Wells Fargo International Equity Fund | | | 21 | |
(For a share outstanding throughout each period)
| | | | | | | | | | | | | | | | | | | | |
| | | Year ended October 31 | |
| ADMINISTRATOR CLASS | | 2017 | | | 2016 | | | 2015 | | | 2014 | | | 2013 | |
Net asset value, beginning of period | | | $10.88 | | | | $11.33 | | | | $11.09 | | | | $11.79 | | | | $9.62 | |
Net investment income | | | 0.21 | 1 | | | 0.22 | | | | 0.17 | 1 | | | 0.37 | 1 | | | 0.22 | |
Net realized and unrealized gains (losses) on investments | | | 2.43 | | | | (0.53 | ) | | | 0.57 | | | | (0.80 | ) | | | 2.22 | |
| | | | | | | | | | | | | | | | | | | | |
Total from investment operations | | | 2.64 | | | | (0.31 | ) | | | 0.74 | | | | (0.43 | ) | | | 2.44 | |
Distributions to shareholders from | | | | | | | | | | | | | | | | | | | | |
Net investment income | | | (0.32 | ) | | | (0.14 | ) | | | (0.50 | ) | | | (0.27 | ) | | | (0.27 | ) |
Net asset value, end of period | | | $13.20 | | | | $10.88 | | | | $11.33 | | | | $11.09 | | | | $11.79 | |
Total return | | | 24.84 | % | | | (2.71 | )% | | | 6.89 | % | | | (3.82 | )% | | | 26.00 | % |
Ratios to average net assets (annualized) | | | | | | | | | | | | | | | | | | | | |
Gross expenses | | | 1.39 | % | | | 1.38 | % | | | 1.40 | % | | | 1.37 | % | | | 1.37 | % |
Net expenses | | | 1.14 | % | | | 1.12 | % | | | 1.09 | % | | | 1.09 | % | | | 1.09 | % |
Net investment income | | | 1.79 | % | | | 1.93 | % | | | 1.44 | % | | | 3.21 | % | | | 2.08 | % |
Supplemental data | | | | | | | | | | | | | | | | | | | | |
Portfolio turnover rate | | | 59 | % | | | 65 | % | | | 27 | % | | | 32 | % | | | 38 | % |
Net assets, end of period (000s omitted) | | | $18,174 | | | | $36,032 | | | | $52,469 | | | | $12,962 | | | | $3,955 | |
| 1 | Calculated based upon average shares outstanding |
The accompanying notes are an integral part of these financial statements.
| | | | |
| 22 | | Wells Fargo International Equity Fund | | Financial highlights |
(For a share outstanding throughout each period)
| | | | | | | | | | | | | | | | | | | | |
| | | Year ended October 31 | |
| INSTITUTIONAL CLASS | | 2017 | | | 2016 | | | 2015 | | | 2014 | | | 2013 | |
Net asset value, beginning of period | | | $11.05 | | | | $11.49 | | | | $11.25 | | | | $11.96 | | | | $9.76 | |
Net investment income | | | 0.28 | 1 | | | 0.23 | | | | 0.19 | 1 | | | 0.37 | 1 | | | 0.24 | 1 |
Net realized and unrealized gains (losses) on investments | | | 2.43 | | | | (0.52 | ) | | | 0.58 | | | | (0.77 | ) | | | 2.26 | |
| | | | | | | | | | | | | | | | | | | | |
Total from investment operations | | | 2.71 | | | | (0.29 | ) | | | 0.77 | | | | (0.40 | ) | | | 2.50 | |
Distributions to shareholders from | | | | | | | | | | | | | | | | | | | | |
Net investment income | | | (0.36 | ) | | | (0.15 | ) | | | (0.53 | ) | | | (0.31 | ) | | | (0.30 | ) |
Net asset value, end of period | | | $13.40 | | | | $11.05 | | | | $11.49 | | | | $11.25 | | | | $11.96 | |
Total return | | | 25.21 | % | | | (2.48 | )% | | | 7.07 | % | | | (3.53 | )% | | | 26.31 | % |
Ratios to average net assets (annualized) | | | | | | | | | | | | | | | | | | | | |
Gross expenses | | | 1.14 | % | | | 1.14 | % | | | 1.15 | % | | | 1.10 | % | | | 1.13 | % |
Net expenses | | | 0.89 | % | | | 0.87 | % | | | 0.84 | % | | | 0.84 | % | | | 0.84 | % |
Net investment income | | | 2.28 | % | | | 2.27 | % | | | 1.67 | % | | | 3.18 | % | | | 2.29 | % |
Supplemental data | | | | | | | | | | | | | | | | | | | | |
Portfolio turnover rate | | | 59 | % | | | 65 | % | | | 27 | % | | | 32 | % | | | 38 | % |
Net assets, end of period (000s omitted) | | | $236,946 | | | | $182,639 | | | | $192,799 | | | | $63,766 | | | | $82,982 | |
| 1 | Calculated based upon average shares outstanding |
The accompanying notes are an integral part of these financial statements.
| | | | | | |
| Notes to financial statements | | Wells Fargo International Equity Fund | | | 23 | |
1. ORGANIZATION
Wells Fargo Funds Trust (the “Trust”), a Delaware statutory trust organized on March 10, 1999, is an open-end management investment company registered under the Investment Company Act of 1940, as amended (the “1940 Act”). As an investment company, the Trust follows the accounting and reporting guidance in Financial Accounting Standards Board Accounting Standards Codification Topic 946, Financial Services – Investment Companies. These financial statements report on the Wells Fargo International Equity Fund (the “Fund”) which is a diversified series of the Trust.
Effective at the close of business on May 5, 2017, Class B shares were converted to Class A shares and are no longer offered by the Fund. Information for Class B shares reflected in the financial statements represents activity through May 5, 2017.
2. SIGNIFICANT ACCOUNTING POLICIES
The following significant accounting policies, which are consistently followed in the preparation of the financial statements of the Fund, are in conformity with U.S. generally accepted accounting principles which require management to make estimates and assumptions that affect the reported amounts of assets and liabilities, disclosure of contingent assets and liabilities at the date of the financial statements, and the reported amounts of revenues and expenses during the reporting period. Actual results could differ from those estimates.
Securities valuation
All investments are valued each business day as of the close of regular trading on the New York Stock Exchange (generally 4 p.m. Eastern Time), although the Fund may deviate from this calculation time under unusual or unexpected circumstances.
Equity securities that are listed on a foreign or domestic exchange or market are valued at the official closing price or, if none, the last sales price. If no sale occurs on the principal exchange or market that day, a fair value price will be determined in accordance with the Fund’s Valuation Procedures.
The values of securities denominated in foreign currencies are translated into U.S. dollars at rates provided by an independent foreign currency pricing source at a time each business day specified by the Management Valuation Team of Wells Fargo Funds Management, LLC (“Funds Management”).
Many securities markets and exchanges outside the U.S. close prior to the close of the New York Stock Exchange and therefore may not fully reflect trading or events that occur after the close of the principal exchange in which the foreign securities are traded, but before the close of the New York Stock Exchange. If such trading or events are expected to materially affect the value of such securities, then fair value pricing procedures approved by the Board of Trustees of the Fund are applied. These procedures take into account multiple factors including movements in U.S. securities markets after foreign exchanges close. Foreign securities that are fair valued under these procedures are categorized as Level 2 and the application of these procedures may result in transfers between Level 1 and Level 2. Depending on market activity, such fair valuations may be frequent. Such fair value pricing may result in net asset values that are higher or lower than net asset values based on the last reported sales price or latest quoted bid price. On October 31, 2017, such fair value pricing was not used in pricing foreign securities.
Investments in registered open-end investment companies are valued at net asset value. Interests in non-registered investment companies that are redeemable at net asset value are fair valued normally at net asset value.
Investments which are not valued using any of the methods discussed above are valued at their fair value, as determined in good faith by the Board of Trustees. The Board of Trustees has established a Valuation Committee comprised of the Trustees and has delegated to it the authority to take any actions regarding the valuation of portfolio securities that the Valuation Committee deems necessary or appropriate, including determining the fair value of portfolio securities, unless the determination has been delegated to the Management Valuation Team. The Board of Trustees retains the authority to make or ratify any valuation decisions or approve any changes to the Valuation Procedures as it deems appropriate. On a quarterly basis, the Board of Trustees receives reports on any valuation actions taken by the Valuation Committee or the Management Valuation Team which may include items for ratification.
Valuations of fair valued securities are compared to the next actual sales price when available, or other appropriate market values, to assess the continued appropriateness of the fair valuation methodologies used. These securities are fair valued on a day-to-day basis, taking into consideration changes to appropriate market information and any significant changes to the inputs considered in the valuation process until there is a readily available price provided on an exchange or by an independent pricing service. Valuations received from an independent pricing service or independent broker-dealer quotes are periodically validated by comparisons to most recent trades and valuations provided by other independent pricing services in addition to the review of prices by the manager and/or subadviser. Unobservable inputs used in determining fair valuations are identified based on the type of security, taking into consideration factors utilized by market participants in valuing the investment, knowledge about the issuer and the current market environment.
| | | | |
| 24 | | Wells Fargo International Equity Fund | | Notes to financial statements |
Foreign currency translation
The accounting records of the Fund are maintained in U.S. dollars. The values of other assets and liabilities denominated in foreign currencies are translated into U.S. dollars at rates provided by an independent foreign currency pricing source at a time each business day specified by the Management Valuation Team. Purchases and sales of securities, and income and expenses are converted at the rate of exchange on the respective dates of such transactions. Net realized foreign exchange gains or losses arise from sales of foreign currencies, currency gains or losses realized between the trade and settlement dates on securities transactions, and the difference between the amounts of dividends, interest and foreign withholding taxes recorded and the U.S. dollar equivalent of the amounts actually paid or received. Net unrealized foreign exchange gains and losses arise from changes in the fair value of assets and liabilities other than investments in securities resulting from changes in exchange rates. The changes in net assets arising from changes in exchange rates of securities and the changes in net assets resulting from changes in market prices of securities are not separately presented. Such changes are included in net realized and unrealized gains or losses from investments.
Participation notes
The Fund may invest in participation notes to gain exposure to securities in certain foreign markets. Participation notes are issued by banks or broker-dealers and are designed to offer a return linked to a particular underlying foreign security. Participation notes involve transaction costs, which may be higher than those applicable to the underlying foreign security. The holder of the participation note is entitled to receive from the bank or broker-dealer, an amount equal to the dividend paid by the issuer of the underlying foreign security; however, the holder is not entitled to the same rights (i.e. dividends, voting rights) as an owner of the underlying foreign security. Investments in participation notes involve risks beyond those normally associated with a direct investment in an underlying security. The Fund has no rights against the issuer of the underlying foreign security and participation notes expose the Fund to counterparty risk in the event the counterparty does not perform. There is also no assurance there will be a secondary trading market for the participation note or that the trading price of the participation note will equal the underlying value of the foreign security that it seeks to replicate.
Forward foreign currency contracts
The Fund is subject to foreign currency risk in the normal course of pursuing its investment objectives. A forward foreign currency contract is an agreement between two parties to purchase or sell a specific currency for an agreed-upon price at a future date. The Fund enters into forward foreign currency contracts to facilitate transactions in foreign-denominated securities and to attempt to minimize the risk to the Fund from adverse changes in the relationship between currencies. Forward foreign currency contracts are recorded at the forward rate and marked-to-market daily. When the contracts are closed, realized gains and losses arising from such transactions are recorded as realized gains or losses on forward foreign currency contract transactions. The Fund could be exposed to risks if the counterparties to the contracts are unable to meet the terms of their contracts or if the value of the foreign currency changes unfavorably. The Fund’s maximum risk of loss from counterparty credit risk is the unrealized gains on the contracts. This risk may be mitigated if there is a master netting arrangement between the Fund and the counterparty.
Security loans
The Fund may lend its securities from time to time in order to earn additional income in the form of fees or interest on securities received as collateral or the investment of any cash received as collateral. The Fund continues to receive interest or dividends on the securities loaned. The Fund receives collateral in the form of cash or securities with a value at least equal to the value of the securities on loan. The value of the loaned securities is determined at the close of each business day and any additional required collateral is delivered to the Fund on the next business day. In a securities lending transaction, the net asset value of the Fund will be affected by an increase or decrease in the value of the securities loaned and by an increase or decrease in the value of the instrument in which collateral is invested. The amount of securities lending activity undertaken by the Fund fluctuates from time to time. In the event of default or bankruptcy by the borrower, the Fund may be prevented from recovering the loaned securities or gaining access to the collateral or may experience delays or costs in doing so. In addition, the investment of any cash collateral received may lose all or part of its value. The Fund has the right under the lending agreement to recover the securities from the borrower on demand.
The Fund lends its securities through an unaffiliated securities lending agent. Cash collateral received in connection with its securities lending transactions is invested in Securities Lending Cash Investments, LLC (the “Securities Lending Fund”). The Securities Lending Fund is exempt from registration under Section 3(c)(7) of the 1940 Act and is managed by Funds Management and is subadvised by Wells Capital Management Incorporated (“WellsCap”), an affiliate of Funds Management and an indirect wholly owned subsidiary of Wells Fargo & Company (“Wells Fargo”). Funds Management receives an advisory fee starting at 0.05% and declining to 0.01% as the average daily net assets of the Securities Lending Fund increase. All of the fees received by Funds Management are paid to WellsCap for its services as subadviser. The Securities Lending Fund seeks to
| | | | | | |
| Notes to financial statements | | Wells Fargo International Equity Fund | | | 25 | |
provide a positive return compared to the daily Fed Funds Open Rate by investing in high-quality, U.S. dollar-denominated short-term money market instruments. Securities Lending Fund investments are valued at the evaluated bid price provided by an independent pricing service. Income earned from investment in the Securities Lending Fund is included in income from affiliated securities on the Statement of Operations.
Security transactions and income recognition
Securities transactions are recorded on a trade date basis. Realized gains or losses are recorded on the basis of identified cost.
Dividend income is recognized on the ex-dividend date, except for certain dividends from foreign securities, which are recorded as soon as the custodian verifies the ex-dividend date. Dividend income from foreign securities is recorded net of foreign taxes withheld where recovery of such taxes is not assured.
Distributions to shareholders
Distributions to shareholders from net investment income and net realized gains, if any, are recorded on the ex-dividend date. Such distributions are determined in accordance with income tax regulations and may differ from U.S. generally accepted accounting principles. Dividend sources are estimated at the time of declaration. The tax character of distributions is determined as of the Fund’s fiscal year end. Therefore, a portion of the Fund’s distributions made prior to the Fund’s fiscal year end may be categorized as a tax return of capital.
Federal and other taxes
The Fund intends to continue to qualify as a regulated investment company by distributing substantially all of its investment company taxable income and any net realized capital gains (after reduction for capital loss carryforwards) sufficient to relieve it from all, or substantially all, federal income taxes. Accordingly, no provision for federal income taxes was required.
The Fund’s income and federal excise tax returns and all financial records supporting those returns for the prior three fiscal years are subject to examination by the federal and Delaware revenue authorities. Management has analyzed the Fund’s tax positions taken on federal, state, and foreign tax returns for all open tax years and does not believe that there are any uncertain tax positions that require recognition of a tax liability.
As of October 31, 2017, the aggregate cost of all investments for federal income tax purposes was $396,515,460 and the unrealized gains (losses) consisted of:
| | | | |
Gross unrealized gains | | $ | 84,665,680 | |
Gross unrealized losses | | | (10,787,580) | |
Net unrealized gains | | $ | 73,878,100 | |
Reclassifications are made to the Fund’s capital accounts for permanent tax differences to reflect income and gains available for distribution (or available capital loss carryforwards) under federal income tax regulations. U.S. generally accepted accounting principles require that certain components of net assets be adjusted to reflect permanent differences between financial and tax reporting. These reclassifications have no effect on net assets or net asset values per share. The primary permanent differences causing such reclassifications are due to foreign currency transactions and corporate actions. At October 31, 2017, as a result of permanent book-to-tax differences, the following reclassification adjustments were made on the Statement of Assets and Liabilities:
| | |
Undistributed net
investment income | | Accumulated net
realized losses
on investments |
| $8,457,624 | | $(8,457,624) |
As of October 31, 2017 the Fund had capital loss carryforwards which consist of $6,311,382 in short-term capital losses.
Class allocations
The separate classes of shares offered by the Fund differ principally in applicable sales charges, distribution, shareholder servicing, and administration fees. Class specific expenses are charged directly to that share class. Investment income, common expenses, and realized and unrealized gains (losses) on investments are allocated daily to each class of shares based on the relative proportion of net assets of each class.
| | | | |
| 26 | | Wells Fargo International Equity Fund | | Notes to financial statements |
3. FAIR VALUATION MEASUREMENTS
Fair value measurements of investments are determined within a framework that has established a fair value hierarchy based upon the various data inputs utilized in determining the value of the Fund’s investments. The three-level hierarchy gives the highest priority to unadjusted quoted prices in active markets for identical assets or liabilities (Level 1) and the lowest priority to unobservable inputs (Level 3). The Fund’s investments are classified within the fair value hierarchy based on the lowest level of input that is significant to the fair value measurement. The inputs are summarized into three broad levels as follows:
| ∎ | | Level 1 – quoted prices in active markets for identical securities |
| ∎ | | Level 2 – other significant observable inputs (including quoted prices for similar securities, interest rates, prepayment speeds, credit risk, etc.) |
| ∎ | | Level 3 – significant unobservable inputs (including the Fund’s own assumptions in determining the fair value of investments) |
The inputs or methodologies used for valuing investments in securities are not necessarily an indication of the risk associated with investing in those securities.
The following is a summary of the inputs used in valuing the Fund’s assets and liabilities as of October 31, 2017:
| | | | | | | | | | | | | | | | |
| | | Quoted prices
(Level 1) | | | Other significant
observable inputs (Level 2) | | | Significant
unobservable inputs (Level 3) | | | Total | |
Assets | | | | | | | | | | | | | | | | |
Investments in: | | | | | | | | | | | | | | | | |
| | | | |
Common stocks | | | | | | | | | | | | | | | | |
Brazil | | $ | 12,745,701 | | | $ | 0 | | | $ | 0 | | | $ | 12,745,701 | |
Canada | | | 10,614,516 | | | | 0 | | | | 0 | | | | 10,614,516 | |
China | | | 32,794,506 | | | | 0 | | | | 0 | | | | 32,794,506 | |
Denmark | | | 1,452,629 | | | | 0 | | | | 0 | | | | 1,452,629 | |
France | | | 26,658,655 | | | | 0 | | | | 0 | | | | 26,658,655 | |
Germany | | | 65,226,088 | | | | 0 | | | | 0 | | | | 65,226,088 | |
Hong Kong | | | 6,547,966 | | | | 0 | | | | 0 | | | | 6,547,966 | |
Italy | | | 33,487,562 | | | | 0 | | | | 0 | | | | 33,487,562 | |
Japan | | | 45,316,703 | | | | 0 | | | | 0 | | | | 45,316,703 | |
Malaysia | | | 13,423,682 | | | | 0 | | | | 0 | | | | 13,423,682 | |
Netherlands | | | 50,726,251 | | | | 0 | | | | 0 | | | | 50,726,251 | |
Norway | | | 16,852,905 | | | | 0 | | | | 0 | | | | 16,852,905 | |
Russia | | | 7,061,050 | | | | 0 | | | | 0 | | | | 7,061,050 | |
South Africa | | | 10,905,118 | | | | 0 | | | | 0 | | | | 10,905,118 | |
South Korea | | | 24,757,917 | | | | 0 | | | | 0 | | | | 24,757,917 | |
Switzerland | | | 17,396,267 | | | | 0 | | | | 0 | | | | 17,396,267 | |
United Kingdom | | | 41,176,569 | | | | 0 | | | | 0 | | | | 41,176,569 | |
United States | | | 11,936,801 | | | | 0 | | | | 0 | | | | 11,936,801 | |
| | | | |
Participation notes | | | | | | | | | | | | | | | | |
China | | | 0 | | | | 6,667,875 | | | | 0 | | | | 6,667,875 | |
| | | | |
Short-term investments | | | | | | | | | | | | | | | | |
Investment companies | | | 32,495,353 | | | | 0 | | | | 0 | | | | 32,495,353 | |
Investments measured at net asset value* | | | | | | | | | | | | | | | 2,149,446 | |
| | | | |
| | | 461,576,239 | | | | 6,667,875 | | | | 0 | | | | 470,393,560 | |
Forward foreign currency contracts | | | 0 | | | | 262,354 | | | | 0 | | | | 262,354 | |
Total assets | | $ | 461,576,239 | | | $ | 6,930,229 | | | $ | 0 | | | $ | 470,655,914 | |
Liabilities | | | | | | | | | | | | | | | | |
Forward foreign currency contracts | | $ | 0 | | | $ | 104,105 | | | $ | 0 | | | $ | 104,105 | |
Total liabilities | | $ | 0 | | | $ | 104,105 | | | $ | 0 | | | $ | 104,105 | |
| * | Investments that are measured at fair value using the net asset value per share (or its equivalent) as a practical expedient have not been categorized in the fair value hierarchy. The fair value amount presented in the table is intended to permit reconciliation of the fair value hierarchy to the amounts presented in the Statement of Assets and Liabilities. The Fund’s investment in Securities Lending Cash Investments, LLC valued at $2,149,446 does not have a redemption period notice, can be redeemed daily and does not have any unfunded commitments. |
| | | | | | |
| Notes to financial statements | | Wells Fargo International Equity Fund | | | 27 | |
Forward foreign currency contracts are reported at their unrealized gains (losses) at measurement date, which represents the change in the contract’s value from trade date. All other assets and liabilities are reported at their market value at measurement date.
The Fund recognizes transfers between levels within the fair value hierarchy at the end of the reporting period. At October 31, 2017, the Fund did not have any transfers into/out of Level 1, Level 2, or Level 3.
4. TRANSACTIONS WITH AFFILIATES AND OTHER EXPENSES
Management fee
Funds Management, an indirect wholly owned subsidiary of Wells Fargo, is the manager of the Fund and provides advisory and fund-level administrative services under an investment management agreement. Under the investment management agreement, Funds Management is responsible for, among other services, implementing the investment objectives and strategies of the Fund, supervising the subadviser, providing fund-level administrative services in connection with the Fund’s operations, and providing any other fund-level administrative services reasonably necessary for the operation of the Fund. As compensation for its services under the investment management agreement, Funds Management is entitled to receive an annual management fee starting at 0.85% and declining to 0.68% as the average daily net assets of the Fund increase. Prior to March 1, 2017, Funds Management received a fee at an annual rate which started at 0.90% and declined to 0.73% as the average daily net assets of the Fund increased. For the year ended October 31, 2017, the management fee was equivalent to an annual rate of 0.87% of the Fund’s average daily net assets.
Funds Management has retained the services of a subadviser to provide daily portfolio management to the Fund. The fee for subadvisory services is borne by Funds Management. WellsCap is the subadviser to the Fund and is entitled to receive a fee from Funds Management at an annual rate starting at 0.45% and declining to 0.40% as the average daily net assets of the Fund increase.
Administration fees
Under a class-level administration agreement, Funds Management provides class-level administrative services to the Fund, which includes paying fees and expenses for services provided by the transfer agent, sub-transfer agents, omnibus account servicers and record-keepers. As compensation for its services under the class-level administration agreement, Funds Management receives an annual fee which is calculated based on the average daily net assets of each class as follows:
| | | | |
| | | Class-level
administration fee | |
Class A, Class B, Class C, Class R | | | 0.21 | % |
Class R6 | | | 0.03 | |
Administrator Class, Institutional Class | | | 0.13 | |
Funds Management has contractually waived and/or reimbursed management and administration fees to the extent necessary to maintain certain net operating expense ratios for the Fund. Waiver of fees and/or reimbursement of expenses by Funds Management were made first from fund level expenses on a proportionate basis and then from class specific expenses. Funds Management has committed through February 28, 2018 to waive fees and/or reimburse expenses to the extent necessary to cap the Fund’s expenses at 1.14% for Class A shares, 1.89% for Class C shares, 1.39% for Class R shares, 0.84% for Class R6 shares, 1.14% for Administrator Class shares, and 0.89% for Institutional Class shares. After this time, the cap may be increased or the commitment to maintain the cap may be terminated only with the approval of the Board of Trustees.
Out-of-pocket reimbursements
During the year ended October 31, 2017, State Street Bank and Trust Company (“State Street”), the Fund’s custodian, reimbursed the Fund $222,895 for certain out-of-pocket expenses that were billed to the Fund in error from 1998-2015. This amount is included in dividend income on the Statement of Operations. In addition, Funds Management was also reimbursed $50,184 by State Street for waivers/reimbursements it made to the Fund to limit Fund expenses during the period the Fund was erroneously billed.
Distribution fees
The Trust has adopted a distribution plan for Class B, Class C, and Class R shares of the Fund pursuant to Rule 12b-1 under the 1940 Act. Distribution fees are charged to Class B, Class C, and Class R shares and paid to Wells Fargo Funds Distributor, LLC (“Funds Distributor”), the principal underwriter, at an annual rate of 0.75% of the average daily net assets of Class B and Class C shares and 0.25% of the average daily net assets of Class R shares.
| | | | |
| 28 | | Wells Fargo International Equity Fund | | Notes to financial statements |
In addition, Funds Distributor is entitled to receive the front-end sales charge from the purchase of Class A shares and a contingent deferred sales charge on the redemption of certain Class A shares. Funds Distributor is also entitled to receive the contingent deferred sales charges from redemptions of Class B and Class C shares. For the year ended October 31, 2017, Funds Distributor received $14,884 from the sale of Class A shares and $89 in contingent deferred sales charges from redemptions of Class C shares. No contingent deferred sales charges were incurred by Class A and Class B for the year ended October 31, 2017.
Shareholder servicing fees
The Trust has entered into contracts with one or more shareholder servicing agents, whereby Class A, Class B, Class C, Class R, and Administrator Class of the Fund are charged a fee at an annual rate of 0.25% of the average daily net assets of each respective class.
A portion of these total shareholder servicing fees were paid to affiliates of Wells Fargo.
Interfund transactions
The Fund may purchase or sell investment securities to other Wells Fargo affiliates pursuant to Rule 17a-7 under the 1940 Act and under procedures adopted by the Board of Trustees. The procedures have been designed to ensure that these interfund transactions, which do not incur broker commissions, are effected at current market prices.
5. INVESTMENT PORTFOLIO TRANSACTIONS
Purchases and sales of investments, excluding U.S. government obligations (if any) and short-term securities, for the year ended October 31, 2017 were $245,371,204 and $222,627,587, respectively.
6. DERIVATIVE TRANSACTIONS
During the year ended October 31, 2017, the Fund entered into forward foreign currency contracts for economic hedging purposes. The Fund had average contract amounts of $13,335,774 and $54,628,510 in forward foreign currency contracts to buy and forward foreign currency contracts to sell, respectively, during the year ended October 31, 2017.
The fair value, realized gains or losses and change in unrealized gains or losses, if any, on derivative instruments are reflected in the corresponding financial statement captions.
For certain types of derivative transactions, the Fund has entered into International Swaps and Derivatives Association, Inc. master agreements (“ISDA Master Agreements”) or similar agreements with approved counterparties. The ISDA Master Agreements or similar agreements may have requirements to deliver/deposit securities or cash to/with an exchange or broker-dealer as collateral and allows the Fund to offset, with each counterparty, certain derivative financial instrument’s assets and/or liabilities with collateral held or pledged. Collateral requirements differ by type of derivative. Collateral or margin requirements are set by the broker or exchange clearinghouse for exchange traded derivatives while collateral terms are contract specific for over-the-counter traded derivatives. Cash collateral that has been pledged to cover obligations of the Fund under ISDA Master Agreements or similar agreements, if any, are reported separately in the Statement of Assets and Liabilities. Securities pledged as collateral, if any, are noted in the Portfolio of Investments. With respect to balance sheet offsetting, absent an event of default by the counterparty or a termination of the agreement, the reported amounts of financial assets and financial liabilities in the Statement of Assets and Liabilities are not offset across transactions between the Fund and the applicable counterparty. A reconciliation of the gross amounts on the Statement of Assets and Liabilities to the net amounts by derivative type, including any collateral exposure, is as follows:
| | | | | | | | | | | | | | | | |
| Counterparty | | Gross amounts
of assets in the
Statement of
Assets and
Liabilities | | | Amounts
subject to
netting
agreements | | | Collateral
received | | | Net amount
of assets | |
Goldman Sachs | | | $262,354 | | | | $0 | | | $ | (262,354 | ) | | $ | 0 | |
| | | | | | | | | | | | | | | | |
| Counterparty | | Gross amounts
of liabilities in the
Statement of
Assets and
Liabilities | | | Amounts subject to
netting
agreements | | | Collateral
pledged | | | Net amount
of liabilities | |
Morgan Stanley | | | $104,105 | | | | $0 | | | $ | 0 | | | $ | 104,105 | |
| | | | | | |
| Notes to financial statements | | Wells Fargo International Equity Fund | | | 29 | |
7. BANK BORROWINGS
The Trust (excluding the money market funds and certain other funds) and Wells Fargo Variable Trust are parties to a $280,000,000 revolving credit agreement whereby the Fund is permitted to use bank borrowings for temporary or emergency purposes, such as to fund shareholder redemption requests. Interest under the credit agreement is charged to the Fund based on a borrowing rate equal to the higher of the Federal Funds rate in effect on that day plus 1.25% or the overnight LIBOR rate in effect on that day plus 1.25%. In addition, an annual commitment fee equal to 0.25% of the unused balance is allocated to each participating fund. Prior to August 29, 2017, the revolving credit agreement amount was $250,000,000.
For the year ended October 31, 2017, there were no borrowings by the Fund under the agreement.
8. DISTRIBUTIONS TO SHAREHOLDERS
The tax character of distributions paid was $11,461,894 and $6,187,351 of ordinary income for the years ended October 31, 2017 and October 31, 2016, respectively.
As of October 31, 2017, the components of distributable earnings on a tax basis were as follows:
| | | | |
Undistributed ordinary income | | Unrealized gains | | Capital loss
carryforward |
| $16,441,050 | | $73,894,290 | | $(6,311,382) |
9. CONCENTRATION RISK
Concentration risks result from exposure to a limited number of sectors. A fund that invests a substantial portion of its assets in any sector may be more affected by changes in that sector than would be a fund whose investments are not heavily weighted in any sector.
10. INDEMNIFICATION
Under the Trust’s organizational documents, the officers and Trustees have been granted certain indemnification rights against certain liabilities that may arise out of performance of their duties to the Trust. Additionally, in the normal course of business, the Trust may enter into contracts with service providers that contain a variety of indemnification clauses. The Trust’s maximum exposure under these arrangements is dependent on future claims that may be made against the Fund and, therefore, cannot be estimated.
| | | | |
| 30 | | Wells Fargo International Equity Fund | | Report of independent registered public accounting firm |
BOARD OF TRUSTEES AND SHAREHOLDERS OF WELLS FARGO FUNDS TRUST:
We have audited the accompanying statement of assets and liabilities, including the portfolio of investments, of the Wells Fargo International Equity Fund (the “Fund”), one of the funds constituting the Wells Fargo Funds Trust, as of October 31, 2017, and the related statements of operations for the year then ended, the statements of changes in net assets for each of the years in the two-year period then ended, and the financial highlights for each of the years or periods in the five-year period then ended. These financial statements and financial highlights are the responsibility of the Fund’s management. Our responsibility is to express an opinion on these financial statements and financial highlights based on our audits.
We conducted our audits in accordance with the standards of the Public Company Accounting Oversight Board (United States). Those standards require that we plan and perform the audit to obtain reasonable assurance about whether the financial statements and financial highlights are free of material misstatement. An audit includes examining, on a test basis, evidence supporting the amounts and disclosures in the financial statements. Our procedures included confirmation of securities owned as of October 31, 2017, by correspondence with custodian and brokers, or by other appropriate audit procedures. An audit also includes assessing the accounting principles used and significant estimates made by management, as well as evaluating the overall financial statement presentation. We believe that our audits provide a reasonable basis for our opinion.
In our opinion, the financial statements and financial highlights referred to above present fairly, in all material respects, the financial position of the Wells Fargo International Equity Fund as of October 31, 2017 the results of its operations for the year then ended, the changes in its net assets for each of the years in the two-year period then ended, and the financial highlights for each of the years or periods in the five-year period then ended, in conformity with U.S. generally accepted accounting principles.

Boston, Massachusetts
December 21, 2017
| | | | | | |
| Other information (unaudited) | | Wells Fargo International Equity Fund | | | 31 | |
TAX INFORMATION
For corporate shareholders, pursuant to Section 854 of the Internal Revenue Code, 2.07% of ordinary income dividends qualify for the corporate dividends-received deduction for the fiscal year ended October 31, 2017.
Pursuant to Section 854 of the Internal Revenue Code, $10,176,934 of income dividends paid during the fiscal year ended October 31, 2017 has been designated as qualified dividend income (QDI).
For the fiscal year ended October 31, 2017, $53,876 has been designated as interest-related dividends for nonresident alien shareholders pursuant to Section 871 of the Internal Revenue Code.
Pursuant to Section 853 of the Internal Revenue Code, the Fund expects to designate amounts as foreign taxes paid for the fiscal year ended October 31, 2017. Additional details will be available in the semiannual report.
PROXY VOTING INFORMATION
A description of the policies and procedures that the Fund uses to determine how to vote proxies relating to portfolio securities is available, upon request, by calling 1-800-222-8222, visiting our website at wellsfargofunds.com, or visiting the SEC website at sec.gov. Information regarding how the Fund voted proxies relating to portfolio securities during the most recent 12-month period ended June 30 is available on the Fund’s website at wellsfargofunds.com or by visiting the SEC website at sec.gov.
PORTFOLIO HOLDINGS INFORMATION
The complete portfolio holdings for the Fund are publicly available monthly on the Fund’s website (wellsfargofunds.com), on a one-month delayed basis. In addition, top ten holdings information (excluding derivative positions) for the Fund is publicly available on the Fund’s website on a monthly, seven-day or more delayed basis. The Fund files its complete schedule of portfolio holdings with the SEC for the first and third quarters of each fiscal year on Form N-Q, which is available by visiting the SEC website at sec.gov. In addition, the Fund’s Form N-Q may be reviewed and copied at the SEC’s Public Reference Room in Washington, DC, and at regional offices in New York City, at 233 Broadway, and in Chicago, at 175 West Jackson Boulevard, Suite 900. Information about the Public Reference Room may be obtained by calling 1-800-SEC-0330.
| | | | |
| 32 | | Wells Fargo International Equity Fund | | Other information (unaudited) |
BOARD OF TRUSTEES AND OFFICERS
Each of the Trustees and Officers1 listed in the table below acts in identical capacities for each fund in the Wells Fargo family of funds, which consists of 152 mutual funds comprising the Wells Fargo Funds Trust, Wells Fargo Variable Trust, Wells Fargo Master Trust and four closed-end funds (collectively the “Fund Complex”). This table should be read in conjunction with the Prospectus and the Statement of Additional Information2. The mailing address of each Trustee and Officer is 525 Market Street, 12th Floor, San Francisco, CA 94105. Each Trustee and Officer serves an indefinite term, however, each Trustee serves such term until reaching the mandatory retirement age established by the Trustees.
Independent Trustees
| | | | | | |
Name and year of birth | | Position held and length of service* | | Principal occupations during past five years or longer | | Current other public company or
investment company
directorships |
William R. Ebsworth (Born 1957) | | Trustee, since 2015 | | Retired. From 1984 to 2013, equities analyst, portfolio manager, research director and chief investment officer at Fidelity Management and Research Company in Boston, Tokyo, and Hong Kong, and retired in 2013 as Chief Investment Officer of Fidelity Strategic Advisers, Inc. where he led a team of investment professionals managing client assets. Prior thereto, Board member of Hong Kong Securities Clearing Co., Hong Kong Options Clearing Corp., the Thailand International Fund, Ltd., Fidelity Investments Life Insurance Company, and Empire Fidelity Investments Life Insurance Company. Board member of the Forté Foundation (non-profit organization) and the Vincent Memorial Hospital Endowment (non-profit organization), where he serves on the Investment Committee and as Chair of the Audit Committee. Mr. Ebsworth is a CFA® charterholder. | | Asset Allocation Trust |
Jane A. Freeman** (Born 1953) | | Trustee, since 2015; Chair Liaison, effective 2018 | | Retired. From 2012 to 2014 and 1999 to 2008, Chief Financial Officer of Scientific Learning Corporation. From 2008 to 2012, Ms. Freeman provided consulting services related to strategic business projects. Prior to 1999, Portfolio Manager at Rockefeller & Co. and Scudder, Stevens & Clark. Board member of the Harding Loevner Funds from 1996 to 2014, serving as both Lead Independent Director and chair of the Audit Committee. Board member of the Russell Exchange Traded Funds Trust from 2011 to 2012 and the chair of the Audit Committee. Ms. Freeman is a Board Member of Ruth Bancroft Garden (non-profit organization) and an inactive chartered financial analyst. | | Asset Allocation Trust |
Peter G. Gordon*** (Born 1942) | | Trustee, from 1998 to 2017; Chairman, from 2005 to 2017 | | Co-Founder, Retired Chairman, President and CEO of Crystal Geyser Water Company. Trustee Emeritus, Colby College. | | Asset Allocation Trust |
Isaiah Harris, Jr. (Born 1952) | | Trustee, since 2009 | | Retired. Chairman of the Board of CIGNA Corporation since 2009, and Director since 2005. From 2003 to 2011, Director of Deluxe Corporation. Prior thereto, President and CEO of BellSouth Advertising and Publishing Corp. from 2005 to 2007, President and CEO of BellSouth Enterprises from 2004 to 2005 and President of BellSouth Consumer Services from 2000 to 2003. Emeritus member of the Iowa State University Foundation Board of Governors. Emeritus Member of the Advisory Board of Iowa State University School of Business. Advisory Board Member, Palm Harbor Academy (charter school). Advisory Board Member, Child Evangelism Fellowship (non-profit). Mr. Harris is a certified public accountant (inactive status). | | CIGNA Corporation; Asset Allocation Trust |
Judith M. Johnson (Born 1949) | | Trustee, since 2008; Audit Committee Chairman, since 2008 | | Retired. Prior thereto, Chief Executive Officer and Chief Investment Officer of Minneapolis Employees Retirement Fund from 1996 to 2008. Ms. Johnson is an attorney, certified public accountant and a certified managerial accountant. | | Asset Allocation Trust |
David F. Larcker (Born 1950) | | Trustee, since 2009 | | James Irvin Miller Professor of Accounting at the Graduate School of Business, Stanford University, Director of the Corporate Governance Research Initiative and Senior Faculty of The Rock Center for Corporate Governance since 2006. From 2005 to 2008, Professor of Accounting at the Graduate School of Business, Stanford University. Prior thereto, Ernst & Young Professor of Accounting at The Wharton School, University of Pennsylvania from 1985 to 2005. | | Asset Allocation Trust |
| | | | | | |
| Other information (unaudited) | | Wells Fargo International Equity Fund | | | 33 | |
| | | | | | |
Name and year of birth | | Position held and length of service* | | Principal occupations during past five years or longer | | Current other public company or
investment company
directorships |
Olivia S. Mitchell**** (Born 1953) | | Trustee, since 2006; Governance Committee Chairman, effective 2018 | | International Foundation of Employee Benefit Plans Professor, Wharton School of the University of Pennsylvania since 1993. Director of Wharton’s Pension Research Council and Boettner Center on Pensions & Retirement Research, and Research Associate at the National Bureau of Economic Research. Previously, Cornell University Professor from 1978 to 1993. | | Asset Allocation Trust |
Timothy J. Penny***** (Born 1951) | | Trustee, since 1996; Chairman, effective 2018; Vice Chairman, from 2017 to 2018 | | President and Chief Executive Officer of Southern Minnesota Initiative Foundation, a non-profit organization, since 2007 and Senior Fellow at the Humphrey Institute Policy Forum at the University of Minnesota since 1995. Member of the Board of Trustees of NorthStar Education Finance, Inc., a non-profit organization, since 2007. | | Asset Allocation Trust |
| James G. Polisson****** (Born 1959) | | Trustee, effective 2018; Advisory Board Member, from 2017 to 2018 | | Retired. Chief Marketing Officer, Source (ETF) UK Services, Ltd, from 2015 to 2017. From 2012 to 2015, Principal of The Polisson Group, LLC, a management consulting, corporate advisory and principal investing company. Chief Executive Officer and Managing Director at Russell Investments, Global Exchange Traded Funds from 2010 to 2012. Managing Director of Barclays Global Investors from 1998 to 2010 and Global Chief Marketing Officer for iShares and Barclays Global Investors from 2000 to 2010. Prior thereto, Vice President, Fidelity Retail Mutual Fund Group from 1996 to 1998 and Risk Management Practice Manager, Fidelity Consulting from 1995 to 1996. Board member of the Russell Exchange Traded Fund Trust from 2011 to 2012. Director of Barclays Global Investors Holdings Deutschland GmbH from 2006 to 2009. Mr. Polisson is an attorney and has a retired status with the Massachusetts and District of Columbia Bar Associations. | | Asset Allocation Trust |
Michael S. Scofield (Born 1943) | | Trustee, since 2010 | | Served on the Investment Company Institute’s Board of Governors and Executive Committee from 2008-2011 as well the Governing Council of the Independent Directors Council from 2006-2011 and the Independent Directors Council Executive Committee from 2008-2011. Trustee of the Evergreen Funds complex (and its predecessors) from 1984 to 2010. Chairman of the Evergreen Funds from 2000-2010. Former Trustee of the Mentor Funds. Retired Attorney, Law Offices of Michael S. Scofield. | | Asset Allocation Trust |
Pamela Wheelock****** (Born 1959) | | Trustee, effective 2018; Advisory Board Member, from 2017 to 2018 | | Chief Operating Officer, Twin Cities Habitat for Humanity, since January, 2017. Vice President of University Services, University of Minnesota from 2012 to 2017. Prior thereto, Interim President and Chief Executive Officer of Blue Cross Blue Shield of Minnesota from 2010 to 2011, Chairman of the Board from 2009 to 2011 and Board Director from 2003 to 2015. Vice President, Leadership and Community Engagement, Bush Foundation, Saint Paul, Minnesota (a private foundation) from 2009 to 2011. Executive Vice President and Chief Financial Officer, Minnesota Sports and Entertainment from 2004 to 2009 and Senior Vice President from 2002 to 2004. Commissioner of Finance, State of Minnesota, from 1999 to 2002. Currently on the Board of Directors, Governance Committee and Finance Committee, for the Minnesota Philanthropy Partners (Saint Paul Foundation) since 2012 and Board Chair of the Minnesota Wild Foundation since 2010. | | Asset Allocation Trust |
| * | Length of service dates reflect the Trustee’s commencement of service with the Trust’s predecessor entities, where applicable. |
| ** | Jane Freeman will become Chair Liaison effective January 1, 2018. |
| *** | Peter Gordon will retire on December 31, 2017. |
| **** | Olivia Mitchell will become Chairman of the Governance Committee effective January 1, 2018. |
| ***** | Timothy Penny will become Chairman effective January 1, 2018. |
| ****** | James Polisson and Pamela Wheelock each will become a Trustee effective January 1, 2018. |
| | | | |
| 34 | | Wells Fargo International Equity Fund | | Other information (unaudited) |
Officers
| | | | | | |
Name and year of birth | | Position held and length of service | | Principal occupations during past five years or longer | | |
Andrew Owen (Born 1960) | | President, since 2017 | | Executive Vice President of Wells Fargo & Company and Head of Affiliated Managers, Wells Fargo Asset Management, since 2014. In addition, Mr. Owen is currently President, Chief Executive Officer and Director of Wells Fargo Funds Management, LLC since 2017. Prior thereto, Executive Vice President responsible for marketing, investments and product development for Wells Fargo Funds Management, LLC, from 2009 to 2014. | | |
Jeremy DePalma1 (Born 1974) | | Treasurer, since 2012 | | Senior Vice President of Wells Fargo Funds Management, LLC since 2009. Senior Vice President of Evergreen Investment Management Company, LLC from 2008 to 2010 and head of the Fund Reporting and Control Team within Fund Administration from 2005 to 2010. | | |
C. David Messman (Born 1960) | | Secretary, since 2000; Chief Legal Officer, since 2003 | | Senior Vice President and Secretary of Wells Fargo Funds Management, LLC since 2001. Assistant General Counsel of Wells Fargo Bank, N.A. since 2013 and Vice President and Managing Counsel of Wells Fargo Bank, N.A. from 1996 to 2013. | | |
Michael H. Whitaker (Born 1967) | | Chief Compliance Officer, since 2016 | | Senior Vice President and Chief Compliance Officer since 2016. Senior Vice President and Chief Compliance Officer for Fidelity Investments from 2007 to 2016. | | |
David Berardi (Born 1975) | | Assistant Treasurer, since 2009 | | Vice President of Wells Fargo Funds Management, LLC since 2009. Vice President of Evergreen Investment Management Company, LLC from 2008 to 2010. Manager of Fund Reporting and Control for Evergreen Investment Management Company, LLC from 2004 to 2010. | | |
| 1 | Jeremy DePalma acts as Treasurer of 76 funds and Assistant Treasurer of 76 funds in the Fund Complex. |
| 2 | The Statement of Additional Information includes additional information about the Trustees and is available, without charge, upon request, by calling 1-800-222-8222 or by visiting the website at wellsfargofunds.com. |
| | | | | | |
| Other information (unaudited) | | Wells Fargo International Equity Fund | | | 35 | |
BOARD CONSIDERATION OF INVESTMENT MANAGEMENT AND SUB-ADVISORY AGREEMENTS:
Under the Investment Company Act of 1940 (the “1940 Act”), the Board of Trustees (the “Board”) of Wells Fargo Funds Trust (the “Trust”) must determine annually whether to approve the continuation of the Trust’s investment management and sub-advisory agreements. In this regard, at an in-person meeting held on May 16-17, 2017 (the “Meeting”), the Board, all the members of which have no direct or indirect interest in the investment management and sub-advisory agreements and are not “interested persons” of the Trust, as defined in the 1940 Act (the “Independent Trustees”), reviewed and approved for Wells Fargo International Equity Fund (the “Fund”): (i) an investment management agreement (the “Management Agreement”) with Wells Fargo Funds Management, LLC (“Funds Management”); and (ii) an investment sub-advisory agreement (the “Sub-Advisory Agreement”) with Wells Capital Management Incorporated (the “Sub-Adviser”), an affiliate of Funds Management. The Management Agreement and the Sub-Advisory Agreement are collectively referred to as the “Advisory Agreements.”
At the Meeting, the Board considered the factors and reached the conclusions described below relating to the selection of Funds Management and the Sub-Adviser and the approval of the Advisory Agreements. Prior to the Meeting, including at an in-person meeting in April 2017, the Trustees conferred extensively among themselves and with representatives of Funds Management about these matters. Also, the Board has adopted a team-based approach, with each team consisting of a sub-set of Trustees, to assist the full Board in the discharge of its duties in reviewing performance and other matters throughout the year. The Independent Trustees were assisted in their evaluation of the Advisory Agreements by independent legal counsel, from whom they received separate legal advice and with whom they met separately.
In providing information to the Board, Funds Management and the Sub-Adviser were guided by a detailed set of requests for information submitted to them by independent legal counsel on behalf of the Independent Trustees at the start of the Board’s annual contract renewal process earlier in 2017. In considering and approving the Advisory Agreements, the Trustees considered the information they believed relevant, including but not limited to the information discussed below. The Board considered not only the specific information presented in connection with the Meeting, but also the knowledge gained over time through interaction with Funds Management and the Sub-Adviser about various topics. In this regard, the Board reviewed reports of Funds Management at each of its quarterly meetings, which included, among other things, portfolio reviews and performance reports. In addition, the Board and the teams mentioned above confer with portfolio managers at various times throughout the year. The Board did not identify any particular information or consideration that was all-important or controlling, and each individual Trustee may have attributed different weights to various factors.
After its deliberations, the Board unanimously approved the continuation of the Advisory Agreements for a one-year term and determined that the compensation payable to Funds Management and the Sub-Adviser under each of the Advisory Agreements was reasonable. The Board considered the approval of the Advisory Agreements for the Fund as part of its consideration of agreements for funds across the complex, but its approvals were made on a fund-by-fund basis. The following summarizes a number of important, but not necessarily all, factors considered by the Board in support of its approvals.
Nature, extent and quality of services
The Board received and considered various information regarding the nature, extent and quality of services provided to the Fund by Funds Management and the Sub-Adviser under the Advisory Agreements. This information included a description of the investment advisory services and Fund-level administrative services covered by the Management Agreement, as well as, among other things, a summary of the background and experience of senior management of Funds Management, a summary of certain organizational and personnel changes involving Funds Management and the Sub-Adviser, and a description of Funds Management’s and the Sub-Adviser’s business continuity planning programs and of their approaches to data privacy and cybersecurity. The Board also considered the qualifications, background, tenure and responsibilities of each of the portfolio managers primarily responsible for the day-to-day portfolio management of the Fund.
The Board evaluated the ability of Funds Management and the Sub-Adviser to attract and retain qualified investment professionals, including research, advisory and supervisory personnel. The Board further considered the compliance programs and compliance records of Funds Management and the Sub-Adviser. In addition, the Board took into account the full range of services provided to the Fund by Funds Management and its affiliates.
Fund performance and expenses
The Board considered the performance results for the Fund over various time periods ended December 31, 2016. The Board considered these results in comparison to the performance of funds in a universe that was determined by Broadridge Inc.
| | | | |
| 36 | | Wells Fargo International Equity Fund | | Other information (unaudited) |
(“Broadridge”) to be similar to the Fund (the “Universe”), and in comparison to the Fund’s benchmark index and to other comparative data. Broadridge is an independent provider of investment company data. The Board received a description of the methodology used by Broadridge to select the mutual funds in the performance Universe. The Board noted that the performance of the Fund (Class A) was higher than or in range of the average performance of the Universe for all periods under review. The Board also noted that the performance of the Fund was higher than or in range of its benchmark, the MSCI ACWI Index ex USA (Net), for all periods under review.
The Board also received and considered information regarding the Fund’s net operating expense ratios and their various components, including actual management fees, custodian and other non-management fees, and Rule 12b-1 and non-Rule 12b-1 shareholder service fees. The Board considered these ratios in comparison to the median ratios of funds in class-specific expense groups that were determined by Broadridge to be similar to the Fund (the “Groups”). The Board received a description of the methodology used by Broadridge to select the mutual funds in the expense Groups and an explanation of how funds comprising expense groups and their expense ratios may vary from year-to-year. Based on the Broadridge reports, the Board noted that the net operating expense ratios of the Fund were lower than the median net operating expense ratios of the expense Groups for all share classes.
The Board took into account the Fund performance and expense information provided to it among the factors considered in deciding to re-approve the Advisory Agreements.
Investment management and sub-advisory fee rates
The Board reviewed and considered the contractual fee rates payable by the Fund to Funds Management under the Management Agreement, as well as the contractual fee rates payable by the Fund to Funds Management for class-level administrative services under a Class-Level Administration Agreement, which include, among other things, class-level transfer agency and sub-transfer agency costs (collectively, the “Management Rates”). The Board also reviewed and considered the contractual investment sub-advisory fee rates that are payable by Funds Management to the Sub-Adviser for investment sub-advisory services.
Among other information reviewed by the Board was a comparison of the Fund’s Management Rates with the average contractual investment management fee rates of funds in the expense Groups at a common asset level as well as transfer agency costs of the funds in the expense Groups. The Board noted that the Management Rates of the Fund were lower than or in range of the sum of these average rates for the expense Groups for all share classes except Class R and Administrator Class. However, the Board noted that the net operating expense ratios of the Fund were lower than the median net operating expense ratios of the expense Groups for all share classes.
The Board also received and considered information about the portion of the total management fee that was retained by Funds Management after payment of the fee to the Sub-Adviser for sub-advisory services. In assessing the reasonableness of this amount, the Board received and evaluated information about the nature and extent of responsibilities retained and risks assumed by Funds Management and not delegated to or assumed by the Sub-Adviser, and about Funds Management’s on-going oversight services. Given the affiliation between Funds Management and the Sub-Adviser, the Board ascribed limited relevance to the allocation of fees between them.
The Board also received and considered information about the nature and extent of services offered and fee rates charged by Funds Management and the Sub-Adviser to other types of clients with investment strategies similar to those of the Fund. In this regard, the Board received information about the significantly greater scope of services, and compliance, reporting and other legal burdens and risks of managing mutual funds compared with those associated with managing assets of non-mutual fund clients such as institutional separate accounts.
Based on its consideration of the factors and information it deemed relevant, including those described here, the Board determined that the compensation payable to Funds Management under the Management Agreement and to the Sub-Adviser under the Sub-Advisory Agreement was reasonable.
Profitability
The Board received and considered information concerning the profitability of Funds Management, as well as the profitability of Wells Fargo as a whole, from providing services to the Fund and the fund family as a whole. The Board also received and considered information concerning the profitability of the Sub-Adviser from providing services to the fund family as a whole, noting that the Sub-Adviser’s profitability information with respect to providing services to the Fund was subsumed in the Wells Fargo and Funds Management profitability analysis.
Funds Management reported on the methodologies and estimates used in calculating profitability, including a description of the methodology used to allocate certain expenses. Among other things, the Board noted that the levels of
| | | | | | |
| Other information (unaudited) | | Wells Fargo International Equity Fund | | | 37 | |
profitability reported on a fund-by-fund basis varied widely, depending on factors such as the size and type of fund. Based on its review, the Board did not deem the profits reported by Funds Management or Wells Fargo from its services to the Fund to be at a level that would prevent it from approving the continuation of the Advisory Agreements.
Economies of scale
With respect to possible economies of scale, the Board noted the existence of breakpoints in the Fund’s management fee structure, which operate generally to reduce the Fund’s expense ratios as the Fund grows in size. It considered that, for a small fund or a fund that shrinks in size, breakpoints conversely can result in higher fee levels. The Board also considered that in addition to management fee breakpoints, competitive management fee rates set at the outset without regard to breakpoints and fee waiver and expense reimbursement arrangements are means of sharing potential economies of scale with shareholders of the Fund. The Board considered Funds Management’s view, which Funds Management indicated was supported by independent third-party industry studies which were summarized for the Board, that any analyses of potential economies of scale in managing a particular fund are inherently limited in light of the joint and common costs and investments that Funds Management incurs across the fund family as a whole.
The Board concluded that the Fund’s fee and expense arrangements, including contractual breakpoints, constituted a reasonable approach to sharing potential economies of scale with the Fund and its shareholders.
Other benefits to Funds Management and the Sub-Adviser
The Board received and considered information regarding potential “fall-out” or ancillary benefits received by Funds Management and its affiliates, including the Sub-Adviser, as a result of their relationships with the Fund. Ancillary benefits could include, among others, benefits directly attributable to other relationships with the Fund and benefits potentially derived from an increase in Funds Management’s and the Sub-Adviser’s business as a result of their relationships with the Fund. The Board noted that various affiliates of Funds Management may receive distribution-related fees, shareholder servicing payments and sub-transfer agency fees in respect of shares sold or held through them and services provided.
The Board also reviewed information about soft dollar credits earned and utilized by the Sub-Adviser, fees earned by Funds Management and the Sub-Adviser from managing a private investment vehicle for the fund family’s securities lending collateral and commissions earned by an affiliated broker from portfolio transactions.
Based on its consideration of the factors and information it deemed relevant, including those described here, the Board did not find that any ancillary benefits received by Funds Management and its affiliates, including the Sub-Adviser, were unreasonable.
Conclusion
At the Meeting, after considering the above-described factors and based on its deliberations and its evaluation of the information described above, the Board unanimously approved the continuation of the Advisory Agreements for a one-year term and determined that the compensation payable to Funds Management and the Sub-Adviser under each of the Advisory Agreements was reasonable.
| | | | |
| 38 | | Wells Fargo International Equity Fund | | List of abbreviations |
The following is a list of common abbreviations for terms and entities that may have appeared in this report.
| ACA | — ACA Financial Guaranty Corporation |
| ADR | — American depositary receipt |
| ADS | — American depositary shares |
| AGC | — Assured Guaranty Corporation |
| AGM | — Assured Guaranty Municipal |
| Ambac | — Ambac Financial Group Incorporated |
| AMT | — Alternative minimum tax |
| BAN | — Bond anticipation notes |
| BHAC | — Berkshire Hathaway Assurance Corporation |
| CAB | — Capital appreciation bond |
| CCAB | — Convertible capital appreciation bond |
| CDA | — Community Development Authority |
| CDO | — Collateralized debt obligation |
| CLO | — Collateralized loan obligation |
| DRIVER | — Derivative inverse tax-exempt receipts |
| DW&P | — Department of Water & Power |
| DWR | — Department of Water Resources |
| ECFA | — Educational & Cultural Facilities Authority |
| EDA | — Economic Development Authority |
| EDFA | — Economic Development Finance Authority |
| ETF | — Exchange-traded fund |
| FDIC | — Federal Deposit Insurance Corporation |
| FFCB | — Federal Farm Credit Banks |
| FGIC | — Financial Guaranty Insurance Corporation |
| FHA | — Federal Housing Administration |
| FHLB | — Federal Home Loan Bank |
| FHLMC | — Federal Home Loan Mortgage Corporation |
| FICO | — The Financing Corporation |
| FNMA | — Federal National Mortgage Association |
| GDR | — Global depositary receipt |
| GNMA | — Government National Mortgage Association |
| HCFR | — Healthcare facilities revenue |
| HEFA | — Health & Educational Facilities Authority |
| HEFAR | — Higher education facilities authority revenue |
| HFA | — Housing Finance Authority |
| HFFA | — Health Facilities Financing Authority |
| HUD | — Department of Housing and Urban Development |
| IDA | — Industrial Development Authority |
| IDAG | — Industrial Development Agency |
| KRW | — Republic of Korea won |
| LIBOR | — London Interbank Offered Rate |
| LIFER | — Long Inverse Floating Exempt Receipts |
| LLC | — Limited liability company |
| LLLP | — Limited liability limited partnership |
| LLP | — Limited liability partnership |
| MBIA | — Municipal Bond Insurance Association |
| MFHR | — Multifamily housing revenue |
| MSTR | — Municipal securities trust receipts |
| MUD | — Municipal Utility District |
| National | — National Public Finance Guarantee Corporation |
| PCFA | — Pollution Control Financing Authority |
| PCL | — Public Company Limited |
| PCR | — Pollution control revenue |
| PFA | — Public Finance Authority |
| PFFA | — Public Facilities Financing Authority |
| PFOTER | — Puttable floating option tax-exempt receipts |
| PJSC | — Public Joint Stock Company |
| plc | — Public limited company |
| PUTTER | — Puttable tax-exempt receipts |
| R&D | — Research & development |
| Radian | — Radian Asset Assurance |
| RAN | — Revenue anticipation notes |
| RDA | — Redevelopment Authority |
| RDFA | — Redevelopment Finance Authority |
| REIT | — Real estate investment trust |
| ROC | — Reset option certificates |
| SAVRS | — Select auction variable rate securities |
| SBA | — Small Business Authority |
| SDR | — Swedish depositary receipt |
| SFHR | — Single-family housing revenue |
| SFMR | — Single-family mortgage revenue |
| SPA | — Standby purchase agreement |
| SPDR | — Standard & Poor’s Depositary Receipts |
| SPEAR | — Short Puttable Exempt Adjustable Receipts |
| STRIPS | — Separate trading of registered interest and |
| TAN | — Tax anticipation notes |
| TIPS | — Treasury inflation-protected securities |
| TRAN | — Tax revenue anticipation notes |
| TTFA | — Transportation Trust Fund Authority |
| TVA | — Tennessee Valley Authority |
This page is intentionally left blank.
This page is intentionally left blank.

For more information
More information about Wells Fargo Funds is available free upon request. To obtain literature, please write, email, visit the Fund’s website, or call:
Wells Fargo Funds
P.O. Box 8266
Boston, MA 02266-8266
Email: fundservice@wellsfargo.com
Website: wellsfargofunds.com
Individual investors: 1-800-222-8222
Retail investment professionals: 1-888-877-9275
Institutional investment professionals:
1-866-765-0778
This report and the financial statements contained herein are submitted for the general information of the shareholders of the Fund. If this report is used for promotional purposes, distribution of the report must be accompanied or preceded by a current prospectus. Before investing, please consider the investment objectives, risks, charges, and expenses of the investment. For a current prospectus and, if available, a summary prospectus, containing this information, call 1-800-222-8222 or visit the Fund’s website at wellsfargofunds.com. Read the prospectus carefully before you invest or send money.
Wells Fargo Asset Management (WFAM) is a trade name used by the asset management businesses of Wells Fargo & Company. Wells Fargo Funds Management, LLC, a wholly owned subsidiary of Wells Fargo & Company, provides investment advisory and administrative services for Wells Fargo Funds. Other affiliates of Wells Fargo & Company provide subadvisory and other services for the funds. The funds are distributed by Wells Fargo Funds Distributor, LLC, Member FINRA, an affiliate of Wells Fargo & Company. Neither Wells Fargo Funds Distributor nor Wells Fargo Funds Management holds fund shareholder accounts or assets. This material is for general informational and educational purposes only and is NOT intended to provide investment advice or a recommendation of any kind—including a recommendation for any specific investment, strategy, or plan.
NOT FDIC INSURED ◾ NO BANK GUARANTEE ◾ MAY LOSE VALUE
© 2017 Wells Fargo Funds Management, LLC. All rights reserved.
| | |
 | | 307203 12-17 A240/AR240 10-17 |
Annual Report
October 31, 2017

Wells Fargo Intrinsic World Equity Fund


Reduce clutter. Save trees.
Sign up for electronic delivery of prospectuses and shareholder reports at wellsfargo.com/advantagedelivery
Contents
The views expressed and any forward-looking statements are as of October 31, 2017, unless otherwise noted, and are those of the Fund managers and/or Wells Fargo Funds Management, LLC. Discussions of individual securities, or the markets generally, or any Wells Fargo Fund are not intended as individual recommendations. Future events or results may vary significantly from those expressed in any forward-looking statements. The views expressed are subject to change at any time in response to changing circumstances in the market. Wells Fargo Funds Management, LLC and the Fund disclaim any obligation to publicly update or revise any views expressed or forward-looking statements.
NOT FDIC INSURED ◾ NO BANK GUARANTEE ◾ MAY LOSE VALUE
| | | | |
| 2 | | Wells Fargo Intrinsic World Equity Fund | | Letter to shareholders (unaudited) |

Andrew Owen
President
Wells Fargo Funds
Global stocks generally delivered double-digit results; bond markets had smaller but positive results as well.
Dear Shareholder:
We are pleased to offer you this annual report for the Wells Fargo Intrinsic World Equity Fund for the 12-month period that ended October 31, 2017. Global stocks generally delivered double-digit results; bond markets had smaller but positive results as well. U.S. and international stocks performed similarly overall with returns of 23.63% and 23.64%, respectively, for the 12-month period, as measured by the S&P 500 Index1 and the MSCI ACWI ex USA Index (Net),2 respectively. Within fixed income, the Bloomberg Barclays U.S. Aggregate Bond Index3 returned 0.90% and the Bloomberg Barclays Municipal Bond Index4 returned 2.19% as interest rates rose from low levels.
Election results and central banks’ policies commanded investor attention as 2016 closed.
During the last two months of 2016, investors appeared intent on the prospective outcomes of elections in the U.S. and central-bank actions globally. Following Donald Trump’s election victory in November, U.S. stocks rallied. Investors appeared optimistic that the new administration would pursue progrowth policies. Favorable economic news supported stocks, and interest rates moved higher. At their mid-December meeting, U.S. Federal Reserve (Fed) officials raised the target interest rate by a quarter percentage point to a range of 0.50% to 0.75%. The fourth quarter also saw the implementation of the U.S. Securities and Exchange Commission’s amended rule for money market funds, which included the possibility of liquidity fees and redemption gates and, for institutional prime and municipal money market funds, floating net asset values (NAVs). Outside of the U.S., the prospects for faster U.S. growth appeared to trigger some acceleration in Europe.
Financial markets gained during the first two quarters of 2017 on positive economic data.
Stocks rallied globally through the first quarter of 2017, supported by signs of improvement in the U.S. and global economies. In the U.S., hiring remained strong, and business and consumer sentiment improved. In March, Fed officials raised their target interest rate by a quarter percentage point to a range of 0.75% to 1.00%. With the Fed’s target interest-rate increase, short-term bond yields rose during the quarter. Meanwhile, longer-term Treasury yields were little changed, leading to positive performance. Investment-grade and high-yield bonds benefited from strong demand. Municipal bond returns were positive in the quarter, helped by strong demand and constrained new-issue supply. Outside the U.S., stocks in emerging markets generally outperformed stocks in the U.S. and
international developed markets because they benefited from both global economic growth and recent weakening of the U.S. dollar. Stocks in Asia, Europe, and Latin America also outperformed the U.S. market during the quarter.
| 1 | The S&P 500 Index consists of 500 stocks chosen for market size, liquidity, and industry group representation. It is a market-value-weighted index with each stock’s weight in the index proportionate to its market value. You cannot invest directly in an index. |
| 2 | The Morgan Stanley Capital International (MSCI) All Country World Index (ACWI) ex USA Index (Net) is a free-float-adjusted market-capitalization-weighted index that is designed to measure the equity market performance of developed markets, excluding the United States and Canada. Source: MSCI. MSCI makes no express or implied warranties or representations and shall have no liability whatsoever with respect to any MSCI data contained herein. The MSCI data may not be further redistributed or used as a basis for other indexes or any securities or financial products. This report is not approved, reviewed, or produced by MSCI. You cannot invest directly in an index. |
| 3 | The Bloomberg Barclays U.S. Aggregate Bond Index is a broad-based benchmark that measures the investment-grade, U.S. dollar-denominated, fixed-rate taxable bond market, including Treasuries, government-related and corporate securities, mortgage-backed securities (agency fixed-rate and hybrid adjustable-rate mortgage pass-throughs), asset-backed securities, and commercial mortgage-backed securities. You cannot invest directly in an index. |
| 4 | The Bloomberg Barclays Municipal Bond Index is an unmanaged index composed of long-term tax-exempt bonds with a minimum credit rating of Baa. You cannot invest directly in an index. |
| | | | | | |
| Letter to shareholders (unaudited) | | Wells Fargo Intrinsic World Equity Fund | | | 3 | |
Globally, stocks marked continued gains through the second quarter of 2017. Steady, albeit modest, economic growth both in the U.S. and abroad and generally favorable corporate earnings announcements supported higher valuations. U.S. inflation trended lower despite a continued decline in the unemployment rate. Ten-year U.S. Treasury yields declined, resulting in stronger prices for long-term bonds. As was widely expected, Fed officials raised the target interest rate in June by a quarter percentage point to a range of 1.00% to 1.25%. In addition, the Fed indicated that it planned to start selling bonds that accumulated on its balance sheet during quantitative easing programs conducted since 2008.
As global growth improved in the third quarter of 2017, financial markets generally advanced.
Most stock markets worldwide moved higher during the quarter and ended the period at or near all-time highs. Moderate acceleration in global economic growth was supported by improving corporate earnings, low inflation pressure, and still-low interest rates. Corporate earnings reports were favorable overall as companies continued to benefit from healthy operating leverage. Global commodity prices climbed during the quarter. Oil prices rebounded, partly due to a better balance between supply and demand. While North Korea’s recent missile launches and nuclear testing raised serious concerns around the world, the heightened geopolitical risk had relatively minimal impact on the quarter’s stock returns. In the U.S., economic data released during the quarter reflected a generally healthy economy. Second-quarter economic output grew at a 3.1% annual rate, and consumers displayed more willingness to spend. Meanwhile, the Fed maintained the target range for the federal funds rate at 1.00% to 1.25%, noting that inflation had remained below the Fed’s 2.00% objective. Reflecting continued confidence in the U.S. economy, the Fed also stated the possibility of one more 0.25% increase in the federal funds rate by the end of 2017 and announced plans to begin the process of unwinding its $4.5 trillion portfolio of bonds and other assets in October. Outside the U.S., stocks in the Asia Pacific region benefited from solid earnings reports and investors’ willingness to take on risk despite the rising tensions between North Korea and the U.S. In Europe, markets were supported by better-than-expected economic growth, which has led to narrowing of the gap between Europe’s growth rate and that of the U.S. In emerging markets, many countries benefited from stronger currencies versus the U.S. dollar. Also, commodity prices were on an upward trajectory, which benefited many companies that rely on natural resources for exports.
Positive economic and market news continued into October.
October proved to be a strong month for U.S. stocks. The S&P 500 Index delivered 11 record closes amid rising consumer confidence and signs the economy was continuing to gain momentum, including news in late October that economic output was estimated to have grown at a 3.0% annual rate in the third quarter. At its October meeting, the Fed, in a unanimous vote, left short-term interest rates unchanged but signaled it could make another rate increase before the end of 2017 if the economy remains on track. The Fed also began the process of unwinding its quantitative easing program. Outside the U.S., international stocks generally delivered positive results in October as global economic growth continued to strengthen.
| | | | |
| 4 | | Wells Fargo Intrinsic World Equity Fund | | Letter to shareholders (unaudited) |
Don’t let short-term uncertainty derail long-term investment goals.
Periods of investment uncertainty can present challenges, but experience has taught us that maintaining long-term investment goals can be an effective way to plan for the future. To help you create a sound strategy based on your personal goals and risk tolerance, Wells Fargo Funds offers more than 100 mutual funds spanning a wide range of asset classes and investment styles. Although diversification cannot guarantee an investment profit or prevent losses, we believe it can be an effective way to manage investment risk and potentially smooth out overall portfolio performance. We encourage investors to know their investments and to understand that appropriate levels of risk-taking may unlock opportunities.
Thank you for choosing to invest with Wells Fargo Funds. We appreciate your confidence in us and remain committed to helping you meet your financial needs.
Sincerely,

Andrew Owen
President
Wells Fargo Funds
Although diversification cannot guarantee an investment profit or prevent losses, we believe it can be an effective way to manage investment risk and potentially smooth out overall portfolio performance.
For further information about your Fund, contact your investment professional, visit our website at wellsfargofunds.com, or call us directly at 1-800-222-8222. We are available 24 hours a day, 7 days a week.
This page is intentionally left blank.
| | | | |
| 6 | | Wells Fargo Intrinsic World Equity Fund | | Performance highlights (unaudited) |
Investment objective
The Fund seeks long-term capital appreciation.
Manager
Wells Fargo Funds Management, LLC
Subadviser
Wells Capital Management Incorporated
Portfolio managers
Amit Kumar‡
Jean-Baptiste Nadal, CFA®
Jen Robertson, CFA®‡
Average annual total returns (%) as of October 31, 20171
| | | | | | | | | | | | | | | | | | | | | | | | | | | | | | | | | | |
| | | | | Including sales charge | | | Excluding sales charge | | | Expense ratios2 (%) | |
| | | Inception date | | 1 year | | | 5 year | | | 10 year | | | 1 year | | | 5 year | | | 10 year | | | Gross | | | Net3 | |
| Class A (EWEAX) | | 4-30-1996 | | | 18.23 | | | | 8.99 | | | | 4.36 | | | | 25.44 | | | | 10.28 | | | | 4.98 | | | | 1.46 | | | | 1.35 | |
| Class C (EWECX) | | 5-18-2007 | | | 23.54 | | | | 9.45 | | | | 4.20 | | | | 24.54 | | | | 9.45 | | | | 4.20 | | | | 2.21 | | | | 2.10 | |
| Administrator Class (EWEIX) | | 5-18-2007 | | | – | | | | – | | | | – | | | | 25.60 | | | | 10.50 | | | | 5.21 | | | | 1.38 | | | | 1.25 | |
| Institutional Class (EWENX) | | 7-30-2010 | | | – | | | | – | | | | – | | | | 25.92 | | | | 10.75 | | | | 5.37 | | | | 1.13 | | | | 0.95 | |
| MSCI World Index (Net)4 | | – | | | – | | | | – | | | | – | | | | 22.77 | | | | 11.56 | | | | 4.10 | | | | – | | | | – | |
Figures quoted represent past performance, which is no guarantee of future results, and do not reflect taxes that a shareholder may pay on fund distributions or the redemption of fund shares. Investment return and principal value of an investment will fluctuate so that an investor’s shares, when redeemed, may be worth more or less than their original cost. Performance shown without sales charges would be lower if sales charges were reflected. Current performance may be lower or higher than the performance data quoted, which assumes the reinvestment of dividends and capital gains. Current month-end performance is available on the Fund’s website, wellsfargofunds.com.
Index returns do not include transaction costs associated with buying and selling securities, any mutual fund fees or expenses, or any taxes. It is not possible to invest directly in an index.
For Class A shares, the maximum front-end sales charge is 5.75%. For Class C shares, the maximum contingent deferred sales charge is 1.00%. Performance including a contingent deferred sales charge assumes the sales charge for the corresponding time period. Administrator Class and Institutional Class shares are sold without a front-end sales charge or contingent deferred sales charge.
Stock values fluctuate in response to the activities of individual companies and general market and economic conditions. Foreign investments are especially volatile and can rise or fall dramatically due to differences in the political and economic conditions of the host country. These risks are generally intensified in emerging markets. The use of derivatives may reduce returns and/or increase volatility. Certain investment strategies tend to increase the total risk of an investment (relative to the broader market). The Fund is exposed to focused portfolio risk, geographic risk, and smaller company securities risk. Consult the Fund’s prospectus for additional information on these and other risks.
Please see footnotes on page 7.
| | | | | | |
| Performance highlights (unaudited) | | Wells Fargo Intrinsic World Equity Fund | | | 7 | |
|
| Growth of $10,000 investment as of October 31, 20175 |
|
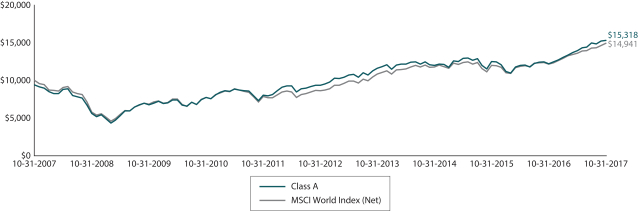 |
| ‡ | Mr. Kumar and Ms. Robertson became portfolio managers of the Fund on June 6, 2017. |
| 1 | Historical performance shown for Institutional Class shares prior to their inception reflects the performance of Administrator Class shares, and includes the higher expenses applicable to Administrator Class shares. If these expenses had not been included, returns for Institutional Class shares would be higher. Historical performance shown for all classes of the Fund prior to July 19, 2010, is based on the performance of the Fund’s predecessor, Evergreen Intrinsic World Equity Fund. |
| 2 | Reflects the expense ratios as stated in the most recent prospectuses. The expense ratios shown are subject to change and may differ from the annualized expense ratios shown in the financial highlights of this report. |
| 3 | The manager has contractually committed through February 28, 2018, to waive fees and/or reimburse expenses to the extent necessary to cap the Fund’s Total Annual Operating Expenses After Fee Waivers at the amounts shown. After this time, the cap may be increased or the commitment to maintain the cap may be terminated only with the approval of the Board of Trustees. Brokerage commissions, stamp duty fees, interest, taxes, acquired fund fees and expenses, and extraordinary expenses are excluded from the expense cap. Without this cap, the Fund’s returns would have been lower. The expense ratio paid by an investor is the net expense ratio or the Fund’s Total Annual Fund Operating Expenses After Fee Waivers, as stated in the prospectuses. |
| 4 | The Morgan Stanley Capital International (MSCI) World Index (Net) is a free-float-adjusted market-capitalization-weighted index that is designed to measure the equity market performance of developed markets. The MSCI World Index (Net) consists of the following 23 developed markets country indexes: Australia, Austria, Belgium, Canada, Denmark, Finland, France, Germany, Hong Kong, Ireland, Israel, Italy, Japan, the Netherlands, New Zealand, Norway, Portugal, Singapore, Spain, Sweden, Switzerland, the United Kingdom, and the United States. Source: MSCI. MSCI makes no express or implied warranties or representations and shall have no liability whatsoever with respect to any MSCI data contained herein. The MSCI data may not be further redistributed or used as a basis for other indexes or any securities or financial products. This report is not approved, reviewed, or produced by MSCI. You cannot invest directly in an index. |
| 5 | The chart compares the performance of Class A shares for the most recent ten years with the MSCI World Index (Net). The chart assumes a hypothetical investment of $10,000 in Class A shares and reflects all operating expenses and assumes the maximum initial sales charge of 5.75%. |
| 6 | The ten largest holdings, excluding cash and cash equivalents, are calculated based on the value of the investments divided by total net assets of the Fund. Holdings are subject to change and may have changed since the date specified. |
| 7 | Amounts are calculated based on the total long-term investments of the Fund. These amounts are subject to change and may have changed since the date specified. |
| | | | |
| 8 | | Wells Fargo Intrinsic World Equity Fund | | Performance highlights (unaudited) |
MANAGER’S DISCUSSION
Fund highlights
| ∎ | | The Fund outperformed its benchmark, the MSCI World Index (Net), for the 12-month period that ended October 31, 2017. |
| ∎ | | The Fund’s outperformance was driven primarily by stock selection, especially in the consumer staples, industrials, financials, and health care sectors. Relative sector weightings, which are a by-product of our bottom-up stock-selection process, also had a net-positive effect. |
| ∎ | | Stock selection in the consumer discretionary sector detracted from the Fund’s relative return. |
The Fund outperformed in a global stock market driven by worldwide economic growth, tightening monetary policies, and normalizing interest rates. Stocks in both developed and emerging markets produced strong, positive returns during the period. Risk appetites among investors were healthy, with emerging markets and developed non-U.S. equity markets generally outpacing U.S. stocks. A weaker U.S. dollar, lack of momentum in fiscal policy in the U.S., and accelerating economic growth in Europe all contributed to strength in these markets.
We adhered to the same intrinsic value investment philosophy and process and consistently applied it to investment selection for the Fund. We define intrinsic value as the present discounted value of future cash streams. Our fundamental analysis involves identifying the stocks that we believe are high-quality, value-creating businesses selling at a discount to our estimate of intrinsic or true value and that possess what we believe are identifiable catalysts that could close the valuation gap over our investment time horizon. Over the long term, we seek to add value primarily through stock selection due to our research-intensive, bottom-up investment process.
| | | | |
| Ten largest holdings (%) as of October 31, 20176 | |
Capgemini SA | | | 2.78 | |
Microsoft Corporation | | | 2.64 | |
Societe Generale SA | | | 2.55 | |
Air Liquide SA | | | 2.54 | |
Visa Incorporated Class A | | | 2.52 | |
Alphabet Incorporated Class C | | | 2.49 | |
Nidec Corporation | | | 2.41 | |
Cigna Corporation | | | 2.39 | |
CaixaBank SA | | | 2.32 | |
AerCap Holdings NV | | | 2.31 | |
Our long-term investment process typically has resulted in low portfolio turnover as we seek to invest in businesses over a three- to five-year investment horizon. During the reporting period, we sold the Fund’s positions in eight companies across six sectors and added positions in seven new companies across six sectors. Positions sold from the Fund during the period included Autoliv, Incorporated, in the consumer discretionary sector; PepsiCo, Incorporated, and The Procter & Gamble Company in the consumer staples sector; Express Scripts Holding Company in the health care sector; Lockheed Martin Corporation and Siemens AG in the industrials sector; Samsung Electronics Company, Limited, in the information technology (IT) sector; and Millicom International Cellular S.A. in the telecommunication
services sector. Positions added to the Fund included Advance Auto Parts, Incorporated, in the consumer discretionary sector; Anheuser-Busch InBev and Mondelēz International, Incorporated, in the consumer staples sector; Affiliated Managers Group, Incorporated, in the financials sector; Eli Lilly and Company in the health care sector; Capgemini SE in the IT sector; and Vulcan Materials Company in the materials sector. All buy and sell decisions were driven by company-specific, fundamental analysis rather than top-down, sector-allocation decisions.
Please see footnotes on page 7.
| | | | | | |
| Performance highlights (unaudited) | | Wells Fargo Intrinsic World Equity Fund | | | 9 | |
|
| Sector distribution as of October 31, 20177 |
|
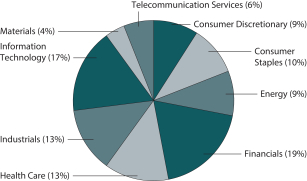 |
|
| Country allocation as of October 31, 20177 |
|
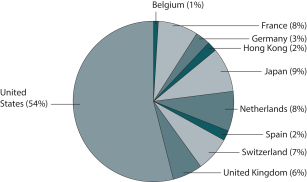 |
Stock selection in a number of sectors largely drove the Fund’s outperformance.
Stock selection in the consumer staples, industrials, financials, and health care sectors contributed to relative performance. In consumer staples, Unilever N.V.—the global conglomerate of personal care, home care, and food products—was the principal contributor. In industrials, contributors included global aerospace and defense-related companies Airbus SE and General Dynamics Corporation. Within financials, Spanish regional bank CaixaBank, S.A., and French corporate and retail bank Societe Generale SA were the best performers. In the health care sector, managed care organization Cigna Corporation and health care conglomerate Abbott Laboratories were top performers.
Stock selection in the consumer discretionary sector hindered Fund performance.
The Fund’s relative weakness in the consumer discretionary sector for the period was hindered by retailer Advance Auto Parts, Incorporated, a distributor of automotive parts to consumers and professional installers.
We remain confident that our investment process should create shareholder value over time.
In our view, the 12-month period that ended October 31, 2017, demonstrated the continued positive impact of an improving global economy and normalization of global interest rates on our intrinsic value approach. The investment team has long argued that deflation, flat interest rates, tepid economic growth, and the shift from active to passive investment vehicles create difficulties in differentiating high-quality from low-quality investments. Recently, sector or industry trends have become more important than macro trends, further demonstrating the value of our active, intrinsic value approach.
Expectations for improved economic and earnings growth should bode well for the portfolio’s positioning. With improving growth, rising inflation, and increasing wages in the U.S., rising interest rates are a likely outcome, and investor expectations appear to lean in this direction. The high-quality companies with strong free cash flow that we have identified have the ability to self-finance strategic decisions better than their lower-quality peers. Therefore, we believe investors will continue to benefit from our intrinsic value approach. While companies we select may use their free cash flow to pay dividends, our primary focus is allowing company management teams to identify the most appropriate uses of this free cash. These uses may include balance-sheet restructuring, share repurchases, new products, acquisitions, or marketing. We believe company management teams have superior knowledge of their markets, competitors, and customers, enabling them to identify the most effective uses of free cash.
Despite some potential risks in the market, such as renewed deflationary pressures in some regions as contrasted with the potential for faster-than-expected inflation in other regions, geopolitical events, and protectionism/trade barriers, we believe the Fund is well positioned to benefit from normalizing interest rates, accelerating global economic growth, expanding valuation multiples, increasing market volatility, and an improving energy sector.
Please see footnotes on page 7.
| | | | |
| 10 | | Wells Fargo Intrinsic World Equity Fund | | Fund expenses (unaudited) |
As a shareholder of the Fund, you incur two types of costs: (1) transaction costs, including sales charges (loads) on purchase payments and contingent deferred sales charges (if any) on redemptions and (2) ongoing costs, including management fees, distribution (12b-1) and/or shareholder servicing fees, and other Fund expenses. This example is intended to help you understand your ongoing costs (in dollars) of investing in the Fund and to compare these costs with the ongoing costs of investing in other mutual funds.
The example is based on an investment of $1,000 invested at the beginning of the six-month period and held for the entire period from May 1, 2017 to October 31, 2017.
Actual expenses
The “Actual” line of the table below provides information about actual account values and actual expenses. You may use the information in this line, together with the amount you invested, to estimate the expenses that you paid over the period. Simply divide your account value by $1,000 (for example, an $8,600 account value divided by $1,000 = 8.6), then multiply the result by the number in the “Actual” line under the heading entitled “Expenses paid during period” for your applicable class of shares to estimate the expenses you paid on your account during this period.
Hypothetical example for comparison purposes
The “Hypothetical” line of the table below provides information about hypothetical account values and hypothetical expenses based on the Fund’s actual expense ratio and an assumed rate of return of 5% per year before expenses, which is not the Fund’s actual return. The hypothetical account values and expenses may not be used to estimate the actual ending account balance or expenses you paid for the period. You may use this information to compare the ongoing costs of investing in the Fund and other funds. To do so, compare this 5% hypothetical example with the 5% hypothetical examples that appear in the shareholder reports of the other funds.
Please note that the expenses shown in the table are meant to highlight your ongoing costs only and do not reflect any transactional costs, such as sales charges (loads) and contingent deferred sales charges. Therefore, the “Hypothetical” line of the table is useful in comparing ongoing costs only and will not help you determine the relative total costs of owning different funds. In addition, if these transactional costs were included, your costs would have been higher.
| | | | | | | | | | | | | | | | |
| | | Beginning
account value
5-1-2017 | | | Ending
account value
10-31-2017 | | | Expenses
paid during
the period¹ | | | Annualized net
expense ratio | |
Class A | | | | | | | | | | | | | | | | |
Actual | | $ | 1,000.00 | | | $ | 1,095.92 | | | $ | 7.13 | | | | 1.35 | % |
Hypothetical (5% return before expenses) | | $ | 1,000.00 | | | $ | 1,018.40 | | | $ | 6.87 | | | | 1.35 | % |
Class C | | | | | | | | | | | | | | | | |
Actual | | $ | 1,000.00 | | | $ | 1,092.21 | | | $ | 11.07 | | | | 2.10 | % |
Hypothetical (5% return before expenses) | | $ | 1,000.00 | | | $ | 1,014.62 | | | $ | 10.66 | | | | 2.10 | % |
Administrator Class | | | | | | | | | | | | | | | | |
Actual | | $ | 1,000.00 | | | $ | 1,096.90 | | | $ | 6.61 | | | | 1.25 | % |
Hypothetical (5% return before expenses) | | $ | 1,000.00 | | | $ | 1,018.90 | | | $ | 6.36 | | | | 1.25 | % |
Institutional Class | | | | | | | | | | | | | | | | |
Actual | | $ | 1,000.00 | | | $ | 1,098.14 | | | $ | 5.02 | | | | 0.95 | % |
Hypothetical (5% return before expenses) | | $ | 1,000.00 | | | $ | 1,020.42 | | | $ | 4.84 | | | | 0.95 | % |
| 1 | Expenses paid is equal to the annualized net expense ratio of each class multiplied by the average account value over the period, multiplied by the number of days in the most recent fiscal half-year divided by the number of days in the fiscal year (to reflect the one-half-year period). |
| | | | | | |
| Portfolio of investments—October 31, 2017 | | Wells Fargo Intrinsic World Equity Fund | | | 11 | |
| | | | | | | | | | | | | | | | |
| Security name | | | | | | | | Shares | | | Value | |
| | | | |
Common Stocks: 99.63% | | | | | | | | | | | | | | | | |
| | | | |
| Belgium: 0.97% | | | | | | | | | | | | | | | | |
Anheuser-Busch InBev NV ADR (Consumer Staples, Beverages) « | | | | | | | | | | | 12,700 | | | $ | 1,559,306 | |
| | | | | | | | | | | | | | | | |
| | | | |
| France: 7.87% | | | | | | | | | | | | | | | | |
Air Liquide SA (Materials, Chemicals) | | | | | | | | | | | 32,000 | | | | 4,074,178 | |
Capgemini SA (Information Technology, IT Services) | | | | | | | | | | | 36,600 | | | | 4,448,805 | |
Societe Generale SA (Financials, Banks) | | | | | | | | | | | 73,500 | | | | 4,092,466 | |
| | | | |
| | | | | | | | | | | | | | | 12,615,449 | |
| | | | | | | | | | | | | | | | |
| | | | |
| Germany: 2.79% | | | | | | | | | | | | | | | | |
Bayer AG (Health Care, Pharmaceuticals) | | | | | | | | | | | 9,700 | | | | 1,262,103 | |
Deutsche Telekom AG (Telecommunication Services, Diversified Telecommunication Services) | | | | | | | | | | | 176,500 | | | | 3,215,520 | |
| | | | |
| | | | | | | | | | | | | | | 4,477,623 | |
| | | | | | | | | | | | | | | | |
| | | | |
| Hong Kong: 1.96% | | | | | | | | | | | | | | | | |
AIA Group Limited (Financials, Insurance) | | | | | | | | | | | 416,800 | | | | 3,136,124 | |
| | | | | | | | | | | | | | | | |
| | | | |
| Japan: 9.40% | | | | | | | | | | | | | | | | |
Honda Motor Company Limited (Consumer Discretionary, Automobiles) | | | | | | | | | | | 102,500 | | | | 3,175,828 | |
Kao Corporation (Consumer Staples, Personal Products) | | | | | | | | | | | 35,300 | | | | 2,122,253 | |
Nidec Corporation (Industrials, Electrical Equipment) | | | | | | | | | | | 29,300 | | | | 3,863,977 | |
ORIX Corporation (Financials, Diversified Financial Services) | | | | | | | | | | | 167,300 | | | | 2,852,215 | |
Sony Corporation (Consumer Discretionary, Household Durables) | | | | | | | | | | | 78,740 | | | | 3,055,975 | |
| | | | |
| | | | | | | | | | | | | | | 15,070,248 | |
| | | | | | | | | | | | | | | | |
| | | | |
| Netherlands: 7.65% | | | | | | | | | | | | | | | | |
AerCap Holdings NV (Industrials, Trading Companies & Distributors) † | | | | | | | | | | | 70,200 | | | | 3,695,328 | |
Airbus SE (Industrials, Aerospace & Defense) | | | | | | | | | | | 19,800 | | | | 2,023,868 | |
Heineken NV (Consumer Staples, Beverages) | | | | | | | | | | | 22,800 | | | | 2,221,890 | |
Sensata Technologies Holding NV (Industrials, Electrical Equipment) † | | | | | | | | | | | 41,200 | | | | 2,015,092 | |
Unilever NV (Consumer Staples, Personal Products) | | | | | | | | | | | 39,700 | | | | 2,301,012 | |
| | | | |
| | | | | | | | | | | | | | | 12,257,190 | |
| | | | | | | | | | | | | | | | |
| | | | |
| Spain: 2.32% | | | | | | | | | | | | | | | | |
CaixaBank SA (Financials, Banks) | | | | | | | | | | | 793,900 | | | | 3,715,742 | |
| | | | | | | | | | | | | | | | |
| | | | |
| Switzerland: 7.44% | | | | | | | | | | | | | | | | |
Nestle SA (Consumer Staples, Food Products) | | | | | | | | | | | 29,300 | | | | 2,464,061 | |
Novartis AG ADR (Health Care, Pharmaceuticals) | | | | | | | | | | | 39,500 | | | | 3,261,910 | |
Roche Holding AG (Health Care, Pharmaceuticals) | | | | | | | | | | | 11,000 | | | | 2,541,472 | |
UBS Group AG (Financials, Capital Markets) | | | | | | | | | | | 214,300 | | | | 3,647,385 | |
| | | | |
| | | | | | | | | | | | | | | 11,914,828 | |
| | | | | | | | | | | | | | | | |
| | | | |
| United Kingdom: 6.04% | | | | | | | | | | | | | | | | |
Diageo plc (Consumer Staples, Beverages) | | | | | | | | | | | 71,200 | | | | 2,432,193 | |
Royal Dutch Shell plc Class A (Energy, Oil, Gas & Consumable Fuels) | | | | | | | | | | | 115,100 | | | | 3,615,310 | |
Vodafone Group plc (Telecommunication Services, Wireless Telecommunication Services) | | | | | | | | | | | 1,265,000 | | | | 3,622,317 | |
| | | | |
| | | | | | | | | | | | | | | 9,669,820 | |
| | | | | | | | | | | | | | | | |
The accompanying notes are an integral part of these financial statements.
| | | | |
| 12 | | Wells Fargo Intrinsic World Equity Fund | | Portfolio of investments—October 31, 2017 |
| | | | | | | | | | | | | | | | |
| Security name | | | | | | | | Shares | | | Value | |
| | | | |
| United States: 53.19% | | | | | | | | | | | | | | | | |
Abbott Laboratories (Health Care, Health Care Equipment & Supplies) | | | | | | | | | | | 43,000 | | | $ | 2,331,890 | |
Advance Auto Parts Incorporated (Consumer Discretionary, Specialty Retail) | | | | | | | | | | | 34,590 | | | | 2,827,387 | |
Affiliated Managers Group Incorporated (Financials, Capital Markets) | | | | | | | | | | | 16,300 | | | | 3,039,950 | |
Alphabet Incorporated Class C (Information Technology, Internet Software & Services) † | | | | | | | | | | | 3,920 | | | | 3,985,229 | |
Apple Incorporated (Information Technology, Technology Hardware, Storage & Peripherals) | | | | | | | | | | | 19,300 | | | | 3,262,472 | |
BB&T Corporation (Financials, Banks) | | | | | | | | | | | 70,000 | | | | 3,446,800 | |
Chevron Corporation (Energy, Oil, Gas & Consumable Fuels) | | | | | | | | | | | 28,700 | | | | 3,326,043 | |
Cigna Corporation (Health Care, Health Care Providers & Services) | | | | | | | | | | | 19,410 | | | | 3,828,040 | |
CIT Group Incorporated (Financials, Banks) | | | | | | | | | | | 77,100 | | | | 3,594,402 | |
Eli Lilly & Company (Health Care, Pharmaceuticals) | | | | | | | | | | | 20,200 | | | | 1,655,188 | |
EOG Resources Incorporated (Energy, Oil, Gas & Consumable Fuels) | | | | | | | | | | | 36,700 | | | | 3,665,229 | |
General Dynamics Corporation (Industrials, Aerospace & Defense) | | | | | | | | | | | 12,218 | | | | 2,480,010 | |
Gilead Sciences Incorporated (Health Care, Biotechnology) | | | | | | | | | | | 36,800 | | | | 2,758,528 | |
Honeywell International Incorporated (Industrials, Industrial Conglomerates) | | | | | | | | | | | 22,000 | | | | 3,171,520 | |
Merck & Company Incorporated (Health Care, Pharmaceuticals) | | | | | | | | | | | 57,600 | | | | 3,173,184 | |
Microsoft Corporation (Information Technology, Software) | | | | | | | | | | | 50,900 | | | | 4,233,861 | |
Mondelez International Incorporated Class A (Consumer Staples, Food Products) | | | | | | | | | | | 86,400 | | | | 3,579,552 | |
Motorola Solutions Incorporated (Information Technology, Communications Equipment) | | | | | | | | | | | 37,200 | | | | 3,368,088 | |
Oracle Corporation (Information Technology, Software) | | | | | | | | | | | 58,800 | | | | 2,992,920 | |
Samsonite International SA (Consumer Discretionary, Textiles, Apparel & Luxury Goods) | | | | | | | | | | | 832,290 | | | | 3,472,587 | |
Schlumberger Limited (Energy, Energy Equipment & Services) | | | | | | | | | | | 49,700 | | | | 3,180,800 | |
The Charles Schwab Corporation (Financials, Capital Markets) | | | | | | | | | | | 12,516 | | | | 561,217 | |
The Goldman Sachs Group Incorporated (Financials, Capital Markets) | | | | | | | | | | | 7,245 | | | | 1,756,768 | |
The Walt Disney Company (Consumer Discretionary, Media) | | | | | | | | | | | 24,700 | | | | 2,415,907 | |
United Parcel Service Incorporated Class B (Industrials, Air Freight & Logistics) | | | | | | | | | | | 28,630 | | | | 3,364,884 | |
Verizon Communications Incorporated (Telecommunication Services, Diversified Telecommunication Services) | | | | | | | | | | | 67,400 | | | | 3,226,438 | |
Visa Incorporated Class A (Information Technology, IT Services) | | | | | | | | | | | 36,700 | | | | 4,036,266 | |
Vulcan Materials Company (Materials, Construction Materials) | | | | | | | | | | | 20,600 | | | | 2,508,050 | |
| | | | |
| | | | | | | | | | | | | | | 85,243,210 | |
| | | | | | | | | | | | | | | | |
| | | |
Total Common Stocks (Cost $121,800,821) | | | | | | | | | | | | 159,659,540 | |
| | | | | | | | | | | | | | | | |
| | | | |
| | | Yield | | | | | | | | | | |
| Short-Term Investments: 1.40% | | | | | | | | | | | | | |
|
| Investment Companies: 1.40% | |
Securities Lending Cash Investment LLC (l)(r)(u) | | | 1.26 | % | | | | | | | 1,478,852 | | | | 1,479,000 | |
Wells Fargo Government Money Market Fund Select Class (l)(u) | | | 0.96 | | | | | | | | 763,828 | | | | 763,828 | |
| | | |
Total Short-Term Investments (Cost $2,242,828) | | | | | | | | | | | | 2,242,828 | |
| | | | | | | | | | | | | | | | |
| | | | | | | | |
| Total investments in securities (Cost $124,043,649) | | | 101.03 | % | | | 161,902,368 | |
Other assets and liabilities, net | | | (1.03 | ) | | | (1,648,335 | ) |
| | | | | | | | |
| Total net assets | | | 100.00 | % | | $ | 160,254,033 | |
| | | | | | | | |
| « | All or a portion of this security is on loan. |
| † | Non-income-earning security |
| (l) | The issuer of the security is an affiliated person of the Fund as defined in the Investment Company Act of 1940. |
| (r) | The investment is a non-registered investment company purchased with cash collateral received from securities on loan. |
| (u) | The rate represents the 7-day annualized yield at period end. |
The accompanying notes are an integral part of these financial statements.
| | | | | | |
| Portfolio of investments—October 31, 2017 | | Wells Fargo Intrinsic World Equity Fund | | | 13 | |
Investments in Affiliates
An affiliated investment is an investment in which the Fund owns at least 5% of the outstanding voting shares of the issuer or as a result of other relationships, such as the Fund and the issuer having the same investment manager. Transactions with issuers that were either affiliated persons of the Fund at the beginning of the period or the end of the period were as follows:
| | | | | | | | | | | | | | | | | | | | | | | | | | | | | | | | | | | | |
| | | Shares,
beginning of
period | | | Shares
purchased | | | Shares
sold | | | Shares, end of
period | | | Net
realized
gains
(losses) | | | Net change in
unrealized
gains
(losses) | | | Income
from
affiliated
securities | | | Value,
end
of period | | | %, of
net
assets | |
Short-Term Investments | | | | | | | | | | | | | | | | | | | | | | | | | | | | | | | | | | | | |
Investment companies | | | | | | | | | | | | | | | | | | | | | | | | | | | | | | | | | | | | |
Securities Lending Cash Investment LLC | | | 0 | | | | 56,225,998 | | | | 54,747,146 | | | | 1,478,852 | | | $ | (116 | ) | | $ | 0 | | | $ | 20,078 | | | $ | 1,479,000 | | | | | |
Wells Fargo Government Money Market Fund Select Class | | | 343,055 | | | | 25,230,909 | | | | 24,810,136 | | | | 763,828 | | | | 0 | | | | 0 | | | | 3,705 | | | | 763,828 | | | | | |
| | | | | | | | | | | | | | | | | | | | | | | | | | | | | | | | | | | | |
| | | | | | | | | | | | | | | | | | $ | (116 | ) | | $ | 0 | | | $ | 23,783 | | | $ | 2,242,828 | | | | 1.40 | % |
| | | | | | | | | | | | | | | | | | | | | | | | | | | | | | | | | | | | |
The accompanying notes are an integral part of these financial statements.
| | | | |
| 14 | | Wells Fargo Intrinsic World Equity Fund | | Statement of assets and liabilities—October 31, 2017 |
| | | | |
| | | | |
| |
Assets | | | | |
Investments in unaffiliated securities (including $1,473,360 of securities loaned), at value (cost $121,800,821) | | $ | 159,659,540 | |
Investments in affiliated securities, at value (cost $2,242,828) | | | 2,242,828 | |
Foreign currency, at value (cost $78) | | | 77 | |
Receivable for investments sold | | | 742,141 | |
Receivable for Fund shares sold | | | 75,513 | |
Receivable for dividends | | | 336,847 | |
Receivable for securities lending income | | | 414 | |
Prepaid expenses and other assets | | | 50,283 | |
| | | | |
Total assets | | | 163,107,643 | |
| | | | |
| |
Liabilities | | | | |
Payable upon receipt of securities loaned | | | 1,479,116 | |
Payable for investments purchased | | | 1,111,834 | |
Management fee payable | | | 100,553 | |
Payable for Fund shares redeemed | | | 43,571 | |
Administration fees payable | | | 27,902 | |
Distribution fee payable | | | 4,507 | |
Trustees’ fees and expenses payable | | | 2,315 | |
Accrued expenses and other liabilities | | | 83,812 | |
| | | | |
Total liabilities | | | 2,853,610 | |
| | | | |
Total net assets | | $ | 160,254,033 | |
| | | | |
| |
NET ASSETS CONSIST OF | | | | |
Paid-in capital | | $ | 110,184,672 | |
Undistributed net investment income | | | 747,677 | |
Accumulated net realized gains on investments | | | 11,462,933 | |
Net unrealized gains on investments | | | 37,858,751 | |
| | | | |
Total net assets | | $ | 160,254,033 | |
| | | | |
| |
COMPUTATION OF NET ASSET VALUE AND OFFERING PRICE PER SHARE | | | | |
Net assets – Class A | | $ | 141,831,443 | |
Shares outstanding – Class A1 | | | 6,145,417 | |
Net asset value per share – Class A | | | $23.08 | |
Maximum offering price per share – Class A2 | | | $24.49 | |
Net assets – Class C | | $ | 7,015,300 | |
Shares outstanding – Class C1 | | | 316,752 | |
Net asset value per share – Class C | | | $22.15 | |
Net assets – Administrator Class | | $ | 4,726,591 | |
Shares outstanding – Administrator Class1 | | | 205,681 | |
Net asset value per share – Administrator Class | | | $22.98 | |
Net assets – Institutional Class | | $ | 6,680,699 | |
Shares outstanding – Institutional Class1 | | | 289,793 | |
Net asset value per share – Institutional Class | | | $23.05 | |
| 1 | The Fund has an unlimited number of authorized shares. |
| 2 | Maximum offering price is computed as 100/94.25 of net asset value. On investments of $50,000 or more, the offering price is reduced. |
The accompanying notes are an integral part of these financial statements.
| | | | | | |
| Statement of operations—year ended October 31, 2017 | | Wells Fargo Intrinsic World Equity Fund | | | 15 | |
| | | | |
| | | | |
| |
Investment income | | | | |
Dividends (net of foreign withholding taxes of $171,961) | | $ | 3,392,375 | |
Income from affiliated securities | | | 23,783 | |
| | | | |
Total investment income | | | 3,416,158 | |
| | | | |
| |
Expenses | | | | |
Management fee | | | 1,300,353 | |
Administration fees | |
Class A | | | 285,433 | |
Class C | | | 15,162 | |
Administrator Class | | | 5,250 | |
Institutional Class | | | 7,545 | |
Shareholder servicing fees | |
Class A | | | 339,801 | |
Class C | | | 18,050 | |
Administrator Class | | | 9,890 | |
Distribution fee | |
Class C | | | 54,149 | |
Custody and accounting fees | | | 30,566 | |
Professional fees | | | 61,123 | |
Registration fees | | | 65,353 | |
Shareholder report expenses | | | 50,144 | |
Trustees’ fees and expenses | | | 22,444 | |
Other fees and expenses | | | 11,482 | |
| | | | |
Total expenses | | | 2,276,745 | |
Less: Fee waivers and/or expense reimbursements | | | (184,583 | ) |
| | | | |
Net expenses | | | 2,092,162 | |
| | | | |
Net investment income | | | 1,323,996 | |
| | | | |
| |
REALIZED AND UNREALIZED GAINS (LOSSES) ON INVESTMENTS | | | | |
|
Net realized gains (losses) on: | |
Unaffiliated securities | | | 11,579,930 | |
Affiliated securities | | | (116 | ) |
| | | | |
Net realized gains on investments | | | 11,579,814 | |
| | | | |
Net change in unrealized gains (losses) on investments | | | 21,512,782 | |
| | | | |
Net realized and unrealized gains (losses) on investments | | | 33,092,596 | |
| | | | |
Net increase in net assets resulting from operations | | $ | 34,416,592 | |
| | | | |
The accompanying notes are an integral part of these financial statements.
| | | | |
| 16 | | Wells Fargo Intrinsic World Equity Fund | | Statement of changes in net assets |
| | | | | | | | | | | | | | | | |
| | | Year ended
October 31, 2017 | | | Year ended
October 31, 2016 | |
| | | | |
Operations | | | | | | | | | | | | | | | | |
Net investment income | | | | | | $ | 1,323,996 | | | | | | | $ | 1,612,182 | |
Net realized gains on investments | | | | | | | 11,579,814 | | | | | | | | 7,022,443 | |
Net change in unrealized gains (losses) on investments | | | | | | | 21,512,782 | | | | | | | | (13,434,282 | ) |
| | | | |
Net increase (decrease) in net assets resulting from operations | | | | | | | 34,416,592 | | | | | | | | (4,799,657 | ) |
| | | | |
| | | | |
Distributions to shareholders from | | | | | | | | | | | | | | | | |
Net investment income | | | | | | | | | | | | | | | | |
Class A | | | | | | | (1,555,768 | ) | | | | | | | (1,480,000 | ) |
Class C | | | | | | | (31,841 | ) | | | | | | | (5,766 | ) |
Administrator Class | | | | | | | (46,398 | ) | | | | | | | (77,002 | ) |
Institutional Class | | | | | | | (82,395 | ) | | | | | | | (77,098 | ) |
Net realized gains | | | | | | | | | | | | | | | | |
Class A | | | | | | | (6,105,260 | ) | | | | | | | (15,944,560 | ) |
Class C | | | | | | | (361,793 | ) | | | | | | | (992,532 | ) |
Administrator Class | | | | | | | (186,415 | ) | | | | | | | (637,316 | ) |
Institutional Class | | | | | | | (246,870 | ) | | | | | | | (554,534 | ) |
| | | | |
Total distributions to shareholders | | | | | | | (8,616,740 | ) | | | | | | | (19,768,808 | ) |
| | | | |
| | | | |
Capital share transactions | | | Shares | | | | | | | | Shares | | | | | |
Proceeds from shares sold | | | | | | | | | | | | | | | | |
Class A | | | 91,775 | | | | 1,943,663 | | | | 77,894 | | | | 1,519,486 | |
Class C | | | 11,239 | | | | 230,175 | | | | 48,859 | | | | 912,817 | |
Administrator Class | | | 61,599 | | | | 1,310,161 | | | | 99,764 | | | | 1,871,151 | |
Institutional Class | | | 141,316 | | | | 2,903,861 | | | | 87,333 | | | | 1,706,229 | |
| | | | |
| | | | | | | 6,387,860 | | | | | | | | 6,009,683 | |
| | | | |
Reinvestment of distributions | | | | | | | | | | | | | | | | |
Class A | | | 382,200 | | | | 7,440,005 | | | | 871,879 | | | | 16,927,692 | |
Class C | | | 19,294 | | | | 360,925 | | | | 51,392 | | | | 955,480 | |
Administrator Class | | | 11,665 | | | | 225,913 | | | | 36,033 | | | | 697,376 | |
Institutional Class | | | 14,333 | | | | 278,253 | | | | 24,158 | | | | 469,358 | |
| | | | |
| | | | | | | 8,305,096 | | | | | | | | 19,049,906 | |
| | | | |
Payment for shares redeemed | | | | | | | | | | | | | | | | |
Class A | | | (854,675 | ) | | | (17,932,087 | ) | | | (975,567 | ) | | | (18,924,820 | ) |
Class C | | | (100,134 | ) | | | (2,025,420 | ) | | | (121,189 | ) | | | (2,191,011 | ) |
Administrator Class | | | (111,252 | ) | | | (2,222,251 | ) | | | (166,281 | ) | | | (3,242,731 | ) |
Institutional Class | | | (89,219 | ) | | | (1,831,803 | ) | | | (109,687 | ) | | | (2,106,188 | ) |
| | | | |
| | | | | | | (24,011,561 | ) | | | | | | | (26,464,750 | ) |
| | | | |
Net decrease in net assets resulting from capital share transactions | | | | | | | (9,318,605 | ) | | | | | | | (1,405,161 | ) |
| | | | |
Total increase (decrease) in net assets | | | | | | | 16,481,247 | | | | | | | | (25,973,626 | ) |
| | | | |
| | | | |
Net assets | | | | | | | | | | | | | | | | |
Beginning of period | | | | | | | 143,772,786 | | | | | | | | 169,746,412 | |
| | | | |
End of period | | | | | | $ | 160,254,033 | | | | | | | $ | 143,772,786 | |
| | | | |
Undistributed net investment income | | | | | | $ | 747,677 | | | | | | | $ | 1,144,741 | |
| | | | |
The accompanying notes are an integral part of these financial statements.
| | | | | | |
| Financial highlights | | Wells Fargo Intrinsic World Equity Fund | | | 17 | |
(For a share outstanding throughout each period)
| | | | | | | | | | | | | | | | | | | | |
| | | Year ended October 31 | |
| CLASS A | | 2017 | | | 2016 | | | 2015 | | | 2014 | | | 2013 | |
Net asset value, beginning of period | | | $19.53 | | | | $22.82 | | | | $22.39 | | | | $21.88 | | | | $17.94 | |
Net investment income | | | 0.19 | | | | 0.20 | | | | 0.19 | | | | 0.17 | | | | 0.20 | |
Net realized and unrealized gains (losses) on investments | | | 4.54 | | | | (0.83 | ) | | | 0.73 | | | | 0.59 | | | | 4.00 | |
| | | | | | | | | | | | | | | | | | | | |
Total from investment operations | | | 4.73 | | | | (0.63 | ) | | | 0.92 | | | | 0.76 | | | | 4.20 | |
Distributions to shareholders from | | | | | | | | | | | | | | | | | | | | |
Net investment income | | | (0.23 | ) | | | (0.20 | ) | | | (0.12 | ) | | | (0.25 | ) | | | (0.26 | ) |
Net realized gains | | | (0.95 | ) | | | (2.46 | ) | | | (0.37 | ) | | | 0.00 | | | | 0.00 | |
| | | | | | | | | | | | | | | | | | | | |
Total distributions to shareholders | | | (1.18 | ) | | | (2.66 | ) | | | (0.49 | ) | | | (0.25 | ) | | | (0.26 | ) |
Net asset value, end of period | | | $23.08 | | | | $19.53 | | | | $22.82 | | | | $22.39 | | | | $21.88 | |
Total return1 | | | 25.44 | % | | | (2.54 | )% | | | 4.23 | % | | | 3.45 | % | | | 23.74 | % |
Ratios to average net assets (annualized) | | | | | | | | | | | | | | | | | | | | |
Gross expenses | | | 1.47 | % | | | 1.46 | % | | | 1.48 | % | | | 1.47 | % | | | 1.49 | % |
Net expenses | | | 1.35 | % | | | 1.37 | % | | | 1.40 | % | | | 1.40 | % | | | 1.40 | % |
Net investment income | | | 0.88 | % | | | 1.09 | % | | | 0.79 | % | | | 0.70 | % | | | 0.95 | % |
Supplemental data | | | | | | | | | | | | | | | | | | | | |
Portfolio turnover rate | | | 21 | % | | | 23 | % | | | 32 | % | | | 23 | % | | | 22 | % |
Net assets, end of period (000s omitted) | | | $141,831 | | | | $127,428 | | | | $149,492 | | | | $157,061 | | | | $168,621 | |
| 1 | Total return calculations do not include any sales charges. |
The accompanying notes are an integral part of these financial statements.
| | | | |
| 18 | | Wells Fargo Intrinsic World Equity Fund | | Financial highlights |
(For a share outstanding throughout each period)
| | | | | | | | | | | | | | | | | | | | |
| | | Year ended October 31 | |
| CLASS C | | 2017 | | | 2016 | | | 2015 | | | 2014 | | | 2013 | |
Net asset value, beginning of period | | | $18.77 | | | | $21.99 | | | | $21.64 | | | | $21.19 | | | | $17.37 | |
Net investment income (loss) | | | 0.03 | 1 | | | 0.05 | | | | 0.01 | 1 | | | (0.02 | ) | | | 0.05 | |
Net realized and unrealized gains (losses) on investments | | | 4.38 | | | | (0.80 | ) | | | 0.71 | | | | 0.58 | | | | 3.89 | |
| | | | | | | | | | | | | | | | | | | | |
Total from investment operations | | | 4.41 | | | | (0.75 | ) | | | 0.72 | | | | 0.56 | | | | 3.94 | |
Distributions to shareholders from | | | | | | | | | | | | | | | | | | | | |
Net investment income | | | (0.08 | ) | | | (0.01 | ) | | | 0.00 | | | | (0.11 | ) | | | (0.12 | ) |
Net realized gains | | | (0.95 | ) | | | (2.46 | ) | | | (0.37 | ) | | | 0.00 | | | | 0.00 | |
| | | | | | | | | | | | | | | | | | | | |
Total distributions to shareholders | | | (1.03 | ) | | | (2.47 | ) | | | (0.37 | ) | | | (0.11 | ) | | | (0.12 | ) |
Net asset value, end of period | | | $22.15 | | | | $18.77 | | | | $21.99 | | | | $21.64 | | | | $21.19 | |
Total return2 | | | 24.54 | % | | | (3.26 | )% | | | 3.41 | % | | | 2.65 | % | | | 22.82 | % |
Ratios to average net assets (annualized) | | | | | | | | | | | | | | | | | | | | |
Gross expenses | | | 2.22 | % | | | 2.21 | % | | | 2.23 | % | | | 2.22 | % | | | 2.24 | % |
Net expenses | | | 2.10 | % | | | 2.12 | % | | | 2.15 | % | | | 2.15 | % | | | 2.15 | % |
Net investment income (loss) | | | 0.13 | % | | | 0.32 | % | | | 0.05 | % | | | (0.06 | )% | | | 0.20 | % |
Supplemental data | | | | | | | | | | | | | | | | | | | | |
Portfolio turnover rate | | | 21 | % | | | 23 | % | | | 32 | % | | | 23 | % | | | 22 | % |
Net assets, end of period (000s omitted) | | | $7,015 | | | | $7,252 | | | | $8,958 | | | | $9,788 | | | | $9,949 | |
| 1 | Calculated based upon average shares outstanding |
| 2 | Total return calculations do not include any sales charges. |
The accompanying notes are an integral part of these financial statements.
| | | | | | |
| Financial highlights | | Wells Fargo Intrinsic World Equity Fund | | | 19 | |
(For a share outstanding throughout each period)
| | | | | | | | | | | | | | | | | | | | |
| | | Year ended October 31 | |
| ADMINISTRATOR CLASS | | 2017 | | | 2016 | | | 2015 | | | 2014 | | | 2013 | |
Net asset value, beginning of period | | | $19.43 | | | | $22.76 | | | | $22.33 | | | | $21.81 | | | | $17.89 | |
Net investment income | | | 0.20 | 1 | | | 0.24 | 1 | | | 0.23 | 1 | | | 0.22 | 1 | | | 0.24 | 1 |
Net realized and unrealized gains (losses) on investments | | | 4.54 | | | | (0.84 | ) | | | 0.75 | | | | 0.59 | | | | 3.99 | |
| | | | | | | | | | | | | | | | | | | | |
Total from investment operations | | | 4.74 | | | | (0.60 | ) | | | 0.98 | | | | 0.81 | | | | 4.23 | |
Distributions to shareholders from | | | | | | | | | | | | | | | | | | | | |
Net investment income | | | (0.24 | ) | | | (0.27 | ) | | | (0.18 | ) | | | (0.29 | ) | | | (0.31 | ) |
Net realized gains | | | (0.95 | ) | | | (2.46 | ) | | | (0.37 | ) | | | 0.00 | | | | 0.00 | |
| | | | | | | | | | | | | | | | | | | | |
Total distributions to shareholders | | | (1.19 | ) | | | (2.73 | ) | | | (0.55 | ) | | | (0.29 | ) | | | (0.31 | ) |
Net asset value, end of period | | | $22.98 | | | | $19.43 | | | | $22.76 | | | | $22.33 | | | | $21.81 | |
Total return | | | 25.60 | % | | | (2.43 | )% | | | 4.51 | % | | | 3.70 | % | | | 24.03 | % |
Ratios to average net assets (annualized) | | | | | | | | | | | | | | | | | | | | |
Gross expenses | | | 1.38 | % | | | 1.37 | % | | | 1.34 | % | | | 1.29 | % | | | 1.31 | % |
Net expenses | | | 1.25 | % | | | 1.22 | % | | | 1.15 | % | | | 1.15 | % | | | 1.15 | % |
Net investment income | | | 0.95 | % | | | 1.27 | % | | | 1.01 | % | | | 0.96 | % | | | 1.18 | % |
Supplemental data | | | | | | | | | | | | | | | | | | | | |
Portfolio turnover rate | | | 21 | % | | | 23 | % | | | 32 | % | | | 23 | % | | | 22 | % |
Net assets, end of period (000s omitted) | | | $4,727 | | | | $4,735 | | | | $6,239 | | | | $7,327 | | | | $5,306 | |
| 1 | Calculated based upon average shares outstanding |
The accompanying notes are an integral part of these financial statements.
| | | | |
| 20 | | Wells Fargo Intrinsic World Equity Fund | | Financial highlights |
(For a share outstanding throughout each period)
| | | | | | | | | | | | | | | | | | | | |
| | | Year ended October 31 | |
| INSTITUTIONAL CLASS | | 2017 | | | 2016 | | | 2015 | | | 2014 | | | 2013 | |
Net asset value, beginning of period | | | $19.51 | | | | $22.83 | | | | $22.40 | | | | $21.87 | | | | $17.93 | |
Net investment income | | | 0.27 | | | | 0.26 | | | | 0.28 | | | | 0.25 | 1 | | | 0.26 | 1 |
Net realized and unrealized gains (losses) on investments | | | 4.53 | | | | (0.80 | ) | | | 0.75 | | | | 0.60 | | | | 4.02 | |
| | | | | | | | | | | | | | | | | | | | |
Total from investment operations | | | 4.80 | | | | (0.54 | ) | | | 1.03 | | | | 0.85 | | | | 4.28 | |
Distributions to shareholders from | | | | | | | | | | | | | | | | | | | | |
Net investment income | | | (0.31 | ) | | | (0.32 | ) | | | (0.23 | ) | | | (0.32 | ) | | | (0.34 | ) |
Net realized gains | | | (0.95 | ) | | | (2.46 | ) | | | (0.37 | ) | | | 0.00 | | | | 0.00 | |
| | | | | | | | | | | | | | | | | | | | |
Total distributions to shareholders | | | (1.26 | ) | | | (2.78 | ) | | | (0.60 | ) | | | (0.32 | ) | | | (0.34 | ) |
Net asset value, end of period | | | $23.05 | | | | $19.51 | | | | $22.83 | | | | $22.40 | | | | $21.87 | |
Total return | | | 25.92 | % | | | (2.13 | )% | | | 4.72 | % | | | 3.90 | % | | | 24.28 | % |
Ratios to average net assets (annualized) | | | | | | | | | | | | | | | | | | | | |
Gross expenses | | | 1.14 | % | | | 1.13 | % | | | 1.09 | % | | | 1.04 | % | | | 1.06 | % |
Net expenses | | | 0.95 | % | | | 0.95 | % | | | 0.95 | % | | | 0.95 | % | | | 0.95 | % |
Net investment income | | | 1.28 | % | | | 1.47 | % | | | 1.23 | % | | | 1.11 | % | | | 1.32 | % |
Supplemental data | | | | | | | | | | | | | | | | | | | | |
Portfolio turnover rate | | | 21 | % | | | 23 | % | | | 32 | % | | | 23 | % | | | 22 | % |
Net assets, end of period (000s omitted) | | | $6,681 | | | | $4,357 | | | | $5,058 | | | | $3,179 | | | | $2,352 | |
| 1 | Calculated based upon average shares outstanding |
The accompanying notes are an integral part of these financial statements.
| | | | | | |
| Notes to financial statements | | Wells Fargo Intrinsic World Equity Fund | | | 21 | |
1. ORGANIZATION
Wells Fargo Funds Trust (the “Trust”), a Delaware statutory trust organized on March 10, 1999, is an open-end management investment company registered under the Investment Company Act of 1940, as amended (the “1940 Act”). As an investment company, the Trust follows the accounting and reporting guidance in Financial Accounting Standards Board Accounting Standards Codification Topic 946, Financial Services – Investment Companies. These financial statements report on the Wells Fargo Intrinsic World Equity Fund (the “Fund”) which is a diversified series of the Trust.
2. SIGNIFICANT ACCOUNTING POLICIES
The following significant accounting policies, which are consistently followed in the preparation of the financial statements of the Fund, are in conformity with U.S. generally accepted accounting principles which require management to make estimates and assumptions that affect the reported amounts of assets and liabilities, disclosure of contingent assets and liabilities at the date of the financial statements, and the reported amounts of revenues and expenses during the reporting period. Actual results could differ from those estimates.
Securities valuation
All investments are valued each business day as of the close of regular trading on the New York Stock Exchange (generally 4 p.m. Eastern Time), although the Fund may deviate from this calculation time under unusual or unexpected circumstances.
Equity securities that are listed on a foreign or domestic exchange or market are valued at the official closing price or, if none, the last sales price. If no sale occurs on the principal exchange or market that day, a fair value price will be determined in accordance with the Fund’s Valuation Procedures.
The values of securities denominated in foreign currencies are translated into U.S. dollars at rates provided by an independent foreign currency pricing source at a time each business day specified by the Management Valuation Team of Wells Fargo Funds Management, LLC (“Funds Management”).
Many securities markets and exchanges outside the U.S. close prior to the close of the New York Stock Exchange and therefore may not fully reflect trading or events that occur after the close of the principal exchange in which the foreign securities are traded, but before the close of the New York Stock Exchange. If such trading or events are expected to materially affect the value of such securities, then fair value pricing procedures approved by the Board of Trustees of the Fund are applied. These procedures take into account multiple factors including movements in U.S. securities markets after foreign exchanges close. Foreign securities that are fair valued under these procedures are categorized as Level 2 and the application of these procedures may result in transfers between Level 1 and Level 2. Depending on market activity, such fair valuations may be frequent. Such fair value pricing may result in net asset values that are higher or lower than net asset values based on the last reported sales price or latest quoted bid price. On October 31, 2017, such fair value pricing was not used in pricing foreign securities.
Investments in registered open-end investment companies are valued at net asset value. Interests in non-registered investment companies that are redeemable at net asset value are fair valued normally at net asset value.
Investments which are not valued using any of the methods discussed above are valued at their fair value, as determined in good faith by the Board of Trustees. The Board of Trustees has established a Valuation Committee comprised of the Trustees and has delegated to it the authority to take any actions regarding the valuation of portfolio securities that the Valuation Committee deems necessary or appropriate, including determining the fair value of portfolio securities, unless the determination has been delegated to the Management Valuation Team. The Board of Trustees retains the authority to make or ratify any valuation decisions or approve any changes to the Valuation Procedures as it deems appropriate. On a quarterly basis, the Board of Trustees receives reports on any valuation actions taken by the Valuation Committee or the Management Valuation Team which may include items for ratification.
Valuations of fair valued securities are compared to the next actual sales price when available, or other appropriate market values, to assess the continued appropriateness of the fair valuation methodologies used. These securities are fair valued on a day-to-day basis, taking into consideration changes to appropriate market information and any significant changes to the inputs considered in the valuation process until there is a readily available price provided on an exchange or by an independent pricing service. Valuations received from an independent pricing service or independent broker-dealer quotes are periodically validated by comparisons to most recent trades and valuations provided by other independent pricing services in addition to the review of prices by the manager and/or subadviser. Unobservable inputs used in determining fair valuations are identified based on the type of security, taking into consideration factors utilized by market participants in valuing the investment, knowledge about the issuer and the current market environment.
| | | | |
| 22 | | Wells Fargo Intrinsic World Equity Fund | | Notes to financial statements |
Foreign currency translation
The accounting records of the Fund are maintained in U.S. dollars. The values of other assets and liabilities denominated in foreign currencies are translated into U.S. dollars at rates provided by an independent foreign currency pricing source at a time each business day specified by the Management Valuation Team. Purchases and sales of securities, and income and expenses are converted at the rate of exchange on the respective dates of such transactions. Net realized foreign exchange gains or losses arise from sales of foreign currencies, currency gains or losses realized between the trade and settlement dates on securities transactions, and the difference between the amounts of dividends, interest and foreign withholding taxes recorded and the U.S. dollar equivalent of the amounts actually paid or received. Net unrealized foreign exchange gains and losses arise from changes in the fair value of assets and liabilities other than investments in securities resulting from changes in exchange rates. The changes in net assets arising from changes in exchange rates of securities and the changes in net assets resulting from changes in market prices of securities are not separately presented. Such changes are included in net realized and unrealized gains or losses from investments.
Security loans
The Fund may lend its securities from time to time in order to earn additional income in the form of fees or interest on securities received as collateral or the investment of any cash received as collateral. The Fund continues to receive interest or dividends on the securities loaned. The Fund receives collateral in the form of cash or securities with a value at least equal to the value of the securities on loan. The value of the loaned securities is determined at the close of each business day and any additional required collateral is delivered to the Fund on the next business day. In a securities lending transaction, the net asset value of the Fund will be affected by an increase or decrease in the value of the securities loaned and by an increase or decrease in the value of the instrument in which collateral is invested. The amount of securities lending activity undertaken by the Fund fluctuates from time to time. In the event of default or bankruptcy by the borrower, the Fund may be prevented from recovering the loaned securities or gaining access to the collateral or may experience delays or costs in doing so. In addition, the investment of any cash collateral received may lose all or part of its value. The Fund has the right under the lending agreement to recover the securities from the borrower on demand.
The Fund lends its securities through an unaffiliated securities lending agent. Cash collateral received in connection with its securities lending transactions is invested in Securities Lending Cash Investments, LLC (the “Securities Lending Fund”). The Securities Lending Fund is exempt from registration under Section 3(c)(7) of the 1940 Act and is managed by Funds Management and is subadvised by Wells Capital Management Incorporated (“WellsCap”), an affiliate of Funds Management and an indirect wholly owned subsidiary of Wells Fargo & Company (“Wells Fargo”). Funds Management receives an advisory fee starting at 0.05% and declining to 0.01% as the average daily net assets of the Securities Lending Fund increase. All of the fees received by Funds Management are paid to WellsCap for its services as subadviser. The Securities Lending Fund seeks to provide a positive return compared to the daily Fed Funds Open Rate by investing in high-quality, U.S. dollar-denominated short-term money market instruments. Securities Lending Fund investments are valued at the evaluated bid price provided by an independent pricing service. Income earned from investment in the Securities Lending Fund is included in income from affiliates securities on the Statement of Operations.
Security transactions and income recognition
Securities transactions are recorded on a trade date basis. Realized gains or losses are recorded on the basis of identified cost.
Dividend income is recognized on the ex-dividend date, except for certain dividends from foreign securities, which are recorded as soon as the custodian verifies the ex-dividend date. Dividend income from foreign securities is recorded net of foreign taxes withheld where recovery of such taxes is not assured.
Distributions to shareholders
Distributions to shareholders from net investment income and net realized gains, if any, are recorded on the ex-dividend date. Such distributions are determined in accordance with income tax regulations and may differ from U.S. generally accepted accounting principles. Dividend sources are estimated at the time of declaration. The tax character of distributions is determined as of the Fund’s fiscal year end. Therefore, a portion of the Fund’s distributions made prior to the Fund’s fiscal year end may be categorized as a tax return of capital.
Federal and other taxes
The Fund intends to continue to qualify as a regulated investment company by distributing substantially all of its investment company taxable income and any net realized capital gains (after reduction for capital loss carryforwards) sufficient to relieve it from all, or substantially all, federal income taxes. Accordingly, no provision for federal income taxes was required.
| | | | | | |
| Notes to financial statements | | Wells Fargo Intrinsic World Equity Fund | | | 23 | |
The Fund’s income and federal excise tax returns and all financial records supporting those returns for the prior three fiscal years are subject to examination by the federal and Delaware revenue authorities. Management has analyzed the Fund’s tax positions taken on federal, state, and foreign tax returns for all open tax years and does not believe that there are any uncertain tax positions that require recognition of a tax liability.
As of October 31, 2017, the aggregate cost of all investments for federal income tax purposes was $124,918,836 and the unrealized gains (losses) consisted of:
| | | | |
Gross unrealized gains | | $ | 40,454,075 | |
Gross unrealized losses | | | (3,470,543 | ) |
Net unrealized gains | | $ | 36,983,532 | |
Reclassifications are made to the Fund’s capital accounts for permanent tax differences to reflect income and gains available for distribution (or available capital loss carryforwards) under federal income tax regulations. U.S. generally accepted accounting principles require that certain components of net assets be adjusted to reflect permanent differences between financial and tax reporting. These reclassifications have no effect on net assets or net asset values per share. At October 31, 2017, as a result of permanent book-to-tax differences, the following reclassification adjustments were made on the Statement of Assets and Liabilities:
| | |
Undistributed net investment income | | Accumulated net realized gains on investments |
| $(4,658) | | $4,658 |
Class allocations
The separate classes of shares offered by the Fund differ principally in applicable sales charges, distribution, shareholder servicing, and administration fees. Class specific expenses are charged directly to that share class. Investment income, common expenses, and realized and unrealized gains (losses) on investments are allocated daily to each class of shares based on the relative proportion of net assets of each class.
3. FAIR VALUATION MEASUREMENTS
Fair value measurements of investments are determined within a framework that has established a fair value hierarchy based upon the various data inputs utilized in determining the value of the Fund’s investments. The three-level hierarchy gives the highest priority to unadjusted quoted prices in active markets for identical assets or liabilities (Level 1) and the lowest priority to unobservable inputs (Level 3). The Fund’s investments are classified within the fair value hierarchy based on the lowest level of input that is significant to the fair value measurement. The inputs are summarized into three broad levels as follows:
| ∎ | | Level 1 – quoted prices in active markets for identical securities |
| ∎ | | Level 2 – other significant observable inputs (including quoted prices for similar securities, interest rates, prepayment speeds, credit risk, etc.) |
| ∎ | | Level 3 – significant unobservable inputs (including the Fund’s own assumptions in determining the fair value of investments) |
The inputs or methodologies used for valuing investments in securities are not necessarily an indication of the risk associated with investing in those securities.
| | | | |
| 24 | | Wells Fargo Intrinsic World Equity Fund | | Notes to financial statements |
The following is a summary of the inputs used in valuing the Fund’s assets and liabilities as of October 31, 2017:
| | | | | | | | | | | | | | | | |
| | | Quoted prices (Level 1) | | | Other significant observable inputs (Level 2) | | | Significant unobservable inputs (Level 3) | | | Total | |
Assets | | | | | | | | | | | | | | | | |
Investments in: | | | | | | | | | | | | | | | | |
| | | | |
Common stocks | | | | | | | | | | | | | | | | |
Belgium | | $ | 1,559,306 | | | $ | 0 | | | $ | 0 | | | $ | 1,559,306 | |
France | | | 12,615,449 | | | | 0 | | | | 0 | | | | 12,615,449 | |
Germany | | | 4,477,623 | | | | 0 | | | | 0 | | | | 4,477,623 | |
Hong Kong | | | 3,136,124 | | | | 0 | | | | 0 | | | | 3,136,124 | |
Japan | | | 15,070,248 | | | | 0 | | | | 0 | | | | 15,070,248 | |
Netherlands | | | 12,257,190 | | | | 0 | | | | 0 | | | | 12,257,190 | |
Spain | | | 3,715,742 | | | | 0 | | | | 0 | | | | 3,715,742 | |
Switzerland | | | 11,914,828 | | | | 0 | | | | 0 | | | | 11,914,828 | |
United Kingdom | | | 9,669,820 | | | | 0 | | | | 0 | | | | 9,669,820 | |
United States | | | 85,243,210 | | | | 0 | | | | 0 | | | | 85,243,210 | |
| | | | |
Short-term investments | | | | | | | | | | | | | | | | |
Investment companies | | | 763,828 | | | | 0 | | | | 0 | | | | 763,828 | |
Investments measured at net asset value* | | | | | | | | | | | | | | | 1,479,000 | |
Total assets | | $ | 160,423,368 | | | $ | 0 | | | $ | 0 | | | $ | 161,902,368 | |
| * | Investments that are measured at fair value using the net asset value per share (or its equivalent) as a practical expedient have not been categorized in the fair value hierarchy. The fair value amount presented in the table is intended to permit reconciliation of the fair value hierarchy to the amounts presented in the Statement of Assets and Liabilities. The Fund’s investment in Securities Lending Cash Investments, LLC valued at $1,479,000 does not have a redemption period notice, can be redeemed daily and does not have any unfunded commitments. |
The Fund recognizes transfers between levels within the fair value hierarchy at the end of the reporting period. At October 31, 2017, the Fund did not have any transfers into/out of Level 1, Level 2, or Level 3.
4. TRANSACTIONS WITH AFFILIATES AND OTHER EXPENSES
Management fee
Funds Management, an indirect wholly owned subsidiary of Wells Fargo, is the manager of the Fund and provides advisory and fund-level administrative services under an investment management agreement. Under the investment management agreement, Funds Management is responsible for, among other services, implementing the investment objectives and strategies of the Fund, supervising the subadviser, providing fund-level administrative services in connection with the Fund’s operations, and providing any other fund-level administrative services reasonably necessary for the operation of the Fund. As compensation for its services under the investment management agreement, Funds Management is entitled to receive an annual management fee starting at 0.85% and declining to 0.68% as the average daily net assets of the Fund increase. For the year ended October 31, 2017, the management fee was equivalent to an annual rate of 0.85% of the Fund’s average daily net assets.
Funds Management has retained the services of a subadviser to provide daily portfolio management to the Fund. The fee for subadvisory services is borne by Funds Management. WellsCap is the subadviser to the Fund and is entitled to receive a fee from Funds Management at an annual rate starting at 0.35% and declining to 0.20% as the average daily net assets of the Fund increase.
Administration fees
Under a class-level administration agreement, Funds Management provides class-level administrative services to the Fund, which includes paying fees and expenses for services provided by the transfer agent, sub-transfer agents, omnibus
| | | | | | |
| Notes to financial statements | | Wells Fargo Intrinsic World Equity Fund | | | 25 | |
account servicers and record-keepers. As compensation for its services under the class-level administration agreement, Funds Management receives an annual fee which is calculated based on the average daily net assets of each class as follows:
| | | | |
| | | Class-level
administration fee | |
Class A, Class C | | | 0.21 | % |
Administrator Class, Institutional Class | | | 0.13 | |
Funds Management has contractually waived and/or reimbursed management and administration fees to the extent necessary to maintain certain net operating expense ratios for the Fund. Waiver of fees and/or reimbursement of expenses by Funds Management were made first from fund level expenses on a proportionate basis and then from class specific expenses. Funds Management has committed through February 28, 2018 to waive fees and/or reimburse expenses to the extent necessary to cap the Fund’s expenses at 1.35% for Class A shares, 2.10% for Class C shares, 1.25% for Administrator Class shares, and 0.95% for Institutional Class shares. After this time, the cap may be increased or the commitment to maintain the cap may be terminated only with the approval of the Board of Trustees.
Out-of-pocket reimbursements
During the year ended October 31, 2017, State Street Bank and Trust Company (“State Street”), the Fund’s custodian, reimbursed the Fund $29,258 for certain out-of-pocket expenses that were billed to the Fund in error from 1998-2015. This amount is included in dividend income on the Statement of Operations. In addition, Funds Management was also reimbursed $49,603 by State Street for waivers/reimbursements it made to the Fund to limit Fund expenses during the period the Fund was erroneously billed.
Distribution fee
The Trust has adopted a distribution plan for Class C shares of the Fund pursuant to Rule 12b-1 under the 1940 Act. A distribution fee is charged to Class C shares and paid to Wells Fargo Funds Distributor, LLC (“Funds Distributor”), the principal underwriter, at an annual rate of 0.75% of the average daily net assets of Class C shares.
In addition, Funds Distributor is entitled to receive the front-end sales charge from the purchase of Class A shares and a contingent deferred sales charge on the redemption of certain Class A shares. Funds Distributor is also entitled to receive the contingent deferred sales charges from redemptions of Class C shares. For the year ended October 31, 2017, Funds Distributor received $1,422 from the sale of Class A shares. No contingent deferred sales charges were incurred by Class A and Class C shares for the year ended October 31, 2017.
Shareholder servicing fees
The Trust has entered into contracts with one or more shareholder servicing agents, whereby Class A, Class C, and Administrator Class, of the Fund are charged a fee at an annual rate of 0.25% of the average daily net assets of each respective class.
A portion of these total shareholder servicing fees were paid to affiliates of Wells Fargo.
Interfund transactions
The Fund may purchase or sell portfolio investment securities to certain other Wells Fargo affiliates pursuant to Rule 17a-7 under the 1940 Act and under procedures adopted by the Board of Trustees. The procedures have been designed to ensure that these interfund transactions, which do not incur broker commissions, are effected at current market prices.
5. INVESTMENT PORTFOLIO TRANSACTIONS
Purchases and sales of investments, excluding U.S. government obligations (if any) and short-term securities, for the year ended October 31, 2017 were $31,478,222 and $48,080,254, respectively.
6. BANK BORROWINGS
The Trust (excluding the money market funds and certain other funds) and Wells Fargo Variable Trust are parties to a $280,000,000 revolving credit agreement whereby the Fund is permitted to use bank borrowings for temporary or emergency purposes, such as to fund shareholder redemption requests. Interest under the credit agreement is charged to the Fund based on a borrowing rate equal to the higher of the Federal Funds rate in effect on that day plus 1.25% or the overnight LIBOR rate in effect on that day plus 1.25%. In addition, an annual commitment fee equal to 0.25% of the unused balance is allocated to each participating fund. Prior to August 29, 2017, the revolving credit agreement amount was $250,000,000.
| | | | |
| 26 | | Wells Fargo Intrinsic World Equity Fund | | Notes to financial statements |
For the year ended October 31, 2017, there were no borrowings by the Fund under the agreement.
7. DISTRIBUTIONS TO SHAREHOLDERS
The tax character of distributions paid during the years ended October 31, 2017 and October 31, 2016 were as follows:
| | | | | | | | |
| | | Year ended October 31 | |
| | | 2017 | | | 2016 | |
Ordinary income | | $ | 1,716,402 | | | $ | 2,314,580 | |
Long-term capital gain | | | 6,900,338 | | | | 17,454,228 | |
As of October 31, 2017, the components of distributable earnings on a tax basis were as follows:
| | | | |
Undistributed ordinary income | | Undistributed long-term
gain | | Unrealized gains |
| $1,951,084 | | $11,144,006 | | $36,983,564 |
8. INDEMNIFICATION
Under the Trust’s organizational documents, the officers and Trustees have been granted certain indemnification rights against certain liabilities that may arise out of performance of their duties to the Trust. Additionally, in the normal course of business, the Trust may enter into contracts with service providers that contain a variety of indemnification clauses. The Trust’s maximum exposure under these arrangements is dependent on future claims that may be made against the Fund and, therefore, cannot be estimated.
9. SUBSEQUENT DISTRIBUTIONS
On December 13, 2017, the Fund declared distributions from capital gains to shareholders of record on December 12, 2017. The per share amounts payable on December 14, 2017 were as follows:
| | | | | | | | |
| | | Short-term capital gains | | | Long-term capital gains | |
Class A | | $ | 0.07013 | | | $ | 1.62242 | |
Class C | | | 0.07013 | | | | 1.62242 | |
Administrator Class | | | 0.07013 | | | | 1.62242 | |
Institutional Class | | | 0.07013 | | | | 1.62242 | |
These distributions are not reflected in the accompanying financial statements.
| | | | | | |
| Report of independent registered public accounting firm | | Wells Fargo Intrinsic World Equity Fund | | | 27 | |
BOARD OF TRUSTEES AND SHAREHOLDERS OF WELLS FARGO FUNDS TRUST:
We have audited the accompanying statement of assets and liabilities, including the portfolio of investments, of the Wells Fargo Intrinsic World Equity Fund (the “Fund”), one of the funds constituting the Wells Fargo Funds Trust, as of October 31, 2017, and the related statements of operations for the year then ended, the statements of changes in net assets for each of the years in the two-year period then ended, and the financial highlights for each of the years in the five-year period then ended. These financial statements and financial highlights are the responsibility of the Fund’s management. Our responsibility is to express an opinion on these financial statements and financial highlights based on our audits.
We conducted our audits in accordance with the standards of the Public Company Accounting Oversight Board (United States). Those standards require that we plan and perform the audit to obtain reasonable assurance about whether the financial statements and financial highlights are free of material misstatement. An audit includes examining, on a test basis, evidence supporting the amounts and disclosures in the financial statements. Our procedures included confirmation of securities owned as of October 31, 2017, by correspondence with custodian and brokers, or by other appropriate audit procedures. An audit also includes assessing the accounting principles used and significant estimates made by management, as well as evaluating the overall financial statement presentation. We believe that our audits provide a reasonable basis for our opinion.
In our opinion, the financial statements and financial highlights referred to above present fairly, in all material respects, the financial position of the Wells Fargo Intrinsic World Equity Fund as of October 31, 2017 the results of its operations for the year then ended, the changes in its net assets for each of the years in the two-year period then ended, and the financial highlights for each of the years or periods in the five-year period then ended, in conformity with U.S. generally accepted accounting principles.

Boston, Massachusetts
December 21, 2017
| | | | |
| 28 | | Wells Fargo Intrinsic World Equity Fund | | Other information (unaudited) |
TAX INFORMATION
For corporate shareholders, pursuant to Section 854 of the Internal Revenue Code, 96.23% of ordinary income dividends qualify for the corporate dividends-received deduction for the fiscal year ended October 31, 2017.
Pursuant to Section 852 of the Internal Revenue Code, $6,900,338 was designated as a 20% rate gain distribution for the fiscal year ended October 31, 2017.
Pursuant to Section 854 of the Internal Revenue Code, $1,716,402 of income dividends paid during the fiscal year ended October 31, 2017 has been designated as qualified dividend income (QDI).
PROXY VOTING INFORMATION
A description of the policies and procedures that the Fund uses to determine how to vote proxies relating to portfolio securities is available, upon request, by calling 1-800-222-8222, visiting our website at wellsfargofunds.com, or visiting the SEC website at sec.gov. Information regarding how the Fund voted proxies relating to portfolio securities during the most recent 12-month period ended June 30 is available on the Fund’s website at wellsfargofunds.com or by visiting the SEC website at sec.gov.
PORTFOLIO HOLDINGS INFORMATION
The complete portfolio holdings for the Fund are publicly available monthly on the Fund’s website (wellsfargofunds.com), on a one-month delayed basis. In addition, top ten holdings information (excluding derivative positions) for the Fund is publicly available on the Fund’s website on a monthly, seven-day or more delayed basis. The Fund files its complete schedule of portfolio holdings with the SEC for the first and third quarters of each fiscal year on Form N-Q, which is available by visiting the SEC website at sec.gov. In addition, the Fund’s Form N-Q may be reviewed and copied at the SEC’s Public Reference Room in Washington, DC, and at regional offices in New York City, at 233 Broadway, and in Chicago, at 175 West Jackson Boulevard, Suite 900. Information about the Public Reference Room may be obtained by calling 1-800-SEC-0330.
| | | | | | |
| Other information (unaudited) | | Wells Fargo Intrinsic World Equity Fund | | | 29 | |
BOARD OF TRUSTEES AND OFFICERS
Each of the Trustees and Officers1 listed in the table below acts in identical capacities for each fund in the Wells Fargo family of funds, which consists of 152 mutual funds comprising the Wells Fargo Funds Trust, Wells Fargo Variable Trust, Wells Fargo Master Trust and four closed-end funds (collectively the “Fund Complex”). This table should be read in conjunction with the Prospectus and the Statement of Additional Information2. The mailing address of each Trustee and Officer is 525 Market Street, 12th Floor, San Francisco, CA 94105. Each Trustee and Officer serves an indefinite term, however, each Trustee serves such term until reaching the mandatory retirement age established by the Trustees.
Independent Trustees
| | | | | | |
Name and year of birth | | Position held and length of service* | | Principal occupations during past five years or longer | | Current other
public company or
investment company
directorships |
William R. Ebsworth (Born 1957) | | Trustee, since 2015 | | Retired. From 1984 to 2013, equities analyst, portfolio manager, research director and chief investment officer at Fidelity Management and Research Company in Boston, Tokyo, and Hong Kong, and retired in 2013 as Chief Investment Officer of Fidelity Strategic Advisers, Inc. where he led a team of investment professionals managing client assets. Prior thereto, Board member of Hong Kong Securities Clearing Co., Hong Kong Options Clearing Corp., the Thailand International Fund, Ltd., Fidelity Investments Life Insurance Company, and Empire Fidelity Investments Life Insurance Company. Board member of the Forté Foundation (non-profit organization) and the Vincent Memorial Hospital Endowment (non-profit organization), where he serves on the Investment Committee and as Chair of the Audit Committee. Mr. Ebsworth is a CFA® charterholder. | | Asset Allocation Trust |
Jane A. Freeman** (Born 1953) | | Trustee, since 2015; Chair Liaison, effective 2018 | | Retired. From 2012 to 2014 and 1999 to 2008, Chief Financial Officer of Scientific Learning Corporation. From 2008 to 2012, Ms. Freeman provided consulting services related to strategic business projects. Prior to 1999, Portfolio Manager at Rockefeller & Co. and Scudder, Stevens & Clark. Board member of the Harding Loevner Funds from 1996 to 2014, serving as both Lead Independent Director and chair of the Audit Committee. Board member of the Russell Exchange Traded Funds Trust from 2011 to 2012 and the chair of the Audit Committee. Ms. Freeman is a Board Member of Ruth Bancroft Garden (non-profit organization) and an inactive chartered financial analyst. | | Asset Allocation Trust |
Peter G. Gordon*** (Born 1942) | | Trustee, from 1998 to 2017; Chairman, from 2005 to 2017 | | Co-Founder, Retired Chairman, President and CEO of Crystal Geyser Water Company. Trustee Emeritus, Colby College. | | Asset Allocation Trust |
Isaiah Harris, Jr. (Born 1952) | | Trustee, since 2009 | | Retired. Chairman of the Board of CIGNA Corporation since 2009, and Director since 2005. From 2003 to 2011, Director of Deluxe Corporation. Prior thereto, President and CEO of BellSouth Advertising and Publishing Corp. from 2005 to 2007, President and CEO of BellSouth Enterprises from 2004 to 2005 and President of BellSouth Consumer Services from 2000 to 2003. Emeritus member of the Iowa State University Foundation Board of Governors. Emeritus Member of the Advisory Board of Iowa State University School of Business. Advisory Board Member, Palm Harbor Academy (charter school). Advisory Board Member, Child Evangelism Fellowship (non-profit). Mr. Harris is a certified public accountant (inactive status). | | CIGNA Corporation; Asset Allocation Trust |
Judith M. Johnson (Born 1949) | | Trustee, since 2008; Audit Committee Chairman, since 2008 | | Retired. Prior thereto, Chief Executive Officer and Chief Investment Officer of Minneapolis Employees Retirement Fund from 1996 to 2008. Ms. Johnson is an attorney, certified public accountant and a certified managerial accountant. | | Asset Allocation Trust |
David F. Larcker (Born 1950) | | Trustee, since 2009 | | James Irvin Miller Professor of Accounting at the Graduate School of Business, Stanford University, Director of the Corporate Governance Research Initiative and Senior Faculty of The Rock Center for Corporate Governance since 2006. From 2005 to 2008, Professor of Accounting at the Graduate School of Business, Stanford University. Prior thereto, Ernst & Young Professor of Accounting at The Wharton School, University of Pennsylvania from 1985 to 2005. | | Asset Allocation Trust |
| | | | |
| 30 | | Wells Fargo Intrinsic World Equity Fund | | Other information (unaudited) |
| | | | | | |
Name and year of birth | | Position held and length of service* | | Principal occupations during past five years or longer | | Current other
public company or
investment company
directorships |
Olivia S. Mitchell**** (Born 1953) | | Trustee, since 2006; Governance Committee Chairman, effective 2018 | | International Foundation of Employee Benefit Plans Professor, Wharton School of the University of Pennsylvania since 1993. Director of Wharton’s Pension Research Council and Boettner Center on Pensions & Retirement Research, and Research Associate at the National Bureau of Economic Research. Previously, Cornell University Professor from 1978 to 1993. | | Asset Allocation Trust |
Timothy J. Penny***** (Born 1951) | | Trustee, since 1996; Chairman, effective 2018; Vice Chairman, from 2017 to 2018 | | President and Chief Executive Officer of Southern Minnesota Initiative Foundation, a non-profit organization, since 2007 and Senior Fellow at the Humphrey Institute Policy Forum at the University of Minnesota since 1995. Member of the Board of Trustees of NorthStar Education Finance, Inc., a non-profit organization, since 2007. | | Asset Allocation Trust |
James G. Polisson****** (Born 1959) | | Trustee, effective 2018; Advisory Board Member, from 2017 to 2018 | | Retired. Chief Marketing Officer, Source (ETF) UK Services, Ltd, from 2015 to 2017. From 2012 to 2015, Principal of The Polisson Group, LLC, a management consulting, corporate advisory and principal investing company. Chief Executive Officer and Managing Director at Russell Investments, Global Exchange Traded Funds from 2010 to 2012. Managing Director of Barclays Global Investors from 1998 to 2010 and Global Chief Marketing Officer for iShares and Barclays Global Investors from 2000 to 2010. Prior thereto, Vice President, Fidelity Retail Mutual Fund Group from 1996 to 1998 and Risk Management Practice Manager, Fidelity Consulting from 1995 to 1996. Board member of the Russell Exchange Traded Fund Trust from 2011 to 2012. Director of Barclays Global Investors Holdings Deutschland GmbH from 2006 to 2009. Mr. Polisson is an attorney and has a retired status with the Massachusetts and District of Columbia Bar Associations. | | Asset Allocation Trust |
Michael S. Scofield (Born 1943) | | Trustee, since 2010 | | Served on the Investment Company Institute’s Board of Governors and Executive Committee from 2008-2011 as well the Governing Council of the Independent Directors Council from 2006-2011 and the Independent Directors Council Executive Committee from 2008-2011. Trustee of the Evergreen Funds complex (and its predecessors) from 1984 to 2010. Chairman of the Evergreen Funds from 2000-2010. Former Trustee of the Mentor Funds. Retired Attorney, Law Offices of Michael S. Scofield. | | Asset Allocation Trust |
Pamela Wheelock****** (Born 1959) | | Trustee, effective 2018; Advisory Board Member, from 2017 to 2018 | | Chief Operating Officer, Twin Cities Habitat for Humanity, since January, 2017. Vice President of University Services, University of Minnesota from 2012 to 2017. Prior thereto, Interim President and Chief Executive Officer of Blue Cross Blue Shield of Minnesota from 2010 to 2011, Chairman of the Board from 2009 to 2011 and Board Director from 2003 to 2015. Vice President, Leadership and Community Engagement, Bush Foundation, Saint Paul, Minnesota (a private foundation) from 2009 to 2011. Executive Vice President and Chief Financial Officer, Minnesota Sports and Entertainment from 2004 to 2009 and Senior Vice President from 2002 to 2004. Commissioner of Finance, State of Minnesota, from 1999 to 2002. Currently on the Board of Directors, Governance Committee and Finance Committee, for the Minnesota Philanthropy Partners (Saint Paul Foundation) since 2012 and Board Chair of the Minnesota Wild Foundation since 2010. | | Asset Allocation Trust |
| * | Length of service dates reflect the Trustee’s commencement of service with the Trust’s predecessor entities, where applicable. |
| ** | Jane Freeman will become Chair Liaison effective January 1, 2018. |
| *** | Peter Gordon will retire on December 31, 2017. |
| **** | Olivia Mitchell will become Chairman of the Governance Committee effective January 1, 2018. |
| ***** | Timothy Penny will become Chairman effective January 1, 2018. |
| ****** | James Polisson and Pamela Wheelock each will become a Trustee effective January 1, 2018. |
| | | | | | |
| Other information (unaudited) | | Wells Fargo Intrinsic World Equity Fund | | | 31 | |
Officers
| | | | | | |
Name and year of birth | | Position held and length of service | | Principal occupations during past five years or longer | | |
Andrew Owen (Born 1960) | | President, since 2017 | | Executive Vice President of Wells Fargo & Company and Head of Affiliated Managers, Wells Fargo Asset Management, since 2014. In addition, Mr. Owen is currently President, Chief Executive Officer and Director of Wells Fargo Funds Management, LLC since 2017. Prior thereto, Executive Vice President responsible for marketing, investments and product development for Wells Fargo Funds Management, LLC, from 2009 to 2014. | | |
Jeremy DePalma1 (Born 1974) | | Treasurer, since 2012 | | Senior Vice President of Wells Fargo Funds Management, LLC since 2009. Senior Vice President of Evergreen Investment Management Company, LLC from 2008 to 2010 and head of the Fund Reporting and Control Team within Fund Administration from 2005 to 2010. | | |
C. David Messman (Born 1960) | | Secretary, since 2000; Chief Legal Officer, since 2003 | | Senior Vice President and Secretary of Wells Fargo Funds Management, LLC since 2001. Assistant General Counsel of Wells Fargo Bank, N.A. since 2013 and Vice President and Managing Counsel of Wells Fargo Bank, N.A. from 1996 to 2013. | | |
Michael H. Whitaker (Born 1967) | | Chief Compliance Officer, since 2016 | | Senior Vice President and Chief Compliance Officer since 2016. Senior Vice President and Chief Compliance Officer for Fidelity Investments from 2007 to 2016. | | |
David Berardi (Born 1975) | | Assistant Treasurer, since 2009 | | Vice President of Wells Fargo Funds Management, LLC since 2009. Vice President of Evergreen Investment Management Company, LLC from 2008 to 2010. Manager of Fund Reporting and Control for Evergreen Investment Management Company, LLC from 2004 to 2010. | | |
| 1 | Jeremy DePalma acts as Treasurer of 76 funds and Assistant Treasurer of 76 funds in the Fund Complex. |
| 2 | The Statement of Additional Information includes additional information about the Trustees and is available, without charge, upon request, by calling 1-800-222-8222 or by visiting the website at wellsfargofunds.com. |
| | | | |
| 32 | | Wells Fargo Intrinsic World Equity Fund | | Other information (unaudited) |
BOARD CONSIDERATION OF INVESTMENT MANAGEMENT AND SUB-ADVISORY AGREEMENTS:
Under the Investment Company Act of 1940 (the “1940 Act”), the Board of Trustees (the “Board”) of Wells Fargo Funds Trust (the “Trust”) must determine annually whether to approve the continuation of the Trust’s investment management and sub-advisory agreements. In this regard, at an in-person meeting held on May 16-17, 2017 (the “Meeting”), the Board, all the members of which have no direct or indirect interest in the investment management and sub-advisory agreements and are not “interested persons” of the Trust, as defined in the 1940 Act (the “Independent Trustees”), reviewed and approved for Wells Fargo Intrinsic World Equity Fund (the “Fund”): (i) an investment management agreement (the “Management Agreement”) with Wells Fargo Funds Management, LLC (“Funds Management”); and (ii) an investment sub-advisory agreement (the “Sub-Advisory Agreement”) with Wells Capital Management Incorporated (the “Sub-Adviser”), an affiliate of Funds Management. The Management Agreement and the Sub-Advisory Agreement are collectively referred to as the “Advisory Agreements.”
At the Meeting, the Board considered the factors and reached the conclusions described below relating to the selection of Funds Management and the Sub-Adviser and the approval of the Advisory Agreements. Prior to the Meeting, including at an in-person meeting in April 2017, the Trustees conferred extensively among themselves and with representatives of Funds Management about these matters. Also, the Board has adopted a team-based approach, with each team consisting of a sub-set of Trustees, to assist the full Board in the discharge of its duties in reviewing performance and other matters throughout the year. The Independent Trustees were assisted in their evaluation of the Advisory Agreements by independent legal counsel, from whom they received separate legal advice and with whom they met separately.
In providing information to the Board, Funds Management and the Sub-Adviser were guided by a detailed set of requests for information submitted to them by independent legal counsel on behalf of the Independent Trustees at the start of the Board’s annual contract renewal process earlier in 2017. In considering and approving the Advisory Agreements, the Trustees considered the information they believed relevant, including but not limited to the information discussed below. The Board considered not only the specific information presented in connection with the Meeting, but also the knowledge gained over time through interaction with Funds Management and the Sub-Adviser about various topics. In this regard, the Board reviewed reports of Funds Management at each of its quarterly meetings, which included, among other things, portfolio reviews and performance reports. In addition, the Board and the teams mentioned above confer with portfolio managers at various times throughout the year. The Board did not identify any particular information or consideration that was all-important or controlling, and each individual Trustee may have attributed different weights to various factors.
After its deliberations, the Board unanimously approved the continuation of the Advisory Agreements for a one-year term and determined that the compensation payable to Funds Management and the Sub-Adviser under each of the Advisory Agreements was reasonable. The Board considered the approval of the Advisory Agreements for the Fund as part of its consideration of agreements for funds across the complex, but its approvals were made on a fund-by-fund basis. The following summarizes a number of important, but not necessarily all, factors considered by the Board in support of its approvals.
Nature, extent and quality of services
The Board received and considered various information regarding the nature, extent and quality of services provided to the Fund by Funds Management and the Sub-Adviser under the Advisory Agreements. This information included a description of the investment advisory services and Fund-level administrative services covered by the Management Agreement, as well as, among other things, a summary of the background and experience of senior management of Funds Management, a summary of certain organizational and personnel changes involving Funds Management and the Sub-Adviser, and a description of Funds Management’s and the Sub-Adviser’s business continuity planning programs and of their approaches to data privacy and cybersecurity. The Board also considered the qualifications, background, tenure and responsibilities of each of the portfolio managers primarily responsible for the day-to-day portfolio management of the Fund.
The Board evaluated the ability of Funds Management and the Sub-Adviser to attract and retain qualified investment professionals, including research, advisory and supervisory personnel. The Board further considered the compliance programs and compliance records of Funds Management and the Sub-Adviser. In addition, the Board took into account the full range of services provided to the Fund by Funds Management and its affiliates.
Fund performance and expenses
The Board considered the performance results for the Fund over various time periods ended December 31, 2016. The Board considered these results in comparison to the performance of funds in a universe that was determined by
| | | | | | |
| Other information (unaudited) | | Wells Fargo Intrinsic World Equity Fund | | | 33 | |
Broadridge Inc. (“Broadridge”) to be similar to the Fund (the “Universe”), and in comparison to the Fund’s benchmark index and to other comparative data. Broadridge is an independent provider of investment company data. The Board received a description of the methodology used by Broadridge to select the mutual funds in the performance Universe. The Board noted that the performance of the Fund (Administrator Class) was higher than or in range of the average performance of the Universe for all periods under review. The Board also noted that the performance of the Fund was higher than its benchmark, the MSCI World Index (Net), for the ten-year period under review, but lower than its benchmark for the one-, three- and five-year periods under review.
The Board also received and considered information regarding the Fund’s net operating expense ratios and their various components, including actual management fees, custodian and other non-management fees, and Rule 12b-1 and non-Rule 12b-1 shareholder service fees. The Board considered these ratios in comparison to the median ratios of funds in class-specific expense groups that were determined by Broadridge to be similar to the Fund (the “Groups”). The Board received a description of the methodology used by Broadridge to select the mutual funds in the expense Groups and an explanation of how funds comprising expense groups and their expense ratios may vary from year-to-year. Based on the Broadridge reports, the Board noted that the net operating expense ratios of the Fund were lower than or equal to the median net operating expense ratios of the expense Groups for all share classes.
The Board took into account the Fund performance and expense information provided to it among the factors considered in deciding to re-approve the Advisory Agreements.
Investment management and sub-advisory fee rates
The Board reviewed and considered the contractual fee rates payable by the Fund to Funds Management under the Management Agreement, as well as the contractual fee rates payable by the Fund to Funds Management for class-level administrative services under a Class-Level Administration Agreement, which include, among other things, class-level transfer agency and sub-transfer agency costs (collectively, the “Management Rates”). The Board also reviewed and considered the contractual investment sub-advisory fee rates that are payable by Funds Management to the Sub-Adviser for investment sub-advisory services.
Among other information reviewed by the Board was a comparison of the Fund’s Management Rates with the average contractual investment management fee rates of funds in the expense Groups at a common asset level as well as transfer agency costs of the funds in the expense Groups. The Board noted that the Management Rates of the Fund were in range of the sum of these average rates for the Fund’s expense Groups for all share classes.
The Board also received and considered information about the portion of the total management fee that was retained by Funds Management after payment of the fee to the Sub-Adviser for sub-advisory services. In assessing the reasonableness of this amount, the Board received and evaluated information about the nature and extent of responsibilities retained and risks assumed by Funds Management and not delegated to or assumed by the Sub-Adviser, and about Funds Management’s on-going oversight services. Given the affiliation between Funds Management and the Sub-Adviser, the Board ascribed limited relevance to the allocation of fees between them.
The Board also received and considered information about the nature and extent of services offered and fee rates charged by Funds Management and the Sub-Adviser to other types of clients with investment strategies similar to those of the Fund. In this regard, the Board received information about the significantly greater scope of services, and compliance, reporting and other legal burdens and risks of managing mutual funds compared with those associated with managing assets of non-mutual fund clients such as institutional separate accounts.
Based on its consideration of the factors and information it deemed relevant, including those described here, the Board determined that the compensation payable to Funds Management under the Management Agreement and to the Sub-Adviser under the Sub-Advisory Agreement was reasonable.
Profitability
The Board received and considered information concerning the profitability of Funds Management, as well as the profitability of Wells Fargo as a whole, from providing services to the Fund and the fund family as a whole. The Board also received and considered information concerning the profitability of the Sub-Adviser from providing services to the fund family as a whole, noting that the Sub-Adviser’s profitability information with respect to providing services to the Fund was subsumed in the Wells Fargo and Funds Management profitability analysis.
Funds Management reported on the methodologies and estimates used in calculating profitability, including a description of the methodology used to allocate certain expenses. Among other things, the Board noted that the levels of profitability reported on a fund-by-fund basis varied widely, depending on factors such as the size and type of fund.
| | | | |
| 34 | | Wells Fargo Intrinsic World Equity Fund | | Other information (unaudited) |
Based on its review, the Board did not deem the profits reported by Funds Management or Wells Fargo from its services to the Fund to be at a level that would prevent it from approving the continuation of the Advisory Agreements.
Economies of scale
With respect to possible economies of scale, the Board noted the existence of breakpoints in the Fund’s management fee structure, which operate generally to reduce the Fund’s expense ratios as the Fund grows in size. It considered that, for a small fund or a fund that shrinks in size, breakpoints conversely can result in higher fee levels. The Board also considered that in addition to management fee breakpoints, competitive management fee rates set at the outset without regard to breakpoints and fee waiver and expense reimbursement arrangements are means of sharing potential economies of scale with shareholders of the Fund. The Board considered Funds Management’s view, which Funds Management indicated was supported by independent third-party industry studies which were summarized for the Board, that any analyses of potential economies of scale in managing a particular fund are inherently limited in light of the joint and common costs and investments that Funds Management incurs across the fund family as a whole.
The Board concluded that the Fund’s fee and expense arrangements, including contractual breakpoints, constituted a reasonable approach to sharing potential economies of scale with the Fund and its shareholders.
Other benefits to Funds Management and the Sub-Adviser
The Board received and considered information regarding potential “fall-out” or ancillary benefits received by Funds Management and its affiliates, including the Sub-Adviser, as a result of their relationships with the Fund. Ancillary benefits could include, among others, benefits directly attributable to other relationships with the Fund and benefits potentially derived from an increase in Funds Management’s and the Sub-Adviser’s business as a result of their relationships with the Fund. The Board noted that various affiliates of Funds Management may receive distribution-related fees, shareholder servicing payments and sub-transfer agency fees in respect of shares sold or held through them and services provided.
The Board also reviewed information about soft dollar credits earned and utilized by the Sub-Adviser, fees earned by Funds Management and the Sub-Adviser from managing a private investment vehicle for the fund family’s securities lending collateral and commissions earned by an affiliated broker from portfolio transactions.
Based on its consideration of the factors and information it deemed relevant, including those described here, the Board did not find that any ancillary benefits received by Funds Management and its affiliates, including the Sub-Adviser, were unreasonable.
Conclusion
At the Meeting, after considering the above-described factors and based on its deliberations and its evaluation of the information described above, the Board unanimously approved the continuation of the Advisory Agreements for a one-year term and determined that the compensation payable to Funds Management and the Sub-Adviser under each of the Advisory Agreements was reasonable.
| | | | | | |
| List of abbreviations | | Wells Fargo Intrinsic World Equity Fund | | | 35 | |
The following is a list of common abbreviations for terms and entities that may have appeared in this report.
| ACA | — ACA Financial Guaranty Corporation |
| ADR | — American depositary receipt |
| ADS | — American depositary shares |
| AGC | — Assured Guaranty Corporation |
| AGM | — Assured Guaranty Municipal |
| Ambac | — Ambac Financial Group Incorporated |
| AMT | — Alternative minimum tax |
| BAN | — Bond anticipation notes |
| BHAC | — Berkshire Hathaway Assurance Corporation |
| CAB | — Capital appreciation bond |
| CCAB | — Convertible capital appreciation bond |
| CDA | — Community Development Authority |
| CDO | — Collateralized debt obligation |
| CLO | — Collateralized loan obligation |
| DRIVER | — Derivative inverse tax-exempt receipts |
| DW&P | — Department of Water & Power |
| DWR | — Department of Water Resources |
| ECFA | — Educational & Cultural Facilities Authority |
| EDA | — Economic Development Authority |
| EDFA | — Economic Development Finance Authority |
| ETF | — Exchange-traded fund |
| FDIC | — Federal Deposit Insurance Corporation |
| FFCB | — Federal Farm Credit Banks |
| FGIC | — Financial Guaranty Insurance Corporation |
| FHA | — Federal Housing Administration |
| FHLB | — Federal Home Loan Bank |
| FHLMC | — Federal Home Loan Mortgage Corporation |
| FICO | — The Financing Corporation |
| FNMA | — Federal National Mortgage Association |
| GDR | — Global depositary receipt |
| GNMA | — Government National Mortgage Association |
| HCFR | — Healthcare facilities revenue |
| HEFA | — Health & Educational Facilities Authority |
| HEFAR | — Higher education facilities authority revenue |
| HFA | — Housing Finance Authority |
| HFFA | — Health Facilities Financing Authority |
| HUD | — Department of Housing and Urban Development |
| IDA | — Industrial Development Authority |
| IDAG | — Industrial Development Agency |
| KRW | — Republic of Korea won |
| LIBOR | — London Interbank Offered Rate |
| LIFER | — Long Inverse Floating Exempt Receipts |
| LLC | — Limited liability company |
| LLLP | — Limited liability limited partnership |
| LLP | — Limited liability partnership |
| MBIA | — Municipal Bond Insurance Association |
| MFHR | — Multifamily housing revenue |
| MSTR | — Municipal securities trust receipts |
| MUD | — Municipal Utility District |
| National | — National Public Finance Guarantee Corporation |
| PCFA | — Pollution Control Financing Authority |
| PCL | — Public Company Limited |
| PCR | — Pollution control revenue |
| PFA | — Public Finance Authority |
| PFFA | — Public Facilities Financing Authority |
| PFOTER | — Puttable floating option tax-exempt receipts |
| PJSC | — Public Joint Stock Company |
| plc | — Public limited company |
| PUTTER | — Puttable tax-exempt receipts |
| R&D | — Research & development |
| Radian | — Radian Asset Assurance |
| RAN | — Revenue anticipation notes |
| RDA | — Redevelopment Authority |
| RDFA | — Redevelopment Finance Authority |
| REIT | — Real estate investment trust |
| ROC | — Reset option certificates |
| SAVRS | — Select auction variable rate securities |
| SBA | — Small Business Authority |
| SDR | — Swedish depositary receipt |
| SFHR | — Single-family housing revenue |
| SFMR | — Single-family mortgage revenue |
| SPA | — Standby purchase agreement |
| SPDR | — Standard & Poor’s Depositary Receipts |
| SPEAR | — Short Puttable Exempt Adjustable Receipts |
| STRIPS | — Separate trading of registered interest and |
| TAN | — Tax anticipation notes |
| TIPS | — Treasury inflation-protected securities |
| TRAN | — Tax revenue anticipation notes |
| TTFA | — Transportation Trust Fund Authority |
| TVA | — Tennessee Valley Authority |
This page is intentionally left blank.

For more information
More information about Wells Fargo Funds is available free upon request. To obtain literature, please write, email, visit the Fund’s website, or call:
Wells Fargo Funds
P.O. Box 8266
Boston, MA 02266-8266
Email: fundservice@wellsfargo.com
Website: wellsfargofunds.com
Individual investors: 1-800-222-8222
Retail investment professionals: 1-888-877-9275
Institutional investment professionals: 1-866-765-0778
This report and the financial statements contained herein are submitted for the general information of the shareholders of the Fund. If this report is used for promotional purposes, distribution of the report must be accompanied or preceded by a current prospectus. Before investing, please consider the investment objectives, risks, charges, and expenses of the investment. For a current prospectus and, if available, a summary prospectus, containing this information, call 1-800-222-8222 or visit the Fund’s website at wellsfargofunds.com. Read the prospectus carefully before you invest or send money.
Wells Fargo Asset Management (WFAM) is a trade name used by the asset management businesses of Wells Fargo & Company. Wells Fargo Funds Management, LLC, a wholly owned subsidiary of Wells Fargo & Company, provides investment advisory and administrative services for Wells Fargo Funds. Other affiliates of Wells Fargo & Company provide subadvisory and other services for the funds. The funds are distributed by Wells Fargo Funds Distributor, LLC, Member FINRA, an affiliate of Wells Fargo & Company. Neither Wells Fargo Funds Distributor nor Wells Fargo Funds Management holds fund shareholder accounts or assets. This material is for general informational and educational purposes only and is NOT intended to provide investment advice or a recommendation of any kind—including a recommendation for any specific investment, strategy, or plan.
NOT FDIC INSURED ◾ NO BANK GUARANTEE ◾ MAY LOSE VALUE
© 2017 Wells Fargo Funds Management, LLC. All rights reserved.
| | |
 | | 307204 12-17 A241/AR241 10-17 |
ITEM 2. CODE OF ETHICS
(a) As of the end of the period covered by the report, Wells Fargo Funds Trust has adopted a code of ethics that applies to its President and Treasurer. A copy of the code of ethics is filed as an exhibit to this Form N-CSR.
(c) During the period covered by this report, there were no amendments to the provisions of the code of ethics adopted in Item 2(a) above.
(d) During the period covered by this report, there were no implicit or explicit waivers to the provisions of the code of ethics adopted in Item 2(a) above.
ITEM 3. AUDIT COMMITTEE FINANCIAL EXPERT
The Board of Trustees of Wells Fargo Funds Trust has determined that Judith Johnson is an audit committee financial expert, as defined in Item 3 of Form N-CSR. Mrs. Johnson is independent for purposes of Item 3 of Form N-CSR.
ITEM 4. PRINCIPAL ACCOUNTANT FEES AND SERVICES
(a), (b), (c), (d) The following table presents aggregate fees billed in each of the last two fiscal years for services rendered to the Registrant by the Registrant’s principal accountant. These fees were billed to the registrant and were approved by the Registrant’s audit committee.
| | | | | | | | |
| | | Fiscal
year ended
October 31, 2017 | | | Fiscal
year ended
October 31, 2016 | |
Audit fees | | $ | 246,756 | | | $ | 244,446 | |
Audit-related fees | | | — | | | | — | |
Tax fees (1) | | | 36,790 | | | | 34,610 | |
All other fees | | | — | | | | — | |
| | | | | | | | |
| | $ | 283,546 | | | $ | 279,056 | |
| | | | | | | | |
| (1) | Tax fees consist of fees for tax compliance, tax advice, tax planning and excise tax. |
(e) The Chairman of the Audit Committees is authorized to pre-approve: (1) audit services for the mutual funds of Wells Fargo Funds Trust; (2) non-audit tax or compliance consulting or training services provided to the Funds by the independent auditors (“Auditors”) if the fees for any particular engagement are not anticipated to exceed $50,000; and (3) non-audit tax or compliance consulting or training services provided by the Auditors to a Fund’s investment adviser and its controlling entities (where pre-approval is required because
the engagement relates directly to the operations and financial reporting of the Fund) if the fee to the Auditors for any particular engagement is not anticipated to exceed $50,000. For any such pre-approval sought from the Chairman, Management shall prepare a brief description of the proposed services. If the Chairman approves of such service, he or she shall sign the statement prepared by Management. Such written statement shall be presented to the full Committees at their next regularly scheduled meetings.
(f) Not applicable
(g) Not applicable
(h) Not applicable
ITEM 5. AUDIT COMMITTEE OF LISTED REGISTRANTS
Not applicable.
ITEM 6. INVESTMENTS
A Portfolio of Investments for each series of Wells Fargo Funds Trust is included as part of the report to shareholders filed under Item 1 of this Form.
ITEM 7. DISCLOSURE OF PROXY VOTING POLICIES AND PROCEDURES FOR CLOSED-END MANAGEMENT INVESTMENT COMPANIES
Not applicable.
ITEM 8. PORTFOLIO MANAGERS OF CLOSED-END MANAGEMENT INVESTMENT COMPANIES
Not applicable.
ITEM 9. PURCHASES OF EQUITY SECURITIES BY CLOSED-END MANAGEMENT INVESTMENT COMPANY AND AFFILIATED PURCHASERS
Not applicable.
ITEM 10. SUBMISSION OF MATTERS TO A VOTE OF SECURITY HOLDERS
There have been no material changes to the procedures by which shareholders may recommend nominees to the registrant’s Board of Trustees that have been implemented since the registrant’s last provided disclosure in response to the requirements of this Item.
ITEM 11. CONTROLS AND PROCEDURES
(a) The President and Treasurer have concluded that the Wells Fargo Funds Trust (the “Trust”) disclosure controls and procedures (as defined in Rule 30a-3(c) under the Investment Company Act of 1940) provide reasonable assurances that material information relating to the Trust is made known to them by the appropriate persons based on their evaluation of these controls and procedures as of a date within 90 days of the filing of this report.
(b) There were no significant changes in the Trust’s internal controls over financial reporting (as defined in Rule 30a-3(d) under the Investment Company Act of 1940) that occurred during the second fiscal quarter of the period covered by this report that materially affected, or is reasonably likely to materially affect, the registrant’s internal control over financial reporting.
ITEM 12. EXHIBITS
(a)(1) Code of Ethics pursuant to Item 2 of Form N-CSR is filed and attached hereto as Exhibit COE.
(a)(2) Certification pursuant to Rule 30a-2(a) under the Investment Company Act of 1940 (17 CFR 270.30a-2(a)) is filed and attached hereto as Exhibit 99.CERT.
(a)(3) Not applicable.
(b) Certification pursuant to Rule 30a-2(b) under the Investment Company Act of 1940 (17 CFR 270.30a-2(b)) is filed and attached hereto as Exhibit 99.906CERT.
SIGNATURES
Pursuant to the requirements of the Securities Exchange Act of 1934 and the Investment Company Act of 1940, the registrant has duly caused this report to be signed on its behalf by the undersigned, thereunto duly authorized.
| | |
Wells Fargo Funds Trust |
| |
By: | | |
| |
| | /s/ Andrew Owen |
| | President |
|
Date: December 21, 2017 |
Pursuant to the requirements of the Securities Exchange Act of 1934 and the Investment Company Act of 1940, this report has been signed below by the following persons on behalf of the registrant and in the capacities and on the date indicated.
| | |
Wells Fargo Funds Trust |
| |
By: | | |
| |
| | /s/ Andrew Owen |
| | President |
|
Date: December 21, 2017 |
| |
By: | | |
| |
| | /s/ Jeremy DePalma |
| | Treasurer |
|
Date: December 21, 2017 |