
UNITED STATES
SECURITIES AND EXCHANGE COMMISSION
Washington, D.C. 20549
FORM N-CSR
CERTIFIED SHAREHOLDER REPORT OF REGISTERED
MANAGEMENT INVESTMENT COMPANIES
Investment Company Act file number: 811-09253
Wells Fargo Funds Trust
(Exact name of registrant as specified in charter)
525 Market St., San Francisco, CA 94105
(Address of principal executive offices) (Zip code)
C. David Messman
Wells Fargo Funds Management, LLC
525 Market St., San Francisco, CA 94105
(Name and address of agent for service)
Registrant’s telephone number, including area code: 800-222-8222
Date of fiscal year end: March 31
Registrant is making a filing for 9 of its series:
Wells Fargo Intrinsic Small Cap Value Fund, Wells Fargo Small Cap Core Fund, Wells Fargo Small Cap Opportunities Fund, Wells Fargo Small Cap Value Fund, Wells Fargo Special Small Cap Value Fund, Wells Fargo Traditional Small Cap Growth Fund, Wells Fargo Precious Metals Fund, Wells Fargo Specialized Technology Fund, and Wells Fargo Utility and Telecommunications Fund.
Date of reporting period: March 31, 2018
| ITEM 1. | REPORT TO STOCKHOLDERS |
Annual Report
March 31, 2018
Wells Fargo Intrinsic Small Cap Value Fund


Reduce clutter. Save trees.
Sign up for electronic delivery of prospectuses and shareholder reports at wellsfargo.com/advantagedelivery
Contents
The views expressed and any forward-looking statements are as of March 31, 2018, unless otherwise noted, and are those of the Fund managers and/or Wells Fargo Funds Management, LLC. Discussions of individual securities, or the markets generally, or any Wells Fargo Fund are not intended as individual recommendations. Future events or results may vary significantly from those expressed in any forward-looking statements. The views expressed are subject to change at any time in response to changing circumstances in the market. Wells Fargo Funds Management, LLC and the Fund disclaim any obligation to publicly update or revise any views expressed or forward-looking statements.
NOT FDIC INSURED ◾ NO BANK GUARANTEE ◾ MAY LOSE VALUE
| | | | |
| 2 | | Wells Fargo Intrinsic Small Cap Value Fund | | Letter to shareholders (unaudited) |

Andrew Owen
President
Wells Fargo Funds
Dear Shareholder:
We are pleased to offer you this annual report for the Wells Fargo Intrinsic Small Cap Value Fund for the 12-month period that ended March 31, 2018. During the last three quarters of 2017, investors enjoyed consistently rising equity values globally. Short-term interest rates tended to increase, while long-term rates remained flat to lower. During the final two months of the first quarter of 2018, equity market volatility returned, stocks reversed year-to-date gains, and bond yields rose while prices fell.
For the period, U.S. stocks, as measured by the S&P 500 Index,1 gained 13.99% and international stocks, as measured by the MSCI ACWI ex USA Index (Net),2 added 16.53%. Emerging market stocks, as measured by the MSCI EM Index (Net),3 added 24.93%. In bond markets, the Bloomberg Barclays U.S. Aggregate Bond Index4 added 1.20% and the Bloomberg Barclays Municipal Bond Index5 added 2.66% while fixed-income investments outside the U.S. gained 11.75%, according to the Bloomberg Barclays Global Aggregate ex-USD Index.6 The ICE BofAML U.S. High Yield Index7 earned 3.69%.
Through the last nine months of 2017, stocks advanced on synchronized global growth, which led to higher investor and consumer confidence. The first quarter of 2018 began with strong stock market gains in January. A strong January 2018 U.S. employment report and inflation concerns prompted equity volatility in February. Investor optimism for growth was supplanted with concerns over trade tensions, increased interest rates, and the prospect of new data privacy regulations.
Reactions to U.S. interest rate increases were uneven across the yield curve and globally.
The U.S. Federal Reserve (Fed) increased the federal funds rate three times during the 12-month period for a combined 75 basis points (bps; 100 bps equals 1.00%). Following an increase in March 2017, short-term bond yields in the U.S. rose while longer-term Treasury yields were little changed. Municipal bond returns were positive, helped by strong demand and constrained new-issue supply. The Fed raised the target interest rate once again in June 2017 to a range of 1.00% to 1.25%. Ten-year U.S. Treasury yields declined, the yield curve flattened, and long-term bond prices benefited.
| 1 | The S&P 500 Index consists of 500 stocks chosen for market size, liquidity, and industry group representation. It is a market-value-weighted index with each stock’s weight in the index proportionate to its market value. You cannot invest directly in an index. |
| 2 | The Morgan Stanley Capital International (MSCI) All Country World Index (ACWI) ex USA Index (Net) is a free-float-adjusted market-capitalization-weighted index that is designed to measure the equity market performance of developed markets, excluding the United States and Canada. Source: MSCI. MSCI makes no express or implied warranties or representations and shall have no liability whatsoever with respect to any MSCI data contained herein. The MSCI data may not be further redistributed or used as a basis for other indices or any securities or financial products. This report is not approved, reviewed, or produced by MSCI. You cannot invest directly in an index. |
| 3 | The MSCI Emerging Markets (EM) Index (Net) is a free-float-adjusted market-capitalization-weighted index that is designed to measure large- and mid-cap equity market performance of emerging markets. The MSCI EM Index (Net) consists of the following 24 emerging market country indices: Brazil, Chile, China, Colombia, Czech Republic, Egypt, Greece, Hungary, India, Indonesia, Korea, Malaysia, Mexico, Pakistan, Peru, the Philippines, Poland, Qatar, Russia, South Africa, Taiwan, Thailand, Turkey, and the United Arab Emirates. You cannot invest directly in an index. |
| 4 | The Bloomberg Barclays U.S. Aggregate Bond Index is a broad-based benchmark that measures the investment-grade, U.S. dollar-denominated, fixed-rate taxable bond market, including Treasuries, government-related and corporate securities, mortgage-backed securities (agency fixed-rate and hybrid adjustable-rate mortgage pass-throughs), asset-backed securities, and commercial mortgage-backed securities. You cannot invest directly in an index. |
| 5 | The Bloomberg Barclays Municipal Bond Index is an unmanaged index composed of long-term tax-exempt bonds with a minimum credit rating of Baa. You cannot invest directly in an index. |
| 6 | The Bloomberg Barclays Global Aggregate ex-USD Index is an unmanaged index that provides a broad-based measure of the global investment-grade fixed-income markets excluding the U.S. dollar-denominated debt market. You cannot invest directly in an index. |
| 7 | The ICE BofAML U.S. High Yield Index is a market-capitalization-weighted index of domestic and Yankee high-yield bonds. The index tracks the performance of high-yield securities traded in the U.S. bond market. You cannot invest directly in an index. Copyright 2018. ICE Data Indices, LLC. All rights reserved. |
| | | | | | |
| Letter to shareholders (unaudited) | | Wells Fargo Intrinsic Small Cap Value Fund | | | 3 | |
Internationally, central banks maintained low interest rates and accommodative monetary policies that supported business activity and stock values in foreign markets. A weaker U.S. dollar was generally supportive of business activity in regions around the globe. The Bank of Japan continued its accommodative monetary policies, and industrial production, retail sales, and fixed asset investment increased in China.
Growth continued through the summer of 2017.
Globally, stocks moved higher during the third quarter of 2017. Low inflation and interest rates supported accelerating global economic growth and corporate earnings. Brief episodes of geopolitical tensions, often associated with North Korea’s advancing nuclear missile program, flaring conflicts in the Middle East, and uncertainty surrounding U.S. trade policies, did not discourage investing activity.
In the U.S., economic data released during the quarter reflected a generally healthy economy. Second-quarter economic output grew at a 3.1% annual rate. Stocks in international developed and emerging markets continued to benefit from improving economic growth.
Positive economic and market news continued as 2017 closed and 2018 began.
During the fourth quarter of 2017, stock markets continued the move higher. Third-quarter economic output in the U.S. grew at a 3.2% annual rate. The unemployment rate fell to a 17-year low of 4.1%. Tax reform passed and wage growth data improved, encouraging increased business and consumer spending.
Fed officials announced in October 2017 plans to begin unwinding its $4.5 trillion portfolio of bonds and other assets accumulated during rounds of quantitative easing conducted since the 2008–2009 recession. Still, restrained inflation kept long-term bond rates steady and the flattened yield curve persisted. The Fed raised the federal funds rate target to a range of 1.25% to 1.50% in December 2017 and began selling bonds held in its portfolio.
2018 opened with continued stock advances, then volatility.
Improving business and economic data globally continued to support stocks through January 2018. Political wrangling in the U.S. over budget resolutions could not dissuade investors from buying stocks as payrolls and factory orders increased. Long-term interest rates in the U.S. trended higher as the yield curve steepened—the 10-year Treasury rate moved from 2.46% to 2.84% and the 30-year rate moved from 2.81% to 3.08% during January 2018.
Investor sentiment shifted in February as inflation concerns emerged in the U.S. when readings from the Producer Price Index in January rose 2.5% year over year. During February, the U.S. market endured a loss from January’s high of nearly 12% before recovering much of that loss. The Fed raised the federal funds rate in March 2018. Bond yields rose across the yield curve.
During January 2018, purchasing managers’ indices in China, the eurozone, India, and Japan reported data for December that indicated continued growth. Despite positive economic signals and business fundamentals, international stock values fell during February and March 2018, swept up in the selling momentum in U.S. markets.
Globally, stocks moved higher during the third quarter of 2017.
During February, the U.S. market endured a loss from January’s high of nearly 12% before recovering much of that loss.
| | | | |
| 4 | | Wells Fargo Intrinsic Small Cap Value Fund | | Letter to shareholders (unaudited) |
Don’t let short-term uncertainty derail long-term investment goals.
Periods of investment uncertainty can present challenges, but experience has taught us that maintaining long-term investment goals can be an effective way to plan for the future. To help you create a sound strategy based on your personal goals and risk tolerance, Wells Fargo Funds offers more than 100 mutual funds spanning a wide range of asset classes and investment styles. Although diversification cannot guarantee an investment profit or prevent losses, we believe it can be an effective way to manage investment risk and potentially smooth out overall portfolio performance. We encourage investors to know their investments and to understand that appropriate levels of risk-taking may unlock opportunities.
Thank you for choosing to invest with Wells Fargo Funds. We appreciate your confidence in us and remain committed to helping you meet your financial needs.
Sincerely,

Andrew Owen
President
Wells Fargo Funds
For further information about your Fund, contact your investment professional, visit our website at wellsfargofunds.com, or call us directly at 1-800-222-8222.
This page is intentionally left blank.
| | | | |
| 6 | | Wells Fargo Intrinsic Small Cap Value Fund | | Performance highlights (unaudited) |
Investment objective
The Fund seeks long-term capital appreciation.
Manager
Wells Fargo Funds Management, LLC
Subadviser
Wells Capital Management Incorporated
Portfolio managers
Ann Miletti
Christopher G. Miller, CFA®
Average annual total returns (%) as of March 31, 2018
| | | | | | | | | | | | | | | | | | | | | | | | | | | | | | | | | | |
| | | | | Including sales charge | | | Excluding sales charge | | | Expense ratios1 (%) | |
| | | Inception date | | 1 year | | | 5 year | | | 10 year | | | 1 year | | | 5 year | | | 10 year | | | Gross | | | Net2 | |
| Class A (WFSMX) | | 3-31-2008 | | | 2.54 | | | | 8.92 | | | | 8.13 | | | | 8.78 | | | | 10.22 | | | | 8.78 | | | | 1.49 | | | | 1.36 | |
| Class C (WSCDX) | | 3-31-2008 | | | 6.96 | | | | 9.40 | | | | 7.97 | | | | 7.96 | | | | 9.40 | | | | 7.97 | | | | 2.24 | | | | 2.11 | |
| Administrator Class (WFSDX) | | 4-8-2005 | | | – | | | | – | | | | – | | | | 8.94 | | | | 10.42 | | | | 9.01 | | | | 1.41 | | | | 1.21 | |
| Institutional Class (WFSSX) | | 4-8-2005 | | | – | | | | – | | | | – | | | | 9.15 | | | | 10.65 | | | | 9.24 | | | | 1.16 | | | | 1.01 | |
| Russell 2000® Value Index3 | | – | | | – | | | | – | | | | – | | | | 5.13 | | | | 9.96 | | | | 8.61 | | | | – | | | | – | |
Figures quoted represent past performance, which is no guarantee of future results, and do not reflect taxes that a shareholder may pay on fund distributions or the redemption of fund shares. Investment return and principal value of an investment will fluctuate so that an investor’s shares, when redeemed, may be worth more or less than their original cost. Performance shown without sales charges would be lower if sales charges were reflected. Current performance may be lower or higher than the performance data quoted, which assumes the reinvestment of dividends and capital gains. Current month-end performance is available on the Fund’s website, wellsfargofunds.com.
Index returns do not include transaction costs associated with buying and selling securities, any mutual fund fees or expenses, or any taxes. It is not possible to invest directly in an index.
For Class A shares, the maximum front-end sales charge is 5.75%. For Class C shares, the maximum contingent deferred sales charge is 1.00%. Performance including a contingent deferred sales charge assumes the sales charge for the corresponding time period. Administrator Class and Institutional Class shares are sold without a front-end sales charge or contingent deferred sales charge.
Stock values fluctuate in response to the activities of individual companies and general market and economic conditions. Smaller-company stocks tend to be more volatile and less liquid than those of larger companies. Certain investment strategies tend to increase the total risk of an investment (relative to the broader market). Consult the Fund’s prospectus for additional information on these and other risks.
Please see footnotes on page 7.
| | | | | | |
| Performance highlights (unaudited) | | Wells Fargo Intrinsic Small Cap Value Fund | | | 7 | |
|
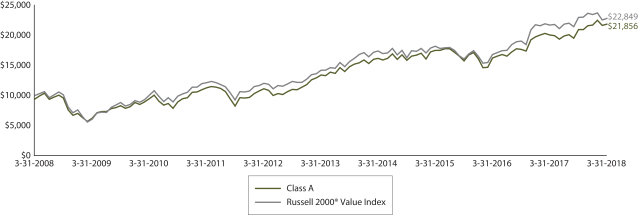
| Growth of $10,000 investment as of March 31, 20184 |
|
 |
| 1 | Reflects the expense ratios as stated in the most recent prospectuses, which include the impact of 0.01% in acquired fund fees and expenses. The expense ratios shown are subject to change and may differ from the annualized expense ratios shown in the financial highlights of this report, which do not include acquired fund fees and expenses. |
| 2 | The manager has contractually committed through July 31, 2018, to waive fees and/or reimburse expenses to the extent necessary to cap the Fund’s Total Annual Fund Operating Expenses After Fee Waivers at the 1.35% for Class A, 2.10% for Class C, 1.20% for Administrator Class, and 1.00% for Institutional Class. After this time, the cap may be increased or the commitment to maintain the cap may be terminated only with the approval of the Board of Trustees. Brokerage commissions, stamp duty fees, interest, taxes, acquired fund fees and expenses (if any), and extraordinary expenses are excluded from the expense cap. Without this cap, the Fund’s returns would have been lower. The expense ratio paid by an investor is the net expense ratio (the total annual fund operating expenses after fee waivers) as stated in the prospectuses. |
| 3 | The Russell 2000® Value Index measures the performance of those Russell 2000 companies with lower price/book ratios and lower forecasted growth values. You cannot invest directly in an index. |
| 4 | The chart compares the performance of Class A shares for the most recent ten years with the Russell 2000® Value Index. The chart assumes a hypothetical investment of $10,000 in Class A shares and reflects all operating expenses and assumes the maximum initial sales charge of 5.75%. |
| 5 | The ten largest holdings, excluding cash and cash equivalents, are calculated based on the value of the investments divided by total net assets of the Fund. Holdings are subject to change and may have changed since the date specified. |
| 6 | Amounts are calculated based on the total long-term investments of the Fund. These amounts are subject to change and may have changed since the date specified. |
| | | | |
| 8 | | Wells Fargo Intrinsic Small Cap Value Fund | | Performance highlights (unaudited) |
MANAGER’S DISCUSSION
Fund highlights
| ∎ | | The Fund outperformed its benchmark, the Russell 2000® Value Index, for the 12-month period that ended March 31, 2018. |
| ∎ | | Stock selection in the health care, energy, and materials sectors contributed the most to performance relative to the index. |
| ∎ | | Stock selection in the consumer staples sector detracted from performance relative to the index. |
The U.S. stock market rallied for most of the reporting period, with many stock market indices hitting new all-time highs in January 2018 before pulling back in the subsequent two months. Market volatility hit an all-time low in late 2017, and larger-cap and growth stocks tended to outperform smaller-cap and value stocks. The small-cap value segment of the U.S. stock market, represented by the Russell 2000® Value Index, followed a similar pattern and ended with a 5.1% gain for the period.
A number of factors influenced the U.S. stock market during the period. From our perspective, the outcome of the November 2016 U.S. presidential election likely had the biggest impact; the U.S. stock market generally rallied since the election through the latter part of January 2018 as investors expected businesses to benefit from the new administration’s progrowth positioning. In December 2017, the Tax Cuts and Jobs Act of 2017 was passed by the U.S. Congress and signed into law. The U.S. Federal Reserve (Fed) raised its benchmark interest rate by 0.25% three times during the reporting period, most recently to a range of 1.50% to 1.75% at its March 2018 meeting. The Fed also released a fairly detailed outline of its plans to reduce the size of its balance sheet of approximately $4.5 trillion and began implementing the reduction. Overall, the U.S. economy remained resilient, with 15 straight quarters of growth in gross domestic product, and continued to experience favorable trends in employment, wages, and consumer confidence.
Throughout all of the market and economic events that occurred during the reporting period, we continued to seek well-positioned companies—those with good business models, strong management teams, and healthy cash flows—trading at attractive discounts to their private market valuations (PMVs). The PMV represents the expected price that would be paid for the entire company as a stand-alone private entity.
| | | | |
| Ten largest holdings (%) as of March 31, 20185 | |
Zions Bancorporation | | | 2.19 | |
Sterling BanCorp | | | 2.17 | |
Webster Financial Corporation | | | 2.16 | |
WPX Energy Incorporated | | | 2.13 | |
RSP Permian Incorporated | | | 2.08 | |
Bio-Rad Laboratories Incorporated Class A | | | 1.91 | |
LegacyTexas Financial Group | | | 1.85 | |
National General Holdings Corporation | | | 1.83 | |
Stifel Financial Corporation | | | 1.82 | |
Haemonetics Corporation | | | 1.78 | |
Portfolio holdings in the health care, energy, and materials sectors were the largest contributors to relative performance.
Health care was the best-performing sector in the index, rising almost 25% during the reporting period. The Fund’s overweight position and stock selection outperformed the sector, making it the largest contributor to relative performance. Holdings in the health care equipment and services industry, including Haemonetics Corporation, STERIS plc, and Integer Holdings Corporation, outperformed their peers. Haemonetics, a global health care company providing innovative blood management solutions, rose 80% during the period on reporting strong financial results
after implementing cost-cutting measures and experiencing sequential growth. Even though energy was one of the worst-performing sectors in the index, declining over 18%, the Fund’s overweight position in high-quality companies gained 3.6% during the period. West Texas Intermediate crude oil prices rose 28% and, along with debt reduction and operational improvements, aided the performance of the Fund’s energy holdings. In the materials sector, holdings in the chemicals and mining industries outperformed their peers.
Please see footnotes on page 7.
| | | | | | |
| Performance highlights (unaudited) | | Wells Fargo Intrinsic Small Cap Value Fund | | | 9 | |
|
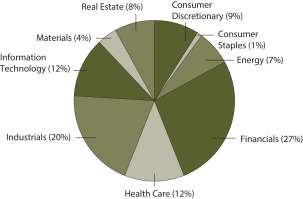
| Sector distribution as of March 31, 20186 |
|
 |
Stock selection in the consumer staples sector detracted from relative performance.
The consumer staples sector in the index declined 5.6% during the reporting period, with the Fund’s holdings in the food products industry underperforming the benchmark, making it the leading detractor from relative performance. TreeHouse Foods, Incorporated, is a food and beverage manufacturing company operating in the U.S. and Canada, specializing in the production of private label products. The company has been dealing with a competitive pricing environment that negatively affected margins and future earnings potential, causing the stock to decline 54% during the period.
Our methodology includes buying stocks at a discount to their estimated PMV and selling stocks as they approach or exceed the upper end of their PMV range.
Our bottom-up investment process leads us to be overweight or underweight certain sectors. This positioning changes over time based on macroeconomic and industry-specific factors. During the reporting period, our process led us to be overweight the industrials, health care, and information technology sectors and underweight utilities, real estate, and financials. Through our disciplined investment process, we remain keenly aware of both price and enterprise values on a company-by-company basis. Our proprietary database of historical company acquisitions across industries, sectors, and time frames enables us to maintain an extensive foundation for assessing the PMV of companies compared with their public stock prices. We strive to take advantage of those price discrepancies for the benefit of Fund shareholders by purchasing stocks when we believe they are selling at a discount to their PMV.
Similar themes may prevail for the rest of 2018.
Looking ahead to the rest of the year, the policies of the U.S. government, the impact of tax reform, interest rates, and energy prices are themes that likely could influence the overall market and the relative performance of the Fund. Now that tax reform has been accomplished, the U.S. administration has turned its sights on trade agreements, further reduction of commercial business regulations, and infrastructure.
The Fed has signaled more rate hikes in 2018 if labor markets tighten further, global economic risks remain balanced, and inflation measures hit the Fed’s target. Volatility in commodity prices and global currencies likely may continue to drive global stock markets.
Please see footnotes on page 7.
| | | | |
| 10 | | Wells Fargo Intrinsic Small Cap Value Fund | | Fund expenses (unaudited) |
As a shareholder of the Fund, you incur two types of costs: (1) transaction costs, including sales charges (loads) on purchase payments and contingent deferred sales charges (if any) on redemptions and (2) ongoing costs, including management fees, distribution (12b-1) and/or shareholder servicing fees, and other Fund expenses. This example is intended to help you understand your ongoing costs (in dollars) of investing in the Fund and to compare these costs with the ongoing costs of investing in other mutual funds.
The example is based on an investment of $1,000 invested at the beginning of the six-month period and held for the entire period from October 1, 2017 to March 31, 2018.
Actual expenses
The “Actual” line of the table below provides information about actual account values and actual expenses. You may use the information in this line, together with the amount you invested, to estimate the expenses that you paid over the period. Simply divide your account value by $1,000 (for example, an $8,600 account value divided by $1,000 = 8.6), then multiply the result by the number in the “Actual” line under the heading entitled “Expenses paid during period” for your applicable class of shares to estimate the expenses you paid on your account during this period.
Hypothetical example for comparison purposes
The “Hypothetical” line of the table below provides information about hypothetical account values and hypothetical expenses based on the Fund’s actual expense ratio and an assumed rate of return of 5% per year before expenses, which is not the Fund’s actual return. The hypothetical account values and expenses may not be used to estimate the actual ending account balance or expenses you paid for the period. You may use this information to compare the ongoing costs of investing in the Fund and other funds. To do so, compare this 5% hypothetical example with the 5% hypothetical examples that appear in the shareholder reports of the other funds.
Please note that the expenses shown in the table are meant to highlight your ongoing costs only and do not reflect any transactional costs, such as sales charges (loads) and contingent deferred sales charges. Therefore, the “Hypothetical” line of the table is useful in comparing ongoing costs only and will not help you determine the relative total costs of owning different funds. In addition, if these transactional costs were included, your costs would have been higher.
| | | | | | | | | | | | | | | | |
| | | Beginning account value 10-1-2017 | | | Ending
account value
3-31-2018 | | | Expenses
paid during
the period¹ | | | Annualized net
expense ratio | |
Class A | | | | | | | | | | | | | | | | |
Actual | | $ | 1,000.00 | | | $ | 1,042.07 | | | $ | 6.87 | | | | 1.35 | % |
Hypothetical (5% return before expenses) | | $ | 1,000.00 | | | $ | 1,018.20 | | | $ | 6.79 | | | | 1.35 | % |
Class C | | | | | | | | | | | | | | | | |
Actual | | $ | 1,000.00 | | | $ | 1,038.27 | | | $ | 10.67 | | | | 2.10 | % |
Hypothetical (5% return before expenses) | | $ | 1,000.00 | | | $ | 1,014.46 | | | $ | 10.55 | | | | 2.10 | % |
Administrator Class | | | | | | | | | | | | | | | | |
Actual | | $ | 1,000.00 | | | $ | 1,042.94 | | | $ | 6.11 | | | | 1.20 | % |
Hypothetical (5% return before expenses) | | $ | 1,000.00 | | | $ | 1,018.95 | | | $ | 6.04 | | | | 1.20 | % |
Institutional Class | | | | | | | | | | | | | | | | |
Actual | | $ | 1,000.00 | | | $ | 1,044.08 | | | $ | 5.10 | | | | 1.00 | % |
Hypothetical (5% return before expenses) | | $ | 1,000.00 | | | $ | 1,019.95 | | | $ | 5.04 | | | | 1.00 | % |
| 1 | Expenses paid is equal to the annualized net expense ratio of each class multiplied by the average account value over the period, multiplied by the number of days in the most recent fiscal half-year divided by the number of days in the fiscal year (to reflect the one-half-year period). |
| | | | | | |
| Portfolio of investments—March 31, 2018 | | Wells Fargo Intrinsic Small Cap Value Fund | | | 11 | |
| | | | | | | | | | | | | | | | |
| Security name | | | | | | | | Shares | | | Value | |
| | | | |
Common Stocks: 98.57% | | | | | | | | | | | | | | | | |
| | | | |
Consumer Discretionary: 9.08% | | | | | | | | | | | | | | | | |
| | | | |
| Auto Components: 3.08% | | | | | | | | | | | | | | | | |
Dana Incorporated | | | | | | | | | | | 48,651 | | | $ | 1,253,250 | |
Tenneco Incorporated | | | | | | | | | | | 22,694 | | | | 1,245,220 | |
| | | | |
| | | | | | | | | | | | | | | 2,498,470 | |
| | | | | | | | | | | | | | | | |
| | | | |
| Diversified Consumer Services: 0.87% | | | | | | | | | | | | | | | | |
Houghton Mifflin Harcourt Company † | | | | | | | | | | | 101,436 | | | | 704,980 | |
| | | | | | | | | | | | | | | | |
| | | | |
| Hotels, Restaurants & Leisure: 1.32% | | | | | | | | | | | | | | | | |
Playa Hotels & Resorts NV † | | | | | | | | | | | 43,812 | | | | 447,759 | |
Red Robin Gourmet Burgers Incorporated † | | | | | | | | | | | 10,851 | | | | 629,358 | |
| | | | |
| | | | | | | | | | | | | | | 1,077,117 | |
| | | | | | | | | | | | | | | | |
| | | | |
| Leisure Products: 1.26% | | | | | | | | | | | | | | | | |
Callaway Golf Company | | | | | | | | | | | 62,612 | | | | 1,024,332 | |
| | | | | | | | | | | | | | | | |
| | | | |
| Media: 1.33% | | | | | | | | | | | | | | | | |
Lions Gate Entertainment Class B | | | | | | | | | | | 29,235 | | | | 703,979 | |
MDC Partners Incorporated Class A † | | | | | | | | | | | 52,393 | | | | 377,230 | |
| | | | |
| | | | | | | | | | | | | | | 1,081,209 | |
| | | | | | | | | | | | | | | | |
| | | | |
| Textiles, Apparel & Luxury Goods: 1.22% | | | | | | | | | | | | | | | | |
Carter’s Incorporated | | | | | | | | | | | 9,500 | | | | 988,950 | |
| | | | | | | | | | | | | | | | |
| | | | |
Consumer Staples: 0.54% | | | | | | | | | | | | | | | | |
| | | | |
| Food Products: 0.54% | | | | | | | | | | | | | | | | |
TreeHouse Foods Incorporated † | | | | | | | | | | | 11,464 | | | | 438,727 | |
| | | | | | | | | | | | | | | | |
| | | | |
Energy: 7.08% | | | | | | | | | | | | | | | | |
| | | | |
| Energy Equipment & Services: 0.50% | | | | | | | | | | | | | | | | |
Forum Energy Technologies Incorporated † | | | | | | | | | | | 36,707 | | | | 403,777 | |
| | | | | | | | | | | | | | | | |
| | | | |
| Oil, Gas & Consumable Fuels: 6.58% | | | | | | | | | | | | | | | | |
Encana Corporation | | | | | | | | | | | 79,606 | | | | 875,666 | |
Matador Resources Company † | | | | | | | | | | | 35,423 | | | | 1,059,502 | |
RSP Permian Incorporated † | | | | | | | | | | | 35,961 | | | | 1,685,852 | |
WPX Energy Incorporated † | | | | | | | | | | | 116,852 | | | | 1,727,073 | |
| | | | |
| | | | | | | | | | | | | | | 5,348,093 | |
| | | | | | | | | | | | | | | | |
| | | | |
Financials: 26.49% | | | | | | | | | | | | | | | | |
| | | | |
| Banks: 18.12% | | | | | | | | | | | | | | | | |
Ameris Bancorp | | | | | | | | | | | 24,770 | | | | 1,310,333 | |
First Midwest Bancorp Incorporated | | | | | | | | | | | 26,628 | | | | 654,783 | |
LegacyTexas Financial Group | | | | | | | | | | | 35,088 | | | | 1,502,468 | |
PacWest Bancorp | | | | | | | | | | | 28,348 | | | | 1,404,076 | |
Pinnacle Financial Partners Incorporated | | | | | | | | | | | 19,790 | | | | 1,270,518 | |
Renasant Corporation | | | | | | | | | | | 22,504 | | | | 957,770 | |
The accompanying notes are an integral part of these financial statements.
| | | | |
| 12 | | Wells Fargo Intrinsic Small Cap Value Fund | | Portfolio of investments—March 31, 2018 |
| | | | | | | | | | | | | | | | |
| Security name | | | | | | | | Shares | | | Value | |
| | | | |
| Banks (continued) | | | | | | | | | | | | | | | | |
Sterling BanCorp | | | | | | | | | | | 77,993 | | | $ | 1,758,742 | |
United Community Bank | | | | | | | | | | | 36,202 | | | | 1,145,793 | |
Webster Financial Corporation | | | | | | | | | | | 31,608 | | | | 1,751,083 | |
Wintrust Financial Corporation | | | | | | | | | | | 13,726 | | | | 1,181,122 | |
Zions Bancorporation | | | | | | | | | | | 33,704 | | | | 1,777,212 | |
| | | | |
| | | | | | | | | | | | | | | 14,713,900 | |
| | | | | | | | | | | | | | | | |
| | | | |
| Capital Markets: 1.82% | | | | | | | | | | | | | | | | |
Stifel Financial Corporation | | | | | | | | | | | 24,937 | | | | 1,477,019 | |
| | | | | | | | | | | | | | | | |
| | | | |
| Insurance: 5.26% | | | | | | | | | | | | | | | | |
CNO Financial Group Incorporated | | | | | | | | | | | 64,324 | | | | 1,393,901 | |
First American Financial Corporation | | | | | | | | | | | 13,727 | | | | 805,500 | |
Maiden Holdings Limited | | | | | | | | | | | 89,420 | | | | 581,230 | |
National General Holdings Corporation | | | | | | | | | | | 61,230 | | | | 1,488,501 | |
| | | | |
| | | | | | | | | | | | | | | 4,269,132 | |
| | | | | | | | | | | | | | | | |
| | | | |
| Thrifts & Mortgage Finance: 1.29% | | | | | | | | | | | | | | | | |
Essent Group Limited † | | | | | | | | | | | 24,740 | | | | 1,052,934 | |
| | | | | | | | | | | | | | | | |
| | | | |
Health Care: 12.35% | | | | | | | | | | | | | | | | |
| | | | |
| Health Care Equipment & Supplies: 7.49% | | | | | | | | | | | | | | | | |
AngioDynamics Incorporated † | | | | | | | | | | | 81,559 | | | | 1,406,893 | |
Haemonetics Corporation † | | | | | | | | | | | 19,770 | | | | 1,446,373 | |
Integer Holdings Corporation † | | | | | | | | | | | 21,594 | | | | 1,221,141 | |
STERIS plc | | | | | | | | | | | 14,273 | | | | 1,332,527 | |
Wright Medical Group NV † | | | | | | | | | | | 33,878 | | | | 672,140 | |
| | | | |
| | | | | | | | | | | | | | | 6,079,074 | |
| | | | | | | | | | | | | | | | |
| | | | |
| Health Care Providers & Services: 1.45% | | | | | | | | | | | | | | | | |
Envision Healthcare Corporation † | | | | | | | | | | | 30,579 | | | | 1,175,151 | |
| | | | | | | | | | | | | | | | |
| | | | |
| Life Sciences Tools & Services: 3.41% | | | | | | | | | | | | | | | | |
Bio-Rad Laboratories Incorporated Class A † | | | | | | | | | | | 6,212 | | | | 1,553,497 | |
Bruker Corporation | | | | | | | | | | | 40,747 | | | | 1,219,150 | |
| | | | |
| | | | | | | | | | | | | | | 2,772,647 | |
| | | | | | | | | | | | | | | | |
| | | | |
Industrials: 19.47% | | | | | | | | | | | | | | | | |
| | | | |
| Aerospace & Defense: 0.83% | | | | | | | | | | | | | | | | |
Aerojet Rocketdyne Holdings † | | | | | | | | | | | 24,064 | | | | 673,070 | |
| | | | | | | | | | | | | | | | |
| | | | |
| Airlines: 1.10% | | | | | | | | | | | | | | | | |
Spirit Airlines Incorporated †« | | | | | | | | | | | 23,555 | | | | 889,908 | |
| | | | | | | | | | | | | | | | |
| | | | |
| Commercial Services & Supplies: 4.57% | | | | | | | | | | | | | | | | |
Interface Incorporated | | | | | | | | | | | 56,041 | | | | 1,412,233 | |
KAR Auction Services Incorporated | | | | | | | | | | | 24,751 | | | | 1,341,504 | |
Steelcase Incorporated Class A | | | | | | | | | | | 70,737 | | | | 962,023 | |
| | | | |
| | | | | | | | | | | | | | | 3,715,760 | |
| | | | | | | | | | | | | | | | |
The accompanying notes are an integral part of these financial statements.
| | | | | | |
| Portfolio of investments—March 31, 2018 | | Wells Fargo Intrinsic Small Cap Value Fund | | | 13 | |
| | | | | | | | | | | | | | | | |
| Security name | | | | | | | | Shares | | | Value | |
| | | | |
| Construction & Engineering: 0.45% | | | | | | | | | | | | | | | | |
Valmont Industries Incorporated | | | | | | | | | | | 2,483 | | | $ | 363,263 | |
| | | | | | | | | | | | | | | | |
| | | | |
| Machinery: 4.53% | | | | | | | | | | | | | | | | |
Altra Holdings Incorporated « | | | | | | | | | | | 24,987 | | | | 1,148,153 | |
ITT Incorporated | | | | | | | | | | | 26,366 | | | | 1,291,407 | |
Rexnord Corporation † | | | | | | | | | | | 41,785 | | | | 1,240,179 | |
| | | | |
| | | | | | | | | | | | | | | 3,679,739 | |
| | | | | | | | | | | | | | | | |
| | | | |
| Road & Rail: 2.86% | | | | | | | | | | | | | | | | |
Avis Budget Group Incorporated †« | | | | | | | | | | | 22,107 | | | | 1,035,492 | |
Genesee & Wyoming Incorporated Class A † | | | | | | | | | | | 18,138 | | | | 1,283,989 | |
| | | | |
| | | | | | | | | | | | | | | 2,319,481 | |
| | | | | | | | | | | | | | | | |
| | | | |
| Trading Companies & Distributors: 5.13% | | | | | | | | | | | | | | | | |
Air Lease Corporation | | | | | | | | | | | 23,246 | | | | 990,745 | |
GATX Corporation « | | | | | | | | | | | 14,003 | | | | 959,065 | |
MRC Global Incorporated † | | | | | | | | | | | 73,543 | | | | 1,209,047 | |
WESCO International Incorporated † | | | | | | | | | | | 16,253 | | | | 1,008,499 | |
| | | | |
| | | | | | | | | | | | | | | 4,167,356 | |
| | | | | | | | | | | | | | | | |
| | | | |
Information Technology: 11.90% | | | | | | | | | | | | | | | | |
| | | | |
| Communications Equipment: 1.58% | | | | | | | | | | | | | | | | |
Infinera Corporation † | | | | | | | | | | | 117,808 | | | | 1,279,395 | |
| | | | | | | | | | | | | | | | |
| | | | |
| Electronic Equipment, Instruments & Components: 6.85% | | | | | | | | | | | | | | | | |
Anixter International Incorporated † | | | | | | | | | | | 14,556 | | | | 1,102,617 | |
Avnet Incorporated | | | | | | | | | | | 30,232 | | | | 1,262,488 | |
Synnex Corporation | | | | | | | | | | | 8,624 | | | | 1,021,082 | |
VeriFone Systems Incorporated † | | | | | | | | | | | 63,869 | | | | 982,305 | |
Zebra Technologies Corporation Class A † | | | | | | | | | | | 8,576 | | | | 1,193,693 | |
| | | | |
| | | | | | | | | | | | | | | 5,562,185 | |
| | | | | | | | | | | | | | | | |
| | | | |
| IT Services: 2.42% | | | | | | | | | | | | | | | | |
Conduent Incorporated † | | | | | | | | | | | 68,092 | | | | 1,269,235 | |
WEX Incorporated † | | | | | | | | | | | 4,434 | | | | 694,453 | |
| | | | |
| | | | | | | | | | | | | | | 1,963,688 | |
| | | | | | | | | | | | | | | | |
| | | | |
| Technology Hardware, Storage & Peripherals: 1.05% | | | | | | | | | | | | | | | | |
Diebold Nixdorf Incorporated « | | | | | | | | | | | 55,484 | | | | 854,454 | |
| | | | | | | | | | | | | | | | |
| | | | |
Materials: 3.62% | | | | | | | | | | | | | | | | |
| | | | |
| Chemicals: 0.70% | | | | | | | | | | | | | | | | |
PolyOne Corporation | | | | | | | | | | | 13,399 | | | | 569,725 | |
| | | | | | | | | | | | | | | | |
| | | | |
| Metals & Mining: 2.92% | | | | | | | | | | | | | | | | |
Reliance Steel & Aluminum Company | | | | | | | | | | | 16,133 | | | | 1,383,243 | |
Royal Gold Incorporated | | | | | | | | | | | 11,533 | | | | 990,339 | |
| | | | |
| | | | | | | | | | | | | | | 2,373,582 | |
| | | | | | | | | | | | | | | | |
The accompanying notes are an integral part of these financial statements.
| | | | |
| 14 | | Wells Fargo Intrinsic Small Cap Value Fund | | Portfolio of investments—March 31, 2018 |
| | | | | | | | | | | | | | | | |
| Security name | | | | | | | | Shares | | | Value | |
| | | | |
Real Estate: 8.04% | | | | | | | | | | | | | | | | |
| | | | |
| Equity REITs: 8.04% | | | | | | | | | | | | | | | | |
Cousins Properties Incorporated | | | | | | | | | | | 92,354 | | | $ | 801,633 | |
Four Corners Property Trust Incorporated | | | | | | | | | | | 35,235 | | | | 813,576 | |
Hudson Pacific Properties Incorporated | | | | | | | | | | | 38,184 | | | | 1,242,126 | |
Outfront Media Incorporated | | | | | | | | | | | 36,946 | | | | 692,368 | |
Physicians Realty Trust | | | | | | | | | | | 66,772 | | | | 1,039,640 | |
Retail Opportunity Investment Corporation | | | | | | | | | | | 59,777 | | | | 1,056,260 | |
Taubman Centers Incorporated | | | | | | | | | | | 15,558 | | | | 885,406 | |
| | | | |
| | | | | | | | | | | | | | | 6,531,009 | |
| | | | | | | | | | | | | | | | |
| | | | |
Total Common Stocks (Cost $65,559,386) | | | | | | | | | | | | | | | 80,048,127 | |
| | | | | | | | | | | | | | | | |
| | | | |
| | | Yield | | | | | | | | | | |
| Short-Term Investments: 6.74% | | | | | | | | | | | | | | | | |
| | | | |
| Investment Companies: 6.74% | | | | | | | | | | | | | | | | |
Securities Lending Cash Investment LLC (l)(r)(u) | | | 1.89 | % | | | | | | | 4,579,892 | | | | 4,580,350 | |
Wells Fargo Government Money Market Fund Select Class (l)(u) | | | 1.54 | | | | | | | | 893,311 | | | | 893,311 | |
| | | | |
Total Short-Term Investments (Cost $5,473,592) | | | | | | | | | | | | | | | 5,473,661 | |
| | | | | | | | | | | | | | | | |
| | | | | | | | |
| Total investments in securities (Cost $71,032,978) | | | 105.31 | % | | | 85,521,788 | |
Other assets and liabilities, net | | | (5.31 | ) | | | (4,310,851 | ) |
| | | | | | | | |
| Total net assets | | | 100.00 | % | | $ | 81,210,937 | |
| | | | | | | | |
| † | Non-income-earning security |
| « | All or a portion of this security is on loan. |
| (l) | The issuer of the security is an affiliated person of the Fund as defined in the Investment Company Act of 1940. |
| (r) | The investment is a non-registered investment company purchased with cash collateral received from securities on loan. |
| (u) | The rate represents the 7-day annualized yield at period end. |
Investments in Affiliates
An affiliated investment is an investment in which the Fund owns at least 5% of the outstanding voting shares of the issuer or as a result of other relationships, such as the Fund and the issuer having the same investment manager. Transactions with issuers that were either affiliated persons of the Portfolio at the beginning of the period or the end of the period were as follows:
| | | | | | | | | | | | | | | | | | | | | | | | | | | | | | | | | | | | |
| | | Shares,
beginning of
period | | | Shares
purchased | | | Shares
sold | | | Shares,
end of
period | | | Net
realized
gains
(losses) | | | Net
change in
unrealized
gains
(losses) | | | Income
from
affiliated
securities | | | Value, end
of period | | | % of
net
assets | |
Short-Term Investments | | | | | | | | | | | | | | | | | | | | | | | | | | | | | | | | | | | | |
Investment companies | | | | | | | | | | | | | | | | | | | | | | | | | | | | | | | | | | | | |
Securities Lending Cash Investment LLC | | | 6,194,706 | | | | 55,772,053 | | | | 57,386,867 | | | | 4,579,892 | | | $ | 239 | | | $ | (229 | ) | | $ | 13,832 | | | $ | 4,580,350 | | | | | |
Wells Fargo Government Money Market Fund Select Class | | | 3,115,232 | | | | 23,681,112 | | | | 25,903,033 | | | | 893,311 | | | | 0 | | | | 0 | | | | 17,244 | | | | 893,311 | | | | | |
| | | | | | | | | | | | | | | | | | | | | | | | | | | | | | | | | | | | |
| | | | | | | | | | | | | | | | | | $ | 239 | | | $ | (229 | ) | | $ | 31,076 | | | $ | 5,473,661 | | | | 6.74 | % |
| | | | | | | | | | | | | | | | | | | | | | | | | | | | | | | | | | | | |
The accompanying notes are an integral part of these financial statements.
| | | | | | |
| Statement of assets and liabilities—March 31, 2018 | | Wells Fargo Intrinsic Small Cap Value Fund | | | 15 | |
| | | | |
| | | | |
| |
Assets | | | | |
Investments in unaffiliated securities (including $4,550,752 of securities loaned), at value (cost $65,559,386) | | $ | 80,048,127 | |
Investments in affiliated securities, at value (cost $5,473,592) | | | 5,473,661 | |
Cash | | | 37,106 | |
Receivable for investments sold | | | 355,601 | |
Receivable for Fund shares sold | | | 3,576 | |
Receivable for dividends | | | 79,182 | |
Receivable for securities lending income | | | 1,768 | |
Prepaid expenses and other assets | | | 30,321 | |
| | | | |
Total assets | | | 86,029,342 | |
| | | | |
| |
Liabilities | | | | |
Payable upon receipt of securities loaned | | | 4,579,825 | |
Payable for investments purchased | | | 71,451 | |
Management fee payable | | | 46,061 | |
Payable for Fund shares redeemed | | | 42,662 | |
Administration fees payable | | | 13,049 | |
Distribution fee payable | | | 560 | |
Trustees’ fees and expenses payable | | | 457 | |
Accrued expenses and other liabilities | | | 64,340 | |
| | | | |
Total liabilities | | | 4,818,405 | |
| | | | |
Total net assets | | $ | 81,210,937 | |
| | | | |
| |
NET ASSETS CONSIST OF | | | | |
Paid-in capital | | $ | 67,232,207 | |
Accumulated net realized losses on investments | | | (510,080 | ) |
Net unrealized gains on investments | | | 14,488,810 | |
| | | | |
Total net assets | | $ | 81,210,937 | |
| | | | |
| |
COMPUTATION OF NET ASSET VALUE AND OFFERING PRICE PER SHARE | | | | |
Net assets – Class A | | $ | 50,992,747 | |
Shares outstanding – Class A1 | | | 1,620,811 | |
Net asset value per share – Class A | | | $31.46 | |
Maximum offering price per share – Class A2 | | | $33.38 | |
Net assets – Class C | | $ | 839,833 | |
Shares outstanding – Class C1 | | | 28,661 | |
Net asset value per share – Class C | | | $29.30 | |
Net assets – Administrator Class | | $ | 1,346,618 | |
Shares outstanding – Administrator Class1 | | | 42,003 | |
Net asset value per share – Administrator Class | | | $32.06 | |
Net assets – Institutional Class | | $ | 28,031,739 | |
Shares outstanding – Institutional Class1 | | | 863,736 | |
Net asset value per share – Institutional Class | | | $32.45 | |
| 1 | The Fund has an unlimited number of authorized shares. |
| 2 | Maximum offering price is computed as 100/94.25 of net asset value. On investments of $50,000 or more, the offering price is reduced. |
The accompanying notes are an integral part of these financial statements.
| | | | |
| 16 | | Wells Fargo Intrinsic Small Cap Value Fund | | Statement of operations—year ended March 31, 2018 |
| | | | |
| | | | |
| |
Investment income | | | | |
Dividends (net of foreign withholding taxes of $1,097) | | $ | 859,915 | |
Income from affiliated securities | | | 31,076 | |
| | | | |
Total investment income | | | 890,991 | |
| | | | |
| |
Expenses | | | | |
Management fee | | | 695,648 | |
Administration fees | | | | |
Class A | | | 106,688 | |
Class C | | | 1,752 | |
Administrator Class | | | 4,303 | |
Institutional Class | | | 34,961 | |
Shareholder servicing fees | | | | |
Class A | | | 127,010 | |
Class C | | | 2,085 | |
Administrator Class | | | 8,275 | |
Distribution fee | | | | |
Class C | | | 6,256 | |
Custody and accounting fees | | | 15,576 | |
Professional fees | | | 40,553 | |
Registration fees | | | 62,519 | |
Shareholder report expenses | | | 36,318 | |
Trustees’ fees and expenses | | | 23,965 | |
Interest expense | | | 1,661 | |
Other fees and expenses | | | 10,622 | |
| | | | |
Total expenses | | | 1,178,192 | |
Less: Fee waivers and/or expense reimbursements | | | (164,512 | ) |
| | | | |
Net expenses | | | 1,013,680 | |
| | | | |
Net investment loss | | | (122,689 | ) |
| | | | |
| |
REALIZED AND UNREALIZED GAINS (LOSSES) ON INVESTMENTS | | | | |
| |
Net realized gains on: | | | | |
Unaffiliated securities | | | 8,078,919 | |
Affiliated securities | | | 239 | |
| | | | |
Net realized gains on investments | | | 8,079,158 | |
| | | | |
| |
Net change in unrealized gains (losses) on: | | | | |
Unaffiliated securities | | | (1,592,378 | ) |
Affiliated securities | | | (229 | ) |
| | | | |
Net change in unrealized gains (losses) on investments | | | (1,592,607 | ) |
| | | | |
Net realized and unrealized gains (losses) on investments | | | 6,486,551 | |
| | | | |
Net increase in net assets resulting from operations | | $ | 6,363,862 | |
| | | | |
The accompanying notes are an integral part of these financial statements.
| | | | | | |
| Statement of changes in net assets | | Wells Fargo Intrinsic Small Cap Value Fund | | | 17 | |
| | | | | | | | | | | | | | | | |
| | | Year ended
March 31, 2018 | | | Year ended
March 31, 2017 | |
| | | |
Operations | | | | | | | | | | | | |
Net investment loss | | | | | | $ | (122,689 | ) | | | | | | $ | (475,847 | ) |
Net realized gains on investments | | | | | | | 8,079,158 | | | | | | | | 15,786,751 | |
Net change in unrealized gains (losses) on investments | | | | | | | (1,592,607 | ) | | | | | | | 8,093,313 | |
| | | | |
Net increase in net assets resulting from operations | | | | | | | 6,363,862 | | | | | | | | 23,404,217 | |
| | | | |
| | | |
Distributions to shareholders from | | | | | | | | | | | | |
Net investment income | | | | | | | | | | | | | | | | |
Class A | | | | | | | 0 | | | | | | | | (256,325 | ) |
Administrator Class | | | | | | | 0 | | | | | | | | (23,316 | ) |
Institutional Class | | | | | | | 0 | | | | | | | | (465,017 | ) |
| | | | |
Total distributions to shareholders | | | | | | | 0 | | | | | | | | (744,658 | ) |
| | | | |
| | | | |
Capital share transactions | | | Shares | | | | | | | | Shares | | | | | |
Proceeds from shares sold | | | | | | | | | | | | | | | | |
Class A | | | 56,287 | | | | 1,697,291 | | | | 94,698 | | | | 2,625,025 | |
Class C | | | 3,291 | | | | 88,944 | | | | 26,166 | | | | 698,694 | |
Administrator Class | | | 9,745 | | | | 302,977 | | | | 20,547 | | | | 548,375 | |
Institutional Class | | | 134,112 | | | | 4,360,186 | | | | 642,995 | | | | 18,321,155 | |
| | | | |
| | | | | | | 6,449,398 | | | | | | | | 22,193,249 | |
| | | | |
Reinvestment of distributions | | | | | | | | | | | | | | | | |
Class A | | | 0 | | | | 0 | | | | 8,734 | | | | 248,050 | |
Administrator Class | | | 0 | | | | 0 | | | | 314 | | | | 9,086 | |
Institutional Class | | | 0 | | | | 0 | | | | 12,540 | | | | 365,784 | |
| | | | |
| | | | | | | 0 | | | | | | | | 622,920 | |
| | | | |
Payment for shares redeemed | | | | | | | | | | | | | | | | |
Class A | | | (261,867 | ) | | | (7,767,468 | ) | | | (401,261 | ) | | | (10,930,489 | ) |
Class C | | | (11,065 | ) | | | (298,907 | ) | | | (2,636 | ) | | | (65,871 | ) |
Administrator Class | | | (115,713 | ) | | | (3,702,140 | ) | | | (77,690 | ) | | | (2,099,588 | ) |
Institutional Class | | | (1,288,079 | ) | | | (37,985,828 | ) | | | (1,582,608 | ) | | | (40,376,065 | ) |
| | | | |
| | | | | | | (49,754,343 | ) | | | | | | | (53,472,013 | ) |
| | | | |
Net decrease in net assets resulting from capital share transactions | | | | | | | (43,304,945 | ) | | | | | | | (30,655,844 | ) |
| | | | |
Total decrease in net assets | | | | | | | (36,941,083 | ) | | | | | | | (7,996,285 | ) |
| | | | |
| | |
Net assets | | | | | | | | |
Beginning of period | | | | | | | 118,152,020 | | | | | | | | 126,148,305 | |
| | | | |
End of period | | | | | | $ | 81,210,937 | | | | | | | $ | 118,152,020 | |
| | | | |
Undistributed net investment income | | | | | | $ | 0 | | | | | | | $ | 0 | |
| | | | |
The accompanying notes are an integral part of these financial statements.
| | | | |
| 18 | | Wells Fargo Intrinsic Small Cap Value Fund | | Financial highlights |
(For a share outstanding throughout each period)
| | | | | | | | | | | | | | | | | | | | | | | | |
| | | Year ended March 31 | | | Year ended
October 31, 2013 | |
| CLASS A | | 2018 | | | 2017 | | | 2016 | | | 2015 | | | 20141 | | |
Net asset value, beginning of period | | | $28.92 | | | | $23.49 | | | | $25.50 | | | | $23.53 | | | | $22.16 | | | | $15.96 | |
Net investment income (loss) | | | (0.08 | )2 | | | (0.15 | )2 | | | 0.22 | 2 | | | 0.04 | | | | 0.02 | | | | 0.03 | |
Net realized and unrealized gains (losses) on investments | | | 2.62 | | | | 5.71 | | | | (2.09 | ) | | | 1.93 | | | | 1.35 | | | | 6.17 | |
| | | | | | | | | | | | | | | | | | | | | | | | |
Total from investment operations | | | 2.54 | | | | 5.56 | | | | (1.87 | ) | | | 1.97 | | | | 1.37 | | | | 6.20 | |
Distributions to shareholders from | | | | | | | | | | | | | | | | | | | | |
Net investment income | | | 0.00 | | | | (0.13 | ) | | | (0.14 | ) | | | 0.00 | | | | 0.00 | | | | 0.00 | |
Net asset value, end of period | | | $31.46 | | | | $28.92 | | | | $23.49 | | | | $25.50 | | | | $23.53 | | | | $22.16 | |
Total return3 | | | 8.78 | % | | | 23.68 | % | | | (7.36 | )% | | | 8.37 | % | | | 6.33 | % | | | 38.66 | % |
Ratios to average net assets (annualized) | | | | | | | | | | | | | | | | | | | | |
Gross expenses | | | 1.54 | % | | | 1.48 | % | | | 1.47 | % | | | 1.46 | % | | | 1.57 | % | | | 1.56 | % |
Net expenses | | | 1.35 | % | | | 1.35 | % | | | 1.35 | % | | | 1.40 | % | | | 1.44 | % | | | 1.45 | % |
Net investment income (loss) | | | (0.26 | )% | | | (0.57 | )% | | | 0.95 | % | | | 0.15 | % | | | 0.19 | % | | | 0.11 | % |
Supplemental data | | | | | | | | | | | | | | | | | | | | |
Portfolio turnover rate | | | 27 | % | | | 142 | % | | | 66 | % | | | 60 | % | | | 22 | % | | | 75 | % |
Net assets, end of period (000s omitted) | | | $50,993 | | | | $52,817 | | | | $49,898 | | | | $817 | | | | $908 | | | | $967 | |
| 1 | For the five months ended March 31, 2014. The Fund changed its fiscal year end from October 31 to March 31, effective March 31, 2014. |
| 2 | Calculated based upon average shares outstanding |
| 3 | Total return calculations do not include any sales charges. Returns for periods of less than one year are not annualized. |
The accompanying notes are an integral part of these financial statements.
| | | | | | |
| Financial highlights | | Wells Fargo Intrinsic Small Cap Value Fund | | | 19 | |
(For a share outstanding throughout each period)
| | | | | | | | | | | | | | | | | | | | | | | | |
| | | Year ended March 31 | | | Year ended
October 31, 2013 | |
| CLASS C | | 2018 | | | 2017 | | | 2016 | | | 2015 | | | 20141 | | |
Net asset value, beginning of period | | | $27.14 | | | | $22.11 | | | | $24.04 | | | | $22.35 | | | | $21.12 | | | | $15.32 | |
Net investment loss | | | (0.28 | )2 | | | (0.39 | )2 | | | (0.00 | )2,3 | | | (0.14 | )2 | | | (0.05 | ) | | | (0.13 | )2 |
Net realized and unrealized gains (losses) on investments | | | 2.44 | | | | 5.42 | | | | (1.93 | ) | | | 1.83 | | | | 1.28 | | | | 5.93 | |
| | | | | | | | | | | | | | | | | | | | | | | | |
Total from investment operations | | | 2.16 | | | | 5.03 | | | | (1.93 | ) | | | 1.69 | | | | 1.23 | | | | 5.80 | |
Net asset value, end of period | | | $29.30 | | | | $27.14 | | | | $22.11 | | | | $24.04 | | | | $22.35 | | | | $21.12 | |
Total return4 | | | 7.96 | % | | | 22.75 | % | | | (8.03 | )% | | | 7.56 | % | | | 6.02 | % | | | 37.60 | % |
Ratios to average net assets (annualized) | | | | | | | | | | | | | | | | | | | | |
Gross expenses | | | 2.29 | % | | | 2.22 | % | | | 2.22 | % | | | 2.21 | % | | | 2.33 | % | | | 2.30 | % |
Net expenses | | | 2.10 | % | | | 2.10 | % | | | 2.12 | % | | | 2.15 | % | | | 2.19 | % | | | 2.20 | % |
Net investment loss | | | (1.02 | )% | | | (1.52 | )% | | | (0.00 | )% | | | (0.62 | )% | | | (0.54 | )% | | | (0.66 | )% |
Supplemental data | | | | | | | | | | | | | | | | | | | | |
Portfolio turnover rate | | | 27 | % | | | 142 | % | | | 66 | % | | | 60 | % | | | 22 | % | | | 75 | % |
Net assets, end of period (000s omitted) | | | $840 | | | | $989 | | | | $285 | | | | $304 | | | | $429 | | | | $418 | |
| 1 | For the five months ended March 31, 2014. The Fund changed its fiscal year end from October 31 to March 31, effective March 31, 2014. |
| 2 | Calculated based upon average shares outstanding |
| 3 | Amount is more than $(0.005). |
| 4 | Total return calculations do not include any sales charges. Returns for periods of less than one year are not annualized. |
The accompanying notes are an integral part of these financial statements.
| | | | |
| 20 | | Wells Fargo Intrinsic Small Cap Value Fund | | Financial highlights |
(For a share outstanding throughout each period)
| | | | | | | | | | | | | | | | | | | | | | | | |
| | | Year ended March 31 | | | Year ended
October 31, 2013 | |
| ADMINISTRATOR CLASS | | 2018 | | | 2017 | | | 2016 | | | 2015 | | | 20141 | | |
Net asset value, beginning of period | | | $29.43 | | | | $23.89 | | | | $25.95 | | | | $23.90 | | | | $22.49 | | | | $16.16 | |
Net investment income (loss) | | | (0.03 | )2 | | | (0.10 | )2 | | | 0.22 | 2 | | | 0.07 | 2 | | | 0.04 | 2 | | | 0.09 | |
Net realized and unrealized gains (losses) on investments | | | 2.66 | | | | 5.80 | | | | (2.08 | ) | | | 1.98 | | | | 1.37 | | | | 6.24 | |
| | | | | | | | | | | | | | | | | | | | | | | | |
Total from investment operations | | | 2.63 | | | | 5.70 | | | | (1.86 | ) | | | 2.05 | | | | 1.41 | | | | 6.33 | |
Distributions to shareholders from | | | | | | | | | | | | | | | | | | | | |
Net investment income | | | 0.00 | | | | (0.16 | ) | | | (0.20 | ) | | | 0.00 | | | | (0.00 | )3 | | | 0.00 | |
Net asset value, end of period | | | $32.06 | | | | $29.43 | | | | $23.89 | | | | $25.95 | | | | $23.90 | | | | $22.49 | |
Total return4 | | | 8.94 | % | | | 23.86 | % | | | (7.17 | )% | | | 8.58 | % | | | 6.43 | % | | | 38.99 | % |
Ratios to average net assets (annualized) | | | | | | | | | | | | | | | | | | | | |
Gross expenses | | | 1.46 | % | | | 1.40 | % | | | 1.37 | % | | | 1.30 | % | | | 1.42 | % | | | 1.40 | % |
Net expenses | | | 1.20 | % | | | 1.20 | % | | | 1.20 | % | | | 1.20 | % | | | 1.20 | % | | | 1.20 | % |
Net investment income (loss) | | | (0.10 | )% | | | (0.38 | )% | | | 0.91 | % | | | 0.27 | % | | | 0.45 | % | | | 0.52 | % |
Supplemental data | | | | | | | | | | | | | | | | | | | | |
Portfolio turnover rate | | | 27 | % | | | 142 | % | | | 66 | % | | | 60 | % | | | 22 | % | | | 75 | % |
Net assets, end of period (000s omitted) | | | $1,347 | | | | $4,355 | | | | $4,893 | | | | $5,110 | | | | $10,498 | | | | $11,182 | |
| 1 | For the five months ended March 31, 2014. The Fund changed its fiscal year end from October 31 to March 31, effective March 31, 2014. |
| 2 | Calculated based upon average shares outstanding |
| 3 | Amount is less than $0.005. |
| 4 | Returns for periods of less than one year are not annualized. |
The accompanying notes are an integral part of these financial statements.
| | | | | | |
| Financial highlights | | Wells Fargo Intrinsic Small Cap Value Fund | | | 21 | |
(For a share outstanding throughout each period)
| | | | | | | | | | | | | | | | | | | | | | | | |
| | | Year ended March 31 | | | Year ended
October 31, 2013 | |
| INSTITUTIONAL CLASS | | 2018 | | | 2017 | | | 2016 | | | 2015 | | | 20141 | | |
Net asset value, beginning of period | | | $29.73 | | | | $24.13 | | | | $26.22 | | | | $24.19 | | | | $22.78 | | | | $16.32 | |
Net investment income (loss) | | | 0.03 | 2 | | | (0.07 | )2 | | | 0.33 | | | | 0.14 | 2 | | | 0.06 | 2 | | | 0.12 | 2 |
Net realized and unrealized gains (losses) on investments | | | 2.69 | | | | 5.89 | | | | (2.17 | ) | | | 1.99 | | | | 1.39 | | | | 6.34 | |
| | | | | | | | | | | | | | | | | | | | | | | | |
Total from investment operations | | | 2.72 | | | | 5.82 | | | | (1.84 | ) | | | 2.13 | | | | 1.45 | | | | 6.46 | |
Distributions to shareholders from | | | | | | | | | | | | | | | | | | | | |
Net investment income | | | 0.00 | | | | (0.22 | ) | | | (0.25 | ) | | | (0.10 | ) | | | (0.04 | ) | | | 0.00 | |
Net asset value, end of period | | | $32.45 | | | | $29.73 | | | | $24.13 | | | | $26.22 | | | | $24.19 | | | | $22.78 | |
Total return3 | | | 9.15 | % | | | 24.14 | % | | | (7.02 | )% | | | 8.83 | % | | | 6.50 | % | | | 39.40 | % |
Ratios to average net assets (annualized) | | | | | | | | | | | | | | | | | | | | |
Gross expenses | | | 1.21 | % | | | 1.15 | % | | | 1.12 | % | | | 1.03 | % | | | 1.15 | % | | | 1.10 | % |
Net expenses | | | 1.00 | % | | | 1.00 | % | | | 1.00 | % | | | 1.00 | % | | | 1.00 | % | | | 1.00 | % |
Net investment income (loss) | | | 0.08 | % | | | (0.26 | )% | | | 1.10 | % | | | 0.57 | % | | | 0.64 | % | | | 0.58 | % |
Supplemental data | | | | | | | | | | | | | | | | | | | | |
Portfolio turnover rate | | | 27 | % | | | 142 | % | | | 66 | % | | | 60 | % | | | 22 | % | | | 75 | % |
Net assets, end of period (000s omitted) | | | $28,032 | | | | $59,991 | | | | $71,072 | | | | $84,563 | | | | $79,312 | | | | $71,934 | |
| 1 | For the five months ended March 31, 2014. The Fund changed its fiscal year end from October 31 to March 31, effective March 31, 2014. |
| 2 | Calculated based upon average shares outstanding |
| 3 | Returns for periods of less than one year are not annualized. |
The accompanying notes are an integral part of these financial statements.
| | | | |
| 22 | | Wells Fargo Intrinsic Small Cap Value Fund | | Notes to financial statements |
1. ORGANIZATION
Wells Fargo Funds Trust (the “Trust”), a Delaware statutory trust organized on March 10, 1999, is an open-end management investment company registered under the Investment Company Act of 1940, as amended (the “1940 Act”). As an investment company, the Trust follows the accounting and reporting guidance in Financial Accounting Standards Board Accounting Standards Codification Topic 946, Financial Services – Investment Companies. These financial statements report on the Wells Fargo Intrinsic Small Cap Value Fund (the “Fund”) which is a diversified series of the Trust.
2. SIGNIFICANT ACCOUNTING POLICIES
The following significant accounting policies, which are consistently followed in the preparation of the financial statements of the Fund, are in conformity with U.S. generally accepted accounting principles which require management to make estimates and assumptions that affect the reported amounts of assets and liabilities, disclosure of contingent assets and liabilities at the date of the financial statements, and the reported amounts of revenues and expenses during the reporting period. Actual results could differ from those estimates.
Securities valuation
All investments are valued each business day as of the close of regular trading on the New York Stock Exchange (generally 4 p.m. Eastern Time), although the Fund may deviate from this calculation time under unusual or unexpected circumstances.
Equity securities that are listed on a foreign or domestic exchange or market are valued at the official closing price or, if none, the last sales price. If no sale occurs on the primary exchange or market that day, the prior day’s price will be deemed “stale” and a fair value price will be determined in accordance with the Fund’s Valuation Procedures.
Investments in registered open-end investment companies are valued at net asset value. Interests in non-registered investment vehicles that are redeemable at net asset value are fair valued at net asset value when available.
Investments which are not valued using any of the methods discussed above are valued at their fair value, as determined in good faith by the Board of Trustees of the Fund. The Board of Trustees has established a Valuation Committee comprised of the Trustees and has delegated to it the authority to take any actions regarding the valuation of portfolio securities that the Valuation Committee deems necessary or appropriate, including determining the fair value of portfolio securities, unless the determination has been delegated to the Wells Fargo Asset Management Pricing Committee at Wells Fargo Funds Management, LLC (“Funds Management”). The Board of Trustees retains the authority to make or ratify any valuation decisions or approve any changes to the Valuation Procedures as it deems appropriate. On a quarterly basis, the Board of Trustees receives reports on any valuation actions taken by the Valuation Committee or the Wells Fargo Asset Management Pricing Committee which may include items for ratification.
Valuations of fair valued securities are compared to the next actual sales price when available, or other appropriate market values, to assess the continued appropriateness of the fair valuation methodologies used. These securities are fair valued on a day-to-day basis, taking into consideration changes to appropriate market information and any significant changes to the inputs considered in the valuation process until there is a readily available price provided on an exchange or by an independent pricing service. Valuations received from an independent pricing service or independent broker-dealer quotes are periodically validated by comparisons to most recent trades and valuations provided by other independent pricing services in addition to the review of prices by the adviser and/or subadviser. Unobservable inputs used in determining fair valuations are identified based on the type of security, taking into consideration factors utilized by market participants in valuing the investment, knowledge about the issuer and the current market environment.
Securities lending
The Fund may lend its securities from time to time in order to earn additional income in the form of fees or interest on securities received as collateral or the investment of any cash received as collateral. The Fund continues to receive interest or dividends on the securities loaned. The Fund receives collateral in the form of cash or securities with a value at least equal to the value of the securities on loan. The value of the loaned securities is determined at the close of each business day and any additional required collateral is delivered to the Fund on the next business day. In a securities lending transaction, the net asset value of the Fund will be affected by an increase or decrease in the value of the securities loaned and by an increase or decrease in the value of the instrument in which collateral is invested. The amount of securities lending activity undertaken by the Fund fluctuates from time to time. In the event of default or bankruptcy by the borrower, the Fund may be prevented from recovering the loaned securities or gaining access to the collateral or may experience delays or costs in doing so. In addition, the investment of any cash collateral received may lose all or part of its value. The Fund has the right under the lending agreement to recover the securities from the borrower on demand.
| | | | | | |
| Notes to financial statements | | Wells Fargo Intrinsic Small Cap Value Fund | | | 23 | |
The Fund lends its securities through an unaffiliated securities lending agent. Cash collateral received in connection with its securities lending transactions is invested in Securities Lending Cash Investments, LLC (the “Securities Lending Fund”). The Securities Lending Fund is exempt from registration under Section 3(c)(7) of the 1940 Act and is managed by Funds Management and is subadvised by Wells Capital Management Incorporated (“WellsCap”), an affiliate of Funds Management and an indirect wholly owned subsidiary of Wells Fargo & Company (“Wells Fargo”). Funds Management receives an advisory fee starting at 0.05% and declining to 0.01% as the average daily net assets of the Securities Lending Fund increase. All of the fees received by Funds Management are paid to WellsCap for its services as subadviser. The Securities Lending Fund seeks to provide a positive return compared to the daily Fed Funds Open Rate by investing in high-quality, U.S. dollar-denominated short-term money market instruments. Securities Lending Fund investments are valued at the evaluated bid price provided by an independent pricing service. Income earned from investment in the Securities Lending Fund, if any, is included in income from affiliated securities on the Statement of Operations.
Security transactions and income recognition
Securities transactions are recorded on a trade date basis. Realized gains or losses are recorded on the basis of identified cost.
Dividend income is recognized on the ex-dividend date. Dividend income from foreign securities is recorded net of foreign taxes withheld where recovery of such taxes is not assured.
Distributions to shareholders
Distributions to shareholders from net investment income and any net realized gains are recorded on the ex-dividend date and paid at least annually. Such distributions are determined in accordance with income tax regulations and may differ from U.S. generally accepted accounting principles. Dividend sources are estimated at the time of declaration. The tax character of distributions is determined as of the Fund’s fiscal year end. Therefore, a portion of the Fund’s distributions made prior to the Fund’s fiscal year end may be categorized as a tax return of capital at year end.
Federal and other taxes
The Fund intends to continue to qualify as a regulated investment company by distributing substantially all of its investment company taxable income and any net realized capital gains (after reduction for capital loss carryforwards) sufficient to relieve it from all, or substantially all, federal income taxes. Accordingly, no provision for federal income taxes was required.
The Fund’s income and federal excise tax returns and all financial records supporting those returns for the prior three fiscal years are subject to examination by the federal and Delaware revenue authorities. Management has analyzed the Fund’s tax positions taken on federal, state, and foreign tax returns for all open tax years and does not believe that there are any uncertain tax positions that require recognition of a tax liability.
As of March 31, 2018, the aggregate cost of all investments for federal income tax purposes was $71,543,058 and the unrealized gains (losses) consisted of:
| | | | |
Gross unrealized gains | | $ | 17,165,646 | |
Gross unrealized losses | | | (3,186,916 | ) |
Net unrealized gains | | $ | 13,978,730 | |
Reclassifications are made to the Fund’s capital accounts for permanent tax differences to reflect income and gains available for distribution (or available capital loss carryforwards) under federal income tax regulations. U.S. generally accepted accounting principles require that certain components of net assets be adjusted to reflect permanent differences between financial and tax reporting. These reclassifications have no effect on net assets or net asset values per share. The primary permanent differences causing such reclassifications are due to expiration of capital loss carryforwards and net operating losses. At March 31, 2018, as a result of permanent book-to-tax differences, the following reclassification adjustments were made on the Statement of Assets and Liabilities:
| | | | |
| Paid-in capital | | Undistributed net
investment income | | Accumulated net
realized losses
on investments |
| $(365,228) | | $122,689 | | $242,539 |
| | | | |
| 24 | | Wells Fargo Intrinsic Small Cap Value Fund | | Notes to financial statements |
Class allocations
The separate classes of shares offered by the Fund differ principally in applicable sales charges, distribution, shareholder servicing, and administration fees. Class specific expenses are charged directly to that share class. Investment income, common expenses, and realized and unrealized gains (losses) on investments are allocated daily to each class of shares based on the relative proportion of net assets of each class.
3. FAIR VALUATION MEASUREMENTS
Fair value measurements of investments are determined within a framework that has established a fair value hierarchy based upon the various data inputs utilized in determining the value of the Fund’s investments. The three-level hierarchy gives the highest priority to unadjusted quoted prices in active markets for identical assets or liabilities (Level 1) and the lowest priority to unobservable inputs (Level 3). The Fund’s investments are classified within the fair value hierarchy based on the lowest level of input that is significant to the fair value measurement. The inputs are summarized into three broad levels as follows:
| ∎ | | Level 1 – quoted prices in active markets for identical securities |
| ∎ | | Level 2 – other significant observable inputs (including quoted prices for similar securities, interest rates, prepayment speeds, credit risk, etc.) |
| ∎ | | Level 3 – significant unobservable inputs (including the Fund’s own assumptions in determining the fair value of investments) |
The inputs or methodologies used for valuing investments in securities are not necessarily an indication of the risk associated with investing in those securities.
The following is a summary of the inputs used in valuing the Fund’s assets and liabilities as of March 31, 2018:
| | | | | | | | | | | | | | | | |
| | | Quoted prices
(Level 1) | | | Other significant
observable inputs
(Level 2) | | | Significant
unobservable inputs (Level 3) | | | Total | |
Assets | | | | | | | | | | | | | | | | |
Investments in: | | | | | | | | | | | | | | | | |
| | | | |
Common stocks | | | | | | | | | | | | | | | | |
Consumer discretionary | | $ | 7,375,058 | | | $ | 0 | | | $ | 0 | | | $ | 7,375,058 | |
Consumer staples | | | 438,727 | | | | 0 | | | | 0 | | | | 438,727 | |
Energy | | | 5,751,870 | | | | 0 | | | | 0 | | | | 5,751,870 | |
Financials | | | 21,512,985 | | | | 0 | | | | 0 | | | | 21,512,985 | |
Health care | | | 10,026,872 | | | | 0 | | | | 0 | | | | 10,026,872 | |
Industrials | | | 15,808,577 | | | | 0 | | | | 0 | | | | 15,808,577 | |
Information technology | | | 9,659,722 | | | | 0 | | | | 0 | | | | 9,659,722 | |
Materials | | | 2,943,307 | | | | 0 | | | | 0 | | | | 2,943,307 | |
Real estate | | | 6,531,009 | | | | 0 | | | | 0 | | | | 6,531,009 | |
| | | | |
Short-term investments | | | | | | | | | | | | | | | | |
Investment companies | | | 893,311 | | | | 0 | | | | 0 | | | | 893,311 | |
Investments measured at net asset value* | | | | | | | | | | | | | | | 4,580,350 | |
Total assets | | $ | 80,941,438 | | | $ | 0 | | | $ | 0 | | | $ | 85,521,788 | |
| * | Investments that are measured at fair value using the net asset value per share (or its equivalent) as a practical expedient have not been categorized in the fair value hierarchy. The fair value amount presented in the table is intended to permit reconciliation of the fair value hierarchy to the amounts presented in the Statement of Assets and Liabilities. The Fund’s investment in Securities Lending Cash Investments, LLC valued at $4,580,350 does not have a redemption period notice, can be redeemed daily and does not have any unfunded commitments. |
The Fund recognizes transfers between levels within the fair value hierarchy at the end of the reporting period. At March 31, 2018, the Fund did not have any transfers into/out of Level 1, Level 2, or Level 3.
| | | | | | |
| Notes to financial statements | | Wells Fargo Intrinsic Small Cap Value Fund | | | 25 | |
4. TRANSACTIONS WITH AFFILIATES
Management fee
Funds Management, an indirect wholly owned subsidiary of Wells Fargo, is the manager of the Fund and provides advisory and fund-level administrative services under an investment management agreement. Under the investment management agreement, Funds Management is responsible for, among other services, implementing the investment objectives and strategies of the Fund, supervising the subadviser, providing fund-level administrative services in connection with the Fund’s operations, and providing any other fund-level administrative services reasonably necessary for the operation of the Fund. As compensation for its services under the investment management agreement, Funds Management is entitled to receive an annual management fee starting at 0.85% and declining to 0.71% as the average daily net assets of the Fund increase. For the year ended March 31, 2018, the management fee was equivalent to an annual rate of 0.85% of the Fund’s average daily net assets.
Funds Management has retained the services of a subadviser to provide daily portfolio management to the Fund. The fee for subadvisory services is borne by Funds Management. WellsCap is the subadviser to the Fund and is entitled to receive a fee from Funds Management at an annual rate starting at 0.55% and declining to 0.40% as the average daily net assets of the Fund increase.
Administration fees
Under a class-level administration agreement, Funds Management provides class-level administrative services to the Fund, which includes paying fees and expenses for services provided by the transfer agent, sub-transfer agents, omnibus account servicers and record-keepers. As compensation for its services under the class-level administration agreement, Funds Management receives an annual fee which is calculated based on the average daily net assets of each class as follows:
| | | | |
| | | Class level
administration fee | |
Class A, Class C | | | 0.21 | % |
Administrator Class, Institutional Class | | | 0.13 | |
Funds Management has contractually waived and/or reimbursed management and administration fees to the extent necessary to maintain certain net operating expense ratios for the Fund. Waiver of fees and/or reimbursement of expenses by Funds Management were made first from fund level expenses on a proportionate basis and then from class specific expenses. Funds Management has committed through July 31, 2018 to waive fees and/or reimburse expenses to the extent necessary to cap the Fund’s expenses at 1.35% for Class A shares, 2.10% for Class C shares, 1.20% for Administrator Class shares, and 1.00% for Institutional Class shares. After this time, the cap may be increased or the commitment to maintain the cap may be terminated only with the approval of the Board of Trustees.
Distribution fee
The Trust has adopted a Distribution Plan for Class C shares of the Fund pursuant to Rule 12b-1 under the 1940 Act. A distribution fee is charged to Class C shares and paid to Wells Fargo Funds Distributor, LLC (“Funds Distributor”), the principal underwriter, at an annual rate of 0.75% of the average daily net assets of Class C shares.
In addition, Funds Distributor is entitled to receive the front-end sales charge from the purchase of Class A shares and a contingent deferred sales charge on the redemption of certain Class A shares. Funds Distributor is also entitled to receive the contingent deferred sales charges from redemptions of Class C shares. For the year ended March 31, 2018, Funds Distributor received $623 from the sale of Class A shares. No contingent deferred sales charges were incurred by Class A and Class C for the year ended March 31, 2018.
Shareholder servicing fees
The Trust has entered into contracts with one or more shareholder servicing agents, whereby Class A, Class C, and Administrator Class of the Fund is charged a fee at an annual rate of 0.25% of the average daily net assets of each respective class.
A portion of these total shareholder servicing fees were paid to affiliates of Wells Fargo.
Interfund transactions
The Fund may purchase or sell portfolio investment securities to certain other Wells Fargo affiliates pursuant to Rule 17a-7 under the 1940 Act and under procedures adopted by the Board of Trustees. The procedures have been designed to ensure that these interfund transactions, which do not incur broker commissions, are effected at current market prices.
| | | | |
| 26 | | Wells Fargo Intrinsic Small Cap Value Fund | | Notes to financial statements |
5. INVESTMENT PORTFOLIO TRANSACTIONS
Purchases and sales of investments, excluding U.S. government obligations (if any) and short-term securities, for the year ended March 31, 2018 were $22,688,620 and $63,546,888, respectively.
6. BANK BORROWINGS
The Trust (excluding the money market funds and certain other funds) and Wells Fargo Variable Trust are parties to a $280,000,000 revolving credit agreement whereby the Fund is permitted to use bank borrowings for temporary or emergency purposes, such as to fund shareholder redemption requests. Interest under the credit agreement is charged to the Fund based on a borrowing rate equal to the higher of the Federal Funds rate in effect on that day plus 1.25% or the overnight LIBOR rate in effect on that day plus 1.25%. In addition, an annual commitment fee equal to 0.25% of the unused balance is allocated to each participating fund. Prior to August 29, 2017, the revolving credit agreement amount was $250,000,000.
During the year ended March 31, 2018, the Fund had average borrowings outstanding of $75,158 at an average rate of 2.21% and paid interest in the amount of $1,661.
7. DISTRIBUTIONS TO SHAREHOLDERS
For the year ended March 31, 2018, the Fund did not have any distributions paid to shareholders. The tax character of distributions paid for the year ended March 31, 2017 was $744,658 of ordinary income.
As of March 31, 2018, distributable earnings on a tax basis consisted of $13,978,730 in unrealized gains.
8. CONCENTRATION RISK
Concentration risks result from exposure to a limited number of sectors. A fund that invests a substantial portion of its assets in any sector may be more affected by changes in that sector than would be a fund whose investments are not heavily weighted in any sector.
9. INDEMNIFICATION
Under the Trust’s organizational documents, the officers and Trustees have been granted certain indemnification rights against certain liabilities that may arise out of performance of their duties to the Trust. Additionally, in the normal course of business, the Trust may enter into contracts with service providers that contain a variety of indemnification clauses. The Trust’s maximum exposure under these arrangements is dependent on future claims that may be made against the Fund and, therefore, cannot be estimated.
| | | | | | |
| Report of independent registered public accounting firm | | Wells Fargo Intrinsic Small Cap Value Fund | | | 27 | |
BOARD OF TRUSTEES AND SHAREHOLDERS OF WELLS FARGO FUNDS TRUST:
Opinion on the Financial Statements
We have audited the accompanying statement of assets and liabilities of the Wells Fargo Intrinsic Small Cap Value Fund (the “Fund”), one of the funds constituting the Wells Fargo Funds Trust, including the portfolio of investments, as of March 31, 2018, the related statement of operations for the year then ended, the statements of changes in net assets for each of the years in the two-year period then ended, and the related notes (collectively, the “financial statements”) and the financial highlights for each of the years in the four-year period then ended, the period from November 1, 2013 to March 31, 2014, and the year ended October 31, 2013. In our opinion, the financial statements and financial highlights present fairly, in all material respects, the financial position of the Fund as of March 31, 2018, the results of its operations for the year then ended, the changes in its net assets for each of the years in the two-year period then ended, and the financial highlights for each of the years or periods noted above, in conformity with U.S. generally accepted accounting principles.
Basis for Opinion
These financial statements and financial highlights are the responsibility of the Fund’s management. Our responsibility is to express an opinion on these financial statements and financial highlights based on our audits. We are a public accounting firm registered with the Public Company Accounting Oversight Board (United States) (“PCAOB”) and are required to be independent with respect to the Fund in accordance with the U.S. federal securities laws and the applicable rules and regulations of the Securities and Exchange Commission and the PCAOB.
We conducted our audits in accordance with the standards of the PCAOB. Those standards require that we plan and perform the audit to obtain reasonable assurance about whether the financial statements and financial highlights are free of material misstatement, whether due to error or fraud. Our audits included performing procedures to assess the risks of material misstatement of the financial statements and financial highlights, whether due to error or fraud, and performing procedures that respond to those risks. Such procedures included examining, on a test basis, evidence regarding the amounts and disclosures in the financial statements and financial highlights. Such procedures also included confirmation of securities owned as of March 31, 2018, by correspondence with the custodian and brokers, or by other appropriate auditing procedures. Our audits also included evaluating the accounting principles used and significant estimates made by management, as well as evaluating the overall presentation of the financial statements and financial highlights. We believe that our audits provide a reasonable basis for our opinion.

We have not been able to determine the specific year that we began serving as the auditor of one or more Wells Fargo Funds investment companies, however we are aware that we have served as the auditor of one or more Wells Fargo Funds investment companies since at least 1955.
Boston, Massachusetts
May 23, 2018
| | | | |
| 28 | | Wells Fargo Intrinsic Small Cap Value Fund | | Other information (unaudited) |
PROXY VOTING INFORMATION
A description of the policies and procedures that the Fund uses to determine how to vote proxies relating to portfolio securities is available, upon request, by calling 1-800-222-8222, visiting our website at wellsfargofunds.com, or visiting the SEC website at sec.gov. Information regarding how the Fund voted proxies relating to portfolio securities during the most recent 12-month period ended June 30 is available on the Fund’s website at wellsfargofunds.com or by visiting the SEC website at sec.gov.
PORTFOLIO HOLDINGS INFORMATION
The complete portfolio holdings for the Fund are publicly available monthly on the Fund’s website (wellsfargofunds.com), on a one-month delayed basis. In addition, top ten holdings information (excluding derivative positions) for the Fund is publicly available on the Fund’s website on a monthly, seven-day or more delayed basis. The Fund files its complete schedule of portfolio holdings with the SEC for the first and third quarters of each fiscal year on Form N-Q, which is available by visiting the SEC website at sec.gov. In addition, the Fund’s Form N-Q may be reviewed and copied at the SEC’s Public Reference Room in Washington, DC, and at regional offices in New York City, at 233 Broadway, and in Chicago, at 175 West Jackson Boulevard, Suite 900. Information about the Public Reference Room may be obtained by calling 1-800-SEC-0330.
| | | | | | |
| Other information (unaudited) | | Wells Fargo Intrinsic Small Cap Value Fund | | | 29 | |
BOARD OF TRUSTEES AND OFFICERS
Each of the Trustees and Officers1 listed in the table below acts in identical capacities for each fund in the Wells Fargo family of funds, which consists of 153 mutual funds comprising the Wells Fargo Funds Trust, Wells Fargo Variable Trust, Wells Fargo Master Trust and four closed-end funds (collectively the “Fund Complex”). This table should be read in conjunction with the Prospectus and the Statement of Additional Information2. The mailing address of each Trustee and Officer is 525 Market Street, 12th Floor, San Francisco, CA 94105. Each Trustee and Officer serves an indefinite term, however, each Trustee serves such term until reaching the mandatory retirement age established by the Trustees.
Independent Trustees
| | | | | | |
Name and year of birth | | Position held and length of service* | | Principal occupations during past five years or longer | | Current other public company or investment company directorships |
William R. Ebsworth (Born 1957) | | Trustee, since 2015 | | Retired. From 1984 to 2013, equities analyst, portfolio manager, research director and chief investment officer at Fidelity Management and Research Company in Boston, Tokyo, and Hong Kong, and retired in 2013 as Chief Investment Officer of Fidelity Strategic Advisers, Inc. where he led a team of investment professionals managing client assets. Prior thereto, Board member of Hong Kong Securities Clearing Co., Hong Kong Options Clearing Corp., the Thailand International Fund, Ltd., Fidelity Investments Life Insurance Company, and Empire Fidelity Investments Life Insurance Company. Board member of the Forté Foundation (non-profit organization) and the Vincent Memorial Hospital Endowment (non-profit organization), where he serves on the Investment Committee and as a Chair of the Audit Committee. Mr. Ebsworth is a CFA® charterholder. | | Asset Allocation Trust |
Jane A. Freeman** (Born 1953) | | Trustee, since 2015; Chair Liaison, since 2018 | | Retired. From 2012 to 2014 and 1999 to 2008, Chief Financial Officer of Scientific Learning Corporation. From 2008 to 2012, Ms. Freeman provided consulting services related to strategic business projects. Prior to 1999, Portfolio Manager at Rockefeller & Co. and Scudder, Stevens & Clark. Board member of the Harding Loevner Funds from 1996 to 2014, serving as both Lead Independent Director and chair of the Audit Committee. Board member of the Russell Exchange Traded Funds Trust from 2011 to 2012 and the chair of the Audit Committee. Ms. Freeman is a Board Member of Ruth Bancroft Garden (non-profit organization) and the Glimmerglass Festival. She is also an inactive Chartered Financial Analyst. | | Asset Allocation Trust |
Isaiah Harris, Jr. (Born 1952) | | Trustee, since 2009 | | Retired. Chairman of the Board of CIGNA Corporation since 2009, and Director since 2005. From 2003 to 2011, Director of Deluxe Corporation. Prior thereto, President and CEO of BellSouth Advertising and Publishing Corp. from 2005 to 2007, President and CEO of BellSouth Enterprises from 2004 to 2005 and President of BellSouth Consumer Services from 2000 to 2003. Emeritus member of the Iowa State University Foundation Board of Governors. Emeritus Member of the Advisory Board of Iowa State University School of Business. Advisory Board Member, Palm Harbor Academy (charter school). Advisory Board Member, Child Evangelism Fellowship (non-profit). Mr. Harris is a certified public accountant (inactive status). | | CIGNA Corporation; Asset Allocation Trust |
Judith M. Johnson (Born 1949) | | Trustee, since 2008; Audit Committee Chairman, since 2008 | | Retired. Prior thereto, Chief Executive Officer and Chief Investment Officer of Minneapolis Employees Retirement Fund from 1996 to 2008. Ms. Johnson is an attorney, certified public accountant and a certified managerial accountant. | | Asset Allocation Trust |
David F. Larcker (Born 1950) | | Trustee, since 2009 | | James Irvin Miller Professor of Accounting at the Graduate School of Business, Stanford University, Director of the Corporate Governance Research Initiative and Senior Faculty of The Rock Center for Corporate Governance since 2006. From 2005 to 2008, Professor of Accounting at the Graduate School of Business, Stanford University. Prior thereto, Ernst & Young Professor of Accounting at The Wharton School, University of Pennsylvania from 1985 to 2005. | | Asset Allocation Trust |
| | | | |
| 30 | | Wells Fargo Intrinsic Small Cap Value Fund | | Other information (unaudited) |
| | | | | | |
Name and year of birth | | Position held and length of service* | | Principal occupations during past five years or longer | | Current other public company or investment company directorships |
Olivia S. Mitchell*** (Born 1953) | | Trustee, since 2006; Governance Committee Chairman, since 2018 | | International Foundation of Employee Benefit Plans Professor, Wharton School of the University of Pennsylvania since 1993. Director of Wharton’s Pension Research Council and Boettner Center on Pensions & Retirement Research, and Research Associate at the National Bureau of Economic Research. Previously, Cornell University Professor from 1978 to 1993. | | Asset Allocation Trust |
Timothy J. Penny**** (Born 1951) | | Trustee, since 1996; Chairman, since 2018; Vice Chairman, from 2017 to 2018 | | President and Chief Executive Officer of Southern Minnesota Initiative Foundation, a non-profit organization, since 2007. Member of the Board of Trustees of NorthStar Education Finance, Inc., a non-profit organization, since 2007. | | Asset Allocation Trust |
James G. Polisson***** (Born 1959) | | Trustee, since 2018; Advisory Board Member, from 2017 to 2018 | | Retired. Chief Marketing Officer, Source (ETF) UK Services, Ltd, from 2015 to 2017. From 2012 to 2015, Principal of The Polisson Group, LLC, a management consulting, corporate advisory and principal investing company. Chief Executive Officer and Managing Director at Russell Investments, Global Exchange Traded Funds from 2010 to 2012. Managing Director of Barclays Global Investors from 1998 to 2010 and Global Chief Marketing Officer for iShares and Barclays Global Investors from 2000 to 2010. Trustee of the San Francisco Mechanics’ Institute, a non-profit organization, from 2013 to 2015. Board member of the Russell Exchange Traded Fund Trust from 2011 to 2012. Director of Barclays Global Investors Holdings Deutschland GmbH from 2006 to 2009. Mr. Polisson is an attorney and has a retired status with the Massachusetts and District of Columbia Bar Associations. | | Asset Allocation Trust |
Michael S. Scofield (Born 1943) | | Trustee, since 2010 | | Served on the Investment Company Institute’s Board of Governors and Executive Committee from 2008-2011 as well the Governing Council of the Independent Directors Council from 2006-2011 and the Independent Directors Council Executive Committee from 2008-2011. Trustee of the Evergreen Fund complex (and its predecessors) from 1984 to 2010. Chairman of the Evergreen Funds from 2000-2010. Former Trustee of the Mentor Funds. Retired Attorney, Law Offices of Michael S. Scofield. | | Asset Allocation Trust |
Pamela Wheelock***** (Born 1959) | | Trustee, since 2018; Advisory Board Member, from 2017 to 2018 | | Chief Operating Officer, Twin Cities Habitat for Humanity, since January, 2017. Vice President of University Services, University of Minnesota from 2012 to 2017. Prior thereto, Interim President and Chief Executive Officer of Blue Cross Blue Shield of Minnesota from 2010 to 2011, Chairman of the Board from 2009 to 2011 and Board Director from 2003 to 2015. Vice President, Leadership and Community Engagement, Bush Foundation, Saint Paul, Minnesota (a private foundation) from 2009 to 2011. Executive Vice President and Chief Financial Officer, Minnesota Sports and Entertainment from 2004 to 2009 and Senior Vice President from 2002 to 2004. Commissioner of Finance, State of Minnesota, from 1999 to 2002. Currently on the Board of Directors, Governance Committee and Finance Committee, for the Minnesota Philanthropy Partners (Saint Paul Foundation) since 2012 and Board Chair of the Minnesota Wild Foundation since 2010. | | Asset Allocation Trust |
| * | Length of service dates reflect the Trustee’s commencement of service with the Trust’s predecessor entities, where applicable. |
| ** | Jane Freeman became Chair Liaison effective January 1, 2018. |
| *** | Olivia Mitchell became Chairman of the Governance Committee effective January 1, 2018. |
| **** | Timothy Penny became Chairman effective January 1, 2018. |
| ***** | James Polisson and Pamela Wheelock each became a Trustee effective January 1, 2018. |
| | | | | | |
| Other information (unaudited) | | Wells Fargo Intrinsic Small Cap Value Fund | | | 31 | |
Officers
| | | | | | |
Name and year of birth | | Position held and
length of service | | Principal occupations during past five years or longer | | |
Andrew Owen (Born 1960) | | President, since 2017 | | Executive Vice President of Wells Fargo & Company and Head of Affiliated Managers, Wells Fargo Asset Management, since 2014. In addition, Mr. Owen is currently President, Chief Executive Officer and Director of Wells Fargo Funds Management, LLC since 2017. Prior thereto, Executive Vice President responsible for marketing, investments and product development for Wells Fargo Funds Management, LLC, from 2009 to 2014. | | |
Nancy Wiser1 (Born 1967) | | Treasurer, since 2012 | | Executive Vice President of Wells Fargo Funds Management, LLC since 2011. Chief Operating Officer and Chief Compliance Officer at LightBox Capital Management LLC, from 2008 to 2011. | | |
Alexander Kymn* (Born 1973) | | Secretary, since 2018; Chief Legal Officer, since 2018 | | Senior Company Counsel of Wells Fargo Bank, N.A. since 2018 (previously Senior Counsel from 2007 to 2018). Vice President of Wells Fargo Funds Management, LLC from 2008 to 2014. | | |
C. David Messman** (Born 1960) | | Secretary, since 2000; Chief Legal Officer, since 2003 | | Senior Vice President and Secretary of Wells Fargo Funds Management, LLC since 2001. Assistant General Counsel of Wells Fargo Bank, N.A. since 2013 and Vice President and Managing Counsel of Wells Fargo Bank, N.A. from 1996 to 2013. | | |
Michael H. Whitaker (Born 1967) | | Chief Compliance Officer, since 2016 | | Senior Vice President and Chief Compliance Officer since 2016. Senior Vice President and Chief Compliance Officer for Fidelity Investments from 2007 to 2016. | | |
David Berardi (Born 1975) | | Assistant Treasurer, since 2009 | | Vice President of Wells Fargo Funds Management, LLC since 2009. Vice President of Evergreen Investment Management Company, LLC from 2008 to 2010. Manager of Fund Reporting and Control for Evergreen Investment Management Company, LLC from 2004 to 2010. | | |
Jeremy DePalma1 (Born 1974) | | Assistant Treasurer, since 2009 | | Senior Vice President of Wells Fargo Funds Management, LLC since 2009. Senior Vice President of Evergreen Investment Management Company, LLC from 2008 to 2010 and head of the Fund Reporting and Control Team within Fund Administration from 2005 to 2010. | | |
| 1 | Nancy Wiser acts as Treasurer of 77 funds in the Fund Complex. Jeremy DePalma acts as Treasurer of 76 funds and Assistant Treasurer of 77 funds in the Fund Complex. |
| 2 | The Statement of Additional Information includes additional information about the Trustees and is available, without charge, upon request, by calling 1-800-222-8222 or by visiting the website at wellsfargofunds.com. |
| * | Alexander Kymn became the Secretary and Chief Legal Officer effective April 17, 2018. |
| ** | David Messman was the Secretary and Chief Legal Officer until April 16, 2018. |
| | | | |
| 32 | | Wells Fargo Intrinsic Small Cap Value Fund | | List of abbreviations |
The following is a list of common abbreviations for terms and entities that may have appeared in this report.
| ACA | — ACA Financial Guaranty Corporation |
| ADR | — American depositary receipt |
| ADS | — American depositary shares |
| AGC | — Assured Guaranty Corporation |
| AGM | — Assured Guaranty Municipal |
| Ambac | — Ambac Financial Group Incorporated |
| AMT | — Alternative minimum tax |
| BAN | — Bond anticipation notes |
| BHAC | — Berkshire Hathaway Assurance Corporation |
| CAB | — Capital appreciation bond |
| CCAB | — Convertible capital appreciation bond |
| CDA | — Community Development Authority |
| CDO | — Collateralized debt obligation |
| CLO | — Collateralized loan obligation |
| DRIVER | — Derivative inverse tax-exempt receipts |
| DW&P | — Department of Water & Power |
| DWR | — Department of Water Resources |
| ECFA | — Educational & Cultural Facilities Authority |
| EDA | — Economic Development Authority |
| EDFA | — Economic Development Finance Authority |
| ETF | — Exchange-traded fund |
| FDIC | — Federal Deposit Insurance Corporation |
| FFCB | — Federal Farm Credit Banks |
| FGIC | — Financial Guaranty Insurance Corporation |
| FHA | — Federal Housing Administration |
| FHLB | — Federal Home Loan Bank |
| FHLMC | — Federal Home Loan Mortgage Corporation |
| FICO | — The Financing Corporation |
| FNMA | — Federal National Mortgage Association |
| GDR | — Global depositary receipt |
| GNMA | — Government National Mortgage Association |
| HCFR | — Healthcare facilities revenue |
| HEFA | — Health & Educational Facilities Authority |
| HEFAR | — Higher education facilities authority revenue |
| HFA | — Housing Finance Authority |
| HFFA | — Health Facilities Financing Authority |
| HUD | — Department of Housing and Urban Development |
| IDA | — Industrial Development Authority |
| IDAG | — Industrial Development Agency |
| KRW | — Republic of Korea won |
| LIBOR | — London Interbank Offered Rate |
| LIFER | — Long Inverse Floating Exempt Receipts |
| LLC | — Limited liability company |
| LLLP | — Limited liability limited partnership |
| LLP | — Limited liability partnership |
| MBIA | — Municipal Bond Insurance Association |
| MFHR | — Multifamily housing revenue |
| MSTR | — Municipal securities trust receipts |
| MUD | — Municipal Utility District |
| National | — National Public Finance Guarantee Corporation |
| PCFA | — Pollution Control Financing Authority |
| PCL | — Public Company Limited |
| PCR | — Pollution control revenue |
| PFA | — Public Finance Authority |
| PFFA | — Public Facilities Financing Authority |
| PFOTER | — Puttable floating option tax-exempt receipts |
| PJSC | — Public Joint Stock Company |
| plc | — Public limited company |
| PUTTER | — Puttable tax-exempt receipts |
| R&D | — Research & development |
| Radian | — Radian Asset Assurance |
| RAN | — Revenue anticipation notes |
| RDA | — Redevelopment Agency |
| RDFA | — Redevelopment Finance Authority |
| REIT | — Real estate investment trust |
| ROC | — Reset option certificates |
| SAVRS | — Select auction variable rate securities |
| SBA | — Small Business Authority |
| SDR | — Swedish depositary receipt |
| SFHR | — Single-family housing revenue |
| SFMR | — Single-family mortgage revenue |
| SIFMA | — Securities Industry and Financial Markets Association |
| SPA | — Standby purchase agreement |
| SPDR | — Standard & Poor’s Depositary Receipts |
| SPEAR | — Short Puttable Exempt Adjustable Receipts |
| STRIPS | — Separate trading of registered interest and |
| TAN | — Tax anticipation notes |
| TIPS | — Treasury inflation-protected securities |
| TRAN | — Tax revenue anticipation notes |
| TTFA | — Transportation Trust Fund Authority |
| TVA | — Tennessee Valley Authority |

For more information
More information about Wells Fargo Funds is available free upon request. To obtain literature, please write, email, visit the Fund’s website, or call:
Wells Fargo Funds
P.O. Box 8266
Boston, MA 02266-8266
Email: fundservice@wellsfargo.com
Website: wellsfargofunds.com
Individual investors: 1-800-222-8222
Retail investment professionals: 1-888-877-9275
Institutional investment professionals:
1-866-765-0778
This report and the financial statements contained herein are submitted for the general information of the shareholders of the Fund. If this report is used for promotional purposes, distribution of the report must be accompanied or preceded by a current prospectus. Before investing, please consider the investment objectives, risks, charges, and expenses of the investment. For a current prospectus and, if available, a summary prospectus, containing this information, call 1-800-222-8222 or visit the Fund’s website at wellsfargofunds.com. Read the prospectus carefully before you invest or send money.
Wells Fargo Asset Management (WFAM) is a trade name used by the asset management businesses of Wells Fargo & Company. Wells Fargo Funds Management, LLC, a wholly owned subsidiary of Wells Fargo & Company, provides investment advisory and administrative services for Wells Fargo Funds. Other affiliates of Wells Fargo & Company provide subadvisory and other services for the funds. The funds are distributed by Wells Fargo Funds Distributor, LLC, Member FINRA, an affiliate of Wells Fargo & Company. Neither Wells Fargo Funds Distributor nor Wells Fargo Funds Management holds fund shareholder accounts or assets. This material is for general informational and educational purposes only and is NOT intended to provide investment advice or a recommendation of any kind—including a recommendation for any specific investment, strategy, or plan.
NOT FDIC INSURED ◾ NO BANK GUARANTEE ◾ MAY LOSE VALUE
© 2018 Wells Fargo Funds Management, LLC. All rights reserved.
| | |
 | | 309981 05-18 A242/AR242 03-18 |
Annual Report
March 31, 2018

Wells Fargo Small Cap Core Fund


Reduce clutter. Save trees.
Sign up for electronic delivery of prospectuses and shareholder reports at wellsfargo.com/advantagedelivery
Contents
The views expressed and any forward-looking statements are as of March 31, 2018, unless otherwise noted, and are those of the Fund managers and/or Wells Fargo Funds Management, LLC. Discussions of individual securities, or the markets generally, or any Wells Fargo Fund are not intended as individual recommendations. Future events or results may vary significantly from those expressed in any forward-looking statements. The views expressed are subject to change at any time in response to changing circumstances in the market. Wells Fargo Funds Management, LLC and the Fund disclaim any obligation to publicly update or revise any views expressed or forward-looking statements.
NOT FDIC INSURED ◾ NO BANK GUARANTEE ◾ MAY LOSE VALUE
| | | | |
| 2 | | Wells Fargo Small Cap Core Fund | | Letter to shareholders (unaudited) |

Andrew Owen
President
Wells Fargo Funds
Dear Shareholder:
We are pleased to offer you this annual report for the Wells Fargo Small Cap Core Fund for the 12-month period that ended March 31, 2018. During the last three quarters of 2017, investors enjoyed consistently rising equity values globally. Short-term interest rates tended to increase, while long-term rates remained flat to lower. During the final two months of the first quarter of 2018, equity market volatility returned, stocks reversed year-to-date gains, and bond yields rose while prices fell.
For the period, U.S. stocks, as measured by the S&P 500 Index,1 gained 13.99% and international stocks, as measured by the MSCI ACWI ex USA Index (Net),2 added 16.53%. Emerging market stocks, as measured by the MSCI EM Index (Net),3 added 24.93%. In bond markets, the Bloomberg Barclays U.S. Aggregate Bond Index4 added 1.20% and the Bloomberg Barclays Municipal Bond Index5 added 2.66% while fixed-income investments outside the U.S. gained 11.75%, according to the Bloomberg Barclays Global Aggregate ex-USD Index.6 The ICE BofAML U.S. High Yield Index7 earned 3.69%.
Through the last nine months of 2017, stocks advanced on synchronized global growth, which led to higher investor and consumer confidence. The first quarter of 2018 began with strong stock market gains in January. A strong January 2018 U.S. employment report and inflation concerns prompted equity volatility in February. Investor optimism for growth was supplanted with concerns over trade tensions, increased interest rates, and the prospect of new data privacy regulations.
Reactions to U.S. interest rate increases were uneven across the yield curve and globally.
The U.S. Federal Reserve (Fed) increased the federal funds rate three times during the 12-month period for a combined 75 basis points (bps; 100 bps equals 1.00%). Following an increase in March 2017, short-term bond yields in the U.S. rose while longer-term Treasury yields were little changed. Municipal bond returns were positive, helped by strong demand and constrained new-issue supply. The Fed raised the target interest rate once again in June 2017 to a range of 1.00% to 1.25%. Ten-year U.S. Treasury yields declined, the yield curve flattened, and long-term bond prices benefited.
| 1 | The S&P 500 Index consists of 500 stocks chosen for market size, liquidity, and industry group representation. It is a market-value-weighted index with each stock’s weight in the index proportionate to its market value. You cannot invest directly in an index. |
| 2 | The Morgan Stanley Capital International (MSCI) All Country World Index (ACWI) ex USA Index (Net) is a free-float-adjusted market-capitalization-weighted index that is designed to measure the equity market performance of developed markets, excluding the United States and Canada. Source: MSCI. MSCI makes no express or implied warranties or representations and shall have no liability whatsoever with respect to any MSCI data contained herein. The MSCI data may not be further redistributed or used as a basis for other indices or any securities or financial products. This report is not approved, reviewed, or produced by MSCI. You cannot invest directly in an index. |
| 3 | The MSCI Emerging Markets (EM) Index (Net) is a free-float-adjusted market-capitalization-weighted index that is designed to measure large- and mid-cap equity market performance of emerging markets. The MSCI EM Index (Net) consists of the following 24 emerging market country indices: Brazil, Chile, China, Colombia, Czech Republic, Egypt, Greece, Hungary, India, Indonesia, Korea, Malaysia, Mexico, Pakistan, Peru, the Philippines, Poland, Qatar, Russia, South Africa, Taiwan, Thailand, Turkey, and the United Arab Emirates. You cannot invest directly in an index. |
| 4 | The Bloomberg Barclays U.S. Aggregate Bond Index is a broad-based benchmark that measures the investment-grade, U.S. dollar-denominated, fixed-rate taxable bond market, including Treasuries, government-related and corporate securities, mortgage-backed securities (agency fixed-rate and hybrid adjustable-rate mortgage pass-throughs), asset-backed securities, and commercial mortgage-backed securities. You cannot invest directly in an index. |
| 5 | The Bloomberg Barclays Municipal Bond Index is an unmanaged index composed of long-term tax-exempt bonds with a minimum credit rating of Baa. You cannot invest directly in an index. |
| 6 | The Bloomberg Barclays Global Aggregate ex-USD Index is an unmanaged index that provides a broad-based measure of the global investment-grade fixed-income markets excluding the U.S. dollar-denominated debt market. You cannot invest directly in an index. |
| 7 | The ICE BofAML U.S. High Yield Index is a market-capitalization-weighted index of domestic and Yankee high-yield bonds. The index tracks the performance of high-yield securities traded in the U.S. bond market. You cannot invest directly in an index. Copyright 2018. ICE Data Indices, LLC. All rights reserved. |
| | | | | | |
| Letter to shareholders (unaudited) | | Wells Fargo Small Cap Core Fund | | | 3 | |
Internationally, central banks maintained low interest rates and accommodative monetary policies that supported business activity and stock values in foreign markets. A weaker U.S. dollar was generally supportive of business activity in regions around the globe. The Bank of Japan continued its accommodative monetary policies, and industrial production, retail sales, and fixed asset investment increased in China.
Growth continued through the summer of 2017.
Globally, stocks moved higher during the third quarter of 2017. Low inflation and interest rates supported accelerating global economic growth and corporate earnings. Brief episodes of geopolitical tensions, often associated with North Korea’s advancing nuclear missile program, flaring conflicts in the Middle East, and uncertainty surrounding U.S. trade policies, did not discourage investing activity.
In the U.S., economic data released during the quarter reflected a generally healthy economy. Second-quarter economic output grew at a 3.1% annual rate. Stocks in international developed and emerging markets continued to benefit from improving economic growth.
Positive economic and market news continued as 2017 closed and 2018 began.
During the fourth quarter of 2017, stock markets continued the move higher. Third-quarter economic output in the U.S. grew at a 3.2% annual rate. The unemployment rate fell to a 17-year low of 4.1%. Tax reform passed and wage growth data improved, encouraging increased business and consumer spending.
Fed officials announced in October 2017 plans to begin unwinding its $4.5 trillion portfolio of bonds and other assets accumulated during rounds of quantitative easing conducted since the 2008–2009 recession. Still, restrained inflation kept long-term bond rates steady and the flattened yield curve persisted. The Fed raised the federal funds rate target to a range of 1.25% to 1.50% in December 2017 and began selling bonds held in its portfolio.
2018 opened with continued stock advances, then volatility.
Improving business and economic data globally continued to support stocks through January 2018. Political wrangling in the U.S. over budget resolutions could not dissuade investors from buying stocks as payrolls and factory orders increased. Long-term interest rates in the U.S. trended higher as the yield curve steepened—the 10-year Treasury rate moved from 2.46% to 2.84% and the 30-year rate moved from 2.81% to 3.08% during January 2018.
Investor sentiment shifted in February as inflation concerns emerged in the U.S. when readings from the Producer Price Index in January rose 2.5% year over year. During February, the U.S. market endured a loss from January’s high of nearly 12% before recovering much of that loss. The Fed raised the federal funds rate in March 2018. Bond yields rose across the yield curve.
During January 2018, purchasing managers’ indices in China, the eurozone, India, and Japan reported data for December that indicated continued growth. Despite positive economic signals and business fundamentals, international stock values fell during February and March 2018, swept up in the selling momentum in U.S. markets.
Globally, stocks moved higher during the third quarter of 2017.
During February, the U.S. market endured a loss from January’s high of nearly 12% before recovering much of that loss.
| | | | |
| 4 | | Wells Fargo Small Cap Core Fund | | Letter to shareholders (unaudited) |
Don’t let short-term uncertainty derail long-term investment goals.
Periods of investment uncertainty can present challenges, but experience has taught us that maintaining long-term investment goals can be an effective way to plan for the future. To help you create a sound strategy based on your personal goals and risk tolerance, Wells Fargo Funds offers more than 100 mutual funds spanning a wide range of asset classes and investment styles. Although diversification cannot guarantee an investment profit or prevent losses, we believe it can be an effective way to manage investment risk and potentially smooth out overall portfolio performance. We encourage investors to know their investments and to understand that appropriate levels of risk-taking may unlock opportunities.
Thank you for choosing to invest with Wells Fargo Funds. We appreciate your confidence in us and remain committed to helping you meet your financial needs.
Sincerely,

Andrew Owen
President
Wells Fargo Funds
For further information about your Fund, contact your investment professional, visit our website at wellsfargofunds.com, or call us directly at 1-800-222-8222.
This page is intentionally left blank.
| | | | |
| 6 | | Wells Fargo Small Cap Core Fund | | Performance highlights (unaudited) |
Investment objective
The Fund seeks long-term capital appreciation.
Manager
Wells Fargo Funds Management, LLC
Subadviser
Wells Capital Management Incorporated
Portfolio managers
John R. Campbell, CFA®
Justin P. Carr, CFA®
Greg W. Golden, CFA®
Average annual total returns (%) as of March 31, 20181
| | | | | | | | | | | | | | | | | | | | | | | | | | | | | | | | | | |
| | | | | Including sales charge | | | Excluding sales charge | | | Expense ratios2 (%) | |
| | | Inception date | | 1 year | | | 5 year | | | 10 year | | | 1 year | | | 5 year | | | 10 year | | | Gross | | | Net3 | |
| Class A (WOSCX) | | 5-20-2016 | | | (8.76 | ) | | | 7.68 | | | | 6.04 | | | | (3.20 | )* | | | 8.97 | | | | 6.67 | | | | 1.49 | | | | 1.35 | |
| Class C (WCSCX) | | 5-20-2016 | | | (4.90 | ) | | | 8.16 | | | | 5.88 | | | | (3.93 | ) | | | 8.16 | | | | 5.88 | | | | 2.24 | | | | 2.10 | |
| Class R6 (WRSCX) | | 5-20-2016 | | | – | | | | – | | | | – | | | | (2.76 | )* | | | 9.39 | | | | 7.06 | | | | 1.06 | | | | 0.90 | |
| Administrator Class (WNSCX) | | 5-20-2016 | | | – | | | | – | | | | – | | | | (3.15 | )* | | | 9.08 | | | | 6.77 | | | | 1.41 | | | | 1.25 | |
| Institutional Class (WYSCX) | | 9-13-2005 | | | – | | | | – | | | | – | | | | (2.81 | ) | | | 9.37 | | | | 7.05 | | | | 1.16 | | | | 1.00 | |
| Russell 2000® Index4 | | – | | | – | | | | – | | | | – | | | | 11.79 | | | | 11.47 | | | | 9.84 | | | | – | | | | – | |
| * | | Total return differs from the return in the Financial Highlights in this report. The total return presented is calculated based on the NAV at which the shareholder transactions were processed. The NAV and total return presented in the Financial Highlights reflects certain adjustments made to the net assets of the Fund that are necessary under U.S. generally accepted accounting principles. |
Figures quoted represent past performance, which is no guarantee of future results, and do not reflect taxes that a shareholder may pay on fund distributions or the redemption of fund shares. Investment return and principal value of an investment will fluctuate so that an investor’s shares, when redeemed, may be worth more or less than their original cost. Performance shown without sales charges would be lower if sales charges were reflected. Current performance may be lower or higher than the performance data quoted, which assumes the reinvestment of dividends and capital gains. Current month-end performance is available on the Fund’s website, wellsfargofunds.com.
Index returns do not include transaction costs associated with buying and selling securities, any mutual fund fees or expenses, or any taxes. It is not possible to invest directly in an index.
For Class A shares, the maximum front-end sales charge is 5.75%. For Class C shares, the maximum contingent deferred sales charge is 1.00%. Performance including a contingent deferred sales charge assumes the sales charge for the corresponding time period. Class R6, Administrator Class, and Institutional Class shares are sold without a front-end sales charge or contingent deferred sales charge.
Stock values fluctuate in response to the activities of individual companies and general market and economic conditions. Certain investment strategies tend to increase the total risk of an investment (relative to the broader market). The Fund is exposed to foreign investment risk and smaller-company securities risk. Consult the Fund’s prospectus for additional information on these and other risks.
Please see footnotes on page 7.
| | | | | | |
| Performance highlights (unaudited) | | Wells Fargo Small Cap Core Fund | | | 7 | |
|
| Growth of $10,000 investment as of March 31, 20185 |
|
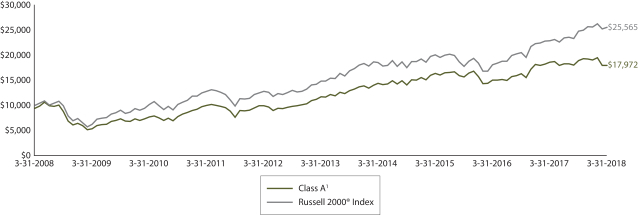 |
| 1 | Historical performance shown for the Class A, Class C, and Administrator Class shares prior to their inception reflects the performance of the Institutional Class shares, and are adjusted to reflect Class A, Class C, and Administrator shares expenses, respectively. Historical performance shown for the Class R6 shares prior to their inception reflects the performance of the Institutional Class shares, and has not been adjusted to reflect the expenses of the Class R6 shares. If these expenses had been included, returns for Class R6 shares would be higher. Historical performance shown for all classes of the Fund prior to May 20, 2016 is based on the performance of the Fund’s predecessor, Golden Small Cap Core Fund. |
| 2 | Reflects the expense ratios as stated in the most recent prospectuses. The expense ratios shown are subject to change and may differ from the annualized expense ratios shown in the financial highlights of this report. |
| 3 | The manager has contractually committed through July 31, 2019, to waive fees and/or reimburse expenses to the extent necessary to cap the Fund’s Total Annual Fund Operating Expenses After Fee Waivers at the amounts shown. After this time, the cap may be increased or the commitment to maintain the cap may be terminated only with the approval of the Board of Trustees. Brokerage commissions, stamp duty fees, interest, taxes, acquired fund fees and expenses (if any), and extraordinary expenses are excluded from the expense cap. Without this cap, the Fund’s returns would have been lower. The expense ratio paid by an investor is the net expense ratio (the total annual fund operating expenses after fee waivers) as stated in the prospectuses. |
| 4 | The Russell 2000® Index measures the performance of the 2,000 smallest companies in the Russell 3000® Index, which represents approximately 8% of the total market capitalization of the Russell 3000® Index. You cannot invest directly in an index. |
| 5 | The chart compares the performance of Class A shares for the most recent ten years with the Russell 2000® Index. The chart assumes a hypothetical investment of $10,000 in Class A shares and reflects all operating expenses and assumes the maximum initial sales charge of 5.75%. |
| 6 | The ten largest holdings, excluding cash and cash equivalents, are calculated based on the value of the investments divided by total net assets of the Fund. Holdings are subject to change and may have changed since the date specified. |
| 7 | Amounts are calculated based on the total long-term investments of the Fund. These amounts are subject to change and may have changed since the date specified. |
| | | | |
| 8 | | Wells Fargo Small Cap Core Fund | | Performance highlights (unaudited) |
MANAGER’S DISCUSSION
Fund highlights
| ∎ | | The Fund underperformed its benchmark, the Russell 2000® Index, for the 12-month period that ended March 31, 2018. |
| ∎ | | Stock selection was a detractor in 9 of the 10 sectors in which the Fund held investments, with the weakest results in information technology (IT), health care, consumer discretionary, and industrials. Stock selection added value in the materials sector. |
| ∎ | | Sector exposures contributed positively to the Fund’s relative performance. An overweight to health care and an underweight to real estate were the most beneficial. An overweight to IT and a modest cash position were the top detracting allocations. |
| ∎ | | The Fund was positioned with overweight exposures to health care, industrials, and IT. It had underweight exposures to real estate, financials, and energy. Other sector exposures were within 1% of the benchmark. |
| | | | |
| Ten largest holdings (%) as of March 31, 20186 | |
Magellan Health Services Incorporated | | | 2.26 | |
ICU Medical Incorporated | | | 2.23 | |
The Greenbrier Companies Incorporated | | | 2.20 | |
EMCOR Group Incorporated | | | 2.13 | |
Insperity Incorporated | | | 2.09 | |
Ruth’s Chris Steak House Incorporated | | | 2.04 | |
Encompass Health Corporation | | | 2.03 | |
Applied Industrial Technologies Incorporated | | | 2.01 | |
FCB Financial Holdings Class A | | | 2.00 | |
Brooks Automation Incorporated | | | 2.00 | |
Selected stocks detracted from relative performance
Stock selection led to the Fund’s underperformance. The top detractors were Nutrisystem, Incorporated; Westmoreland Coal Company; and Sanmina Corporation. Nutrisystem is a leading provider of weight-management products and services, including the Nutrisystem and South Beach Diet brands. Its shares declined after the company reported disappointing fourth-quarter 2017 earnings per share (EPS). Management noted a slower-than-expected start to diet season results, which it attributed to a poor response to the company’s marketing campaign. Management issued guidance for fiscal-year 2018 earnings with the midpoint of the guided EPS range nearly 13% below the consensus estimate. This was viewed as a temporary and fixable setback, and management said it expected a return to meaningful growth in 2019.
Westmoreland Coal was added and removed as a Fund holding in 2017. In addition to its attractiveness from our model’s perspective, we anticipated reduced regulatory pressures and a push for energy development to provide a healthy environment for coal companies. Those expectations did not materialize. Westmoreland’s operating earnings for second-quarter 2017 failed to meet analysts’ estimates, and it lowered guidance for fiscal 2017 results. Management cited an unfavorable sales mix and higher costs as factors that weighed on performance.
Sanmina is a leading producer of optical, electronic, and mechanical products. The company reported disappointing financial results in the second half of calendar-year 2017, and management cited slower-than-expected new program ramps and an unfavorable program mix. We sold our position in January 2018.
There were some notable positive contributors, including ICU Medical, Incorporated; Insperity, Incorporated; and Supernus Pharmaceuticals, Incorporated.
Our investment process seeks to identify attractively valued companies likely to exceed earnings expectations.
Our investment process, which we refer to as an active-quant approach, combines quantitative and qualitative evaluations of each company being considered. Our quantitative evaluation looks at valuation, earnings, and momentum-related factors to produce an objective, unbiased review of each company in the investment universe and its ranking compared with other companies being considered. A company’s ranking is the primary basis for our buy and sell decisions. We also place a high value on qualitative analysis; our investment professionals evaluate each company in light of overall market conditions and the company’s potential impact on the Fund from a risk/reward perspective. We have developed measurement tools and have tailored our investment process in support of two key tenets of our investment philosophy: Companies purchased should be available at a reasonable price, and they should be profitable and capable of increasing revenues and earnings.
Please see footnotes on page 7.
| | | | | | |
| Performance highlights (unaudited) | | Wells Fargo Small Cap Core Fund | | | 9 | |
We believe our process will continue to uncover potentially attractive investment opportunities.
In 2017 and the first quarter of 2018, investors favored companies producing strong earnings growth and did not seem to be deterred by the elevated valuations of many of these companies. While we expect earnings growth to be the primary market driver in coming quarters, we think it is unlikely the market’s price/earnings multiple will expand much given elevated valuation levels and rising interest rates. We believe a renewed focus on valuations will benefit our investment strategy.
Inflation and the interest rate environment are likely to be a focus for investors in 2018. We expect the Federal Open Market Committee’s measured path of monetary policy normalization to continue under the committee’s new chairman, Jerome Powell. While we see inflation trending higher, we do not anticipate a sharp increase over the course of 2018.
Trade policies, including tariffs, ought to be monitored; however, a relatively weak U.S. dollar and a strong global backdrop should support exports. Domestic demand could benefit from fiscal stimulus.
Though we are mindful of how political and macroeconomic environments evolve, including their impact on expectations for corporate earnings and investors’ risk appetites, we will maintain focus on company fundamentals.
|
| Sector distribution as of March 31, 20187 |
|
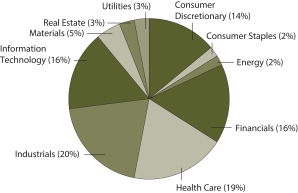
|
Please see footnotes on page 7.
| | | | |
| 10 | | Wells Fargo Small Cap Core Fund | | Fund expenses (unaudited) |
As a shareholder of the Fund, you incur two types of costs: (1) transaction costs, including sales charges (loads) on purchase payments and contingent deferred sales charges (if any) on redemptions and (2) ongoing costs, including management fees, distribution (12b-1) and/or shareholder servicing fees, and other Fund expenses. This example is intended to help you understand your ongoing costs (in dollars) of investing in the Fund and to compare these costs with the ongoing costs of investing in other mutual funds.
The example is based on an investment of $1,000 invested at the beginning of the six-month period and held for the entire period from October 1, 2017 to March 31, 2018.
Actual expenses
The “Actual” line of the table below provides information about actual account values and actual expenses. You may use the information in this line, together with the amount you invested, to estimate the expenses that you paid over the period. Simply divide your account value by $1,000 (for example, an $8,600 account value divided by $1,000 = 8.6), then multiply the result by the number in the “Actual” line under the heading entitled “Expenses paid during period” for your applicable class of shares to estimate the expenses you paid on your account during this period.
Hypothetical example for comparison purposes
The “Hypothetical” line of the table below provides information about hypothetical account values and hypothetical expenses based on the Fund’s actual expense ratio and an assumed rate of return of 5% per year before expenses, which is not the Fund’s actual return. The hypothetical account values and expenses may not be used to estimate the actual ending account balance or expenses you paid for the period. You may use this information to compare the ongoing costs of investing in the Fund and other funds. To do so, compare this 5% hypothetical example with the 5% hypothetical examples that appear in the shareholder reports of the other funds.
Please note that the expenses shown in the table are meant to highlight your ongoing costs only and do not reflect any transactional costs, such as sales charges (loads) and contingent deferred sales charges. Therefore, the “Hypothetical” line of the table is useful in comparing ongoing costs only and will not help you determine the relative total costs of owning different funds. In addition, if these transactional costs were included, your costs would have been higher.
| | | | | | | | | | | | | | | | |
| | | Beginning
account value
10-1-2017 | | | Ending
account value
3-31-2018 | | | Expenses
paid during
the period¹ | | | Annualized net
expense ratio | |
Class A | | | | | | | | | | | | | | | | |
Actual | | $ | 1,000.00 | | | $ | 948.10 | | | $ | 6.56 | | | | 1.35 | % |
Hypothetical (5% return before expenses) | | $ | 1,000.00 | | | $ | 1,018.20 | | | $ | 6.79 | | | | 1.35 | % |
Class C | | | | | | | | | | | | | | | | |
Actual | | $ | 1,000.00 | | | $ | 944.30 | | | $ | 10.18 | | | | 2.10 | % |
Hypothetical (5% return before expenses) | | $ | 1,000.00 | | | $ | 1,014.46 | | | $ | 10.55 | | | | 2.10 | % |
Class R6 | | | | | | | | | | | | | | | | |
Actual | | $ | 1,000.00 | | | $ | 950.00 | | | $ | 4.38 | | | | 0.90 | % |
Hypothetical (5% return before expenses) | | $ | 1,000.00 | | | $ | 1,020.44 | | | $ | 4.54 | | | | 0.90 | % |
Administrator Class | | | | | | | | | | | | | | | | |
Actual | | $ | 1,000.00 | | | $ | 948.50 | | | $ | 6.07 | | | | 1.25 | % |
Hypothetical (5% return before expenses) | | $ | 1,000.00 | | | $ | 1,018.70 | | | $ | 6.29 | | | | 1.25 | % |
Institutional Class | | | | | | | | | | | | | | | | |
Actual | | $ | 1,000.00 | | | $ | 950.00 | | | $ | 4.86 | | | | 1.00 | % |
Hypothetical (5% return before expenses) | | $ | 1,000.00 | | | $ | 1,019.95 | | | $ | 5.04 | | | | 1.00 | % |
| 1 | Expenses paid is equal to the annualized net expense ratio of each class multiplied by the average account value over the period, multiplied by the number of days in the most recent fiscal half-year divided by the number of days in the fiscal year (to reflect the one-half-year period). |
| | | | | | |
| Portfolio of investments—March 31, 2018 | | Wells Fargo Small Cap Core Fund | | | 11 | |
| | | | | | | | | | | | | | | | |
| Security name | | | | | | | | Shares | | | Value | |
| | | | |
Common Stocks: 99.61% | | | | | | | | | | | | | | | | |
| | | | |
Consumer Discretionary: 13.88% | | | | | | | | | | | | | | | | |
| | | | |
| Auto Components: 4.62% | | | | | | | | | | | | | | | | |
LCI Industries | | | | | | | | | | | 10,301 | | | $ | 1,072,849 | |
Tenneco Incorporated | | | | | | | | | | | 21,340 | | | | 1,170,926 | |
Tower International Incorporated | | | | | | | | | | | 31,440 | | | | 872,460 | |
| | | | |
| | | | | | | | | | | | | | | 3,116,235 | |
| | | | | | | | | | | | | | | | |
| | | | |
| Automobiles: 1.31% | | | | | | | | | | | | | | | | |
Winnebago Industries Incorporated | | | | | | | | | | | 23,480 | | | | 882,848 | |
| | | | | | | | | | | | | | | | |
| | | | |
| Hotels, Restaurants & Leisure: 2.04% | | | | | | | | | | | | | | | | |
Ruth’s Chris Steak House Incorporated | | | | | | | | | | | 56,204 | | | | 1,374,188 | |
| | | | | | | | | | | | | | | | |
| | | | |
| Internet & Direct Marketing Retail: 1.08% | | | | | | | | | | | | | | | | |
Nutrisystem Incorporated | | | | | | | | | | | 27,125 | | | | 731,019 | |
| | | | | | | | | | | | | | | | |
| | | | |
| Multiline Retail: 1.50% | | | | | | | | | | | | | | | | |
Big Lots Stores Incorporated « | | | | | | | | | | | 23,292 | | | | 1,013,901 | |
| | | | | | | | | | | | | | | | |
| | | | |
| Specialty Retail: 1.90% | | | | | | | | | | | | | | | | |
Children’s Place Retail Stores Incorporated | | | | | | | | | | | 9,503 | | | | 1,285,281 | |
| | | | | | | | | | | | | | | | |
| | | | |
| Textiles, Apparel & Luxury Goods: 1.43% | | | | | | | | | | | | | | | | |
Skechers U.S.A. Incorporated Class A † | | | | | | | | | | | 24,834 | | | | 965,794 | |
| | | | | | | | | | | | | | | | |
| | | | |
Consumer Staples: 1.70% | | | | | | | | | | | | | | | | |
| | | | |
| Food Products: 1.70% | | | | | | | | | | | | | | | | |
Sanderson Farms Incorporated | | | | | | | | | | | 9,622 | | | | 1,145,210 | |
| | | | | | | | | | | | | | | | |
| | | | |
Energy: 1.73% | | | | | | | | | | | | | | | | |
| | | | |
| Energy Equipment & Services: 1.73% | | | | | | | | | | | | | | | | |
C&J Energy Services Incorporated † | | | | | | | | | | | 45,289 | | | | 1,169,362 | |
| | | | | | | | | | | | | | | | |
| | | | |
Financials: 16.18% | | | | | | | | | | | | | | | | |
| | | | |
| Banks: 3.85% | | | | | | | | | | | | | | | | |
FCB Financial Holdings Class A † | | | | | | | | | | | 26,474 | | | | 1,352,821 | |
First Merchants Corporation | | | | | | | | | | | 29,908 | | | | 1,247,164 | |
| | | | |
| | | | | | | | | | | | | | | 2,599,985 | |
| | | | | | | | | | | | | | | | |
| | | | |
| Capital Markets: 5.75% | | | | | | | | | | | | | | | | |
Brightsphere Investment Group Incorporated | | | | | | | | | | | 80,163 | | | | 1,263,369 | |
Evercore Partners Incorporated Class A | | | | | | | | | | | 15,084 | | | | 1,315,325 | |
Houlihan Lokey Incorporated | | | | | | | | | | | 29,221 | | | | 1,303,257 | |
| | | | |
| | | | | | | | | | | | | | | 3,881,951 | |
| | | | | | | | | | | | | | | | |
The accompanying notes are an integral part of these financial statements.
| | | | |
| 12 | | Wells Fargo Small Cap Core Fund | | Portfolio of investments—March 31, 2018 |
| | | | | | | | | | | | | | | | |
| Security name | | | | | | | | Shares | | | Value | |
| | | | |
| Insurance: 6.58% | | | | | | | | | | | | | | | | |
Heritage Insurance Holdings Incorporated « | | | | | | | | | | | 69,759 | | | $ | 1,057,546 | |
National General Holdings Corporation | | | | | | | | | | | 52,166 | | | | 1,268,155 | |
Third Point Reinsurance Limited † | | | | | | | | | | | 69,492 | | | | 969,413 | |
Universal Insurance Holdings Company | | | | | | | | | | | 35,982 | | | | 1,147,826 | |
| | | | |
| | | | | | | | | | | | | | | 4,442,940 | |
| | | | | | | | | | | | | | | | |
| | | | |
Health Care: 19.18% | | | | | | | | | | | | | | | | |
| | | | |
| Biotechnology: 1.11% | | | | | | | | | | | | | | | | |
MiMedx Group Incorporated Ǡ | | | | | | | | | | | 107,305 | | | | 747,916 | |
| | | | | | | | | | | | | | | | |
| | | | |
| Health Care Equipment & Supplies: 5.57% | | | | | | | | | | | | | | | | |
ICU Medical Incorporated † | | | | | | | | | | | 5,958 | | | | 1,503,799 | |
OraSure Technologies Incorporated † | | | | | | | | | | | 64,607 | | | | 1,091,212 | |
Orthofix International NV † | | | | | | | | | | | 19,809 | | | | 1,164,373 | |
| | | | |
| | | | | | | | | | | | | | | 3,759,384 | |
| | | | | | | | | | | | | | | | |
| | | | |
| Health Care Providers & Services: 5.97% | | | | | | | | | | | | | | | | |
Encompass Health Corporation | | | | | | | | | | | 23,931 | | | | 1,368,135 | |
Magellan Health Services Incorporated † | | | | | | | | | | | 14,276 | | | | 1,528,960 | |
Tivity Health Incorporated † | | | | | | | | | | | 28,533 | | | | 1,131,333 | |
| | | | |
| | | | | | | | | | | | | | | 4,028,428 | |
| | | | | | | | | | | | | | | | |
| | | | |
| Life Sciences Tools & Services: 1.36% | | | | | | | | | | | | | | | | |
Syneos Health Incorporated † | | | | | | | | | | | 25,967 | | | | 921,829 | |
| | | | | | | | | | | | | | | | |
| | | | |
| Pharmaceuticals: 5.17% | | | | | | | | | | | | | | | | |
Catalent Incorporated † | | | | | | | | | | | 27,097 | | | | 1,112,603 | |
Corcept Therapeutics Incorporated Ǡ | | | | | | | | | | | 62,841 | | | | 1,033,734 | |
Supernus Pharmaceuticals Incorporated † | | | | | | | | | | | 29,417 | | | | 1,347,299 | |
| | | | |
| | | | | | | | | | | | | | | 3,493,636 | |
| | | | | | | | | | | | | | | | |
| | | | |
Industrials: 20.09% | | | | | | | | | | | | | | | | |
| | | | |
| Commercial Services & Supplies: 4.98% | | | | | | | | | | | | | | | | |
ACCO Brands Corporation | | | | | | | | | | | 87,171 | | | | 1,093,996 | |
SP Plus Corporation † | | | | | | | | | | | 30,174 | | | | 1,074,194 | |
UniFirst Corporation | | | | | | | | | | | 7,397 | | | | 1,195,725 | |
| | | | |
| | | | | | | | | | | | | | | 3,363,915 | |
| | | | | | | | | | | | | | | | |
| | | | |
| Construction & Engineering: 4.93% | | | | | | | | | | | | | | | | |
Argan Incorporated | | | | | | | | | | | 19,137 | | | | 821,934 | |
EMCOR Group Incorporated | | | | | | | | | | | 18,442 | | | | 1,437,185 | |
MasTec Incorporated † | | | | | | | | | | | 22,749 | | | | 1,070,340 | |
| | | | |
| | | | | | | | | | | | | | | 3,329,459 | |
| | | | | | | | | | | | | | | | |
| | | | |
| Machinery: 3.76% | | | | | | | | | | | | | | | | |
EnPro Industries Incorporated | | | | | | | | | | | 13,577 | | | | 1,050,588 | |
The Greenbrier Companies Incorporated « | | | | | | | | | | | 29,607 | | | | 1,487,752 | |
| | | | |
| | | | | | | | | | | | | | | 2,538,340 | |
| | | | | | | | | | | | | | | | |
The accompanying notes are an integral part of these financial statements.
| | | | | | |
| Portfolio of investments—March 31, 2018 | | Wells Fargo Small Cap Core Fund | | | 13 | |
| | | | | | | | | | | | | | | | |
| Security name | | | | | | | | Shares | | | Value | |
| | | | |
| Professional Services: 2.95% | | | | | | | | | | | | | | | | |
Insperity Incorporated | | | | | | | | | | | 20,319 | | | $ | 1,413,186 | |
RPX Corporation | | | | | | | | | | | 53,931 | | | | 576,522 | |
| | | | |
| | | | | | | | | | | | | | | 1,989,708 | |
| | | | | | | | | | | | | | | | |
| | | | |
| Trading Companies & Distributors: 3.47% | | | | | | | | | | | | | | | | |
Applied Industrial Technologies Incorporated | | | | | | | | | | | 18,576 | | | | 1,354,190 | |
Rush Enterprises Incorporated † | | | | | | | | | | | 23,338 | | | | 991,632 | |
| | | | |
| | | | | | | | | | | | | | | 2,345,822 | |
| | | | | | | | | | | | | | | | |
| | | | |
Information Technology: 16.17% | | | | | | | | | | | | | | | | |
| | | | |
| Electronic Equipment, Instruments & Components: 4.60% | | | | | | | | | | | | | | | | |
Kemet Corporation † | | | | | | | | | | | 55,535 | | | | 1,006,850 | |
Methode Electronics Incorporated | | | | | | | | | | | 24,479 | | | | 957,129 | |
Synnex Corporation | | | | | | | | | | | 9,610 | | | | 1,137,824 | |
| | | | |
| | | | | | | | | | | | | | | 3,101,803 | |
| | | | | | | | | | | | | | | | |
| | | | |
| Internet Software & Services: 1.49% | | | | | | | | | | | | | | | | |
Appfolio Incorporated Class A † | | | | | | | | | | | 24,651 | | | | 1,006,993 | |
| | | | | | | | | | | | | | | | |
| | | | |
| IT Services: 3.68% | | | | | | | | | | | | | | | | |
Hackett Group Incorporated | | | | | | | | | | | 72,479 | | | | 1,164,013 | |
ManTech International Corporation Class A | | | | | | | | | | | 23,841 | | | | 1,322,460 | |
| | | | |
| | | | | | | | | | | | | | | 2,486,473 | |
| | | | | | | | | | | | | | | | |
| | | | |
| Semiconductors & Semiconductor Equipment: 6.40% | | | | | | | | | | | | | | | | |
Advanced Energy Industries Incorporated † | | | | | | | | | | | 16,533 | | | | 1,056,459 | |
Brooks Automation Incorporated | | | | | | | | | | | 49,820 | | | | 1,349,126 | |
Cirrus Logic Incorporated † | | | | | | | | | | | 22,128 | | | | 899,061 | |
Ultra Clean Holdings Incorporated † | | | | | | | | | | | 52,879 | | | | 1,017,921 | |
| | | | |
| | | | | | | | | | | | | | | 4,322,567 | |
| | | | | | | | | | | | | | | | |
| | | | |
Materials: 5.10% | | | | | | | | | | | | | | | | |
| | | | |
| Chemicals: 1.91% | | | | | | | | | | | | | | | | |
Trinseo SA | | | | | | | | | | | 17,451 | | | | 1,292,247 | |
| | | | | | | | | | | | | | | | |
| | | | |
| Metals & Mining: 3.19% | | | | | | | | | | | | | | | | |
Materion Corporation | | | | | | | | | | | 22,130 | | | | 1,129,737 | |
Suncoke Energy Incorporated † | | | | | | | | | | | 95,035 | | | | 1,022,577 | |
| | | | |
| | | | | | | | | | | | | | | 2,152,314 | |
| | | | | | | | | | | | | | | | |
| | | | |
Real Estate: 2.87% | | | | | | | | | | | | | | | | |
| | | | |
| Equity REITs: 2.87% | | | | | | | | | | | | | | | | |
Ashford Hospitality Trust Incorporated | | | | | | | | | | | 140,202 | | | | 905,705 | |
The Geo Group Incorporated | | | | | | | | | | | 50,405 | | | | 1,031,790 | |
| | | | |
| | | | | | | | | | | | | | | 1,937,495 | |
| | | | | | | | | | | | | | | | |
The accompanying notes are an integral part of these financial statements.
| | | | |
| 14 | | Wells Fargo Small Cap Core Fund | | Portfolio of investments—March 31, 2018 |
| | | | | | | | | | | | | | | | |
| Security name | | | | | | | | Shares | | | Value | |
| | | | |
Utilities: 2.71% | | | | | | | | | | | | | | | | |
| | | | |
| Electric Utilities: 0.99% | | | | | | | | | | | | | | | | |
Spark Energy Incorporated Class A « | | | | | | | | | | | 56,784 | | | $ | 672,890 | |
| | | | | | | | | | | | | | | | |
| | | | |
| Independent Power & Renewable Electricity Producers: 1.72% | | | | | | | | | | | | | | | | |
NRG Yield Incorporated Class A | | | | | | | | | | | 70,545 | | | | 1,159,760 | |
| | | | | | | | | | | | | | | | |
| | | | |
Total Common Stocks (Cost $57,663,232) | | | | | | | | | | | | | | | 67,259,693 | |
| | | | | | | | | | | | | | | | |
| | | | |
| | | Yield | | | | | | | | | | |
| Short-Term Investments: 6.98% | | | | | | | | | | | | | | | | |
| | | | |
| Investment Companies: 6.98% | | | | | | | | | | | | | | | | |
Securities Lending Cash Investment LLC (l)(r)(u) | | | 1.89 | % | | | | | | | 4,708,943 | | | | 4,709,414 | |
| | | | | | | | | | | | | | | | |
| | | | |
Total Short-Term Investments (Cost $4,709,414) | | | | | | | | | | | | | | | 4,709,414 | |
| | | | | | | | | | | | | | | | |
| | | | | | | | |
| Total investments in securities (Cost $62,372,646) | | | 106.59 | % | | | 71,969,107 | |
Other assets and liabilities, net | | | (6.59 | ) | | | (4,446,508 | ) |
| | | | | | | | |
| Total net assets | | | 100.00 | % | | $ | 67,522,599 | |
| | | | | | | | |
| « | All or a portion of this security is on loan. |
| † | Non-income-earning security |
| (l) | The issuer of the security is an affiliated person of the Fund as defined in the Investment Company Act of 1940. |
| (r) | The investment is a non-registered investment company purchased with cash collateral received from securities on loan. |
| (u) | The rate represents the 7-day annualized yield at period end. |
Investments in Affiliates
An affiliated investment is an investment in which the Fund owns at least 5% of the outstanding voting shares of the issuer or as a result of other relationships, such as the Fund and the issuer having the same investment manager. Transactions with issuers that were either affiliated persons of the Fund at the beginning of the period or the end of the period were as follows:
| | | | | | | | | | | | | | | | | | | | | | | | | | | | | | | | | | | | |
| | | Shares,
beginning of
period | | | Shares
purchased | | | Shares
sold | | | Shares,
end of
period | | | Net
realized
gains
(losses) | | | Net
change in
unrealized
gains
(losses) | | | Income
from
affiliated
securities | | | Value,
end
of period | | | % of
net
assets | |
Short-Term Investments | | | | | | | | | | | | | | | | | | | | | | | | | | | | | | | | | | | | |
Investment Companies | | | | | | | | | | | | | | | | | | | | | | | | | | | | | | | | | | | | |
Securities Lending Cash Investment LLC | | | 0 | | | | 13,532,762 | | | | 8,823,819 | | | | 4,708,943 | | | $ | 0 | | | $ | 0 | | | $ | 26,541 | | | $ | 4,709,414 | | | | | |
Wells Fargo Government Money Market Fund Select Class * | | | 794,950 | | | | 20,511,508 | | | | 21,306,458 | | | | 0 | | | | 0 | | | | 0 | | | | 6,439 | | | | 0 | | | | | |
| | | | | | | | | | | | | | | | | | | | | | | | | | | | | | | | | | | | |
| | | | | | | | | | | | | | | | | | $ | 0 | | | $ | 0 | | | $ | 32,980 | | | $ | 4,709,414 | | | | 6.98 | % |
| | | | | | | | | | | | | | | | | | | | | | | | | | | | | | | | | | | | |
| | * | No longer held at the end of the period |
The accompanying notes are an integral part of these financial statements.
| | | | | | |
| Statement of assets and liabilities—March 31, 2018 | | Wells Fargo Small Cap Core Fund | | | 15 | |
| | | | |
| | | | |
| |
Assets | | | | |
Investments in unaffiliated securities (including $4,619,333, of securities loaned), at value (cost $57,663,232) | | $ | 67,259,693 | |
Investments in affiliated securities, at value (cost $4,709,414) | | | 4,709,414 | |
Receivable for investments sold | | | 2,509,342 | |
Receivable for Fund shares sold | | | 397 | |
Receivable for dividends | | | 37,668 | |
Receivable for securities lending income | | | 12,759 | |
Receivable from manager | �� | | 29,496 | |
Prepaid expenses and other assets | | | 20,669 | |
| | | | |
Total assets | | | 74,579,438 | |
| | | | |
| |
Liabilities | | | | |
Payable upon receipt of securities loaned | | | 4,709,414 | |
Due to custodian bank | | | 2,208,652 | |
Payable for Fund shares redeemed | | | 80,261 | |
Administration fees payable | | | 4,022 | |
Trustees’ fees and expenses payable | | | 474 | |
Distribution fee payable | | | 301 | |
Accrued expenses and other liabilities | | | 53,715 | |
| | | | |
Total liabilities | | | 7,056,839 | |
| | | | |
Total net assets | | $ | 67,522,599 | |
| | | | |
| |
NET ASSETS CONSIST OF | | | | |
Paid-in capital | | $ | 58,336,026 | |
Undistributed net investment income | | | 105,535 | |
Accumulated net realized losses on investments | | | (515,423 | ) |
Net unrealized gains on investments | | | 9,596,461 | |
| | | | |
Total net assets | | $ | 67,522,599 | |
| | | | |
| |
COMPUTATION OF NET ASSET VALUE AND OFFERING PRICE PER SHARE | | | | |
Net assets – Class A | | $ | 806,137 | |
Shares outstanding – Class A1 | | | 39,734 | |
Net asset value per share – Class A | | | $20.29 | |
Maximum offering price per share – Class A2 | | | $21.53 | |
Net assets – Class C | | $ | 449,077 | |
Shares outstanding – Class C1 | | | 22,426 | |
Net asset value per share – Class C | | | $20.02 | |
Net assets – Class R6 | | $ | 44,923,862 | |
Shares outstanding – Class R61 | | | 2,195,970 | |
Net asset value per share – Class R6 | | | $20.46 | |
Net assets – Administrator Class | | $ | 135,525 | |
Shares outstanding – Administrator Class1 | | | 6,668 | |
Net asset value per share – Administrator Class | | | $20.33 | |
Net assets – Institutional Class | | $ | 21,207,998 | |
Shares outstanding – Institutional Class1 | | | 1,038,074 | |
Net asset value per share – Institutional Class | | | $20.43 | |
| 1 | The Fund has an unlimited number of authorized shares. |
| 2 | Maximum offering price is computed as 100/94.25 of net asset value. On investments of $50,000 or more, the offering price is reduced. |
The accompanying notes are an integral part of these financial statements.
| | | | |
| 16 | | Wells Fargo Small Cap Core Fund | | Statement of operations—year ended March 31, 2018 |
| | | | |
| | | | |
| |
Investment income | | | | |
Dividends | | $ | 846,364 | |
Income from affiliated securities | | | 32,980 | |
| | | | |
Total investment income | | | 879,344 | |
| | | | |
| |
Expenses | | | | |
Management fee | | | 655,846 | |
Administration fees | | | | |
Class A | | | 1,524 | |
Class C | | | 865 | |
Class R6 | | | 1,557 | |
Administrator Class | | | 179 | |
Institutional Class | | | 91,903 | |
Shareholder servicing fees | | | | |
Class A | | | 1,814 | |
Class C | | | 1,030 | |
Administrator Class | | | 343 | |
Distribution fee | | | | |
Class C | | | 3,089 | |
Custody and accounting fees | | | 19,612 | |
Professional fees | | | 55,714 | |
Registration fees | | | 113,798 | |
Shareholder report expenses | | | 35,628 | |
Trustees’ fees and expenses | | | 16,870 | |
Other fees and expenses | | | 10,795 | |
| | | | |
Total expenses | | | 1,010,567 | |
Less: Fee waivers and/or expense reimbursements | | | (236,758 | ) |
| | | | |
Net expenses | | | 773,809 | |
| | | | |
Net investment income | | | 105,535 | |
| | | | |
| |
REALIZED AND UNREALIZED GAINS (LOSSES) ON INVESTMENTS | | | | |
Net realized gains on investments | | | 8,151,237 | |
Net change in unrealized gains (losses) on investments | | | (10,668,825 | ) |
| | | | |
Net realized and unrealized gains (losses) on investments | | | (2,517,588 | ) |
| | | | |
Net decrease in net assets resulting from operations | | $ | (2,412,053 | ) |
| | | | |
The accompanying notes are an integral part of these financial statements.
| | | | | | |
| Statement of changes in net assets | | Wells Fargo Small Cap Core Fund | | | 17 | |
| | | | | | | | | | | | | | | | | | | | | | | | |
| | | Year ended
March 31, 2018 | | | Year ended
March 31, 20171 | | | Year ended
June 30, 20162 | |
| | | | | | |
Operations | | | | | | | | | | | | | | | | | | | | | | | | |
Net investment income (loss) | | | | | | $ | 105,535 | | | | | | | $ | (35,541 | ) | | | | | | $ | 285,872 | |
Net realized gains (losses) on investments | | | | | | | 8,151,237 | | | | | | | | 5,996,629 | | | | | | | | (10,551,715 | ) |
Net change in unrealized gains (losses) on investments | | | | | | | (10,668,825 | ) | | | | | | | 15,099,348 | | | | | | | | (2,795,570 | ) |
| | | | |
Net increase (decrease) in net assets resulting from operations | | | | | | | (2,412,053 | ) | | | | | | | 21,060,436 | | | | | | | | (13,061,413 | ) |
| | | | |
| | | | | | |
Distributions to shareholders from | | | | | | | | | | | | | | | | | | | | | | | | |
Net investment income | | | | | | | | | | | | | | | | | | | | | | | | |
Class A | | | | | | | 0 | | | | | | | | (604 | ) | | | | | | | 0 | 3 |
Class C | | | | | | | 0 | | | | | | | | (175 | ) | | | | | | | 0 | 3 |
Class R6 | | | | | | | 0 | | | | | | | | (284 | ) | | | | | | | 0 | 3 |
Administrator Class | | | | | | | 0 | | | | | | | | (256 | ) | | | | | | | 0 | 3 |
Institutional Class | | | | | | | 0 | | | | | | | | (215,546 | ) | | | | | | | (153,914 | ) |
| | | | |
Total distributions to shareholders | | | | | | | 0 | | | | | | | | (216,865 | ) | | | | | | | (153,914 | ) |
| | | | |
| | | | | | |
Capital share transactions | | | Shares | | | | | | | | Shares | | | | | | | | Shares | | | | | |
Proceeds from shares sold | | | | | | | | | | | | | | | | | | | | | | | | |
Class A | | | 37,520 | | | | 783,618 | | | | 20,038 | | | | 404,696 | | | | 7,790 | 3 | | | 130,000 | 3 |
Class C | | | 16,509 | | | | 337,254 | | | | 3,008 | | | | 61,918 | | | | 6,017 | 3 | | | 100,000 | 3 |
Class R6 | | | 2,403,202 | | | | 49,394,331 | | | | 0 | | | | 0 | | | | 6,017 | 3 | | | 100,000 | 3 |
Administrator Class | | | 526 | | | | 10,842 | | | | 112 | | | | 2,000 | | | | 6,017 | 3 | | | 100,000 | 3 |
Institutional Class | | | 439,875 | | | | 9,607,302 | | | | 249,066 | | | | 4,819,045 | | | | 5,103,153 | | | | 91,283,720 | |
| | | | |
| | | | | | | 60,133,347 | | | | | | | | 5,287,659 | | | | | | | | 91,713,720 | |
| | | | |
Reinvestment of distributions | | | | | | | | | | | | | | | | | | | | | | | | |
Class A | | | 0 | | | | 0 | | | | 30 | | | | 604 | | | | 0 | 3 | | | 0 | 3 |
Class C | | | 0 | | | | 0 | | | | 9 | | | | 175 | | | | 0 | 3 | | | 0 | 3 |
Class R6 | | | 0 | | | | 0 | | | | 14 | | | | 284 | | | | 0 | 3 | | | 0 | 3 |
Administrator Class | | | 0 | | | | 0 | | | | 13 | | | | 256 | | | | 0 | 3 | | | 0 | 3 |
Institutional Class | | | 0 | | | | 0 | | | | 2,392 | | | | 48,291 | | | | 1,813 | | | | 32,246 | |
| | | | |
| | | | | | | 0 | | | | | | | | 49,610 | | | | | | | | 32,246 | |
| | | | |
Payment for shares redeemed | | | | | | | | | | | | | | | | | | | | | | | | |
Class A | | | (18,944 | ) | | | (398,834 | ) | | | (6,700 | ) | | | (137,246 | ) | | | 0 | 3 | | | 0 | 3 |
Class C | | | (1,955 | ) | | | (40,335 | ) | | | (1,162 | ) | | | (23,747 | ) | | | 0 | 3 | | | 0 | 3 |
Class R6 | | | (213,263 | ) | | | (4,357,007 | ) | | | 0 | | | | 0 | | | | 0 | 3 | | | 0 | 3 |
Institutional Class | | | (3,401,750 | ) | | | (70,332,621 | ) | | | (2,874,456 | ) | | | (53,427,708 | ) | | | (2,992,788 | ) | | | (50,609,931 | ) |
| | | | |
| | | | | | | (75,128,797 | ) | | | | | | | (53,588,701 | ) | | | | | | | (50,609,931 | ) |
| | | | |
Net increase (decrease) in net assets resulting from capital share transactions | | | | | | | (14,995,450 | ) | | | | | | | (48,251,432 | ) | | | | | | | 41,136,035 | |
| | | | |
Total increase (decrease) in net assets | | | | | | | (17,407,503 | ) | | | | | | | (27,407,861 | ) | | | | | | | 27,920,708 | |
| | | | |
| | | | | | |
Net assets | | | | | | | | | | | | | | | | | | | | | | | | |
Beginning of period | | | | | | | 84,930,102 | | | | | | | | 112,337,963 | | | | | | | | 84,417,255 | |
| | | | |
End of period | | | | | | $ | 67,522,599 | | | | | | | $ | 84,930,102 | | | | | | | $ | 112,337,963 | |
| | | | |
Undistributed net investment income | | | | | | $ | 105,535 | | | | | | | $ | 0 | | | | | | | $ | 216,815 | |
| | | | |
| 1 | For the nine months ended March 31, 2017. The Fund changed its fiscal year end from June 30 to March 31, effective March 31, 2017. |
| 2 | After the close of business on May 20, 2016, the Fund acquired the net assets of Golden Small Cap Core Fund, which became the accounting and performance survivor in the transaction. The information for the periods prior to May 20, 2016 is that of Golden Small Cap Core Fund. |
| 3 | For the period May 20, 2016 (commencement of class operations) to June 30, 2016. |
The accompanying notes are an integral part of these financial statements.
| | | | |
| 18 | | Wells Fargo Small Cap Core Fund | | Financial highlights |
(For a share outstanding throughout each period)
| | | | | | | | | | | | |
| | | Year ended March 31 | | | Year ended
June 30, 20162 | |
| CLASS A | | 2018 | | | 20171 | | |
Net asset value, beginning of period | | | $20.95 | | | | $16.89 | | | | $16.62 | |
Net investment income (loss) | | | (0.05 | )3 | | | (0.05 | )3 | | | 0.01 | 3 |
Net realized and unrealized gains (losses) on investments | | | (0.61 | ) | | | 4.15 | | | | 0.26 | |
| | | | | | | | | | | | |
Total from investment operations | | | (0.66 | ) | | | 4.10 | | | | 0.27 | |
Distributions to shareholders from | | | | | | | | | | | | |
Net investment income | | | 0.00 | | | | (0.04 | ) | | | 0.00 | |
Net asset value, end of period | | | $20.29 | | | | $20.95 | | | | $16.89 | |
Total return4 | | | (3.15 | )% | | | 24.30 | % | | | 1.62 | % |
Ratios to average net assets (annualized) | | | | | | | | | | | | |
Gross expenses | | | 1.66 | % | | | 1.50 | % | | | 1.46 | % |
Net expenses | | | 1.35 | % | | | 1.35 | % | | | 1.35 | % |
Net investment income (loss) | | | (0.25 | )% | | | (0.32 | )% | | | 0.65 | % |
Supplemental data | | | | | | | | | | | | |
Portfolio turnover rate | | | 53 | % | | | 25 | % | | | 61 | % |
Net assets, end of period (000s omitted) | | | $806 | | | | $443 | | | | $132 | |
| 1 | For the nine months ended March 31, 2017. The Fund changed its fiscal year end from June 30 to March 31, effective March 31, 2017. |
| 2 | For the period May 20, 2016 (commencement of class operations) to June 30, 2016. |
| 3 | Calculated based upon average shares outstanding. |
| 4 | Total return calculations do not include any sales charges. Returns for periods of less than one year are not annualized. |
The accompanying notes are an integral part of these financial statements.
| | | | | | |
| Financial highlights | | Wells Fargo Small Cap Core Fund | | | 19 | |
(For a share outstanding throughout each period)
| | | | | | | | | | | | |
| | | Year ended March 31 | | | Year ended
June 30, 20162 | |
| CLASS C | | 2018 | | | 20171 | | |
Net asset value, beginning of period | | | $20.84 | | | | $16.87 | | | | $16.62 | |
Net investment loss | | | (0.08 | ) | | | (0.12 | ) | | | (0.00 | )3,4 |
Net realized and unrealized gains (losses) on investments | | | (0.74 | ) | | | 4.12 | | | | 0.25 | |
| | | | | | | | | | | | |
Total from investment operations | | | (0.82 | ) | | | 4.00 | | | | 0.25 | |
Distributions to shareholders from | | | | | | | | | | | | |
Net investment income | | | 0.00 | | | | (0.03 | ) | | | 0.00 | |
Net asset value, end of period5 | | | $20.02 | | | | $20.84 | | | | $16.87 | |
Total return5 | | | (3.93 | )% | | | 23.70 | % | | | 1.50 | % |
Ratios to average net assets (annualized) | | | | | | | | | | | | |
Gross expenses | | | 2.41 | % | | | 2.24 | % | | | 2.21 | % |
Net expenses | | | 2.10 | % | | | 2.10 | % | | | 2.10 | % |
Net investment loss | | | (0.98 | )% | | | (1.10 | )% | | | (0.27 | )% |
Supplemental data | | | | | | | | | | | | |
Portfolio turnover rate | | | 53 | % | | | 25 | % | | | 61 | % |
Net assets, end of period (000s omitted) | | | $449 | | | | $164 | | | | $102 | |
| 1 | For the nine months ended March 31, 2017. The Fund changed its fiscal year end from June 30 to March 31, effective March 31, 2017. |
| 2 | For the period May 20, 2016 (commencement of class operations) to June 30, 2016. |
| 3 | Calculated based upon average shares outstanding |
| 4 | Amount is more than $(0.005). |
| 5 | Total return calculations do not include any sales charges. Returns for periods of less than one year are not annualized. |
The accompanying notes are an integral part of these financial statements.
| | | | |
| 20 | | Wells Fargo Small Cap Core Fund | | Financial highlights |
(For a share outstanding throughout each period)
| | | | | | | | | | | | |
| | | Year ended March 31 | | | Year ended
June 30, 20162 | |
| CLASS R6 | | 2018 | | | 20171 | | |
Net asset value, beginning of period | | | $21.03 | | | | $16.90 | | | | $16.62 | |
Net investment income (loss) | | | (0.01 | ) | | | 0.01 | | | | 0.02 | 3 |
Net realized and unrealized gains (losses) on investments | | | (0.56 | ) | | | 4.17 | | | | 0.26 | |
| | | | | | | | | | | | |
Total from investment operations | | | (0.57 | ) | | | 4.18 | | | | 0.28 | |
Distributions to shareholders from | | | | | | | | | | | | |
Net investment income | | | 0.00 | | | | (0.05 | ) | | | 0.00 | |
Net asset value, end of period | | | $20.46 | | | | $21.03 | | | | $16.90 | |
Total return4 | | | (2.71 | )% | | | 24.73 | % | | | 1.68 | % |
Ratios to average net assets (annualized) | | | | | | | | | | | | |
Gross expenses | | | 2.15 | % | | | 1.06 | % | | | 1.03 | % |
Net expenses | | | 0.90 | % | | | 0.90 | % | | | 0.90 | % |
Net investment income (loss) | | | (1.41 | )% | | | 0.09 | % | | | 0.93 | % |
Supplemental data | | | | | | | | | | | | |
Portfolio turnover rate | | | 53 | % | | | 25 | % | | | 61 | % |
Net assets, end of period (000s omitted) | | | $44,924 | | | | $127 | | | | $102 | |
| 1 | For the nine months ended March 31, 2017. The Fund changed its fiscal year end from June 30 to March 31, effective March 31, 2017. |
| 2 | For the period May 20, 2016 (commencement of class operations) to June 30, 2016. |
| 3 | Calculated based upon average shares outstanding |
| 4 | Returns for periods of less than one year are not annualized. |
The accompanying notes are an integral part of these financial statements.
| | | | | | |
| Financial highlights | | Wells Fargo Small Cap Core Fund | | | 21 | |
(For a share outstanding throughout each period)
| | | | | | | | | | | | |
| | | Year ended March 31 | | | Year ended
June 30, 20162 | |
| ADMINISTRATOR CLASS | | 2018 | | | 20171 | | |
Net asset value, beginning of period | | | $20.98 | | | | $16.89 | | | | $16.62 | |
Net investment income (loss) | | | (0.02 | ) | | | (0.04 | ) | | | 0.01 | 3 |
Net realized and unrealized gains (losses) on investments | | | (0.63 | ) | | | 4.17 | | | | 0.26 | |
| | | | | | | | | | | | |
Total from investment operations | | | (0.65 | ) | | | 4.13 | | | | 0.27 | |
Distributions to shareholders from | | | | | | | | | | | | |
Net investment income | | | 0.00 | | | | (0.04 | ) | | | 0.00 | |
Net asset value, end of period | | | $20.33 | | | | $20.98 | | | | $16.89 | |
Total return4 | | | (3.10 | )% | | | 24.47 | % | | | 1.62 | % |
Ratios to average net assets (annualized) | | | | | | | | | | | | |
Gross expenses | | | 1.57 | % | | | 1.41 | % | | | 1.37 | % |
Net expenses | | | 1.25 | % | | | 1.25 | % | | | 1.25 | % |
Net investment income (loss) | | | (0.13 | )% | | | (0.26 | )% | | | 0.58 | % |
Supplemental data | | | | | | | | | | | | |
Portfolio turnover rate | | | 53 | % | | | 25 | % | | | 61 | % |
Net assets, end of period (000s omitted) | | | $136 | | | | $129 | | | | $102 | |
| 1 | For the nine months ended March 31, 2017. The Fund changed its fiscal year end from June 30 to March 31, effective March 31, 2017. |
| 2 | For the period May 20, 2016 (commencement of class operations) to June 30, 2016. |
| 3 | Calculated based upon average shares outstanding. |
| 4 | Returns for periods of less than one year are not annualized. |
The accompanying notes are an integral part of these financial statements.
| | | | |
| 22 | | Wells Fargo Small Cap Core Fund | | Financial highlights |
(For a share outstanding throughout each period)
| | | | | | | | | | | | | | | | | | | | | | | | |
| | | Year ended March 31 | | | Year ended June 30 | |
| INSTITUTIONAL CLASS | | 2018 | | | 20171 | | | 20162 | | | 20152 | | | 20142 | | | 20132 | |
Net asset value, beginning of period | | | $21.02 | | | | $16.90 | | | | $18.71 | | | | $16.76 | | | | $13.57 | | | | $10.64 | |
Net investment income (loss) | | | 0.06 | 3 | | | (0.01 | )3 | | | 0.04 | 3 | | | 0.06 | 3 | | | 0.05 | 3 | | | 0.16 | 3 |
Net realized and unrealized gains (losses) on investments | | | (0.65 | ) | | | 4.18 | | | | (1.83 | ) | | | 1.92 | | | | 3.36 | | | | 2.77 | |
| | | | | | | | | | | | | | | | | | | | | | | | |
Total from investment operations | | | (0.59 | ) | | | 4.17 | | | | (1.79 | ) | | | 1.98 | | | | 3.41 | | | | 2.93 | |
Distributions to shareholders from | | | | | | | | | | | | | | | | | | | | | | | | |
Net investment income | | | 0.00 | | | | (0.05 | ) | | | (0.02 | ) | | | (0.03 | ) | | | (0.22 | ) | | | 0.00 | |
Net asset value, end of period | | | $20.43 | | | | $21.02 | | | | $16.90 | | | | $18.71 | | | | $16.76 | | | | $13.57 | |
Total return4 | | | (2.81 | )% | | | 24.67 | % | | | (9.57 | )% | | | 11.80 | % | | | 25.21 | % | | | 27.54 | % |
Ratios to average net assets (annualized) | | | | | | | | | | | | | | | | | | | | | | | | |
Gross expenses | | | 1.24 | % | | | 1.16 | % | | | 1.11 | % | | | 1.10 | % | | | 1.10 | % | | | 1.10 | % |
Net expenses | | | 1.00 | % | | | 1.00 | % | | | 1.09 | % | | | 1.10 | % | | | 1.10 | % | | | 1.10 | % |
Net investment income (loss) | | | 0.26 | % | | | (0.05 | )% | | | 0.25 | % | | | 0.37 | % | | | 0.30 | % | | | 1.32 | % |
Supplemental data | | | | | | | | | | | | | | | | | | | | | | | | |
Portfolio turnover rate | | | 53 | % | | | 25 | % | | | 61 | % | | | 57 | % | | | 68 | % | | | 52 | % |
Net assets, end of period (000s omitted) | | | $21,208 | | | | $84,067 | | | | $111,902 | | | | $84,417 | | | | $22,170 | | | | $20,093 | |
| 1 | For the nine months ended March 31, 2017. The Fund changed its fiscal year end from June 30 to March 31, effective March 31, 2017. |
| 2 | After the close of business on May 20, 2016, the Fund acquired the net assets of Golden Small Cap Core Fund, which became the accounting and performance survivor in the transaction. The information for the periods prior to May 20, 2016 is that of Golden Small Cap Core Fund. |
| 3 | Calculated based upon average shares outstanding |
| 4 | Returns for periods of less than one year are not annualized. |
The accompanying notes are an integral part of these financial statements.
| | | | | | |
| Notes to financial statements | | Wells Fargo Small Cap Core Fund | | | 23 | |
1. ORGANIZATION
Wells Fargo Funds Trust (the “Trust”), a Delaware statutory trust organized on March 10, 1999, is an open-end management investment company registered under the Investment Company Act of 1940, as amended (the “1940 Act”). As an investment company, the Trust follows the accounting and reporting guidance in Financial Accounting Standards Board Accounting Standards Codification Topic 946, Financial Services – Investment Companies. These financial statements report on the Wells Fargo Small Cap Core Fund (the “Fund”) which is a diversified series of the Trust.
After the close of business on May 20, 2016, the net assets of Golden Small Cap Core Fund were acquired by the Fund, which was created to receive the assets of Golden Small Cap Core Fund, in an exchange for shares of the Fund. Institutional shares of Golden Small Cap Core Fund received shares of Institutional Class of the Fund in the transaction. Since Golden Small Cap Core Fund contributed all of the net assets and shareholders to the newly created Wells Fargo fund, the accounting and performance history of Golden Small Cap Core Fund has been carried forward in the financial statements contained herein.
2. SIGNIFICANT ACCOUNTING POLICIES
The following significant accounting policies, which are consistently followed in the preparation of the financial statements of the Fund, are in conformity with U.S. generally accepted accounting principles which require management to make estimates and assumptions that affect the reported amounts of assets and liabilities, disclosure of contingent assets and liabilities at the date of the financial statements, and the reported amounts of revenues and expenses during the reporting period. Actual results could differ from those estimates.
Securities valuation
All investments are valued each business day as of the close of regular trading on the New York Stock Exchange (generally 4 p.m. Eastern Time), although the Fund may deviate from this calculation time under unusual or unexpected circumstances.
Equity securities that are listed on a foreign or domestic exchange or market are valued at the official closing price or, if none, the last sales price. If no sale occurs on the principal exchange or market that day, a fair value price will be determined in accordance with the Fund’s Valuation Procedures.
Investments in registered open-end investment companies are valued at net asset value. Interests in non-registered investment companies that are redeemable at net asset value are fair valued normally at net asset value.
Investments which are not valued using any of the methods discussed above are valued at their fair value, as determined in good faith by the Board of Trustees of the Fund. The Board of Trustees has established a Valuation Committee comprised of the Trustees and has delegated to it the authority to take any actions regarding the valuation of portfolio securities that the Valuation Committee deems necessary or appropriate, including determining the fair value of portfolio securities, unless the determination has been delegated to the Wells Fargo Asset Management Pricing Committee at Wells Fargo Funds Management, LLC (“Funds Management”). The Board of Trustees retains the authority to make or ratify any valuation decisions or approve any changes to the Valuation Procedures as it deems appropriate. On a quarterly basis, the Board of Trustees receives reports on any valuation actions taken by the Valuation Committee or the Wells Fargo Asset Management Pricing Committee which may include items for ratification.
Valuations of fair valued securities are compared to the next actual sales price when available, or other appropriate market values, to assess the continued appropriateness of the fair valuation methodologies used. These securities are fair valued on a day-to-day basis, taking into consideration changes to appropriate market information and any significant changes to the inputs considered in the valuation process until there is a readily available price provided on an exchange or by an independent pricing service. Valuations received from an independent pricing service or independent broker-dealer quotes are periodically validated by comparisons to most recent trades and valuations provided by other independent pricing services in addition to the review of prices by the manager and/or subadviser. Unobservable inputs used in determining fair valuations are identified based on the type of security, taking into consideration factors utilized by market participants in valuing the investment, knowledge about the issuer and the current market environment.
Securities lending
The Fund may lend its securities from time to time in order to earn additional income in the form of fees or interest on securities received as collateral or the investment of any cash received as collateral. The Fund continues to receive interest or dividends on the securities loaned. The Fund receives collateral in the form of cash or securities with a value at least equal to the value of the securities on loan. The value of the loaned securities is determined at the close of each business day and any additional required collateral is delivered to the Fund on the next business day. In a securities lending transaction, the net asset value of the Fund will be affected by an increase or decrease in the value of the securities loaned and by an increase or decrease in the value of the instrument in which collateral is invested. The amount of securities lending activity undertaken by the Fund fluctuates from time to time. In the event of default or bankruptcy by the borrower, the Fund may be prevented from recovering the loaned securities
| | | | |
| 24 | | Wells Fargo Small Cap Core Fund | | Notes to financial statements |
or gaining access to the collateral or may experience delays or costs in doing so. In addition, the investment of any cash collateral received may lose all or part of its value. The Fund has the right under the lending agreement to recover the securities from the borrower on demand.
The Fund lends its securities through an unaffiliated securities lending agent. Cash collateral received in connection with its securities lending transactions is invested in Securities Lending Cash Investments, LLC (the “Securities Lending Fund”). The Securities Lending Fund is exempt from registration under Section 3(c)(7) of the 1940 Act and is managed by Funds Management and is subadvised by Wells Capital Management Incorporated (“WellsCap”), an affiliate of Funds Management and an indirect wholly owned subsidiary of Wells Fargo & Company (“Wells Fargo”). Funds Management receives an advisory fee starting at 0.05% and declining to 0.01% as the average daily net assets of the Securities Lending Fund increase. All of the fees received by Funds Management are paid to WellsCap for its services as subadviser. The Securities Lending Fund seeks to provide a positive return compared to the daily Fed Funds Open Rate by investing in high-quality, U.S. dollar-denominated short-term money market instruments. Securities Lending Fund investments are valued at the evaluated bid price provided by an independent pricing service. Income earned from investment in the Securities Lending Fund, if any, is included in income from affiliated securities on the Statement of Operations.
Security transactions and income recognition
Securities transactions are recorded on a trade date basis. Realized gains or losses are recorded on the basis of identified cost.
Dividend income is recognized on the ex-dividend date.
Distributions to shareholders
Distributions to shareholders from net investment income and any net realized gains are recorded on the ex-dividend date and paid at least annually. Such distributions are determined in accordance with income tax regulations and may differ from U.S. generally accepted accounting principles. Dividend sources are estimated at the time of declaration. The tax character of distributions is determined as of the Fund’s fiscal year end. Therefore, a portion of the Fund’s distributions made prior to the Fund’s fiscal year end may be categorized as a tax return of capital at year end.
Federal and other taxes
The Fund intends to continue to qualify as a regulated investment company by distributing substantially all of its investment company taxable income and any net realized capital gains (after reduction for capital loss carryforwards) sufficient to relieve it from all, or substantially all, federal income taxes. Accordingly, no provision for federal income taxes was required.
The Fund’s income and federal excise tax returns and all financial records supporting those returns for the prior three fiscal years are subject to examination by the federal and Delaware revenue authorities. Management has analyzed the Fund’s tax positions taken on federal, state, and foreign tax returns for all open tax years and does not believe that there are any uncertain tax positions that require recognition of a tax liability.
As of March 31, 2018, the aggregate cost of all investments for federal income tax purposes was $62,888,069 and the unrealized gains (losses) consisted of:
| | | | |
Gross unrealized gains | | $ | 12,709,703 | |
Gross unrealized losses | | | (3,628,665 | ) |
Net unrealized gains | | $ | 9,081,038 | |
Reclassifications are made to the Fund’s capital accounts for permanent tax differences to reflect income and gains available for distribution (or available capital loss carryforwards) under federal income tax regulations. U.S. generally accepted accounting principles require that certain components of net assets be adjusted to reflect permanent differences between financial and tax reporting. These reclassifications have no effect on net assets or net asset values per share. The primary permanent difference causing such reclassifications is due to expiration of capital loss carryforwards. At March 31, 2018, as a result of permanent book-to-tax differences, the following reclassification adjustments were made on the Statement of Assets and Liabilities:
| | |
| Paid-in capital | | Accumulated net
realized losses
on investments |
| $(45,471,391) | | $45,471,391 |
| | | | | | |
| Notes to financial statements | | Wells Fargo Small Cap Core Fund | | | 25 | |
Class allocations
The separate classes of shares offered by the Fund differ principally in applicable sales charges, distribution, shareholder servicing, and administration fees. Class specific expenses are charged directly to that share class. Investment income, common expenses, and realized and unrealized gains (losses) on investments are allocated daily to each class of shares based on the relative proportion of net assets of each class.
3. FAIR VALUATION MEASUREMENTS
Fair value measurements of investments are determined within a framework that has established a fair value hierarchy based upon the various data inputs utilized in determining the value of the Fund’s investments. The three-level hierarchy gives the highest priority to unadjusted quoted prices in active markets for identical assets or liabilities (Level 1) and the lowest priority to unobservable inputs (Level 3). The Fund’s investments are classified within the fair value hierarchy based on the lowest level of input that is significant to the fair value measurement. The inputs are summarized into three broad levels as follows:
| ∎ | | Level 1 – quoted prices in active markets for identical securities |
| ∎ | | Level 2 – other significant observable inputs (including quoted prices for similar securities, interest rates, prepayment speeds, credit risk, etc.) |
| ∎ | | Level 3 – significant unobservable inputs (including the Fund’s own assumptions in determining the fair value of investments) |
The inputs or methodologies used for valuing investments in securities are not necessarily an indication of the risk associated with investing in those securities.
The following is a summary of the inputs used in valuing the Fund’s assets and liabilities as of March 31, 2018:
| | | | | | | | | | | | | | | | |
| | | Quoted prices
(Level 1) | | | Other significant
observable inputs
(Level 2) | | | Significant
unobservable inputs (Level 3) | | | Total | |
Assets | | | | | | | | | | | | | | | | |
Investments in: | | | | | | | | | | | | | | | | |
| | | | |
Common stocks | | | | | | | | | | | | | | | | |
Consumer discretionary | | $ | 9,369,266 | | | $ | 0 | | | $ | 0 | | | $ | 9,369,266 | |
Consumer staples | | | 1,145,210 | | | | 0 | | | | 0 | | | | 1,145,210 | |
Energy | | | 1,169,362 | | | | 0 | | | | 0 | | | | 1,169,362 | |
Financials | | | 10,924,876 | | | | 0 | | | | 0 | | | | 10,924,876 | |
Health care | | | 12,951,193 | | | | 0 | | | | 0 | | | | 12,951,193 | |
Industrials | | | 13,567,244 | | | | 0 | | | | 0 | | | | 13,567,244 | |
Information technology | | | 10,917,836 | | | | 0 | | | | 0 | | | | 10,917,836 | |
Materials | | | 3,444,561 | | | | 0 | | | | 0 | | | | 3,444,561 | |
Real estate | | | 1,937,495 | | | | 0 | | | | 0 | | | | 1,937,495 | |
Utilities | | | 1,832,650 | | | | 0 | | | | 0 | | | | 1,832,650 | |
Investments measured at net asset value* | | | | | | | | | | | | | | | 4,709,414 | |
Total assets | | $ | 67,259,693 | | | $ | 0 | | | $ | 0 | | | $ | 71,969,107 | |
| * | Investments that are measured at fair value using the net asset value per share (or its equivalent) as a practical expedient have not been categorized in the fair value hierarchy. The fair value amount presented in the table is intended to permit reconciliation of the fair value hierarchy to the amounts presented in the Statement of Assets and Liabilities. The Fund’s investment in Securities Lending Cash Investments, LLC valued at $4,709,414 does not have a redemption period notice, can be redeemed daily and does not have any unfunded commitments. |
The Fund recognizes transfers between levels within the fair value hierarchy at the end of the reporting period. At March 31, 2018, the Fund did not have any transfers into/out of Level 1, Level 2, or Level 3.
4. TRANSACTIONS WITH AFFILIATES
Management fee
Funds Management, an indirect wholly owned subsidiary of Wells Fargo, is the manager of the Fund and provides advisory and fund-level administrative services under an investment management agreement. Under the investment management agreement, Funds Management is responsible for, among other services, implementing the investment objectives and strategies of the Fund, supervising the subadviser, providing fund-level administrative services in
| | | | |
| 26 | | Wells Fargo Small Cap Core Fund | | Notes to financial statements |
connection with the Fund’s operations, and providing any other fund-level administrative services reasonably necessary for the operation of the Fund. As compensation for its services under the investment management agreement, Funds Management is entitled to receive an annual management fee starting at 0.85% and declining to 0.71% as the average daily net assets of the Fund increase. For the year ended March 31, 2018, the management fee was equivalent to an annual rate of 0.85% of the Fund’s average daily net assets.
Funds Management has retained the services of a subadviser to provide daily portfolio management to the Fund. The fee for subadvisory services is borne by Funds Management. In connection with the completion of the merger of Golden Capital Management LLC into WellsCap on January 1, 2018, WellsCap became the subadviser to the Fund. The merger did not result in any change to the services provided to the Fund or to its strategies or fees and expenses. WellsCap is entitled to receive a fee from Funds Management at an annual rate starting at 0.55% and declining to 0.45% as the average daily net assets of the Fund increase.
Administration fees
Under a class-level administration agreement, Funds Management provides class-level administrative services to the Fund, which includes paying fees and expenses for services provided by the transfer agent, sub-transfer agents, omnibus account servicers and record-keepers. As compensation for its services under the class-level administration agreement, Funds Management receives an annual fee which is calculated based on the average daily net assets of each class as follows:
| | | | |
| | | Class-level
administration fee | |
Class A, Class C | | | 0.21 | % |
Class R6 | | | 0.03 | |
Administrator Class, Institutional Class | | | 0.13 | |
Funds Management has contractually waived and/or reimbursed management and administration fees to the extent necessary to maintain certain net operating expense ratios for the Fund. Waiver of fees and/or reimbursement of expenses by Funds Management were made first from fund level expenses on a proportionate basis and then from class specific expenses. Funds Management has committed through July 31, 2019 to waive fees and/or reimburse expenses to the extent necessary to cap the Fund’s expenses at 1.35% for Class A shares, 2.10% for Class C shares, 0.90% for Class R6 shares, 1.25% for Administrator Class shares, and 1.00% for Institutional Class shares. After this time, the cap may be increased or the commitment to maintain the cap may be terminated only with the approval of the Board of Trustees.
Distribution fee
The Trust has adopted a distribution plan for Class C shares of the Fund pursuant to Rule 12b-1 under the 1940 Act. A distribution fee is charged to Class C shares and paid to Wells Fargo Funds Distributor, LLC, the principal underwriter, at an annual rate of 0.75% of the average daily net assets of Class C shares.
In addition, Funds Distributor is entitled to receive the front-end sales charge from the purchase of Class A shares and a contingent deferred sales charge on the redemption of certain Class A shares. Funds Distributor is also entitled to receive the contingent deferred sales charges from redemptions of Class C shares. For the year ended March 31, 2018, Funds Distributor received $873 from the sale of Class A. No contingent deferred sales charges were incurred by Class A and Class C shares for the year ended March 31, 2018.
Shareholder servicing fees
The Trust has entered into contracts with one or more shareholder servicing agents, whereby Class A, Class C, and Administrator Class of the Fund are charged a fee at an annual rate of 0.25% of the average daily net assets of each respective class.
A portion of these total shareholder servicing fees were paid to affiliates of Wells Fargo.
Interfund transactions
The Fund may purchase or sell portfolio investment securities to certain other Wells Fargo affiliates pursuant to Rule 17a-7 under the 1940 Act and under procedures adopted by the Board of Trustees. The procedures have been designed to ensure that these interfund transactions, which do not incur broker commissions, are effected at current market prices.
| | | | | | |
| Notes to financial statements | | Wells Fargo Small Cap Core Fund | | | 27 | |
5. INVESTMENT PORTFOLIO TRANSACTIONS
Purchases and sales of investments, excluding U.S. government obligations (if any) and short-term securities, for the year ended March 31, 2018 were $40,690,944 and $54,797,622, respectively.
6. BANK BORROWINGS
The Trust (excluding the money market funds and certain other funds) and Wells Fargo Variable Trust are parties to a $280,000,000 revolving credit agreement whereby the Fund is permitted to use bank borrowings for temporary or emergency purposes, such as to fund shareholder redemption requests. Interest under the credit agreement is charged to the Fund based on a borrowing rate equal to the higher of the Federal Funds rate in effect on that day plus 1.25% or the overnight LIBOR rate in effect on that day plus 1.25%. In addition, an annual commitment fee equal to 0.25% of the unused balance is allocated to each participating fund. Prior to August 29, 2017, the revolving credit agreement amount was $250,000,000.
For the year ended March 31, 2018, there were no borrowings by the Fund under the agreement.
7. DISTRIBUTIONS TO SHAREHOLDERS
The tax characters of distributions paid were as follows:
| | | | | | | | | | | | |
| | | Year ended March 31 | | | Year ended June 2016 | |
| | | 2018 | | | 2017* | | |
Ordinary income | | $ | 0 | | | $ | 216,865 | | | $ | 153,914 | |
| * | For the nine months ended March 31, 2017. The Fund changed its fiscal year end from June 30 to March 31, effective March 31, 2017. |
As of March 31, 2018, the components of distributable earnings on a tax basis were as follows:
| | |
Undistributed
ordinary
income | | Unrealized
gains |
| $105,535 | | $9,081,038 |
8. INDEMNIFICATION
Under the Trust’s organizational documents, the officers and Trustees have been granted certain indemnification rights against certain liabilities that may arise out of performance of their duties to the Trust. Additionally, in the normal course of business, the Trust may enter into contracts with service providers that contain a variety of indemnification clauses. The Trust’s maximum exposure under these arrangements is dependent on future claims that may be made against the Fund and, therefore, cannot be estimated.
| | | | |
| 28 | | Wells Fargo Small Cap Core Fund | | Report of independent registered public accounting firm |
BOARD OF TRUSTEES AND SHAREHOLDERS OF WELLS FARGO FUNDS TRUST:
Opinion on the Financial Statements
We have audited the accompanying statement of assets and liabilities of the Wells Fargo Small Cap Core Fund (the “Fund”), one of the funds constituting the Wells Fargo Funds Trust, including the portfolio of investments, as of March 31, 2018, the related statement of operations for the year then ended, the statements of changes in net assets for the year then ended, for the period from July 1, 2016 to March 31, 2017, and the year ended June 30, 2016, and the related notes (collectively, the “financial statements”), and the financial highlights for the year then ended, for the period from July 1, 2016 to March 31, 2017, and for the year ended June 30, 2016. In our opinion, the financial statements and financial highlights present fairly, in all material respects, the financial position of the Fund as of March 31, 2018, the results of its operations for the year then ended, the changes in its net assets for each of the years or periods noted above, and the financial highlights for each of the years or periods noted above, in conformity with U.S. generally accepted accounting principles. The financial highlights for each of the years in the three-year period ended June 30, 2015, were audited by other independent registered public accountants whose report, dated August 19, 2015, expressed an unqualified opinion on those financial highlights.
Basis for Opinion
These financial statements and financial highlights are the responsibility of the Fund’s management. Our responsibility is to express an opinion on these financial statements and financial highlights based on our audits. We are a public accounting firm registered with the Public Company Accounting Oversight Board (United States) (“PCAOB”) and are required to be independent with respect to the Fund in accordance with the U.S. federal securities laws and the applicable rules and regulations of the Securities and Exchange Commission and the PCAOB.
We conducted our audits in accordance with the standards of the PCAOB. Those standards require that we plan and perform the audit to obtain reasonable assurance about whether the financial statements and financial highlights are free of material misstatement, whether due to error or fraud. Our audits included performing procedures to assess the risks of material misstatement of the financial statements and financial highlights, whether due to error or fraud, and performing procedures that respond to those risks. Such procedures included examining, on a test basis, evidence regarding the amounts and disclosures in the financial statements and financial highlights. Such procedures also included confirmation of securities owned as of March 31, 2018, by correspondence with the custodian and brokers, or by other appropriate auditing procedures. Our audits also included evaluating the accounting principles used and significant estimates made by management, as well as evaluating the overall presentation of the financial statements and financial highlights. We believe that our audits provide a reasonable basis for our opinion.

We have not been able to determine the specific year that we began serving as the auditor of one or more Wells Fargo Funds investment companies, however we are aware that we have served as the auditor of one or more Wells Fargo Funds investment companies since at least 1955.
Boston, Massachusetts
May 23, 2018
| | | | | | |
| Other information (unaudited) | | Wells Fargo Small Cap Core Fund | | | 29 | |
PROXY VOTING INFORMATION
A description of the policies and procedures that the Fund uses to determine how to vote proxies relating to portfolio securities is available, upon request, by calling 1-800-222-8222, visiting our website at wellsfargofunds.com, or visiting the SEC website at sec.gov. Information regarding how the Fund voted proxies relating to portfolio securities during the most recent 12-month period ended June 30 is available on the Fund’s website at wellsfargofunds.com or by visiting the SEC website at sec.gov.
PORTFOLIO HOLDINGS INFORMATION
The complete portfolio holdings for the Fund are publicly available monthly on the Fund’s website (wellsfargofunds.com), on a one-month delayed basis. In addition, top ten holdings information (excluding derivative positions) for the Fund is publicly available on the Fund’s website on a monthly, seven-day or more delayed basis. The Fund files its complete schedule of portfolio holdings with the SEC for the first and third quarters of each fiscal year on Form N-Q, which is available by visiting the SEC website at sec.gov. In addition, the Fund’s Form N-Q may be reviewed and copied at the SEC’s Public Reference Room in Washington, DC, and at regional offices in New York City, at 233 Broadway, and in Chicago, at 175 West Jackson Boulevard, Suite 900. Information about the Public Reference Room may be obtained by calling 1-800-SEC-0330.
| | | | |
| 30 | | Wells Fargo Small Cap Core Fund | | Other information (unaudited) |
BOARD OF TRUSTEES AND OFFICERS
Each of the Trustees and Officers1 listed in the table below acts in identical capacities for each fund in the Wells Fargo family of funds, which consists of 153 mutual funds comprising the Wells Fargo Funds Trust, Wells Fargo Variable Trust, Wells Fargo Master Trust and four closed-end funds (collectively the “Fund Complex”). This table should be read in conjunction with the Prospectus and the Statement of Additional Information2. The mailing address of each Trustee and Officer is 525 Market Street, 12th Floor, San Francisco, CA 94105. Each Trustee and Officer serves an indefinite term, however, each Trustee serves such term until reaching the mandatory retirement age established by the Trustees.
Independent Trustees
| | | | | | |
Name and
year of birth | | Position held and
length of service* | | Principal occupations during past five years or longer | | Current other
public company or
investment company
directorships |
William R. Ebsworth
(Born 1957) | | Trustee, since 2015 | | Retired. From 1984 to 2013, equities analyst, portfolio manager, research director and chief investment officer at Fidelity Management and Research Company in Boston, Tokyo, and Hong Kong, and retired in 2013 as Chief Investment Officer of Fidelity Strategic Advisers, Inc. where he led a team of investment professionals managing client assets. Prior thereto, Board member of Hong Kong Securities Clearing Co., Hong Kong Options Clearing Corp., the Thailand International Fund, Ltd., Fidelity Investments Life Insurance Company, and Empire Fidelity Investments Life Insurance Company. Board member of the Forté Foundation (non-profit organization) and the Vincent Memorial Hospital Endowment (non-profit organization), where he serves on the Investment Committee and as a Chair of the Audit Committee. Mr. Ebsworth is a CFA® charterholder. | | Asset Allocation Trust |
Jane A. Freeman** (Born 1953) | | Trustee, since 2015;
Chair Liaison, since 2018 | | Retired. From 2012 to 2014 and 1999 to 2008, Chief Financial Officer of Scientific Learning Corporation. From 2008 to 2012, Ms. Freeman provided consulting services related to strategic business projects. Prior to 1999, Portfolio Manager at Rockefeller & Co. and Scudder, Stevens & Clark. Board member of the Harding Loevner Funds from 1996 to 2014, serving as both Lead Independent Director and chair of the Audit Committee. Board member of the Russell Exchange Traded Funds Trust from 2011 to 2012 and the chair of the Audit Committee. Ms. Freeman is a Board Member of Ruth Bancroft Garden (non-profit organization) and the Glimmerglass Festival. She is also an inactive Chartered Financial Analyst. | | Asset Allocation Trust |
Isaiah Harris, Jr. (Born 1952) | | Trustee, since 2009 | | Retired. Chairman of the Board of CIGNA Corporation since 2009, and Director since 2005. From 2003 to 2011, Director of Deluxe Corporation. Prior thereto, President and CEO of BellSouth Advertising and Publishing Corp. from 2005 to 2007, President and CEO of BellSouth Enterprises from 2004 to 2005 and President of BellSouth Consumer Services from 2000 to 2003. Emeritus member of the Iowa State University Foundation Board of Governors. Emeritus Member of the Advisory Board of Iowa State University School of Business. Advisory Board Member, Palm Harbor Academy (charter school). Advisory Board Member, Child Evangelism Fellowship (non-profit). Mr. Harris is a certified public accountant (inactive status). | | CIGNA Corporation; Asset Allocation Trust |
Judith M. Johnson (Born 1949) | | Trustee, since 2008; Audit Committee Chairman, since 2008 | | Retired. Prior thereto, Chief Executive Officer and Chief Investment Officer of Minneapolis Employees Retirement Fund from 1996 to 2008. Ms. Johnson is an attorney, certified public accountant and a certified managerial accountant. | | Asset Allocation Trust |
David F. Larcker (Born 1950) | | Trustee, since 2009 | | James Irvin Miller Professor of Accounting at the Graduate School of Business, Stanford University, Director of the Corporate Governance Research Initiative and Senior Faculty of The Rock Center for Corporate Governance since 2006. From 2005 to 2008, Professor of Accounting at the Graduate School of Business, Stanford University. Prior thereto, Ernst & Young Professor of Accounting at The Wharton School, University of Pennsylvania from 1985 to 2005. | | Asset Allocation Trust |
| | | | | | |
| Other information (unaudited) | | Wells Fargo Small Cap Core Fund | | | 31 | |
| | | | | | |
Name and
year of birth | | Position held and
length of service* | | Principal occupations during past five years or longer | | Current other
public company or
investment company
directorships |
Olivia S. Mitchell*** (Born 1953) | | Trustee, since 2006; Governance Committee Chairman, since 2018 | | International Foundation of Employee Benefit Plans Professor, Wharton School of the University of Pennsylvania since 1993. Director of Wharton’s Pension Research Council and Boettner Center on Pensions & Retirement Research, and Research Associate at the National Bureau of Economic Research. Previously, Cornell University Professor from 1978 to 1993. | | Asset Allocation Trust |
Timothy J. Penny**** (Born 1951) | | Trustee, since 1996; Chairman, since 2018; Vice Chairman, from 2017 to 2018 | | President and Chief Executive Officer of Southern Minnesota Initiative Foundation, a non-profit organization, since 2007. Member of the Board of Trustees of NorthStar Education Finance, Inc., a non-profit organization, since 2007. | | Asset Allocation Trust |
James G. Polisson***** (Born 1959) | | Trustee, since 2018; Advisory Board Member, from 2017 to 2018 | | Retired. Chief Marketing Officer, Source (ETF) UK Services, Ltd, from 2015 to 2017. From 2012 to 2015, Principal of The Polisson Group, LLC, a management consulting, corporate advisory and principal investing company. Chief Executive Officer and Managing Director at Russell Investments, Global Exchange Traded Funds from 2010 to 2012. Managing Director of Barclays Global Investors from 1998 to 2010 and Global Chief Marketing Officer for iShares and Barclays Global Investors from 2000 to 2010. Trustee of the San Francisco Mechanics’ Institute, a non-profit organization, from 2013 to 2015. Board member of the Russell Exchange Traded Fund Trust from 2011 to 2012. Director of Barclays Global Investors Holdings Deutschland GmbH from 2006 to 2009. Mr. Polisson is an attorney and has a retired status with the Massachusetts and District of Columbia Bar Associations. | | Asset Allocation Trust |
Michael S. Scofield (Born 1943) | | Trustee, since 2010 | | Served on the Investment Company Institute’s Board of Governors and Executive Committee from 2008-2011 as well the Governing Council of the Independent Directors Council from 2006-2011 and the Independent Directors Council Executive Committee from 2008-2011. Trustee of the Evergreen Fund complex (and its predecessors) from 1984 to 2010. Chairman of the Evergreen Funds from 2000-2010. Former Trustee of the Mentor Funds. Retired Attorney, Law Offices of Michael S. Scofield. | | Asset Allocation Trust |
Pamela Wheelock***** (Born 1959) | | Trustee, since 2018; Advisory Board Member, from 2017 to 2018 | | Chief Operating Officer, Twin Cities Habitat for Humanity, since January, 2017. Vice President of University Services, University of Minnesota from 2012 to 2017. Prior thereto, Interim President and Chief Executive Officer of Blue Cross Blue Shield of Minnesota from 2010 to 2011, Chairman of the Board from 2009 to 2011 and Board Director from 2003 to 2015. Vice President, Leadership and Community Engagement, Bush Foundation, Saint Paul, Minnesota (a private foundation) from 2009 to 2011. Executive Vice President and Chief Financial Officer, Minnesota Sports and Entertainment from 2004 to 2009 and Senior Vice President from 2002 to 2004. Commissioner of Finance, State of Minnesota, from 1999 to 2002. Currently on the Board of Directors, Governance Committee and Finance Committee, for the Minnesota Philanthropy Partners (Saint Paul Foundation) since 2012 and Board Chair of the Minnesota Wild Foundation since 2010. | | Asset Allocation Trust |
| * | Length of service dates reflect the Trustee’s commencement of service with the Trust’s predecessor entities, where applicable. |
| ** | Jane Freeman became Chair Liaison effective January 1, 2018. |
| *** | Olivia Mitchell became Chairman of the Governance Committee effective January 1, 2018. |
| **** | Timothy Penny became Chairman effective January 1, 2018. |
| ***** | James Polisson and Pamela Wheelock each became a Trustee effective January 1, 2018. |
| | | | |
| 32 | | Wells Fargo Small Cap Core Fund | | Other information (unaudited) |
Officers
| | | | | | |
Name and
year of birth | | Position held and
length of service | | Principal occupations during past five years or longer | | |
Andrew Owen (Born 1960) | | President, since 2017 | | Executive Vice President of Wells Fargo & Company and Head of Affiliated Managers, Wells Fargo Asset Management, since 2014. In addition, Mr. Owen is currently President, Chief Executive Officer and Director of Wells Fargo Funds Management, LLC since 2017. Prior thereto, Executive Vice President responsible for marketing, investments and product development for Wells Fargo Funds Management, LLC, from 2009 to 2014. | | |
Nancy Wiser1 (Born 1967) | | Treasurer, since 2012 | | Executive Vice President of Wells Fargo Funds Management, LLC since 2011. Chief Operating Officer and Chief Compliance Officer at LightBox Capital Management LLC, from 2008 to 2011. | | |
Alexander Kymn* (Born 1973) | | Secretary, since 2018; Chief Legal Officer, since 2018 | | Senior Company Counsel of Wells Fargo Bank, N.A. since 2018 (previously Senior Counsel from 2007 to 2018). Vice President of Wells Fargo Funds Management, LLC from 2008 to 2014. | | |
C. David Messman** (Born 1960) | | Secretary, since 2000; Chief Legal Officer, since 2003 | | Senior Vice President and Secretary of Wells Fargo Funds Management, LLC since 2001. Assistant General Counsel of Wells Fargo Bank, N.A. since 2013 and Vice President and Managing Counsel of Wells Fargo Bank, N.A. from 1996 to 2013. | | |
Michael H. Whitaker (Born 1967) | | Chief Compliance Officer, since 2016 | | Senior Vice President and Chief Compliance Officer since 2016. Senior Vice President and Chief Compliance Officer for Fidelity Investments from 2007 to 2016. | | |
David Berardi (Born 1975) | | Assistant Treasurer, since 2009 | | Vice President of Wells Fargo Funds Management, LLC since 2009. Vice President of Evergreen Investment Management Company, LLC from 2008 to 2010. Manager of Fund Reporting and Control for Evergreen Investment Management Company, LLC from 2004 to 2010. | | |
Jeremy DePalma1 (Born 1974) | | Assistant Treasurer, since 2009 | | Senior Vice President of Wells Fargo Funds Management, LLC since 2009. Senior Vice President of Evergreen Investment Management Company, LLC from 2008 to 2010 and head of the Fund Reporting and Control Team within Fund Administration from 2005 to 2010. | | |
| 1 | Nancy Wiser acts as Treasurer of 77 funds in the Fund Complex. Jeremy DePalma acts as Treasurer of 76 funds and Assistant Treasurer of 77 funds in the Fund Complex. |
| 2 | The Statement of Additional Information includes additional information about the Trustees and is available, without charge, upon request, by calling 1-800-222-8222 or by visiting the website at wellsfargofunds.com. |
| * | Alexander Kymn became the Secretary and Chief Legal Officer effective April 17, 2018. |
| ** | David Messman was the Secretary and Chief Legal Officer until April 16, 2018. |
| | | | | | |
| List of abbreviations | | Wells Fargo Small Cap Core Fund | | | 33 | |
The following is a list of common abbreviations for terms and entities that may have appeared in this report.
| ACA | — ACA Financial Guaranty Corporation |
| ADR | — American depositary receipt |
| ADS | — American depositary shares |
| AGC | — Assured Guaranty Corporation |
| AGM | — Assured Guaranty Municipal |
| Ambac | — Ambac Financial Group Incorporated |
| AMT | — Alternative minimum tax |
| BAN | — Bond anticipation notes |
| BHAC | — Berkshire Hathaway Assurance Corporation |
| CAB | — Capital appreciation bond |
| CCAB | — Convertible capital appreciation bond |
| CDA | — Community Development Authority |
| CDO | — Collateralized debt obligation |
| CLO | — Collateralized loan obligation |
| DRIVER | — Derivative inverse tax-exempt receipts |
| DW&P | — Department of Water & Power |
| DWR | — Department of Water Resources |
| ECFA | — Educational & Cultural Facilities Authority |
| EDA | — Economic Development Authority |
| EDFA | — Economic Development Finance Authority |
| ETF | — Exchange-traded fund |
| FDIC | — Federal Deposit Insurance Corporation |
| FFCB | — Federal Farm Credit Banks |
| FGIC | — Financial Guaranty Insurance Corporation |
| FHA | — Federal Housing Administration |
| FHLB | — Federal Home Loan Bank |
| FHLMC | — Federal Home Loan Mortgage Corporation |
| FICO | — The Financing Corporation |
| FNMA | — Federal National Mortgage Association |
| GDR | — Global depositary receipt |
| GNMA | — Government National Mortgage Association |
| HCFR | — Healthcare facilities revenue |
| HEFA | — Health & Educational Facilities Authority |
| HEFAR | — Higher education facilities authority revenue |
| HFA | — Housing Finance Authority |
| HFFA | — Health Facilities Financing Authority |
| HUD | — Department of Housing and Urban Development |
| IDA | — Industrial Development Authority |
| IDAG | — Industrial Development Agency |
| KRW | — Republic of Korea won |
| LIBOR | — London Interbank Offered Rate |
| LIFER | — Long Inverse Floating Exempt Receipts |
| LLC | — Limited liability company |
| LLLP | — Limited liability limited partnership |
| LLP | — Limited liability partnership |
| MBIA | — Municipal Bond Insurance Association |
| MFHR | — Multifamily housing revenue |
| MSTR | — Municipal securities trust receipts |
| MUD | — Municipal Utility District |
| National | — National Public Finance Guarantee Corporation |
| PCFA | — Pollution Control Financing Authority |
| PCL | — Public Company Limited |
| PCR | — Pollution control revenue |
| PFA | — Public Finance Authority |
| PFFA | — Public Facilities Financing Authority |
| PFOTER | — Puttable floating option tax-exempt receipts |
| PJSC | — Public Joint Stock Company |
| plc | — Public limited company |
| PUTTER | — Puttable tax-exempt receipts |
| R&D | — Research & development |
| Radian | — Radian Asset Assurance |
| RAN | — Revenue anticipation notes |
| RDA | — Redevelopment Agency |
| RDFA | — Redevelopment Finance Authority |
| REIT | — Real estate investment trust |
| ROC | — Reset option certificates |
| SAVRS | — Select auction variable rate securities |
| SBA | — Small Business Authority |
| SDR | — Swedish depositary receipt |
| SFHR | — Single-family housing revenue |
| SFMR | — Single-family mortgage revenue |
| SIFMA | — Securities Industry and Financial Markets Association |
| SPA | — Standby purchase agreement |
| SPDR | — Standard & Poor’s Depositary Receipts |
| SPEAR | — Short Puttable Exempt Adjustable Receipts |
| STRIPS | — Separate trading of registered interest and |
| TAN | — Tax anticipation notes |
| TIPS | — Treasury inflation-protected securities |
| TRAN | — Tax revenue anticipation notes |
| TTFA | — Transportation Trust Fund Authority |
| TVA | — Tennessee Valley Authority |
This page is intentionally left blank.
This page is intentionally left blank.
This page is intentionally left blank.

For more information
More information about Wells Fargo Funds is available free upon request. To obtain literature, please write, email, visit the Fund’s website, or call:
Wells Fargo Funds
P.O. Box 8266
Boston, MA 02266-8266
Email: fundservice@wellsfargo.com
Website: wellsfargofunds.com
Individual investors: 1-800-222-8222
Retail investment professionals: 1-888-877-9275
Institutional investment professionals:
1-866-765-0778
This report and the financial statements contained herein are submitted for the general information of the shareholders of the Fund. If this report is used for promotional purposes, distribution of the report must be accompanied or preceded by a current prospectus. Before investing, please consider the investment objectives, risks, charges, and expenses of the investment. For a current prospectus and, if available, a summary prospectus, containing this information, call 1-800-222-8222 or visit the Fund’s website at wellsfargofunds.com. Read the prospectus carefully before you invest or send money.
Wells Fargo Asset Management (WFAM) is a trade name used by the asset management businesses of Wells Fargo & Company. Wells Fargo Funds Management, LLC, a wholly owned subsidiary of Wells Fargo & Company, provides investment advisory and administrative services for Wells Fargo Funds. Other affiliates of Wells Fargo & Company provide subadvisory and other services for the funds. The funds are distributed by Wells Fargo Funds Distributor, LLC, Member FINRA, an affiliate of Wells Fargo & Company. Neither Wells Fargo Funds Distributor nor Wells Fargo Funds Management holds fund shareholder accounts or assets. This material is for general informational and educational purposes only and is NOT intended to provide investment advice or a recommendation of any kind—including a recommendation for any specific investment, strategy, or plan.
NOT FDIC INSURED ◾ NO BANK GUARANTEE ◾ MAY LOSE VALUE
© 2018 Wells Fargo Funds Management, LLC. All rights reserved.
| | |
 | | 309982 05-18 A269/AR269 03-18 |
Annual Report
March 31, 2018

Wells Fargo Small Cap Opportunities Fund


Reduce clutter. Save trees.
Sign up for electronic delivery of prospectuses and shareholder reports at wellsfargo.com/advantagedelivery
Contents
The views expressed and any forward-looking statements are as of March 31, 2018, unless otherwise noted, and are those of the Fund managers and/or Wells Fargo Funds Management, LLC. Discussions of individual securities, or the markets generally, or any Wells Fargo Fund are not intended as individual recommendations. Future events or results may vary significantly from those expressed in any forward-looking statements. The views expressed are subject to change at any time in response to changing circumstances in the market. Wells Fargo Funds Management, LLC and the Fund disclaim any obligation to publicly update or revise any views expressed or forward-looking statements.
NOT FDIC INSURED ◾ NO BANK GUARANTEE ◾ MAY LOSE VALUE
| | | | |
| 2 | | Wells Fargo Small Cap Opportunities Fund | | Letter to shareholders (unaudited) |

Andrew Owen
President
Wells Fargo Funds
Dear Shareholder:
We are pleased to offer you this annual report for the Wells Fargo Small Cap Opportunities Fund for the 12-month period that ended March 31, 2018. During the last three quarters of 2017, investors enjoyed consistently rising equity values globally. Short-term interest rates tended to increase, while long-term rates remained flat to lower. During the final two months of the first quarter of 2018, equity market volatility returned, stocks reversed year-to-date gains, and bond yields rose while prices fell.
For the period, U.S. stocks, as measured by the S&P 500 Index,1 gained 13.99% and international stocks, as measured by the MSCI ACWI ex USA Index (Net),2 added 16.53%. Emerging market stocks, as measured by the MSCI EM Index (Net),3 added 24.93%. In bond markets, the Bloomberg Barclays U.S. Aggregate Bond Index4 added 1.20% and the Bloomberg Barclays Municipal Bond Index5 added 2.66% while fixed-income investments outside the U.S. gained 11.75%, according to the Bloomberg Barclays Global Aggregate ex-USD Index.6 The ICE BofAML U.S. High Yield Index7 earned 3.69%.
Through the last nine months of 2017, stocks advanced on synchronized global growth, which led to higher investor and consumer confidence. The first quarter of 2018 began with strong stock market gains in January. A strong January 2018 U.S. employment report and inflation concerns prompted equity volatility in February. Investor optimism for growth was supplanted with concerns over trade tensions, increased interest rates, and the prospect of new data privacy regulations.
Reactions to U.S. interest rate increases were uneven across the yield curve and globally.
The U.S. Federal Reserve (Fed) increased the federal funds rate three times during the 12-month period for a combined 75 basis points (bps; 100 bps equals 1.00%). Following an increase in March 2017, short-term bond yields in the U.S. rose while longer-term Treasury yields were little changed. Municipal bond returns were positive, helped by strong demand and constrained new-issue supply. The Fed raised the target interest rate once again in June 2017 to a range of 1.00% to 1.25%. Ten-year U.S. Treasury yields declined, the yield curve flattened, and long-term bond prices benefited.
| 1 | The S&P 500 Index consists of 500 stocks chosen for market size, liquidity, and industry group representation. It is a market-value-weighted index with each stock’s weight in the index proportionate to its market value. You cannot invest directly in an index. |
| 2 | The Morgan Stanley Capital International (MSCI) All Country World Index (ACWI) ex USA Index (Net) is a free-float-adjusted market-capitalization-weighted index that is designed to measure the equity market performance of developed markets, excluding the United States and Canada. Source: MSCI. MSCI makes no express or implied warranties or representations and shall have no liability whatsoever with respect to any MSCI data contained herein. The MSCI data may not be further redistributed or used as a basis for other indices or any securities or financial products. This report is not approved, reviewed, or produced by MSCI. You cannot invest directly in an index. |
| 3 | The MSCI Emerging Markets (EM) Index (Net) is a free-float-adjusted market-capitalization-weighted index that is designed to measure large- and mid-cap equity market performance of emerging markets. The MSCI EM Index (Net) consists of the following 24 emerging market country indices: Brazil, Chile, China, Colombia, Czech Republic, Egypt, Greece, Hungary, India, Indonesia, Korea, Malaysia, Mexico, Pakistan, Peru, the Philippines, Poland, Qatar, Russia, South Africa, Taiwan, Thailand, Turkey, and the United Arab Emirates. You cannot invest directly in an index. |
| 4 | The Bloomberg Barclays U.S. Aggregate Bond Index is a broad-based benchmark that measures the investment-grade, U.S. dollar-denominated, fixed-rate taxable bond market, including Treasuries, government-related and corporate securities, mortgage-backed securities (agency fixed-rate and hybrid adjustable-rate mortgage pass-throughs), asset-backed securities, and commercial mortgage-backed securities. You cannot invest directly in an index. |
| 5 | The Bloomberg Barclays Municipal Bond Index is an unmanaged index composed of long-term tax-exempt bonds with a minimum credit rating of Baa. You cannot invest directly in an index. |
| 6 | The Bloomberg Barclays Global Aggregate ex-USD Index is an unmanaged index that provides a broad-based measure of the global investment-grade fixed-income markets excluding the U.S. dollar-denominated debt market. You cannot invest directly in an index. |
| 7 | The ICE BofAML U.S. High Yield Index is a market-capitalization-weighted index of domestic and Yankee high-yield bonds. The index tracks the performance of high-yield securities traded in the U.S. bond market. You cannot invest directly in an index. Copyright 2018. ICE Data Indices, LLC. All rights reserved. |
| | | | | | |
| Letter to shareholders (unaudited) | | Wells Fargo Small Cap Opportunities Fund | | | 3 | |
Internationally, central banks maintained low interest rates and accommodative monetary policies that supported business activity and stock values in foreign markets. A weaker U.S. dollar was generally supportive of business activity in regions around the globe. The Bank of Japan continued its accommodative monetary policies, and industrial production, retail sales, and fixed asset investment increased in China.
Growth continued through the summer of 2017.
Globally, stocks moved higher during the third quarter of 2017. Low inflation and interest rates supported accelerating global economic growth and corporate earnings. Brief episodes of geopolitical tensions, often associated with North Korea’s advancing nuclear missile program, flaring conflicts in the Middle East, and uncertainty surrounding U.S. trade policies, did not discourage investing activity.
In the U.S., economic data released during the quarter reflected a generally healthy economy. Second-quarter economic output grew at a 3.1% annual rate. Stocks in international developed and emerging markets continued to benefit from improving economic growth.
Positive economic and market news continued as 2017 closed and 2018 began.
During the fourth quarter of 2017, stock markets continued the move higher. Third-quarter economic output in the U.S. grew at a 3.2% annual rate. The unemployment rate fell to a 17-year low of 4.1%. Tax reform passed and wage growth data improved, encouraging increased business and consumer spending.
Fed officials announced in October 2017 plans to begin unwinding its $4.5 trillion portfolio of bonds and other assets accumulated during rounds of quantitative easing conducted since the 2008–2009 recession. Still, restrained inflation kept long-term bond rates steady and the flattened yield curve persisted. The Fed raised the federal funds rate target to a range of 1.25% to 1.50% in December 2017 and began selling bonds held in its portfolio.
2018 opened with continued stock advances, then volatility.
Improving business and economic data globally continued to support stocks through January 2018. Political wrangling in the U.S. over budget resolutions could not dissuade investors from buying stocks as payrolls and factory orders increased. Long-term interest rates in the U.S. trended higher as the yield curve steepened—the 10-year Treasury rate moved from 2.46% to 2.84% and the 30-year rate moved from 2.81% to 3.08% during January 2018.
Investor sentiment shifted in February as inflation concerns emerged in the U.S. when readings from the Producer Price Index in January rose 2.5% year over year. During February, the U.S. market endured a loss from January’s high of nearly 12% before recovering much of that loss. The Fed raised the federal funds rate in March 2018. Bond yields rose across the yield curve.
During January 2018, purchasing managers’ indices in China, the eurozone, India, and Japan reported data for December that indicated continued growth. Despite positive economic signals and business fundamentals, international stock values fell during February and March 2018, swept up in the selling momentum in U.S. markets.
Globally, stocks moved higher during the third quarter of 2017.
During February, the U.S. market endured a loss from January’s high of nearly 12% before recovering much of that loss.
| | | | |
| 4 | | Wells Fargo Small Cap Opportunities Fund | | Letter to shareholders (unaudited) |
Don’t let short-term uncertainty derail long-term investment goals.
Periods of investment uncertainty can present challenges, but experience has taught us that maintaining long-term investment goals can be an effective way to plan for the future. To help you create a sound strategy based on your personal goals and risk tolerance, Wells Fargo Funds offers more than 100 mutual funds spanning a wide range of asset classes and investment styles. Although diversification cannot guarantee an investment profit or prevent losses, we believe it can be an effective way to manage investment risk and potentially smooth out overall portfolio performance. We encourage investors to know their investments and to understand that appropriate levels of risk-taking may unlock opportunities.
Thank you for choosing to invest with Wells Fargo Funds. We appreciate your confidence in us and remain committed to helping you meet your financial needs.
Sincerely,

Andrew Owen
President
Wells Fargo Funds
For further information about your Fund, contact your investment professional, visit our website at wellsfargofunds.com, or call us directly at 1-800-222-8222.
This page is intentionally left blank.
| | | | |
| 6 | | Wells Fargo Small Cap Opportunities Fund | | Performance highlights (unaudited) |
Investment objective
The Fund seeks long-term capital appreciation.
Manager
Wells Fargo Funds Management, LLC
Subadviser
Schroder Investment Management North America Inc.
Portfolio managers
Jenny B. Jones
Robert Kaynor, CFA®‡
Average annual total returns (%) as of March 31, 20181
| | | | | | | | | | | | | | | | | | | | | | |
| | | | | | | | | | | | | | Expense ratios2 (%) | |
| | | Inception date | | 1 year | | | 5 year | | | 10 year | | | Gross | | | Net3 | |
| Class R6 (WSCJX) | | 10-31-2016 | | | 8.95 | | | | 12.08 | | | | 9.68 | | | | 1.00 | | | | 0.92 | |
| Administrator Class (NVSOX) | | 8-1-1993 | | | 8.52 | | | | 11.84 | | | | 9.57 | | | | 1.35 | | | | 1.27 | |
| Institutional Class (WSCOX) | | 10-31-2014 | | | 8.81 | | | | 12.04 | | | | 9.67 | | | | 1.10 | | | | 1.02 | |
| Russell 2000® Index4 | | – | | | 11.79 | | | | 11.47 | | | | 9.84 | | | | – | | | | – | |
Figures quoted represent past performance, which is no guarantee of future results, and do not reflect taxes that a shareholder may pay on fund distributions or the redemption of fund shares. Investment return and principal value of an investment will fluctuate so that an investor’s shares, when redeemed, may be worth more or less than their original cost. Performance shown without sales charges would be lower if sales charges were reflected. Current performance may be lower or higher than the performance data quoted, which assumes the reinvestment of dividends and capital gains. Current month-end performance is available on the Fund’s website, wellsfargofunds.com.
Index returns do not include transaction costs associated with buying and selling securities, any mutual fund fees or expenses, or any taxes. It is not possible to invest directly in an index.
Class R6, Administrator Class, and Institutional Class shares are sold without a front-end sales charge or contingent deferred sales charge.
Stock values fluctuate in response to the activities of individual companies and general market and economic conditions. Smaller-company stocks tend to be more volatile and less liquid than those of larger companies. The use of derivatives may reduce returns and/or increase volatility. Consult the Fund’s prospectus for additional information on these and other risks.
Please see footnotes on page 7.
| | | | | | |
| Performance highlights (unaudited) | | Wells Fargo Small Cap Opportunities Fund | | | 7 | |
|
| Growth of $1,000,000 investment as of March 31, 20185 |
|
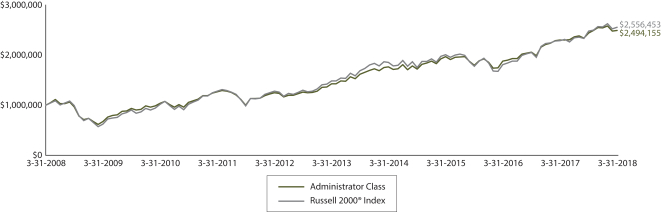 |
| ‡ | Mr. Kaynor became a portfolio manager of the Fund on January 12, 2018. |
| 1 | Historical performance shown for Class R6 shares prior to their inception reflects the performance of the Institutional Class shares, and is not adjusted to reflect the expenses of Class R6. If these expenses had been included, returns for Class R6 would be higher. Historical performance shown for the Institutional Class shares prior to their inception reflects the performance of the Administrator Class shares, and is not adjusted to reflect the expenses of the Institutional Class. If these expenses had been included, returns for the Institutional Class shares would be higher. |
| 2 | Reflects the expense ratios as stated in the most recent prospectuses, which include the impact of 0.07% in acquired fund fees and expenses. The expense ratios shown are subject to change and may differ from the annualized expense ratios shown in the financial highlights of this report, which do not include acquired fund fees and expenses. |
| 3 | The manager has contractually committed through July 31, 2018, to waive fees and/or reimburse expenses to the extent necessary to cap the Fund’s Total Annual Fund Operating Expenses After Fee Waivers at 0.85% for Class R6, 1.20% for Administrator Class, and 0.95% for Institutional Class. After this time, the cap may be increased or the commitment to maintain the cap may be terminated only with the approval of the Board of Trustees. Brokerage commissions, stamp duty fees, interest, taxes, acquired fund fees and expenses (if any), and extraordinary expenses are excluded from the expense cap. Without this cap, the Fund’s returns would have been lower. The expense ratio paid by an investor is the net expense ratio (the total annual fund operating expenses after fee waivers) as stated in the prospectuses. |
| 4 | The Russell 2000® Index measures the performance of the 2,000 smallest companies in the Russell 3000® Index, which represents approximately 8% of the total market capitalization of the Russell 3000® Index. You cannot invest directly in an index. |
| 5 | The chart compares the performance of Administrator Class shares for the most recent ten years with the Russell 2000® Index. The chart assumes a hypothetical investment of $1,000,000 in Administrator Class shares and reflects all operating expenses. |
| 6 | The ten largest holdings, excluding cash and cash equivalents, are calculated based on the value of the investments divided by total net assets of the Fund. Holdings are subject to change and may have changed since the date specified. |
| 7 | Amounts are calculated based on the total long-term investments of the Fund. These amounts are subject to change and may have changed since the date specified. |
| * | This security was no longer held at the end of the reporting period. |
| | | | |
| 8 | | Wells Fargo Small Cap Opportunities Fund | | Performance highlights (unaudited) |
MANAGER’S DISCUSSION
Fund highlights
| ∎ | | The Fund underperformed its benchmark, the Russell 2000® Index, for the 12-month period that ended March 31, 2018. |
| ∎ | | Negative stock selection occurred most significantly within the health care, industrials, and consumer discretionary sectors. The Fund’s allocation to cash also hindered performance. |
| ∎ | | The Fund benefited from positive stock selection in the energy, information technology (IT), and real estate sectors. |
| ∎ | | The index rose by 11.79% for the reporting period. The broader market was driven by large-cap, growth, and momentum stocks. |
A strong economy and tax bill stimulus sent U.S. stocks climbing higher.
The U.S. economy was generally positive, as seen in a number of data points. The employment picture remained strong. The Institute for Supply Management Nonmanufacturing Index remained in expansionary territory. Small business confidence (as measured by the National Federation of Independent Business Optimism Index) set an average-monthly-optimism record over the period (there is a 45-year history for this measure). One highlight was third-quarter gross domestic product expanding at a 3.2% annual rate ahead of the 2.6% consensus. The year ended with retail sales rising ahead of consensus, with global Purchasing Managers’ Index readings also strong. The government also is adding stimulus to the economy from the recently passed $1.3 trillion U.S. budget. However, the period ended with a spike in volatility as talks of tariffs and trade wars have spooked investors.
We made several changes to the Fund’s portfolio during the period.
The most noteworthy change to the Fund’s portfolio during the period was a weighting shift in the Fund’s health care sector from a slight underweight to a more significant underweight. This was due to a surge in the biotechnology sector, which rallied over 34% in the period (within the index) and now accounts for 39% of the index’s health care sector weight. The Fund increased its exposure to both the IT and financials sectors over the quarter. Within financials, the Fund added new positions in regional banks CenterState Bank Corporation, Union Bankshares Corporation, and First Merchants Corporation. The Fund also purchased two new stocks in internet services and software IT services: Carbonite, Incorporated, and CSG Systems International, Incorporated.
| | | | |
| Ten largest holdings (%) as of March 31, 20186 | |
Chemical Financial Corporation | | | 1.41 | |
First Citizens BancShares Corporation Class A | | | 1.30 | |
Terreno Realty Corporation | | | 1.29 | |
CoreLogic Incorporated | | | 1.29 | |
Hexcel Corporation | | | 1.29 | |
ServiceMaster Global Holdings Incorporated | | | 1.29 | |
Entegris Incorporated | | | 1.29 | |
Catalent Incorporated | | | 1.26 | |
Cavco Industries Incorporated | | | 1.24 | |
Ashland Global Holdings Incorporated | | | 1.24 | |
Stock selection in the health care and consumer discretionary sectors detracted from Fund performance.
Stock selection was negative for the reporting period, especially in the health care and consumer discretionary sectors. The lag in consumer discretionary was largely due to our position in AMC Entertainment Holdings, Incorporated*. Within health care, underperformance was a result of an underweight to the biotechnology industry, which rose over 34% within the index during the period, as well as stock selection. The Fund’s position in Otonomy, Incorporated*, and not holding Kite Pharma, Incorporated, and Nektar Therapeutics detracted from returns. The strategy’s average cash position of 7.4% also detracted from returns.
Holdings within the energy sector contributed to the Fund’s performance for the period, as did select IT holdings.
Key stock contributors were led by Match Group, Incorporated; Catalent, Incorporated; and ON Semiconductor Corporation. Match Group, a provider of online dating services, is continuing to add value after reporting a series of better-than-expected earnings results. Match Group’s Tinder Gold mobile application continues to deliver growth, and the core Match business has stabilized. Contract manufacturing organization Catalent outperformed after a competitor received a buyout offer at a significant premium and after reporting a series of strong earnings and reaffirming guidance. ON Semiconductor, a designer and manufacturer of semiconductor components, rallied after reporting strong earnings, specifically among industrials sector clients, as well as issuing solid forward guidance.
The strategy also benefited from underweights to real estate and consumer staples.
Please see footnotes on page 7.
| | | | | | |
| Performance highlights (unaudited) | | Wells Fargo Small Cap Opportunities Fund | | | 9 | |
|
| Sector distribution as of March 31, 20187 |
|
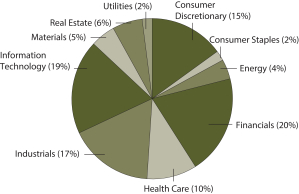 |
Valuations and potential trade tariffs remain concerns.
The impact of the tax reform bill and the fiscal stimulus from the new budget has driven earnings expectations higher. As a result, valuations have come down.
An interesting point is that after a decade of monetary policy driving growth, fiscal policy is now in the driver’s seat. Key recent headlines from Washington, at least as far as the market is concerned, center on trade issues. The proposed tariffs on foreign steel and aluminum, plus the additional tariffs proposed on an undetermined set of Chinese products, have spooked investors. The Chinese have quickly responded in kind, albeit in a measured fashion. We remind our investors to look at what the U.S. administration does and to not get caught up in various
headlines and tweets. To the extent that tariffs and trade wars materialize, this may likely be to the disadvantage of U.S. large- cap stocks, as a larger percentage of their revenues come from non-U.S. sources (36%) than small-cap companies (18%).
Please see footnotes on page 7.
| | | | |
| 10 | | Wells Fargo Small Cap Opportunities Fund | | Fund expenses (unaudited) |
As a shareholder of the Fund, you incur two types of costs: (1) transaction costs, including sales charges (loads) on purchase payments and contingent deferred sales charges (if any) on redemptions and (2) ongoing costs, including management fees, distribution (12b-1) and/or shareholder servicing fees, and other Fund expenses. This example is intended to help you understand your ongoing costs (in dollars) of investing in the Fund and to compare these costs with the ongoing costs of investing in other mutual funds.
The example is based on an investment of $1,000 invested at the beginning of the six-month period and held for the entire period from October 1, 2017 to March 31, 2018.
Actual expenses
The “Actual” line of the table below provides information about actual account values and actual expenses. You may use the information in this line, together with the amount you invested, to estimate the expenses that you paid over the period. Simply divide your account value by $1,000 (for example, an $8,600 account value divided by $1,000 = 8.6), then multiply the result by the number in the “Actual” line under the heading entitled “Expenses paid during period” for your applicable class of shares to estimate the expenses you paid on your account during this period.
Hypothetical example for comparison purposes
The “Hypothetical” line of the table below provides information about hypothetical account values and hypothetical expenses based on the Fund’s actual expense ratio and an assumed rate of return of 5% per year before expenses, which is not the Fund’s actual return. The hypothetical account values and expenses may not be used to estimate the actual ending account balance or expenses you paid for the period. You may use this information to compare the ongoing costs of investing in the Fund and other funds. To do so, compare this 5% hypothetical example with the 5% hypothetical examples that appear in the shareholder reports of the other funds.
Please note that the expenses shown in the table are meant to highlight your ongoing costs only and do not reflect any transactional costs, such as sales charges (loads) and contingent deferred sales charges. Therefore, the “Hypothetical” line of the table is useful in comparing ongoing costs only and will not help you determine the relative total costs of owning different funds. In addition, if these transactional costs were included, your costs would have been higher.
| | | | | | | | | | | | | | | | |
| | | Beginning
account value
10-1-2017 | | | Ending
account value
3-31-2018 | | | Expenses
paid during
the period¹ | | | Annualized net
expense ratio | |
Class R6 | | | | | | | | | | | | | | | | |
Actual | | $ | 1,000.00 | | | $ | 1,023.31 | | | $ | 4.29 | | | | 0.85 | % |
Hypothetical (5% return before expenses) | | $ | 1,000.00 | | | $ | 1,020.69 | | | $ | 4.28 | | | | 0.85 | % |
Administrator Class | | | | | | | | | | | | | | | | |
Actual | | $ | 1,000.00 | | | $ | 1,021.27 | | | $ | 6.05 | | | | 1.20 | % |
Hypothetical (5% return before expenses) | | $ | 1,000.00 | | | $ | 1,018.95 | | | $ | 6.04 | | | | 1.20 | % |
Institutional Class | | | | | | | | | | | | | | | | |
Actual | | $ | 1,000.00 | | | $ | 1,022.80 | | | $ | 4.79 | | | | 0.95 | % |
Hypothetical (5% return before expenses) | | $ | 1,000.00 | | | $ | 1,020.19 | | | $ | 4.78 | | | | 0.95 | % |
| 1 | Expenses paid is equal to the annualized net expense ratio of each class multiplied by the average account value over the period, multiplied by the number of days in the most recent fiscal half-year divided by the number of days in the fiscal year (to reflect the one-half-year period). |
| | | | | | |
| Portfolio of investments—March 31, 2018 | | Wells Fargo Small Cap Opportunities Fund | | | 11 | |
| | | | | | | | | | | | | | | | |
| Security name | | | | | | | | Shares | | | Value | |
| | | | |
Common Stocks: 91.61% | | | | | | | | | | | | | | | | |
| | | | |
Consumer Discretionary: 13.81% | | | | | | | | | | | | | | | | |
| | | | |
| Auto Components: 1.34% | | | | | | | | | | | | | | | | |
Gentherm Incorporated † | | | | | | | | | | | 39,131 | | | $ | 1,328,497 | |
Standard Motor Products Incorporated | | | | | | | | | | | 23,503 | | | | 1,118,038 | |
| | | | |
| | | | | | | | | | | | | | | 2,446,535 | |
| | | | | | | | | | | | | | | | |
| | | | |
| Diversified Consumer Services: 2.17% | | | | | | | | | | | | | | | | |
Graham Holdings Company Class B | | | | | | | | | | | 2,696 | | | | 1,623,666 | |
ServiceMaster Global Holdings Incorporated † | | | | | | | | | | | 46,394 | | | | 2,359,135 | |
| | | | |
| | | | | | | | | | | | | | | 3,982,801 | |
| | | | | | | | | | | | | | | | |
| | | | |
| Hotels, Restaurants & Leisure: 2.55% | | | | | | | | | | | | | | | | |
Extended Stay America Incorporated | | | | | | | | | | | 4,372 | | | | 86,434 | |
Jack in the Box Incorporated | | | | | | | | | | | 7,657 | | | | 653,372 | |
Playags Incorporated † | | | | | | | | | | | 50,634 | | | | 1,177,747 | |
Red Rock Resorts Incorporated Class A | | | | | | | | | | | 30,571 | | | | 895,119 | |
The Cheesecake Factory Incorporated « | | | | | | | | | | | 38,604 | | | | 1,861,485 | |
| | | | |
| | | | | | | | | | | | | | | 4,674,157 | |
| | | | | | | | | | | | | | | | |
| | | | |
| Household Durables: 1.48% | | | | | | | | | | | | | | | | |
Cavco Industries Incorporated † | | | | | | | | | | | 13,045 | | | | 2,266,569 | |
Helen of Troy Limited † | | | | | | | | | | | 5,063 | | | | 440,481 | |
| | | | |
| | | | | | | | | | | | | | | 2,707,050 | |
| | | | | | | | | | | | | | | | |
| | | | |
| Leisure Products: 1.15% | | | | | | | | | | | | | | | | |
The Brunswick Corporation | | | | | | | | | | | 35,445 | | | | 2,105,079 | |
| | | | | | | | | | | | | | | | |
| | | | |
| Media: 0.94% | | | | | | | | | | | | | | | | |
Hemisphere Media Group Incorporated † | | | | | | | | | | | 41,780 | | | | 470,025 | |
MDC Partners Incorporated Class A † | | | | | | | | | | | 173,057 | | | | 1,246,010 | |
| | | | |
| | | | | | | | | | | | | | | 1,716,035 | |
| | | | | | | | | | | | | | | | |
| | | | |
| Specialty Retail: 1.92% | | | | | | | | | | | | | | | | |
Asbury Automotive Group Incorporated † | | | | | | | | | | | 22,026 | | | | 1,486,755 | |
Caleres Incorporated | | | | | | | | | | | 30,492 | | | | 1,024,531 | |
Hudson Limited Class A †« | | | | | | | | | | | 63,669 | | | | 1,012,974 | |
| | | | |
| | | | | | | | | | | | | | | 3,524,260 | |
| | | | | | | | | | | | | | | | |
| | | | |
| Textiles, Apparel & Luxury Goods: 2.26% | | | | | | | | | | | | | | | | |
Oxford Industries Incorporated | | | | | | | | | | | 29,475 | | | | 2,197,656 | |
Steven Madden Limited | | | | | | | | | | | 44,364 | | | | 1,947,580 | |
| | | | |
| | | | | | | | | | | | | | | 4,145,236 | |
| | | | | | | | | | | | | | | | |
| | | | |
Consumer Staples: 2.05% | | | | | | | | | | | | | | | | |
| | | | |
| Food & Staples Retailing: 0.80% | | | | | | | | | | | | | | | | |
Performance Food Group Company † | | | | | | | | | | | 49,193 | | | | 1,468,411 | |
| | | | | | | | | | | | | | | | |
The accompanying notes are an integral part of these financial statements.
| | | | |
| 12 | | Wells Fargo Small Cap Opportunities Fund | | Portfolio of investments—March 31, 2018 |
| | | | | | | | | | | | | | | | |
| Security name | | | | | | | | Shares | | | Value | |
| | | | |
| Food Products: 1.25% | | | | | | | | | | | | | | | | |
Darling Ingredients Incorporated † | | | | | | | | | | | 51,220 | | | $ | 886,106 | |
Hain Celestial Group Incorporated † | | | | | | | | | | | 43,657 | | | | 1,400,080 | |
| | | | |
| | | | | | | | | | | | | | | 2,286,186 | |
| | | | | | | | | | | | | | | | |
| | | | |
Energy: 3.20% | | | | | | | | | | | | | | | | |
| | | | |
| Energy Equipment & Services: 1.29% | | | | | | | | | | | | | | | | |
ProPetro Holding Corporation †« | | | | | | | | | | | 94,135 | | | | 1,495,805 | |
Solaris Oilfield Infrastructure Incorporated Class A † | | | | | | | | | | | 52,232 | | | | 864,962 | |
| | | | |
| | | | | | | | | | | | | | | 2,360,767 | |
| | | | | | | | | | | | | | | | |
| | | | |
| Oil, Gas & Consumable Fuels: 1.91% | | | | | | | | | | | | | | | | |
Centennial Resource Development Class A †« | | | | | | | | | | | 42,458 | | | | 779,104 | |
Jagged Peak Energy Incorporated † | | | | | | | | | | | 1,291 | | | | 18,242 | |
Ring Energy Incorporated † | | | | | | | | | | | 14,578 | | | | 209,194 | |
SRC Energy Incorporated † | | | | | | | | | | | 177,157 | | | | 1,670,591 | |
World Fuel Services Corporation | | | | | | | | | | | 33,671 | | | | 826,623 | |
| | | | |
| | | | | | | | | | | | | | | 3,503,754 | |
| | | | | | | | | | | | | | | | |
| | | | |
Financials: 18.45% | | | | | | | | | | | | | | | | |
| | | | |
| Banks: 12.22% | | | | | | | | | | | | | | | | |
CenterState Banks Incorporated | | | | | | | | | | | 36,379 | | | | 965,135 | |
Chemical Financial Corporation | | | | | | | | | | | 47,123 | | | | 2,576,683 | |
First Citizens BancShares Corporation Class A | | | | | | | | | | | 5,767 | | | | 2,383,155 | |
First Horizon National Corporation | | | | | | | | | | | 104,450 | | | | 1,966,794 | |
First Merchants Corporation | | | | | | | | | | | 35,835 | | | | 1,494,320 | |
First Midwest Bancorp Incorporated | | | | | | | | | | | 90,624 | | | | 2,228,444 | |
Heritage Financial Corporation | | | | | | | | | | | 54,067 | | | | 1,654,450 | |
Lakeland Financial Corporation | | | | | | | | | | | 22,047 | | | | 1,019,233 | |
Simmons First National Corporation Class A | | | | | | | | | | | 40,684 | | | | 1,157,460 | |
Union Bankshares Corporation | | | | | | | | | | | 17,856 | | | | 655,494 | |
United Community Bank | | | | | | | | | | | 68,831 | | | | 2,178,501 | |
Univest Corporation of Pennsylvania | | | | | | | | | | | 24,680 | | | | 683,636 | |
Westamerica Bancorporation « | | | | | | | | | | | 20,197 | | | | 1,173,042 | |
Western Alliance Bancorp † | | | | | | | | | | | 38,656 | | | | 2,246,300 | |
| | | | |
| | | | | | | | | | | | | | | 22,382,647 | |
| | | | | | | | | | | | | | | | |
| | | | |
| Capital Markets: 0.85% | | | | | | | | | | | | | | | | |
Golub Capital BDC Incorporated « | | | | | | | | | | | 87,099 | | | | 1,558,201 | |
| | | | | | | | | | | | | | | | |
| | | | |
| Diversified Financial Services: 0.83% | | | | | | | | | | | | | | | | |
Compass Diversified Holdings | | | | | | | | | | | 92,735 | | | | 1,520,854 | |
| | | | | | | | | | | | | | | | |
| | | | |
| Insurance: 4.55% | | | | | | | | | | | | | | | | |
Amerisafe Incorporated | | | | | | | | | | | 25,032 | | | | 1,383,018 | |
Brown & Brown Incorporated | | | | | | | | | | | 78,457 | | | | 1,995,946 | |
National General Holdings Corporation | | | | | | | | | | | 89,282 | | | | 2,170,445 | |
The accompanying notes are an integral part of these financial statements.
| | | | | | |
| Portfolio of investments—March 31, 2018 | | Wells Fargo Small Cap Opportunities Fund | | | 13 | |
| | | | | | | | | | | | | | | | |
| Security name | | | | | | | | Shares | | | Value | |
| | | | |
| Insurance (continued) | | | | | | | | | | | | | | | | |
ProAssurance Corporation | | | | | | | | | | | 17,705 | | | $ | 859,578 | |
Reinsurance Group of America Incorporated | | | | | | | | | | | 12,515 | | | | 1,927,310 | |
| | | | |
| | | | | | | | | | | | | | | 8,336,297 | |
| | | | | | | | | | | | | | | | |
| | | | |
Health Care: 9.56% | | | | | | | | | | | | | | | | |
| | | | |
| Biotechnology: 1.35% | | | | | | | | | | | | | | | | |
Flexion Therapeutics Incorporated †« | | | | | | | | | | | 42,297 | | | | 947,876 | |
Puma Biotechnology Incorporated † | | | | | | | | | | | 7,394 | | | | 503,162 | |
Repligen Corporation † | | | | | | | | | | | 28,363 | | | | 1,026,173 | |
| | | | |
| | | | | | | | | | | | | | | 2,477,211 | |
| | | | | | | | | | | | | | | | |
| | | | |
| Health Care Equipment & Supplies: 3.37% | | | | | | | | | | | | | | | | |
Dentsply Sirona Incorporated | | | | | | | | | | | 20,615 | | | | 1,037,141 | |
DexCom Incorporated †« | | | | | | | | | | | 18,753 | | | | 1,390,722 | |
K2M Group Holdings Incorporated † | | | | | | | | | | | 59,905 | | | | 1,135,200 | |
Masimo Corporation † | | | | | | | | | | | 10,390 | | | | 913,801 | |
Sientra Incorporated †« | | | | | | | | | | | 41,837 | | | | 404,145 | |
The Cooper Companies Incorporated | | | | | | | | | | | 4,132 | | | | 945,443 | |
West Pharmaceutical Services Incorporated | | | | | | | | | | | 3,889 | | | | 343,360 | |
| | | | |
| | | | | | | | | | | | | | | 6,169,812 | |
| | | | | | | | | | | | | | | | |
| | | | |
| Health Care Providers & Services: 0.31% | | | | | | | | | | | | | | | | |
Patterson Companies Incorporated « | | | | | | | | | | | 25,787 | | | | 573,245 | |
| | | | | | | | | | | | | | | | |
| | | | |
| Health Care Technology: 0.42% | | | | | | | | | | | | | | | | |
Teladoc Incorporated †« | | | | | | | | | | | 18,896 | | | | 761,509 | |
| | | | | | | | | | | | | | | | |
| | | | |
| Life Sciences Tools & Services: 1.98% | | | | | | | | | | | | | | | | |
Bio-Techne Corporation | | | | | | | | | | | 14,885 | | | | 2,248,230 | |
Syneos Health Incorporated † | | | | | | | | | | | 39,009 | | | | 1,384,820 | |
| | | | |
| | | | | | | | | | | | | | | 3,633,050 | |
| | | | | | | | | | | | | | | | |
| | | | |
| Pharmaceuticals: 2.13% | | | | | | | | | | | | | | | | |
Akorn Incorporated † | | | | | | | | | | | 27,339 | | | | 511,513 | |
Catalent Incorporated † | | | | | | | | | | | 56,334 | | | | 2,313,074 | |
Evolus Incorporated † | | | | | | | | | | | 39,808 | | | | 359,466 | |
Pacira Pharmaceuticals Incorporated † | | | | | | | | | | | 22,688 | | | | 706,731 | |
| | | | |
| | | | | | | | | | | | | | | 3,890,784 | |
| | | | | | | | | | | | | | | | |
| | | | |
Industrials: 15.31% | | | | | | | | | | | | | | | | |
| | | | |
| Aerospace & Defense: 1.85% | | | | | | | | | | | | | | | | |
Hexcel Corporation | | | | | | | | | | | 36,582 | | | | 2,362,831 | |
Maxar Technologies Limited | | | | | | | | | | | 22,053 | | | | 1,019,951 | |
| | | | |
| | | | | | | | | | | | | | | 3,382,782 | |
| | | | | | | | | | | | | | | | |
| | | | |
| Airlines: 1.21% | | | | | | | | | | | | | | | | |
Allegiant Travel Company | | | | | | | | | | | 7,758 | | | | 1,338,643 | |
Spirit Airlines Incorporated †« | | | | | | | | | | | 23,132 | | | | 873,927 | |
| | | | |
| | | | | | | | | | | | | | | 2,212,570 | |
| | | | | | | | | | | | | | | | |
The accompanying notes are an integral part of these financial statements.
| | | | |
| 14 | | Wells Fargo Small Cap Opportunities Fund | | Portfolio of investments—March 31, 2018 |
| | | | | | | | | | | | | | | | |
| Security name | | | | | | | | Shares | | | Value | |
| | | | |
| Building Products: 1.05% | | | | | | | | | | | | | | | | |
Fortune Brands Home & Security Incorporated | | | | | | | | | | | 13,418 | | | $ | 790,186 | |
Simpson Manufacturing Company Incorporated | | | | | | | | | | | 19,697 | | | | 1,134,350 | |
| | | | |
| | | | | | | | | | | | | | | 1,924,536 | |
| | | | | | | | | | | | | | | | |
| | | | |
| Commercial Services & Supplies: 1.33% | | | | | | | | | | | | | | | | |
Advanced Disposal Services Incorporated † | | | | | | | | | | | 56,188 | | | | 1,251,869 | |
Covanta Holding Corporation | | | | | | | | | | | 57,921 | | | | 839,855 | |
Knoll Incorporated | | | | | | | | | | | 17,496 | | | | 353,244 | |
| | | | |
| | | | | | | | | | | | | | | 2,444,968 | |
| | | | | | | | | | | | | | | | |
| | | | |
| Construction & Engineering: 1.87% | | | | | | | | | | | | | | | | |
Dycom Industries Incorporated † | | | | | | | | | | | 11,865 | | | | 1,277,030 | |
Valmont Industries Incorporated | | | | | | | | | | | 14,666 | | | | 2,145,636 | |
| | | | |
| | | | | | | | | | | | | | | 3,422,666 | |
| | | | | | | | | | | | | | | | |
| | | | |
| Electrical Equipment: 0.58% | | | | | | | | | | | | | | | | |
Generac Holdings Incorporated † | | | | | | | | | | | 23,106 | | | | 1,060,796 | |
| | | | | | | | | | | | | | | | |
| | | | |
| Machinery: 4.43% | | | | | | | | | | | | | | | | |
EnPro Industries Incorporated | | | | | | | | | | | 14,478 | | | | 1,120,308 | |
ESCO Technologies Incorporated | | | | | | | | | | | 28,817 | | | | 1,687,235 | |
Franklin Electric Company Incorporated | | | | | | | | | | | 47,076 | | | | 1,918,347 | |
IDEX Corporation | | | | | | | | | | | 13,461 | | | | 1,918,327 | |
Kornit Digital Limited †« | | | | | | | | | | | 15,523 | | | | 200,247 | |
REV Group Incorporated | | | | | | | | | | | 61,596 | | | | 1,278,733 | |
| | | | |
| | | | | | | | | | | | | | | 8,123,197 | |
| | | | | | | | | | | | | | | | |
| | | | |
| Professional Services: 1.26% | | | | | | | | | | | | | | | | |
ASGN Incorporated † | | | | | | | | | | | 23,247 | | | | 1,903,464 | |
Exponent Incorporated | | | | | | | | | | | 5,146 | | | | 404,733 | |
| | | | |
| | | | | | | | | | | | | | | 2,308,197 | |
| | | | | | | | | | | | | | | | |
| | | | |
| Road & Rail: 0.91% | | | | | | | | | | | | | | | | |
Ryder System Incorporated | | | | | | | | | | | 22,871 | | | | 1,664,780 | |
| | | | | | | | | | | | | | | | |
| | | | |
| Trading Companies & Distributors: 0.82% | | | | | | | | | | | | | | | | |
MSC Industrial Direct Company Class A | | | | | | | | | | | 6,140 | | | | 563,099 | |
Univar Incorporated † | | | | | | | | | | | 33,769 | | | | 937,090 | |
| | | | |
| | | | | | | | | | | | | | | 1,500,189 | |
| | | | | | | | | | | | | | | | |
| | | | |
Information Technology: 17.19% | | | | | | | | | | | | | | | | |
| | | | |
| Communications Equipment: 1.87% | | | | | | | | | | | | | | | | |
Acacia Communications Incorporated †« | | | | | | | | | | | 31,292 | | | | 1,203,490 | |
Ciena Corporation † | | | | | | | | | | | 85,897 | | | | 2,224,732 | |
| | | | |
| | | | | | | | | | | | | | | 3,428,222 | |
| | | | | | | | | | | | | | | | |
The accompanying notes are an integral part of these financial statements.
| | | | | | |
| Portfolio of investments—March 31, 2018 | | Wells Fargo Small Cap Opportunities Fund | | | 15 | |
| | | | | | | | | | | | | | | | |
| Security name | | | | | | | | Shares | | | Value | |
| | | | |
| Electronic Equipment, Instruments & Components: 1.88% | | | | | | | | | | | | | | | | |
Arrow Electronics Incorporated † | | | | | | | | | | | 12,038 | | | $ | 927,167 | |
Fabrinet † | | | | | | | | | | | 51,556 | | | | 1,617,827 | |
Novanta Incorporated † | | | | | | | | | | | 17,328 | | | | 903,655 | |
| | | | |
| | | | | | | | | | | | | | | 3,448,649 | |
| | | | | | | | | | | | | | | | |
| | | | |
| Internet Software & Services: 2.31% | | | | | | | | | | | | | | | | |
Carbonite Incorporated † | | | | | | | | | | | 56,010 | | | | 1,613,088 | |
Match Group Incorporated †« | | | | | | | | | | | 28,877 | | | | 1,283,294 | |
Shutterstock Incorporated † | | | | | | | | | | | 3,191 | | | | 153,647 | |
Yelp Incorporated † | | | | | | | | | | | 28,170 | | | | 1,176,098 | |
| | | | |
| | | | | | | | | | | | | | | 4,226,127 | |
| | | | | | | | | | | | | | | | |
| | | | |
| IT Services: 5.57% | | | | | | | | | | | | | | | | |
Acxiom Corporation † | | | | | | | | | | | 51,032 | | | | 1,158,937 | |
CoreLogic Incorporated † | | | | | | | | | | | 52,267 | | | | 2,364,036 | |
CSG Systems International Incorporated | | | | | | | | | | | 33,977 | | | | 1,538,818 | |
EPAM Systems Incorporated † | | | | | | | | | | | 16,783 | | | | 1,921,989 | |
Leidos Holdings Incorporated | | | | | | | | | | | 26,049 | | | | 1,703,605 | |
WNS Holdings Limited † | | | | | | | | | | | 33,500 | | | | 1,518,555 | |
| | | | |
| | | | | | | | | | | | | | | 10,205,940 | |
| | | | | | | | | | | | | | | | |
| | | | |
| Semiconductors & Semiconductor Equipment: 3.61% | | | | | | | | | | | | | | | | |
Entegris Incorporated | | | | | | | | | | | 67,754 | | | | 2,357,839 | |
Integrated Device Technology Incorporated † | | | | | | | | | | | 43,713 | | | | 1,335,869 | |
ON Semiconductor Corporation † | | | | | | | | | | | 71,243 | | | | 1,742,604 | |
Versum Materials Incorporated | | | | | | | | | | | 31,130 | | | | 1,171,422 | |
| | | | |
| | | | | | | | | | | | | | | 6,607,734 | |
| | | | | | | | | | | | | | | | |
| | | | |
| Software: 1.95% | | | | | | | | | | | | | | | | |
Cadence Design Systems Incorporated † | | | | | | | | | | | 16,659 | | | | 612,551 | |
Fortinet Incorporated † | | | | | | | | | | | 12,885 | | | | 690,378 | |
PTC Incorporated † | | | | | | | | | | | 28,986 | | | | 2,261,198 | |
| | | | |
| | | | | | | | | | | | | | | 3,564,127 | |
| | | | | | | | | | | | | | | | |
| | | | |
Materials: 4.47% | | | | | | | | | | | | | | | | |
| | | | |
| Chemicals: 2.24% | | | | | | | | | | | | | | | | |
Ashland Global Holdings Incorporated | | | | | | | | | | | 32,468 | | | | 2,265,942 | |
Valvoline Incorporated | | | | | | | | | | | 82,918 | | | | 1,834,975 | |
| | | | |
| | | | | | | | | | | | | | | 4,100,917 | |
| | | | | | | | | | | | | | | | |
| | | | |
| Containers & Packaging: 1.41% | | | | | | | | | | | | | | | | |
Ardagh Group SA « | | | | | | | | | | | 50,463 | | | | 942,649 | |
Graphic Packaging Holding Company | | | | | | | | | | | 106,854 | | | | 1,640,209 | |
| | | | |
| | | | | | | | | | | | | | | 2,582,858 | |
| | | | | | | | | | | | | | | | |
| | | | |
| Metals & Mining: 0.82% | | | | | | | | | | | | | | | | |
Pretium Resources Incorporated †« | | | | | | | | | | | 66,604 | | | | 443,583 | |
Steel Dynamics Incorporated | | | | | | | | | | | 23,816 | | | | 1,053,144 | |
| | | | |
| | | | | | | | | | | | | | | 1,496,727 | |
| | | | | | | | | | | | | | | | |
The accompanying notes are an integral part of these financial statements.
| | | | |
| 16 | | Wells Fargo Small Cap Opportunities Fund | | Portfolio of investments—March 31, 2018 |
| | | | | | | | | | | | | | | | |
| Security name | | | | | | | | Shares | | | Value | |
| | | | |
Real Estate: 5.42% | | | | | | | | | | | | | | | | |
| | | | |
| Equity REITs: 4.46% | | | | | | | | | | | | | | | | |
Columbia Property Trust Incorporated | | | | | | | | | | | 41,985 | | | $ | 859,013 | |
Douglas Emmett Incorporated | | | | | | | | | | | 31,360 | | | | 1,152,794 | |
Equity Lifestyle Properties Incorporated | | | | | | | | | | | 17,923 | | | | 1,573,102 | |
Gramercy Property Trust Incorporated | | | | | | | | | | | 53,036 | | | | 1,152,472 | |
Mid-America Apartment Communities Incorporated | | | | | | | | | | | 11,673 | | | | 1,065,045 | |
Terreno Realty Corporation | | | | | | | | | | | 68,657 | | | | 2,369,353 | |
| | | | |
| | | | | | | | | | | | | | | 8,171,779 | |
| | | | | | | | | | | | | | | | |
| | | | |
| Real Estate Management & Development: 0.96% | | | | | | | | | | | | | | | | |
HFF Incorporated Class A | | | | | | | | | | | 15,746 | | | | 782,576 | |
Kennedy Wilson Holdings Incorporated | | | | | | | | | | | 56,246 | | | | 978,680 | |
| | | | |
| | | | | | | | | | | | | | | 1,761,256 | |
| | | | | | | | | | | | | | | | |
| | | | |
Utilities: 2.15% | | | | | | | | | | | | | | | | |
| | | | |
| Electric Utilities: 1.16% | | | | | | | | | | | | | | | | |
IDACORP Incorporated | | | | | | | | | | | 24,126 | | | | 2,129,602 | |
| | | | | | | | | | | | | | | | |
| | | | |
| Multi-Utilities: 0.45% | | | | | | | | | | | | | | | | |
Vectren Corporation | | | | | | | | | | | 12,964 | | | | 828,659 | |
| | | | | | | | | | | | | | | | |
| | | | |
| Water Utilities: 0.54% | | | | | | | | | | | | | | | | |
SJW Corporation | | | | | | | | | | | 18,659 | | | | 983,516 | |
| | | | | | | | | | | | | | | | |
| | | | |
Total Common Stocks (Cost $131,718,497) | | | | | | | | | | | | | | | 167,804,675 | |
| | | | | | | | | | | | | | | | |
| | | | |
| | | Yield | | | | | | | | | | |
| Short-Term Investments: 15.59% | | | | | | | | | | | | | | | | |
| | | | |
| Investment Companies: 15.59% | | | | | | | | | | | | | | | | |
Securities Lending Cash Investment LLC (l)(r)(u) | | | 1.89 | % | | | | | | | 13,754,682 | | | | 13,756,058 | |
Wells Fargo Government Money Market Fund Select Class (l)(u) | | | 1.54 | | | | | | | | 14,793,357 | | | | 14,793,357 | |
| | | | |
Total Short-Term Investments (Cost $28,549,415) | | | | | | | | | | | | | | | 28,549,415 | |
| | | | | | | | | | | | | | | | |
| | | | | | | | |
| Total investments in securities (Cost $160,267,912) | | | 107.20 | % | | | 196,354,090 | |
Other assets and liabilities, net | | | (7.20 | ) | | | (13,179,716 | ) |
| | | | | | | | |
| Total net assets | | | 100.00 | % | | $ | 183,174,374 | |
| | | | | | | | |
| † | Non-income-earning security |
| « | All or a portion of this security is on loan. |
| (l) | The issuer of the security is an affiliated person of the Fund as defined in the Investment Company Act of 1940. |
| (r) | The investment is a non-registered investment company purchased with cash collateral received from securities on loan. |
| (u) | The rate represents the 7-day annualized yield at period end. |
The accompanying notes are an integral part of these financial statements.
| | | | | | |
| Portfolio of investments—March 31, 2018 | | Wells Fargo Small Cap Opportunities Fund | | | 17 | |
Investments in Affiliates
An affiliated investment is an investment in which the Fund owns at least 5% of the outstanding voting shares of the issuer or as a result of other relationships, such as the Fund and the issuer having the same investment manager. Transactions with issuers that were either affiliated persons of the Fund at the beginning of the period or the end of the period were as follows:
| | | | | | | | | | | | | | | | | | | | | | | | | | | | | | | | | | | | |
| | | Shares,
beginning of
period | | | Shares
purchased | | | Shares sold | | | Shares,
end of
period | | | Net
realized
gains
(losses) | | | Net
change in
unrealized
gains
(losses) | | | Income
from
affiliated
securities | | | Value, end of period | | | % of
net
assets | |
Short-Term Investments | | | | | | | | | | | | | | | | | | | | | | | | | | | | | | | | | | | | |
Investment Companies | | | | | | | | | | | | | | | | | | | | | | | | | | | | | | | | | | | | |
Securities Lending Cash Investment LLC | | | 15,210,362 | | | | 158,507,521 | | | | 159,963,201 | | | | 13,754,682 | | | $ | 1,305 | | | $ | (1,184 | ) | | $ | 389,516 | | | $ | 13,756,058 | | | | | |
Wells Fargo Government Money Market Fund Select Class | | | 13,563,576 | | | | 105,832,637 | | | | 104,602,856 | | | | 14,793,357 | | | | 0 | | | | 0 | | | | 186,463 | | | | 14,793,357 | | | | | |
| | | | | | | | | | | | | | | | | | | | | | | | | | | | | | | | | | | | |
| | | | | | | | | | | | | | | | | | $ | 1,305 | | | $ | (1,184 | ) | | $ | 575,979 | | | $ | 28,549,415 | | | | 15.59 | % |
| | | | | | | | | | | | | | | | | | | | | | | | | | | | | | | | | | | | |
The accompanying notes are an integral part of these financial statements.
| | | | |
| 18 | | Wells Fargo Small Cap Opportunities Fund | | Statement of assets and liabilities—March 31, 2018 |
| | | | |
| | | | |
| |
Assets | | | | |
Investments in unaffiliated securities (including $13,710,653 of securities loaned), at value (cost $131,718,497) | | $ | 167,804,675 | |
Investments in affiliated securities, at value (cost $28,549,415) | | | 28,549,415 | |
Receivable for investments sold | | | 2,503,815 | |
Receivable for Fund shares sold | | | 152,681 | |
Receivable for dividends | | | 174,351 | |
Receivable for securities lending income | | | 22,618 | |
Prepaid expenses and other assets | | | 39,148 | |
| | | | |
Total assets | | | 199,246,703 | |
| | | | |
| |
Liabilities | | | | |
Payable upon receipt of securities loaned | | | 13,754,688 | |
Payable for investments purchased | | | 1,810,775 | |
Payable for Fund shares redeemed | | | 269,423 | |
Management fee payable | | | 78,222 | |
Due to custodian bank | | | 69,614 | |
Administration fees payable | | | 19,669 | |
Trustees’ fees and expenses payable | | | 915 | |
Accrued expenses and other liabilities | | | 69,023 | |
| | | | |
Total liabilities | | | 16,072,329 | |
| | | | |
Total net assets | | $ | 183,174,374 | |
| | | | |
| |
NET ASSETS CONSIST OF | | | | |
Paid-in capital | | $ | 113,651,180 | |
Undistributed net investment income | | | 168,078 | |
Accumulated net realized gains on investments | | | 33,268,938 | |
Net unrealized gains on investments | | | 36,086,178 | |
| | | | |
Total net assets | | $ | 183,174,374 | |
| | | | |
| |
COMPUTATION OF NET ASSET VALUE PER SHARE | | | | |
Net assets – Class R6 | | $ | 23,870,636 | |
Shares outstanding – Class R61 | | | 1,054,846 | |
Net asset value per share – Class R6 | | | $22.63 | |
Net assets – Administrator Class | | $ | 91,506,188 | |
Shares outstanding – Administrator Class1 | | | 4,062,410 | |
Net asset value per share – Administrator Class | | | $22.53 | |
Net assets – Institutional Class | | $ | 67,797,550 | |
Shares outstanding – Institutional Class1 | | | 2,999,116 | |
Net asset value per share – Institutional Class | | | $22.61 | |
| 1 | The Fund has an unlimited number of authorized shares. |
The accompanying notes are an integral part of these financial statements.
| | | | | | |
| Statement of operations—year ended March 31, 2018 | | Wells Fargo Small Cap Opportunities Fund | | | 19 | |
| | | | |
| | | | |
| |
Investment income | | | | |
Dividends (net of foreign withholding taxes of $9,549) | | $ | 2,908,887 | |
Securities lending income from affiliates, net | | | 389,516 | |
Income from affiliated securities | | | 186,463 | |
| | | | |
Total investment income | | | 3,484,866 | |
| | | | |
| |
Expenses | | | | |
Management fee | | | 2,249,316 | |
Administration fees | | | | |
Class R6 | | | 1,361 | |
Administrator Class | | | 245,703 | |
Institutional Class | | | 92,411 | |
Shareholder servicing fees | | | | |
Administrator Class | | | 470,952 | |
Custody and accounting fees | | | 11,869 | |
Professional fees | | | 47,372 | |
Registration fees | | | 71,737 | |
Shareholder report expenses | | | 38,526 | |
Trustees’ fees and expenses | | | 23,455 | |
Other fees and expenses | | | 11,653 | |
| | | | |
Total expenses | | | 3,264,355 | |
Less: Fee waivers and/or expense reimbursements | | | (282,445 | ) |
| | | | |
Net expenses | | | 2,981,910 | |
| | | | |
Net investment income | | | 502,956 | |
| | | | |
| |
REALIZED AND UNREALIZED GAINS (LOSSES) ON INVESTMENTS | | | | |
| |
Net realized gains on: | | | | |
Unaffiliated securities | | | 54,266,080 | |
Affiliated securities | | | 1,305 | |
| | | | |
Net realized gains on investments | | | 54,267,385 | |
| | | | |
| |
Net change in unrealized gains (losses) on: | | | | |
Unaffiliated securities | | | (28,400,321 | ) |
Affiliated securities | | | (1,184 | ) |
| | | | |
Net change in unrealized gains (losses) on investments | | | (28,401,505 | ) |
| | | | |
Net realized and unrealized gains (losses) on investments | | | 25,865,880 | |
| | | | |
Net increase in net assets resulting from operations | | $ | 26,368,836 | |
| | | | |
The accompanying notes are an integral part of these financial statements.
| | | | |
| 20 | | Wells Fargo Small Cap Opportunities Fund | | Statement of changes in net assets |
| | | | | | | | | | | | | | | | |
| | | Year ended
March 31, 2018 | | | Year ended
March 31, 2017 | |
| | | | |
Operations | | | | | | | | | | | | | | | | |
Net investment income | | | | | | $ | 502,956 | | | | | | | $ | 1,060,402 | |
Net realized gains on investments | | | | | | | 54,267,385 | | | | | | | | 28,776,630 | |
Net change in unrealized gains (losses) on investments | | | | | | | (28,401,505 | ) | | | | | | | 26,052,434 | |
| | | | |
Net increase in net assets resulting from operations | | | | | | | 26,368,836 | | | | | | | | 55,889,466 | |
| | | | |
| | | | |
Distributions to shareholders from | | | | | | | | | | | | | | | | |
Net investment income | | | | | | | | | | | | | | | | |
Class R6 | | | | | | | (5,027 | ) | | | | | | | (166 | )1 |
Administrator Class | | | | | | | (339,109 | ) | | | | | | | (757,254 | ) |
Institutional Class | | | | | | | (183,973 | ) | | | | | | | (205,414 | ) |
Net realized gains | | | | | | | | | | | | | | | | |
Class R6 | | | | | | | (260,359 | ) | | | | | | | (2,149 | )1 |
Administrator Class | | | | | | | (27,052,520 | ) | | | | | | | (19,845,550 | ) |
Institutional Class | | | | | | | (10,040,057 | ) | | | | | | | (2,743,894 | ) |
| | | | |
Total distributions to shareholders | | | | | | | (37,881,045 | ) | | | | | | | (23,554,427 | ) |
| | | | |
| | | | |
Capital share transactions | | | Shares | | | | | | | | Shares | | | | | |
Proceeds from shares sold | | | | | | | | | | | | | | | | |
Class R6 | | | 1,016,892 | | | | 23,696,710 | | | | 68,165 | 1 | | | 1,622,149 | 1 |
Administrator Class | | | 1,003,396 | | | | 24,583,627 | | | | 1,687,551 | | | | 38,157,468 | |
Institutional Class | | | 1,609,570 | | | | 39,079,106 | | | | 2,357,789 | | | | 54,583,111 | |
| | | | |
| | | | | | | 87,359,443 | | | | | | | | 94,362,728 | |
| | | | |
Reinvestment of distributions | | | | | | | | | | | | | | | | |
Class R6 | | | 11,427 | | | | 261,336 | | | | 99 | 1 | | | 2,315 | 1 |
Administrator Class | | | 1,202,741 | | | | 27,387,299 | | | | 876,609 | | | | 20,454,367 | |
Institutional Class | | | 386,831 | | | | 8,839,448 | | | | 120,565 | | | | 2,820,495 | |
| | | | |
| | | | | | | 36,488,083 | | | | | | | | 23,277,177 | |
| | | | |
Payment for shares redeemed | | | | | | | | | | | | | | | | |
Class R6 | | | (41,737 | ) | | | (978,591 | ) | | | 0 | 1 | | | 0 | 1 |
Administrator Class | | | (7,857,302 | ) | | | (184,787,406 | ) | | | (5,357,915 | ) | | | (122,878,100 | ) |
Institutional Class | | | (1,280,303 | ) | | | (30,434,668 | ) | | | (207,771 | ) | | | (4,880,539 | ) |
| | | | |
| | | | | | | (216,200,665 | ) | | | | | | | (127,758,639 | ) |
| | | | |
Net decrease in net assets resulting from capital share transactions | | | | | | | (92,353,139 | ) | | | | | | | (10,118,734 | ) |
| | | | |
Total increase (decrease) in net assets | | | | | | | (103,865,348 | ) | | | | | | | 22,216,305 | |
| | | | |
| | | | |
Net assets | | | | | | | | | | | | | | | | |
Beginning of period | | | | | | | 287,039,722 | | | | | | | | 264,823,417 | |
| | | | |
End of period | | | | | | $ | 183,174,374 | | | | | | | $ | 287,039,722 | |
| | | | |
Undistributed net investment income | | | | | | $ | 168,078 | | | | | | | $ | 257,825 | |
| | | | |
| 1 | For the period from October 31, 2016 (commencement of operations) to March 31, 2017 |
The accompanying notes are an integral part of these financial statements.
| | | | | | |
| Financial highlights | | Wells Fargo Small Cap Opportunities Fund | | | 21 | |
(For a share outstanding throughout each period)
| | | | | | | | |
| | | Year ended March 31 | |
| CLASS R6 | | 2018 | | | 20171 | |
Net asset value, beginning of period | | | $23.82 | | | | $22.43 | |
Net investment income | | | 0.07 | | | | 0.14 | |
Net realized and unrealized gains (losses) on investments | | | 2.08 | | | | 3.32 | |
| | | | | | | | |
Total from investment operations | | | 2.15 | | | | 3.46 | |
Distributions to shareholders from | | | | | | | | |
Net investment income | | | (0.06 | ) | | | (0.14 | ) |
Net realized gains | | | (3.28 | ) | | | (1.93 | ) |
| | | | | | | | |
Total distributions to shareholders | | | (3.34 | ) | | | (2.07 | ) |
Net asset value, end of period | | | $22.63 | | | | $23.82 | |
Total return2 | | | 8.95 | % | | | 15.63 | % |
Ratios to average net assets (annualized) | | | | | | | | |
Gross expenses | | | 1.06 | % | | | 0.92 | % |
Net expenses | | | 0.85 | % | | | 0.85 | % |
Net investment income | | | 0.14 | % | | | 0.67 | % |
Supplemental data | | | | | | | | |
Portfolio turnover rate | | | 48 | % | | | 73 | % |
Net assets, end of period (000s omitted) | | | $23,871 | | | | $1,626 | |
| 1 | For the period from October 31, 2016 (commencement of class operations) to March 31, 2017 |
| 2 | Returns for periods of less than one year are not annualized. |
The accompanying notes are an integral part of these financial statements.
| | | | |
| 22 | | Wells Fargo Small Cap Opportunities Fund | | Financial highlights |
(For a share outstanding throughout each period)
| | | | | | | | | | | | | | | | | | | | | | | | |
| | | Year ended March 31 | | | Year ended
October 31, 2013 | |
| ADMINISTRATOR CLASS | | 2018 | | | 2017 | | | 2016 | | | 2015 | | | 20141 | | |
Net asset value, beginning of period | | | $23.79 | | | | $21.15 | | | | $25.19 | | | | $37.93 | | | | $42.43 | | | | $34.45 | |
Net investment income | | | 0.06 | | | | 0.08 | 2 | | | 0.06 | | | | 0.02 | | | | 0.02 | | | | 0.11 | |
Net realized and unrealized gains (losses) on investments | | | 2.00 | | | | 4.56 | | | | (1.24 | ) | | | 3.13 | | | | 2.33 | | | | 10.48 | |
| | | | | | | | | | | | | | | | | | | | | | | | |
Total from investment operations | | | 2.06 | | | | 4.64 | | | | (1.18 | ) | | | 3.15 | | | | 2.35 | | | | 10.59 | |
Distributions to shareholders from | | | | | | | | | | | | | | | | | | | | | | | | |
Net investment income | | | (0.04 | ) | | | (0.07 | ) | | | (0.02 | ) | | | 0.00 | | | | (0.02 | ) | | | (0.08 | ) |
Net realized gains | | | (3.28 | ) | | | (1.93 | ) | | | (2.84 | ) | | | (15.89 | ) | | | (6.83 | ) | | | (2.53 | ) |
| | | | | | | | | | | | | | | | | | | | | | | | |
Total distributions to shareholders | | | (3.32 | ) | | | (2.00 | ) | | | (2.86 | ) | | | (15.89 | ) | | | (6.85 | ) | | | (2.61 | ) |
Net asset value, end of period | | | $22.53 | | | | $23.79 | | | | $21.15 | | | | $25.19 | | | | $37.93 | | | | $42.43 | |
Total return3 | | | 8.52 | % | | | 22.13 | % | | | (4.39 | )% | | | 11.75 | % | | | 6.26 | % | | | 33.19 | % |
Ratios to average net assets (annualized) | | | | | | | | | | | | | | | | | | | | | | | | |
Gross expenses | | | 1.30 | % | | | 1.28 | % | | | 1.29 | % | | | 1.24 | % | | | 1.24 | % | | | 1.22 | % |
Net expenses | | | 1.20 | % | | | 1.20 | % | | | 1.20 | % | | | 1.20 | % | | | 1.20 | % | | | 1.20 | % |
Net investment income | | | 0.12 | % | | | 0.36 | % | | | 0.25 | % | | | 0.06 | % | | | 0.11 | % | | | 0.31 | % |
Supplemental data | | | | | | | | | | | | | | | | | | | | | | | | |
Portfolio turnover rate | | | 48 | % | | | 73 | % | | | 59 | % | | | 60 | % | | | 26 | % | | | 76 | % |
Net assets, end of period (000s omitted) | | | $91,506 | | | | $231,039 | | | | $264,560 | | | | $306,628 | | | | $471,330 | | | | $705,671 | |
| 1 | For the five months ended March 31, 2014. The Fund changed its fiscal year end from October 31 to March 31, effective March 31, 2014. |
| 2 | Calculated based upon average shares outstanding |
| 3 | Returns for periods of less than one year are not annualized. |
The accompanying notes are an integral part of these financial statements.
| | | | | | |
| Financial highlights | | Wells Fargo Small Cap Opportunities Fund | | | 23 | |
(For a share outstanding throughout each period)
| | | | | | | | | | | | | | | | |
| | | Year ended March 31 | |
| INSTITUTIONAL CLASS | | 2018 | | | 2017 | | | 2016 | | | 20151 | |
Net asset value, beginning of period | | | $23.82 | | | | $21.18 | | | | $25.22 | | | | $39.04 | |
Net investment income | | | 0.09 | | | | 0.09 | | | | 0.16 | 2 | | | 0.06 | |
Net realized and unrealized gains (losses) on investments | | | 2.03 | | | | 4.61 | | | | (1.28 | ) | | | 2.01 | |
| | | | | | | | | | | | | | | | |
Total from investment operations | | | 2.12 | | | | 4.70 | | | | (1.12 | ) | | | 2.07 | |
Distributions to shareholders from | | | | | | | | | | | | | | | | |
Net investment income | | | (0.05 | ) | | | (0.13 | ) | | | (0.08 | ) | | | 0.00 | |
Net realized gains | | | (3.28 | ) | | | (1.93 | ) | | | (2.84 | ) | | | (15.89 | ) |
| | | | | | | | | | | | | | | | |
Total distributions to shareholders | | | (3.33 | ) | | | (2.06 | ) | | | (2.92 | ) | | | (15.89 | ) |
Net asset value, end of period | | | $22.61 | | | | $23.82 | | | | $21.18 | | | | $25.22 | |
Total return3 | | | 8.81 | % | | | 22.43 | % | | | (4.12 | )% | | | 8.68 | % |
Ratios to average net assets (annualized) | | | | | | | | | | | | | | | | |
Gross expenses | | | 1.07 | % | | | 1.03 | % | | | 1.05 | % | | | 0.92 | % |
Net expenses | | | 0.95 | % | | | 0.95 | % | | | 0.95 | % | | | 0.92 | % |
Net investment income | | | 0.37 | % | | | 0.56 | % | | | 0.71 | % | | | 0.59 | % |
Supplemental data | | | | | | | | | | | | | | | | |
Portfolio turnover rate | | | 48 | % | | | 73 | % | | | 59 | % | | | 60 | % |
Net assets, end of period (000s omitted) | | | $67,798 | | | | $54,375 | | | | $263 | | | | $11 | |
| 1 | For the period from October 31, 2014 (commencement of class operations) to March 31, 2015 |
| 2 | Calculated based upon average shares outstanding |
| 3 | Returns for periods of less than one year are not annualized. |
The accompanying notes are an integral part of these financial statements.
| | | | |
| 24 | | Wells Fargo Small Cap Opportunities Fund | | Notes to financial statements |
1. ORGANIZATION
Wells Fargo Funds Trust (the “Trust”), a Delaware statutory trust organized on March 10, 1999, is an open-end management investment company registered under the Investment Company Act of 1940, as amended (the “1940 Act”). As an investment company, the Trust follows the accounting and reporting guidance in Financial Accounting Standards Board Accounting Standards Codification Topic 946, Financial Services – Investment Companies. These financial statements report on the Wells Fargo Small Cap Opportunities Fund (the “Fund”) which is a diversified series of the Trust.
2. SIGNIFICANT ACCOUNTING POLICIES
The following significant accounting policies, which are consistently followed in the preparation of the financial statements of the Fund, are in conformity with U.S. generally accepted accounting principles which require management to make estimates and assumptions that affect the reported amounts of assets and liabilities, disclosure of contingent assets and liabilities at the date of the financial statements, and the reported amounts of revenues and expenses during the reporting period. Actual results could differ from those estimates.
Securities valuation
All investments are valued each business day as of the close of regular trading on the New York Stock Exchange (generally 4 p.m. Eastern Time), although the Fund may deviate from this calculation time under unusual or unexpected circumstances.
Equity securities that are listed on a foreign or domestic exchange or market are valued at the official closing price or, if none, the last sales price. If no sale occurs on the principal exchange or market that day, a fair value price will be determined in accordance with the Fund’s Valuation Procedures.
Investments in registered open-end investment companies are valued at net asset value. Interests in non-registered investment companies that are redeemable at net asset value are fair valued normally at net asset value.
Investments which are not valued using any of the methods discussed above are valued at their fair value, as determined in good faith by the Board of Trustees of the Fund. The Board of Trustees has established a Valuation Committee comprised of the Trustees and has delegated to it the authority to take any actions regarding the valuation of portfolio securities that the Valuation Committee deems necessary or appropriate, including determining the fair value of portfolio securities, unless the determination has been delegated to the Wells Fargo Asset Management Pricing Committee at Wells Fargo Funds Management, LLC (“Funds Management”). The Board of Trustees retains the authority to make or ratify any valuation decisions or approve any changes to the Valuation Procedures as it deems appropriate. On a quarterly basis, the Board of Trustees receives reports on any valuation actions taken by the Valuation Committee or the Wells Fargo Asset Management Pricing Committee which may include items for ratification.
Valuations of fair valued securities are compared to the next actual sales price when available, or other appropriate market values, to assess the continued appropriateness of the fair valuation methodologies used. These securities are fair valued on a day-to-day basis, taking into consideration changes to appropriate market information and any significant changes to the inputs considered in the valuation process until there is a readily available price provided on an exchange or by an independent pricing service. Valuations received from an independent pricing service or independent broker-dealer quotes are periodically validated by comparisons to most recent trades and valuations provided by other independent pricing services in addition to the review of prices by the manager and/or subadviser. Unobservable inputs used in determining fair valuations are identified based on the type of security, taking into consideration factors utilized by market participants in valuing the investment, knowledge about the issuer and the current market environment.
Securities lending
The Fund may lend its securities from time to time in order to earn additional income in the form of fees or interest on securities received as collateral or the investment of any cash received as collateral. The Fund continues to receive interest or dividends on the securities loaned. The Fund receives collateral in the form of cash or securities with a value at least equal to the value of the securities on loan. The value of the loaned securities is determined at the close of each business day and any additional required collateral is delivered to the Fund on the next business day. In a securities lending transaction, the net asset value of the Fund will be affected by an increase or decrease in the value of the securities loaned and by an increase or decrease in the value of the instrument in which collateral is invested. The amount of securities lending activity undertaken by the Fund fluctuates from time to time. In the event of default or bankruptcy by the borrower, the Fund may be prevented from recovering the loaned securities or gaining access to the collateral or may experience delays or costs in doing so. In addition, the investment of any cash collateral received may lose all or part of its value. The Fund has the right under the lending agreement to recover the securities from the borrower on demand.
| | | | | | |
| Notes to financial statements | | Wells Fargo Small Cap Opportunities Fund | | | 25 | |
The Fund lends its securities through an unaffiliated securities lending agent. Cash collateral received in connection with its securities lending transactions is invested in Securities Lending Cash Investments, LLC (the “Securities Lending Fund”). The Securities Lending Fund is exempt from registration under Section 3(c)(7) of the 1940 Act and is managed by Funds Management and is subadvised by Wells Capital Management Incorporated (“WellsCap”), an affiliate of Funds Management and an indirect wholly owned subsidiary of Wells Fargo & Company (“Wells Fargo”). Funds Management receives an advisory fee starting at 0.05% and declining to 0.01% as the average daily net assets of the Securities Lending Fund increase. All of the fees received by Funds Management are paid to WellsCap for its services as subadviser. The Securities Lending Fund seeks to provide a positive return compared to the daily Fed Funds Open Rate by investing in high-quality, U.S. dollar-denominated short-term money market instruments. Securities Lending Fund investments are valued at the evaluated bid price provided by an independent pricing service. Income earned from investment in the Securities Lending Fund, if any, is included in securities lending income from affiliates (net of fees and rebates) on the Statement of Operations.
Security transactions and income recognition
Securities transactions are recorded on a trade date basis. Realized gains or losses are recorded on the basis of identified cost.
Dividend income is recognized on the ex-dividend date. Dividend income is recorded net of foreign taxes withheld where recovery of such taxes is not assured.
Distributions to shareholders
Distributions to shareholders from net investment income and any net realized gains are recorded on the ex-dividend date and paid at least annually. Such distributions are determined in accordance with income tax regulations and may differ from U.S. generally accepted accounting principles. Dividend sources are estimated at the time of declaration. The tax character of distributions is determined as of the Fund’s fiscal year end. Therefore, a portion of the Fund’s distributions made prior to the Fund’s fiscal year end may be categorized as a tax return of capital at year end.
Federal and other taxes
The Fund intends to continue to qualify as a regulated investment company by distributing substantially all of its investment company taxable income and any net realized capital gains (after reduction for capital loss carryforwards) sufficient to relieve it from all, or substantially all, federal income taxes. Accordingly, no provision for federal income taxes was required.
The Fund’s income and federal excise tax returns and all financial records supporting those returns for the prior three fiscal years are subject to examination by the federal and Delaware revenue authorities. Management has analyzed the Fund’s tax positions taken on federal, state, and foreign tax returns for all open tax years and does not believe that there are any uncertain tax positions that require recognition of a tax liability.
As of March 31, 2018, the aggregate cost of all investments for federal income tax purposes was $160,983,900 and the unrealized gains (losses) consisted of:
| | | | |
Gross unrealized gains | | $ | 39,678,727 | |
Gross unrealized losses | | | (4,308,537 | ) |
Net unrealized gains | | $ | 35,370,190 | |
Reclassifications are made to the Fund’s capital accounts for permanent tax differences to reflect income and gains available for distribution (or available capital loss carryforwards) under federal income tax regulations. U.S. generally accepted accounting principles require that certain components of net assets be adjusted to reflect permanent differences between financial and tax reporting. These reclassifications have no effect on net assets or net asset values per share. The primary permanent differences causing such reclassifications are due to passive foreign investment companies and recognition of partnership income. At March 31, 2018, as a result of permanent book-to-tax differences, the following reclassification adjustments were made on the Statement of Assets and Liabilities:
| | | | |
| Paid-in capital | | Undistributed net investment income | | Accumulated net
realized gains
on investments |
| $(10) | | $(64,594) | | $64,604 |
| | | | |
| 26 | | Wells Fargo Small Cap Opportunities Fund | | Notes to financial statements |
Class allocations
The separate classes of shares offered by the Fund differ principally in applicable sales charges, distribution, shareholder servicing, and administration fees. Class specific expenses are charged directly to that share class. Investment income, common expenses, and realized and unrealized gains (losses) on investments are allocated daily to each class of shares based on the relative proportion of net assets of each class.
3. FAIR VALUATION MEASUREMENTS
Fair value measurements of investments are determined within a framework that has established a fair value hierarchy based upon the various data inputs utilized in determining the value of the Fund’s investments. The three-level hierarchy gives the highest priority to unadjusted quoted prices in active markets for identical assets or liabilities (Level 1) and the lowest priority to unobservable inputs (Level 3). The Fund’s investments are classified within the fair value hierarchy based on the lowest level of input that is significant to the fair value measurement. The inputs are summarized into three broad levels as follows:
| ∎ | | Level 1 – quoted prices in active markets for identical securities |
| ∎ | | Level 2 – other significant observable inputs (including quoted prices for similar securities, interest rates, prepayment speeds, credit risk, etc.) |
| ∎ | | Level 3 – significant unobservable inputs (including the Fund’s own assumptions in determining the fair value of investments) |
The inputs or methodologies used for valuing investments in securities are not necessarily an indication of the risk associated with investing in those securities.
The following is a summary of the inputs used in valuing the Fund’s assets and liabilities as of March 31, 2018:
| | | | | | | | | | | | | | | | |
| | | Quoted prices
(Level 1) | | | Other significant
observable inputs
(Level 2) | | | Significant
unobservable inputs (Level 3) | | | Total | |
Assets | | | | | | | | | | | | | | | | |
Investments in: | | | | | | | | | | | | | | | | |
| | | | |
Common stocks | | | | | | | | | | | | | | | | |
Consumer discretionary | | $ | 25,301,153 | | | $ | 0 | | | $ | 0 | | | $ | 25,301,153 | |
Consumer staples | | | 3,754,597 | | | | 0 | | | | 0 | | | | 3,754,597 | |
Energy | | | 5,864,521 | | | | 0 | | | | 0 | | | | 5,864,521 | |
Financials | | | 33,797,999 | | | | 0 | | | | 0 | | | | 33,797,999 | |
Health care | | | 17,505,611 | | | | 0 | | | | 0 | | | | 17,505,611 | |
Industrials | | | 28,044,681 | | | | 0 | | | | 0 | | | | 28,044,681 | |
Information technology | | | 31,480,799 | | | | 0 | | | | 0 | | | | 31,480,799 | |
Materials | | | 8,180,502 | | | | 0 | | | | 0 | | | | 8,180,502 | |
Real estate | | | 9,933,035 | | | | 0 | | | | 0 | | | | 9,933,035 | |
Utilities | | | 3,941,777 | | | | 0 | | | | 0 | | | | 3,941,777 | |
| | | | |
Short-term investments | | | | | | | | | | | | | | | | |
Investment companies | | | 14,793,357 | | | | 0 | | | | 0 | | | | 14,793,357 | |
Investments measured at net asset value* | | | | | | | | | | | | | | | 13,756,058 | |
Total assets | | $ | 182,598,032 | | | $ | 0 | | | $ | 0 | | | $ | 196,354,090 | |
| * | Investments that are measured at fair value using the net asset value per share (or its equivalent) as a practical expedient have not been categorized in the fair value hierarchy. The fair value amount presented in the table is intended to permit reconciliation of the fair value hierarchy to the amounts presented in the Statement of Assets and Liabilities. The Fund’s investment in Securities Lending Cash Investments, LLC valued at $13,756,058 does not have a redemption period notice, can be redeemed daily and does not have any unfunded commitments. |
The Fund recognizes transfers between levels within the fair value hierarchy at the end of the reporting period. At March 31, 2018, the Fund did not have any transfers into/out of Level 1, Level 2, or Level 3.
| | | | | | |
| Notes to financial statements | | Wells Fargo Small Cap Opportunities Fund | | | 27 | |
4. TRANSACTIONS WITH AFFILIATES AND OTHER EXPENSES
Management fee
Funds Management, an indirect wholly owned subsidiary of Wells Fargo, is the manager of the Fund and provides advisory and fund-level administrative services under an investment management agreement. Under the investment management agreement, Funds Management is responsible for, among other services, implementing the investment objectives and strategies of the Fund, supervising the subadviser, providing fund-level administrative services in connection with the Fund’s operations, and providing any other fund-level administrative services reasonably necessary for the operation of the Fund. As compensation for its services under the investment management agreement, Funds Management is entitled to receive an annual management fee starting at 0.85% and declining to 0.71% as the average daily net assets of the Fund increase. For the year ended March 31, 2018, the management fee was equivalent to an annual rate of 0.85% of the Fund’s average daily net assets.
Funds Management has retained the services of a subadviser to provide daily portfolio management to the Fund. The fee for subadvisory services is borne by Funds Management. Schroder Investment Management North America Inc., which is not an affiliate of Funds Management, is the subadviser to the Fund and is entitled to receive a fee from Funds Management at an annual rate starting at 0.50% and declining to 0.45% as the average daily net assets of the Fund increase.
Administration fees
Under a class-level administration agreement, Funds Management provides class-level administrative services to the Fund, which includes paying fees and expenses for services provided by the transfer agent, sub-transfer agents, omnibus account servicers and record-keepers. As compensation for its services under the class-level administration agreement, Funds Management receives an annual fee which is calculated based on the average daily net assets of each class as follows:
| | | | |
| | | Class-level
administration fee | |
Class R6 | | | 0.03 | % |
Administrator Class, Institutional Class | | | 0.13 | |
Funds Management has contractually waived and/or reimbursed management and administration fees to the extent necessary to maintain certain net operating expense ratios for the Fund. Waiver of fees and/or reimbursement of expenses by Funds Management were made first from fund level expenses on a proportionate basis and then from class specific expenses. Funds Management has committed through July 31, 2018 to waive fees and/or reimburse expenses to the extent necessary to cap the Fund’s expenses at 0.85% for Class R6 shares, 1.20% for Administrator Class shares, and 0.95% for Institutional Class shares. After this time, the cap may be increased or the commitment to maintain the cap may be terminated only with the approval of the Board of Trustees.
Shareholder servicing fees
The Trust has entered into contracts with one or more shareholder servicing agents, whereby Administrator Class of the Fund is charged a fee at an annual rate of 0.25% of its average daily net assets.
A portion of these total shareholder servicing fees were paid to affiliates of Wells Fargo.
Interfund transactions
The Fund may purchase or sell portfolio investment securities to certain other Wells Fargo affiliates pursuant to Rule 17a-7 under the 1940 Act and under procedures adopted by the Board of Trustees. The procedures have been designed to ensure that these interfund transactions, which do not incur broker commissions, are effected at current market prices.
5. INVESTMENT PORTFOLIO TRANSACTIONS
Purchases and sales of investments, excluding U.S. government obligations (if any) and short-term securities, for the year ended March 31, 2018 were $117,267,063 and $227,799,362, respectively.
6. BANK BORROWINGS
The Trust (excluding the money market funds and certain other funds) and Wells Fargo Variable Trust are parties to a $280,000,000 revolving credit agreement whereby the Fund is permitted to use bank borrowings for temporary or emergency purposes, such as to fund shareholder redemption requests. Interest under the credit agreement is charged to the Fund based on a borrowing rate equal to the higher of the Federal Funds rate in effect on that day plus 1.25% or the overnight LIBOR rate in effect on that day plus 1.25%. In addition, an annual commitment fee equal to 0.25% of the unused balance is allocated to each participating fund. Prior to August 29, 2017, the revolving credit agreement amount was $250,000,000.
| | | | |
| 28 | | Wells Fargo Small Cap Opportunities Fund | | Notes to financial statements |
For the year ended March 31, 2018, there were no borrowings by the Fund under the agreement.
7. DISTRIBUTIONS TO SHAREHOLDERS
The tax character of distributions paid during the years ended March 31, 2018 and March 31, 2017 were as follows:
| | | | | | | | |
| | | Year ended March 31 | |
| | | 2018 | | | 2017 | |
Ordinary income | | $ | 4,968,700 | | | $ | 962,834 | |
Long-term capital gain | | | 32,912,345 | | | | 22,591,593 | |
As of March 31, 2018, the components of distributable earnings on a tax basis were as follows:
| | | | |
Undistributed ordinary income | | Undistributed long-term gain | | Unrealized gains |
| $812,180 | | $33,340,824 | | $35,370,190 |
8. INDEMNIFICATION
Under the Trust’s organizational documents, the officers and Trustees have been granted certain indemnification rights against certain liabilities that may arise out of performance of their duties to the Trust. Additionally, in the normal course of business, the Trust may enter into contracts with service providers that contain a variety of indemnification clauses. The Trust’s maximum exposure under these arrangements is dependent on future claims that may be made against the Fund and, therefore, cannot be estimated.
| | | | | | |
| Report of independent registered public accounting firm | | Wells Fargo Small Cap Opportunities Fund | | | 29 | |
BOARD OF TRUSTEES AND SHAREHOLDERS OF WELLS FARGO FUNDS TRUST:
Opinion on the Financial Statements
We have audited the accompanying statement of assets and liabilities of the Wells Fargo Small Cap Opportunities Fund (the “Fund”), one of the funds constituting the Wells Fargo Funds Trust, including the portfolio of investments, as of March 31, 2018, the related statement of operations for the year then ended, the statements of changes in net assets for each of the years in the two-year period then ended, and the related notes (collectively, the “financial statements”) and the financial highlights for each of the years in the four-year period then ended, the period from November 1, 2013 to March 31, 2014, and the year ended October 31, 2013. In our opinion, the financial statements and financial highlights present fairly, in all material respects, the financial position of the Fund as of March 31, 2018, the results of its operations for the year then ended, the changes in its net assets for each of the years in the two-year period then ended, and the financial highlights for each of the years or periods noted above, in conformity with U.S. generally accepted accounting principles.
Basis for Opinion
These financial statements and financial highlights are the responsibility of the Fund’s management. Our responsibility is to express an opinion on these financial statements and financial highlights based on our audits. We are a public accounting firm registered with the Public Company Accounting Oversight Board (United States) (“PCAOB”) and are required to be independent with respect to the Fund in accordance with the U.S. federal securities laws and the applicable rules and regulations of the Securities and Exchange Commission and the PCAOB.
We conducted our audits in accordance with the standards of the PCAOB. Those standards require that we plan and perform the audit to obtain reasonable assurance about whether the financial statements and financial highlights are free of material misstatement, whether due to error or fraud. Our audits included performing procedures to assess the risks of material misstatement of the financial statements and financial highlights, whether due to error or fraud, and performing procedures that respond to those risks. Such procedures included examining, on a test basis, evidence regarding the amounts and disclosures in the financial statements and financial highlights. Such procedures also included confirmation of securities owned as of March 31, 2018, by correspondence with the custodian and brokers, or by other appropriate auditing procedures. Our audits also included evaluating the accounting principles used and significant estimates made by management, as well as evaluating the overall presentation of the financial statements and financial highlights. We believe that our audits provide a reasonable basis for our opinion.

We have not been able to determine the specific year that we began serving as the auditor of one or more Wells Fargo Funds investment companies, however we are aware that we have served as the auditor of one or more Wells Fargo Funds investment companies since at least 1955.
Boston, Massachusetts
May 23, 2018
| | | | |
| 30 | | Wells Fargo Small Cap Opportunities Fund | | Other information (unaudited) |
TAX INFORMATION
For corporate shareholders, pursuant to Section 854 of the Internal Revenue Code, 52.64% of ordinary income dividends qualify for the corporate dividends-received deduction for the fiscal year ended March 31, 2018.
Pursuant to Section 852 of the Internal Revenue Code, $32,912,345 was designated as a 20% rate gain distribution for the fiscal year ended March 31, 2018.
Pursuant to Section 854 of the Internal Revenue Code, $2,610,665 of income dividends paid during the fiscal year ended March 31, 2018 has been designated as qualified dividend income (QDI).
For the fiscal year ended March 31, 2018, $8,720 has been designated as interest-related dividends for nonresident alien shareholders pursuant to Section 871 of the Internal Revenue Code.
For the fiscal year ended March 31, 2018, $4,440,591 has been designated as short-term capital gain dividends for nonresident alien shareholders pursuant to Section 871 of the Internal Revenue Code.
PROXY VOTING INFORMATION
A description of the policies and procedures that the Fund uses to determine how to vote proxies relating to portfolio securities is available, upon request, by calling 1-800-222-8222, visiting our website at wellsfargofunds.com, or visiting the SEC website at sec.gov. Information regarding how the Fund voted proxies relating to portfolio securities during the most recent 12-month period ended June 30 is available on the Fund’s website at wellsfargofunds.com or by visiting the SEC website at sec.gov.
PORTFOLIO HOLDINGS INFORMATION
The complete portfolio holdings for the Fund are publicly available monthly on the Fund’s website (wellsfargofunds.com), on a one-month delayed basis. In addition, top ten holdings information (excluding derivative positions) for the Fund is publicly available on the Fund’s website on a monthly, seven-day or more delayed basis. The Fund files its complete schedule of portfolio holdings with the SEC for the first and third quarters of each fiscal year on Form N-Q, which is available by visiting the SEC website at sec.gov. In addition, the Fund’s Form N-Q may be reviewed and copied at the SEC’s Public Reference Room in Washington, DC, and at regional offices in New York City, at 233 Broadway, and in Chicago, at 175 West Jackson Boulevard, Suite 900. Information about the Public Reference Room may be obtained by calling 1-800-SEC-0330.
| | | | | | |
| Other information (unaudited) | | Wells Fargo Small Cap Opportunities Fund | | | 31 | |
BOARD OF TRUSTEES AND OFFICERS
Each of the Trustees and Officers1 listed in the table below acts in identical capacities for each fund in the Wells Fargo family of funds, which consists of 153 mutual funds comprising the Wells Fargo Funds Trust, Wells Fargo Variable Trust, Wells Fargo Master Trust and four closed-end funds (collectively the “Fund Complex”). This table should be read in conjunction with the Prospectus and the Statement of Additional Information2. The mailing address of each Trustee and Officer is 525 Market Street, 12th Floor, San Francisco, CA 94105. Each Trustee and Officer serves an indefinite term, however, each Trustee serves such term until reaching the mandatory retirement age established by the Trustees.
Independent Trustees
| | | | | | |
Name and year of birth | | Position held and length of service* | | Principal occupations during past five years or longer | | Current other public company or
investment company
directorships |
| William R. Ebsworth (Born 1957) | | Trustee, since 2015 | | Retired. From 1984 to 2013, equities analyst, portfolio manager, research director and chief investment officer at Fidelity Management and Research Company in Boston, Tokyo, and Hong Kong, and retired in 2013 as Chief Investment Officer of Fidelity Strategic Advisers, Inc. where he led a team of investment professionals managing client assets. Prior thereto, Board member of Hong Kong Securities Clearing Co., Hong Kong Options Clearing Corp., the Thailand International Fund, Ltd., Fidelity Investments Life Insurance Company, and Empire Fidelity Investments Life Insurance Company. Board member of the Forté Foundation (non-profit organization) and the Vincent Memorial Hospital Endowment (non-profit organization), where he serves on the Investment Committee and as a Chair of the Audit Committee. Mr. Ebsworth is a CFA® charterholder. | | Asset Allocation Trust |
Jane A. Freeman** (Born 1953) | | Trustee, since 2015; Chair Liaison, since 2018 | | Retired. From 2012 to 2014 and 1999 to 2008, Chief Financial Officer of Scientific Learning Corporation. From 2008 to 2012, Ms. Freeman provided consulting services related to strategic business projects. Prior to 1999, Portfolio Manager at Rockefeller & Co. and Scudder, Stevens & Clark. Board member of the Harding Loevner Funds from 1996 to 2014, serving as both Lead Independent Director and chair of the Audit Committee. Board member of the Russell Exchange Traded Funds Trust from 2011 to 2012 and the chair of the Audit Committee. Ms. Freeman is a Board Member of Ruth Bancroft Garden (non-profit organization) and the Glimmerglass Festival. She is also an inactive Chartered Financial Analyst. | | Asset Allocation Trust |
Isaiah Harris, Jr. (Born 1952) | | Trustee, since 2009 | | Retired. Chairman of the Board of CIGNA Corporation since 2009, and Director since 2005. From 2003 to 2011, Director of Deluxe Corporation. Prior thereto, President and CEO of BellSouth Advertising and Publishing Corp. from 2005 to 2007, President and CEO of BellSouth Enterprises from 2004 to 2005 and President of BellSouth Consumer Services from 2000 to 2003. Emeritus member of the Iowa State University Foundation Board of Governors. Emeritus Member of the Advisory Board of Iowa State University School of Business. Advisory Board Member, Palm Harbor Academy (charter school). Advisory Board Member, Child Evangelism Fellowship (non-profit). Mr. Harris is a certified public accountant (inactive status). | | CIGNA Corporation; Asset Allocation Trust |
Judith M. Johnson (Born 1949) | | Trustee, since 2008; Audit Committee Chairman, since 2008 | | Retired. Prior thereto, Chief Executive Officer and Chief Investment Officer of Minneapolis Employees Retirement Fund from 1996 to 2008. Ms. Johnson is an attorney, certified public accountant and a certified managerial accountant. | | Asset Allocation Trust |
David F. Larcker (Born 1950) | | Trustee, since 2009 | | James Irvin Miller Professor of Accounting at the Graduate School of Business, Stanford University, Director of the Corporate Governance Research Initiative and Senior Faculty of The Rock Center for Corporate Governance since 2006. From 2005 to 2008, Professor of Accounting at the Graduate School of Business, Stanford University. Prior thereto, Ernst & Young Professor of Accounting at The Wharton School, University of Pennsylvania from 1985 to 2005. | | Asset Allocation Trust |
| | | | |
| 32 | | Wells Fargo Small Cap Opportunities Fund | | Other information (unaudited) |
| | | | | | |
Name and year of birth | | Position held and length of service* | | Principal occupations during past five years or longer | | Current other public company or
investment company
directorships |
Olivia S. Mitchell*** (Born 1953) | | Trustee, since 2006; Governance Committee Chairman, since 2018 | | International Foundation of Employee Benefit Plans Professor, Wharton School of the University of Pennsylvania since 1993. Director of Wharton’s Pension Research Council and Boettner Center on Pensions & Retirement Research, and Research Associate at the National Bureau of Economic Research. Previously, Cornell University Professor from 1978 to 1993. | | Asset Allocation Trust |
Timothy J. Penny**** (Born 1951) | | Trustee, since 1996; Chairman, since 2018; Vice Chairman, from 2017 to 2018 | | President and Chief Executive Officer of Southern Minnesota Initiative Foundation, a non-profit organization, since 2007. Member of the Board of Trustees of NorthStar Education Finance, Inc., a non-profit organization, since 2007. | | Asset Allocation Trust |
James G. Polisson***** (Born 1959) | | Trustee, since 2018; Advisory Board Member, from 2017 to 2018 | | Retired. Chief Marketing Officer, Source (ETF) UK Services, Ltd, from 2015 to 2017. From 2012 to 2015, Principal of The Polisson Group, LLC, a management consulting, corporate advisory and principal investing company. Chief Executive Officer and Managing Director at Russell Investments, Global Exchange Traded Funds from 2010 to 2012. Managing Director of Barclays Global Investors from 1998 to 2010 and Global Chief Marketing Officer for iShares and Barclays Global Investors from 2000 to 2010. Trustee of the San Francisco Mechanics’ Institute, a non-profit organization, from 2013 to 2015. Board member of the Russell Exchange Traded Fund Trust from 2011 to 2012. Director of Barclays Global Investors Holdings Deutschland GmbH from 2006 to 2009. Mr. Polisson is an attorney and has a retired status with the Massachusetts and District of Columbia Bar Associations. | | Asset Allocation Trust |
Michael S. Scofield (Born 1943) | | Trustee, since 2010 | | Served on the Investment Company Institute’s Board of Governors and Executive Committee from 2008-2011 as well the Governing Council of the Independent Directors Council from 2006-2011 and the Independent Directors Council Executive Committee from 2008-2011. Trustee of the Evergreen Fund complex (and its predecessors) from 1984 to 2010. Chairman of the Evergreen Funds from 2000-2010. Former Trustee of the Mentor Funds. Retired Attorney, Law Offices of Michael S. Scofield. | | Asset Allocation Trust |
Pamela Wheelock***** (Born 1959) | | Trustee, since 2018; Advisory Board Member, from 2017 to 2018 | | Chief Operating Officer, Twin Cities Habitat for Humanity, since January, 2017. Vice President of University Services, University of Minnesota from 2012 to 2017. Prior thereto, Interim President and Chief Executive Officer of Blue Cross Blue Shield of Minnesota from 2010 to 2011, Chairman of the Board from 2009 to 2011 and Board Director from 2003 to 2015. Vice President, Leadership and Community Engagement, Bush Foundation, Saint Paul, Minnesota (a private foundation) from 2009 to 2011. Executive Vice President and Chief Financial Officer, Minnesota Sports and Entertainment from 2004 to 2009 and Senior Vice President from 2002 to 2004. Commissioner of Finance, State of Minnesota, from 1999 to 2002. Currently on the Board of Directors, Governance Committee and Finance Committee, for the Minnesota Philanthropy Partners (Saint Paul Foundation) since 2012 and Board Chair of the Minnesota Wild Foundation since 2010. | | Asset Allocation Trust |
| * | Length of service dates reflect the Trustee’s commencement of service with the Trust’s predecessor entities, where applicable. |
| ** | Jane Freeman became Chair Liaison effective January 1, 2018. |
| *** | Olivia Mitchell became Chairman of the Governance Committee effective January 1, 2018. |
| **** | Timothy Penny became Chairman effective January 1, 2018. |
| ***** | James Polisson and Pamela Wheelock each became a Trustee effective January 1, 2018. |
| | | | | | |
| Other information (unaudited) | | Wells Fargo Small Cap Opportunities Fund | | | 33 | |
Officers
| | | | | | |
Name and year of birth | | Position held and length of service | | Principal occupations during past five years or longer | | |
Andrew Owen (Born 1960) | | President, since 2017 | | Executive Vice President of Wells Fargo & Company and Head of Affiliated Managers, Wells Fargo Asset Management, since 2014. In addition, Mr. Owen is currently President, Chief Executive Officer and Director of Wells Fargo Funds Management, LLC since 2017. Prior thereto, Executive Vice President responsible for marketing, investments and product development for Wells Fargo Funds Management, LLC, from 2009 to 2014. | | |
Nancy Wiser1 (Born 1967) | | Treasurer, since 2012 | | Executive Vice President of Wells Fargo Funds Management, LLC since 2011. Chief Operating Officer and Chief Compliance Officer at LightBox Capital Management LLC, from 2008 to 2011. | | |
Alexander Kymn* (Born 1973) | | Secretary, since 2018; Chief Legal Officer, since 2018 | | Senior Company Counsel of Wells Fargo Bank, N.A. since 2018 (previously Senior Counsel from 2007 to 2018). Vice President of Wells Fargo Funds Management, LLC from 2008 to 2014. | | |
C. David Messman** (Born 1960) | | Secretary, since 2000; Chief Legal Officer, since 2003 | | Senior Vice President and Secretary of Wells Fargo Funds Management, LLC since 2001. Assistant General Counsel of Wells Fargo Bank, N.A. since 2013 and Vice President and Managing Counsel of Wells Fargo Bank, N.A. from 1996 to 2013. | | |
Michael H. Whitaker (Born 1967) | | Chief Compliance Officer, since 2016 | | Senior Vice President and Chief Compliance Officer since 2016. Senior Vice President and Chief Compliance Officer for Fidelity Investments from 2007 to 2016. | | |
David Berardi (Born 1975) | | Assistant Treasurer, since 2009 | | Vice President of Wells Fargo Funds Management, LLC since 2009. Vice President of Evergreen Investment Management Company, LLC from 2008 to 2010. Manager of Fund Reporting and Control for Evergreen Investment Management Company, LLC from 2004 to 2010. | | |
Jeremy DePalma1 (Born 1974) | | Assistant Treasurer, since 2009 | | Senior Vice President of Wells Fargo Funds Management, LLC since 2009. Senior Vice President of Evergreen Investment Management Company, LLC from 2008 to 2010 and head of the Fund Reporting and Control Team within Fund Administration from 2005 to 2010. | | |
| 1 | Nancy Wiser acts as Treasurer of 77 funds in the Fund Complex. Jeremy DePalma acts as Treasurer of 76 funds and Assistant Treasurer of 77 funds in the Fund Complex. |
| 2 | The Statement of Additional Information includes additional information about the Trustees and is available, without charge, upon request, by calling 1-800-222-8222 or by visiting the website at wellsfargofunds.com. |
| * | Alexander Kymn became the Secretary and Chief Legal Officer effective April 17, 2018. |
| ** | David Messman was the Secretary and Chief Legal Officer until April 16, 2018. |
| | | | |
| 34 | | Wells Fargo Small Cap Opportunities Fund | | List of abbreviations |
The following is a list of common abbreviations for terms and entities that may have appeared in this report.
| ACA | — ACA Financial Guaranty Corporation |
| ADR | — American depositary receipt |
| ADS | — American depositary shares |
| AGC | — Assured Guaranty Corporation |
| AGM | — Assured Guaranty Municipal |
| Ambac | — Ambac Financial Group Incorporated |
| AMT | — Alternative minimum tax |
| BAN | — Bond anticipation notes |
| BHAC | — Berkshire Hathaway Assurance Corporation |
| CAB | — Capital appreciation bond |
| CCAB | — Convertible capital appreciation bond |
| CDA | — Community Development Authority |
| CDO | — Collateralized debt obligation |
| CLO | — Collateralized loan obligation |
| DRIVER | — Derivative inverse tax-exempt receipts |
| DW&P | — Department of Water & Power |
| DWR | — Department of Water Resources |
| ECFA | — Educational & Cultural Facilities Authority |
| EDA | — Economic Development Authority |
| EDFA | — Economic Development Finance Authority |
| ETF | — Exchange-traded fund |
| FDIC | — Federal Deposit Insurance Corporation |
| FFCB | — Federal Farm Credit Banks |
| FGIC | — Financial Guaranty Insurance Corporation |
| FHA | — Federal Housing Administration |
| FHLB | — Federal Home Loan Bank |
| FHLMC | — Federal Home Loan Mortgage Corporation |
| FICO | — The Financing Corporation |
| FNMA | — Federal National Mortgage Association |
| GDR | — Global depositary receipt |
| GNMA | — Government National Mortgage Association |
| HCFR | — Healthcare facilities revenue |
| HEFA | — Health & Educational Facilities Authority |
| HEFAR | — Higher education facilities authority revenue |
| HFA | — Housing Finance Authority |
| HFFA | — Health Facilities Financing Authority |
| HUD | — Department of Housing and Urban Development |
| IDA | — Industrial Development Authority |
| IDAG | — Industrial Development Agency |
| KRW | — Republic of Korea won |
| LIBOR | — London Interbank Offered Rate |
| LIFER | — Long Inverse Floating Exempt Receipts |
| LLC | — Limited liability company |
| LLLP | — Limited liability limited partnership |
| LLP | — Limited liability partnership |
| MBIA | — Municipal Bond Insurance Association |
| MFHR | — Multifamily housing revenue |
| MSTR | — Municipal securities trust receipts |
| MUD | — Municipal Utility District |
| National | — National Public Finance Guarantee Corporation |
| PCFA | — Pollution Control Financing Authority |
| PCL | — Public Company Limited |
| PCR | — Pollution control revenue |
| PFA | — Public Finance Authority |
| PFFA | — Public Facilities Financing Authority |
| PFOTER | — Puttable floating option tax-exempt receipts |
| PJSC | — Public Joint Stock Company |
| plc | — Public limited company |
| PUTTER | — Puttable tax-exempt receipts |
| R&D | — Research & development |
| Radian | — Radian Asset Assurance |
| RAN | — Revenue anticipation notes |
| RDA | — Redevelopment Agency |
| RDFA | — Redevelopment Finance Authority |
| REIT | — Real estate investment trust |
| ROC | — Reset option certificates |
| SAVRS | — Select auction variable rate securities |
| SBA | — Small Business Authority |
| SDR | — Swedish depositary receipt |
| SFHR | — Single-family housing revenue |
| SFMR | — Single-family mortgage revenue |
| SIFMA | — Securities Industry and Financial Markets Association |
| SPA | — Standby purchase agreement |
| SPDR | — Standard & Poor’s Depositary Receipts |
| SPEAR | — Short Puttable Exempt Adjustable Receipts |
| STRIPS | — Separate trading of registered interest and |
| TAN | — Tax anticipation notes |
| TIPS | — Treasury inflation-protected securities |
| TRAN | — Tax revenue anticipation notes |
| TTFA | — Transportation Trust Fund Authority |
| TVA | — Tennessee Valley Authority |
This page is intentionally left blank.
This page is intentionally left blank.

For more information
More information about Wells Fargo Funds is available free upon request. To obtain literature, please write, email, visit the Fund’s website, or call:
Wells Fargo Funds
P.O. Box 8266
Boston, MA 02266-8266
Email: fundservice@wellsfargo.com
Website: wellsfargofunds.com
Individual investors: 1-800-222-8222
Retail investment professionals: 1-888-877-9275
Institutional investment professionals: 1-866-765-0778
This report and the financial statements contained herein are submitted for the general information of the shareholders of the Fund. If this report is used for promotional purposes, distribution of the report must be accompanied or preceded by a current prospectus. Before investing, please consider the investment objectives, risks, charges, and expenses of the investment. For a current prospectus and, if available, a summary prospectus, containing this information, call 1-800-222-8222 or visit the Fund’s website at wellsfargofunds.com. Read the prospectus carefully before you invest or send money.
Wells Fargo Asset Management (WFAM) is a trade name used by the asset management businesses of Wells Fargo & Company. Wells Fargo Funds Management, LLC, a wholly owned subsidiary of Wells Fargo & Company, provides investment advisory and administrative services for Wells Fargo Funds. Other affiliates of Wells Fargo & Company provide subadvisory and other services for the funds. The funds are distributed by Wells Fargo Funds Distributor, LLC, Member FINRA, an affiliate of Wells Fargo & Company. Neither Wells Fargo Funds Distributor nor Wells Fargo Funds Management holds fund shareholder accounts or assets. This material is for general informational and educational purposes only and is NOT intended to provide investment advice or a recommendation of any kind—including a recommendation for any specific investment, strategy, or plan.
NOT FDIC INSURED ◾ NO BANK GUARANTEE ◾ MAY LOSE VALUE
© 2018 Wells Fargo Funds Management, LLC. All rights reserved.
| | |
 | | 309983 05-18 A243/AR243 03-18 |
Annual Report
March 31, 2018

Wells Fargo Small Cap Value Fund


Reduce clutter. Save trees.
Sign up for electronic delivery of prospectuses and shareholder reports at wellsfargo.com/advantagedelivery
Contents
The views expressed and any forward-looking statements are as of March 31, 2018, unless otherwise noted, and are those of the Fund managers and/or Wells Fargo Funds Management, LLC. Discussions of individual securities, or the markets generally, or any Wells Fargo Fund are not intended as individual recommendations. Future events or results may vary significantly from those expressed in any forward-looking statements. The views expressed are subject to change at any time in response to changing circumstances in the market. Wells Fargo Funds Management, LLC and the Fund disclaim any obligation to publicly update or revise any views expressed or forward-looking statements.
NOT FDIC INSURED ◾ NO BANK GUARANTEE ◾ MAY LOSE VALUE
| | | | |
| 2 | | Wells Fargo Small Cap Value Fund | | Letter to shareholders (unaudited) |

Andrew Owen
President
Wells Fargo Funds
Dear Shareholder:
We are pleased to offer you this annual report for the Wells Fargo Small Cap Value Fund for the 12-month period that ended March 31, 2018. During the last three quarters of 2017, investors enjoyed consistently rising equity values globally. Short-term interest rates tended to increase, while long-term rates remained flat to lower. During the final two months of the first quarter of 2018, equity market volatility returned, stocks reversed year-to-date gains, and bond yields rose while prices fell.
For the period, U.S. stocks, as measured by the S&P 500 Index,1 gained 13.99% and international stocks, as measured by the MSCI ACWI ex USA Index (Net),2 added 16.53%. Emerging market stocks, as measured by the MSCI EM Index (Net),3 added 24.93%. In bond markets, the Bloomberg Barclays U.S. Aggregate Bond Index4 added 1.20% and the Bloomberg Barclays Municipal Bond Index5 added 2.66% while fixed-income investments outside the U.S. gained 11.75%, according to the Bloomberg Barclays Global Aggregate ex-USD Index.6 The ICE BofAML U.S. High Yield Index7 earned 3.69%.
Through the last nine months of 2017, stocks advanced on synchronized global growth, which led to higher investor and consumer confidence. The first quarter of 2018 began with strong stock market gains in January. A strong January 2018 U.S. employment report and inflation concerns prompted equity volatility in February. Investor optimism for growth was supplanted with concerns over trade tensions, increased interest rates, and the prospect of new data privacy regulations.
Reactions to U.S. interest rate increases were uneven across the yield curve and globally.
The U.S. Federal Reserve (Fed) increased the federal funds rate three times during the 12-month period for a combined 75 basis points (bps; 100 bps equals 1.00%). Following an increase in March 2017, short-term bond yields in the U.S. rose while longer-term Treasury yields were little changed. Municipal bond returns were positive, helped by strong demand and constrained new-issue supply. The Fed raised the target interest rate once again in June 2017 to a range of 1.00% to 1.25%. Ten-year U.S. Treasury yields declined, the yield curve flattened, and long-term bond prices benefited.
| 1 | The S&P 500 Index consists of 500 stocks chosen for market size, liquidity, and industry group representation. It is a market-value-weighted index with each stock’s weight in the index proportionate to its market value. You cannot invest directly in an index. |
| 2 | The Morgan Stanley Capital International (MSCI) All Country World Index (ACWI) ex USA Index (Net) is a free-float-adjusted market-capitalization-weighted index that is designed to measure the equity market performance of developed markets, excluding the United States and Canada. Source: MSCI. MSCI makes no express or implied warranties or representations and shall have no liability whatsoever with respect to any MSCI data contained herein. The MSCI data may not be further redistributed or used as a basis for other indices or any securities or financial products. This report is not approved, reviewed, or produced by MSCI. You cannot invest directly in an index. |
| 3 | The MSCI Emerging Markets (EM) Index (Net) is a free-float-adjusted market-capitalization-weighted index that is designed to measure large- and mid-cap equity market performance of emerging markets. The MSCI EM Index (Net) consists of the following 24 emerging market country indices: Brazil, Chile, China, Colombia, Czech Republic, Egypt, Greece, Hungary, India, Indonesia, Korea, Malaysia, Mexico, Pakistan, Peru, the Philippines, Poland, Qatar, Russia, South Africa, Taiwan, Thailand, Turkey, and the United Arab Emirates. You cannot invest directly in an index. |
| 4 | The Bloomberg Barclays U.S. Aggregate Bond Index is a broad-based benchmark that measures the investment-grade, U.S. dollar-denominated, fixed-rate taxable bond market, including Treasuries, government-related and corporate securities, mortgage-backed securities (agency fixed-rate and hybrid adjustable-rate mortgage pass-throughs), asset-backed securities, and commercial mortgage-backed securities. You cannot invest directly in an index. |
| 5 | The Bloomberg Barclays Municipal Bond Index is an unmanaged index composed of long-term tax-exempt bonds with a minimum credit rating of Baa. You cannot invest directly in an index. |
| 6 | The Bloomberg Barclays Global Aggregate ex-USD Index is an unmanaged index that provides a broad-based measure of the global investment-grade fixed-income markets excluding the U.S. dollar-denominated debt market. You cannot invest directly in an index. |
| 7 | The ICE BofAML U.S. High Yield Index is a market-capitalization-weighted index of domestic and Yankee high-yield bonds. The index tracks the performance of high-yield securities traded in the U.S. bond market. You cannot invest directly in an index. Copyright 2018. ICE Data Indices, LLC. All rights reserved. |
| | | | | | |
| Letter to shareholders (unaudited) | | Wells Fargo Small Cap Value Fund | | | 3 | |
Internationally, central banks maintained low interest rates and accommodative monetary policies that supported business activity and stock values in foreign markets. A weaker U.S. dollar was generally supportive of business activity in regions around the globe. The Bank of Japan continued its accommodative monetary policies, and industrial production, retail sales, and fixed asset investment increased in China.
Growth continued through the summer of 2017.
Globally, stocks moved higher during the third quarter of 2017. Low inflation and interest rates supported accelerating global economic growth and corporate earnings. Brief episodes of geopolitical tensions, often associated with North Korea’s advancing nuclear missile program, flaring conflicts in the Middle East, and uncertainty surrounding U.S. trade policies, did not discourage investing activity.
In the U.S., economic data released during the quarter reflected a generally healthy economy. Second-quarter economic output grew at a 3.1% annual rate. Stocks in international developed and emerging markets continued to benefit from improving economic growth.
Positive economic and market news continued as 2017 closed and 2018 began.
During the fourth quarter of 2017, stock markets continued the move higher. Third-quarter economic output in the U.S. grew at a 3.2% annual rate. The unemployment rate fell to a 17-year low of 4.1%. Tax reform passed and wage growth data improved, encouraging increased business and consumer spending.
Fed officials announced in October 2017 plans to begin unwinding its $4.5 trillion portfolio of bonds and other assets accumulated during rounds of quantitative easing conducted since the 2008–2009 recession. Still, restrained inflation kept long-term bond rates steady and the flattened yield curve persisted. The Fed raised the federal funds rate target to a range of 1.25% to 1.50% in December 2017 and began selling bonds held in its portfolio.
2018 opened with continued stock advances, then volatility.
Improving business and economic data globally continued to support stocks through January 2018. Political wrangling in the U.S. over budget resolutions could not dissuade investors from buying stocks as payrolls and factory orders increased. Long-term interest rates in the U.S. trended higher as the yield curve steepened—the 10-year Treasury rate moved from 2.46% to 2.84% and the 30-year rate moved from 2.81% to 3.08% during January 2018.
Investor sentiment shifted in February as inflation concerns emerged in the U.S. when readings from the Producer Price Index in January rose 2.5% year over year. During February, the U.S. market endured a loss from January’s high of nearly 12% before recovering much of that loss. The Fed raised the federal funds rate in March 2018. Bond yields rose across the yield curve.
During January 2018, purchasing managers’ indices in China, the eurozone, India, and Japan reported data for December that indicated continued growth. Despite positive economic signals and business fundamentals, international stock values fell during February and March 2018, swept up in the selling momentum in U.S. markets.
Globally, stocks moved higher during the third quarter of 2017.
During February, the U.S. market endured a loss from January’s high of nearly 12% before recovering much of that loss.
| | | | |
| 4 | | Wells Fargo Small Cap Value Fund | | Letter to shareholders (unaudited) |
Don’t let short-term uncertainty derail long-term investment goals.
Periods of investment uncertainty can present challenges, but experience has taught us that maintaining long-term investment goals can be an effective way to plan for the future. To help you create a sound strategy based on your personal goals and risk tolerance, Wells Fargo Funds offers more than 100 mutual funds spanning a wide range of asset classes and investment styles. Although diversification cannot guarantee an investment profit or prevent losses, we believe it can be an effective way to manage investment risk and potentially smooth out overall portfolio performance. We encourage investors to know their investments and to understand that appropriate levels of risk-taking may unlock opportunities.
Thank you for choosing to invest with Wells Fargo Funds. We appreciate your confidence in us and remain committed to helping you meet your financial needs.
Sincerely,

Andrew Owen
President
Wells Fargo Funds
For further information about your Fund, contact your investment professional, visit our website at wellsfargofunds.com, or call us directly at 1-800-222-8222.
This page is intentionally left blank.
| | | | |
| 6 | | Wells Fargo Small Cap Value Fund | | Performance highlights (unaudited) |
Investment objective
The Fund seeks long-term capital appreciation.
Manager
Wells Fargo Funds Management, LLC
Subadviser
Wells Capital Management Incorporated
Portfolio managers
Erik C. Astheimer
Michael Schneider, CFA®
Average annual total returns (%) as of March 31, 20181
| | | | | | | | | | | | | | | | | | | | | | | | | | | | | | | | | | |
| | | | | Including sales charge | | | Excluding sales charge | | | Expense ratios2 (%) | |
| | | Inception date | | 1 year | | | 5 year | | | 10 year | | | 1 year | | | 5 year | | | 10 year | | | Gross | | | Net3 | |
| Class A (SMVAX) | | 11-30-2000 | | | 1.78 | | | | 6.23 | | | | 6.34 | | | | 7.97 | | | | 7.50 | | | | 6.97 | | | | 1.32 | | | | 1.28 | |
| Class C (SMVCX) | | 11-30-2000 | | | 6.08 | | | | 6.69 | | | | 6.17 | | | | 7.08 | | | | 6.69 | | | | 6.17 | | | | 2.07 | | | | 2.03 | |
| Class R6 (SMVRX) | | 6-28-2013 | | | – | | | | – | | | | – | | | | 8.38 | | | | 7.97 | | | | 7.44 | | | | 0.89 | | | | 0.83 | |
| Administrator Class (SMVDX) | | 7-30-2010 | | | – | | | | – | | | | – | | | | 8.18 | | | | 7.72 | | | | 7.22 | | | | 1.24 | | | | 1.08 | |
| Institutional Class (WFSVX) | | 7-31-2007 | | | – | | | | – | | | | – | | | | 8.39 | | | | 7.93 | | | | 7.42 | | | | 0.99 | | | | 0.88 | |
| Russell 2000® Value Index4 | | – | | | – | | | | – | | | | – | | | | 5.13 | | | | 9.96 | | | | 8.61 | | | | – | | | | – | |
Figures quoted represent past performance, which is no guarantee of future results, and do not reflect taxes that a shareholder may pay on fund distributions or the redemption of fund shares. Investment return and principal value of an investment will fluctuate so that an investor’s shares, when redeemed, may be worth more or less than their original cost. Performance shown without sales charges would be lower if sales charges were reflected. Current performance may be lower or higher than the performance data quoted, which assumes the reinvestment of dividends and capital gains. Current month-end performance is available on the Fund’s website, wellsfargofunds.com.
Index returns do not include transaction costs associated with buying and selling securities, any mutual fund fees or expenses, or any taxes. It is not possible to invest directly in an index.
For Class A shares, the maximum front-end sales charge is 5.75%. For Class C shares, the maximum contingent deferred sales charge is 1.00%. Performance including a contingent deferred sales charge assumes the sales charge for the corresponding time period. Class R6, Administrator Class, and Institutional Class shares are sold without a front-end sales charge or contingent deferred sales charge.
Stock values fluctuate in response to the activities of individual companies and general market and economic conditions. Smaller-company stocks tend to be more volatile and less liquid than those of larger companies. The use of derivatives may reduce returns and/or increase volatility. Certain investment strategies tend to increase the total risk of an investment (relative to the broader market). The Fund is exposed to foreign investment risk. Consult the Fund’s prospectus for additional information on these and other risks.
Please see footnotes on page 7.
| | | | | | |
| Performance highlights (unaudited) | | Wells Fargo Small Cap Value Fund | | | 7 | |
|
| Growth of $10,000 investment as of March 31, 20185 |
|
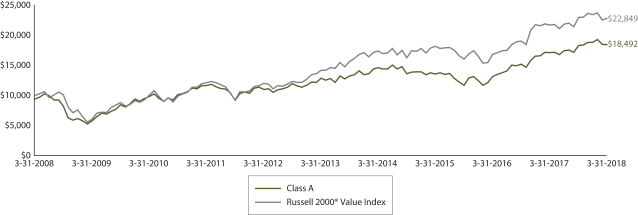 |
| 1 | Historical performance shown for Class R6 shares prior to their inception reflects the performance of Institutional Class shares and includes the higher expenses applicable to Institutional Class shares. If these expenses had not been included, returns for Class R6 shares would be higher. Historical performance shown for Administrator Class shares prior to their inception reflects the performance of Institutional Class shares and has been adjusted to reflect the higher expenses applicable to Administrator Class shares. Historical performance shown for Institutional Class shares prior to their inception reflects the performance of the former Investor Class shares, and includes the higher expenses applicable to the former Investor class shares. If these expenses had not been included, returns for Institutional Class shares would be higher. Effective June 20, 2008, Class Z was renamed Investor Class and modified to assume the features and attributes of the Investor Class. |
| 2 | Reflects the expense ratios as stated in the most recent prospectuses. The expense ratios shown are subject to change and may differ from the annualized expense ratios shown in the financial highlights of this report. |
| 3 | The manager has contractually committed through July 31, 2018, to waive fees and/or reimburse expenses to the extent necessary to cap the Fund’s Total Annual Fund Operating Expenses After Fee Waivers at the amounts shown. After this time, the cap may be increased or the commitment to maintain the cap may be terminated only with the approval of the Board of Trustees. Brokerage commissions, stamp duty fees, interest, taxes, acquired fund fees and expenses (if any), and extraordinary expenses are excluded from the expense cap. Without this cap, the Fund’s returns would have been lower. The expense ratio paid by an investor is the net expense ratio (the total annual fund operating expenses after fee waivers) as stated in the prospectuses. |
| 4 | The Russell 2000® Value Index measures the performance of those Russell 2000 companies with lower price/book ratios and lower forecasted growth values. You cannot invest directly in an index. |
| 5 | The chart compares the performance of Class A shares for the most recent ten years with the Russell 2000® Value Index. The chart assumes a hypothetical investment of $10,000 in Class A shares and reflects all operating expenses. |
| 6 | The ten largest holdings, excluding cash and cash equivalents, are calculated based on the value of the investments divided by total net assets of the Fund. Holdings are subject to change and may have changed since the date specified. |
| 7 | Amounts are calculated based on the total long-term investments of the Fund. These amounts are subject to change and may have changed since the date specified. |
| * | This security was no longer held at the end of the reporting period. |
| | | | |
| 8 | | Wells Fargo Small Cap Value Fund | | Performance highlights (unaudited) |
MANAGER’S DISCUSSION
Fund highlights
| ∎ | | The Fund outperformed its benchmark, the Russell 2000® Value Index, for the 12-month period that ended March 31, 2018. |
| ∎ | | Strong stock selection in the consumer discretionary and financials sectors drove performance, as did an underweight to the real estate sector. |
| ∎ | | Weakness in the industrials and information technology (IT) sectors detracted from performance. |
U.S. small-cap equities posted a solid year in 2017. Economic growth in the U.S. was strong and improved globally. Major tax legislation was passed in the U.S., which, among other things, lowers the corporate tax rate. This should benefit many U.S.-based small-cap companies. However, after many years of strong performance, we are cautious on the markets overall. A lot of good news already may be priced into stocks, and any negative change in outlook could cause pressure on equities. In addition, rising interest rates, which currently are being viewed as a positive, could at some point start putting pressure on earnings multiples, which also could be a headwind for stocks.
Portfolio positions in selected stocks increased.
We are bottom-up stock pickers, so sector weights are a reflection of individual stock selection. Over the past year, the Fund’s weighting in banks increased materially. We expect the yield curve to steepen, which may lead to increased profitability for the industry as a whole and for selected stocks in the portfolio. In addition, we believe a more benign regulatory environment is also a tailwind for these companies. We have increased our exposure to selected energy sector stocks and are now slightly overweight the sector. This is primarily driven by our increased investment in Navigator Holdings Limited, which operates a fleet of liquefied gas carriers and stands to benefit from new petrochemical plants coming online, as well as increased U.S. exports.
The Fund benefited from positive stock selection in the consumer discretionary and financials sectors as well as an underweight to the real estate sector.
Strong stock selection in the consumer discretionary sector helped Fund performance. The Fund’s positions in Cavco Industries, Incorporated, and Skyline Corporation returned 49% and 134%, respectively. Both companies are manufactured-housing producers, which have been continuing to benefit from the improvement in the industry. Cavco is the second-largest producer in the country and has an excellent management team and a solid balance sheet. Skyline is merging with a much larger, private manufactured-housing producer, which has increased the company’s market share materially. Our outlook for both companies remains positive.
The Fund’s financial stocks contributed to performance. Enova International, Incorporated, an online consumer lender, increased 48%. Enova was aided by strong demand for its products, solid credit performance, and a more benign regulatory environment. Another contributor was The Bancorp, Incorporated, which increased 112%. Bancorp is a commercial bank and is expected to benefit from higher interest rates more than its peers.
Our underweight to the poorly performing real estate sector aided Fund performance for the period. Within our holdings, we continue to remain positive on UMH Properties, Incorporated, which owns manufactured-housing communities. We believe the demand for low-cost housing may continue to increase, which could benefit UMH.
Weakness in the industrials and IT sectors hindered the Fund’s performance.
The Fund’s industrial holdings detracted from performance. The primary detractor within industrials was Armstrong Flooring, Incorporated, which decreased 26%. Armstrong, a producer of wood flooring products, was affected by the ongoing competition from Chinese imports. The company’s turnaround is taking longer than expected; however, we remain constructive, as we believe there is ample room to improve margins.
Within the IT sector, the Fund’s holdings detracted from performance during the period. Synchronoss Technologies, Incorporated*, a provider of telecom cloud-services, was the largest detractor, decreasing 63%. The underperformance of Synchronoss was due to the ill-timed strategy pivot to enter the enterprise security market with the purchase of Intralinks Holdings, Incorporated. We exited our position in the company during the period.
Please see footnotes on page 7.
| | | | | | |
| Performance highlights (unaudited) | | Wells Fargo Small Cap Value Fund | | | 9 | |
We believe it is prudent to remain cautious.
We are cautious on the broader equity market. After such a strong run over the past several years, we would not be surprised to see the equity market take a pause. We expect volatility to increase as the Federal Reserve slowly unwinds the extraordinary monetary policies it put in place during the Great Recession.
While we are cautious on the broader markets, we are positive on how the portfolio is positioned. We believe that rising interest rates and the potential for deregulation and consolidation are positive for the banking industry, and we are overweight banks. We own gold miners, which tend to have very little correlation with the broader equity market, and we are hopeful that our investment in these stocks can provide stability to the portfolio in times of broader market volatility. In addition, increased volatility may provide us with a greater set of investment opportunities for us to deploy capital. We remain encouraged with our current holdings and our outlook for the Fund.
| | | | |
| Ten largest holdings (%) as of March 31, 20186 | |
National General Holdings Corporation | | | 3.83 | |
Randgold Resources Limited ADR | | | 3.58 | |
BankUnited Incorporated | | | 3.09 | |
Enova International Incorporated | | | 3.03 | |
The Bancorp Incorporated | | | 2.80 | |
Bloomin’ Brands Incorporated | | | 2.51 | |
CenterState Banks Incorporated | | | 2.45 | |
ACCO Brands Corporation | | | 2.45 | |
OSI Systems Incorporated | | | 2.38 | |
Navigator Holdings Limited | | | 2.37 | |
|
| Sector distribution as of March 31, 20187 |
|
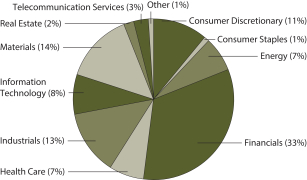
|
Please see footnotes on page 7.
| | | | |
| 10 | | Wells Fargo Small Cap Value Fund | | Fund expenses (unaudited) |
As a shareholder of the Fund, you incur two types of costs: (1) transaction costs, including sales charges (loads) on purchase payments and contingent deferred sales charges (if any) on redemptions and (2) ongoing costs, including management fees, distribution (12b-1) and/or shareholder servicing fees, and other Fund expenses. This example is intended to help you understand your ongoing costs (in dollars) of investing in the Fund and to compare these costs with the ongoing costs of investing in other mutual funds.
The example is based on an investment of $1,000 invested at the beginning of the six-month period and held for the entire period from October 1, 2017 to March 31, 2018.
Actual expenses
The “Actual” line of the table below provides information about actual account values and actual expenses. You may use the information in this line, together with the amount you invested, to estimate the expenses that you paid over the period. Simply divide your account value by $1,000 (for example, an $8,600 account value divided by $1,000 = 8.6), then multiply the result by the number in the “Actual” line under the heading entitled “Expenses paid during period” for your applicable class of shares to estimate the expenses you paid on your account during this period.
Hypothetical example for comparison purposes
The “Hypothetical” line of the table below provides information about hypothetical account values and hypothetical expenses based on the Fund’s actual expense ratio and an assumed rate of return of 5% per year before expenses, which is not the Fund’s actual return. The hypothetical account values and expenses may not be used to estimate the actual ending account balance or expenses you paid for the period. You may use this information to compare the ongoing costs of investing in the Fund and other funds. To do so, compare this 5% hypothetical example with the 5% hypothetical examples that appear in the shareholder reports of the other funds.
Please note that the expenses shown in the table are meant to highlight your ongoing costs only and do not reflect any transactional costs, such as sales charges (loads) and contingent deferred sales charges. Therefore, the “Hypothetical” line of the table is useful in comparing ongoing costs only and will not help you determine the relative total costs of owning different funds. In addition, if these transactional costs were included, your costs would have been higher.
| | | | | | | | | | | | | | | | |
| | | Beginning account value 10-1-2017 | | | Ending account value 3-31-2018 | | | Expenses paid during the period¹ | | | Annualized net expense ratio | |
Class A | | | | | | | | | | | | | | | | |
Actual | | $ | 1,000.00 | | | $ | 1,010.55 | | | $ | 6.42 | | | | 1.28 | % |
Hypothetical (5% return before expenses) | | $ | 1,000.00 | | | $ | 1,018.55 | | | $ | 6.44 | | | | 1.28 | % |
Class C | | | | | | | | | | | | | | | | |
Actual | | $ | 1,000.00 | | | $ | 1,006.31 | | | $ | 10.15 | | | | 2.03 | % |
Hypothetical (5% return before expenses) | | $ | 1,000.00 | | | $ | 1,014.81 | | | $ | 10.20 | | | | 2.03 | % |
Class R6 | | | | | | | | | | | | | | | | |
Actual | | $ | 1,000.00 | | | $ | 1,011.90 | | | $ | 4.16 | | | | 0.83 | % |
Hypothetical (5% return before expenses) | | $ | 1,000.00 | | | $ | 1,020.79 | | | $ | 4.18 | | | | 0.83 | % |
Administrator Class | | | | | | | | | | | | | | | | |
Actual | | $ | 1,000.00 | | | $ | 1,011.43 | | | $ | 5.42 | | | | 1.08 | % |
Hypothetical (5% return before expenses) | | $ | 1,000.00 | | | $ | 1,019.55 | | | $ | 5.44 | | | | 1.08 | % |
Institutional Class | | | | | | | | | | | | | | | | |
Actual | | $ | 1,000.00 | | | $ | 1,012.39 | | | $ | 4.42 | | | | 0.88 | % |
Hypothetical (5% return before expenses) | | $ | 1,000.00 | | | $ | 1,020.54 | | | $ | 4.43 | | | | 0.88 | % |
| 1 | Expenses paid is equal to the annualized net expense ratio of each class multiplied by the average account value over the period, multiplied by the number of days in the most recent fiscal half-year divided by the number of days in the fiscal year (to reflect the one-half-year period). |
| | | | | | |
| Portfolio of investments—March 31, 2018 | | Wells Fargo Small Cap Value Fund | | | 11 | |
| | | | | | | | | | | | | | | | |
| Security name | | | | | | | | Shares | | | Value | |
| | | | |
Common Stocks: 98.10% | | | | | | | | | | | | | | | | |
| | | | |
Consumer Discretionary: 10.66% | | | | | | | | | | | | | | | | |
| | | | |
| Hotels, Restaurants & Leisure: 4.49% | | | | | | | | | | | | | | | | |
Bloomin’ Brands Incorporated | | | | | | | | | | | 566,600 | | | $ | 13,757,048 | |
Century Casinos Incorporated † | | | | | | | | | | | 1,326,000 | | | | 9,891,960 | |
Peak Resorts Incorporated | | | | | | | | | | | 100 | | | | 485 | |
Scientific Games Corporation Class A † | | | | | | | | | | | 8,600 | | | | 357,760 | |
The Wendy’s Company | | | | | | | | | | | 38,100 | | | | 668,655 | |
| | | | |
| | | | | | | | | | | | | | | 24,675,908 | |
| | | | | | | | | | | | | | | | |
| | | | |
| Household Durables: 5.96% | | | | | | | | | | | | | | | | |
Cavco Industries Incorporated † | | | | | | | | | | | 73,606 | | | | 12,789,043 | |
Nobility Homes Incorporated | | | | | | | | | | | 64,300 | | | | 1,350,300 | |
Skyline Corporation † | | | | | | | | | | | 366,900 | | | | 8,071,800 | |
Taylor Morrison Home Corporation Class A † | | | | | | | | | | | 181,000 | | | | 4,213,680 | |
The New Home Company Incorporated † | | | | | | | | | | | 568,700 | | | | 6,301,196 | |
| | | | |
| | | | | | | | | | | | | | | 32,726,019 | |
| | | | | | | | | | | | | | | | |
| | | | |
| Textiles, Apparel & Luxury Goods: 0.21% | | | | | | | | | | | | | | | | |
G-III Apparel Group Limited † | | | | | | | | | | | 30,300 | | | | 1,141,704 | |
| | | | | | | | | | | | | | | | |
| | | | |
Consumer Staples: 0.71% | | | | | | | | | | | | | | | | |
| | | | |
| Food Products: 0.71% | | | | | | | | | | | | | | | | |
Amira Nature Foods Limited † | | | | | | | | | | | 932,600 | | | | 3,888,942 | |
| | | | | | | | | | | | | | | | |
| | | | |
Energy: 7.36% | | | | | | | | | | | | | | | | |
| | | | |
| Energy Equipment & Services: 2.42% | | | | | | | | | | | | | | | | |
CARBO Ceramics Incorporated † | | | | | | | | | | | 655,600 | | | | 4,753,100 | |
Newpark Resources Incorporated † | | | | | | | | | | | 544,200 | | | | 4,408,020 | |
Parker Drilling Company † | | | | | | | | | | | 769,000 | | | | 488,315 | |
PHI Incorporated - Non Voting † | | | | | | | | | | | 92,200 | | | | 944,128 | |
Smart Sand Incorporated † | | | | | | | | | | | 466,300 | | | | 2,713,866 | |
| | | | |
| | | | | | | | | | | | | | | 13,307,429 | |
| | | | | | | | | | | | | | | | |
| | | | |
| Oil, Gas & Consumable Fuels: 4.94% | | | | | | | | | | | | | | | | |
Navigator Holdings Limited † | | | | | | | | | | | 1,109,600 | | | | 13,037,800 | |
Oasis Petroleum Incorporated † | | | | | | | | | | | 551,400 | | | | 4,466,340 | |
Paramount Resources Limited Class A † | | | | | | | | | | | 183,120 | | | | 2,090,516 | |
Range Resources Corporation | | | | | | | | | | | 306,100 | | | | 4,450,694 | |
Sanchez Energy Corporation † | | | | | | | | | | | 986,500 | | | | 3,087,745 | |
| | | | |
| | | | | | | | | | | | | | | 27,133,095 | |
| | | | | | | | | | | | | | | | |
| | | | |
Financials: 33.33% | | | | | | | | | | | | | | | | |
| | | | |
| Banks: 21.01% | | | | | | | | | | | | | | | | |
Ameris Bancorp | | | | | | | | | | | 135,300 | | | | 7,157,370 | |
BankUnited Incorporated | | | | | | | | | | | 424,200 | | | | 16,959,516 | |
CenterState Banks Incorporated | | | | | | | | | | | 508,000 | | | | 13,477,240 | |
First Horizon National Corporation | | | | | | | | | | | 392,800 | | | | 7,396,424 | |
The accompanying notes are an integral part of these financial statements.
| | | | |
| 12 | | Wells Fargo Small Cap Value Fund | | Portfolio of investments—March 31, 2018 |
| | | | | | | | | | | | | | | | |
| Security name | | | | | | | | Shares | | | Value | |
| | | | |
| Banks (continued) | | | | | | | | | | | | | | | | |
Hanmi Financial Corporation | | | | | | | | | | | 178,100 | | | $ | 5,476,575 | |
Hilltop Holdings Incorporated | | | | | | | | | | | 217,500 | | | | 5,102,550 | |
Hope Bancorp Incorporated | | | | | | | | | | | 708,700 | | | | 12,891,253 | |
IBERIABANK Corporation | | | | | | | | | | | 160,700 | | | | 12,534,600 | |
LegacyTexas Financial Group | | | | | | | | | | | 208,900 | | | | 8,945,098 | |
OFG Bancorp | | | | | | | | | | | 184,400 | | | | 1,926,980 | |
Sterling BanCorp | | | | | | | | | | | 233,100 | | | | 5,256,405 | |
The Bancorp Incorporated † | | | | | | | | | | | 1,424,900 | | | | 15,388,920 | |
Valley National Bancorp | | | | | | | | | | | 229,600 | | | | 2,860,816 | |
| | | | |
| | | | | | | | | | | | | | | 115,373,747 | |
| | | | | | | | | | | | | | | | |
| | | | |
| Capital Markets: 0.34% | | | | | | | | | | | | | | | | |
Medley Management Incorporated Class A (l) | | | | | | | | | | | 323,400 | | | | 1,843,380 | |
| | | | | | | | | | | | | | | | |
| | | | |
| Consumer Finance: 3.03% | | | | | | | | | | | | | | | | |
Enova International Incorporated † | | | | | | | | | | | 753,800 | | | | 16,621,290 | |
| | | | | | | | | | | | | | | | |
| | | | |
| Insurance: 6.51% | | | | | | | | | | | | | | | | |
Argo Group International Holdings Limited | | | | | | | | | | | 128,230 | | | | 7,360,402 | |
First Acceptance Corporation † | | | | | | | | | | | 83,100 | | | | 70,635 | |
James River Group Holdings Limited | | | | | | | | | | | 205,900 | | | | 7,303,273 | |
National General Holdings Corporation | | | | | | | | | | | 865,100 | | | | 21,030,581 | |
| | | | |
| | | | | | | | | | | | | | | 35,764,891 | |
| | | | | | | | | | | | | | | | |
| | | | |
| Mortgage REITs: 1.84% | | | | | | | | | | | | | | | | |
Redwood Trust Incorporated | | | | | | | | | | | 654,600 | | | | 10,126,662 | |
| | | | | | | | | | | | | | | | |
| | | | |
| Thrifts & Mortgage Finance: 0.60% | | | | | | | | | | | | | | | | |
BofI Holding Incorporated † | | | | | | | | | | | 49,000 | | | | 1,985,970 | |
Essent Group Limited † | | | | | | | | | | | 30,500 | | | | 1,298,080 | |
| | | | |
| | | | | | | | | | | | | | | 3,284,050 | |
| | | | | | | | | | | | | | | | |
| | | | |
Health Care: 6.59% | | | | | | | | | | | | | | | | |
| | | | |
| Health Care Equipment & Supplies: 0.85% | | | | | | | | | | | | | | | | |
Hologic Incorporated † | | | | | | | | | | | 29,900 | | | | 1,117,064 | |
Lantheus Holdings Incorporated † | | | | | | | | | | | 216,800 | | | | 3,447,120 | |
OraSure Technologies Incorporated † | | | | | | | | | | | 6,800 | | | | 114,852 | |
| | | | |
| | | | | | | | | | | | | | | 4,679,036 | |
| | | | | | | | | | | | | | | | |
| | | | |
| Health Care Providers & Services: 2.67% | | | | | | | | | | | | | | | | |
Cross Country Healthcare Incorporated † | | | | | | | | | | | 563,300 | | | | 6,258,263 | |
Tivity Health Incorporated † | | | | | | | | | | | 211,500 | | | | 8,385,975 | |
| | | | |
| | | | | | | | | | | | | | | 14,644,238 | |
| | | | | | | | | | | | | | | | |
| | | | |
| Health Care Technology: 2.39% | | | | | | | | | | | | | | | | |
Allscripts Healthcare Solutions Incorporated † | | | | | | | | | | | 683,800 | | | | 8,444,930 | |
Omnicell Incorporated † | | | | | | | | | | | 108,600 | | | | 4,713,240 | |
| | | | |
| | | | | | | | | | | | | | | 13,158,170 | |
| | | | | | | | | | | | | | | | |
The accompanying notes are an integral part of these financial statements.
| | | | | | |
| Portfolio of investments—March 31, 2018 | | Wells Fargo Small Cap Value Fund | | | 13 | |
| | | | | | | | | | | | | | | | |
| Security name | | | | | | | | Shares | | | Value | |
| | | | |
| Pharmaceuticals: 0.68% | | | | | | | | | | | | | | | | |
Prestige Brands Holdings Incorporated † | | | | | | | | | | | 110,300 | | | $ | 3,719,316 | |
| | | | | | | | | | | | | | | | |
| | | | |
Industrials: 13.30% | | | | | | | | | | | | | | | | |
| | | | |
| Air Freight & Logistics: 0.84% | | | | | | | | | | | | | | | | |
Atlas Air Worldwide Holdings Incorporated † | | | | | | | | | | | 76,300 | | | | 4,612,335 | |
| | | | | | | | | | | | | | | | |
| | | | |
| Building Products: 1.60% | | | | | | | | | | | | | | | | |
Armstrong Flooring Incorporated † | | | | | | | | | | | 344,700 | | | | 4,677,579 | |
CSW Industrials Incorporated † | | | | | | | | | | | 91,200 | | | | 4,108,560 | |
| | | | |
| | | | | | | | | | | | | | | 8,786,139 | |
| | | | | | | | | | | | | | | | |
| | | | |
| Commercial Services & Supplies: 3.83% | | | | | | | | | | | | | | | | |
ABM Industries Incorporated | | | | | | | | | | | 151,000 | | | | 5,055,480 | |
ACCO Brands Corporation | | | | | | | | | | | 1,073,700 | | | | 13,474,935 | |
Healthcare Services Group Incorporated | | | | | | | | | | | 40,300 | | | | 1,752,244 | |
Hudson Technologies Incorporated † | | | | | | | | | | | 149,000 | | | | 736,060 | |
| | | | |
| | | | | | | | | | | | | | | 21,018,719 | |
| | | | | | | | | | | | | | | | |
| | | | |
| Construction & Engineering: 1.44% | | | | | | | | | | | | | | | | |
Bird Construction Incorporated (a) | | | | | | | | | | | 194,200 | | | | 1,288,638 | |
IES Holdings Incorporated † | | | | | | | | | | | 142,800 | | | | 2,163,420 | |
Tutor Perini Corporation † | | | | | | | | | | | 202,900 | | | | 4,473,945 | |
| | | | |
| | | | | | | | | | | | | | | 7,926,003 | |
| | | | | | | | | | | | | | | | |
| | | | |
| Machinery: 3.74% | | | | | | | | | | | | | | | | |
Actuant Corporation Class A | | | | | | | | | | | 209,000 | | | | 4,859,250 | |
Freightcar America Incorporated (l) | | | | | | | | | | | 697,800 | | | | 9,350,520 | |
Milacron Holdings Corporation † | | | | | | | | | | | 67,100 | | | | 1,351,394 | |
Mueller Water Products Incorporated Class A | | | | | | | | | | | 457,300 | | | | 4,970,851 | |
| | | | |
| | | | | | | | | | | | | | | 20,532,015 | |
| | | | | | | | | | | | | | | | |
| | | | |
| Professional Services: 1.03% | | | | | | | | | | | | | | | | |
Hill International Incorporated † | | | | | | | | | | | 987,800 | | | | 5,630,460 | |
| | | | | | | | | | | | | | | | |
| | | | |
| Trading Companies & Distributors: 0.82% | | | | | | | | | | | | | | | | |
Applied Industrial Technologies Incorporated | | | | | | | | | | | 62,000 | | | | 4,519,800 | |
| | | | | | | | | | | | | | | | |
| | | | |
Information Technology: 8.32% | | | | | | | | | | | | | | | | |
| | | | |
| Communications Equipment: 1.68% | | | | | | | | | | | | | | | | |
Finisar Corporation † | | | | | | | | | | | 291,300 | | | | 4,605,453 | |
Harmonic Incorporated † | | | | | | | | | | | 1,210,800 | | | | 4,601,040 | |
| | | | |
| | | | | | | | | | | | | | | 9,206,493 | |
| | | | | | | | | | | | | | | | |
| | | | |
| Electronic Equipment, Instruments & Components: 2.78% | | | | | | | | | | | | | | | | |
Coherent Incorporated † | | | | | | | | | | | 11,700 | | | | 2,192,580 | |
OSI Systems Incorporated † | | | | | | | | | | | 200,400 | | | | 13,080,108 | |
| | | | |
| | | | | | | | | | | | | | | 15,272,688 | |
| | | | | | | | | | | | | | | | |
The accompanying notes are an integral part of these financial statements.
| | | | |
| 14 | | Wells Fargo Small Cap Value Fund | | Portfolio of investments—March 31, 2018 |
| | | | | | | | | | | | | | | | |
| Security name | | | | | | | | Shares | | | Value | |
| | | | |
| IT Services: 0.48% | | | | | | | | | | | | | | | | |
Travelport Worldwide Limited | | | | | | | | | | | 161,100 | | | $ | 2,632,374 | |
| | | | | | | | | | | | | | | | |
| | | | |
| Technology Hardware, Storage & Peripherals: 3.38% | | | | | | | | | | | | | | | | |
Cray Incorporated † | | | | | | | | | | | 534,900 | | | | 11,072,430 | |
Diebold Nixdorf Incorporated | | | | | | | | | | | 229,600 | | | | 3,535,840 | |
Quantum Corporation † | | | | | | | | | | | 1,090,300 | | | | 3,968,692 | |
| | | | |
| | | | | | | | | | | | | | | 18,576,962 | |
| | | | | | | | | | | | | | | | |
| | | | |
Materials: 13.63% | | | | | | | | | | | | | | | | |
| | | | |
| Containers & Packaging: 0.33% | | | | | | | | | | | | | | | | |
Intertape Polymer Group Incorporated | | | | | | | | | | | 112,500 | | | | 1,789,875 | |
| | | | | | | | | | | | | | | | |
| | | | |
| Metals & Mining: 13.30% | | | | | | | | | | | | | | | | |
Agnico Eagle Mines Limited | | | | | | | | | | | 11,300 | | | | 475,391 | |
Argonaut Gold Incorporated † | | | | | | | | | | | 734,600 | | | | 1,388,394 | |
Carpenter Technology Corporation | | | | | | | | | | | 91,400 | | | | 4,032,568 | |
Eldorado Gold Corporation † | | | | | | | | | | | 1,242,600 | | | | 1,043,784 | |
Haynes International Incorporated | | | | | | | | | | | 201,500 | | | | 7,477,665 | |
Nevsun Resources Limited | | | | | | | | | | | 986,600 | | | | 2,348,108 | |
NovaGold Resources Incorporated † | | | | | | | | | | | 956,700 | | | | 4,142,511 | |
Olympic Steel Incorporated | | | | | | | | | | | 95,300 | | | | 1,954,603 | |
Randgold Resources Limited ADR | | | | | | | | | | | 235,900 | | | | 19,636,316 | |
Royal Gold Incorporated | | | | | | | | | | | 34,300 | | | | 2,945,341 | |
Ryerson Holding Corporation † | | | | | | | | | | | 347,900 | | | | 2,835,385 | |
Sandstorm Gold Limited † | | | | | | | | | | | 2,588,200 | | | | 12,319,832 | |
Schnitzer Steel Industry | | | | | | | | | | | 252,000 | | | | 8,152,200 | |
SSR Mining Incorporated † | | | | | | | | | | | 188,700 | | | | 1,811,520 | |
TimkenSteel Corporation † | | | | | | | | | | | 163,200 | | | | 2,479,008 | |
| | | | |
| | | | | | | | | | | | | | | 73,042,626 | |
| | | | | | | | | | | | | | | | |
| | | | |
Real Estate: 1.69% | | | | | | | | | | | | | | | | |
| | | | |
| Equity REITs: 1.69% | | | | | | | | | | | | | | | | |
UMH Properties Incorporated | | | | | | | | | | | 690,600 | | | | 9,260,946 | |
| | | | | | | | | | | | | | | | |
| | | | |
Telecommunication Services: 2.51% | | | | | | | | | | | | | | | | |
| | | | |
| Diversified Telecommunication Services: 2.51% | | | | | | | | | | | | | | | | |
Cincinnati Bell Incorporated † | | | | | | | | | | | 614,600 | | | | 8,512,210 | |
Iradium Communications Incorporated † | | | | | | | | | | | 470,800 | | | | 5,296,500 | |
| | | | |
| | | | | | | | | | | | | | | 13,808,710 | |
| | | | | | | | | | | | | | | | |
| | | | |
Total Common Stocks (Cost $437,249,129) | | | | | | | | | | | | | | | 538,704,022 | |
| | | | | | | | | | | | | | | | |
| | | | |
Exchange-Traded Funds: 1.40% | | | | | | | | | | | | | | | | |
SPDR S&P Regional Banking ETF | | | | | | | | | | | 22,400 | | | | 1,352,736 | |
VanEck Vectors Gold Miners ETF | | | | | | | | | | | 181,451 | | | | 3,988,293 | |
VanEck Vectors Junior Gold Miners ETF | | | | | | | | | | | 72,683 | | | | 2,336,758 | |
| | | | |
Total Exchange-Traded Funds (Cost $7,826,674) | | | | | | | | | | | | | | | 7,677,787 | |
| | | | | | | | | | | | | | | | |
The accompanying notes are an integral part of these financial statements.
| | | | | | |
| Portfolio of investments—March 31, 2018 | | Wells Fargo Small Cap Value Fund | | | 15 | |
| | | | | | | | | | | | | | | | |
| Security name | | Yield | | | | | | Shares | | | Value | |
| | | | |
Short-Term Investments: 0.31% | | | | | | | | | | | | | | | | |
| | | | |
| Investment Companies: 0.31% | | | | | | | | | | | | | | | | |
Wells Fargo Government Money Market Fund Select Class (l)(u) | | | 1.54 | % | | | | | | | 1,673,791 | | | $ | 1,673,791 | |
| | | | | | | | | | | | | | | | |
| | | | |
Total Short-Term Investments (Cost $1,673,791) | | | | | | | | | | | | | | | 1,673,791 | |
| | | | | | | | | | | | | | | | |
| | | | | | | | |
| Total investments in securities (Cost $446,749,594) | | | 99.81 | % | | | 548,055,600 | |
Other assets and liabilities, net | | | 0.19 | | | | 1,064,882 | |
| | | | | | | | |
| Total net assets | | | 100.00 | % | | $ | 549,120,482 | |
| | | | | | | | |
| † | Non-income-earning security |
| (l) | The issuer of the security is an affiliated person of the Fund as defined in the Investment Company Act of 1940. |
| (a) | The security is fair valued in accordance with procedures approved by the Board of Trustees. |
| (u) | The rate represents the 7-day annualized yield at period end. |
Investments in Affiliates
An affiliated investment is an investment in which the Fund owns at least 5% of the outstanding voting shares of the issuer or as a result of other relationships, such as the Fund and the issuer having the same investment manager. Transactions with issuers that were either affiliated persons of the Fund at the beginning of the period or the end of the period were as follows:
| | | | | | | | | | | | | | | | | | | | | | | | | | | | | | | | | | | | |
| | | Shares,
beginning of
period | | | Shares
purchased | | | Shares
sold | | | Shares,
end of
period | | | Net
realized
gains
(losses) | | | Net
change in
unrealized
gains
(losses) | | | Income
from
affiliated
securities | | | Value,
end
of period | | | % of
net
assets | |
Common Stocks | | | | | | | | | | | | | | | | | | | | | | | | | | | | | | | | | | | | |
Consumer Discretionary | | | | | | | | | | | | | | | | | | | | | | | | | | | | | | | | | | | | |
Hotels, Restaurants & Leisure | | | | | | | | | | | | | | | | | | | | | | | | | | | | | | | | | | | | |
Century Casinos Incorporated * | | | 1,762,300 | | | | 201,800 | | | | 638,100 | | | | 1,326,000 | | | $ | 1,916,512 | | | $ | (1,931,298 | ) | | $ | 0 | | | $ | 9,891,960 | | | | | |
Household Durables | | | | | | | | | | | | | | | | | | | | | | | | | | | | | | | | | | | | |
Skyline Corporation * | | | 815,200 | | | | 12,669 | | | | 460,969 | | | | 366,900 | | | | 3,598,814 | | | | 2,456,000 | | | | 0 | | | | 8,071,800 | | | | | |
Financials | | | | | | | | | | | | | | | | | | | | | | | | | | | | | | | | | | | | |
Capital Markets | | | | | | | | | | | | | | | | | | | | | | | | | | | | | | | | | | | | |
Medley Management Incorporated Class A | | | 454,000 | | | | 30,000 | | | | 160,600 | | | | 323,400 | | | | (1,328,602 | ) | | | 311,568 | | | | 273,800 | | | | 1,843,380 | | | | | |
Industrials | | | | | | | | | | | | | | | | | | | | | | | | | | | | | | | | | | | | |
Machinery | | | | | | | | | | | | | | | | | | | | | | | | | | | | | | | | | | | | |
Freightcar America Incorporated | | | 420,700 | | | | 418,000 | | | | 140,900 | | | | 697,800 | | | | 507,681 | | | | (1,207,330 | ) | | | 63,045 | | | | 9,350,520 | | | | | |
| | | | | | | | | |
| | | | | | | | | | | | | | | | | | | | | | | | | | | | | | | 29,157,660 | | | | 5.31 | % |
| | | | | | | | | | | | | | | | | | | | | | | | | | | | | | | | | | | | |
| | | | | | | | | |
Short-Term Investments | | | | | | | | | | | | | | | | | | | | | | | | | | | | | | | | | | | | |
Investment Companies | | | | | | | | | | | | | | | | | | | | | | | | | | | | | | | | | | | | |
Wells Fargo Government Money Market Fund Select Class | | | 85,665,191 | | | | 168,036,832 | | | | 252,028,232 | | | | 1,673,791 | | | | 0 | | | | 0 | | | | 223,820 | | | | 1,673,791 | | | | 0.31 | |
| | | | | | | | | | | | | | | | | | | | | | | | | | | | | | | | | | | | |
| | | | | | | | | | | | | | | | | | $ | 4,694,405 | | | $ | (371,060 | ) | | $ | 560,665 | | | $ | 30,831,451 | | | | 5.62 | % |
| | | | | | | | | | | | | | | | | | | | | | | | | | | | | | | | | | | | |
| | * | No longer an affiliate of the Fund at the end of the period. |
The accompanying notes are an integral part of these financial statements.
| | | | |
| 16 | | Wells Fargo Small Cap Value Fund | | Statement of assets and liabilities—March 31, 2018 |
| | | | |
| | | | |
| |
Assets | | | | |
Investments in unaffiliated securities, at value (cost $429,236,052) | | $ | 535,187,909 | |
Investments in affiliated securities, at value (cost $17,513,542) | | | 12,867,691 | |
Cash | | | 132,079 | |
Receivable for investments sold | | | 1,629,859 | |
Receivable for Fund shares sold | | | 70,763 | |
Receivable for dividends | | | 683,279 | |
Prepaid expenses and other assets | | | 38,085 | |
| | | | |
Total assets | | | 550,609,665 | |
| | | | |
| |
Liabilities | | | | |
Payable for Fund shares redeemed | | | 676,622 | |
Management fee payable | | | 383,398 | |
Payable for investments purchased | | | 106,819 | |
Shareholder servicing fees payable | | | 106,534 | |
Administration fees payable | | | 93,824 | |
Distribution fee payable | | | 17,135 | |
Trustees’ fees and expenses payable | | | 1,382 | |
Accrued expenses and other liabilities | | | 103,469 | |
| | | | |
Total liabilities | | | 1,489,183 | |
| | | | |
Total net assets | | $ | 549,120,482 | |
| | | | |
| |
NET ASSETS CONSIST OF | | | | |
Paid-in capital | | $ | 377,732,493 | |
Accumulated net investment loss | | | (666,360 | ) |
Accumulated net realized gains on investments | | | 70,748,343 | |
Net unrealized gains on investments | | | 101,306,006 | |
| | | | |
Total net assets | | $ | 549,120,482 | |
| | | | |
| |
COMPUTATION OF NET ASSET VALUE AND OFFERING PRICE PER SHARE | | | | |
Net assets – Class A | | $ | 437,703,682 | |
Shares outstanding – Class A1 | | | 25,616,483 | |
Net asset value per share – Class A | | | $17.09 | |
Maximum offering price per share – Class A2 | | | $18.13 | |
Net assets – Class C | | $ | 25,110,868 | |
Shares outstanding – Class C1 | | | 2,171,482 | |
Net asset value per share – Class C | | | $11.56 | |
Net assets – Class R6 | | $ | 43,671,226 | |
Shares outstanding – Class R61 | | | 2,357,679 | |
Net asset value per share – Class R6 | | | $18.52 | |
Net assets – Administrator Class | | $ | 9,935,993 | |
Shares outstanding – Administrator Class1 | | | 541,860 | |
Net asset value per share – Administrator Class | | | $18.34 | |
Net assets – Institutional Class | | $ | 32,698,713 | |
Shares outstanding – Institutional Class1 | | | 1,768,470 | |
Net asset value per share – Institutional Class | | | $18.49 | |
| 1 | The Fund has an unlimited number of authorized shares. |
| 2 | Maximum offering price is computed as 100/94.25 of net asset value. On investments of $50,000 or more, the offering price is reduced. |
The accompanying notes are an integral part of these financial statements.
| | | | | | |
| Statement of operations—year ended March 31, 2018 | | Wells Fargo Small Cap Value Fund | | | 17 | |
| | | | |
| | | | |
| |
Investment income | | | | |
Dividends (net of foreign withholding taxes of $40,991) | | $ | 5,226,688 | |
Income from affiliated securities | | | 560,665 | |
| | | | |
Total investment income | | | 5,787,353 | |
| | | | |
| |
Expenses | | | | |
Management fee | | | 6,097,615 | |
Administration fees | | | | |
Class A | | | 991,936 | |
Class C | | | 62,156 | |
Class R6 | | | 21,669 | |
Administrator Class | | | 15,129 | |
Institutional Class | | | 179,875 | |
Shareholder servicing fees | | | | |
Class A | | | 1,180,876 | |
Class C | | | 73,996 | |
Administrator Class | | | 28,872 | |
Distribution fee | | | | |
Class C | | | 221,987 | |
Custody and accounting fees | | | 41,955 | |
Professional fees | | | 46,950 | |
Registration fees | | | 20,548 | |
Shareholder report expenses | | | 5,489 | |
Trustees’ fees and expenses | | | 25,025 | |
Other fees and expenses | | | 27,338 | |
| | | | |
Total expenses | | | 9,041,416 | |
Less: Fee waivers and/or expense reimbursements | | | (451,703 | ) |
| | | | |
Net expenses | | | 8,589,713 | |
| | | | |
Net investment loss | | | (2,802,360 | ) |
| | | | |
| |
REALIZED AND UNREALIZED GAINS (LOSSES) ON INVESTMENTS | | | | |
| |
Net realized gains on: | | | | |
Unaffiliated securities | | | 311,620,644 | |
Affiliated securities | | | 4,694,405 | |
| | | | |
Net realized gains on investments | | | 316,315,049 | |
| | | | |
| |
Net change in unrealized gains (losses) on: | | | | |
Unaffiliated securities | | | (258,974,104 | ) |
Affiiliated securities | | | (371,060 | ) |
| | | | |
Net change in unrealized gains (losses) on investments | | | (259,345,164 | ) |
| | | | |
Net realized and unrealized gains (losses) on investments | | | 56,969,885 | |
| | | | |
Net increase in net assets resulting from operations | | $ | 54,167,525 | |
| | | | |
The accompanying notes are an integral part of these financial statements.
| | | | |
| 18 | | Wells Fargo Small Cap Value Fund | | Statement of changes in net assets |
| | | | | | | | | | | | | | | | |
| | | Year ended
March 31, 2018 | | | Year ended
March 31, 2017 | |
| | | | |
Operations | | | | | | | | | | | | | | | | |
Net investment loss | | | | | | $ | (2,802,360 | ) | | | | | | $ | (3,089,007 | ) |
Net realized gains on investments | | | | | | | 316,315,049 | | | | | | | | 178,473,238 | |
Net change in unrealized gains (losses) on investments | | | | | | | (259,345,164 | ) | | | | | | | 76,306,664 | |
| | | | |
Net increase in net assets resulting from operations | | | | | | | 54,167,525 | | | | | | | | 251,690,895 | |
| | | | |
| | | | |
Distributions to shareholders from | | | | | | | | | | | | | | | | |
Net realized gains | | | | | | | | | | | | | | | | |
Class A | | | | | | | (139,185,621 | ) | | | | | | | (56,388,139 | ) |
Class C | | | | | | | (11,577,587 | ) | | | | | | | (5,270,387 | ) |
Class R6 | | | | | | | (18,852,432 | ) | | | | | | | (10,487,806 | ) |
Administrator Class | | | | | | | (3,280,317 | ) | | | | | | | (2,045,288 | ) |
Institutional Class | | | | | | | (59,214,889 | ) | | | | | | | (37,253,131 | ) |
| | | | |
Total distributions to shareholders | | | | | | | (232,110,846 | ) | | | | | | | (111,444,751 | ) |
| | | | |
| | | | |
Capital share transactions | | | Shares | | | | | | | | Shares | | | | | |
Proceeds from shares sold | | | | | | | | | | | | | | | | |
Class A | | | 1,049,139 | | | | 20,283,556 | | | | 1,740,528 | | | | 35,433,223 | |
Class C | | | 82,745 | | | | 1,093,645 | | | | 191,902 | | | | 3,019,730 | |
Class R6 | | | 362,552 | | | | 7,674,684 | | | | 424,030 | | | | 9,098,907 | |
Administrator Class | | | 79,721 | | | | 1,605,699 | | | | 130,653 | | | | 2,811,213 | |
Institutional Class | | | 453,494 | | | | 9,352,699 | | | | 4,669,898 | | | | 101,916,638 | |
| | | | |
| | | | | | | 40,010,283 | | | | | | | | 152,279,711 | |
| | | | |
Reinvestment of distributions | | | | | | | | | | | | | | | | |
Class A | | | 7,549,312 | | | | 135,464,919 | | | | 2,776,179 | | | | 55,114,701 | |
Class C | | | 870,426 | | | | 10,955,100 | | | | 292,458 | | | | 4,514,956 | |
Class R6 | | | 964,823 | | | | 18,847,152 | | | | 502,696 | | | | 10,487,806 | |
Administrator Class | | | 144,268 | | | | 2,762,509 | | | | 87,246 | | | | 1,799,155 | |
Institutional Class | | | 2,910,455 | | | | 57,830,989 | | | | 1,730,984 | | | | 36,212,221 | |
| | | | |
| | | | | | | 225,860,669 | | | | | | | | 108,128,839 | |
| | | | |
Payment for shares redeemed | | | | | | | | | | | | | | | | |
Class A | | | (5,792,964 | ) | | | (110,590,516 | ) | | | (7,484,677 | ) | | | (152,570,289 | ) |
Class B | | | N/A | | | | N/A | | | | (285 | )1 | | | (4,290 | )1 |
Class C | | | (909,855 | ) | | | (12,886,548 | ) | | | (803,103 | ) | | | (12,684,211 | ) |
Class R6 | | | (2,930,324 | ) | | | (61,212,656 | ) | | | (1,679,233 | ) | | | (36,127,102 | ) |
Administrator Class | | | (251,974 | ) | | | (5,114,206 | ) | | | (1,056,888 | ) | | | (22,334,104 | ) |
Institutional Class | | | (19,803,060 | ) | | | (399,900,378 | ) | | | (2,762,181 | ) | | | (58,313,031 | ) |
| | | | |
| | | | | | | (589,704,304 | ) | | | | | | | (282,033,027 | ) |
| | | | |
Net asset value of shares issued in acquisition | | | | | | | | | | | | | | | | |
Class A | | | 0 | | | | 0 | | | | 2,339,168 | | | | 45,638,463 | |
Class C | | | 0 | | | | 0 | | | | 219,630 | | | | 3,343,096 | |
Administrator Class | | | 0 | | | | 0 | | | | 141,240 | | | | 2,888,953 | |
Institutional Class | | | 0 | | | | 0 | | | | 172,399 | | | | 3,537,176 | |
| | | | |
| | | | | | | 0 | | | | | | | | 55,407,688 | |
| | | | |
Net increase (decrease) in net assets resulting from capital share transactions | | | | | | | (323,833,352 | ) | | | | | | | 33,783,211 | |
| | | | |
Total increase (decrease) in net assets | | | | | | | (501,776,673 | ) | | | | | | | 174,029,355 | |
| | | | |
| | | | |
Net assets | | | | | | | | | | | | | | | | |
Beginning of period | | | | | | | 1,050,897,155 | | | | | | | | 876,867,800 | |
| | | | |
End of period | | | | | | $ | 549,120,482 | | | | | | | $ | 1,050,897,155 | |
| | | | |
Accumulated net investment loss | | | | | | $ | (666,360 | ) | | | | | | $ | (2,079,153 | ) |
| | | | |
| 1 | For the period from April 1, 2016 to June 6, 2016. Effective June 7, 2016, Class B shares of the Fund are no longer offered to shareholders. |
The accompanying notes are an integral part of these financial statements.
| | | | | | |
| Financial highlights | | Wells Fargo Small Cap Value Fund | | | 19 | |
(For a share outstanding throughout each period)
| | | | | | | | | | | | | | | | | | | | | | | | |
| | | Year ended March 31 | | | Year ended
October 31, 2013 | |
| CLASS A | | 2018 | | | 2017 | | | 2016 | | | 2015 | | | 20141 | | |
Net asset value, beginning of period | | | $21.68 | | | | $18.84 | | | | $27.51 | | | | $35.74 | | | | $36.33 | | | | $32.87 | |
Net investment income (loss) | | | (0.09 | )2 | | | (0.11 | ) | | | (0.06 | )2 | | | 0.01 | 2 | | | 0.18 | | | | 0.23 | |
Net realized and unrealized gains (losses) on investments | | | 1.62 | | | | 5.45 | | | | (1.19 | ) | | | (2.55 | ) | | | 2.71 | | | | 4.68 | |
| | | | | | | | | | | | | | | | | | | | | | | | |
Total from investment operations | | | 1.53 | | | | 5.34 | | | | (1.25 | ) | | | (2.54 | ) | | | 2.89 | | | | 4.91 | |
Distributions to shareholders from | | | | | | | | | | | | | | | | | | | | | | | | |
Net investment income | | | 0.00 | | | | 0.00 | | | | 0.00 | | | | (0.13 | ) | | | (0.11 | ) | | | (0.24 | ) |
Net realized gains | | | (6.12 | ) | | | (2.50 | ) | | | (7.42 | ) | | | (5.56 | ) | | | (3.37 | ) | | | (1.21 | ) |
| | | | | | | | | | | | | | | | | | | | | | | | |
Total distributions to shareholders | | | (6.12 | ) | | | (2.50 | ) | | | (7.42 | ) | | | (5.69 | ) | | | (3.48 | ) | | | (1.45 | ) |
Net asset value, end of period | | | $17.09 | | | | $21.68 | | | | $18.84 | | | | $27.51 | | | | $35.74 | | | | $36.33 | |
Total return3 | | | 7.97 | % | | | 29.92 | % | | | (2.90 | )% | | | (7.29 | )% | | | 8.87 | % | | | 15.67 | % |
Ratios to average net assets (annualized) | | | | | | | | | | | | | | | | | | | | | | | | |
Gross expenses | | | 1.33 | % | | | 1.32 | % | | | 1.36 | % | | | 1.35 | % | | | 1.33 | % | | | 1.33 | % |
Net expenses | | | 1.28 | % | | | 1.28 | % | | | 1.28 | % | | | 1.29 | % | | | 1.30 | % | | | 1.30 | % |
Net investment income (loss) | | | (0.47 | )% | | | (0.48 | )% | | | (0.27 | )% | | | 0.02 | % | | | 1.26 | % | | | 0.72 | % |
Supplemental data | | | | | | | | | | | | | | | | | | | | | | | | |
Portfolio turnover rate | | | 36 | % | | | 31 | % | | | 16 | % | | | 9 | % | | | 7 | % | | | 18 | % |
Net assets, end of period (000s omitted) | | | $437,704 | | | | $494,607 | | | | $441,679 | | | | $289,669 | | | | $443,671 | | | | $482,677 | |
| 1 | For the five months ended March 31, 2014. The Fund changed its fiscal year end from October 31 to March 31, effective March 31, 2014. |
| 2 | Calculated based upon average shares outstanding |
| 3 | Total return calculations do not include any sales charges. Returns for periods of less than one year are not annualized. |
The accompanying notes are an integral part of these financial statements.
| | | | |
| 20 | | Wells Fargo Small Cap Value Fund | | Financial highlights |
(For a share outstanding throughout each period)
| | | | | | | | | | | | | | | | | | | | | | | | |
| | | Year ended March 31 | | | Year ended October 31, 2013 | |
| CLASS C | | 2018 | | | 2017 | | | 2016 | | | 2015 | | | 20141 | | |
Net asset value, beginning of period | | | $16.67 | | | | $15.09 | | | | $23.80 | | | | $31.89 | | | | $32.77 | | | | $29.82 | |
Net investment income (loss) | | | (0.17 | )2 | | | (0.20 | )2 | | | (0.24 | )2 | | | (0.20 | )2 | | | 0.07 | 2 | | | (0.02 | )2 |
Net realized and unrealized gains (losses) on investments | | | 1.18 | | | | 4.28 | | | | (1.05 | ) | | | (2.27 | ) | | | 2.42 | | | | 4.23 | |
| | | | | | | | | | | | | | | | | | | | | | | | |
Total from investment operations | | | 1.01 | | | | 4.08 | | | | (1.29 | ) | | | (2.47 | ) | | | 2.49 | | | | 4.21 | |
Distributions to shareholders from | | | | | | | | | | | | | | | | | | | | | | | | |
Net investment income | | | 0.00 | | | | 0.00 | | | | 0.00 | | | | (0.06 | ) | | | 0.00 | | | | (0.05 | ) |
Net realized gains | | | (6.12 | ) | | | (2.50 | ) | | | (7.42 | ) | | | (5.56 | ) | | | (3.37 | ) | | | (1.21 | ) |
| | | | | | | | | | | | | | | | | | | | | | | | |
Total distributions to shareholders | | | (6.12 | ) | | | (2.50 | ) | | | (7.42 | ) | | | (5.62 | ) | | | (3.37 | ) | | | (1.26 | ) |
Net asset value, end of period | | | $11.56 | | | | $16.67 | | | | $15.09 | | | | $23.80 | | | | $31.89 | | | | $32.77 | |
Total return3 | | | 7.08 | % | | | 28.93 | % | | | (3.58 | )% | | | (8.00 | )% | | | 8.53 | % | | | 14.80 | % |
Ratios to average net assets (annualized) | | | | | | | | | | | | | | | | | | | | | | | | |
Gross expenses | | | 2.08 | % | | | 2.07 | % | | | 2.11 | % | | | 2.10 | % | | | 2.08 | % | | | 2.08 | % |
Net expenses | | | 2.03 | % | | | 2.03 | % | | | 2.03 | % | | | 2.04 | % | | | 2.05 | % | | | 2.05 | % |
Net investment income (loss) | | | (1.23 | )% | | | (1.23 | )% | | | (1.18 | )% | | | (0.70 | )% | | | 0.52 | % | | | (0.06 | )% |
Supplemental data | | | | | | | | | | | | | | | | | | | | | | | | |
Portfolio turnover rate | | | 36 | % | | | 31 | % | | | 16 | % | | | 9 | % | | | 7 | % | | | 18 | % |
Net assets, end of period (000s omitted) | | | $25,111 | | | | $35,470 | | | | $33,601 | | | | $80,969 | | | | $105,309 | | | | $105,491 | |
| 1 | For the five months ended March 31, 2014. The Fund changed its fiscal year end from October 31 to March 31, effective March 31, 2014. |
| 2 | Calculated based upon average shares outstanding |
| 3 | Total return calculations do not include any sales charges. Returns for periods of less than one year are not annualized. |
The accompanying notes are an integral part of these financial statements.
| | | | | | |
| Financial highlights | | Wells Fargo Small Cap Value Fund | | | 21 | |
(For a share outstanding throughout each period)
| | | | | | | | | | | | | | | | | | | | | | | | |
| | | Year ended March 31 | | | Year ended October 31, 20132 | |
| CLASS R6 | | 2018 | | | 2017 | | | 2016 | | | 2015 | | | 20141 | | |
Net asset value, beginning of period | | | $22.93 | | | | $19.72 | | | | $28.29 | | | | $36.52 | | | | $37.13 | | | | $33.69 | |
Net investment income (loss) | | | (0.00 | )3,4 | | | (0.01 | )3 | | | 0.03 | 3 | | | 0.23 | 3 | | | 0.35 | | | | 0.07 | 3 |
Net realized and unrealized gains (losses) on investments | | | 1.71 | | | | 5.72 | | | | (1.18 | ) | | | (2.69 | ) | | | 2.67 | | | | 3.37 | |
| | | | | | | | | | | | | | | | | | | | | | | | |
Total from investment operations | | | 1.71 | | | | 5.71 | | | | (1.15 | ) | | | (2.46 | ) | | | 3.02 | | | | 3.44 | |
Distributions to shareholders from | | | | | | | | | | | | | | | | | | | | | | | | |
Net investment income | | | 0.00 | | | | 0.00 | | | | 0.00 | | | | (0.21 | ) | | | (0.26 | ) | | | 0.00 | |
Net realized gains | | | (6.12 | ) | | | (2.50 | ) | | | (7.42 | ) | | | (5.56 | ) | | | (3.37 | ) | | | 0.00 | |
| | | | | | | | | | | | | | | | | | | | | | | | |
Total distributions to shareholders | | | (6.12 | ) | | | (2.50 | ) | | | (7.42 | ) | | | (5.77 | ) | | | (3.63 | ) | | | 0.00 | |
Net asset value, end of period | | | $18.52 | | | | $22.93 | | | | $19.72 | | | | $28.29 | | | | $36.52 | | | | $37.13 | |
Total return5 | | | 8.38 | % | | | 30.50 | % | | | (2.43 | )% | | | (6.90 | )% | | | 9.07 | % | | | 10.21 | % |
Ratios to average net assets (annualized) | | | | | | | | | | | | | | | | | | | | | | | | |
Gross expenses | | | 0.90 | % | | | 0.89 | % | | | 0.92 | % | | | 0.87 | % | | | 0.85 | % | | | 0.85 | % |
Net expenses | | | 0.83 | % | | | 0.83 | % | | | 0.83 | % | | | 0.83 | % | | | 0.85 | % | | | 0.85 | % |
Net investment income (loss) | | | (0.01 | )% | | | (0.03 | )% | | | 0.12 | % | | | 0.72 | % | | | 2.82 | % | | | 0.60 | % |
Supplemental data | | | | | | | | | | | | | | | | | | | | | | | | |
Portfolio turnover rate | | | 36 | % | | | 31 | % | | | 16 | % | | | 9 | % | | | 7 | % | | | 18 | % |
Net assets, end of period (000s omitted) | | | $43,671 | | | | $90,809 | | | | $92,929 | | | | $52,613 | | | | $398 | | | | $28 | |
| 1 | For the five months ended March 31, 2014. The Fund changed its fiscal year end from October 31 to March 31, effective March 31, 2014. |
| 2 | For the period from June 28, 2013 (commencement of class operations) to October 31, 2013. |
| 3 | Calculated based upon average shares outstanding |
| 4 | Amount is more than $(0.005). |
| 5 | Returns for periods of less than one year are not annualized. |
The accompanying notes are an integral part of these financial statements.
| | | | |
| 22 | | Wells Fargo Small Cap Value Fund | | Financial highlights |
(For a share outstanding throughout each period)
| | | | | | | | | | | | | | | | | | | | | | | | |
| | | Year ended March 31 | | | Year ended October 31, 2013 | |
| ADMINISTRATOR CLASS | | 2018 | | | 2017 | | | 2016 | | | 2015 | | | 20141 | | |
Net asset value, beginning of period | | | $22.80 | | | | $19.66 | | | | $28.30 | | | | $36.40 | | | | $36.98 | | | | $33.45 | |
Net investment income (loss) | | | (0.06 | )2 | | | (0.07 | )2 | | | (0.06 | )2 | | | 0.01 | 2 | | | 0.21 | | | | 0.31 | |
Net realized and unrealized gains (losses) on investments | | | 1.72 | | | | 5.71 | | | | (1.16 | ) | | | (2.55 | ) | | | 2.77 | | | | 4.75 | |
| | | | | | | | | | | | | | | | | | | | | | | | |
Total from investment operations | | | 1.66 | | | | 5.64 | | | | (1.22 | ) | | | (2.54 | ) | | | 2.98 | | | | 5.06 | |
Distributions to shareholders from | | | | | | | | | | | | | | | | | | | | | | | | |
Net investment income | | | 0.00 | | | | 0.00 | | | | 0.00 | | | | 0.00 | | | | (0.19 | ) | | | (0.32 | ) |
Net realized gains | | | (6.12 | ) | | | (2.50 | ) | | | (7.42 | ) | | | (5.56 | ) | | | (3.37 | ) | | | (1.21 | ) |
| | | | | | | | | | | | | | | | | | | | | | | | |
Total distributions to shareholders | | | (6.12 | ) | | | (2.50 | ) | | | (7.42 | ) | | | (5.56 | ) | | | (3.56 | ) | | | (1.53 | ) |
Net asset value, end of period | | | $18.34 | | | | $22.80 | | | | $19.66 | | | | $28.30 | | | | $36.40 | | | | $36.98 | |
Total return3 | | | 8.18 | % | | | 30.22 | % | | | (2.70 | )% | | | (7.16 | )% | | | 8.97 | % | | | 15.92 | % |
Ratios to average net assets (annualized) | | | | | | | | | | | | | | | | | | | | | | | | |
Gross expenses | | | 1.24 | % | | | 1.24 | % | | | 1.25 | % | | | 1.19 | % | | | 1.17 | % | | | 1.17 | % |
Net expenses | | | 1.08 | % | | | 1.08 | % | | | 1.08 | % | | | 1.09 | % | | | 1.10 | % | | | 1.10 | % |
Net investment income (loss) | | | (0.28 | )% | | | (0.31 | )% | | | (0.24 | )% | | | 0.03 | % | | | 1.48 | % | | | 0.87 | % |
Supplemental data | | | | | | | | | | | | | | | | | | | | | | | | |
Portfolio turnover rate | | | 36 | % | | | 31 | % | | | 16 | % | | | 9 | % | | | 7 | % | | | 18 | % |
Net assets, end of period (000s omitted) | | | $9,936 | | | | $12,994 | | | | $24,927 | | | | $74,820 | | | | $711,869 | | | | $666,812 | |
| 1 | For the five months ended March 31, 2014. The Fund changed its fiscal year end from October 31 to March 31, effective March 31, 2014. |
| 2 | Calculated based upon average shares outstanding |
| 3 | Returns for periods of less than one year are not annualized. |
The accompanying notes are an integral part of these financial statements.
| | | | | | |
| Financial highlights | | Wells Fargo Small Cap Value Fund | | | 23 | |
(For a share outstanding throughout each period)
| | | | | | | | | | | | | | | | | | | | | | | | |
| | | Year ended March 31 | | | Year ended October 31, 2013 | |
| INSTITUTIONAL CLASS | | 2018 | | | 2017 | | | 2016 | | | 2015 | | | 20141 | | |
Net asset value, beginning of period | | | $22.90 | | | | $19.71 | | | | $28.29 | | | | $36.53 | | | | $37.12 | | | | $33.56 | |
Net investment income (loss) | | | (0.02 | )2 | | | (0.01 | )2 | | | (0.01 | )2 | | | 0.17 | 2 | | | 0.26 | | | | 0.38 | 2 |
Net realized and unrealized gains (losses) on investments | | | 1.73 | | | | 5.70 | | | | (1.15 | ) | | | (2.65 | ) | | | 2.76 | | | | 4.76 | |
| | | | | | | | | | | | | | | | | | | | | | | | |
Total from investment operations | | | 1.71 | | | | 5.69 | | | | (1.16 | ) | | | (2.48 | ) | | | 3.02 | | | | 5.14 | |
Distributions to shareholders from | | | | | | | | | | | | | | | | | | | | | | | | |
Net investment income | | | 0.00 | | | | 0.00 | | | | 0.00 | | | | (0.20 | ) | | | (0.24 | ) | | | (0.37 | ) |
Net realized gains | | | (6.12 | ) | | | (2.50 | ) | | | (7.42 | ) | | | (5.56 | ) | | | (3.37 | ) | | | (1.21 | ) |
| | | | | | | | | | | | | | | | | | | | | | | | |
Total distributions to shareholders | | | (6.12 | ) | | | (2.50 | ) | | | (7.42 | ) | | | (5.76 | ) | | | (3.61 | ) | | | (1.58 | ) |
Net asset value, end of period | | | $18.49 | | | | $22.90 | | | | $19.71 | | | | $28.29 | | | | $36.53 | | | | $37.12 | |
Total return3 | | | 8.39 | % | | | 30.41 | % | | | (2.46 | )% | | | (6.95 | )% | | | 9.05 | % | | | 16.15 | % |
Ratios to average net assets (annualized) | | | | | | | | | | | | | | | | | | | | | | | | |
Gross expenses | | | 0.99 | % | | | 0.99 | % | | | 0.99 | % | | | 0.92 | % | | | 0.90 | % | | | 0.90 | % |
Net expenses | | | 0.88 | % | | | 0.88 | % | | | 0.88 | % | | | 0.89 | % | | | 0.90 | % | | | 0.90 | % |
Net investment income (loss) | | | (0.11 | )% | | | (0.06 | )% | | | (0.03 | )% | | | 0.52 | % | | | 1.66 | % | | | 1.08 | % |
Supplemental data | | | | | | | | | | | | | | | | | | | | | | | | |
Portfolio turnover rate | | | 36 | % | | | 31 | % | | | 16 | % | | | 9 | % | | | 7 | % | | | 18 | % |
Net assets, end of period (000s omitted) | | | $32,699 | | | | $417,018 | | | | $283,728 | | | | $1,017,115 | | | | $984,881 | | | | $1,081,869 | |
| 1 | For the five months ended March 31, 2014. The Fund changed its fiscal year end from October 31 to March 31, effective March 31, 2014. |
| 2 | Calculated based upon average shares outstanding |
| 3 | Returns for periods of less than one year are not annualized. |
The accompanying notes are an integral part of these financial statements.
| | | | |
| 24 | | Wells Fargo Small Cap Value Fund | | Notes to financial statements |
1. ORGANIZATION
Wells Fargo Funds Trust (the “Trust”), a Delaware statutory trust organized on March 10, 1999, is an open-end management investment company registered under the Investment Company Act of 1940, as amended (the “1940 Act”). As an investment company, the Trust follows the accounting and reporting guidance in Financial Accounting Standards Board Accounting Standards Codification Topic 946, Financial Services – Investment Companies. These financial statements report on the Wells Fargo Small Cap Value Fund (the “Fund”) which is a diversified series of the Trust.
Effective June 7, 2016, Class B shares of the Fund are no longer offered. Information for Class B shares reflected in the financial statements represents activity through June 6, 2016.
2. SIGNIFICANT ACCOUNTING POLICIES
The following significant accounting policies, which are consistently followed in the preparation of the financial statements of the Fund, are in conformity with U.S. generally accepted accounting principles which require management to make estimates and assumptions that affect the reported amounts of assets and liabilities, disclosure of contingent assets and liabilities at the date of the financial statements, and the reported amounts of revenues and expenses during the reporting period. Actual results could differ from those estimates.
Securities valuation
All investments are valued each business day as of the close of regular trading on the New York Stock Exchange (generally 4 p.m. Eastern Time), although the Fund may deviate from this calculation time under unusual or unexpected circumstances.
Equity securities that are listed on a foreign or domestic exchange or market are valued at the official closing price or, if none, the last sales price. If no sale occurs on the principal exchange or market that day, a fair value price will be determined in accordance with the Fund’s Valuation Procedures.
The values of securities denominated in foreign currencies are translated into U.S. dollars at rates provided by an independent foreign currency pricing source at a time each business day specified by the Wells Fargo Asset Management Pricing Committee at Wells Fargo Funds Management, LLC (“Funds Management”).
Many securities markets and exchanges outside the U.S. close prior to the close of the New York Stock Exchange and therefore may not fully reflect trading or events that occur after the close of the principal exchange in which the foreign securities are traded, but before the close of the New York Stock Exchange. If such trading or events are expected to materially affect the value of such securities, then fair value pricing procedures approved by the Board of Trustees of the Fund are applied. These procedures take into account multiple factors including movements in U.S. securities markets after foreign exchanges close. Foreign securities that are fair valued under these procedures are categorized as Level 2 and the application of these procedures may result in transfers between Level 1 and Level 2. Depending on market activity, such fair valuations may be frequent. Such fair value pricing may result in net asset values that are higher or lower than net asset values based on the last reported sales price or latest quoted bid price. On March 31, 2018, such fair value pricing was used in pricing certain foreign securities.
Investments in registered open-end investment companies are valued at net asset value.
Investments which are not valued using any of the methods discussed above are valued at their fair value, as determined in good faith by the Board of Trustees. The Board of Trustees has established a Valuation Committee comprised of the Trustees and has delegated to it the authority to take any actions regarding the valuation of portfolio securities that the Valuation Committee deems necessary or appropriate, including determining the fair value of portfolio securities, unless the determination has been delegated to the Wells Fargo Asset Management Pricing Committee at Funds Management. The Board of Trustees retains the authority to make or ratify any valuation decisions or approve any changes to the Valuation Procedures as it deems appropriate. On a quarterly basis, the Board of Trustees receives reports on any valuation actions taken by the Valuation Committee or the Wells Fargo Asset Management Pricing Committee which may include items for ratification.
Valuations of fair valued securities are compared to the next actual sales price when available, or other appropriate market values, to assess the continued appropriateness of the fair valuation methodologies used. These securities are fair valued on a day-to-day basis, taking into consideration changes to appropriate market information and any significant changes to the inputs considered in the valuation process until there is a readily available price provided on an exchange or by an independent pricing service. Valuations received from an independent pricing service or independent broker-dealer quotes are periodically validated by comparisons to most recent trades and valuations provided by other independent pricing services in addition to the review of prices by the manager and/or subadviser. Unobservable inputs
| | | | | | |
| Notes to financial statements | | Wells Fargo Small Cap Value Fund | | | 25 | |
used in determining fair valuations are identified based on the type of security, taking into consideration factors utilized by market participants in valuing the investment, knowledge about the issuer and the current market environment.
Foreign currency translation
The accounting records of the Fund are maintained in U.S. dollars. The values of other assets and liabilities denominated in foreign currencies are translated into U.S. dollars at rates provided by an independent foreign currency pricing source at a time each business day specified by the Wells Fargo Asset Management Pricing Committee. Purchases and sales of securities, and income and expenses are converted at the rate of exchange on the respective dates of such transactions. Net realized foreign exchange gains or losses arise from sales of foreign currencies, currency gains or losses realized between the trade and settlement dates on securities transactions, and the difference between the amounts of dividends, interest and foreign withholding taxes recorded and the U.S. dollar equivalent of the amounts actually paid or received. Net unrealized foreign exchange gains and losses arise from changes in the fair value of assets and liabilities other than investments in securities resulting from changes in exchange rates. The changes in net assets arising from changes in exchange rates of securities and the changes in net assets resulting from changes in market prices of securities are not separately presented. Such changes are included in net realized and unrealized gains or losses from investments.
Security transactions and income recognition
Securities transactions are recorded on a trade date basis. Realized gains or losses are recorded on the basis of identified cost.
Dividend income is recognized on the ex-dividend date, except for certain dividends from foreign securities, which are recorded as soon as the custodian verifies the ex-dividend date. Dividend income from foreign securities is recorded net of foreign taxes withheld where recovery of such taxes is not assured.
Distributions to shareholders
Distributions to shareholders from net investment income and any net realized gains are recorded on the ex-dividend date and paid at least annually. Such distributions are determined in accordance with income tax regulations and may differ from U.S. generally accepted accounting principles. Dividend sources are estimated at the time of declaration. The tax character of distributions is determined as of the Fund’s fiscal year end. Therefore, a portion of the Fund’s distributions made prior to the Fund’s fiscal year end may be categorized as a tax return of capital at year end.
Federal and other taxes
The Fund intends to continue to qualify as a regulated investment company by distributing substantially all of its investment company taxable income and any net realized capital gains (after reduction for capital loss carryforwards) sufficient to relieve it from all, or substantially all, federal income taxes. Accordingly, no provision for federal income taxes was required.
The Fund’s income and federal excise tax returns and all financial records supporting those returns for the prior three fiscal years are subject to examination by the federal and Delaware revenue authorities. Management has analyzed the Fund’s tax positions taken on federal, state, and foreign tax returns for all open tax years and does not believe that there are any uncertain tax positions that require recognition of a tax liability.
As of March 31, 2018, the aggregate cost of all investments for federal income tax purposes was $448,609,579 and the unrealized gains (losses) consisted of:
| | | | |
Gross unrealized gains | | $ | 154,891,451 | |
Gross unrealized losses | | | (55,445,430 | ) |
Net unrealized gains | | $ | 99,446,021 | |
Reclassifications are made to the Fund’s capital accounts for permanent tax differences to reflect income and gains available for distribution (or available capital loss carryforwards) under federal income tax regulations. U.S. generally accepted accounting principles require that certain components of net assets be adjusted to reflect permanent differences between financial and tax reporting. These reclassifications have no effect on net assets or net asset values per share. The primary permanent differences causing such reclassifications are due to net operating losses, passive foreign investment companies, and redemptions in-kind. At March 31, 2018, as a result of permanent book-to-tax differences, the following reclassification adjustments were made on the Statement of Assets and Liabilities:
| | | | |
| Paid-in capital | | Accumulated net
investment loss | | Accumulated net
realized gains
on investments |
| $140,178,228 | | $4,215,153 | | $(144,393,381) |
| | | | |
| 26 | | Wells Fargo Small Cap Value Fund | | Notes to financial statements |
Class allocations
The separate classes of shares offered by the Fund differ principally in applicable sales charges, distribution, shareholder servicing, and administration fees. Class specific expenses are charged directly to that share class. Investment income, common expenses, and realized and unrealized gains (losses) on investments are allocated daily to each class of shares based on the relative proportion of net assets of each class.
3. FAIR VALUATION MEASUREMENTS
Fair value measurements of investments are determined within a framework that has established a fair value hierarchy based upon the various data inputs utilized in determining the value of the Fund’s investments. The three-level hierarchy gives the highest priority to unadjusted quoted prices in active markets for identical assets or liabilities (Level 1) and the lowest priority to unobservable inputs (Level 3). The Fund’s investments are classified within the fair value hierarchy based on the lowest level of input that is significant to the fair value measurement. The inputs are summarized into three broad levels as follows:
| ∎ | | Level 1 – quoted prices in active markets for identical securities |
| ∎ | | Level 2 – other significant observable inputs (including quoted prices for similar securities, interest rates, prepayment speeds, credit risk, etc.) |
| ∎ | | Level 3 – significant unobservable inputs (including the Fund’s own assumptions in determining the fair value of investments) |
The inputs or methodologies used for valuing investments in securities are not necessarily an indication of the risk associated with investing in those securities.
The following is a summary of the inputs used in valuing the Fund’s assets and liabilities as of March 31, 2018:
| | | | | | | | | | | | | | | | |
| | | Quoted prices
(Level 1) | | | Other significant
observable inputs
(Level 2) | | | Significant
unobservable inputs (Level 3) | | | Total | |
Assets | | | | | | | | | | | | | | | | |
Investments in: | | | | | | | | | | | | | | | | |
| | | | |
Common stocks | | | | | | | | | | | | | | | | |
Consumer Discretionary | | $ | 57,193,331 | | | $ | 1,350,300 | | | $ | 0 | | | $ | 58,543,631 | |
Consumer Staples | | | 3,888,942 | | | | 0 | | | | 0 | | | | 3,888,942 | |
Energy | | | 40,440,524 | | | | 0 | | | | 0 | | | | 40,440,524 | |
Financials | | | 183,014,020 | | | | 0 | | | | 0 | | | | 183,014,020 | |
Health Care | | | 36,200,760 | | | | 0 | | | | 0 | | | | 36,200,760 | |
Industrials | | | 71,736,833 | | | | 1,288,638 | | | | 0 | | | | 73,025,471 | |
Information Technology | | | 45,688,517 | | | | 0 | | | | 0 | | | | 45,688,517 | |
Materials | | | 73,042,626 | | | | 1,789,875 | | | | 0 | | | | 74,832,501 | |
Real Estate | | | 9,260,946 | | | | 0 | | | | 0 | | | | 9,260,946 | |
Telecommunication Services | | | 13,808,710 | | | | 0 | | | | 0 | | | | 13,808,710 | |
| | | | |
Exchange-traded funds | | | 7,677,787 | | | | 0 | | | | 0 | | | | 7,677,787 | |
| | | | |
Short-term investments | | | | | | | | | | | | | | | | |
Investment companies | | | 1,673,791 | | | | 0 | | | | 0 | | | | 1,673,791 | |
Total assets | | $ | 543,626,787 | | | $ | 4,428,813 | | | $ | 0 | | | $ | 548,055,600 | |
The Fund recognizes transfers between levels within the fair value hierarchy at the end of the reporting period. At March 31, 2018, the Fund did not have any transfers into/out of Level 1, Level 2, or Level 3.
4. TRANSACTIONS WITH AFFILIATES
Management fee
Funds Management, an indirect wholly owned subsidiary of Wells Fargo, is the manager of the Fund and provides advisory and fund-level administrative services under an investment management agreement. Under the investment management agreement, Funds Management is responsible for, among other services, implementing the investment
| | | | | | |
| Notes to financial statements | | Wells Fargo Small Cap Value Fund | | | 27 | |
objectives and strategies of the Fund, supervising the subadviser, providing fund-level administrative services in connection with the Fund’s operations, and providing any other fund-level administrative services reasonably necessary for the operation of the Fund. As compensation for its services under the investment management agreement, Funds Management is entitled to receive an annual management fee starting at 0.85% and declining to 0.71% as the average daily net assets of the Fund increase. For the year ended March 31, 2018, the management fee was equivalent to an annual rate of 0.84% of the Fund’s average daily net assets.
Funds Management has retained the services of a subadviser to provide daily portfolio management to the Fund. The fee for subadvisory services is borne by Funds Management. Wells Capital Management Incorporated, an affiliate of Funds Management and an indirect wholly owned subsidiary of Wells Fargo, is the subadviser to the Fund and is entitled to receive a fee from Funds Management at an annual rate starting at 0.55% and declining to 0.40% as the average daily net assets of the Fund increase.
Administration fees
Under a class-level administration agreement, Funds Management provides class-level administrative services to the Fund, which includes paying fees and expenses for services provided by the transfer agent, sub-transfer agents, omnibus account servicers and record-keepers. As compensation for its services under the class-level administration agreement, Funds Management receives an annual fee which is calculated based on the average daily net assets of each class as follows:
| | | | |
| | | Class-level
administration fee | |
Class A, Class C | | | 0.21 | % |
Class R6 | | | 0.03 | |
Administrator Class, Institutional Class | | | 0.13 | |
Funds Management has contractually waived and/or reimbursed management and administration fees to the extent necessary to maintain certain net operating expense ratios for the Fund. Waiver of fees and/or reimbursement of expenses by Funds Management were made first from fund level expenses on a proportionate basis and then from class specific expenses. Funds Management has committed through July 31, 2018 to waive fees and/or reimburse expenses to the extent necessary to cap the Fund’s expenses at 1.28% for Class A shares, 2.03% for Class C shares, 0.83% for Class R6 shares, 1.08% for Administrator Class shares, and 0.88% for Institutional Class shares. After this time, the cap may be increased or the commitment to maintain the cap may be terminated only with the approval of the Board of Trustees.
Distribution fee
The Trust has adopted a distribution plan for Class C shares of the Fund pursuant to Rule 12b-1 under the 1940 Act. A distribution fee is charged to Class C shares and paid to Wells Fargo Funds Distributor, LLC (“Funds Distributor”), the principal underwriter, at an annual rate of 0.75% of the average daily net assets of Class C shares.
In addition, Funds Distributor is entitled to receive the front-end sales charge from the purchase of Class A shares and a contingent deferred sales charge on the redemption of certain Class A shares. Funds Distributor is also entitled to receive the contingent deferred sales charges from redemptions of Class C shares. For the year ended March 31, 2018, Funds Distributor received $4,938 from the sale of Class A shares and $21 in contingent deferred sales charges from redemptions of Class C shares. No contingent deferred sales charges were incurred by Class A shares for the year ended March 31, 2018.
Shareholder servicing fees
The Trust has entered into contracts with one or more shareholder servicing agents, whereby Class A, Class C, and Administrator Class of the Fund are charged a fee at an annual rate of 0.25% of the average daily net assets of each respective class.
A portion of these total shareholder servicing fees were paid to affiliates of Wells Fargo.
Interfund transactions
The Fund may purchase or sell portfolio investment securities to certain other Wells Fargo affiliates pursuant to Rule 17a-7 under the 1940 Act and under procedures adopted by the Board of Trustees. The procedures have been designed to ensure that these interfund transactions, which do not incur broker commissions, are effected at current market prices.
| | | | |
| 28 | | Wells Fargo Small Cap Value Fund | | Notes to financial statements |
5. INVESTMENT PORTFOLIO TRANSACTIONS
Purchases and sales of investments, excluding U.S. government obligations (if any) and short-term securities, for the year ended March 31, 2018 were $ 256,067,688 and $391,109,896, respectively.
6. ACQUISITION
After the close of business on July 22, 2016, the Fund acquired the net assets of Wells Fargo Small/Mid Cap Value Fund. The purpose of the transaction was to combine two funds with similar investment objectives and strategies. Shareholders holding Class A, Class C, Administrator Class, and Institutional Class shares of Wells Fargo Small/Mid Cap Value Fund received Class A, Class C, Administrator Class, and Institutional Class shares, respectively, of the Fund in there organization. The acquisition was accomplished by a tax-free exchange of all of the shares of Wells Fargo Small/Mid Cap Value Fund for 2,872,437 shares of the Fund valued at $55,407,688 at an exchange ratio of 0.63, 0.75, 0.62, and 0.63 for Class A, Class C, Administrator Class, and Institutional Class shares, respectively. The investment portfolio of Wells Fargo Small/Mid Cap Value Fund with a fair value of $45,240,508, identified cost of $27,461,432 and unrealized gains of $17,779,076 at July 22, 2016 were the principal assets acquired by the Fund. The aggregate net assets of Wells Fargo Small/Mid Cap Value Fund and the Fund immediately prior to the acquisition were $55,407,688 and $934,257,976, respectively. The aggregate net assets of the Fund immediately after the acquisition were $989,665,664. For financial reporting purposes, assets received and shares issued by the Fund were recorded at fair value; however, the cost basis of the investments received from Wells Fargo Small/Mid Cap Value Fund was carried forward to align ongoing reporting of the Fund’s realized and unrealized gains and losses with amounts distributable to shareholders for tax purposes.
Assuming the acquisition had been completed April 1, 2016, the beginning of the annual reporting period for the Fund, the pro forma results of operations for the year ended March 31, 2017 would have been:
| | | | |
Net investment loss | | $ | (2,807,515 | ) |
Net realized and unrealized gains (losses) on investments | | | 261,166,279 | |
Net increase in net assets resulting from operations | | $ | 258,358,764 | |
7. BANK BORROWINGS
The Trust (excluding the money market funds and certain other funds) and Wells Fargo Variable Trust are parties to a $280,000,000 revolving credit agreement whereby the Fund is permitted to use bank borrowings for temporary or emergency purposes, such as to fund shareholder redemption requests. Interest under the credit agreement is charged to the Fund based on a borrowing rate equal to the higher of the Federal Funds rate in effect on that day plus 1.25% or the overnight LIBOR rate in effect on that day plus 1.25%. In addition, an annual commitment fee equal to 0.25% of the unused balance is allocated to each participating fund. Prior to August 29, 2017, the revolving credit agreement amount was $250,000,000.
For the year ended March 31, 2018, there were no borrowings by the Fund under the agreement.
8. DISTRIBUTIONS TO SHAREHOLDERS
The tax character of distributions paid during the years ended March 31, 2018 and March 31, 2017 were as follows:
| | | | | | | | |
| | | Year ended March 31 | |
| | | 2018 | | | 2017 | |
Ordinary income | | $ | 1,352,843 | | | $ | 0 | |
Long-term capital gain | | | 230,758,003 | | | | 111,444,751 | |
As of March 31, 2018, the components of distributable earnings on a tax basis were as follows:
| | |
Undistributed long-term gain | | Unrealized gains |
| $71,941,968 | | $99,446,021 |
| | | | | | |
| Notes to financial statements | | Wells Fargo Small Cap Value Fund | | | 29 | |
9. CONCENTRATION RISK
Concentration risks result from exposure to a limited number of sectors. A fund that invests a substantial portion of its assets in any sector may be more affected by changes in that sector than would be a fund whose investments are not heavily weighted in any sector.
10. INDEMNIFICATION
Under the Trust’s organizational documents, the officers and Trustees have been granted certain indemnification rights against certain liabilities that may arise out of performance of their duties to the Trust. Additionally, in the normal course of business, the Trust may enter into contracts with service providers that contain a variety of indemnification clauses. The Trust’s maximum exposure under these arrangements is dependent on future claims that may be made against the Fund and, therefore, cannot be estimated.
11. REDEMPTION IN-KIND
After the close of business on July 7, 2017, the Fund redeemed assets through an in-kind redemption. In the redemption transaction, the Fund issued securities with a value of $317,068,893 and cash in the amount of $17,087,078. The Fund recognized gains in the amount of $145,197,411 which is reflected on the Statement of Operations. The redemption in-kind by a shareholder of the Institutional Class represented 34% of the Fund and is reflected on the Statement of Changes in Net Assets.
| | | | |
| 30 | | Wells Fargo Small Cap Value Fund | | Report of independent registered public accounting firm |
BOARD OF TRUSTEES AND SHAREHOLDERS OF WELLS FARGO FUNDS TRUST:
Opinion on the Financial Statements
We have audited the accompanying statement of assets and liabilities of the Wells Fargo Small Cap Value Fund (the “Fund”), one of the funds constituting the Wells Fargo Funds Trust, including the portfolio of investments, as of March 31, 2018, the related statement of operations for the year then ended, the statements of changes in net assets for each of the years in the two-year period then ended, and the related notes (collectively, the “financial statements”) and the financial highlights for each of the years in the four-year period then ended, the period from November 1, 2013 to March 31, 2014, and the year ended October 31, 2013. In our opinion, the financial statements and financial highlights present fairly, in all material respects, the financial position of the Fund as of March 31, 2018, the results of its operations for the year then ended, the changes in its net assets for each of the years in the two-year period then ended, and the financial highlights for each of the years or periods noted above, in conformity with U.S. generally accepted accounting principles.
Basis for Opinion
These financial statements and financial highlights are the responsibility of the Fund’s management. Our responsibility is to express an opinion on these financial statements and financial highlights based on our audits. We are a public accounting firm registered with the Public Company Accounting Oversight Board (United States) (“PCAOB”) and are required to be independent with respect to the Fund in accordance with the U.S. federal securities laws and the applicable rules and regulations of the Securities and Exchange Commission and the PCAOB.
We conducted our audits in accordance with the standards of the PCAOB. Those standards require that we plan and perform the audit to obtain reasonable assurance about whether the financial statements and financial highlights are free of material misstatement, whether due to error or fraud. Our audits included performing procedures to assess the risks of material misstatement of the financial statements and financial highlights, whether due to error or fraud, and performing procedures that respond to those risks. Such procedures included examining, on a test basis, evidence regarding the amounts and disclosures in the financial statements and financial highlights. Such procedures also included confirmation of securities owned as of March 31, 2018, by correspondence with the custodian and brokers, or by other appropriate auditing procedures. Our audits also included evaluating the accounting principles used and significant estimates made by management, as well as evaluating the overall presentation of the financial statements and financial highlights. We believe that our audits provide a reasonable basis for our opinion.

We have not been able to determine the specific year that we began serving as the auditor of one or more Wells Fargo Funds investment companies, however we are aware that we have served as the auditor of one or more Wells Fargo Funds investment companies since at least 1955.
Boston, Massachusetts
May 23, 2018
| | | | | | |
| Other information (unaudited) | | Wells Fargo Small Cap Value Fund | | | 31 | |
TAX INFORMATION
For corporate shareholders, pursuant to Section 854 of the Internal Revenue Code, 100% of ordinary income dividends qualify for the corporate dividends-received deduction for the fiscal year ended March 31, 2018.
Pursuant to Section 852 of the Internal Revenue Code, $230,758,003 was designated as a 20% rate gain distribution for the fiscal year ended March 31, 2018.
Pursuant to Section 854 of the Internal Revenue Code, $1,352,843 of income dividends paid during the fiscal year ended March 31, 2018 has been designated as qualified dividend income (QDI).
PROXY VOTING INFORMATION
A description of the policies and procedures that the Fund uses to determine how to vote proxies relating to portfolio securities is available, upon request, by calling 1-800-222-8222, visiting our website at wellsfargofunds.com, or visiting the SEC website at sec.gov. Information regarding how the Fund voted proxies relating to portfolio securities during the most recent 12-month period ended June 30 is available on the Fund’s website at wellsfargofunds.com or by visiting the SEC website at sec.gov.
PORTFOLIO HOLDINGS INFORMATION
The complete portfolio holdings for the Fund are publicly available monthly on the Fund’s website (wellsfargofunds.com), on a one-month delayed basis. In addition, top ten holdings information (excluding derivative positions) for the Fund is publicly available on the Fund’s website on a monthly, seven-day or more delayed basis. The Fund files its complete schedule of portfolio holdings with the SEC for the first and third quarters of each fiscal year on Form N-Q, which is available by visiting the SEC website at sec.gov. In addition, the Fund’s Form N-Q may be reviewed and copied at the SEC’s Public Reference Room in Washington, DC, and at regional offices in New York City, at 233 Broadway, and in Chicago, at 175 West Jackson Boulevard, Suite 900. Information about the Public Reference Room may be obtained by calling 1-800-SEC-0330.
| | | | |
| 32 | | Wells Fargo Small Cap Value Fund | | Other information (unaudited) |
BOARD OF TRUSTEES AND OFFICERS
Each of the Trustees and Officers1 listed in the table below acts in identical capacities for each fund in the Wells Fargo family of funds, which consists of 153 mutual funds comprising the Wells Fargo Funds Trust, Wells Fargo Variable Trust, Wells Fargo Master Trust and four closed-end funds (collectively the “Fund Complex”). This table should be read in conjunction with the Prospectus and the Statement of Additional Information2. The mailing address of each Trustee and Officer is 525 Market Street, 12th Floor, San Francisco, CA 94105. Each Trustee and Officer serves an indefinite term, however, each Trustee serves such term until reaching the mandatory retirement age established by the Trustees.
Independent Trustees
| | | | | | |
Name and year of birth | | Position held and length of service* | | Principal occupations during past five years or longer | | Current other public company or investment company directorships |
William R. Ebsworth (Born 1957) | | Trustee, since 2015 | | Retired. From 1984 to 2013, equities analyst, portfolio manager, research director and chief investment officer at Fidelity Management and Research Company in Boston, Tokyo, and Hong Kong, and retired in 2013 as Chief Investment Officer of Fidelity Strategic Advisers, Inc. where he led a team of investment professionals managing client assets. Prior thereto, Board member of Hong Kong Securities Clearing Co., Hong Kong Options Clearing Corp., the Thailand International Fund, Ltd., Fidelity Investments Life Insurance Company, and Empire Fidelity Investments Life Insurance Company. Board member of the Forté Foundation (non-profit organization) and the Vincent Memorial Hospital Endowment (non-profit organization), where he serves on the Investment Committee and as a Chair of the Audit Committee. Mr. Ebsworth is a CFA® charterholder. | | Asset Allocation Trust |
Jane A. Freeman** (Born 1953) | | Trustee, since 2015; Chair Liaison, since 2018 | | Retired. From 2012 to 2014 and 1999 to 2008, Chief Financial Officer of Scientific Learning Corporation. From 2008 to 2012, Ms. Freeman provided consulting services related to strategic business projects. Prior to 1999, Portfolio Manager at Rockefeller & Co. and Scudder, Stevens & Clark. Board member of the Harding Loevner Funds from 1996 to 2014, serving as both Lead Independent Director and chair of the Audit Committee. Board member of the Russell Exchange Traded Funds Trust from 2011 to 2012 and the chair of the Audit Committee. Ms. Freeman is a Board Member of Ruth Bancroft Garden (non-profit organization) and the Glimmerglass Festival. She is also an inactive Chartered Financial Analyst. | | Asset Allocation Trust |
Isaiah Harris, Jr. (Born 1952) | | Trustee, since 2009 | | Retired. Chairman of the Board of CIGNA Corporation since 2009, and Director since 2005. From 2003 to 2011, Director of Deluxe Corporation. Prior thereto, President and CEO of BellSouth Advertising and Publishing Corp. from 2005 to 2007, President and CEO of BellSouth Enterprises from 2004 to 2005 and President of BellSouth Consumer Services from 2000 to 2003. Emeritus member of the Iowa State University Foundation Board of Governors. Emeritus Member of the Advisory Board of Iowa State University School of Business. Advisory Board Member, Palm Harbor Academy (charter school). Advisory Board Member, Child Evangelism Fellowship (non-profit). Mr. Harris is a certified public accountant (inactive status). | | CIGNA Corporation; Asset Allocation Trust |
Judith M. Johnson (Born 1949) | | Trustee, since 2008; Audit Committee Chairman, since 2008 | | Retired. Prior thereto, Chief Executive Officer and Chief Investment Officer of Minneapolis Employees Retirement Fund from 1996 to 2008. Ms. Johnson is an attorney, certified public accountant and a certified managerial accountant. | | Asset Allocation Trust |
David F. Larcker (Born 1950) | | Trustee, since 2009 | | James Irvin Miller Professor of Accounting at the Graduate School of Business, Stanford University, Director of the Corporate Governance Research Initiative and Senior Faculty of The Rock Center for Corporate Governance since 2006. From 2005 to 2008, Professor of Accounting at the Graduate School of Business, Stanford University. Prior thereto, Ernst & Young Professor of Accounting at The Wharton School, University of Pennsylvania from 1985 to 2005. | | Asset Allocation Trust |
| | | | | | |
| Other information (unaudited) | | Wells Fargo Small Cap Value Fund | | | 33 | |
| | | | | | |
Name and year of birth | | Position held and length of service* | | Principal occupations during past five years or longer | | Current other public company or
investment company
directorships |
Olivia S. Mitchell*** (Born 1953) | | Trustee, since 2006; Governance Committee Chairman, since 2018 | | International Foundation of Employee Benefit Plans Professor, Wharton School of the University of Pennsylvania since 1993. Director of Wharton’s Pension Research Council and Boettner Center on Pensions & Retirement Research, and Research Associate at the National Bureau of Economic Research. Previously, Cornell University Professor from 1978 to 1993. | | Asset Allocation Trust |
Timothy J. Penny**** (Born 1951) | | Trustee, since 1996; Chairman, since 2018; Vice Chairman, from 2017 to 2018 | | President and Chief Executive Officer of Southern Minnesota Initiative Foundation, a non-profit organization, since 2007. Member of the Board of Trustees of NorthStar Education Finance, Inc., a non-profit organization, since 2007. | | Asset Allocation Trust |
James G. Polisson***** (Born 1959) | | Trustee, since 2018; Advisory Board Member, from 2017 to 2018 | | Retired. Chief Marketing Officer, Source (ETF) UK Services, Ltd, from 2015 to 2017. From 2012 to 2015, Principal of The Polisson Group, LLC, a management consulting, corporate advisory and principal investing company. Chief Executive Officer and Managing Director at Russell Investments, Global Exchange Traded Funds from 2010 to 2012. Managing Director of Barclays Global Investors from 1998 to 2010 and Global Chief Marketing Officer for iShares and Barclays Global Investors from 2000 to 2010. Trustee of the San Francisco Mechanics’ Institute, a non-profit organization, from 2013 to 2015. Board member of the Russell Exchange Traded Fund Trust from 2011 to 2012. Director of Barclays Global Investors Holdings Deutschland GmbH from 2006 to 2009. Mr. Polisson is an attorney and has a retired status with the Massachusetts and District of Columbia Bar Associations. | | Asset Allocation Trust |
Michael S. Scofield (Born 1943) | | Trustee, since 2010 | | Served on the Investment Company Institute’s Board of Governors and Executive Committee from 2008-2011 as well the Governing Council of the Independent Directors Council from 2006-2011 and the Independent Directors Council Executive Committee from 2008-2011. Trustee of the Evergreen Fund complex (and its predecessors) from 1984 to 2010. Chairman of the Evergreen Funds from 2000-2010. Former Trustee of the Mentor Funds. Retired Attorney, Law Offices of Michael S. Scofield. | | Asset Allocation Trust |
Pamela Wheelock***** (Born 1959) | | Trustee, since 2018; Advisory Board Member, from 2017 to 2018 | | Chief Operating Officer, Twin Cities Habitat for Humanity, since January, 2017. Vice President of University Services, University of Minnesota from 2012 to 2017. Prior thereto, Interim President and Chief Executive Officer of Blue Cross Blue Shield of Minnesota from 2010 to 2011, Chairman of the Board from 2009 to 2011 and Board Director from 2003 to 2015. Vice President, Leadership and Community Engagement, Bush Foundation, Saint Paul, Minnesota (a private foundation) from 2009 to 2011. Executive Vice President and Chief Financial Officer, Minnesota Sports and Entertainment from 2004 to 2009 and Senior Vice President from 2002 to 2004. Commissioner of Finance, State of Minnesota, from 1999 to 2002. Currently on the Board of Directors, Governance Committee and Finance Committee, for the Minnesota Philanthropy Partners (Saint Paul Foundation) since 2012 and Board Chair of the Minnesota Wild Foundation since 2010. | | Asset Allocation Trust |
| * | Length of service dates reflect the Trustee’s commencement of service with the Trust’s predecessor entities, where applicable. |
| ** | Jane Freeman became Chair Liaison effective January 1, 2018. |
| *** | Olivia Mitchell became Chairman of the Governance Committee effective January 1, 2018. |
| **** | Timothy Penny became Chairman effective January 1, 2018. |
| ***** | James Polisson and Pamela Wheelock each became a Trustee effective January 1, 2018. |
| | | | |
| 34 | | Wells Fargo Small Cap Value Fund | | Other information (unaudited) |
Officers
| | | | | | |
Name and year of birth | | Position held and length of service | | Principal occupations during past five years or longer | | |
Andrew Owen (Born 1960) | | President, since 2017 | | Executive Vice President of Wells Fargo & Company and Head of Affiliated Managers, Wells Fargo Asset Management, since 2014. In addition, Mr. Owen is currently President, Chief Executive Officer and Director of Wells Fargo Funds Management, LLC since 2017. Prior thereto, Executive Vice President responsible for marketing, investments and product development for Wells Fargo Funds Management, LLC, from 2009 to 2014. | | |
Nancy Wiser1 (Born 1967) | | Treasurer, since 2012 | | Executive Vice President of Wells Fargo Funds Management, LLC since 2011. Chief Operating Officer and Chief Compliance Officer at LightBox Capital Management LLC, from 2008 to 2011. | | |
Alexander Kymn* (Born 1973) | | Secretary, since 2018; Chief Legal Officer, since 2018 | | Senior Company Counsel of Wells Fargo Bank, N.A. since 2018 (previously Senior Counsel from 2007 to 2018). Vice President of Wells Fargo Funds Management, LLC from 2008 to 2014. | | |
C. David Messman** (Born 1960) | | Secretary, since 2000; Chief Legal Officer, since 2003 | | Senior Vice President and Secretary of Wells Fargo Funds Management, LLC since 2001. Assistant General Counsel of Wells Fargo Bank, N.A. since 2013 and Vice President and Managing Counsel of Wells Fargo Bank, N.A. from 1996 to 2013. | | |
Michael H. Whitaker (Born 1967) | | Chief Compliance Officer, since 2016 | | Senior Vice President and Chief Compliance Officer since 2016. Senior Vice President and Chief Compliance Officer for Fidelity Investments from 2007 to 2016. | | |
David Berardi (Born 1975) | | Assistant Treasurer, since 2009 | | Vice President of Wells Fargo Funds Management, LLC since 2009. Vice President of Evergreen Investment Management Company, LLC from 2008 to 2010. Manager of Fund Reporting and Control for Evergreen Investment Management Company, LLC from 2004 to 2010. | | |
Jeremy DePalma1 (Born 1974) | | Assistant Treasurer, since 2009 | | Senior Vice President of Wells Fargo Funds Management, LLC since 2009. Senior Vice President of Evergreen Investment Management Company, LLC from 2008 to 2010 and head of the Fund Reporting and Control Team within Fund Administration from 2005 to 2010. | | |
| 1 | Nancy Wiser acts as Treasurer of 77 funds in the Fund Complex. Jeremy DePalma acts as Treasurer of 76 funds and Assistant Treasurer of 77 funds in the Fund Complex. |
| 2 | The Statement of Additional Information includes additional information about the Trustees and is available, without charge, upon request, by calling 1-800-222-8222 or by visiting the website at wellsfargofunds.com. |
| * | Alexander Kymn became the Secretary and Chief Legal Officer effective April 17, 2018. |
| ** | David Messman was the Secretary and Chief Legal Officer until April 16, 2018. |
| | | | | | |
| List of abbreviations | | Wells Fargo Small Cap Value Fund | | | 35 | |
The following is a list of common abbreviations for terms and entities that may have appeared in this report.
| ACA | — ACA Financial Guaranty Corporation |
| ADR | — American depositary receipt |
| ADS | — American depositary shares |
| AGC | — Assured Guaranty Corporation |
| AGM | — Assured Guaranty Municipal |
| Ambac | — Ambac Financial Group Incorporated |
| AMT | — Alternative minimum tax |
| BAN | — Bond anticipation notes |
| BHAC | — Berkshire Hathaway Assurance Corporation |
| CAB | — Capital appreciation bond |
| CCAB | — Convertible capital appreciation bond |
| CDA | — Community Development Authority |
| CDO | — Collateralized debt obligation |
| CLO | — Collateralized loan obligation |
| DRIVER | — Derivative inverse tax-exempt receipts |
| DW&P | — Department of Water & Power |
| DWR | — Department of Water Resources |
| ECFA | — Educational & Cultural Facilities Authority |
| EDA | — Economic Development Authority |
| EDFA | — Economic Development Finance Authority |
| ETF | — Exchange-traded fund |
| FDIC | — Federal Deposit Insurance Corporation |
| FFCB | — Federal Farm Credit Banks |
| FGIC | — Financial Guaranty Insurance Corporation |
| FHA | — Federal Housing Administration |
| FHLB | — Federal Home Loan Bank |
| FHLMC | — Federal Home Loan Mortgage Corporation |
| FICO | — The Financing Corporation |
| FNMA | — Federal National Mortgage Association |
| GDR | — Global depositary receipt |
| GNMA | — Government National Mortgage Association |
| HCFR | — Healthcare facilities revenue |
| HEFA | — Health & Educational Facilities Authority |
| HEFAR | — Higher education facilities authority revenue |
| HFA | — Housing Finance Authority |
| HFFA | — Health Facilities Financing Authority |
| HUD | — Department of Housing and Urban Development |
| IDA | — Industrial Development Authority |
| IDAG | — Industrial Development Agency |
| KRW | — Republic of Korea won |
| LIBOR | — London Interbank Offered Rate |
| LIFER | — Long Inverse Floating Exempt Receipts |
| LLC | — Limited liability company |
| LLLP | — Limited liability limited partnership |
| LLP | — Limited liability partnership |
| MBIA | — Municipal Bond Insurance Association |
| MFHR | — Multifamily housing revenue |
| MSTR | — Municipal securities trust receipts |
| MUD | — Municipal Utility District |
| National | — National Public Finance Guarantee Corporation |
| PCFA | — Pollution Control Financing Authority |
| PCL | — Public Company Limited |
| PCR | — Pollution control revenue |
| PFA | — Public Finance Authority |
| PFFA | — Public Facilities Financing Authority |
| PFOTER | — Puttable floating option tax-exempt receipts |
| PJSC | — Public Joint Stock Company |
| plc | — Public limited company |
| PUTTER | — Puttable tax-exempt receipts |
| R&D | — Research & development |
| Radian | — Radian Asset Assurance |
| RAN | — Revenue anticipation notes |
| RDA | — Redevelopment Agency |
| RDFA | — Redevelopment Finance Authority |
| REIT | — Real estate investment trust |
| ROC | — Reset option certificates |
| SAVRS | — Select auction variable rate securities |
| SBA | — Small Business Authority |
| SDR | — Swedish depositary receipt |
| SFHR | — Single-family housing revenue |
| SFMR | — Single-family mortgage revenue |
| SIFMA | — Securities Industry and Financial Markets Association |
| SPA | — Standby purchase agreement |
| SPDR | — Standard & Poor’s Depositary Receipts |
| SPEAR | — Short Puttable Exempt Adjustable Receipts |
| STRIPS | — Separate trading of registered interest and |
| TAN | — Tax anticipation notes |
| TIPS | — Treasury inflation-protected securities |
| TRAN | — Tax revenue anticipation notes |
| TTFA | — Transportation Trust Fund Authority |
| TVA | — Tennessee Valley Authority |
This page is intentionally left blank.

For more information
More information about Wells Fargo Funds is available free upon request. To obtain literature, please write, email, visit the Fund’s website, or call:
Wells Fargo Funds
P.O. Box 8266
Boston, MA 02266-8266
Email: fundservice@wellsfargo.com
Website: wellsfargofunds.com
Individual investors: 1-800-222-8222
Retail investment professionals: 1-888-877-9275
Institutional investment professionals:
1-866-765-0778
This report and the financial statements contained herein are submitted for the general information of the shareholders of the Fund. If this report is used for promotional purposes, distribution of the report must be accompanied or preceded by a current prospectus. Before investing, please consider the investment objectives, risks, charges, and expenses of the investment. For a current prospectus and, if available, a summary prospectus, containing this information, call 1-800-222-8222 or visit the Fund’s website at wellsfargofunds.com. Read the prospectus carefully before you invest or send money.
Wells Fargo Asset Management (WFAM) is a trade name used by the asset management businesses of Wells Fargo & Company. Wells Fargo Funds Management, LLC, a wholly owned subsidiary of Wells Fargo & Company, provides investment advisory and administrative services for Wells Fargo Funds. Other affiliates of Wells Fargo & Company provide subadvisory and other services for the funds. The funds are distributed by Wells Fargo Funds Distributor, LLC, Member FINRA, an affiliate of Wells Fargo & Company. Neither Wells Fargo Funds Distributor nor Wells Fargo Funds Management holds fund shareholder accounts or assets. This material is for general informational and educational purposes only and is NOT intended to provide investment advice or a recommendation of any kind—including a recommendation for any specific investment, strategy, or plan.
NOT FDIC INSURED ◾ NO BANK GUARANTEE ◾ MAY LOSE VALUE
© 2018 Wells Fargo Funds Management, LLC. All rights reserved.
| | |
 | | 309984 05-18 A244/AR244 03-18 |
Annual Report
March 31, 2018

Wells Fargo Special Small Cap Value Fund


Reduce clutter. Save trees.
Sign up for electronic delivery of prospectuses and shareholder reports at wellsfargo.com/advantagedelivery
Contents
The views expressed and any forward-looking statements are as of March 31, 2018, unless otherwise noted, and are those of the Fund managers and/or Wells Fargo Funds Management, LLC. Discussions of individual securities, or the markets generally, or any Wells Fargo Fund are not intended as individual recommendations. Future events or results may vary significantly from those expressed in any forward-looking statements. The views expressed are subject to change at any time in response to changing circumstances in the market. Wells Fargo Funds Management, LLC and the Fund disclaim any obligation to publicly update or revise any views expressed or forward-looking statements.
NOT FDIC INSURED ◾ NO BANK GUARANTEE ◾ MAY LOSE VALUE
| | | | |
| 2 | | Wells Fargo Special Small Cap Value Fund | | Letter to shareholders (unaudited) |

Andrew Owen
President
Wells Fargo Funds
Dear Shareholder:
We are pleased to offer you this annual report for the Wells Fargo Special Small Cap Value Fund for the 12-month period that ended March 31, 2018. During the last three quarters of 2017, investors enjoyed consistently rising equity values globally. Short-term interest rates tended to increase, while long-term rates remained flat to lower. During the final two months of the first quarter of 2018, equity market volatility returned, stocks reversed year-to-date gains, and bond yields rose while prices fell.
For the period, U.S. stocks, as measured by the S&P 500 Index,1 gained 13.99% and international stocks, as measured by the MSCI ACWI ex USA Index (Net),2 added 16.53%. Emerging market stocks, as measured by the MSCI EM Index (Net),3 added 24.93%. In bond markets, the Bloomberg Barclays U.S. Aggregate Bond Index4 added 1.20% and the Bloomberg Barclays Municipal Bond Index5 added 2.66% while fixed-income investments outside the U.S. gained 11.75%, according to the Bloomberg Barclays Global Aggregate ex-USD Index.6 The ICE BofAML U.S. High Yield Index7 earned 3.69%.
Through the last nine months of 2017, stocks advanced on synchronized global growth, which led to higher investor and consumer confidence. The first quarter of 2018 began with strong stock market gains in January. A strong January 2018 U.S. employment report and inflation concerns prompted equity volatility in February. Investor optimism for growth was supplanted with concerns over trade tensions, increased interest rates, and the prospect of new data privacy regulations.
Reactions to U.S. interest rate increases were uneven across the yield curve and globally.
The U.S. Federal Reserve (Fed) increased the federal funds rate three times during the 12-month period for a combined 75 basis points (bps; 100 bps equals 1.00%). Following an increase in March 2017, short-term bond yields in the U.S. rose while longer-term Treasury yields were little changed. Municipal bond returns were positive, helped by strong demand and constrained new-issue supply. The Fed raised the target interest rate once again in June 2017 to a range of 1.00% to 1.25%. Ten-year U.S. Treasury yields declined, the yield curve flattened, and long-term bond prices benefited.
| 1 | The S&P 500 Index consists of 500 stocks chosen for market size, liquidity, and industry group representation. It is a market-value-weighted index with each stock’s weight in the index proportionate to its market value. You cannot invest directly in an index. |
| 2 | The Morgan Stanley Capital International (MSCI) All Country World Index (ACWI) ex USA Index (Net) is a free-float-adjusted market-capitalization-weighted index that is designed to measure the equity market performance of developed markets, excluding the United States and Canada. Source: MSCI. MSCI makes no express or implied warranties or representations and shall have no liability whatsoever with respect to any MSCI data contained herein. The MSCI data may not be further redistributed or used as a basis for other indices or any securities or financial products. This report is not approved, reviewed, or produced by MSCI. You cannot invest directly in an index. |
| 3 | The MSCI Emerging Markets (EM) Index (Net) is a free-float-adjusted market-capitalization-weighted index that is designed to measure large- and mid-cap equity market performance of emerging markets. The MSCI EM Index (Net) consists of the following 24 emerging market country indices: Brazil, Chile, China, Colombia, Czech Republic, Egypt, Greece, Hungary, India, Indonesia, Korea, Malaysia, Mexico, Pakistan, Peru, the Philippines, Poland, Qatar, Russia, South Africa, Taiwan, Thailand, Turkey, and the United Arab Emirates. You cannot invest directly in an index. |
| 4 | The Bloomberg Barclays U.S. Aggregate Bond Index is a broad-based benchmark that measures the investment-grade, U.S. dollar-denominated, fixed-rate taxable bond market, including Treasuries, government-related and corporate securities, mortgage-backed securities (agency fixed-rate and hybrid adjustable-rate mortgage pass-throughs), asset-backed securities, and commercial mortgage-backed securities. You cannot invest directly in an index. |
| 5 | The Bloomberg Barclays Municipal Bond Index is an unmanaged index composed of long-term tax-exempt bonds with a minimum credit rating of Baa. You cannot invest directly in an index. |
| 6 | The Bloomberg Barclays Global Aggregate ex-USD Index is an unmanaged index that provides a broad-based measure of the global investment-grade fixed-income markets excluding the U.S. dollar-denominated debt market. You cannot invest directly in an index. |
| 7 | The ICE BofAML U.S. High Yield Index is a market-capitalization-weighted index of domestic and Yankee high-yield bonds. The index tracks the performance of high-yield securities traded in the U.S. bond market. You cannot invest directly in an index. Copyright 2018. ICE Data Indices, LLC. All rights reserved. |
| | | | | | |
| Letter to shareholders (unaudited) | | Wells Fargo Special Small Cap Value Fund | | | 3 | |
Internationally, central banks maintained low interest rates and accommodative monetary policies that supported business activity and stock values in foreign markets. A weaker U.S. dollar was generally supportive of business activity in regions around the globe. The Bank of Japan continued its accommodative monetary policies, and industrial production, retail sales, and fixed asset investment increased in China.
Growth continued through the summer of 2017.
Globally, stocks moved higher during the third quarter of 2017. Low inflation and interest rates supported accelerating global economic growth and corporate earnings. Brief episodes of geopolitical tensions, often associated with North Korea’s advancing nuclear missile program, flaring conflicts in the Middle East, and uncertainty surrounding U.S. trade policies, did not discourage investing activity.
In the U.S., economic data released during the quarter reflected a generally healthy economy. Second-quarter economic output grew at a 3.1% annual rate. Stocks in international developed and emerging markets continued to benefit from improving economic growth.
Positive economic and market news continued as 2017 closed and 2018 began.
During the fourth quarter of 2017, stock markets continued the move higher. Third-quarter economic output in the U.S. grew at a 3.2% annual rate. The unemployment rate fell to a 17-year low of 4.1%. Tax reform passed and wage growth data improved, encouraging increased business and consumer spending.
Fed officials announced in October 2017 plans to begin unwinding its $4.5 trillion portfolio of bonds and other assets accumulated during rounds of quantitative easing conducted since the 2008–2009 recession. Still, restrained inflation kept long-term bond rates steady and the flattened yield curve persisted. The Fed raised the federal funds rate target to a range of 1.25% to 1.50% in December 2017 and began selling bonds held in its portfolio.
2018 opened with continued stock advances, then volatility.
Improving business and economic data globally continued to support stocks through January 2018. Political wrangling in the U.S. over budget resolutions could not dissuade investors from buying stocks as payrolls and factory orders increased. Long-term interest rates in the U.S. trended higher as the yield curve steepened—the 10-year Treasury rate moved from 2.46% to 2.84% and the 30-year rate moved from 2.81% to 3.08% during January 2018.
Investor sentiment shifted in February as inflation concerns emerged in the U.S. when readings from the Producer Price Index in January rose 2.5% year over year. During February, the U.S. market endured a loss from January’s high of nearly 12% before recovering much of that loss. The Fed raised the federal funds rate in March 2018. Bond yields rose across the yield curve.
During January 2018, purchasing managers’ indices in China, the eurozone, India, and Japan reported data for December that indicated continued growth. Despite positive economic signals and business fundamentals, international stock values fell during February and March 2018, swept up in the selling momentum in U.S. markets.
Globally, stocks moved higher during the third quarter of 2017.
During February, the U.S. market endured a loss from January’s high of nearly 12% before recovering much of that loss.
| | | | |
| 4 | | Wells Fargo Special Small Cap Value Fund | | Letter to shareholders (unaudited) |
Don’t let short-term uncertainty derail long-term investment goals.
Periods of investment uncertainty can present challenges, but experience has taught us that maintaining long-term investment goals can be an effective way to plan for the future. To help you create a sound strategy based on your personal goals and risk tolerance, Wells Fargo Funds offers more than 100 mutual funds spanning a wide range of asset classes and investment styles. Although diversification cannot guarantee an investment profit or prevent losses, we believe it can be an effective way to manage investment risk and potentially smooth out overall portfolio performance. We encourage investors to know their investments and to understand that appropriate levels of risk-taking may unlock opportunities.
Thank you for choosing to invest with Wells Fargo Funds. We appreciate your confidence in us and remain committed to helping you meet your financial needs.
Sincerely,

Andrew Owen
President
Wells Fargo Funds
For further information about your Fund, contact your investment professional, visit our website at wellsfargofunds.com, or call us directly at 1-800-222-8222.
This page is intentionally left blank.
| | | | |
| 6 | | Wells Fargo Special Small Cap Value Fund | | Performance highlights (unaudited) |
Investment objective
The Fund seeks long-term capital appreciation.
Manager
Wells Fargo Funds Management, LLC
Subadviser
Wells Capital Management Incorporated
Portfolio managers
Robert Rifkin, CFA®
James M. Tringas, CFA®
Bryant VanCronkhite, CFA®, CPA
Average annual total returns (%) as of March 31, 20181
| | | | | | | | | | | | | | | | | | | | | | | | | | | | | | | | | | |
| | | | | Including sales charge | | | Excluding sales charge | | | Expense ratios2 (%) | |
| | | Inception date | | 1 year | | | 5 year | | | 10 year | | | 1 year | | | 5 year | | | 10 year | | | Gross | | | Net3 | |
| Class A (ESPAX) | | 5-7-1993 | | | 3.14 | | | | 11.59 | | | | 9.08 | | | | 9.42 | | | | 12.92 | | | | 9.72 | | | | 1.33 | | | | 1.33 | |
| Class C (ESPCX) | | 12-12-2000 | | | 7.60 | | | | 12.07 | | | | 8.90 | | | | 8.60 | | | | 12.07 | | | | 8.90 | | | | 2.08 | | | | 2.08 | |
| Class R (ESPHX) | | 9-30-2015 | | | – | | | | – | | | | – | | | | 9.13 | | | | 12.65 | | | | 9.43 | | | | 1.58 | | | | 1.58 | |
| Class R6 (ESPRX) | | 10-31-2014 | | | – | | | | – | | | | – | | | | 9.85 | | | | 13.39 | | | | 10.13 | | | | 0.90 | | | | 0.90 | |
| Administrator Class (ESPIX) | | 7-23-1996 | | | – | | | | – | | | | – | | | | 9.52 | | | | 13.12 | | | | 9.96 | | | | 1.25 | | | | 1.21 | |
| Institutional Class (ESPNX) | | 7-30-2010 | | | – | | | | – | | | | – | | | | 9.82 | | | | 13.36 | | | | 10.12 | | | | 1.00 | | | | 0.95 | |
| Russell 2000® Value Index4 | | – | | | – | | | | – | | | | – | | | | 5.13 | | | | 9.96 | | | | 8.61 | | | | – | | | | – | |
Figures quoted represent past performance, which is no guarantee of future results, and do not reflect taxes that a shareholder may pay on fund distributions or the redemption of fund shares. Investment return and principal value of an investment will fluctuate so that an investor’s shares, when redeemed, may be worth more or less than their original cost. Performance shown without sales charges would be lower if sales charges were reflected. Current performance may be lower or higher than the performance data quoted, which assumes the reinvestment of dividends and capital gains. Current month-end performance is available on the Fund’s website, wellsfargofunds.com.
Index returns do not include transaction costs associated with buying and selling securities, any mutual fund fees or expenses, or any taxes. It is not possible to invest directly in an index.
For Class A shares, the maximum front-end sales charge is 5.75%. For Class C shares, the maximum contingent deferred sales charge is 1.00%. Performance including a contingent deferred sales charge assumes the sales charge for the corresponding time period. Class R, Class R6, Administrator Class, and Institutional Class shares are sold without a front-end sales charge or contingent deferred sales charge.
Stock values fluctuate in response to the activities of individual companies and general market and economic conditions. Smaller-company stocks tend to be more volatile and less liquid than those of larger companies. Consult the Fund’s prospectus for additional information on these and other risks.
Please see footnotes on page 7.
| | | | | | |
| Performance highlights (unaudited) | | Wells Fargo Special Small Cap Value Fund | | | 7 | |
|
| Growth of $10,000 investment as of March 31, 20185 |
|
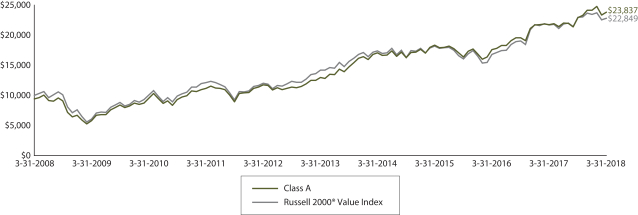 |
| 1 | Historical performance shown for Class R shares prior to their inception reflects the performance of the Institutional Class shares adjusted to reflect the higher expenses applicable to Class R shares. Historical performance for Class R6 shares prior to their inception reflects the performance of the Institutional Class shares, and includes the higher expenses applicable to Institutional Class shares. If these expenses had not been included, returns for Class R6 shares would be higher. Historical performance shown for Institutional Class shares prior to their inception reflects the performance of Administrator Class shares, and includes the higher expenses applicable to Administrator Class shares. If these expenses had not been included, returns for Institutional Class shares would be higher. Historical performance shown for all classes of the Fund prior to July 19, 2010, is based on the performance of the Fund’s predecessor, Evergreen Special Values Fund. |
| 2 | Reflects the expense ratios as stated in the most recent prospectuses, which include the impact of 0.01% in acquired fund fees and expenses. The expense ratios shown are subject to change and may differ from the annualized expense ratios shown in the financial highlights of this report, which do not include acquired fund fees and expenses. |
| 3 | The manager has contractually committed through July 31, 2018, to waive fees and/or reimburse expenses to the extent necessary to cap the Fund’s Total Annual Fund Operating Expenses After Fee Waivers at 1.34% for Class A, 2.09% for Class C, 1.59% for Class R, 0.89% for Class R6, 1.20% for Administrator Class, and 0.94% for Institutional Class. After this time, the cap may be increased or the commitment to maintain the cap may be terminated only with the approval of the Board of Trustees. Brokerage commissions, stamp duty fees, interest, taxes, acquired fund fees and expenses (if any), and extraordinary expenses are excluded from the expense cap. Without this cap, the Fund’s returns would have been lower. The expense ratio paid by an investor is the net expense ratio (the total annual fund operating expenses after fee waivers) as stated in the prospectuses. |
| 4 | The Russell 2000® Value Index measures the performance of those Russell 2000 companies with lower price/book ratios and lower forecasted growth values. You cannot invest directly in an index. |
| 5 | The chart compares the performance of Class A shares for the most recent ten years with the Russell 2000® Value Index. The chart assumes a hypothetical investment of $10,000 in Class A shares and reflects all operating expenses and assumes the maximum initial sales charge of 5.75%. |
| 6 | The ten largest holdings, excluding cash and cash equivalents, are calculated based on the value of the investments divided by total net assets of the Fund. Holdings are subject to change and may have changed since the date specified. |
| 7 | Amounts are calculated based on the total long-term investments of the Fund. These amounts are subject to change and may have changed since the date specified. |
| | | | |
| 8 | | Wells Fargo Special Small Cap Value Fund | | Performance highlights (unaudited) |
MANAGER’S DISCUSSION
Fund highlights
| ∎ | | The Fund outperformed its benchmark, the Russell 2000® Value Index, for the 12-month period that ended March 31, 2018. |
| ∎ | | Stock selection in the information technology (IT) sector as well as an overweight to the industrials sector contributed to relative performance. |
| ∎ | | Stock selection in the health care sector and an overweight to consumer staples detracted from performance. |
Over the 12-month reporting period, small-cap value stocks provided favorable returns. The Russell 2000® Value Index rose more than 5% during the period. Through much of 2017, small-cap value stocks traded in a narrow range coming off of an exceptionally strong 2016. Beginning in September, small-cap value stocks began to move higher as investors began to see the increased likelihood for corporate tax reform to become a reality, which was eventually passed into legislation in December. The benefits of tax reform were quickly discarded by equity investors in the first quarter of 2018 as volatility spiked based on fears of higher interest rates and potential protectionist trade policies.
| | | | |
| Ten largest holdings (%) as of March 31, 20186 | |
Simpson Manufacturing Company Incorporated | | | 2.55 | |
First Citizens BancShares Corporation Class A | | | 2.40 | |
UMB Financial Corporation | | | 2.15 | |
Neenah Paper Incorporated | | | 2.15 | |
Innospec Incorporated | | | 2.03 | |
HRG Group Incorporated | | | 2.01 | |
Mueller Industries Incorporated | | | 1.91 | |
Eagle Materials Incorporated | | | 1.88 | |
Denny’s Corporation | | | 1.81 | |
Hawaiian Electric Industries Incorporated | | | 1.75 | |
Recent market volatility strengthens our belief that it is always prudent to protect downside risks. Our bottom-up process is designed to find companies that can control their own destiny via their clear competitive advantages, strong and sustainable free cash flows, and flexible balance sheets that can be used to grow shareholder value regardless of the macro environment. We did not make any major changes to portfolio positioning during the reporting period, and we continue to emphasize companies that prudently allocate their capital.
Key contributors included stock selection within IT and an overweight to industrials.
Stock selection in IT contributed to relative performance. Novanta Incorporated, a manufacturer of photonic and motion control components for the industrial and medical markets, benefited the Fund’s performance. We have been attracted to Novanta’s capital redeployment strategy to diversify its end markets into the higher margin and more stable medical portion of the business. The company has continued delivering favorable results, which in turn has led to further multiple expansion.
The Fund’s overweight to the industrials sector contributed to the Fund’s relative performance as investors anticipated stronger economic tailwinds. The overweight was driven by favorable reward-to-risk valuation opportunities our process uncovered within the sector.
Detractors to performance included stock selection in health care and an overweight to consumer staples.
Stock selection in health care detracted from relative performance. Patterson Companies, Incorporated, is a distributor of dental and animal health products. The company has faced challenges primarily as a result of actions it took to break into the corporate account market, including restructuring its sales force, which subsequently led to lost market share. Talk of Amazon.com, Incorporated, entering the dental distribution market has also pressured the stock. We believe the current valuation reflects these concerns, and we are optimistic that the new management team should benefit the stock going forward.
The Fund’s overweight to the consumer staples sector detracted from relative performance. As investors preferred more economically sensitive stocks during the period, consumer staples stocks underperformed.
Please see footnotes on page 7.
| | | | | | |
| Performance highlights (unaudited) | | Wells Fargo Special Small Cap Value Fund | | | 9 | |
|
| Sector distribution as of March 31, 20187 |
|
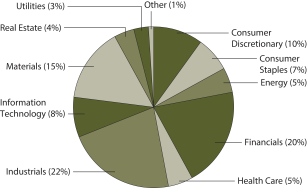 |
Our outlook is cautious yet confident.
As we look out over the next 12 months, we expect volatility to remain elevated. We believe it is prudent to protect the Fund’s downside risks as we look for investment opportunities to present themselves. We do not focus on forecasting future macroeconomic news and the short-term direction of the market. Through our bottom-up stock selection process, we focus on investing in companies that have the potential to generate strong cash flows and have the balance sheet flexibility to make intelligent investment decisions. In our view, this approach may better position our investments to reap outsized rewards relative to other stocks. Because of this disciplined investment process, we remain confident in our ability to navigate all economic environments over the long term.
Please see footnotes on page 7.
| | | | |
| 10 | | Wells Fargo Special Small Cap Value Fund | | Fund expenses (unaudited) |
As a shareholder of the Fund, you incur two types of costs: (1) transaction costs, including sales charges (loads) on purchase payments and contingent deferred sales charges (if any) on redemptions and (2) ongoing costs, including management fees, distribution (12b-1) and/or shareholder servicing fees, and other Fund expenses. This example is intended to help you understand your ongoing costs (in dollars) of investing in the Fund and to compare these costs with the ongoing costs of investing in other mutual funds.
The example is based on an investment of $1,000 invested at the beginning of the six-month period and held for the entire period from October 1, 2017 to March 31, 2018.
Actual expenses
The “Actual” line of the table below provides information about actual account values and actual expenses. You may use the information in this line, together with the amount you invested, to estimate the expenses that you paid over the period. Simply divide your account value by $1,000 (for example, an $8,600 account value divided by $1,000 = 8.6), then multiply the result by the number in the “Actual” line under the heading entitled “Expenses paid during period” for your applicable class of shares to estimate the expenses you paid on your account during this period.
Hypothetical example for comparison purposes
The “Hypothetical” line of the table below provides information about hypothetical account values and hypothetical expenses based on the Fund’s actual expense ratio and an assumed rate of return of 5% per year before expenses, which is not the Fund’s actual return. The hypothetical account values and expenses may not be used to estimate the actual ending account balance or expenses you paid for the period. You may use this information to compare the ongoing costs of investing in the Fund and other funds. To do so, compare this 5% hypothetical example with the 5% hypothetical examples that appear in the shareholder reports of the other funds.
Please note that the expenses shown in the table are meant to highlight your ongoing costs only and do not reflect any transactional costs, such as sales charges (loads) and contingent deferred sales charges. Therefore, the “Hypothetical” line of the table is useful in comparing ongoing costs only and will not help you determine the relative total costs of owning different funds. In addition, if these transactional costs were included, your costs would have been higher.
| | | | | | | | | | | | | | | | |
| | | Beginning
account value
10-1-2017 | | | Ending
account value
3-31-2018 | | | Expenses
paid during
the period¹ | | | Annualized net
expense ratio | |
Class A | | | | | | | | | | | | | | | | |
Actual | | $ | 1,000.00 | | | $ | 1,039.04 | | | $ | 6.65 | | | | 1.31 | % |
Hypothetical (5% return before expenses) | | $ | 1,000.00 | | | $ | 1,018.41 | | | $ | 6.58 | | | | 1.31 | % |
Class C | | | | | | | | | | | | | | | | |
Actual | | $ | 1,000.00 | | | $ | 1,035.24 | | | $ | 10.44 | | | | 2.06 | % |
Hypothetical (5% return before expenses) | | $ | 1,000.00 | | | $ | 1,014.67 | | | $ | 10.34 | | | | 2.06 | % |
Class R | | | | | | | | | | | | | | | | |
Actual | | $ | 1,000.00 | | | $ | 1,037.46 | | | $ | 7.93 | | | | 1.56 | % |
Hypothetical (5% return before expenses) | | $ | 1,000.00 | | | $ | 1,017.14 | | | $ | 7.85 | | | | 1.56 | % |
Class R6 | | | | | | | | | | | | | | | | |
Actual | | $ | 1,000.00 | | | $ | 1,041.15 | | | $ | 4.45 | | | | 0.88 | % |
Hypothetical (5% return before expenses) | | $ | 1,000.00 | | | $ | 1,020.57 | | | $ | 4.41 | | | | 0.88 | % |
Administrator Class | | | | | | | | | | | | | | | | |
Actual | | $ | 1,000.00 | | | $ | 1,039.43 | | | $ | 6.10 | | | | 1.20 | % |
Hypothetical (5% return before expenses) | | $ | 1,000.00 | | | $ | 1,018.95 | | | $ | 6.04 | | | | 1.20 | % |
Institutional Class | | | | | | | | | | | | | | | | |
Actual | | $ | 1,000.00 | | | $ | 1,040.83 | | | $ | 4.78 | | | | 0.94 | % |
Hypothetical (5% return before expenses) | | $ | 1,000.00 | | | $ | 1,020.24 | | | $ | 4.73 | | | | 0.94 | % |
| 1 | Expenses paid is equal to the annualized net expense ratio of each class multiplied by the average account value over the period, multiplied by the number of days in the most recent fiscal half-year divided by the number of days in the fiscal year (to reflect the one-half-year period). |
| | | | | | |
| Portfolio of investments—March 31, 2018 | | Wells Fargo Special Small Cap Value Fund | | | 11 | |
| | | | | | | | | | | | | | | | |
| Security name | | | | | | | | Shares | | | Value | |
| | | | |
Common Stocks: 92.77% | | | | | | | | | | | | | | | | |
| | | | |
Consumer Discretionary: 9.30% | | | | | | | | | | | | | | | | |
| | | | |
| Diversified Consumer Services: 0.12% | | | | | | | | | | | | | | | | |
Liberty Tax Incorporated « | | | | | | | | | | | 270,146 | | | $ | 2,728,475 | |
| | | | | | | | | | | | | | | | |
| | | | |
| Hotels, Restaurants & Leisure: 4.54% | | | | | | | | | | | | | | | | |
Denny’s Corporation † | | | | | | | | | | | 2,668,018 | | | | 41,167,518 | |
DineEquity Incorporated « | | | | | | | | | | | 532,400 | | | | 34,914,792 | |
The Wendy’s Company | | | | | | | | | | | 1,560,500 | | | | 27,386,775 | |
| | | | |
| | | | | | | | | | | | | | | 103,469,085 | |
| | | | | | | | | | | | | | | | |
| | | | |
| Household Durables: 1.40% | | | | | | | | | | | | | | | | |
Dixie Group Incorporated † | | | | | | | | | | | 706,635 | | | | 1,943,246 | |
Helen of Troy Limited † | | | | | | | | | | | 345,000 | | | | 30,015,000 | |
| | | | |
| | | | | | | | | | | | | | | 31,958,246 | |
| | | | | | | | | | | | | | | | |
| | | | |
| Media: 1.44% | | | | | | | | | | | | | | | | |
A.H. Belo Corporation Class A (l) | | | | | | | | | | | 1,423,589 | | | | 7,331,483 | |
Gannett Company Incorporated | | | | | | | | | | | 965,621 | | | | 9,636,898 | |
New Media Investment Group Incorporated | | | | | | | | | | | 923,143 | | | | 15,822,671 | |
| | | | |
| | | | | | | | | | | | | | | 32,791,052 | |
| | | | | | | | | | | | | | | | |
| | | | |
| Specialty Retail: 0.58% | | | | | | | | | | | | | | | | |
Christopher & Banks Corporation Ǡ | | | | | | | | | | | 1,070,348 | | | | 1,145,272 | |
Signet Jewelers Limited « | | | | | | | | | | | 88,300 | | | | 3,401,316 | |
The Buckle Incorporated « | | | | | | | | | | | 391,500 | | | | 8,671,725 | |
| | | | |
| | | | | | | | | | | | | | | 13,218,313 | |
| | | | | | | | | | | | | | | | |
| | | | |
| Textiles, Apparel & Luxury Goods: 1.22% | | | | | | | | | | | | | | | | |
Delta Apparel Incorporated †(l) | | | | | | | | | | | 459,492 | | | | 8,280,046 | |
Steven Madden Limited | | | | | | | | | | | 444,000 | | | | 19,491,600 | |
| | | | |
| | | | | | | | | | | | | | | 27,771,646 | |
| | | | | | | | | | | | | | | | |
| | | | |
Consumer Staples: 6.56% | | | | | | | | | | | | | | | | |
| | | | |
| Beverages: 0.82% | | | | | | | | | | | | | | | | |
Cott Corporation | | | | | | | | | | | 1,266,100 | | | | 18,636,992 | |
| | | | | | | | | | | | | | | | |
| | | | |
| Food & Staples Retailing: 0.29% | | | | | | | | | | | | | | | | |
SUPERVALU Incorporated Ǡ | | | | | | | | | | | 434,603 | | | | 6,619,004 | |
| | | | | | | | | | | | | | | | |
| | | | |
| Food Products: 2.31% | | | | | | | | | | | | | | | | |
Hostess Brands Incorporated † | | | | | | | | | | | 496,723 | | | | 7,346,533 | |
Nomad Foods Limited † | | | | | | | | | | | 1,987,424 | | | | 31,282,054 | |
TreeHouse Foods Incorporated † | | | | | | | | | | | 363,785 | | | | 13,922,052 | |
| | | | |
| | | | | | | | | | | | | | | 52,550,639 | |
| | | | | | | | | | | | | | | | |
The accompanying notes are an integral part of these financial statements.
| | | | |
| 12 | | Wells Fargo Special Small Cap Value Fund | | Portfolio of investments—March 31, 2018 |
| | | | | | | | | | | | | | | | |
| Security name | | | | | | | | Shares | | | Value | |
| | | | |
| Household Products: 3.14% | | | | | | | | | | | | | | | | |
Central Garden & Pet Company † | | | | | | | | | | | 553,580 | | | $ | 23,803,940 | |
Central Garden & Pet Company Class A † | | | | | | | | | | | 53,900 | | | | 2,134,979 | |
HRG Group Incorporated † | | | | | | | | | | | 2,772,300 | | | | 45,715,227 | |
| | | | |
| | | | | | | | | | | | | | | 71,654,146 | |
| | | | | | | | | | | | | | | | |
| | | | |
Energy: 4.95% | | | | | | | | | | | | | | | | |
| | | | |
| Energy Equipment & Services: 2.64% | | | | | | | | | | | | | | | | |
C&J Energy Services Incorporated † | | | | | | | | | | | 505,900 | | | | 13,062,338 | |
Forum Energy Technologies Incorporated † | | | | | | | | | | | 116,600 | | | | 1,282,600 | |
Frank’s International NV « | | | | | | | | | | | 526,243 | | | | 2,857,499 | |
Oil States International Incorporated † | | | | | | | | | | | 493,000 | | | | 12,916,600 | |
Patterson-UTI Energy Incorporated | | | | | | | | | | | 1,046,700 | | | | 18,327,717 | |
Tetra Technologies Incorporated † | | | | | | | | | | | 2,248,700 | | | | 8,432,625 | |
US Silica Holdings Incorporated « | | | | | | | | | | | 130,200 | | | | 3,322,704 | |
| | | | |
| | | | | | | | | | | | | | | 60,202,083 | |
| | | | | | | | | | | | | | | | |
| | | | |
| Oil, Gas & Consumable Fuels: 2.31% | | | | | | | | | | | | | | | | |
Laredo Petroleum Incorporated † | | | | | | | | | | | 822,300 | | | | 7,162,233 | |
QEP Resources Incorporated † | | | | | | | | | | | 1,391,300 | | | | 13,620,827 | |
WPX Energy Incorporated † | | | | | | | | | | | 2,153,968 | | | | 31,835,647 | |
| | | | |
| | | | | | | | | | | | | | | 52,618,707 | |
| | | | | | | | | | | | | | | | |
| | | | |
Financials: 18.38% | | | | | | | | | | | | | | | | |
| | | | |
| Banks: 10.13% | | | | | | | | | | | | | | | | |
Associated Banc Corporation | | | | | | | | | | | 1,257,800 | | | | 31,256,330 | |
First Citizens BancShares Corporation Class A | | | | | | | | | | | 132,550 | | | | 54,774,962 | |
Hancock Holding Company | | | | | | | | | | | 587,800 | | | | 30,389,260 | |
IBERIABANK Corporation | | | | | | | | | | | 288,400 | | | | 22,495,200 | |
Renasant Corporation | | | | | | | | | | | 834,868 | | | | 35,531,982 | |
South State Corporation | | | | | | | | | | | 86,700 | | | | 7,395,510 | |
UMB Financial Corporation | | | | | | | | | | | 677,386 | | | | 49,035,973 | |
| | | | |
| | | | | | | | | | | | | | | 230,879,217 | |
| | | | | | | | | | | | | | | | |
| | | | |
| Capital Markets: 3.21% | | | | | | | | | | | | | | | | |
Apollo Investment Corporation | | | | | | | | | | | 2,343,416 | | | | 12,232,632 | |
Artisan Partners Asset Management Incorporated Class A | | | | | | | | | | | 762,301 | | | | 25,384,623 | |
New Mountain Finance Corporation | | | | | | | | | | | 1,009,500 | | | | 13,274,925 | |
Westwood Holdings Group Incorporated | | | | | | | | | | | 394,885 | | | | 22,307,054 | |
| | | | |
| | | | | | | | | | | | | | | 73,199,234 | |
| | | | | | | | | | | | | | | | |
| | | | |
| Insurance: 4.31% | | | | | | | | | | | | | | | | |
Aspen Insurance Holdings Limited | | | | | | | | | | | 475,500 | | | | 21,326,175 | |
ProAssurance Corporation | | | | | | | | | | | 575,394 | | | | 27,935,379 | |
Stewart Information Services Corporation | | | | | | | | | | | 573,607 | | | | 25,204,292 | |
Validus Holdings Limited | | | | | | | | | | | 351,400 | | | | 23,701,930 | |
| | | | |
| | | | | | | | | | | | | | | 98,167,776 | |
| | | | | | | | | | | | | | | | |
The accompanying notes are an integral part of these financial statements.
| | | | | | |
| Portfolio of investments—March 31, 2018 | | Wells Fargo Special Small Cap Value Fund | | | 13 | |
| | | | | | | | | | | | | | | | |
| Security name | | | | | | | | Shares | | | Value | |
| | | | |
| Mortgage REITs: 0.73% | | | | | | | | | | | | | | | | |
Apollo Commercial Real Estate Finance Incorporated « | | | | | | | | | | | 917,937 | | | $ | 16,504,507 | |
| | | | | | | | | | | | | | | | |
| | | | |
Health Care: 4.18% | | | | | | | | | | | | | | | | |
| | | | |
| Health Care Equipment & Supplies: 2.19% | | | | | | | | | | | | | | | | |
Analogic Corporation | | | | | | | | | | | 377,099 | | | | 36,163,794 | |
Haemonetics Corporation † | | | | | | | | | | | 187,400 | | | | 13,710,184 | |
| | | | |
| | | | | | | | | | | | | | | 49,873,978 | |
| | | | | | | | | | | | | | | | |
| | | | |
| Health Care Providers & Services: 0.63% | | | | | | | | | | | | | | | | |
Patterson Companies Incorporated « | | | | | | | | | | | 645,600 | | | | 14,351,688 | |
| | | | | | | | | | | | | | | | |
| | | | |
| Pharmaceuticals: 1.36% | | | | | | | | | | | | | | | | |
Innoviva Incorporated † | | | | | | | | | | | 682,302 | | | | 11,373,974 | |
Prestige Brands Holdings Incorporated † | | | | | | | | | | | 579,300 | | | | 19,533,996 | |
| | | | |
| | | | | | | | | | | | | | | 30,907,970 | |
| | | | | | | | | | | | | | | | |
| | | | |
Industrials: 20.87% | | | | | | | | | | | | | | | | |
| | | | |
| Building Products: 4.10% | | | | | | | | | | | | | | | | |
CSW Industrials Incorporated † | | | | | | | | | | | 664,244 | | | | 29,924,192 | |
Griffon Corporation | | | | | | | | | | | 144,200 | | | | 2,631,650 | |
Quanex Building Products Corporation | | | | | | | | | | | 159,300 | | | | 2,771,820 | |
Simpson Manufacturing Company Incorporated | | | | | | | | | | | 1,009,195 | | | | 58,119,540 | |
| | | | |
| | | | | | | | | | | | | | | 93,447,202 | |
| | | | | | | | | | | | | | | | |
| | | | |
| Commercial Services & Supplies: 5.37% | | | | | | | | | | | | | | | | |
ACCO Brands Corporation | | | | | | | | | | | 1,462,211 | | | | 18,350,748 | |
Brady Corporation Class A | | | | | | | | | | | 634,874 | | | | 23,585,569 | |
Deluxe Corporation | | | | | | | | | | | 407,000 | | | | 30,122,070 | |
Ennis Incorporated (l) | | | | | | | | | | | 1,320,620 | | | | 26,016,214 | |
LSC Communications Incorporated | | | | | | | | | | | 290,962 | | | | 5,077,287 | |
Viad Corporation | | | | | | | | | | | 364,750 | | | | 19,131,138 | |
| | | | |
| | | | | | | | | | | | | | | 122,283,026 | |
| | | | | | | | | | | | | | | | |
| | | | |
| Electrical Equipment: 2.01% | | | | | | | | | | | | | | | | |
Atkore International Incorporated † | | | | | | | | | | | 968,492 | | | | 19,224,566 | |
EnerSys | | | | | | | | | | | 381,935 | | | | 26,494,831 | |
| | | | |
| | | | | | | | | | | | | | | 45,719,397 | |
| | | | | | | | | | | | | | | | |
| | | | |
| Machinery: 8.39% | | | | | | | | | | | | | | | | |
Douglas Dynamics Incorporated | | | | | | | | | | | 738,570 | | | | 32,017,010 | |
Franklin Electric Company Incorporated | | | | | | | | | | | 864,536 | | | | 35,229,842 | |
Global Brass & Copper Holdings Incorporated | | | | | | | | | | | 684,996 | | | | 22,913,116 | |
Hillenbrand Incorporated | | | | | | | | | | | 566,644 | | | | 26,008,960 | |
Kadant Incorporated | | | | | | | | | | | 270,278 | | | | 25,541,271 | |
Mueller Industries Incorporated | | | | | | | | | | | 1,663,573 | | | | 43,519,070 | |
NN Incorporated | | | | | | | | | | | 248,500 | | | | 5,964,000 | |
| | | | |
| | | | | | | | | | | | | | | 191,193,269 | |
| | | | | | | | | | | | | | | | |
The accompanying notes are an integral part of these financial statements.
| | | | |
| 14 | | Wells Fargo Special Small Cap Value Fund | | Portfolio of investments—March 31, 2018 |
| | | | | | | | | | | | | | | | |
| Security name | | | | | | | | Shares | | | Value | |
| | | | |
| Professional Services: 1.00% | | | | | | | | | | | | | | | | |
Korn/Ferry International | | | | | | | | | | | 443,732 | | | $ | 22,892,134 | |
| | | | | | | | | | | | | | | | |
| | | | |
Information Technology: 7.73% | | | | | | | | | | | | | | | | |
| | | | |
| Communications Equipment: 0.74% | | | | | | | | | | | | | | | | |
NETGEAR Incorporated † | | | | | | | | | | | 296,702 | | | | 16,971,354 | |
| | | | | | | | | | | | | | | | |
| | | | |
| Electronic Equipment, Instruments & Components: 4.53% | | | | | | | | | | | | | | | | |
AVX Corporation | | | | | | | | | | | 867,260 | | | | 14,353,153 | |
Badger Meter Incorporated | | | | | | | | | | | 168,395 | | | | 7,939,824 | |
Belden Incorporated | | | | | | | | | | | 520,400 | | | | 35,876,376 | |
Novanta Incorporated † | | | | | | | | | | | 521,145 | | | | 27,177,712 | |
Orbotech Limited † | | | | | | | | | | | 285,630 | | | | 17,760,473 | |
| | | | |
| | | | | | | | | | | | | | | 103,107,538 | |
| | | | | | | | | | | | | | | | |
| | | | |
| IT Services: 1.58% | | | | | | | | | | | | | | | | |
Conduent Incorporated † | | | | | | | | | | | 847,500 | | | | 15,797,400 | |
Sykes Enterprises Incorporated † | | | | | | | | | | | 696,400 | | | | 20,153,816 | |
| | | | |
| | | | | | | | | | | | | | | 35,951,216 | |
| | | | | | | | | | | | | | | | |
| | | | |
| Semiconductors & Semiconductor Equipment: 0.28% | | | | | | | | | | | | | | | | |
DSP Group Incorporated † | | | | | | | | | | | 533,415 | | | | 6,294,297 | |
| | | | | | | | | | | | | | | | |
| | | | |
| Technology Hardware, Storage & Peripherals: 0.60% | | | | | | | | | | | | | | | | |
Glassbridge Enterprises Incorporated Ǡ(l) | | | | | | | | | | | 305,221 | | | | 363,213 | |
NCR Corporation † | | | | | | | | | | | 422,300 | | | | 13,310,896 | |
| | | | |
| | | | | | | | | | | | | | | 13,674,109 | |
| | | | | | | | | | | | | | | | |
| | | | |
Materials: 14.47% | | | | | | | | | | | | | | | | |
| | | | |
| Chemicals: 7.18% | | | | | | | | | | | | | | | | |
A. Schulman Incorporated | | | | | | | | | | | 552,558 | | | | 23,759,994 | |
Innophos Holdings Incorporated | | | | | | | | | | | 103,500 | | | | 4,161,735 | |
Innospec Incorporated | | | | | | | | | | | 675,491 | | | | 46,338,683 | |
KMG Chemicals Incorporated | | | | | | | | | | | 488,626 | | | | 29,293,129 | |
PolyOne Corporation | | | | | | | | | | | 304,700 | | | | 12,955,844 | |
PQ Group Holdings Incorporated † | | | | | | | | | | | 591,073 | | | | 8,257,290 | |
Quaker Chemical Corporation | | | | | | | | | | | 100,690 | | | | 14,915,210 | |
Sensient Technologies Corporation | | | | | | | | | | | 339,800 | | | | 23,983,084 | |
| | | | |
| | | | | | | | | | | | | | | 163,664,969 | |
| | | | | | | | | | | | | | | | |
| | | | |
| Construction Materials: 1.88% | | | | | | | | | | | | | | | | |
Eagle Materials Incorporated | | | | | | | | | | | 416,600 | | | | 42,930,630 | |
| | | | | | | | | | | | | | | | |
| | | | |
| Containers & Packaging: 1.47% | | | | | | | | | | | | | | | | |
Silgan Holdings Incorporated | | | | | | | | | | | 1,200,542 | | | | 33,435,095 | |
| | | | | | | | | | | | | | | | |
| | | | |
| Metals & Mining: 0.79% | | | | | | | | | | | | | | | | |
Compass Minerals International Incorporated « | | | | | | | | | | | 299,600 | | | | 18,065,880 | |
| | | | | | | | | | | | | | | | |
The accompanying notes are an integral part of these financial statements.
| | | | | | |
| Portfolio of investments—March 31, 2018 | | Wells Fargo Special Small Cap Value Fund | | | 15 | |
| | | | | | | | | | | | | | | | |
| Security name | | | | | | | | Shares | | | Value | |
| | | | |
| Paper & Forest Products: 3.15% | | | | | | | | | | | | | | | | |
Neenah Paper Incorporated | | | | | | | | | | | 623,520 | | | $ | 48,883,968 | |
Schweitzer-Mauduit International Incorporated | | | | | | | | | | | 582,587 | | | | 22,808,281 | |
| | | | |
| | | | | | | | | | | | | | | 71,692,249 | |
| | | | | | | | | | | | | | | | |
| | | | |
Real Estate: 3.47% | | | | | | | | | | | | | | | | |
| | | | |
| Equity REITs: 3.47% | | | | | | | | | | | | | | | | |
Acadia Realty Trust | | | | | | | | | | | 304,300 | | | | 7,485,780 | |
Gramercy Property Trust Incorporated | | | | | | | | | | | 958,738 | | | | 20,833,377 | |
LaSalle Hotel Properties | | | | | | | | | | | 1,093,900 | | | | 31,734,039 | |
Washington REIT | | | | | | | | | | | 699,657 | | | | 19,100,636 | |
| | | | |
| | | | | | | | | | | | | | | 79,153,832 | |
| | | | | | | | | | | | | | | | |
| | | | |
Telecommunication Services: 0.24% | | | | | | | | | | | | | | | | |
| | | | |
| Diversified Telecommunication Services: 0.24% | | | | | | | | | | | | | | | | |
Consolidated Communications Holdings Incorporated « | | | | | | | | | | | 497,724 | | | | 5,455,055 | |
| | | | | | | | | | | | | | | | |
| | | | |
Utilities: 2.62% | | | | | | | | | | | | | | | | |
| | | | |
| Electric Utilities: 2.62% | | | | | | | | | | | | | | | | |
Hawaiian Electric Industries Incorporated | | | | | | | | | | | 1,157,354 | | | | 39,789,831 | |
IDACORP Incorporated | | | | | | | | | | | 226,400 | | | | 19,984,324 | |
| | | | |
| | | | | | | | | | | | | | | 59,774,155 | |
| | | | | | | | | | | | | | | | |
| | | | |
Total Common Stocks (Cost $1,837,400,512) | | | | | | | | | | | | | | | 2,113,808,165 | |
| | | | | | | | | | | | | | | | |
| | | | |
Exchange-Traded Funds: 0.70% | | | | | | | | | | | | | | | | |
iShares Russell 2000 Value Index ETF « | | | | | | | | | | | 130,700 | | | | 15,929,716 | |
| | | | | | | | | | | | | | | | |
| | | | |
Total Exchange-Traded Funds (Cost $16,581,325) | | | | | | | | | | | | | | | 15,929,716 | |
| | | | | | | | | | | | | | | | |
| | | | |
| | | Dividend yield | | | | | | | | | | |
| Preferred Stocks: 0.40% | | | | | | | | | | | | | | | | |
| | | | |
Financials: 0.40% | | | | | | | | | | | | | | | | |
| | | | |
| Diversified Financial Services: 0.40% | | | | | | | | | | | | | | | | |
Steel Partners Holdings LP « | | | 7.35 | % | | | | | | | 453,550 | | | | 9,256,956 | |
| | | | | | | | | | | | | | | | |
| | | | |
Total Preferred Stocks (Cost $11,398,218) | | | | | | | | | | | | | | | 9,256,956 | |
| | | | | | | | | | | | | | | | |
| | | | |
| | | Yield | | | | | | | | | | |
| Short-Term Investments: 9.68% | | | | | | | | | | | | | | | | |
| | | | |
| Investment Companies: 9.68% | | | | | | | | | | | | | | | | |
Securities Lending Cash Investment LLC (l)(r)(u) | | | 1.89 | | | | | | | | 81,074,217 | | | | 81,082,324 | |
Wells Fargo Government Money Market Fund Select Class (l)(u) | | | 1.54 | | | | | | | | 139,485,748 | | | | 139,485,748 | |
| | | | |
Total Short-Term Investments (Cost $220,568,072) | | | | | | | | | | | | | | | 220,568,072 | |
| | | | | | | | | | | | | | | | |
| | | | | | | | |
| Total investments in securities (Cost $2,085,948,127) | | | 103.55 | % | | | 2,359,562,909 | |
Other assets and liabilities, net | | | (3.55 | ) | | | (80,992,754 | ) |
| | | | | | | | |
| Total net assets | | | 100.00 | % | | $ | 2,278,570,155 | |
| | | | | | | | |
The accompanying notes are an integral part of these financial statements.
| | | | |
| 16 | | Wells Fargo Special Small Cap Value Fund | | Portfolio of investments—March 31, 2018 |
| « | All or a portion of this security is on loan. |
| † | Non-income-earning security |
| (l) | The issuer of the security is an affiliated person of the Fund as defined in the Investment Company Act of 1940. |
| (r) | The investment is a non-registered investment company purchased with cash collateral received from securities on loan. |
| (u) | The rate represents the 7-day annualized yield at period end. |
Investments in Affiliates
An affiliated investment is an investment in which the Fund owns at least 5% of the outstanding voting shares of the issuer or as a result of other relationships, such as the Fund and the issuer having the same investment manager. Transactions with issuers that were either affiliated persons of the Fund at the beginning of the period or the end of the period were as follows:
| | | | | | | | | | | | | | | | | | | | | | | | | | | | | | | | | | | | |
| | | Shares,
beginning of
period | | | Shares
purchased | | | Shares sold | | | Shares, end of period | | | Net
realized
gains
(losses) | | | Net change in
unrealized
gains (losses) | | | Income from
affiliated
securities | | | Value, end of period | | | % of
net
assets | |
Common Stocks | | | | | | | | | | | | | | | | | | | | | | | | | | | | | | | | | | | | |
Consumer Discretionary | | | | | | | | | | | | | | | | | | | | | | | | | | | | | | | | | | | | |
Media | | | | | | | | | | | | | | | | | | | | | | | | | | | | | | | | | | | | |
A.H. Belo Corporation Class A | | | 1,289,840 | | | | 133,749 | | | | 0 | | | | 1,423,589 | | | $ | 0 | | | $ | (1,270,591 | ) | | $ | 606,830 | | | $ | 7,331,483 | | | | | |
Textiles, Apparel & Luxury Goods | | | | | | | | | | | | | | | | | | | | | | | | | | | | | | | | | | | | |
Delta Apparel Incorporated | | | 440,392 | | | | 19,100 | | | | 0 | | | | 459,492 | | | | 0 | | | | 141,162 | | | | 0 | | | | 8,280,046 | | | | | |
Industrials | | | | | | | | | | | | | | | | | | | | | | | | | | | | | | | | | | | | |
Commercial Services & Supplies | | | | | | | | | | | | | | | | | | | | | | | | | | | | | | | | | | | | |
Ennis Incorporated | | | 1,285,320 | | | | 38,100 | | | | 2,800 | | | | 1,320,620 | | | | (1,684 | ) | | | 3,482,684 | | | | 1,136,732 | | | | 26,016,214 | | | | | |
Information Technology | | | | | | | | | | | | | | | | | | | | | | | | | | | | | | | | | | | | |
Technology Hardware, Storage & Peripherals | | | | | | | | | | | | | | | | | | | | | | | | | | | | | | | | | | | | |
Glassbridge Enterprises Incorporated | | | 305,221 | | | | 0 | | | | 0 | | | | 305,221 | | | | 0 | | | | (1,107,952 | ) | | | 0 | | | | 363,213 | | | | | |
| | | | | | | | | |
| | | | | | | | | | | | | | | | | | | | | | | | | | | | | | | 41,990,956 | | | | 1.84 | % |
| | | | | | | | | | | | | | | | | | | | | | | | | | | | | | | | | | | | |
Short-Term Investments | | | | | | | | | | | | | | | | | | | | | | | | | | | | | | | | | | | | |
Investment Companies | | | | | | | | | | | | | | | | | | | | | | | | | | | | | | | | | | | | |
Securities Lending Cash Investment LLC | | | 48,035,648 | | | | 495,342,880 | | | | 462,304,311 | | | | 81,074,217 | | | | 3,062 | | | | (3,156 | ) | | | 448,448 | | | | 81,082,324 | | | | | |
Wells Fargo Government Money Market Fund Select Class | | | 129,441,277 | | | | 523,651,403 | | | | 513,606,932 | | | | 139,485,748 | | | | 0 | | | | 0 | | | | 1,306,233 | | | | 139,485,748 | | | | | |
| | | | | | | | | |
| | | | | | | | | | | | | | | | | | | | | | | | | | | | | | | 220,568,072 | | | | 9.68 | |
| | | | | | | | | | | | | | | | | | | | | | | | | | | | | | | | | | | | |
| | | | | | | | | | | | | | | | | | $ | 1,378 | | | $ | 1,242,147 | | | $ | 3,498,243 | | | $ | 262,559,028 | | | | 11.52 | % |
| | | | | | | | | | | | | | | | | | | | | | | | | | | | | | | | | | | | |
The accompanying notes are an integral part of these financial statements.
| | | | | | |
| Statement of assets and liabilities—March 31, 2018 | | Wells Fargo Special Small Cap Value Fund | | | 17 | |
| | | | |
| | | | |
| |
Assets | | | | |
Investments in unaffiliated securities (including $79,625,229 of securities loaned), at value (cost $1,799,010,843) | | $ | 2,097,003,881 | |
Investments in affiliated securities, at value (cost $286,937,284) | | | 262,559,028 | |
Receivable for investments sold | | | 6,721,235 | |
Receivable for Fund shares sold | | | 8,807,113 | |
Receivable for dividends | | | 3,553,932 | |
Receivable for securities lending income | | | 55,979 | |
Prepaid expenses and other assets | | | 143,328 | |
| | | | |
Total assets | | | 2,378,844,496 | |
| | | | |
| |
Liabilities | | | | |
Payable upon receipt of securities loaned | | | 81,066,778 | |
Payable for investments purchased | | | 10,210,530 | |
Payable for Fund shares redeemed | | | 6,504,263 | |
Management fee payable | | | 1,476,904 | |
Due to custodian bank | | | 347,187 | |
Administration fees payable | | | 278,711 | |
Distribution fees payable | | | 36,133 | |
Trustees’ fees and expenses payable | | | 2,435 | |
Accrued expenses and other liabilities | | | 351,400 | |
| | | | |
Total liabilities | | | 100,274,341 | |
| | | | |
Total net assets | | $ | 2,278,570,155 | |
| | | | |
| |
NET ASSETS CONSIST OF | | | | |
Paid-in capital | | $ | 1,920,374,104 | |
Undistributed net investment income | | | 3,571,012 | |
Accumulated net realized gains on investments | | | 81,010,257 | |
Net unrealized gains on investments | | | 273,614,782 | |
| | | | |
Total net assets | | $ | 2,278,570,155 | |
| | | | |
| |
COMPUTATION OF NET ASSET VALUE AND OFFERING PRICE PER SHARE | | | | |
Net assets – Class A | | $ | 539,499,299 | |
Shares outstanding – Class A1 | | | 15,675,943 | |
Net asset value per share – Class A | | | $34.42 | |
Maximum offering price per share – Class A2 | | | $36.52 | |
Net assets – Class C | | $ | 53,145,322 | |
Shares outstanding – Class C1 | | | 1,703,043 | |
Net asset value per share – Class C | | | $31.21 | |
Net assets – Class R | | $ | 4,631,310 | |
Shares outstanding – Class R1 | | | 132,543 | |
Net asset value per share – Class R | | | $34.94 | |
Net assets – Class R6 | | $ | 254,800,964 | |
Shares outstanding – Class R61 | | | 7,227,398 | |
Net asset value per share – Class R6 | | | $35.25 | |
Net assets – Administrator Class | | $ | 229,991,912 | |
Shares outstanding – Administrator Class1 | | | 6,529,700 | |
Net asset value per share – Administrator Class | | | $35.22 | |
Net assets – Institutional Class | | $ | 1,196,501,348 | |
Shares outstanding – Institutional Class1 | | | 33,925,862 | |
Net asset value per share – Institutional Class | | | $35.27 | |
| 1 | The Fund has an unlimited number of authorized shares. |
| 2 | Maximum offering price is computed as 100/94.25 of net asset value. On investments of $50,000 or more, the offering price is reduced. |
The accompanying notes are an integral part of these financial statements.
| | | | |
| 18 | | Wells Fargo Special Small Cap Value Fund | | Statement of operations—year ended March 31, 2018 |
| | | | |
| | | | |
| |
Investment income | | | | |
Dividends (net of foreign withholding taxes of $45,241) | | $ | 37,592,403 | |
Income from affiliated securities | | | 3,498,243 | |
Interest | | | 5,242 | |
| | | | |
Total investment income | | | 41,095,888 | |
| | | | |
| |
Expenses | | | | |
Management fee | | | 17,074,220 | |
Administration fees | | | | |
Class A | | | 1,171,392 | |
Class B | | | 42 | 1 |
Class C | | | 117,162 | |
Class R | | | 5,438 | |
Class R6 | | | 67,286 | |
Administrator Class | | | 270,039 | |
Institutional Class | | | 1,355,565 | |
Shareholder servicing fees | | | | |
Class A | | | 1,394,515 | |
Class B | | | 50 | 1 |
Class C | | | 139,479 | |
Class R | | | 6,473 | |
Administrator Class | | | 516,263 | |
Distribution fees | | | | |
Class B | | | 151 | 1 |
Class C | | | 418,438 | |
Class R | | | 6,473 | |
Custody and accounting fees | | | 99,469 | |
Professional fees | | | 73,435 | |
Registration fees | | | 268,709 | |
Shareholder report expenses | | | 216,654 | |
Trustees’ fees and expenses | | | 21,590 | |
Other fees and expenses | | | 39,450 | |
| | | | |
Total expenses | | | 23,262,293 | |
Less: Fee waivers and/or expense reimbursements | | | (524,536 | ) |
| | | | |
Net expenses | | | 22,737,757 | |
| | | | |
Net investment income | | | 18,358,131 | |
| | | | |
| |
REALIZED AND UNREALIZED GAINS (LOSSES) ON INVESTMENTS | | | | |
| |
Net realized gains on: | | | | |
Unaffiliated securities | | | 147,677,516 | |
Affiliated securities | | | 1,378 | |
Futures contracts | | | 596,919 | |
| | | | |
Net realized gains on investments | | | 148,275,813 | |
| | | | |
| |
Net change in unrealized gains (losses) on: | | | | |
Unaffiliated securities | | | 20,125,355 | |
Affiliated securities | | | 1,242,147 | |
| | | | |
Net change in unrealized gains (losses) on investments | | | 21,367,502 | |
| | | | |
Net realized and unrealized gains (losses) on investments | | | 169,643,315 | |
| | | | |
Net increase in net assets resulting from operations | | $ | 188,001,446 | |
| | | | |
| 1 | For the period from April 1, 2017 to May 5, 2017. Effective at the close of business on May 5, 2017, Class B shares were converted to Class A shares and are no longer offered by the Fund. |
The accompanying notes are an integral part of these financial statements.
| | | | | | |
| Statement of changes in net assets | | Wells Fargo Special Small Cap Value Fund | | | 19 | |
| | | | | | | | | | | | | | | | |
| | | Year ended
March 31, 2018 | | | Year ended
March 31, 2017 | |
| | | | |
Operations | | | | | | | | | | | | | | | | |
Net investment income | | | | | | $ | 18,358,131 | | | | | | | $ | 18,930,061 | |
Net realized gains on investments | | | | | | | 148,275,813 | | | | | | | | 56,938,105 | |
Net change in unrealized gains (losses) on investments | | | | | | | 21,367,502 | | | | | | | | 180,498,414 | |
| | | | |
Net increase in net assets resulting from operations | | | | | | | 188,001,446 | | | | | | | | 256,366,580 | |
| | | | |
| | | | |
Distributions to shareholders from | | | | | | | | | | | | | | | | |
Net investment income | | | | | | | | | | | | | | | | |
Class A | | | | | | | (5,156,558 | ) | | | | | | | (3,100,647 | ) |
Class C | | | | | | | (80,902 | ) | | | | | | | 0 | |
Class R | | | | | | | (28,233 | ) | | | | | | | (1,857 | ) |
Class R6 | | | | | | | (3,491,795 | ) | | | | | | | (1,263,592 | ) |
Administrator Class | | | | | | | (2,253,608 | ) | | | | | | | (1,252,758 | ) |
Institutional Class | | | | | | | (14,206,922 | ) | | | | | | | (4,942,668 | ) |
Net realized gains | | | | | | | | | | | | | | | | |
Class A | | | | | | | (23,767,259 | ) | | | | | | | (9,755,571 | ) |
Class B | | | | | | | 0 | 1 | | | | | | | (14,723 | ) |
Class C | | | | | | | (2,620,489 | ) | | | | | | | (1,021,360 | ) |
Class R | | | | | | | (123,012 | ) | | | | | | | (4,214 | ) |
Class R6 | | | | | | | (10,469,298 | ) | | | | | | | (2,330,686 | ) |
Administrator Class | | | | | | | (8,842,873 | ) | | | | | | | (3,021,363 | ) |
Institutional Class | | | | | | | (45,129,294 | ) | | | | | | | (9,439,217 | ) |
| | | | |
Total distributions to shareholders | | | | | | | (116,170,243 | ) | | | | | | | (36,148,656 | ) |
| | | | |
| | | | |
Capital share transactions | | | Shares | | | | | | | | Shares | | | | | |
Proceeds from shares sold | | | | | | | | | | | | | | | | |
Class A | | | 2,772,875 | | | | 94,731,826 | | | | 6,332,575 | | | | 198,916,138 | |
Class B | | | 0 | 1 | | | 0 | 1 | | | 753 | | | | 22,742 | |
Class C | | | 191,743 | | | | 5,942,942 | | | | 671,919 | | | | 19,355,935 | |
Class R | | | 122,899 | | | | 4,239,675 | | | | 23,263 | | | | 763,546 | |
Class R6 | | | 4,147,795 | | | | 146,057,838 | | | | 4,344,349 | | | | 138,461,632 | |
Administrator Class | | | 2,707,738 | | | | 94,110,194 | | | | 4,235,478 | | | | 132,626,330 | |
Institutional Class | | | 15,040,023 | | | | 526,877,607 | | | | 23,307,034 | | | | 756,707,717 | |
| | | | |
| | | | | | | 871,960,082 | | | | | | | | 1,246,854,040 | |
| | | | |
Reinvestment of distributions | | | | | | | | | | | | | | | | |
Class A | | | 772,732 | | | | 26,881,022 | | | | 368,285 | | | | 12,346,246 | |
Class B | | | 0 | 1 | | | 0 | 1 | | | 435 | | | | 13,247 | |
Class C | | | 82,534 | | | | 2,591,651 | | | | 29,455 | | | | 902,197 | |
Class R | | | 4,226 | | | | 149,401 | | | | 178 | | | | 6,071 | |
Class R6 | | | 360,421 | | | | 12,863,108 | | | | 104,957 | | | | 3,594,278 | |
Administrator Class | | | 304,887 | | | | 10,860,280 | | | | 122,938 | | | | 4,212,480 | |
Institutional Class | | | 1,252,402 | | | | 44,708,634 | | | | 352,682 | | | | 12,086,229 | |
| | | | |
| | | | | | | 98,054,096 | | | | | | | | 33,160,748 | |
| | | | |
Payment for shares redeemed | | | | | | | | | | | | | | | | |
Class A | | | (5,222,764 | ) | | | (178,462,050 | ) | | | (4,570,348 | ) | | | (144,377,311 | ) |
Class B | | | (11,387 | )1 | | | (339,787 | )1 | | | (40,390 | ) | | | (1,132,998 | ) |
Class C | | | (568,844 | ) | | | (17,485,661 | ) | | | (320,882 | ) | | | (9,162,909 | ) |
Class R | | | (17,869 | ) | | | (617,184 | ) | | | (1,114 | ) | | | (37,538 | ) |
Class R6 | | | (2,479,153 | ) | | | (87,096,747 | ) | | | (548,575 | ) | | | (18,002,089 | ) |
Administrator Class | | | (2,360,366 | ) | | | (81,310,178 | ) | | | (1,872,525 | ) | | | (58,288,811 | ) |
Institutional Class | | | (9,522,751 | ) | | | (332,025,710 | ) | | | (5,644,752 | ) | | | (181,693,370 | ) |
| | | | |
| | | | | | | (697,337,317 | ) | | | | | | | (412,695,026 | ) |
| | | | |
Net increase in net assets resulting from capital share transactions | | | | | | | 272,676,861 | | | | | | | | 867,319,762 | |
| | | | |
Total increase in net assets | | | | | | | 344,508,064 | | | | | | | | 1,087,537,686 | |
| | | | |
| | | | |
Net assets | | | | | | | | | | | | | | | | |
Beginning of period | | | | | | | 1,934,062,091 | | | | | | | | 846,524,405 | |
| | | | |
End of period | | | | | | $ | 2,278,570,155 | | | | | | | $ | 1,934,062,091 | |
| | | | |
Undistributed net investment income | | | | | | $ | 3,571,012 | | | | | | | $ | 10,432,382 | |
| | | | |
| 1 | For the period from April 1, 2017 to May 5, 2017. Effective at the close of business on May 5, 2017, Class B shares were converted to Class A shares and are no longer offered by the Fund. |
The accompanying notes are an integral part of these financial statements.
| | | | |
| 20 | | Wells Fargo Special Small Cap Value Fund | | Financial highlights |
(For a share outstanding throughout each period)
| | | | | | | | | | | | | | | | | | | | | | | | |
| | | Year ended March 31 | | | Year ended
October 31, 2013 | |
| CLASS A | | 2018 | | | 2017 | | | 2016 | | | 2015 | | | 20141 | | |
Net asset value, beginning of period | | | $33.15 | | | | $27.40 | | | | $29.27 | | | | $32.59 | | | | $31.35 | | | | $22.97 | |
Net investment income | | | 0.24 | | | | 0.35 | 2 | | | 0.20 | | | | 0.26 | | | | 0.10 | | | | 0.01 | 2 |
Net realized and unrealized gains (losses) on investments | | | 2.89 | | | | 6.15 | | | | (1.46 | ) | | | 1.81 | | | | 3.14 | | | | 8.37 | |
| | | | | | | | | | | | | | | | | | | | | | | | |
Total from investment operations | | | 3.13 | | | | 6.50 | | | | (1.26 | ) | | | 2.07 | | | | 3.24 | | | | 8.38 | |
Distributions to shareholders from | | | | | | | | | | | | | | | | | | | | | | | | |
Net investment income | | | (0.32 | ) | | | (0.18 | ) | | | (0.19 | ) | | | (0.21 | ) | | | (0.03 | ) | | | 0.00 | |
Net realized gains | | | (1.54 | ) | | | (0.57 | ) | | | (0.42 | ) | | | (5.18 | ) | | | (1.97 | ) | | | 0.00 | |
| | | | | | | | | | | | | | | | | | | | | | | | |
Total distributions to shareholders | | | (1.86 | ) | | | (0.75 | ) | | | (0.61 | ) | | | (5.39 | ) | | | (2.00 | ) | | | 0.00 | |
Net asset value, end of period | | | $34.42 | | | | $33.15 | | | | $27.40 | | | | $29.27 | | | | $32.59 | | | | $31.35 | |
Total return3 | | | 9.42 | % | | | 23.69 | % | | | (4.21 | )% | | | 7.56 | % | | | 10.74 | % | | | 36.48 | % |
Ratios to average net assets (annualized) | | | | | | | | | | | | | | | | | | | | | | | | |
Gross expenses | | | 1.31 | % | | | 1.32 | % | | | 1.36 | % | | | 1.39 | % | | | 1.41 | % | | | 1.40 | % |
Net expenses | | | 1.31 | % | | | 1.32 | % | | | 1.34 | % | | | 1.34 | % | | | 1.34 | % | | | 1.34 | % |
Net investment income | | | 0.66 | % | | | 1.14 | % | | | 0.73 | % | | | 0.90 | % | | | 0.75 | % | | | 0.04 | % |
Supplemental data | | | | | | | | | | | | | | | | | | | | | | | | |
Portfolio turnover rate | | | 41 | % | | | 51 | % | | | 46 | % | | | 79 | % | | | 37 | % | | | 65 | % |
Net assets, end of period (000s omitted) | | | $539,499 | | | | $575,269 | | | | $417,161 | | | | $448,980 | | | | $429,089 | | | | $409,557 | |
| 1 | For the five months ended March 31, 2014. The Fund changed its fiscal year end from October 31 to March 31, effective March 31, 2014. |
| 2 | Calculated based upon average shares outstanding |
| 3 | Total return calculations do not include any sales charges. Returns for periods of less than one year are not annualized. |
The accompanying notes are an integral part of these financial statements.
| | | | | | |
| Financial highlights | | Wells Fargo Special Small Cap Value Fund | | | 21 | |
(For a share outstanding throughout each period)
| | | | | | | | | | | | | | | | | | | | | | | | |
| | | Year ended March 31 | | | Year ended
October 31, 2013 | |
| CLASS C | | 2018 | | | 2017 | | | 2016 | | | 2015 | | | 20141 | | |
Net asset value, beginning of period | | | $30.19 | | | | $25.05 | | | | $26.81 | | | | $30.31 | | | | $29.34 | | | | $21.66 | |
Net investment income (loss) | | | (0.03 | )2 | | | 0.12 | 2 | | | (0.03 | ) | | | 0.04 | 2 | | | 0.00 | 2,3 | | | (0.18 | )2 |
Net realized and unrealized gains (losses) on investments | | | 2.64 | | | | 5.59 | | | | (1.31 | ) | | | 1.65 | | | | 2.94 | | | | 7.86 | |
| | | | | | | | | | | | | | | | | | | | | | | | |
Total from investment operations | | | 2.61 | | | | 5.71 | | | | (1.34 | ) | | | 1.69 | | | | 2.94 | | | | 7.68 | |
Distributions to shareholders from | | | | | | | | | | | | | | | | | | | | | | | | |
Net investment income | | | (0.05 | ) | | | 0.00 | | | | 0.00 | | | | (0.01 | ) | | | 0.00 | | | | 0.00 | |
Net realized gains | | | (1.54 | ) | | | (0.57 | ) | | | (0.42 | ) | | | (5.18 | ) | | | (1.97 | ) | | | 0.00 | |
| | | | | | | | | | | | | | | | | | | | | | | | |
Total distributions to shareholders | | | (1.59 | ) | | | (0.57 | ) | | | (0.42 | ) | | | (5.19 | ) | | | (1.97 | ) | | | 0.00 | |
Net asset value, end of period | | | $31.21 | | | | $30.19 | | | | $25.05 | | | | $26.81 | | | | $30.31 | | | | $29.34 | |
Total return4 | | | 8.60 | % | | | 22.75 | % | | | (4.93 | )% | | | 6.75 | % | | | 10.42 | % | | | 35.46 | % |
Ratios to average net assets (annualized) | | | | | | | | | | | | | | | | | | | | | | | | |
Gross expenses | | | 2.06 | % | | | 2.07 | % | | | 2.11 | % | | | 2.14 | % | | | 2.16 | % | | | 2.15 | % |
Net expenses | | | 2.06 | % | | | 2.07 | % | | | 2.09 | % | | | 2.09 | % | | | 2.09 | % | | | 2.09 | % |
Net investment income (loss) | | | (0.10 | )% | | | 0.42 | % | | | (0.02 | )% | | | 0.15 | % | | | 0.00 | % | | | (0.71 | )% |
Supplemental data | | | | | | | | | | | | | | | | | | | | | | | | |
Portfolio turnover rate | | | 41 | % | | | 51 | % | | | 46 | % | | | 79 | % | | | 37 | % | | | 65 | % |
Net assets, end of period (000s omitted) | | | $53,145 | | | | $60,309 | | | | $40,512 | | | | $44,327 | | | | $42,816 | | | | $39,620 | |
| 1 | For the five months ended March 31, 2014. The Fund changed its fiscal year end from October 31 to March 31, effective March 31, 2014. |
| 2 | Calculated based upon average shares outstanding |
| 3 | Amount is less than $0.005. |
| 4 | Total return calculations do not include any sales charges. Returns for periods of less than one year are not annualized. |
The accompanying notes are an integral part of these financial statements.
| | | | |
| 22 | | Wells Fargo Special Small Cap Value Fund | | Financial highlights |
(For a share outstanding throughout each period)
| | | | | | | | | | | | |
| | | Year ended March 31 | |
| CLASS R | | 2018 | | | 2017 | | | 20161 | |
Net asset value, beginning of period | | | $33.73 | | | | $27.97 | | | | $26.72 | |
Net investment income | | | 0.17 | | | | 0.63 | 2 | | | 0.08 | 2 |
Net realized and unrealized gains (losses) on investments | | | 2.92 | | | | 5.94 | | | | 1.87 | |
| | | | | | | | | | | | |
Total from investment operations | | | 3.09 | | | | 6.57 | | | | 1.95 | |
Distributions to shareholders from | | | | | | | | | | | | |
Net investment income | | | (0.34 | ) | | | (0.24 | ) | | | (0.28 | ) |
Net realized gains | | | (1.54 | ) | | | (0.57 | ) | | | (0.42 | ) |
| | | | | | | | | | | | |
Total distributions to shareholders | | | (1.88 | ) | | | (0.81 | ) | | | (0.70 | ) |
Net asset value, end of period | | | $34.94 | | | | $33.73 | | | | $27.97 | |
Total return3 | | | 9.13 | % | | | 23.47 | % | | | 7.40 | % |
Ratios to average net assets (annualized) | | | | | | | | | | | | |
Gross expenses | | | 1.57 | % | | | 1.56 | % | | | 1.59 | % |
Net expenses | | | 1.56 | % | | | 1.56 | % | | | 1.58 | % |
Net investment income | | | 0.43 | % | | | 1.86 | % | | | 0.56 | % |
Supplemental data | | | | | | | | | | | | |
Portfolio turnover rate | | | 41 | % | | | 51 | % | | | 46 | % |
Net assets, end of period (000s omitted) | | | $4,631 | | | | $785 | | | | $27 | |
| 1 | For the period from September 30, 2015 (commencement of class operations) to March 31, 2016. |
| 2 | Calculated based upon average shares outstanding |
| 3 | Returns for periods of less than one year are not annualized. |
The accompanying notes are an integral part of these financial statements.
| | | | | | |
| Financial highlights | | Wells Fargo Special Small Cap Value Fund | | | 23 | |
(For a share outstanding throughout each period)
| | | | | | | | | | | | | | | | |
| | | Year ended March 31 | |
| CLASS R6 | | 2018 | | | 2017 | | | 2016 | | | 20151 | |
Net asset value, beginning of period | | | $33.93 | | | | $28.01 | | | | $29.91 | | | | $33.38 | |
Net investment income | | | 0.38 | 2 | | | 0.61 | 2 | | | 0.39 | | | | 0.26 | 2 |
Net realized and unrealized gains (losses) on investments | | | 2.97 | | | | 6.18 | | | | (1.54 | ) | | | 1.80 | |
| | | | | | | | | | | | | | | | |
Total from investment operations | | | 3.35 | | | | 6.79 | | | | (1.15 | ) | | | 2.06 | |
Distributions to shareholders from | | | | | | | | | | | | | | | | |
Net investment income | | | (0.49 | ) | | | (0.30 | ) | | | (0.33 | ) | | | (0.35 | ) |
Net realized gains | | | (1.54 | ) | | | (0.57 | ) | | | (0.42 | ) | | | (5.18 | ) |
| | | | | | | | | | | | | | | | |
Total distributions to shareholders | | | (2.03 | ) | | | (0.87 | ) | | | (0.75 | ) | | | (5.53 | ) |
Net asset value, end of period | | | $35.25 | | | | $33.93 | | | | $28.01 | | | | $29.91 | |
Total return3 | | | 9.85 | % | | | 24.22 | % | | | (3.74 | )% | | | 7.42 | % |
Ratios to average net assets (annualized) | | | | | | | | | | | | | | | | |
Gross expenses | | | 0.88 | % | | | 0.89 | % | | | 0.93 | % | | | 0.89 | % |
Net expenses | | | 0.88 | % | | | 0.89 | % | | | 0.89 | % | | | 0.89 | % |
Net investment income | | | 1.10 | % | | | 1.87 | % | | | 1.56 | % | | | 2.19 | % |
Supplemental data | | | | | | | | | | | | | | | | |
Portfolio turnover rate | | | 41 | % | | | 51 | % | | | 46 | % | | | 79 | % |
Net assets, end of period (000s omitted) | | | $254,801 | | | | $176,362 | | | | $36,344 | | | | $27 | |
| 1 | For the period from October 31, 2014 (commencement of class operations) to March 31, 2015 |
| 2 | Calculated based upon average shares outstanding |
| 3 | Returns for periods of less than one year are not annualized. |
The accompanying notes are an integral part of these financial statements.
| | | | |
| 24 | | Wells Fargo Special Small Cap Value Fund | | Financial highlights |
(For a share outstanding throughout each period)
| | | | | | | | | | | | | | | | | | | | | | | | |
| | | Year ended March 31 | | | Year ended
October 31, 2013 | |
| ADMINISTRATOR CLASS | | 2018 | | | 2017 | | | 2016 | | | 2015 | | | 20141 | | |
Net asset value, beginning of period | | | $33.90 | | | | $28.02 | | | | $29.94 | | | | $33.21 | | | | $31.85 | | | | $23.28 | |
Net investment income | | | 0.27 | 2 | | | 0.44 | 2 | | | 0.26 | 2 | | | 0.35 | 2 | | | 0.14 | 2 | | | 0.08 | 2 |
Net realized and unrealized gains (losses) on investments | | | 2.97 | | | | 6.24 | | | | (1.49 | ) | | | 1.83 | | | | 3.21 | | | | 8.49 | |
| | | | | | | | | | | | | | | | | | | | | | | | |
Total from investment operations | | | 3.24 | | | | 6.68 | | | | (1.23 | ) | | | 2.18 | | | | 3.35 | | | | 8.57 | |
Distributions to shareholders from | | | | | | | | | | | | | | | | | | | | | | | | |
Net investment income | | | (0.38 | ) | | | (0.23 | ) | | | (0.27 | ) | | | (0.27 | ) | | | (0.02 | ) | | | (0.00 | )3 |
Net realized gains | | | (1.54 | ) | | | (0.57 | ) | | | (0.42 | ) | | | (5.18 | ) | | | (1.97 | ) | | | 0.00 | |
| | | | | | | | | | | | | | | | | | | | | | | | |
Total distributions to shareholders | | | (1.92 | ) | | | (0.80 | ) | | | (0.69 | ) | | | (5.45 | ) | | | (1.99 | ) | | | (0.00 | )3 |
Net asset value, end of period | | | $35.22 | | | | $33.90 | | | | $28.02 | | | | $29.94 | | | | $33.21 | | | | $31.85 | |
Total return4 | | | 9.52 | % | | | 23.82 | % | | | (4.01 | )% | | | 7.78 | % | | | 10.91 | % | | | 36.82 | % |
Ratios to average net assets (annualized) | | | | | | | | | | | | | | | | | | | | | | | | |
Gross expenses | | | 1.23 | % | | | 1.24 | % | | | 1.26 | % | | | 1.23 | % | | | 1.24 | % | | | 1.23 | % |
Net expenses | | | 1.20 | % | | | 1.20 | % | | | 1.17 | % | | | 1.09 | % | | | 1.09 | % | | | 1.09 | % |
Net investment income | | | 0.76 | % | | | 1.36 | % | | | 0.95 | % | | | 1.10 | % | | | 1.04 | % | | | 0.30 | % |
Supplemental data | | | | | | | | | | | | | | | | | | | | | | | | |
Portfolio turnover rate | | | 41 | % | | | 51 | % | | | 46 | % | | | 79 | % | | | 37 | % | | | 65 | % |
Net assets, end of period (000s omitted) | | | $229,992 | | | | $199,262 | | | | $95,030 | | | | $70,100 | | | | $78,563 | | | | $96,940 | |
| 1 | For the five months ended March 31, 2014. The Fund changed its fiscal year end from October 31 to March 31, effective March 31, 2014. |
| 2 | Calculated based upon average shares outstanding |
| 3 | Amount is less than $0.005. |
| 4 | Returns for periods of less than one year are not annualized. |
The accompanying notes are an integral part of these financial statements.
| | | | | | |
| Financial highlights | | Wells Fargo Special Small Cap Value Fund | | | 25 | |
(For a share outstanding throughout each period)
| | | | | | | | | | | | | | | | | | | | | | | | |
| | | Year ended March 31 | | | Year ended
October 31, 2013 | |
| INSTITUTIONAL CLASS | | 2018 | | | 2017 | | | 2016 | | | 2015 | | | 20141 | | |
Net asset value, beginning of period | | | $33.94 | | | | $28.03 | | | | $29.93 | | | | $33.21 | | | | $31.94 | | | | $23.36 | |
Net investment income | | | 0.33 | | | | 0.60 | 2 | | | 0.30 | | | | 0.43 | 2 | | | 0.15 | | | | 0.10 | |
Net realized and unrealized gains (losses) on investments | | | 3.01 | | | | 6.17 | | | | (1.46 | ) | | | 1.80 | | | | 3.22 | | | | 8.53 | |
| | | | | | | | | | | | | | | | | | | | | | | | |
Total from investment operations | | | 3.34 | | | | 6.77 | | | | (1.16 | ) | | | 2.23 | | | | 3.37 | | | | 8.63 | |
Distributions to shareholders from | | | | | | | | | | | | | | | | | | | | | | | | |
Net investment income | | | (0.47 | ) | | | (0.29 | ) | | | (0.32 | ) | | | (0.33 | ) | | | (0.13 | ) | | | (0.05 | ) |
Net realized gains | | | (1.54 | ) | | | (0.57 | ) | | | (0.42 | ) | | | (5.18 | ) | | | (1.97 | ) | | | 0.00 | |
| | | | | | | | | | | | | | | | | | | | | | | | |
Total distributions to shareholders | | | (2.01 | ) | | | (0.86 | ) | | | (0.74 | ) | | | (5.51 | ) | | | (2.10 | ) | | | (0.05 | ) |
Net asset value, end of period | | | $35.27 | | | | $33.94 | | | | $28.03 | | | | $29.93 | | | | $33.21 | | | | $31.94 | |
Total return3 | | | 9.82 | % | | | 24.13 | % | | | (3.79 | )% | | | 7.96 | % | | | 10.97 | % | | | 37.02 | % |
Ratios to average net assets (annualized) | | | | | | | | | | | | | | | | | | | | | | | | |
Gross expenses | | | 0.98 | % | | | 0.99 | % | | | 1.01 | % | | | 0.96 | % | | | 0.98 | % | | | 0.97 | % |
Net expenses | | | 0.94 | % | | | 0.94 | % | | | 0.94 | % | | | 0.94 | % | | | 0.94 | % | | | 0.94 | % |
Net investment income | | | 1.02 | % | | | 1.86 | % | | | 1.17 | % | | | 1.36 | % | | | 1.15 | % | | | 0.42 | % |
Supplemental data | | | | | | | | | | | | | | | | | | | | | | | | |
Portfolio turnover rate | | | 41 | % | | | 51 | % | | | 46 | % | | | 79 | % | | | 37 | % | | | 65 | % |
Net assets, end of period (000s omitted) | | | $1,196,501 | | | | $921,732 | | | | $256,190 | | | | $189,965 | | | | $146,162 | | | | $138,638 | |
| 1 | For the five months ended March 31, 2014. The Fund changed its fiscal year end from October 31 to March 31, effective March 31, 2014. |
| 2 | Calculated based upon average shares outstanding |
| 3 | Returns for periods of less than one year are not annualized. |
The accompanying notes are an integral part of these financial statements.
| | | | |
| 26 | | Wells Fargo Special Small Cap Value Fund | | Notes to financial statements |
1. ORGANIZATION
Wells Fargo Funds Trust (the “Trust”), a Delaware statutory trust organized on March 10, 1999, is an open-end management investment company registered under the Investment Company Act of 1940, as amended (the “1940 Act”). As an investment company, the Trust follows the accounting and reporting guidance in Financial Accounting Standards Board Accounting Standards Codification Topic 946, Financial Services – Investment Companies. These financial statements report on the Wells Fargo Special Small Cap Value Fund (the “Fund”) which is a diversified series of the Trust.
Effective at the close of business on May 5, 2017, Class B shares were converted to Class A shares and are no longer offered by the Fund. Information for Class B shares reflected in the financial statements represents activity through May 5, 2017.
2. SIGNIFICANT ACCOUNTING POLICIES
The following significant accounting policies, which are consistently followed in the preparation of the financial statements of the Fund, are in conformity with U.S. generally accepted accounting principles which require management to make estimates and assumptions that affect the reported amounts of assets and liabilities, disclosure of contingent assets and liabilities at the date of the financial statements, and the reported amounts of revenues and expenses during the reporting period. Actual results could differ from those estimates.
Securities valuation
All investments are valued each business day as of the close of regular trading on the New York Stock Exchange (generally 4 p.m. Eastern Time), although the Fund may deviate from this calculation time under unusual or unexpected circumstances.
Equity securities that are listed on a foreign or domestic exchange or market are valued at the official closing price or, if none, the last sales price. If no sale occurs on the principal exchange or market that day, a fair value price will be determined in accordance with the Fund’s Valuation Procedures.
Debt securities are valued at the evaluated bid price provided by an independent pricing service or, if a reliable price is not available, the quoted bid price from an independent broker-dealer.
Investments in registered open-end investment companies are valued at net asset value. Interests in non-registered investment companies that are redeemable at net asset value are fair valued normally at net asset value.
Investments which are not valued using any of the methods discussed above are valued at their fair value, as determined in good faith by the Board of Trustees of the Fund. The Board of Trustees has established a Valuation Committee comprised of the Trustees and has delegated to it the authority to take any actions regarding the valuation of portfolio securities that the Valuation Committee deems necessary or appropriate, including determining the fair value of portfolio securities, unless the determination has been delegated to the Wells Fargo Asset Management Pricing Committee at Wells Fargo Funds Management, LLC (“Funds Management”). The Board of Trustees retains the authority to make or ratify any valuation decisions or approve any changes to the Valuation Procedures as it deems appropriate. On a quarterly basis, the Board of Trustees receives reports on any valuation actions taken by the Valuation Committee or the Wells Fargo Asset Management Pricing Committee which may include items for ratification.
Valuations of fair valued securities are compared to the next actual sales price when available, or other appropriate market values, to assess the continued appropriateness of the fair valuation methodologies used. These securities are fair valued on a day-to-day basis, taking into consideration changes to appropriate market information and any significant changes to the inputs considered in the valuation process until there is a readily available price provided on an exchange or by an independent pricing service. Valuations received from an independent pricing service or independent broker-dealer quotes are periodically validated by comparisons to most recent trades and valuations provided by other independent pricing services in addition to the review of prices by the manager and/or subadviser. Unobservable inputs used in determining fair valuations are identified based on the type of security, taking into consideration factors utilized by market participants in valuing the investment, knowledge about the issuer and the current market environment.
Futures contracts
The Fund is subject to equity price risk in the normal course of pursuing its investment objectives. The Fund may buy and sell futures contracts in order to gain exposure to, or protect against, changes in security values rates. The primary risks associated with the use of futures contracts are the imperfect correlation between changes in market values of securities held by the Fund and the prices of futures contracts, and the possibility of an illiquid market.
The aggregate principal amounts of the contracts are not recorded in the financial statements. Fluctuations in the value of the contracts are recorded in the Statement of Assets and Liabilities as an asset or liability and in the Statement of Operations as unrealized gains or losses until the contracts are closed, at which point they are recorded as net realized gains or losses on futures contracts. With futures contracts, there is minimal counterparty risk to the Fund since futures are exchange traded and the exchange’s clearinghouse, as counterparty to all exchange traded futures, guarantees the futures against default.
| | | | | | |
| Notes to financial statements | | Wells Fargo Special Small Cap Value Fund | | | 27 | |
Securities lending
The Fund may lend its securities from time to time in order to earn additional income in the form of fees or interest on securities received as collateral or the investment of any cash received as collateral. The Fund continues to receive interest or dividends on the securities loaned. The Fund receives collateral in the form of cash or securities with a value at least equal to the value of the securities on loan. The value of the loaned securities is determined at the close of each business day and any additional required collateral is delivered to the Fund on the next business day. In a securities lending transaction, the net asset value of the Fund will be affected by an increase or decrease in the value of the securities loaned and by an increase or decrease in the value of the instrument in which collateral is invested. The amount of securities lending activity undertaken by the Fund fluctuates from time to time. In the event of default or bankruptcy by the borrower, the Fund may be prevented from recovering the loaned securities or gaining access to the collateral or may experience delays or costs in doing so. In addition, the investment of any cash collateral received may lose all or part of its value. The Fund has the right under the lending agreement to recover the securities from the borrower on demand.
The Fund lends its securities through an unaffiliated securities lending agent. Cash collateral received in connection with its securities lending transactions is invested in Securities Lending Cash Investments, LLC (the “Securities Lending Fund”). The Securities Lending Fund is exempt from registration under Section 3(c)(7) of the 1940 Act and is managed by Funds Management and is subadvised by Wells Capital Management Incorporated (“WellsCap”), an affiliate of Funds Management and an indirect wholly owned subsidiary of Wells Fargo & Company (“Wells Fargo”). Funds Management receives an advisory fee starting at 0.05% and declining to 0.01% as the average daily net assets of the Securities Lending Fund increase. All of the fees received by Funds Management are paid to WellsCap for its services as subadviser. The Securities Lending Fund seeks to provide a positive return compared to the daily Fed Funds Open Rate by investing in high-quality, U.S. dollar-denominated short-term money market instruments. Securities Lending Fund investments are valued at the evaluated bid price provided by an independent pricing service. Income earned from investment in the Securities Lending Fund, if any, is included in income from affiliated securities on the Statement of Operations.
Security transactions and income recognition
Securities transactions are recorded on a trade date basis. Realized gains or losses are recorded on the basis of identified cost.
Dividend income is recognized on the ex-dividend date. Dividend income is recorded net of foreign taxes withheld where recovery of such taxes is not assured.
Interest income is accrued daily and bond discounts are accreted and premiums are amortized daily. To the extent debt obligations are placed on non-accrual status, any related interest income may be reduced by writing off interest receivables when the collection of all or a portion of interest has been determined to be doubtful based on consistently applied procedures and the fair value has decreased. If the issuer subsequently resumes interest payments or when the collectability of interest is reasonably assured, the debt obligation is removed from non-accrual status.
Distributions to shareholders
Distributions to shareholders from net investment income and any net realized gains are recorded on the ex-dividend date and paid at least annually. Such distributions are determined in accordance with income tax regulations and may differ from U.S. generally accepted accounting principles. Dividend sources are estimated at the time of declaration. The tax character of distributions is determined as of the Fund’s fiscal year end. Therefore, a portion of the Fund’s distributions made prior to the Fund’s fiscal year end may be categorized as a tax return of capital at year end.
Federal and other taxes
The Fund intends to continue to qualify as a regulated investment company by distributing substantially all of its investment company taxable income and any net realized capital gains (after reduction for capital loss carryforwards) sufficient to relieve it from all, or substantially all, federal income taxes. Accordingly, no provision for federal income taxes was required.
The Fund’s income and federal excise tax returns and all financial records supporting those returns for the prior three fiscal years are subject to examination by the federal and Delaware revenue authorities. Management has analyzed the Fund’s tax positions taken on federal, state, and foreign tax returns for all open tax years and does not believe that there are any uncertain tax positions that require recognition of a tax liability.
As of March 31, 2018, the aggregate cost of all investments for federal income tax purposes was $2,092,829,498 and the unrealized gains (losses) consisted of:
| | | | |
Gross unrealized gains | | $ | 392,796,635 | |
Gross unrealized losses | | | (126,063,224 | ) |
Net unrealized gains | | $ | 266,733,411 | |
| | | | |
| 28 | | Wells Fargo Special Small Cap Value Fund | | Notes to financial statements |
Reclassifications are made to the Fund’s capital accounts for permanent tax differences to reflect income and gains available for distribution (or available capital loss carryforwards) under federal income tax regulations. U.S. generally accepted accounting principles require that certain components of net assets be adjusted to reflect permanent differences between financial and tax reporting. These reclassifications have no effect on net assets or net asset values per share. At March 31, 2018, as a result of permanent book-to-tax differences, the following reclassification adjustments were made on the Statement of Assets and Liabilities:
| | | | |
| Paid-in capital | | Undistributed net investment income | | Accumulated net realized gains on investments |
| $5 | | $(1,483) | | $1,478 |
Class allocations
The separate classes of shares offered by the Fund differ principally in applicable sales charges, distribution, shareholder servicing, and administration fees. Class specific expenses are charged directly to that share class. Investment income, common expenses, and realized and unrealized gains (losses) on investments are allocated daily to each class of shares based on the relative proportion of net assets of each class.
3. FAIR VALUATION MEASUREMENTS
Fair value measurements of investments are determined within a framework that has established a fair value hierarchy based upon the various data inputs utilized in determining the value of the Fund’s investments. The three-level hierarchy gives the highest priority to unadjusted quoted prices in active markets for identical assets or liabilities (Level 1) and the lowest priority to unobservable inputs (Level 3). The Fund’s investments are classified within the fair value hierarchy based on the lowest level of input that is significant to the fair value measurement. The inputs are summarized into three broad levels as follows:
| ∎ | | Level 1 – quoted prices in active markets for identical securities |
| ∎ | | Level 2 – other significant observable inputs (including quoted prices for similar securities, interest rates, prepayment speeds, credit risk, etc.) |
| ∎ | | Level 3 – significant unobservable inputs (including the Fund’s own assumptions in determining the fair value of investments) |
The inputs or methodologies used for valuing investments in securities are not necessarily an indication of the risk associated with investing in those securities.
| | | | | | |
| Notes to financial statements | | Wells Fargo Special Small Cap Value Fund | | | 29 | |
The following is a summary of the inputs used in valuing the Fund’s assets and liabilities as of March 31, 2018:
| | | | | | | | | | | | | | | | |
| | | Quoted prices (Level 1) | | | Other significant
observable inputs
(Level 2) | | | Significant
unobservable inputs (Level 3) | | | Total | |
Assets | | | | | | | | | | | | | | | | |
Investments in: | | | | | | | | | | | | | | | | |
| | | | |
Common stocks | | | | | | | | | | | | | | | | |
Consumer discretionary | | $ | 211,936,817 | | | $ | 0 | | | $ | 0 | | | $ | 211,936,817 | |
Consumer staples | | | 149,460,781 | | | | 0 | | | | 0 | | | | 149,460,781 | |
Energy | | | 112,820,790 | | | | 0 | | | | 0 | | | | 112,820,790 | |
Financials | | | 418,750,734 | | | | 0 | | | | 0 | | | | 418,750,734 | |
Health care | | | 95,133,636 | | | | 0 | | | | 0 | | | | 95,133,636 | |
Industrials | | | 475,535,028 | | | | 0 | | | | 0 | | | | 475,535,028 | |
Information technology | | | 175,998,514 | | | | 0 | | | | 0 | | | | 175,998,514 | |
Materials | | | 329,788,823 | | | | 0 | | | | 0 | | | | 329,788,823 | |
Real estate | | | 79,153,832 | | | | 0 | | | | 0 | | | | 79,153,832 | |
Telecommunication services | | | 5,455,055 | | | | 0 | | | | 0 | | | | 5,455,055 | |
Utilities | | | 59,774,155 | | | | 0 | | | | 0 | | | | 59,774,155 | |
| | | | |
Exchange-traded funds | | | 15,929,716 | | | | 0 | | | | 0 | | | | 15,929,716 | |
| | | | |
Preferred stocks | | | | | | | | | | | | | | | | |
Financials | | | 9,256,956 | | | | 0 | | | | 0 | | | | 9,256,956 | |
| | | | |
Short-term investments | | | | | | | | | | | | | | | | |
Investment companies | | | 139,485,748 | | | | 0 | | | | 0 | | | | 139,485,748 | |
Investments measured at net asset value* | | | | | | | | | | | | | | | 81,082,324 | |
Total assets | | $ | 2,278,480,585 | | | $ | 0 | | | $ | 0 | | | $ | 2,359,562,909 | |
| * | Investments that are measured at fair value using the net asset value per share (or its equivalent) as a practical expedient have not been categorized in the fair value hierarchy. The fair value amount presented in the table is intended to permit reconciliation of the fair value hierarchy to the amounts presented in the Statement of Assets and Liabilities. The Fund’s investment in Securities Lending Cash Investments, LLC valued at $81,082,324 does not have a redemption period notice, can be redeemed daily and does not have any unfunded commitments. |
The Fund recognizes transfers between levels within the fair value hierarchy at the end of the reporting period. At March 31, 2018, the Fund did not have any transfers into/out of Level 1, Level 2, or Level 3.
4. TRANSACTIONS WITH AFFILIATES
Management fee
Funds Management, an indirect wholly owned subsidiary of Wells Fargo, is the manager of the Fund and provides advisory and fund-level administrative services under an investment management agreement. Under the investment management agreement, Funds Management is responsible for, among other services, implementing the investment objectives and strategies of the Fund, supervising the subadviser, providing fund-level administrative services in connection with the Fund’s operations, and providing any other fund-level administrative services reasonably necessary for the operation of the Fund. As compensation for its services under the investment management agreement, Funds Management is entitled to receive an annual management fee starting at 0.85% and declining to 0.71% as the average daily net assets of the Fund increase. For the year ended March 31, 2018, the management fee was equivalent to an annual rate of 0.82% of the Fund’s average daily net assets.
Funds Management has retained the services of a subadviser to provide daily portfolio management to the Fund. The fee for subadvisory services is borne by Funds Management. WellsCap is the subadviser to the Fund and is entitled to receive a fee from Funds Management at an annual rate starting at 0.55% and declining to 0.40% as the average daily net assets of the Fund increase.
Administration fees
Under a class-level administration agreement, Funds Management provides class-level administrative services to the Fund, which includes paying fees and expenses for services provided by the transfer agent, sub-transfer agents, omnibus account
| | | | |
| 30 | | Wells Fargo Special Small Cap Value Fund | | Notes to financial statements |
servicers and record-keepers. As compensation for its services under the class-level administration agreement, Funds Management receives an annual fee which is calculated based on the average daily net assets of each class as follows:
| | | | |
| | | Class-level
administration fee | |
Class A, Class B, Class C, Class R | | | 0.21 | % |
Class R6 | | | 0.03 | |
Administrator Class, Institutional Class | | | 0.13 | |
Funds Management has contractually waived and/or reimbursed management and administration fees to the extent necessary to maintain certain net operating expense ratios for the Fund. Waiver of fees and/or reimbursement of expenses by Funds Management were made first from fund level expenses on a proportionate basis and then from class specific expenses. Funds Management has committed through July 31, 2018 to waive fees and/or reimburse expenses to the extent necessary to cap the Fund’s expenses at 1.34% for Class A shares, 2.09% for Class C shares, 1.59% for Class R shares, 0.89% for Class R6 shares, 1.20% for Administrator Class shares, and 0.94% for Institutional Class shares. After this time, the cap may be increased or the commitment to maintain the cap may be terminated only with the approval of the Board of Trustees.
Distribution fees
The Trust has adopted a distribution plan for Class B, Class C, and Class R shares of the Fund pursuant to Rule 12b-1 under the 1940 Act. Distribution fees are charged to Class B, Class C, and Class R shares and paid to Wells Fargo Funds Distributor, LLC (“Funds Distributor”), the principal underwriter, at an annual rate of 0.75% of the average daily net assets of Class B and Class C shares and 0.25% of the average daily net assets of Class R shares.
In addition, Funds Distributor is entitled to receive the front-end sales charge from the purchase of Class A shares and a contingent deferred sales charge on the redemption of certain Class A shares. Funds Distributor is also entitled to receive the contingent deferred sales charges from redemptions of Class C shares. For the year ended March 31, 2018, Funds Distributor received $26,549 from the sale of Class A shares and $89 in contingent deferred sales charges from redemptions of Class C shares, respectively. No contingent deferred sales charges were incurred by Class A and Class B shares for the year ended March 31, 2018.
Shareholder servicing fees
The Trust has entered into contracts with one or more shareholder servicing agents, whereby Class A, Class B, Class C, Class R, and Administrator Class of the Fund are charged a fee at an annual rate of 0.25% of the average daily net assets of each respective class.
A portion of these total shareholder servicing fees were paid to affiliates of Wells Fargo.
Interfund transactions
The Fund may purchase or sell portfolio investment securities to certain other Wells Fargo affiliates pursuant to Rule 17a-7 of the 1940 Act and under procedures adopted by the Board of Trustees. The procedures have been designed to ensure that these interfund transactions, which do not incur broker commissions, are effected at current market prices. Pursuant to these procedures, the Fund had $8,488,986 and $27,535,380 in interfund purchases and sales, respectively, during the year ended March 31, 2018.
5. INVESTMENT PORTFOLIO TRANSACTIONS
Purchases and sales of investments, excluding U.S. government obligations (if any) and short-term securities, for the year ended March 31, 2018 were $1,015,225,019 and $817,003,422, respectively.
6. DERIVATIVE TRANSACTIONS
During the year ended March 31, 2018, the Fund entered into futures contracts to gain market exposure. The Fund had an average notional amount of $7,409,729 in long futures contracts during the year ended March 31, 2018.
The fair value, realized gains or losses and change in unrealized gains or losses, if any, on derivative instruments are reflected in the corresponding financial statement captions.
| | | | | | |
| Notes to financial statements | | Wells Fargo Special Small Cap Value Fund | | | 31 | |
7. BANK BORROWINGS
The Trust (excluding the money market funds and certain other funds) and Wells Fargo Variable Trust are parties to a $280,000,000 revolving credit agreement whereby the Fund is permitted to use bank borrowings for temporary or emergency purposes, such as to fund shareholder redemption requests. Interest under the credit agreement is charged to the Fund based on a borrowing rate equal to the higher of the Federal Funds rate in effect on that day plus 1.25% or the overnight LIBOR rate in effect on that day plus 1.25%. In addition, an annual commitment fee equal to 0.25% of the unused balance is allocated to each participating fund. Prior to August 29, 2017, the revolving credit agreement amount was $250,000,000.
For the year ended March 31, 2018, there were no borrowings by the Fund under the agreement.
8. DISTRIBUTIONS TO SHAREHOLDERS
The tax character of distributions paid during the years ended March 31, 2018 and March 31, 2017 were as follows:
| | | | | | | | |
| | | Year ended March 31 | |
| | | 2018 | | | 2017 | |
Ordinary income | | $ | 55,288,780 | | | $ | 20,122,971 | |
Long-term capital gain | | | 60,881,463 | | | | 16,025,685 | |
As of March 31, 2018, the components of distributable earnings on a tax basis were as follows:
| | | | |
Undistributed ordinary income | | Undistributed long-term gain | | Unrealized gains |
| $15,701,431 | | $75,797,298 | | $266,733,411 |
9. INDEMNIFICATION
Under the Trust’s organizational documents, the officers and Trustees have been granted certain indemnification rights against certain liabilities that may arise out of performance of their duties to the Trust. Additionally, in the normal course of business, the Trust may enter into contracts with service providers that contain a variety of indemnification clauses. The Trust’s maximum exposure under these arrangements is dependent on future claims that may be made against the Fund and, therefore, cannot be estimated.
| | | | |
| 32 | | Wells Fargo Special Small Cap Value Fund | | Report of independent registered public accounting firm |
BOARD OF TRUSTEES AND SHAREHOLDERS OF WELLS FARGO FUNDS TRUST:
Opinion on the Financial Statements
We have audited the accompanying statement of assets and liabilities of the Wells Fargo Special Small Cap Value Fund (the “Fund”), one of the funds constituting the Wells Fargo Funds Trust, including the portfolio of investments, as of March 31, 2018, the related statement of operations for the year then ended, the statements of changes in net assets for each of the years in the two-year period then ended, and the related notes (collectively, the “financial statements”) and the financial highlights for each of the years in the four-year period then ended, the period from November 1, 2013 to March 31, 2014, and the year ended October 31, 2013. In our opinion, the financial statements and financial highlights present fairly, in all material respects, the financial position of the Fund as of March 31, 2018, the results of its operations for the year then ended, the changes in its net assets for each of the years in the two-year period then ended, and the financial highlights for each of the years or periods noted above, in conformity with U.S. generally accepted accounting principles.
Basis for Opinion
These financial statements and financial highlights are the responsibility of the Fund’s management. Our responsibility is to express an opinion on these financial statements and financial highlights based on our audits. We are a public accounting firm registered with the Public Company Accounting Oversight Board (United States) (“PCAOB”) and are required to be independent with respect to the Fund in accordance with the U.S. federal securities laws and the applicable rules and regulations of the Securities and Exchange Commission and the PCAOB.
We conducted our audits in accordance with the standards of the PCAOB. Those standards require that we plan and perform the audit to obtain reasonable assurance about whether the financial statements and financial highlights are free of material misstatement, whether due to error or fraud. Our audits included performing procedures to assess the risks of material misstatement of the financial statements and financial highlights, whether due to error or fraud, and performing procedures that respond to those risks. Such procedures included examining, on a test basis, evidence regarding the amounts and disclosures in the financial statements and financial highlights. Such procedures also included confirmation of securities owned as of March 31, 2018, by correspondence with the custodian and brokers, or by other appropriate auditing procedures. Our audits also included evaluating the accounting principles used and significant estimates made by management, as well as evaluating the overall presentation of the financial statements and financial highlights. We believe that our audits provide a reasonable basis for our opinion.

We have not been able to determine the specific year that we began serving as the auditor of one or more Wells Fargo Funds investment companies, however we are aware that we have served as the auditor of one or more Wells Fargo Funds investment companies since at least 1955.
Boston, Massachusetts
May 23, 2018
| | | | | | |
| Other information (unaudited) | | Wells Fargo Special Small Cap Value Fund | | | 33 | |
TAX INFORMATION
For corporate shareholders, pursuant to Section 854 of the Internal Revenue Code, 59.29% of ordinary income dividends qualify for the corporate dividends-received deduction for the fiscal year ended March 31, 2018.
Pursuant to Section 852 of the Internal Revenue Code, $60,881,463 was designated as a 20% rate gain distribution for the fiscal year ended March 31, 2018.
Pursuant to Section 854 of the Internal Revenue Code, $33,905,245 of income dividends paid during the fiscal year ended March 31, 2018 has been designated as qualified dividend income (QDI).
For the fiscal year ended March 31, 2018, $589,829 has been designated as interest-related dividends for nonresident alien shareholders pursuant to Section 871 of the Internal Revenue Code.
For the fiscal year ended March 31, 2018, $30,070,762 has been designated as short-term capital gain dividends for nonresident alien shareholders pursuant to Section 871 of the Internal Revenue Code.
PROXY VOTING INFORMATION
A description of the policies and procedures that the Fund uses to determine how to vote proxies relating to portfolio securities is available, upon request, by calling 1-800-222-8222, visiting our website at wellsfargofunds.com, or visiting the SEC website at sec.gov. Information regarding how the Fund voted proxies relating to portfolio securities during the most recent 12-month period ended June 30 is available on the Fund’s website at wellsfargofunds.com or by visiting the SEC website at sec.gov.
PORTFOLIO HOLDINGS INFORMATION
The complete portfolio holdings for the Fund are publicly available monthly on the Fund’s website (wellsfargofunds.com), on a one-month delayed basis. In addition, top ten holdings information (excluding derivative positions) for the Fund is publicly available on the Fund’s website on a monthly, seven-day or more delayed basis. The Fund files its complete schedule of portfolio holdings with the SEC for the first and third quarters of each fiscal year on Form N-Q, which is available by visiting the SEC website at sec.gov. In addition, the Fund’s Form N-Q may be reviewed and copied at the SEC’s Public Reference Room in Washington, DC, and at regional offices in New York City, at 233 Broadway, and in Chicago, at 175 West Jackson Boulevard, Suite 900. Information about the Public Reference Room may be obtained by calling 1-800-SEC-0330.
| | | | |
| 34 | | Wells Fargo Special Small Cap Value Fund | | Other information (unaudited) |
BOARD OF TRUSTEES AND OFFICERS
Each of the Trustees and Officers1 listed in the table below acts in identical capacities for each fund in the Wells Fargo family of funds, which consists of 153 mutual funds comprising the Wells Fargo Funds Trust, Wells Fargo Variable Trust, Wells Fargo Master Trust and four closed-end funds (collectively the “Fund Complex”). This table should be read in conjunction with the Prospectus and the Statement of Additional Information2. The mailing address of each Trustee and Officer is 525 Market Street, 12th Floor, San Francisco, CA 94105. Each Trustee and Officer serves an indefinite term, however, each Trustee serves such term until reaching the mandatory retirement age established by the Trustees.
Independent Trustees
| | | | | | |
Name and year of birth | | Position held and length of service* | | Principal occupations during past five years or longer | | Current other public company or
investment company
directorships |
William R. Ebsworth (Born 1957) | | Trustee, since 2015 | | Retired. From 1984 to 2013, equities analyst, portfolio manager, research director and chief investment officer at Fidelity Management and Research Company in Boston, Tokyo, and Hong Kong, and retired in 2013 as Chief Investment Officer of Fidelity Strategic Advisers, Inc. where he led a team of investment professionals managing client assets. Prior thereto, Board member of Hong Kong Securities Clearing Co., Hong Kong Options Clearing Corp., the Thailand International Fund, Ltd., Fidelity Investments Life Insurance Company, and Empire Fidelity Investments Life Insurance Company. Board member of the Forté Foundation (non-profit organization) and the Vincent Memorial Hospital Endowment (non-profit organization), where he serves on the Investment Committee and as a Chair of the Audit Committee. Mr. Ebsworth is a CFA® charterholder. | | Asset Allocation Trust |
Jane A. Freeman** (Born 1953) | | Trustee, since 2015; Chair Liaison, since 2018 | | Retired. From 2012 to 2014 and 1999 to 2008, Chief Financial Officer of Scientific Learning Corporation. From 2008 to 2012, Ms. Freeman provided consulting services related to strategic business projects. Prior to 1999, Portfolio Manager at Rockefeller & Co. and Scudder, Stevens & Clark. Board member of the Harding Loevner Funds from 1996 to 2014, serving as both Lead Independent Director and chair of the Audit Committee. Board member of the Russell Exchange Traded Funds Trust from 2011 to 2012 and the chair of the Audit Committee. Ms. Freeman is a Board Member of Ruth Bancroft Garden (non-profit organization) and the Glimmerglass Festival. She is also an inactive Chartered Financial Analyst. | | Asset Allocation Trust |
Isaiah Harris, Jr. (Born 1952) | | Trustee, since 2009 | | Retired. Chairman of the Board of CIGNA Corporation since 2009, and Director since 2005. From 2003 to 2011, Director of Deluxe Corporation. Prior thereto, President and CEO of BellSouth Advertising and Publishing Corp. from 2005 to 2007, President and CEO of BellSouth Enterprises from 2004 to 2005 and President of BellSouth Consumer Services from 2000 to 2003. Emeritus member of the Iowa State University Foundation Board of Governors. Emeritus Member of the Advisory Board of Iowa State University School of Business. Advisory Board Member, Palm Harbor Academy (charter school). Advisory Board Member, Child Evangelism Fellowship (non-profit). Mr. Harris is a certified public accountant (inactive status). | | CIGNA Corporation; Asset Allocation Trust |
Judith M. Johnson (Born 1949) | | Trustee, since 2008; Audit Committee Chairman, since 2008 | | Retired. Prior thereto, Chief Executive Officer and Chief Investment Officer of Minneapolis Employees Retirement Fund from 1996 to 2008. Ms. Johnson is an attorney, certified public accountant and a certified managerial accountant. | | Asset Allocation Trust |
David F. Larcker (Born 1950) | | Trustee, since 2009 | | James Irvin Miller Professor of Accounting at the Graduate School of Business, Stanford University, Director of the Corporate Governance Research Initiative and Senior Faculty of The Rock Center for Corporate Governance since 2006. From 2005 to 2008, Professor of Accounting at the Graduate School of Business, Stanford University. Prior thereto, Ernst & Young Professor of Accounting at The Wharton School, University of Pennsylvania from 1985 to 2005. | | Asset Allocation Trust |
| | | | | | |
| Other information (unaudited) | | Wells Fargo Special Small Cap Value Fund | | | 35 | |
| | | | | | |
Name and year of birth | | Position held and length of service* | | Principal occupations during past five years or longer | | Current other public company or
investment company
directorships |
Olivia S. Mitchell*** (Born 1953) | | Trustee, since 2006; Governance Committee Chairman, since 2018 | | International Foundation of Employee Benefit Plans Professor, Wharton School of the University of Pennsylvania since 1993. Director of Wharton’s Pension Research Council and Boettner Center on Pensions & Retirement Research, and Research Associate at the National Bureau of Economic Research. Previously, Cornell University Professor from 1978 to 1993. | | Asset Allocation Trust |
| Timothy J. Penny**** (Born 1951) | | Trustee, since 1996; Chairman, since 2018; Vice Chairman, from 2017 to 2018 | | President and Chief Executive Officer of Southern Minnesota Initiative Foundation, a non-profit organization, since 2007. Member of the Board of Trustees of NorthStar Education Finance, Inc., a non-profit organization, since 2007. | | Asset Allocation Trust |
James G. Polisson***** (Born 1959) | | Trustee, since 2018; Advisory Board Member, from 2017 to 2018 | | Retired. Chief Marketing Officer, Source (ETF) UK Services, Ltd, from 2015 to 2017. From 2012 to 2015, Principal of The Polisson Group, LLC, a management consulting, corporate advisory and principal investing company. Chief Executive Officer and Managing Director at Russell Investments, Global Exchange Traded Funds from 2010 to 2012. Managing Director of Barclays Global Investors from 1998 to 2010 and Global Chief Marketing Officer for iShares and Barclays Global Investors from 2000 to 2010. Trustee of the San Francisco Mechanics’ Institute, a non-profit organization, from 2013 to 2015. Board member of the Russell Exchange Traded Fund Trust from 2011 to 2012. Director of Barclays Global Investors Holdings Deutschland GmbH from 2006 to 2009. Mr. Polisson is an attorney and has a retired status with the Massachusetts and District of Columbia Bar Associations. | | Asset Allocation Trust |
Michael S. Scofield (Born 1943) | | Trustee, since 2010 | | Served on the Investment Company Institute’s Board of Governors and Executive Committee from 2008-2011 as well the Governing Council of the Independent Directors Council from 2006-2011 and the Independent Directors Council Executive Committee from 2008-2011. Trustee of the Evergreen Fund complex (and its predecessors) from 1984 to 2010. Chairman of the Evergreen Funds from 2000-2010. Former Trustee of the Mentor Funds. Retired Attorney, Law Offices of Michael S. Scofield. | | Asset Allocation Trust |
Pamela Wheelock***** (Born 1959) | | Trustee, since 2018; Advisory Board Member, from 2017 to 2018 | | Chief Operating Officer, Twin Cities Habitat for Humanity, since January, 2017. Vice President of University Services, University of Minnesota from 2012 to 2017. Prior thereto, Interim President and Chief Executive Officer of Blue Cross Blue Shield of Minnesota from 2010 to 2011, Chairman of the Board from 2009 to 2011 and Board Director from 2003 to 2015. Vice President, Leadership and Community Engagement, Bush Foundation, Saint Paul, Minnesota (a private foundation) from 2009 to 2011. Executive Vice President and Chief Financial Officer, Minnesota Sports and Entertainment from 2004 to 2009 and Senior Vice President from 2002 to 2004. Commissioner of Finance, State of Minnesota, from 1999 to 2002. Currently on the Board of Directors, Governance Committee and Finance Committee, for the Minnesota Philanthropy Partners (Saint Paul Foundation) since 2012 and Board Chair of the Minnesota Wild Foundation since 2010. | | Asset Allocation Trust |
| * | Length of service dates reflect the Trustee’s commencement of service with the Trust’s predecessor entities, where applicable. |
| ** | Jane Freeman became Chair Liaison effective January 1, 2018. |
| *** | Olivia Mitchell became Chairman of the Governance Committee effective January 1, 2018. |
| **** | Timothy Penny became Chairman effective January 1, 2018. |
| ***** | James Polisson and Pamela Wheelock each became a Trustee effective January 1, 2018. |
| | | | |
| 36 | | Wells Fargo Special Small Cap Value Fund | | Other information (unaudited) |
Officers
| | | | | | |
Name and year of birth | | Position held and
length of service | | Principal occupations during past five years or longer | | |
Andrew Owen (Born 1960) | | President, since 2017 | | Executive Vice President of Wells Fargo & Company and Head of Affiliated Managers, Wells Fargo Asset Management, since 2014. In addition, Mr. Owen is currently President, Chief Executive Officer and Director of Wells Fargo Funds Management, LLC since 2017. Prior thereto, Executive Vice President responsible for marketing, investments and product development for Wells Fargo Funds Management, LLC, from 2009 to 2014. | | |
Nancy Wiser1 (Born 1967) | | Treasurer, since 2012 | | Executive Vice President of Wells Fargo Funds Management, LLC since 2011. Chief Operating Officer and Chief Compliance Officer at LightBox Capital Management LLC, from 2008 to 2011. | | |
Alexander Kymn* (Born 1973) | | Secretary, since 2018; Chief Legal Officer, since 2018 | | Senior Company Counsel of Wells Fargo Bank, N.A. since 2018 (previously Senior Counsel from 2007 to 2018). Vice President of Wells Fargo Funds Management, LLC from 2008 to 2014. | | |
C. David Messman** (Born 1960) | | Secretary, since 2000; Chief Legal Officer, since 2003 | | Senior Vice President and Secretary of Wells Fargo Funds Management, LLC since 2001. Assistant General Counsel of Wells Fargo Bank, N.A. since 2013 and Vice President and Managing Counsel of Wells Fargo Bank, N.A. from 1996 to 2013. | | |
Michael H. Whitaker (Born 1967) | | Chief Compliance Officer, since 2016 | | Senior Vice President and Chief Compliance Officer since 2016. Senior Vice President and Chief Compliance Officer for Fidelity Investments from 2007 to 2016. | | |
David Berardi (Born 1975) | | Assistant Treasurer, since 2009 | | Vice President of Wells Fargo Funds Management, LLC since 2009. Vice President of Evergreen Investment Management Company, LLC from 2008 to 2010. Manager of Fund Reporting and Control for Evergreen Investment Management Company, LLC from 2004 to 2010. | | |
Jeremy DePalma1 (Born 1974) | | Assistant Treasurer, since 2009 | | Senior Vice President of Wells Fargo Funds Management, LLC since 2009. Senior Vice President of Evergreen Investment Management Company, LLC from 2008 to 2010 and head of the Fund Reporting and Control Team within Fund Administration from 2005 to 2010. | | |
| 1 | Nancy Wiser acts as Treasurer of 77 funds in the Fund Complex. Jeremy DePalma acts as Treasurer of 76 funds and Assistant Treasurer of 77 funds in the Fund Complex. |
| 2 | The Statement of Additional Information includes additional information about the Trustees and is available, without charge, upon request, by calling 1-800-222-8222 or by visiting the website at wellsfargofunds.com. |
| * | Alexander Kymn became the Secretary and Chief Legal Officer effective April 17, 2018. |
| ** | David Messman was the Secretary and Chief Legal Officer until April 16, 2018. |
| | | | | | |
| List of abbreviations | | Wells Fargo Special Small Cap Value Fund | | | 37 | |
The following is a list of common abbreviations for terms and entities that may have appeared in this report.
| ACA | — ACA Financial Guaranty Corporation |
| ADR | — American depositary receipt |
| ADS | — American depositary shares |
| AGC | — Assured Guaranty Corporation |
| AGM | — Assured Guaranty Municipal |
| Ambac | — Ambac Financial Group Incorporated |
| AMT | — Alternative minimum tax |
| BAN | — Bond anticipation notes |
| BHAC | — Berkshire Hathaway Assurance Corporation |
| CAB | — Capital appreciation bond |
| CCAB | — Convertible capital appreciation bond |
| CDA | — Community Development Authority |
| CDO | — Collateralized debt obligation |
| CLO | — Collateralized loan obligation |
| DRIVER | — Derivative inverse tax-exempt receipts |
| DW&P | — Department of Water & Power |
| DWR | — Department of Water Resources |
| ECFA | — Educational & Cultural Facilities Authority |
| EDA | — Economic Development Authority |
| EDFA | — Economic Development Finance Authority |
| ETF | — Exchange-traded fund |
| FDIC | — Federal Deposit Insurance Corporation |
| FFCB | — Federal Farm Credit Banks |
| FGIC | — Financial Guaranty Insurance Corporation |
| FHA | — Federal Housing Administration |
| FHLB | — Federal Home Loan Bank |
| FHLMC | — Federal Home Loan Mortgage Corporation |
| FICO | — The Financing Corporation |
| FNMA | — Federal National Mortgage Association |
| GDR | — Global depositary receipt |
| GNMA | — Government National Mortgage Association |
| HCFR | — Healthcare facilities revenue |
| HEFA | — Health & Educational Facilities Authority |
| HEFAR | — Higher education facilities authority revenue |
| HFA | — Housing Finance Authority |
| HFFA | — Health Facilities Financing Authority |
| HUD | — Department of Housing and Urban Development |
| IDA | — Industrial Development Authority |
| IDAG | — Industrial Development Agency |
| KRW | — Republic of Korea won |
| LIBOR | — London Interbank Offered Rate |
| LIFER | — Long Inverse Floating Exempt Receipts |
| LLC | — Limited liability company |
| LLLP | — Limited liability limited partnership |
| LLP | — Limited liability partnership |
| MBIA | — Municipal Bond Insurance Association |
| MFHR | — Multifamily housing revenue |
| MSTR | — Municipal securities trust receipts |
| MUD | — Municipal Utility District |
| National | — National Public Finance Guarantee Corporation |
| PCFA | — Pollution Control Financing Authority |
| PCL | — Public Company Limited |
| PCR | — Pollution control revenue |
| PFA | — Public Finance Authority |
| PFFA | — Public Facilities Financing Authority |
| PFOTER | — Puttable floating option tax-exempt receipts |
| PJSC | — Public Joint Stock Company |
| plc | — Public limited company |
| PUTTER | — Puttable tax-exempt receipts |
| R&D | — Research & development |
| Radian | — Radian Asset Assurance |
| RAN | — Revenue anticipation notes |
| RDA | — Redevelopment Agency |
| RDFA | — Redevelopment Finance Authority |
| REIT | — Real estate investment trust |
| ROC | — Reset option certificates |
| SAVRS | — Select auction variable rate securities |
| SBA | — Small Business Authority |
| SDR | — Swedish depositary receipt |
| SFHR | — Single-family housing revenue |
| SFMR | — Single-family mortgage revenue |
| SIFMA | — Securities Industry and Financial Markets Association |
| SPA | — Standby purchase agreement |
| SPDR | — Standard & Poor’s Depositary Receipts |
| SPEAR | — Short Puttable Exempt Adjustable Receipts |
| STRIPS | — Separate trading of registered interest and |
| TAN | — Tax anticipation notes |
| TIPS | — Treasury inflation-protected securities |
| TRAN | — Tax revenue anticipation notes |
| TTFA | — Transportation Trust Fund Authority |
| TVA | — Tennessee Valley Authority |
This page is intentionally left blank.
This page is intentionally left blank.
This page is intentionally left blank.

For more information
More information about Wells Fargo Funds is available free upon request. To obtain literature, please write, email, visit the Fund’s website, or call:
Wells Fargo Funds
P.O. Box 8266
Boston, MA 02266-8266
Email: fundservice@wellsfargo.com
Website: wellsfargofunds.com
Individual investors: 1-800-222-8222
Retail investment professionals: 1-888-877-9275
Institutional investment professionals: 1-866-765-0778
This report and the financial statements contained herein are submitted for the general information of the shareholders of the Fund. If this report is used for promotional purposes, distribution of the report must be accompanied or preceded by a current prospectus. Before investing, please consider the investment objectives, risks, charges, and expenses of the investment. For a current prospectus and, if available, a summary prospectus, containing this information, call 1-800-222-8222 or visit the Fund’s website at wellsfargofunds.com. Read the prospectus carefully before you invest or send money.
Wells Fargo Asset Management (WFAM) is a trade name used by the asset management businesses of Wells Fargo & Company. Wells Fargo Funds Management, LLC, a wholly owned subsidiary of Wells Fargo & Company, provides investment advisory and administrative services for Wells Fargo Funds. Other affiliates of Wells Fargo & Company provide subadvisory and other services for the funds. The funds are distributed by Wells Fargo Funds Distributor, LLC, Member FINRA, an affiliate of Wells Fargo & Company. Neither Wells Fargo Funds Distributor nor Wells Fargo Funds Management holds fund shareholder accounts or assets. This material is for general informational and educational purposes only and is NOT intended to provide investment advice or a recommendation of any kind—including a recommendation for any specific investment, strategy, or plan.
NOT FDIC INSURED ◾ NO BANK GUARANTEE ◾ MAY LOSE VALUE
© 2018 Wells Fargo Funds Management, LLC. All rights reserved.
| | |
 | | 309985 05-18 A246/AR246 03-18 |
Annual Report
March 31, 2018

Wells Fargo Traditional Small Cap Growth Fund


Reduce clutter. Save trees.
Sign up for electronic delivery of prospectuses and shareholder reports at wellsfargo.com/advantagedelivery
Contents
The views expressed and any forward-looking statements are as of March 31, 2018, unless otherwise noted, and are those of the Fund managers and/or Wells Fargo Funds Management, LLC. Discussions of individual securities, or the markets generally, or any Wells Fargo Fund are not intended as individual recommendations. Future events or results may vary significantly from those expressed in any forward-looking statements. The views expressed are subject to change at any time in response to changing circumstances in the market. Wells Fargo Funds Management, LLC and the Fund disclaim any obligation to publicly update or revise any views expressed or forward-looking statements.
NOT FDIC INSURED ◾ NO BANK GUARANTEE ◾ MAY LOSE VALUE
| | | | |
| 2 | | Wells Fargo Traditional Small Cap Growth Fund | | Letter to shareholders (unaudited) |

Andrew Owen
President
Wells Fargo Funds
Dear Shareholder:
We are pleased to offer you this annual report for the Wells Fargo Traditional Small Cap Growth Fund for the 12-month period that ended March 31, 2018. During the last three quarters of 2017, investors enjoyed consistently rising equity values globally. Short-term interest rates tended to increase, while long-term rates remained flat to lower. During the final two months of the first quarter of 2018, equity market volatility returned, stocks reversed year-to-date gains, and bond yields rose while prices fell.
For the period, U.S. stocks, as measured by the S&P 500 Index,1 gained 13.99% and international stocks, as measured by the MSCI ACWI ex USA Index (Net),2 added 16.53%. Emerging market stocks, as measured by the MSCI EM Index (Net),3 added 24.93%. In bond markets, the Bloomberg Barclays U.S. Aggregate Bond Index4 added 1.20% and the Bloomberg Barclays Municipal Bond Index5 added 2.66% while fixed-income investments outside the U.S. gained 11.75%, according to the Bloomberg Barclays Global Aggregate ex-USD Index.6 The ICE BofAML U.S. High Yield Index7 earned 3.69%.
Through the last nine months of 2017, stocks advanced on synchronized global growth, which led to higher investor and consumer confidence. The first quarter of 2018 began with strong stock market gains in January. A strong January 2018 U.S. employment report and inflation concerns prompted equity volatility in February. Investor optimism for growth was supplanted with concerns over trade tensions, increased interest rates, and the prospect of new data privacy regulations.
Reactions to U.S. interest rate increases were uneven across the yield curve and globally.
The U.S. Federal Reserve (Fed) increased the federal funds rate three times during the 12-month period for a combined 75 basis points (bps; 100 bps equals 1.00%). Following an increase in March 2017, short-term bond yields in the U.S. rose while longer-term Treasury yields were little changed. Municipal bond returns were positive, helped by strong demand and constrained new-issue supply. The Fed raised the target interest rate once again in June 2017 to a range of 1.00% to 1.25%. Ten-year U.S. Treasury yields declined, the yield curve flattened, and long-term bond prices benefited.
| 1 | The S&P 500 Index consists of 500 stocks chosen for market size, liquidity, and industry group representation. It is a market-value-weighted index with each stock’s weight in the index proportionate to its market value. You cannot invest directly in an index. |
| 2 | The Morgan Stanley Capital International (MSCI) All Country World Index (ACWI) ex USA Index (Net) is a free-float-adjusted market-capitalization-weighted index that is designed to measure the equity market performance of developed markets, excluding the United States and Canada. Source: MSCI. MSCI makes no express or implied warranties or representations and shall have no liability whatsoever with respect to any MSCI data contained herein. The MSCI data may not be further redistributed or used as a basis for other indices or any securities or financial products. This report is not approved, reviewed, or produced by MSCI. You cannot invest directly in an index. |
| 3 | The MSCI Emerging Markets (EM) Index (Net) is a free-float-adjusted market-capitalization-weighted index that is designed to measure large- and mid-cap equity market performance of emerging markets. The MSCI EM Index (Net) consists of the following 24 emerging market country indices: Brazil, Chile, China, Colombia, Czech Republic, Egypt, Greece, Hungary, India, Indonesia, Korea, Malaysia, Mexico, Pakistan, Peru, the Philippines, Poland, Qatar, Russia, South Africa, Taiwan, Thailand, Turkey, and the United Arab Emirates. You cannot invest directly in an index. |
| 4 | The Bloomberg Barclays U.S. Aggregate Bond Index is a broad-based benchmark that measures the investment-grade, U.S. dollar-denominated, fixed-rate taxable bond market, including Treasuries, government-related and corporate securities, mortgage-backed securities (agency fixed-rate and hybrid adjustable-rate mortgage pass-throughs), asset-backed securities, and commercial mortgage-backed securities. You cannot invest directly in an index. |
| 5 | The Bloomberg Barclays Municipal Bond Index is an unmanaged index composed of long-term tax-exempt bonds with a minimum credit rating of Baa. You cannot invest directly in an index. |
| 6 | The Bloomberg Barclays Global Aggregate ex-USD Index is an unmanaged index that provides a broad-based measure of the global investment-grade fixed-income markets excluding the U.S. dollar-denominated debt market. You cannot invest directly in an index. |
| 7 | The ICE BofAML U.S. High Yield Index is a market-capitalization-weighted index of domestic and Yankee high-yield bonds. The index tracks the performance of high-yield securities traded in the U.S. bond market. You cannot invest directly in an index. Copyright 2018. ICE Data Indices, LLC. All rights reserved. |
| | | | | | |
| Letter to shareholders (unaudited) | | Wells Fargo Traditional Small Cap Growth Fund | | | 3 | |
Internationally, central banks maintained low interest rates and accommodative monetary policies that supported business activity and stock values in foreign markets. A weaker U.S. dollar was generally supportive of business activity in regions around the globe. The Bank of Japan continued its accommodative monetary policies, and industrial production, retail sales, and fixed asset investment increased in China.
Growth continued through the summer of 2017.
Globally, stocks moved higher during the third quarter of 2017. Low inflation and interest rates supported accelerating global economic growth and corporate earnings. Brief episodes of geopolitical tensions, often associated with North Korea’s advancing nuclear missile program, flaring conflicts in the Middle East, and uncertainty surrounding U.S. trade policies, did not discourage investing activity.
In the U.S., economic data released during the quarter reflected a generally healthy economy. Second-quarter economic output grew at a 3.1% annual rate. Stocks in international developed and emerging markets continued to benefit from improving economic growth.
Positive economic and market news continued as 2017 closed and 2018 began.
During the fourth quarter of 2017, stock markets continued the move higher. Third-quarter economic output in the U.S. grew at a 3.2% annual rate. The unemployment rate fell to a 17-year low of 4.1%. Tax reform passed and wage growth data improved, encouraging increased business and consumer spending.
Fed officials announced in October 2017 plans to begin unwinding its $4.5 trillion portfolio of bonds and other assets accumulated during rounds of quantitative easing conducted since the 2008–2009 recession. Still, restrained inflation kept long-term bond rates steady and the flattened yield curve persisted. The Fed raised the federal funds rate target to a range of 1.25% to 1.50% in December 2017 and began selling bonds held in its portfolio.
2018 opened with continued stock advances, then volatility.
Improving business and economic data globally continued to support stocks through January 2018. Political wrangling in the U.S. over budget resolutions could not dissuade investors from buying stocks as payrolls and factory orders increased. Long-term interest rates in the U.S. trended higher as the yield curve steepened—the 10-year Treasury rate moved from 2.46% to 2.84% and the 30-year rate moved from 2.81% to 3.08% during January 2018.
Investor sentiment shifted in February as inflation concerns emerged in the U.S. when readings from the Producer Price Index in January rose 2.5% year over year. During February, the U.S. market endured a loss from January’s high of nearly 12% before recovering much of that loss. The Fed raised the federal funds rate in March 2018. Bond yields rose across the yield curve.
During January 2018, purchasing managers’ indices in China, the eurozone, India, and Japan reported data for December that indicated continued growth. Despite positive economic signals and business fundamentals, international stock values fell during February and March 2018, swept up in the selling momentum in U.S. markets.
Globally, stocks moved higher during the third quarter of 2017.
During February, the U.S. market endured a loss from January’s high of nearly 12% before recovering much of that loss.
| | | | |
| 4 | | Wells Fargo Traditional Small Cap Growth Fund | | Letter to shareholders (unaudited) |
Don’t let short-term uncertainty derail long-term investment goals.
Periods of investment uncertainty can present challenges, but experience has taught us that maintaining long-term investment goals can be an effective way to plan for the future. To help you create a sound strategy based on your personal goals and risk tolerance, Wells Fargo Funds offers more than 100 mutual funds spanning a wide range of asset classes and investment styles. Although diversification cannot guarantee an investment profit or prevent losses, we believe it can be an effective way to manage investment risk and potentially smooth out overall portfolio performance. We encourage investors to know their investments and to understand that appropriate levels of risk-taking may unlock opportunities.
Thank you for choosing to invest with Wells Fargo Funds. We appreciate your confidence in us and remain committed to helping you meet your financial needs.
Sincerely,

Andrew Owen
President
Wells Fargo Funds
For further information about your Fund, contact your investment professional, visit our website at wellsfargofunds.com, or call us directly at 1-800-222-8222.
This page is intentionally left blank.
| | | | |
| 6 | | Wells Fargo Traditional Small Cap Growth Fund | | Performance highlights (unaudited) |
Investment objective
The Fund seeks long-term capital appreciation.
Manager
Wells Fargo Funds Management, LLC
Subadviser
Wells Capital Management Incorporated
Portfolio managers‡
Michael T. Smith, CFA®
Christopher J. Warner, CFA®
Average annual total returns (%) as of March 31, 20181
| | | | | | | | | | | | | | | | | | | | | | | | | | | | | | | | | | |
| | | | | Including sales charge | | | Excluding sales charge | | | Expense ratios2 (%) | |
| | | Inception date | | 1 year | | | 5 year | | | 10 year | | | 1 year | | | 5 year | | | 10 year | | | Gross | | | Net3 | |
| Class A (EGWAX) | | 6-5-1995 | | | 9.39 | | | | 9.32 | | | | 8.70 | | | | 16.08 | | | | 10.63 | | | | 9.35 | | | | 1.51 | | | | 1.33 | |
| Class C (EGWCX) | | 7-30-2010 | | | 14.17 | | | | 9.80 | | | | 8.53 | | | | 15.17 | | | | 9.80 | | | | 8.53 | | | | 2.26 | | | | 2.08 | |
| Administrator Class (EGWDX) | | 7-30-2010 | | | – | | | | – | | | | – | | | | 16.21 | | | | 10.82 | | | | 9.49 | | | | 1.43 | | | | 1.20 | |
| Institutional Class (EGRYX) | | 11-19-1997 | | | – | | | | – | | | | – | | | | 16.40 | | | | 11.01 | | | | 9.70 | | | | 1.18 | | | | 0.98 | |
| Russell 2000® Growth Index4 | | – | | | – | | | | – | | | | – | | | | 18.63 | | | | 12.90 | | | | 10.95 | | | | – | | | | – | |
Figures quoted represent past performance, which is no guarantee of future results, and do not reflect taxes that a shareholder may pay on fund distributions or the redemption of fund shares. Investment return and principal value of an investment will fluctuate so that an investor’s shares, when redeemed, may be worth more or less than their original cost. Performance shown without sales charges would be lower if sales charges were reflected. Current performance may be lower or higher than the performance data quoted, which assumes the reinvestment of dividends and capital gains. Current month-end performance is available on the Fund’s website, wellsfargofunds.com.
Index returns do not include transaction costs associated with buying and selling securities, any mutual fund fees or expenses, or any taxes. It is not possible to invest directly in an index.
For Class A shares, the maximum front-end sales charge is 5.75%. For Class C shares, the maximum contingent deferred sales charge is 1.00%. Performance including a contingent deferred sales charge assumes the sales charge for the corresponding time period. Administrator Class and Institutional Class shares are sold without a front-end sales charge or contingent deferred sales charge.
Stock values fluctuate in response to the activities of individual companies and general market and economic conditions. Smaller-company stocks tend to be more volatile and less liquid than those of larger companies. Consult the Fund’s prospectus for additional information on these and other risks.
Please see footnotes on page 7.
| | | | | | |
| Performance highlights (unaudited) | | Wells Fargo Traditional Small Cap Growth Fund | | | 7 | |
|
| Growth of $10,000 investment as of March 31, 20185 |
|
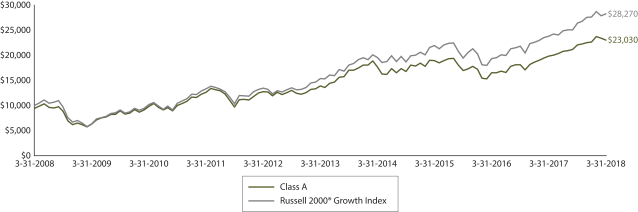 |
| ‡ | Mr. Smith and Mr. Warner became portfolio managers of the Fund on March 1, 2018. |
| 1 | Historical performance shown for Class C shares prior to their inception reflects the performance of Class A shares and has been adjusted to reflect the higher expenses applicable to Class C shares. Historical performance shown for Administrator Class shares prior to their inception reflects the performance of Institutional Class shares and has been adjusted to reflect the higher expenses applicable to Administrator Class shares. Historical performance shown for all classes of the Fund prior to July 19, 2010, is based on the performance of the Fund’s predecessor, Evergreen Growth Fund. |
| 2 | Reflects the expense ratios as stated in the most recent prospectuses. The expense ratios shown are subject to change and may differ from the annualized expense ratios shown in the financial highlights of this report. |
| 3 | The manager has contractually committed through July 31, 2018, to waive fees and/or reimburse expenses to the extent necessary to cap the Fund’s Total Annual Fund Operating Expenses After Fee Waivers at the amounts shown. After this time, the cap may be increased or the commitment to maintain the cap may be terminated only with the approval of the Board of Trustees. Brokerage commissions, stamp duty fees, interest, taxes, acquired fund fees and expenses (if any), and extraordinary expenses are excluded from the expense cap. Without this cap, the Fund’s returns would have been lower. The expense ratio paid by an investor is the net expense ratio (the total annual fund operating expenses after fee waivers) as stated in the prospectuses. |
| 4 | The Russell 2000® Growth Index measures the performance of those Russell 2000 companies with higher price/book ratios and higher forecasted growth values. You cannot invest directly in an index. |
| 5 | The chart compares the performance of Class A shares for the most recent ten years with the Russell 2000® Growth Index. The chart assumes a hypothetical investment of $10,000 in Class A shares and reflects all operating expenses and assumes the maximum initial sales charge of 5.75%. |
| 6 | The ten largest holdings, excluding cash and cash equivalents, are calculated based on the value of the investments divided by total net assets of the Fund. Holdings are subject to change and may have changed since the date specified. |
| 7 | Amounts are calculated based on the total long-term investments of the Fund. These amounts are subject to change and may have changed since the date specified. |
| | | | |
| 8 | | Wells Fargo Traditional Small Cap Growth Fund | | Performance highlights (unaudited) |
MANAGER’S DISCUSSION
Fund highlights
| ∎ | | The Fund underperformed its benchmark, the Russell 2000® Growth Index, for the 12-month period that ended March 31, 2018. |
| ∎ | | Relative weakness within the consumer discretionary, industrials, and health care sectors weighed on the Fund’s performance. |
| ∎ | | Holdings within the financials and consumer staples sectors generated strong relative performance; an underweight to the real estate and energy sectors also contributed positively. |
U.S. stocks rallied for most of the past 12 months, aided by synchronized global growth.
The U.S. stock market benefited from steady improvement in global economic activity and corporate earnings, which more than offset various geopolitical concerns. Market leadership was often found in market segments with strong earnings and favorable earnings revisions, which influenced the solid results from the information technology (IT) sector. However, during parts of this period, market leadership was found in stocks with the highest valuations as well as companies with no earnings, evident specifically in the small-cap biotechnology industry. These market dynamics created a challenging environment at times for the Fund’s emphases of profitable companies and sustainable growth.
Sector allocations became more diversified.
The Fund’s allocation to the IT sector was reduced, while the allocation to the health care sector was increased over this period. These changes in positioning were in an effort to continue managing the overall volatility and stock-specific risks in the Fund. Within IT, the primary change was a decrease in the IT services industry, highlighted by the sale of Silver Spring Networks, Incorporated. Within health care, the key change was an increase to the providers and services industry, highlighted by a greater allocation to AMN Healthcare Services, Incorporated; LHC Group, Incorporated; and The Ensign Group, Incorporated.
Select holdings in the consumer discretionary, industrials, and health care sectors detracted from performance.
The Fund’s underperformance in the consumer discretionary sector was heavily influenced by weakness in Motorcar Parts of America, Incorporated, which suffered in the midst of a relatively mild winter. Consequently, customer demand for the company’s after-market auto parts was less robust than anticipated and earnings estimates declined as a result. Nautilus, Incorporated, also declined over the period as it suffered multiple fundamental disappointments, which led to the position being sold from the Fund. Within industrials, professional services firm WageWorks, Incorporated, declined significantly in the first quarter of 2018 following the announcement by company management of a delay in the company’s filing of financial statements. Within health care, an underweight allocation to the biotechnology industry significantly hindered relative returns as the industry rallied over this period, influenced partly by increased merger and acquisition activity and Food and Drug Administration approvals.
Solid results from financials and consumer staples holdings boosted Fund performance.
The Fund’s success in the financials sector was influenced by the Fund’s holdings in niche consumer growth areas. Green Dot Corporation and LendingTree, Incorporated, continued to benefit from a broad consumer migration to alternative sources of banking, loans, and payments. Green Dot was the top contributor in the Fund as the company continued to generate robust growth largely from its core business of prepaid debit cards. The Fund’s outperformance in consumer staples was driven by Freshpet, Incorporated, which rallied earlier in this period, supported by progress by company management on various operational efficiency initiatives. Finally, the Fund’s underweight to the real estate sector contributed strongly as investors tended to favor companies with more attractive earnings-growth prospects in other sectors.
Caution is warranted but opportunities remain.
Over the past few months, investor attention shifted from widespread bullishness to higher risk awareness. Long-dormant market volatility has spiked, talk of tariffs has increased fears of a trade war, and short-term interest rates have risen meaningfully. We expect that these risk factors, in addition to the potential new ones to emerge, will linger over market sentiment for some time.
Please see footnotes on page 7.
| | | | | | |
| Performance highlights (unaudited) | | Wells Fargo Traditional Small Cap Growth Fund | | | 9 | |
Although there is considerable caution, in our view opportunities remain. The key aspects of our outlook are for moderate economic growth, low inflation, and rising corporate earnings. We do not see harbingers of a bear market like a recession or credit bubble on the horizon. Even with higher volatility, we see a constructive environment for companies with strong revenue growth, profitable business models, and durable free cash flows. Capital should continue to be drawn to companies with these traits.
This market backdrop should allow the durable fundamentals of the portfolio to be unlocked. We anticipate a market that continues to reward companies that produce superior growth. We remain committed to themes of global e-commerce, mobile payments, cloud computing, automation, and mobile gaming. As such, the portfolio maintains a mix of secular and idiosyncratic growth companies, along with caution around cyclicality and momentum.
| | | | |
| Ten largest holdings (%) as of March 31, 20186 | |
AMN Healthcare Services Incorporated | | | 4.04 | |
Green Dot Corporation Class A | | | 3.07 | |
The Trade Desk Incorporated Class A | | | 2.79 | |
Deluxe Corporation | | | 2.76 | |
Planet Fitness Incorporated Class A | | | 2.61 | |
Summit Materials Incorporated Class A | | | 2.60 | |
Blackhawk Network Incorporated | | | 2.52 | |
LogMeIn Incorporated | | | 2.46 | |
LHC Group Incorporated | | | 2.29 | |
Freshpet Incorporated | | | 2.27 | |
|
| Sector distribution as of March 31, 20187 |
|
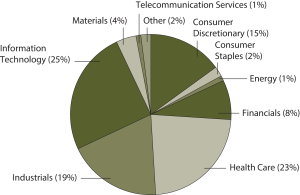 |
Please see footnotes on page 7.
| | | | |
| 10 | | Wells Fargo Traditional Small Cap Growth Fund | | Fund expenses (unaudited) |
As a shareholder of the Fund, you incur two types of costs: (1) transaction costs, including sales charges (loads) on purchase payments and contingent deferred sales charges (if any) on redemptions and (2) ongoing costs, including management fees, distribution (12b-1) and/or shareholder servicing fees, and other Fund expenses. This example is intended to help you understand your ongoing costs (in dollars) of investing in the Fund and to compare these costs with the ongoing costs of investing in other mutual funds.
The example is based on an investment of $1,000 invested at the beginning of the six-month period and held for the entire period from October 1, 2017 to March 31, 2018.
Actual expenses
The “Actual” line of the table below provides information about actual account values and actual expenses. You may use the information in this line, together with the amount you invested, to estimate the expenses that you paid over the period. Simply divide your account value by $1,000 (for example, an $8,600 account value divided by $1,000 = 8.6), then multiply the result by the number in the “Actual” line under the heading entitled “Expenses paid during period” for your applicable class of shares to estimate the expenses you paid on your account during this period.
Hypothetical example for comparison purposes
The “Hypothetical” line of the table below provides information about hypothetical account values and hypothetical expenses based on the Fund’s actual expense ratio and an assumed rate of return of 5% per year before expenses, which is not the Fund’s actual return. The hypothetical account values and expenses may not be used to estimate the actual ending account balance or expenses you paid for the period. You may use this information to compare the ongoing costs of investing in the Fund and other funds. To do so, compare this 5% hypothetical example with the 5% hypothetical examples that appear in the shareholder reports of the other funds.
Please note that the expenses shown in the table are meant to highlight your ongoing costs only and do not reflect any transactional costs, such as sales charges (loads) and contingent deferred sales charges. Therefore, the “Hypothetical” line of the table is useful in comparing ongoing costs only and will not help you determine the relative total costs of owning different funds. In addition, if these transactional costs were included, your costs would have been higher.
| | | | | | | | | | | | | | | | |
| | | Beginning
account value
10-1-2017 | | | Ending
account value
3-31-2018 | | | Expenses
paid during
the period¹ | | | Annualized net
expense ratio | |
Class A | | | | | | | | | | | | | | | | |
Actual | | $ | 1,000.00 | | | $ | 1,041.65 | | | $ | 6.77 | | | | 1.33 | % |
Hypothetical (5% return before expenses) | | $ | 1,000.00 | | | $ | 1,018.30 | | | $ | 6.69 | | | | 1.33 | % |
Class C | | | | | | | | | | | | | | | | |
Actual | | $ | 1,000.00 | | | $ | 1,037.53 | | | $ | 10.57 | | | | 2.08 | % |
Hypothetical (5% return before expenses) | | $ | 1,000.00 | | | $ | 1,014.56 | | | $ | 10.45 | | | | 2.08 | % |
Administrator Class | | | | | | | | | | | | | | | | |
Actual | | $ | 1,000.00 | | | $ | 1,042.71 | | | $ | 6.11 | | | | 1.20 | % |
Hypothetical (5% return before expenses) | | $ | 1,000.00 | | | $ | 1,018.95 | | | $ | 6.04 | | | | 1.20 | % |
Institutional Class | | | | | | | | | | | | | | | | |
Actual | | $ | 1,000.00 | | | $ | 1,043.56 | | | $ | 4.99 | | | | 0.98 | % |
Hypothetical (5% return before expenses) | | $ | 1,000.00 | | | $ | 1,020.04 | | | $ | 4.94 | | | | 0.98 | % |
| 1 | Expenses paid is equal to the annualized net expense ratio of each class multiplied by the average account value over the period, multiplied by the number of days in the most recent fiscal half-year divided by the number of days in the fiscal year (to reflect the one-half-year period). |
| | | | | | |
| Portfolio of investments—March 31, 2018 | | Wells Fargo Traditional Small Cap Growth Fund | | | 11 | |
| | | | | | | | | | | | | | | | |
| Security name | | | | | | | | Shares | | | Value | |
| | | | |
Common Stocks: 97.23% | | | | | | | | | | | | | | | | |
| | | | |
Consumer Discretionary: 14.73% | | | | | | | | | | | | | | | | |
| | | | |
| Auto Components: 2.53% | | | | | | | | | | | | | | | | |
Horizon Global Corporation † | | | | | | | | | | | 80,900 | | | $ | 666,616 | |
Motorcar Parts of America Incorporated † | | | | | | | | | | | 80,000 | | | | 1,714,400 | |
| | | | |
| | | | | | | | | | | | | | | 2,381,016 | |
| | | | | | | | | | | | | | | | |
| | | | |
| Hotels, Restaurants & Leisure: 9.34% | | | | | | | | | | | | | | | | |
BJ’s Restaurants Incorporated | | | | | | | | | | | 10,000 | | | | 449,000 | |
Boyd Gaming Corporation « | | | | | | | | | | | 60,000 | | | | 1,911,600 | |
Cedar Fair Entertainment Company | | | | | | | | | | | 24,000 | | | | 1,533,120 | |
Dave & Buster’s Entertainment Incorporated † | | | | | | | | | | | 25,000 | | | | 1,043,500 | |
Planet Fitness Incorporated Class A † | | | | | | | | | | | 65,000 | | | | 2,455,050 | |
Sonic Corporation « | | | | | | | | | | | 55,000 | | | | 1,387,650 | |
| | | | |
| | | | | | | | | | | | | | | 8,779,920 | |
| | | | | | | | | | | | | | | | |
| | | | |
| Household Durables: 0.57% | | | | | | | | | | | | | | | | |
TopBuild Corporation † | | | | | | | | | | | 7,000 | | | | 535,640 | |
| | | | | | | | | | | | | | | | |
| | | | |
| Internet & Direct Marketing Retail: 1.95% | | | | | | | | | | | | | | | | |
Shutterfly Incorporated † | | | | | | | | | | | 22,500 | | | | 1,828,125 | |
| | | | | | | | | | | | | | | | |
| | | | |
| Specialty Retail: 0.34% | | | | | | | | | | | | | | | | |
National Vision Holdings Incorporated † | | | | | | | | | | | 10,000 | | | | 323,100 | |
| | | | | | | | | | | | | | | | |
| | | | |
Consumer Staples: 2.27% | | | | | | | | | | | | | | | | |
| | | | |
| Food Products: 2.27% | | | | | | | | | | | | | | | | |
Freshpet Incorporated Ǡ | | | | | | | | | | | 130,000 | | | | 2,138,500 | |
| | | | | | | | | | | | | | | | |
| | | | |
Energy: 0.59% | | | | | | | | | | | | | | | | |
| | | | |
| Energy Equipment & Services: 0.59% | | | | | | | | | | | | | | | | |
Aspen Aerogels Incorporated † | | | | | | | | | | | 130,000 | | | | 555,100 | |
| | | | | | | | | | | | | | | | |
| | | | |
Financials: 8.32% | | | | | | | | | | | | | | | | |
| | | | |
| Banks: 2.20% | | | | | | | | | | | | | | | | |
Heartland Financial USA Incorporated | | | | | | | | | | | 39,000 | | | | 2,068,950 | |
| | | | | | | | | | | | | | | | |
| | | | |
| Consumer Finance: 3.07% | | | | | | | | | | | | | | | | |
Green Dot Corporation Class A † | | | | | | | | | | | 45,000 | | | | 2,887,200 | |
| | | | | | | | | | | | | | | | |
| | | | |
| Insurance: 1.40% | | | | | | | | | | | | | | | | |
Stewart Information Services Corporation | | | | | | | | | | | 30,000 | | | | 1,318,200 | |
| | | | | | | | | | | | | | | | |
| | | | |
| Thrifts & Mortgage Finance: 1.65% | | | | | | | | | | | | | | | | |
BofI Holding Incorporated Ǡ | | | | | | | | | | | 30,000 | | | | 1,215,900 | |
LendingTree Incorporated Ǡ | | | | | | | | | | | 1,000 | | | | 328,150 | |
| | | | |
| | | | | | | | | | | | | | | 1,544,050 | |
| | | | | | | | | | | | | | | | |
The accompanying notes are an integral part of these financial statements.
| | | | |
| 12 | | Wells Fargo Traditional Small Cap Growth Fund | | Portfolio of investments—March 31, 2018 |
| | | | | | | | | | | | | | | | |
| Security name | | | | | | | | Shares | | | Value | |
| | | | |
Health Care: 23.04% | | | | | | | | | | | | | | | | |
| | | | |
| Biotechnology: 3.11% | | | | | | | | | | | | | | | | |
ACADIA Pharmaceuticals Incorporated Ǡ | | | | | | | | | | | 7,500 | | | $ | 168,525 | |
Emergent BioSolutions Incorporated † | | | | | | | | | | | 18,000 | | | | 947,700 | |
Ligand Pharmaceuticals Incorporated Ǡ | | | | | | | | | | | 5,000 | | | | 825,800 | |
Repligen Corporation † | | | | | | | | | | | 27,000 | | | | 976,860 | |
| |
| | | | 2,918,885 | |
| | | | | | | | | | | | | | | | |
| | | | |
| Health Care Equipment & Supplies: 5.88% | | | | | | | | | | | | | | | | |
Globus Medical Incorporated Class A † | | | | | | | | | | | 26,000 | | | | 1,295,320 | |
Halyard Health Incorporated † | | | | | | | | | | | 38,000 | | | | 1,751,040 | |
Inogen Incorporated † | | | | | | | | | | | 11,000 | | | | 1,351,240 | |
Nevro Corporation † | | | | | | | | | | | 13,000 | | | | 1,126,710 | |
| |
| | | | 5,524,310 | |
| | | | | | | | | | | | | | | | |
| | | | |
| Health Care Providers & Services: 8.57% | | | | | | | | | | | | | | | | |
AMN Healthcare Services Incorporated † | | | | | | | | | | | 67,000 | | | | 3,802,250 | |
LHC Group Incorporated † | | | | | | | | | | | 35,000 | | | | 2,154,600 | |
The Ensign Group Incorporated | | | | | | | | | | | 80,000 | | | | 2,104,000 | |
| |
| | | | 8,060,850 | |
| | | | | | | | | | | | | | | | |
| | | | |
| Health Care Technology: 2.00% | | | | | | | | | | | | | | | | |
Medidata Solutions Incorporated † | | | | | | | | | | | 30,000 | | | | 1,884,300 | |
| | | | | | | | | | | | | | | | |
| | | | |
| Life Sciences Tools & Services: 1.70% | | | | | | | | | | | | | | | | |
Charles River Laboratories International Incorporated † | | | | | | | | | | | 15,000 | | | | 1,601,100 | |
| | | | | | | | | | | | | | | | |
| | | | |
| Pharmaceuticals: 1.78% | | | | | | | | | | | | | | | | |
Horizon Pharma plc † | | | | | | | | | | | 40,000 | | | | 568,000 | |
Intersect ENT Incorporated † | | | | | | | | | | | 28,000 | | | | 1,100,400 | |
| |
| | | | 1,668,400 | |
| | | | | | | | | | | | | | | | |
| | | | |
Industrials: 19.52% | | | | | | | | | | | | | | | | |
| | | | |
| Commercial Services & Supplies: 7.02% | | | | | | | | | | | | | | | | |
Cimpress NV † | | | | | | | | | | | 4,000 | | | | 618,800 | |
Deluxe Corporation | | | | | | | | | | | 35,000 | | | | 2,590,350 | |
Healthcare Services Group Incorporated | | | | | | | | | | | 45,000 | | | | 1,956,600 | |
Mobile Mini Incorporated | | | | | | | | | | | 33,000 | | | | 1,435,500 | |
| |
| | | | 6,601,250 | |
| | | | | | | | | | | | | | | | |
| | | | |
| Electrical Equipment: 2.20% | | | | | | | | | | | | | | | | |
Generac Holdings Incorporated † | | | | | | | | | | | 45,000 | | | | 2,065,950 | |
| | | | | | | | | | | | | | | | |
| | | | |
| Machinery: 4.80% | | | | | | | | | | | | | | | | |
Astec Industries Incorporated | | | | | | | | | | | 20,000 | | | | 1,103,600 | |
Franklin Electric Company Incorporated | | | | | | | | | | | 27,000 | | | | 1,100,250 | |
REV Group Incorporated | | | | | | | | | | | 40,000 | | | | 830,400 | |
Rexnord Corporation † | | | | | | | | | | | 50,000 | | | | 1,484,000 | |
| |
| | | | 4,518,250 | |
| | | | | | | | | | | | | | | | |
The accompanying notes are an integral part of these financial statements.
| | | | | | |
| Portfolio of investments—March 31, 2018 | | Wells Fargo Traditional Small Cap Growth Fund | | | 13 | |
| | | | | | | | | | | | | | | | |
| Security name | | | | | | | | Shares | | | Value | |
| | | | |
| Professional Services: 2.26% | | | | | | | | | | | | | | | | |
WageWorks Incorporated † | | | | | | | | | | | 47,020 | | | $ | 2,125,304 | |
| | | | | | | | | | | | | | | | |
| | | | |
| Road & Rail: 1.60% | | | | | | | | | | | | | | | | |
Saia Incorporated † | | | | | | | | | | | 20,000 | | | | 1,503,000 | |
| | | | | | | | | | | | | | | | |
| | | | |
| Trading Companies & Distributors: 1.64% | | | | | | | | | | | | | | | | |
Siteone Landscape Supply Incorporated † | | | | | | | | | | | 20,000 | | | | 1,540,800 | |
| | | | | | | | | | | | | | | | |
| | | | |
Information Technology: 23.76% | | | | | | | | | | | | | | | | |
| | | | |
| Communications Equipment: 0.43% | | | | | | | | | | | | | | | | |
NETGEAR Incorporated † | | | | | | | | | | | 7,000 | | | | 400,400 | |
| | | | | | | | | | | | | | | | |
| | | | |
| Electronic Equipment, Instruments & Components: 2.42% | | | | | | | | | | | | | | | | |
Littelfuse Incorporated | | | | | | | | | | | 8,000 | | | | 1,665,440 | |
VeriFone Systems Incorporated † | | | | | | | | | | | 40,000 | | | | 615,200 | |
| | | | |
| | | | | | | | | | | | | | | 2,280,640 | |
| | | | | | | | | | | | | | | | |
| | | | |
| Internet Software & Services: 7.25% | | | | | | | | | | | | | | | | |
2U Incorporated † | | | | | | | | | | | 10,000 | | | | 840,300 | |
LogMeIn Incorporated | | | | | | | | | | | 20,000 | | | | 2,311,000 | |
Quotient Technology Incorporated † | | | | | | | | | | | 80,000 | | | | 1,048,000 | |
The Trade Desk Incorporated Class A Ǡ | | | | | | | | | | | 52,822 | | | | 2,621,028 | |
| | | | |
| | | | | | | | | | | | | | | 6,820,328 | |
| | | | | | | | | | | | | | | | |
| | | | |
| IT Services: 4.58% | | | | | | | | | | | | | | | | |
Blackhawk Network Incorporated † | | | | | | | | | | | 53,000 | | | | 2,369,100 | |
EPAM Systems Incorporated † | | | | | | | | | | | 10,000 | | | | 1,145,200 | |
Euronet Worldwide Incorporated † | | | | | | | | | | | 10,000 | | | | 789,200 | |
| | | | |
| | | | | | | | | | | | | | | 4,303,500 | |
| | | | | | | | | | | | | | | | |
| | | | |
| Semiconductors & Semiconductor Equipment: 3.22% | | | | | | | | | | | | | | | | |
Advanced Energy Industries Incorporated † | | | | | | | | | | | 20,000 | | | | 1,278,000 | |
Integrated Device Technology Incorporated † | | | | | | | | | | | 27,000 | | | | 825,120 | |
Monolithic Power Systems Incorporated | | | | | | | | | | | 8,000 | | | | 926,160 | |
| | | | |
| | | | | | | | | | | | | | | 3,029,280 | |
| | | | | | | | | | | | | | | | |
| | | | |
| Software: 5.86% | | | | | | | | | | | | | | | | |
Bottomline Technologies (de) Incorporated † | | | | | | | | | | | 40,000 | | | | 1,550,000 | |
PTC Incorporated † | | | | | | | | | | | 11,000 | | | | 858,110 | |
Rapid7 Incorporated † | | | | | | | | | | | 75,000 | | | | 1,917,750 | |
RealPage Incorporated † | | | | | | | | | | | 23,000 | | | | 1,184,500 | |
| | | | |
| | | | | | | | | | | | | | | 5,510,360 | |
| | | | | | | | | | | | | | | | |
| | | | |
Materials: 3.60% | | | | | | | | | | | | | | | | |
| | | | |
| Chemicals: 0.75% | | | | | | | | | | | | | | | | |
Sensient Technologies Corporation | | | | | | | | | | | 10,000 | | | | 705,800 | |
| | | | | | | | | | | | | | | | |
| | | | |
| Construction Materials: 2.60% | | | | | | | | | | | | | | | | |
Summit Materials Incorporated Class A † | | | | | | | | | | | 80,699 | | | | 2,443,566 | |
| | | | | | | | | | | | | | | | |
The accompanying notes are an integral part of these financial statements.
| | | | |
| 14 | | Wells Fargo Traditional Small Cap Growth Fund | | Portfolio of investments—March 31, 2018 |
| | | | | | | | | | | | | | | | |
| Security name | | | | | | | | Shares | | | Value | |
| | | | |
| Metals & Mining: 0.25% | | | | | | | | | | | | | | | | |
Allegheny Technologies Incorporated † | | | | | | | | | | | 10,000 | | | $ | 236,800 | |
| | | | | | | | | | | | | | | | |
| | | | |
Telecommunication Services: 1.40% | | | | | | | | | | | | | | | | |
| | | | |
| Diversified Telecommunication Services: 1.40% | | | | | | | | | | | | | | | | |
ORBCOMM Incorporated † | | | | | | | | | | | 140,000 | | | | 1,311,799 | |
| | | | | | | | | | | | | | | | |
| | | | |
Total Common Stocks (Cost $70,120,317) | | | | | | | | | | | | | | | 91,414,673 | |
| | | | | | | | | | | | | | | | |
| | | | |
Exchange-Traded Funds: 2.00% | | | | | | | | | | | | | | | | |
SPDR S&P Biotech ETF « | | | | | | | | | | | 21,500 | | | | 1,886,195 | |
| | | | | | | | | | | | | | | | |
| | | | |
Total Exchange-Traded Funds (Cost $1,521,021) | | | | | | | | | | | | | | | 1,886,195 | |
| | | | | | | | | | | | | | | | |
| | | | |
| | | Yield | | | | | | | | | | |
| Short-Term Investments: 12.12% | | | | | | | | | | | | | | | | |
| | | | |
| Investment Companies: 12.12% | | | | | | | | | | | | | | | | |
Securities Lending Cash Investment LLC (l)(r)(u) | | | 1.89 | % | | | | | | | 10,521,186 | | | | 10,522,238 | |
Wells Fargo Government Money Market Fund Select Class (l)(u) | | | 1.54 | | | | | | | | 870,700 | | | | 870,700 | |
| | | | |
Total Short-Term Investments (Cost $11,392,938) | | | | | | | | | | | | | | | 11,392,938 | |
| | | | | | | | | | | | | | | | |
| | | | | | | | |
| Total investments in securities (Cost $83,034,276) | | | 111.35 | % | | | 104,693,806 | |
Other assets and liabilities, net | | | (11.35 | ) | | | (10,671,524 | ) |
| | | | | | | | |
| Total net assets | | | 100.00 | % | | $ | 94,022,282 | |
| | | | | | | | |
| † | Non-income-earning security |
| « | All or a portion of this security is on loan. |
| (l) | The issuer of the security is an affiliated person of the Fund as defined in the Investment Company Act of 1940. |
| (r) | The investment is a non-registered investment company purchased with cash collateral received from securities on loan. |
| (u) | The rate represents the 7-day annualized yield at period end. |
Investments in Affiliates
An affiliated investment is an investment in which the Fund owns at least 5% of the outstanding voting shares of the issuer or as a result of other relationships, such as the Fund and the issuer having the same investment manager. Transactions with issuers that were either affiliated persons of the Fund at the beginning of the period or the end of the period were as follows:
| | | | | | | | | | | | | | | | | | | | | | | | | | | | | | | | | | | | |
| | | Shares,
beginning of
period | | | Shares
purchased | | | Shares
sold | | | Shares,
end of
period | | | Net
realized
gains
(losses) | | | Net
change in
unrealized
gains
(losses) | | | Income
from
affiliated
securities | | | Value,
end
of period | | | % of
net
assets | |
Short-Term Investments | | | | | | | | | | | | | | | | | | | | | | | | | | | | | | | | | | | | |
Investment Companies | | | | | | | | | | | | | | | | | | | | | | | | | | | | | | | | | | | | |
Securities Lending Cash Investment LLC | | | 11,600,829 | | | | 60,755,268 | | | | 61,834,911 | | | | 10,521,186 | | | $ | 853 | | | $ | (855 | ) | | $ | 66,137 | | | $ | 10,522,238 | | | | | |
Wells Fargo Government Money Market Fund Select Class | | | 3,170,531 | | | | 21,699,629 | | | | 23,999,460 | | | | 870,700 | | | | 0 | | | | 0 | | | | 26,081 | | | | 870,700 | | | | | |
| | | | | | | | | | | | | | | | | | | | | | | | | | | | | | | | | | | | |
| | | | | | | | | | | | | | | | | | $ | 853 | | | $ | (855 | ) | | $ | 92,218 | | | $ | 11,392,938 | | | | 12.12 | % |
| | | | | | | | | | | | | | | | | | | | | | | | | | | | | | | | | | | | |
The accompanying notes are an integral part of these financial statements.
| | | | | | |
| Statement of assets and liabilities—March 31, 2018 | | Wells Fargo Traditional Small Cap Growth Fund | | | 15 | |
| | | | |
| | | | |
| |
Assets | | | | |
Investments in unaffiliated securities (including $10,306,504 of securities loaned), at value (cost $71,641,338) | | $ | 93,300,868 | |
Investments in affiliated securities, at value (cost $11,392,938) | | | 11,392,938 | |
Cash | | | 9,000 | |
Receivable for Fund shares sold | | | 15,005 | |
Receivable for dividends | | | 10,490 | |
Receivable for securities lending income | | | 7,054 | |
Prepaid expenses and other assets | | | 23,549 | |
| | | | |
Total assets | | | 104,758,904 | |
| | | | |
| |
Liabilities | | | | |
Payable upon receipt of securities loaned | | | 10,521,250 | |
Payable for Fund shares redeemed | | | 71,995 | |
Management fee payable | | | 50,868 | |
Administration fees payable | | | 17,168 | |
Trustees’ fees and expenses payable | | | 2,077 | |
Distribution fee payable | | | 184 | |
Accrued expenses and other liabilities | | | 73,080 | |
| | | | |
Total liabilities | | | 10,736,622 | |
| | | | |
Total net assets | | $ | 94,022,282 | |
| | | | |
| |
NET ASSETS CONSIST OF | | | | |
Paid-in capital | | $ | 68,779,380 | |
Accumulated net investment loss | | | (73,600 | ) |
Accumulated net realized gains on investments | | | 3,656,972 | |
Net unrealized gains on investments | | | 21,659,530 | |
| | | | |
Total net assets | | $ | 94,022,282 | |
| | | | |
| |
COMPUTATION OF NET ASSET VALUE AND OFFERING PRICE PER SHARE | | | | |
Net assets – Class A | | $ | 84,737,510 | |
Shares outstanding – Class A1 | | | 5,531,244 | |
Net asset value per share – Class A | | | $15.32 | |
Maximum offering price per share – Class A2 | | | $16.25 | |
Net assets – Class C | | $ | 273,691 | |
Shares outstanding – Class C1 | | | 19,628 | |
Net asset value per share – Class C | | | $13.94 | |
Net assets – Administrator Class | | $ | 132,599 | |
Shares outstanding – Administrator Class1 | | | 7,735 | |
Net asset value per share – Administrator Class | | | $17.14 | |
Net assets – Institutional Class | | $ | 8,878,482 | |
Shares outstanding – Institutional Class1 | | | 506,402 | |
Net asset value per share – Institutional Class | | | $17.53 | |
| 1 | The Fund has an unlimited number of authorized shares. |
| 2 | Maximum offering price is computed as 100/94.25 of net asset value. On investments of $50,000 or more, the offering price is reduced. |
The accompanying notes are an integral part of these financial statements.
| | | | |
| 16 | | Wells Fargo Traditional Small Cap Growth Fund | | Statement of operations—year ended March 31, 2018 |
| | | | |
| | | | |
| |
Investment income | | | | |
Dividends | | $ | 413,634 | |
Securities lending income from affiliates, net | | | 66,137 | |
Income from affiliated securities | | | 26,081 | |
| | | | |
Total investment income | | | 505,852 | |
| | | | |
| |
Expenses | | | | |
Management fee | | | 795,215 | |
Administration fees | | | | |
Class A | | | 177,856 | |
Class C | | | 509 | |
Administrator Class | | | 180 | |
Institutional Class | | | 11,025 | |
Shareholder servicing fees | | | | |
Class A | | | 211,733 | |
Class C | | | 605 | |
Administrator Class | | | 345 | |
Distribution fee | | | | |
Class C | | | 1,816 | |
Custody and accounting fees | | | 13,879 | |
Professional fees | | | 51,130 | |
Registration fees | | | 67,478 | |
Shareholder report expenses | | | 35,342 | |
Trustees’ fees and expenses | | | 16,753 | |
Other fees and expenses | | | 10,050 | |
| | | | |
Total expenses | | | 1,393,916 | |
Less: Fee waivers and/or expense reimbursements | | | (177,685 | ) |
| | | | |
Net expenses | | | 1,216,231 | |
| | | | |
Net investment loss | | | (710,379 | ) |
| | | | |
| |
REALIZED AND UNREALIZED GAINS (LOSSES) ON INVESTMENTS | | | | |
| |
Net realized gains on: | | | | |
Unaffiliated securities | | | 6,531,396 | |
Affiliated securities | | | 853 | |
| | | | |
Net realized gains on investments | | | 6,532,249 | |
| | | | |
| |
Net change in unrealized gains (losses) on: | | | | |
Unaffiliated securities | | | 8,068,287 | |
Affiliated securities | | | (855 | ) |
| | | | |
Net change in unrealized gains (losses) on investments | | | 8,067,432 | |
| | | | |
Net realized and unrealized gains (losses) on investments | | | 14,599,681 | |
| | | | |
Net increase in net assets resulting from operations | | $ | 13,889,302 | |
| | | | |
The accompanying notes are an integral part of these financial statements.
| | | | | | |
| Statement of changes in net assets | | Wells Fargo Traditional Small Cap Growth Fund | | | 17 | |
| | | | | | | | | | | | | | | | |
| | | Year ended
March 31, 2018 | | | Year ended
March 31, 2017 | |
| | | | |
Operations | | | | | | | | | | | | | | | | |
Net investment loss | | | | | | $ | (710,379 | ) | | | | | | $ | (690,644 | ) |
Net realized gains on investments | | | | | | | 6,532,249 | | | | | | | | 8,140,814 | |
Net change in unrealized gains (losses) on investments | | | | | | | 8,067,432 | | | | | | | | 9,695,337 | |
| | | | |
Net increase in net assets resulting from operations | | | | | | | 13,889,302 | | | | | | | | 17,145,507 | |
| | | | |
| | | | |
Distributions to shareholders from | | | | | | | | | | | | | | | | |
Net realized gains | | | | | | | | | | | | | | | | |
Class A | | | | | | | (5,360,360 | ) | | | | | | | (2,281,810 | ) |
Class C | | | | | | | (16,142 | ) | | | | | | | (5,379 | ) |
Administrator Class | | | | | | | (7,844 | ) | | | | | | | (4,301 | ) |
Institutional Class | | | | | | | (468,228 | ) | | | | | | | (251,489 | ) |
| | | | |
Total distributions to shareholders | | | | | | | (5,852,574 | ) | | | | | | | (2,542,979 | ) |
| | | | |
| | | | |
Capital share transactions | | | Shares | | | | | | | | Shares | | | | | |
Proceeds from shares sold | | | | | | | | | | | | | | | | |
Class A | | | 100,773 | | | | 1,525,252 | | | | 89,073 | | | | 1,166,255 | |
Class C | | | 3,801 | | | | 52,022 | | | | 3,789 | | | | 47,755 | |
Administrator Class | | | 6,799 | | | | 114,428 | | | | 6,204 | | | | 87,459 | |
Institutional Class | | | 85,364 | | | | 1,472,577 | | | | 270,621 | | | | 4,080,166 | |
| | | | |
| | | | | | | 3,164,279 | | | | | | | | 5,381,635 | |
| | | | |
Reinvestment of distributions | | | | | | | | | | | | | | | | |
Class A | | | 352,388 | | | | 5,243,537 | | | | 164,284 | | | | 2,217,829 | |
Class C | | | 975 | | | | 13,232 | | | | 388 | | | | 4,844 | |
Administrator Class | | | 362 | | | | 6,032 | | | | 269 | | | | 4,025 | |
Institutional Class | | | 26,092 | | | | 443,822 | | | | 15,888 | | | | 242,297 | |
| | | | |
| | | | | | | 5,706,623 | | | | | | | | 2,468,995 | |
| | | | |
Payment for shares redeemed | | | | | | | | | | | | | | | | |
Class A | | | (795,898 | ) | | | (11,972,813 | ) | | | (1,362,749 | ) | | | (17,646,891 | ) |
Class C | | | (2,471 | ) | | | (34,576 | ) | | | (1,303 | ) | | | (15,835 | ) |
Administrator Class | | | (10,531 | ) | | | (172,453 | ) | | | (176,884 | ) | | | (2,575,835 | ) |
Institutional Class | | | (107,067 | ) | | | (1,838,265 | ) | | | (447,579 | ) | | | (6,776,181 | ) |
| | | | |
| | | | | | | (14,018,107 | ) | | | | | | | (27,014,742 | ) |
| | | | |
Net decrease in net assets resulting from capital share transactions | | | | | | | (5,147,205 | ) | | | | | | | (19,164,112 | ) |
| | | | |
Total increase (decrease) in net assets | | | | | | | 2,889,523 | | | | | | | | (4,561,584 | ) |
| | | | |
| | | | |
Net assets | | | | | | | | | | | | | | | | |
Beginning of period | | | | | | | 91,132,759 | | | | | | | | 95,694,343 | |
| | | | |
End of period | | | | | | $ | 94,022,282 | | | | | | | $ | 91,132,759 | |
| | | | |
Accumulated net investment loss | | | | | | $ | (73,600 | ) | | | | | | $ | (12,593 | ) |
| | | | |
The accompanying notes are an integral part of these financial statements.
| | | | |
| 18 | | Wells Fargo Traditional Small Cap Growth Fund | | Financial highlights |
(For a share outstanding throughout each period)
| | | | | | | | | | | | | | | | | | | | | | | | |
| | | Year ended March 31 | | | Year ended
October 31, 2013 | |
| CLASS A | | 2018 | | | 2017 | | | 2016 | | | 2015 | | | 20141 | | |
Net asset value, beginning of period | | | $14.08 | | | | $12.05 | | | | $18.04 | | | | $20.37 | | | | $23.11 | | | | $17.08 | |
Net investment loss | | | (0.12 | )2 | | | (0.10 | )2 | | | (0.12 | )2 | | | (0.18 | ) | | | (0.09 | )2 | | | (0.11 | )2 |
Net realized and unrealized gains (losses) on investments | | | 2.35 | | | | 2.51 | | | | (2.13 | ) | | | 1.33 | | | | 0.96 | | | | 6.34 | |
| | | | | | | | | | | | | | | | | | | | | | | | |
Total from investment operations | | | 2.23 | | | | 2.41 | | | | (2.25 | ) | | | 1.15 | | | | 0.87 | | | | 6.23 | |
Distributions to shareholders from | | | | | | | | | | | | | | | | | | | | | | | | |
Net realized gains | | | (0.99 | ) | | | (0.38 | ) | | | (3.74 | ) | | | (3.48 | ) | | | (3.61 | ) | | | (0.20 | ) |
Net asset value, end of period | | | $15.32 | | | | $14.08 | | | | $12.05 | | | | $18.04 | | | | $20.37 | | | | $23.11 | |
Total return3 | | | 16.08 | % | | | 20.10 | % | | | (12.86 | )% | | | 6.77 | % | | | 4.14 | % | | | 36.98 | % |
Ratios to average net assets (annualized) | | | | | | | | | | | | | | | | | | | | | | | | |
Gross expenses | | | 1.52 | % | | | 1.51 | % | | | 1.50 | % | | | 1.47 | % | | | 1.54 | % | | | 1.48 | % |
Net expenses | | | 1.33 | % | | | 1.33 | % | | | 1.33 | % | | | 1.33 | % | | | 1.33 | % | | | 1.33 | % |
Net investment loss | | | (0.79 | )% | | | (0.77 | )% | | | (0.74 | )% | | | (0.87 | )% | | | (1.04 | )% | | | (0.58 | )% |
Supplemental data | | | | | | | | | | | | | | | | | | | | | | | | |
Portfolio turnover rate | | | 44 | % | | | 113 | % | | | 123 | % | | | 73 | % | | | 36 | % | | | 77 | % |
Net assets, end of period (000s omitted) | | | $84,738 | | | | $82,734 | | | | $84,139 | | | | $123,712 | | | | $141,446 | | | | $141,933 | |
| 1 | For the five months ended March 31, 2014. The Fund changed its fiscal year end from October 31 to March 31, effective March 31, 2014. |
| 2 | Calculated based upon average shares outstanding |
| 3 | Total return calculations do not include any sales charges. Returns for periods of less than one year are not annualized. |
The accompanying notes are an integral part of these financial statements.
| | | | | | |
| Financial highlights | | Wells Fargo Traditional Small Cap Growth Fund | | | 19 | |
(For a share outstanding throughout each period)
| | | | | | | | | | | | | | | | | | | | | | | | |
| | | Year ended March 31 | | | Year ended
October 31, 2013 | |
| CLASS C | | 2018 | | | 2017 | | | 2016 | | | 2015 | | | 20141 | | |
Net asset value, beginning of period | | | $12.99 | | | | $11.22 | | | | $17.21 | | | | $19.73 | | | | $22.56 | | | | $16.80 | |
Net investment loss | | | (0.21 | )2 | | | (0.18 | )2 | | | (0.18 | ) | | | (0.29 | )2 | | | (0.15 | )2 | | | (0.26 | ) |
Net realized and unrealized gains (losses) on investments | | | 2.15 | | | | 2.33 | | | | (2.07 | ) | | | 1.25 | | | | 0.93 | | | | 6.22 | |
| | | | | | | | | | | | | | | | | | | | | | | | |
Total from investment operations | | | 1.94 | | | | 2.15 | | | | (2.25 | ) | | | 0.96 | | | | 0.78 | | | | 5.96 | |
Distributions to shareholders from | | | | | | | | | | | | | | | | | | | | | | | | |
Net realized gains | | | (0.99 | ) | | | (0.38 | ) | | | (3.74 | ) | | | (3.48 | ) | | | (3.61 | ) | | | (0.20 | ) |
Net asset value, end of period | | | $13.94 | | | | $12.99 | | | | $11.22 | | | | $17.21 | | | | $19.73 | | | | $22.56 | |
Total return3 | | | 15.17 | % | | | 19.26 | % | | | (13.55 | )% | | | 5.98 | % | | | 3.85 | % | | | 35.92 | % |
Ratios to average net assets (annualized) | | | | | | | | | | | | | | | | | | | | | | | | |
Gross expenses | | | 2.27 | % | | | 2.26 | % | | | 2.25 | % | | | 2.22 | % | | | 2.30 | % | | | 2.23 | % |
Net expenses | | | 2.08 | % | | | 2.08 | % | | | 2.08 | % | | | 2.08 | % | | | 2.08 | % | | | 2.08 | % |
Net investment loss | | | (1.54 | )% | | | (1.52 | )% | | | (1.49 | )% | | | (1.61 | )% | | | (1.81 | )% | | | (1.36 | )% |
Supplemental data | | | | | | | | | | | | | | | | | | | | | | | | |
Portfolio turnover rate | | | 44 | % | | | 113 | % | | | 123 | % | | | 73 | % | | | 36 | % | | | 77 | % |
Net assets, end of period (000s omitted) | | | $274 | | | | $225 | | | | $162 | | | | $232 | | | | $403 | | | | $150 | |
| 1 | For the five months ended March 31, 2014. The Fund changed its fiscal year end from October 31 to March 31, effective March 31, 2014. |
| 2 | Calculated based upon average shares outstanding |
| 3 | Total return calculations do not include any sales charges. Returns for periods of less than one year are not annualized. |
The accompanying notes are an integral part of these financial statements.
| | | | |
| 20 | | Wells Fargo Traditional Small Cap Growth Fund | | Financial highlights |
(For a share outstanding throughout each period)
| | | | | | | | | | | | | | | | | | | | | | | | |
| | | Year ended March 31 | | | Year ended
October 31, 2013 | |
| ADMINISTRATOR CLASS | | 2018 | | | 2017 | | | 2016 | | | 2015 | | | 20141 | | |
Net asset value, beginning of period | | | $15.63 | | | | $13.29 | | | | $19.44 | | | | $21.65 | | | | $24.33 | | | | $17.94 | |
Net investment loss | | | (0.11 | )2 | | | (0.09 | )2 | | | (0.10 | )2 | | | (0.15 | )2 | | | (0.08 | )2 | | | (0.09 | )2 |
Net realized and unrealized gains (losses) on investments | | | 2.61 | | | | 2.81 | | | | (2.31 | ) | | | 1.42 | | | | 1.01 | | | | 6.68 | |
| | | | | | | | | | | | | | | | | | | | | | | | |
Total from investment operations | | | 2.50 | | | | 2.72 | | | | (2.41 | ) | | | 1.27 | | | | 0.93 | | | | 6.59 | |
Distributions to shareholders from | | | | | | | | | | | | | | | | | | | | | | | | |
Net realized gains | | | (0.99 | ) | | | (0.38 | ) | | | (3.74 | ) | | | (3.48 | ) | | | (3.61 | ) | | | (0.20 | ) |
Net asset value, end of period | | | $17.14 | | | | $15.63 | | | | $13.29 | | | | $19.44 | | | | $21.65 | | | | $24.33 | |
Total return3 | | | 16.21 | % | | | 20.56 | % | | | (12.76 | )% | | | 6.93 | % | | | 4.18 | % | | | 37.21 | % |
Ratios to average net assets (annualized) | | | | | | | | | | | | | | | | | | | | | | | | |
Gross expenses | | | 1.44 | % | | | 1.43 | % | | | 1.39 | % | | | 1.29 | % | | | 1.32 | % | | | 1.26 | % |
Net expenses | | | 1.20 | % | | | 1.20 | % | | | 1.20 | % | | | 1.19 | % | | | 1.19 | % | | | 1.17 | % |
Net investment loss | | | (0.66 | )% | | | (0.64 | )% | | | (0.61 | )% | | | (0.73 | )% | | | (0.90 | )% | | | (0.43 | )% |
Supplemental data | | | | | | | | | | | | | | | | | | | | | | | | |
Portfolio turnover rate | | | 44 | % | | | 113 | % | | | 123 | % | | | 73 | % | | | 36 | % | | | 77 | % |
Net assets, end of period (000s omitted) | | | $133 | | | | $174 | | | | $2,413 | | | | $3,128 | | | | $3,896 | | | | $3,882 | |
| 1 | For the five months ended March 31, 2014. The Fund changed its fiscal year end from October 31 to March 31, effective March 31, 2014. |
| 2 | Calculated based upon average shares outstanding |
| 3 | Returns for periods of less than one year are not annualized. |
The accompanying notes are an integral part of these financial statements.
| | | | | | |
| Financial highlights | | Wells Fargo Traditional Small Cap Growth Fund | | | 21 | |
(For a share outstanding throughout each period)
| | | | | | | | | | | | | | | | | | | | | | | | |
| | | Year ended March 31 | | | Year ended
October 31, 2013 | |
| INSTITUTIONAL CLASS | | 2018 | | | 2017 | | | 2016 | | | 2015 | | | 20141 | | |
Net asset value, beginning of period | | | $15.94 | | | | $13.54 | | | | $19.69 | | | | $21.84 | | | | $24.50 | | | | $18.03 | |
Net investment income (loss) | | | (0.08 | )2 | | | (0.06 | )2 | | | (0.07 | )2 | | | (0.11 | )2 | | | (0.07 | )2 | | | 0.00 | 2,3 |
Net realized and unrealized gains (losses) on investments | | | 2.66 | | | | 2.84 | | | | (2.34 | ) | | | 1.44 | | | | 1.02 | | | | 6.67 | |
| | | | | | | | | | | | | | | | | | | | | | | | |
Total from investment operations | | | 2.58 | | | | 2.78 | | | | (2.41 | ) | | | 1.33 | | | | 0.95 | | | | 6.67 | |
Distributions to shareholders from | | | | | | | | | | | | | | | | | | | | | | | | |
Net realized gains | | | (0.99 | ) | | | (0.38 | ) | | | (3.74 | ) | | | (3.48 | ) | | | (3.61 | ) | | | (0.20 | ) |
Net asset value, end of period | | | $17.53 | | | | $15.94 | | | | $13.54 | | | | $19.69 | | | | $21.84 | | | | $24.50 | |
Total return4 | | | 16.40 | % | | | 20.62 | % | | | (12.58 | )% | | | 7.16 | % | | | 4.29 | % | | | 37.42 | % |
Ratios to average net assets (annualized) | | | | | | | | | | | | | | | | | | | | | | | | |
Gross expenses | | | 1.19 | % | | | 1.18 | % | | | 1.14 | % | | | 1.04 | % | | | 1.10 | % | | | 1.04 | % |
Net expenses | | | 0.98 | % | | | 0.98 | % | | | 0.98 | % | | | 0.98 | % | | | 0.98 | % | | | 0.98 | % |
Net investment income (loss) | | | (0.44 | )% | | | (0.43 | )% | | | (0.39 | )% | | | (0.52 | )% | | | (0.69 | )% | | | 0.01 | % |
Supplemental data | | | | | | | | | | | | | | | | | | | | | | | | |
Portfolio turnover rate | | | 44 | % | | | 113 | % | | | 123 | % | | | 73 | % | | | 36 | % | | | 77 | % |
Net assets, end of period (000s omitted) | | | $8,878 | | | | $8,001 | | | | $8,980 | | | | $11,812 | | | | $17,086 | | | | $17,997 | |
| 1 | For the five months ended March 31, 2014. The Fund changed its fiscal year end from October 31 to March 31, effective March 31, 2014. |
| 2 | Calculated based upon average shares outstanding |
| 3 | Amount is less than $0.005. |
| 4 | Returns for periods of less than one year are not annualized. |
The accompanying notes are an integral part of these financial statements.
| | | | |
| 22 | | Wells Fargo Traditional Small Cap Growth Fund | | Notes to financial statements |
1. ORGANIZATION
Wells Fargo Funds Trust (the “Trust”), a Delaware statutory trust organized on March 10, 1999, is an open-end management investment company registered under the Investment Company Act of 1940, as amended (the “1940 Act”). As an investment company, the Trust follows the accounting and reporting guidance in Financial Accounting Standards Board Accounting Standards Codification Topic 946, Financial Services – Investment Companies. These financial statements report on the Wells Fargo Traditional Small Cap Growth Fund (the “Fund”) which is a diversified series of the Trust.
2. SIGNIFICANT ACCOUNTING POLICIES
The following significant accounting policies, which are consistently followed in the preparation of the financial statements of the Fund, are in conformity with U.S. generally accepted accounting principles which require management to make estimates and assumptions that affect the reported amounts of assets and liabilities, disclosure of contingent assets and liabilities at the date of the financial statements, and the reported amounts of revenues and expenses during the reporting period. Actual results could differ from those estimates.
Securities valuation
All investments are valued each business day as of the close of regular trading on the New York Stock Exchange (generally 4 p.m. Eastern Time), although the Fund may deviate from this calculation time under unusual or unexpected circumstances.
Equity securities that are listed on a foreign or domestic exchange or market are valued at the official closing price or, if none, the last sales price. If no sale occurs on the principal exchange or market that day, a fair value price will be determined in accordance with the Fund’s Valuation Procedures.
Investments in registered open-end investment companies are valued at net asset value. Interests in non-registered investment companies that are redeemable at net asset value are fair valued normally at net asset value.
Investments which are not valued using any of the methods discussed above are valued at their fair value, as determined in good faith by the Board of Trustees of the Fund. The Board of Trustees has established a Valuation Committee comprised of the Trustees and has delegated to it the authority to take any actions regarding the valuation of portfolio securities that the Valuation Committee deems necessary or appropriate, including determining the fair value of portfolio securities, unless the determination has been delegated to the Wells Fargo Asset Management Pricing Committee at Wells Fargo Funds Management, LLC (“Funds Management”). The Board of Trustees retains the authority to make or ratify any valuation decisions or approve any changes to the Valuation Procedures as it deems appropriate. On a quarterly basis, the Board of Trustees receives reports on any valuation actions taken by the Valuation Committee or the Wells Fargo Asset Management Pricing Committee which may include items for ratification.
Valuations of fair valued securities are compared to the next actual sales price when available, or other appropriate market values, to assess the continued appropriateness of the fair valuation methodologies used. These securities are fair valued on a day-to-day basis, taking into consideration changes to appropriate market information and any significant changes to the inputs considered in the valuation process until there is a readily available price provided on an exchange or by an independent pricing service. Valuations received from an independent pricing service or independent broker-dealer quotes are periodically validated by comparisons to most recent trades and valuations provided by other independent pricing services in addition to the review of prices by the manager and/or subadviser. Unobservable inputs used in determining fair valuations are identified based on the type of security, taking into consideration factors utilized by market participants in valuing the investment, knowledge about the issuer and the current market environment.
Securities lending
The Fund may lend its securities from time to time in order to earn additional income in the form of fees or interest on securities received as collateral or the investment of any cash received as collateral. The Fund continues to receive interest or dividends on the securities loaned. The Fund receives collateral in the form of cash or securities with a value at least equal to the value of the securities on loan. The value of the loaned securities is determined at the close of each business day and any additional required collateral is delivered to the Fund on the next business day. In a securities lending transaction, the net asset value of the Fund will be affected by an increase or decrease in the value of the securities loaned and by an increase or decrease in the value of the instrument in which collateral is invested. The amount of securities lending activity undertaken by the Fund fluctuates from time to time. In the event of default or bankruptcy by the borrower, the Fund may be prevented from recovering the loaned securities or gaining access to the collateral or may experience delays or costs in doing so. In addition, the investment of any cash collateral received may lose all or part of its value. The Fund has the right under the lending agreement to recover the securities from the borrower on demand.
| | | | | | |
| Notes to financial statements | | Wells Fargo Traditional Small Cap Growth Fund | | | 23 | |
The Fund lends its securities through an unaffiliated securities lending agent. Cash collateral received in connection with its securities lending transactions is invested in Securities Lending Cash Investments, LLC (the “Securities Lending Fund”). The Securities Lending Fund is exempt from registration under Section 3(c)(7) of the 1940 Act and is managed by Funds Management and is subadvised by Wells Capital Management Incorporated (“WellsCap”), an affiliate of Funds Management and an indirect wholly owned subsidiary of Wells Fargo & Company (“Wells Fargo”). Funds Management receives an advisory fee starting at 0.05% and declining to 0.01% as the average daily net assets of the Securities Lending Fund increase. All of the fees received by Funds Management are paid to WellsCap for its services as subadviser. The Securities Lending Fund seeks to provide a positive return compared to the daily Fed Funds Open Rate by investing in high-quality, U.S. dollar-denominated short-term money market instruments. Securities Lending Fund investments are valued at the evaluated bid price provided by an independent pricing service. Income earned from investment in the Securities Lending Fund, if any, is included in securities lending income from affiliates (net of fees and rebates) on the Statement of Operations.
Security transactions and income recognition
Securities transactions are recorded on a trade date basis. Realized gains or losses are recorded on the basis of identified cost.
Dividend income is recognized on the ex-dividend date.
Distributions to shareholders
Distributions to shareholders from net investment income and any net realized gains are recorded on the ex-dividend date and paid at least annually. Such distributions are determined in accordance with income tax regulations and may differ from U.S. generally accepted accounting principles. Dividend sources are estimated at the time of declaration. The tax character of distributions is determined as of the Fund’s fiscal year end. Therefore, a portion of the Fund’s distributions made prior to the Fund’s fiscal year end may be categorized as a tax return of capital at year end.
Federal and other taxes
The Fund intends to continue to qualify as a regulated investment company by distributing substantially all of its investment company taxable income and any net realized capital gains (after reduction for capital loss carryforwards) sufficient to relieve it from all, or substantially all, federal income taxes. Accordingly, no provision for federal income taxes was required.
The Fund’s income and federal excise tax returns and all financial records supporting those returns for the prior three fiscal years are subject to examination by the federal and Delaware revenue authorities. Management has analyzed the Fund’s tax positions taken on federal, state, and foreign tax returns for all open tax years and does not believe that there are any uncertain tax positions that require recognition of a tax liability.
As of March 31, 2018, the aggregate cost of all investments for federal income tax purposes was $83,158,119 and the unrealized gains (losses) consisted of:
| | | | |
Gross unrealized gains | | $ | 23,840,533 | |
Gross unrealized losses | | | (2,304,846 | ) |
Net unrealized gains | | $ | 21,535,687 | |
Reclassifications are made to the Fund’s capital accounts for permanent tax differences to reflect income and gains available for distribution (or available capital loss carryforwards) under federal income tax regulations. U.S. generally accepted accounting principles require that certain components of net assets be adjusted to reflect permanent differences between financial and tax reporting. These reclassifications have no effect on net assets or net asset values per share. The primary permanent differences causing such reclassifications are due to dividends from certain securities, net operating losses, and recognition of partnership income. At March 31, 2018, as a result of permanent book-to-tax differences, the following reclassification adjustments were made on the Statement of Assets and Liabilities:
| | | | |
| Paid-in capital | | Accumulated net investment loss | | Accumulated net
realized gains
on investments |
| $(4,963) | | $649,372 | | $(644,409) |
As of March 31, 2018, the Fund had a qualified late-year ordinary loss of $61,372 which will be recognized on the first day of the following fiscal year.
| | | | |
| 24 | | Wells Fargo Traditional Small Cap Growth Fund | | Notes to financial statements |
Class allocations
The separate classes of shares offered by the Fund differ principally in applicable sales charges, distribution, shareholder servicing, and administration fees. Class specific expenses are charged directly to that share class. Investment income, common expenses, and realized and unrealized gains (losses) on investments are allocated daily to each class of shares based on the relative proportion of net assets of each class.
3. FAIR VALUATION MEASUREMENTS
Fair value measurements of investments are determined within a framework that has established a fair value hierarchy based upon the various data inputs utilized in determining the value of the Fund’s investments. The three-level hierarchy gives the highest priority to unadjusted quoted prices in active markets for identical assets or liabilities (Level 1) and the lowest priority to unobservable inputs (Level 3). The Fund’s investments are classified within the fair value hierarchy based on the lowest level of input that is significant to the fair value measurement. The inputs are summarized into three broad levels as follows:
| ∎ | | Level 1 – quoted prices in active markets for identical securities |
| ∎ | | Level 2 – other significant observable inputs (including quoted prices for similar securities, interest rates, prepayment speeds, credit risk, etc.) |
| ∎ | | Level 3 – significant unobservable inputs (including the Fund’s own assumptions in determining the fair value of investments) |
The inputs or methodologies used for valuing investments in securities are not necessarily an indication of the risk associated with investing in those securities.
The following is a summary of the inputs used in valuing the Fund’s assets and liabilities as of March 31, 2018:
| | | | | | | | | | | | | | | | |
| | | Quoted prices
(Level 1) | | | Other significant
observable inputs
(Level 2) | | | Significant
unobservable inputs (Level 3) | | | Total | |
Assets | | | | | | | | | | | | | | | | |
Investments in: | | | | | | | | | | | | | | | | |
| | | | |
Common stocks | | | | | | | | | | | | | | | | |
Consumer discretionary | | $ | 13,847,801 | | | $ | 0 | | | $ | 0 | | | $ | 13,847,801 | |
Consumer staples | | | 2,138,500 | | | | 0 | | | | 0 | | | | 2,138,500 | |
Energy | | | 555,100 | | | | 0 | | | | 0 | | | | 555,100 | |
Financials | | | 7,818,400 | | | | 0 | | | | 0 | | | | 7,818,400 | |
Health care | | | 21,657,845 | | | | 0 | | | | 0 | | | | 21,657,845 | |
Industrials | | | 18,354,554 | | | | 0 | | | | 0 | | | | 18,354,554 | |
Information technology | | | 22,344,508 | | | | 0 | | | | 0 | | | | 22,344,508 | |
Materials | | | 3,386,166 | | | | 0 | | | | 0 | | | | 3,386,166 | |
Telecommunication services | | | 1,311,799 | | | | 0 | | | | 0 | | | | 1,311,799 | |
| | | | |
Exchange-traded funds | | | 1,886,195 | | | | 0 | | | | 0 | | | | 1,886,195 | |
| | | | |
Short-term investments | | | | | | | | | | | | | | | | |
Investment companies | | | 870,700 | | | | 0 | | | | 0 | | | | 870,700 | |
Investments measured at net asset value* | | | | | | | | | | | | | | | 10,522,238 | |
Total assets | | $ | 94,171,568 | | | $ | 0 | | | $ | 0 | | | $ | 104,693,806 | |
| * | Investments that are measured at fair value using the net asset value per share (or its equivalent) as a practical expedient have not been categorized in the fair value hierarchy. The fair value amount presented in the table is intended to permit reconciliation of the fair value hierarchy to the amounts presented in the Statement of Assets and Liabilities. The Fund’s investment in Securities Lending Cash Investments, LLC valued at $10,522,238 does not have a redemption period notice, can be redeemed daily and does not have any unfunded commitments. |
The Fund recognizes transfers between levels within the fair value hierarchy at the end of the reporting period. At March 31, 2018, the Fund did not have any transfers into/out of Level 1, Level 2, or Level 3.
| | | | | | |
| Notes to financial statements | | Wells Fargo Traditional Small Cap Growth Fund | | | 25 | |
4. TRANSACTIONS WITH AFFILIATES
Management fee
Funds Management, an indirect wholly owned subsidiary of Wells Fargo, is the manager of the Fund and provides advisory and fund-level administrative services under an investment management agreement. Under the investment management agreement, Funds Management is responsible for, among other services, implementing the investment objectives and strategies of the Fund, supervising the subadviser, providing fund-level administrative services in connection with the Fund’s operations, and providing any other fund-level administrative services reasonably necessary for the operation of the Fund. As compensation for its services under the investment management agreement, Funds Management is entitled to receive an annual management fee starting at 0.85% and declining to 0.71% as the average daily net assets of the Fund increase. For the year ended March 31, 2018, the management fee was equivalent to an annual rate of 0.85% of the Fund’s average daily net assets.
Funds Management has retained the services of a subadviser to provide daily portfolio management to the Fund. The fee for subadvisory services is borne by Funds Management. WellsCap is the subadviser to the Fund and is entitled to receive a fee from Funds Management at an annual rate starting at 0.55% and declining to 0.40% as the average daily net assets of the Fund increase.
Administration fees
Under a class-level administration agreement, Funds Management provides class-level administrative services to the Fund, which includes paying fees and expenses for services provided by the transfer agent, sub-transfer agents, omnibus account servicers and record-keepers. As compensation for its services under the class-level administration agreement, Funds Management receives an annual fee which is calculated based on the average daily net assets of each class as follows:
| | | | |
| | | Class-level
administration fee | |
Class A, Class C | | | 0.21 | % |
Administrator Class, Institutional Class | | | 0.13 | |
Funds Management has contractually waived and/or reimbursed management and administration fees to the extent necessary to maintain certain net operating expense ratios for the Fund. Waiver of fees and/or reimbursement of expenses by Funds Management were made first from fund level expenses on a proportionate basis and then from class specific expenses. Funds Management has committed through July 31, 2018 to waive fees and/or reimburse expenses to the extent necessary to cap the Fund’s expenses at 1.33% for Class A shares, 2.08% for Class C shares, 1.20% for Administrator Class shares, and 0.98% for Institutional Class shares. After this time, the cap may be increased or the commitment to maintain the cap may be terminated only with the approval of the Board of Trustees.
Distribution fee
The Trust has adopted a distribution plan for Class C shares of the Fund pursuant to Rule 12b-1 under the 1940 Act. A distribution fee is charged to Class C shares and paid to Wells Fargo Funds Distributor, LLC (“Funds Distributor”), the principal underwriter, at an annual rate of 0.75% of the average daily net assets of Class C shares.
In addition, Funds Distributor is entitled to receive the front-end sales charge from the purchase of Class A shares and a contingent deferred sales charge on the redemption of certain Class A shares. Funds Distributor is also entitled to receive the contingent deferred sales charges from redemptions of Class C shares. For the year ended March 31, 2018, Funds Distributor received $632 from the sale of Class A shares. No contingent deferred sales charges were incurred by Class A and Class C shares for the year ended March 31, 2018.
Shareholder servicing fees
The Trust has entered into contracts with one or more shareholder servicing agents, whereby Class A, Class C, and Administrator Class of the Fund are charged a fee at an annual rate of 0.25% of the average daily net assets of each respective class.
A portion of these total shareholder servicing fees were paid to affiliates of Wells Fargo.
Interfund transactions
The Fund may purchase or sell portfolio investment securities to certain other Wells Fargo affiliates pursuant to Rule 17a-7 under the 1940 Act and under procedures adopted by the Board of Trustees. The procedures have been designed to ensure that these interfund transactions, which do not incur broker commissions, are effected at current market prices.
| | | | |
| 26 | | Wells Fargo Traditional Small Cap Growth Fund | | Notes to financial statements |
5. INVESTMENT PORTFOLIO TRANSACTIONS
Purchases and sales of investments, excluding U.S. government obligations (if any) and short-term securities, for the year ended March 31, 2018 were $40,141,287 and $47,765,367, respectively.
6. BANK BORROWINGS
The Trust (excluding the money market funds and certain other funds) and Wells Fargo Variable Trust are parties to a $280,000,000 revolving credit agreement whereby the Fund is permitted to use bank borrowings for temporary or emergency purposes, such as to fund shareholder redemption requests. Interest under the credit agreement is charged to the Fund based on a borrowing rate equal to the higher of the Federal Funds rate in effect on that day plus 1.25% or the overnight LIBOR rate in effect on that day plus 1.25%. In addition, an annual commitment fee equal to 0.25% of the unused balance is allocated to each participating fund. Prior to August 29, 2017, the revolving credit agreement amount was $250,000,000.
For the year ended March 31, 2018, there were no borrowings by the Fund under the agreement.
7. DISTRIBUTIONS TO SHAREHOLDERS
The tax character of distributions paid during the years ended March 31, 2018 and March 31, 2017 were as follows:
| | | | | | | | |
| | | Year ended March 31 | |
| | | 2018 | | | 2017 | |
Ordinary income | | $ | 2,191,875 | | | $ | 0 | |
Long-term capital gain | | | 3,660,699 | | | | 2,542,979 | |
As of March 31, 2018, the components of distributable earnings on a tax basis were as follows:
| | | | |
Undistributed
long-term
gain | | Unrealized
gains | | Late-year ordinary losses deferred |
| $3,780,815 | | $21,535,687 | | $(61,372) |
8. CONCENTRATION RISK
Concentration risks result from exposure to a limited number of sectors. A fund that invests a substantial portion of its assets in any sector may be more affected by changes in that sector than would be a fund whose investments are not heavily weighted in any sector.
9. INDEMNIFICATION
Under the Trust’s organizational documents, the officers and Trustees have been granted certain indemnification rights against certain liabilities that may arise out of performance of their duties to the Trust. Additionally, in the normal course of business, the Trust may enter into contracts with service providers that contain a variety of indemnification clauses. The Trust’s maximum exposure under these arrangements is dependent on future claims that may be made against the Fund and, therefore, cannot be estimated.
| | | | | | |
| Report of independent registered public accounting firm | | Wells Fargo Traditional Small Cap Growth Fund | | | 27 | |
BOARD OF TRUSTEES AND SHAREHOLDERS OF WELLS FARGO FUNDS TRUST:
Opinion on the Financial Statements
We have audited the accompanying statement of assets and liabilities of the Wells Fargo Traditional Small Cap Growth Fund (the “Fund”), one of the funds constituting the Wells Fargo Funds Trust, including the portfolio of investments, as of March 31, 2018, the related statement of operations for the year then ended, the statements of changes in net assets for each of the years in the two-year period then ended, and the related notes (collectively, the “financial statements”) and the financial highlights for each of the years in the four-year period then ended, the period from November 1, 2013 to March 31, 2014, and the year ended October 31, 2013. In our opinion, the financial statements and financial highlights present fairly, in all material respects, the financial position of the Fund as of March 31, 2018, the results of its operations for the year then ended, the changes in its net assets for each of the years in the two-year period then ended, and the financial highlights for each of the years or periods noted above, in conformity with U.S. generally accepted accounting principles.
Basis for Opinion
These financial statements and financial highlights are the responsibility of the Fund’s management. Our responsibility is to express an opinion on these financial statements and financial highlights based on our audits. We are a public accounting firm registered with the Public Company Accounting Oversight Board (United States) (“PCAOB”) and are required to be independent with respect to the Fund in accordance with the U.S. federal securities laws and the applicable rules and regulations of the Securities and Exchange Commission and the PCAOB.
We conducted our audits in accordance with the standards of the PCAOB. Those standards require that we plan and perform the audit to obtain reasonable assurance about whether the financial statements and financial highlights are free of material misstatement, whether due to error or fraud. Our audits included performing procedures to assess the risks of material misstatement of the financial statements and financial highlights, whether due to error or fraud, and performing procedures that respond to those risks. Such procedures included examining, on a test basis, evidence regarding the amounts and disclosures in the financial statements and financial highlights. Such procedures also included confirmation of securities owned as of March 31, 2018, by correspondence with the custodian and brokers, or by other appropriate auditing procedures. Our audits also included evaluating the accounting principles used and significant estimates made by management, as well as evaluating the overall presentation of the financial statements and financial highlights. We believe that our audits provide a reasonable basis for our opinion.

We have not been able to determine the specific year that we began serving as the auditor of one or more Wells Fargo Funds investment companies, however we are aware that we have served as the auditor of one or more Wells Fargo Funds investment companies since at least 1955.
Boston, Massachusetts
May 23, 2018
| | | | |
| 28 | | Wells Fargo Traditional Small Cap Growth Fund | | Other information (unaudited) |
TAX INFORMATION
For corporate shareholders, pursuant to Section 854 of the Internal Revenue Code, 34.42% of ordinary income dividends qualify for the corporate dividends-received deduction for the fiscal year ended March 31, 2018.
Pursuant to Section 852 of the Internal Revenue Code, $3,660,699 was designated as a 20% rate gain distribution for the fiscal year ended March 31, 2018.
Pursuant to Section 854 of the Internal Revenue Code, $753,088 of income dividends paid during the fiscal year ended March 31, 2018 has been designated as qualified dividend income (QDI).
For the fiscal year ended March 31, 2018, $2,191,875 has been designated as short-term capital gain dividends for nonresident alien shareholders pursuant to Section 871 of the Internal Revenue Code.
PROXY VOTING INFORMATION
A description of the policies and procedures that the Fund uses to determine how to vote proxies relating to portfolio securities is available, upon request, by calling 1-800-222-8222, visiting our website at wellsfargofunds.com, or visiting the SEC website at sec.gov. Information regarding how the Fund voted proxies relating to portfolio securities during the most recent 12-month period ended June 30 is available on the Fund’s website at wellsfargofunds.com or by visiting the SEC website at sec.gov.
PORTFOLIO HOLDINGS INFORMATION
The complete portfolio holdings for the Fund are publicly available monthly on the Fund’s website (wellsfargofunds.com), on a one-month delayed basis. In addition, top ten holdings information (excluding derivative positions) for the Fund is publicly available on the Fund’s website on a monthly, seven-day or more delayed basis. The Fund files its complete schedule of portfolio holdings with the SEC for the first and third quarters of each fiscal year on Form N-Q, which is available by visiting the SEC website at sec.gov. In addition, the Fund’s Form N-Q may be reviewed and copied at the SEC’s Public Reference Room in Washington, DC, and at regional offices in New York City, at 233 Broadway, and in Chicago, at 175 West Jackson Boulevard, Suite 900. Information about the Public Reference Room may be obtained by calling 1-800-SEC-0330.
| | | | | | |
| Other information (unaudited) | | Wells Fargo Traditional Small Cap Growth Fund | | | 29 | |
BOARD OF TRUSTEES AND OFFICERS
Each of the Trustees and Officers1 listed in the table below acts in identical capacities for each fund in the Wells Fargo family of funds, which consists of 153 mutual funds comprising the Wells Fargo Funds Trust, Wells Fargo Variable Trust, Wells Fargo Master Trust and four closed-end funds (collectively the “Fund Complex”). This table should be read in conjunction with the Prospectus and the Statement of Additional Information2. The mailing address of each Trustee and Officer is 525 Market Street, 12th Floor, San Francisco, CA 94105. Each Trustee and Officer serves an indefinite term, however, each Trustee serves such term until reaching the mandatory retirement age established by the Trustees.
Independent Trustees
| | | | | | |
Name and
year of birth | | Position held and
length of service* | | Principal occupations during past five years or longer | | Current other
public company or
investment company
directorships |
William R. Ebsworth (Born 1957) | | Trustee, since 2015 | | Retired. From 1984 to 2013, equities analyst, portfolio manager, research director and chief investment officer at Fidelity Management and Research Company in Boston, Tokyo, and Hong Kong, and retired in 2013 as Chief Investment Officer of Fidelity Strategic Advisers, Inc. where he led a team of investment professionals managing client assets. Prior thereto, Board member of Hong Kong Securities Clearing Co., Hong Kong Options Clearing Corp., the Thailand International Fund, Ltd., Fidelity Investments Life Insurance Company, and Empire Fidelity Investments Life Insurance Company. Board member of the Forté Foundation (non-profit organization) and the Vincent Memorial Hospital Endowment (non-profit organization), where he serves on the Investment Committee and as a Chair of the Audit Committee. Mr. Ebsworth is a CFA® charterholder. | | Asset Allocation Trust |
Jane A. Freeman** (Born 1953) | | Trustee, since 2015; Chair Liaison, since 2018 | | Retired. From 2012 to 2014 and 1999 to 2008, Chief Financial Officer of Scientific Learning Corporation. From 2008 to 2012, Ms. Freeman provided consulting services related to strategic business projects. Prior to 1999, Portfolio Manager at Rockefeller & Co. and Scudder, Stevens & Clark. Board member of the Harding Loevner Funds from 1996 to 2014, serving as both Lead Independent Director and chair of the Audit Committee. Board member of the Russell Exchange Traded Funds Trust from 2011 to 2012 and the chair of the Audit Committee. Ms. Freeman is a Board Member of Ruth Bancroft Garden (non-profit organization) and the Glimmerglass Festival. She is also an inactive Chartered Financial Analyst. | | Asset Allocation Trust |
Isaiah Harris, Jr. (Born 1952) | | Trustee, since 2009 | | Retired. Chairman of the Board of CIGNA Corporation since 2009, and Director since 2005. From 2003 to 2011, Director of Deluxe Corporation. Prior thereto, President and CEO of BellSouth Advertising and Publishing Corp. from 2005 to 2007, President and CEO of BellSouth Enterprises from 2004 to 2005 and President of BellSouth Consumer Services from 2000 to 2003. Emeritus member of the Iowa State University Foundation Board of Governors. Emeritus Member of the Advisory Board of Iowa State University School of Business. Advisory Board Member, Palm Harbor Academy (charter school). Advisory Board Member, Child Evangelism Fellowship (non-profit). Mr. Harris is a certified public accountant (inactive status). | | CIGNA Corporation; Asset Allocation Trust |
Judith M. Johnson (Born 1949) | | Trustee, since 2008; Audit Committee Chairman, since 2008 | | Retired. Prior thereto, Chief Executive Officer and Chief Investment Officer of Minneapolis Employees Retirement Fund from 1996 to 2008. Ms. Johnson is an attorney, certified public accountant and a certified managerial accountant. | | Asset Allocation Trust |
David F. Larcker (Born 1950) | | Trustee, since 2009 | | James Irvin Miller Professor of Accounting at the Graduate School of Business, Stanford University, Director of the Corporate Governance Research Initiative and Senior Faculty of The Rock Center for Corporate Governance since 2006. From 2005 to 2008, Professor of Accounting at the Graduate School of Business, Stanford University. Prior thereto, Ernst & Young Professor of Accounting at The Wharton School, University of Pennsylvania from 1985 to 2005. | | Asset Allocation Trust |
| | | | |
| 30 | | Wells Fargo Traditional Small Cap Growth Fund | | Other information (unaudited) |
| | | | | | |
Name and
year of birth | | Position held and
length of service* | | Principal occupations during past five years or longer | | Current other
public company or
investment company
directorships |
Olivia S. Mitchell*** (Born 1953) | | Trustee, since 2006; Governance Committee Chairman, since 2018 | | International Foundation of Employee Benefit Plans Professor, Wharton School of the University of Pennsylvania since 1993. Director of Wharton’s Pension Research Council and Boettner Center on Pensions & Retirement Research, and Research Associate at the National Bureau of Economic Research. Previously, Cornell University Professor from 1978 to 1993. | | Asset Allocation Trust |
Timothy J. Penny**** (Born 1951) | | Trustee, since 1996; Chairman, since 2018; Vice Chairman, from 2017 to 2018 | | President and Chief Executive Officer of Southern Minnesota Initiative Foundation, a non-profit organization, since 2007. Member of the Board of Trustees of NorthStar Education Finance, Inc., a non-profit organization, since 2007. | | Asset Allocation Trust |
James G. Polisson***** (Born 1959) | | Trustee, since 2018; Advisory Board Member, from 2017 to 2018 | | Retired. Chief Marketing Officer, Source (ETF) UK Services, Ltd, from 2015 to 2017. From 2012 to 2015, Principal of The Polisson Group, LLC, a management consulting, corporate advisory and principal investing company. Chief Executive Officer and Managing Director at Russell Investments, Global Exchange Traded Funds from 2010 to 2012. Managing Director of Barclays Global Investors from 1998 to 2010 and Global Chief Marketing Officer for iShares and Barclays Global Investors from 2000 to 2010. Trustee of the San Francisco Mechanics’ Institute, a non-profit organization, from 2013 to 2015. Board member of the Russell Exchange Traded Fund Trust from 2011 to 2012. Director of Barclays Global Investors Holdings Deutschland GmbH from 2006 to 2009. Mr. Polisson is an attorney and has a retired status with the Massachusetts and District of Columbia Bar Associations. | | Asset Allocation Trust |
Michael S. Scofield (Born 1943) | | Trustee, since 2010 | | Served on the Investment Company Institute’s Board of Governors and Executive Committee from 2008-2011 as well the Governing Council of the Independent Directors Council from 2006-2011 and the Independent Directors Council Executive Committee from 2008-2011. Trustee of the Evergreen Fund complex (and its predecessors) from 1984 to 2010. Chairman of the Evergreen Funds from 2000-2010. Former Trustee of the Mentor Funds. Retired Attorney, Law Offices of Michael S. Scofield. | | Asset Allocation Trust |
Pamela Wheelock***** (Born 1959) | | Trustee, since 2018; Advisory Board Member, from 2017 to 2018 | | Chief Operating Officer, Twin Cities Habitat for Humanity, since January, 2017. Vice President of University Services, University of Minnesota from 2012 to 2017. Prior thereto, Interim President and Chief Executive Officer of Blue Cross Blue Shield of Minnesota from 2010 to 2011, Chairman of the Board from 2009 to 2011 and Board Director from 2003 to 2015. Vice President, Leadership and Community Engagement, Bush Foundation, Saint Paul, Minnesota (a private foundation) from 2009 to 2011. Executive Vice President and Chief Financial Officer, Minnesota Sports and Entertainment from 2004 to 2009 and Senior Vice President from 2002 to 2004. Commissioner of Finance, State of Minnesota, from 1999 to 2002. Currently on the Board of Directors, Governance Committee and Finance Committee, for the Minnesota Philanthropy Partners (Saint Paul Foundation) since 2012 and Board Chair of the Minnesota Wild Foundation since 2010. | | Asset Allocation Trust |
| * | Length of service dates reflect the Trustee’s commencement of service with the Trust’s predecessor entities, where applicable. |
| ** | Jane Freeman became Chair Liaison effective January 1, 2018. |
| *** | Olivia Mitchell became Chairman of the Governance Committee effective January 1, 2018. |
| **** | Timothy Penny became Chairman effective January 1, 2018. |
| ***** | James Polisson and Pamela Wheelock each became a Trustee effective January 1, 2018. |
| | | | | | |
| Other information (unaudited) | | Wells Fargo Traditional Small Cap Growth Fund | | | 31 | |
Officers
| | | | | | |
Name and
year of birth | | Position held and
length of service | | Principal occupations during past five years or longer | | |
Andrew Owen (Born 1960) | | President, since 2017 | | Executive Vice President of Wells Fargo & Company and Head of Affiliated Managers, Wells Fargo Asset Management, since 2014. In addition, Mr. Owen is currently President, Chief Executive Officer and Director of Wells Fargo Funds Management, LLC since 2017. Prior thereto, Executive Vice President responsible for marketing, investments and product development for Wells Fargo Funds Management, LLC, from 2009 to 2014. | | |
Nancy Wiser1 (Born 1967) | | Treasurer, since 2012 | | Executive Vice President of Wells Fargo Funds Management, LLC since 2011. Chief Operating Officer and Chief Compliance Officer at LightBox Capital Management LLC, from 2008 to 2011. | | |
Alexander Kymn* (Born 1973) | | Secretary, since 2018; Chief Legal Officer, since 2018 | | Senior Company Counsel of Wells Fargo Bank, N.A. since 2018 (previously Senior Counsel from 2007 to 2018). Vice President of Wells Fargo Funds Management, LLC from 2008 to 2014. | | |
C. David Messman** (Born 1960) | | Secretary, since 2000; Chief Legal Officer, since 2003 | | Senior Vice President and Secretary of Wells Fargo Funds Management, LLC since 2001. Assistant General Counsel of Wells Fargo Bank, N.A. since 2013 and Vice President and Managing Counsel of Wells Fargo Bank, N.A. from 1996 to 2013. | | |
Michael H. Whitaker (Born 1967) | | Chief Compliance Officer, since 2016 | | Senior Vice President and Chief Compliance Officer since 2016. Senior Vice President and Chief Compliance Officer for Fidelity Investments from 2007 to 2016. | | |
David Berardi (Born 1975) | | Assistant Treasurer, since 2009 | | Vice President of Wells Fargo Funds Management, LLC since 2009. Vice President of Evergreen Investment Management Company, LLC from 2008 to 2010. Manager of Fund Reporting and Control for Evergreen Investment Management Company, LLC from 2004 to 2010. | | |
Jeremy DePalma1 (Born 1974) | | Assistant Treasurer, since 2009 | | Senior Vice President of Wells Fargo Funds Management, LLC since 2009. Senior Vice President of Evergreen Investment Management Company, LLC from 2008 to 2010 and head of the Fund Reporting and Control Team within Fund Administration from 2005 to 2010. | | |
| 1 | Nancy Wiser acts as Treasurer of 77 funds in the Fund Complex. Jeremy DePalma acts as Treasurer of 76 funds and Assistant Treasurer of 77 funds in the Fund Complex. |
| 2 | The Statement of Additional Information includes additional information about the Trustees and is available, without charge, upon request, by calling 1-800-222-8222 or by visiting the website at wellsfargofunds.com. |
| * | Alexander Kymn became the Secretary and Chief Legal Officer effective April 17, 2018. |
| ** | David Messman was the Secretary and Chief Legal Officer until April 16, 2018. |
| | | | |
| 32 | | Wells Fargo Traditional Small Cap Growth Fund | | List of abbreviations |
The following is a list of common abbreviations for terms and entities that may have appeared in this report.
| ACA | — ACA Financial Guaranty Corporation |
| ADR | — American depositary receipt |
| ADS | — American depositary shares |
| AGC | — Assured Guaranty Corporation |
| AGM | — Assured Guaranty Municipal |
| Ambac | — Ambac Financial Group Incorporated |
| AMT | — Alternative minimum tax |
| BAN | — Bond anticipation notes |
| BHAC | — Berkshire Hathaway Assurance Corporation |
| CAB | — Capital appreciation bond |
| CCAB | — Convertible capital appreciation bond |
| CDA | — Community Development Authority |
| CDO | — Collateralized debt obligation |
| CLO | — Collateralized loan obligation |
| DRIVER | — Derivative inverse tax-exempt receipts |
| DW&P | — Department of Water & Power |
| DWR | — Department of Water Resources |
| ECFA | — Educational & Cultural Facilities Authority |
| EDA | — Economic Development Authority |
| EDFA | — Economic Development Finance Authority |
| ETF | — Exchange-traded fund |
| FDIC | — Federal Deposit Insurance Corporation |
| FFCB | — Federal Farm Credit Banks |
| FGIC | — Financial Guaranty Insurance Corporation |
| FHA | — Federal Housing Administration |
| FHLB | — Federal Home Loan Bank |
| FHLMC | — Federal Home Loan Mortgage Corporation |
| FICO | — The Financing Corporation |
| FNMA | — Federal National Mortgage Association |
| GDR | — Global depositary receipt |
| GNMA | — Government National Mortgage Association |
| HCFR | — Healthcare facilities revenue |
| HEFA | — Health & Educational Facilities Authority |
| HEFAR | — Higher education facilities authority revenue |
| HFA | — Housing Finance Authority |
| HFFA | — Health Facilities Financing Authority |
| HUD | — Department of Housing and Urban Development |
| IDA | — Industrial Development Authority |
| IDAG | — Industrial Development Agency |
| KRW | — Republic of Korea won |
| LIBOR | — London Interbank Offered Rate |
| LIFER | — Long Inverse Floating Exempt Receipts |
| LLC | — Limited liability company |
| LLLP | — Limited liability limited partnership |
| LLP | — Limited liability partnership |
| MBIA | — Municipal Bond Insurance Association |
| MFHR | — Multifamily housing revenue |
| MSTR | — Municipal securities trust receipts |
| MUD | — Municipal Utility District |
| National | — National Public Finance Guarantee Corporation |
| PCFA | — Pollution Control Financing Authority |
| PCL | — Public Company Limited |
| PCR | — Pollution control revenue |
| PFA | — Public Finance Authority |
| PFFA | — Public Facilities Financing Authority |
| PFOTER | — Puttable floating option tax-exempt receipts |
| PJSC | — Public Joint Stock Company |
| plc | — Public limited company |
| PUTTER | — Puttable tax-exempt receipts |
| R&D | — Research & development |
| Radian | — Radian Asset Assurance |
| RAN | — Revenue anticipation notes |
| RDA | — Redevelopment Agency |
| RDFA | — Redevelopment Finance Authority |
| REIT | — Real estate investment trust |
| ROC | — Reset option certificates |
| SAVRS | — Select auction variable rate securities |
| SBA | — Small Business Authority |
| SDR | — Swedish depositary receipt |
| SFHR | — Single-family housing revenue |
| SFMR | — Single-family mortgage revenue |
| SIFMA | — Securities Industry and Financial Markets Association |
| SPA | — Standby purchase agreement |
| SPDR | — Standard & Poor’s Depositary Receipts |
| SPEAR | — Short Puttable Exempt Adjustable Receipts |
| STRIPS | — Separate trading of registered interest and |
| TAN | — Tax anticipation notes |
| TIPS | — Treasury inflation-protected securities |
| TRAN | — Tax revenue anticipation notes |
| TTFA | — Transportation Trust Fund Authority |
| TVA | — Tennessee Valley Authority |

For more information
More information about Wells Fargo Funds is available free upon request. To obtain literature, please write, email, visit the Fund’s website, or call:
Wells Fargo Funds
P.O. Box 8266
Boston, MA 02266-8266
Email: fundservice@wellsfargo.com
Website: wellsfargofunds.com
Individual investors: 1-800-222-8222
Retail investment professionals: 1-888-877-9275
Institutional investment professionals:
1-866-765-0778
This report and the financial statements contained herein are submitted for the general information of the shareholders of the Fund. If this report is used for promotional purposes, distribution of the report must be accompanied or preceded by a current prospectus. Before investing, please consider the investment objectives, risks, charges, and expenses of the investment. For a current prospectus and, if available, a summary prospectus, containing this information, call 1-800-222-8222 or visit the Fund’s website at wellsfargofunds.com. Read the prospectus carefully before you invest or send money.
Wells Fargo Asset Management (WFAM) is a trade name used by the asset management businesses of Wells Fargo & Company. Wells Fargo Funds Management, LLC, a wholly owned subsidiary of Wells Fargo & Company, provides investment advisory and administrative services for Wells Fargo Funds. Other affiliates of Wells Fargo & Company provide subadvisory and other services for the funds. The funds are distributed by Wells Fargo Funds Distributor, LLC, Member FINRA, an affiliate of Wells Fargo & Company. Neither Wells Fargo Funds Distributor nor Wells Fargo Funds Management holds fund shareholder accounts or assets. This material is for general informational and educational purposes only and is NOT intended to provide investment advice or a recommendation of any kind—including a recommendation for any specific investment, strategy, or plan.
NOT FDIC INSURED ◾ NO BANK GUARANTEE ◾ MAY LOSE VALUE
© 2018 Wells Fargo Funds Management, LLC. All rights reserved.
| | |
 | | 309986 05-18 A247/AR247 03-18 |
Annual Report
March 31, 2018

Wells Fargo Precious Metals Fund


Reduce clutter. Save trees.
Sign up for electronic delivery of prospectuses and shareholder reports at wellsfargo.com/advantagedelivery
Contents
The views expressed and any forward-looking statements are as of March 31, 2018, unless otherwise noted, and are those of the Fund managers and/or Wells Fargo Funds Management, LLC. Discussions of individual securities, or the markets generally, or any Wells Fargo Fund are not intended as individual recommendations. Future events or results may vary significantly from those expressed in any forward-looking statements. The views expressed are subject to change at any time in response to changing circumstances in the market. Wells Fargo Funds Management, LLC and the Fund disclaim any obligation to publicly update or revise any views expressed or forward-looking statements.
NOT FDIC INSURED ◾ NO BANK GUARANTEE ◾ MAY LOSE VALUE
| | | | |
| 2 | | Wells Fargo Precious Metals Fund | | Letter to shareholders (unaudited) |

Andrew Owen
President
Wells Fargo Funds
Dear Shareholder:
We are pleased to offer you this annual report for the Wells Fargo Precious Metals Fund for the 12-month period that ended March 31, 2018. During the last three quarters of 2017, investors enjoyed consistently rising equity values globally. Short-term interest rates tended to increase, while long-term rates remained flat to lower. During the final two months of the first quarter of 2018, equity market volatility returned, stocks reversed year-to-date gains, and bond yields rose while prices fell.
For the period, U.S. stocks, as measured by the S&P 500 Index,1 gained 13.99% and international stocks, as measured by the MSCI ACWI ex USA Index (Net),2 added 16.53%. Emerging market stocks, as measured by the MSCI EM Index (Net),3 added 24.93%. In bond markets, the Bloomberg Barclays U.S. Aggregate Bond Index4 added 1.20% and the Bloomberg Barclays Municipal Bond Index5 added 2.66% while fixed-income investments outside the U.S. gained 11.75%, according to the Bloomberg Barclays Global Aggregate ex-USD Index.6 The ICE BofAML U.S. High Yield Index7 earned 3.69%.
Through the last nine months of 2017, stocks advanced on synchronized global growth, which led to higher investor and consumer confidence. The first quarter of 2018 began with strong stock market gains in January. A strong January 2018 U.S. employment report and inflation concerns prompted equity volatility in February. Investor optimism for growth was supplanted with concerns over trade tensions, increased interest rates, and the prospect of new data privacy regulations.
Reactions to U.S. interest rate increases were uneven across the yield curve and globally.
The U.S. Federal Reserve (Fed) increased the federal funds rate three times during the 12-month period for a combined 75 basis points (bps; 100 bps equals 1.00%). Following an increase in March 2017, short-term bond yields in the U.S. rose while longer-term Treasury yields were little changed. Municipal bond returns were positive, helped by strong demand and constrained new-issue supply. The Fed raised the target interest rate once again in June 2017 to a range of 1.00% to 1.25%. Ten-year U.S. Treasury yields declined, the yield curve flattened, and long-term bond prices benefited.
| 1 | The S&P 500 Index consists of 500 stocks chosen for market size, liquidity, and industry group representation. It is a market-value-weighted index with each stock’s weight in the index proportionate to its market value. You cannot invest directly in an index. |
| 2 | The Morgan Stanley Capital International (MSCI) All Country World Index (ACWI) ex USA Index (Net) is a free-float-adjusted market-capitalization-weighted index that is designed to measure the equity market performance of developed markets, excluding the United States and Canada. Source: MSCI. MSCI makes no express or implied warranties or representations and shall have no liability whatsoever with respect to any MSCI data contained herein. The MSCI data may not be further redistributed or used as a basis for other indices or any securities or financial products. This report is not approved, reviewed, or produced by MSCI. You cannot invest directly in an index. |
| 3 | The MSCI Emerging Markets (EM) Index (Net) is a free-float-adjusted market-capitalization-weighted index that is designed to measure large- and mid-cap equity market performance of emerging markets. The MSCI EM Index (Net) consists of the following 24 emerging market country indices: Brazil, Chile, China, Colombia, Czech Republic, Egypt, Greece, Hungary, India, Indonesia, Korea, Malaysia, Mexico, Pakistan, Peru, the Philippines, Poland, Qatar, Russia, South Africa, Taiwan, Thailand, Turkey, and the United Arab Emirates. You cannot invest directly in an index. |
| 4 | The Bloomberg Barclays U.S. Aggregate Bond Index is a broad-based benchmark that measures the investment-grade, U.S. dollar-denominated, fixed-rate taxable bond market, including Treasuries, government-related and corporate securities, mortgage-backed securities (agency fixed-rate and hybrid adjustable-rate mortgage pass-throughs), asset-backed securities, and commercial mortgage-backed securities. You cannot invest directly in an index. |
| 5 | The Bloomberg Barclays Municipal Bond Index is an unmanaged index composed of long-term tax-exempt bonds with a minimum credit rating of Baa. You cannot invest directly in an index. |
| 6 | The Bloomberg Barclays Global Aggregate ex-USD Index is an unmanaged index that provides a broad-based measure of the global investment-grade fixed-income markets excluding the U.S. dollar-denominated debt market. You cannot invest directly in an index. |
| 7 | The ICE BofAML U.S. High Yield Index is a market-capitalization-weighted index of domestic and Yankee high-yield bonds. The index tracks the performance of high-yield securities traded in the U.S. bond market. You cannot invest directly in an index. Copyright 2018. ICE Data Indices, LLC. All rights reserved. |
| | | | | | |
| Letter to shareholders (unaudited) | | Wells Fargo Precious Metals Fund | | | 3 | |
Internationally, central banks maintained low interest rates and accommodative monetary policies that supported business activity and stock values in foreign markets. A weaker U.S. dollar was generally supportive of business activity in regions around the globe. The Bank of Japan continued its accommodative monetary policies, and industrial production, retail sales, and fixed asset investment increased in China.
Growth continued through the summer of 2017.
Globally, stocks moved higher during the third quarter of 2017. Low inflation and interest rates supported accelerating global economic growth and corporate earnings. Brief episodes of geopolitical tensions, often associated with North Korea’s advancing nuclear missile program, flaring conflicts in the Middle East, and uncertainty surrounding U.S. trade policies, did not discourage investing activity.
In the U.S., economic data released during the quarter reflected a generally healthy economy. Second-quarter economic output grew at a 3.1% annual rate. Stocks in international developed and emerging markets continued to benefit from improving economic growth.
Positive economic and market news continued as 2017 closed and 2018 began.
During the fourth quarter of 2017, stock markets continued the move higher. Third-quarter economic output in the U.S. grew at a 3.2% annual rate. The unemployment rate fell to a 17-year low of 4.1%. Tax reform passed and wage growth data improved, encouraging increased business and consumer spending.
Fed officials announced in October 2017 plans to begin unwinding its $4.5 trillion portfolio of bonds and other assets accumulated during rounds of quantitative easing conducted since the 2008–2009 recession. Still, restrained inflation kept long-term bond rates steady and the flattened yield curve persisted. The Fed raised the federal funds rate target to a range of 1.25% to 1.50% in December 2017 and began selling bonds held in its portfolio.
2018 opened with continued stock advances, then volatility.
Improving business and economic data globally continued to support stocks through January 2018. Political wrangling in the U.S. over budget resolutions could not dissuade investors from buying stocks as payrolls and factory orders increased. Long-term interest rates in the U.S. trended higher as the yield curve steepened—the 10-year Treasury rate moved from 2.46% to 2.84% and the 30-year rate moved from 2.81% to 3.08% during January 2018.
Investor sentiment shifted in February as inflation concerns emerged in the U.S. when readings from the Producer Price Index in January rose 2.5% year over year. During February, the U.S. market endured a loss from January’s high of nearly 12% before recovering much of that loss. The Fed raised the federal funds rate in March 2018. Bond yields rose across the yield curve.
During January 2018, purchasing managers’ indices in China, the eurozone, India, and Japan reported data for December that indicated continued growth. Despite positive economic signals and business fundamentals, international stock values fell during February and March 2018, swept up in the selling momentum in U.S. markets.
Globally, stocks moved higher during the third quarter of 2017.
During February, the U.S. market endured a loss from January’s high of nearly 12% before recovering much of that loss.
| | | | |
| 4 | | Wells Fargo Precious Metals Fund | | Letter to shareholders (unaudited) |
Don’t let short-term uncertainty derail long-term investment goals.
Periods of investment uncertainty can present challenges, but experience has taught us that maintaining long-term investment goals can be an effective way to plan for the future. To help you create a sound strategy based on your personal goals and risk tolerance, Wells Fargo Funds offers more than 100 mutual funds spanning a wide range of asset classes and investment styles. Although diversification cannot guarantee an investment profit or prevent losses, we believe it can be an effective way to manage investment risk and potentially smooth out overall portfolio performance. We encourage investors to know their investments and to understand that appropriate levels of risk-taking may unlock opportunities.
Thank you for choosing to invest with Wells Fargo Funds. We appreciate your confidence in us and remain committed to helping you meet your financial needs.
Sincerely,

Andrew Owen
President
Wells Fargo Funds
For further information about your Fund, contact your investment professional, visit our website at wellsfargofunds.com, or call us directly at 1-800-222-8222.
This page is intentionally left blank.
| | | | |
| 6 | | Wells Fargo Precious Metals Fund | | Performance highlights (unaudited) |
Investment objective
The Fund seeks long-term capital appreciation.
Manager
Wells Fargo Funds Management, LLC
Subadviser
Wells Capital Management Incorporated
Portfolio managers
Michael Bradshaw, CFA®
Oleg Makhorine
Average annual total returns (%) as of March 31, 20181
| | | | | | | | | | | | | | | | | | | | | | | | | | | | | | |
| | | | | Including sales charge | | | Excluding sales charge | | | Expense ratios2 (%) |
| | | Inception date | | 1 year | | | 5 year | | | 10 year | | | 1 year | | | 5 year | | | 10 year | | | Gross | | Net3 |
| Class A (EKWAX) | | 1-20-1998 | | | (12.89 | ) | | | (9.84 | ) | | | (5.66 | ) | | | (7.56 | ) | | | (8.77 | ) | | | (5.10 | ) | | 1.21 | | 1.09 |
| Class C (EKWCX) | | 1-29-1998 | | | (9.24 | ) | | | (9.44 | ) | | | (5.81 | ) | | | (8.24 | ) | | | (9.44 | ) | | | (5.81 | ) | | 1.96 | | 1.84 |
| Administrator Class (EKWDX) | | 7-30-2010 | | | – | | | | – | | | | – | | | | (7.40 | ) | | | (8.63 | ) | | | (4.97 | ) | | 1.13 | | 0.95 |
| Institutional Class (EKWYX) | | 2-29-2000 | | | – | | | | – | | | | – | | | | (7.27 | ) | | | (8.50 | ) | | | (4.82 | ) | | 0.88 | | 0.79 |
| FTSE Gold Mines Index4 | | – | | | – | | | | – | | | | – | | | | (4.94 | ) | | | (8.30 | ) | | | (6.13 | ) | | – | | – |
| S&P 500 Index5 | | – | | | – | | | | – | | | | – | | | | 13.99 | | | | 13.31 | | | | 9.49 | | | – | | – |
Figures quoted represent past performance, which is no guarantee of future results, and do not reflect taxes that a shareholder may pay on fund distributions or the redemption of fund shares. Investment return and principal value of an investment will fluctuate so that an investor’s shares, when redeemed, may be worth more or less than their original cost. Performance shown without sales charges would be lower if sales charges were reflected. Current performance may be lower or higher than the performance data quoted, which assumes the reinvestment of dividends and capital gains. Current month-end performance is available on the Fund’s website, wellsfargofunds.com.
While the S&P 500 Index is comprised of U.S. equity securities of companies diversified across ten sectors, the Fund’s holdings are concentrated primarily in precious metals related stocks. Therefore, the performance of the S&P 500 Index is displayed only to show how the concentrated Fund performed compared with a diversified selection of U.S. equity securities.
Index returns do not include transaction costs associated with buying and selling securities, any mutual fund fees or expenses, or any taxes. It is not possible to invest directly in an index.
For Class A shares, the maximum front-end sales charge is 5.75%. For Class C shares, the maximum contingent deferred sales charge is 1.00%. Performance including a contingent deferred sales charge assumes the sales charge for the corresponding time period. Administrator Class and Institutional Class shares are sold without a front-end sales charge or contingent deferred sales charge.
Stock values fluctuate in response to the activities of individual companies and general market and economic conditions. Bond values fluctuate in response to the financial condition of individual issuers, general market and economic conditions, and changes in interest rates. Changes in market conditions and government policies may lead to periods of heightened volatility in the bond market and reduced liquidity for certain bonds held by the Fund. In general, when interest rates rise, bond values fall and investors may lose principal value. Interest-rate changes and their impact on the Fund and its share price can be sudden and unpredictable. Funds that concentrate their investments in limited sectors, such as gold-related investments, are more vulnerable to adverse market, economic, regulatory, political, or other developments affecting those sectors. Certain investment strategies tend to increase the total risk of an investment (relative to the broader market). The Fund is exposed to foreign investment risk, geographic, non-diversification risk, smaller-company securities risk, and subsidiary risk. Consult the Fund’s prospectus for additional information on these and other risks.
Please see footnotes on page 7.
| | | | | | |
| Performance highlights (unaudited) | | Wells Fargo Precious Metals Fund | | | 7 | |
|
| Growth of $10,000 investment as of March 31, 20186 |
|
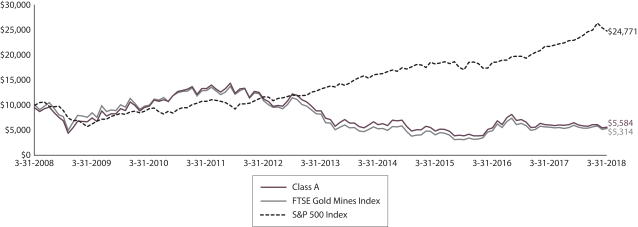 |
| 1 | Historical performance shown for Administrator Class shares prior to their inception reflects the performance of Institutional Class shares and has been adjusted to reflect the higher expenses applicable to Administrator Class shares. Historical performance shown for all classes of the Fund prior to July 19, 2010, is based on the Fund’s predecessor Evergreen Precious Metals Fund. |
| 2 | Reflect the expense ratios as stated in the most recent prospectuses. The expense ratios are subject to change and may differ from the annualized expense ratios shown in the financial highlights of this report. |
| 3 | The manager has contractually committed through July 31, 2018, to waive fees and/or reimburse expenses to the extent necessary to cap the Fund’s Total Annual Fund Operating Expenses After Fee Waivers at the amounts shown. After this time, the cap may be increased or the commitment to maintain the cap may be terminated only with the approval of the Board of Trustees. Brokerage commissions, stamp duty fees, interest, taxes, acquired fund fees and expenses (if any), and extraordinary expenses are excluded from the expense cap. Without this cap, the Fund’s returns would have been lower. The expense ratio paid by an investor is the net expense ratio (the total annual fund operating expenses after fee waivers) as stated in the prospectuses. |
| 4 | FTSE Gold Mines Index is an unmanaged, open-ended index designed to reflect the performance of the worldwide market in the shares of companies whose principal activity is the mining of gold. You cannot invest directly in an index. |
| 5 | The S&P 500 Index consists of 500 stocks chosen for market size, liquidity, and industry group representation. It is a market-value weighted index with each stock’s weight in the index proportionate to its market value. You cannot invest directly in an index. |
| 6 | The chart compares the performance of Class A shares for the most recent ten years with the FTSE Gold Mines Index and the S&P 500 Index. The chart assumes a hypothetical investment of $10,000 in Class A shares and reflects all operating expenses and assumes the maximum initial sales charge of 5.75%. |
| 7 | The ten largest holdings, excluding cash and cash equivalents, are calculated based on the value of the investments divided by total net assets of the Fund. Holdings are subject to change and may have changed since the date specified. |
| 8 | Amounts are calculated based on the total long-term investments of the Fund. These amounts are subject to change and may have changed since the date specified. |
| * | This security was no longer held at the end of the reporting period. |
| | | | |
| 8 | | Wells Fargo Precious Metals Fund | | Performance highlights (unaudited) |
MANAGER’S DISCUSSION
Fund highlights
| ∎ | | The Fund underperformed the FTSE Gold Mines Index for the 12-month period that ended March 31, 2018. |
| ∎ | | The Fund’s positions in Torex Gold Resources Incorporated, Pretium Resources Incorporated*, and Mag Silver Corporation detracted from results, as did its underweight to Newmont Mining Corporation and Northern Star Resources Limited. |
| ∎ | | The Fund’s holdings in Royal Gold, Incorporated, and Franco-Nevada Corporation aided results during the period. Overweights to Kirkland Lake Gold Limited, Kinross Gold Corporation, and B2Gold Corporation also helped results. |
| ∎ | | The price of gold rose approximately 6.1% during the 12-month period, and the share prices of precious metals stocks underperformed the gold price. |
The price of gold declined 0.6% during the first quarter of the reporting period after positive economic commentary from U.S. Federal Reserve (Fed) Chair Janet Yellen on June 14 led to an increase in bond yields. During the second and third quarters of the reporting period, gold prices rose 5%. The gold price was propelled higher during the summer months by rising military tensions between the U.S. and North Korea. During the fourth quarter of the reporting period, the gold price rose 1.7%. Fears of rising inflation, uncertainty around global trade, and a declining stock market provided the backdrop for a higher gold price.
Purchases and sales of gold exchange-traded funds (ETFs) have an impact on gold prices. Purchases of gold ETFs increased during every quarter of the reporting period, positively affecting the price of gold. During the second quarter of the reporting period, gold-backed ETF purchases accelerated as rising military tensions with North Korea caused the stock market and bond yields to fall.
| | | | |
| Ten largest holdings (%) as of March 31, 20187 | |
Newmont Mining Corporation | | | 7.82 | |
Randgold Resources Limited ADR | | | 7.62 | |
Royal Gold Incorporated | | | 5.63 | |
Kinross Gold Corporation | | | 5.12 | |
Kirkland Lake Gold Limited | | | 4.35 | |
B2Gold Corporation | | | 4.25 | |
Gold Bullion | | | 4.25 | |
Newcrest Mining Limited | | | 3.85 | |
Goldcorp Incorporated | | | 3.46 | |
Agnico Eagle Mines Limited | | | 3.41 | |
Gold-mining stocks underperformed relative to the price of gold.
The prices of gold-mining stocks typically rise or fall more sharply than the price of gold. However, this was not the case during the 12-month reporting period. Companies that delivered better-than-expected operating and financial results fared the best, while those with assets domiciled in Australia also outperformed.
Two of the Fund’s most noteworthy detractors were Torex Gold and Pretium Resources. Torex Gold declined after the firm announced on November 6, 2017, that because of an illegal blockade at its El Limon Mine in Mexico, the company would be suspending mining operations. Pretium dropped on news that the commissioning
of its Brucejack Mine in Canada was behind schedule and, as a result, the 2018 operating plan would be lower than expected. The Fund’s underweight to Newmont Mining also detracted from performance as the company benefited from better-than-expected operating and financial results during the reporting period.
Royal Gold was among the Fund’s best contributors. The company benefited from better-than-expected financial results during the reporting period. Kirkland Lake Gold’s share price more than doubled during the reporting period as exploration success at its Fosterville Mine in Australia led to a doubling of gold reserves. Other key contributors included Kinross Gold, B2Gold, and Franco-Nevada.
Please see footnotes on page 7.
| | | | | | |
| Performance highlights (unaudited) | | Wells Fargo Precious Metals Fund | | | 9 | |
|
| Country allocation as of March 31, 20188 |
|
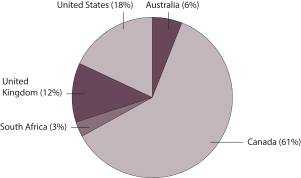 |
In our view, investment in gold and precious metals companies likely will remain a perceived hedge against economic and political uncertainty.
We believe the short-term outlook for gold prices depends largely on economic data and their resulting impact on U.S. interest rates and the U.S. dollar. In addition, global trade tensions between the U.S. and China could negatively affect economic growth and cause the Fed to delay further interest rate increases. Should this occur, we believe the economic environment likely would continue to support gold prices and gold stocks.
Over the longer term, we believe the primary drivers of gold are positive. First, rising fiscal deficits in the U.S. could cause the dollar to weaken. Second, increasing inflation in the U.S., caused by a tight labor market and higher cost imports, could benefit the price of gold. And finally, increased stock market volatility from rising geopolitical risks may cause investors to offset this risk by adding gold to their investment portfolios.
We believe gold-related stocks may have better appreciation potential than the metal itself. However, stock selection will remain important because company fundamentals tend to drive stock prices; higher-quality companies with internal growth catalysts, such as effective execution of business plans and mining successes, are most likely to outperform.
Please see footnotes on page 7.
| | | | |
| 10 | | Wells Fargo Precious Metals Fund | | Fund expenses (unaudited) |
As a shareholder of the Fund, you incur two types of costs: (1) transaction costs, including sales charges (loads) on purchase payments and contingent deferred sales charges (if any) on redemptions and (2) ongoing costs, including management fees, distribution (12b-1) and/or shareholder servicing fees, and other Fund expenses. This example is intended to help you understand your ongoing costs (in dollars) of investing in the Fund and to compare these costs with the ongoing costs of investing in other mutual funds.
The example is based on an investment of $1,000 invested at the beginning of the six-month period and held for the entire period from October 1, 2017 to March 31, 2018.
Actual expenses
The “Actual” line of the table below provides information about actual account values and actual expenses. You may use the information in this line, together with the amount you invested, to estimate the expenses that you paid over the period. Simply divide your account value by $1,000 (for example, an $8,600 account value divided by $1,000 = 8.6), then multiply the result by the number in the “Actual” line under the heading entitled “Expenses paid during period” for your applicable class of shares to estimate the expenses you paid on your account during this period.
Hypothetical example for comparison purposes
The “Hypothetical” line of the table below provides information about hypothetical account values and hypothetical expenses based on the Fund’s actual expense ratio and an assumed rate of return of 5% per year before expenses, which is not the Fund’s actual return. The hypothetical account values and expenses may not be used to estimate the actual ending account balance or expenses you paid for the period. You may use this information to compare the ongoing costs of investing in the Fund and other funds. To do so, compare this 5% hypothetical example with the 5% hypothetical examples that appear in the shareholder reports of the other funds.
Please note that the expenses shown in the table are meant to highlight your ongoing costs only and do not reflect any transactional costs, such as sales charges (loads) and contingent deferred sales charges. Therefore, the “Hypothetical” line of the table is useful in comparing ongoing costs only and will not help you determine the relative total costs of owning different funds. In addition, if these transactional costs were included, your costs would have been higher.
| | | | | | | | | | | | | | | | |
| | | Beginning
account value
10-1-2017 | | | Ending
account value
3-31-2018 | | | Expenses
paid during
the period¹ | | | Annualized net
expense ratio | |
Class A | | | | | | | | | | | | | | | | |
Actual | | $ | 1,000.00 | | | $ | 921.84 | | | $ | 4.70 | | | | 0.98 | % |
Hypothetical (5% return before expenses) | | $ | 1,000.00 | | | $ | 1,020.04 | | | $ | 4.94 | | | | 0.98 | % |
Class C | | | | | | | | | | | | | | | | |
Actual | | $ | 1,000.00 | | | $ | 918.42 | | | $ | 8.27 | | | | 1.73 | % |
Hypothetical (5% return before expenses) | | $ | 1,000.00 | | | $ | 1,016.31 | | | $ | 8.70 | | | | 1.73 | % |
Administrator Class | | | | | | | | | | | | | | | | |
Actual | | $ | 1,000.00 | | | $ | 922.66 | | | $ | 4.12 | | | | 0.86 | % |
Hypothetical (5% return before expenses) | | $ | 1,000.00 | | | $ | 1,020.64 | | | $ | 4.33 | | | | 0.86 | % |
Institutional Class | | | | | | | | | | | | | | | | |
Actual | | $ | 1,000.00 | | | $ | 923.21 | | | $ | 3.21 | | | | 0.67 | % |
Hypothetical (5% return before expenses) | | $ | 1,000.00 | | | $ | 1,021.59 | | | $ | 3.38 | | | | 0.67 | % |
| 1 | Expenses paid is equal to the annualized net expense ratio of each class multiplied by the average account value over the period, multiplied by the number of days in the most recent fiscal half-year divided by the number of days in the fiscal year (to reflect the one-half-year period). |
| | | | | | |
| Consolidated portfolio of investments—March 31, 2018 | | Wells Fargo Precious Metals Fund | | | 11 | |
| | | | | | | | | | | | | | | | |
| Security name | | | | | | | | Shares | | | Value | |
|
Common Stocks: 93.76% | |
|
| Australia: 6.20% | |
Evolution Mining Limited (Materials, Metals & Mining) | | | | | | | | | | | 2,000,000 | | | $ | 4,689,079 | |
Newcrest Mining Limited (Materials, Metals & Mining) | | | | | | | | | | | 772,294 | | | | 11,648,181 | |
Northern Star Resources Limited (Materials, Metals & Mining) | | | | | | | | | | | 500,000 | | | | 2,426,788 | |
| | | | |
| | | | | | | | | | | | | | | 18,764,048 | |
| | | | | | | | | | | | | | | | |
|
| Canada: 59.83% | |
Agnico-Eagle Mines Limited (Materials, Metals & Mining) | | | | | | | | | | | 245,164 | | | | 10,314,049 | |
Agnico-Eagle Mines Limited-Legend Shares (Materials, Metals & Mining) | | | | | | | | | | | 35,000 | | | | 1,472,450 | |
Agnico-Eagle Mines Limited-U.S. Exchange Traded Shares (Materials, Metals & Mining) | | | | | | | | | | | 212,370 | | | | 8,934,260 | |
Alamos Gold Incorporated Class A (Materials, Metals & Mining) | | | | | | | | | | | 1,428,980 | | | | 7,431,339 | |
B2Gold Corporation (Materials, Metals & Mining) † | | | | | | | | | | | 4,700,000 | | | | 12,877,712 | |
Barrick Gold Corporation (Materials, Metals & Mining) | | | | | | | | | | | 549,083 | | | | 6,836,083 | |
Centerra Gold Incorporated-Legend Shares (Materials, Metals & Mining) 144A | | | | | | | | | | | 350,000 | | | | 2,007,607 | |
Continental Gold Incorporated (Materials, Metals & Mining) † | | | | | | | | | | | 500,000 | | | | 1,373,850 | |
Detour Gold Corporation (Materials, Metals & Mining) † | | | | | | | | | | | 521,057 | | | | 5,273,864 | |
Detour Gold Corporation-Legend Shares (Materials, Metals & Mining) †144A | | | | | | | | | | | 525,000 | | | | 5,313,773 | |
Detour Gold Corporation-Legend Shares (Materials, Metals & Mining) † | | | | | | | | | | | 90,000 | | | | 910,933 | |
Endeavour Mining Corporation (Materials, Metals & Mining) † | | | | | | | | | | | 480,000 | | | | 8,855,979 | |
Franco-Nevada Corporation-Legend Shares (Materials, Metals & Mining) 144A | | | | | | | | | | | 142,948 | | | | 9,752,885 | |
Goldcorp Incorporated (Materials, Metals & Mining) | | | | | | | | | | | 757,454 | | | | 10,459,197 | |
Goldcorp Incorporated-U.S. Exchange Traded Shares (Materials, Metals & Mining) | | | | | | | | | | | 300,694 | | | | 4,155,591 | |
IAMGOLD Corporation (Materials, Metals & Mining) † | | | | | | | | | | | 1,650,000 | | | | 8,555,129 | |
Kinross Gold Corporation (Materials, Metals & Mining) † | | | | | | | | | | | 3,925,553 | | | | 15,509,035 | |
Kirkland Lake Gold Limited (Materials, Metals & Mining) | | | | | | | | | | | 850,000 | | | | 13,175,379 | |
Mag Silver Corporation (Materials, Metals & Mining) † | | | | | | | | | | | 580,000 | | | | 5,681,375 | |
Mag Silver Corporation-Legend Shares (Materials, Metals & Mining) † | | | | | | | | | | | 100,000 | | | | 979,547 | |
OceanaGold Corporation (Materials, Metals & Mining) | | | | | | | | | | | 1,200,000 | | | | 3,232,041 | |
Osisko Gold Royalties Limited (Materials, Metals & Mining) | | | | | | | | | | | 246,700 | | | | 2,382,076 | |
Pan American Silver Corporation (Materials, Metals & Mining) | | | | | | | | | | | 475,000 | | | | 7,671,250 | |
Platinum Group Metals Limited-Legend Shares (Materials, Metals & Mining) | | | | | | | | | | | 80,000 | | | | 23,907 | |
Semafo Incorporated (Materials, Metals & Mining) † | | | | | | | | | | | 2,860,400 | | | | 8,236,957 | |
SSR Mining Incorporated (Materials, Metals & Mining) † | | | | | | | | | | | 350,000 | | | | 3,360,000 | |
Tahoe Resources Incorporated (Materials, Metals & Mining) | | | | | | | | | | | 84,820 | | | | 398,309 | |
Tahoe Resources Incorporated-Legend Shares (Materials, Metals & Mining) | | | | | | | | | | | 280,000 | | | | 1,314,860 | |
Torex Gold Resources Incorporated (Materials, Metals & Mining) † | | | | | | | | | | | 400,000 | | | | 2,455,854 | |
Torex Gold Resources Incorporated-Legend Shares (Materials, Metals & Mining) †144A | | | | | | | | | | | 185,000 | | | | 1,135,833 | |
Torex Gold Resources Incorporated-Legend Shares (Materials, Metals & Mining) † | | | | | | | | | | | 266,250 | | | | 1,634,678 | |
Wheaton Precious Metals Corporation (Materials, Metals & Mining) | | | | | | | | | | | 12,950 | | | | 263,855 | |
Wheaton Precious Metals Corporation-U.S. Exchange Traded Shares (Materials, Metals & Mining) | | | | | | | | | | | 380,000 | | | | 7,740,600 | |
Yamana Gold Incorporated (Materials, Metals & Mining) | | | | | | | | | | | 500,000 | | | | 1,381,612 | |
| | | | |
| | | | | | | | | | | | | | | 181,101,869 | |
| | | | | | | | | | | | | | | | |
|
| South Africa: 2.37% | |
AngloGold Ashanti Limited ADR (Materials, Metals & Mining) | | | | | | | | | | | 755,591 | | | | 7,170,560 | |
| | | | | | | | | | | | | | | | |
|
| United Kingdom: 11.91% | |
Centamin plc (Materials, Metals & Mining) | | | | | | | | | | | 1,200,000 | | | | 2,601,810 | |
Fresnillo plc (Materials, Metals & Mining) | | | | | | | | | | | 500,000 | | | | 8,927,933 | |
The accompanying notes are an integral part of these financial statements.
| | | | |
| 12 | | Wells Fargo Precious Metals Fund | | Consolidated portfolio of investments—March 31, 2018 |
| | | | | | | | | | | | | | | | |
| Security name | | | | | | | | Shares | | | Value | |
|
| United Kingdom (continued) | |
Hochschild Mining plc (Materials, Metals & Mining) | | | | | | | | | | | 526,470 | | | $ | 1,473,883 | |
Randgold Resources Limited ADR (Materials, Metals & Mining) | | | | | | | | | | | 277,000 | | | | 23,057,480 | |
| | | | |
| | | | | | | | | | | | | | | 36,061,106 | |
| | | | | | | | | | | | | | | | |
|
| United States: 13.45% | |
Newmont Mining Corporation (Materials, Metals & Mining) | | | | | | | | | | | 605,455 | | | | 23,655,127 | |
Royal Gold Incorporated (Materials, Metals & Mining) | | | | 198,436 | | | | 17,039,699 | |
| | | | |
| | | | | | | | | | | | | | | 40,694,826 | |
| | | | | | | | | | | | | | | | |
| |
Total Common Stocks (Cost $218,290,535) | | | | 283,792,409 | |
| | | | | | | | | | | | | | | | |
| | |
| | | | Troy ounces | | | | |
| Commodities: 4.25% | |
Gold Bullion †** | | | | 9,690 | | | | 12,854,044 | |
| | | | | | | | | | | | | | | | |
| |
Total Commodities (Cost $5,772,407) | | | | 12,854,044 | |
| | | | | | | | | | | | | | | | |
| | | | |
| | | Yield | | | | | | Shares | | | | |
| Short-Term Investments: 1.63% | | | | | | | | | | | | | | | | |
| | | | |
| Investment Companies: 1.63% | | | | | | | | | | | | | | | | |
Wells Fargo Government Money Market Fund Select Class (l)(u) | | | 1.54 | % | | | | | | | 4,941,346 | | | | 4,941,346 | |
| | | | | | | | | | | | | | | | |
| | | | |
Total Short-Term Investments (Cost $4,941,346) | | | | | | | | | | | | | | | 4,941,346 | |
| | | | | | | | | | | | | | | | |
| | | | | | | | |
| Total investments in securities (Cost $229,004,288) | | | 99.64 | % | | | 301,587,799 | |
Other assets and liabilities, net | | | 0.36 | | | | 1,091,155 | |
| | | | | | | | |
| Total net assets | | | 100.00 | % | | $ | 302,678,954 | |
| | | | | | | | |
| † | Non-income-earning security |
| 144A | The security may be resold in transactions exempt from registration, normally to qualified institutional buyers, pursuant to Rule 144A under the Securities Act of 1933. |
| ** | Represents an investment held in Special Investments (Cayman) SPC, the consolidated entity. |
| (l) | The issuer of the security is an affiliated person of the Fund as defined in the Investment Company Act of 1940. |
| (u) | The rate represents the 7-day annualized yield at period end. |
Investments in Affiliates
An affiliated investment is an investment in which the Fund owns at least 5% of the outstanding voting shares of the issuer or as a result of other relationships, such as the Fund and the issuer having the same investment manager. Transactions with issuers that were either affiliated persons of the Fund at the beginning of the period or the end of the period were as follows:
| | | | | | | | | | | | | | | | | | | | | | | | | | | | | | | | | | | | |
| | | Shares,
beginning of
period | | | Shares
purchased | | | Shares
sold | | | Shares,
end of
period | | | Net
realized
gains
(losses) | | | Net
change in unrealized
gains
(losses) | | | Income
from
affiliated
securities | | | Value,
end
of period | | | % of
net
assets | |
Short-Term Investments | | | | | | | | | | | | | | | | | | | | | | | | | | | | | | | | | | | | |
Investment Companies | | | | | | | | | | | | | | | | | | | | | | | | | | | | | | | | | | | | |
Wells Fargo Government Money Market Fund Select Class | | | 11,654,511 | | | | 119,863,191 | | | | 126,576,356 | | | | 4,941,346 | | | $ | 0 | | | $ | 0 | | | $ | 53,087 | | | $ | 4,941,346 | | | | 1.63 | % |
The accompanying notes are an integral part of these financial statements.
| | | | | | |
| Consolidated statement of assets and liabilities—March 31, 2018 | | Wells Fargo Precious Metals Fund | | | 13 | |
| | | | |
| | | | |
| |
Assets | | | | |
Investments in unaffiliated securities, at value (cost $218,290,535) | | $ | 283,792,409 | |
Investments in commodities, at value (cost $5,772,407) | | | 12,854,044 | |
Investments in affiliated securities, at value (cost $4,941,346) | | | 4,941,346 | |
Cash | | | 76,256 | |
Foreign currency, at value (cost $649,067) | | | 648,054 | |
Receivable for investments sold | | | 1,406 | |
Receivable for Fund shares sold | | | 657,786 | |
Receivable for dividends | | | 824,673 | |
Prepaid expenses and other assets | | | 55,919 | |
| | | | |
Total assets | | | 303,851,893 | |
| | | | |
| |
Liabilities | | | | |
Payable for Fund shares redeemed | | | 670,700 | |
Management fee payable | | | 151,797 | |
Administration fees payable | | | 48,869 | |
Distribution fees payable | | | 21,628 | |
Trustees’ fees and expenses payable | | | 2,959 | |
Accrued expenses and other liabilities | | | 276,986 | |
| | | | |
Total liabilities | | | 1,172,939 | |
| | | | |
Total net assets | | $ | 302,678,954 | |
| | | | |
| |
NET ASSETS CONSIST OF | | | | |
Paid-in capital | | $ | 421,002,675 | |
Accumulated net investment loss | | | (12,736 | ) |
Accumulated net realized losses on investments | | | (190,892,640 | ) |
Net unrealized gains on investments | | | 72,581,655 | |
| | | | |
Total net assets | | $ | 302,678,954 | |
| | | | |
| |
COMPUTATION OF NET ASSET VALUE AND OFFERING PRICE PER SHARE | | | | |
Net assets – Class A | | $ | 177,859,007 | |
Shares outstanding – Class A1 | | | 5,422,358 | |
Net asset value per share – Class A | | | $32.80 | |
Maximum offering price per share – Class A2 | | | $34.80 | |
Net assets – Class C | | $ | 33,021,754 | |
Shares outstanding – Class C1 | | | 1,135,318 | |
Net asset value per share – Class C | | | $29.09 | |
Net assets – Administrator Class | | $ | 9,147,981 | |
Shares outstanding – Administrator Class1 | | | 276,499 | |
Net asset value per share – Administrator Class | | | $33.09 | |
Net assets – Institutional Class | | $ | 82,650,212 | |
Shares outstanding – Institutional Class1 | | | 2,481,838 | |
Net asset value per share – Institutional Class | | | $33.30 | |
| 1 | The Fund has an unlimited number of authorized shares. |
| 2 | Maximum offering price is computed as 100/94.25 of net asset value. On investments of $50,000 or more, the offering price is reduced. |
The accompanying notes are an integral part of these financial statements.
| | | | |
| 14 | | Wells Fargo Precious Metals Fund | | Consolidated statement of operations—March 31, 2018 |
| | | | |
| | | | |
| |
Investment income | | | | |
Dividends (net of foreign withholding taxes of $149,869) | | $ | 2,536,280 | |
Income from affiliated securities | | | 53,087 | |
| | | | |
Total investment income | | | 2,589,367 | |
| | | | |
| |
Expenses | | | | |
Management fee | | | 2,352,199 | |
Administration fees | | | | |
Class A | | | 457,760 | |
Class B | | | 43 | 1 |
Class C | | | 84,751 | |
Administrator Class | | | 19,567 | |
Institutional Class | | | 115,006 | |
Shareholder servicing fees | | | | |
Class A | | | 544,952 | |
Class B | | | 52 | 1 |
Class C | | | 100,894 | |
Administrator Class | | | 37,427 | |
Distribution fees | | | | |
Class B | | | 155 | 1 |
Class C | | | 302,682 | |
Custody and accounting fees | | | 69,486 | |
Professional fees | | | 73,238 | |
Registration fees | | | 100,469 | |
Shareholder report expenses | | | 67,301 | |
Trustees’ fees and expenses | | | 20,950 | |
Interest expense | | | 2,025 | |
Other fees and expenses | | | 38,602 | |
| | | | |
Total expenses | | | 4,387,559 | |
Less: Fee waivers and/or expense reimbursements | | | (612,569 | ) |
| | | | |
Net expenses | | | 3,774,990 | |
| | | | |
Net investment loss | | | (1,185,623 | ) |
| | | | |
| |
REALIZED AND UNREALIZED GAINS (LOSSES) ON INVESTMENTS | | | | |
| |
Net realized gains (losses) on: | | | | |
Unaffiliated securities | | | (3,435,693 | ) |
Commodities | | | 2,845,965 | |
| | | | |
Net realized losses on investments | | | (589,728 | ) |
| | | | |
| |
Net change in unrealized gains (losses) on: | | | | |
Unaffiliated securities | | | (22,203,670 | ) |
Commodities | | | (1,973,726 | ) |
| | | | |
Net change in unrealized gains (losses) on investments | | | (24,177,396 | ) |
| | | | |
Net realized and unrealized gains (losses) on investments | | | (24,767,124 | ) |
| | | | |
Net decrease in net assets resulting from operations | | $ | (25,952,747 | ) |
| | | | |
| 1 | For the period from April 1, 2017 to May 5, 2017. Effective at the close of business on May 5, 2017, Class B shares were converted to Class A shares and are no longer offered by the Fund. |
The accompanying notes are an integral part of these financial statements.
| | | | | | |
| Consolidated statement of changes in net assets | | Wells Fargo Precious Metals Fund | | | 15 | |
| | | | | | | | | | | | | | | | |
| | | Year ended
March 31, 2018 | | | Year ended
March 31, 2017 | |
| | | | |
Operations | | | | | | | | | | | | | | | | |
Net investment loss | | | | | | $ | (1,185,623 | ) | | | | | | $ | (2,691,281 | ) |
Net realized losses on investments | | | | | | | (589,728 | ) | | | | | | | (13,480,723 | ) |
Net change in unrealized gains (losses) on investments | | | | | | | (24,177,396 | ) | | | | | | | 53,869,022 | |
| | | | |
Net increase (decrease) in net assets resulting from operations | | | | | | | (25,952,747 | ) | | | | | | | 37,697,018 | |
| | | | |
| | | | |
Distributions to shareholders from | | | | | | | | | | | | | | | | |
Net investment income | | | | | | | | | | | | | | | | |
Class A | | | | | | | (2,808,058 | ) | | | | | | | (2,528,219 | ) |
Class C | | | | | | | (414,068 | ) | | | | | | | (93,205 | ) |
Administrator Class | | | | | | | (169,120 | ) | | | | | | | (171,836 | ) |
Institutional Class | | | | | | | (1,238,811 | ) | | | | | | | (1,107,568 | ) |
| | | | |
Total distributions to shareholders | | | | | | | (4,630,057 | ) | | | | | | | (3,900,828 | ) |
| | | | |
| | | | |
Capital share transactions | | | Shares | | | | | | | | Shares | | | | | |
Proceeds from shares sold | | | | | | | | | | | | | | | | |
Class A | | | 1,343,343 | | | | 47,874,671 | | | | 3,226,333 | | | | 129,043,997 | |
Class C | | | 71,931 | | | | 2,255,869 | | | | 176,439 | | | | 6,487,911 | |
Administrator Class | | | 312,074 | | | | 11,409,031 | | | | 400,135 | | | | 16,365,612 | |
Institutional Class | | | 1,240,353 | | | | 44,707,060 | | | | 2,035,032 | | | | 80,762,220 | |
| | | | |
| | | | | | | 106,246,631 | | | | | | | | 232,659,740 | |
| | | | |
Reinvestment of distributions | | | | | | | | | | | | | | | | |
Class A | | | 76,499 | | | | 2,579,538 | | | | 73,573 | | | | 2,335,195 | |
Class C | | | 12,259 | | | | 367,387 | | | | 2,603 | | | | 73,806 | |
Administrator Class | | | 4,880 | | | | 165,920 | | | | 5,281 | | | | 168,842 | |
Institutional Class | | | 34,049 | | | | 1,164,824 | | | | 32,082 | | | | 1,030,807 | |
| | | | |
| | | | | | | 4,277,669 | | | | | | | | 3,608,650 | |
| | | | |
Payment for shares redeemed | | | | | | | | | | | | | | | | |
Class A | | | (2,732,751 | ) | | | (97,070,775 | ) | | | (3,783,850 | ) | | | (149,375,218 | ) |
Class B | | | (9,235 | )1 | | | (291,832 | )1 | | | (43,303 | ) | | | (1,545,178 | ) |
Class C | | | (467,766 | ) | | | (14,797,679 | ) | | | (469,094 | ) | | | (15,888,846 | ) |
Administrator Class | | | (463,024 | ) | | | (16,820,569 | ) | | | (471,423 | ) | | | (17,496,401 | ) |
Institutional Class | | | (1,251,776 | ) | | | (44,720,355 | ) | | | (1,419,312 | ) | | | (56,098,146 | ) |
| | | | |
| | | | | | | (173,701,210 | ) | | | | | | | (240,403,789 | ) |
| | | | |
Net decrease in net assets resulting from capital share transactions | | | | | | | (63,176,910 | ) | | | | | | | (4,135,399 | ) |
| | | | |
Total increase (decrease) in net assets | | | | | | | (93,759,714 | ) | | | | | | | 29,660,791 | |
| | | | |
| | | | |
Net assets | | | | | | | | | | | | | | | | |
Beginning of period | | | | | | | 396,438,668 | | | | | | | | 366,777,877 | |
| | | | |
End of period | | | | | | $ | 302,678,954 | | | | | | | $ | 396,438,668 | |
| | | | |
Undistributed (accumulated) net investment income (loss) | | | | | | $ | (12,736 | ) | | | | | | $ | 4,610,365 | |
| | | | |
| 1 | For the period from April 1, 2017 to May 5, 2017. Effective at the close of business on May 5, 2017, Class B shares were converted to Class A shares and are no longer offered by the Fund. |
The accompanying notes are an integral part of these financial statements.
| | | | |
| 16 | | Wells Fargo Precious Metals Fund | | Consolidated financial highlights |
(For a share outstanding throughout each period)
| | | | | | | | | | | | | | | | | | | | |
| | | Year ended March 31 | |
| CLASS A | | 2018 | | | 2017 | | | 2016 | | | 2015 | | | 20141 | |
Net asset value, beginning of period | | | $35.99 | | | | $32.73 | | | | $28.99 | | | | $36.65 | | | | $53.59 | |
Net investment income (loss) | | | (0.11 | )2 | | | (0.22 | )2 | | | (0.05 | ) | | | (0.11 | )2 | | | 0.05 | 2 |
Net realized and unrealized gains (losses) on investments | | | (2.60 | ) | | | 3.85 | | | | 3.79 | | | | (7.55 | ) | | | (16.78 | ) |
| | | | | | | | | | | | | | | | | | | | |
Total from investment operations | | | (2.71 | ) | | | 3.63 | | | | 3.74 | | | | (7.66 | ) | | | (16.73 | ) |
Distributions to shareholders from | | | | | | | | | | | | | | | | | | | | |
Net investment income | | | (0.48 | ) | | | (0.37 | ) | | | 0.00 | | | | 0.00 | | | | 0.00 | |
Net realized gains | | | 0.00 | | | | 0.00 | | | | 0.00 | | | | 0.00 | | | | (0.21 | ) |
| | | | | | | | | | | | | | | | | | | | |
Total distributions to shareholders | | | (0.48 | ) | | | (0.37 | ) | | | 0.00 | | | | 0.00 | | | | (0.21 | ) |
Net asset value, end of period | | | $32.80 | | | | $35.99 | | | | $32.73 | | | | $28.99 | | | | $36.65 | |
Total return3 | | | (7.56 | )% | | | 11.24 | % | | | 12.90 | % | | | (20.90 | )% | | | (31.17 | )% |
Ratios to average net assets (annualized) | | | | | | | | | | | | | | | | | | | | |
Gross expenses | | | 1.21 | % | | | 1.20 | % | | | 1.23 | % | | | 1.23 | % | | | 1.22 | % |
Net expenses | | | 1.04 | % | | | 1.09 | % | | | 1.10 | % | | | 1.10 | % | | | 1.09 | % |
Net investment income (loss) | | | (0.33 | )% | | | (0.57 | )% | | | (0.24 | )% | | �� | (0.30 | )% | | | 0.12 | % |
Supplemental data | | | | | | | | | | | | | | | | | | | | |
Portfolio turnover rate | | | 27 | %4 | | | 21 | %4 | | | 18 | %4 | | | 9 | %4 | | | 16 | % |
Net assets, end of period (000s omitted) | | | $177,859 | | | | $242,423 | | | | $236,310 | | | | $211,477 | | | | $300,906 | |
| 1 | Amounts do not reflect the consolidated financial results of its wholly-owned subsidiary. |
| 2 | Calculated based upon average shares outstanding |
| 3 | Total return calculations do not include any sales charges. |
| 4 | Portfolio turnover rate includes the purchases and sales transactions of its wholly-owned subsidiary. |
The accompanying notes are an integral part of these financial statements.
| | | | | | |
| Consolidated financial highlights | | Wells Fargo Precious Metals Fund | | | 17 | |
(For a share outstanding throughout each period)
| | | | | | | | | | | | | | | | | | | | |
| | | Year ended March 31 | |
| CLASS C | | 2018 | | | 2017 | | | 2016 | | | 2015 | | | 20141 | |
Net asset value, beginning of period | | | $32.07 | | | | $29.10 | | | | $25.97 | | | | $33.08 | | | | $48.76 | |
Net investment loss | | | (0.33 | )2 | | | (0.46 | )2 | | | (0.24 | )2 | | | (0.35 | )2 | | | (0.22 | )2 |
Net realized and unrealized gains (losses) on investments | | | (2.30 | ) | | | 3.49 | | | | 3.37 | | | | (6.76 | ) | | | (15.25 | ) |
| | | | | | | | | | | | | | | | | | | | |
Total from investment operations | | | (2.63 | ) | | | 3.03 | | | | 3.13 | | | | (7.11 | ) | | | (15.47 | ) |
Distributions to shareholders from | | | | | | | | | | | | | | | | | | | | |
Net investment income | | | (0.35 | ) | | | (0.06 | ) | | | 0.00 | | | | 0.00 | | | | 0.00 | |
Net realized gains | | | 0.00 | | | | 0.00 | | | | 0.00 | | | | 0.00 | | | | (0.21 | ) |
| | | | | | | | | | | | | | | | | | | | |
Total distributions to shareholders | | | (0.35 | ) | | | (0.06 | ) | | | 0.00 | | | | 0.00 | | | | (0.21 | ) |
Net asset value, end of period | | | $29.09 | | | | $32.07 | | | | $29.10 | | | | $25.97 | | | | $33.08 | |
Total return3 | | | (8.24 | )% | | | 10.42 | % | | | 12.05 | % | | | (21.49 | )% | | | (31.67 | )% |
Ratios to average net assets (annualized) | | | | | | | | | | | | | | | | | | | | |
Gross expenses | | | 1.96 | % | | | 1.95 | % | | | 1.99 | % | | | 1.98 | % | | | 1.97 | % |
Net expenses | | | 1.79 | % | | | 1.84 | % | | | 1.85 | % | | | 1.85 | % | | | 1.84 | % |
Net investment loss | | | (1.07 | )% | | | (1.32 | )% | | | (0.99 | )% | | | (1.06 | )% | | | (0.62 | )% |
Supplemental data | | | | | | | | | | | | | | | | | | | | |
Portfolio turnover rate | | | 27 | %4 | | | 21 | %4 | | | 18 | %4 | | | 9 | %4 | | | 16 | % |
Net assets, end of period (000s omitted) | | | $33,022 | | | | $48,710 | | | | $52,648 | | | | $59,074 | | | | $94,865 | |
| 1 | Amounts do not reflect the consolidated financial results of its wholly-owned subsidiary. |
| 2 | Calculated based upon average shares outstanding |
| 3 | Total return calculations do not include any sales charges. |
| 4 | Portfolio turnover rate includes the purchases and sales transactions of its wholly-owned subsidiary. |
The accompanying notes are an integral part of these financial statements.
| | | | |
| 18 | | Wells Fargo Precious Metals Fund | | Consolidated financial highlights |
(For a share outstanding throughout each period)
| | | | | | | | | | | | | | | | | | | | |
| | | Year ended March 31 | |
| ADMINISTRATOR CLASS | | 2018 | | | 2017 | | | 2016 | | | 2015 | | | 20141 | |
Net asset value, beginning of period | | | $36.27 | | | | $32.98 | | | | $29.17 | | | | $36.82 | | | | $53.75 | |
Net investment income (loss) | | | (0.09 | )2 | | | (0.17 | )2 | | | (0.03 | )2 | | | (0.06 | )2 | | | 0.10 | 2 |
Net realized and unrealized gains (losses) on investments | | | (2.59 | ) | | | 3.87 | | | | 3.84 | | | | (7.59 | ) | | | (16.82 | ) |
| | | | | | | | | | | | | | | | | | | | |
Total from investment operations | | | (2.68 | ) | | | 3.70 | | | | 3.81 | | | | (7.65 | ) | | | (16.72 | ) |
Distributions to shareholders from | | | | | | | | | | | | | | | | | | | | |
Net investment income | | | (0.50 | ) | | | (0.41 | ) | | | 0.00 | | | | 0.00 | | | | 0.00 | |
Net realized gains | | | 0.00 | | | | 0.00 | | | | 0.00 | | | | 0.00 | | | | (0.21 | ) |
| | | | | | | | | | | | | | | | | | | | |
Total distributions to shareholders | | | (0.50 | ) | | | (0.41 | ) | | | 0.00 | | | | 0.00 | | | | (0.21 | ) |
Net asset value, end of period | | | $33.09 | | | | $36.27 | | | | $32.98 | | | | $29.17 | | | | $36.82 | |
Total return | | | (7.40 | )% | | | 11.37 | % | | | 13.06 | % | | | (20.78 | )% | | | (31.06 | )% |
Ratios to average net assets (annualized) | | | | | | | | | | | | | | | | | | | | |
Gross expenses | | | 1.15 | % | | | 1.12 | % | | | 1.13 | % | | | 1.07 | % | | | 1.04 | % |
Net expenses | | | 0.91 | % | | | 0.95 | % | | | 0.96 | % | | | 0.96 | % | | | 0.95 | % |
Net investment income (loss) | | | (0.25 | )% | | | (0.44 | )% | | | (0.10 | )% | | | (0.17 | )% | | | 0.26 | % |
Supplemental data | | | | | | | | | | | | | | | | | | | | |
Portfolio turnover rate | | | 27 | %3 | | | 21 | %3 | | | 18 | %3 | | | 9 | %3 | | | 16 | % |
Net assets, end of period (000s omitted) | | | $9,148 | | | | $15,325 | | | | $16,114 | | | | $21,917 | | | | $32,230 | |
| 1 | Amounts do not reflect the consolidated financial results of its wholly-owned subsidiary. |
| 2 | Calculated based upon average shares outstanding |
| 3 | Portfolio turnover rate includes the purchases and sales transactions of its wholly-owned subsidiary. |
The accompanying notes are an integral part of these financial statements.
| | | | | | |
| Consolidated financial highlights | | Wells Fargo Precious Metals Fund | | | 19 | |
(For a share outstanding throughout each period)
| | | | | | | | | | | | | | | | | | | | |
| | | Year ended March 31 | |
| INSTITUTIONAL CLASS | | 2018 | | | 2017 | | | 2016 | | | 2015 | | | 20141 | |
Net asset value, beginning of period | | | $36.47 | | | | $33.21 | | | | $29.33 | | | | $36.96 | | | | $53.87 | |
Net investment income (loss) | | | 0.02 | | | | (0.09 | )2 | | | 0.02 | 2 | | | 0.01 | 2 | | | 0.16 | 2 |
Net realized and unrealized gains (losses) on investments | | | (2.67 | ) | | | 3.85 | | | | 3.86 | | | | (7.64 | ) | | | (16.86 | ) |
| | | | | | | | | | | | | | | | | | | | |
Total from investment operations | | | (2.65 | ) | | | 3.76 | | | | 3.88 | | | | (7.63 | ) | | | (16.70 | ) |
Distributions to shareholders from | | | | | | | | | | | | | | | | | | | | |
Net investment income | | | (0.52 | ) | | | (0.50 | ) | | | 0.00 | | | | 0.00 | | | | 0.00 | |
Net realized gains | | | 0.00 | | | | 0.00 | | | | 0.00 | | | | 0.00 | | | | (0.21 | ) |
| | | | | | | | | | | | | | | | | | | | |
Total distributions to shareholders | | | (0.52 | ) | | | (0.50 | ) | | | 0.00 | | | | 0.00 | | | | (0.21 | ) |
Net asset value, end of period | | | $33.30 | | | | $36.47 | | | | $33.21 | | | | $29.33 | | | | $36.96 | |
Total return | | | (7.27 | )% | | | 11.49 | % | | | 13.23 | % | | | (20.64 | )% | | | (30.95 | )% |
Ratios to average net assets (annualized) | | | | | | | | | | | | | | | | | | | | |
Gross expenses | | | 0.88 | % | | | 0.88 | % | | | 0.88 | % | | | 0.80 | % | | | 0.79 | % |
Net expenses | | | 0.73 | % | | | 0.79 | % | | | 0.80 | % | | | 0.79 | % | | | 0.78 | % |
Net investment income (loss) | | | 0.01 | % | | | (0.24 | )% | | | 0.06 | % | | | 0.03 | % | | | 0.41 | % |
Supplemental data | | | | | | | | | | | | | | | | | | | | |
Portfolio turnover rate | | | 27 | %3 | | | 21 | %3 | | | 18 | %3 | | | 9 | %3 | | | 16 | % |
Net assets, end of period (000s omitted) | | | $82,650 | | | | $89,680 | | | | $60,156 | | | | $43,014 | | | | $41,993 | |
| 1 | Amounts do not reflect the consolidated financial results of its wholly-owned subsidiary. |
| 2 | Calculated based upon average shares outstanding |
| 3 | Portfolio turnover rate includes the purchases and sales transactions of its wholly-owned subsidiary. |
The accompanying notes are an integral part of these financial statements.
| | | | |
| 20 | | Wells Fargo Precious Metals Fund | | Notes to consolidated financial statements |
1. ORGANIZATION
Wells Fargo Funds Trust (the “Trust”), a Delaware statutory trust organized on March 10, 1999, is an open-end management investment company registered under the Investment Company Act of 1940, as amended (the “1940 Act”). As an investment company, the Trust follows the accounting and reporting guidance in Financial Accounting Standards Board Accounting Standards Codification Topic 946, Financial Services – Investment Companies. These financial statements report on the Wells Fargo Precious Metals Fund (the “Fund”) which is a non-diversified series of the Trust.
Effective at the close of business on May 5, 2017, Class B shares were converted to Class A shares and are no longer offered by the Fund. Information for Class B shares reflected in the financial statements represents activity through May 5, 2017.
2. INVESTMENT IN SUBSIDIARY
The Fund invests in precious metals and minerals through Special Investments (Cayman) SPC (the “Subsidiary”), a wholly-owned subsidiary incorporated on May 3, 2005 under the laws of the Cayman Islands as an exempted segregated portfolio company with limited liability. As of March 31, 2018, the Subsidiary held $12,854,044 in gold bullion representing 100% of its net assets. The Fund is the sole shareholder of the Subsidiary. As of March 31, 2018, the Fund held $12,807,583 in the Subsidiary, representing 4.23% of the Fund’s net assets.
The consolidated financial statements of the Fund include the financial results of its wholly-owned subsidiary. The Consolidated Portfolio of Investments includes positions of the Fund and the Subsidiary and the consolidated financial statements include the accounts of the Fund and the Subsidiary. Accordingly, all interfund balances and transactions between the Fund and the Subsidiary have been eliminated in consolidation.
3. SIGNIFICANT ACCOUNTING POLICIES
The following significant accounting policies, which are consistently followed in the preparation of the financial statements of the Fund, are in conformity with U.S. generally accepted accounting principles which require management to make estimates and assumptions that affect the reported amounts of assets and liabilities, disclosure of contingent assets and liabilities at the date of the financial statements, and the reported amounts of revenues and expenses during the reporting period. Actual results could differ from those estimates.
Securities valuation
All investments are valued each business day as of the close of regular trading on the New York Stock Exchange (generally 4 p.m. Eastern Time), although the Fund may deviate from this calculation time under unusual or unexpected circumstances.
Equity securities that are listed on a foreign or domestic exchange or market are valued at the official closing price or, if none, the last sales price. If no sale occurs on the principal exchange or market that day, a fair value price will be determined in accordance with the Fund’s Valuation Procedures.
Investments in commodities are valued at their last traded price.
The values of securities denominated in foreign currencies are translated into U.S. dollars at rates provided by an independent foreign currency pricing source at a time each business day specified by the Wells Fargo Asset Management Pricing Committee at Wells Fargo Funds Management, LLC (“Funds Management”)
Many securities markets and exchanges outside the U.S. close prior to the close of the New York Stock Exchange and therefore may not fully reflect trading or events that occur after the close of the principal exchange in which the foreign securities are traded, but before the close of the New York Stock Exchange. If such trading or events are expected to materially affect the value of such securities, then fair value pricing procedures approved by the Board of Trustees of the Fund are applied. These procedures take into account multiple factors including movements in U.S. securities markets after foreign exchanges close. Foreign securities that are fair valued under these procedures are categorized as Level 2 and the application of these procedures may result in transfers between Level 1 and Level 2. Depending on market activity, such fair valuations may be frequent. Such fair value pricing may result in net asset values that are higher or lower than net asset values based on the last reported sales price or latest quoted bid price. On March 31, 2018, such fair value pricing was used in pricing certain foreign securities.
Investments in registered open-end investment companies are valued at net asset value.
Investments which are not valued using any of the methods discussed above are valued at their fair value, as determined in good faith by the Board of Trustees. The Board of Trustees has established a Valuation Committee comprised of the
| | | | | | |
| Notes to consolidated financial statements | | Wells Fargo Precious Metals Fund | | | 21 | |
Trustees and has delegated to it the authority to take any actions regarding the valuation of portfolio securities that the Valuation Committee deems necessary or appropriate, including determining the fair value of portfolio securities, unless the determination has been delegated to the Wells Fargo Asset Management Pricing Committee. The Board of Trustees retains the authority to make or ratify any valuation decisions or approve any changes to the Valuation Procedures as it deems appropriate. On a quarterly basis, the Board of Trustees receives reports on any valuation actions taken by the Valuation Committee or the Wells Fargo Asset Management Pricing Committee which may include items for ratification.
Valuations of fair valued securities are compared to the next actual sales price when available, or other appropriate market values, to assess the continued appropriateness of the fair valuation methodologies used. These securities are fair valued on a day-to-day basis, taking into consideration changes to appropriate market information and any significant changes to the inputs considered in the valuation process until there is a readily available price provided on an exchange or by an independent pricing service. Valuations received from an independent pricing service or independent broker-dealer quotes are periodically validated by comparisons to most recent trades and valuations provided by other independent pricing services in addition to the review of prices by the manager and/or subadviser. Unobservable inputs used in determining fair valuations are identified based on the type of security, taking into consideration factors utilized by market participants in valuing the investment, knowledge about the issuer and the current market environment.
Foreign currency translation
The accounting records of the Fund are maintained in U.S. dollars. The values of other assets and liabilities denominated in foreign currencies are translated into U.S. dollars at rates provided by an independent foreign currency pricing source at a time each business day specified by the Wells Fargo Asset Management Pricing Committee. Purchases and sales of securities, and income and expenses are converted at the rate of exchange on the respective dates of such transactions. Net realized foreign exchange gains or losses arise from sales of foreign currencies, currency gains or losses realized between the trade and settlement dates on securities transactions, and the difference between the amounts of dividends, interest and foreign withholding taxes recorded and the U.S. dollar equivalent of the amounts actually paid or received. Net unrealized foreign exchange gains and losses arise from changes in the fair value of assets and liabilities other than investments in securities resulting from changes in exchange rates. The changes in net assets arising from changes in exchange rates of securities and the changes in net assets resulting from changes in market prices of securities are not separately presented. Such changes are included in net realized and unrealized gains or losses from investments.
Security transactions and income recognition
Securities transactions are recorded on a trade date basis. Realized gains or losses are recorded on the basis of identified cost.
Dividend income is recognized on the ex-dividend date, except for certain dividends from foreign securities, which are recorded as soon as the custodian verifies the ex-dividend date. Dividend income from foreign securities is recorded net of foreign taxes withheld where recovery of such taxes is not assured.
Distributions to shareholders
Distributions to shareholders from net investment income and any net realized gains are recorded on the ex-dividend date and paid at least annually. Such distributions are determined in accordance with income tax regulations and may differ from U.S. generally accepted accounting principles. Dividend sources are estimated at the time of declaration. The tax character of distributions is determined as of the Fund’s fiscal year end. Therefore, a portion of the Fund’s distributions made prior to the Fund’s fiscal year end may be categorized as a tax return of capital at year end.
Federal and other taxes
The Fund intends to continue to qualify as a regulated investment company by distributing substantially all of its investment company taxable income and any net realized capital gains (after reduction for capital loss carryforwards) sufficient to relieve it from all, or substantially all, federal income taxes. Accordingly, no provision for federal income taxes was required.
The Subsidiary is classified as a controlled foreign corporation under Subchapter N of the Internal Revenue Code. Therefore, the Fund is required to increase its taxable income by its share of the Subsidiary’s income. Net investment losses of the Subsidiary cannot be deducted by the Fund in the current period nor carried forward to offset taxable income in future periods.
The Fund’s income and federal excise tax returns and all financial records supporting those returns for the prior three fiscal years are subject to examination by the federal and Delaware revenue authorities. Management has analyzed the
| | | | |
| 22 | | Wells Fargo Precious Metals Fund | | Notes to consolidated financial statements |
Fund’s tax positions taken on federal, state, and foreign tax returns for all open tax years and does not believe that there are any uncertain tax positions that require recognition of a tax liability.
As of March 31, 2018, the aggregate cost of all investments for federal income tax purposes was $243,705,071 and the unrealized gains (losses) consisted of:
| | | | |
Gross unrealized gains | | $ | 84,145,104 | |
Gross unrealized losses | | | (26,262,376 | ) |
Net unrealized gains | | $ | 57,882,728 | |
Reclassifications are made to the Fund’s capital accounts for permanent tax differences to reflect income and gains available for distribution (or available capital loss carryforwards) under federal income tax regulations. U.S. generally accepted accounting principles require that certain components of net assets be adjusted to reflect permanent differences between financial and tax reporting. These reclassifications have no effect on net assets or net asset values per share. The primary permanent differences causing such reclassifications are due to dividends from certain securities, net operating losses, and passive foreign investment companies. At March 31, 2018, as a result of permanent book-to-tax differences, the following reclassification adjustments were made on the Statement of Assets and Liabilities:
| | | | |
| Paid-in capital | | Accumulated net
investment loss | | Accumulated net
realized losses
on investments |
| $(610,528) | | $1,192,579 | | $(582,051) |
As of March 31, 2018, the Fund had capital loss carryforwards which consist of $25,473,541 in short-term capital losses and $150,718,316 in long-term capital losses.
Class allocations
The separate classes of shares offered by the Fund differ principally in applicable sales charges, distribution, shareholder servicing, and administration fees. Class specific expenses are charged directly to that share class. Investment income, common expenses, and realized and unrealized gains (losses) on investments are allocated daily to each class of shares based on the relative proportion of net assets of each class.
4. FAIR VALUATION MEASUREMENTS
Fair value measurements of investments are determined within a framework that has established a fair value hierarchy based upon the various data inputs utilized in determining the value of the Fund’s investments. The three-level hierarchy gives the highest priority to unadjusted quoted prices in active markets for identical assets or liabilities (Level 1) and the lowest priority to unobservable inputs (Level 3). The Fund’s investments are classified within the fair value hierarchy based on the lowest level of input that is significant to the fair value measurement. The inputs are summarized into three broad levels as follows:
| ∎ | | Level 1 – quoted prices in active markets for identical securities |
| ∎ | | Level 2 – other significant observable inputs (including quoted prices for similar securities, interest rates, prepayment speeds, credit risk, etc.) |
| ∎ | | Level 3 – significant unobservable inputs (including the Fund’s own assumptions in determining the fair value of investments) |
The inputs or methodologies used for valuing investments in securities are not necessarily an indication of the risk associated with investing in those securities.
| | | | | | |
| Notes to consolidated financial statements | | Wells Fargo Precious Metals Fund | | | 23 | |
The following is a summary of the inputs used in valuing the Fund’s assets and liabilities as of March 31, 2018:
| | | | | | | | | | | | | | | | |
| | | Quoted prices (Level 1) | | | Other significant
observable inputs
(Level 2) | | | Significant
unobservable inputs (Level 3) | | | Total | |
Assets | | | | | | | | | | | | | | | | |
Investments in: | | | | | | | | | | | | | | | | |
| | | | |
Common stocks | | | | | | | | | | | | | | | | |
Australia | | $ | 0 | | | $ | 18,764,048 | | | $ | 0 | | | $ | 18,764,048 | |
Canada | | | 156,555,396 | | | | 24,546,473 | | | | 0 | | | | 181,101,869 | |
South Africa | | | 7,170,560 | | | | 0 | | | | 0 | | | | 7,170,560 | |
United Kingdom | | | 23,057,480 | | | | 13,003,626 | | | | 0 | | | | 36,061,106 | |
United States | | | 40,694,826 | | | | 0 | | | | 0 | | | | 40,694,826 | |
| | | | |
Commodities | | | 12,854,044 | | | | 0 | | | | 0 | | | | 12,854,044 | |
| | | | |
Short-term investments | | | | | | | | | | | | | | | | |
Investment companies | | | 4,941,346 | | | | 0 | | | | 0 | | | | 4,941,346 | |
Total assets | | $ | 245,273,652 | | | $ | 56,314,147 | | | $ | 0 | | | $ | 301,587,799 | |
The Fund recognizes transfers between levels within the fair value hierarchy at the end of the reporting period. At March 31, 2018, fair value pricing was used in pricing certain foreign securities and common stocks valued at $24,651,807 were transferred from Level 1 to Level 2 within the fair value hierarchy. The Fund did not have any transfers into/out of Level 3.
5. TRANSACTIONS WITH AFFILIATES
Management fee
Funds Management, an indirect wholly owned subsidiary of Wells Fargo & Company (“Wells Fargo”), is the manager of the Fund and provides advisory and fund-level administrative services under an investment management agreement. Under the investment management agreement, Funds Management is responsible for, among other services, implementing the investment objectives and strategies of the Fund, supervising the subadviser, providing fund-level administrative services in connection with the Fund’s operations, and providing any other fund-level administrative services reasonably necessary for the operation of the Fund. As compensation for its services under the investment management agreement, Funds Management is entitled to receive an annual management fee starting at 0.65% and declining to 0.48% as the average daily net assets of the Fund increase. For the year ended March 31, 2018, the management fee was equivalent to an annual rate of 0.65% of the Fund’s average daily net assets.
The Subsidiary has entered into a separate advisory contract with Funds Management to manage the investment and reinvestment of its assets in conformity with its investment objectives and restrictions. Under this agreement, the Subsidiary does not pay Funds Management a fee for its services.
Funds Management has retained the services of a subadviser to provide daily portfolio management to the Fund. The fee for subadvisory services is borne by Funds Management. Wells Capital Management Incorporated, an affiliate of Funds Management and an indirect wholly owned subsidiary of Wells Fargo, is the subadviser to the Fund and is entitled to receive a fee from Funds Management at an annual rate starting at 0.40% and declining to 0.30% as the average daily net assets of the Fund increase.
Administration fees
Under a class-level administration agreement, Funds Management provides class-level administrative services to the Fund, which includes paying fees and expenses for services provided by the transfer agent, sub-transfer agents, omnibus account servicers and record-keepers. As compensation for its services under the class-level administration agreement, Funds Management receives an annual fee which is calculated based on the average daily net assets of each class as follows:
| | | | |
| | | Class-level administration fee | |
Class A, Class B, Class C | | | 0.21 | % |
Administrator Class, Institutional Class | | | 0.13 | |
| | | | |
| 24 | | Wells Fargo Precious Metals Fund | | Notes to consolidated financial statements |
Funds Management has contractually waived and/or reimbursed management and administration fees to the extent necessary to maintain certain net operating expense ratios for the Fund. Waiver of fees and/or reimbursement of expenses by Funds Management were made first from fund level expenses on a proportionate basis and then from class specific expenses. Funds Management has committed through July 31, 2018 to waive fees and/or reimburse expenses to the extent necessary to cap the Fund’s expenses at 1.09% for Class A shares, 1.84% for Class C shares, 0.95% for Administrator Class shares, and 0.79% for Institutional Class shares. After this time, the cap may be increased or the commitment to maintain the cap may be terminated only with the approval of the Board of Trustees.
Distribution fees
The Trust has adopted a distribution plan for Class B and Class C shares of the Fund pursuant to Rule 12b-1 under the 1940 Act. Distribution fees are charged to Class B and Class C shares and paid to Wells Fargo Funds Distributor, LLC (“Funds Distributor”), the principal underwriter, at an annual rate of 0.75% of the average daily net assets of Class B and Class C shares.
In addition, Funds Distributor is entitled to receive the front-end sales charge from the purchase of Class A shares and a contingent deferred sales charge on the redemption of certain Class A shares. Funds Distributor is also entitled to receive the contingent deferred sales charges from redemptions of Class C shares. For the year ended March 31, 2018, Funds Distributor received $14,703 from the sale of Class A shares and $102 in contingent deferred sales charges from redemptions of Class C shares, respectively. No contingent deferred sales charges were incurred by Class A and Class B shares for the year ended March 31, 2018.
Shareholder servicing fees
The Trust has entered into contracts with one or more shareholder servicing agents, whereby Class A, Class B, Class C, and Administrator Class of the Fund are charged a fee at an annual rate of 0.25% of the average daily net assets of each respective class.
A portion of these total shareholder servicing fees were paid to affiliates of Wells Fargo.
Interfund transactions
The Fund may purchase or sell investment securities to other Wells Fargo affiliates pursuant to Rule 17a-7 under the 1940 Act and under procedures adopted by the Board of Trustees. The procedures have been designed to ensure that these interfund transactions, which do not incur broker commissions, are effected at current market prices.
6. INVESTMENT PORTFOLIO TRANSACTIONS
Purchases and sales of investments, excluding U.S. government obligations (if any) and short-term securities, for the year ended March 31, 2018 were $96,558,564 and $166,398,137, respectively. These amounts include purchases and sales transactions of the Subsidiary.
7. BANK BORROWINGS
The Trust (excluding the money market funds and certain other funds) and Wells Fargo Variable Trust are parties to a $280,000,000 revolving credit agreement whereby the Fund is permitted to use bank borrowings for temporary or emergency purposes, such as to fund shareholder redemption requests. Interest under the credit agreement is charged to the Fund based on a borrowing rate equal to the higher of the Federal Funds rate in effect on that day plus 1.25% or the overnight LIBOR rate in effect on that day plus 1.25%. In addition, an annual commitment fee equal to 0.25% of the unused balance is allocated to each participating fund. Prior to August 29, 2017, the revolving credit agreement amount was $250,000,000.
During the year ended March 31, 2018, the Fund had average borrowings outstanding of $81,984 at an average interest rate of 2.47% and paid interest in the amount of $2,025.
8. DISTRIBUTIONS TO SHAREHOLDERS
The tax character of distributions paid was $4,630,057 and $3,900,828 of ordinary income for the years ended March 31, 2018 and March 31, 2017, respectively.
As of March 31, 2018, the components of distributable earnings on a tax basis were as follows:
| | |
Unrealized gains | | Capital loss carryforward |
| $57,880,872 | | $(176,191,857) |
| | | | | | |
| Notes to consolidated financial statements | | Wells Fargo Precious Metals Fund | | | 25 | |
9. CONCENTRATION RISK
The Fund invests a substantial portion of its assets in precious metals companies and, therefore, may be more affected by changes in the precious metals sector than a fund whose investments are not heavily weighted in any sector.
10. INDEMNIFICATION
Under the Trust’s organizational documents, the officers and Trustees have been granted certain indemnification rights against certain liabilities that may arise out of performance of their duties to the Trust. Additionally, in the normal course of business, the Trust may enter into contracts with service providers that contain a variety of indemnification clauses. The Trust’s maximum exposure under these arrangements is dependent on future claims that may be made against the Fund and, therefore, cannot be estimated.
| | | | |
| 26 | | Wells Fargo Precious Metals Fund | | Report of independent registered public accounting firm |
BOARD OF TRUSTEES AND SHAREHOLDERS OF WELLS FARGO FUNDS TRUST:
Opinion on the Financial Statements
We have audited the accompanying consolidated statement of assets and liabilities of the Wells Fargo Precious Metals Fund (the “Fund”), one of the funds constituting the Wells Fargo Funds Trust, including the consolidated portfolio of investments, as of March 31, 2018, the related consolidated statement of operations for the year then ended, the consolidated statements of changes in net assets for each of the years in the two-year period then ended, and the related consolidated notes (collectively, the “consolidated financial statements”) and the consolidated financial highlights for each of the years in the five-year period then ended. In our opinion, the consolidated financial statements and consolidated financial highlights present fairly, in all material respects, the consolidated financial position of the Fund as of March 31, 2018, the results of its operations for the year then ended, the changes in its net assets for each of the years in the two-year period then ended, and the financial highlights for each of the years in the five-year period then ended, in conformity with U.S. generally accepted accounting principles.
Basis for Opinion
These consolidated financial statements and consolidated financial highlights are the responsibility of the Fund’s management. Our responsibility is to express an opinion on these consolidated financial statements and consolidated financial highlights based on our audits. We are a public accounting firm registered with the Public Company Accounting Oversight Board (United States) (“PCAOB”) and are required to be independent with respect to the Fund in accordance with the U.S. federal securities laws and the applicable rules and regulations of the Securities and Exchange Commission and the PCAOB.
We conducted our audits in accordance with the standards of the PCAOB. Those standards require that we plan and perform the audit to obtain reasonable assurance about whether the consolidated financial statements and consolidated financial highlights are free of material misstatement, whether due to error or fraud. Our audits included performing procedures to assess the risks of material misstatement of the consolidated financial statements and consolidated financial highlights, whether due to error or fraud, and performing procedures that respond to those risks. Such procedures included examining, on a test basis, evidence regarding the amounts and disclosures in the consolidated financial statements and consolidated financial highlights. Such procedures also included confirmation of securities owned as of March 31, 2018, by correspondence with the custodian and brokers, or by other appropriate auditing procedures. Our audits also included evaluating the accounting principles used and significant estimates made by management, as well as evaluating the overall presentation of the consolidated financial statements and consolidated financial highlights. We believe that our audits provide a reasonable basis for our opinion.

We have not been able to determine the specific year that we began serving as the auditor of one or more Wells Fargo Funds investment companies, however we are aware that we have served as the auditor of one or more Wells Fargo Funds investment companies since at least 1955.
Boston, Massachusetts
May 23, 2018
| | | | | | |
| Other information (unaudited) | | Wells Fargo Precious Metals Fund | | | 27 | |
TAX INFORMATION
For corporate shareholders, pursuant to Section 854 of the Internal Revenue Code, 5.18% of ordinary income dividends qualify for the corporate dividends-received deduction for the fiscal year ended March 31, 2018.
Pursuant to Section 854 of the Internal Revenue Code, $2,556,657 of income dividends paid during the fiscal year ended March 31, 2018 has been designated as qualified dividend income (QDI).
For the fiscal year ended March 31, 2018, $24,539 has been designated as interest-related dividends for nonresident alien shareholders pursuant to Section 871 of the Internal Revenue Code.
Pursuant to Section 853 of the Internal Revenue Code, the Fund expects to designate amounts as foreign taxes paid for the fiscal year ended March 31, 2018. Additional details will be available in the semiannual report.
PROXY VOTING INFORMATION
A description of the policies and procedures that the Fund uses to determine how to vote proxies relating to portfolio securities is available, upon request, by calling 1-800-222-8222, visiting our website at wellsfargofunds.com, or visiting the SEC website at sec.gov. Information regarding how the Fund voted proxies relating to portfolio securities during the most recent 12-month period ended June 30 is available on the Fund’s website at wellsfargofunds.com or by visiting the SEC website at sec.gov.
PORTFOLIO HOLDINGS INFORMATION
The complete portfolio holdings for the Fund are publicly available monthly on the Fund’s website (wellsfargofunds.com), on a one-month delayed basis. In addition, top ten holdings information (excluding derivative positions) for the Fund is publicly available on the Fund’s website on a monthly, seven-day or more delayed basis. The Fund files its complete schedule of portfolio holdings with the SEC for the first and third quarters of each fiscal year on Form N-Q, which is available by visiting the SEC website at sec.gov. In addition, the Fund’s Form N-Q may be reviewed and copied at the SEC’s Public Reference Room in Washington, DC, and at regional offices in New York City, at 233 Broadway, and in Chicago, at 175 West Jackson Boulevard, Suite 900. Information about the Public Reference Room may be obtained by calling 1-800-SEC-0330.
| | | | |
| 28 | | Wells Fargo Precious Metals Fund | | Other information (unaudited) |
BOARD OF TRUSTEES AND OFFICERS
Each of the Trustees and Officers1 listed in the table below acts in identical capacities for each fund in the Wells Fargo family of funds, which consists of 153 mutual funds comprising the Wells Fargo Funds Trust, Wells Fargo Variable Trust, Wells Fargo Master Trust and four closed-end funds (collectively the “Fund Complex”). This table should be read in conjunction with the Prospectus and the Statement of Additional Information2. The mailing address of each Trustee and Officer is 525 Market Street, 12th Floor, San Francisco, CA 94105. Each Trustee and Officer serves an indefinite term, however, each Trustee serves such term until reaching the mandatory retirement age established by the Trustees.
Independent Trustees
| | | | | | |
Name and year of birth | | Position held and
length of service* | | Principal occupations during past five years or longer | | Current other
public company or
investment company
directorships |
William R. Ebsworth (Born 1957) | | Trustee, since 2015 | | Retired. From 1984 to 2013, equities analyst, portfolio manager, research director and chief investment officer at Fidelity Management and Research Company in Boston, Tokyo, and Hong Kong, and retired in 2013 as Chief Investment Officer of Fidelity Strategic Advisers, Inc. where he led a team of investment professionals managing client assets. Prior thereto, Board member of Hong Kong Securities Clearing Co., Hong Kong Options Clearing Corp., the Thailand International Fund, Ltd., Fidelity Investments Life Insurance Company, and Empire Fidelity Investments Life Insurance Company. Board member of the Forté Foundation (non-profit organization) and the Vincent Memorial Hospital Endowment (non-profit organization), where he serves on the Investment Committee and as a Chair of the Audit Committee. Mr. Ebsworth is a CFA® charterholder. | | Asset Allocation Trust |
Jane A. Freeman** (Born 1953) | | Trustee, since 2015; Chair Liaison, since 2018 | | Retired. From 2012 to 2014 and 1999 to 2008, Chief Financial Officer of Scientific Learning Corporation. From 2008 to 2012, Ms. Freeman provided consulting services related to strategic business projects. Prior to 1999, Portfolio Manager at Rockefeller & Co. and Scudder, Stevens & Clark. Board member of the Harding Loevner Funds from 1996 to 2014, serving as both Lead Independent Director and chair of the Audit Committee. Board member of the Russell Exchange Traded Funds Trust from 2011 to 2012 and the chair of the Audit Committee. Ms. Freeman is a Board Member of Ruth Bancroft Garden (non-profit organization) and the Glimmerglass Festival. She is also an inactive Chartered Financial Analyst. | | Asset Allocation Trust |
Isaiah Harris, Jr. (Born 1952) | | Trustee, since 2009 | | Retired. Chairman of the Board of CIGNA Corporation since 2009, and Director since 2005. From 2003 to 2011, Director of Deluxe Corporation. Prior thereto, President and CEO of BellSouth Advertising and Publishing Corp. from 2005 to 2007, President and CEO of BellSouth Enterprises from 2004 to 2005 and President of BellSouth Consumer Services from 2000 to 2003. Emeritus member of the Iowa State University Foundation Board of Governors. Emeritus Member of the Advisory Board of Iowa State University School of Business. Advisory Board Member, Palm Harbor Academy (charter school). Advisory Board Member, Child Evangelism Fellowship (non-profit). Mr. Harris is a certified public accountant (inactive status). | | CIGNA Corporation; Asset Allocation Trust |
Judith M. Johnson (Born 1949) | | Trustee, since 2008; Audit Committee Chairman, since 2008 | | Retired. Prior thereto, Chief Executive Officer and Chief Investment Officer of Minneapolis Employees Retirement Fund from 1996 to 2008. Ms. Johnson is an attorney, certified public accountant and a certified managerial accountant. | | Asset Allocation Trust |
David F. Larcker (Born 1950) | | Trustee, since 2009 | | James Irvin Miller Professor of Accounting at the Graduate School of Business, Stanford University, Director of the Corporate Governance Research Initiative and Senior Faculty of The Rock Center for Corporate Governance since 2006. From 2005 to 2008, Professor of Accounting at the Graduate School of Business, Stanford University. Prior thereto, Ernst & Young Professor of Accounting at The Wharton School, University of Pennsylvania from 1985 to 2005. | | Asset Allocation Trust |
| | | | | | |
| Other information (unaudited) | | Wells Fargo Precious Metals Fund | | | 29 | |
| | | | | | |
Name and year of birth | | Position held and
length of service* | | Principal occupations during past five years or longer | | Current other
public company or
investment company
directorships |
Olivia S. Mitchell*** (Born 1953) | | Trustee, since 2006; Governance Committee Chairman, since 2018 | | International Foundation of Employee Benefit Plans Professor, Wharton School of the University of Pennsylvania since 1993. Director of Wharton’s Pension Research Council and Boettner Center on Pensions & Retirement Research, and Research Associate at the National Bureau of Economic Research. Previously, Cornell University Professor from 1978 to 1993. | | Asset Allocation Trust |
Timothy J. Penny**** (Born 1951) | | Trustee, since 1996; Chairman, since 2018; Vice Chairman, from 2017 to 2018 | | President and Chief Executive Officer of Southern Minnesota Initiative Foundation, a non-profit organization, since 2007. Member of the Board of Trustees of NorthStar Education Finance, Inc., a non-profit organization, since 2007. | | Asset Allocation Trust |
James G. Polisson***** (Born 1959) | | Trustee, since 2018; Advisory Board Member, from 2017 to 2018 | | Retired. Chief Marketing Officer, Source (ETF) UK Services, Ltd, from 2015 to 2017. From 2012 to 2015, Principal of The Polisson Group, LLC, a management consulting, corporate advisory and principal investing company. Chief Executive Officer and Managing Director at Russell Investments, Global Exchange Traded Funds from 2010 to 2012. Managing Director of Barclays Global Investors from 1998 to 2010 and Global Chief Marketing Officer for iShares and Barclays Global Investors from 2000 to 2010. Trustee of the San Francisco Mechanics’ Institute, a non-profit organization, from 2013 to 2015. Board member of the Russell Exchange Traded Fund Trust from 2011 to 2012. Director of Barclays Global Investors Holdings Deutschland GmbH from 2006 to 2009. Mr. Polisson is an attorney and has a retired status with the Massachusetts and District of Columbia Bar Associations. | | Asset Allocation Trust |
Michael S. Scofield (Born 1943) | | Trustee, since 2010 | | Served on the Investment Company Institute’s Board of Governors and Executive Committee from 2008-2011 as well the Governing Council of the Independent Directors Council from 2006-2011 and the Independent Directors Council Executive Committee from 2008-2011. Trustee of the Evergreen Fund complex (and its predecessors) from 1984 to 2010. Chairman of the Evergreen Funds from 2000-2010. Former Trustee of the Mentor Funds. Retired Attorney, Law Offices of Michael S. Scofield. | | Asset Allocation Trust |
Pamela Wheelock***** (Born 1959) | | Trustee, since 2018; Advisory Board Member, from 2017 to 2018 | | Chief Operating Officer, Twin Cities Habitat for Humanity, since January, 2017. Vice President of University Services, University of Minnesota from 2012 to 2017. Prior thereto, Interim President and Chief Executive Officer of Blue Cross Blue Shield of Minnesota from 2010 to 2011, Chairman of the Board from 2009 to 2011 and Board Director from 2003 to 2015. Vice President, Leadership and Community Engagement, Bush Foundation, Saint Paul, Minnesota (a private foundation) from 2009 to 2011. Executive Vice President and Chief Financial Officer, Minnesota Sports and Entertainment from 2004 to 2009 and Senior Vice President from 2002 to 2004. Commissioner of Finance, State of Minnesota, from 1999 to 2002. Currently on the Board of Directors, Governance Committee and Finance Committee, for the Minnesota Philanthropy Partners (Saint Paul Foundation) since 2012 and Board Chair of the Minnesota Wild Foundation since 2010. | | Asset Allocation Trust |
| * | Length of service dates reflect the Trustee’s commencement of service with the Trust’s predecessor entities, where applicable. |
| ** | Jane Freeman became Chair Liaison effective January 1, 2018. |
| *** | Olivia Mitchell became Chairman of the Governance Committee effective January 1, 2018. |
| **** | Timothy Penny became Chairman effective January 1, 2018. |
| ***** | James Polisson and Pamela Wheelock each became a Trustee effective January 1, 2018. |
| | | | |
| 30 | | Wells Fargo Precious Metals Fund | | Other information (unaudited) |
Officers
| | | | | | |
Name and year of birth | | Position held and
length of service | | Principal occupations during past five years or longer | | |
Andrew Owen (Born 1960) | | President, since 2017 | | Executive Vice President of Wells Fargo & Company and Head of Affiliated Managers, Wells Fargo Asset Management, since 2014. In addition, Mr. Owen is currently President, Chief Executive Officer and Director of Wells Fargo Funds Management, LLC since 2017. Prior thereto, Executive Vice President responsible for marketing, investments and product development for Wells Fargo Funds Management, LLC, from 2009 to 2014. | | |
Nancy Wiser1 (Born 1967) | | Treasurer, since 2012 | | Executive Vice President of Wells Fargo Funds Management, LLC since 2011. Chief Operating Officer and Chief Compliance Officer at LightBox Capital Management LLC, from 2008 to 2011. | | |
Alexander Kymn* (Born 1973) | | Secretary, since 2018; Chief Legal Officer, since 2018 | | Senior Company Counsel of Wells Fargo Bank, N.A. since 2018 (previously Senior Counsel from 2007 to 2018). Vice President of Wells Fargo Funds Management, LLC from 2008 to 2014. | | |
C. David Messman** (Born 1960) | | Secretary, since 2000; Chief Legal Officer, since 2003 | | Senior Vice President and Secretary of Wells Fargo Funds Management, LLC since 2001. Assistant General Counsel of Wells Fargo Bank, N.A. since 2013 and Vice President and Managing Counsel of Wells Fargo Bank, N.A. from 1996 to 2013. | | |
Michael H. Whitaker (Born 1967) | | Chief Compliance Officer, since 2016 | | Senior Vice President and Chief Compliance Officer since 2016. Senior Vice President and Chief Compliance Officer for Fidelity Investments from 2007 to 2016. | | |
David Berardi (Born 1975) | | Assistant Treasurer, since 2009 | | Vice President of Wells Fargo Funds Management, LLC since 2009. Vice President of Evergreen Investment Management Company, LLC from 2008 to 2010. Manager of Fund Reporting and Control for Evergreen Investment Management Company, LLC from 2004 to 2010. | | |
Jeremy DePalma1 (Born 1974) | | Assistant Treasurer, since 2009 | | Senior Vice President of Wells Fargo Funds Management, LLC since 2009. Senior Vice President of Evergreen Investment Management Company, LLC from 2008 to 2010 and head of the Fund Reporting and Control Team within Fund Administration from 2005 to 2010. | | |
| 1 | Nancy Wiser acts as Treasurer of 77 funds in the Fund Complex. Jeremy DePalma acts as Treasurer of 76 funds and Assistant Treasurer of 77 funds in the Fund Complex. |
| 2 | The Statement of Additional Information includes additional information about the Trustees and is available, without charge, upon request, by calling 1-800-222-8222 or by visiting the website at wellsfargofunds.com. |
| * | Alexander Kymn became the Secretary and Chief Legal Officer effective April 17, 2018. |
| ** | David Messman was the Secretary and Chief Legal Officer until April 16, 2018. |
| | | | | | |
| List of abbreviations | | Wells Fargo Precious Metals Fund | | | 31 | |
The following is a list of common abbreviations for terms and entities that may have appeared in this report.
| ACA | — ACA Financial Guaranty Corporation |
| ADR | — American depositary receipt |
| ADS | — American depositary shares |
| AGC | — Assured Guaranty Corporation |
| AGM | — Assured Guaranty Municipal |
| Ambac | — Ambac Financial Group Incorporated |
| AMT | — Alternative minimum tax |
| BAN | — Bond anticipation notes |
| BHAC | — Berkshire Hathaway Assurance Corporation |
| CAB | — Capital appreciation bond |
| CCAB | — Convertible capital appreciation bond |
| CDA | — Community Development Authority |
| CDO | — Collateralized debt obligation |
| CLO | — Collateralized loan obligation |
| DRIVER | — Derivative inverse tax-exempt receipts |
| DW&P | — Department of Water & Power |
| DWR | — Department of Water Resources |
| ECFA | — Educational & Cultural Facilities Authority |
| EDA | — Economic Development Authority |
| EDFA | — Economic Development Finance Authority |
| ETF | — Exchange-traded fund |
| FDIC | — Federal Deposit Insurance Corporation |
| FFCB | — Federal Farm Credit Banks |
| FGIC | — Financial Guaranty Insurance Corporation |
| FHA | — Federal Housing Administration |
| FHLB | — Federal Home Loan Bank |
| FHLMC | — Federal Home Loan Mortgage Corporation |
| FICO | — The Financing Corporation |
| FNMA | — Federal National Mortgage Association |
| GDR | — Global depositary receipt |
| GNMA | — Government National Mortgage Association |
| HCFR | — Healthcare facilities revenue |
| HEFA | — Health & Educational Facilities Authority |
| HEFAR | — Higher education facilities authority revenue |
| HFA | — Housing Finance Authority |
| HFFA | — Health Facilities Financing Authority |
| HUD | — Department of Housing and Urban Development |
| IDA | — Industrial Development Authority |
| IDAG | — Industrial Development Agency |
| KRW | — Republic of Korea won |
| LIBOR | — London Interbank Offered Rate |
| LIFER | — Long Inverse Floating Exempt Receipts |
| LLC | — Limited liability company |
| LLLP | — Limited liability limited partnership |
| LLP | — Limited liability partnership |
| MBIA | — Municipal Bond Insurance Association |
| MFHR | — Multifamily housing revenue |
| MSTR | — Municipal securities trust receipts |
| MUD | — Municipal Utility District |
| National | — National Public Finance Guarantee Corporation |
| PCFA | — Pollution Control Financing Authority |
| PCL | — Public Company Limited |
| PCR | — Pollution control revenue |
| PFA | — Public Finance Authority |
| PFFA | — Public Facilities Financing Authority |
| PFOTER | — Puttable floating option tax-exempt receipts |
| PJSC | — Public Joint Stock Company |
| plc | — Public limited company |
| PUTTER | — Puttable tax-exempt receipts |
| R&D | — Research & development |
| Radian | — Radian Asset Assurance |
| RAN | — Revenue anticipation notes |
| RDA | — Redevelopment Agency |
| RDFA | — Redevelopment Finance Authority |
| REIT | — Real estate investment trust |
| ROC | — Reset option certificates |
| SAVRS | — Select auction variable rate securities |
| SBA | — Small Business Authority |
| SDR | — Swedish depositary receipt |
| SFHR | — Single-family housing revenue |
| SFMR | — Single-family mortgage revenue |
| SIFMA | — Securities Industry and Financial Markets Association |
| SPA | — Standby purchase agreement |
| SPDR | — Standard & Poor’s Depositary Receipts |
| SPEAR | — Short Puttable Exempt Adjustable Receipts |
| STRIPS | — Separate trading of registered interest and |
| TAN | — Tax anticipation notes |
| TIPS | — Treasury inflation-protected securities |
| TRAN | — Tax revenue anticipation notes |
| TTFA | — Transportation Trust Fund Authority |
| TVA | — Tennessee Valley Authority |
This page is intentionally left blank.

For more information
More information about Wells Fargo Funds is available free upon request. To obtain literature, please write, email, visit the Fund’s website, or call:
Wells Fargo Funds
P.O. Box 8266
Boston, MA 02266-8266
Email: fundservice@wellsfargo.com
Website: wellsfargofunds.com
Individual investors: 1-800-222-8222
Retail investment professionals: 1-888-877-9275
Institutional investment professionals: 1-866-765-0778
This report and the financial statements contained herein are submitted for the general information of the shareholders of the Fund. If this report is used for promotional purposes, distribution of the report must be accompanied or preceded by a current prospectus. Before investing, please consider the investment objectives, risks, charges, and expenses of the investment. For a current prospectus and, if available, a summary prospectus, containing this information, call 1-800-222-8222 or visit the Fund’s website at wellsfargofunds.com. Read the prospectus carefully before you invest or send money.
Wells Fargo Asset Management (WFAM) is a trade name used by the asset management businesses of Wells Fargo & Company. Wells Fargo Funds Management, LLC, a wholly owned subsidiary of Wells Fargo & Company, provides investment advisory and administrative services for Wells Fargo Funds. Other affiliates of Wells Fargo & Company provide subadvisory and other services for the funds. The funds are distributed by Wells Fargo Funds Distributor, LLC, Member FINRA, an affiliate of Wells Fargo & Company. Neither Wells Fargo Funds Distributor nor Wells Fargo Funds Management holds fund shareholder accounts or assets. This material is for general informational and educational purposes only and is NOT intended to provide investment advice or a recommendation of any kind—including a recommendation for any specific investment, strategy, or plan.
NOT FDIC INSURED ◾ NO BANK GUARANTEE ◾ MAY LOSE VALUE
© 2018 Wells Fargo Funds Management, LLC. All rights reserved.
| | |
 | | 309987 05-18 A316/AR316 03-18 |
Annual Report
March 31, 2018

Wells Fargo Specialized Technology Fund


Reduce clutter. Save trees.
Sign up for electronic delivery of prospectuses and shareholder reports at wellsfargo.com/advantagedelivery
Contents
The views expressed and any forward-looking statements are as of March 31, 2018, unless otherwise noted, and are those of the Fund managers and/or Wells Fargo Funds Management, LLC. Discussions of individual securities, or the markets generally, or any Wells Fargo Fund are not intended as individual recommendations. Future events or results may vary significantly from those expressed in any forward-looking statements. The views expressed are subject to change at any time in response to changing circumstances in the market. Wells Fargo Funds Management, LLC and the Fund disclaim any obligation to publicly update or revise any views expressed or forward-looking statements.
NOT FDIC INSURED ◾ NO BANK GUARANTEE ◾ MAY LOSE VALUE
| | | | |
| 2 | | Wells Fargo Specialized Technology Fund | | Letter to shareholders (unaudited) |

Andrew Owen
President
Wells Fargo Funds
Dear Shareholder:
We are pleased to offer you this annual report for the Wells Fargo Specialized Technology Fund for the 12-month period that ended March 31, 2018. During the last three quarters of 2017, investors enjoyed consistently rising equity values globally. Short-term interest rates tended to increase, while long-term rates remained flat to lower. During the final two months of the first quarter of 2018, equity market volatility returned, stocks reversed year-to-date gains, and bond yields rose while prices fell.
For the period, U.S. stocks, as measured by the S&P 500 Index,1 gained 13.99% and international stocks, as measured by the MSCI ACWI ex USA Index (Net),2 added 16.53%. Emerging market stocks, as measured by the MSCI EM Index (Net),3 added 24.93%. In bond markets, the Bloomberg Barclays U.S. Aggregate Bond Index4 added 1.20% and the Bloomberg Barclays Municipal Bond Index5 added 2.66% while fixed-income investments outside the U.S. gained 11.75%, according to the Bloomberg Barclays Global Aggregate ex-USD Index.6 The ICE BofAML U.S. High Yield Index7 earned 3.69%.
Through the last nine months of 2017, stocks advanced on synchronized global growth, which led to higher investor and consumer confidence. The first quarter of 2018 began with strong stock market gains in January. A strong January 2018 U.S. employment report and inflation concerns prompted equity volatility in February. Investor optimism for growth was supplanted with concerns over trade tensions, increased interest rates, and the prospect of new data privacy regulations.
Reactions to U.S. interest rate increases were uneven across the yield curve and globally.
The U.S. Federal Reserve (Fed) increased the federal funds rate three times during the 12-month period for a combined 75 basis points (bps; 100 bps equals 1.00%). Following an increase in March 2017, short-term bond yields in the U.S. rose while longer-term Treasury yields were little changed. Municipal bond returns were positive, helped by strong demand and constrained new-issue supply. The Fed raised the target interest rate once again in June 2017 to a range of 1.00% to 1.25%. Ten-year U.S. Treasury yields declined, the yield curve flattened, and long-term bond prices benefited.
| 1 | The S&P 500 Index consists of 500 stocks chosen for market size, liquidity, and industry group representation. It is a market-value-weighted index with each stock’s weight in the index proportionate to its market value. You cannot invest directly in an index. |
| 2 | The Morgan Stanley Capital International (MSCI) All Country World Index (ACWI) ex USA Index (Net) is a free-float-adjusted market-capitalization-weighted index that is designed to measure the equity market performance of developed markets, excluding the United States and Canada. Source: MSCI. MSCI makes no express or implied warranties or representations and shall have no liability whatsoever with respect to any MSCI data contained herein. The MSCI data may not be further redistributed or used as a basis for other indices or any securities or financial products. This report is not approved, reviewed, or produced by MSCI. You cannot invest directly in an index. |
| 3 | The MSCI Emerging Markets (EM) Index (Net) is a free-float-adjusted market-capitalization-weighted index that is designed to measure large- and mid-cap equity market performance of emerging markets. The MSCI EM Index (Net) consists of the following 24 emerging market country indices: Brazil, Chile, China, Colombia, Czech Republic, Egypt, Greece, Hungary, India, Indonesia, Korea, Malaysia, Mexico, Pakistan, Peru, the Philippines, Poland, Qatar, Russia, South Africa, Taiwan, Thailand, Turkey, and the United Arab Emirates. You cannot invest directly in an index. |
| 4 | The Bloomberg Barclays U.S. Aggregate Bond Index is a broad-based benchmark that measures the investment-grade, U.S. dollar-denominated, fixed-rate taxable bond market, including Treasuries, government-related and corporate securities, mortgage-backed securities (agency fixed-rate and hybrid adjustable-rate mortgage pass-throughs), asset-backed securities, and commercial mortgage-backed securities. You cannot invest directly in an index. |
| 5 | The Bloomberg Barclays Municipal Bond Index is an unmanaged index composed of long-term tax-exempt bonds with a minimum credit rating of Baa. You cannot invest directly in an index. |
| 6 | The Bloomberg Barclays Global Aggregate ex-USD Index is an unmanaged index that provides a broad-based measure of the global investment-grade fixed-income markets excluding the U.S. dollar-denominated debt market. You cannot invest directly in an index. |
| 7 | The ICE BofAML U.S. High Yield Index is a market-capitalization-weighted index of domestic and Yankee high-yield bonds. The index tracks the performance of high-yield securities traded in the U.S. bond market. You cannot invest directly in an index. Copyright 2018. ICE Data Indices, LLC. All rights reserved. |
| | | | | | |
| Letter to shareholders (unaudited) | | Wells Fargo Specialized Technology Fund | | | 3 | |
Internationally, central banks maintained low interest rates and accommodative monetary policies that supported business activity and stock values in foreign markets. A weaker U.S. dollar was generally supportive of business activity in regions around the globe. The Bank of Japan continued its accommodative monetary policies, and industrial production, retail sales, and fixed asset investment increased in China.
Growth continued through the summer of 2017.
Globally, stocks moved higher during the third quarter of 2017. Low inflation and interest rates supported accelerating global economic growth and corporate earnings. Brief episodes of geopolitical tensions, often associated with North Korea’s advancing nuclear missile program, flaring conflicts in the Middle East, and uncertainty surrounding U.S. trade policies, did not discourage investing activity.
In the U.S., economic data released during the quarter reflected a generally healthy economy. Second-quarter economic output grew at a 3.1% annual rate. Stocks in international developed and emerging markets continued to benefit from improving economic growth.
Positive economic and market news continued as 2017 closed and 2018 began.
During the fourth quarter of 2017, stock markets continued the move higher. Third-quarter economic output in the U.S. grew at a 3.2% annual rate. The unemployment rate fell to a 17-year low of 4.1%. Tax reform passed and wage growth data improved, encouraging increased business and consumer spending.
Fed officials announced in October 2017 plans to begin unwinding its $4.5 trillion portfolio of bonds and other assets accumulated during rounds of quantitative easing conducted since the 2008–2009 recession. Still, restrained inflation kept long-term bond rates steady and the flattened yield curve persisted. The Fed raised the federal funds rate target to a range of 1.25% to 1.50% in December 2017 and began selling bonds held in its portfolio.
2018 opened with continued stock advances, then volatility.
Improving business and economic data globally continued to support stocks through January 2018. Political wrangling in the U.S. over budget resolutions could not dissuade investors from buying stocks as payrolls and factory orders increased. Long-term interest rates in the U.S. trended higher as the yield curve steepened—the 10-year Treasury rate moved from 2.46% to 2.84% and the 30-year rate moved from 2.81% to 3.08% during January 2018.
Investor sentiment shifted in February as inflation concerns emerged in the U.S. when readings from the Producer Price Index in January rose 2.5% year over year. During February, the U.S. market endured a loss from January’s high of nearly 12% before recovering much of that loss. The Fed raised the federal funds rate in March 2018. Bond yields rose across the yield curve.
During January 2018, purchasing managers’ indices in China, the eurozone, India, and Japan reported data for December that indicated continued growth. Despite positive economic signals and business fundamentals, international stock values fell during February and March 2018, swept up in the selling momentum in U.S. markets.
Globally, stocks moved higher during the third quarter of 2017.
During February, the U.S. market endured a loss from January’s high of nearly 12% before recovering much of that loss.
| | | | |
| 4 | | Wells Fargo Specialized Technology Fund | | Letter to shareholders (unaudited) |
Don’t let short-term uncertainty derail long-term investment goals.
Periods of investment uncertainty can present challenges, but experience has taught us that maintaining long-term investment goals can be an effective way to plan for the future. To help you create a sound strategy based on your personal goals and risk tolerance, Wells Fargo Funds offers more than 100 mutual funds spanning a wide range of asset classes and investment styles. Although diversification cannot guarantee an investment profit or prevent losses, we believe it can be an effective way to manage investment risk and potentially smooth out overall portfolio performance. We encourage investors to know their investments and to understand that appropriate levels of risk-taking may unlock opportunities.
Thank you for choosing to invest with Wells Fargo Funds. We appreciate your confidence in us and remain committed to helping you meet your financial needs.
Sincerely,

Andrew Owen
President
Wells Fargo Funds
For further information about your Fund, contact your investment professional, visit our website at wellsfargofunds.com, or call us directly at 1-800-222-8222.
This page is intentionally left blank.
| | | | |
| 6 | | Wells Fargo Specialized Technology Fund | | Performance highlights (unaudited) |
Investment objective
The Fund seeks long-term capital appreciation.
Manager
Wells Fargo Funds Management, LLC
Subadviser
Allianz Global Investors U.S. LLC
Portfolio managers
Huachen Chen, CFA®
Walter C. Price, Jr., CFA®
Average annual total returns (%) as of March 31, 20181
| | | | | | | | | | | | | | | | | | | | | | | | | | | | | | | | | | |
| | | | | Including sales charge | | | Excluding sales charge | | | Expense ratios2 (%) | |
| | | Inception date | | 1 year | | | 5 year | | | 10 year | | | 1 year | | | 5 year | | | 10 year | | | Gross | | | Net3 | |
| Class A (WFSTX) | | 9-18-2000 | | | 30.43 | | | | 20.00 | | | | 13.59 | | | | 38.41 | | | | 21.43 | | | | 14.26 | | | | 1.42 | | | | 1.41 | |
| Class C (WFTCX) | | 9-18-2000 | | | 36.45 | | | | 20.51 | | | | 13.40 | | | | 37.45 | | | | 20.51 | | | | 13.40 | | | | 2.17 | | | | 2.16 | |
| Administrator Class (WFTDX) | | 7-30-2010 | | | – | | | | – | | | | – | | | | 38.55 | | | | 21.59 | | | | 14.40 | | | | 1.34 | | | | 1.31 | |
| Institutional Class (WFTIX) | | 10-31-2016 | | | – | | | | – | | | | – | | | | 38.91 | | | | 21.65 | | | | 14.43 | | | | 1.09 | | | | 1.06 | |
| S&P North American Technology Index4 | | – | | | – | | | | – | | | | – | | | | 31.12 | | | | 21.40 | | | | 14.81 | | | | – | | | | – | |
| S&P 500 Index5 | | – | | | – | | | | – | | | | – | | | | 13.99 | | | | 13.31 | | | | 9.49 | | | | – | | | | – | |
Figures quoted represent past performance, which is no guarantee of future results, and do not reflect taxes that a shareholder may pay on fund distributions or the redemption of fund shares. Investment return and principal value of an investment will fluctuate so that an investor’s shares, when redeemed, may be worth more or less than their original cost. Performance shown without sales charges would be lower if sales charges were reflected. Current performance may be lower or higher than the performance data quoted, which assumes the reinvestment of dividends and capital gains. Current month-end performance is available on the Fund’s website, wellsfargofunds.com.
Please keep in mind that high double-digit returns were primarily achieved during favorable market conditions. You should not expect that such favorable returns can be consistently achieved. A fund’s performance, especially for short time periods, should not be the sole factor in making your investment decision.
While the S&P 500 Index is comprised of U.S. equity securities of companies diversified across ten sectors, the Fund’s holdings are concentrated primarily in technology related stocks. Therefore, the performance of the S&P 500 Index is displayed only to show how the concentrated Fund performed compared with a diversified selection of U.S. equity securities.
Index returns do not include transaction costs associated with buying and selling securities, any mutual fund fees or expenses, or any taxes. It is not possible to invest directly in an index.
For Class A shares, the maximum front-end sales charge is 5.75%. For Class C shares, the maximum contingent deferred sales charge is 1.00%. Performance including a contingent deferred sales charge assumes the sales charge for the corresponding time period. Administrator Class and Institutional Class shares are sold without a front-end sales charge or contingent deferred sales charge.
Stock values fluctuate in response to the activities of individual companies and general market and economic conditions. Funds that concentrate their investments in limited sectors, such as information technology, are more vulnerable to adverse market, economic, regulatory, political, or other developments affecting those sectors. Certain investment strategies tend to increase the total risk of an investment (relative to the broader market). The Fund is exposed to convertible securities risk, foreign investment risk, non-diversification risk, and smaller-company securities risk. Consult the Fund’s prospectus for additional information on these and other risks.
Please see footnotes on page 7.
| | | | | | |
| Performance highlights (unaudited) | | Wells Fargo Specialized Technology Fund | | | 7 | |
|
| Growth of $10,000 investment as of March 31, 20186 |
|
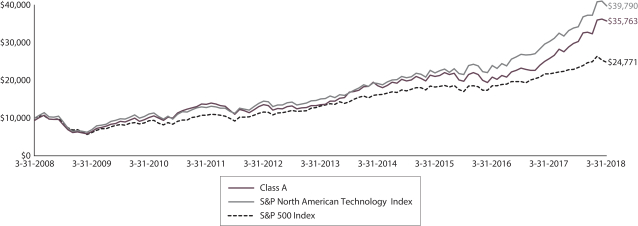 |
| 1 | Historical performance shown for Administrator Class shares prior to their inception reflects the performance of Class A shares, and includes the higher expenses applicable to Class A shares. If these expenses had not been included, returns for Administrator Class shares would be higher. Historical performance shown for the Institutional Class shares prior to their inception reflects the performance of the Administrator Class shares, and is not adjusted to reflect Institutional Class expenses. If these expenses had been included, returns for Institutional Class shares would be higher. |
| 2 | Reflects the expense ratios as stated in the most recent prospectuses. The expense ratios shown are subject to change and may differ from the annualized expense ratios shown in the financial highlights of this report. |
| 3 | The manager has contractually committed through August 1, 2019, to waive fees and/or reimburse expenses to the extent necessary to cap the Fund’s Total Annual Fund Operating Expenses After Fee Waivers at the amounts shown. After this time, the cap may be increased or the commitment to maintain the cap may be terminated only with the approval of the Board of Trustees. Brokerage commissions, stamp duty fees, interest, taxes, acquired fund fees and expenses (if any), and extraordinary expenses are excluded from the expense cap. Without this cap, the Fund’s returns would have been lower. The expense ratio paid by an investor is the net expense ratio (the total annual fund operating expenses after fee waivers) as stated in the prospectuses. |
| 4 | The S&P North American Technology Index is a modified market-capitalization-weighted index of select technology stocks. You cannot invest directly in an index. |
| 5 | The S&P 500 Index consists of 500 stocks chosen for market size, liquidity, and industry group representation. It is a market-value weighted index with each stock’s weight in the index proportionate to its market value. You cannot invest directly in an index. |
| 6 | The chart compares the performance of Class A shares for the most recent ten years with the S&P North American Technology Index and the S&P 500 Index. The chart assumes a hypothetical investment of $10,000 in Class A shares and reflects all operating expenses and assumes the maximum initial sales charge of 5.75%. |
| 7 | The ten largest holdings, excluding cash and cash equivalents, are calculated based on the value of the investments divided by total net assets of the Fund. Holdings are subject to change and may have changed since the date specified. |
| 8 | Amounts are calculated based on the total long-term investments of the Fund. These amounts are subject to change and may have changed since the date specified. |
| * | This security was not held in the Fund at the end of the reporting period. |
| | | | |
| 8 | | Wells Fargo Specialized Technology Fund | | Performance highlights (unaudited) |
MANAGER’S DISCUSSION
Fund highlights
| ∎ | | The Fund outperformed the S&P North American Technology Index for the 12-month period that ended March 31, 2018. |
| ∎ | | The primary drivers for the Fund’s absolute and relative performance include our overweights to some high-growth software companies as well as strong stock selection within the semiconductor industry. |
| ∎ | | The Fund’s underweight to some mega-cap information technology (IT) companies, such as Amazon.com, Incorporated, and Microsoft Corporation, detracted from relative performance. While the underweight positions hurt relative performance, these stocks remain key holdings in the Fund and our positions helped absolute returns. |
The concerns over the health of the global economy that weighed on investor sentiment for much of 2016 dissipated in 2017. Over the past 12 months, the global economy experienced a synchronized economic upturn, led by the U.S. This was supportive for corporate earnings, which in many cases remained robust.
The IT sector’s performance was particularly strong, fueled by multiple factors, including robust earnings growth.
We believe one of the most attractive qualities of the IT sector is the regular emergence of new and disruptive trends. Many of these new technologies potentially could expand the influence of technology into other areas of the economy as well as draw value from predecessor technologies within the sector. Our primary goal continues to be to identify these major trends ahead of the crowd and invest in the emerging leaders.
Over the 12-month period, we increased our exposure to selected software and storage and equipment companies benefiting from the accelerating adoption of cloud computing and software-as-a-service solutions. Many of these stocks performed well due to higher demand for their innovative product offerings, which led to consistently strong earnings growth. Conversely, after very strong performance from the semiconductor stocks in the Fund, the team reduced exposure to the industry. We believe the semiconductor industry should continue to benefit from higher demand and tighter supply in the near term, but the risk/reward profile is not as compelling as it was a year ago.
Overweights to Square and ServiceNow were the primary contributors to the Fund’s performance.
The Fund’s overweight to Square, Incorporated, was the top contributor during the period. The company develops business management software for small and medium-size businesses and monetizes many of these products through transaction processing. The company continues to execute well against its long-term goals. We believe Square is unique in the payments-processing space due to its ability to expand payments processing and software solutions to previously untapped markets.
The Fund’s overweight to ServiceNow, Incorporated, was also among the top contributors during the period. The company has expanded its product offerings and created a platform that can automate workflow processes across multiple departments of an enterprise. As the company closes a greater number of larger-size deals, many of which are subscription-based, we expect to see earnings growth over time.
Other top contributors to relative returns included an overweight to Paycom Software, Incorporated; an underweight to Oracle Corporation;* and not owning IBM Corporation.
The portfolio’s underweight to some mega-cap IT companies such as Amazon and Microsoft detracted from relative performance. We maintain a positive long-term view of these companies; however, the benchmark is heavily concentrated in the largest IT companies. The combined weight of the benchmark’s top five holdings is over 39%. The team prefers to spread the Fund’s risks and theme exposures across a larger variety of stocks, as we believe this approach offers a more attractive risk/reward profile.
The Fund’s underweight to Amazon was the top detractor from relative returns. The company has demonstrated robust top-line growth as well as significant operational efficiency. Amazon remains the clear leader in the e-commerce and cloud infrastructure markets as it continues to develop new products and services that enhance customer loyalty.
Please see footnotes on page 7.
| | | | | | |
| Performance highlights (unaudited) | | Wells Fargo Specialized Technology Fund | | | 9 | |
The Fund’s underweight to Microsoft was also among the top detractors from relative performance. Microsoft has been investing in data centers and developing partnerships to boost sales of its main cloud products, which appear to be paying off for the company. We believe Microsoft’s push toward more innovative products and services should drive strong long-term sales and profit growth. Other top detractors from relative returns included an overweight to Tesla Motors, Incorporated; an underweight to PayPal Holdings, Incorporated; and not owning Intel Corporation.
We retain an optimistic outlook for the IT sector and for the Fund.
Looking forward, we continue to believe the IT sector may provide some of the stock markets’ best absolute- and relative-return opportunities, especially for bottom-up stock pickers like us. We have observed a wave of innovation within the sector that we believe could produce attractive returns for companies offering best-in-class solutions. We also see a number of companies with present valuations that, in our view, do not fully reflect positive company-specific and/or industry-specific tailwinds. We believe some of the attractive growth themes include cloud computing, auto technology, artificial intelligence, and robotics.
| | | | |
| Ten largest holdings (%) as of March 31, 20187 | |
Amazon.com Incorporated | | | 6.39 | |
Microsoft Corporation | | | 5.65 | |
Micron Technology Incorporated | | | 4.21 | |
ServiceNow Incorporated | | | 4.00 | |
NetApp Incorporated | | | 3.71 | |
Square Incorporated Class A | | | 3.62 | |
Netflix Incorporated | | | 3.28 | |
Arista Networks Incorporated | | | 3.11 | |
Apple Incorporated | | | 3.05 | |
DXC Technology Company | | | 3.05 | |
|
| Industry distribution as of March 31, 20188 |
|
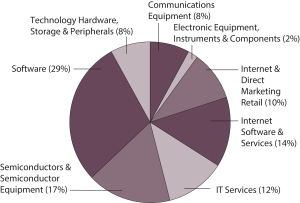 |
Please see footnotes on page 7.
| | | | |
| 10 | | Wells Fargo Specialized Technology Fund | | Fund expenses (unaudited) |
As a shareholder of the Fund, you incur two types of costs: (1) transaction costs, including sales charges (loads) on purchase payments and contingent deferred sales charges (if any) on redemptions and (2) ongoing costs, including management fees, distribution (12b-1) and/or shareholder servicing fees, and other Fund expenses. This example is intended to help you understand your ongoing costs (in dollars) of investing in the Fund and to compare these costs with the ongoing costs of investing in other mutual funds.
The example is based on an investment of $1,000 invested at the beginning of the six-month period and held for the entire period from October 1, 2017 to March 31, 2018.
Actual expenses
The “Actual” line of the table below provides information about actual account values and actual expenses. You may use the information in this line, together with the amount you invested, to estimate the expenses that you paid over the period. Simply divide your account value by $1,000 (for example, an $8,600 account value divided by $1,000 = 8.6), then multiply the result by the number in the “Actual” line under the heading entitled “Expenses paid during period” for your applicable class of shares to estimate the expenses you paid on your account during this period.
Hypothetical example for comparison purposes
The “Hypothetical” line of the table below provides information about hypothetical account values and hypothetical expenses based on the Fund’s actual expense ratio and an assumed rate of return of 5% per year before expenses, which is not the Fund’s actual return. The hypothetical account values and expenses may not be used to estimate the actual ending account balance or expenses you paid for the period. You may use this information to compare the ongoing costs of investing in the Fund and other funds. To do so, compare this 5% hypothetical example with the 5% hypothetical examples that appear in the shareholder reports of the other funds.
Please note that the expenses shown in the table are meant to highlight your ongoing costs only and do not reflect any transactional costs, such as sales charges (loads) and contingent deferred sales charges. Therefore, the “Hypothetical” line of the table is useful in comparing ongoing costs only and will not help you determine the relative total costs of owning different funds. In addition, if these transactional costs were included, your costs would have been higher.
| | | | | | | | | | | | | | | | |
| | | Beginning
account value
10-1-2017 | | | Ending
account value
3-31-2018 | | | Expenses
paid during
the period¹ | | | Annualized net
expense ratio | |
Class A | | | | | | | | | | | | | | | | |
Actual | | $ | 1,000.00 | | | $ | 1,180.37 | | | $ | 7.61 | | | | 1.40 | % |
Hypothetical (5% return before expenses) | | $ | 1,000.00 | | | $ | 1,017.95 | | | $ | 7.05 | | | | 1.40 | % |
Class C | | | | | | | | | | | | | | | | |
Actual | | $ | 1,000.00 | | | $ | 1,175.96 | | | $ | 11.66 | | | | 2.15 | % |
Hypothetical (5% return before expenses) | | $ | 1,000.00 | | | $ | 1,014.21 | | | $ | 10.80 | | | | 2.15 | % |
Administrator Class | | | | | | | | | | | | | | | | |
Actual | | $ | 1,000.00 | | | $ | 1,180.58 | | | $ | 7.12 | | | | 1.31 | % |
Hypothetical (5% return before expenses) | | $ | 1,000.00 | | | $ | 1,018.40 | | | $ | 6.59 | | | | 1.31 | % |
Institutional Class | | | | | | | | | | | | | | | | |
Actual | | $ | 1,000.00 | | | $ | 1,181.87 | | | $ | 5.77 | | | | 1.06 | % |
Hypothetical (5% return before expenses) | | $ | 1,000.00 | | | $ | 1,019.65 | | | $ | 5.34 | | | | 1.06 | % |
| 1 | Expenses paid is equal to the annualized net expense ratio of each class multiplied by the average account value over the period, multiplied by the number of days in the most recent fiscal half-year divided by the number of days in the fiscal year (to reflect the one-half-year period). |
| | | | | | |
| Portfolio of investments—March 31, 2018 | | Wells Fargo Specialized Technology Fund | | | 11 | |
| | | | | | | | | | | | | | | | |
| Security name | | | | | | | | Shares | | | Value | |
|
Common Stocks: 96.21% | |
|
Consumer Discretionary: 10.26% | |
|
| Automobiles: 0.46% | |
Tesla Motors Incorporated † | | | | | | | | | | | 7,185 | | | $ | 1,912,144 | |
| | | | | | | | | | | | | | | | |
|
| Internet & Direct Marketing Retail: 9.80% | |
Amazon.com Incorporated † | | | | | | | | | | | 18,360 | | | | 26,573,162 | |
Ctrip.com International Limited ADR † | | | | | | | | | | | 12,040 | | | | 564,294 | |
JD.com Incorporated ADR † | | | | | | | | | | | 595 | | | | 24,092 | |
Netflix Incorporated † | | | | | | | | | | | 46,165 | | | | 13,634,833 | |
| | | | |
| | | | | | | | | | | | | | | 40,796,381 | |
| | | | | | | | | | | | | | | | |
|
Health Care: 0.27% | |
|
| Health Care Technology: 0.27% | |
Veeva Systems Incorporated Class A † | | | | | | | | | | | 15,065 | | | | 1,100,046 | |
| | | | | | | | | | | | | | | | |
|
Industrials: 0.27% | |
|
| Professional Services: 0.27% | |
51job Incorporated ADR † | | | | | | | | | | | 13,040 | | | | 1,121,962 | |
| | | | | | | | | | | | | | | | |
|
Information Technology: 85.41% | |
|
| Communications Equipment: 7.45% | |
Arista Networks Incorporated † | | | | | | | | | | | 50,770 | | | | 12,961,581 | |
Cisco Systems Incorporated | | | | | | | | | | | 145,345 | | | | 6,233,847 | |
Palo Alto Networks Incorporated † | | | | | | | | | | | 65,010 | | | | 11,800,615 | |
| | | | |
| | | | | | | | | | | | | | | 30,996,043 | |
| | | | | | | | | | | | | | | | |
|
| Electronic Equipment, Instruments & Components: 1.73% | |
CDW Corporation of Delaware | | | | | | | | | | | 6,890 | | | | 484,436 | |
Cognex Corporation | | | | | | | | | | | 52,955 | | | | 2,753,130 | |
Dolby Laboratories Incorporated Class A | | | | | | | | | | | 8,125 | | | | 516,425 | |
Flex Limited † | | | | | | | | | | | 27,390 | | | | 447,279 | |
IPG Photonics Corporation † | | | | | | | | | | | 12,735 | | | | 2,972,094 | |
| | | | |
| | | | | | | | | | | | | | | 7,173,364 | |
| | | | | | | | | | | | | | | | |
|
| Internet Software & Services: 13.27% | |
Alibaba Group Holding Limited ADR † | | | | | | | | | | | 32,620 | | | | 5,987,075 | |
Alphabet Incorporated Class A † | | | | | | | | | | | 9,630 | | | | 9,987,658 | |
Alphabet Incorporated Class C † | | | | | | | | | | | 7,095 | | | | 7,320,550 | |
Baidu Incorporated ADR † | | | | | | | | | | | 5,020 | | | | 1,120,414 | |
Dropbox Incorporated Class A Ǡ | | | | | | | | | | | 3,935 | | | | 122,969 | |
Facebook Incorporated Class A † | | | | | | | | | | | 54,080 | | | | 8,641,443 | |
MercadoLibre Incorporated | | | | | | | | | | | 1,600 | | | | 570,224 | |
MongoDB Incorporated Ǡ | | | | | | | | | | | 40,380 | | | | 1,752,492 | |
MuleSoft Incorporated Class A † | | | | | | | | | | | 52,319 | | | | 2,300,990 | |
NetEase Incorporated ADR | | | | | | | | | | | 6,975 | | | | 1,955,720 | |
Okta Incorporated † | | | | | | | | | | | 146,085 | | | | 5,821,487 | |
Tencent Holdings Limited | | | | | | | | | | | 98,000 | | | | 5,260,595 | |
The accompanying notes are an integral part of these financial statements.
| | | | |
| 12 | | Wells Fargo Specialized Technology Fund | | Portfolio of investments—March 31, 2018 |
| | | | | | | | | | | | | | | | |
| Security name | | | | | | | | Shares | | | Value | |
|
| Internet Software & Services (continued) | |
Yandex NV Class A † | | | | | | | | | | | 97,175 | | | $ | 3,833,554 | |
Yelp Incorporated † | | | | | | | | | | | 13,370 | | | | 558,198 | |
| | | | |
| | | | | | | | | | | | | | | 55,233,369 | |
| | | | | | | | | | | | | | | | |
|
| IT Services: 11.58% | |
Amadeus IT Holding SA Class A | | | | | | | | | | | 14,685 | | | | 1,086,736 | |
Capgemini SA | | | | | | | | | | | 8,150 | | | | 1,016,911 | |
Cognizant Technology Solutions Corporation Class A | | | | | | | | | | | 46,650 | | | | 3,755,325 | |
DXC Technology Company | | | | | | | | | | | 126,140 | | | | 12,680,854 | |
Global Payments Incorporated | | | | | | | | | | | 25,625 | | | | 2,857,700 | |
MasterCard Incorporated Class A | | | | | | | | | | | 7,700 | | | | 1,348,732 | |
PayPal Holdings Incorporated † | | | | | | | | | | | 77,295 | | | | 5,864,372 | |
Square Incorporated Class A † | | | | | | | | | | | 306,310 | | | | 15,070,452 | |
Total System Services Incorporated | | | | | | | | | | | 35,840 | | | | 3,091,558 | |
Visa Incorporated Class A | | | | | | | | | | | 7,485 | | | | 895,356 | |
Worldpay Incorporated Class A † | | | | | | | | | | | 6,370 | | | | 523,869 | |
| | | | |
| | | | | | | | | | | | | | | 48,191,865 | |
| | | | | | | | | | | | | | | | |
|
| Semiconductors & Semiconductor Equipment: 15.62% | |
ams AG | | | | | | | | | | | 2,625 | | | | 275,652 | |
Applied Materials Incorporated | | | | | | | | | | | 15,610 | | | | 868,072 | |
ASML Holding NV « | | | | | | | | | | | 5,625 | | | | 1,116,900 | |
Broadcom Limited | | | | | | | | | | | 7,595 | | | | 1,789,762 | |
Cree Incorporated † | | | | | | | | | | | 115,665 | | | | 4,662,456 | |
Infineon Technologies AG | | | | | | | | | | | 168,275 | | | | 4,525,457 | |
Lam Research Corporation | | | | | | | | | | | 33,950 | | | | 6,897,282 | |
Marvell Technology Group Limited | | | | | | | | | | | 138,395 | | | | 2,906,295 | |
Microchip Technology Incorporated « | | | | | | | | | | | 103,960 | | | | 9,497,786 | |
Micron Technology Incorporated † | | | | | | | | | | | 335,955 | | | | 17,516,694 | |
NVIDIA Corporation | | | | | | | | | | | 26,900 | | | | 6,229,771 | |
ON Semiconductor Corporation † | | | | | | | | | | | 79,180 | | | | 1,936,743 | |
SK Hynix Incorporated | | | | | | | | | | | 38,270 | | | | 2,931,940 | |
Teradyne Incorporated | | | | | | | | | | | 84,320 | | | | 3,854,267 | |
| | | | |
| | | | | | | | | | | | | | | 65,009,077 | |
| | | | | | | | | | | | | | | | |
|
| Software: 28.10% | |
Adobe Systems Incorporated † | | | | | | | | | | | 3,100 | | | | 669,848 | |
Atlassian Corporation plc Class A † | | | | | | | | | | | 15,055 | | | | 811,766 | |
Autodesk Incorporated † | | | | | | | | | | | 13,235 | | | | 1,662,051 | |
FireEye Incorporated † | | | | | | | | | | | 66,810 | | | | 1,131,093 | |
Guidewire Software Incorporated † | | | | | | | | | | | 9,130 | | | | 737,978 | |
HubSpot Incorporated † | | | | | | | | | | | 13,265 | | | | 1,436,600 | |
Microsoft Corporation | | | | | | | | | | | 257,490 | | | | 23,501,112 | |
Nintendo Company Limited | | | | | | | | | | | 7,000 | | | | 3,109,912 | |
Paycom Software Incorporated Ǡ | | | | | | | | | | | 100,675 | | | | 10,811,488 | |
Proofpoint Incorporated † | | | | | | | | | | | 99,550 | | | | 11,313,858 | |
RealPage Incorporated † | | | | | | | | | | | 10,555 | | | | 543,583 | |
Red Hat Incorporated † | | | | | | | | | | | 30,235 | | | | 4,520,435 | |
RingCentral Incorporated Class A † | | | | | | | | | | | 80,820 | | | | 5,132,070 | |
The accompanying notes are an integral part of these financial statements.
| | | | | | |
| Portfolio of investments—March 31, 2018 | | Wells Fargo Specialized Technology Fund | | | 13 | |
| | | | | | | | | | | | | | | | |
| Security name | | | | | | | | Shares | | | Value | |
|
| Software (continued) | |
Salesforce.com Incorporated † | | | | | | | | | | | 90,180 | | | $ | 10,487,934 | |
ServiceNow Incorporated † | | | | | | | | | | | 100,695 | | | | 16,659,988 | |
Sophos Group plc 144A | | | | | | | | | | | 610,170 | | | | 3,716,800 | |
Splunk Incorporated † | | | | | | | | | | | 33,125 | | | | 3,259,169 | |
Tableau Software Incorporated Class A † | | | | | | | | | | | 22,585 | | | | 1,825,320 | |
Take-Two Interactive Software Incorporated † | | | | | | | | | | | 26,945 | | | | 2,634,682 | |
Temenos Group AG | | | | | | | | | | | 19,010 | | | | 2,279,475 | |
Workday Incorporated Class A † | | | | | | | | | | | 84,075 | | | | 10,686,770 | |
| | | | |
| | | | | | | | | | | | | | | 116,931,932 | |
| | | | | | | | | | | | | | | | |
|
| Technology Hardware, Storage & Peripherals: 7.66% | |
Apple Incorporated | | | | | | | | | | | 75,755 | | | | 12,710,174 | |
HP Incorporated | | | | | | | | | | | 77,620 | | | | 1,701,430 | |
NetApp Incorporated | | | | | | | | | | | 250,550 | | | | 15,456,430 | |
Pure Storage Incorporated Class A † | | | | | | | | | | | 101,095 | | | | 2,016,845 | |
| | | | |
| | | | | | | | | | | | | | | 31,884,879 | |
| | | | | | | | | | | | | | | | |
| |
Total Common Stocks (Cost $253,789,054) | | | | 400,351,062 | |
| | | | | |
| | | | |
| | | Yield | | | | | | | | | | |
| Short-Term Investments: 6.40% | | | | | | | | | | | | | |
| | | |
| Investment Companies: 6.40% | | | | | | | | | | | | | |
Securities Lending Cash Investment LLC (l)(r)(u) | | | 1.89 | % | | | | | | | 23,934,530 | | | | 23,936,923 | |
Wells Fargo Government Money Market Fund Select Class (l)(u) | | | 1.54 | | | | | | | | 2,705,051 | | | | 2,705,051 | |
| |
Total Short-Term Investments (Cost $26,641,974) | | | | 26,641,974 | |
| | | | | |
| | | | | | | | |
| Total investments in securities (Cost $280,431,028) | | | 102.61 | % | | | 426,993,036 | |
Other assets and liabilities, net | | | (2.61 | ) | | | (10,860,523 | ) |
| | | | | | | | |
| Total net assets | | | 100.00 | % | | $ | 416,132,513 | |
| | | | | | | | |
| † | Non-income-earning security |
| « | All or a portion of this security is on loan. |
| 144A | The security may be resold in transactions exempt from registration, normally to qualified institutional buyers, pursuant to Rule 144A under the Securities Act of 1933. |
| (l) | The issuer of the security is an affiliated person of the Fund as defined in the Investment Company Act of 1940. |
| (r) | The investment is a non-registered investment company purchased with cash collateral received from securities on loan. |
| (u) | The rate represents the 7-day annualized yield at period end. |
Forward Foreign Currency Contracts
| | | | | | | | | | | | | | |
Currency to be
received | | Currency to be
delivered | | Counterparty | | Settlement date | | Unrealized
gains | | | Unrealized
losses | |
| 398,807 USD | | 42,340,819 JPY | | Northern Trust Company¤¤ | | 4-4-2018 | | $ | 860 | | | $ | 0 | |
| | ¤¤ | Transactions can only be closed with the originating counterparty. |
The accompanying notes are an integral part of these financial statements.
| | | | |
| 14 | | Wells Fargo Specialized Technology Fund | | Portfolio of investments—March 31, 2018 |
Investments in Affiliates
An affiliated investment is an investment in which the Fund owns at least 5% of the outstanding voting shares of the issuer or as a result of other relationships, such as the Fund and the issuer having the same investment manager. Transactions with issuers that were either affiliated persons of the Fund at the beginning of the period or the end of the period were as follows:
| | | | | | | | | | | | | | | | | | | | | | | | | | | | | | | | | | | | |
| | | Shares,
beginning of
period | | | Shares
purchased | | | Shares
sold | | | Shares,
end of
period | | | Net
realized
gains
(losses) | | | Net
change in
unrealized
gains
(losses) | | | Income
from
affiliated
securities | | | Value,
end
of period | | | % of
net
assets | |
Short-Term Investments | | | | | | | | | | | | | | | | | | | | | | | | | | | | | | | | | | | | |
Investment Companies | | | | | | | | | | | | | | | | | | | | | | | | | | | | | | | | | | | | |
Securities Lending Cash Investment LLC | | | 10,457,879 | | | | 308,046,500 | | | | 294,569,849 | | | | 23,934,530 | | | $ | 23 | | | $ | 0 | | | $ | 63,668 | | | $ | 23,936,923 | | | | | |
Wells Fargo Government Money Market Fund Select Class | | | 15,382,494 | | | | 138,533,213 | | | | 151,210,656 | | | | 2,705,051 | | | | 0 | | | | 0 | | | | 138,838 | | | | 2,705,051 | | | | | |
| | | | | | | | | | | | | | | | | | | | | | | | | | | | | | | | | | | | |
| | | | | | | | | | | | | | | | | | $ | 23 | | | $ | 0 | | | $ | 202,506 | | | $ | 26,641,974 | | | | 6.40 | % |
| | | | | | | | | | | | | | | | | | | | | | | | | | | | | | | | | | | | |
The accompanying notes are an integral part of these financial statements.
| | | | | | |
| Statement of assets and liabilities—March 31, 2018 | | Wells Fargo Specialized Technology Fund | | | 15 | |
| | | | |
| | | | |
| |
Assets | | | | |
Investments in unaffiliated securities (including $20,915,947 of securities loaned), at value (cost $253,789,054) | | $ | 400,351,062 | |
Investments in affiliated securities, at value (cost $26,641,974) | | | 26,641,974 | |
Cash | | | 296 | |
Foreign currency, at value (cost $25) | | | 25 | |
Receivable for investments sold | | | 45,446,065 | |
Receivable for Fund shares sold | | | 661,339 | |
Receivable for dividends | | | 146,633 | |
Receivable for securities lending income | | | 7,688 | |
Unrealized gains on forward foreign currency contracts | | | 860 | |
Prepaid expenses and other assets | | | 38,117 | |
| | | | |
Total assets | | | 473,294,059 | |
| | | | |
| |
Liabilities | | | | |
Payable for Fund shares redeemed | | | 28,307,082 | |
Payable upon receipt of securities loaned | | | 23,936,900 | |
Payable for investments purchased | | | 4,290,980 | |
Management fee payable | | | 356,823 | |
Administration fees payable | | | 80,744 | |
Distribution fee payable | | | 10,835 | |
Trustees’ fees and expenses payable | | | 1,453 | |
Accrued expenses and other liabilities | | | 176,729 | |
| | | | |
Total liabilities | | | 57,161,546 | |
| | | | |
Total net assets | | $ | 416,132,513 | |
| | | | |
| |
NET ASSETS CONSIST OF | | | | |
Paid-in capital | | $ | 188,277,070 | |
Accumulated net investment loss | | | (860 | ) |
Accumulated net realized gains on investments | | | 81,293,333 | |
Net unrealized gains on investments | | | 146,562,970 | |
| | | | |
Total net assets | | $ | 416,132,513 | |
| | | | |
| |
COMPUTATION OF NET ASSET VALUE AND OFFERING PRICE PER SHARE | | | | |
Net assets – Class A | | $ | 353,552,363 | |
Shares outstanding – Class A1 | | | 25,104,692 | |
Net asset value per share – Class A2 | | | $14.08 | |
Maximum offering price per share – Class A | | | $14.94 | |
Net assets – Class C | | $ | 15,931,665 | |
Shares outstanding – Class C1 | | | 1,399,389 | |
Net asset value per share – Class C | | | $11.38 | |
Net assets – Administrator Class | | $ | 19,139,894 | |
Shares outstanding – Administrator Class1 | | | 1,334,330 | |
Net asset value per share – Administrator Class | | | $14.34 | |
Net assets – Institutional Class | | $ | 27,508,591 | |
Shares outstanding – Institutional Class1 | | | 1,913,712 | |
Net asset value per share – Institutional Class | | | $14.37 | |
| 1 | The Fund has an unlimited number of authorized shares. |
| 2 | Maximum offering price is computed as 100/94.25 of net asset value. On investments of $50,000 or more, the offering price is reduced. |
The accompanying notes are an integral part of these financial statements.
| | | | |
| 16 | | Wells Fargo Specialized Technology Fund | | Statement of operations—year ended March 31, 2018 |
| | | | |
| | | | |
| |
Investment income | | | | |
Dividends (net of foreign withholding taxes of $33,098) | | $ | 2,458,912 | |
Income from affiliated securities | | | 202,506 | |
| | | | |
Total investment income | | | 2,661,418 | |
| | | | |
| |
Expenses | | | | |
Management fee | | | 3,554,835 | |
Administration fees | | | | |
Class A | | | 651,851 | |
Class C | | | 30,089 | |
Administrator Class | | | 68,684 | |
Institutional Class | | | 29,877 | |
Shareholder servicing fees | | | | |
Class A | | | 776,014 | |
Class C | | | 35,820 | |
Administrator Class | | | 132,084 | |
Distribution fee | | | | |
Class C | | | 107,460 | |
Custody and accounting fees | | | 31,943 | |
Professional fees | | | 49,261 | |
Registration fees | | | 85,504 | |
Shareholder report expenses | | | 58,851 | |
Trustees’ fees and expenses | | | 23,028 | |
Other fees and expenses | | | 13,734 | |
| | | | |
Total expenses | | | 5,649,035 | |
Less: Fee waivers and/or expense reimbursements | | | (19,292 | ) |
| | | | |
Net expenses | | | 5,629,743 | |
| | | | |
Net investment loss | | | (2,968,325 | ) |
| | | | |
| |
REALIZED AND UNREALIZED GAINS (LOSSES) ON INVESTMENTS | | | | |
| |
Net realized gains on: | | | | |
Unaffiliated securities | | | 85,427,800 | |
Affiliated securities | | | 23 | |
Forward foreign currency contracts | | | 35,766 | |
| | | | |
Net realized gains on investments | | | 85,463,589 | |
| | | | |
| |
Net change in unrealized gains (losses) on: | | | | |
Unaffiliated securities | | | 45,514,804 | |
Forward foreign currency contracts | | | 860 | |
| | | | |
Net change in unrealized gains (losses) on investments | | | 45,515,664 | |
| | | | |
Net realized and unrealized gains (losses) on investments | | | 130,979,253 | |
| | | | |
Net increase in net assets resulting from operations | | $ | 128,010,928 | |
| | | | |
The accompanying notes are an integral part of these financial statements.
| | | | | | |
| Statement of changes in net assets | | Wells Fargo Specialized Technology Fund | | | 17 | |
| | | | | | | | | | | | | | | | |
| | | Year ended
March 31, 2018 | | | Year ended
March 31, 2017 | |
| | | | |
Operations | | | | | | | | | | | | | | | | |
Net investment loss | | | | | | $ | (2,968,325 | ) | | | | | | $ | (941,513 | ) |
Net realized gains on investments | | | | | | | 85,463,589 | | | | | | | | 34,096,006 | |
Net change in unrealized gains (losses) on investments | | | | | | | 45,515,664 | | | | | | | | 34,389,614 | |
| | | | |
Net increase in net assets resulting from operations | | | | | | | 128,010,928 | | | | | | | | 67,544,107 | |
| | | | |
| | | | |
Distributions to shareholders from | | | | | | | | | | | | | | | | |
Net realized gains | | | | | | | | | | | | | | | | |
Class A | | | | | | | (22,775,603 | ) | | | | | | | (14,880,730 | ) |
Class C | | | | | | | (1,248,847 | ) | | | | | | | (848,385 | ) |
Administrator Class | | | | | | | (3,999,359 | ) | | | | | | | (1,833,645 | ) |
Institutional Class | | | | | | | (1,741,744 | ) | | | | | | | (171,234 | )1 |
| | | | |
Total distributions to shareholders | | | | | | | (29,765,553 | ) | | | | | | | (17,733,994 | ) |
| | | | |
| | | | |
Capital share transactions | | | Shares | | | | | | | | Shares | | | | | |
Proceeds from shares sold | | | | | | | | | | | | | | | | |
Class A | | | 2,084,687 | | | | 27,533,950 | | | | 1,119,979 | | | | 11,186,546 | |
Class B | | | N/A | | | | N/A | | | | 3,850 | 2 | | | 30,758 | 2 |
Class C | | | 192,101 | | | | 2,045,595 | | | | 126,948 | | | | 1,060,179 | |
Administrator Class | | | 1,546,441 | | | | 19,850,044 | | | | 1,074,890 | | | | 11,187,307 | |
Institutional Class | | | 564,328 | | | | 7,724,961 | | | | 1,879,809 | 1 | | | 20,363,858 | 1 |
| | | | |
| | | | | | | 57,154,550 | | | | | | | | 43,828,648 | |
| | | | |
Reinvestment of distributions | | | | | | | | | | | | | | | | |
Class A | | | 1,731,116 | | | | 22,071,725 | | | | 1,487,581 | | | | 14,459,290 | |
Class C | | | 116,005 | | | | 1,198,329 | | | | 96,557 | | | | 779,219 | |
Administrator Class | | | 307,642 | | | | 3,990,121 | | | | 165,740 | | | | 1,635,859 | |
Institutional Class | | | 123,913 | | | | 1,610,864 | | | | 17,366 | 1 | | | 171,234 | 1 |
| | | | |
| | | | | | | 28,871,039 | | | | | | | | 17,045,602 | |
| | | | |
Payment for shares redeemed | | | | | | | | | | | | | | | | |
Class A | | | (3,040,823 | ) | | | (38,796,202 | ) | | | (6,802,529 | ) | | | (69,234,485 | ) |
Class B | | | N/A | | | | N/A | | | | (19,232 | )2 | | | (163,421 | )2 |
Class C | | | (323,924 | ) | | | (3,371,408 | ) | | | (549,746 | ) | | | (4,592,945 | ) |
Administrator Class | | | (4,102,652 | ) | | | (57,561,216 | ) | | | (1,059,277 | ) | | | (10,759,802 | ) |
Institutional Class | | | (561,375 | ) | | | (7,267,274 | ) | | | (110,329 | )1 | | | (1,179,831 | )1 |
| | | | |
| | | | | | | (106,996,100 | ) | | | | | | | (85,930,484 | ) |
| | | | |
Net decrease in net assets resulting from capital share transactions | | | | | | | (20,970,511 | ) | | | | | | | (25,056,234 | ) |
| | | | |
Total increase in net assets | | | | | | | 77,274,864 | | | | | | | | 24,753,879 | |
| | | | |
| | | | |
Net assets | | | | | | | | | | | | | | | | |
Beginning of period | | | | | | | 338,857,649 | | | | | | | | 314,103,770 | |
| | | | |
End of period | | | | | | $ | 416,132,513 | | | | | | | $ | 338,857,649 | |
| | | | |
Undistributed (accumulated) net investment income (loss) | | | | | | $ | (860 | ) | | | | | | $ | 0 | |
| | | | |
| 1 | For the period from October 31, 2016 (commencement of class operations) to March 31, 2017 |
| 2 | For the period from April 1, 2016 to December 5, 2016. Effective at the close of business on December 5, 2016, Class B shares were converted to Class A shares and are no longer offered by the Fund. |
The accompanying notes are an integral part of these financial statements.
| | | | |
| 18 | | Wells Fargo Specialized Technology Fund | | Financial highlights |
(For a share outstanding throughout each period)
| | | | | | | | | | | | | | | | | | | | |
| | | Year ended March 31 | |
| CLASS A | | 2018 | | | 2017 | | | 2016 | | | 2015 | | | 2014 | |
Net asset value, beginning of period | | | $10.95 | | | | $9.39 | | | | $10.74 | | | | $10.65 | | | | $8.15 | |
Net investment loss | | | (0.10 | )1 | | | (0.03 | )1 | | | (0.06 | ) | | | (0.06 | ) | | | (0.06 | ) |
Net realized and unrealized gains (losses) on investments | | | 4.20 | | | | 2.17 | | | | 0.02 | | | | 1.43 | | | | 3.07 | |
| | | | | | | | | | | | | | | | | | | | |
Total from investment operations | | | 4.10 | | | | 2.14 | | | | (0.04 | ) | | | 1.37 | | | | 3.01 | |
Distributions to shareholders from | | | | | | | | | | | | | | | | | | | | |
Net realized gains | | | (0.97 | ) | | | (0.58 | ) | | | (1.31 | ) | | | (1.28 | ) | | | (0.51 | ) |
Net asset value, end of period | | | $14.08 | | | | $10.95 | | | | $9.39 | | | | $10.74 | | | | $10.65 | |
Total return2 | | | 38.41 | % | | | 23.55 | % | | | (0.66 | )% | | | 13.24 | % | | | 37.27 | % |
Ratios to average net assets (annualized) | | | | | | | | | | | | | | | | | | | | |
Gross expenses | | | 1.41 | % | | | 1.44 | % | | | 1.45 | % | | | 1.52 | % | | | 1.60 | % |
Net expenses | | | 1.41 | % | | | 1.44 | % | | | 1.45 | % | | | 1.51 | % | | | 1.56 | % |
Net investment loss | | | (0.75 | )% | | | (0.28 | )% | | | (0.53 | )% | | | (0.58 | )% | | | (0.63 | )% |
Supplemental data | | | | | | | | | | | | | | | | | | | | |
Portfolio turnover rate | | | 109 | % | | | 131 | % | | | 153 | % | | | 119 | % | | | 132 | % |
Net assets, end of period (000s omitted) | | | $353,552 | | | | $266,329 | | | | $267,811 | | | | $168,108 | | | | $154,833 | |
| 1 | Calculated based upon average shares outstanding |
| 2 | Total return calculations do not include any sales charges. |
The accompanying notes are an integral part of these financial statements.
| | | | | | |
| Financial highlights | | Wells Fargo Specialized Technology Fund | | | 19 | |
(For a share outstanding throughout each period)
| | | | | | | | | | | | | | | | | | | | |
| | | Year ended March 31 | |
| CLASS C | | 2018 | | | 2017 | | | 2016 | | | 2015 | | | 2014 | |
Net asset value, beginning of period | | | $9.06 | | | | $7.92 | | | | $9.33 | | | | $9.47 | | | | $7.35 | |
Net investment loss | | | (0.16 | ) | | | (0.09 | )1 | | | (0.12 | )1 | | | (0.13 | )1 | | | (0.12 | )1 |
Net realized and unrealized gains (losses) on investments | | | 3.45 | | | | 1.81 | | | | 0.02 | | | | 1.27 | | | | 2.75 | |
| | | | | | | | | | | | | | | | | | | | |
Total from investment operations | | | 3.29 | | | | 1.72 | | | | (0.10 | ) | | | 1.14 | | | | 2.63 | |
Distributions to shareholders from | | | | | | | | | | | | | | | | | | | | |
Net realized gains | | | (0.97 | ) | | | (0.58 | ) | | | (1.31 | ) | | | (1.28 | ) | | | (0.51 | ) |
Net asset value, end of period | | | $11.38 | | | | $9.06 | | | | $7.92 | | | | $9.33 | | | | $9.47 | |
Total return2 | | | 37.45 | % | | | 22.59 | % | | | (1.45 | )% | | | 12.44 | % | | | 36.14 | % |
Ratios to average net assets (annualized) | | | | | | | | | | | | | | | | | | | | |
Gross expenses | | | 2.16 | % | | | 2.19 | % | | | 2.20 | % | | | 2.27 | % | | | 2.35 | % |
Net expenses | | | 2.16 | % | | | 2.19 | % | | | 2.20 | % | | | 2.26 | % | | | 2.31 | % |
Net investment loss | | | (1.49 | )% | | | (1.03 | )% | | | (1.34 | )% | | | (1.33 | )% | | | (1.38 | )% |
Supplemental data | | | | | | | | | | | | | | | | | | | | |
Portfolio turnover rate | | | 109 | % | | | 131 | % | | | 153 | % | | | 119 | % | | | 132 | % |
Net assets, end of period (000s omitted) | | | $15,932 | | | | $12,827 | | | | $13,797 | | | | $14,143 | | | | $10,907 | |
| 1 | Calculated based upon average shares outstanding |
| 2 | Total return calculations do not include any sales charges. |
The accompanying notes are an integral part of these financial statements.
| | | | |
| 20 | | Wells Fargo Specialized Technology Fund | | Financial highlights |
(For a share outstanding throughout each period)
| | | | | | | | | | | | | | | | | | | | |
| | | Year ended March 31 | |
| ADMINISTRATOR CLASS | | 2018 | | | 2017 | | | 2016 | | | 2015 | | | 2014 | |
Net asset value, beginning of period | | | $11.12 | | | | $9.52 | | | | $10.86 | | | | $10.74 | | | | $8.20 | |
Net investment loss | | | (0.09 | )1 | | | (0.02 | ) | | | (0.05 | ) | | | (0.05 | ) | | | (0.05 | ) |
Net realized and unrealized gains (losses) on investments | | | 4.28 | | | | 2.20 | | | | 0.02 | | | | 1.45 | | | | 3.10 | |
| | | | | | | | | | | | | | | | | | | | |
Total from investment operations | | | 4.19 | | | | 2.18 | | | | (0.03 | ) | | | 1.40 | | | | 3.05 | |
Distributions to shareholders from | | | | | | | | | | | | | | | | | | | | |
Net realized gains | | | (0.97 | ) | | | (0.58 | ) | | | (1.31 | ) | | | (1.28 | ) | | | (0.51 | ) |
Net asset value, end of period | | | $14.34 | | | | $11.12 | | | | $9.52 | | | | $10.86 | | | | $10.74 | |
Total return | | | 38.55 | % | | | 23.65 | % | | | (0.56 | )% | | | 13.42 | % | | | 37.54 | % |
Ratios to average net assets (annualized) | | | | | | | | | | | | | | | | | | | | |
Gross expenses | | | 1.33 | % | | | 1.36 | % | | | 1.35 | % | | | 1.36 | % | | | 1.44 | % |
Net expenses | | | 1.32 | % | | | 1.33 | % | | | 1.33 | % | | | 1.35 | % | | | 1.40 | % |
Net investment loss | | | (0.66 | )% | | | (0.17 | )% | | | (0.48 | )% | | | (0.42 | )% | | | (0.48 | )% |
Supplemental data | | | | | | | | | | | | | | | | | | | | |
Portfolio turnover rate | | | 109 | % | | | 131 | % | | | 153 | % | | | 119 | % | | | 132 | % |
Net assets, end of period (000s omitted) | | | $19,140 | | | | $39,833 | | | | $32,373 | | | | $31,842 | | | | $31,681 | |
| 1 | Calculated based upon average shares outstanding |
The accompanying notes are an integral part of these financial statements.
| | | | | | |
| Financial highlights | | Wells Fargo Specialized Technology Fund | | | 21 | |
(For a share outstanding throughout each period)
| | | | | | | | |
| | | Year ended March 31 | |
| INSTITUTIONAL CLASS | | 2018 | | | 20171 | |
Net asset value, beginning of period | | | $11.12 | | | | $10.42 | |
Net investment income (loss) | | | (0.05 | ) | | | 0.01 | 2 |
Net realized and unrealized gains (losses) on investments | | | 4.27 | | | | 1.27 | |
| | | | | | | | |
Total from investment operations | | | 4.22 | | | | 1.28 | |
Distributions to shareholders from | | | | | | | | |
Net realized gains | | | (0.97 | ) | | | (0.58 | ) |
Net asset value, end of period | | | $14.37 | | | | $11.12 | |
Total return3 | | | 38.91 | % | | | 12.97 | % |
Ratios to average net assets (annualized) | | | | | | | | |
Gross expenses | | | 1.08 | % | | | 1.11 | % |
Net expenses | | | 1.07 | % | | | 1.08 | % |
Net investment income (loss) | | | (0.40 | )% | | | 0.17 | % |
Supplemental data | | | | | | | | |
Portfolio turnover rate | | | 109 | % | | | 131 | % |
Net assets, end of period (000s omitted) | | | $27,509 | | | | $19,869 | |
| 1 | For the period from October 31, 2016 (commencement of class operations) to March 31, 2017 |
| 2 | Calculated based upon average shares outstanding |
| 3 | Returns for periods of less than one year are not annualized. |
The accompanying notes are an integral part of these financial statements.
| | | | |
| 22 | | Wells Fargo Specialized Technology Fund | | Notes to financial statements |
1. ORGANIZATION
Wells Fargo Funds Trust (the “Trust”), a Delaware statutory trust organized on March 10, 1999, is an open-end management investment company registered under the Investment Company Act of 1940, as amended (the “1940 Act”). As an investment company, the Trust follows the accounting and reporting guidance in Financial Accounting Standards Board Accounting Standards Codification Topic 946, Financial Services – Investment Companies. These financial statements report on the Wells Fargo Specialized Technology Fund (the “Fund”) which is a non-diversified series of the Trust.
Effective at the close of business on December 5, 2016, Class B shares were converted to Class A shares and are no longer offered by the Fund. Information for Class B shares reflected in the financial statements represents activity through December 5, 2016.
2. SIGNIFICANT ACCOUNTING POLICIES
The following significant accounting policies, which are consistently followed in the preparation of the financial statements of the Fund, are in conformity with U.S. generally accepted accounting principles which require management to make estimates and assumptions that affect the reported amounts of assets and liabilities, disclosure of contingent assets and liabilities at the date of the financial statements, and the reported amounts of revenues and expenses during the reporting period. Actual results could differ from those estimates.
Securities valuation
All investments are valued each business day as of the close of regular trading on the New York Stock Exchange (generally 4 p.m. Eastern Time), although the Fund may deviate from this calculation time under unusual or unexpected circumstances.
Equity securities that are listed on a foreign or domestic exchange or market are valued at the official closing price or, if none, the last sales price. If no sale occurs on the principal exchange or market that day, a fair value price will be determined in accordance with the Fund’s Valuation Procedures.
The values of securities denominated in foreign currencies are translated into U.S. dollars at rates provided by an independent foreign currency pricing source at a time each business day specified by the Wells Fargo Asset Management Pricing Committee at Wells Fargo Funds Management, LLC (“Funds Management”).
Many securities markets and exchanges outside the U.S. close prior to the close of the New York Stock Exchange and therefore may not fully reflect trading or events that occur after the close of the principal exchange in which the foreign securities are traded, but before the close of the New York Stock Exchange. If such trading or events are expected to materially affect the value of such securities, then fair value pricing procedures approved by the Board of Trustees of the Fund are applied. These procedures take into account multiple factors including movements in U.S. securities markets after foreign exchanges close. Foreign securities that are fair valued under these procedures are categorized as Level 2 and the application of these procedures may result in transfers between Level 1 and Level 2. Depending on market activity, such fair valuations may be frequent. Such fair value pricing may result in net asset values that are higher or lower than net asset values based on the last reported sales price or latest quoted bid price. On March 31, 2018, such fair value pricing was used in pricing certain foreign securities.
Investments in registered open-end investment companies are valued at net asset value. Interests in non-registered investment companies that are redeemable at net asset value are fair valued normally at net asset value.
Investments which are not valued using any of the methods discussed above are valued at their fair value, as determined in good faith by the Board of Trustees. The Board of Trustees has established a Valuation Committee comprised of the Trustees and has delegated to it the authority to take any actions regarding the valuation of portfolio securities that the Valuation Committee deems necessary or appropriate, including determining the fair value of portfolio securities, unless the determination has been delegated to the Wells Fargo Asset Management Pricing Committee. The Board of Trustees retains the authority to make or ratify any valuation decisions or approve any changes to the Valuation Procedures as it deems appropriate. On a quarterly basis, the Board of Trustees receives reports on any valuation actions taken by the Valuation Committee or the Wells Fargo Asset Management Pricing Committee which may include items for ratification.
Valuations of fair valued securities are compared to the next actual sales price when available, or other appropriate market values, to assess the continued appropriateness of the fair valuation methodologies used. These securities are fair valued on a day-to-day basis, taking into consideration changes to appropriate market information and any significant changes to the inputs considered in the valuation process until there is a readily available price provided on an exchange or by an independent pricing service. Valuations received from an independent pricing service or independent
| | | | | | |
| Notes to financial statements | | Wells Fargo Specialized Technology Fund | | | 23 | |
broker-dealer quotes are periodically validated by comparisons to most recent trades and valuations provided by other independent pricing services in addition to the review of prices by the manager and/or subadviser. Unobservable inputs used in determining fair valuations are identified based on the type of security, taking into consideration factors utilized by market participants in valuing the investment, knowledge about the issuer and the current market environment.
Foreign currency translation
The accounting records of the Fund are maintained in U.S. dollars. The values of other assets and liabilities denominated in foreign currencies are translated into U.S. dollars at rates provided by an independent foreign currency pricing source at a time each business day specified by the Wells Fargo Asset Management Pricing Committee. Purchases and sales of securities, and income and expenses are converted at the rate of exchange on the respective dates of such transactions. Net realized foreign exchange gains or losses arise from sales of foreign currencies, currency gains or losses realized between the trade and settlement dates on securities transactions, and the difference between the amounts of dividends, interest and foreign withholding taxes recorded and the U.S. dollar equivalent of the amounts actually paid or received. Net unrealized foreign exchange gains and losses arise from changes in the fair value of assets and liabilities other than investments in securities resulting from changes in exchange rates. The changes in net assets arising from changes in exchange rates of securities and the changes in net assets resulting from changes in market prices of securities are not separately presented. Such changes are included in net realized and unrealized gains or losses from investments.
Forward foreign currency contracts
The Fund is subject to foreign currency risk in the normal course of pursuing its investment objectives. A forward foreign currency contract is an agreement between two parties to purchase or sell a specific currency for an agreed-upon price at a future date. The Fund enters into forward foreign currency contracts to facilitate transactions in foreign-denominated securities and to attempt to minimize the risk to the Fund from adverse changes in the relationship between currencies. Forward foreign currency contracts are recorded at the forward rate and marked-to-market daily. When the contracts are closed, realized gains and losses arising from such transactions are recorded as realized gains or losses on forward foreign currency contract transactions. The Fund could be exposed to risks if the counterparties to the contracts are unable to meet the terms of their contracts or if the value of the foreign currency changes unfavorably. The Fund’s maximum risk of loss from counterparty credit risk is the unrealized gains on the contracts. This risk may be mitigated if there is a master netting arrangement between the Fund and the counterparty.
Securities lending
The Fund may lend its securities from time to time in order to earn additional income in the form of fees or interest on securities received as collateral or the investment of any cash received as collateral. The Fund continues to receive interest or dividends on the securities loaned. The Fund receives collateral in the form of cash or securities with a value at least equal to the value of the securities on loan. The value of the loaned securities is determined at the close of each business day and any additional required collateral is delivered to the Fund on the next business day. In a securities lending transaction, the net asset value of the Fund will be affected by an increase or decrease in the value of the securities loaned and by an increase or decrease in the value of the instrument in which collateral is invested. The amount of securities lending activity undertaken by the Fund fluctuates from time to time. In the event of default or bankruptcy by the borrower, the Fund may be prevented from recovering the loaned securities or gaining access to the collateral or may experience delays or costs in doing so. In addition, the investment of any cash collateral received may lose all or part of its value. The Fund has the right under the lending agreement to recover the securities from the borrower on demand.
The Fund lends its securities through an unaffiliated securities lending agent. Cash collateral received in connection with its securities lending transactions is invested in Securities Lending Cash Investments, LLC (the “Securities Lending Fund”). The Securities Lending Fund is exempt from registration under Section 3(c)(7) of the 1940 Act and is managed by Funds Management and is subadvised by Wells Capital Management Incorporated (“WellsCap”), an affiliate of Funds Management and an indirect wholly owned subsidiary of Wells Fargo & Company (“Wells Fargo”). Funds Management receives an advisory fee starting at 0.05% and declining to 0.01% as the average daily net assets of the Securities Lending Fund increase. All of the fees received by Funds Management are paid to WellsCap for its services as subadviser. The Securities Lending Fund seeks to provide a positive return compared to the daily Fed Funds Open Rate by investing in high-quality, U.S. dollar-denominated short-term money market instruments. Securities Lending Fund investments are valued at the evaluated bid price provided by an independent pricing service. Income earned from investment in the Securities Lending Fund, if any, is included in income from affiliated securities on the Statement of Operations.
| | | | |
| 24 | | Wells Fargo Specialized Technology Fund | | Notes to financial statements |
Security transactions and income recognition
Securities transactions are recorded on a trade date basis. Realized gains or losses are recorded on the basis of identified cost.
Dividend income is recognized on the ex-dividend date, except for certain dividends from foreign securities, which are recorded as soon as the custodian verifies the ex-dividend date. Dividend income from foreign securities is recorded net of foreign taxes withheld where recovery of such taxes is not assured.
Distributions to shareholders
Distributions to shareholders from net investment income and any net realized gains are recorded on the ex-dividend date and paid at least annually. Such distributions are determined in accordance with income tax regulations and may differ from U.S. generally accepted accounting principles. Dividend sources are estimated at the time of declaration. The tax character of distributions is determined as of the Fund’s fiscal year end. Therefore, a portion of the Fund’s distributions made prior to the Fund’s fiscal year end may be categorized as a tax return of capital at year end.
Federal and other taxes
The Fund intends to continue to qualify as a regulated investment company by distributing substantially all of its investment company taxable income and any net realized capital gains (after reduction for capital loss carryforwards) sufficient to relieve it from all, or substantially all, federal income taxes. Accordingly, no provision for federal income taxes was required.
The Fund’s income and federal excise tax returns and all financial records supporting those returns for the prior three fiscal years are subject to examination by the federal and Delaware revenue authorities. Management has analyzed the Fund’s tax positions taken on federal, state, and foreign tax returns for all open tax years and does not believe that there are any uncertain tax positions that require recognition of a tax liability.
As of March 31, 2018, the aggregate cost of all investments for federal income tax purposes was $282,487,305 and the unrealized gains (losses) consisted of:
| | | | |
Gross unrealized gains | | $ | 146,003,779 | |
Gross unrealized losses | | | (1,497,188 | ) |
Net unrealized gains | | $ | 144,506,591 | |
Reclassifications are made to the Fund’s capital accounts for permanent tax differences to reflect income and gains available for distribution (or available capital loss carryforwards) under federal income tax regulations. U.S. generally accepted accounting principles require that certain components of net assets be adjusted to reflect permanent differences between financial and tax reporting. These reclassifications have no effect on net assets or net asset values per share. The primary permanent difference causing such reclassification is due to net operating losses. At March 31, 2018, as a result of permanent book-to-tax differences, the following reclassification adjustments were made on the Statement of Assets and Liabilities:
| | |
Accumulated net investment loss | | Accumulated net
realized gains
on investments |
| $2,967,465 | | $(2,967,465) |
Class allocations
The separate classes of shares offered by the Fund differ principally in applicable sales charges, distribution, shareholder servicing, and administration fees. Class specific expenses are charged directly to that share class. Investment income, common expenses, and realized and unrealized gains (losses) on investments are allocated daily to each class of shares based on the relative proportion of net assets of each class.
3. FAIR VALUATION MEASUREMENTS
Fair value measurements of investments are determined within a framework that has established a fair value hierarchy based upon the various data inputs utilized in determining the value of the Fund’s investments. The three-level hierarchy gives the highest priority to unadjusted quoted prices in active markets for identical assets or liabilities (Level 1) and the lowest priority to unobservable inputs (Level 3). The Fund’s investments are classified within the fair value hierarchy
| | | | | | |
| Notes to financial statements | | Wells Fargo Specialized Technology Fund | | | 25 | |
based on the lowest level of input that is significant to the fair value measurement. The inputs are summarized into three broad levels as follows:
| ∎ | | Level 1 – quoted prices in active markets for identical securities |
| ∎ | | Level 2 – other significant observable inputs (including quoted prices for similar securities, interest rates, prepayment speeds, credit risk, etc.) |
| ∎ | | Level 3 – significant unobservable inputs (including the Fund’s own assumptions in determining the fair value of investments) |
The inputs or methodologies used for valuing investments in securities are not necessarily an indication of the risk associated with investing in those securities.
The following is a summary of the inputs used in valuing the Fund’s assets and liabilities as of March 31, 2018:
| | | | | | | | | | | | | | | | |
| | | Quoted prices
(Level 1) | | | Other significant
observable inputs
(Level 2) | | | Significant
unobservable inputs (Level 3) | | | Total | |
Assets | | | | | | | | | | | | | | | | |
Investments in: | | | | | | | | | | | | | | | | |
| | | | |
Common stocks | | | | | | | | | | | | | | | | |
Consumer discretionary | | $ | 42,708,525 | | | $ | 0 | | | $ | 0 | | | $ | 42,708,525 | |
Health care | | | 1,100,046 | | | | 0 | | | | 0 | | | | 1,100,046 | |
Industrials | | | 1,121,962 | | | | 0 | | | | 0 | | | | 1,121,962 | |
Information technology | | | 331,217,051 | | | | 24,203,478 | | | | 0 | | | | 355,420,529 | |
| | | | |
Short-term investments | | | | | | | | | | | | | | | | |
Investment companies | | | 2,705,051 | | | | 0 | | | | 0 | | | | 2,705,051 | |
Investments measured at net asset value* | | | | | | | | | | | | | | | 23,936,923 | |
| | | 378,852,635 | | | | 24,203,478 | | | | 0 | | | | 426,993,036 | |
Forward foreign currency contracts | | | 0 | | | | 860 | | | | 0 | | | | 860 | |
Total assets | | $ | 378,852,635 | | | $ | 24,204,338 | | | $ | 0 | | | $ | 426,993,896 | |
| * | Investments that are measured at fair value using the net asset value per share (or its equivalent) as a practical expedient have not been categorized in the fair value hierarchy. The fair value amount presented in the table is intended to permit reconciliation of the fair value hierarchy to the amounts presented in the Statement of Assets and Liabilities. The Fund’s investment in Securities Lending Cash Investments, LLC valued at $23,936,923 does not have a redemption period notice, can be redeemed daily and does not have any unfunded commitments. |
Forward foreign currency contracts are reported at their cumulative unrealized gains (losses) at measurement date. All other assets and liabilities are reported at their market value at measurement date.
The Fund recognizes transfers between levels within the fair value hierarchy at the end of the reporting period. At March 31, 2018, fair value pricing was used in pricing certain foreign securities and common stocks valued at $9,786,052 were transferred between Level 1 and Level 2 within the fair value hierarchy. The Fund did not have any transfers into/out of Level 3.
4. TRANSACTIONS WITH AFFILIATES AND OTHER EXPENSES
Management fee
Funds Management, an indirect wholly owned subsidiary of Wells Fargo, is the manager of the Fund and provides advisory and fund-level administrative services under an investment management agreement. Under the investment management agreement, Funds Management is responsible for, among other services, implementing the investment objectives and strategies of the Fund, supervising the subadviser, providing fund-level administrative services in connection with the Fund’s operations, and providing any other fund-level administrative services reasonably necessary for the operation of the Fund. As compensation for its services under the investment management agreement, Funds Management is entitled to receive an annual management fee starting at 0.88% and declining to 0.78% as the average daily net assets of the Fund increase. Prior to September 1, 2017, Funds Management received a fee at an annual rate which started at 0.90% and declined to 0.78% as the average daily net assets of the Fund decreased. For the year ended March 31, 2018, the management fee was equivalent to an annual rate of 0.89% of the Fund’s average daily net assets.
| | | | |
| 26 | | Wells Fargo Specialized Technology Fund | | Notes to financial statements |
Funds Management has retained the services of a subadviser to provide daily portfolio management to the Fund. The fee for subadvisory services is borne by Funds Management. Allianz Global Investors U.S. LLC, which is not an affiliate of Funds Management, is the subadviser to the Fund and is entitled to receive a fee from Funds Management at an annual rate starting at 0.80% and declining to 0.55% as the average daily net assets of the Fund increase. Prior to September 1, 2017, the subadviser received an annual fee which started at 0.90% and declined to 0.55% as the average daily net assets of the Fund increased.
Administration fees
Under a class-level administration agreement, Funds Management provides class-level administrative services to the Fund, which includes paying fees and expenses for services provided by the transfer agent, sub-transfer agents, omnibus account servicers and record-keepers. As compensation for its services under the class-level administration agreement, Funds Management receives an annual fee which is calculated based on the average daily net assets of each class as follows:
| | | | |
| | | Class-level
administration fee | |
Class A, Class C | | | 0.21 | % |
Administrator Class, Institutional Class | | | 0.13 | |
Funds Management has contractually waived and/or reimbursed management and administration fees to the extent necessary to maintain certain net operating expense ratios for the Fund. Waiver of fees and/or reimbursement of expenses by Funds Management were made first from fund level expenses on a proportionate basis and then from class specific expenses. Funds Management has committed through August 1, 2019 to waive fees and/or reimburse expenses to the extent necessary to cap the Fund’s expenses at 1.41% for Class A shares, 2.16% for Class C shares, 1.31% for Administrator Class shares, and 1.06% for Institutional Class shares. After this time, the cap may be increased or the commitment to maintain the cap may be terminated only with the approval of the Board of Trustees. Prior to September 1, 2017, the Fund’s expenses were capped at 1.50% for Class A shares, 2.25% for Class C shares, 1.33% for Administrator Class shares, and 1.08% for Institutional Class shares.
Distribution fee
The Trust has adopted a distribution plan for Class C shares of the Fund pursuant to Rule 12b-1 under the 1940 Act. A distribution fee is charged to Class C shares and paid to Wells Fargo Funds Distributor, LLC (“Funds Distributor”), the principal underwriter, at an annual rate of 0.75% of the average daily net assets of Class C shares.
In addition, Funds Distributor is entitled to receive the front-end sales charge from the purchase of Class A shares and a contingent deferred sales charge on the redemption of certain Class A shares. Funds Distributor is also entitled to receive the contingent deferred sales charges from redemptions of Class C shares. For the year ended March 31, 2018, Funds Distributor received $17,760 from the sale of Class A shares. No contingent deferred sales charges were incurred by Class A and Class C shares for the year ended March 31, 2018.
Shareholder servicing fees
The Trust has entered into contracts with one or more shareholder servicing agents, whereby Class A, Class C, and Administrator Class of the Fund are charged a fee at an annual rate of 0.25% of the average daily net assets of each respective class.
A portion of these total shareholder servicing fees were paid to affiliates of Wells Fargo.
Interfund transactions
The Fund may purchase or sell investment securities to other Wells Fargo affiliates pursuant to Rule 17a-7 under the 1940 Act and under procedures adopted by the Board of Trustees. The procedures have been designed to ensure that these interfund transactions, which do not incur broker commissions, are effected at current market prices.
5. INVESTMENT PORTFOLIO TRANSACTIONS
Purchases and sales of investments, excluding U.S. government obligations (if any) and short-term securities, for the year ended March 31, 2018 were $417,783,105 and $476,752,552, respectively.
| | | | | | |
| Notes to financial statements | | Wells Fargo Specialized Technology Fund | | | 27 | |
6. DERIVATIVE TRANSACTIONS
During the year ended March 31, 2018, the Fund entered into forward foreign currency contracts for economic hedging purposes. The Fund had average contract amounts of $82,460 and $22,124 in forward foreign currency contracts to buy and forward foreign currency contracts to sell, respectively, during the year ended March 31, 2018.
The fair value, realized gains or losses and change in unrealized gains or losses, if any, on derivative instruments are reflected in the corresponding financial statement captions.
For certain types of derivative transactions, the Fund has entered into International Swaps and Derivatives Association, Inc. master agreements (“ISDA Master Agreements”) or similar agreements with approved counterparties. The ISDA Master Agreements or similar agreements may have requirements to deliver/deposit securities or cash to/with an exchange or broker-dealer as collateral and allows the Fund to offset, with each counterparty, certain derivative financial instrument’s assets and/or liabilities with collateral held or pledged. Collateral requirements differ by type of derivative. Collateral or margin requirements are set by the broker or exchange clearinghouse for exchange traded derivatives while collateral terms are contract specific for over-the-counter traded derivatives. Cash collateral that has been pledged to cover obligations of the Fund under ISDA Master Agreements or similar agreements, if any, are reported separately in the Statement of Assets and Liabilities. Securities pledged as collateral, if any, are noted in the Portfolio of Investments. With respect to balance sheet offsetting, absent an event of default by the counterparty or a termination of the agreement, the reported amounts of financial assets and financial liabilities in the Statement of Assets and Liabilities are not offset across transactions between the Fund and the applicable counterparty. A reconciliation of the gross amounts on the Statement of Assets and Liabilities to the net amounts by derivative type, including any collateral exposure, is as follows:
| | | | | | | | | | | | | | | | |
| Counterparty | | Gross amounts of
assets in the
Statement of
Assets and Liabilities | | | Amounts
subject
to netting
agreements | | | Collateral
received | | | Net amount
of assets | |
Northern Trust Company | | $ | 860 | | | $ | 0 | | | $ | 0 | | | $ | 860 | |
7. BANK BORROWINGS
The Trust (excluding the money market funds and certain other funds) and Wells Fargo Variable Trust are parties to a $280,000,000 revolving credit agreement whereby the Fund is permitted to use bank borrowings for temporary or emergency purposes, such as to fund shareholder redemption requests. Interest under the credit agreement is charged to the Fund based on a borrowing rate equal to the higher of the Federal Funds rate in effect on that day plus 1.25% or the overnight LIBOR rate in effect on that day plus 1.25%. In addition, an annual commitment fee equal to 0.25% of the unused balance is allocated to each participating fund. Prior to August 29, 2017, the revolving credit agreement amount was $250,000,000.
For the year ended March 31, 2018, there were no borrowings by the Fund under the agreement.
8. DISTRIBUTIONS TO SHAREHOLDERS
The tax character of distributions paid during the years ended March 31, 2018 and March 31, 2017 were as follows:
| | | | | | | | |
| | | Year ended March 31 | |
| | | 2018 | | | 2017 | |
Ordinary income | | $ | 7,805,610 | | | $ | 0 | |
Long-term capital gain | | | 21,959,943 | | | | 17,733,994 | |
As of March 31, 2018, the components of distributable earnings on a tax basis were as follows:
| | | | |
Undistributed ordinary income | | Undistributed long-term gain | | Unrealized gains |
| $30,325,807 | | $53,022,944 | | $144,506,693 |
| | | | |
| 28 | | Wells Fargo Specialized Technology Fund | | Notes to financial statements |
9. CONCENTRATION RISK
The Fund invests a substantial portion of its assets in technology companies and, therefore, would be more affected by changes in the technology sector than would be a fund whose investments are not heavily weighted in the sector.
10. INDEMNIFICATION
Under the Trust’s organizational documents, the officers and Trustees have been granted certain indemnification rights against certain liabilities that may arise out of performance of their duties to the Trust. Additionally, in the normal course of business, the Trust may enter into contracts with service providers that contain a variety of indemnification clauses. The Trust’s maximum exposure under these arrangements is dependent on future claims that may be made against the Fund and, therefore, cannot be estimated.
| | | | | | |
| Report of independent registered public accounting firm | | Wells Fargo Specialized Technology Fund | | | 29 | |
BOARD OF TRUSTEES AND SHAREHOLDERS OF WELLS FARGO FUNDS TRUST:
Opinion on the Financial Statements
We have audited the accompanying statement of assets and liabilities of the Wells Fargo Specialized Technology Fund (the “Fund”), one of the funds constituting the Wells Fargo Funds Trust, including the portfolio of investments, as of March 31, 2018, the related statement of operations for the year then ended, the statements of changes in net assets for each of the years in the two-year period then ended, and the related notes (collectively, the “financial statements”) and the financial highlights for each of the years or periods in the five-year period then ended. In our opinion, the financial statements and financial highlights present fairly, in all material respects, the financial position of the Fund as of March 31, 2018, the results of its operations for the year then ended, the changes in its net assets for each of the years in the two-year period then ended, and the financial highlights for each of the years or periods in the five-year period then ended, in conformity with U.S. generally accepted accounting principles.
Basis for Opinion
These financial statements and financial highlights are the responsibility of the Fund’s management. Our responsibility is to express an opinion on these financial statements and financial highlights based on our audits. We are a public accounting firm registered with the Public Company Accounting Oversight Board (United States) (“PCAOB”) and are required to be independent with respect to the Fund in accordance with the U.S. federal securities laws and the applicable rules and regulations of the Securities and Exchange Commission and the PCAOB.
We conducted our audits in accordance with the standards of the PCAOB. Those standards require that we plan and perform the audit to obtain reasonable assurance about whether the financial statements and financial highlights are free of material misstatement, whether due to error or fraud. Our audits included performing procedures to assess the risks of material misstatement of the financial statements and financial highlights, whether due to error or fraud, and performing procedures that respond to those risks. Such procedures included examining, on a test basis, evidence regarding the amounts and disclosures in the financial statements and financial highlights. Such procedures also included confirmation of securities owned as of March 31, 2018, by correspondence with the custodian and brokers, or by other appropriate auditing procedures. Our audits also included evaluating the accounting principles used and significant estimates made by management, as well as evaluating the overall presentation of the financial statements and financial highlights. We believe that our audits provide a reasonable basis for our opinion.

We have not been able to determine the specific year that we began serving as the auditor of one or more Wells Fargo Funds investment companies, however we are aware that we have served as the auditor of one or more Wells Fargo Funds investment companies since at least 1955.
Boston, Massachusetts
May 23, 2018
| | | | |
| 30 | | Wells Fargo Specialized Technology Fund | | Other information (unaudited) |
TAX INFORMATION
For corporate shareholders, pursuant to Section 854 of the Internal Revenue Code, 46.67% of ordinary income dividends qualify for the corporate dividends-received deduction for the fiscal year ended March 31, 2018.
Pursuant to Section 852 of the Internal Revenue Code, $21,959,943 was designated as a 20% rate gain distribution for the fiscal year ended March 31, 2018.
Pursuant to Section 854 of the Internal Revenue Code, $3,642,761 of income dividends paid during the fiscal year ended March 31, 2018 has been designated as qualified dividend income (QDI).
For the fiscal year ended March 31, 2018, $7,805,610 has been designated as short-term capital gain dividends for nonresident alien shareholders pursuant to Section 871 of the Internal Revenue Code.
PROXY VOTING INFORMATION
A description of the policies and procedures that the Fund uses to determine how to vote proxies relating to portfolio securities is available, upon request, by calling 1-800-222-8222, visiting our website at wellsfargofunds.com, or visiting the SEC website at sec.gov. Information regarding how the Fund voted proxies relating to portfolio securities during the most recent 12-month period ended June 30 is available on the Fund’s website at wellsfargofunds.com or by visiting the SEC website at sec.gov.
PORTFOLIO HOLDINGS INFORMATION
The complete portfolio holdings for the Fund are publicly available monthly on the Fund’s website (wellsfargofunds.com), on a one-month delayed basis. In addition, top ten holdings information (excluding derivative positions) for the Fund is publicly available on the Fund’s website on a monthly, seven-day or more delayed basis. The Fund files its complete schedule of portfolio holdings with the SEC for the first and third quarters of each fiscal year on Form N-Q, which is available by visiting the SEC website at sec.gov. In addition, the Fund’s Form N-Q may be reviewed and copied at the SEC’s Public Reference Room in Washington, DC, and at regional offices in New York City, at 233 Broadway, and in Chicago, at 175 West Jackson Boulevard, Suite 900. Information about the Public Reference Room may be obtained by calling 1-800-SEC-0330.
| | | | | | |
| Other information (unaudited) | | Wells Fargo Specialized Technology Fund | | | 31 | |
BOARD OF TRUSTEES AND OFFICERS
Each of the Trustees and Officers1 listed in the table below acts in identical capacities for each fund in the Wells Fargo family of funds, which consists of 153 mutual funds comprising the Wells Fargo Funds Trust, Wells Fargo Variable Trust, Wells Fargo Master Trust and four closed-end funds (collectively the “Fund Complex”). This table should be read in conjunction with the Prospectus and the Statement of Additional Information2. The mailing address of each Trustee and Officer is 525 Market Street, 12th Floor, San Francisco, CA 94105. Each Trustee and Officer serves an indefinite term, however, each Trustee serves such term until reaching the mandatory retirement age established by the Trustees.
Independent Trustees
| | | | | | |
Name and year of birth | | Position held and
length of service* | | Principal occupations during past five years or longer | | Current other
public company or
investment company
directorships |
William R. Ebsworth (Born 1957) | | Trustee, since 2015 | | Retired. From 1984 to 2013, equities analyst, portfolio manager, research director and chief investment officer at Fidelity Management and Research Company in Boston, Tokyo, and Hong Kong, and retired in 2013 as Chief Investment Officer of Fidelity Strategic Advisers, Inc. where he led a team of investment professionals managing client assets. Prior thereto, Board member of Hong Kong Securities Clearing Co., Hong Kong Options Clearing Corp., the Thailand International Fund, Ltd., Fidelity Investments Life Insurance Company, and Empire Fidelity Investments Life Insurance Company. Board member of the Forté Foundation (non-profit organization) and the Vincent Memorial Hospital Endowment (non-profit organization), where he serves on the Investment Committee and as a Chair of the Audit Committee. Mr. Ebsworth is a CFA® charterholder. | | Asset Allocation Trust |
Jane A. Freeman** (Born 1953) | | Trustee, since 2015; Chair Liaison, since 2018 | | Retired. From 2012 to 2014 and 1999 to 2008, Chief Financial Officer of Scientific Learning Corporation. From 2008 to 2012, Ms. Freeman provided consulting services related to strategic business projects. Prior to 1999, Portfolio Manager at Rockefeller & Co. and Scudder, Stevens & Clark. Board member of the Harding Loevner Funds from 1996 to 2014, serving as both Lead Independent Director and chair of the Audit Committee. Board member of the Russell Exchange Traded Funds Trust from 2011 to 2012 and the chair of the Audit Committee. Ms. Freeman is a Board Member of Ruth Bancroft Garden (non-profit organization) and the Glimmerglass Festival. She is also an inactive Chartered Financial Analyst. | | Asset Allocation Trust |
Isaiah Harris, Jr. (Born 1952) | | Trustee, since 2009 | | Retired. Chairman of the Board of CIGNA Corporation since 2009, and Director since 2005. From 2003 to 2011, Director of Deluxe Corporation. Prior thereto, President and CEO of BellSouth Advertising and Publishing Corp. from 2005 to 2007, President and CEO of BellSouth Enterprises from 2004 to 2005 and President of BellSouth Consumer Services from 2000 to 2003. Emeritus member of the Iowa State University Foundation Board of Governors. Emeritus Member of the Advisory Board of Iowa State University School of Business. Advisory Board Member, Palm Harbor Academy (charter school). Advisory Board Member, Child Evangelism Fellowship (non-profit). Mr. Harris is a certified public accountant (inactive status). | | CIGNA Corporation; Asset Allocation Trust |
Judith M. Johnson (Born 1949) | | Trustee, since 2008; Audit Committee Chairman, since 2008 | | Retired. Prior thereto, Chief Executive Officer and Chief Investment Officer of Minneapolis Employees Retirement Fund from 1996 to 2008. Ms. Johnson is an attorney, certified public accountant and a certified managerial accountant. | | Asset Allocation Trust |
David F. Larcker (Born 1950) | | Trustee, since 2009 | | James Irvin Miller Professor of Accounting at the Graduate School of Business, Stanford University, Director of the Corporate Governance Research Initiative and Senior Faculty of The Rock Center for Corporate Governance since 2006. From 2005 to 2008, Professor of Accounting at the Graduate School of Business, Stanford University. Prior thereto, Ernst & Young Professor of Accounting at The Wharton School, University of Pennsylvania from 1985 to 2005. | | Asset Allocation Trust |
| | | | |
| 32 | | Wells Fargo Specialized Technology Fund | | Other information (unaudited) |
| | | | | | |
Name and year of birth | | Position held and
length of service* | | Principal occupations during past five years or longer | | Current other
public company or
investment company
directorships |
Olivia S. Mitchell*** (Born 1953) | | Trustee, since 2006; Governance Committee Chairman, since 2018 | | International Foundation of Employee Benefit Plans Professor, Wharton School of the University of Pennsylvania since 1993. Director of Wharton’s Pension Research Council and Boettner Center on Pensions & Retirement Research, and Research Associate at the National Bureau of Economic Research. Previously, Cornell University Professor from 1978 to 1993. | | Asset Allocation Trust |
Timothy J. Penny**** (Born 1951) | | Trustee, since 1996; Chairman, since 2018; Vice Chairman, from 2017 to 2018 | | President and Chief Executive Officer of Southern Minnesota Initiative Foundation, a non-profit organization, since 2007. Member of the Board of Trustees of NorthStar Education Finance, Inc., a non-profit organization, since 2007. | | Asset Allocation Trust |
James G. Polisson***** (Born 1959) | | Trustee, since 2018; Advisory Board Member, from 2017 to 2018 | | Retired. Chief Marketing Officer, Source (ETF) UK Services, Ltd, from 2015 to 2017. From 2012 to 2015, Principal of The Polisson Group, LLC, a management consulting, corporate advisory and principal investing company. Chief Executive Officer and Managing Director at Russell Investments, Global Exchange Traded Funds from 2010 to 2012. Managing Director of Barclays Global Investors from 1998 to 2010 and Global Chief Marketing Officer for iShares and Barclays Global Investors from 2000 to 2010. Trustee of the San Francisco Mechanics’ Institute, a non-profit organization, from 2013 to 2015. Board member of the Russell Exchange Traded Fund Trust from 2011 to 2012. Director of Barclays Global Investors Holdings Deutschland GmbH from 2006 to 2009. Mr. Polisson is an attorney and has a retired status with the Massachusetts and District of Columbia Bar Associations. | | Asset Allocation Trust |
Michael S. Scofield (Born 1943) | | Trustee, since 2010 | | Served on the Investment Company Institute’s Board of Governors and Executive Committee from 2008-2011 as well the Governing Council of the Independent Directors Council from 2006-2011 and the Independent Directors Council Executive Committee from 2008-2011. Trustee of the Evergreen Fund complex (and its predecessors) from 1984 to 2010. Chairman of the Evergreen Funds from 2000-2010. Former Trustee of the Mentor Funds. Retired Attorney, Law Offices of Michael S. Scofield. | | Asset Allocation Trust |
Pamela Wheelock***** (Born 1959) | | Trustee, since 2018; Advisory Board Member, from 2017 to 2018 | | Chief Operating Officer, Twin Cities Habitat for Humanity, since January, 2017. Vice President of University Services, University of Minnesota from 2012 to 2017. Prior thereto, Interim President and Chief Executive Officer of Blue Cross Blue Shield of Minnesota from 2010 to 2011, Chairman of the Board from 2009 to 2011 and Board Director from 2003 to 2015. Vice President, Leadership and Community Engagement, Bush Foundation, Saint Paul, Minnesota (a private foundation) from 2009 to 2011. Executive Vice President and Chief Financial Officer, Minnesota Sports and Entertainment from 2004 to 2009 and Senior Vice President from 2002 to 2004. Commissioner of Finance, State of Minnesota, from 1999 to 2002. Currently on the Board of Directors, Governance Committee and Finance Committee, for the Minnesota Philanthropy Partners (Saint Paul Foundation) since 2012 and Board Chair of the Minnesota Wild Foundation since 2010. | | Asset Allocation Trust |
| * | Length of service dates reflect the Trustee’s commencement of service with the Trust’s predecessor entities, where applicable. |
| ** | Jane Freeman became Chair Liaison effective January 1, 2018. |
| *** | Olivia Mitchell became Chairman of the Governance Committee effective January 1, 2018. |
| **** | Timothy Penny became Chairman effective January 1, 2018. |
| ***** | James Polisson and Pamela Wheelock each became a Trustee effective January 1, 2018. |
| | | | | | |
| Other information (unaudited) | | Wells Fargo Specialized Technology Fund | | | 33 | |
Officers
| | | | | | |
Name and
year of birth | | Position held and
length of service | | Principal occupations during past five years or longer | | |
Andrew Owen (Born 1960) | | President, since 2017 | | Executive Vice President of Wells Fargo & Company and Head of Affiliated Managers, Wells Fargo Asset Management, since 2014. In addition, Mr. Owen is currently President, Chief Executive Officer and Director of Wells Fargo Funds Management, LLC since 2017. Prior thereto, Executive Vice President responsible for marketing, investments and product development for Wells Fargo Funds Management, LLC, from 2009 to 2014. | | |
Nancy Wiser1 (Born 1967) | | Treasurer, since 2012 | | Executive Vice President of Wells Fargo Funds Management, LLC since 2011. Chief Operating Officer and Chief Compliance Officer at LightBox Capital Management LLC, from 2008 to 2011. | | |
| Alexander Kymn* (Born 1973) | | Secretary, since 2018; Chief Legal Officer, since 2018 | | Senior Company Counsel of Wells Fargo Bank, N.A. since 2018 (previously Senior Counsel from 2007 to 2018). Vice President of Wells Fargo Funds Management, LLC from 2008 to 2014. | | |
C. David Messman** (Born 1960) | | Secretary, since 2000; Chief Legal Officer, since 2003 | | Senior Vice President and Secretary of Wells Fargo Funds Management, LLC since 2001. Assistant General Counsel of Wells Fargo Bank, N.A. since 2013 and Vice President and Managing Counsel of Wells Fargo Bank, N.A. from 1996 to 2013. | | |
| Michael H. Whitaker (Born 1967) | | Chief Compliance Officer, since 2016 | | Senior Vice President and Chief Compliance Officer since 2016. Senior Vice President and Chief Compliance Officer for Fidelity Investments from 2007 to 2016. | | |
David Berardi (Born 1975) | | Assistant Treasurer, since 2009 | | Vice President of Wells Fargo Funds Management, LLC since 2009. Vice President of Evergreen Investment Management Company, LLC from 2008 to 2010. Manager of Fund Reporting and Control for Evergreen Investment Management Company, LLC from 2004 to 2010. | | |
| Jeremy DePalma1 (Born 1974) | | Assistant Treasurer, since 2009 | | Senior Vice President of Wells Fargo Funds Management, LLC since 2009. Senior Vice President of Evergreen Investment Management Company, LLC from 2008 to 2010 and head of the Fund Reporting and Control Team within Fund Administration from 2005 to 2010. | | |
| 1 | Nancy Wiser acts as Treasurer of 77 funds in the Fund Complex. Jeremy DePalma acts as Treasurer of 76 funds and Assistant Treasurer of 77 funds in the Fund Complex. |
| 2 | The Statement of Additional Information includes additional information about the Trustees and is available, without charge, upon request, by calling 1-800-222-8222 or by visiting the website at wellsfargofunds.com. |
| * | Alexander Kymn became the Secretary and Chief Legal Officer effective April 17, 2018. |
| ** | David Messman was the Secretary and Chief Legal Officer until April 16, 2018. |
| | | | |
| 34 | | Wells Fargo Specialized Technology Fund | | List of abbreviations |
The following is a list of common abbreviations for terms and entities that may have appeared in this report.
| ACA | — ACA Financial Guaranty Corporation |
| ADR | — American depositary receipt |
| ADS | — American depositary shares |
| AGC | — Assured Guaranty Corporation |
| AGM | — Assured Guaranty Municipal |
| Ambac | — Ambac Financial Group Incorporated |
| AMT | — Alternative minimum tax |
| BAN | — Bond anticipation notes |
| BHAC | — Berkshire Hathaway Assurance Corporation |
| CAB | — Capital appreciation bond |
| CCAB | — Convertible capital appreciation bond |
| CDA | — Community Development Authority |
| CDO | — Collateralized debt obligation |
| CLO | — Collateralized loan obligation |
| DRIVER | — Derivative inverse tax-exempt receipts |
| DW&P | — Department of Water & Power |
| DWR | — Department of Water Resources |
| ECFA | — Educational & Cultural Facilities Authority |
| EDA | — Economic Development Authority |
| EDFA | — Economic Development Finance Authority |
| ETF | — Exchange-traded fund |
| FDIC | — Federal Deposit Insurance Corporation |
| FFCB | — Federal Farm Credit Banks |
| FGIC | — Financial Guaranty Insurance Corporation |
| FHA | — Federal Housing Administration |
| FHLB | — Federal Home Loan Bank |
| FHLMC | — Federal Home Loan Mortgage Corporation |
| FICO | — The Financing Corporation |
| FNMA | — Federal National Mortgage Association |
| GDR | — Global depositary receipt |
| GNMA | — Government National Mortgage Association |
| HCFR | — Healthcare facilities revenue |
| HEFA | — Health & Educational Facilities Authority |
| HEFAR | — Higher education facilities authority revenue |
| HFA | — Housing Finance Authority |
| HFFA | — Health Facilities Financing Authority |
| HUD | — Department of Housing and Urban Development |
| IDA | — Industrial Development Authority |
| IDAG | — Industrial Development Agency |
| KRW | — Republic of Korea won |
| LIBOR | — London Interbank Offered Rate |
| LIFER | — Long Inverse Floating Exempt Receipts |
| LLC | — Limited liability company |
| LLLP | — Limited liability limited partnership |
| LLP | — Limited liability partnership |
| MBIA | — Municipal Bond Insurance Association |
| MFHR | — Multifamily housing revenue |
| MSTR | — Municipal securities trust receipts |
| MUD | — Municipal Utility District |
| National | — National Public Finance Guarantee Corporation |
| PCFA | — Pollution Control Financing Authority |
| PCL | — Public Company Limited |
| PCR | — Pollution control revenue |
| PFA | — Public Finance Authority |
| PFFA | — Public Facilities Financing Authority |
| PFOTER | — Puttable floating option tax-exempt receipts |
| PJSC | — Public Joint Stock Company |
| plc | — Public limited company |
| PUTTER | — Puttable tax-exempt receipts |
| R&D | — Research & development |
| Radian | — Radian Asset Assurance |
| RAN | — Revenue anticipation notes |
| RDA | — Redevelopment Agency |
| RDFA | — Redevelopment Finance Authority |
| REIT | — Real estate investment trust |
| ROC | — Reset option certificates |
| SAVRS | — Select auction variable rate securities |
| SBA | — Small Business Authority |
| SDR | — Swedish depositary receipt |
| SFHR | — Single-family housing revenue |
| SFMR | — Single-family mortgage revenue |
| SIFMA | — Securities Industry and Financial Markets Association |
| SPA | — Standby purchase agreement |
| SPDR | — Standard & Poor’s Depositary Receipts |
| SPEAR | — Short Puttable Exempt Adjustable Receipts |
| STRIPS | — Separate trading of registered interest and |
| TAN | — Tax anticipation notes |
| TIPS | — Treasury inflation-protected securities |
| TRAN | — Tax revenue anticipation notes |
| TTFA | — Transportation Trust Fund Authority |
| TVA | — Tennessee Valley Authority |
This page is intentionally left blank.
This page is intentionally left blank.

For more information
More information about Wells Fargo Funds is available free upon request. To obtain literature, please write, email, visit the Fund’s website, or call:
Wells Fargo Funds
P.O. Box 8266
Boston, MA 02266-8266
Email: fundservice@wellsfargo.com
Website: wellsfargofunds.com
Individual investors: 1-800-222-8222
Retail investment professionals: 1-888-877-9275
Institutional investment professionals: 1-866-765-0778
This report and the financial statements contained herein are submitted for the general information of the shareholders of the Fund. If this report is used for promotional purposes, distribution of the report must be accompanied or preceded by a current prospectus. Before investing, please consider the investment objectives, risks, charges, and expenses of the investment. For a current prospectus and, if available, a summary prospectus, containing this information, call 1-800-222-8222 or visit the Fund’s website at wellsfargofunds.com. Read the prospectus carefully before you invest or send money.
Wells Fargo Asset Management (WFAM) is a trade name used by the asset management businesses of Wells Fargo & Company. Wells Fargo Funds Management, LLC, a wholly owned subsidiary of Wells Fargo & Company, provides investment advisory and administrative services for Wells Fargo Funds. Other affiliates of Wells Fargo & Company provide subadvisory and other services for the funds. The funds are distributed by Wells Fargo Funds Distributor, LLC, Member FINRA, an affiliate of Wells Fargo & Company. Neither Wells Fargo Funds Distributor nor Wells Fargo Funds Management holds fund shareholder accounts or assets. This material is for general informational and educational purposes only and is NOT intended to provide investment advice or a recommendation of any kind—including a recommendation for any specific investment, strategy, or plan.
NOT FDIC INSURED ◾ NO BANK GUARANTEE ◾ MAY LOSE VALUE
© 2018 Wells Fargo Funds Management, LLC. All rights reserved.
| | |
 | | 309988 05-18 A317/AR317 03-18 |
Annual Report
March 31, 2018

Wells Fargo Utility and Telecommunications Fund


Reduce clutter. Save trees.
Sign up for electronic delivery of prospectuses and shareholder reports at wellsfargo.com/advantagedelivery
Contents
The views expressed and any forward-looking statements are as of March 31, 2018, unless otherwise noted, and are those of the Fund managers and/or Wells Fargo Funds Management, LLC. Discussions of individual securities, or the markets generally, or any Wells Fargo Fund are not intended as individual recommendations. Future events or results may vary significantly from those expressed in any forward-looking statements. The views expressed are subject to change at any time in response to changing circumstances in the market. Wells Fargo Funds Management, LLC and the Fund disclaim any obligation to publicly update or revise any views expressed or forward-looking statements.
NOT FDIC INSURED ◾ NO BANK GUARANTEE ◾ MAY LOSE VALUE
| | | | |
| 2 | | Wells Fargo Utility and Telecommunications Fund | | Letter to shareholders (unaudited) |

Andrew Owen
President
Wells Fargo Funds
Dear Shareholder:
We are pleased to offer you this annual report for the Wells Fargo Utility and Telecommunications Fund for the 12-month period that ended March 31, 2018. During the last three quarters of 2017, investors enjoyed consistently rising equity values globally. Short-term interest rates tended to increase, while long-term rates remained flat to lower. During the final two months of the first quarter of 2018, equity market volatility returned, stocks reversed year-to-date gains, and bond yields rose while prices fell.
For the period, U.S. stocks, as measured by the S&P 500 Index,1 gained 13.99% and international stocks, as measured by the MSCI ACWI ex USA Index (Net),2 added 16.53%. Emerging market stocks, as measured by the MSCI EM Index (Net),3 added 24.93%. In bond markets, the Bloomberg Barclays U.S. Aggregate Bond Index4 added 1.20% and the Bloomberg Barclays Municipal Bond Index5 added 2.66% while fixed-income investments outside the U.S. gained 11.75%, according to the Bloomberg Barclays Global Aggregate ex-USD Index.6 The ICE BofAML U.S. High Yield Index7 earned 3.69%.
Through the last nine months of 2017, stocks advanced on synchronized global growth, which led to higher investor and consumer confidence. The first quarter of 2018 began with strong stock market gains in January. A strong January 2018 U.S. employment report and inflation concerns prompted equity volatility in February. Investor optimism for growth was supplanted with concerns over trade tensions, increased interest rates, and the prospect of new data privacy regulations.
Reactions to U.S. interest rate increases were uneven across the yield curve and globally.
The U.S. Federal Reserve (Fed) increased the federal funds rate three times during the 12-month period for a combined 75 basis points (bps; 100 bps equals 1.00%). Following an increase in March 2017, short-term bond yields in the U.S. rose while longer-term Treasury yields were little changed. Municipal bond returns were positive, helped by strong demand and constrained new-issue supply. The Fed raised the target interest rate once again in June 2017 to a range of 1.00% to 1.25%. Ten-year U.S. Treasury yields declined, the yield curve flattened, and long-term bond prices benefited.
| 1 | The S&P 500 Index consists of 500 stocks chosen for market size, liquidity, and industry group representation. It is a market-value-weighted index with each stock’s weight in the index proportionate to its market value. You cannot invest directly in an index. |
| 2 | The Morgan Stanley Capital International (MSCI) All Country World Index (ACWI) ex USA Index (Net) is a free-float-adjusted market-capitalization-weighted index that is designed to measure the equity market performance of developed markets, excluding the United States and Canada. Source: MSCI. MSCI makes no express or implied warranties or representations and shall have no liability whatsoever with respect to any MSCI data contained herein. The MSCI data may not be further redistributed or used as a basis for other indices or any securities or financial products. This report is not approved, reviewed, or produced by MSCI. You cannot invest directly in an index. |
| 3 | The MSCI Emerging Markets (EM) Index (Net) is a free-float-adjusted market-capitalization-weighted index that is designed to measure large- and mid-cap equity market performance of emerging markets. The MSCI EM Index (Net) consists of the following 24 emerging market country indices: Brazil, Chile, China, Colombia, Czech Republic, Egypt, Greece, Hungary, India, Indonesia, Korea, Malaysia, Mexico, Pakistan, Peru, the Philippines, Poland, Qatar, Russia, South Africa, Taiwan, Thailand, Turkey, and the United Arab Emirates. You cannot invest directly in an index. |
| 4 | The Bloomberg Barclays U.S. Aggregate Bond Index is a broad-based benchmark that measures the investment-grade, U.S. dollar-denominated, fixed-rate taxable bond market, including Treasuries, government-related and corporate securities, mortgage-backed securities (agency fixed-rate and hybrid adjustable-rate mortgage pass-throughs), asset-backed securities, and commercial mortgage-backed securities. You cannot invest directly in an index. |
| 5 | The Bloomberg Barclays Municipal Bond Index is an unmanaged index composed of long-term tax-exempt bonds with a minimum credit rating of Baa. You cannot invest directly in an index. |
| 6 | The Bloomberg Barclays Global Aggregate ex-USD Index is an unmanaged index that provides a broad-based measure of the global investment-grade fixed-income markets excluding the U.S. dollar-denominated debt market. You cannot invest directly in an index. |
| 7 | The ICE BofAML U.S. High Yield Index is a market-capitalization-weighted index of domestic and Yankee high-yield bonds. The index tracks the performance of high-yield securities traded in the U.S. bond market. You cannot invest directly in an index. Copyright 2018. ICE Data Indices, LLC. All rights reserved. |
| | | | | | |
| Letter to shareholders (unaudited) | | Wells Fargo Utility and Telecommunications Fund | | | 3 | |
Internationally, central banks maintained low interest rates and accommodative monetary policies that supported business activity and stock values in foreign markets. A weaker U.S. dollar was generally supportive of business activity in regions around the globe. The Bank of Japan continued its accommodative monetary policies, and industrial production, retail sales, and fixed asset investment increased in China.
Growth continued through the summer of 2017.
Globally, stocks moved higher during the third quarter of 2017. Low inflation and interest rates supported accelerating global economic growth and corporate earnings. Brief episodes of geopolitical tensions, often associated with North Korea’s advancing nuclear missile program, flaring conflicts in the Middle East, and uncertainty surrounding U.S. trade policies, did not discourage investing activity.
In the U.S., economic data released during the quarter reflected a generally healthy economy. Second-quarter economic output grew at a 3.1% annual rate. Stocks in international developed and emerging markets continued to benefit from improving economic growth.
Positive economic and market news continued as 2017 closed and 2018 began.
During the fourth quarter of 2017, stock markets continued the move higher. Third-quarter economic output in the U.S. grew at a 3.2% annual rate. The unemployment rate fell to a 17-year low of 4.1%. Tax reform passed and wage growth data improved, encouraging increased business and consumer spending.
Fed officials announced in October 2017 plans to begin unwinding its $4.5 trillion portfolio of bonds and other assets accumulated during rounds of quantitative easing conducted since the 2008–2009 recession. Still, restrained inflation kept long-term bond rates steady and the flattened yield curve persisted. The Fed raised the federal funds rate target to a range of 1.25% to 1.50% in December 2017 and began selling bonds held in its portfolio.
2018 opened with continued stock advances, then volatility.
Improving business and economic data globally continued to support stocks through January 2018. Political wrangling in the U.S. over budget resolutions could not dissuade investors from buying stocks as payrolls and factory orders increased. Long-term interest rates in the U.S. trended higher as the yield curve steepened—the 10-year Treasury rate moved from 2.46% to 2.84% and the 30-year rate moved from 2.81% to 3.08% during January 2018.
Investor sentiment shifted in February as inflation concerns emerged in the U.S. when readings from the Producer Price Index in January rose 2.5% year over year. During February, the U.S. market endured a loss from January’s high of nearly 12% before recovering much of that loss. The Fed raised the federal funds rate in March 2018. Bond yields rose across the yield curve.
During January 2018, purchasing managers’ indices in China, the eurozone, India, and Japan reported data for December that indicated continued growth. Despite positive economic signals and business fundamentals, international stock values fell during February and March 2018, swept up in the selling momentum in U.S. markets.
Globally, stocks moved higher during the third quarter of 2017.
During February, the U.S. market endured a loss from January’s high of nearly 12% before recovering much of that loss.
| | | | |
| 4 | | Wells Fargo Utility and Telecommunications Fund | | Letter to shareholders (unaudited) |
Don’t let short-term uncertainty derail long-term investment goals.
Periods of investment uncertainty can present challenges, but experience has taught us that maintaining long-term investment goals can be an effective way to plan for the future. To help you create a sound strategy based on your personal goals and risk tolerance, Wells Fargo Funds offers more than 100 mutual funds spanning a wide range of asset classes and investment styles. Although diversification cannot guarantee an investment profit or prevent losses, we believe it can be an effective way to manage investment risk and potentially smooth out overall portfolio performance. We encourage investors to know their investments and to understand that appropriate levels of risk-taking may unlock opportunities.
Thank you for choosing to invest with Wells Fargo Funds. We appreciate your confidence in us and remain committed to helping you meet your financial needs.
Sincerely,

Andrew Owen
President
Wells Fargo Funds
For further information about your Fund, contact your investment professional, visit our website at wellsfargofunds.com, or call us directly at 1-800-222-8222.
This page is intentionally left blank.
| | | | |
| 6 | | Wells Fargo Utility and Telecommunications Fund | | Performance highlights (unaudited) |
Investment objective
The Fund seeks total return, consisting of current income and capital appreciation.
Manager
Wells Fargo Funds Management, LLC
Subadviser
Crow Point Partners, LLC
Portfolio manager
Timothy P. O’Brien, CFA®
Average annual total returns (%) as of March 31, 20181
| | | | | | | | | | | | | | | | | | | | | | | | | | | | | | | | | | |
| | | | | Including sales charge | | | Excluding sales charge | | | Expense ratios2 (%) | |
| | | Inception date | | 1 year | | | 5 year | | | 10 year | | | 1 year | | | 5 year | | | 10 year | | | Gross | | | Net3 | |
| Class A (EVUAX) | | 1-4-1994 | | | (1.98 | ) | | | 5.89 | | | | 5.77 | | | | 4.00 | | | | 7.15 | | | | 6.40 | | | | 1.18 | | | | 1.14 | |
| Class C (EVUCX) | | 9-2-1994 | | | 2.24 | | | | 6.36 | | | | 5.60 | | | | 3.24 | | | | 6.36 | | | | 5.60 | | | | 1.93 | | | | 1.89 | |
| Administrator Class (EVUDX) | | 7-30-2010 | | | – | | | | – | | | | – | | | | 4.21 | | | | 7.36 | | | | 6.56 | | | | 1.10 | | | | 0.95 | |
| Institutional Class (EVUYX) | | 2-28-1994 | | | – | | | | – | | | | – | | | | 4.38 | | | | 7.51 | | | | 6.72 | | | | 0.85 | | | | 0.78 | |
| S&P 500 Utilities Index4 | | – | | | – | | | | – | | | | – | | | | 1.89 | | | | 9.16 | | | | 7.07 | | | | – | | | | – | |
| S&P 500 Index5 | | – | | | – | | | | – | | | | – | | | | 13.99 | | | | 13.31 | | | | 9.49 | | | | – | | | | – | |
Figures quoted represent past performance, which is no guarantee of future results, and do not reflect taxes that a shareholder may pay on fund distributions or the redemption of fund shares. Investment return and principal value of an investment will fluctuate so that an investor’s shares, when redeemed, may be worth more or less than their original cost. Performance shown without sales charges would be lower if sales charges were reflected. Current performance may be lower or higher than the performance data quoted, which assumes the reinvestment of dividends and capital gains. Current month-end performance is available on the Fund’s website, wellsfargofunds.com.
While the S&P 500 Index is comprised of U.S. equity securities of companies diversified across ten sectors, the Fund’s holdings are concentrated primarily in utilities and telecommunication services stocks. Therefore, the performance of the S&P 500 Index is displayed only to show how the concentrated Fund performed compared with a diversified selection of U.S. equity securities.
Index returns do not include transaction costs associated with buying and selling securities, any mutual fund fees or expenses, or any taxes. It is not possible to invest directly in an index.
For Class A shares, the maximum front-end sales charge is 5.75%. For Class C shares, the maximum contingent deferred sales charge is 1.00%. Performance including a contingent deferred sales charge assumes the sales charge for the corresponding time period. Administrator Class and Institutional Class shares are sold without a front-end sales charge or contingent deferred sales charge.
Stock values fluctuate in response to the activities of individual companies and general market and economic conditions. Bond values fluctuate in response to the financial condition of individual issuers, general market and economic conditions, and changes in interest rates. Changes in market conditions and government policies may lead to periods of heightened volatility in the bond market and reduced liquidity for certain bonds held by the Fund. In general, when interest rates rise, bond values fall and investors may lose principal value. Interest-rate changes and their impact on the Fund and its share price can be sudden and unpredictable. The use of derivatives may reduce returns and/or increase volatility. Funds that concentrate their investments in limited sectors, such as utilities and telecommunication services, are more vulnerable to adverse market, economic, regulatory, political, or other developments affecting those sectors. Certain investment strategies tend to increase the total risk of an investment (relative to the broader market). The Fund is exposed to convertible securities risk, foreign investment risk, high-yield securities risk, smaller-company securities risk, non-diversification risk and subsidiary risk. Consult the Fund’s prospectus for additional information on these and other risks.
Please see footnotes on page 7.
| | | | | | |
| Performance highlights (unaudited) | | Wells Fargo Utility and Telecommunications Fund | | | 7 | |
|
| Growth of $10,000 investment as of March 31, 20186 |
|
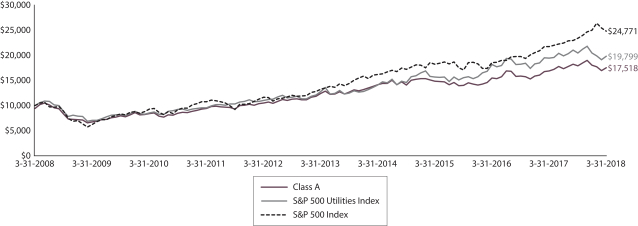 |
| 1 | Historical performance shown for Administrator Class shares prior to their inception reflects the performance of Institutional Class shares and has been adjusted to reflect the higher expenses applicable to Administrator Class shares. Historical performance shown for all classes of the Fund prior to July 19, 2010, is based on the performance of the Fund’s predecessor, Evergreen Utility and Telecommunications Fund. |
| 2 | Reflects the expense ratios as stated in the most recent prospectuses. The expense ratios shown are subject to change and may differ from the annualized expense ratios shown in the financial highlights of this report. |
| 3 | The manager has contractually committed through July 31, 2018, to waive fees and/or reimburse expenses to the extent necessary to cap the Fund’s Total Annual Fund Operating Expenses After Fee Waivers at the amounts shown. Brokerage commissions, stamp duty fees, interest, taxes, acquired fund fees and expenses (if any), and extraordinary expenses are excluded from the expense cap. After this time, the cap may be increased or the commitment to maintain the cap may be terminated only with the approval of the Board of Trustees. Without this cap, the Fund’s returns would have been lower. The expense ratio paid by an investor is the net expense ratio (the total annual fund operating expenses after fee waivers) as stated in the prospectuses. |
| 4 | The S&P 500 Utilities Index is a market-value-weighted index, that measures the performance of all stocks within the utilities sector of the S&P 500 Index. You cannot invest directly in an index. |
| 5 | The S&P 500 Index consists of 500 stocks chosen for market size, liquidity, and industry group representation. It is a market-value-weighted index with each stock’s weight in the index proportionate to its market value. You cannot invest directly in an index. |
| 6 | The chart compares the performance of Class A shares for the most recent ten years with the S&P 500 Utilities Index and the S&P 500 Index. The chart assumes a hypothetical investment of $10,000 in Class A shares and reflects all operating expenses and assumes the maximum initial sales charge of 5.75%. |
| 7 | The ten largest holdings, excluding cash and cash equivalents, are calculated based on the value of the investments divided by total net assets of the Fund. Holdings are subject to change and may have changed since the date specified. |
| 8 | Amounts are calculated based on the total long-term investments of the Fund. These amounts are subject to change and may have changed since the date specified. |
| | | | |
| 8 | | Wells Fargo Utility and Telecommunications Fund | | Performance highlights (unaudited) |
MANAGER’S DISCUSSION
Fund highlights
| ∎ | | The Fund outperformed the S&P 500 Utilities Index for the 12-month period that ended March 31, 2018. |
| ∎ | | The Fund benefited from strength in many regulated utilities holdings, certain telecommunication services firms, and select information technology holdings. |
| ∎ | | A California electric utility and certain telecommunication services holdings detracted from performance. |
A strong economy accompanied rising energy prices and interest rates.
Energy prices recovered substantially during the 12-month reporting period. Oil prices rose following producer-output reductions and modestly higher demand. The recovery in natural gas prices was less impressive, with demand depressed by comparatively warm winter weather. Interest rates rose during the year, not only on the short end but also on the long end of the yield curve. U.S. economic growth during the year was robust.
We made only moderate changes to the Fund during the reporting period.
The Fund’s composition did not change dramatically during the reporting period, and turnover remained low. We initiated and subsequently eliminated a position in PG&E Corporation after initially thinking concerns about fire liability were overblown and then deciding that they weren’t. Positions in Chatham Lodging Trust; Clipper Realty Incorporated; EQT Corporation; Snam S.p.A; and South Jersey Industries, Incorporated, were eliminated. We initiated a position in Hera S.p.A and added to existing positions in Perma-Pipe International Holdings, Incorporated, and Dominion Energy, Incorporated.
Some of the Fund’s best-performing utility holdings included American Water Works Company, Incorporated; PNM Resources, Incorporated; and Alliant Energy Corporation. The position in Shenandoah Telecommunications Company performed particularly well, as did the Visa Incorporated and MasterCard Incorporated positions.
Wheeler Real Estate Investment Trust, Incorporated, was a drag on performance, as were telecommunication services and related media holdings AT&T Incorporated and Comcast Corporation. California utility holding Edison International was a material detractor, falling in price over concerns about its potential liability for wildfires. Spark Energy, Incorporated, lagged badly after it reduced guidance.
Our outlook for utilities remains, on balance, favorable.
In our view, the fundamentals of regulated network utilities appear strong. Regulated utilities may have abundant opportunities to invest in their core businesses at returns we view as attractive. While the U.S. retains adequate power-generation capacity, current regulatory mandates are requiring utilities to increase renewable-energy sources and reduce the country’s historical reliance on fossil fuels in general and coal in particular. The development of U.S. shale-gas production has been providing investors with opportunities to make investments in gas gathering, processing, and transport infrastructure. Overall, utilities may be growing faster than at any time since the 1950s, and their growth could be sustainable for the intermediate term or longer. Our outlook for telecommunication services companies generally is less robust, with the legacy local-exchange telephone business in secular decline, cable under pressure, and wireless approaching saturation; however, select telecommunication services stocks likely present opportunities.
Short-term interest rates have begun to normalize after years of central-bank suppression. We do not believe that rates are likely to go up much on the short or the long end of the yield curve, as inflation seems well contained. A continued low interest rate environment likely should help support the prices of utilities stocks because income-seeking investors favor their relatively generous dividends. Also, the tax environment has remained reasonably favorable for utilities investors. While the tax rate on qualified dividend income increased to 23.8% from 15.0% in 2013, it remains well below the top marginal tax rate for ordinary income and has had little visible impact on the performance of utilities stocks. For now, we view the outlook for utilities as reasonably bright, with many important positives outweighing a few limited concerns.
Please see footnotes on page 7.
| | | | | | |
| Performance highlights (unaudited) | | Wells Fargo Utility and Telecommunications Fund | | | 9 | |
| | | | |
| Ten largest holdings (%) as of March 31, 20187 | |
Visa Incorporated Class A | | | 8.85 | |
CMS Energy Corporation | | | 7.44 | |
NextEra Energy Incorporated | | | 7.38 | |
Eversource Energy | | | 6.86 | |
Alliant Energy Corporation | | | 6.49 | |
PNM Resources Incorporated | | | 6.29 | |
Sempra Energy | | | 6.09 | |
Edison International | | | 5.67 | |
Dominion Energy Incorporated | | | 4.97 | |
Shenandoah Telecommunications Company | | | 4.93 | |
|
| Industry distribution as of March 31, 20188 |
|
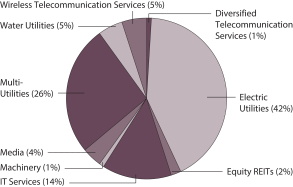
|
Please see footnotes on page 7.
| | | | |
| 10 | | Wells Fargo Utility and Telecommunications Fund | | Fund expenses (unaudited) |
As a shareholder of the Fund, you incur two types of costs: (1) transaction costs, including sales charges (loads) on purchase payments and contingent deferred sales charges (if any) on redemptions and (2) ongoing costs, including management fees, distribution (12b-1) and/or shareholder servicing fees, and other Fund expenses. This example is intended to help you understand your ongoing costs (in dollars) of investing in the Fund and to compare these costs with the ongoing costs of investing in other mutual funds.
The example is based on an investment of $1,000 invested at the beginning of the six-month period and held for the entire period from October 1, 2017 to March 31, 2018.
Actual expenses
The “Actual” line of the table below provides information about actual account values and actual expenses. You may use the information in this line, together with the amount you invested, to estimate the expenses that you paid over the period. Simply divide your account value by $1,000 (for example, an $8,600 account value divided by $1,000 = 8.6), then multiply the result by the number in the “Actual” line under the heading entitled “Expenses paid during period” for your applicable class of shares to estimate the expenses you paid on your account during this period.
Hypothetical example for comparison purposes
The “Hypothetical” line of the table below provides information about hypothetical account values and hypothetical expenses based on the Fund’s actual expense ratio and an assumed rate of return of 5% per year before expenses, which is not the Fund’s actual return. The hypothetical account values and expenses may not be used to estimate the actual ending account balance or expenses you paid for the period. You may use this information to compare the ongoing costs of investing in the Fund and other funds. To do so, compare this 5% hypothetical example with the 5% hypothetical examples that appear in the shareholder reports of the other funds.
Please note that the expenses shown in the table are meant to highlight your ongoing costs only and do not reflect any transactional costs, such as sales charges (loads) and contingent deferred sales charges. Therefore, the “Hypothetical” line of the table is useful in comparing ongoing costs only and will not help you determine the relative total costs of owning different funds. In addition, if these transactional costs were included, your costs would have been higher.
| | | | | | | | | | | | | | | | |
| | | Beginning
account value
10-1-2017 | | | Ending
account value
3-31-2018 | | | Expenses
paid during
the period¹ | | | Annualized net
expense ratio | |
Class A | | | | | | | | | | | | | | | | |
Actual | | $ | 1,000.00 | | | $ | 978.23 | | | $ | 5.61 | | | | 1.14 | % |
Hypothetical (5% return before expenses) | | $ | 1,000.00 | | | $ | 1,019.26 | | | $ | 5.72 | | | | 1.14 | % |
Class C | | | | | | | | | | | | | | | | |
Actual | | $ | 1,000.00 | | | $ | 974.50 | | | $ | 9.29 | | | | 1.89 | % |
Hypothetical (5% return before expenses) | | $ | 1,000.00 | | | $ | 1,015.52 | | | $ | 9.48 | | | | 1.89 | % |
Administrator Class | | | | | | | | | | | | | | | | |
Actual | | $ | 1,000.00 | | | $ | 978.78 | | | $ | 4.69 | | | | 0.95 | % |
Hypothetical (5% return before expenses) | | $ | 1,000.00 | | | $ | 1,020.19 | | | $ | 4.78 | | | | 0.95 | % |
Institutional Class | | | | | | | | | | | | | | | | |
Actual | | $ | 1,000.00 | | | $ | 979.56 | | | $ | 3.85 | | | | 0.78 | % |
Hypothetical (5% return before expenses) | | $ | 1,000.00 | | | $ | 1,021.04 | | | $ | 3.93 | | | | 0.78 | % |
| 1 | Expenses paid is equal to the annualized net expense ratio of each class multiplied by the average account value over the period, multiplied by the number of days in the most recent fiscal half-year divided by the number of days in the fiscal year (to reflect the one-half-year period). |
| | | | | | |
| Portfolio of investments—March 31, 2018 | | Wells Fargo Utility and Telecommunications Fund | | | 11 | |
| | | | | | | | | | | | | | | | |
| Security name | | | | | | | | Shares | | | Value | |
| | | | |
Common Stocks: 95.83% | | | | | | | | | | | | | | | | |
| | | | |
Consumer Discretionary: 4.21% | | | | | | | | | | | | | | | | |
| | | | |
| Media: 4.21% | | | | | | | | | | | | | | | | |
Comcast Corporation Class A | | | | | | | | | | | 450,200 | | | $ | 15,383,334 | |
| | | | | | | | | | | | | | | | |
| | | | |
Financials: 0.17% | | | | | | | | | | | | | | | | |
| | | | |
| Diversified Financial Services: 0.17% | | | | | | | | | | | | | | | | |
A-Mark Precious Metals Incorporated | | | | | | | | | | | 49,427 | | | | 605,481 | |
| | | | | | | | | | | | | | | | |
| | | | |
Industrials: 0.51% | | | | | | | | | | | | | | | | |
| | | | |
| Machinery: 0.51% | | | | | | | | | | | | | | | | |
Perma-Pipe International Holdings Incorporated † | | | | | | | | | | | 206,842 | | | | 1,871,920 | |
| | | | | | | | | | | | | | | | |
| | | | |
Information Technology: 13.41% | | | | | | | | | | | | | | | | |
| | | | |
| IT Services: 13.41% | | | | | | | | | | | | | | | | |
MasterCard Incorporated Class A | | | | | | | | | | | 95,000 | | | | 16,640,200 | |
Visa Incorporated Class A | | | | | | | | | | | 270,000 | | | | 32,297,400 | |
| |
| | | | 48,937,600 | |
| | | | | | | | | | | | | | | | |
| | | | |
Real Estate: 1.10% | | | | | | | | | | | | | | | | |
| | | | |
| Equity REITs: 1.10% | | | | | | | | | | | | | | | | |
Gladstone Land REIT Corporation | | | | | | | | | | | 40,000 | | | | 483,200 | |
Preferred Apartment Communities Incorporated Series A | | | | | | | | | | | 250,000 | | | | 3,547,500 | |
| |
| | �� | | 4,030,700 | |
| | | | | | | | | | | | | | | | |
| | | | |
Telecommunication Services: 5.91% | | | | | | | | | | | | | | | | |
| | | | |
| Diversified Telecommunication Services: 0.98% | | | | | | | | | | | | | | | | |
AT&T Incorporated | | | | | | | | | | | 100,000 | | | | 3,565,000 | |
| | | | | | | | | | | | | | | | |
| | | | |
| Wireless Telecommunication Services: 4.93% | | | | | | | | | | | | | | | | |
Shenandoah Telecommunications Company | | | | | | | | | | | 500,000 | | | | 18,000,000 | |
| | | | | | | | | | | | | | | | |
| | | | |
Utilities: 70.52% | | | | | | | | | | | | | | | | |
| | | | |
| Electric Utilities: 40.37% | | | | | | | | | | | | | | | | |
ALLETE Incorporated | | | | | | | | | | | 10,000 | | | | 722,500 | |
Alliant Energy Corporation | | | | | | | | | | | 580,000 | | | | 23,698,800 | |
American Electric Power Company Incorporated | | | | | | | | | | | 175,000 | | | | 12,003,250 | |
Edison International | | | | | | | | | | | 325,000 | | | | 20,689,500 | |
Eversource Energy | | | | | | | | | | | 425,000 | | | | 25,041,000 | |
Great Plains Energy Incorporated | | | | | | | | | | | 210,000 | | | | 6,675,900 | |
NextEra Energy Incorporated | | | | | | | | | | | 165,000 | | | | 26,949,450 | |
PNM Resources Incorporated | | | | | | | | | | | 600,000 | | | | 22,950,000 | |
Spark Energy Incorporated Class A (l) | | | | | | | | | | | 729,006 | | | | 8,638,721 | |
| |
| | | | 147,369,121 | |
| | | | | | | | | | | | | | | | |
| | | | |
| Multi-Utilities: 25.65% | | | | | | | | | | | | | | | | |
CenterPoint Energy Incorporated | | | | | | | | | | | 250,000 | | | | 6,850,000 | |
CMS Energy Corporation | | | | | | | | | | | 600,000 | | | | 27,174,000 | |
The accompanying notes are an integral part of these financial statements.
| | | | |
| 12 | | Wells Fargo Utility and Telecommunications Fund | | Portfolio of investments—March 31, 2018 |
| | | | | | | | | | | | | | | | |
| Security name | | | | | | | | Shares | | | Value | |
| | | | |
| Multi-Utilities (continued) | | | | | | | | | | | | | | | | |
Dominion Energy Incorporated | | | | | | | | | | | 269,000 | | | $ | 18,138,670 | |
Hera SpA | | | | | | | | | | | 1,000,000 | | | | 3,664,140 | |
Northwestern Corporation | | | | | | | | | | | 102,411 | | | | 5,509,712 | |
Public Service Enterprise Group Incorporated | | | | | | | | | | | 200,000 | | | | 10,048,000 | |
Sempra Energy | | | | | | | | | | | 200,000 | | | | 22,244,000 | |
| | | | |
| | | | | | | | | | | | | | | 93,628,522 | |
| | | | | | | | | | | | | | | | |
| | | | |
| Water Utilities: 4.50% | | | | | | | | | | | | | | | | |
American Water Works Company Incorporated | | | | | | | | | | | 200,000 | | | | 16,426,000 | |
| | | | | | | | | | | | | | | | |
| | | | |
Total Common Stocks (Cost $148,888,409) | | | | | | | | | | | | | | | 349,817,678 | |
| | | | | | | | | | | | | | | | |
| | | | |
| | | Dividend yield | | | | | | | | | | |
| Preferred Stocks: 1.63% | | | | | | | | | | | | | | | | |
| | | | |
Real Estate: 0.64% | | | | | | | | | | | | | | | | |
| | | | |
| Equity REITs: 0.64% | | | | | | | | | | | | | | | | |
Wheeler REIT Incorporated « | | | 14.00 | % | | | | | | | 150,000 | | | | 2,344,500 | |
| | | | | | | | | | | | | | | | |
| | | | |
Utilities: 0.99% | | | | | | | | | | | | | | | | |
| | | | |
| Electric Utilities: 0.99% | | | | | | | | | | | | | | | | |
Spark Energy Incorporated | | | 9.87 | | | | | | | | 150,000 | | | | 3,600,000 | |
| | | | | | | | | | | | | | | | |
| | | | |
Total Preferred Stocks (Cost $7,496,558) | | | | | | | | | | | | | | | 5,944,500 | |
| | | | | | | | | | | | | | | | |
| | | | |
| | | | | | Expiration date | | | | | | | |
| Warrants: 0.00% | | | | | | | | | | | | | | | | |
| | | | |
Energy: 0.00% | | | | | | | | | | | | | | | | |
| | | | |
| Oil, Gas & Consumable Fuels: 0.00% | | | | | | | | | | | | | | | | |
Energy & Exploration Partners Incorporated †(a) | | | | | | | 5-16-2023 | | | | 9 | | | | 0 | |
| | | | | | | | | | | | | | | | |
| | | | |
Total Warrants (Cost $0) | | | | | | | | | | | | | | | 0 | |
| | | | | | | | | | | | | | | | |
| | | | |
| | | Yield | | | | | | | | | | |
| | | | |
Short-Term Investments: 2.92% | | | | | | | | | | | | | | | | |
| | | | |
| Investment Companies: 2.92% | | | | | | | | | | | | | | | | |
Securities Lending Cash Investment LLC (l)(r)(u) | | | 1.89 | | | | | | | | 1,328,142 | | | | 1,328,275 | |
Wells Fargo Government Money Market Fund Select Class (l)(u) | | | 1.54 | | | | | | | | 9,340,273 | | | | 9,340,273 | |
| | | | |
Total Short-Term Investments (Cost $10,668,548) | | | | | | | | | | | | | | | 10,668,548 | |
| | | | | | | | | | | | | | | | |
| | | | | | | | |
| Total investments in securities (Cost $167,053,515) | | | 100.38 | % | | | 366,430,726 | |
Other assets and liabilities, net | | | (0.38 | ) | | | (1,403,882 | ) |
| | | | | | | | |
| Total net assets | | | 100.00 | % | | $ | 365,026,844 | |
| | | | | | | | |
The accompanying notes are an integral part of these financial statements.
| | | | | | |
| Portfolio of investments—March 31, 2018 | | Wells Fargo Utility and Telecommunications Fund | | | 13 | |
| † | Non-income-earning security |
| (l) | The issuer of the security is an affiliated person of the Fund as defined in the Investment Company Act of 1940. |
| « | All or a portion of this security is on loan. |
| ± | Variable rate investment. The rate shown is the rate in effect at period end. |
| (a) | The security is fair valued in accordance with procedures approved by the Board of Trustees. |
| (r) | The investment is a non-registered investment company purchased with cash collateral received from securities on loan. |
| (u) | The rate represents the 7-day annualized yield at period end. |
Investments in Affiliates
An affiliated investment is an investment in which the Fund owns at least 5% of the outstanding voting shares of the issuer or as a result of other relationships, such as the Fund and the issuer having the same investment manager. Transactions with issuers that were either affiliated persons of the Fund at the beginning of the period or the end of the period were as follows:
| | | | | | | | | | | | | | | | | | | | | | | | | | | | | | | | | | | | |
| | | Shares,
beginning of
period | | | Shares
purchased | | | Shares
sold | | | Shares,
end of
period | | | Net
realized
gains
(losses) | | | Net
change in
unrealized
gains
(losses) | | | Income
from
affiliated
securities | | | Value,
end
of period | | | % of
net
assets | |
Common Stocks | | | | | | | | | | | | | | | | | | | | | | | | | | | | | | | | | | | | |
Utilities | | | | | | | | | | | | | | | | | | | | | | | | | | | | | | | | | | | | |
Electric Utilities | | | | | | | | | | | | | | | | | | | | | | | | | | | | | | | | | | | | |
Spark Energy Incorporated Class A | | | 364,503 | | | | 364,503 | | | | 0 | | | | 729,006 | | | $ | 0 | | | $ | (3,007,150 | ) | | $ | 528,529 | | | $ | 8,638,721 | | | | 2.36 | % |
| | | | | | | | | |
Short-Term Investments | | | | | | | | | | | | | | | | | | | | | | | | | | | | | | | | | | | | |
Investment Companies | | | | | | | | | | | | | | | | | | | | | | | | | | | | | | | | | | | | |
Securities Lending Cash Investment LLC | | | 40,496 | | | | 36,449,783 | | | | 35,162,137 | | | | 1,328,142 | | | | 50 | | | | 0 | | | | 85,097 | | | | 1,328,275 | | | | | |
Wells Fargo Government Money Market Fund Select Class | | | 9,484,804 | | | | 57,839,019 | | | | 57,983,550 | | | | 9,340,273 | | | | 0 | | | | 0 | | | | 93,791 | | | | 9,340,273 | | | | | |
| | | | | | | | | |
| | | | | | | | | | | | | | | | | | | | | | | | | | | | | | | 10,668,548 | | | | 2.92 | |
| | | | | | | | | | | | | | | | | | | | | | | | | | | | | | | | | | | | |
| | | | | | | | | | | | | | | | | | $ | 50 | | | $ | (3,007,150 | ) | | $ | 707,417 | | | $ | 19,307,269 | | | | 5.28 | % |
| | | | | | | | | | | | | | | | | | | | | | | | | | | | | | | | | | | | |
The accompanying notes are an integral part of these financial statements.
| | | | |
| 14 | | Wells Fargo Utility and Telecommunications Fund | | Statement of assets and liabilities—March 31, 2018 |
| | | | |
| | | | |
| |
Assets | | | | |
Investments in unaffiliated securities (including $1,361,373 of securities loaned), at value (cost $149,628,926) | | $ | 347,123,457 | |
Investments in affiliated securities, at value (cost $17,424,589) | | | 19,307,269 | |
Cash | | | 306,625 | |
Foreign currency, at value (cost $183,983) | | | 181,793 | |
Receivable for Fund shares sold | | | 151,819 | |
Receivable for dividends | | | 616,225 | |
Receivable for securities lending income | | | 3,813 | |
Prepaid expenses and other assets | | | 28,054 | |
| | | | |
Total assets | | | 367,719,055 | |
| | | | |
| |
Liabilities | | | | |
Payable upon receipt of securities loaned | | | 1,328,225 | |
Payable for investments purchased | | | 690,716 | |
Payable for Fund shares redeemed | | | 221,214 | |
Management fee payable | | | 204,346 | |
Administration fees payable | | | 63,884 | |
Distribution fees payable | | | 27,285 | |
Trustees’ fees and expenses payable | | | 2,025 | |
Shareholder servicing fees payable | | | 72,461 | |
Accrued expenses and other liabilities | | | 82,055 | |
| | | | |
Total liabilities | | | 2,692,211 | |
| | | | |
Total net assets | | $ | 365,026,844 | |
| | | | |
| |
NET ASSETS CONSIST OF | | | | |
Paid-in capital | | $ | 175,206,324 | |
Undistributed net investment income | | | 451,894 | |
Accumulated net realized losses on investments | | | (10,006,395 | ) |
Net unrealized gains on investments | | | 199,375,021 | |
| | | | |
Total net assets | | $ | 365,026,844 | |
| | | | |
| |
COMPUTATION OF NET ASSET VALUE AND OFFERING PRICE PER SHARE | | | | |
Net assets – Class A | | $ | 287,047,139 | |
Shares outstanding – Class A1 | | | 14,028,458 | |
Net asset value per share – Class A | | | $20.46 | |
Maximum offering price per share – Class A2 | | | $21.71 | |
Net assets – Class C | | $ | 41,729,112 | |
Shares outstanding – Class C1 | | | 2,038,623 | |
Net asset value per share – Class C | | | $20.47 | |
Net assets – Administrator Class | | $ | 4,702,476 | |
Shares outstanding – Administrator Class1 | | | 229,569 | |
Net asset value per share – Administrator Class | | | $20.48 | |
Net assets – Institutional Class | | $ | 31,548,117 | |
Shares outstanding – Institutional Class1 | | | 1,542,526 | |
Net asset value per share – Institutional Class | | | $20.45 | |
| 1 | The Fund has an unlimited number of authorized shares. |
| 2 | Maximum offering price is computed as 100/94.25 of net asset value. On investments of $50,000 or more, the offering price is reduced. |
The accompanying notes are an integral part of these financial statements.
| | | | | | |
| Statement of operations—year ended March 31, 2018 | | Wells Fargo Utility and Telecommunications Fund | | | 15 | |
| | | | |
| | | | |
| |
Investment income | | | | |
Dividends (net of foreign withholding taxes of $25,604) | | $ | 9,964,967 | |
Income from affiliated securities | | | 707,417 | |
| | | | |
Total investment income | | | 10,672,384 | |
| | | | |
| |
Expenses | | | | |
Management fee | | | 2,530,016 | |
Administration fees | | | | |
Class A | | | 651,639 | |
Class B | | | 102 | 1 |
Class C | | | 100,228 | |
Administrator Class | | | 6,092 | |
Institutional Class | | | 34,407 | |
Shareholder servicing fees | | | | |
Class A | | | 775,761 | |
Class B | | | 121 | 1 |
Class C | | | 119,319 | |
Administrator Class | | | 11,715 | |
Distribution fees | | | | |
Class B | | | 363 | 1 |
Class C | | | 357,957 | |
Custody and accounting fees | | | 25,623 | |
Professional fees | | | 48,819 | |
Registration fees | | | 71,133 | |
Shareholder report expenses | | | 75,850 | |
Trustees’ fees and expenses | | | 18,999 | |
Other fees and expenses | | | 10,795 | |
| | | | |
Total expenses | | | 4,838,939 | |
Less: Fee waivers and/or expense reimbursements | | | (153,432 | ) |
| | | | |
Net expenses | | | 4,685,507 | |
| | | | |
Net investment income | | | 5,986,877 | |
| | | | |
| |
REALIZED AND UNREALIZED GAINS (LOSSES) ON INVESTMENTS | | | | |
| |
Net realized gains (losses) on: | | | | |
Unaffiliated securities | | | (3,563,434 | ) |
Affiliated securities | | | 50 | |
| | | | |
Net realized losses on investments | | | (3,563,384 | ) |
| | | | |
| |
Net change in unrealized gains (losses) on: | | | | |
Unaffiliated securities | | | 16,376,553 | |
Affiliated securities | | | (3,007,150 | ) |
| | | | |
Net change in unrealized gains (losses) on investments | | | 13,369,403 | |
| | | | |
Net realized and unrealized gains (losses) on investments | | | 9,806,019 | |
| | | | |
Net increase in net assets resulting from operations | | $ | 15,792,896 | |
| | | | |
| 1 | For the period from April 1, 2017 to May 5, 2017. Effective at the close of business on May 5, 2017, Class B shares were converted to Class A shares and are no longer offered by the Fund. |
The accompanying notes are an integral part of these financial statements.
| | | | |
| 16 | | Wells Fargo Utility and Telecommunications Fund | | Statement of changes in net assets |
| | | | | | | | | | | | | | | | | | | | |
| | | | | | Year ended March 31, 2018 | | | Year ended March 31, 2017 | |
| | | | | |
Operations | | | | | | | | | | | | | | | | | | | | |
Net investment income | | | | | | | | | | $ | 5,986,877 | | | | | | | $ | 6,758,973 | |
Net realized gains (losses) on investments | | | | | | | | | | | (3,563,384 | ) | | | | | | | 9,085,832 | |
Net change in unrealized gains (losses) on investments | | | | | | | | | | | 13,369,403 | | | | | | | | 16,612,203 | |
| | | | | | | | |
Net increase in net assets resulting from operations | | | | | | | | | | | 15,792,896 | | | | | | | | 32,457,008 | |
| | | | | | | | |
| | | | | |
Distributions to shareholders from | | | | | | | | | | | | | | | | | | | | |
Net investment income | | | | | | | | | | | | | | | | | | | | |
Class A | | | | | | | | | | | (5,216,624 | ) | | | | | | | (5,455,227 | ) |
Class B | | | | | | | | | | | 0 | 1 | | | | | | | (13,658 | ) |
Class C | | | | | | | | | | | (426,300 | ) | | | | | | | (530,072 | ) |
Administrator Class | | | | | | | | | | | (90,935 | ) | | | | | | | (123,585 | ) |
Institutional Class | | | | | | | | | | | (572,093 | ) | | | | | | | (469,463 | ) |
| | | | | | | | |
Total distributions to shareholders | | | | | | | | | | | (6,305,952 | ) | | | | | | | (6,592,005 | ) |
| | | | | | | | |
| | | | | |
Capital share transactions | | | | | | | Shares | | | | | | | | Shares | | | | | |
Proceeds from shares sold | | | | | | | | | | | | | | | | | | | | |
Class A | | | | | | | 519,687 | | | | 10,873,178 | | | | 856,994 | | | | 16,502,586 | |
Class B | | | | | | | 0 | 1 | | | 0 | 1 | | | 931 | | | | 17,537 | |
Class C | | | | | | | 32,953 | | | | 695,831 | | | | 133,306 | | | | 2,547,241 | |
Administrator Class | | | | | | | 69,039 | | | | 1,434,536 | | | | 167,059 | | | | 3,222,053 | |
Institutional Class | | | | | | | 667,149 | | | | 13,862,735 | | | | 1,186,116 | | | | 22,755,310 | |
| | | | | | | | |
| | | | | | | | | | | 26,866,280 | | | | | | | | 45,044,727 | |
| | | | | | | | |
Reinvestment of distributions | | | | | | | | | | | | | | | | | | | | |
Class A | | | | | | | 231,217 | | | | 4,823,724 | | | | 261,582 | | | | 5,117,059 | |
Class B | | | | | | | 0 | 1 | | | 0 | 1 | | | 526 | | | | 10,337 | |
Class C | | | | | | | 19,292 | | | | 401,388 | | | | 24,081 | | | | 472,936 | |
Administrator Class | | | | | | | 4,175 | | | | 87,094 | | | | 6,212 | | | | 121,579 | |
Institutional Class | | | | | | | 25,626 | | | | 532,962 | | | | 21,471 | | | | 420,106 | |
| | | | | | | | |
| | | | | | | | | | | 5,845,168 | | | | | | | | 6,142,017 | |
| | | | | | | | |
Payment for shares redeemed | | | | | | | | | | | | | | | | | | | | |
Class A | | | | | | | (2,125,163 | ) | | | (44,280,111 | ) | | | (2,573,856 | ) | | | (49,397,946 | ) |
Class B | | | | | | | (34,601 | )1 | | | (704,872 | )1 | | | (121,956 | ) | | | (2,335,058 | ) |
Class C | | | | | | | (568,843 | ) | | | (11,910,983 | ) | | | (673,370 | ) | | | (12,905,384 | ) |
Administrator Class | | | | | | | (101,645 | ) | | | (2,105,048 | ) | | | (275,364 | ) | | | (5,137,966 | ) |
Institutional Class | | | | | | | (379,011 | ) | | | (7,884,279 | ) | | | (797,063 | ) | | | (15,174,155 | ) |
| | | | | | | | |
| | | | | | | | | | | (66,885,293 | ) | | | | | | | (84,950,509 | ) |
| | | | | | | | |
Net decrease in net assets resulting from capital share transactions | | | | | | | | | | | (34,173,845 | ) | | | | | | | (33,763,765 | ) |
| | | | | | | | |
Total decrease in net assets | | | | | | | | | | | (24,686,901 | ) | | | | | | | (7,898,762 | ) |
| | | | | | | | |
| | | | | |
Net assets | | | | | | | | | | | | | | | | | | | | |
Beginning of period | | | | | | | | | | | 389,713,745 | | | | | | | | 397,612,507 | |
| | | | | | | | |
End of period | | | | | | | | | | $ | 365,026,844 | | | | | | | $ | 389,713,745 | |
| | | | | | | | |
Undistributed net investment income | | | | | | | | | | $ | 451,894 | | | | | | | $ | 779,965 | |
| | | | | | | | |
| 1 | For the period from April 1, 2017 to May 5, 2017. Effective at the close of business on May 5, 2017, Class B shares were converted to Class A shares and are no longer offered by the Fund. |
The accompanying notes are an integral part of these financial statements.
| | | | | | |
| Financial highlights | | Wells Fargo Utility and Telecommunications Fund | | | 17 | |
(For a share outstanding throughout each period)
| | | | | | | | | | | | | | | | | | | | |
| | | Year ended March 31 | |
| CLASS A | | 2018 | | | 2017 | | | 2016 | | | 2015 | | | 2014 | |
Net asset value, beginning of period | | | $20.01 | | | | $18.70 | | | | $18.23 | | | | $17.71 | | | | $15.85 | |
Net investment income | | | 0.34 | | | | 0.35 | | | | 0.31 | | | | 0.29 | | | | 0.36 | |
Net realized and unrealized gains (losses) on investments | | | 0.47 | | | | 1.30 | | | | 0.45 | | | | 0.57 | | | | 1.84 | |
| | | | | | | | | | | | | | | | | | | | |
Total from investment operations | | | 0.81 | | | | 1.65 | | | | 0.76 | | | | 0.86 | | | | 2.20 | |
Distributions to shareholders from | | | | | | | | | | | | | | | | | | | | |
Net investment income | | | (0.36 | ) | | | (0.34 | ) | | | (0.29 | ) | | | (0.34 | ) | | | (0.34 | ) |
Net asset value, end of period | | | $20.46 | | | | $20.01 | | | | $18.70 | | | | $18.23 | | | | $17.71 | |
Total return1 | | | 4.00 | % | | | 8.87 | % | | | 4.30 | % | | | 4.82 | % | | | 14.12 | % |
Ratios to average net assets (annualized) | | | | | | | | | | | | | | | | | | | | |
Gross expenses | | | 1.17 | % | | | 1.18 | % | | | 1.20 | % | | | 1.22 | % | | | 1.22 | % |
Net expenses | | | 1.14 | % | | | 1.14 | % | | | 1.14 | % | | | 1.14 | % | | | 1.14 | % |
Net investment income | | | 1.60 | % | | | 1.79 | % | | | 1.73 | % | | | 1.57 | % | | | 2.21 | % |
Supplemental data | | | | | | | | | | | | | | | | | | | | |
Portfolio turnover rate | | | 7 | % | | | 22 | % | | | 15 | % | | | 29 | % | | | 20 | % |
Net assets, end of period (000s omitted) | | | $287,047 | | | | $308,152 | | | | $315,238 | | | | $341,342 | | | | $350,029 | |
| 1 | Total return calculations do not include any sales charges. |
The accompanying notes are an integral part of these financial statements.
| | | | |
| 18 | | Wells Fargo Utility and Telecommunications Fund | | Financial highlights |
(For a share outstanding throughout each period)
| | | | | | | | | | | | | | | | | | | | |
| | | Year ended March 31 | |
| CLASS C | | 2018 | | | 2017 | | | 2016 | | | 2015 | | | 2014 | |
Net asset value, beginning of period | | | $20.01 | | | | $18.70 | | | | $18.25 | | | | $17.73 | | | | $15.86 | |
Net investment income | | | 0.13 | | | | 0.16 | | | | 0.17 | 1 | | | 0.15 | | | | 0.24 | 1 |
Net realized and unrealized gains (losses) on investments | | | 0.52 | | | | 1.34 | | | | 0.45 | | | | 0.57 | | | | 1.85 | |
| | | | | | | | | | | | | | | | | | | | |
Total from investment operations | | | 0.65 | | | | 1.50 | | | | 0.62 | | | | 0.72 | | | | 2.09 | |
Distributions to shareholders from | | | | | | | | | | | | | | | | | | | | |
Net investment income | | | (0.19 | ) | | | (0.19 | ) | | | (0.17 | ) | | | (0.20 | ) | | | (0.22 | ) |
Net asset value, end of period | | | $20.47 | | | | $20.01 | | | | $18.70 | | | | $18.25 | | | | $17.73 | |
Total return2 | | | 3.24 | % | | �� | 8.04 | % | | | 3.49 | % | | | 4.04 | % | | | 13.31 | % |
Ratios to average net assets (annualized) | | | | | | | | | | | | | | | | | | | | |
Gross expenses | | | 1.92 | % | | | 1.93 | % | | | 1.95 | % | | | 1.97 | % | | | 1.97 | % |
Net expenses | | | 1.89 | % | | | 1.89 | % | | | 1.89 | % | | | 1.89 | % | | | 1.89 | % |
Net investment income | | | 0.85 | % | | | 1.02 | % | | | 0.99 | % | | | 0.82 | % | | | 1.46 | % |
Supplemental data | | | | | | | | | | | | | | | | | | | | |
Portfolio turnover rate | | | 7 | % | | | 22 | % | | | 15 | % | | | 29 | % | | | 20 | % |
Net assets, end of period (000s omitted) | | | $41,729 | | | | $51,123 | | | | $57,431 | | | | $63,632 | | | | $61,329 | |
| 1 | Calculated based upon average shares outstanding |
| 2 | Total return calculations do not include any sales charges. |
The accompanying notes are an integral part of these financial statements.
| | | | | | |
| Financial highlights | | Wells Fargo Utility and Telecommunications Fund | | | 19 | |
(For a share outstanding throughout each period)
| | | | | | | | | | | | | | | | | | | | |
| | | Year ended March 31 | |
| ADMINISTRATOR CLASS | | 2018 | | | 2017 | | | 2016 | | | 2015 | | | 2014 | |
Net asset value, beginning of period | | | $20.03 | | | | $18.72 | | | | $18.25 | | | | $17.73 | | | | $15.86 | |
Net investment income | | | 0.37 | | | | 0.38 | | | | 0.34 | | | | 0.33 | | | | 0.40 | |
Net realized and unrealized gains (losses) on investments | | | 0.48 | | | | 1.30 | | | | 0.45 | | | | 0.56 | | | | 1.84 | |
| | | | | | | | | | | | | | | | | | | | |
Total from investment operations | | | 0.85 | | | | 1.68 | | | | 0.79 | | | | 0.89 | | | | 2.24 | |
Distributions to shareholders from | | | | | | | | | | | | | | | | | | | | |
Net investment income | | | (0.40 | ) | | | (0.37 | ) | | | (0.32 | ) | | | (0.37 | ) | | | (0.37 | ) |
Net asset value, end of period | | | $20.48 | | | | $20.03 | | | | $18.72 | | | | $18.25 | | | | $17.73 | |
Total return | | | 4.21 | % | | | 9.04 | % | | | 4.49 | % | | | 5.01 | % | | | 14.41 | % |
Ratios to average net assets (annualized) | | | | | | | | | | | | | | | | | | | | |
Gross expenses | | | 1.09 | % | | | 1.10 | % | | | 1.09 | % | | | 1.06 | % | | | 1.04 | % |
Net expenses | | | 0.95 | % | | | 0.95 | % | | | 0.95 | % | | | 0.95 | % | | | 0.95 | % |
Net investment income | | | 1.80 | % | | | 1.93 | % | | | 1.93 | % | | | 1.79 | % | | | 2.38 | % |
Supplemental data | | | | | | | | | | | | | | | | | | | | |
Portfolio turnover rate | | | 7 | % | | | 22 | % | | | 15 | % | | | 29 | % | | | 20 | % |
Net assets, end of period (000s omitted) | | | $4,702 | | | | $5,168 | | | | $6,740 | | | | $8,365 | | | | $9,383 | |
The accompanying notes are an integral part of these financial statements.
| | | | |
| 20 | | Wells Fargo Utility and Telecommunications Fund | | Financial highlights |
(For a share outstanding throughout each period)
| | | | | | | | | | | | | | | | | | | | |
| | | Year ended March 31 | |
| INSTITUTIONAL CLASS | | 2018 | | | 2017 | | | 2016 | | | 2015 | | | 2014 | |
Net asset value, beginning of period | | | $20.00 | | | | $18.69 | | | | $18.23 | | | | $17.74 | | | | $15.87 | |
Net investment income | | | 0.41 | | | | 0.42 | | | | 0.36 | 1 | | | 0.35 | 1 | | | 0.42 | |
Net realized and unrealized gains (losses) on investments | | | 0.47 | | | | 1.30 | | | | 0.45 | | | | 0.54 | | | | 1.85 | |
| | | | | | | | | | | | | | | | | | | | |
Total from investment operations | | | 0.88 | | | | 1.72 | | | | 0.81 | | | | 0.89 | | | | 2.27 | |
Distributions to shareholders from | | | | | | | | | | | | | | | | | | | | |
Net investment income | | | (0.43 | ) | | | (0.41 | ) | | | (0.35 | ) | | | (0.40 | ) | | | (0.40 | ) |
Net asset value, end of period | | | $20.45 | | | | $20.00 | | | | $18.69 | | | | $18.23 | | | | $17.74 | |
Total return | | | 4.38 | % | | | 9.26 | % | | | 4.63 | % | | | 5.02 | % | | | 14.58 | % |
Ratios to average net assets (annualized) | | | | | | | | | | | | | | | | | | | | |
Gross expenses | | | 0.84 | % | | | 0.85 | % | | | 0.84 | % | | | 0.79 | % | | | 0.79 | % |
Net expenses | | | 0.78 | % | | | 0.78 | % | | | 0.78 | % | | | 0.78 | % | | | 0.78 | % |
Net investment income | | | 1.95 | % | | | 2.18 | % | | | 2.03 | % | | | 1.89 | % | | | 2.56 | % |
Supplemental data | | | | | | | | | | | | | | | | | | | | |
Portfolio turnover rate | | | 7 | % | | | 22 | % | | | 15 | % | | | 29 | % | | | 20 | % |
Net assets, end of period (000s omitted) | | | $31,548 | | | | $24,575 | | | | $15,295 | | | | $14,156 | | | | $10,325 | |
| 1 | Calculated based upon average shares outstanding |
The accompanying notes are an integral part of these financial statements.
| | | | | | |
| Notes to financial statements | | Wells Fargo Utility and Telecommunications Fund | | | 21 | |
1. ORGANIZATION
Wells Fargo Funds Trust (the “Trust”), a Delaware statutory trust organized on March 10, 1999, is an open-end management investment company registered under the Investment Company Act of 1940, as amended (the “1940 Act”). As an investment company, the Trust follows the accounting and reporting guidance in Financial Accounting Standards Board Accounting Standards Codification Topic 946, Financial Services – Investment Companies. These financial statements report on the Wells Fargo Utility and Telecommunications Fund (the “Fund”) which is a non-diversified series of the Trust.
Effective at the close of business on May 5, 2017, Class B shares were converted to Class A shares and are no longer offered by the Fund. Information for Class B shares reflected in the financial statements represents activity through May 5, 2017.
2. SIGNIFICANT ACCOUNTING POLICIES
The following significant accounting policies, which are consistently followed in the preparation of the financial statements of the Fund, are in conformity with U.S. generally accepted accounting principles which require management to make estimates and assumptions that affect the reported amounts of assets and liabilities, disclosure of contingent assets and liabilities at the date of the financial statements, and the reported amounts of revenues and expenses during the reporting period. Actual results could differ from those estimates.
Securities valuation
All investments are valued each business day as of the close of regular trading on the New York Stock Exchange (generally 4 p.m. Eastern Time), although the Fund may deviate from this calculation time under unusual or unexpected circumstances.
Equity securities and options that are listed on a foreign or domestic exchange or market are valued at the official closing price or, if none, the last sales price. If no sale occurs on the principal exchange or market that day, a fair value price will be determined in accordance with the Fund’s Valuation Procedures.
Non-listed options are valued at the evaluated price provided by an independent pricing service or, if a reliable price is not available, the quoted bid price from an independent broker-dealer.
The values of securities denominated in foreign currencies are translated into U.S. dollars at rates provided by an independent foreign currency pricing source at a time each business day specified by the Wells Fargo Asset Management Pricing Committee at Wells Fargo Funds Management, LLC (“Funds Management”).
Many securities markets and exchanges outside the U.S. close prior to the close of the New York Stock Exchange and therefore may not fully reflect trading or events that occur after the close of the principal exchange in which the foreign securities are traded, but before the close of the New York Stock Exchange. If such trading or events are expected to materially affect the value of such securities, then fair value pricing procedures approved by the Board of Trustees of the Fund are applied. These procedures take into account multiple factors including movements in U.S. securities markets after foreign exchanges close. Foreign securities that are fair valued under these procedures are categorized as Level 2 and the application of these procedures may result in transfers between Level 1 and Level 2. Depending on market activity, such fair valuations may be frequent. Such fair value pricing may result in net asset values that are higher or lower than net asset values based on the last reported sales price or latest quoted bid price. On March 31, 2018, such fair value pricing was used in pricing certain foreign securities.
Investments in registered open-end investment companies are valued at net asset value. Interests in non-registered investment companies that are redeemable at net asset value are fair valued normally at net asset value.
Investments which are not valued using any of the methods discussed above are valued at their fair value, as determined in good faith by the Board of Trustees. The Board of Trustees has established a Valuation Committee comprised of the Trustees and has delegated to it the authority to take any actions regarding the valuation of portfolio securities that the Valuation Committee deems necessary or appropriate, including determining the fair value of portfolio securities, unless the determination has been delegated to the Wells Fargo Asset Management Pricing Committee. The Board of Trustees retains the authority to make or ratify any valuation decisions or approve any changes to the Valuation Procedures as it deems appropriate. On a quarterly basis, the Board of Trustees receives reports on any valuation actions taken by the Valuation Committee or the Wells Fargo Asset Management Pricing Committee which may include items for ratification.
Valuations of fair valued securities are compared to the next actual sales price when available, or other appropriate market values, to assess the continued appropriateness of the fair valuation methodologies used. These securities are fair
| | | | |
| 22 | | Wells Fargo Utility and Telecommunications Fund | | Notes to financial statements |
valued on a day-to-day basis, taking into consideration changes to appropriate market information and any significant changes to the inputs considered in the valuation process until there is a readily available price provided on an exchange or by an independent pricing service. Valuations received from an independent pricing service or independent broker-dealer quotes are periodically validated by comparisons to most recent trades and valuations provided by other independent pricing services in addition to the review of prices by the manager and/or subadviser. Unobservable inputs used in determining fair valuations are identified based on the type of security, taking into consideration factors utilized by market participants in valuing the investment, knowledge about the issuer and the current market environment.
Foreign currency translation
The accounting records of the Fund are maintained in U.S. dollars. The values of other assets and liabilities denominated in foreign currencies are translated into U.S. dollars at rates provided by an independent foreign currency pricing source at a time each business day specified by the Wells Fargo Asset Management Pricing Committee. Purchases and sales of securities, and income and expenses are converted at the rate of exchange on the respective dates of such transactions. Net realized foreign exchange gains or losses arise from sales of foreign currencies, currency gains or losses realized between the trade and settlement dates on securities transactions, and the difference between the amounts of dividends, interest and foreign withholding taxes recorded and the U.S. dollar equivalent of the amounts actually paid or received. Net unrealized foreign exchange gains and losses arise from changes in the fair value of assets and liabilities other than investments in securities resulting from changes in exchange rates. The changes in net assets arising from changes in exchange rates of securities and the changes in net assets resulting from changes in market prices of securities are not separately presented. Such changes are included in net realized and unrealized gains or losses from investments.
Securities lending
The Fund may lend its securities from time to time in order to earn additional income in the form of fees or interest on securities received as collateral or the investment of any cash received as collateral. The Fund continues to receive interest or dividends on the securities loaned. The Fund receives collateral in the form of cash or securities with a value at least equal to the value of the securities on loan. The value of the loaned securities is determined at the close of each business day and any additional required collateral is delivered to the Fund on the next business day. In a securities lending transaction, the net asset value of the Fund will be affected by an increase or decrease in the value of the securities loaned and by an increase or decrease in the value of the instrument in which collateral is invested. The amount of securities lending activity undertaken by the Fund fluctuates from time to time. In the event of default or bankruptcy by the borrower, the Fund may be prevented from recovering the loaned securities or gaining access to the collateral or may experience delays or costs in doing so. In addition, the investment of any cash collateral received may lose all or part of its value. The Fund has the right under the lending agreement to recover the securities from the borrower on demand.
The Fund lends its securities through an unaffiliated securities lending agent. Cash collateral received in connection with its securities lending transactions is invested in Securities Lending Cash Investments, LLC (the “Securities Lending Fund”). The Securities Lending Fund is exempt from registration under Section 3(c)(7) of the 1940 Act and is managed by Funds Management and is subadvised by Wells Capital Management Incorporated (“WellsCap”), an affiliate of Funds Management and an indirect wholly owned subsidiary of Wells Fargo & Company (“Wells Fargo”). Funds Management receives an advisory fee starting at 0.05% and declining to 0.01% as the average daily net assets of the Securities Lending Fund increase. All of the fees received by Funds Management are paid to WellsCap for its services as subadviser. The Securities Lending Fund seeks to provide a positive return compared to the daily Fed Funds Open Rate by investing in high-quality, U.S. dollar-denominated short-term money market instruments. Securities Lending Fund investments are valued at the evaluated bid price provided by an independent pricing service. Income earned from investment in the Securities Lending Fund, if any, is included in income from affiliated securities on the Statement of Operations.
Options
The Fund is subject to equity price risk in the normal course of pursuing its investment objectives. The Fund may write covered call options or secured put options on individual securities and/or indexes. When the Fund writes an option, an amount equal to the premium received is recorded as a liability and is subsequently adjusted to the current market value of the written option. Premiums received from written options that expire unexercised are recognized as realized gains on the expiration date. For exercised options, the difference between the premium received and the amount paid on effecting a closing purchase transaction, including brokerage commissions, is treated as a realized gain or loss. If a call option is exercised, the premium is added to the proceeds from the sale of the underlying security in calculating the realized gain or loss on the sale. If a put option is exercised, the premium reduces the cost of the security purchased. The Fund, as a writer of an option, bears the market risk of an unfavorable change in the price of the security and/or index underlying the written option.
| | | | | | |
| Notes to financial statements | | Wells Fargo Utility and Telecommunications Fund | | | 23 | |
The Fund may also purchase call or put options. Premiums paid are included in the Statement of Assets and Liabilities as investments, the values of which are subsequently adjusted based on the current market values of the options. Premiums paid for purchased options that expire are recognized as realized losses on the expiration date. Premiums paid for purchased options that are exercised or closed are added to the amount paid or offset against the proceeds received for the underlying security to determine the realized gain or loss. The risk of loss associated with purchased options is limited to the premium paid.
Options traded on an exchange are regulated and terms of the options are standardized. Purchased options traded over-the-counter expose the Fund to counterparty risk in the event the counterparty does not perform. This risk can be mitigated by having a master netting arrangement between the Fund and the counterparty and by having the counterparty post collateral to cover the Fund’s exposure to the counterparty.
Security transactions and income recognition
Securities transactions are recorded on a trade date basis. Realized gains or losses are recorded on the basis of identified cost.
Dividend income is recognized on the ex-dividend date, except for certain dividends from foreign securities, which are recorded as soon as the custodian verifies the ex-dividend date. Dividend income from foreign securities is recorded net of foreign taxes withheld where recovery of such taxes is not assured.
Distributions to shareholders
Distributions to shareholders are recorded on the ex-dividend date and paid from net investment income quarterly and any net realized gains are paid at least annually. Such distributions are determined in accordance with income tax regulations and may differ from U.S. generally accepted accounting principles. Dividend sources are estimated at the time of declaration. The tax character of distributions is determined as of the Fund’s fiscal year end. Therefore, a portion of the Fund’s distributions made prior to the Fund’s fiscal year end may be categorized as a tax return of capital at year end.
Federal and other taxes
The Fund intends to continue to qualify as a regulated investment company by distributing substantially all of its investment company taxable income and any net realized capital gains (after reduction for capital loss carryforwards) sufficient to relieve it from all, or substantially all, federal income taxes. Accordingly, no provision for federal income taxes was required.
The Fund’s income and federal excise tax returns and all financial records supporting those returns for the prior three fiscal years are subject to examination by the federal and Delaware revenue authorities. Management has analyzed the Fund’s tax positions taken on federal, state, and foreign tax returns for all open tax years and does not believe that there are any uncertain tax positions that require recognition of a tax liability.
As of March 31, 2018, the aggregate cost of all investments for federal income tax purposes was $172,076,229 and the unrealized gains (losses) consisted of:
| | | | |
Gross unrealized gains | | $ | 200,932,069 | |
Gross unrealized losses | | | (6,577,572 | ) |
Net unrealized gains | | $ | 194,354,497 | |
Reclassifications are made to the Fund’s capital accounts for permanent tax differences to reflect income and gains available for distribution (or available capital loss carryforwards) under federal income tax regulations. U.S. generally accepted accounting principles require that certain components of net assets be adjusted to reflect permanent differences between financial and tax reporting. These reclassifications have no effect on net assets or net asset values per share. At March 31, 2018, as a result of permanent book-to-tax differences, the following reclassification adjustments were made on the Statement of Assets and Liabilities:
| | |
Undistributed net
investment income | | Accumulated net
realized losses
on investments |
| $(8,996) | | $8,996 |
As of March 31, 2018 the Fund had capital loss carryforwards which consist of $4,983,682 in short-term capital losses.
Class allocations
The separate classes of shares offered by the Fund differ principally in applicable sales charges, distribution, shareholder servicing, and administration fees. Class specific expenses are charged directly to that share class. Investment income, common expenses, and realized and unrealized gains (losses) on investments are allocated daily to each class of shares based on the relative proportion of net assets of each class.
| | | | |
| 24 | | Wells Fargo Utility and Telecommunications Fund | | Notes to financial statements |
3. FAIR VALUATION MEASUREMENTS
Fair value measurements of investments are determined within a framework that has established a fair value hierarchy based upon the various data inputs utilized in determining the value of the Fund’s investments. The three-level hierarchy gives the highest priority to unadjusted quoted prices in active markets for identical assets or liabilities (Level 1) and the lowest priority to unobservable inputs (Level 3). The Fund’s investments are classified within the fair value hierarchy based on the lowest level of input that is significant to the fair value measurement. The inputs are summarized into three broad levels as follows:
| ∎ | | Level 1 – quoted prices in active markets for identical securities |
| ∎ | | Level 2 – other significant observable inputs (including quoted prices for similar securities, interest rates, prepayment speeds, credit risk, etc.) |
| ∎ | | Level 3 – significant unobservable inputs (including the Fund’s own assumptions in determining the fair value of investments) |
The inputs or methodologies used for valuing investments in securities are not necessarily an indication of the risk associated with investing in those securities.
The following is a summary of the inputs used in valuing the Fund’s assets and liabilities as of March 31, 2018:
| | | | | | | | | | | | | | | | |
| | | Quoted prices
(Level 1) | | | Other significant
observable inputs
(Level 2) | | | Significant
unobservable inputs (Level 3) | | | Total | |
Assets | | | | | | | | | | | | | | | | |
Investments in: | | | | | | | | | | | | | | | | |
| | | | |
Common stocks | | | | | | | | | | | | | | | | |
Consumer discretionary | | $ | 15,383,334 | | | $ | 0 | | | $ | 0 | | | $ | 15,383,334 | |
Financials | | | 605,481 | | | | 0 | | | | 0 | | | | 605,481 | |
Industrials | | | 1,871,920 | | | | 0 | | | | 0 | | | | 1,871,920 | |
Information technology | | | 48,937,600 | | | | 0 | | | | 0 | | | | 48,937,600 | |
Real estate | | | 4,030,700 | | | | 0 | | | | 0 | | | | 4,030,700 | |
Telecommunication services | | | 21,565,000 | | | | 0 | | | | 0 | | | | 21,565,000 | |
Utilities | | | 253,759,503 | | | | 3,664,140 | | | | 0 | | | | 257,423,643 | |
| | | | |
Preferred stocks | | | | | | | | | | | | | | | | |
Real estate | | | 2,344,500 | | | | 0 | | | | 0 | | | | 2,344,500 | |
Utilities | | | 3,600,000 | | | | 0 | | | | 0 | | | | 3,600,000 | |
| | | | |
Warrants | | | | | | | | | | | | | | | | |
Energy | | | 0 | | | | 0 | | | | 0 | | | | 0 | |
| | | | |
Short-term investments | | | | | | | | | | | | | | | | |
Investment companies | | | 9,340,273 | | | | 0 | | | | 0 | | | | 9,340,273 | |
Investments measured at net asset value* | | | | | | | | | | | | | | | 1,328,275 | |
Total assets | | $ | 361,438,311 | | | $ | 3,664,140 | | | $ | 0 | | | $ | 366,430,726 | |
| * | Investments that are measured at fair value using the net asset value per share (or its equivalent) as a practical expedient have not been categorized in the fair value hierarchy. The fair value amount presented in the table is intended to permit reconciliation of the fair value hierarchy to the amounts presented in the Statement of Assets and Liabilities. The Fund’s investment in Securities Lending Cash Investments, LLC valued at $1,328,275 does not have a redemption period notice, can be redeemed daily and does not have any unfunded commitments. |
The Fund recognizes transfers between levels within the fair value hierarchy at the end of the reporting period. At March 31, 2018, the Fund had no material transfers between Level 1 and Level 2. The Fund did not have any transfers into/out of Level 3.
4. TRANSACTIONS WITH AFFILIATES AND OTHER EXPENSES
Management fee
Funds Management, an indirect wholly owned subsidiary of Wells Fargo, is the manager of the Fund and provides advisory and fund-level administrative services under an investment management agreement. Under the investment
| | | | | | |
| Notes to financial statements | | Wells Fargo Utility and Telecommunications Fund | | | 25 | |
management agreement, Funds Management is responsible for, among other services, implementing the investment objectives and strategies of the Fund, supervising the subadviser, providing fund-level administrative services in connection with the Fund’s operations, and providing any other fund-level administrative services reasonably necessary for the operation of the Fund. As compensation for its services under the investment management agreement, Funds Management is entitled to receive an annual management fee starting at 0.65% and declining to 0.48% as the average daily net assets of the Fund increase. For the year ended March 31, 2018, the management fee was equivalent to an annual rate of 0.65% of the Fund’s average daily net assets.
Funds Management has retained the services of a subadviser to provide daily portfolio management to the Fund. The fee for subadvisory services is borne by Funds Management. Crow Point Partners, LLC, which is not an affiliate of Funds Management, is the subadviser to the Fund and is entitled to receive a fee from Funds Management at an annual rate starting at 0.20% and declining to 0.10% as the average daily net assets of the Fund increase.
Administration fees
Under a class-level administration agreement, Funds Management provides class-level administrative services to the Fund, which includes paying fees and expenses for services provided by the transfer agent, sub-transfer agents, omnibus account servicers and record-keepers. As compensation for its services under the class-level administration agreement, Funds Management receives an annual fee which is calculated based on the average daily net assets of each class as follows:
| | | | |
| | | Class-level
administration fee | |
Class A, Class B, Class C | | | 0.21 | % |
Administrator Class, Institutional Class | | | 0.13 | |
Funds Management has contractually waived and/or reimbursed management and administration fees to the extent necessary to maintain certain net operating expense ratios for the Fund. Waiver of fees and/or reimbursement of expenses by Funds Management were made first from fund level expenses on a proportionate basis and then from class specific expenses. Funds Management has committed through July 31, 2018 to waive fees and/or reimburse expenses to the extent necessary to cap the Fund’s expenses at 1.14% for Class A shares, 1.89% for Class C shares, 0.95% for Administrator Class shares, and 0.78% for Institutional Class shares. After this time, the cap may be increased or the commitment to maintain the cap may be terminated only with the approval of the Board of Trustees.
Distribution fees
The Trust has adopted a distribution plan for Class B and Class C shares of the Fund pursuant to Rule 12b-1 under the 1940 Act. Distribution fees are charged to Class B and Class C shares and paid to Wells Fargo Funds Distributor, LLC (“Funds Distributor”), the principal underwriter, at an annual rate of 0.75% of the average daily net assets of Class B and Class C shares.
In addition, Funds Distributor is entitled to receive the front-end sales charge from the purchase of Class A shares and a contingent deferred sales charge on the redemption of certain Class A shares. Funds Distributor is also entitled to receive the contingent deferred sales charges from redemptions of Class B and Class C shares. For the year ended March 31, 2018, Funds Distributor received $10,424 from the sale of Class A shares. No contingent deferred sales charges were incurred by Class A, Class B, and Class C for the year ended March 31, 2018.
Shareholder servicing fees
The Trust has entered into contracts with one or more shareholder servicing agents, whereby Class A, Class B, Class C, and Administrator Class of the Fund are charged a fee at an annual rate of 0.25% of the average daily net assets of each respective class.
A portion of these total shareholder servicing fees were paid to affiliates of Wells Fargo.
Interfund transactions
The Fund may purchase or sell portfolio investment securities to certain other Wells Fargo affiliates pursuant to Rule 17a-7 under the 1940 Act and under procedures adopted by the Board of Trustees. The procedures have been designed to ensure that these interfund transactions, which do not incur broker commissions, are effected at current market prices.
5. INVESTMENT PORTFOLIO TRANSACTIONS
Purchases and sales of investments, excluding U.S. government obligations (if any) and short-term securities, for the year ended March 31, 2018 were $ 27,740,788 and $61,626,120, respectively.
| | | | |
| 26 | | Wells Fargo Utility and Telecommunications Fund | | Notes to financial statements |
6. BANK BORROWINGS
The Trust (excluding the money market funds and certain other funds) and Wells Fargo Variable Trust are parties to a $280,000,000 revolving credit agreement whereby the Fund is permitted to use bank borrowings for temporary or emergency purposes, such as to fund shareholder redemption requests. Interest under the credit agreement is charged to the Fund based on a borrowing rate equal to the higher of the Federal Funds rate in effect on that day plus 1.25% or the overnight LIBOR rate in effect on that day plus 1.25%. In addition, an annual commitment fee equal to 0.25% of the unused balance is allocated to each participating fund. Prior to August 29, 2017, the revolving credit agreement amount was $250,000,000.
For the year ended March 31, 2018, there were no borrowings by the Fund under the agreement.
7. DISTRIBUTIONS TO SHAREHOLDERS
The tax character of distributions paid was $6,305,952 and $6,592,005 of ordinary income for the years ended March 31, 2018 and March 31, 2017, respectively.
As of March 31 2018, the components of distributable earnings on a tax basis were as follows:
| | | | |
Undistributed ordinary income | | Unrealized gains | | Capital loss carryforward |
| $459,714 | | $194,352,307 | | $(4,983,682) |
8. CONCENTRATION RISK
The Fund invests a substantial portion of its assets in utility and telecommunications companies and, therefore, may be more affected by changes in the utility and telecommunications sectors than would be a fund whose investments are not heavily weighted in any sector.
9. INDEMNIFICATION
Under the Trust’s organizational documents, the officers and Trustees have been granted certain indemnification rights against certain liabilities that may arise out of performance of their duties to the Trust. Additionally, in the normal course of business, the Trust may enter into contracts with service providers that contain a variety of indemnification clauses. The Trust’s maximum exposure under these arrangements is dependent on future claims that may be made against the Fund and, therefore, cannot be estimated.
| | | | | | |
| Report of independent registered public accounting firm | | Wells Fargo Utility and Telecommunications Fund | | | 27 | |
BOARD OF TRUSTEES AND SHAREHOLDERS OF WELLS FARGO FUNDS TRUST:
Opinion on the Financial Statements
We have audited the accompanying statement of assets and liabilities of the Wells Fargo Utility and Telecommunications Fund (the “Fund”), one of the funds constituting the Wells Fargo Funds Trust, including the portfolio of investments, as of March 31, 2018, the related statement of operations for the year then ended, the statements of changes in net assets for each of the years in the two-year period then ended, and the related notes (collectively, the “financial statements”) and the financial highlights for each of the years in the five-year period then ended. In our opinion, the financial statements and financial highlights present fairly, in all material respects, the financial position of the Fund as of March 31, 2018, the results of its operations for the year then ended, the changes in its net assets for each of the years in the two-year period then ended, and the financial highlights for each of the years in the five-year period then ended, in conformity with U.S. generally accepted accounting principles.
Basis for Opinion
These financial statements and financial highlights are the responsibility of the Fund’s management. Our responsibility is to express an opinion on these financial statements and financial highlights based on our audits. We are a public accounting firm registered with the Public Company Accounting Oversight Board (United States) (“PCAOB”) and are required to be independent with respect to the Fund in accordance with the U.S. federal securities laws and the applicable rules and regulations of the Securities and Exchange Commission and the PCAOB.
We conducted our audits in accordance with the standards of the PCAOB. Those standards require that we plan and perform the audit to obtain reasonable assurance about whether the financial statements and financial highlights are free of material misstatement, whether due to error or fraud. Our audits included performing procedures to assess the risks of material misstatement of the financial statements and financial highlights, whether due to error or fraud, and performing procedures that respond to those risks. Such procedures included examining, on a test basis, evidence regarding the amounts and disclosures in the financial statements and financial highlights. Such procedures also included confirmation of securities owned as of March 31, 2018, by correspondence with the custodian and brokers, or by other appropriate auditing procedures. Our audits also included evaluating the accounting principles used and significant estimates made by management, as well as evaluating the overall presentation of the financial statements and financial highlights. We believe that our audits provide a reasonable basis for our opinion.

We have not been able to determine the specific year that we began serving as the auditor of one or more Wells Fargo Funds investment companies, however we are aware that we have served as the auditor of one or more Wells Fargo Funds investment companies since at least 1955.
Boston, Massachusetts
May 23, 2018
| | | | |
| 28 | | Wells Fargo Utility and Telecommunications Fund | | Other information (unaudited) |
TAX INFORMATION
For corporate shareholders, pursuant to Section 854 of the Internal Revenue Code, 100% of ordinary income dividends qualify for the corporate dividends-received deduction for the fiscal year ended March 31, 2018.
Pursuant to Section 854 of the Internal Revenue Code, $6,305,952 of income dividends paid during the fiscal year ended March 31, 2018 has been designated as qualified dividend income (QDI).
PROXY VOTING INFORMATION
A description of the policies and procedures that the Fund uses to determine how to vote proxies relating to portfolio securities is available, upon request, by calling 1-800-222-8222, visiting our website at wellsfargofunds.com, or visiting the SEC website at sec.gov. Information regarding how the Fund voted proxies relating to portfolio securities during the most recent 12-month period ended June 30 is available on the Fund’s website at wellsfargofunds.com or by visiting the SEC website at sec.gov.
PORTFOLIO HOLDINGS INFORMATION
The complete portfolio holdings for the Fund are publicly available monthly on the Fund’s website (wellsfargofunds.com), on a one-month delayed basis. In addition, top ten holdings information (excluding derivative positions) for the Fund is publicly available on the Fund’s website on a monthly, seven-day or more delayed basis. The Fund files its complete schedule of portfolio holdings with the SEC for the first and third quarters of each fiscal year on Form N-Q, which is available by visiting the SEC website at sec.gov. In addition, the Fund’s Form N-Q may be reviewed and copied at the SEC’s Public Reference Room in Washington, DC, and at regional offices in New York City, at 233 Broadway, and in Chicago, at 175 West Jackson Boulevard, Suite 900. Information about the Public Reference Room may be obtained by calling 1-800-SEC-0330.
| | | | | | |
| Other information (unaudited) | | Wells Fargo Utility and Telecommunications Fund | | | 29 | |
BOARD OF TRUSTEES AND OFFICERS
Each of the Trustees and Officers1 listed in the table below acts in identical capacities for each fund in the Wells Fargo family of funds, which consists of 153 mutual funds comprising the Wells Fargo Funds Trust, Wells Fargo Variable Trust, Wells Fargo Master Trust and four closed-end funds (collectively the “Fund Complex”). This table should be read in conjunction with the Prospectus and the Statement of Additional Information2. The mailing address of each Trustee and Officer is 525 Market Street, 12th Floor, San Francisco, CA 94105. Each Trustee and Officer serves an indefinite term, however, each Trustee serves such term until reaching the mandatory retirement age established by the Trustees.
Independent Trustees
| | | | | | |
Name and year of birth | | Position held and length of service* | | Principal occupations during past five years or longer | | Current other public company or investment company
directorships |
William R. Ebsworth (Born 1957) | | Trustee, since 2015 | | Retired. From 1984 to 2013, equities analyst, portfolio manager, research director and chief investment officer at Fidelity Management and Research Company in Boston, Tokyo, and Hong Kong, and retired in 2013 as Chief Investment Officer of Fidelity Strategic Advisers, Inc. where he led a team of investment professionals managing client assets. Prior thereto, Board member of Hong Kong Securities Clearing Co., Hong Kong Options Clearing Corp., the Thailand International Fund, Ltd., Fidelity Investments Life Insurance Company, and Empire Fidelity Investments Life Insurance Company. Board member of the Forté Foundation (non-profit organization) and the Vincent Memorial Hospital Endowment (non-profit organization), where he serves on the Investment Committee and as a Chair of the Audit Committee. Mr. Ebsworth is a CFA® charterholder. | | Asset Allocation Trust |
Jane A. Freeman** (Born 1953) | | Trustee, since 2015; Chair Liaison, since 2018 | | Retired. From 2012 to 2014 and 1999 to 2008, Chief Financial Officer of Scientific Learning Corporation. From 2008 to 2012, Ms. Freeman provided consulting services related to strategic business projects. Prior to 1999, Portfolio Manager at Rockefeller & Co. and Scudder, Stevens & Clark. Board member of the Harding Loevner Funds from 1996 to 2014, serving as both Lead Independent Director and chair of the Audit Committee. Board member of the Russell Exchange Traded Funds Trust from 2011 to 2012 and the chair of the Audit Committee. Ms. Freeman is a Board Member of Ruth Bancroft Garden (non-profit organization) and the Glimmerglass Festival. She is also an inactive Chartered Financial Analyst. | | Asset Allocation Trust |
Isaiah Harris, Jr. (Born 1952) | | Trustee, since 2009 | | Retired. Chairman of the Board of CIGNA Corporation since 2009, and Director since 2005. From 2003 to 2011, Director of Deluxe Corporation. Prior thereto, President and CEO of BellSouth Advertising and Publishing Corp. from 2005 to 2007, President and CEO of BellSouth Enterprises from 2004 to 2005 and President of BellSouth Consumer Services from 2000 to 2003. Emeritus member of the Iowa State University Foundation Board of Governors. Emeritus Member of the Advisory Board of Iowa State University School of Business. Advisory Board Member, Palm Harbor Academy (charter school). Advisory Board Member, Child Evangelism Fellowship (non-profit). Mr. Harris is a certified public accountant (inactive status). | | CIGNA Corporation; Asset Allocation Trust |
Judith M. Johnson (Born 1949) | | Trustee, since 2008; Audit Committee Chairman, since 2008 | | Retired. Prior thereto, Chief Executive Officer and Chief Investment Officer of Minneapolis Employees Retirement Fund from 1996 to 2008. Ms. Johnson is an attorney, certified public accountant and a certified managerial accountant. | | Asset Allocation Trust |
David F. Larcker (Born 1950) | | Trustee, since 2009 | | James Irvin Miller Professor of Accounting at the Graduate School of Business, Stanford University, Director of the Corporate Governance Research Initiative and Senior Faculty of The Rock Center for Corporate Governance since 2006. From 2005 to 2008, Professor of Accounting at the Graduate School of Business, Stanford University. Prior thereto, Ernst & Young Professor of Accounting at The Wharton School, University of Pennsylvania from 1985 to 2005. | | Asset Allocation Trust |
| | | | |
| 30 | | Wells Fargo Utility and Telecommunications Fund | | Other information (unaudited) |
| | | | | | |
Name and year of birth | | Position held and length of service* | | Principal occupations during past five years or longer | | Current other public company or investment company
directorships |
Olivia S. Mitchell*** (Born 1953) | | Trustee, since 2006; Governance Committee Chairman, since 2018 | | International Foundation of Employee Benefit Plans Professor, Wharton School of the University of Pennsylvania since 1993. Director of Wharton’s Pension Research Council and Boettner Center on Pensions & Retirement Research, and Research Associate at the National Bureau of Economic Research. Previously, Cornell University Professor from 1978 to 1993. | | Asset Allocation Trust |
Timothy J. Penny**** (Born 1951) | | Trustee, since 1996; Chairman, since 2018; Vice Chairman, from 2017 to 2018 | | President and Chief Executive Officer of Southern Minnesota Initiative Foundation, a non-profit organization, since 2007. Member of the Board of Trustees of NorthStar Education Finance, Inc., a non-profit organization, since 2007. | | Asset Allocation Trust |
James G. Polisson***** (Born 1959) | | Trustee, since 2018; Advisory Board Member, from 2017 to 2018 | | Retired. Chief Marketing Officer, Source (ETF) UK Services, Ltd, from 2015 to 2017. From 2012 to 2015, Principal of The Polisson Group, LLC, a management consulting, corporate advisory and principal investing company. Chief Executive Officer and Managing Director at Russell Investments, Global Exchange Traded Funds from 2010 to 2012. Managing Director of Barclays Global Investors from 1998 to 2010 and Global Chief Marketing Officer for iShares and Barclays Global Investors from 2000 to 2010. Trustee of the San Francisco Mechanics’ Institute, a non-profit organization, from 2013 to 2015. Board member of the Russell Exchange Traded Fund Trust from 2011 to 2012. Director of Barclays Global Investors Holdings Deutschland GmbH from 2006 to 2009. Mr. Polisson is an attorney and has a retired status with the Massachusetts and District of Columbia Bar Associations. | | Asset Allocation Trust |
Michael S. Scofield (Born 1943) | | Trustee, since 2010 | | Served on the Investment Company Institute’s Board of Governors and Executive Committee from 2008-2011 as well the Governing Council of the Independent Directors Council from 2006-2011 and the Independent Directors Council Executive Committee from 2008-2011. Trustee of the Evergreen Fund complex (and its predecessors) from 1984 to 2010. Chairman of the Evergreen Funds from 2000-2010. Former Trustee of the Mentor Funds. Retired Attorney, Law Offices of Michael S. Scofield. | | Asset Allocation Trust |
Pamela Wheelock***** (Born 1959) | | Trustee, since 2018; Advisory Board Member, from 2017 to 2018 | | Chief Operating Officer, Twin Cities Habitat for Humanity, since January, 2017. Vice President of University Services, University of Minnesota from 2012 to 2017. Prior thereto, Interim President and Chief Executive Officer of Blue Cross Blue Shield of Minnesota from 2010 to 2011, Chairman of the Board from 2009 to 2011 and Board Director from 2003 to 2015. Vice President, Leadership and Community Engagement, Bush Foundation, Saint Paul, Minnesota (a private foundation) from 2009 to 2011. Executive Vice President and Chief Financial Officer, Minnesota Sports and Entertainment from 2004 to 2009 and Senior Vice President from 2002 to 2004. Commissioner of Finance, State of Minnesota, from 1999 to 2002. Currently on the Board of Directors, Governance Committee and Finance Committee, for the Minnesota Philanthropy Partners (Saint Paul Foundation) since 2012 and Board Chair of the Minnesota Wild Foundation since 2010. | | Asset Allocation Trust |
| * | Length of service dates reflect the Trustee’s commencement of service with the Trust’s predecessor entities, where applicable. |
| ** | Jane Freeman became Chair Liaison effective January 1, 2018. |
| *** | Olivia Mitchell became Chairman of the Governance Committee effective January 1, 2018. |
| **** | Timothy Penny became Chairman effective January 1, 2018. |
| ***** | James Polisson and Pamela Wheelock each became a Trustee effective January 1, 2018. |
| | | | | | |
| Other information (unaudited) | | Wells Fargo Utility and Telecommunications Fund | | | 31 | |
Officers
| | | | | | |
Name and year of birth | | Position held and length of service | | Principal occupations during past five years or longer | | |
Andrew Owen (Born 1960) | | President, since 2017 | | Executive Vice President of Wells Fargo & Company and Head of Affiliated Managers, Wells Fargo Asset Management, since 2014. In addition, Mr. Owen is currently President, Chief Executive Officer and Director of Wells Fargo Funds Management, LLC since 2017. Prior thereto, Executive Vice President responsible for marketing, investments and product development for Wells Fargo Funds Management, LLC, from 2009 to 2014. | | |
Nancy Wiser1 (Born 1967) | | Treasurer, since 2012 | | Executive Vice President of Wells Fargo Funds Management, LLC since 2011. Chief Operating Officer and Chief Compliance Officer at LightBox Capital Management LLC, from 2008 to 2011. | | |
Alexander Kymn* (Born 1973) | | Secretary, since 2018; Chief Legal Officer, since 2018 | | Senior Company Counsel of Wells Fargo Bank, N.A. since 2018 (previously Senior Counsel from 2007 to 2018). Vice President of Wells Fargo Funds Management, LLC from 2008 to 2014. | | |
C. David Messman** (Born 1960) | | Secretary, since 2000; Chief Legal Officer, since 2003 | | Senior Vice President and Secretary of Wells Fargo Funds Management, LLC since 2001. Assistant General Counsel of Wells Fargo Bank, N.A. since 2013 and Vice President and Managing Counsel of Wells Fargo Bank, N.A. from 1996 to 2013. | | |
Michael H. Whitaker (Born 1967) | | Chief Compliance Officer, since 2016 | | Senior Vice President and Chief Compliance Officer since 2016. Senior Vice President and Chief Compliance Officer for Fidelity Investments from 2007 to 2016. | | |
David Berardi (Born 1975) | | Assistant Treasurer, since 2009 | | Vice President of Wells Fargo Funds Management, LLC since 2009. Vice President of Evergreen Investment Management Company, LLC from 2008 to 2010. Manager of Fund Reporting and Control for Evergreen Investment Management Company, LLC from 2004 to 2010. | | |
Jeremy DePalma1 (Born 1974) | | Assistant Treasurer, since 2009 | | Senior Vice President of Wells Fargo Funds Management, LLC since 2009. Senior Vice President of Evergreen Investment Management Company, LLC from 2008 to 2010 and head of the Fund Reporting and Control Team within Fund Administration from 2005 to 2010. | | |
| 1 | Nancy Wiser acts as Treasurer of 77 funds in the Fund Complex. Jeremy DePalma acts as Treasurer of 76 funds and Assistant Treasurer of 77 funds in the Fund Complex. |
| 2 | The Statement of Additional Information includes additional information about the Trustees and is available, without charge, upon request, by calling 1-800-222-8222 or by visiting the website at wellsfargofunds.com. |
| * | Alexander Kymn became the Secretary and Chief Legal Officer effective April 17, 2018. |
| ** | David Messman was the Secretary and Chief Legal Officer until April 16, 2018. |
| | | | |
| 32 | | Wells Fargo Utility and Telecommunications Fund | | List of abbreviations |
The following is a list of common abbreviations for terms and entities that may have appeared in this report.
| ACA | — ACA Financial Guaranty Corporation |
| ADR | — American depositary receipt |
| ADS | — American depositary shares |
| AGC | — Assured Guaranty Corporation |
| AGM | — Assured Guaranty Municipal |
| Ambac | — Ambac Financial Group Incorporated |
| AMT | — Alternative minimum tax |
| BAN | — Bond anticipation notes |
| BHAC | — Berkshire Hathaway Assurance Corporation |
| CAB | — Capital appreciation bond |
| CCAB | — Convertible capital appreciation bond |
| CDA | — Community Development Authority |
| CDO | — Collateralized debt obligation |
| CLO | — Collateralized loan obligation |
| DRIVER | — Derivative inverse tax-exempt receipts |
| DW&P | — Department of Water & Power |
| DWR | — Department of Water Resources |
| ECFA | — Educational & Cultural Facilities Authority |
| EDA | — Economic Development Authority |
| EDFA | — Economic Development Finance Authority |
| ETF | — Exchange-traded fund |
| FDIC | — Federal Deposit Insurance Corporation |
| FFCB | — Federal Farm Credit Banks |
| FGIC | — Financial Guaranty Insurance Corporation |
| FHA | — Federal Housing Administration |
| FHLB | — Federal Home Loan Bank |
| FHLMC | — Federal Home Loan Mortgage Corporation |
| FICO | — The Financing Corporation |
| FNMA | — Federal National Mortgage Association |
| GDR | — Global depositary receipt |
| GNMA | — Government National Mortgage Association |
| HCFR | — Healthcare facilities revenue |
| HEFA | — Health & Educational Facilities Authority |
| HEFAR | — Higher education facilities authority revenue |
| HFA | — Housing Finance Authority |
| HFFA | — Health Facilities Financing Authority |
| HUD | — Department of Housing and Urban Development |
| IDA | — Industrial Development Authority |
| IDAG | — Industrial Development Agency |
| KRW | — Republic of Korea won |
| LIBOR | — London Interbank Offered Rate |
| LIFER | — Long Inverse Floating Exempt Receipts |
| LLC | — Limited liability company |
| LLLP | — Limited liability limited partnership |
| LLP | — Limited liability partnership |
| MBIA | — Municipal Bond Insurance Association |
| MFHR | — Multifamily housing revenue |
| MSTR | — Municipal securities trust receipts |
| MUD | — Municipal Utility District |
| National | — National Public Finance Guarantee Corporation |
| PCFA | — Pollution Control Financing Authority |
| PCL | — Public Company Limited |
| PCR | — Pollution control revenue |
| PFA | — Public Finance Authority |
| PFFA | — Public Facilities Financing Authority |
| PFOTER | — Puttable floating option tax-exempt receipts |
| PJSC | — Public Joint Stock Company |
| plc | — Public limited company |
| PUTTER | — Puttable tax-exempt receipts |
| R&D | — Research & development |
| Radian | — Radian Asset Assurance |
| RAN | — Revenue anticipation notes |
| RDA | — Redevelopment Agency |
| RDFA | — Redevelopment Finance Authority |
| REIT | — Real estate investment trust |
| ROC | — Reset option certificates |
| SAVRS | — Select auction variable rate securities |
| SBA | — Small Business Authority |
| SDR | — Swedish depositary receipt |
| SFHR | — Single-family housing revenue |
| SFMR | — Single-family mortgage revenue |
| SIFMA | — Securities Industry and Financial Markets Association |
| SPA | — Standby purchase agreement |
| SPDR | — Standard & Poor’s Depositary Receipts |
| SPEAR | — Short Puttable Exempt Adjustable Receipts |
| STRIPS | — Separate trading of registered interest and |
| TAN | — Tax anticipation notes |
| TIPS | — Treasury inflation-protected securities |
| TRAN | — Tax revenue anticipation notes |
| TTFA | — Transportation Trust Fund Authority |
| TVA | — Tennessee Valley Authority |

For more information
More information about Wells Fargo Funds is available free upon request. To obtain literature, please write, email, visit the Fund’s website, or call:
Wells Fargo Funds
P.O. Box 8266
Boston, MA 02266-8266
Email: fundservice@wellsfargo.com
Website: wellsfargofunds.com
Individual investors: 1-800-222-8222
Retail investment professionals: 1-888-877-9275
Institutional investment professionals:
1-866-765-0778
This report and the financial statements contained herein are submitted for the general information of the shareholders of the Fund. If this report is used for promotional purposes, distribution of the report must be accompanied or preceded by a current prospectus. Before investing, please consider the investment objectives, risks, charges, and expenses of the investment. For a current prospectus and, if available, a summary prospectus, containing this information, call 1-800-222-8222 or visit the Fund’s website at wellsfargofunds.com. Read the prospectus carefully before you invest or send money.
Wells Fargo Asset Management (WFAM) is a trade name used by the asset management businesses of Wells Fargo & Company. Wells Fargo Funds Management, LLC, a wholly owned subsidiary of Wells Fargo & Company, provides investment advisory and administrative services for Wells Fargo Funds. Other affiliates of Wells Fargo & Company provide subadvisory and other services for the funds. The funds are distributed by Wells Fargo Funds Distributor, LLC, Member FINRA, an affiliate of Wells Fargo & Company. Neither Wells Fargo Funds Distributor nor Wells Fargo Funds Management holds fund shareholder accounts or assets. This material is for general informational and educational purposes only and is NOT intended to provide investment advice or a recommendation of any kind—including a recommendation for any specific investment, strategy, or plan.
NOT FDIC INSURED ◾ NO BANK GUARANTEE ◾ MAY LOSE VALUE
© 2018 Wells Fargo Funds Management, LLC. All rights reserved.
| | |
 | | 309989 05-18 A318/AR318 03-18 |
(a) As of the end of the period covered by the report, Wells Fargo Funds Trust has adopted a code of ethics that applies to its President and Treasurer. A copy of the code of ethics is filed as an exhibit to this Form N-CSR.
(c) During the period covered by this report, there were no amendments to the provisions of the code of ethics adopted in Item 2(a) above.
(d) During the period covered by this report, there were no implicit or explicit waivers to the provisions of the code of ethics adopted in Item 2(a) above.
| ITEM 3. | AUDIT COMMITTEE FINANCIAL EXPERT |
The Board of Trustees of Wells Fargo Funds Trust has determined that Judith Johnson is an audit committee financial expert, as defined in Item 3 of Form N-CSR. Mrs. Johnson is independent for purposes of Item 3 of Form N-CSR.
| ITEM 4. | PRINCIPAL ACCOUNTANT FEES AND SERVICES |
(a), (b), (c), (d) The following table presents aggregate fees billed in each of the last two fiscal years for services rendered
to the Registrant by the Registrant’s principal accountant. These fees were billed to the registrant and were approved by the Registrant’s audit committee.
| | | | | | | | |
| | | Fiscal
year ended
March 31, 2018 | | | Fiscal
year ended
March 31, 2017 | |
Audit fees | | $ | 295,730 | | | $ | 286,125 | |
Audit-related fees | | | — | | | | — | |
Tax fees (1) | | | 40,565 | | | | 39,400 | |
All other fees | | | — | | | | — | |
| | | | | | | | |
| | $ | 336,295 | | | $ | 325,525 | |
| | | | | | | | |
| (1) | Tax fees consist of fees for tax compliance, tax advice, tax planning and excise tax. |
(e) The Chairman of the Audit Committees is authorized to pre-approve: (1) audit services for the mutual funds of Wells Fargo Funds Trust; (2) non-audit tax or compliance consulting or training services provided to the Funds by the independent auditors (“Auditors”) if the fees for any particular engagement are not anticipated to exceed $50,000; and (3) non-audit tax or compliance consulting or training services provided by the Auditors to a Fund’s investment adviser and its controlling entities (where pre-approval is required because the engagement relates directly to the operations and financial reporting of the Fund) if the fee to the Auditors for any particular engagement is not anticipated to exceed $50,000. For any such pre-approval sought from the Chairman, Management shall prepare a brief description of the proposed services. If the Chairman approves of such service, he or she shall sign the statement prepared by Management. Such written statement shall be presented to the full Committees at their next regularly scheduled meetings.
(f) Not applicable
(g) Not applicable
(h) Not applicable
| ITEM 5. | AUDIT COMMITTEE OF LISTED REGISTRANTS |
Not applicable.
A Portfolio of Investments for each series of Wells Fargo Funds Trust is included as part of the report to shareholders filed under Item 1 of this Form.
| ITEM 7. | DISCLOSURE OF PROXY VOTING POLICIES AND PROCEDURES FOR CLOSED-END MANAGEMENT INVESTMENT COMPANIES |
Not applicable.
ITEM 8. PORTFOLIO MANAGERS OF CLOSED-END MANAGEMENT INVESTMENT COMPANIES
Not applicable.
| ITEM 9. | PURCHASES OF EQUITY SECURITIES BY CLOSED-END MANAGEMENT INVESTMENT COMPANY AND AFFILIATED PURCHASERS |
Not applicable.
| ITEM 10. | SUBMISSION OF MATTERS TO A VOTE OF SECURITY HOLDERS |
There have been no material changes to the procedures by which shareholders may recommend nominees to the registrant’s Board of Trustees that have been implemented since the registrant’s last provided disclosure in response to the requirements of this Item.
| ITEM 11. | CONTROLS AND PROCEDURES |
(a) The President and Treasurer have concluded that the Wells Fargo Funds Trust (the “Trust”) disclosure controls and procedures (as defined in Rule 30a-3(c) under the Investment Company Act of 1940) provide reasonable assurances that material information relating to the Trust is made known to them by the appropriate persons based on their evaluation of these controls and procedures as of a date within 90 days of the filing of this report.
(b) There were no significant changes in the Trust’s internal controls over financial reporting (as defined in Rule 30a-3(d) under the Investment Company Act of 1940) that occurred during the second fiscal quarter of the period covered by this report that materially affected, or is reasonably likely to materially affect, the registrant’s internal control over financial reporting.
(a)(1) Code of Ethics pursuant to Item 2 of Form N-CSR is filed and attached hereto as Exhibit COE.
(a)(2) Certification pursuant to Rule 30a-2(a) under the Investment Company Act of 1940 (17 CFR 270.30a-2(a)) is filed and attached hereto as Exhibit 99.CERT.
(a)(3) Not applicable.
(b) Certification pursuant to Rule 30a-2(b) under the Investment Company Act of 1940 (17 CFR 270.30a-2(b)) is filed and attached hereto as Exhibit 99.906CERT.
SIGNATURES
Pursuant to the requirements of the Securities Exchange Act of 1934 and the Investment Company Act of 1940, the registrant has duly caused this report to be signed on its behalf by the undersigned, thereunto duly authorized.
| | |
| Wells Fargo Funds Trust |
| |
| By: | | |
| |
| | Andrew Owen |
| | President |
| |
| Date: | | May 23, 2018 |
Pursuant to the requirements of the Securities Exchange Act of 1934 and the Investment Company Act of 1940, this report has been signed below by the following persons on behalf of the registrant and in the capacities and on the date indicated.
| | |
| Wells Fargo Funds Trust |
| |
| By: | | |
| |
| | Andrew Owen |
| | President |
| |
| Date: | | May 23, 2018 |
| |
| By: | | /s/ Nancy Wiser |
| |
| | Nancy Wiser |
| | Treasurer |
|
| Date: May 23, 2018 |